Indications of shock waves in the solar photosphere
12
A&A 420, 1141–1152 (2004) DOI: 10.1051/0004-6361:20035660 c ESO 2004 Astronomy & Astrophysics Indications of shock waves in the solar photosphere J. Ryb´ ak 1 , H. W ¨ ohl 2 , A. Kuˇ cera 1 , A. Hanslmeier 3 , and O. Steiner 2 1 Astronomical Institute of the Slovak Academy of Sciences, 05960 Tatransk´ a Lomnica, Slovakia 2 Kiepenheuer-Institut f¨ ur Sonnenphysik, Sch¨ oneckstr. 6, 79104 Freiburg, Germany 3 Institut f¨ ur Geophysik, Astrophysik und Meteorologie, Universit¨ atsplatz 5, 8010 Graz, Austria Received 11 November 2003 / Accepted 15 March 2004 Abstract. High resolution observations of solar granulation near the solar limb are used in a search for hydrodynamic shocks caused by an abrupt braking of the fast (probably supersonic) horizontal flow of the granular plasma towards the intergranular lane. Shock signatures in the spectral line of Fe II 6456.38 Å of one particular observed shock event are investigated in detail. Evolution, amplitude, and spatial relation of the spectral line characteristics of the shock event are in agreement with predictions from numerical simulations for such shock phenomena in the solar photosphere. The dimensions and amplitudes of the observed shock signatures are comparable to predicted values when seeing and instrumental effects as well as a possible obliqueness of the shock front with respect to the observer’s line-of-sight are taken into account. The temporal evolution of such an event is observed for the first time. The stable and declining phase of the event were studied for a time period of almost 2 min. A particular relationship was found between the shock event and a nearby G-band bright point located 2 from the shock event. It is suggestive that the observed shock is a causal consequence of the magnetic flux concentration, traced by the G-band bright point. Such a type of shock can appear outside the flux concentrations as a consequence of a rapid flux-tube motion. Key words. Sun: photosphere – Sun: granulation – line: profiles – shock waves 1. Introduction In the past two decades it has become feasible to study the non- stationary nature of the photospheric layers with the help of numerical simulations. First comprehensive simulations treated non-magnetic solar granulation (e.g., Nordlund 1984; Stein & Nordlund 1989; Steffen et al. 1989). While these simulations included a sophisticated treatment of radiative transfer and sub- grid turbulence models, other numerical work included less physics but concentrated on a detailed treatment of turbulence, both in 2D and 3D (e.g., Cattaneo et al. 1989, 1990; Malagoli et al. 1990). Simulations of convective motion including mag- netic field have been carried out in 3D by Nordlund (1986) and Weiss et al. (1996) and more recently by Cattaneo (1999), Emonet & Cattaneo (2001), Stein & Nordlund (2002) or V¨ ogler & Sch¨ ussler (2003) and in 2D in a series of papers by Deinzer et al. (1984a,b), Kn¨ olker et al. (1988), Grossman-Doerth et al. (1988, 1994), and by Hurlburt & Toomre (1988), Fox et al. (1999), and Ploner et al. (1999). Steiner et al. (1998) sim- ulated the dynamical interaction of a preexisting magnetic flux sheet with a fully developed granular convection while Grossman-Doerth et al. (1988) studied the formation of flux sheets in a non-stationary convective environment. The latter two works include the computation of synthetic spectra from simulation snapshots thus enabling the prediction of spectral features, which can be looked for in observed high spatial and spectral resolution spectra of solar granulation. Send offprint requests to: J. Ryb´ ak, e-mail: [email protected] Simulations have predicted supersonic horizontal flows of granular plasma as a consequence of the non-adiabatic cool- ing at the solar surface. The collision of the horizontal flow of neighbouring granules leads to the formation of a pair of shocks which travel from the intergranular lane upstream toward the granule centres (Cattaneo et al. 1989, 1990; Malagoli et al. 1990; Steffen & Freytag 1991; Steiner et al. 1994; Solanki et al. 1996; Gadun 2000). The first attempt to confirm the existence of these horizontally moving shocks was made by Nesis et al. (1992). The observational evidence for such flows in the inter- granular lanes was based on the negative correlation between the line width and the continuum intensity. They argued that the excess in line width was caused by turbulence introduced by the shock that brakes the supersonic flow back to a subsonic one in the intergranular lane. Later, Nesis et al. (1993) found the region of the enhanced turbulence to be concentrated at the borders of granules, especially when there exists a steep ve- locity gradient. High resolution observations made by Solanki et al. (1996) qualitatively confirmed the trend of the relation found by Nesis et al. (1992). On the other hand Solanki et al. (1996) showed, based on numerical simulations, that spectral lines that originate in the intergranular lanes are broader even in the absence of any horizontal supersonic flow and associated shock front. The latter however seem to be prerequisite for the line broadening when observed near the solar limb. The direct spatial identification of enhanced line broadening at the bound- aries of some granules, supports the interpretation of the line broadening in terms of shocks that are formed near granular
-
Upload
itzacatepec -
Category
Documents
-
view
4 -
download
0
Transcript of Indications of shock waves in the solar photosphere
A&A 420, 1141–1152 (2004)DOI: 10.1051/0004-6361:20035660c© ESO 2004
Astronomy&
Astrophysics
Indications of shock waves in the solar photosphere
J. Rybak1, H. Wohl2, A. Kucera1, A. Hanslmeier3, and O. Steiner2
1 Astronomical Institute of the Slovak Academy of Sciences, 05960 Tatranska Lomnica, Slovakia2 Kiepenheuer-Institut fur Sonnenphysik, Schoneckstr. 6, 79104 Freiburg, Germany3 Institut fur Geophysik, Astrophysik und Meteorologie, Universitatsplatz 5, 8010 Graz, Austria
Received 11 November 2003 / Accepted 15 March 2004
Abstract. High resolution observations of solar granulation near the solar limb are used in a search for hydrodynamic shockscaused by an abrupt braking of the fast (probably supersonic) horizontal flow of the granular plasma towards the intergranularlane. Shock signatures in the spectral line of Fe II 6456.38 Å of one particular observed shock event are investigated in detail.Evolution, amplitude, and spatial relation of the spectral line characteristics of the shock event are in agreement with predictionsfrom numerical simulations for such shock phenomena in the solar photosphere. The dimensions and amplitudes of the observedshock signatures are comparable to predicted values when seeing and instrumental effects as well as a possible obliqueness ofthe shock front with respect to the observer’s line-of-sight are taken into account. The temporal evolution of such an eventis observed for the first time. The stable and declining phase of the event were studied for a time period of almost 2 min. Aparticular relationship was found between the shock event and a nearby G-band bright point located 2′′ from the shock event.It is suggestive that the observed shock is a causal consequence of the magnetic flux concentration, traced by the G-band brightpoint. Such a type of shock can appear outside the flux concentrations as a consequence of a rapid flux-tube motion.
Key words. Sun: photosphere – Sun: granulation – line: profiles – shock waves
1. Introduction
In the past two decades it has become feasible to study the non-stationary nature of the photospheric layers with the help ofnumerical simulations. First comprehensive simulations treatednon-magnetic solar granulation (e.g., Nordlund 1984; Stein &Nordlund 1989; Steffen et al. 1989). While these simulationsincluded a sophisticated treatment of radiative transfer and sub-grid turbulence models, other numerical work included lessphysics but concentrated on a detailed treatment of turbulence,both in 2D and 3D (e.g., Cattaneo et al. 1989, 1990; Malagoliet al. 1990). Simulations of convective motion including mag-netic field have been carried out in 3D by Nordlund (1986)and Weiss et al. (1996) and more recently by Cattaneo (1999),Emonet & Cattaneo (2001), Stein & Nordlund (2002) or Vogler& Schussler (2003) and in 2D in a series of papers by Deinzeret al. (1984a,b), Knolker et al. (1988), Grossman-Doerth et al.(1988, 1994), and by Hurlburt & Toomre (1988), Fox et al.(1999), and Ploner et al. (1999). Steiner et al. (1998) sim-ulated the dynamical interaction of a preexisting magneticflux sheet with a fully developed granular convection whileGrossman-Doerth et al. (1988) studied the formation of fluxsheets in a non-stationary convective environment. The lattertwo works include the computation of synthetic spectra fromsimulation snapshots thus enabling the prediction of spectralfeatures, which can be looked for in observed high spatial andspectral resolution spectra of solar granulation.
Send offprint requests to: J. Rybak, e-mail: [email protected]
Simulations have predicted supersonic horizontal flows ofgranular plasma as a consequence of the non-adiabatic cool-ing at the solar surface. The collision of the horizontal flow ofneighbouring granules leads to the formation of a pair of shockswhich travel from the intergranular lane upstream toward thegranule centres (Cattaneo et al. 1989, 1990; Malagoli et al.1990; Steffen & Freytag 1991; Steiner et al. 1994; Solanki et al.1996; Gadun 2000). The first attempt to confirm the existenceof these horizontally moving shocks was made by Nesis et al.(1992). The observational evidence for such flows in the inter-granular lanes was based on the negative correlation betweenthe line width and the continuum intensity. They argued thatthe excess in line width was caused by turbulence introducedby the shock that brakes the supersonic flow back to a subsonicone in the intergranular lane. Later, Nesis et al. (1993) foundthe region of the enhanced turbulence to be concentrated at theborders of granules, especially when there exists a steep ve-locity gradient. High resolution observations made by Solankiet al. (1996) qualitatively confirmed the trend of the relationfound by Nesis et al. (1992). On the other hand Solanki et al.(1996) showed, based on numerical simulations, that spectrallines that originate in the intergranular lanes are broader evenin the absence of any horizontal supersonic flow and associatedshock front. The latter however seem to be prerequisite for theline broadening when observed near the solar limb. The directspatial identification of enhanced line broadening at the bound-aries of some granules, supports the interpretation of the linebroadening in terms of shocks that are formed near granular
1142 J. Rybak et al.: Indications of shock waves in the solar photosphere
Table 1. Atomic parameters and height of formation of the Fe II lines selected for observations of shock signatures. Ep and Wλ stand for theexcitation potential of the lower level and the equivalent width of the line, respectively. The Lande factors are given for the cases of LS couplingand the empirical values. The height of formation was calculated according to the MACKKL model of the solar photosphere (Maltby et al.(1986) by Gadun (2000). References: 1 – Allende Prieto & Garcia Lopez (1998); 2 – Moore (1972); 3 – Kurucz (1990); 4 – Solanki & Stenflo(1985); 5 – Moore et al. (1966).
Solar Wavelength1 [Å] Multiplet2 Ep3 [eV] Transition4 Wλ5 [mÅ] Lande factor4 Formation height [km]
4993.3527 36 2.807 b4F4 12–z6P3 1
234 0.667/0.616 110
6456.3888 74 3.903 b4D3 12–z4P2 1
257 1.214/1.182 205
boundaries as a consequence of the colliding horizontal granu-lar flow.
Steiner et al. (1998) detected three types of shocks in2D MHD simulations of a magnetic flux sheet in interactionwith granulation depending on the place of origin and directionof propagation. Type I shocks belong to the deceleration zoneof the horizontal granular flow on the edge of the intergranularlane. This type is in agreement with the previously predictedshock from non-magnetic simulations made by Cattaneo et al.(1989, 1990) and other authors and is not related to the pres-ence of the flux sheet. Type II shocks are caused by the swayingmotion of the flux sheet when a fast motion of the sheet pushesthe plasma in front of it creating a vertically oriented bow shockmoving horizontally. Type III shocks are found to be horizon-tally oriented and propagating upward within the flux sheet it-self. This type is generated by the deformation of the flux sheetand tube-mode coupling due to the dynamics of convection.
Each of the three types of shocks can be expected to pro-duce signatures in spectral lines. In order to distinguish themtheir temporal evolution, direction of propagation, and their lo-cation with respect to the granular/intergranular intensity andthe magnetic pattern must be determined. As we concentrate onhorizontal flows in the following, type III shocks are not con-sidered. The aim of this paper is to give direct evidence forshocks in the solar photosphere including their temporal devel-opment using high spatial and spectral resolution observationsof the photospheric lines, given in Table 1. A preliminary reportwas given by Kucera et al. (2003)1. Predictions of the shocksignatures from the numerical simulations are summarized inSect. 2 and our observations are described in Sects. 3 and 4.Results on the observed spectral signatures of the suspectedshock events are given in Sect. 5. Discussion of the results anda comparison of the observed shock signatures to the G-bandintensity pattern and to synthetic spectral line profiles are pre-sented in Sect. 6. Final conclusions are provided in Sect. 7.
2. Predictions from numerical simulations
Radiative transfer analysis of numerical simulations predictdistinctive signatures of spectral profiles when a shock travels
1 Due to a program error the full line width given in this report wasdivided by a factor of two. In addition the equivalent width of theinvestigated spectral line was given as 81 instead of 57 mÅ (Table I ofthat paper).
through the formation region of the spectral line in the photo-sphere. These shock signatures can be summarized as follows:
– A significant increase of the line width up to 300% of itsaverage value when no degradation due to atmospheric andinstrumental effects is taken into account (Gadun 2000;Gadun & Hanslmeier 2000) or up to 100% after degra-dation to 0.5′′ spatial resolution (Solanki et al. 1996).Observations near the limb rule out the possibility that thesame effect can be caused by the downward motion in theintergranular lane (Solanki et al. 1996).
– An increase of the residual line intensity as the shock heatsthe post-shock plasma. Increase of the residual intensitycaused by the shock was found to be 250% of its unaffectedvalue for calculations without degradation and 75% afterartificial degradation due to the expected seeing and instru-mental effects. This provides one possible explanation forthe line gap phenomenon – a strong weakening of spec-tral lines – studied for example by Steffen et al. (1994) andSteiner et al. (1998) although other mechanisms caused bythe magnetic field have been presented too (Amer & Kneer1993).Similar results were found by Gadun & Hanslmeier (2000)who also showed that the relative position of shock sig-natures in the line width and in the residual line intensitychanges depending on the inclination of the line-of-sightwith respect to the shock orientation.
– Simulations have predicted extreme jumps of line shiftdue to jumps of velocity across the shock of greaterthan 5 km s−1 (Solanki et al. 1996; Steiner et al. 1998;Gadun & Hanslmeier 2000). A weakening and broadeningof jump signatures can be expected due to the finite spatialresolution of the instrument and seeing conditions as wellas due to the specific orientation of the shock relative to theline-of-sight of the observations. Both signs of the velocityare expected depending on the direction of the shock prop-agation. Jumps in line shifts could not be detected usinglow spatial resolution or when the shock front is not closeto perpendicular with respect to the line-of-sight (Solankiet al. 1996).
– Only very small or no change of the continuum intensitycaused by shocks was found (Steffen et al. 1994).
– Shocks cause only small changes in equivalent width ofspectral lines, since an increase of the line width is roughlycompensated for by an increase of the residual intensity.

J. Rybak et al.: Indications of shock waves in the solar photosphere 1143
– Individual line profiles derived from simulations show ex-tremely distorted or even double line profiles (Solanki et al.1996; Steiner et al. 1998). Nevertheless the effect of fi-nite spatial resolution and seeing, etc., smooths synthesizedspectral line profiles (an illustrative example is given bySteiner et al. 1998). The actual shape of the observed spec-tral profile also depends on the orientation of the shockfront with respect to the line-of-sight.
– The line profiles synthesized by Solanki et al. (1996) fromnumerical simulations made by Steffen & Freytag (1991)have shown that near the solar limb the intergranular lanesdo not show any significant broadening due to the down-flow present there, in contrast to what is observed at diskcentre. Therefore, observations made at large viewing an-gles should be free from the ambivalence of the enhancedline broadening introduced by the downflow in the inter-granular lanes.
Results of Gadun & Hanslmeier (2000) based on the simula-tions performed by Gadun et al. (1999) also suggest to carryout observations of shocks near the limb because of the higherchance there to find corresponding changes in spectral linecharacteristics. Additionally, he found a higher sensitivity oflines of Fe II to photospheric shocks compared to lines of theneutral atoms. The actual viewing angle under which the shockis observed in three-dimensional space is found to be impor-tant. Almost no effect on the spectral profiles takes place if theshock is viewed from a direction parallel to the shock front orfrom a direction oblique to that (Solanki et al. 1996). Generally,observing perpendicular to the shock front strongly favoursregistration of the shock in the spectral profile. Both, the syn-thesized line profiles calculated outside of the magnetic sheetby Steiner et al. (1998) and those profiles derived from theHD simulations (Steffen et al. 1994; Solanki et al. 1996; Gadun& Hanslmeier 2000), have shown that line profiles can serve asa diagnostic of shocks. Very high spatial resolution is required,however.
3. Observations
A careful selection of Fe II lines in the visible wavelength rangeof the spectrum was performed. The amplitude of the expectedshock signatures in the Fe II spectral line profile (Gadun 2000;Gadun & Hanslmeier 2000), the formation heights, and othersuitable lines near the chosen Fe II lines as well as the presenceof any line blends were considered. Finally, only two Fe II lines(4993.35 Å and 6456.38 Å) were selected from eight suitablelines when we also considered the limitations of the spectro-graph and our aim to measure at least two different spectralregions simultaneously in order to increase the number of mea-sured lines (Table 1). These lines probe intermediate layers ofthe photosphere.
Observations were carried out with the Vacuum TowerTelescope (VTT) (Schroter et al. 1985) at the Observatoriodel Teide, Tenerife, Spain. The Adaptive Optics (AO) of theNational Solar Observatory at Sacramento Peak (Sunspot,USA) was allocated on loan for a test deployment at the VTT(Rimmele et al. 1999). The experimental setup of the AO was
used successfully to compensate for pointing errors due toguiding inaccuracies and/or seeing for most of the observingtime. The actual position of the spectrograph slit on the pro-jected solar surface was recorded using the slit-jaw (SJ) imag-ing system (Kentischer 1995). In particular a G-band filterof 9 Å bandpass centred at 4306 Å was used for the slit-jawimage acquisition. A large Echelle spectrograph with the pre-disperser was used to produce high resolution spectra in twodifferent spectral regions at the same time.
This paper is based on measurements taken on April 27,2000 when two spectral regions (both about 3 Å wide) aroundthe selected Fe II lines were recorded. The spectrograph slitwas oriented perpendicularly to the horizon to allow post-factocompensation for differential refraction. The width of the slitwas equivalent to 0.5′′. The spectral data were acquired withtwo 12 bit XEDAR CCD cameras of 1k × 1k frame. The spa-tial sampling was 0.125′′/pixel and the spectral sampling was2.14 mÅ/pixel and 3.09 mÅ/pixel for the first and second spec-tral region, respectively. The spectra were acquired simultane-ously with an exposure time of 1 s and a dwell time of 3 s. TheSJ system was equipped with a 1k × 1k 16 bit DALSA digi-tal camera operated with an exposure time of 5 ms and witha cadence of 2 frames per second. The spatial sampling was0.107′′/pixel.
The data were taken near the solar limb (µ = 0.65) and aspot in the active region NOAA 8967 was used as a target forthe AO tracking. The seeing conditions were of medium qual-ity allowing for an estimated spatial resolution of about 0.5′′.Despite the fact the AO was used to track a relatively high in-tensity gradient (small spot) few intervals of lower contrast andalso random motion of the solar image for a few tens of anarcsecond occurred during the measurements as can be seenfrom Fig. 1. Part of the slit crossed the penumbra of the spotand the rest of the slit covered the quiet atmosphere toward thelimb. The slit was oriented perpendicular to the horizon, 50◦off the north-south direction. The whole observing run startedat 10:20:54 UT and lasted for 15 min.
4. Data reduction
The spectra were photometrically reduced over the 100′′ spatialdistance along the slit. The precise reduction procedure (Wohlet al. 2002) was applied. This procedure takes the temporalchanges of the flat field conditions into account by splittingthe flat-field matrix into two components – one stable in timeconnected to camera artefacts, the other one variable in timereflecting the long-term drift of the spectrograph. High fre-quency noise was removed from the individual spectra by opti-mal filtering (Gray 1976). The effects of filtering were carefullychecked so as not to deform the profiles of the lines. The poly-nomial approximation of the dispersion was determined fromthe averaged disk centre spectra using the wavelength data ofMoore et al. (1966). The zero point of the wavelength scalewas adjusted according to the average positions of lines derivedfrom all the spectra of the run. The intensity scale was nor-malized using the quasi-continua in the spectra taking into ac-count their relation to the true continuum level (Neckel 1999).The centre-to-limb darkening of the continuum intensity was
1144 J. Rybak et al.: Indications of shock waves in the solar photosphere
0.0 0.5 1.0 1.5 2.0TIME [min]
0
1
2
3
4
5
6
SP
AT
IAL
DIR
EC
TIO
N [a
rc s
ec]
6454 Å CONTINUUM INTENSITY Ic
0.97
0.98
0.99
1.00
1.01
1.02
1.03
1.04
1.05
0.0 0.5 1.0 1.5 2.0TIME [min]
0
1
2
3
4
5
6
SP
AT
IAL
DIR
EC
TIO
N [a
rc s
ec]
Fe II 6456.38 Å LINE : RESIDUAL INTENSITY Ir
0.50
0.52
0.54
0.56
0.58
0.60
0.0 0.5 1.0 1.5 2.0TIME [min]
0
1
2
3
4
5
6
SP
AT
IAL
DIR
EC
TIO
N [a
rc s
ec]
Fe II 6456.38 Å LINE : DOPPLER VELOCITY vd [m/s]
-1250
-1000
-750
-500
-250
0
250
500
0.0 0.5 1.0 1.5 2.0TIME [min]
0
1
2
3
4
5
6
SP
AT
IAL
DIR
EC
TIO
N [a
rc s
ec]
Fe II 6456.38 Å LINE : FWHM fw [mÅ]
130
140
150
160
170
180
190
0.0 0.5 1.0 1.5 2.0TIME [min]
0
1
2
3
4
5
6
SP
AT
IAL
DIR
EC
TIO
N [a
rc s
ec]
Fe II 6456.38 Å LINE : EQUIVALENT WIDTH ew [mÅ]
65.0
67.5
70.0
72.5
75.0SEEING
0.0 0.5 1.0 1.5 2.0TIME [min]
5.6
5.8
6.0
6.2
6.4
rms(
I c)
[%]
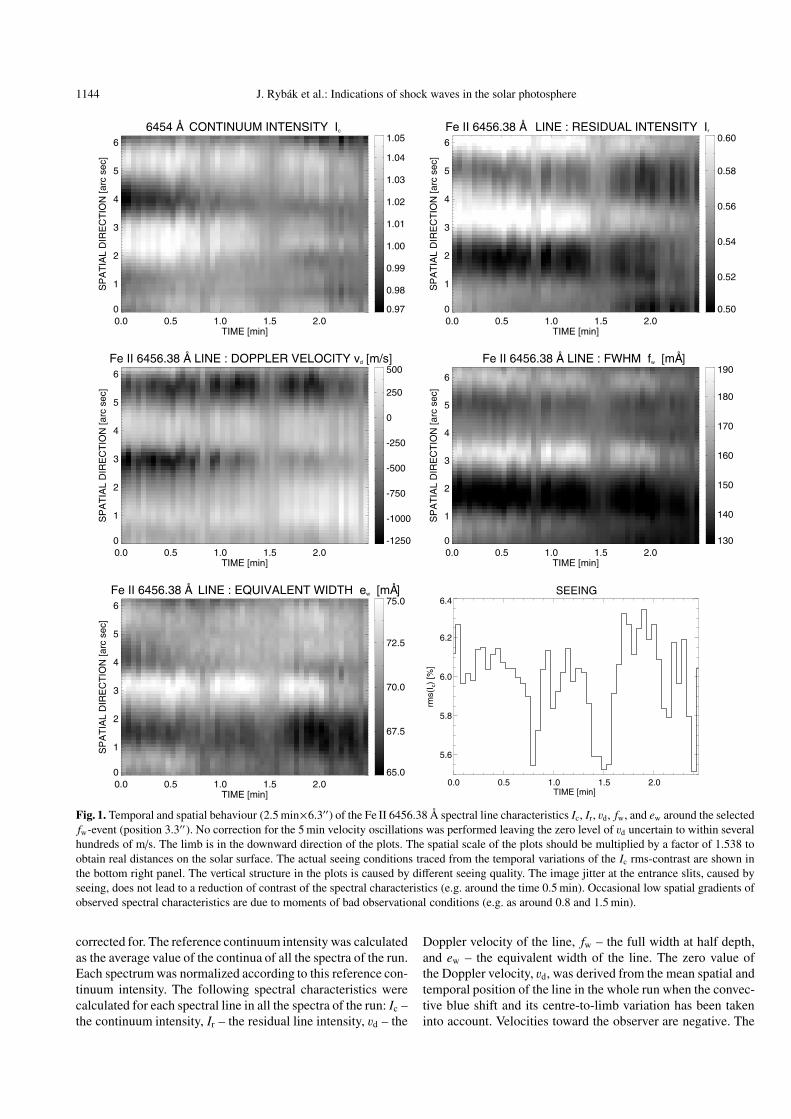
Fig. 1. Temporal and spatial behaviour (2.5 min×6.3′′) of the Fe II 6456.38 Å spectral line characteristics Ic, Ir, vd, fw, and ew around the selectedfw-event (position 3.3′′). No correction for the 5 min velocity oscillations was performed leaving the zero level of vd uncertain to within severalhundreds of m/s. The limb is in the downward direction of the plots. The spatial scale of the plots should be multiplied by a factor of 1.538 toobtain real distances on the solar surface. The actual seeing conditions traced from the temporal variations of the Ic rms-contrast are shown inthe bottom right panel. The vertical structure in the plots is caused by different seeing quality. The image jitter at the entrance slits, caused byseeing, does not lead to a reduction of contrast of the spectral characteristics (e.g. around the time 0.5 min). Occasional low spatial gradients ofobserved spectral characteristics are due to moments of bad observational conditions (e.g. as around 0.8 and 1.5 min).
corrected for. The reference continuum intensity was calculatedas the average value of the continua of all the spectra of the run.Each spectrum was normalized according to this reference con-tinuum intensity. The following spectral characteristics werecalculated for each spectral line in all the spectra of the run: Ic –the continuum intensity, Ir – the residual line intensity, vd – the
Doppler velocity of the line, fw – the full width at half depth,and ew – the equivalent width of the line. The zero value ofthe Doppler velocity, vd, was derived from the mean spatial andtemporal position of the line in the whole run when the convec-tive blue shift and its centre-to-limb variation has been takeninto account. Velocities toward the observer are negative. The
J. Rybak et al.: Indications of shock waves in the solar photosphere 1145
equivalent widths have been calculated excluding the far wingsto prevent contamination by blends.
The SJ images have also been photometrically reduced cor-recting for the mean dark current and the mean flat-field framesusing the procedures provided by Langhans (2000). The narrowfield of the SJ image along the slit was extracted (6.2′′ ×99.6′′)and co-aligned with the spectra and the empirically determineddifferential refraction was corrected for. The SJ images ac-quired during the best seeing conditions were selected for com-parison with the acquired spectra.
5. Results
According to the predictions of the numerical simulations asearch for possible shock signatures was performed in thatpart of the data set pertaining to a quiet region atmosphere(80′′ × 15 min). The only signature used in this search was theline width, fw, of the Fe II 6456.38 Å line. The line width wasselected as it shows the most remarkable line signature of theshock as was demonstrated by the simulation of spectral pro-files by Solanki et al. (1996), Steiner et al. (1998), and Gadun& Hanslmeier (2000). The line-width enhancement is producedby the large velocity gradient across the shock. In this paperonly the results of the event with the most significant signaturein line width are presented. This fw-event appeared at µ = 0.62at a distance of 70′′ from the mentioned spot toward the limb.
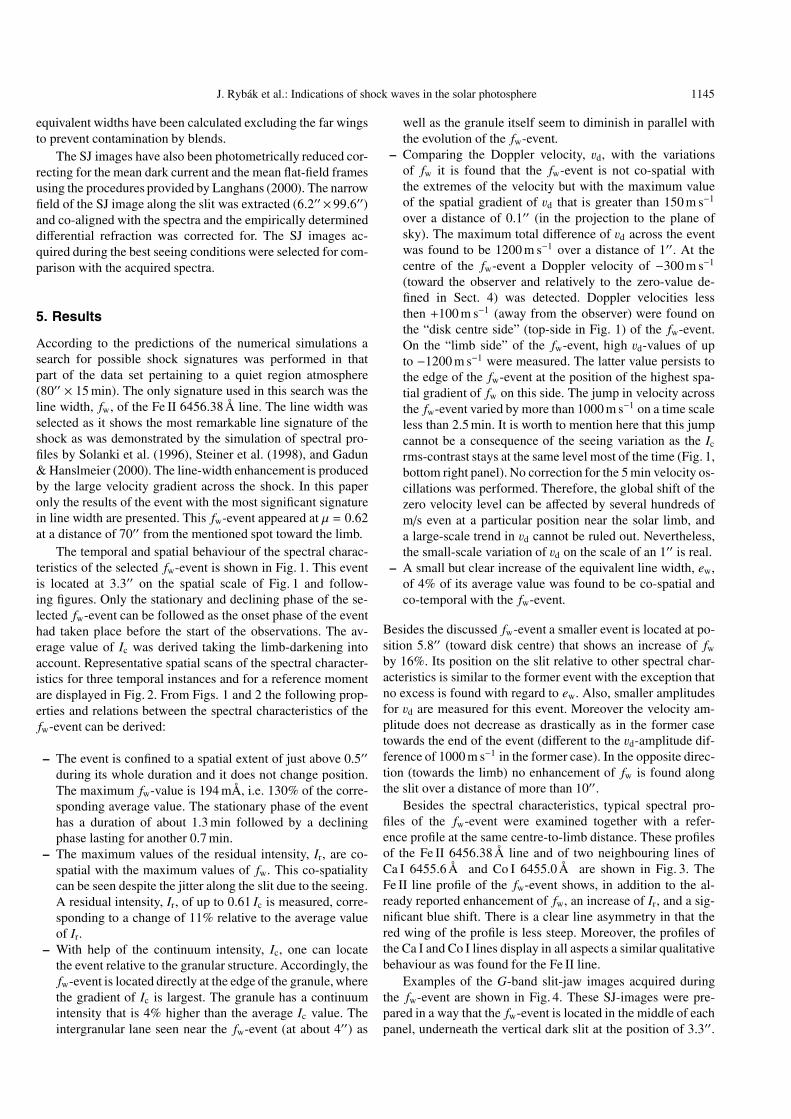
The temporal and spatial behaviour of the spectral charac-teristics of the selected fw-event is shown in Fig. 1. This eventis located at 3.3′′ on the spatial scale of Fig. 1 and follow-ing figures. Only the stationary and declining phase of the se-lected fw-event can be followed as the onset phase of the eventhad taken place before the start of the observations. The av-erage value of Ic was derived taking the limb-darkening intoaccount. Representative spatial scans of the spectral character-istics for three temporal instances and for a reference momentare displayed in Fig. 2. From Figs. 1 and 2 the following prop-erties and relations between the spectral characteristics of thefw-event can be derived:
– The event is confined to a spatial extent of just above 0.5′′during its whole duration and it does not change position.The maximum fw-value is 194 mÅ, i.e. 130% of the corre-sponding average value. The stationary phase of the eventhas a duration of about 1.3 min followed by a decliningphase lasting for another 0.7 min.
– The maximum values of the residual intensity, Ir, are co-spatial with the maximum values of fw. This co-spatialitycan be seen despite the jitter along the slit due to the seeing.A residual intensity, Ir, of up to 0.61 Ic is measured, corre-sponding to a change of 11% relative to the average valueof Ir.
– With help of the continuum intensity, Ic, one can locatethe event relative to the granular structure. Accordingly, thefw-event is located directly at the edge of the granule, wherethe gradient of Ic is largest. The granule has a continuumintensity that is 4% higher than the average Ic value. Theintergranular lane seen near the fw-event (at about 4′′) as
well as the granule itself seem to diminish in parallel withthe evolution of the fw-event.
– Comparing the Doppler velocity, vd, with the variationsof fw it is found that the fw-event is not co-spatial withthe extremes of the velocity but with the maximum valueof the spatial gradient of vd that is greater than 150 m s−1
over a distance of 0.1′′ (in the projection to the plane ofsky). The maximum total difference of vd across the eventwas found to be 1200 m s−1 over a distance of 1′′. At thecentre of the fw-event a Doppler velocity of −300 m s−1
(toward the observer and relatively to the zero-value de-fined in Sect. 4) was detected. Doppler velocities lessthen +100 m s−1 (away from the observer) were found onthe “disk centre side” (top-side in Fig. 1) of the fw-event.On the “limb side” of the fw-event, high vd-values of upto −1200 m s−1 were measured. The latter value persists tothe edge of the fw-event at the position of the highest spa-tial gradient of fw on this side. The jump in velocity acrossthe fw-event varied by more than 1000 m s−1 on a time scaleless than 2.5 min. It is worth to mention here that this jumpcannot be a consequence of the seeing variation as the Ic
rms-contrast stays at the same level most of the time (Fig. 1,bottom right panel). No correction for the 5 min velocity os-cillations was performed. Therefore, the global shift of thezero velocity level can be affected by several hundreds ofm/s even at a particular position near the solar limb, anda large-scale trend in vd cannot be ruled out. Nevertheless,the small-scale variation of vd on the scale of an 1′′ is real.
– A small but clear increase of the equivalent line width, ew,of 4% of its average value was found to be co-spatial andco-temporal with the fw-event.
Besides the discussed fw-event a smaller event is located at po-sition 5.8′′ (toward disk centre) that shows an increase of fwby 16%. Its position on the slit relative to other spectral char-acteristics is similar to the former event with the exception thatno excess is found with regard to ew. Also, smaller amplitudesfor vd are measured for this event. Moreover the velocity am-plitude does not decrease as drastically as in the former casetowards the end of the event (different to the vd-amplitude dif-ference of 1000 m s−1 in the former case). In the opposite direc-tion (towards the limb) no enhancement of fw is found alongthe slit over a distance of more than 10′′.
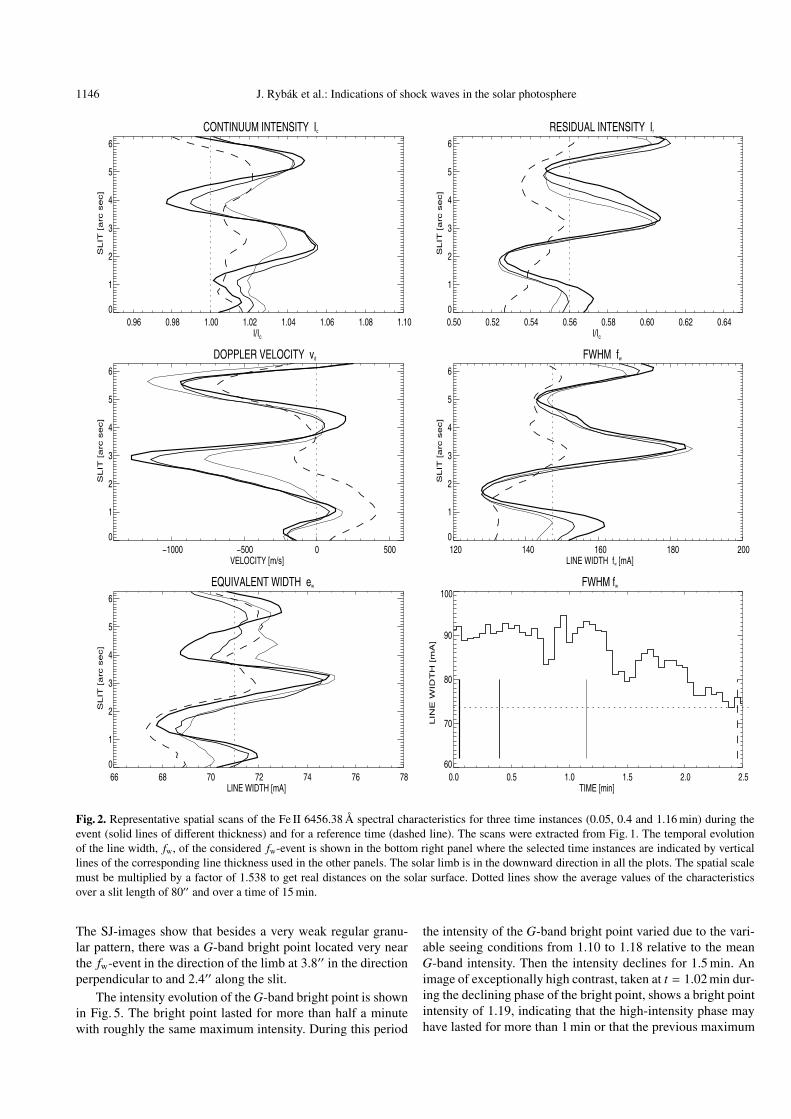
Besides the spectral characteristics, typical spectral pro-files of the fw-event were examined together with a refer-ence profile at the same centre-to-limb distance. These profilesof the Fe II 6456.38 Å line and of two neighbouring lines ofCa I 6455.6 Å and Co I 6455.0 Å are shown in Fig. 3. TheFe II line profile of the fw-event shows, in addition to the al-ready reported enhancement of fw, an increase of Ir, and a sig-nificant blue shift. There is a clear line asymmetry in that thered wing of the profile is less steep. Moreover, the profiles ofthe Ca I and Co I lines display in all aspects a similar qualitativebehaviour as was found for the Fe II line.
Examples of the G-band slit-jaw images acquired duringthe fw-event are shown in Fig. 4. These SJ-images were pre-pared in a way that the fw-event is located in the middle of eachpanel, underneath the vertical dark slit at the position of 3.3′′.
1146 J. Rybak et al.: Indications of shock waves in the solar photosphere
CONTINUUM INTENSITY Ic
0.96 0.98 1.00 1.02 1.04 1.06 1.08 1.10I/Ic
0
1
2
3
4
5
6
SL
IT [
arc
se
c]
RESIDUAL INTENSITY Ir
0.50 0.52 0.54 0.56 0.58 0.60 0.62 0.64I/Ic
0
1
2
3
4
5
6
SL
IT [
arc
se
c]
DOPPLER VELOCITY vd
−1000 −500 0 500VELOCITY [m/s]
0
1
2
3
4
5
6
SL
IT [
arc
se
c]
FWHM fw
120 140 160 180 200LINE WIDTH fw [mA]
0
1
2
3
4
5
6
SL
IT [
arc
se
c]
EQUIVALENT WIDTH ew
66 68 70 72 74 76 78LINE WIDTH [mA]
0
1
2
3
4
5
6
SL
IT [
arc
se
c]
FWHM fw
0.0 0.5 1.0 1.5 2.0 2.5TIME [min]
60
70
80
90
100
LIN
E W
IDT
H [
mA
]
Fig. 2. Representative spatial scans of the Fe II 6456.38 Å spectral characteristics for three time instances (0.05, 0.4 and 1.16 min) during theevent (solid lines of different thickness) and for a reference time (dashed line). The scans were extracted from Fig. 1. The temporal evolutionof the line width, fw, of the considered fw-event is shown in the bottom right panel where the selected time instances are indicated by verticallines of the corresponding line thickness used in the other panels. The solar limb is in the downward direction in all the plots. The spatial scalemust be multiplied by a factor of 1.538 to get real distances on the solar surface. Dotted lines show the average values of the characteristicsover a slit length of 80′′ and over a time of 15 min.
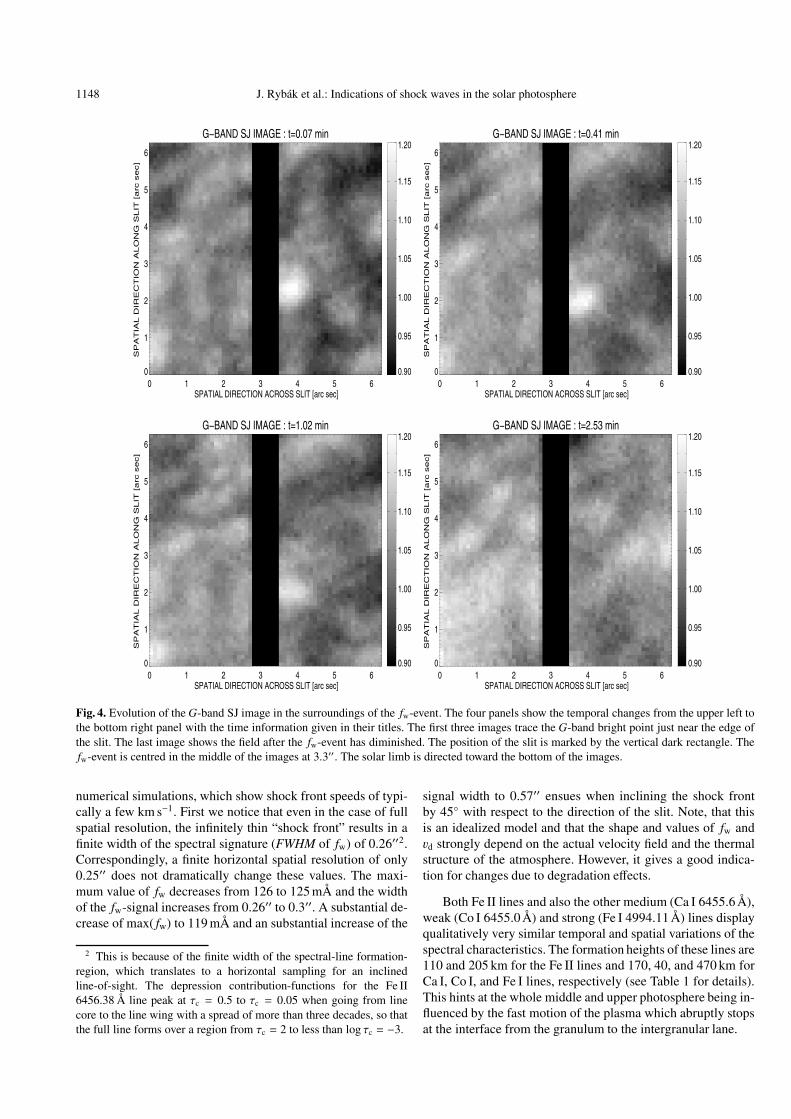
The SJ-images show that besides a very weak regular granu-lar pattern, there was a G-band bright point located very nearthe fw-event in the direction of the limb at 3.8′′ in the directionperpendicular to and 2.4′′ along the slit.
The intensity evolution of the G-band bright point is shownin Fig. 5. The bright point lasted for more than half a minutewith roughly the same maximum intensity. During this period
the intensity of the G-band bright point varied due to the vari-able seeing conditions from 1.10 to 1.18 relative to the meanG-band intensity. Then the intensity declines for 1.5 min. Animage of exceptionally high contrast, taken at t = 1.02 min dur-ing the declining phase of the bright point, shows a bright pointintensity of 1.19, indicating that the high-intensity phase mayhave lasted for more than 1 min or that the previous maximum
J. Rybak et al.: Indications of shock waves in the solar photosphere 1147
EVENT & REFERENCE SPECTRA
6455.0 6455.5 6456.0 6456.5WAVELENGTH [Å]
0.5
0.6
0.7
0.8
0.9
1.0
INT
EN
SIT
Y [
I/I c
]
Co I
Ca I Fe II
t=0.05 min
DIFFERENCE OF SPECTRA
6455.0 6455.5 6456.0 6456.5WAVELENGTH [Å]
−0.10
−0.05
0.00
0.05
0.10
INT
EN
SIT
Y [
I/I c
]
t=0.05 min
Fig. 3. Profiles of the Co I 6455.0 Å, Ca I 6455.6 Å, and Fe II6456.38 Å spectral lines of the fw-event. Upper panel: the line profilestaken during the fw-event (t = 0.05 min at slit position 3.3′′) drawnwith solid line together with the corresponding reference spectrum(dashed). The reference spectrum was prepared from spectra taken atthe same centre-to-limb distance averaging several exposures aroundthe time t = 2.5 min. The relative difference of the spectra calculatedwith an identical continuum intensity is shown in the bottom panel.The vertical dashed lines mark the line centre positions of the refer-ence spectrum.
bright point intensities (e.g., t = 0.07 and t = 0.41 min) couldbe even higher than 1.2. After two minutes, the bright pointhad diminished to the typical granular maximum intensity ofthe surrounding field.
The distance between the fw-event and the G-band brightpoint is 1.24 ± 0.25′′ in the plane of sky corresponding to2.08±0.43′′ on the solar surface. The mean value of this dis-tance and its standard deviation were calculated from the dis-tances of the bright point to the averaged fw-event positionin all SJ-frames within the first minute of the measurement.The errors obtained here come from motions of the SJ-imagecaused by seeing. No systematic motion of the fw-event andthe G-band bright point was detected under the particular see-ing conditions. Comparing the evolution of the G-band brightpoint intensity and the changes of the line width, fw, during thefw-event, a constant phase is seen over the first minute of themeasurement. In the second minute, a more rapid dimming ofthe G-band bright point intensity than the slower decline of fwwas observed.
6. Discussion
The selected fw-event fulfills the basic properties of ashock signature according to the predictions of numericalsimulations obtained for shocks outside magnetic field
concentrations (Sect. 1). The event is located at the bor-der of a granule as marked by the largest gradient of thecontinuum intensity, Ic. Its position can be clearly distin-guished, both, from the granulum area and also from themiddle of the intergranular lane (Figs. 1 and 2). The eventis co-spatial with a significant increase of the residual lineintensity, Ir, indicating that the plasma inside the event isheated up above the border of the granulum. The largestgradient of the Doppler velocity, vd, is detected at the po-sition of the event, with a maximum velocity difference of1200 m s−1. The plasma moves toward the observer on thelimb side of the fw-event with a velocity component alongthe line-of-sight of more than 1000 m s−1. At the positionof the fw-event this motion stops completely. On the oppo-site side, the intergranular plasma is at rest during the fw-event.These properties of the fw-event are in agreement with the pre-dictions of numerical simulations made by Steffen & Freytag(1991), Steffen et al. (1994), Solanki et al. (1996), Steiner et al.(1998), and by Gadun & Hanslmeier (2000).
From Figs. 1 and 2 we see that the intergranular lanes lo-cated at positions 1′′ and 4′′ that harbour downward motionin the bottom photospheric layers are not co-spatial with theenhancement of the line width, fw, so that the latter is not an im-mediate consequence of the intergranular downflow. This con-firms the conclusion made by Solanki et al. (1996) that obser-vations on the limb do not show an increase of the line width fwfrom the downward motion in the intergranular lane.
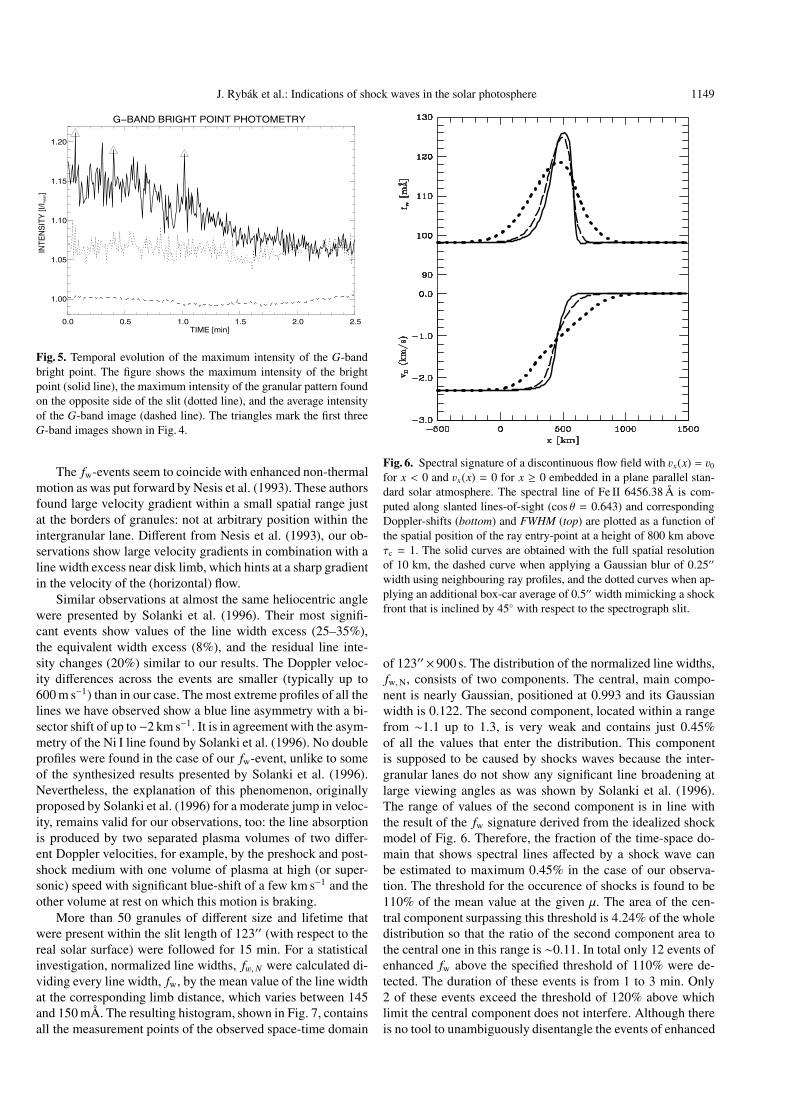
Both, the spatial extension and the amplitude of the shocksignatures are affected by the finite width of the spectral lineformation-region, seeing and instrumental effects, and the ori-entation of the shock front relative to the spectrograph slit.Hence, the measured spatial extent of the fw-signature appearsto be larger than the actual width of the shock front, and the en-hancement of the line width in the fw-event and the gradient inDoppler velocity across the fw-event is actually larger than de-tected. Therefore, the actually observed values of these parame-ters can be much different from the ones predicted from numer-ical simulations with grid constants much smaller than 0.1′′.In order to estimate these effects we have computed syntheticprofiles of Fe II 6456.38 Å from a plane-parallel standard solaratmosphere (Vernazza et al. 1981) in which we assume to exista horizontal, height-independent, constant velocity field vx(x)that abruptly stops at x = 0, mimicking a shock front, sothat vx(x) = v0 for x < 0 and vx(x) = 0 for x ≥ 0. Thespectral lines are computed along slanted lines-of-sight withcos(θ) = µ = 0.643 (θ = 50◦) so that the line is blue-shiftedfor x < 0. Figure 6 shows the line-core Doppler velocity,vd, and the line width, fw, as a function of space for the fullspatial resolution of 10 km (solid line curve) and for a simu-lated spatial resolution of 0.25′′ achieved by a Gaussian blurover individual ray profiles (dashed curve). The dotted curveshows the corresponding value, when we additionally assumethat the shock front is not perpendicular to the slit but inclinedto it by 45◦, which amounts to an additional box-car averag-ing of 0.5′′ width. The value of v0 is chosen to be 3 km s−1
in which case the “shock front” would move with a velocityc1 − v0 < vs < c2 to the left (where c1,2 is the speed of soundup- and downstream the shock front) consistent with results of
1148 J. Rybak et al.: Indications of shock waves in the solar photosphere
0 1 2 3 4 5 6SPATIAL DIRECTION ACROSS SLIT [arc sec]
0
1
2
3
4
5
6
SP
AT
IAL D
IRE
CT
ION
ALO
NG
SLIT
[arc
sec]
G−BAND SJ IMAGE : t=0.07 min
0.90
0.95
1.00
1.05
1.10
1.15
1.20
0 1 2 3 4 5 6SPATIAL DIRECTION ACROSS SLIT [arc sec]
0
1
2
3
4
5
6
SP
AT
IAL D
IRE
CT
ION
ALO
NG
SLIT
[arc
sec]
G−BAND SJ IMAGE : t=0.41 min
0.90
0.95
1.00
1.05
1.10
1.15
1.20
0 1 2 3 4 5 6SPATIAL DIRECTION ACROSS SLIT [arc sec]
0
1
2
3
4
5
6
SP
AT
IAL D
IRE
CT
ION
ALO
NG
SLIT
[arc
sec]
G−BAND SJ IMAGE : t=1.02 min
0.90
0.95
1.00
1.05
1.10
1.15
1.20
0 1 2 3 4 5 6SPATIAL DIRECTION ACROSS SLIT [arc sec]
0
1
2
3
4
5
6
SP
AT
IAL D
IRE
CT
ION
ALO
NG
SLIT
[arc
sec]
G−BAND SJ IMAGE : t=2.53 min
0.90
0.95
1.00
1.05
1.10
1.15
1.20
Fig. 4. Evolution of the G-band SJ image in the surroundings of the fw-event. The four panels show the temporal changes from the upper left tothe bottom right panel with the time information given in their titles. The first three images trace the G-band bright point just near the edge ofthe slit. The last image shows the field after the fw-event has diminished. The position of the slit is marked by the vertical dark rectangle. Thefw-event is centred in the middle of the images at 3.3′′. The solar limb is directed toward the bottom of the images.
numerical simulations, which show shock front speeds of typi-cally a few km s−1. First we notice that even in the case of fullspatial resolution, the infinitely thin “shock front” results in afinite width of the spectral signature (FWHM of fw) of 0.26′′2.Correspondingly, a finite horizontal spatial resolution of only0.25′′ does not dramatically change these values. The maxi-mum value of fw decreases from 126 to 125 mÅ and the widthof the fw-signal increases from 0.26′′ to 0.3′′. A substantial de-crease of max( fw) to 119 mÅ and an substantial increase of the
2 This is because of the finite width of the spectral-line formation-region, which translates to a horizontal sampling for an inclinedline-of-sight. The depression contribution-functions for the Fe II6456.38 Å line peak at τc = 0.5 to τc = 0.05 when going from linecore to the line wing with a spread of more than three decades, so thatthe full line forms over a region from τc = 2 to less than log τc = −3.
signal width to 0.57′′ ensues when inclining the shock frontby 45◦ with respect to the direction of the slit. Note, that thisis an idealized model and that the shape and values of fw andvd strongly depend on the actual velocity field and the thermalstructure of the atmosphere. However, it gives a good indica-tion for changes due to degradation effects.
Both Fe II lines and also the other medium (Ca I 6455.6 Å),weak (Co I 6455.0 Å) and strong (Fe I 4994.11 Å) lines displayqualitatively very similar temporal and spatial variations of thespectral characteristics. The formation heights of these lines are110 and 205 km for the Fe II lines and 170, 40, and 470 km forCa I, Co I, and Fe I lines, respectively (see Table 1 for details).This hints at the whole middle and upper photosphere being in-fluenced by the fast motion of the plasma which abruptly stopsat the interface from the granulum to the intergranular lane.
J. Rybak et al.: Indications of shock waves in the solar photosphere 1149
G−BAND BRIGHT POINT PHOTOMETRY
0.0 0.5 1.0 1.5 2.0 2.5TIME [min]
1.00
1.05
1.10
1.15
1.20
INTE
NS
ITY
[I/I m
ean]
Fig. 5. Temporal evolution of the maximum intensity of the G-bandbright point. The figure shows the maximum intensity of the brightpoint (solid line), the maximum intensity of the granular pattern foundon the opposite side of the slit (dotted line), and the average intensityof the G-band image (dashed line). The triangles mark the first threeG-band images shown in Fig. 4.
The fw-events seem to coincide with enhanced non-thermalmotion as was put forward by Nesis et al. (1993). These authorsfound large velocity gradient within a small spatial range justat the borders of granules: not at arbitrary position within theintergranular lane. Different from Nesis et al. (1993), our ob-servations show large velocity gradients in combination with aline width excess near disk limb, which hints at a sharp gradientin the velocity of the (horizontal) flow.
Similar observations at almost the same heliocentric anglewere presented by Solanki et al. (1996). Their most signifi-cant events show values of the line width excess (25–35%),the equivalent width excess (8%), and the residual line inte-sity changes (20%) similar to our results. The Doppler veloc-ity differences across the events are smaller (typically up to600 m s−1) than in our case. The most extreme profiles of all thelines we have observed show a blue line asymmetry with a bi-sector shift of up to −2 km s−1. It is in agreement with the asym-metry of the Ni I line found by Solanki et al. (1996). No doubleprofiles were found in the case of our fw-event, unlike to someof the synthesized results presented by Solanki et al. (1996).Nevertheless, the explanation of this phenomenon, originallyproposed by Solanki et al. (1996) for a moderate jump in veloc-ity, remains valid for our observations, too: the line absorptionis produced by two separated plasma volumes of two differ-ent Doppler velocities, for example, by the preshock and post-shock medium with one volume of plasma at high (or super-sonic) speed with significant blue-shift of a few km s−1 and theother volume at rest on which this motion is braking.
More than 50 granules of different size and lifetime thatwere present within the slit length of 123′′ (with respect to thereal solar surface) were followed for 15 min. For a statisticalinvestigation, normalized line widths, fw,N were calculated di-viding every line width, fw, by the mean value of the line widthat the corresponding limb distance, which varies between 145and 150 mÅ. The resulting histogram, shown in Fig. 7, containsall the measurement points of the observed space-time domain
Fig. 6. Spectral signature of a discontinuous flow field with vx(x) = v0for x < 0 and vx(x) = 0 for x ≥ 0 embedded in a plane parallel stan-dard solar atmosphere. The spectral line of Fe II 6456.38 Å is com-puted along slanted lines-of-sight (cos θ = 0.643) and correspondingDoppler-shifts (bottom) and FWHM (top) are plotted as a function ofthe spatial position of the ray entry-point at a height of 800 km aboveτc = 1. The solid curves are obtained with the full spatial resolutionof 10 km, the dashed curve when applying a Gaussian blur of 0.25′′
width using neighbouring ray profiles, and the dotted curves when ap-plying an additional box-car average of 0.5′′ width mimicking a shockfront that is inclined by 45◦ with respect to the spectrograph slit.
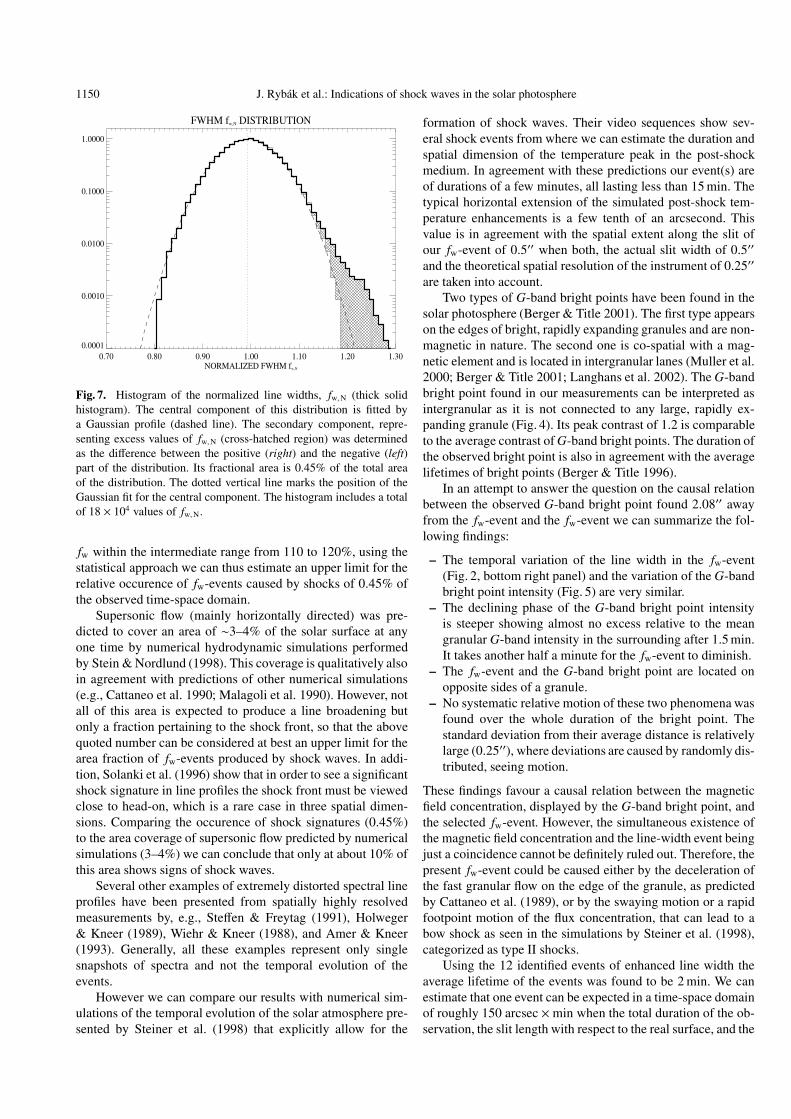
of 123′′ ×900 s. The distribution of the normalized line widths,fw,N, consists of two components. The central, main compo-nent is nearly Gaussian, positioned at 0.993 and its Gaussianwidth is 0.122. The second component, located within a rangefrom ∼1.1 up to 1.3, is very weak and contains just 0.45%of all the values that enter the distribution. This componentis supposed to be caused by shocks waves because the inter-granular lanes do not show any significant line broadening atlarge viewing angles as was shown by Solanki et al. (1996).The range of values of the second component is in line withthe result of the fw signature derived from the idealized shockmodel of Fig. 6. Therefore, the fraction of the time-space do-main that shows spectral lines affected by a shock wave canbe estimated to maximum 0.45% in the case of our observa-tion. The threshold for the occurence of shocks is found to be110% of the mean value at the given µ. The area of the cen-tral component surpassing this threshold is 4.24% of the wholedistribution so that the ratio of the second component area tothe central one in this range is ∼0.11. In total only 12 events ofenhanced fw above the specified threshold of 110% were de-tected. The duration of these events is from 1 to 3 min. Only2 of these events exceed the threshold of 120% above whichlimit the central component does not interfere. Although thereis no tool to unambiguously disentangle the events of enhanced
1150 J. Rybak et al.: Indications of shock waves in the solar photosphere
FWHM fw,N DISTRIBUTION
0.70 0.80 0.90 1.00 1.10 1.20 1.30NORMALIZED FWHM fw,N
0.0001
0.0010
0.0100
0.1000
1.0000
Fig. 7. Histogram of the normalized line widths, fw,N (thick solidhistogram). The central component of this distribution is fitted bya Gaussian profile (dashed line). The secondary component, repre-senting excess values of fw,N (cross-hatched region) was determinedas the difference between the positive (right) and the negative (left)part of the distribution. Its fractional area is 0.45% of the total areaof the distribution. The dotted vertical line marks the position of theGaussian fit for the central component. The histogram includes a totalof 18 × 104 values of fw,N.
fw within the intermediate range from 110 to 120%, using thestatistical approach we can thus estimate an upper limit for therelative occurence of fw-events caused by shocks of 0.45% ofthe observed time-space domain.
Supersonic flow (mainly horizontally directed) was pre-dicted to cover an area of ∼3–4% of the solar surface at anyone time by numerical hydrodynamic simulations performedby Stein & Nordlund (1998). This coverage is qualitatively alsoin agreement with predictions of other numerical simulations(e.g., Cattaneo et al. 1990; Malagoli et al. 1990). However, notall of this area is expected to produce a line broadening butonly a fraction pertaining to the shock front, so that the abovequoted number can be considered at best an upper limit for thearea fraction of fw-events produced by shock waves. In addi-tion, Solanki et al. (1996) show that in order to see a significantshock signature in line profiles the shock front must be viewedclose to head-on, which is a rare case in three spatial dimen-sions. Comparing the occurence of shock signatures (0.45%)to the area coverage of supersonic flow predicted by numericalsimulations (3–4%) we can conclude that only at about 10% ofthis area shows signs of shock waves.
Several other examples of extremely distorted spectral lineprofiles have been presented from spatially highly resolvedmeasurements by, e.g., Steffen & Freytag (1991), Holweger& Kneer (1989), Wiehr & Kneer (1988), and Amer & Kneer(1993). Generally, all these examples represent only singlesnapshots of spectra and not the temporal evolution of theevents.
However we can compare our results with numerical sim-ulations of the temporal evolution of the solar atmosphere pre-sented by Steiner et al. (1998) that explicitly allow for the
formation of shock waves. Their video sequences show sev-eral shock events from where we can estimate the duration andspatial dimension of the temperature peak in the post-shockmedium. In agreement with these predictions our event(s) areof durations of a few minutes, all lasting less than 15 min. Thetypical horizontal extension of the simulated post-shock tem-perature enhancements is a few tenth of an arcsecond. Thisvalue is in agreement with the spatial extent along the slit ofour fw-event of 0.5′′ when both, the actual slit width of 0.5′′and the theoretical spatial resolution of the instrument of 0.25′′are taken into account.
Two types of G-band bright points have been found in thesolar photosphere (Berger & Title 2001). The first type appearson the edges of bright, rapidly expanding granules and are non-magnetic in nature. The second one is co-spatial with a mag-netic element and is located in intergranular lanes (Muller et al.2000; Berger & Title 2001; Langhans et al. 2002). The G-bandbright point found in our measurements can be interpreted asintergranular as it is not connected to any large, rapidly ex-panding granule (Fig. 4). Its peak contrast of 1.2 is comparableto the average contrast of G-band bright points. The duration ofthe observed bright point is also in agreement with the averagelifetimes of bright points (Berger & Title 1996).
In an attempt to answer the question on the causal relationbetween the observed G-band bright point found 2.08′′ awayfrom the fw-event and the fw-event we can summarize the fol-lowing findings:
– The temporal variation of the line width in the fw-event(Fig. 2, bottom right panel) and the variation of the G-bandbright point intensity (Fig. 5) are very similar.
– The declining phase of the G-band bright point intensityis steeper showing almost no excess relative to the meangranular G-band intensity in the surrounding after 1.5 min.It takes another half a minute for the fw-event to diminish.
– The fw-event and the G-band bright point are located onopposite sides of a granule.
– No systematic relative motion of these two phenomena wasfound over the whole duration of the bright point. Thestandard deviation from their average distance is relativelylarge (0.25′′), where deviations are caused by randomly dis-tributed, seeing motion.
These findings favour a causal relation between the magneticfield concentration, displayed by the G-band bright point, andthe selected fw-event. However, the simultaneous existence ofthe magnetic field concentration and the line-width event beingjust a coincidence cannot be definitely ruled out. Therefore, thepresent fw-event could be caused either by the deceleration ofthe fast granular flow on the edge of the granule, as predictedby Cattaneo et al. (1989), or by the swaying motion or a rapidfootpoint motion of the flux concentration, that can lead to abow shock as seen in the simulations by Steiner et al. (1998),categorized as type II shocks.
Using the 12 identified events of enhanced line width theaverage lifetime of the events was found to be 2 min. We canestimate that one event can be expected in a time-space domainof roughly 150 arcsec ×min when the total duration of the ob-servation, the slit length with respect to the real surface, and the
J. Rybak et al.: Indications of shock waves in the solar photosphere 1151
number of identified events are taken into account. Additionalevents may have escaped detection because they were belowthe threshold of 110% of the mean value of the line width atthe given µ. Moreover, this estimation of the spatiotemporalfrequency of enhanced fw phenomena cannot be translated di-rectly into a probability for detecting a shock signature as someof these phenomena may have a physical origin, different fromthe only event discussed here.
It should be emphasized that performing this particular typeof studies is only possible with an extremely high spatial res-olution. On-line corrections of image distortions (Schmidt &Kentischer 1995; von der Luhe et al. 2003) are necessary toperform successful measurements of the temporal evolution ofshock signatures in the solar photosphere. In particular, largeimage field corrections are needed considering the sparse oc-curence of significant shock signatures. In our case the ob-served event was quite far from the subfield corrected by theAO setup, which caused some periods of reduced image qual-ity (Fig. 1). Dual-conjugated AO (Berkefeld et al. 2003) mayhelp to overcome these problems in future.
7. Conclusion
We have observed variations of spectral line characteristics andchanges of the line profiles that are, when compared with nu-merical simulations of convection in the solar granulation, fur-ther indications for the existence of hydrodynamic shocks inthe solar photosphere. Agreement was also found with respectto the amplitudes of the spectral characteristics during the eventwhen seeing and instrumental effects are taken into account.These results are in line with the findings of Solanki et al.(1996).
Both, the stable and the declining phases of the shock eventwere followed for the first time. A possible relation of the shockevent with a nearby G-band bright point was investigated, indi-cating a causal relationship. A final conclusion whether the fastflow and associated discontinuity (shock) are caused by eitherthe swaying motion of the flux concentration or by the granularflow not related to the magnetic field cannot definitely be made.The temporal and spatial coincidence of both features suggeststhat the flow and shock is a consequence of the swaying orrandom motion of the magnetic flux concentration, while thespatial coincidence of the line-broadening event with the edgeof a granule favours interpretation in terms of a shock that wassolely generated by the granular flow.
Acknowledgements. The VTT is operated by the Kiepenheuer-Institutfur Sonnenphysik, Freiburg, at the Observatorio del Teide of theInstituto de Astrofısica de Canarias. We would like to thank M.Sigwarth and T. Berkefeld for the operation of the AO duringour campaign and K. Langhans for his help with the SJ DALSAcamera. We thank the referee whose comments greatly helped usto improve the paper. This work was supported by the Slovakgrant agency VEGA (2/3015/23) and by the Deutsche Forschungs-gemeinschaft grant (DFG 436 SLK 113/7). This research is partof the European Solar Magnetism Network (EC/RTN contractHPRN-CT-2002-00313). A.H., A.K. and J.R. thank the Austrian andSlovak Academies of Sciences for financing the exchange of sci-entists. A.H. acknowledges the support of the Austrian Fonds zur
Forderung der Wissenschaftlichen Forschung. Finally we would liketo acknowledge our late colleague A.S. Gadun who originally initiatedthis project attracting our interest to this topic.
References
Allende Prieto, C., & Garcia Lopez, R. J. 1998, A&A, 131, 431Amer, M. A., & Kneer, F. 1993, A&A, 273, 304Berkefeld, T., Soltau, D., & Luhe, O. von der 2002, in Adaptive Optics
Systems Technologies, ed. P.L. Wizinowich, & D. Bonaccini,Proc. SPIE, 4839, 544
Berger, T. E., & Title, A. M. 1996, ApJ, 463, 365Berger, T. E., & Title, A. M. 2001, ApJ, 553, 449Cattaneo, F., Hulburt, N. E., & Toomre, J. 1989, in Stellar and Solar
Granulation, ed. R. J. Rutten, & G. Severino (Dordrecht: Kluwer),415
Cattaneo, F., Hulburt, N. E., & Toomre, J. 1990, ApJ, 349, L63Cattaneo, F. 1999, ApJ, 515, L39Deinzer, W., Hensler, G., Schussler, M., & Weisshaar, E. 1984a, A&A,
139, 426Deinzer, W., Hensler, G., Schussler, M., & Weisshaar, E. 1984b, A&A,
139, 435Emonet, T., & Cattaneo, F. 2001, ApJ, 560, L197Fox, P. A., Theobald, M. L., & Sofia, S. 1999, ApJ, 383, 860Gadun, A. S. 2000, private communicationGadun, A. S., & Hanslmeier, A. 2000, Kinematika i Fizika Nebesnykh
Tel, 16, 130Gadun, A. S., Solanki, S. K., & Johannesson, A. 1999, A&A, 350,
1018Gray, D. F. 1976, The Observation and Analysis of Stellar Atmosheres
(New York: Wiley & Sons)Grossman-Doerth, U., Schussler, M., & Solanki, S. K. 1988, A&A,
206, L37Grossman-Doerth, U., Knolker, M., Schussler, M., & Solanki, S. K.
1994, A&A, 285, 648Holweger, H., & Kneer, F. 1989, in Stellar and Solar Granulation, ed.
R. J. Rutten, & G. Severino (Dordrecht: Kluwer), 173Hurlburt, N. E., & Toomre, J. 1988, ApJ, 327, 920Kentischer, T. J. 1995, A&AS, 109, 553Knolker, M., Schussler, M., & Weisshaar, E. 1988, A&A, 194, 257Kucera, A., Rybak, J., Hanslmeier, A., & Wohl, H. 2003, Hvar
Observatory Bulletin, 27, 25Kurucz, R. L. 1990, Trans. IAU, XXB, 168 (CD-ROM 23)Langhans, K. 2000, private communicationLanghans, K., Schmidt, W., & Tritschler, A. 2002, A&A, 394, 1069Luhe, O., von der, Soltau, D., Berkefeld, T., & Schelenz, T.
2003, in Innovative Telescopes and Instrumentation for SolarAstrophysics, ed. S. L. Keil, & S. V. Avakyan, Proc. SPIE, 4853,187
Malagoli, A., Cattaneo, F., & Brummell, N.H. 1990, ApJ, 361, L33Maltby, P., Avrett, E. H., Carlsson, M., et al. 1986, ApJ, 306,284Moore, C. E. 1972, A Multiplet Table of Astrophysical Interest,
NSRDS-NBS 40 (Washington: NBS)Moore, C. E., Minnaert, M. G. J., & Houtgast, J. 1966, The Solar
Spectrum 2935 Å to 8770 Å, NBS Monograph, 61 (Washington:NBS)
Muller, R., Dollfus, A., Montagne, M., Moity, J., & Vigneau, J. 2000,A&A, 359, 373
Neckel, H. 1999, Sol. Phys., 184, 421Nesis, A., Bogdan, T. J., Cattaneo, F., et al. 1992, ApJ, 399, L99Nesis, A., Hanslmeier, A., Hammer, R., et al. 1993, A&A, 279, 599Nordlund, Å. 1984, in Small-Scale Dynamical Processes in Quiet
Stellar Atmospheres, ed. S. L. Keil (Sunspot, NM, USA), 181
1152 J. Rybak et al.: Indications of shock waves in the solar photosphere
Nordlund, Å. 1986, in Small Scale Magntic Flux Concentrations inthe Solar Photosphere, ed. W. Deinzer, M. Knolker, & H. Voigt(Gottingen: Vandenhoeck & Ruprecht), 83
Ploner, S. R. O., Solanki, S. K., & Gadun, A. S. 1999, A&A, 352, 679Rimmele, T., Dunn, R., Richards, K., Radick, R. 1999, in High
Resolution Solar Physics: Theory, Observations, and Techniques,ed. T. R. Rimmele, K. S. Balasubramaniam, & R. R. Radick, ASPConf. Ser., 183, 222
Schmidt, W., & Kentischer, T. 1995, A&AS, 113, 363Schroter, E. H., Soltau, D., & Wiehr, E. 1885, Vist. Astron., 28, 519Solanki, S. K., & Stenflo, J. O. 1985, A&A, 148, 123Solanki, S. K., Ruedi, I., Bianda, M., & Steffen, M. 1996, A&A, 308,
623Steffen, M., Ludwig, H.-G., & Kruss, A. 1989, A&A, 213, 371Steffen, M., & Freytag, B. 1991, Rev. Mod. Astron., 4, 43Steffen, M., Freytag, B., & Holweger, H. 1994, in Solar Magnetic
Fields, ed. M. Schussler, & W. Schmidt (Cambridge: CambridgeUniversity Press), 298
Stein, R. F., & Nordlund, Å. 1989, ApJ, 342, L95Stein, R. F., & Nordlund, Å. 1998, ApJ, 499, 914Stein, R. F., & Nordlund, Å. 2002, in Magnetic Coupling of the Solar
Atmosphere Euroconference and IAU Colloquium 188, ed. H.Sawaya-Lacoste, ESA SP-505 (Noordwijk, Netherlands), 83
Steiner, O., Grossman-Doerth, U., Knolker, M., & Schussler, M.1994, in Solar Magnetic Fields, ed. M. Schussler, & W. Schmidt(Cambridge: Cambridge University Press), 282
Steiner, O., Grossman-Doerth, U., Knolker, M., & Schussler, M. 1998,ApJ, 495, 468
Vernazza, J. E., Avrett, E. H., & Loeser, R. 1981, ApJS, 45, 635Vogler, A., & Schussler, M. 2003, Astron. Nachr. 324, 399Weiss, N. O., Brownjohn, D. P., Matthews, P. C., & Proctor, M. R. E.
1996, MNRAS, 283, 1153Wiehr, E., & Kneer, F. 1988, A&A, 195, 310Wohl, H., Kucera, A., Rybak, J., & Hanslmeier, A. 2002, A&A, 394,
1077


![4.1.1] plane waves](https://static.fdokumen.com/doc/165x107/6322513728c445989105b845/411-plane-waves.jpg)