
India’s Post Reform Growth Experience: Regional Perspectives with Special Focus on Assam
14
1 India’s Post Reform Growth Experience: Regional Perspectives with Special Focus on Assam Bipul Kumar Das 1 Dimpal Dekaraja 2 Abstract: It is well known that India move to a high growth path by the year 1993-94 following the wide ranging economic reform process initiated in1991. After a decade of high growth, it was realized that the growth process primarily benefited only a segment of the Indian population. Hence the 11th plan call for inclusive growth and the 12th plan document now proposing greater inclusive growth. Inclusive growth is supposed to enable segments of population, communities and regions left out from the benefit of high growth to participate in the growth process and start enjoying the fruits of it. The problem of inclusive growth can be viewed from different angles and at different dimensions. For this data are collected from various government websites, such as http://www.indiabudget.nic.in, http://www.planning commission.nic.in and http://www.finmin.nic.in. It is found that the per capita NSDP of different states of India varies from NNP per capita. Again the population below poverty line of India decreases, but the population below poverty line of the states having lower per capita NSDP gets increases, e.g., Assam. Again the states having the higher per capita NSDP grab more FDI inflows. Thus we can conclude by saying that higher per capita income states have lower population below poverty line and received more FDI inflows, while lower per capita NSDP states have higher population below poverty line and received fewer amounts of FDI inflows. Again the leading sectors, which drive the Indian growth process very high, have completely failed in Assam. Key Words: Inclusive growth, Per capita NSDP, NNP per capita, Poverty, Manufacturing, Service sector, and FDI. 1 A research Scholar of Gauhati University, E-mail: [email protected], Mobile: 9706159009. 2 A research Scholar of Gauhati University, E-mail: [email protected], Mobile: 9508788128.
Transcript of India’s Post Reform Growth Experience: Regional Perspectives with Special Focus on Assam
1
India’s Post Reform Growth Experience: Regional
Perspectives with Special Focus on Assam
Bipul Kumar Das1
Dimpal Dekaraja2
Abstract:
It is well known that India move to a high growth path by the year 1993-94 following
the wide ranging economic reform process initiated in1991. After a decade of high
growth, it was realized that the growth process primarily benefited only a segment of
the Indian population. Hence the 11th plan call for inclusive growth and the 12th plan
document now proposing greater inclusive growth. Inclusive growth is supposed to
enable segments of population, communities and regions left out from the benefit of
high growth to participate in the growth process and start enjoying the fruits of it. The
problem of inclusive growth can be viewed from different angles and at different
dimensions. For this data are collected from various government websites, such as
http://www.indiabudget.nic.in, http://www.planning commission.nic.in and
http://www.finmin.nic.in. It is found that the per capita NSDP of different states of
India varies from NNP per capita. Again the population below poverty line of India
decreases, but the population below poverty line of the states having lower per capita
NSDP gets increases, e.g., Assam. Again the states having the higher per capita
NSDP grab more FDI inflows. Thus we can conclude by saying that higher per capita
income states have lower population below poverty line and received more FDI
inflows, while lower per capita NSDP states have higher population below poverty
line and received fewer amounts of FDI inflows. Again the leading sectors, which
drive the Indian growth process very high, have completely failed in Assam.
Key Words: Inclusive growth, Per capita NSDP, NNP per capita, Poverty,
Manufacturing, Service sector, and FDI.
1 A research Scholar of Gauhati University, E-mail: [email protected], Mobile: 9706159009.
2 A research Scholar of Gauhati University, E-mail: [email protected], Mobile: 9508788128.
2
1. INTRODUCTION:
It is well known that India move to a high growth path by the year 1992-93 following
the wide ranging economic reform process initiated in 1991. After a decade of high growth, it
was realised that the growth process primarily benefited only a segment of the Indian
population. Hence the 11th
plan call for inclusive growth and the 12th
plan document now
proposing greater inclusive growth. Inclusive growth is supposed to enable segments of
population, communities and regions left out from benefits of high growth to participate in
the growth process and starts enjoying the fruits of it. The inclusive growth approach takes a
longer term perspective as the focus is on productive employment rather than on direct
income redistribution, as a means of increasing incomes for excluded groups. The problem of
inclusive growth can be viewed from different angles and at different dimensions.
Growth and inclusiveness were presented as coequal objectives in recognition of the fact that GDP
growth can never be an end in itself However, faster growth especially of a particular type,
accompanied by economic and social support programmes, which are themselves made more
feasible by high growth and buoyant revenues, can bring about an improvement in incomes and
living standards for the bulk of the population, which is the end objective (Ahluwalia, 2011).
The present paper is an attempt to capture to what extent per capita income growth in
different states of India represents a convergent growth process or persistence of divergent
income levels. The paper also examines Assam’s growth experience during the period at a
sectoral level focusing mainly on specific sectors which have been the drivers of the Indian
high growth story.
This paper has been divided into five broad sections. The introduction in the first
section is followed by the objectives of the paper in the second section. The third section
deals with the data source and methodology of this paper. The fourth section deals with the
detail analysis of the growth experience of major Indian states and examines Assam’s growth
experience at a sectoral level in the post reform period. The fifth section presents the
conclusions of the paper with some findings.
2. OBJECTIVES:
The main objectives of the paper are
a) To see in what extent per capita Net State Domestic Product (NSDP) of different
states are differ from Net National Product (NNP) per capita.
3
b) To examine Assam’s growth experience at a sectoal level after the economic reform.
c) To see the amount of FDI inflows into the states or regions of India after economic
reforms.
3. DATA SOURCE AND METHODOLOGY:
This paper is entirely based on secondary data. The data are collected from various
government websites viz., http://www.indiabudget.nic.in, http://www.planning
commission.nic.in and http://www.finmin.nic.in. The paper tried to compare the Assam’s
growth performance with some of the major Indian states and the amount of FDI inflows into
the states and other regions of the country. For analysis, the data are rearranged
systematically and formulated in tabular forms for the convenience of analysis. Again Bar
charts, addition, subtraction, average and percentages have been done by using Microsoft
excel.
4. ANALYSIS AND DISCUSSION ON THE GROWTH FRONT:
In this section the state wise Indian growth process has been tried to be analysed at a
sectoral level since the early 1990s i.e., after the economic reforms. For this some of the
important indicators of high growth has been selected and tried to be enumerate their
performance over the years. These important indicators are the gap between per capita NSDP
and NNP per capita, number of population below poverty line, contribution of manufacturing
sector and service sector to the NSDP, and the amount of FDI inflows. These are the major
indicators which have been a major role in Indian high growth story. The details are analysed
with the following headings:
4.1. Difference between Per Capita NSDP and NNP Per Capita:
The difference between the per capita Net State Domestic Product (NSDP) and Net
National Product (NNP) per capita represents to what extent different states are lagging
behind to the national average or to what extent states are leading to the national average.
Here we tried to see whether the gap between the per capita NSDP of major Indian States and
the NNP per capita increases or decreases or remain the same over the post reform period.
Emphasis is given to the North-Eastern region (especially Assam). This will give us a clear
picture about the impact of the economic reforms on the North Eastern States (especially
Assam) and on other states or region of India.
4
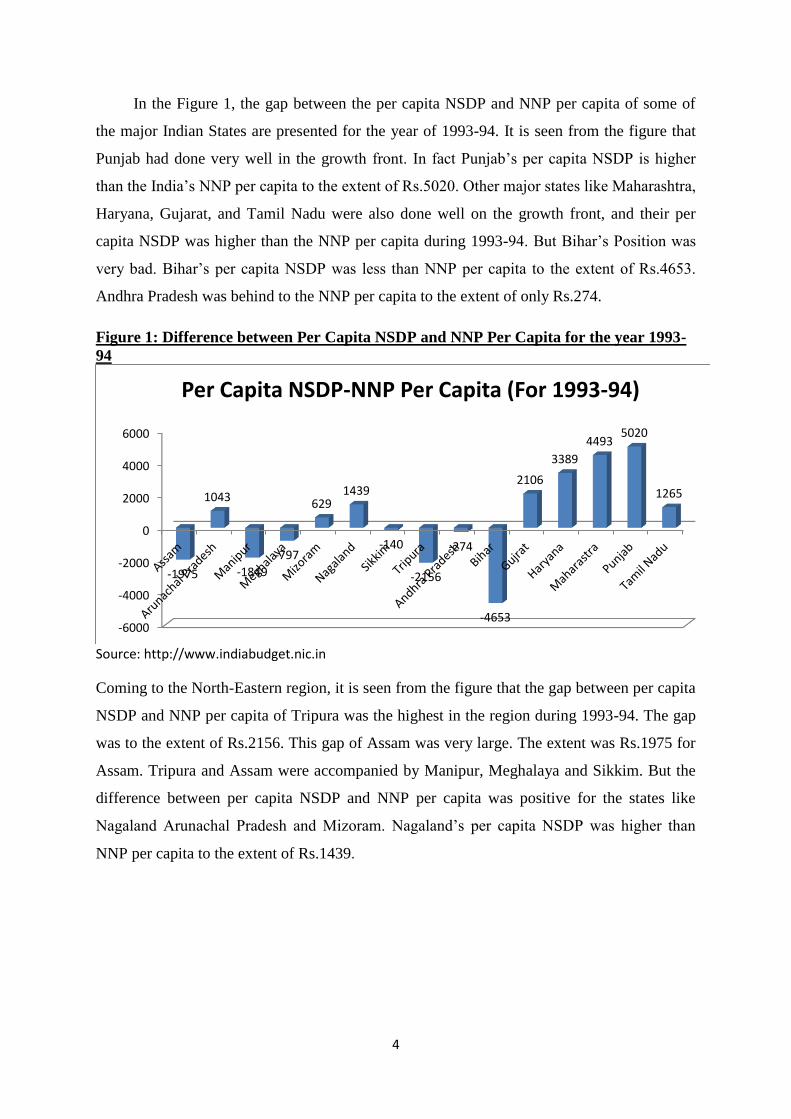
In the Figure 1, the gap between the per capita NSDP and NNP per capita of some of
the major Indian States are presented for the year of 1993-94. It is seen from the figure that
Punjab had done very well in the growth front. In fact Punjab’s per capita NSDP is higher
than the India’s NNP per capita to the extent of Rs.5020. Other major states like Maharashtra,
Haryana, Gujarat, and Tamil Nadu were also done well on the growth front, and their per
capita NSDP was higher than the NNP per capita during 1993-94. But Bihar’s Position was
very bad. Bihar’s per capita NSDP was less than NNP per capita to the extent of Rs.4653.
Andhra Pradesh was behind to the NNP per capita to the extent of only Rs.274.
Figure 1: Difference between Per Capita NSDP and NNP Per Capita for the year 1993-
94
Source: http://www.indiabudget.nic.in
Coming to the North-Eastern region, it is seen from the figure that the gap between per capita
NSDP and NNP per capita of Tripura was the highest in the region during 1993-94. The gap
was to the extent of Rs.2156. This gap of Assam was very large. The extent was Rs.1975 for
Assam. Tripura and Assam were accompanied by Manipur, Meghalaya and Sikkim. But the
difference between per capita NSDP and NNP per capita was positive for the states like
Nagaland Arunachal Pradesh and Mizoram. Nagaland’s per capita NSDP was higher than
NNP per capita to the extent of Rs.1439.
-6000
-4000
-2000
0
2000
4000
6000
-1975
1043
-1849
-797
629 1439
-140
-2156
-274
-4653
2106
3389
4493 5020
1265
Per Capita NSDP-NNP Per Capita (For 1993-94)
5
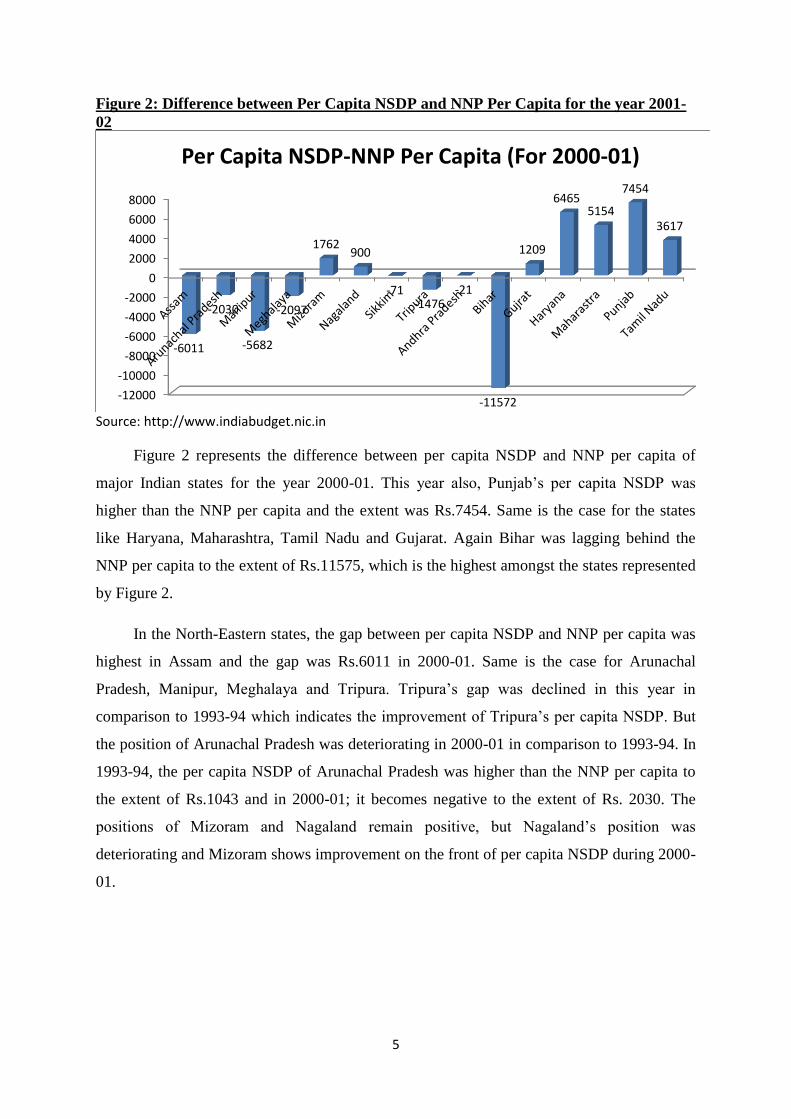
Figure 2: Difference between Per Capita NSDP and NNP Per Capita for the year 2001-
02
Source: http://www.indiabudget.nic.in
Figure 2 represents the difference between per capita NSDP and NNP per capita of
major Indian states for the year 2000-01. This year also, Punjab’s per capita NSDP was
higher than the NNP per capita and the extent was Rs.7454. Same is the case for the states
like Haryana, Maharashtra, Tamil Nadu and Gujarat. Again Bihar was lagging behind the
NNP per capita to the extent of Rs.11575, which is the highest amongst the states represented
by Figure 2.
In the North-Eastern states, the gap between per capita NSDP and NNP per capita was
highest in Assam and the gap was Rs.6011 in 2000-01. Same is the case for Arunachal
Pradesh, Manipur, Meghalaya and Tripura. Tripura’s gap was declined in this year in
comparison to 1993-94 which indicates the improvement of Tripura’s per capita NSDP. But
the position of Arunachal Pradesh was deteriorating in 2000-01 in comparison to 1993-94. In
1993-94, the per capita NSDP of Arunachal Pradesh was higher than the NNP per capita to
the extent of Rs.1043 and in 2000-01; it becomes negative to the extent of Rs. 2030. The
positions of Mizoram and Nagaland remain positive, but Nagaland’s position was
deteriorating and Mizoram shows improvement on the front of per capita NSDP during 2000-
01.
-12000
-10000
-8000
-6000
-4000
-2000
0
2000
4000
6000
8000
-6011
-2030
-5682
-2097
1762 900
-71 -1476
-21
-11572
1209
6465 5154
7454
3617
Per Capita NSDP-NNP Per Capita (For 2000-01)
6
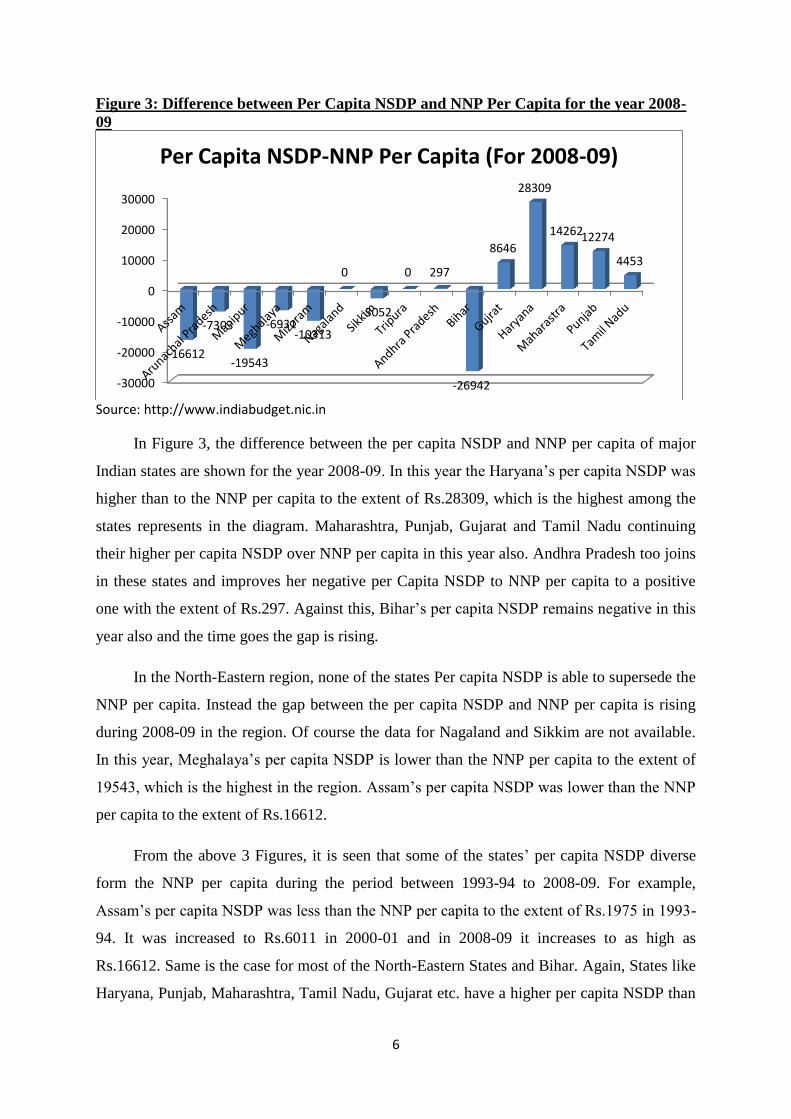
Figure 3: Difference between Per Capita NSDP and NNP Per Capita for the year 2008-
09
Source: http://www.indiabudget.nic.in
In Figure 3, the difference between the per capita NSDP and NNP per capita of major
Indian states are shown for the year 2008-09. In this year the Haryana’s per capita NSDP was
higher than to the NNP per capita to the extent of Rs.28309, which is the highest among the
states represents in the diagram. Maharashtra, Punjab, Gujarat and Tamil Nadu continuing
their higher per capita NSDP over NNP per capita in this year also. Andhra Pradesh too joins
in these states and improves her negative per Capita NSDP to NNP per capita to a positive
one with the extent of Rs.297. Against this, Bihar’s per capita NSDP remains negative in this
year also and the time goes the gap is rising.
In the North-Eastern region, none of the states Per capita NSDP is able to supersede the
NNP per capita. Instead the gap between the per capita NSDP and NNP per capita is rising
during 2008-09 in the region. Of course the data for Nagaland and Sikkim are not available.
In this year, Meghalaya’s per capita NSDP is lower than the NNP per capita to the extent of
19543, which is the highest in the region. Assam’s per capita NSDP was lower than the NNP
per capita to the extent of Rs.16612.
From the above 3 Figures, it is seen that some of the states’ per capita NSDP diverse
form the NNP per capita during the period between 1993-94 to 2008-09. For example,
Assam’s per capita NSDP was less than the NNP per capita to the extent of Rs.1975 in 1993-
94. It was increased to Rs.6011 in 2000-01 and in 2008-09 it increases to as high as
Rs.16612. Same is the case for most of the North-Eastern States and Bihar. Again, States like
Haryana, Punjab, Maharashtra, Tamil Nadu, Gujarat etc. have a higher per capita NSDP than
-30000
-20000
-10000
0
10000
20000
30000
-16612
-7303
-19543
-6931 -10313
0
-3052
0 297
-26942
8646
28309
14262 12274
4453
Per Capita NSDP-NNP Per Capita (For 2008-09)
7
the NNP per capita. The per capita NSDP of these states rises continuously during the period
from 1993-94 to 2000-01. They are diverse positively from the NNP per capita. This makes a
serious imbalance among the states for per capita NSDP i.e., the richer states becoming richer
and the poorer states becoming poorer. Therefore, economic reforms is fail to reduce the
regional disparities among the states and leads the gap more and more wide.
The growth rate of India’s NNP per capita during 1993-94 to 2000-01 was 11.74% in
each year on an average while the average growth rate of Assam’s per capita NSDP was
9.39% during the same period. Again, the average growth rate of NNP per capita during
2000-01 to 2008-09 was 13.50%, while the average growth rate of Assam’s per capita NSDP
was 12.20%. Therefore, Assam’s per capita income growth is also lower than the national
level.
4.2. Number and Percentage of Population below Poverty Line:
A decrease in the number or percentage of population lying below poverty line of a
state indicates a higher growth rate and proper implementation of various social support
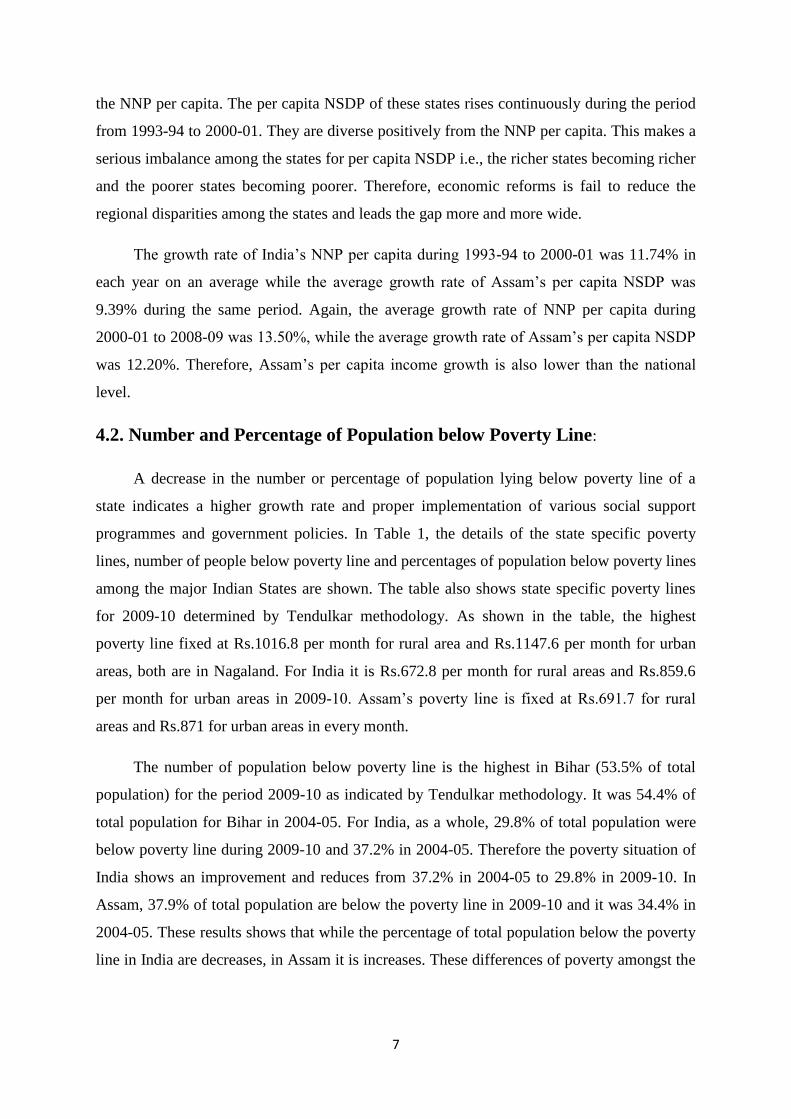
programmes and government policies. In Table 1, the details of the state specific poverty
lines, number of people below poverty line and percentages of population below poverty lines
among the major Indian States are shown. The table also shows state specific poverty lines
for 2009-10 determined by Tendulkar methodology. As shown in the table, the highest
poverty line fixed at Rs.1016.8 per month for rural area and Rs.1147.6 per month for urban
areas, both are in Nagaland. For India it is Rs.672.8 per month for rural areas and Rs.859.6
per month for urban areas in 2009-10. Assam’s poverty line is fixed at Rs.691.7 for rural
areas and Rs.871 for urban areas in every month.
The number of population below poverty line is the highest in Bihar (53.5% of total
population) for the period 2009-10 as indicated by Tendulkar methodology. It was 54.4% of
total population for Bihar in 2004-05. For India, as a whole, 29.8% of total population were
below poverty line during 2009-10 and 37.2% in 2004-05. Therefore the poverty situation of
India shows an improvement and reduces from 37.2% in 2004-05 to 29.8% in 2009-10. In
Assam, 37.9% of total population are below the poverty line in 2009-10 and it was 34.4% in
2004-05. These results shows that while the percentage of total population below the poverty
line in India are decreases, in Assam it is increases. These differences of poverty amongst the
8
states reflect the differences in the pace and nature of growth in each state and also shows the
differences in the implementation of the anti-poverty schemes in each states.
Source: http://planningcommission.nic.in
4.3. Manufacturing:
The growth of manufacturing sectors indicates the industrial development of the state
or region. An increase in the production of various manufacturing products leads to an
increase in income and employment. Therefore a well-developed manufacturing sector is
desirable to each and every state or region. Table 2 shows the contribution of manufacturing
sector to India’s Gross Domestic Product (GDP) at factor cost (current prices) and to NSDP
at factor cost (current prices) of Assam. We can see from the table that, in 2004-05, the
Table 1: State Specific Poverty Lines, Number and Percentage of Population below Poverty Line
by States - 2004-05 & 2009-10
States
State Specific
Poverty Lines
for 2009-10
Tendulkar Methodology (2009-10) Tendulkar Methodology (2004-05)
Monthly per
Capita (Rs.) Rural Urban Total
Rural Urban Total
Rural Urban
% age
of
Persons
% age
of
Persons
% age
of
Persons
No. of
Persons
(lakhs)
% age
of
Persons
% age
of
Persons
% age
of
Persons
No. of
Persons
(lakhs)
Arunachal
Pradesh 773.7 925.2 26.2 24.9 25.9 3.5 33.6 23.5 31.4 3.8
Assam 691.7 871 39.9 26.1 37.9 116.4 36.4 21.8 34.4 97.7
Manipur 871 955 47.4 46.4 47.1 12.5 39.3 34.5 37.9 9
Meghalaya 686.9 989.8 15.3 24.1 17.1 4.9 14 24.7 16.1 4.1
Mizoram 850 939.3 31.1 11.5 21.1 2.3 23 7.9 15.4 1.5
Nagaland 1016.8 1147.6 19.3 25 20.9 4.1 10 4.3 8.8 1.7
Sikkim 728.9 1035.2 15.5 5 13.1 0.8 31.8 25.9 30.9 1.7
Tripura 663.4 782.7 19.8 10 17.4 6.3 44.5 22.5 40 13.4
Andhra
Pradesh 693.8 926.4 22.8 17.7 21.1 176.6 32.3 23.4 29.6 235.1
Bihar 655.6 775.3 55.3 39.4 53.5 543.5 55.7 43.7 54.4 493.8
Gujarat 725.9 951.4 26.7 17.9 23 136.2 39.1 20.1 31.6 171.4
Haryana 791.6 975.4 18.6 23 20.1 50 24.8 22.4 24.1 54.6
Maharashtra 743.7 961.1 29.5 18.3 24.5 270.8 47.9 25.6 38.2 392.4
Punjab 830 960.8 14.6 18.1 15.9 43.5 22.1 18.7 20.9 53.6
Tamil Nadu 639 800.8 21.2 12.8 17.1 121.8 37.5 19.7 29.4 194.1
India 672.8 859.6 33.8 20.9 29.8 3,546.80 42 25.5 37.2 4,072.20
9
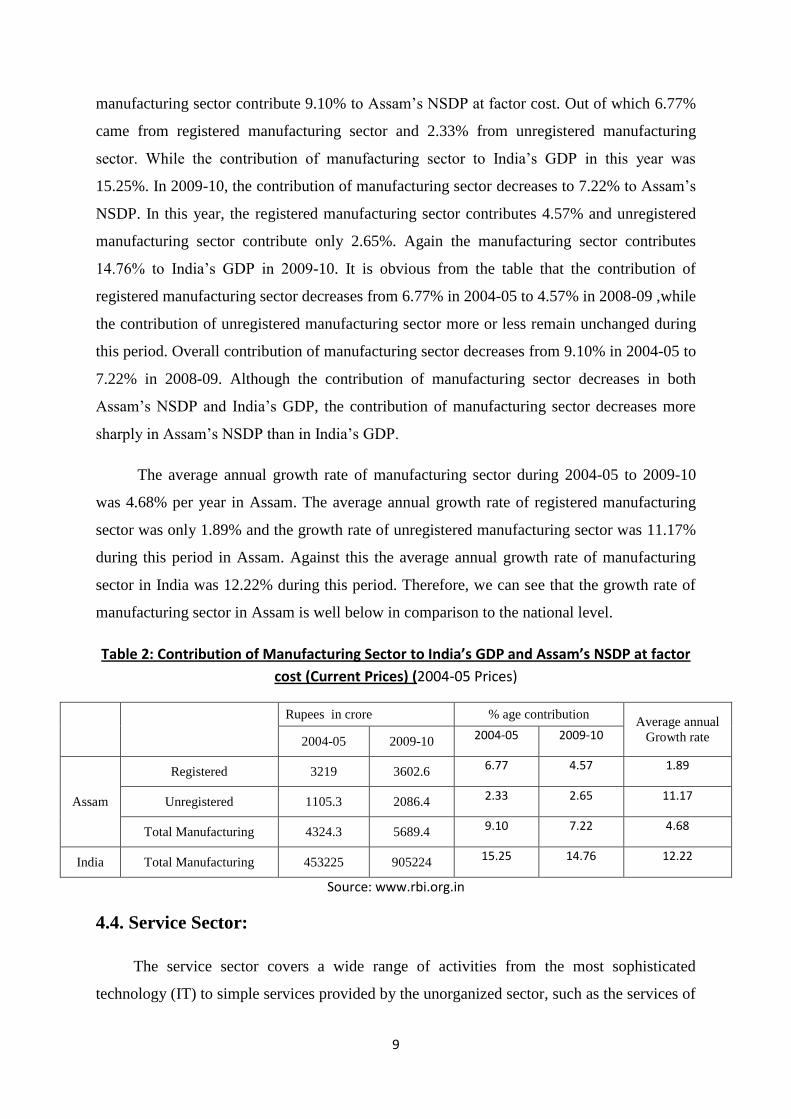
manufacturing sector contribute 9.10% to Assam’s NSDP at factor cost. Out of which 6.77%
came from registered manufacturing sector and 2.33% from unregistered manufacturing
sector. While the contribution of manufacturing sector to India’s GDP in this year was
15.25%. In 2009-10, the contribution of manufacturing sector decreases to 7.22% to Assam’s
NSDP. In this year, the registered manufacturing sector contributes 4.57% and unregistered
manufacturing sector contribute only 2.65%. Again the manufacturing sector contributes
14.76% to India’s GDP in 2009-10. It is obvious from the table that the contribution of
registered manufacturing sector decreases from 6.77% in 2004-05 to 4.57% in 2008-09 ,while
the contribution of unregistered manufacturing sector more or less remain unchanged during
this period. Overall contribution of manufacturing sector decreases from 9.10% in 2004-05 to
7.22% in 2008-09. Although the contribution of manufacturing sector decreases in both
Assam’s NSDP and India’s GDP, the contribution of manufacturing sector decreases more
sharply in Assam’s NSDP than in India’s GDP.
The average annual growth rate of manufacturing sector during 2004-05 to 2009-10
was 4.68% per year in Assam. The average annual growth rate of registered manufacturing
sector was only 1.89% and the growth rate of unregistered manufacturing sector was 11.17%
during this period in Assam. Against this the average annual growth rate of manufacturing
sector in India was 12.22% during this period. Therefore, we can see that the growth rate of
manufacturing sector in Assam is well below in comparison to the national level.
Table 2: Contribution of Manufacturing Sector to India’s GDP and Assam’s NSDP at factor
cost (Current Prices) (2004-05 Prices)
Rupees in crore % age contribution Average annual
Growth rate 2004-05 2009-10 2004-05 2009-10
Assam
Registered 3219 3602.6 6.77 4.57 1.89
Unregistered 1105.3 2086.4 2.33 2.65 11.17
Total Manufacturing 4324.3 5689.4 9.10 7.22 4.68
India Total Manufacturing 453225 905224 15.25 14.76 12.22
Source: www.rbi.org.in
4.4. Service Sector:
The service sector covers a wide range of activities from the most sophisticated
technology (IT) to simple services provided by the unorganized sector, such as the services of
10
the barber and plumber. National accounts classification of the service sector incorporates
trade, hotels and restaurants; transport, storage and communication; financing, insurance, real
estates and business services, and community, social and personal services. But in this paper
we see the performance (growth) of the trade, hotels and restaurants; transport, storage and
communication; finance, real estates, banking and insurance and business services sector of
Assam and compare with the growth of these sectors in India.
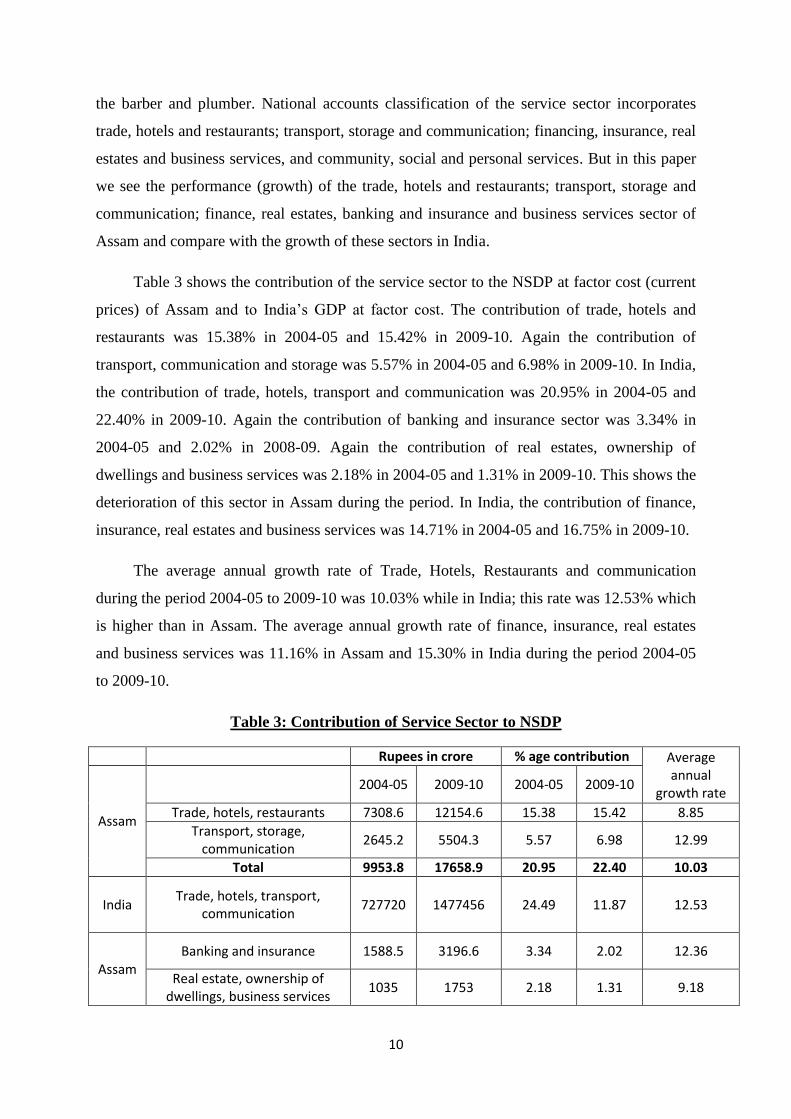
Table 3 shows the contribution of the service sector to the NSDP at factor cost (current
prices) of Assam and to India’s GDP at factor cost. The contribution of trade, hotels and
restaurants was 15.38% in 2004-05 and 15.42% in 2009-10. Again the contribution of
transport, communication and storage was 5.57% in 2004-05 and 6.98% in 2009-10. In India,
the contribution of trade, hotels, transport and communication was 20.95% in 2004-05 and
22.40% in 2009-10. Again the contribution of banking and insurance sector was 3.34% in
2004-05 and 2.02% in 2008-09. Again the contribution of real estates, ownership of
dwellings and business services was 2.18% in 2004-05 and 1.31% in 2009-10. This shows the
deterioration of this sector in Assam during the period. In India, the contribution of finance,
insurance, real estates and business services was 14.71% in 2004-05 and 16.75% in 2009-10.
The average annual growth rate of Trade, Hotels, Restaurants and communication
during the period 2004-05 to 2009-10 was 10.03% while in India; this rate was 12.53% which
is higher than in Assam. The average annual growth rate of finance, insurance, real estates
and business services was 11.16% in Assam and 15.30% in India during the period 2004-05
to 2009-10.
Table 3: Contribution of Service Sector to NSDP
Rupees in crore % age contribution Average annual
growth rate
Assam
2004-05 2009-10 2004-05 2009-10
Trade, hotels, restaurants 7308.6 12154.6 15.38 15.42 8.85
Transport, storage, communication
2645.2 5504.3 5.57 6.98 12.99
Total 9953.8 17658.9 20.95 22.40 10.03
India Trade, hotels, transport,
communication 727720 1477456 24.49 11.87 12.53
Assam Banking and insurance 1588.5 3196.6 3.34 2.02 12.36
Real estate, ownership of dwellings, business services
1035 1753 2.18 1.31 9.18
11
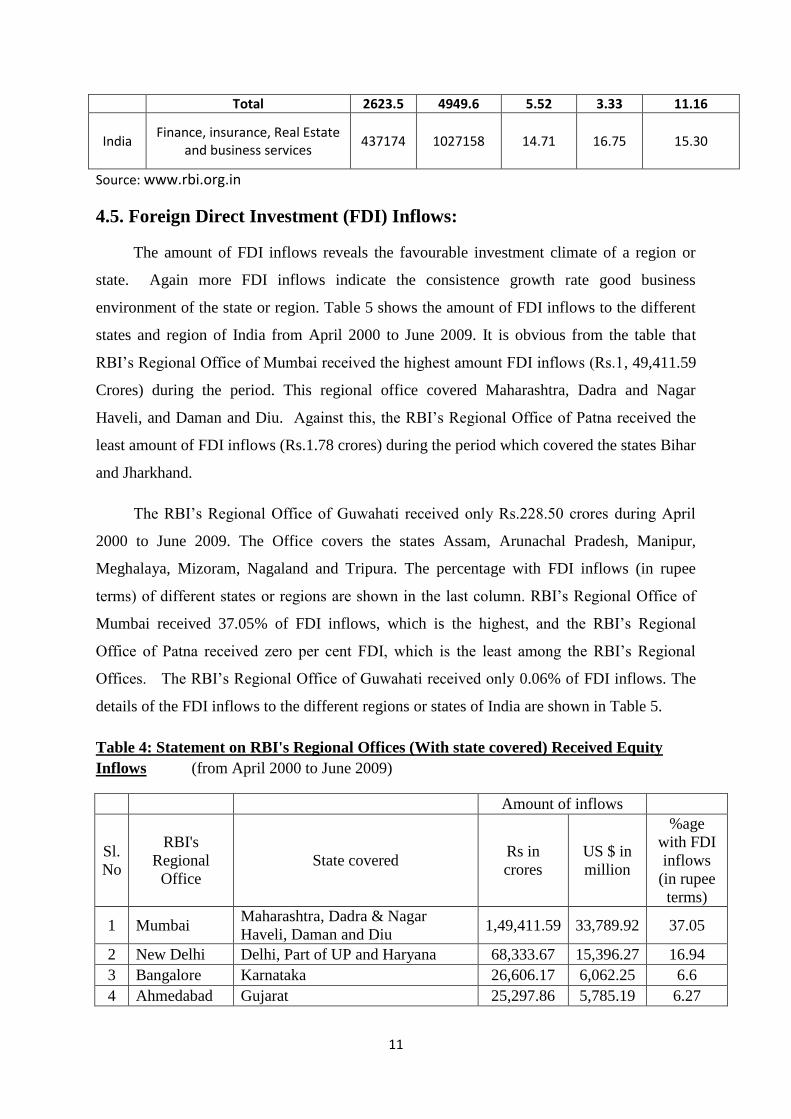
Total 2623.5 4949.6 5.52 3.33 11.16
India Finance, insurance, Real Estate
and business services 437174 1027158 14.71 16.75 15.30
Source: www.rbi.org.in
4.5. Foreign Direct Investment (FDI) Inflows:
The amount of FDI inflows reveals the favourable investment climate of a region or
state. Again more FDI inflows indicate the consistence growth rate good business
environment of the state or region. Table 5 shows the amount of FDI inflows to the different
states and region of India from April 2000 to June 2009. It is obvious from the table that
RBI’s Regional Office of Mumbai received the highest amount FDI inflows (Rs.1, 49,411.59
Crores) during the period. This regional office covered Maharashtra, Dadra and Nagar
Haveli, and Daman and Diu. Against this, the RBI’s Regional Office of Patna received the
least amount of FDI inflows (Rs.1.78 crores) during the period which covered the states Bihar
and Jharkhand.
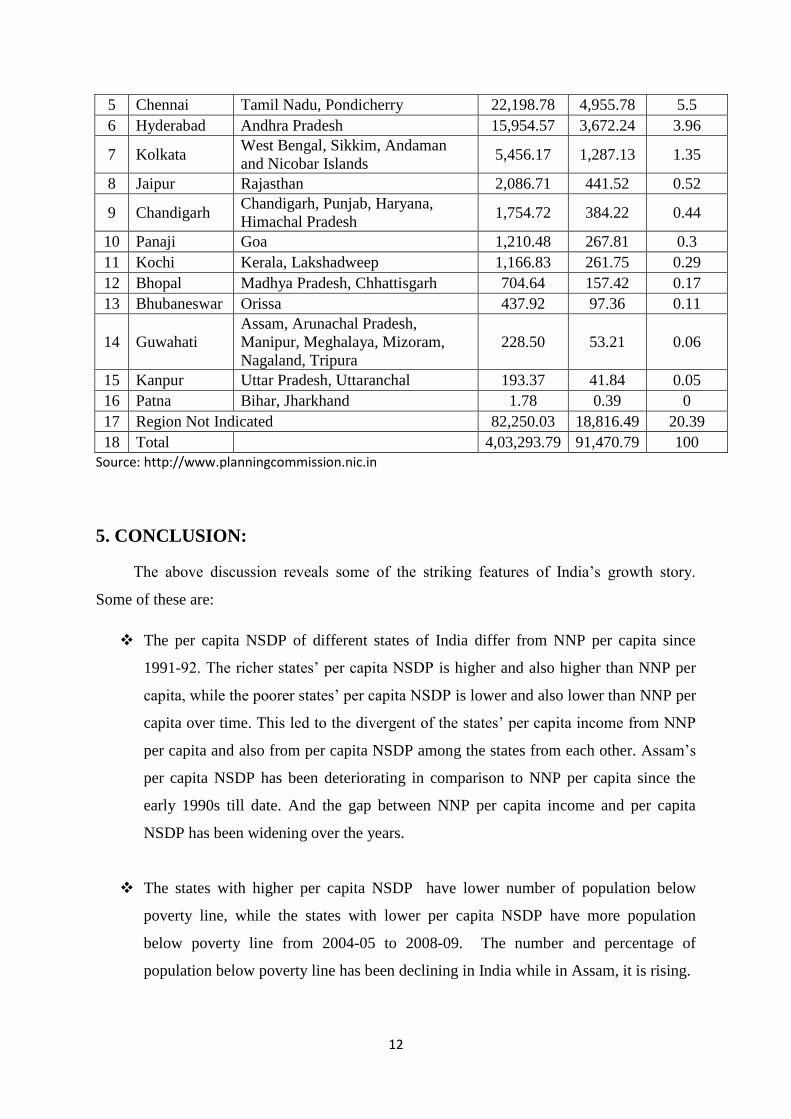
The RBI’s Regional Office of Guwahati received only Rs.228.50 crores during April
2000 to June 2009. The Office covers the states Assam, Arunachal Pradesh, Manipur,
Meghalaya, Mizoram, Nagaland and Tripura. The percentage with FDI inflows (in rupee
terms) of different states or regions are shown in the last column. RBI’s Regional Office of
Mumbai received 37.05% of FDI inflows, which is the highest, and the RBI’s Regional
Office of Patna received zero per cent FDI, which is the least among the RBI’s Regional
Offices. The RBI’s Regional Office of Guwahati received only 0.06% of FDI inflows. The
details of the FDI inflows to the different regions or states of India are shown in Table 5.
Table 4: Statement on RBI's Regional Offices (With state covered) Received Equity
Inflows (from April 2000 to June 2009)
Amount of inflows
Sl.
No
RBI's
Regional
Office
State covered Rs in
crores
US $ in
million
%age
with FDI
inflows
(in rupee
terms)
1 Mumbai Maharashtra, Dadra & Nagar
Haveli, Daman and Diu 1,49,411.59 33,789.92 37.05
2 New Delhi Delhi, Part of UP and Haryana 68,333.67 15,396.27 16.94
3 Bangalore Karnataka 26,606.17 6,062.25 6.6
4 Ahmedabad Gujarat 25,297.86 5,785.19 6.27
12
5 Chennai Tamil Nadu, Pondicherry 22,198.78 4,955.78 5.5
6 Hyderabad Andhra Pradesh 15,954.57 3,672.24 3.96
7 Kolkata West Bengal, Sikkim, Andaman
and Nicobar Islands 5,456.17 1,287.13 1.35
8 Jaipur Rajasthan 2,086.71 441.52 0.52
9 Chandigarh Chandigarh, Punjab, Haryana,
Himachal Pradesh 1,754.72 384.22 0.44
10 Panaji Goa 1,210.48 267.81 0.3
11 Kochi Kerala, Lakshadweep 1,166.83 261.75 0.29
12 Bhopal Madhya Pradesh, Chhattisgarh 704.64 157.42 0.17
13 Bhubaneswar Orissa 437.92 97.36 0.11
14 Guwahati
Assam, Arunachal Pradesh,
Manipur, Meghalaya, Mizoram,
Nagaland, Tripura
228.50 53.21 0.06
15 Kanpur Uttar Pradesh, Uttaranchal 193.37 41.84 0.05
16 Patna Bihar, Jharkhand 1.78 0.39 0
17 Region Not Indicated 82,250.03 18,816.49 20.39
18 Total
4,03,293.79 91,470.79 100
Source: http://www.planningcommission.nic.in
5. CONCLUSION:
The above discussion reveals some of the striking features of India’s growth story.
Some of these are:
The per capita NSDP of different states of India differ from NNP per capita since
1991-92. The richer states’ per capita NSDP is higher and also higher than NNP per
capita, while the poorer states’ per capita NSDP is lower and also lower than NNP per
capita over time. This led to the divergent of the states’ per capita income from NNP
per capita and also from per capita NSDP among the states from each other. Assam’s
per capita NSDP has been deteriorating in comparison to NNP per capita since the
early 1990s till date. And the gap between NNP per capita income and per capita
NSDP has been widening over the years.
The states with higher per capita NSDP have lower number of population below
poverty line, while the states with lower per capita NSDP have more population
below poverty line from 2004-05 to 2008-09. The number and percentage of
population below poverty line has been declining in India while in Assam, it is rising.
13
The contribution of manufacturing sector to India’s GDP and Assam’s NSDP has
been declining during 2004-05 to 2009-10. But the average annual growth rate of the
manufacturing sector in Assam was quite lower than the average annual growth rate
in India.
The contribution of different components of the service sector varies to India’s GDP
and to Assam’s NSDP. The contribution of trade, hotel, restaurants, and
communication etc., increases in both India’s GDP and Assam’s NSDP while the
contribution of banking and insurance sector gets decreases in Assam’s NSDP but
increases in India’s GDP.
RBI’s Mumbai Regional Office received the highest amount of Foreign Direct
Investment (FDI), while Patna Regional Office received the lowest amount of FDI
during 2000-09. The FDI inflows in the North Eastern region are negligible or near to
zero per cent of total FDI inflow in India.
It is obvious from the above discussion that the per capita NSDP of different states of
India varies from NNP per capita. This has been happening since the early 1990s till date.
Again the population below poverty line of India decreases, but the population below poverty
line of the states having lower per capita NSDP gets increases, e.g., Assam. Again the states
having the higher per capita NSDP grab more FDI inflows. Thus we can conclude by saying
that higher per capita income states have lower population below poverty line and received
more FDI inflows, while lower per capita NSDP states have higher population below poverty
line and received fewer amounts of FDI inflows. Again the leading sectors, which drive the
Indian growth process very high, have completely failed in Assam. Therefore we can say that
Assam’s growth process is in the reverse direction in comparison to India’s growth process. -
These results characterises the fact that Indian growth process is a diverse growth process and
it is consistence since the early 1990s. Thus we can say that economic reforms and India’s
five year plans fail to reduce this imbalance and lead the growth process divergent among the
states from each other. Therefore, government has given importance on inclusive growth
which is believed that able to reduce these regional disparities. But the success and failure of
inclusive growth process can be visible only after a long term, since it is a long term
perspective.
14
REFERENCES:
1. Ahluwalia, M. S. (2011), “Prospects and Policy Challenges in the Twelfth Plan”,
Economic and Political Weekly, XLVI (21):88-106.
2. Available: http://indiabudget.nic.in
[Accessed 25th
of May, 2012].
3. Available: http://minfin.nic.in
[Accessed 25th of May, 2012].
4. Available: http://planningcommission.nic.in
[Accessed 25th of May, 2012].