Indian Institute of Management Calcutta Working Paper Series ...
28
1 Indian Institute of Management Calcutta Working Paper Series WPS No 837 /March 2020 Earnings Management and Ownership dilution in Small and Medium Enterprises: Evidence from Indian IPOs Vivek Rajvanshi* Associate Professor, Finance & Control Group, IIM Calcutta Phone: 91-8335865049, Email: [email protected] Tayade Kalyani Sanjeev MBA student of batch 2018-202 IIM Calcutta Email: [email protected] *Corresponding Author Indian Institute of Management Calcutta, Joka, D.H. Road, Kolkata 700104 URL: http://facultylive.iimcal.ac.in/workingpapers
-
Upload
khangminh22 -
Category
Documents
-
view
0 -
download
0
Transcript of Indian Institute of Management Calcutta Working Paper Series ...

1
Indian Institute of Management Calcutta
Working Paper Series
WPS No 837 /March 2020
Earnings Management and Ownership dilution in Small and Medium
Enterprises: Evidence from Indian IPOs
Vivek Rajvanshi*
Associate Professor, Finance & Control Group, IIM Calcutta
Phone: 91-8335865049, Email: [email protected]
Tayade Kalyani Sanjeev
MBA student of batch 2018-202 IIM Calcutta
Email: [email protected]
*Corresponding Author
Indian Institute of Management Calcutta, Joka, D.H. Road, Kolkata
700104
URL: http://facultylive.iimcal.ac.in/workingpapers

2
Earnings Management and Ownership dilution in Small and Medium
Enterprises: Evidence from Indian IPOs
Vivek Rajvanshi1 Tayade Kalyani Sanjeev2
Abstract
We examine the impact of earnings management and ownership dilution on
underpricing, and long-term performance of IPO bound SMEs (Small and
Medium Enterprises) in India for a period from 2016 to 2018. We decompose
total accruals in discretionary and non-discretionary and further into current and
long-term accruals to understand the extent of manipulation around the IPOs.
Findings show that there is no significant evidence of earnings management in
the previous year or IPO year, but discretionary accruals jump immediately in the
next year of IPO. Ownership dilution in promoter’s holding explains the under-
pricing. The regulatory framework for the Issue of Capital and Disclosure
Requirements (ICDR) issued by the Securities and Exchange Board of India
(SEBI) stipulates that minimum promoters’ contribution of 20% of post-issue
capital shall be locked-in for three years. Also, an excess of minimum promoters'
contribution shall be locked-in for one year. Change in discretionary accruals one
year after the IPO shows the impact of regulation as insiders have incentives to
manipulate earnings only after one year of IPOs. Issue size, post-issue leverage,
and book-to-market ratio explain the long-run performance of shares after listing.
Key Words: IPO, Ownership dilution, SME, Earnings Management
1 Associate Professor, Finance & Control Group, IIM Calcutta, Email- [email protected]
2 MBA student of batch 2018-2020, IIM Calcutta, [email protected]

3
Earnings Management and Ownership dilution in Small and Medium
Enterprises: Evidence from Indian IPOs
Introduction
Initial Public Offering is one of the primary sources of financing for firms; it also
helps private equity investors and venture capitalists an opportunity to exit from
the firms (Pagano & Zingales, 1996; Smith & Sathe, 2011; Bayar & Chemmanur,
2011). Small and medium enterprises (SMEs) not only contribute to economic
growth but also provide ample opportunities for employment in emerging
countries (Taiwo et al., 2012; Cravo et al., 2012). However, SMEs have limited
access to capital through the public equity market because of stringent regulations
and therefore rely on term-loans from banks (Casey & Toole 2012; Ryan et al.,
2014). The Securities and Exchange Board of India (SEBI), the regulator of
capital markets in India, allowed SMEs to sell their shares to the public through
IPOs on relaxed norms. Two separate trading terminals – ‘NSE Emerge’ and
‘BSE Sme’ are providing trading facilities in the secondary market for shares of
listed SMEs (SEBI-Master Circular, 2010).
Direct and indirect costs, including fees paid to the underwriters, underpricing,
and more disclosures, make going public to raise capital very costly to the firms
(Bruner & Ramchand, 2004; Changwen, 2006). Allotment of shares to new
shareholders at a lower price than the fair price through the IPOs is known as
underpricing. Underpricing in IPOs has been extensively studied and remain the
focus area in finance literature (Loughran & Ritter, 2004; Ljungqvist, 2007;
Lowry & Shu, 2002; Booth & Chua, 1996). Underpricing in IPOs is explained
through the Information asymmetry between the potential investors and the
insiders in the company (Ritter and Welch, 2002). As insiders (management of
the company) have more information about the prospects of the company than
the outside investors, therefore, fair valuation of the share prices is not easy for

4
the potential investors (Lowry & Shu, 2002; Banerjee et al., 2011; Hoque, 2014).
To attract new investors and to make the IPO successful firms offer shares at
discounts to the investors in the form of underpricing.
IPOs provide an exit opportunity to the existing investors in addition to raise
capital for upcoming projects. Full or partial exit by the promoters or by other
existing investors sends a negative signal in the market (Bruton, 2009). The
market perceives IPOs as either firm already has exhausted its debt
capacity/internal capital or firm does not have highly profitable projects.
Therefore existing shareholders are not contributing their equity. Ownership
dilution magnifies the impact of information asymmetry, and new investor sees
IPOs as risky investments. To compensate for this risk, firms have to offer shares
at a lower price than the fair price. Therefore, ownership dilution also explains
the underpricing (Park & Patel, 2015).
Promoters also try to overstate accounting profits through earnings management
before the IPO so that existing investors or firms can sell shares to the public at a
higher price. Managers try to exaggerate the accounting profits by using accruals
(DuCharme, 2001). Outsiders find it challenging to observe earnings
management by analyzing accounting information as some of the accruals are
necessary and show the overall state of the company. Separation of
nondiscretionary and discretionary accruals is possible only when industry-
related information is available (Kim & Ritter, 1999). Usually, such accounting
data is disclosed by the firms after three months of the quarter ended. Though it
is difficult for the outsiders to reveal the presence of earnings management
through discretionary accruals, insiders cannot involve in such practices
consistently. In the long-run, managers have to reverse the inflated accruals, and
it would hurt the overall performance of the share price of the firm (Teoh et al.,
1998; Roosenboom, 2003).
5
SME sector has been contributing enormously to the development of India. As
per the annual report of the Ministry of Micro, Small and Medium Enterprises
(2018-19) MSME contributes around 28.9% of GDP, and this sector has grown
by 6.43% annually for a period from 2007 to 20163. This sector contributes
heavily to social development as well by creating job opportunities. According to
the 73rd national survey, MSME sector has provided 11.10 Crore jobs in rural and
urban areas across the country in 20164.
The bond market in India is not very developed, and Indian companies prefer to
choose internal financing and bank loans to finance their projects (Raghavan &
Sarwono, 2012). Stringent rules to go public make IPOs a costly affair for smaller
firms. Given the importance of SMEs for the Indian economy, SEBI, the regulator
for capital markets in India, relaxed the norms for SMEs to raise capital from the
equity market through IPO. SEBI allowed shares issued by SMEs to trade on
separate trading platforms rather than the main board in 2012 (SEBI, ICDR-
2009).
This paper examines the role of earnings management and ownership dilution in
underpricing and long-term performance of the IPO bound SMEs. This paper
examines earnings management practices around IPOs for SMEs, which are
having different regulatory framework than the non-SME IPO bound firms. IPOs
in SMEs started in 2012, and only a few companies raised capital through public
equity offering in the initial phase. The study period from 2016 to 2018 provides
a larger sample. Findings show that earnings management through discretionary
accruals around IPOs is not significant, but in the next year of IPO, discretionary
accruals increase significantly. The regulatory framework for the Issue of Capital
and Disclosure Requirements (ICDR) issued by the Securities and Exchange
Board of India (SEBI) stipulates that minimum promoters' contribution of 20%
3 Annual Report 2018-19, Ministry of Micro, Small and Medium Enterprises, Government of India. 4 MSME Sector Contributes Significantly to Indian Economy, Press Information Bureau, Government of India,
Jul 22, 2019

6
of post-issue capital shall be locked-in for three years. Also, an excess of
minimum promoters' contribution shall be locked-in for one year. Change in
discretionary accruals one year after the IPO shows the impact of regulation as
insiders have incentives to manipulate earnings only after one year of IPOs.
Dilution in promoters’ ownership explains the underpricing in SME IPOs. Post-
issue leverage, Issue size explain the long-run performance of shares after listing.
Review of Literature and Hypotheses development
IPO provides a way for pre-IPO shareholders to exit and to raise capital for the
firm's expansion. Valuation is the key to understand the fair price per share and
plays a vital role in the success of IPO. However, empirical studies show that
firms sell shares at a lower price than the fair price through IPOs. Asymmetric
information theory explains the underpricing anomaly in IPOs(Ritter & Welch,
2002).
Insiders of the firm have more (private) information than the outsiders (investors)
about the prospects of the company. However, potential shareholders rely mainly
on the published financial statements and other disclosures shared by the firms.
Accounting practices follow the principals of revenue recognition and accruals,
and therefore it is challenging to extract accurate information about the financial
health of the company. Information asymmetry about the financial health of the
firm makes the valuation of share price difficult for potential investors
(Roosenboom et al., 2002). Firms have incentives to reduce information
asymmetry through credible signaling. Firms appoint credible underwriters,
reputed auditors, involve PEIs/VCs in the early stage of financing (Carter &
Manaster, 1990; Beatty 1989 and Megginson & Weiss 1991).
Issuers involve in earnings management before IPOs send positive signals about
the financial health of the company so that they may get a higher valuation of the
share price (Barth et al., 1999). Accounting regulations/practices allow managers
for accruals. Accruals practices may change and reflect the business requirements

7
of the industry. Firms may manipulate accruals to show a better picture of the
financial health of the firm. Issuers have incentives for opportunistic earnings
management. Several studies have examined the earning management before IPO
but found mixed evidence. Studies show that firms involved in earnings
management before IPO and have a positive relation with underpricing (Teao et
al., 1998; DuCharme et al., 2001; Vinten et al., 2005; Nagata 2013; and Cheng et
al., 2015). However, Armstrong et al., 2009 find conflicting results. Francis et al.,
2012 find that technology firms follow conservative accounting practices around
IPOs to avoid litigation risk.
Regulations play an essential role in limiting the opportunistic behavior of firms.
Kao et al., 2005 examine the impact of the regulatory initiative on earnings
management by IPO bound firms in China. Authors find that penalty regulations
deter IPO bound firms for earnings management and have a positive impact on
long-term performance on the share price of such firms.
Lee & Masulis, 2011 investigate the role of financial intermediaries on earnings
management around IPOs. Authors find no relation to earnings management with
the reputation of venture capital (VC) investors and Investment Banks (IBs).
Ownership retention plays a vital role in earnings quality and reducing
information asymmetry. Katz, 2009 finds that ownership structure, presence of
private equity investors has an impact on earnings quality, and such firms perform
well in the long-run. Cheng et al., 2015 examine the earnings management around
IPO for state-owned firms and find that state-owned enterprises are less inclined
to earnings management as compared to non-state-owned enterprises.
Kouwenberg & Thontirawong, 2016 explore the earnings management for
business group affiliated firms in six Asian countries. They conclude that
business-group affiliated firms are less dependant on external borrowing and have
better earnings quality as compared to non-business-group affiliated firms.

8
Information asymmetry is higher for SMEs than non-SMEs due to lack of
publicly available accounting and other disclosure related information available,
the low interest of institutional investors, and hence equity analysts (Ou & Haynes
2006). SMEs in India usually are family-run-businesses where promoters are
family members and, in some cases, keep 100% equity shares. Going public is
negative signaling for such firms. However, even after listing, the majority (more
than 90%) of the shares are held by the promoters. SEBI regulation restricts
promoters to sell shares by the promoters immediately after the listing. Twenty
percent equivalent of post-issue capital of promoters shares have a lock-in period
of three-years, and excess contribution is locked-in for one year. Therefore, we
expect that managers have little incentives for earnings management in the case
of SMEs in India. However, Due to the signaling effect, we may expect the
presence of underpricing because of ownership dilution. The long-run
performance of shares of such firms should be related to the firm-level
characteristics such as leverage but not earnings management. Thus, we test the
following hypotheses to examine the role of earnings management and ownership
dilution.
H1: Ownership dilution and level of underpricing are negatively associated.
H2: Post-issue stock performance depends on discretionary accruals.
Institutional and Regulatory framework
Indian SMEs represent a diverse set of businesses. As per the 73rd NSS (National
Sample Survey) of 2015-16, there was 633.88 lakh (31% manufacturing, 36%
trade, and 33% other services) unincorporated non-agriculture MSMEs in India.
Out of total MSMEs, 51.25% MSMEs were in the rural area; this makes MSMEs
a critical component in carrying out the growth of the rural are5. Indian MSMEs
are mainly (95.98%) proprietary enterprises. The main problem faced by Indian
5Annual Report 2018-19, Ministry of Micro, Small and Medium Enterprises, Government of India.

9
SMEs was the absence of an alternate channel through which they can have easy
access to public capital. India is becoming conducive to the MSMEs with first
permission to separate SME exchange and later with the support given by the
Udyog Aadhar Memorandum (UAM) of online filling systems.
SEBI prescribed the framework for setting up of a separate trading platform for
SMEs shares. Market-making is mandatory on these trading platforms to ensure
liquidity. According to SEBI, an issuer company whose post-issue paid-up capital
is not more than INR 10 Crore is eligible to list itself at the SME exchange. Firms
with post issue paid-up capital in between INR 10 and INR 20 crore, have an
option to register on SME Exchange or the mainboard. SME IPO issue has to be
100% underwritten with a minimum of 15% of the issue size to be funded by the
merchant bankers. Minimum application size in an SME IPO is INR 100,000 per
application, and a minimum number of allottees should be 506. Companies listed
on SME exchange shall compulsorily migrate on mainboard if their post issue
paid-up capital is more than INR 25 Crore. An issuer with post issue paid-up
capital between INR 10 Crore and INR 25 Crore has an option to migrate to the
mainboard.
ICDR, 2009 allows SMEs to disclose their financial statements every six months
instead of every quarter. The merchant banker to an IPO issue has to do market
making for at least three years. Market Makers play an essential part in providing
liquidity in the secondary market as they are supposed to provide quotes for more
than 75% time of the trade. A market maker needs to offer a two-way quote for
75% of the time in a day. He needs to give advance information about the blackout
period to the exchange. There should not be more than five-market makers per
script. 7.
6 Standardized lot size for SME Exchange / Platform, SEBI Circular-CIR/MRD/DSA/06/2012 February 21, 2012. 7Capital adequacy ratio is an essential criterion with other parameters in selecting market-maker by the exchanges
(SEBI Circular, 2010b).

10
Data and Methodology
We extract data from three sources. IPOs related data received from the PRIME
database. Firm-level is available in Centre for Indian Economy's (CMIE) Prowess
database. The National Stock Exchange (NSE) and the Bombay Stock Exchange
provides data on the share price. We started with all IPOs from the year 2015 to
2018; there were 385 SMEs raised funds through IPOs during the study period.
Though the SEBI allowed SMEs to raise funds with relaxed norms and a separate
trading platform in 2012, the number of IPOs is not quite high in initial years, and
firm-level data is missing for many such firms; therefore, we choose the period
from 2015 to 2018. We remove all firms in Banking and Financial Sector from
our sample for the analysis as these firms’ characteristics are different as
compared to non-financial firms. We need firm-level data of IPO year and
previous year to estimate measures of accruals. To reduce the influence of the
outliers, we have not included top and bottom 1% firms. Finally, we arrive at a
sample of 151 firms. We classify firms in different industries based on the two-
digit National Industry Classification code (NIC); this is equivalent to the Global
Industry Classification Standard (GICS) in developed markets. Table 1 shows the
basic statistics of the sample.
Table 1: Sample Details
Panel A: NIC two-digit distribution
Industry
No. of IPO
firms %
Manufacturing 74 55.6

11
Electricity, gas 2 1.5
Construction 9 6.8
Wholesale and retail trade 25 18.8
Transportation and storage 7 5.3
Accommodation and food services 1 0.8
Information and communication 8 6.0
Professional, scientific and technical
activities 2 1.5
Administrative and support service
activities 5 3.8
Panel B: Time distribution of IPO
firms
2016 37 27.8%
2017 62 46.6%
2018 34 25.6%
Total 133 100.0%
Earnings Management Measures
Earnings management occurs when managers use their discretion over the
accounting numbers with or without restrictions for firm value-maximizing or
opportunistic gains. Earning management can also be carried out using the
manipulation of real activities like accelerating sales, delaying R&D, alternating
schedule of shipments, and changing maintenance expenditure.
In this paper, we are examining the role of earnings management on underpricing
and long-term performance of shares of IPO bound firms. Non-discretionary
accruals capture the business conditions and, therefore, necessary for the firms.
For our analysis, we use discretionary accruals as the main proxy for earnings
management. We follow Teoh et al. (1998) to decompose total accruals (TAcc)
into discretionary current accruals (DCA), discretionary long-term accruals
(DLA), non-discretionary current accruals (NDCA) and non-discretionary long-
term accruals (NDLA).
First, we calculate the total accruals as

12
𝑇𝑜𝑡𝑎𝑙 𝐴𝑐𝑐𝑟𝑢𝑎𝑙 (𝑇𝐴𝑐𝑐) = 𝑁𝑒𝑡 𝐼𝑛𝑐𝑜𝑚𝑒 − 𝐶𝑎𝑠ℎ 𝑓𝑙𝑜𝑤 𝑓𝑟𝑜𝑚 𝑜𝑝𝑒𝑟𝑎𝑡𝑖𝑜𝑛𝑠
Current accruals involve short-term changes involving current assets and
liabilities. We use the following accounting equation to calculate current accruals.
𝐶𝐴 = ∆ [𝑎𝑐𝑐𝑜𝑢𝑛𝑡 𝑟𝑒𝑐𝑒𝑖𝑣𝑎𝑏𝑙𝑒𝑠 + 𝑖𝑛𝑣𝑒𝑛𝑡𝑜𝑟𝑦 + 𝑜𝑡ℎ𝑒𝑟 𝑐𝑢𝑟𝑟𝑒𝑛𝑡 𝑎𝑠𝑠𝑒𝑡𝑠]− ∆ [𝑎𝑐𝑐𝑜𝑢𝑛𝑡 𝑝𝑎𝑦𝑎𝑏𝑙𝑒 + 𝑡𝑎𝑥 𝑝𝑎𝑦𝑎𝑏𝑙𝑒] + 𝑜𝑡ℎ𝑒𝑟 𝑐𝑢𝑟𝑟𝑒𝑛𝑡 𝑙𝑖𝑎𝑏𝑖𝑙𝑖𝑡𝑖𝑒𝑠
A cross-sectional regression provides the expected industry loadings for the
factors which explain the CA. We match the firms in the same industry by using
a two-digit NIC code. We ensure a minimum of 20 firms
for regression models so that our estimates would be consistent and unbiased.
𝐶𝐴𝑘,𝑡
𝑇𝐴𝑘,𝑡−1= α𝑜 (
1
𝑇𝐴𝑘,𝑡−1) + α1 (
∆𝑆𝑎𝑙𝑒𝑠𝑘,𝑡
𝑇𝐴𝑘,𝑡−1) +∈𝑘,𝑡 𝑘 ∈ 𝑒𝑠𝑡𝑖𝑚𝑎𝑡𝑖𝑜𝑛 𝑠𝑎𝑚𝑝𝑙𝑒
We calculate nondiscretionary current accruals by using the estimated values of
α𝑜, α1, and with a change in sales and change in trade receivables for the firm in
the year 't'.
𝑁𝐷𝐶𝐴𝑖,𝑡 ≡ α�̂� (1
𝑇𝐴𝑖,𝑡−1) + α1̂ (
∆𝑆𝑎𝑙𝑒𝑠𝑖,𝑡 − ∆𝑇𝑅𝑖,𝑡
𝑇𝐴𝑖,𝑡−1)
Discretionary current accruals are residuals obtained by removing
nondiscretionary current accruals from the actual current accruals.
𝐷𝐶𝐴𝑖,𝑡 ≡𝐶𝐴𝑖,𝑡
𝑇𝐴𝑖,𝑡−1− 𝑁𝐷𝐶𝐴𝑖,𝑡
We follow a similar procedure for the estimation of long-term discretionary
accruals. The discretionary total accruals DACi,t for year 't' of IPO firm 'i' are
regressed on change in sales and plant, property, and equipment (PPE) for the
industry to obtain industry loadings for these factors.
𝐴𝑐𝑘,𝑡
𝑇𝐴𝑘,𝑡−1= 𝑏𝑜 (
1
𝑇𝐴𝑘,𝑡−1) + 𝑏1 (
∆𝑆𝑎𝑙𝑒𝑠𝑘,𝑡
𝑇𝐴𝑘,𝑡−1) + 𝑏2 (
𝑃𝑃𝐸𝑘,𝑡
𝑇𝐴𝑘,𝑡−1) + ∈𝑘,𝑡

13
𝑘 ∈ 𝑒𝑠𝑡𝑖𝑚𝑎𝑡𝑖𝑜𝑛 𝑠𝑎𝑚𝑝𝑙𝑒.
Then we use regression coefficients of change in sales and PPE to obtain
Nondiscretionary total accruals (NDTAC).
𝑁𝐷𝑇𝐴𝐶𝑖,𝑡 ≡ 𝑏�̂� (1
𝑇𝐴𝑖,𝑡−1) + 𝑏1̂ (
∆𝑆𝑎𝑙𝑒𝑠𝑖,𝑡 − ∆𝑇𝑅𝑖,𝑡
𝑇𝐴𝑖,𝑡−1) + 𝑏2̂ (
𝑃𝑃𝐸𝑖,𝑡
𝑇𝐴𝑖,𝑡−1)
Underpricing
Underpricing in IPOs is a well-researched topic in finance. Several studies
estimate underpricing as the return realized by the investors if they get the shares
at the offer price and sell them on the listing day close price (Agathee et al., 2012).
Studies also suggest controlling for market returns realized between the IPO
subscription date and listing date as market-adjusted returns will capture the
impact of market movement during that time (Geng et al., 2010; Shen et al.,
2014). We use both initial raw returns as a measure of underpricing and market
returns as a control variable in the analysis for the robustness of the results.
𝑈𝑃 = (𝑃𝑐 − 𝑃𝑜)/𝑃𝑜
Where UP = underpricing, Pc = closing stock price on the first trading day, Po =
Offer price
Buy and Hold Abnormal Returns (BHAR)
BHAR (Buy and Hold abnormal Return) are extensively used to measure the
long-term performance of stocks (Lyon et al., 1999). Previous studies have used
stock performance for up to three years to capture the post-listing long-term share
performance of the firms. We use Buy and Hold Returns of one year to measure
the impact of discretionary accruals and ownership dilution for two reasons. First,
we are using IPOs offered till 2018, so we don't have price history for more than
a year. We remove the first three months' returns from the analysis as immediately
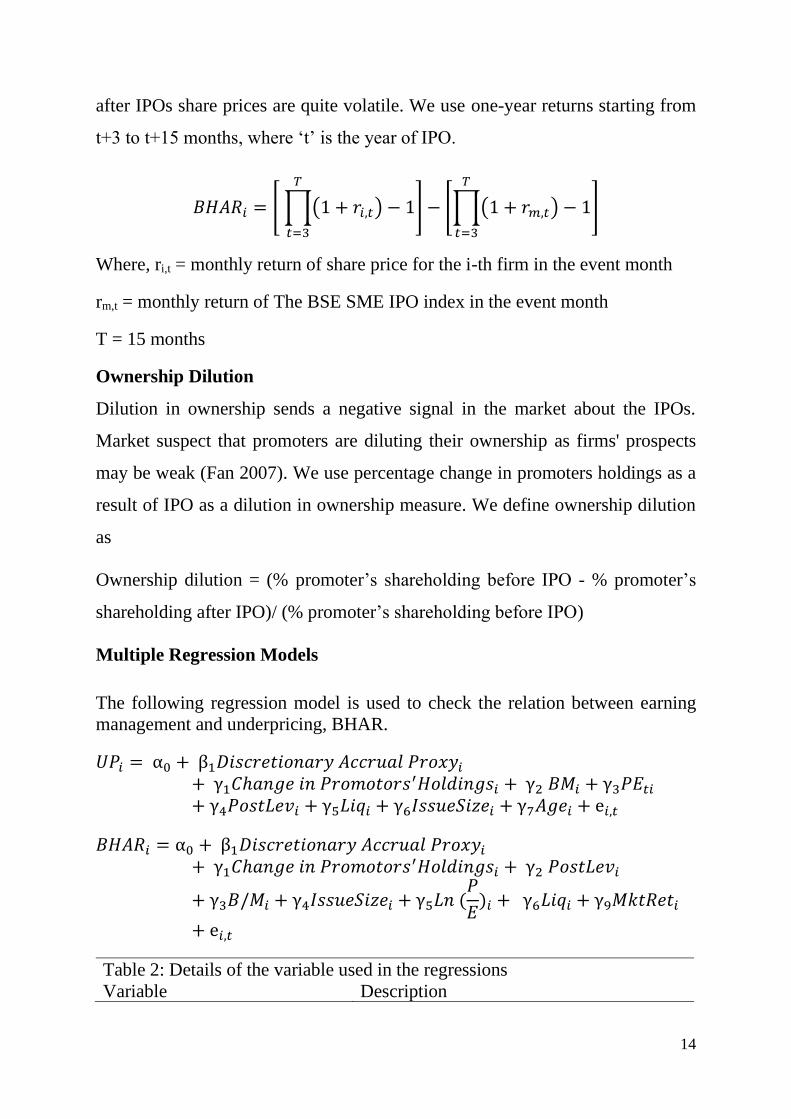
14
after IPOs share prices are quite volatile. We use one-year returns starting from
t+3 to t+15 months, where ‘t’ is the year of IPO.
𝐵𝐻𝐴𝑅𝑖 = [ ∏(1 + 𝑟𝑖,𝑡) − 1
𝑇
𝑡=3
] − [∏(1 + 𝑟𝑚,𝑡) − 1
𝑇
𝑡=3
]
Where, ri,t = monthly return of share price for the i-th firm in the event month
rm,t = monthly return of The BSE SME IPO index in the event month
T = 15 months
Ownership Dilution
Dilution in ownership sends a negative signal in the market about the IPOs.
Market suspect that promoters are diluting their ownership as firms' prospects
may be weak (Fan 2007). We use percentage change in promoters holdings as a
result of IPO as a dilution in ownership measure. We define ownership dilution
as
Ownership dilution = (% promoter’s shareholding before IPO - % promoter’s
shareholding after IPO)/ (% promoter’s shareholding before IPO)
Multiple Regression Models
The following regression model is used to check the relation between earning
management and underpricing, BHAR.
𝑈𝑃𝑖 = α0 + β1𝐷𝑖𝑠𝑐𝑟𝑒𝑡𝑖𝑜𝑛𝑎𝑟𝑦 𝐴𝑐𝑐𝑟𝑢𝑎𝑙 𝑃𝑟𝑜𝑥𝑦𝑖
+ γ1𝐶ℎ𝑎𝑛𝑔𝑒 𝑖𝑛 𝑃𝑟𝑜𝑚𝑜𝑡𝑜𝑟𝑠′𝐻𝑜𝑙𝑑𝑖𝑛𝑔𝑠𝑖 + γ2 𝐵𝑀𝑖 + γ3𝑃𝐸𝑡𝑖
+ γ4𝑃𝑜𝑠𝑡𝐿𝑒𝑣𝑖 + γ5𝐿𝑖𝑞𝑖 + γ6𝐼𝑠𝑠𝑢𝑒𝑆𝑖𝑧𝑒𝑖 + γ7𝐴𝑔𝑒𝑖 + e𝑖,𝑡
𝐵𝐻𝐴𝑅𝑖 = α0 + β1𝐷𝑖𝑠𝑐𝑟𝑒𝑡𝑖𝑜𝑛𝑎𝑟𝑦 𝐴𝑐𝑐𝑟𝑢𝑎𝑙 𝑃𝑟𝑜𝑥𝑦𝑖
+ γ1𝐶ℎ𝑎𝑛𝑔𝑒 𝑖𝑛 𝑃𝑟𝑜𝑚𝑜𝑡𝑜𝑟𝑠′𝐻𝑜𝑙𝑑𝑖𝑛𝑔𝑠𝑖 + γ2 𝑃𝑜𝑠𝑡𝐿𝑒𝑣𝑖
+ γ3𝐵/𝑀𝑖 + γ4𝐼𝑠𝑠𝑢𝑒𝑆𝑖𝑧𝑒𝑖 + γ5𝐿𝑛 (𝑃
𝐸)𝑖 + γ6𝐿𝑖𝑞𝑖 + γ9𝑀𝑘𝑡𝑅𝑒𝑡𝑖
+ e𝑖,𝑡
Table 2: Details of the variable used in the regressions
Variable Description

15
DTA Discretionary Total Accruals
DCA Discretionary Current Accruals
DLA Discretionary Long-term Accruals
Ownership Dilution Change in Promoters' Holdings
B/Mi Book value/ Market value of the IPO firm
PostLevi The book value of total debts divided by
the book value of total assets of the IPO
firm at the end of the IPO year
Liqi Volume traded divided by the number of
shares outstanding of the IPO firm on first
trading day
Ln(P/E)i Natural logarithm of price per share
divided by EPS of the IPO firm at the time
of offering
IssueSizei Natural logarithm of gross proceeds raised
in IPO by the firm (In million INR)
Agei Log (1 + firm’s age at the time of IPO)

16
Results and Discussion
Table 3 provides the descriptive statistics of discretionary and non-discretionary
accruals for the IPO year (Year ‘0’), one year before the IPO Year (year ‘-1’) and
one year after the IPO year (year ‘+1’). The financial year in India is from 1st
April to 31st March, and usually, companies submit annual financial statements
for the period from 1st April to 31st March for each year. We also follow the same
practice for calculating IPO year, e.g., if IPO is available for subscription on 20th
Jan 2018, it will be counted as IPO year 2017-18. All accruals are scaled with last
year's assets’ size to make them comparable. (Jones, 1991) argued that non-
discretionary accruals are necessary and reflect industry growth and economic
conditions. However, discretionary accruals are the results of accounting choices
and changes in credit policy to manipulate the financial numbers, and these
accruals are at the discretion of the managers. As it is difficult for investors to
capture such changes, managers may use their discretions to show a better picture
of the financial health of the company before the IPO. However, it is difficult to
continue such practices, and particularly for small companies where the
complexities of the business are low and revenues and expenses can be analyzed
easily as compared to large firms. Therefore we can expect a reversal in
discretionary accruals later. (Guenther, 1994) argues that managers have little
discretion in influencing long-term accruals as compared to current accruals, as
accounting policies do not allow to make changes in the method of depreciation
etc. and it is difficult to hide those changes.
Table 3 shows that discretionary current accruals are positive in previous years
to IPO year. The mean of discretionary current accruals one-year before the IPO
year was 1.053% and came down to 0.492%. Results suggest the weak presence
of discretionary current accruals. However, the standard deviation (13.48%) in
discretionary current accruals is significantly high and indicates that some of the
firms are involved in earnings management through discretionary current
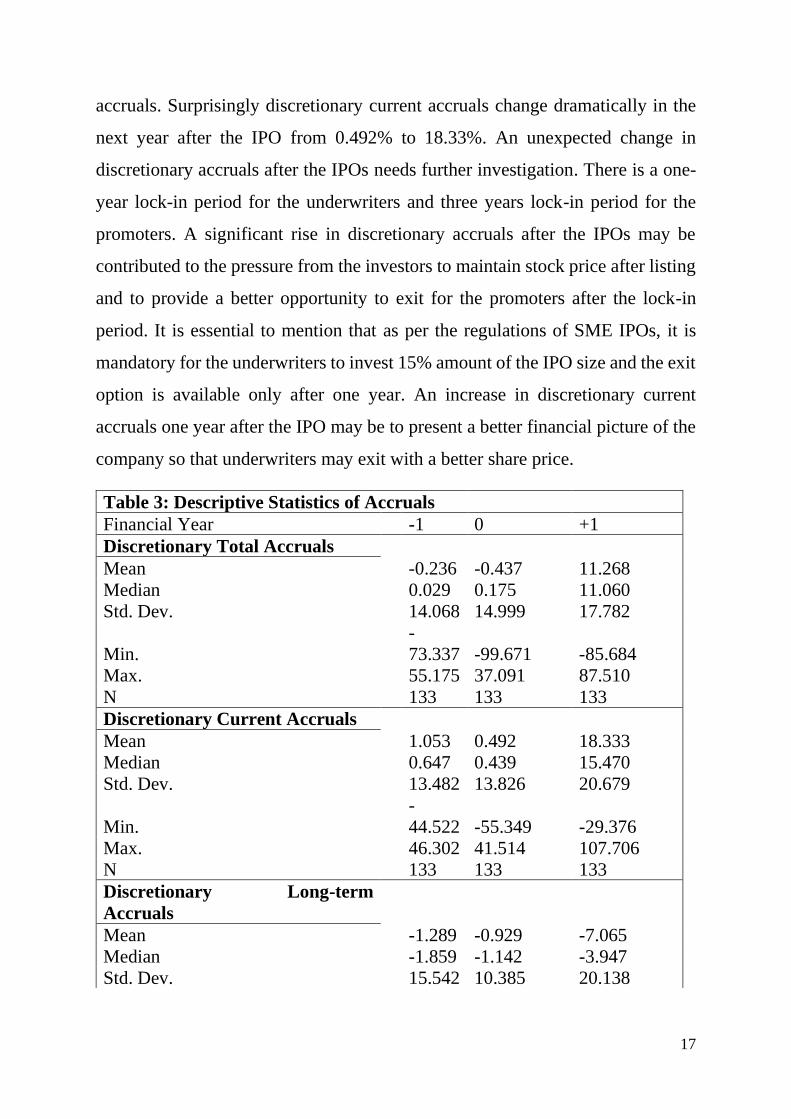
17
accruals. Surprisingly discretionary current accruals change dramatically in the
next year after the IPO from 0.492% to 18.33%. An unexpected change in
discretionary accruals after the IPOs needs further investigation. There is a one-
year lock-in period for the underwriters and three years lock-in period for the
promoters. A significant rise in discretionary accruals after the IPOs may be
contributed to the pressure from the investors to maintain stock price after listing
and to provide a better opportunity to exit for the promoters after the lock-in
period. It is essential to mention that as per the regulations of SME IPOs, it is
mandatory for the underwriters to invest 15% amount of the IPO size and the exit
option is available only after one year. An increase in discretionary current
accruals one year after the IPO may be to present a better financial picture of the
company so that underwriters may exit with a better share price.
Table 3: Descriptive Statistics of Accruals
Financial Year -1 0 +1
Discretionary Total Accruals
Mean -0.236 -0.437 11.268
Median 0.029 0.175 11.060
Std. Dev. 14.068 14.999 17.782
Min.
-
73.337 -99.671 -85.684
Max. 55.175 37.091 87.510
N 133 133 133
Discretionary Current Accruals
Mean 1.053 0.492 18.333
Median 0.647 0.439 15.470
Std. Dev. 13.482 13.826 20.679
Min.
-
44.522 -55.349 -29.376
Max. 46.302 41.514 107.706
N 133 133 133
Discretionary Long-term
Accruals
Mean -1.289 -0.929 -7.065
Median -1.859 -1.142 -3.947
Std. Dev. 15.542 10.385 20.138

18
Min.
-
48.626 -44.322 -147.132
Max. 58.988 31.365 35.829
N 133 133 133
Nondiscretionary Total Accruals
Mean -1.215 -1.062 -1.904
Median -1.439 -1.370 -0.991
Std. Dev. 4.689 7.621 4.323
Min.
-
17.719 -19.903 -43.586
Max. 36.097 80.292 7.619
N 133 133 133
Nondiscretionary Current
Accruals
Mean 0.404 0.638 0.629
Median 0.075 0.381 0.364
Std. Dev. 2.741 2.209 3.798
Min. -9.049 -16.775 -28.105
Max. 18.742 6.847 23.200
N 133 133 133
Nondiscretionary Long-term
Accruals
Mean -1.619 -1.700 -2.533
Median -1.690 -1.832 -2.019
Std. Dev. 4.435 7.157 2.763
Min.
-
10.965 -9.350 -15.581
Max. 37.624 76.598 2.906
N 133 133 133
Total accruals increase significantly after the IPO year. Significantly high
Variations in total accruals in discretionary accruals as compared to non-
discretionary accruals show that some firms involved in earnings management
through discretionary accruals.
Table 2: Descriptive Statistics of Under-pricing
Table 4 provides descriptive statistics of underpricing in IPOs. In all three years
of the study period, we find that there is evidence of underpricing.

19
Table 4: Descriptive Statistics
Mean Median Std. Dev. Min. Max. N
Panel A: Underpricing in IPOs
2016-2017 6.64 4.01 8.14 -12.9 18.2 37
2017-2018 5.15 3.48 11.06 -22.3 18.2 62
2018-2019 4.50 2.96 6.22 -5.1 24.6 34
Total 5.40 3.28 9.22 -22.3 24.6 133
Panel B: Post-listing Stock Performance (After one year)
One Year Raw Returns -9.23 -9.70 53.13 -214 303 133
One Year Index Return -14.1 -15.48 24.37 -38.8 51.4 133
One Year BHAR 4.93 -1.11 51.71 -182 284 133
Panel C: Promoters Holdings
Promoters' Holding Before
IPO (%) 90.75 98.14 13.15 37.42 100.0 133
Promoters' Holding After
IPO (%) 65.89 69.25 9.34 24.32 73.63 133
Change in Promoters
Holdings (%) 27.30 27.00 3.49 0 36.31 133
Panel D: Control Variables
Book to Market 0.62 0.58 0.25 0.16 1.47 133
Log (Age) 1.17 1.15 0.22 0.70 1.65 133
Issue Size 4.80 4.88 0.79 2.91 6.69 133
LnPEi 2.58 2.69 1.32 0 8.00 133
PostLevi 0.328 0.333 0.165 0 0.723 133
Liqi 0.057 0.035 0.069 0 0.333 133
Underpricing in all three years is between 5% to 6%, which is consistent with the
underpricing in SMEs in the Indian market (Arnab, 2017). First day minimum
and maximum returns for the firms with IPOs in the year 2016, 2017, and 2018
were 18.23 (-12.98), 18.23(-22.31), and 44.56(-5.13) respectively. Variations in
underpricing across firms motivate us to analyze what are the reasons for
underpricing. Performance of share price after the listing is not very encouraging
and one-year returns are -9.23%. As there is no broad index for SMEs available
in the Indian market and only SME IPO index is available, we take a small-cap

20
index as a proxy for the index to compare the share performance of SME firms
post-listing. Net small-cap index return adjusted buy and hold returns after three
months of the listing shows that returns in a year were around 4.93% with a
standard deviation of 51.71%. Very high variation in returns shows that the
performance of share price varies significantly after listing; this may be an
indication of the presence of very high idiosyncratic risk associated with returns.
Panel C of Table 4 provides descriptive statistics of promoter's holdings before
and after IPOs. On average, promoters' ownership dilutes around 27.30% after
IPOs. Promoters’ ownership dilutes from 90.75% to 65.89%. As regulation
allows maximum (minimum) 74% (20%) ownership by promoters in a listing
firm, we can see that maximum (minimum) promoters holding is 73.63%
(24.32%), but even after listing average promoter's ownership remains above the
majority shareholding of 50%. After IPO, the control is still with the promoters,
and there is very little control available with the other shareholders. Panel D
provides the details of the statistics associated with other variables such as Book
to market, Age of the firm, Issue size, price-to-earnings after the IPO, post IPO
leverage, and liquidity in the shares on a listing day.
Regression Results
We use a multiple regression model to examine the drivers of underpricing in
IPO. We use returns from offer price to listing day closing price as a measure of
underpricing as defined in equation 4. As an explanatory variable, we use total
discretionary accruals, current discretionary accruals, and long-term
discretionary accruals in three different regression models and dilution in
promoters’ holdings with other control variables. In all regression models, we
take firms that show underpricing, and therefore the number of firms in the
regression reduced to 109. Table 5 reports the regression results of all three
models. Results show that dilution in promoters holding explains the

21
underpricing, not the discretionary accruals. Higher the dilution in promoters
holding results in more underpricing in the IPOs.
Table 5: Regression Results for Underpricing
Model
Model –
I Model - II Model - III
Variable
(Constant) 27.87** 27.94** 27.19**
(2.55) (2.52) (2.44)
DTA -2.206
(-0.42)
DCA 0.452
(0.09)
DLA -1.934
(-0.43)
Change in Promoters' Holdings -66.45** -64.56** -64.38**
(-2.31) (-2.22) (-2.25)
BMi 2.776 2.773 2.79
(0.83) (0.83) (0.84)
Agei -2.743 -2.824 -2.669
(-0.88) (-0.90) (-0.85)
IssueSizei 0.307 0.225 0.312
(0.31) (0.23) (0.32)
LnPEi -1.106** -1.117** -1.124**
(-2.22) (-2.23) (-2.26)
PostLevi 4.314 4.202 4.447
(0.95) (0.92) (0.97)
Liqi 3.452 3.25 3.161
(0.33) (0.31) (0.3)
R-Square 0.12 0.11 0.11
Adjusted R-Square 0.049 0.048 0.05
F-Statistics 1.71 1.68 1.71
N 109 109 109
Further, we divide the discretionary accruals based on aggressive discretionary
accruals and conservative accruals based on the median level of accruals to check
the robustness of the results. We find that not the discretionary accruals but
change in promoter's holding explain the underpricing in SMEs in India. Results
have not been reported here for the brevity of the space but available on request
with the authors. Again, the change in promoter's holding is significant in all three

22
models. Our results support the signaling effect, which argues that dilution in
promoters' ownership through IPOs sends a negative signal in the market.
Therefore, firms provide discounts in the form of underpricing to get a successful
subscription of the IPOs. The coefficient of P/E is negative and statistically
significant, which shows that growth firms that generally require more funds for
growth provide higher underpricing.
Long-term Performance
If managers are involved in earnings management by managing discretionary
accruals, it is interesting to see the impact of such activities on the long-term
performance of the share price. We examined the effect of accruals on the long-
term performance of the share price.
As we have taken all IPOs from the year 2016 to 2018, we have share price
information of around one year only as share price may be very volatile at the
initial phase after listing. Consistent with finance literature, we use share price
data for 12 months, starting after three months of listing.
Results show (see Table 6) that discretionary accruals do not explain the long-
term performance of share price. In all three models, discretionary total accruals,
discretionary current accruals, and discretionary long-term accruals have negative
coefficients, which shows that discretionary accruals hurt the stock performance.
However, coefficients are not statistically significant even at 10% level of
confidence. Insignificant coefficient of discretionary accruals supports our earlier
results on descriptive statistics, which shows that there is not much evidence of
discretionary accruals before IPOs by the firms. Issue size, post-IPO leverage,
Book to Market hurt the long-run performance of the shares after the listing.
Results show that leverage, which is proxy for risk, is explaining the returns on
stocks after listing.
Table 6: Long-term Performance of stock returns after the IPOs
Model Model - I Model - II Model - III

23
Variable
(Constant) 1.149* 1.109* 1.065*
(1.87) (1.82) (1.73)
DTA 0.004
(0.01) DCA 0.353
(1.07) DLA -0.278
(-0.95)
Change in Promoters' Holdings -0.43 -0.306 -0.44
(-0.33) (-0.24) (-0.34)
Issue Size -0.149** -0.149** -0.138**
(-2.44) (-2.51) (-2.27)
LnPEi 0.0251 0.0218 0.0235
(0.73) (0.63) (0.68)
PostLevi -0.482* -0.464* -0.429
(-1.70) (-1.66) (-1.51)
Liqi 0.203 0.182 0.215
(0.32) (0.29) (0.34)
BMi -0.450** -0.458** -0.454**
(-2.36) (-2.41) (-2.39)
Agei 0.0818 0.0898 0.0964
(0.39) (0.43) (0.46)
R-Square 0.1006 0.1089 0.107
Adjusted R-Square 0.0426 0.0514 0.0494
F-Statistics 1.73 1.89 1.86
N 133 133 133
t-statistics is given in parentheses * 10% Significance level, ** 5% Significance level, *** 1% Significance level
Conclusions
In this study, we examine the role of discretionary accruals, and ownership
dilution on the underpricing and long-term performance of the stocks of the IPO
bound SME firms from a period from 2016 to 2018 in the Indian market. We find
that change in ownership dilution explains the underpricing in the IPO but not the
discretionary accruals. However, discretionary accruals change significantly next
year after the IPO; this may be due to the regulation that makes mandatory
investment by the underwriter with a lock-in period of one year. Promoters'

24
ownership dilution explains the underpricing in SMEs IPOs and stock with post-
issue lower leverage perform well in the long-run.
References:
Abdulsaleh, A. M., & Worthington, A. C. (2013). Small and medium-sized
enterprises financing: A review of literature. International Journal of Business
and Management, 8(14), 36.
Armstrong, C., Foster, G., & Taylor, D. J. (2009). Earnings management around
initial public offerings: A re-examination. SSRN eLibrary.
Banerjee, S., Dai, L., & Shrestha, K. (2011). Cross-country IPOs: What explains
differences in underpricing? Journal of Corporate Finance, 17(5), 1289-1305.
Barth, M., and G. Clinch. 1999. “Scale Effects in Capital Markets-Based
Accounting Research.” Working paper, Stanford University.
Bayar, O., & Chemmanur, T. J. (2011). IPOs versus acquisitions and the valuation
premium puzzle: a theory of exit choice by entrepreneurs and venture
capitalists. Journal of Financial and Quantitative Analysis, 46(6), 1755-1793.
Beatty, R. P. (1989). Auditor reputation and the pricing of initial public
offerings. Accounting Review, 693-709.
Beatty, R. P., & Ritter, J. R. (1986). Investment banking, reputation, and the
underpricing of initial public offerings. Journal of Financial Economics, 15(1),
213-232.
Beatty, R. P., & Ritter, J. R. (1986). Investment banking, reputation, and the
underpricing of initial public offerings.
Bhattacharya, A. (2017). Innovations in new venture financing: Evidence from
Indian SME IPOs. Global Finance Journal, 34(C), 72-88.
Booth, J. R., & Chua, L. (1996). Ownership dispersion, costly information, and
IPO underpricing. Journal of Financial Economics, 41(2), 291-310.
Bruner, R., Chaplinsky, S., & Ramchand, L. (2004). US-bound IPOs: Issue costs
and selective entry. Financial Management, 39-60.
Bruton, G. D., Chahine, S., & Filatotchev, I. (2009). Founders, private equity
investors, and underpricing in entrepreneurial IPOs. Entrepreneurship Theory
and Practice, 33(4), 909-928.

25
Carter, R., & Manaster, S. (1990). Initial public offerings and underwriter
reputation. The Journal of Finance, 45(4), 1045-1067.
Casey, E., & O'Toole, C. M. (2014). Bank lending constraints, trade credit and
alternative financing during the financial crisis: Evidence from European
SMEs. Journal of Corporate Finance, 27, 173-193.
Changwen, Y. J. Z. (2006). Pricing Mechanism, Underwriting Contracts and
Issue Costs; Evidence from China's IPO Market [J]. Journal of Financial
Research, 5.
Cheng, C. A., Wang, J., & Wei, S. X. (2015). State ownership and earnings
management around initial public offerings: evidence from China. Journal of
International Accounting Research, 14(2), 89-116.
Cravo, T. A., Gourlay, A., & Becker, B. (2012). SMEs and regional economic
growth in Brazil. Small Business Economics, 38(2), 217-230.
DuCharme, L. L., Malatesta, P. H., & Sefcik, S. E. (2001). Earnings management:
IPO valuation and subsequent performance. Journal of Accounting, Auditing &
Finance, 16(4), 369-396.
Fan, Q. (2007). Earnings management and ownership retention for initial public
offering firms: Theory and evidence. The Accounting Review, 82(1), 27-64.
Francis, B. B., Hasan, I., & Zhou, M. (2012). Strategic conservative earnings
management of technology firms: Evidence from the IPO market. Financial
Markets, Institutions & Instruments, 21(5), 261-293.
Guenther, D. A. (1994). Earnings management in response to corporate tax rate
changes: Evidence from the 1986 Tax Reform Act. Accounting Review, 230-243.
Hoque, H. (2014). Role of asymmetric information and moral hazard on IPO
underpricing and lockup. Journal of International Financial Markets, Institutions
and Money, 30, 81-105.
Jones, J. J. (1991). Earnings management during import relief
investigations. Journal of accounting research, 29(2), 193-228.
Kao, J. L., Wu, D., & Yang, Z. (2009). Regulations, earnings management, and
post-IPO performance: The Chinese evidence. Journal of Banking &
Finance, 33(1), 63-76.

26
Katz, S. P. (2009). Earnings quality and ownership structure: The role of private
equity sponsors. The accounting review, 84(3), 623-658.
Kim, M., & Ritter, J. R. (1999). Valuing IPOs. Journal of financial
economics, 53(3), 409-437.
Kouwenberg, R., & Thontirawong, P. (2016). Group affiliation and earnings
management of Asian IPO issuers. Review of Quantitative Finance and
Accounting, 47(4), 897-917.
Lee, G., & Masulis, R. W. (2011). Do more reputable financial institutions reduce
earnings management by IPO issuers? Journal of Corporate Finance, 17(4), 982-
1000.
Ljungqvist, A. (2007). IPO underpricing. In Handbook of Empirical Corporate
Finance (pp. 375-422). Elsevier.
Loughran, T., & Ritter, J. (2004). Why has IPO underpricing changed over
time? Financial management, 5-37.
Lowry, M., & Shu, S. (2002). Litigation risk and IPO underpricing. Journal of
Financial Economics, 65(3), 309-335.
Lyon, J. D., Barber, B. M., & Tsai, C. L. (1999). Improved methods for tests of
long‐run abnormal stock returns. The Journal of Finance, 54(1), 165-201.
Massel, Norman and Park, Jung Eun and Reichelt, Kenneth John, The Valuation,
Revenue Management, and Subsequent Financial Restatement of IPO Firms
(April 7, 2017). Available at SSRN: https://ssrn.com/abstract=2954646
Megginson, W. L., & Weiss, K. A. (1991). Venture capitalist certification in
initial public offerings. The Journal of Finance, 46(3), 879-903.
Nagata, K. (2013). Does earnings management lead to favorable IPO price
formation or further underpricing? Evidence from Japan. Journal of
Multinational Financial Management, 23(4), 301-313.
Ou, C., & Haynes, G. W. (2006). Acquisition of additional equity capital by small
firms–findings from the national survey of small business finances. Small
Business Economics, 27(2-3), 157-168.
Pagano, M., Panetta, F., & Zingales, L. (1996). The stock market as a source of
capital: Some lessons from initial public offerings in Italy. European Economic
Review, 40(3-5), 1057-1069.

27
Park, H. D., & Patel, P. C. (2015). How does ambiguity influence IPO
underpricing? The role of the signalling environment. Journal of Management
Studies, 52(6), 796-818.
Pastor-Llorca, M. J., & Poveda-Fuentes, F. (2006). Earnings management and the
long-run performance of Spanish initial public offerings. In Initial Public
Offerings (pp. 81-112). Butterworth-Heinemann.
Raghavan, S., & Sarwono, D. (2012). Corporate bond market in India: lessons
from abroad and road ahead. International Journal of Trade, Economics and
Finance, 3(2), 120.
Ritter, J. R., & Welch, I. (2002). A review of IPO activity, pricing, and
allocations. The journal of Finance, 57(4), 1795-1828.
Roosenboom, P., van der Goot, T., & Mertens, G. (2003). Earnings management
and initial public offerings: Evidence from the Netherlands. The International
Journal of Accounting, 38(3), 243-266.
Ryan, R. M., O’Toole, C. M., & McCann, F. (2014). Does bank market power
affect SME financing constraints? Journal of Banking & Finance, 49, 495-505.
SEBI (issue of capital and disclosure requirements) regulations, 2009.
SEBI-Master Circular, 2010; Master Circular on Administration of Stock
Exchanges, Arbitration in recognised Stock Exchanges and Stock Exchanges /
trading platform for Small & Medium Enterprises including guidelines for
Market Makers.
SEBI- Circular, 2010b; Guidelines for market makers on Small and Medium
Enterprise (SME) exchange/separate platform of existing exchange having
nationwide terminal, SEBI Circular CIR/MRD/DP/ 14 /2010, April 26, 2010.
SEBI-ICDR (2018) Securities and Exchange Board of India (Issue of Capital and
Disclosure Requirements) (Third Amendment) Regulations, 2010, April 13,
2010.
Smith, R., Pedace, R., & Sathe, V. (2011). VC fund financial performance: The
relative importance of IPO and M&A exits and exercise of abandonment
options. Financial Management, 40(4), 1029-1065.
Taiwo, M. A., Ayodeji, A. M., & Yusuf, B. A. (2012). Impact of small and
medium enterprises on economic growth and development. American journal of
business and management, 1(1), 18-22.

28
Teoh, S. H., Welch, I., & Wong, T. J. (1998). Earnings management and the
underperformance of seasoned equity offerings. Journal of Financial
Economics, 50(1), 63-99.
Vinten, G., Chen, K. Y., Lin, K. L., & Zhou, J. (2005). Audit quality and earnings
management for Taiwan IPO firms. Managerial Auditing Journal.