India Poverty in India - The Challenge of Uttar Pradesh - World ...
164
Report No. 22323-IN India Poverty in India The Challenge of Uttar Pradesh May 08, 2002 Poverty Reduction and Economic Management Sector Unit South Asia Region Document of the World Bank Public Disclosure Authorized Public Disclosure Authorized Public Disclosure Authorized Public Disclosure Authorized
-
Upload
khangminh22 -
Category
Documents
-
view
2 -
download
0
Transcript of India Poverty in India - The Challenge of Uttar Pradesh - World ...
Report No. 22323-IN
IndiaPoverty in IndiaThe Challenge of Uttar Pradesh
May 08, 2002
Poverty Reduction and Economic Management Sector UnitSouth Asia Region
Document of the World Bank
Pub
lic D
iscl
osur
e A
utho
rized
Pub
lic D
iscl
osur
e A
utho
rized
Pub
lic D
iscl
osur
e A
utho
rized
Pub
lic D
iscl
osur
e A
utho
rized
CURRENCY EQUIVALENTS
Currency units: Rupees (Rs.) as of February 14, 2002$1 = Rs. 48.34
Units
I Lakh = 100 thousandI Crore = 10 mllion
GOVERNMENT'S FISCAL YEAR
April 1- March 31
ABBREVIATIONS AND AcRoNYMs
ANM Auxiliary Nurse Midwife NGO Non-Govemment OrganizationAP Andhra Pradesh NSS National Sample SurveyAPPs Anti-Poverty Programs NSSO National Sample Survey OrganizationBDO Block Development Office OBC Other Backward CasteBEP/BPEP Basic Education Program O&M Operation and MaintenanceBJP Bharatiya Janata Party PDS Public Distribution SystemBPL Below Poverty Line PHC Primary Health CenterBRI Bank Rakayat Indonesia PROBE Public Report on Basic Education in IndiaBSP Bahujan Samaj Party PSMS Poverty and Social Monitoring SystemCHC Community Health Centre PRIs Panchayati Raj InstitutionsCMIE Centre for Monitoring Indian Economy R&D Research and DevelopmentDWCRA Development of Women and Children in Rural Areas RBI Reserve Bank of IndiaDPEP District Primary Education Program RMPs Rural Medical PractitionersEAS Employment Assurance Scheme SC Scheduled CasteEGS Employment Guarantee Scheme SEBs State Electricity BoardsFCI Food Corporation of India SEWA Self-Employed Women's AssociationGOI Govemment of India SITRA Supply of Improved Toolkits to Rural ArtisansGOUP Govemment of Uttar Pradesh SGSY Swamjayanti Gram Swarozgar YojanaGSDP Gross State Domestic Product SJSRY Swam Jayanti Shahari Swarozgar YojanaHDR Human Development Report SME Small and Medium EnterpnseHUDCO Housing and Urban Development Corporation Limited SSI Small Scale IndustryHYV High-Yielding Variety SSK Sahbhagi Shikshan Kendra[AY Indira Awas Yojana ST Scheduled TribeICDS Integrated Child Development Services TRYSEM Training of Rural Youth for Self-EmploymentlIPS Intemational Institute for Population Sciences TPDS Targeted Public Distribution SystemIRDP Integrated Rural Development Program UK United KingdomJGSY Jawahar Gram Samridhi Yojana UP Uttar PradeshJRY Jawahar Rozgar Yojana UPHSDP Uttar Pradesh Health Systems Development ProjectkWh Kilo Watt Hour VRS Voluntary Retirement SchemeMP Madhya Pradesh WHO World Health OrganisationNCAER National Council of Applied Economic Research WUA Water-Users AssociationNFHS National Family Health Survey
Vice President : Mieko NishimizuCountry Director Edwin Lim
Sector Director Sadiq AhmedSector Manager Sanjay Pradhan
Task Leader Valerie Kozel
CONTENTS
Executive Summary ....................................................................... i
Chapter 1: Poverty in Uttar Pradesh - The Context ........................................................................ 1
A. An Introduction ........................................................................ 1B. India's and UP's Poverty Reduction Strategies ........................................................................ 2C. Data Sources and Data Concerns ........................................................................ 8D. Defining Poverty: Levels, Trends, Vulnerability, and Voice .............................................................. 13
Chapter 2: Profile of the Poor: Poverty of Resources, Access, and Relationships ........................... 33
A. Introduction ....................................................................... 33B. Voices of the Poor ....................................................................... 33C. Private, Public, and Social Assets ....................................................................... 34D. Social Identity and Economic Exclusion ....................................................................... 42E. Heterogeneity of the Poor: Why Does it Matter? ....................................................................... 51
Chapter 3: Governance And Poverty Reduction In Uttar Pradesh .................................................. 55
A. Introduction ....................................................................... 55B. The Failure of Public Services in UP ....................................................................... 55C. The Impact of Declining Service Delivery on the Poor: the Case of Justice and Legal Redress ....... 63D. Redressing the Imbalances ....................................................................... 66
Chapter 4: Economic Opportunities For The Poor ....................................................................... 73
A. Introduction ....................................................................... 73B. Improving the Climate for Private-Sector-Led Growth ...................................................................... 74C. Rural Development: Agriculture's Central Role ....................................................................... 79D. Expanding Rural Off-Farm Opportunities ....................................................................... 86E. Widening Opportunities for the Socially Excluded ....................................................................... 89
Chapter 5: Strengthening Delivery: Social Services and Safety Nets ............................................... 93
A. Introduction ....................................................................... 93B. Education ....................................................................... 94C. Health ....................................................................... 105D. Safety-Net Programs ........... 1....... III
Annex I ................. 123Annex II ................. 127Annex Tables ................ 131
References ................ 139

List of Tables
Table 1.1 Growth Trends in UP and All-India .......................................................... l1Table 1.2 Trends in Poverty: Uttar Pradesh and All-India Headcounts ........................................ 15Table 1.3 Urban and Rural Poverty Levels, Depth, and Severity in Uttar Pradesh ....................... 15Table 1.4 Economic Trends in the 1990s .......................................................... 17Table 1.5 Alternative Trends in Poverty, Model Predictions: Uttar Pradesh and All-India .......... 18Table 1.6 Socioeconomic Indicators by Region .......................................................... 19Table 1.7 Regional Trends in Poverty .......................................................... 20Table 1.8 Highest Educational Attainment of the Population ....................................................... 22Table 1.9 Literacy Rates for Selected States, By Gender .......................................................... 23Table 1.10 Net School Enrollment Rates in Uttar Pradesh, By Caste and Gender .......................... 25
Table 2.1 Poverty Incidence by Occupation of Household Head .................................................. 35Table 2.2 Rural Poverty Incidence and Shares by Land Ownership ............................................. 36Table 2.3 Poverty Incidence and Shares by Level of Education of the Household Head .............. 37Table 2.4 Comparison of Health Status of Children in Uttar Pradesh, by Quintile ....................... 38Table 2.5 Housing and Access to Basic Services, NSS 55t Round (1999-00)
Urban and Rural Areas (Percent) .......................................................... 40Table 2.6 Poverty Incidence and Shares by Caste Status .......................................................... 43Table 2.7 Differential Returns to Assets: Scheduled Caste/Tribe and Other Castes (Percent) ...... 46Table 2.8 Distribution of Employment by Gender .......................................................... 49
Table 3.1 State Government Employment per 100 Population ..................................................... 60Table 3.2 Increase in UP Civil Service Employment, 1971-92 ..................................................... 61
Table 4.1 Perceptions of the Investment Climate, Rankings for Major Indian States in 1999 ...... 76Table 4.2 Dependence on Non-Institutional Sources of Credit Among Rural Households ........... 79Table 4.3 Land Ownership and Poverty-Rural Uttar Pradesh ....................................................... 86Table 4.4 Work Intensity and Earnings-Rural Uttar Pradesh ....................................................... 87Table 4.5 Percentage of Female to Male Employees in the Organized Sector .............................. 91
Table 5.1 Government Spending on Social Services and Social Protection .................................. 93Table 5.2 Education Level and Principal Occupation of Main and Marginal Workers ................. 95Table 5.3 Average School Enrollment Rates, Children Aged 7-12 Years 1999-00 ...................... 96Table 5.4 State Spending on Education .......................................................... 98Table 5.5 School Enrollments by Type of School, 1999-00 by Quintile .................................... 102Table 5.6 Access to Reproductive and Child Health Services: by State and Level of Wealth .... 107Table 5.7 Public Sector Health Expenditure by Quintile, 1995-96 ............................................. 110Table 5.8 State Spending on Poverty Alleviation Measures, 1998-99, 1999-00 ......................... 113Table 5.9 Rural Entitlements and Purchases from the TPDS, Past 30 Days, 1999-00 ................ 114Table 5.10 Regional Poverty Incidence and Allocation of PDS Subsidies ................................... 115Table 5.11 Use of Selected Government Programs by Per-Capita Expenditure Quintile .............. 117Table 5.12 Financing of Illness-Related Expenditures by Quintile ............................................... 121Table 5.13 Sources of Loans and Overall Prevalence and Magnitude of Indebtedness
by Quintile ........................................................ 122
List of Boxes
Box 1.1 Poverty and Social Monitoring in Uttar Pradesh ........................................................ 1 1Box 1.2 Vulnerability to Shocks ........................................................ 28Box 1.3 Political Organization and the Urban Poor: Many Voices are Better Than One ........... 29Box 1.4 Rural Destitution ........................................................ 30Box 1.5 Palanpur Village: Paradoxes of Rural Development ..................................................... 31
Box 2.1 People's Perceptions of Poverty ........................ , , , , . .34Box 2.2 Access to Facilities in Rural Uttar Pradesh .39Box 2.3 Signs of Transition .40Box 2.4 Unrecognized Settlements: The Urban Underclass .41Box 2.5 Why Invest in Social Relations? .42Box 2.6 Caste in Indian Society .43Box 2.7 The Impact of Caste and Wealth on School Enrollments .44Box 2.8 Patterns of Employment in Rural UP-Poverty and Caste ........................................... 47Box 2.9 The Plight of Poor Women .48Box 2.10 Broken Dreams of the Poorest .51
Box 3.1 Case Study: The Decline of the UP Irrigation Department .55Box 3.2 General Overview of Government Organization in Uttar Pradesh .58Box 3.3 Justice in Moradabad, UP .66Box 3.4 Participation in Local Democracy in Jamalpur, UP .68
Box 4.1 The Leatherworkers of Bonetown - An Urban Success Story .75Box 4.2 Improving the Business Environment in Karnataka .76Box 4.3 UP Sodic Lands Reclamation Project I and II. 84Box 4.4 Licensing Laws in Uttar Pradesh .85Box 4.5 Workforce Participation of Men and Women in Two Poor Regions of UP .90
Box 5.1 The Midday Meals Program: Who Benefits? 1. 1Box 5.2 Primary Education Project in UP .103Box 5.3 The Progresa Program in Mexico .104Box 5.4 The Health Situation in Chitrakot District .106Box 5.5 The Role of "Alternative" Health Care Providers .108Box 5.6 Failures and Successes of the Health System in UP .108Box 5.7 Innovative Health Insurance Schemes in Indiada .l Box 5.8 India's Anti-Poverty Programmes (APPs) .112Box 5.9 Recent Efforts to Improve Targeting of Foodgrains Through the PDS .115Box 5.10 Transparency and Accountability Under JRY Activities .118Box 5.11 Innovative Micro-Credit Programs .120
List of Figures
Figure 1.1 Poverty Levels by State, 1983 and 1999-00 .14Figure 1.2 Poverty Levels by Region .19Figure 1.3 Regional Distribution of the Poor as Compared to the Population .21Figure 1.4 Literacy Rates by District .24Figure 1.5 Health Indicators by State, 1998-99 ................................................... 26Figure 1.6 Infant and Child Mortality by Time Period .27
Figure 2.1 All-India Incidence of Disease by Wealth, 1992-93 .38
Figure 4.1 Poverty and Agricultural Growth in Uttar Pradesh .81Figure 4.2 Uttar Pradesh: Rural Income Shares by Per-Capita Income Quintiles .88
Figure 5.1 Returns to Education: RslPerson/Month, 1993-94 .95Figure 5.2 Proportion of Children Enrolled in School, 7-12 Years Old NSS 42nd Round (1986-87)
and 52nd Round (1995-96) .97Figure 5.3 Percent of Official BPL Households .116

ACKNOWLEDGMENTS
This report was prepared by a team led by Valerie Kozel, Senior Economist, South AsiaPREM. The draft was prepared under the direction of Roberto Zagha, Sector Director, SouthAsia PREM, and finalized under the direction of Sanjay Pradhan, Sector Manager forGovernance and Poverty, and Sadiq Ahmed, Chief Economist and Sector Director, South AsiaPREM. The report draws on contributions from: Salman Zaidi (SASPR, poverty trends andpoverty profile, regional dimensions of poverty, differential returns); Ravi Srivastava (consultant,growth and labor markets, co-managed UP/Bihar Poverty Study); Robert Beschel and Alpa Shah(SASPR, governance chapter); Barbara Parker (consultant, vulnerability and qualitative work onurban and rural poverty, co-managed Urban Poverty in Uttar Pradesh study); Monica Jain(SASPR, poverty profile and general research assistance); Madhavi Kukreja (socialactivist/consultant, gender, co-managed Urban Poverty in Uttar Pradesh study); David Peterswith contributions from Abdo Yazbeck and G N V Ramana (SASHD, health); Ruth Alsop(SASSD, empowerment and social issues, managed Consultations on Poverty Monitoring study);Rie Hiraoko (Asian Development Bank, child labor); Elena Glinskaya (SASPR, NSS 55h roundpoverty profile); Madhu Raghunath (SASPR, general editoral and research assistance); NandKishore Singh (consultant, NSS 55h round poverty profile); Peter Lanjouw (DECRG, differentialreturns, rural non-farm employment); Martin Ravallion (DECRG, poverty simulations) andGaurav Datt (EASPR, poverty simulations); and Angus Deaton (consultant, education, povertymethodology and measurement).
Alfred Friendly provided editorial assistance and Juliet Teodosio and Oxana Brichafinalized the document.
The report also benefited from collaboration and discussions with Indian researchers,social activists, and institutions. Apart from those already mentioned, these include Dr. NishaSrivastava (Allahabad University), Ajay Kumar (Center for Action Research and DevelopmentInitiatives), Sandeep Khare (Vigyan), Shashi Bhushan (A. N. Sinha Institute), Dr. A. K. Singh(Giri Institute), Sahbhagi Shikshan Kendra (SSK), and the wonderful staff of women atVanangana, who gave generously of their time and knowledge. Useful feedback and guidancewas provided at two workshops organized by the Planning Department, Government of UttarPradesh (GoUP), with wide attendance from Government line departments as well as eminentscholars and researchers. The first workshop in October, 2000 reviewed an early draft of thereport; a follow-on workshop was held in August, 2001 to discuss the draft final report. Inaddition, valuable comments were provided by the Planning Commission as well as theDepartment of Economic Affairs, Ministry of Finance, Government of India.
Pravin Visaria, formerly head of the Institute of Economic Growth, was a source ofinspiration and support throughout the work. His recent death is a loss to all of us.
The peer reviewers include Martin Ravallion (DECRG), Lionel Demery (AFTMI),Reider Kvam (SASSD), and Pravin Visaria (Institute of Economic Growth); their inputs wereinvaluable. Also appreciated are comments and advice provided by individuals at various pointsin the process, including Nicolas Stern, Joelle Chassard, Angus Deaton, Shahrokh F,ardoust,Manuela Ferro, Edgardo Favaro, Elena Glinskaya, Ward Henevald, Keith Hinchcliffe,Christopher Hoban, Stephen Howes, Venita Kaul, Sumir Lal, Rinku Murgai, Peter Lanjouw,Giovanna Prennushi, Pronab Sen, and Dina Umalia-Deininger.
A special note of appreciation is due to Michael Walton, who supported the early workon quantitative and qualitative aspects of poverty (UP/Bihar Poverty Study) and encourageddevelopment of new themes and new thinking. Also to Roberto Zagha, who not only supportedthe early work but also helped to bring the report to closure. Finally, special thanks to colleaguesand friends on the Poverty Board and wider poverty "community" in the Bank; we learn fromeach other and continue to break new ground.
EXECUTIVE SUMMARY
1. Rich in potential - in human and natural resources - Uttar Pradesh (UP) once appearedpositioned to be the pace-setter for India's economic and social development. Most of the statelies in the fertile Indo-Gangetic Plain, with high natural soil fertility, abundant rainfall, andsurface and groundwater resources. The Western region was the springboard for the GreenRevolution in the 1960s and 1970s, which helped UP depart from previously low levels ofagricultural growth. Purposeful investments in agricultural research, extension, roads, irrigation,and marketing infrastructure fueled further advances in the 1980s; growth accelerated,accompanied by steady reductions in poverty between the late-1970s and 1980s. Uttar Pradesh,however, now shows less promise. Economic growth faltered in the 1990s and UP has fallenbehind India's better performing states. While a recent acceleration in growth suggests that thedeterioration in UP's performance has been arrested, many problems remain.
2. At the heart of the state's loss of economic momentum is the loss of effectiveness of thepublic sector, which has led to an investment climate not supportive of private investment andgrowth, and to poor performance in the delivery of social and infrastructure services essential forgrowth and poverty reduction. Reversing this loss of dynamism and the impact of that loss on thestate's 60 million inhabitants (out of 175 million') who live in poverty is the state's mostimportant challenge. A comprehensive reform program was launched in 1998 to improve theperformance of the public sector and initial measures were taken. But the pace of reform hasbeen slow. As a result, UP's poor risk falling further and further behind if reforms to acceleratepoverty reduction fail to accelerate. Because Uttar Pradesh is very large - larger than manycountries - and very poor, meeting this challenge is important not only for India, but of globalsignificance. An estimated 8 percent of the world's poor live in UP alone.2
The Face of Poverty in Uttar Pradesh
3. The report documents poverty along a number of dimensions - material deprivation,human deprivation, and a range of other deprivations - e.g. lack of voice, vulnerability,destitution, and social exclusion. Progress across all dimensions is essential if UP is to meet theambitious development goals laid out in the Government of India's Tenth Five Year Plan, as wellas the Mitlennium Development Goals (MDGs).
4. Poverty, measured in terms of material deprivation, is high in UP relative to other Indianstates, and progress at reducing poverty has been uneven over the past two decades. The vastmajority of poor households live in rural areas (80 percent) and poverty historicaUy has beenconcentrated in the Eastern and Southern regions of the state. Official estimates suggest a declinein poverty between 1983 and 1987-88, with progress diminishing through 1993-94.
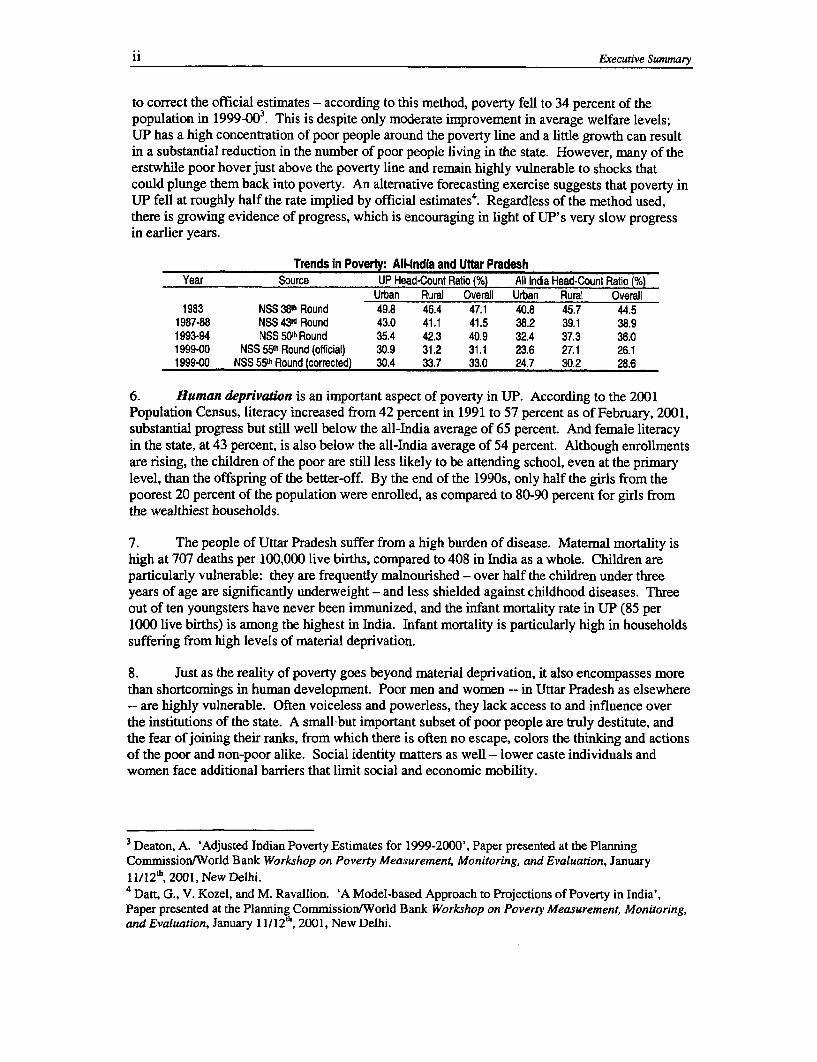
5. India's progress at reducing poverty in the latter half of the 1990s has been the subject ofintense debate, both in India and worldwide. Official estimates based on the most recent NationalSample Survey (NSS 55h Round, 1999-00) herald a dramatic decline in the number of poorpeople living in the state: poverty is estimated to have fallen by 10 percentage points over 6 years- from 41 percent of the total population in 1993-94 to 31 percent in 1999-00. However, changesin the survey methodology have rendered the 55th Round results incompatible with earlier roundsof the NSS. There is still evidence of considerable progress when an econometric method is used
'The statistics used throughout this report deal with Uttar Pradesh as it was before October, 2000, when itsHimalayan Region became the separate state of Uttaranchal.2 Based on an international poverty line of $1.08/person/day in 1993 PPP adjusted prices, 1998 estimates.
ii Executive Summary
to correct the official estimates - according to this method, poverty fell to 34 percent of thepopulation in 1999-003. This is despite only moderate improvement in average welfare levels;UP has a high concentration of poor people around the poverty line and a little growth can resultin a substantial reduction in the number of poor people living in the state. However, rnany of theerstwhile poor hover just above the poverty line and remain highly vulnerable to shocks thatcould plunge them back into poverty. An alternative forecasting exercise suggests that poverty inUP fell at roughly half the rate implied by official estimates4. Regardless of the method used,there is growing evidence of progress, which is encouraging in light of UP's very slow progressin earlier years.
Trends in Poverty: All-Indla and Uttar PradeshYear Source UP Head-Count Ratio (%) All India Head-Count Ratio (%)
Urban Rural Overall Urban Rural Overall1983 NSS 38P Round 49.8 46.4 47.1 40.8 45.7 44.5
1987-88 NSS43fd Round 43.0 41.1 41.5 38.2 39.1 38.91993-94 NSS 50h Round 35.4 42.3 40.9 32.4 37.3 36.01999-00 NSS 55h Round (official) 30.9 31.2 31.1 23.6 27.1 26.11999-00 NSS 55th Round (corrected) 30.4 33.7 33.0 24.7 30.2 28.6
6. Human deprivation is an important aspect of poverty in UP. According to the 2001Population Census, literacy increased from 42 percent in 1991 to 57 percent as of February, 2001,substantial progress but still well below the all-India average of 65 percent. And female literacyin the state, at 43 percent, is also below the all-India average of 54 percent. Although enrollmentsare rising, the children of the poor are still less likely to be attending school, even at the primarylevel, than the offspring of the better-off. By the end of the 1990s, only half the girls from thepoorest 20 percent of the population were enrolled, as compared to 80-90 percent for girls fromthe wealthiest households.
7. The people of Uttar Pradesh suffer from a high burden of disease. Maternal mortality ishigh at 707 deaths per 100,000 live births, compared to 408 in India as a whole. Children areparticularly vulnerable: they are frequently malnourished - over half the children under threeyears of age are significantly underweight - and less shielded against childhood diseases. Threeout of ten youngsters have never been immunized, and the infant mortality rate in UP (85 per1000 live births) is among the highest in India. Infant mortality is particularly high in householdssuffering from high levels of material deprivation.
8. Just as the reality of poverty goes beyond material deprivation, it also encompasses morethan shortcomings in human development. Poor men and women -- in Uttar Pradesh as elsewhere-- are highly vulnerable. Often voiceless and powerless, they lack access to and influence overthe institutions of the state. A small but important subset of poor people are truly destitute, andthe fear of joining their ranks, from which there is often no escape, colors the thinking and actionsof the poor and non-poor alike. Social identity matters as well - lower caste individuals andwomen face additional barriers that limit social and economic mobility.
3 Deaton, A. 'Adjusted Indian Poverty Estimates for 1999-2000', Paper presented at the PlanningCommission/World Bank Workshop on Poverty Measurement, Monitoring, and Evaluation, January11/12h, 2001, New Delhi.4Datt, G., V. Kozel, and M. Ravallion. 'A Model-based Approach to Projections of Poverty in India',Paper presented at the Planning Conrnission/World Bank Workshop on Poverty Measurement, Monitoring,and Evaluation, January 11/12, 2001, New Delhi.
Executive Summary iii
The Causes: Poverty of Resources, Access, and Relationships
9. Poverty is the result of low levels of assets, combined with low and uncertain returns. Incombating poverty, the state will need to build purposefully on all its assets, those in public handsas well as those in the private sector, and not least the real and potential assets of the poorthemselves. The labor of the poor is concentrated in low-paid casual daily wage work; most ownlittle or no land or productive assets. Poor people lack marketable skills and, in most cases,literacy; they suffer disproportionately from poor health and disability. Poverty is caused by ascarcity of private assets. Poor men and women are ill-equipped to take advantage of theopportunities provided by growth in the economy. In addition, public services often by-passthem. Infrastructure development, including provision for drinking and irrigation water,sanitation, electricity and public transport, is very low in UP in comparison with many Indianstates, and access is most limited in backward regions, where many poor people live. Moreover,social services and anti-poverty programs do not perform effectively - in UP there is alsopovertyof access to public goods and services. Neither do the poor participate extensively in networksof informal assistance and mutual support - they suffer frompoverty of social relations. Forthose with extensive social capital, (usually the better-off) these networks can open opportunitiesfor investment or employment, and they can protect households against the economic shocks thatmay plunge the most vulnerable into destitution.
10. In addition to these causes, deprivation linked to gender and caste is a deeply rootedreality in the UP countryside, and any comprehensive effort to reduce poverty must confront thatreality and its consequences. The realities are visible in the segregated hamlets where many ofthe lower castes live on the fringes of rural villages; often distant from community services -schools, health centers, public handpumps, and shops that distribute subsidized grains - inprinciple meant to assist poor families. The realities are as invisible as the girls who never enrollin school. Social inequities are reflected in inequities in the distribution of productive assets,such as land and education. Social inequities are also reflected in inequitable returns to assets:lower-caste households not only own less; they also experience lower returns to the minimalstocks they do possess, including human capital. Deprivations linked to caste and gender createtensions in the society, and these tensions are exacerbated by low growth and limitedopportunities.
11. The poor in UP are highly heterogeneous, ranging from the truly destitute who havenothing and at best manage to survive, to households that are building assets and accumulatingsmall surpluses, well on their way to climbing out of poverty. Many poor people are vulnerable;they face the threat of further impoverishment and a slow slide into destitution. Differing forceslimit economic opportunities among poor households, and the differences impact on futureeconomic prospects as well as have direct bearing on policy and program design.
The Policy Challenges - Beginning with the Essential Role of the State
12. A government that works for poor men and women is a government that works for allcitizens, rich and poor alike. The first and most fundamental challenge for reducing poverty inUttar Pradesh is to improve the quality and effectiveness of the public sector.
13. The reasons behind UP's progressive deterioration in governance are fourfold: first, theadministration has become increasingly politicized, which has eroded the stability of tenure andundercut managerial authority; second, administrative fragmentation has led to a proliferation ofsenior positions and undermined coordination and accountability in administration as well aspolicy-making; third, a related expansion in the size of the civil service, combined with weak
Iv Executive Summary
revenue generation, placed a squeeze on the capital budget as well as spending on operations andmaintenance; and fourth, poor expenditure management practices have undermined the efficacyof public spending for combating poverty in the state. UP's continuing political instability, datingback to the mid-1980s, has contributed to the growing politicization and undermined theeffectiveness of the administration.
14. The burden of poor governance falls directly and indirectly on poor people. They aremore vulnerable to predatory behavior on the part of government officials, particularly the police.And resources intended for the poor are often diverted at the local level for the use of the wealthyand politically well-connected. One result is that poor households frequently lack access to basicservices, and those that reach them are of inferior quality. Indirect impacts are equallypernicious: poor men and women are confined to the sidelines in the state's political life; whilethey carry heavy weights in their daily lives, they carry little or no weight in the offices, agenciesand assemblies where, without their active or informed consent, their lives are often shaped.Many live in isolation and lack basic infornation about their rights and opportunities. Moreover,they lack the resources to vote with their feet and use private providers when unable to get theservices to which they are entitled from the public sector.
15. The way forward is clear. UP needs to find better ways to empower its poorest citizensand bring them into decision-making at all levels. In addition to ensuring that the recently createdPanchayati Raj Institutions (PlRs) include poor people fully as decision makers, JP needs totransforn its public sector so that the conduct of the police, the courts, and the bureaucracy ingeneral is transparent and accountable to citizens at all levels. In addition, administrative andstaffing reforms are needed within the civil service - to reduce fragmentation e.g. by streamniningand combining departments and sub-departments with similar functions, and to improve overallproductivity and staffing and skills mix. Complementary reforms are needed at the sectoral levelto improve regulation and service delivery in the areas that matter most for poor people - health,education, drinking water, and sanitation. As well, the efficiency of public spending must beimproved, both by strengthening core expenditure management processes and developing ways toensure that the state's public expenditure program is pro-poor. Budgets should be linked toperformance, performance measured in terms of discernable improvements in the lives of poormen and women, not just the rich and powerful.
Broadening and Accelerating Economic Growth
16. A second challenge is to accelerate growth, the foundation stone of anti-poverty policiesin Uttar Pradesh as well as worldwide. A dynamic economy, growing strongly, is a powerfulforce for creating new and better employment opportunities for poor people, enablingempowerment, and reducing vulnerability. Poverty in the state has fallen during periods of rapidgrowth and stagnated in periods where growth has been slow.
17. Achieving faster growth will require substantial improvements in the investment climatefor private sector led growth. In a recent survey of CEOs of major firms in India, the investrnentclimate in UP was ranked 16t (just ahead of Bihar) out of a list of 17 major Indian states.Inadequate infrastructure, a poorly skilled domestic work-force, weak governance, and a rigidregulatory environment have all combined to discourage the flow of new investment into manyregions of Uttar Pradesh. The state has moved some way in recent years towards removingnumerous regulations that curbed economic activity and impeded production and investment,liberalizing land purchase for industrial units, and introducing a single-window system for rapidclearances. Government orders have restricted discretionary inspections and streamlined the roleof inspectors, reducing harassment of industrial and trade establishments. While many good laws
Executive Summary V
and measures have been passed or enacted, the main challenge ahead is to ensure furtherderegulation, and effective implementation in practice.
18. Where poverty is endemic in the countryside, as in Uttar Pradesh, accelerated growth inrural areas ranks as an important remedy. In UP' s still heavily agrarian economy (agricultureaccounts for 42 percent of Gross State Domestic Product (GSDP) and 75 percent of totalemployment), a healthy agriculture sector is needed to power rural progress. Growth inagriculture was uneven through the 1990s, averaging less than 2 percent per annum. The sectorhas suffered not just from policy distortions and from pervasive controls on commoditymarketing, policies that had pernicious effects throughout India, but also from a steady decline inlevels and composition of investment in agriculture. As UP fiscal deficits rose through the latterhalf of the 1990s, not only did productive public spending for rural growth slow; but many of theremaining outlays took the form of inefficient subsidies for power, water, and fertilizer, inparticular. Investments in roads and irrigation and in maintaining vital infrastructure suffered.
19. While rpany of today's poor remain heavily dependent on the land, the rural non-farmsector has an important and growing role in providing economic opportunities for poor men andwomen. These views came out strongly in field consultations and participatory studies. Non-agricultural incomes are highly valued by poor households because they increase incomes at themargin as well as minimize risk through diversification. Moreover, an expanding non-farmsector can help to reduce poverty even for those poor not directly employed off-farm bytightening village labor markets and raising wage rates for agriculture laborers.
20. There are three key areas where actions are needed to accelerate growth and reducepoverty in rural areas. First, there is a pressing need to remove bottlenecks in infrastructure andthe supply of goods and services key to production. Critically needed is increased public supportfor research and extension, marketing activities, and infrastructure (particularly irrigation androads). Given the current fiscal crisis, Government should focus on improving the quality andefficiency of infrastructure services through three channels: reallocation of expenditures (e.g. byreducing subsidies, particularly subsidies that accrue to the better off rather than the poor,improving maintenance of roads and the canal irrigation system, and better research anddevelopment); enhanced resource generation (e.g. through user fees for public irrigation, higherpower tariffs, particularly in the agriculture sector, more effective metering, billing and collectionof power tariffs, and better mobilization of private sector investment for marketinginfrastructure); and institutional reforms to support better and more equitable management andmaintenance of local public assets (e.g. water users associations, transferring the maintenance ofvillage roads to PRIs). Second, actions are also needed to improve the regulatory environment,by lifting controls on marketing of agriculture commodities and simplifying rules, regulations andlicensing laws that work as obstacles to higher incomes for poor people. Although large scaleland reforms have proven difficult in UP, reforms in the structure and regulation of the landmarket are needed to improve productivity and broaden the impact of agriculture growth. Third,a breakthrough is needed to ensure an adequate flow of credit to poor farmers and micro-entrepreneurs. As long as provision of credit to all sectors suffers due to the weak commercialorientation of the public banks that dominate India's financial system, the poor are particularlyvulnerable, both directly and indirectly. High transaction costs along with the absence of suitablecollateral means that poor people in UP are often unable to access credit from institutionalsources. Purely state-led efforts to provide financial services to the poor have not beensuccessful, and new approaches should be sought.
21. Correcting gender bias in its multiple social, economic, and political forms can unleashanother strong force for economic growth - the energy of women as farmers and as small-scale,
vi Executive Summary
rural entrepreneurs. On the economic front, the two most immediate areas for action concernlegal rights and credit. Ensuring women's right to possess productive assets will enhance theirsecurity and economic potential. To do so, however, will require reversing both customarypractice and the legislative framework that still function in many ways to deny women equalrights to assets, including land. Even where legal claims exist, women may find themunenforceable. In addition, women, particularly poor women from lower castes, are subject tosocietal as well as domestic violence, and widows and widows and deserted women areparticularly subject to various forms of discrimination not only in access to jobs but also inaccessing basic services and safety nets.
Improving Quality and Access to Services
22. The quality of what government does or fails to do at the local level matters a great dealto the lives of poor men and women. The final challenge is to expand their human capabilities,through widening access to essential services - in particular education, health, social welfareprograms and safety nets. The poverty-reducing impacts of reform-led growth are highlycontingent on actions taken now to help poor people acquire the skills and education they need,provide better access to public goods and services, and remove barriers to using them.Opportunities also carry risks; measures must be in place to reduce risk and protect thevulnerable. The poor in UP have limited access to decent quality education and health servicesprovided through the public sector; they are also ill-served by private providers. And there arepervasive failures in the outreach and impact of many of India's Anti-Poverty Programs (APPs)and safety nets.
23. Uttar Pradesh spends little on elementary education: spending rose from only 1.7 percentof GSDP in the early 1990s to 1.8 percent by the end of the decade. Better performing statesspend more on a per-student basis: Himachal Pradesh spends almost twice as much as UP,Kerala spends half again as much, and Karnataka and Rajasthan spend 25 percent more on a per-student basis.
24. Of the urgent policy responses needed to upgrade educational performance in UP, thefirst is the need to spend more and spend better to achieve India's goal of education for all.Enrollments and literacy improved in the 1990s but there Second, though, are improvements inphysical, economic and social access for children from poor families and the socially excluded,many of whom live either in rural hamlets far from centrally located facilities or in unrecognizedurban slums where no schools exist. Finally, while expanding access may bring children intoschool initially, policy-makers have to improve the quality of teaching and relevance of what istaught so that poor boys and girls not only enter school but also stay to learn the skills they needto compete successfully in India's rapidly changing job market. Poor parents must see - as manydo not - that expected returns to education will be high enough to offset the opportunity cost ofthe child's lost labor (at home as well as in the market) as well as direct costs of schooling. Poorfamilies in particular are less likely to be able to afford the books, school supplies and uniformsrequired for school attendance, and the public sector provides little in the way of financialsupport. Evidence from other countries has shown that scholarship programs (e.g. directed atgirls and ethnic minorities) can be effective at raising school attendance. Addressing these manybarriers also may help reduce the incidence of child labor, a serious problem in UP that theGovernment has sought to address with limited success.
25. Despite extensive coverage in the state of the District Primary Education Program(DPEP), and evidence that it has helped to increase public school enrollments and retention, UttarPradesh still has the highest rate of private school enrollments in India: one-quarter of all rural
Executive Summary vii
children enrolled at the primary level attend private (recognized and unrecognized) schools, as do70 percent of urban children. And there is emerging evidence that private school enrollments areon the rise, even among poor households, reflecting lack of access and poor quality on the part ofpublic providers. While the facts remain to be firmly established, they nonetheless raise concernsabout the efficacy of the public sector in meeting the education needs of poor children.
26. As with education, access to public health services and the quality of these services forthe poor are constrained by inadequate resources inefficiently spent. The proportion of publicresources UP currently comniits to health is low by both Indian and international standards.Moreover, spending in the health sector tends to be regressive, with the exception of someservices, such as immunizations and non-hospital outpatient care, that are pro-poor. Out of every100 rupees spent in the public sector on curative health care services in UP, the poorest 20percent of the population receive 10 rupees in health services while the richest 20 percent receive41 rupees5.
27. Public facilities for primary health care are rarely utilized by poor people. One reason forthis is the lack of adequate supplies of medicines and other medical necessities. Staff shortages,moreover, commnonly result in health centers and similar posts being unattended. Auxiliary NurseMidwifes (ANMs), the health workers with the greatest outreach in the community, are seriouslyoverburdened and lack promised back-up and support. Not only has funding of personnel costsbeen too low, but added resources are required to improve the capabilities and performance ofpublic health practitioners now at work.
28. Like the education sector, many poor households use costly - and often ill-trained andineffective - private health care providers. And like the education sector, this finding raisesserious concerns about the role and efficacy of the public sector in providing basic services forUP's poor people
29. Reforms are needed to rejuvenate UP's health sector to better deliver core functions;make better use of the private sector and improve standards of care; use public information moreeffectively to promote disease prevention and develop more informed health consumers; andfocus the overall system to better serve the needs of the poorest and most vulnerable. Efforts areunderway in the state to develop and implement a strategy to achieve these much needed reforms;early results are encouraging.
30. In order for safety net programs and pro-poor policies to be effective in protecting andenhancing livelihoods, they must be appropriately designed, easily accessible to those who needthem, provide a reliable level of service, and make efficient use of scarce resources. Many ofIndia's anti-poverty programs and social welfare schemes do not meet those standards. Inaddition to program-specific problems, the schemes have been weakened by a lack of politicalcommitment as well as limited transparency and accountability. Accountability is furthercomnpromised by a lack of coordination between the many agencies involved in administeringthese programs. Targeting is poor, and the neediest are frequently bypassed. These programs areparticularly ineffective in UP's least developed regions, where poverty is high and needs aregreatest.
' National Family Health Survey (NFHS-1), 1992-93
Viii Executive Summary
The Way Forward
31. Accelerating growth, putting the delivery of social services to poor men and women onan efficient basis, empowering them as citizens and opening the public sector to public scrutinyso that both corruption and nonfeasance can be identified and redressed - all these are formidablechallenges. They would strain the resources and will of many developed societies. But they arenot utopian goals. They are the prerequisites for steady progress, not just against poverty buttoward widely and equitably shared well-being. The Government will have to harness its effortsand will to overcome all the separate but interlocking challenges enumerated above. It has anessential - and irreplaceable - role in achieving India's longstanding goal of poverty eradication.The newly-elected Government now has an opportunity to accelerate growth and empower thepoorest amongst its citizens through higher incomes, better education and health, and a strongervoice in the decisions that affect their lives.
Chapter I
POVERTY IN UTTAR PRADESH - THE CONTEXT
A. An Introduction
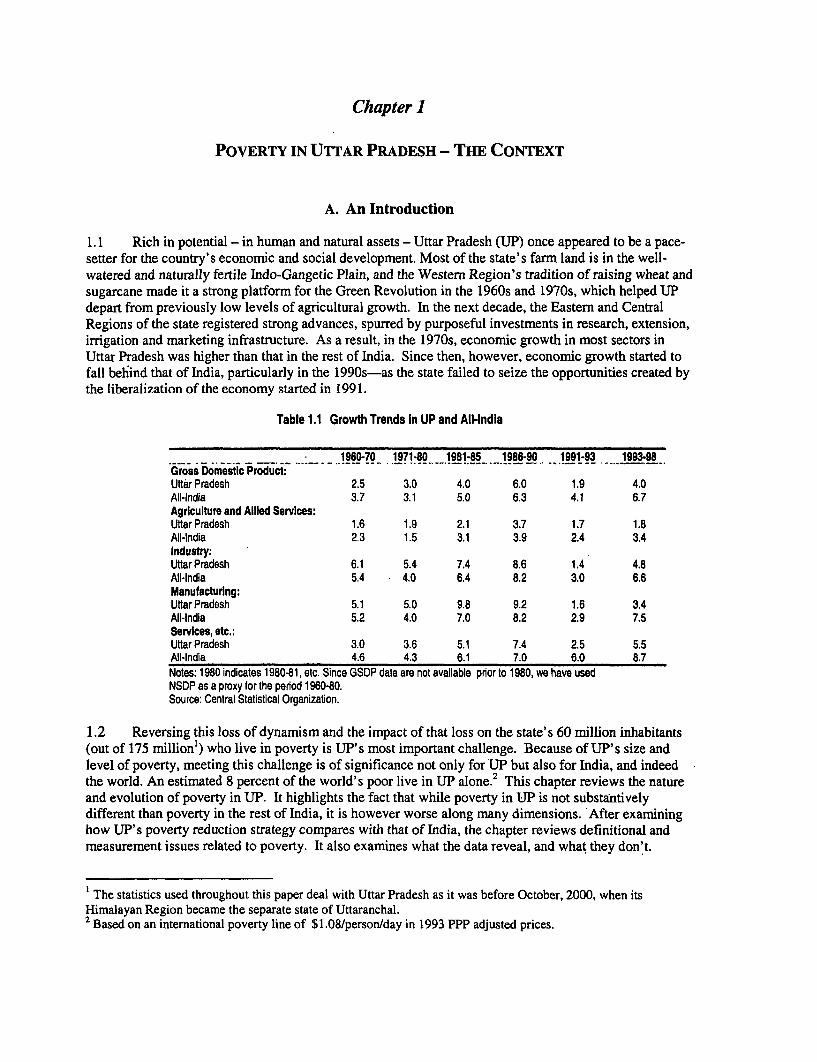
1.1 Rich in potential - in human and natural assets - Uttar Pradesh (UP) once appeared to be a pace-setter for the country's economic and social development. Most of the state's farm land is in the well-watered and naturally fertile Indo-Gangetic Plain, and the Western Region's tradition of raising wheat andsugarcane made it a strong platform for the Green Revolution in the 1960s and 1970s, which helped UPdepart from previously low levels of agricultural growth. In the next decade, the Eastern and CentralRegions of the state registered strong advances, spurred by purposeful investments in research, extension,irrigation and marketing infrastructure. As a result, in the 1970s, economic growth in most sectors inUttar Pradesh was higher than that in the rest of India. Since then, however, economic growth started tofall behind that of India, particularly in the 1990s-as the state failed to seize the opportunities created bythe liberalization of the economy started in 1991.
Table 1.1 Growth Trends In UP and All-India
1960-70 1971-80 1981-85 1986-90 1991-93 1993898Gross iDomestic Product:Uttar Pradesh 2.5 3.0 4.0 6.0 1.9 4.0All-India 3.7 3.1 5.0 6.3 4.1 6.7Agriculture and Allied Services:Uttar Pradesh 1.6 1.9 2.1 3.7 1.7 1.8All-India 2.3 1.5 3.1 3.9 2.4 3.4Industry:Uttar Pradesh 6.1 5.4 7.4 8.6 1.4 4.8All-India 5.4 4.0 6.4 8.2 3.0 6.6Manufacturing:Uttar Pradesh 5.1 5.0 9.8 9.2 1.6 3.4All-India 5.2 4.0 7.0 8.2 2.9 7.5Services, etc.:Uttar Pradesh 3.0 3.6 5.1 7.4 2.5 5.5All-India 4.6 4.3 6.1 7.0 6.0 8.7
Notes: 1980 indicates 1980-81, etc. Since GSDP data are not available pror to 1980, we have usedNSDP as a proxy for the perod 1960-80.Source: Central Statistical Organization.
1.2 Reversing this loss of dynamism and the impact of that loss on the state's 60 million inhabitants(out of 175 million') who live in poverty is UP's most important challenge. Because of UP's size andlevel of poverty, meeting this challenge is of significance not only for UP but also for India, and indeedthe world. An estimated 8 percent of the world's poor live in UP alone.2 This chapter reviews the natureand evolution of poverty in UP. It highlights the fact that while poverty in UP is not substantivelydifferent than poverty in the rest of India, it is however worse along many dimensions. After examininghow UP's poverty reduction strategy compares with that of India, the chapter reviews definitional andmeasurement issues related to poverty. It also examines what the data reveal, and what they don't.
The statistics used throughout this paper deal with Uttar Pradesh as it was before October, 2000, when itsHimalayan Region became the separate state of Uttaranchal.2 Based on an international poverty line of $1.08/person/day in 1993 PPP adjusted prices.
2 Chapter 1: Poverty in Uttar Pradesh - The Context
Growth has been slower in UP than the all-India average; nonetheless important progress appears to havebeen made in combating poverty in recent years. While these gains are noteworthy, it is important tokeep in mind that there are substantial numbers of households clustered in and around the poverty lineand relatively small improvements in their incomes may have a significant impact on the measuredincidence of poverty. This also implies that many households still have welfare levels very near thepoverty cut-off and remain vulnerable to short-term shocks that frequently plunge them back into poverty.
1.3 A profile of the poor in UP is presented in Chapter 2, which analyzes poverty along three criticaldimensions - poverty of private resources, poverty of access to public goods and services, and poverty ofsocial relationships. The chapter also discusses the role played by social identity - and in particular,gender and caste - in limiting or even barring opportunities to escape poverty. It also looks at child laboras a manifestation of the vulnerability of children to the economic and social conditions in which theyhave to grow and develop.
1.4 At the heart of UP's loss of economic momentum has been the loss of effectiveness of the stateadministration which has both led to an investment climate not supportive of private investment andgrowth, and to a poor performance in the delivery of social and infrastructure services essential forgrowth and poverty reduction. Chapter 3 reviews the reasons behind the loss of effectiveness of the stateadministration in carrying out its development functions. It starts with a review of the unstable nature ofthe state politics in recent decades, possible sociological driving forces, and how these may havecontributed to weakening the foundations of the state administration and eroding its effectiveness incarrying out essential functions. Modernizing UP's state administration, reducing its politicization,making it more responsive and accountable to the population are essential for the state to restore itseconomic dynamism and reduce poverty-and the report examines options as to how this can be bestachieved.
1.5 Chapter 4 then turns to examine the economic environment in more detail. It examines thepolicies and constraints to UP' s economic growth-so vital for creating opportunities for the poor,enabling their empowerment, and reducing their vulnerability. The chapter briefly compares theinvestment climate in UP with that of other states in India and explores reasons why UP ranks so low inIndia-mostly because serious infrastructure shortcomings and counterproductive regulations havereduced returns on private investment while poor governance has raised variability and uncertainty onsuch returns. It also examines factors behind the slowdown in growth in the agriculture sector, given itscontinuing important role in providing employment and income for the rural poor.
1.6 Chapter 5 ends the report by examining how well public services reach the poor. The quality ofwhat government does or fails to do at the local level matters a great deal to the lives of the poor. In UP,the poor have limited access to good quality health and education services provided through the publicsector; they are also ill-served by private providers. The chapter also documents pervasive failures in theoutreach and impact of India's anti-poverty programs and safety nets. The chapter highlights variousoptions for improving the delivery of basic services, building on the review of state administration inChapter 3.
B. India's and UP's Poverty Reduction Strategies.
India's Strategy for Poverty Reduction: Growth with Social Justice and Equity
1.7 Poverty reduction has been a key concern of India's founding fathers, and poverty reduction hasbeen addressed in successive five year plans since just after independence. India's current strategy for
Chapter 1: Poverty in Uttar Pradesh - The Context 3
poverty reduction is articulated in considerable detail in the Ninth Five Year Plan, which covers theperiod 1997 to 2002, and in the Mid-Term Appraisal completed in October 2000.
1.8 The overriding objective of India's poverty reduction strategy is growth with socil justice andequity. While projecting public and private investment requirements, the Plan gives greater priority, in aliberalized environment, to "planning for policy" and suggesting the major directions for policy reformsand interventions. Issues related to governance and institutions are also a theme of the strategy, whichenvisages greater local participation to improve the effectiveness of delivery mechanisms, and whichemphasize the empowerment of women, the poor, and local communities. On the growth front, the Plan's15-year long-term perspective targets an average annual growth rate of 7.4%, starting with 6.5% for theNinth Plan period and increasing in successive Plan periods, with a view to reducing poverty to below10% of the population over this period.
1.9 As articulated in the Ninth Plan, India's poverty reduction strategy envisages a two-prongedapproach: (i) promoting faster growth by improving the investment climate and (ii) increasing theeffectiveness of pro-poor interventions. Both require extensive reform at the state level, and the plandiscusses these in considerable detail.
Investment Climate
1.10 Fiscal sustainability. The Plan documents note the precariousness of the current fiscal situation,and recommend corrective measures at both the central and state levels. Tax reforms focusing on basebroadening and improving compliance are planned in order to halt the decline in the tax-to-GDP ratio.Tighter expenditure controls are also important, especially in relation to the wage bill. Subsidies, bothexplicit subsidies at the central level, such as for food and fertilizers, and implicit at the state level, suchas for power, higher education and irrigation, will need to be cut. At the same time, there is recognitionof the need to increase the effectiveness of public spending and also recognition of how poor governanceerodes the effectiveness of spending.
1.11 Governance. Improving the quality of governance is emerging as a key element of India'spoverty reduction strategy. In his address to the National Development Council meeting held on February19, 1999, the Prime Minister stated: "People often perceive the bureaucracy as an agent of exploitationrather than a provider of service. Corruption has become a low risk and high reward activity. Frequentand arbitrary transfers (of government officials) combined with limited tenures are harming the workethics and lowering the morale of honest officers. While expecting discipline and diligence from theadministration, the political executive should self-critically review its own performance. Unless we dothis, we cannot regain credibility in the eyes of the people who have elected us to serve them."
1.12 As highlighted in the Plan, the bureaucracy is becoming increasingly subject to politicalinterference, a phenomenon most manifest in the shrinking average tenure attached to many governmentpositions, especially at the state level. The judicial system is not functioning well: currently an estimated25 million cases are pending in various courts. Tackling these, and related problems, will require reformsdealing with the civil service, the judicial system, anti-corruption strategies, etc., and the activeinvolvement of civil society. The Mid-Term Appraisal outlines a comprehensive strategy along theselines and highlights that "administrative and legal reforms should be an integral part of the reformagenda."
1.13 Domestic and external liberalization. Growth in India benefited greatly from the reduction ofindustrial investment licensing regulations. However, the business environment continues to beunpredictable, discretionary and burdensome. The government strategy recognizes the importance offurther domestic liberalization, including: (i) immediate abolition of small-scale reservations in critical
4 Chapter 1: Poverty in Uttar Pradesh - The Context
export areas, and phasing-out of reservations in other areas; (ii) deregulation in labor policy, accompaniedby introduction of unemployment insurance; (iii) completion of the dismantling of administrative prices(e.g., in petroleum products); and (iv) reduction of clearance delays and harassment of businesses byexcessive inspection requirements. To continue the liberalization of the external regime initiated in 1991,the strategy calls for a time frame to be laid down for a phased reduction of tariffs from their currentaverage level of 30 percent to an average of 10 percent.
1.14 Agricultural reforms. Attacking rural poverty requires deregulation and more liberal ruralpolicies as well as an expansion of rural infrastructure to boost agricultural growth. The Ninth Plan thussets out a multi-dimensional reform agenda for improving incentives to production, rationalizingsubsidies and promoting investments, besides extending protective cover to the poor. A review andelimination of myriad controls in the domestic market for agricultural produce is presented as an urgentnecessity. Other rural development reforms identified pertain to rural credit, land reforms, and thedevelopment of rain-fed areas and exploitation of ground water potential.
1.15 Infrastructure bottlenecks. The Plan recognizes that infrastructure bottlenecks have become amajor constraint on growth. Although public investment in infrastructure will remain central, mobilizationof private investment is also important. The Plan recognizes that private investment has been deterred bythe slow pace of policy reform, the high degree of uncertainty over the policy and regulatory frameworks,the unreliability of the legal system to enforce contracts, and exposure to political interference andcorruption. Key sectoral issues include the following:
* The transport sector will continue to rely largely on public investment. Currently, it is inefficientand under-funded, resulting in growing congestion and longer delays, all of which push up costs forIndian producers. Many rural habitations are not connected to the main road network. Thegovernment is moving towards improving road sector management, creating various road funds at thestate and central levels financed by road users through diesel/petrol cess, and making tangibleprogress on the proposed "quadrilateral" national highway linking the four largest cities in thecountry.
* Urban infrastructure. Despite the relative deceleration in India's rate of urbanization over the last20 years, the gap between demand and supply of basic urban services has widened as a result ofineffective management, inadequate funding, and poor project development. Urban water has goodpotential for private sector participation, but the basic regulatory framework and commercialorientation is yet to develop.
* Power sector reformn. According to the Government's strategy, "reforms in the energy sector shouldstart with the restructuring of State Electricity Boards (SEBs). Unbundling the SEBs and separatinggeneration, transmission and distribution into separate corporations will make it possible to monitorefficiency levels in each activity and also to create appropriate incentives for efficiency in each areaUnbundling will also make it easier to allow private sector operators in each area in a suitablemanner.
More Effective Pro-Poor Interventions
1.16 India's poverty reduction strategy is based on the premise that "economic growth andemployment opportunities in themselves may not be sufficient to improve the living conditions of thepoor. They need to be accompanied by measures which enhance the social and physical conditions ofexistence." The Ninth Plan recognizes that, "despite considerable efforts, provision of socialinfrastructure and services remain inadequate... Primary education, primary health care, safe drinkingwater, nutrition and sanitation require heavy investment which has to be provided out of publicfunds... Furthermore, recognizing the localized nature of these essential services, it is desirable that
Chapter L: Poverty in Uttar Pradesh - The Context 5
control over operation and maintenance of thefacilities should be in the hands ofpeoples' institutionsand local associations."
1.17 Education. India's poverty reduction strategy looks at education as "the most vital and crucialinvestment in human development, " with elementary education receiving the highest priority. The NinthPlan seeks to achieve universal elementary education (age 6-14) through several measures:
* Amendment of the Constitution to make elementary education a fundamental right.* Decentralization of planning, supervision, and management of education through local bodies.* Social mobilization of local communities for adult literacy campaigns andfor promotion of
primary education.* Stronger partnership with NGOs and voluntary organizations.* Advocacy and media campaigns.* Provision of opportunities for non-formal and alternative education for out of school children in
the moss backward areas andfor unreached segments of the population.
1.18 The Cabinet has recently sanctioned the Sarva Shiksha Abhiyan (Education for All), a centrallysponsored scheme within which all existing government programs supporting elementary education willbe placed and which will provide substantial additional financial support to the states.
1.19 Health. In the Ninth Plan, the focus is on integrating communicable, non-communicable andnutrition related health services, through strengthening and better utilization of existing health careinstitutions. The Plan aims to minimize the existing disparities between states and ensure that reforms donot result in deterioration of health status in poorer segments of the population. Special attention is givento gearing up to combat the new threat of TV/AIDS. The National Population Policy 2000 affirms thegovernment's commitment to gender-sensitive policies with a holistic approach to population anddevelopment through decentralized planning and program implementation. It focuses on healthcommunication and behavior change, convergence of service delivery at the village level, meeting theunmet needs for family welfare services, ensuring coverage of the under-served population in urban slumsand tribal communities, and increasing collaboration with the private sector and NGOs.
1.20 More effective anti-poverty programs. India spends heavily on anti-poverty programs in ruralareas, but many question the efficiency and efficacy of these expenditures and their vulnerability tocorruption and rent seeking. The Mid-Term Appraisal notes that the "role of anti-poverty programs tosupplement the growth effort is not only valid in the post-reform period but becomes even greater toprotect the rural poor against adverse consequences of economic reforms. " However, the governmentrecognizes the need to restructure such programs for effective implementation and for enhancing theproductivity of the beneficiaries in rural areas. "A major weakness in the implementation ofpovertyalleviation programs has been the lack of participation by the people for whom the programs are meant.Strong local governance such as expectedfrom Panchayati Raj Institutions - responsive to the needs ofbeneficiaries, encouraging mobilization of the rural poor, and open to social audit - promises betterdelivery of poverty alleviation programs. "
The Role of the States in Poverty Reduction and Reforms
1.21 The Plan also reflects the increasing complementary responsibility of the states in implementingIndia's poverty reduction strategy. India's Constitution grants considerable power to the states in terms ofregulatory oversight, tax and expenditure assignments, provision of infrastructure, and provision of socialservices. Before the 1990s, states' discretion in policy making was limited by the dominance of nationalpolitical parties and central planning. The changes in the 1990s have made the quality of a state's owneconomic and social management a much more important determinant of its growth and social
6 Chapter 1: Poverty in Uttar Pradesh - The Context
performance. The Ninth Plan explicitly recognizes the importance of state-level reform and the need forindividual states to evolve efficient and socially desirable policies.
1.22 A number of states have formulated explicit poverty reduction strategies, sometimes in thecontext of preparing state-level Human Development Reports (HDRs). In the case of AP, for example, athe government has drafted a comprehensive vision document that articulates the development agenda forthe state. The report took several years to prepare and drew on extensive consultations in all districts ofthe state. More recently, 16 policy papers have been tabled for discussion at the State Assembly whichpropose policy and institutional changes to improve the investment climate, increase economic growth,improve the effectiveness of public spending, and ensure the poor's access to essential services - health,education, and drinking water. Karnataka is in the midst of a similar process also based on extensiveconsultation and debate across a range of stakeholders. This work builds on analysis, consultations, andstrategy formulation undertaken for the state's HDR, which was a comprehensive and forward-lookingdocument.
1.23 Reforms needed at the state level to advance growth and poverty reduction are comprehensive.They entail fiscal reform - most states are facing serious fiscal problems that impair essentialdevelopment spending; reform of the public sector - generally overextended and characterized by weakpublic management and institutions that impair the effectiveness of government and delivery of services;and structural reform across a range of sectors, including power, irrigation, agriculture, and roads. Whilemany of needed reform measures can be initiated by state governments, other key reforms needed toimprove the investment climate - e.g. banking reforms, or measures to improve the national highways orother national infrastructure - must be initiated by Central Government. More recent initiatives todevolve certain responsibilities to lower tiers of government have widened the base of institutional actorsinvolved in India's reform agenda. An important development over the nineties is the devolution ofresponsibilities to the third-tier or local governments. In the wake of the 73rd and 74th Amendments,adopted in 1993, many states have developed ambitious plans for decentralization that are at variousstages of implementation. The Plan endorses the move towards decentralization, and notes that both localgovernments and user groups have a role to play in enhancing beneficiary participation and control -- withthe ultimate objective of of increasing the efficiency, transparency and accountability of public spending.However, with very few exceptions, decentralization is at an early stage in India.
1.24 In short, many states face a daunting agenda of high priority reforms, not least because theyrepresent a departure from India's populist policies of earlier years and are politically difficult toimplement - sectoral reforms may entail sharp reductions in subsidies and/or higher user fees (e.g. forpower, irrigation, public transportation) as well as radical changes in institutions (e.g., privatization,reform of large government departments such as public works, forestry, and irrigation).
Addressing the Challenges - UP's Strategyfor Poverty Reduction
1.25 Uttar Pradesh articulates a strategy for poverty reduction in its own Ninth Five Year Plan3,covering the period 1997-2002. The Plan highlights the challenges faced by the state and the slow rate ofprogress in recent decade, particularly during the period of the Eighth Five Year Plan, where aggregategrowth in the state fell well short of the targeted rate of 6.0 percent. Progress at reducing poverty alsowas acknowledged to be slow.
1.26 Consistent with the strategy outlined in GOI's Plan, UP's strategy calls forfaster growth withmore equitable distribution of income, while recognizing an essential role for programs that promote
3The strategy is described in Chapter 4 "Poverty and Unemployment", Government of Uttar Pradesh, Ninth FiveYear Plan 1997-2002, and Annual Plan, 1997-98. Vol 1.
Chapter 1: Poverty in Uttar Pradesh - The Context 7
self-employment as well as short-term wage employment. The Plan highlights the need to expand andbetter target UP's range of employment programs during the period of the Ninth Plan, and notes theimportance of improving productivity in the agriculture sector, with a more rapid shift out of low-value tohigher-value labor intensive crops, and to non-farm activities like milk production, poultry, eggproduction, and pisciculture. It raises concerns about the slow rate of improvement in food grainproduction, increasing rates of under and unemployment, slow improvements in literacy, as compared tobetter performing states in the 1970s and 1980s, high rates of population growth, and increasing numbersof workers in agriculture despite a falling contribution of the sector to output levels in the state.
1.27 UP has the largest population of Scheduled Castes in India, and the state's Ninth Plan looks at thegaps between Scheduled Caste and Schedule Tribe (SC/ST) households and majority households along anumber of dimensions, viz. representation in government services, literacy levels, land ownership,poverty levels, occupational patterns, and violence and atrocities. Security is a recurring theme: the Plannotes that "their (SCIST) social development causes inequilibrium and consequently resentment in othersections of the society. It leads to committing atrocities against them... which frequently occur causinghuge loss to their life and property. " The document reaffirms UP's commitment to the "protection andpromotion of the interests of weaker sections of society, especially Scheduled Castes. "
1.28 Specific objectives cited in the Ninth Plan for improving the welfare of SC/STs include:
* Substantial reduction in poverty and unemployment;* Creation of productive assets in favor of SCISTs to sustain the growth likely to accrue through
development efforts;* Diversification of the economy;* Human resource development by providing educational and health services adequately;* Provision of physical and financial security against exploitation.
1.29 The program of Basic Minimum Services, launched in 1996-97, also forms an important elementof UP's strategy for combating poverty in the state. The Basic Minimum Services program grew out ofIndia's Minimum Needs Program (MNP), initially launched under the Fifth Five Year Plan, but has asharper focus on rural areas and poorer sections of the society. Approximately 60 percent of outlays areprovided through the state's plan budget, with the remaining 40 percent as central share directed towardscentrally sponsored schemes that contribute to achieving seven Basic Minimum Services norms:
* Full coverage of provision of safe drinking water in rural and urban areas;* Full coverage of primary health service facilities in rural and urban areas;* Universalization of primary education;* Provision of public housing assistance to all shelterless poorfamilies;* Extension of mid-day meals program to rural blocks and urban slums and disadvantaged
sections;* Road connections to all unconnected villages and hamlets;* Streamline operation of the Public Distribution System (PDS) to focus more on the poor.
1.30 While UP's strategy for reducing poverty is rightly focused on the programs that could improvethe living conditions of the poor, it does not explore the structural reforms that would enable the state toattract private investment in critical areas, increase growth, and expand economic opportunities for thepoor. Nor does it articulate the reforms needed to ensure that the proposed expansion in governmentprograms is fiscally feasible, effective in its use of public resources, and reaches the poor - all three areformidable challenges that need to be urgently addressed. UP' s strategy also needs to provide greaterclarity on the respective responsibilities of various tiers of government - Center, State, and lower tiersunder the Panchayati Raj Institutions (PRIs) - both in terms of design and implementation. As well, the
8 Chapter 1: Poverty in Uttar Pradesh - The Context
strategy should acknowledge the importance of actors outside the public sector - e.g. civil societyorganizations, private sector firms, and service providers - in combating poverty in the state. While astart was made in formulating such a strategy in 1999-2000, with a number of policy papers prepared anddebated in the State Assembly, the momentum slowed to some extent in the latter half of 2000.
C. Data Sources and Data Concerns
1.31 This report makes use of a wide range of information, including data from household surveys,administrative records, and participatory studies and consultations undertaken specifically for the report.However, the survey data present a number of challenges; in particular, the interpretation of the mostrecent official data on welfare and poverty is controversial and intensely debated, and while moregenerally accepted data are available, they are often out-of-date and of dubious current relevance. Manyof GOI's less controversial official surveys date from the early-to-mid 1990s and may no longer representthe realities of living conditions in the state. In addition, statistics derived from various data sources areoften inconsistent. We raise these issues at various points in the report. One of the keyfindings to emergefrom this work is the urgent need to improve the quality and timeliness of statistics on poverty and livingconditions, not only for UP but for India more widely.
Overview of Data Sources
1.32 The primary sources of information on poverty and living conditions in India are the NationalSample Surveys (NSS), which are conducted on an annual basis by the National Sample SurveyOrganization (NSSO), in GOI's Department of Statistics. Every five years, NSSO conducts an extensiveconsumer expenditure. survey (with a "thick" sample of approximately 150,000 households) that is usedby the Planning Commission to develop "official" poverty estimates at the state and national level. Inintervening years, surveys are conducted on special topics, e.g. health and education, small scaleenterprises, etc. As part of these surveys, data are collected on consumer expenditures from a smallersample of households than in the quinquennial surveys; these "thin" rounds are not fully comparable withthe "thick" rounds, not only because they have a smaller sample size, but also because their differentpurposes mandates a different sample design. In consequence, the GOI's official poverty statistics makeno use of those rounds, though many outside researchers have done so (Visaria, 2000; Sen, 2001; Dattand Ravallion, 1998; Ravallion and Datt, 2001). In the 1980s and 1990s, thick sample consumptionsurveys were conducted in 1983 (NSS 38" round), 1987-88 (NSS 43rd round), 1993-94 (NSS 50' round)and 1999-00 (NSS 55t' round) Extensive surveys of heath and education services were conducted in1986-87 (NSS 42^d round) and 1995-96 (NSS 52nd round). This report uses data from the official series ofconsumption surveys (with a caveat on the 55"' round, discussed shortly) as well as the health andeducation surveys.
1.33 Several other government agencies and research organizations undertake household surveys - alarge national survey of rural households carried out by the National Center for Applied EconomicResearch (NCAER) in 1993-94, and two rounds of the National Family Health Surveys (NFHS-1, NFHS-2), were carried out under the overall supervision of the International Institute for Population Studies(lIPS) in 1992-93 with a follow on survey in 1998-99. Statistics from these surveys are also used in thereport.
1.34 There are problems of consistency between data sources, and in particular between statisticsbased on administrative records (e.g. on school enrollment and drop-outs) and statistics derived fromhousehold surveys. The report cites diverse sources and notes inconsistencies where they exist - as theydo all too frequently. These inconsistencies are particularly severe in the case of education and assessingimpacts of antipoverty programs. For example, administrative records aggregated to the state level show
Chapter 1: Poverty in Uttar Pradesh - The Context 9
that 92 million person-days of employment were generated under the state's employment guaranteeprograms (Swarnjayanti Gram Swarozgar Yojana (SGSY) and Employment Assurance Scheme (EAS),see Chapter 5 for a description of these programs) in 1999-00, for an average of 12 days per eligiblehousehold4 . In contrast, according to early tabulations from the UP 55"h Round Poverty Module (1999-00), only 1.3 percent of the poorest 40 percent of the population (lower two quintiles) reported workingon Jawahar Rozgar Yojana and Jawahar Gram Samridhi Yojana (JRY/SGSY) or other public worksschemes in 1999-00. Clearly there is a very large disparity between the estimated coverage ofemployment programs based on administrative records and coverage based on household survey data.There are large gaps in enrollment statistics as well, based on estimates for districts covered under theDistrict Primary Education Project (Chapter 5). This highlights again the urgent need to improve theaccuracy and consistency of the statistical data base in UP and India more generally.
The Poverty Debate and the NSS 5 5 th Round
1.35 The NSS 55th round, conducted between July, 1999 and June, 2000, has been the subject ofintense debate in India. It is GOI's most recent quinquennial survey of consumer expenditures, designedto draw a sufficiently large sample of households to derive official estimates of poverty at the state as wellas national level. The 55th round was eagerly awaited by policy-makers and researchers throughout India,with the aim of establishing what has been the impact on poverty of recent economic reforms and India'shigh levels of economic growth through the latter part of the 1990s.
1.36 Unfortunately changes in survey methodology have rendered the 55"h Round results incompatible,not only with the earlier "thick" rounds, such as the 50'h and 43rd Rounds, but also with the "thin" roundsfrom the 5 1lt to 54th inclusive (see, for example, Visaria, 2000, Sen, 2001, Tendulkar and Sundaram,2001, Deaton, 2001, Ravallion and Datt, 2002. Also paras. 1.55-1.59 provide an overview). As a result,official estimates of poverty based on the NSS 55"h round are not comparable with those from earlierrounds of the National Sample Survey, based on either the official estimates (for example from the 50'hRound) or unofficial estimates made within the Bank or by other commentators.
1.37 A workshop5, jointly sponsored by the Planning Commission and the World Bank, was held inDelhi in January, 2002, to discuss poverty measurement, monitoring and evaluation, with particular focuson the debate surrounding poverty trends in the 1990s and the controversy surrounding the NSS 55"hRound. Several alternative methods were presented at the workshop to estimate trends in poverty in the1990s. Using a method developed to correct for differences in survey methodology, Deaton (2001)presents new 55"h round state-level estimates of poverty designed to be consistent with estimates fromearlier rounds of the NSS. Poverty estimates based on an alternative approach (Datt, Kozel, Ravallion,2001), linking earlier poverty trends to plausible determining factors and using these factors to predictpoverty levels in 1999-00, were also discussed at the workshop. Both methods suggest that there hasindeed been a fall in national and state poverty rates over recent years though less than would besuggested by comparing the (incomparable) results from the 50'h and 55"h Rounds. In addition to GOI'sofficial poverty estimates, alternative estimates using both of these methods are presented below.
1.38 While India's poverty monitoring system has been seriously compromised by the way in whichthe 55th Round was conducted, this should not detract attention from a number of other long-standingproblems with the Indian poverty statistics. One of the most serious concerns the use of price indexes.Although the price indexes used to update the lines over time appear to be quite accurate, the same cannot
4According to the Ministry of Rural Development, there were approximately 7.5 million Below-the-Poverty-Line(BPL) households in rural UP that were eligible to participate in the SGSY in 1999-00. Eligibility criteria for EAShouseholds is roughly similar.
India: Workshop on Poverty Measurement, Monitoring, and Evaluation, January 11/12h, Imperial Hotel, Delhi.

10 Chapter 1: Poverty in Uttar Pradesh - The Context
be said of the price differentials between states and between the urban and rural sectors that are implicit inthe official poverty lines. The introduction of the new methodology following the recommendations ofthe Expert Group in 1993 resulted in a subsequent serious overestimation of urban relative to ruralpoverty in a number of the large Indian states (see Dubey and Gangopadhyay, 1998; Deaton and Tarozzi,1999, Deaton 2001).
The Poverty Module: UPs State Sample, NSS 5 5 th Round
1.39 Despite the limitations of the NSS 55th Round for measuring poverty trends, the UP state-sample 6
for the 55h Round includes some important innovations designed to provide more information about therelative living conditions of the poor within the state. These innovations are a part of the UP Poverty andSocial Monitoring System (UP PSMS) that the Government of UP began to implement in mid-1999. Inthe context of ongoing institutional reforms, the UP PSMS seeks to monitor the evolution of a range ofpoverty and social outcome indicators. While the system cannot attribute causality between the changesobserved and specific reforms, it nonetheless provides important information on how living standardsrespond to overall economic conditions in the state. It also provides information to assess how well thepublic sector is performing in delivering services to the poor.
1.40 In designing the system, GOUP identified a set of monitoring indicators and baseline informationon these indicators was collected in conjunction with the state sample of the 55t round. The indicatorsinclude measures of (i) private consumption; (ii) poverty statistics (headcount index, poverty gap, severityof poverty), (iii) employment and wage rates, (iv) health outcomes (immunization, infant mortality rates),(v) education outcomes (literacy, enrollments, drop-outs), (vi) housing and infrastructure (access to cleanwater, sanitation, electricity), (vii) use of special antipoverty schemes and welfare programs, (viii)awareness of social rights, and (ix) measures of satisfaction and quality of services.
1.41 Attached to the state sample, a special Poverty Module (Schedule 99) was administered at thesame time and for the same households as the conventional NSS 55th Round schedules (Schedules 1.0 and10.0). The new module includes information on many of the monitoring performance indicators, forexample, access to education and health services, basic infrastructure (water, sanitation), and coverageand use of specific Anti-Poverty Programs (APPs). It also includes questions on awareness andsatisfaction with key government programs. This report uses these new data extensively (World Bank,2002a). In addition, the Government of UP is preparing a comprehensive report based on the 55 h RoundPoverty Module to establish a statistical baseline for its Poverty and Social Monitoring System.
6 NSSO collects information at the all-India level using a sample frame that ensures that survey statistics arerepresentative at the state level. In addition, state-level Directorates of Economnics and Statistics (DES) collect a"matching sample" of households and communities, drawn at random from population. The matching samples arethe same size as the NSS samples (approximately 15,000 households) and were designed to provide a cross-checkon national survey statistics.
Chapter 1: Poverty in Uttar Pradesh - The Context 11
Box 1.1 Poverty and Social Monitoring in Uttar Pradesh
The Govemment of Uttar Pradesh is implementing a 5-year program to monitor overall progress at reducing poverty and improving keygender and social indicators in the state. A key objective of the UP Poverty and Social Monitonng System (UP PSMS) is to aid in monitoringthe impact of key policy and reform measures on the poor, the standard against which the state's development efforts must be judged.The UP PSMS entails efforts along two cntical dimensions - first, defining and measunng key performance indicators, and second, using theinformation to inform policy making and enhance transparency and performance in delivery of core services. But Govemment is not the onlyor even the pnmary stakeholder in the UP PSMS; the system has the longer term objective of keeping the public informed regarding theeffectiveness and impact of public policy and spending decisions.
Work on the UP PSMS has been underway for nearly a year. Although institutional capacity within Govemment is limited, progress hasexceeded expectations in a number of areas. A core set of gender-and caste-disaggregated poverty outcome indicators was identified earlyin the process and a special poverty module, measuring a wide range of key indicators at the household level, added to the state sample ofthe 1999-00 National Sample Survey (NSS). These data are now available and the GOUP is preparng a report documenting baselinepoverty indicators, which will be disseminated widely throughout the state. Once the report is published, UP will have moved from being astate that has never even tabulated its state-sample NSS data to being one of the first states in India to have analyzed and published theresults of the NSS 55th round. The next round of the NSS will be available with an even shoner time lag: under the auspices of the project,GOUP has decentralized data enlry and management to the district level so that future survey results should be available within a fewmonths of the time they are collected. Efforts are also underway to computerze the extensive base of information available at the village,bloclk, and distrct level, e.g., on development indicators, prices, and wages. And a pilot project is being developed to improve theavailability and accuracy of information on the performance of local public service providers, with the objective of improving localaccountability and management of pubic services most needed by the poor.
The UP PSMS also involves building technical and institutional capacity -- in the Directorate of Economics and Statistics (DES) to collectand make information available, as well as capacity in the Department of Planning and line departments to use information more effectively.Many challenges remain: the UP PSMS is itself an important institutional reform and developing greater capacity in Planning and linedepartments to analyze and use this information to assess and ultimately improve performance will require continuing efforts.
Additional Field Studies
1.42 The report also builds on three World Bank sponsored studies of poverty initiated in the late1990s and carried out in close collaboration with local researchers and NGOs in the state. The studieswere launched prior to the NSS 55h Round, with the aim of filling in gaps in the existing survey data insome of the poorest regions, and adding a stronger qualitative dimension, missing from much of theprevious research on poverty in the state. For example, prior to the Poverty Module in the UP 55h Round,there was little up-to-date information available on the impact of GOI's antipoverty programs on the poor,and limited information on access and use of basic services. Nor had much research been done to look atpoverty from the perspective of the poor themselves, using methods developed from Participatory RuralAppraisal (PRA) work. These include qualitative research methods such as focus group discussions,semi-structured interviews, and a series of sorting, ranking and mapping exercises that are aimed ateliciting community-level perceptions and priorities.
1.43 The three studies are described below.
* UP/Bihar Poverty Study. In 1997-98, a study of poverty in eastern and southern UP and centralBihar was carried out in collaboration with Indian academics and NGO and community workers.Fieldwork took place over a period of 9 months, from June, 1997 through February, 1998. The studyused a mix of qualitative research techniques and more conven'tional survey-based methods. It beganwith a qualitative examination of perceptions of poverty in 30 rural villages. This component of thestudy utilized PRA methods. These included social mapping, which provides a visual display ofcommunity members' perceptions of their village and its resou rces in social as well as' economicterms; wealth ranking exercises, which examine local perceptions of the characteristics andconcomitants of wealth and poverty; as well as case history interviews, and assessments of the role ofservices and programs, social capital and gender in determining who is and who remains poor.
12 Chapier 1: Poverty in Uttar Pradesh - The Contexi
In addition to providing important insights in their own right, the PRA findings were used to enrichand sharpen the design of the study's household and community questionnaires, which were designedas integrated living standards surveys. The field survey was carried between November, 1997through February, 1998, in 120 villages (including the 30 covered in the qualitative component) withan overall sample size of 2250 households. Approximately half the households were drawn atrandom from three districts in Southern and Eastern UP - Banda, Allahabad, and Gorakhpur. Inaddition to self-standing analysis, the findings of the qualitative portion of the study are being used toinform, validate, and add explanatory material to the survey-based analyses. Joint use of the twomethods yields a rich picture of the situation of the poor in rural UP and the broad factors thatdetermine their well-being. The qualitative component allowed the researchers to better comprehendthe significance to rural Indians of the economic and social patterns identified and documented by thesurvey results. Since the two methods produce different but complementary types of information, thecombined methodology yielded a more comprehensive view of the multiple dimensions of povertythan could be obtained through either approach alone.
Findings of this initial study led to the implementation of two follow-on studies aimed at elucidatingand clarifying points that had emerged as ambiguous during the data analysis. Since poor health wasfound to be an unexpectedly common cause of impoverishment, a district health assessment wasimplemented in one of the study areas to assess the strengths and weaknesses of the primary healthcare available to the poor. The on-the-ground functioning of the Targeted Public Distribution System(TPDS), a government food subsidization program that was praised by many informants, was thesubject of the second mini-study. Its goal was to examine whether improvements in this much-criticized program were real or illusory, and to document the amount of leakage that occurs.
* Consultations on Poverty Monitoring. Consultations with villagers and other importantstakeholders were held in four districts (one each in the Hill, West, Central and Eastern regions ofUP) during November-December 1999. The goal of the consultations was to guide the Government ofUttar Pradesh in the selection of better and more widely-shared indicators, meaningful for the poorand population at large, for tracking progress at reducing poverty. The Government had developed aset of indicators reflecting their objectives and linked to the state's strategy for poverty reduction -for example, the proportion of people below the poverty line, wage rates for agriculture labor,primary school enrollments for children from poor and socially marginalized families, Furtherconsultations were carried out under this study to determine how the poor themselves measure andjudge progress at reducing poverty and improving living conditions. The field work and reportingwas carried out by a local NGO -- Sahbhagi Shikshan Kendra (SSK). The team discussed key aspectsof poverty with a variety of stakeholders in order to draw community-level viewpoints andunderstandings into the development of a set of indicators to measure changes in the socialcomponents of poverty. Findings were discussed with Government, and will influence future effortsto develop a qualitative component for the UP PSMS.
* Urban Poverty in Uttar Pradesh. During February and March, 2000, a field study examining thecondition of the urban poor was carried out in UP by Vanangana, an NGO located in UP. The studybuilt on the 1997 UP/Bihar Poverty Study and, to facilitate a comparison of rural and urban patternsof response, it employed an adapted version of qualitative research instruments initially developed forthe rural study. Survey teams visited low-income urban communities in two large cities (Lucknowand Kanpur), two medium-sized cities, and five smaller towns. The goal was to explore the forcesand factors supporting the persistence of poverty in the urban setting and to identify the copingstrategies of the urban poor; particularly in terms of the economic and social strategies they pursue,the opportunities they recognize and exploit, and the barriers to success that they encounter.
Chapter 1: Poverty in Uttar Pradesh - The Context 13
1.44 The findings of these studies are used in many parts of the report; they help to enrich the analysisand extend the work to better address social issues and the perspectives of the poor themselves.
D. Defining Poverty: Levels, Trends, Vulnerability, and Voice
1.45 The remainder of the chapter examines poverty - broadly defined as unacceptable deprivation inwell-being - in terms of material deprivation, human deprivation, and a range of other deprivations: lackof voice, vulnerability, violence, destitution, social and political exclusion, and lack of dignity and basicrights. It draws on a range of data sources and methods to define the extent of poverty in the state, as wellas shed light on recent trends in poverty.
Poverty as Material Deprivation.
1.46 Despite the extensive Indian as well as international literature on poverty, poverty lines andpoverty measurement, and years of methodological development, the definition of poverty is still a matterof debate. In India, and indeed throughout the world, the conventional approach equates poverty withmaterial deprivation and defines the poor in terms of incomes or levels of consumption. The PlanningCommission, for example, has for many years defined poverty in terms of the level of per-capitaconsumer expenditure sufficient to provide an average daily intake of 2400 calories per person in ruralareas and 2100 calories per person in urban areas, plus a minimal allocation for basic non-food items.From that benchmark, estimated state-level poverty lines vary according to cost-of-living differentials.
1.47 As noted above, questions have been raised regarding the methods used to estimate India'sofficial poverty lines as well as the reliability and comparability of the data sources on which povertyestimates are based. Researchers have suggested alternative poverty lines to address specificmethodological concems (see Dubey and Gangopadhay, 1998, for an overview of methodological issuesand various derivations of poverty lines and price adjustments; also Deaton, 2000, 2001). India's officialpoverty lines, set by the Planning Commission using the Expert's Group methodology (GOI, 1997), areused throughout this report - they have the advantage of comparability and broad acceptability withinIndia (Annex Table 1.1 presents official poverty lines through 1999-00). Further work remains to be doneto revise and build consensus around an improved set of poverty lines.
1.48 There is no doubt that material deprivation is a key factor that underlies many other dimensionsof poverty. To be materially poor in India is to be poor indeed; India's official poverty lines representliving standards well below the World Bank international comparator line of $1.08 per person per day in1993 PPP-adjusted prices.7 But what does it in fact mean to be poor in India? It is easy to think ofpoverty as a statistical construct. It becomes real when we look at what it means to exist at a subsistencelevel in rural India. Drawing on data from the 1993-94 NSS, a person living at India's official povertyline8 would have spent Rs. 6.8 per day (about 22 cents) and, on a typical day, this amount of morneywould translate into food consumption of:
7The head-count rate in 1997 in India using the intemational $1 per day line is 44 per cent (World DevelopmentReport 2000/01) which is considerably higher than the All-India 1993-94 Planning Comrmission estimate of 37jercent.
Using the all-India average rural food consumption from the NSS 50' Round, 30-40 percent fractile.
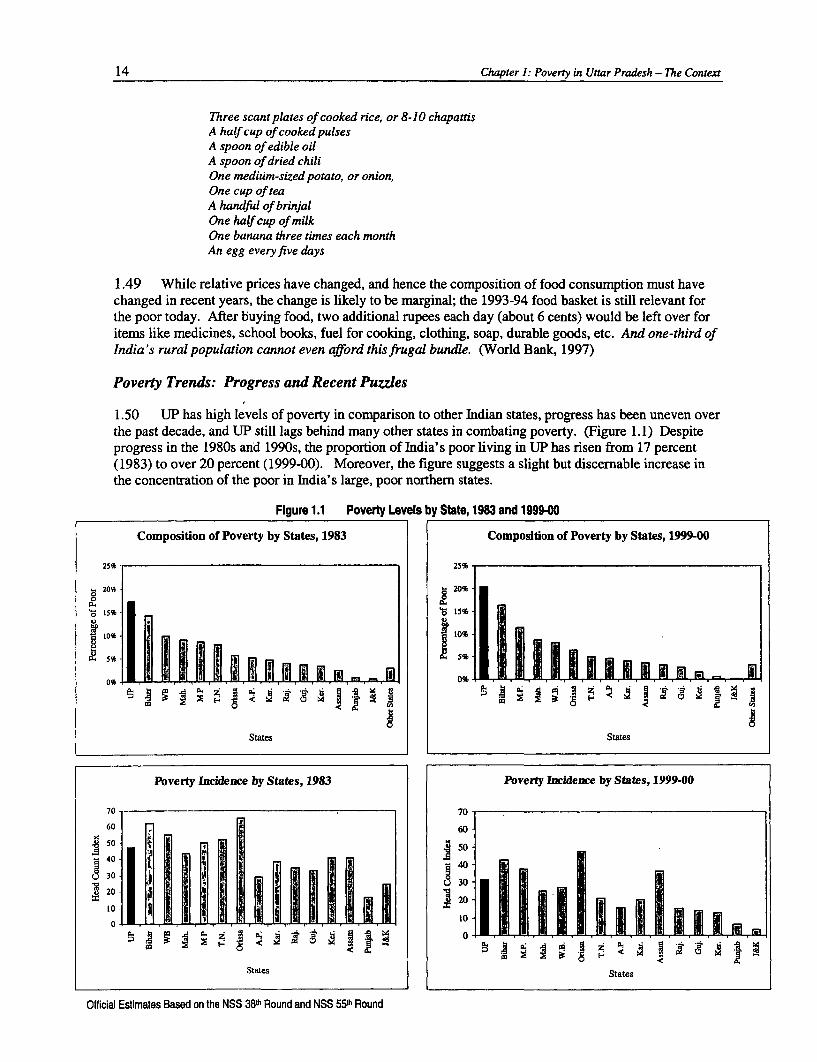
14 Chapter 1: Poverty in Uttar Pradesh - The Context
Three scant plates of cooked rice, or 8-10 chapattisA half cup of cooked pulsesA spoon of edible oilA spoon of dried chiliOne mediium-sized potato, or onion,One cup of teaA handful of brinjalOne half cup of milkOne banana three times each monthAn egg every five days
1.49 While relative prices have changed, and hence the composition of food consumption must havechanged in recent years, the change is likely to be marginal; the 1993-94 food basket is still relevant forthe poor today. After buying food, two additional rupees each day (about 6 cents) would be left over foritems like medicines, school books, fuel for cooking, clothing, soap, durable goods, etc. And one-third ofIndia's rural population cannot even afford this frugal bundle. (World Bank, 1997)
Poverty Trends: Progress and Recent Puzzles
1.50 UP has high levels of poverty in comparison to other Indian states, progress has been uneven overthe past decade, and UP still lags behind many other states in combating poverty. (Figure 1.1) Despiteprogress in the 1980s and 1990s, the proportion of India's poor living in UP has risen from 17 percent(1983) to over 20 percent (1999-00). Moreover, the figure suggests a slight but discernable increase inthe concentration of the poor in India's large, poor northern states.
Flgure 1.1 Poverty Levels by State, 1983 and 1999-00
Composition of Poverty by States, 1983 Composition of Poverty by States, 1999-00
25% 25%-
20% ~~~~~~~~~~~~~~~~~20%
15% X0 15%
1I0% lo:
05 5%M5%
0% ni0%. . . . . .
States States
Poverty Incidence by States, 1983 Poverty ncidence by States, 1999-00
70 70
60 6
.50 50
-40
U~ 30 3
20 j 83I ~~~~~~~~~~~~~20:0 11 WOfficial Estimates Based on the NSS 38 Round and NSS 55 Round
0
States States
Official Estimates Based on the NSS 38th Round and NSS 550h Round
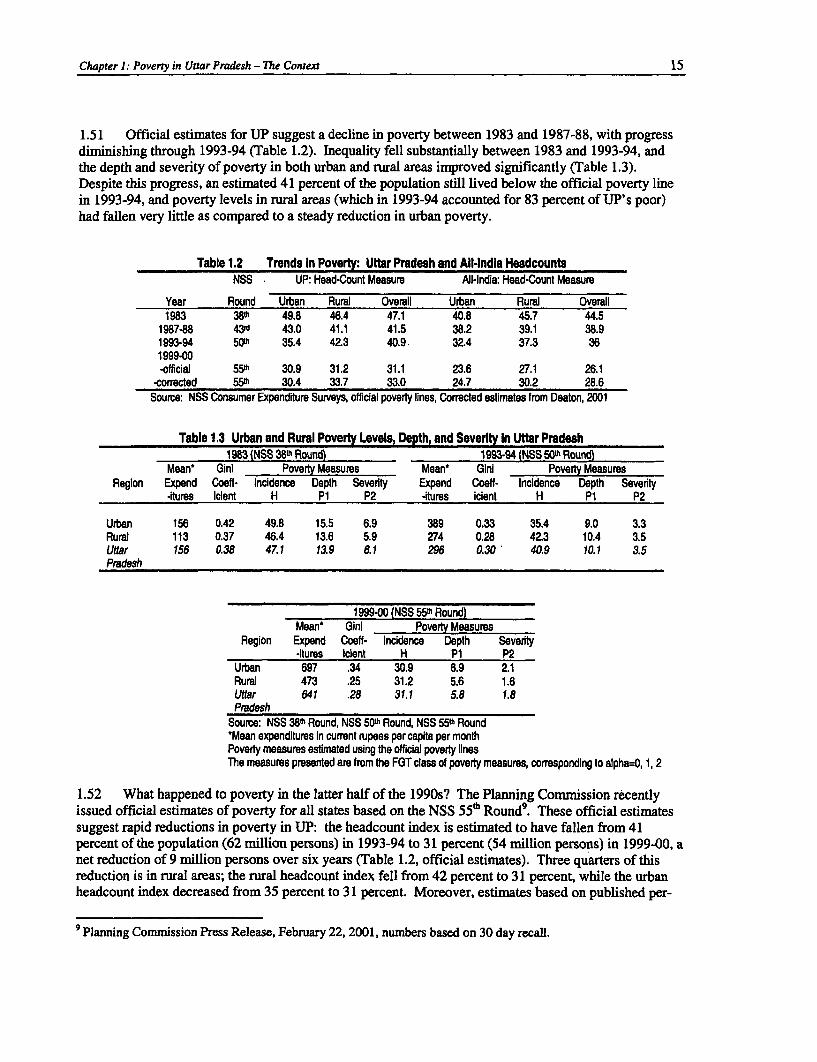
Chapter 1: Poverty in Uttar Pradesh - The Context 15
1.51 Official estimates for UP suggest a decline in poverty between 1983 and 1987-88, with progressdiminishing through 1993-94 (Table 1.2). Inequality fell substantially between 1983 and 1993-94, andthe depth and severity of poverty in both urban and rural areas improved significantly (Table 1.3).Despite this progress, an estimated 41 percent of the population still lived below the official poverty linein 1993-94, and poverty levels in rural areas (which in 1993-94 accounted for 83 percent of UP's poor)had fallen very little as compared to a steady reduction in urban poverty.
Table 1.2 Trends in Poverty: Uttar Pradesh and Alt-Indla HeadcountsNSS UP: Head-Count Measure All-India: Head-Count Measure
Year Round Urban Rural Overall Urban Rural Overall1983 38"' 49.8 46.4 47.1 40.8 45.7 44.5
1987-88 43fd 43.0 41.1 41.5 38.2 39.1 38.91993-94 50th 35.4 42.3 40.9. 32.4 37.3 361999-00-official 55"' 30.9 31.2 31.1 23.6 27.1 26.1
-corrected 55" 30.4 33.7 33.0 24.7 30.2 28.6Source: NSS Consumer Expenditure Surveys, official poverty lines, Corrected estimates from Deaton, 2001
Table 1.3 Urban and Rural Poverty Levels, Depth, and Severity In Uttar Pradesh1983 (NSS 38"' Round) 1993-94 (NSS 50 Round)
Mean* Gini Poverty Measures Mean* Gini Poverty MeasuresRegion Expend Coeff- Incidence Depth Seventy Expend Coeff- Incidence Depth Seventy
-itures Icient H P1 P2 itures icient H P1 P2
Urban 156 0.42 49.8 15.5 6.9 389 0.33 35.4 9.0 3.3Rural 113 0.37 46.4 13.6 5.9 274 0.28 42.3 10.4 3.5Uttar 156 0.38 47.1 13.9 6.1 296 0.30 40.9 10.1 3.5Pradesh
1999-00 (NSS 55' Round)Mean' Gini Poverty Measures
Region Expend Coeff- Incidence Depth Seventy-itures Icient H P1 P2
Urban 697 .34 30.9 6.9 2.1Rural 473 .25 31.2 5.6 1.6Uttar 641 .28 31.1 5.8 1.8Pradesh
Source: NSS 38t" Round, NSS 50"' Round, NSS 55"' Round*Mean expenditures in current rupees per capita per monthPoverty measures estimated using the official poverty linesThe measures presented are from the FGT class of poverty measures, corresponding to alpha=0, 1, 2
1.52 What happened to poverty in the latter half of the 1990s? The Planning Commission recentlyissued official estimates of poverty for all states based on the NSS 55h Round9. These official estimatessuggest rapid reductions in poverty in UP: the headcount index is estimated to have fallen from 41percent of the population (62 million persons) in 1993-94 to 31 percent (54 million persons) in 1999-00, anet reduction of 9 million persons over six years (Table 1.2, official estimates). Three quarters of thisreduction is in rural areas; the rural headcount index fell from 42 percent to 31 percent, while the urbanheadcount index decreased from 35 percent to 31 percent. Moreover, estimates based on published per-
9 Planning Commission Press Release, February 22, 2001, numbers based on 30 day recall.
16 Chapter 1: Poverty in Uttar Pradesh - The Context
capita expenditure distributions from the 55lh Round suggest significant improvements in both urban andrural areas in the depth and severity, of poverty in the latter half of the 1990s. (Table 1.3) Inequalitycontinued to fall in rural areas which contributed to the measured fall in rural poverty.
1.53 In comparison, at the all-India level, official estimates from the 55th Round imply a net reductionin rural poverty of 60 million persons between 1993-94 and 1999-00 - urban poverty fell by around 8percentage points (from 32 percent to only 24 percent); rural poverty is estimated to have fallen by 10percentage points (from 37 percent to 27 percent). UP, as one of the strongest performing states accordingto 55h Round estimates, accounts for 15 percent of the total drop in poverty in India in the latter half ofthe 1990s. Parenthetically, official estimates put Bihar in second place to UP, having lifted some 10million of its rural inhabitants out of poverty between 1993-94 and 1999-00.
1.54 Is the dramatic progress suggested by 55th Round estimates credible? The interpretation of themost recent official data on welfare and poverty has been intensely debated. Changes in survey design forthe 55th Round cast doubt on the resulting poverty estimates with those from earlier rounds of the NSS.
India's Poverty Debate: Corrected Poverty Estimates
1.55 The debate hinges on the impact of changes in reference periods used for measuring consumptionin the 55th Round. Since India's NSS began in the 1950s, it has used a 30-day recall for consumption. Inthe thin samples of the 51s', 52nd, 53rd, and 54th Rounds, households were randomly divided and somegiven an experimental questionnaire with a 7 day recall period for some items (including foods) and either30-day or 365-day recall for others, while others were given the traditional 30-day questionnaire for allitems. The results from those rounds showed that the experimental questionnaire, and particularly the 7-day recall period for food, yielded higher reported rates of monthly purchases and, in consequence, muchlower rates of poverty than the traditional questionnaires. This effect was large enough to effectively cutpoverty rates in half when the experimental questionnaire was used in place of the traditional 30-dayquestionnaire. (Visaria, 2000) Although further work remains to fully understand why the different recallperiods produce such different results, the ratios of average reported expenditures from one questionnaireto another (7-day as compared to 30-day recall) are remarkably constant across these experimental thinrounds.
1.56 In the 55th round, all households were given both questionnaires, a procedure which invited them(or possibly the enumerators) to reconcile the rates of consumption over the two reporting periods. As aresult, although expenditures reported from the experimental questionnaire are still higher than those fromthe traditional questionnaire, the ratio of one to the other is much closer to one than was the case in theexperimental rounds. Hence, although the procedure in the 55th Round may have yielded goodconsumption estimates in itself, they are not comparable with earlier results. More particularly,consumption estimates from the traditional 30-day questionnaire are higher than would have been the casehad households been given only the traditional questionnaire, while consumption estimates from theexperimental questionnaire are lower than would have been the case had households only been given theexperimental questionnaires. The official poverty counts from the 55th Round 30-day questionnaire maytherefore be good poverty counts on their own terms, but they are artificially low compared with thecounts in the 43rd and 50'h Rounds. The 10 percentage point fall in the national poverty rate between1993-94 and 1999-00 (using 30-day recall) is therefore certainly too high, though we have no way ofknowing by how much.
1.57 Deaton (2001, see also Annex 1) has developed a procedure for adjusting poverty estimates fromthe 55"' Round to make them comparable with estimates from earlier large-sample rounds of the NSS (fora similar method also see Lanjouw and Lanjouw, 2001, also Tarozzi, 2001). The method exploits the fact
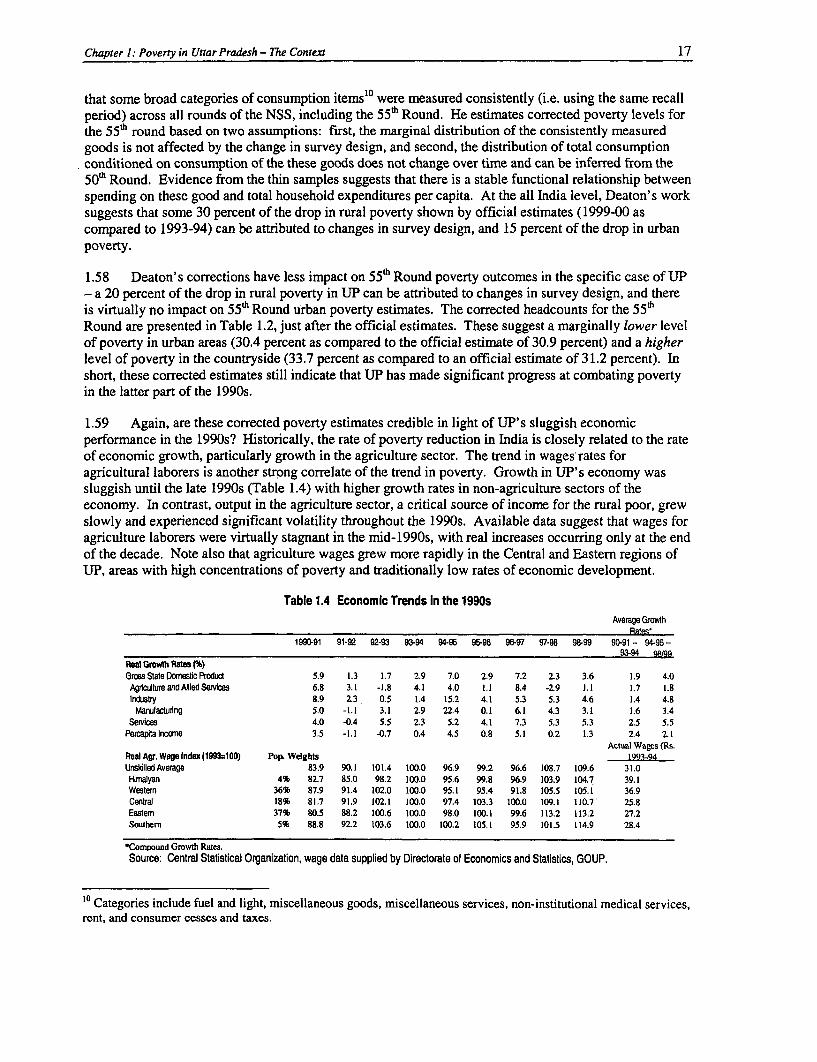
Chapter 1: Poverty in Uttar Pradesh - The Context 17
that some broad categories of consumption items'° were measured consistently (i.e. using the same recallperiod) across all rounds of the NSS, including the 55th Round. He estimates corrected poverty levels forthe 55th round based on two assumptions: first, the marginal distribution of the consistently measuredgoods is not affected by the change in survey design, and second, the distribution of total consumptionconditioned on consumption of the these goods does not change over time and can be inferred from the50th Round. Evidence from the thin samples suggests that there is a stable functional relationship betweenspending on these good and total household expenditures per capita. At the all India level, Deaton's worksuggests that some 30 percent of the drop in rural poverty shown by official estimates (1999-00 ascompared to 1993-94) can be attributed to changes in survey design, and 15 percent of the drop in urbanpoverty.
1.58 Deaton's corrections have less impact on 55" Round poverty outcomes in the specific case of UP- a 20 percent of the drop in rural poverty in UP can be attributed to changes in survey design, and thereis virtually no impact on 55th Round urban poverty estimates. The corrected headcounts for the 5 5th
Round are presented in Table 1.2, just after the official estimates. These suggest a marginally lower levelof poverty in urban areas (30.4 percent as compared to the official estimate of 30.9 percent) and a higherlevel of poverty in the countryside (33.7 percent as compared to an official estimate of 31.2 percent). Inshort, these corrected estimates still indicate that UP has made significant progress at combating povertyin the latter part of the 1990s.
1.59 Again, are these corrected poverty estimates credible in light of UP's sluggish economicperformance in the 1990s? Historically, the rate of poverty reduction in India is closely related to the rateof economic growth, particularly growth in the agriculture sector. The trend in wages rates foragricultural laborers is another strong correlate of the trend in poverty. Growth in UP's economy wassluggish until the late 1990s (Table 1.4) with higher growth rates in non-agriculture sectors of theeconomy. In contrast, output in the agriculture sector, a critical source of income for the rural poor, grewslowly and experienced significant volatility throughout the 1990s. Available data suggest that wages foragriculture laborers were virtually stagnant in the mnid-1990s, with real increases occurring only at the endof the decade. Note also that agriculture wages grew more rapidly in the Central and Eastern regions ofUP, areas with high concentrations of poverty and traditionally low rates of economic development.
Table 1.4 Economic Trends In the 1990sAverage Growth
RatpS-1990-91 91-92 92-93 93-94 94-95 95-9 96-97 97-98 9-99 90-91 -- 94-95 --
93-94 9RQReal Growth Rates I%)Gross State Domestic Product 5.9 1.3 1.7 2.9 7.0 2.9 7.2 2.3 3.6 1.9 4.0AgricutureandAlliedServices 6.8 3.1 -1.8 4.1 4.0 1.1 8.4 -2.9 1.1 1.7 1.8Industry 8.9 2.3 0.5 1.4 15.2 4.1 5.3 5.3 4.6 1.4 4.8
Marifacturng 5.0 -1.1 3.1 2.9 22.4 0.1 6.1 4.3 3.1 1.6 3.4Services 4.0 -0.4 5.5 2.3 5.2 4.1 7.3 5.3 5.3 2.5 5.5
Percapitalncomre 3.5 -1.1 -0.7 0.4 4.5 0.8 5.1 0.2 1.3 2.4 2.1Actual Wages (Rs.
Real Agr. Wage Index (1 993=1 00) Pop, Weights 1991-94UnsilledAverage 83.9 90.1 101.4 100.0 96.9 99.2 96.6 108.7 109.6 31.0
Hlmalyan 4% 82.7 85.0 98.2 100.0 95.6 99.8 96.9 103.9 104.7 39.1Western 36% 87.9 91.4 102.0 100.0 95.1 95.4 91.8 105.5 105.1 36.9Centrai 18% 81.7 91.9 102.1 100.0 97.4 103.3 100.0 109.1 110.7 25.8Eastern 37% 80.5 88.2 100.6 100.0 98.0 100.1 99.6 113.2 113.2 27.2Southern 5% 88.8 92.2 103.6 100.0 100.2 105.1 95.9 101.5 114.9 28.4
*Compound Gowth Rates.Source: Central Statistical Organization, wage data supplied by Directorate of Economics and Statistics, GOUP.
10 Categories include fuel and light, miscellaneous goods, miscellaneous services, non-institutional medical services,rent, and consumer cesses and taxes.
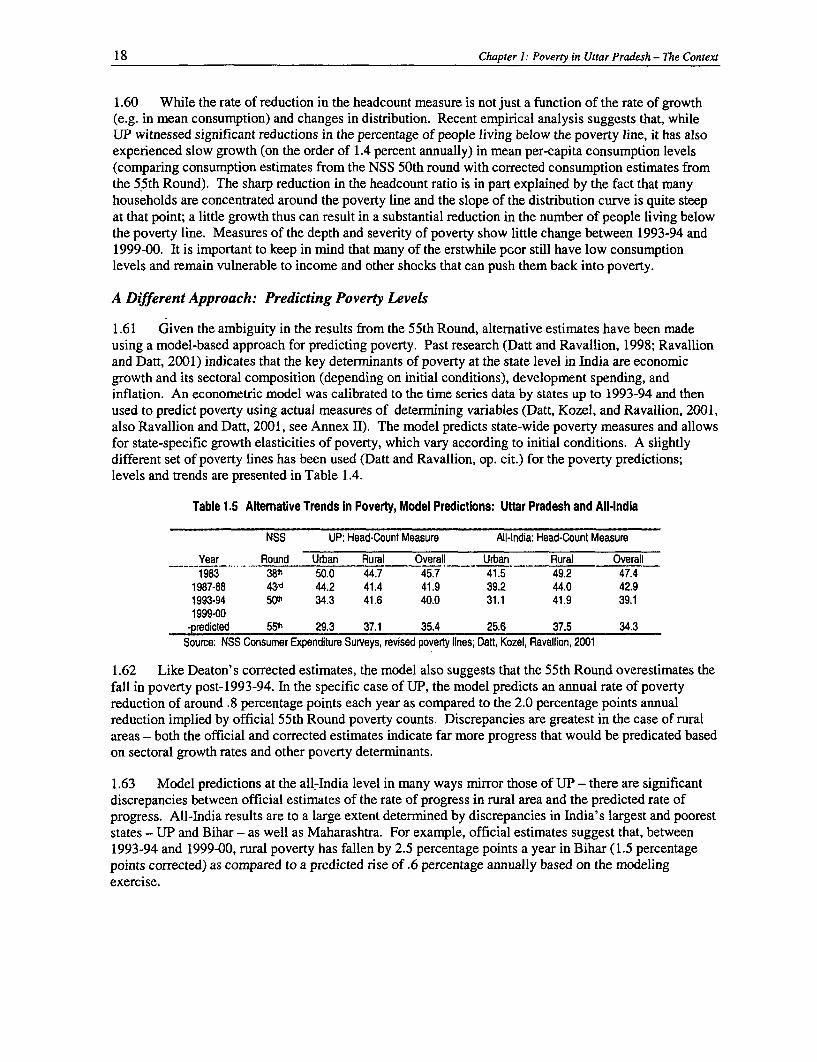
18 Chapter 1: Poverty in Uttar Pradesh - The Context
1.60 While the rate of reduction in the headcount measure is not just a function of the rate of growth(e.g. in mean consumption) and changes in distribution. Recent empirical analysis suggests that, whileUP witnessed significant reductions in the percentage of people living below the poverty line, it has alsoexperienced slow growth (on the order of 1.4 percent annually) in mean per-capita consumption levels(comparing consumption estimates from the NSS 50th round with corrected consumption estimates fromthe 55th Round). The sharp reduction in the headcount ratio is in part explained by the fact that manyhouseholds are concentrated around the poverty line and the slope of the distribution curve is quite steepat that point; a little growth thus can result in a substantial reduction in the number of people living belowthe poverty line. Measures of the depth and severity of poverty show little change between 1993-94 and1999-00. It is important to keep in mind that many of the erstwhile pcor still have low consumptionlevels and remain vulnerable to income and other shocks that can push them back into poverty.
A Different Approach: Predicting Poverty Levels
1.61 Given the ambiguity in the results from the 55th Round, alternative estimates have been madeusing a model-based approach for predicting poverty. Past research (Datt and Ravallion, 1998; Ravallionand Datt, 2001) indicates that the key determinants of poverty at the state level in India are economicgrowth and its sectoral composition (depending on initial conditions), development spending, andinflation. An econometric model was calibrated to the time series data by states up to 1993-94 and thenused to predict poverty using actual measures of determining variables (Datt, Kozel, and Ravallion, 2001,also Ravallion and Datt, 2001, see Annex II). The model predicts state-wide poverty measures and allowsfor state-specific growth elasticities of poverty, which vary according to initial conditions. A slightlydifferent set of poverty lines has been used (Datt and Ravallion, op. cit.) for the poverty predictions;levels and trends are presented in Table 1.4.
Table 1.5 Alternative Trends in Poverty, Model Predictions: Uttar Pradesh and All-India
NSS UP: Head-Count Measure All-India: Head-Count Measure
Year Round Urban Rural Overall Urban Rural Overall1983 38th 50.0 44.7 45.7 41.5 49.2 47.4
1987-88 43d 44.2 41.4 41.9 39.2 44.0 42.91993-94 50th 34.3 41.6 40.0 31.1 41.9 39.11999.00
-predicted 55th 29.3 37.1 35.4 25.6 37.5 34.3Source: NSS Consumer Expenditure Surveys, revised poverty lines; Datt, Kozel, Ravallion, 2001
1.62 Like Deaton's corrected estimnates, the model also suggests that the 55th Round overestimates thefall in poverty post-1993-94. In the specific case of UP, the model predicts an annual rate of povertyreduction of around .8 percentage points each year as compared to the 2.0 percentage points annualreduction implied by official 55th Round poverty counts. Discrepancies are greatest in the case of ruralareas - both the official and corrected estimates indicate far more progress that would be predicated basedon sectoral growth rates and other poverty determinants.
1.63 Model predictions at the all-India level in many ways mirror those of UP - there are significantdiscrepancies between official estimates of the rate of progress in rural area and the predicted rate ofprogress. All-India results are to a large extent determined by discrepancies in India's largest and pooreststates - UP and Bihar - as well as Maharashtra. For example, official estimates suggest that, between1993-94 and 1999-00, rural poverty has fallen by 2.5 percentage points a year in Bihar (1.5 percentagepoints corrected) as compared to a predicted rise of .6 percentage annually based on the modelingexercise.
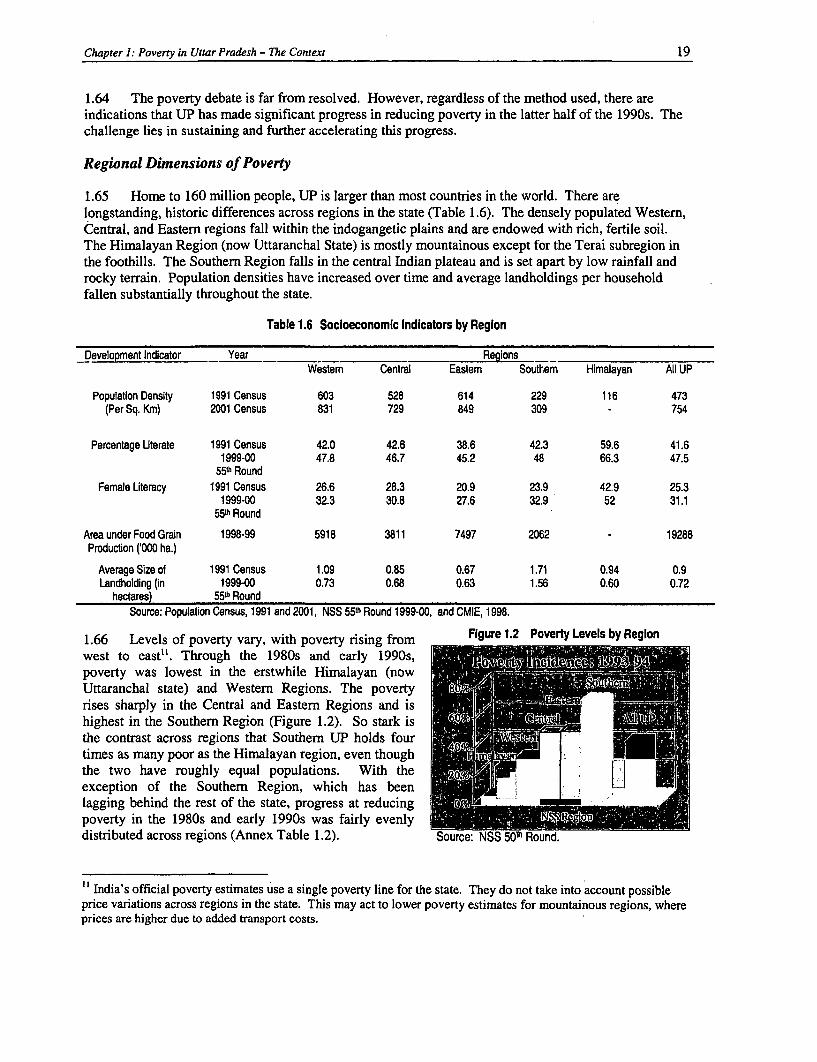
Chapter 1: Poverty in Uttar Pradesh - The Context 19
1.64 The poverty debate is far from resolved. However, regardless of the method used, there areindications that UP has made significant progress in reducing poverty in the latter half of the 1990s. Thechallenge lies in sustaining and further accelerating this progress.
Regional Dimensions of Poverty
1.65 Home to 160 million people, UP is larger than most countries in the world. There arelongstanding, historic differences across regions in the state (Table 1.6). The densely populated Western,Central, and Eastern regions fall within the indogangetic plains and are endowed with rich, fertile soil.The Himalayan Region (now Uttaranchal State) is mostly mountainous except for the Terai subregion inthe foothills. The Southern Region falls in the central Indian plateau and is set apart by low rainfall androcky terrain. Population densities have increased over time and average landholdings per householdfallen substantially throughout the state.
Table 1.6 Socioeconomic Indicators by Reglon
Development Indicator Year ___ RegionsWestem Central Eastem Southem Himalayan All UP
Population Density 1991 Census 603 528 614 229 116 473(Per Sq. Kin) 2001 Census 831 729 849 309 - 754
Percentage Uterate 1991 Census 42.0 42.6 38.6 42.3 59.6 41.61999-00 47.8 46.7 45.2 48 66.3 47.5
55'h RoundFemale Literacy 1991 Census 26.6 28.3 20.9 23.9 42.9 25.3
1999-00 32.3 30.8 27.6 32.9 52 31.155'h Round
Area under Food Grain 1998-99 5918 3811 7497 2062 - 19288Production ('000 ha.)
Average Size of 1991 Census 1.09 0.85 0.67 1.71 0.94 0.9Landholding (in 1999-00 0.73 0.68 0.63 1.56 0.60 0.72
hectares) 55"' RoundSource: Population Census, 1991 and 2001, NSS 55'h Round 1999-00, and CMIE, 1998.
1.66 Levels of poverty vary, with poverty rising from Flgure 1.2 Poverty Levels by Regionwest to east". Through the 1980s and early 1990s,poverty was lowest in the erstwhile Himalayan (nowUttaranchal state) and Western Regions. The poverty 8rises sharply in the Central and Eastern Regions and ishighest in the Southern Region (Figure 1.2). So stark is 0 e t
the contrast across regions that Southern UP holds fourtimes as many poor as the Himalayan region, even thoughthe two have roughly equal populations. With theexception of the Southern Region, which has beenlagging behind the rest of the state, progress at reducing 7poverty in the 1980s and early 1990s was fairly evenlydistributed across regions (Annex Table 1.2). Source: NSS 50 Round.
" India's official poverty estimates use a single poverty line for the state. They do not take into account possibleprice variations across regions in the state. This may act to lower poverty estimates for mountainous regions, whereprices are higher due to added transport costs.
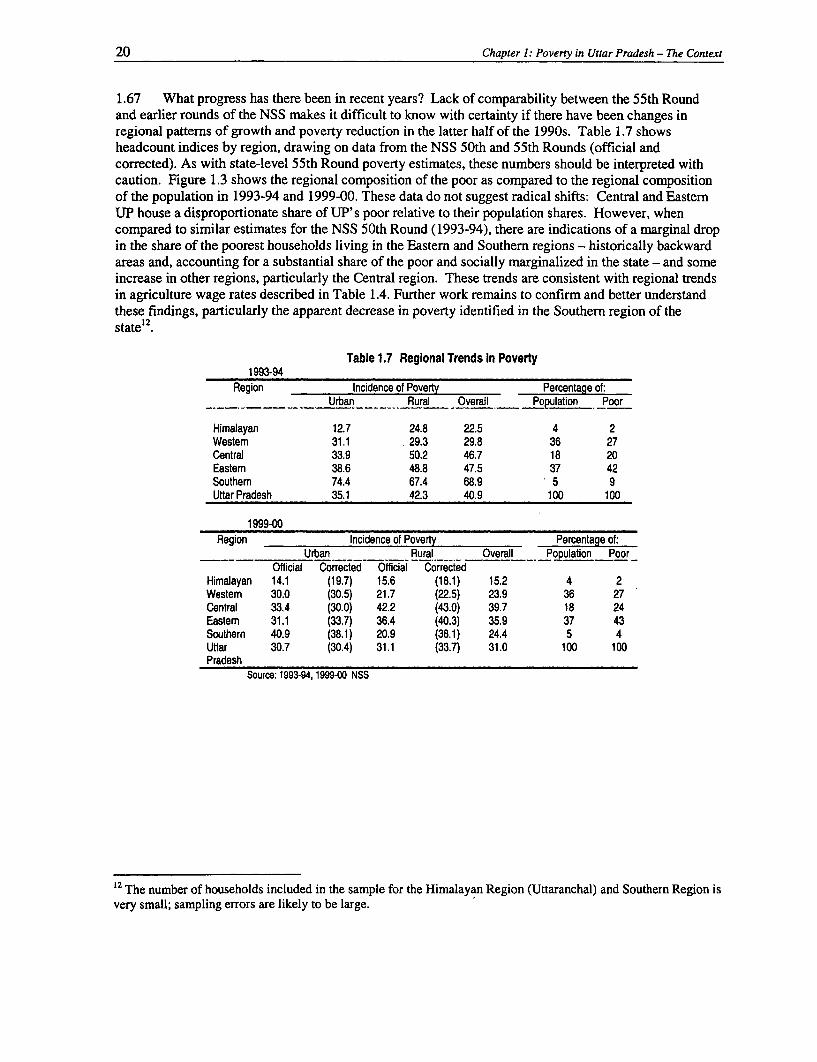
20 Chapter 1: Poverty in Uttar Pradesh - The Context
1.67 What progress has there been in recent years? Lack of comparability between the 55th Roundand earlier rounds of the NSS makes it difficult to know with certainty if there have been changes inregional pattems of growth and poverty reduction in the latter half of the 1990s. Table 1.7 showsheadcount indices by region, drawing on data from the NSS 50th and 55th Rounds (official andcorrected). As with state-level 55th Round poverty estimates, these numbers should be interpreted withcaution. Figure 1.3 shows the regional composition of the poor as compared to the regional compositionof the population in 1993-94 and 1999-00. These data do not suggest radical shifts: Central and EasternUP house a disproportionate share of UP' s poor relative to their population shares. However, whencompared to similar estimates for the NSS 50th Round (1993-94), there are indications of a marginal dropin the share of the poorest households living in the Eastern and Southern regions - historically backwardareas and, accounting for a substantial share of the poor and socially marginalized in the state - and someincrease in other regions, particularly the Central region. These trends are consistent with regional trendsin agriculture wage rates described in Table 1.4. Further work remains to confirm and better understandthese findings, particularly the apparent decrease in poverty identified in the Southern region of the
12state
Table 1.7 Regional Trends In Poverty1993-94
Region Incidence of Poverty Percentage of:Urban Rural Overall Population Poor
Himalayan 12.7 24.8 22.5 4 2Westem 31.1 .29.3 29.8 36 27Central 33.9 50.2 46.7 18 20Eastem 38.6 48.8 47.5 37 42Southem 74.4 67.4 68.9 5 9Uttar Pradesh 35.1 42.3 40.9 100 100
1999-00Region Incidence of Poverty Percentage of:
Urban _ Rural _ Overall Population PoorOfficial Corrected Official Corrected
Himalayan 14.1 (19.7) 15.6 (18.1) 15.2 4 2Westem 30.0 (30.5) 21.7 (22.5) 23.9 36 27Central 33.4 (30.0) 42.2 (43.0) 39.7 18 24Eastem 31.1 (33.7) 36.4 (40.3) 35.9 37 43Southem 40.9 (38.1) 20.9 (38.1) 24.4 5 4Utlar 30.7 (30.4) 31.1 (33.7) 31.0 100 100Pradesh
Source: 1993-94,1999-00 NSS
12 The number of households included in the sample for the Himalayan Region (Uttaranchal) and Southern Region isvery small; sampling errors are likely to be large.
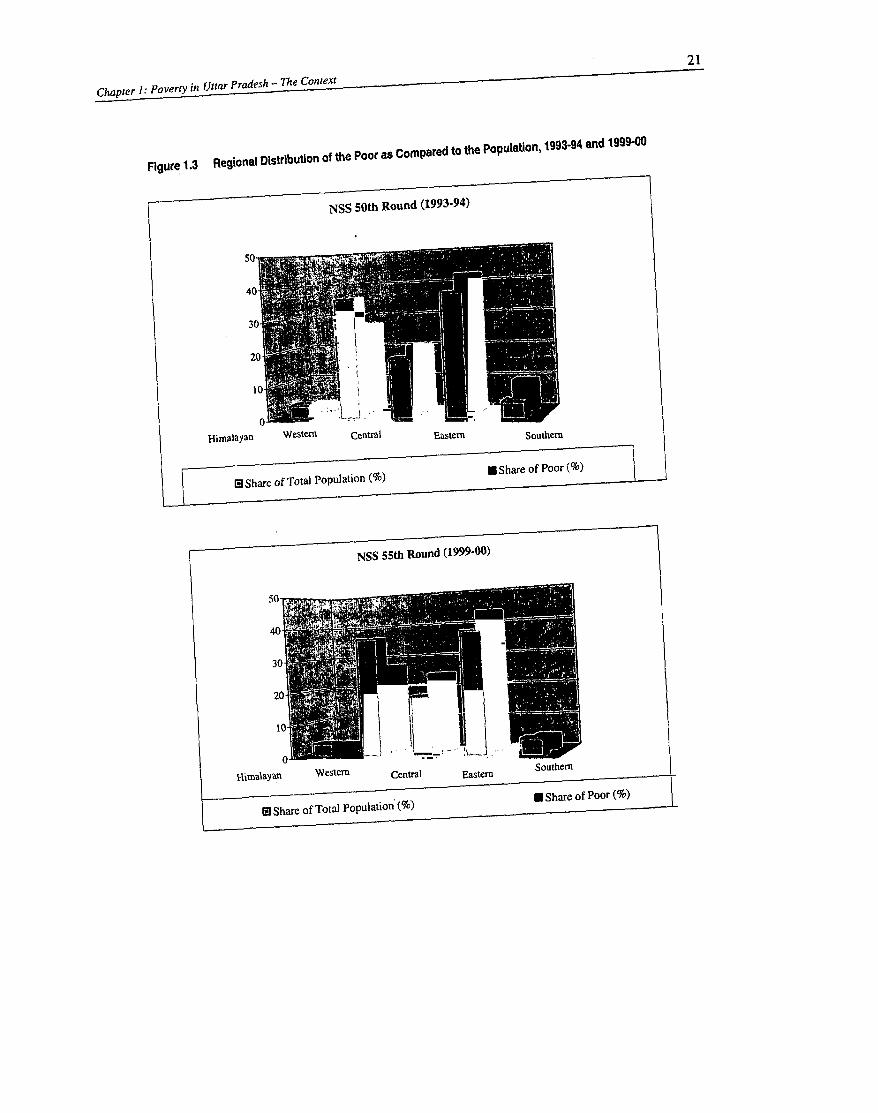
21
pter ! Poverty in Uttar Pradesh - The Context
Figure 1.3 Regional Distribution of the Poor as Compared to the Populatlon, 1993-94 and 1999-00
NSS 50th Round (1993-94)
;jaaa W54m eftTl astr Soulher
30 l l
Himnalayan Western Central eastern SouthemnI
E Share of Total Population (%) * Share of Poor (%)
NSS 55th Round (1999-00)
30
20 l 1..,.i
5{imalayan Westem Central Eastem Southern
l Share of Total Population (%) U Share of Poor (S%0)
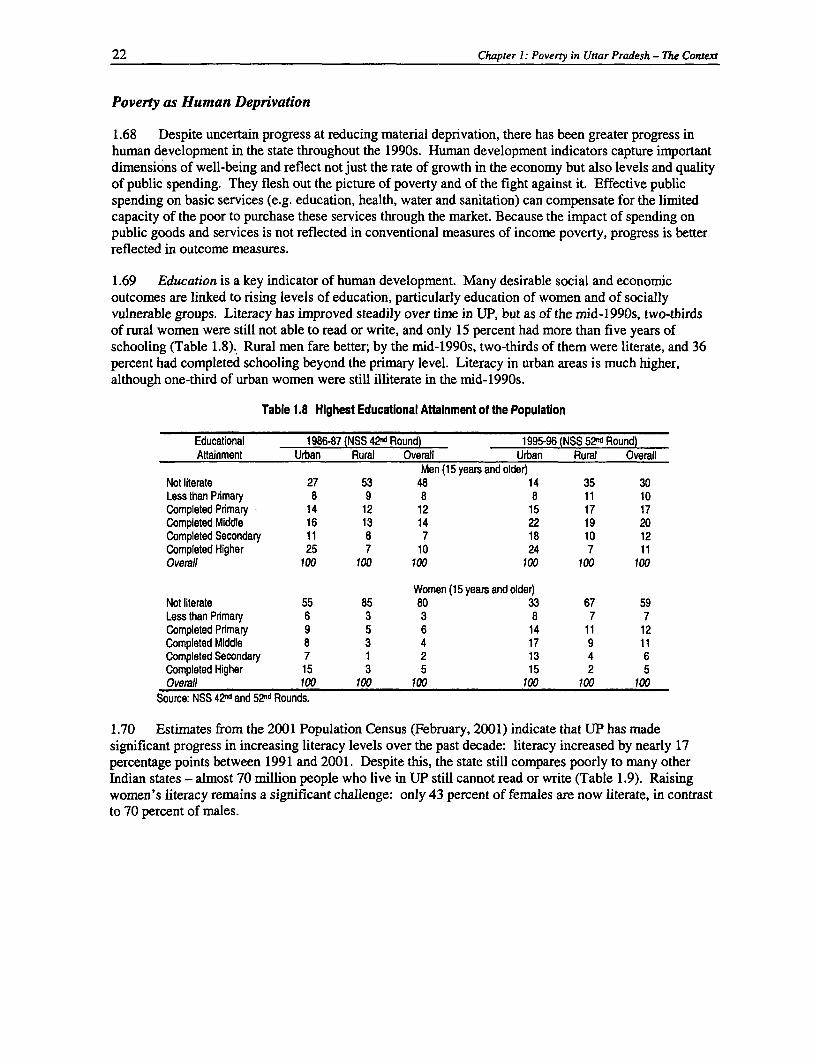
22 Chapter 1: Poverty in Uttar Pradesh - The Context
Poverty as Human Deprivation
1.68 Despite uncertain progress at reducing material deprivation, there has been greater progress inhuman development in the state throughout the 1990s. Human development indicators capture importantdimensions of well-being and reflect not just the rate of growth in the economy but also levels and qualityof public spending. They flesh out the picture of poverty and of the fight against it. Effective publicspending on basic services (e.g. education, health, water and sanitation) can compensate for the limitedcapacity of the poor to purchase these services through the market. Because the impact of spending onpublic goods and services is not reflected in conventional measures of income poverty, progress is betterreflected in outcome measures.
1.69 Education is a key indicator of human development. Many desirable social and economicoutcomes are linked to rising levels of education, particularly education of women and of sociallyvulnerable groups. Literacy has improved steadily over time in UP, but as of the rnid-1990s, two-thirdsof rural women were still not able to read or write, and only 15 percent had more than five years ofschooling (Table 1.8). Rural men fare better; by the mid-1990s, two-thirds of them were literate, and 36percent had completed schooling beyond the primary level. Literacy in urban areas is much higher,although one-third of urban women were still illiterate in the mid-1990s.
Table 1.8 Highest Educational Attainment of the Population
Educational 1986-87 (NSS 42nd Round) 1995-96 (NSS 52nd Round)Attainment Urban Rural Overall Urban Rural Overall
Men (15 years and older)Not literate 27 53 48 14 35 30LessthanPrmary 8 9 8 8 11 10Completed Prmary 14 12 12 15 17 17Completed Middle 16 13 14 22 19 20Completed Secondary 11 6 7 18 10 12Completed Higher 25 7 10 24 7 11Overall 100 100 100 100 100 100
Women (15 years and older)Not literate 55 85 80 33 67 59Less than Pnmary 6 3 3 8 7 7Completed Prmary 9 5 6 14 11 12Completed Middle 8 3 4 17 9 11Completed Secondary 7 1 2 13 4 6Completed Higher 15 3 5 15 2 5Overall 100 100 100 100 100 100
Source: NSS 42nd and 52nd Rounds.
1.70 Estimates from the 2001 Population Census (February, 2001) indicate that UP has madesignificant progress in increasing literacy levels over the past decade: literacy increased by nearly 17percentage points between 1991 and 2001. Despite this, the state still compares poorly to many otherIndian states - almost 70 million people who live in UP still cannot read or write (Table 1.9). Raisingwomen's literacy remains a significant challenge: only 43 percent of females are now literate, in contrastto 70 percent of males.
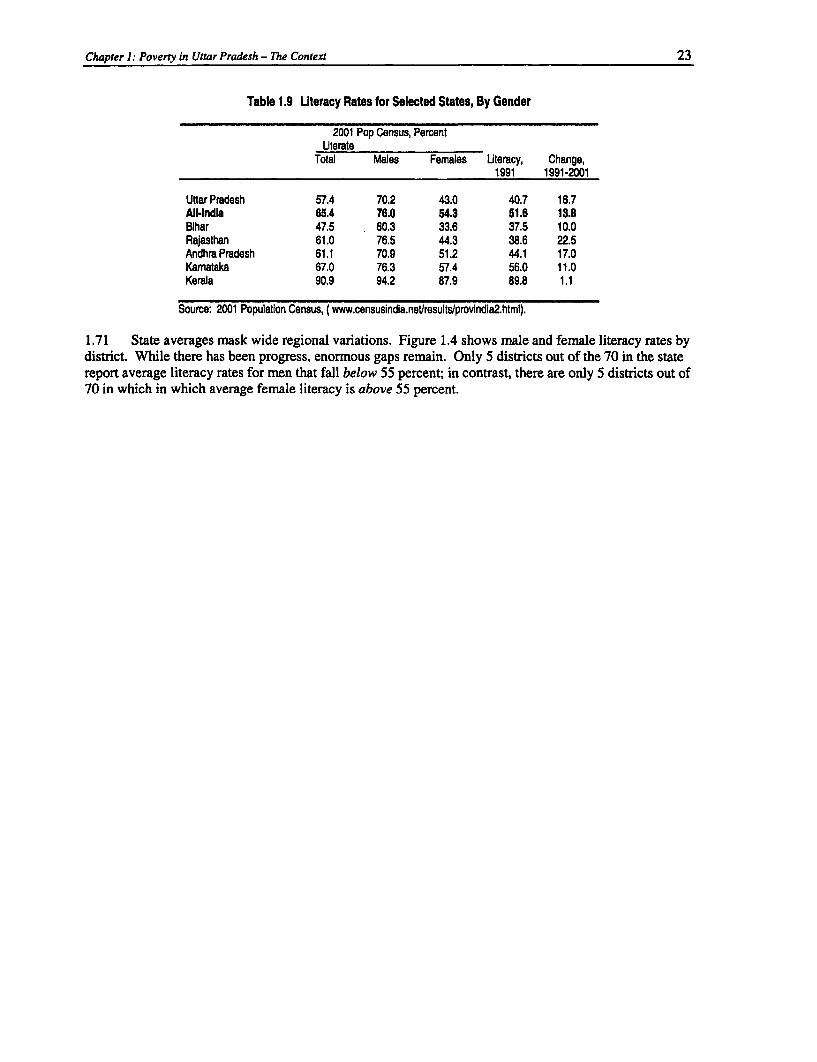
Chapter 1: Poverty in Uttar Pradesh - The Context 23
Table 1.9 Literacy Rates for Selected States, By Gender
2001 Pop Census, PercentUterate
Total Males Females Uteracy, Change,1991 1991-2001
Uttar Pradesh 57.4 70.2 43.0 40.7 16.7AlWndla 65.4 76.0 54.3 51.6 13.8Bihar 47.5 60.3 33.6 37.5 10.0Rajasthan 61.0 76.5 44.3 38.6 22.5Andhra Pradesh 61.1 70.9 51.2 44.1 17.0Kamataka 67.0 76.3 57.4 56.0 11.0Kerala 90.9 94.2 87.9 89.8 1.1
Source: 2001 Population Census, (www.censusindia.netlresults/provindia2.html).
1.71 State averages mask wide regional variations. Figure 1.4 shows male and female literacy rates bydistrict. While there has been progress, enormous gaps remain. Only 5 districts out of the 70 in the statereport average literacy rates for men that fall below 55 percent; in contrast, there are only 5 districts out of70 in which in which average female literacy is above 55 percent.
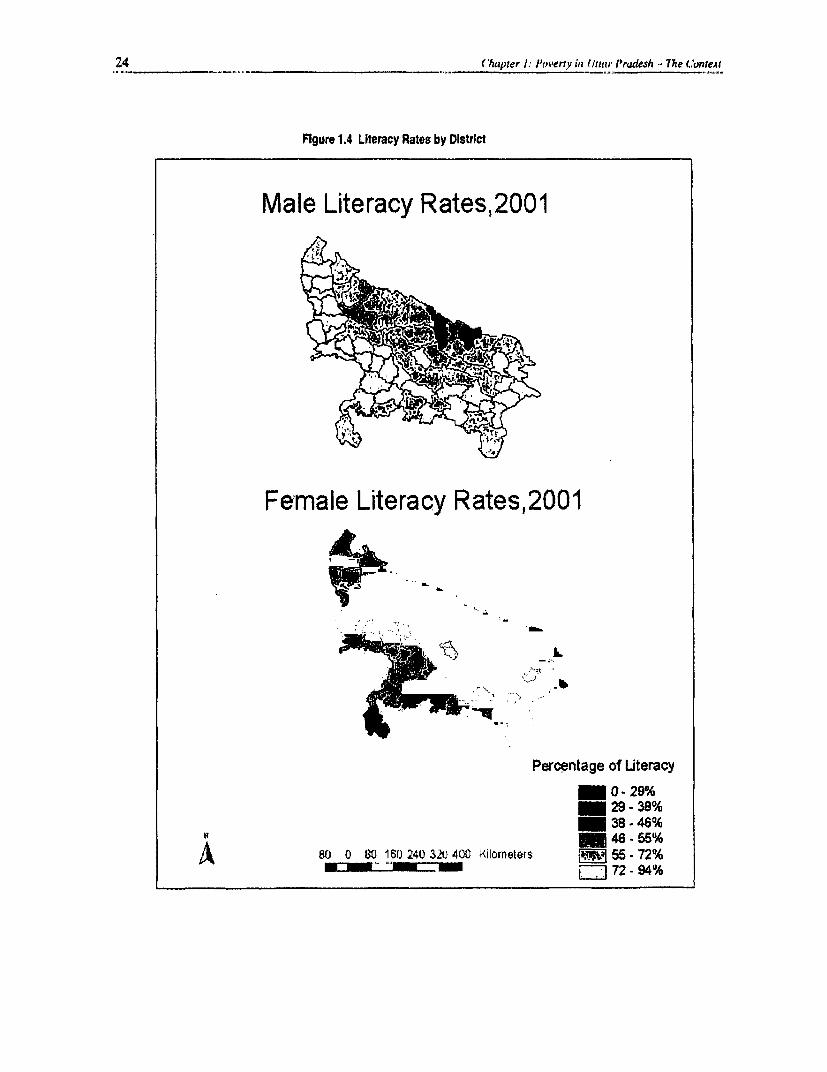
24 C_ (hapter I. P'ov'eny in tirtll ilradesh 7he (c,onleAt
Figure 1.4 Literacy Rates by District
Male Literacy Rates,2001
Female Literacy Rates,2001
..~~~~~~~~~~~A
Peroentage of Literacy
0- 29%29 -38%
- 38-46%46- 65%
80 0 80 160 240 320 400 Kilorneters w 55. 72%
~~ -= ~ ~~~~ 0 ~~ 72 - 94%
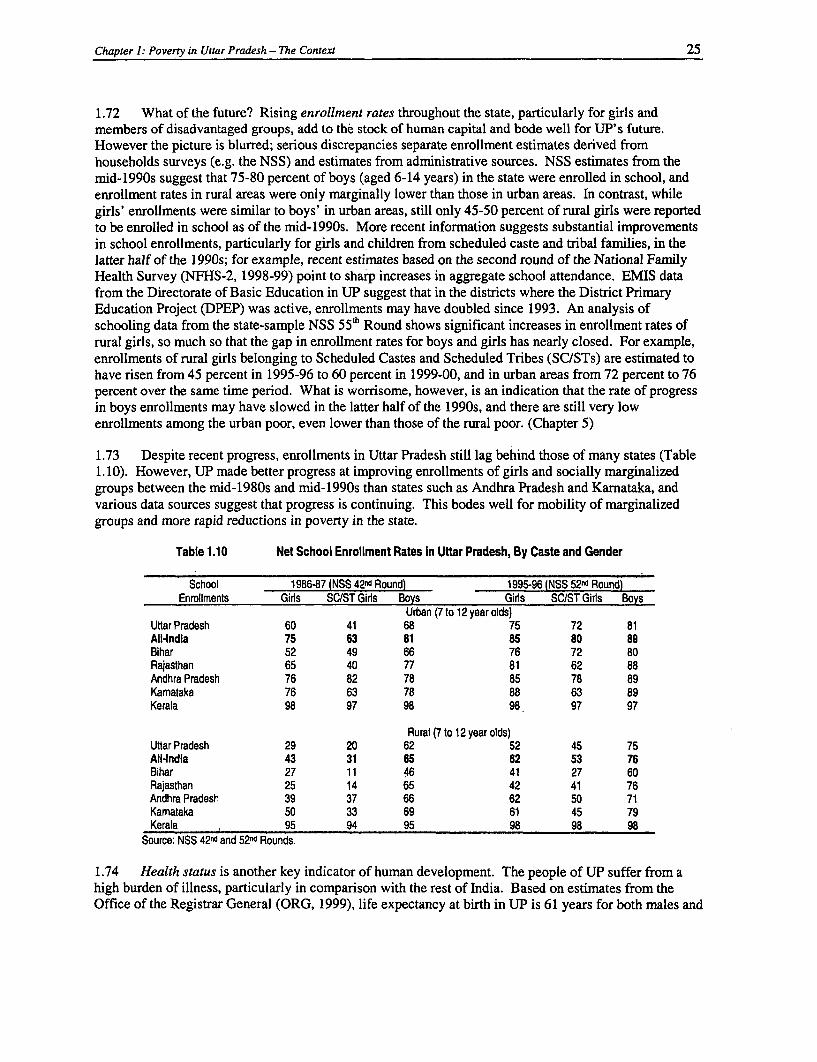
Chapter 1: Poverty in Uttar Pradesh - The Context 25
1.72 What of the future? Rising enrollment rates throughout the state, particularly for girls andmembers of disadvantaged groups, add to the stock of human capital and bode well for UP's future.However the picture is blurred; serious discrepancies separate enrollment estimates derived fromhouseholds surveys (e.g. the NSS) and estimates from administrative sources. NSS estimates from themid-1990s suggest that 75-80 percent of boys (aged 6-14 years) in the state were enrolled in school, andenrollment rates in rural areas were only marginally lower than those in urban areas. In contrast, whilegirls' enrollments were similar to boys' in urban areas, still only 45-50 percent of rural girls were reportedto be enrolled in school as of the mid-1990s. More recent information suggests substantial improvementsin school enrollments, particularly for girls and children from scheduled caste and tribal families, in thelatter half of the 1990s; for example, recent estimates based on the second round of the National FamilyHealth Survey (NFHS-2, 1998-99) point to sharp increases in aggregate school attendance. EMIS datafrom the Directorate of Basic Education in UP suggest that in the districts where the District PrimaryEducation Project (DPEP) was active, enrollments may have doubled since 1993. An analysis ofschooling data from the state-sample NSS 55t Round shows significant increases in enrollment rates ofrural girls, so much so that the gap in enrollment rates for boys and girls has nearly closed. For example,enrollments of rural girls belonging to Scheduled Castes and Scheduled Tribes (SC/STs) are estimated tohave risen from 45 percent in 1995-96 to 60 percent in 1999-00, and in urban areas from 72 percent to 76percent over the same time period. What is worrisome, however, is an indication that the rate of progressin boys enrollments may have slowed in the latter half of the 1990s, and there are still very lowenrollments among the urban poor, even lower than those of the rural poor. (Chapter 5)
1.73 Despite recent progress, enrollments in Uttar Pradesh still lag behind those of many states (Table1.10). However, UP made better progress at improving enrollments of girls and socially marginalizedgroups between the mnid-1980s and mid-1990s than states such as Andhra Pradesh and Karnataka, andvarious data sources suggest that progress is continuing. This bodes well for mobility of marginalizedgroups and more rapid reductions in poverty in the state.
Table 1.10 Net School Enrollment Rates In Uttar Pradesh, By Caste and Gender
School 1986-87 (NSS 42nd Round) 1995-96 (NSS 52nd Round)Enrollments Gils SC/ST Girs Boys Girs SC/ST Girs Boys
Urban (7 to 12 year olds)Uttar Pradesh 60 41 68 75 72 81All-India 75 63 81 85 80 89Bihar 52 49 66 76 72 80Rajasthan 65 40 77 81 62 88Andhra Pradesh 76 82 78 85 78 89Kamataka 76 63 78 88 63 89Kerala 98 97 98 98 97 97
Rural (7 to 12 year olds)Uttar Pradesh 29 20 62 52 45 75All-India 43 31 65 62 53 76Bihar 27 11 46 41 27 60Rajasthan 25 14 65 42 41 76Andhra Pradesh 39 37 66 62 50 71Kamataka 50 33 69 61 45 79Kerala 95 94 95 98 98 98
Source: NSS 42nd and 52nd Rounds.
1.74 Health status is another key indicator of human development. The people of UP suffer from ahigh burden of illness, particularly in comparison with the rest of India. Based on estimates from theOffice of the Registrar General (ORG, 1999), life expectancy at birth in UP is 61 years for both males and

26 Chapter 1: Poverty in Uttar Pradesh - The Context
females, well below the national average (62.4 years for males, and 63.4 years for females.) The totalfertility rate was estimated at 4.8 births in 1997, considerably higher than the national average of 3.5. TheUP matemal mortality rate was estimated at 707 deaths per 100,000 live births in 1997, compared to 408in India as a whole. However, recent trends in demographic and health indicators for women areencouraging. According to results of the National Family Health Survey (NFHS-2) in 1998-99, fertilityrates have been declining and contraceptive prevalence is slowly on the rise, although sterilization stillaccounts for three-quarters of contraceptive use (sterilization is not useful for birth spacing) (IIPS, 2000).
Figure 1.5 Health Indicators by State, 1998-99
Infant Mortality, 1998-99
100 -
~80-
~60-
~40-
20 -
0
States
Percentage of Children Under Age 3 Who are Stunted 1998-99
50-
~40-
30 -
20
10~~~~~~~
States
Source: NFHS-2 (1998-99), IIPS, 2000.
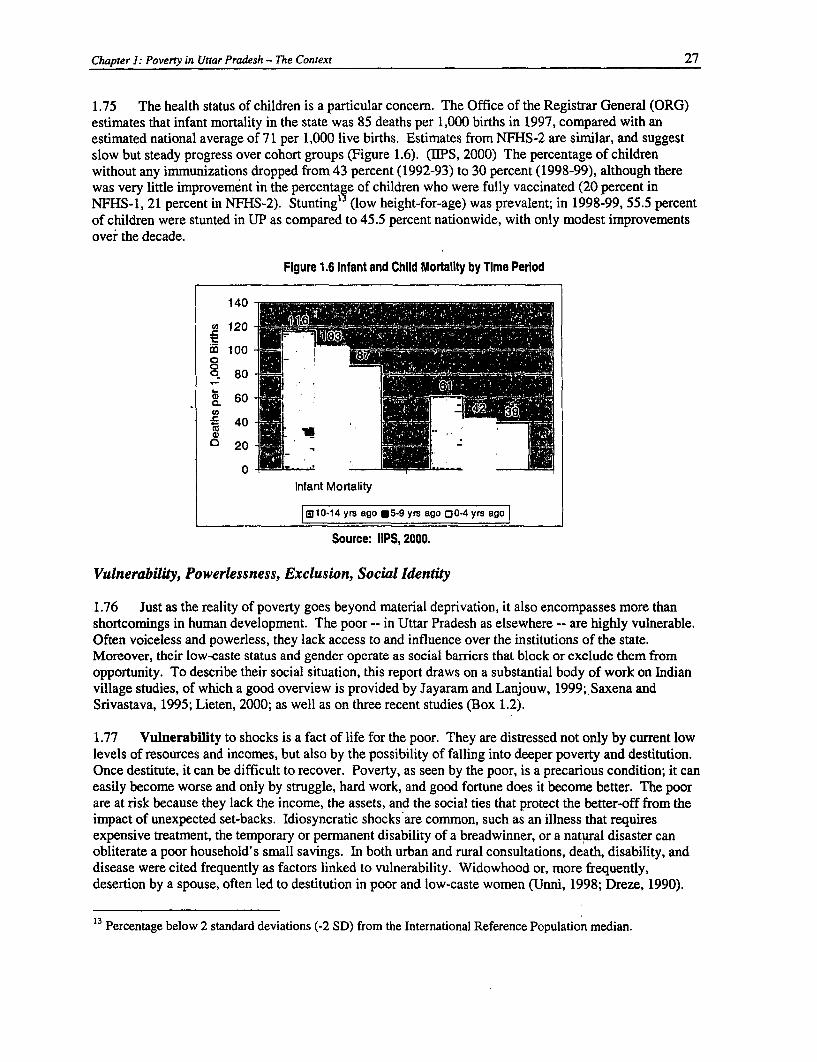
Chapter 1: Poverty in Uttar Pradesh - The Context 27
1.75 The health status of children is a particular concern. The Office of the Registrar General (ORG)estimates that infant mortality in the state was 85 deaths per 1,000 births in 1997, compared with anestimated national average of 71 per 1,000 live births. Estimates from NFHS-2 are simiiar, and suggestslow but steady progress over cohort groups (Figure 1.6). (IIPS, 2000) The percentage of childrenwithout any immunizations dropped from 43 percent (1992-93) to 30 percent (1998-99), although therewas very little improvement in the percentage of children who were fully vaccinated (20 percent inNFHS-1, 21 percent in NFHS-2). Stunting' (low height-for-age) was prevalent; in 1998-99, 55.5 percentof children were stunted in UP as compared to 45.5 percent nationwide, with only modest improvementsover the decade.
Figure 1.6 Infant and Child Mortality by Time Period
140
C 120-
Fm 100 -
. @ 60 - '40
20 8~ 0
Infant Mortality
aImI0-14 yrs ago *5-9 yrs ago C0-4 yrs ago|
Source: IIPS, 2000.
Vulnerability, Powerlessness, Exclusion, Social Identity
1.76 Just as the reality of poverty goes beyond material deprivation, it also encompasses more thanshortcomings in human development. The poor -- in Uttar Pradesh as elsewhere -- are highly vulnerable.Often voiceless and powerless, they lack access to and influence over the institutions of the state.Moreover, their low-caste status and gender operate as social barriers that block or exclude them fromopportunity. To describe their social situation, this report draws on a substantial body of work on Indianvillage studies, of which a good overview is provided by Jayaram and Lanjouw, 1999; Saxena andSrivastava, 1995; Lieten, 2000; as well as on three recent studies (Box 1.2).
1.77 Vulnerability to shocks is a fact of life for the poor. They are distressed not only by current lowlevels of resources and incomes, but also by the possibility of falling into deeper poverty and destitution.Once destitute, it can be difficult to recover. Poverty, as seen by the poor, is a precarious condition; it caneasily become worse and only by struggle, hard work, and good fortune does it become better. The poorare at risk because they lack the income, the assets, and the social ties that protect the better-off from theimpact of unexpected set-backs. Idiosyncratic shocks are common, such as an illness that requiresexpensive treatment, the temporary or permanent disability of a breadwinner, or a natural disaster canobliterate a poor household's small savings. In both urban and rural consultations, death, disability, anddisease were cited frequently as factors linked to vulnerability. Widowhood or, more frequently,desertion by a spouse, often led to destitution in poor and low-caste women (Unni, 1998; Dreze, 1990).
13 Percentage below 2 standard deviations (-2 SD) from the International Reference Population median.

28 Chapter 1: Poverty in Uttar Pradesh - The Context
Economy-wide or systemic shocks also are common. Crops may fail due to poor weather conditions,agricultural wages move with the vagaries of the local economy, and land may become eroded orsalinized due to flooding or inadequate supplies of ground water. If shocks are severe, repeated, or long-lasting, a household may be forced to sell or pawn its few productive assets and, in the worse cases, mayfall into chronic lifelong debt.
Box 1.2 Vulnerability to Shocks
In the recent qualitative study of urban poverty in UP the poorest urbanites were found very often to dwell on the banks of rivers ordrainage canals that are prone to flooding during the monsoon season, when entire communities may then find their homes underwater. In one area of Lucknow, informal settlements were found on the banks of canals (nallas) that drain waste water, includingsewage, from the city and that also serve as a toilet to the settlements. These nallas normally flood their banks once a year,leaving homes knee-deep in untreated sewage. Having nowhere else to go, many residents attempt to remain in their huts evenunder flooded conditions. Not only are their homesteads and possessions damaged or lost to the rising waters, but their health aswell is often severely affected. When disease outbreaks such as cholera epidemics follow upon floods, then illness, which isnormally an idiosyncratic shock, becomes covadant throughout the community of the deprived. The most vulnerable in thesecommunities become destitute as a result of the cost of curative care for those who fall ill and from the necessity of replacinghousing or other essential assets. In many cases, these shocks are regular seasonal events in the lives of the poor. When theyare, these recurrent shocks prevent them from escaping the precarious shantytown environment and may reduce them to beggingor other coping strategies of the truly destitute.
Source: field visits, Study of Urban Poverty in Uttar Pradesh, 2000.
1.78 The perception of risk and the concomitant fear of destitution can exert a strong influence onbehavior of both the poor and the near-poor. It is a truism that a potential loss is most threatening to ahousehold with little saved to cushion against shocks. Examples of extreme deprivation, hunger, andhopelessness are evident throughout the society; the risks are real, not imagined. Even when potentialreturns are significant, the poor may shun uncertain prospects such as leasing in cultivable land,purchasing a dairy cow, diversifying crops, or abandoning a subsistence-level livelihood in order to seekbetter employment, if the possibility of failure would exhaust their reserves or draw them into debt. Theend result is that many of the poor limit themselves to static, unproductive, and low-paying economicactivities to preserve security of livelihood, even at the cost of potential improvements in economic status,perpetuating the vicious cycle of poverty
1.79 Voice and Power. Generally deprived of political influence, the poor lack the leverage to ensurethat state institutions serve them fairly and thus often lack access to public facilities or receive goods ofinferior quality. While Indian citizens of all castes and income levels frequently have to deal with anunresponsive bureaucracy, the burden of non-responsiveness falls particularly upon the poor. Forexample, studies by India's Public Affairs Center (Sekhar and Balakrishnan, 1999) indicate that thewealthy and middle classes are more likely to be able to resolve their complaints and at lower cost. In astudy from Delhi, on average, 27% of ordinary households who complained about a particulargovernment service won redress with an average number of four required visits. In contrast, only 6% ofslum dwellers were able to get their problems solved, and an average slum dweller has to make six visitsin order to do so. Corruption is often a highly regressive tax and the poor pay more of their incomesproportionately - and at times absolutely - in bribes than do the wealthy or middle class. In the Delhiexample, the average bribe paid by ordinary households as Rs. 254; the average bribe paid in the slumswas Rs. 337.
1.80 Although poor households are at a disadvantage when they confront the bureaucracy on anindividual basis, urban slum dwellers interviewed in the course of the study of Urban Poverty in UttarPradesh reported some degree of success when community members organized to resist slum clearanceefforts by city officials.
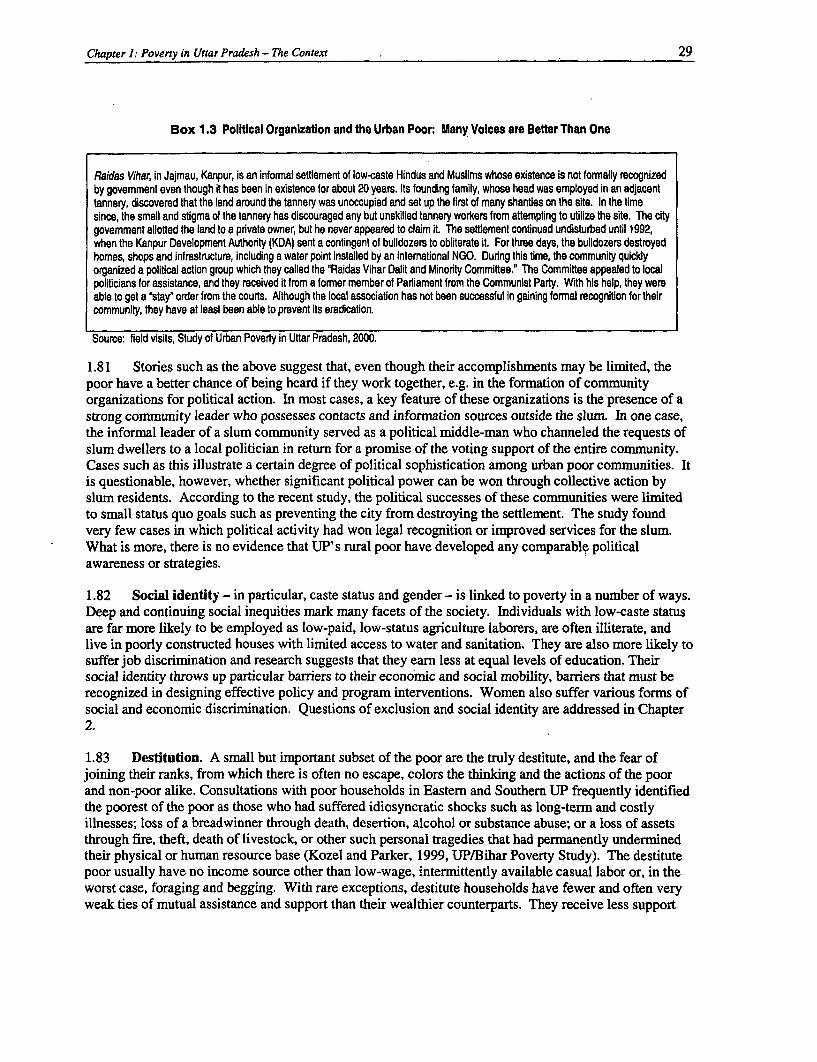
Chapter 1: Poverty in Uttar Pradesh - The Context 29
Box 1.3 Political Organization and the Urban Poor: Many Voices are Better Than One
Raidas Vihar, in Jajmau, Kanpur, is an informal setlement of low-caste Hindus and Muslims whose existence Is not formally recognizedby govemment even though it has been in existence for about 20 years. Its founding family, whose head was employed in an adjacenttannery, discovered that the land around the tannery was unoccupied and set up the first of many shanUes on the site. In the timesince, the smell and stigma of the tannery has discouraged any but unskilled tannery workers from attempting to utilize the site. The citygovemment allotted the land to a private owner, but he never appeared to clalm it. The settlement continued undisturbed until 1992,when the Kanpur Development Authority (KDA) sent a contingent of bulldozers to obliterate it. For three days, the bulldozers destroyedhomes, shops and infrastructure, including a water point Installed by an intemational NGO. During this tme, the community quicklyorganized a political action group which they called the "Raidas Vihar Dalit and Minority Committee.' The Committee appealed to localpoliticians for assistance, and they received it from a former member of Parliament from the Communist Party. With his help, they wereable to get a "stay" order from the courts. Although the local association has not been successful in gaining formal recognition for theircommunity, they have at least been able to prevent its eradication.
Source: field visits, Study of Urban Poverty in Uttar Pradesh, 2000.
1.81 Stories such as the above suggest that, even though their accomplishments may be limited, thepoor have a better chance of being heard if they work together, e.g. in the formation of communityorganizations for political action. In most cases, a key feature of these organizations is the presence of astrong community leader who possesses contacts and information sources outside the slum. In one case,the informal leader of a slum community served as a political middle-man who channeled the requests ofslum dwellers to a local politician in return for a promise of the voting support of the entire community.Cases such as this illustrate a certain degree of political sophistication among urban poor communities. Itis questionable, however, whether significant political power can be won through collective action byslum residents. According to the recent study, the political successes of these communities were limitedto small status quo goals such as preventing the city from destroying the settlement. The study foundvery few cases in which political activity had won legal recognition or improved services for the slum.What is more, there is no evidence that UP' s rural poor have developed any comparable politicalawareness or strategies.
1.82 Social identity - in particular, caste status and gender - is linked to poverty in a number of ways.Deep and continuing social inequities mark many facets of the society. Individuals with low-caste statusare far more likely to be employed as low-paid, low-status agriculture laborers, are often illiterate, andlive in poorly constructed houses with limited access to water and sanitation. They are also more likely tosuffer job discrimination and research suggests that they earn less at equal levels of education. Theirsocial identity throws up particular barriers to their economic and social mobility, barriers that must berecognized in designing effective policy and program interventions. Women also suffer various forms ofsocial and economic discrimination. Questions of exclusion and social identity are addressed in Chapter2.
1.83 Destitution. A small but important subset of the poor are the truly destitute, and the fear ofjoining their ranks, from which there is often no escape, colors the thinking and the actions of the poorand non-poor alike. Consultations with poor households in Eastern and Southern UP frequently identifiedthe poorest of the poor as those who had suffered idiosyncratic shocks such as long-term and costlyillnesses; loss of a breadwinner through death, desertion, alcohol or substance abuse; or a loss of assetsthrough fire, theft, death of livestock, or other such personal tragedies that had permanently underminedtheir physical or human resource base (Kozel and Parker, 1999, UP/Bihar Poverty Study). The destitutepoor usually have no income source other than low-wage, intermittently available casual labor or, in theworst case, foraging and begging. With rare exceptions, destitute households have fewer and often veryweak ties of mutual assistance and support than their wealthier counterparts. They receive less support
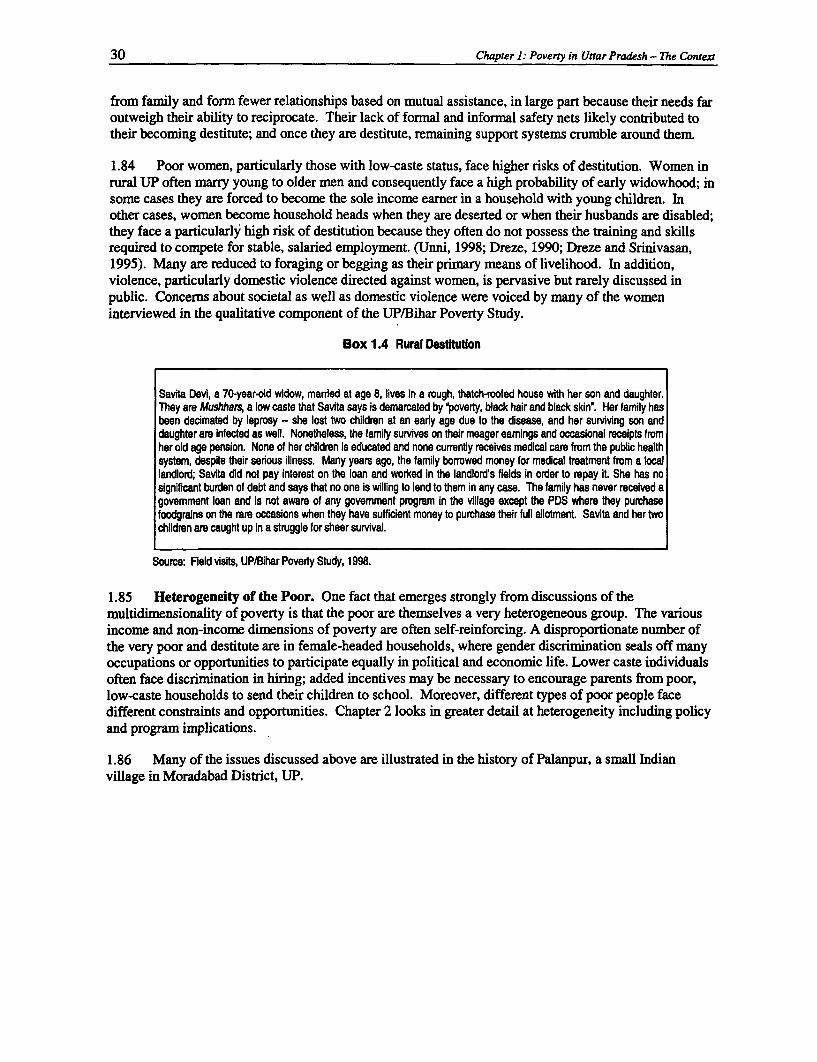
30 Chapter 1: Poverty in Uttar Pradesh - The Context
from family and form fewer relationships based on mutual assistance, in large part because their needs faroutweigh their ability to reciprocate. Their lack of formal and informal safety nets likely contributed totheir becoming destitute; and once they are destitute, remaining support systems crumble around them.
1.84 Poor women, particularly those with low-caste status, face higher risks of destitution. Women inrural UP often marry young to older men and consequently face a high probability of early widowhood; insome cases they are forced to become the sole income earner in a household with young children. Inother cases, women become household heads when they are deserted or when their husbands are disabled;they face a particularly high risk of destitution because they often do not possess the training and skilisrequired to compete for stable, salaried employment. (Unni, 1998; Dreze, 1990; Dreze and Srinivasan,1995). Many are reduced to foraging or begging as their primary means of livelihood. In addition,violence, particularly domestic violence directed against women, is pervasive but rarely discussed inpublic. Concerns about societal as well as domestic violence were voiced by many of the womeninterviewed in the qualitative component of the UP/Bihar Poverty Study.
Box 1.4 Rural DestHtution
Savita Devi, a 70-year-old widow, mamed at age 8, lives in a rough, thatch-rooted house with her son and daughter.They are Mushhars, a low caste that Savita says is demarcated by 'poverty, black hair and black skin". Her family hasbeen decimated by leprosy - she lost two children at an early age due to the disease, and her surviving son anddaughter are infected as well. Nonetheless, the famify survives on their meager eamings and occasional receipts fromher old age pension. None of her children is educated and none currently receives medical care from the public healthsystem, despite their serious illness. Many years ago, the family borrowed money for medical treatment from a locallandlord; Savita did not pay interest on the loan and worked in the landlord's fields in order to repay it. She has nosignificant burden of debt and says that no one is willing to lend to them in any case. The family has never received agovemment loan and is not aware of any govemment program in the village except the PDS where they purchasefoodgrains on the rare occasions when they have sufficient money to purchase their full allotment. Savita and her twochildren are caught up in a stnuggle for sheer survival.
Source: Field visits, UP/Bihar Poverty Study, 1998.
1.85 Heterogeneity of the Poor. One fact that emerges strongly from discussions of themultidimensionality of poverty is that the poor are themselves a very heterogeneous group. The variousincome and non-income dimensions of poverty are often self-reinforcing. A disproportionate number ofthe very poor and destitute are in female-headed households, where gender discrimination seals off manyoccupations or opportunities to participate equally in political and economic life. Lower caste individualsoften face discrimination in hiring; added incentives may be necessary to encourage parents from poor,low-caste households to send their children to school. Moreover, different types of poor people facedifferent constraints and opportunities. Chapter 2 looks in greater detail at heterogeneity including policyand program implications.
1.86 Many of the issues discussed above are illustrated in the history of Palanpur, a small Indianvillage in Moradabad District, UP.
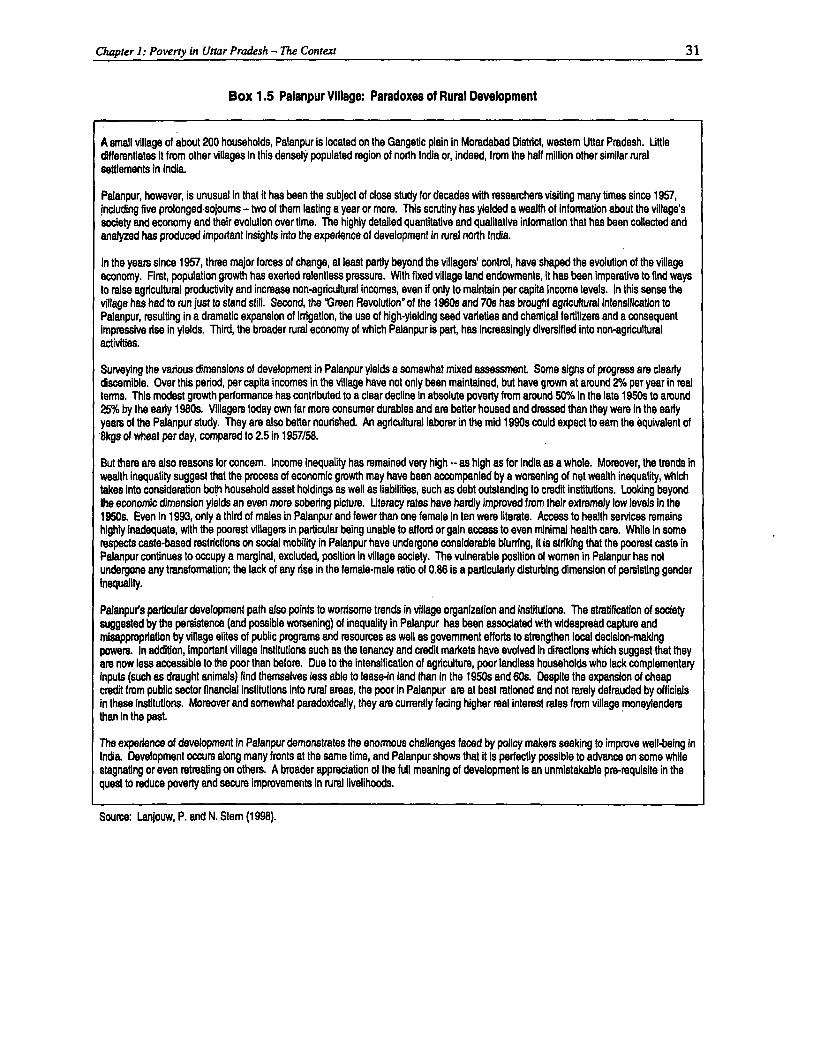
Chapter ): Poverty in Uttar Pradesh - The Context 31
Box 1.5 Palanpur Village: Paradoxes of Rural Development
A small village of about 200 households, Palanpur is located on the Gangetic plain in Moradabad District, westem Uttar Pradesh. Uttledifferentiates it from other villages in this densely populated region of norh India or, indeed, from the half million other similar ruralsettlements in India.
Palanpur, however, is unusual in that it has been the subject of close study for decades with researchers visiting many times since 1957,including five prolonged sojoums - two of them lasting a year or more. This scrutiny has yielded a wealth of information about the village'ssociety and economy and their evolution over time. The highly detailed quantitative and qualitative information that has been collected andanalyzed has produced important Insights into the experience of development in rural north India.
In the years since 1957, three major forces of change, at least partly beyond the villagers' control, have shaped the evolution of the villageeconomy. First, population growth has exerted relentless pressure. With fixed village land endowments, it has been imperative to find waysto raise agricultural productivity and increase non-agricultural Incomes, even if only to maintain per capita Income levels. In this sense thevillage has had to run just to stand still. Second, the 'Green Revolution of the 1 960s and 70s has brought agricultural Intensification toPalanpur, resulting in a dramatic expansion of irrigation, the use of high-yielding seed varieties and chemical fertilizers and a consequentimpressive rise in yields. Third, the broader rural economy of which Palanpur is part, has increasingly diversified into non-agriculturalactivities.
Surveying the various dimensions of development in Palanpur yields a somewhat mixed assessment. Some signs of progress are clearlydiscemible. Over this period, per capita incomes in the village have not only been maintained, but have grown at around 2% per year in realterms. This modest growth performance has contributed to a clear decline in absolute poverty from around 50%fO In the late 1950s to arund25% by the eariy 1980s. Villagers today own far more consumer durables and are better housed and dressed than they were in the eariyyears of the Palanpur study. They are also better nourished. An agricultural laborer in the mid 1990s could expect to eam the equivalent of8kgs of wheat per day, compared to 2.5 in 1957/58.
But there are also reasons for concem. Income inequality has remained very high -- as high as for India as a whole. Moreover, the trends inwealth inequality suggest that the process of economic growth may have been accompanied by a worsening of net wealth inequality, whichtakes Into consideration both household asset holdings as well as liabilities, such as debt outstanding to credit institutions. Looking beyondthe economic dimension yields an even more sobering picture. Uteracy rates have hardly Improved from their extremely low levels in the1950s. Even In 1993, only a third of males in Palanpur and fewer than one female in ten were literate. Access to health services remainshighly Inadequate, with the poorest villagers in particular being unable to afford or gain access to even minimal health care. While in somerespects caste-based restrictions on social mobility in Palanpur have undergone considerable blurring, it is striking that the poorest caste inPalanpur continues to occupy a marginal, excluded, position in village society. The vulnerable position of women in Palanpur has notundergone any transformation; the lack of any rise in the female-male ratio of 0.86 Is a particularly disturbing dimension of persisting genderInequality.
Palanpurs particular development path also points to worrisome trends in village organization and institutions. The stratification of societysuggested by the persistence (and possible worsening) of inequality in Palanpur has been associated with widespread capture andmisappropriaton by village elites of public programs and resources as well as govemment efforts to strengthen local decision-makingpowers. In addftion, Important village institutions such as the tenancy and credit markets have evolved in directions which suggest that theyare now less accessible to the poor than before. Due to the intensification of agriculture, poor landless households who lack complementaryinputs (such as draught animals) find themselves less able to lease-in land than in the 1950s and 60s. Despite the expansion of cheapcredit from public sector financial institutions into rural areas, the poor in Palanpur are at best rationed and not rarely defrauded by officialsin these institutions. Moreover and somewhat paradoxically, they are currently facing higher real interest rates from village moneylendersthan in the past.
The experienoe of development in Palanpur demonstrates the enormous challenges faced by policy makers seeking to improve well-being inIndia. Development occurs along many fronts at the same time, and Palanpur shows that it is perfectly possible to advance on some whilestagnating or even retreating on others. A broader appreciation of the full meaning of development is an unmistakable pre-requisite in thequest to reduce poverty and secure improvements In rural livelihoods.
Source: Lanjouw, P. and N. Stem (1998).

Chapter 2
PROFILE OF THE POOR:POVERTY OF RESOURCES, ACCESS, AND RELATIONSHIPS
A. Introduction
2.1 Poverty is a result of low levels of assets, coupled with low returns. In combating poverty, thestate will need to build purposefully on all of its assets, those in public hands and those in the privatesector, not least the real and potential assets of the poor themselves. Almost by definition, the poor havevery few assets beyond their own labor, inevitably expended in tedious, back-breaking, low-paid work.Usually with too little or no land, a critical material asset, they also tend to lack education, skills and goodhealth - they suffer from poverty of private resources. In addition, the poor have limited access to suchpublic assets as community infrastructure, basic services and government programs - they suffer frompoverty of access to public goods and services. Finally, they are often deprived of informal systems ofsupport and social and political capital - they experience poverty of social relationships. This chapterpresents a profile of poverty in terms of deficiencies in private assets, public assets, and social capital. Tocombat poverty, policy makers must take all these deficiencies into account.
2.2 While economic growth is a powerful force for poverty reduction, few, if any, modem societiesdeliver equality of opportunity to all their citizens. Evidence from around the world suggests that therising tide of economic growth does not lift all boats equally, and there are forces at work that limitopportunities for some individuals and groups. In varying degrees, ranging from indigenous populationsin Bolivia and Guatemala to ethnic minorities in Sri Lanka and Vietnam -- even those in such countries asAustralia, Russia and the United States -- all experience some form of social discrimination that impactson economic well-being. So, throughout the world --again in varying degrees -- do women. In UttarPradesh, exclusion based on gender and social identity is not only deeply ingrained; it is also a powerfulcontributing factor to the persistence of poverty. This chapter looks at the role played by gender and castein limiting or even barring opportunities to escape poverty. Additionally, in the same context, the chapterbriefly discusses child labor.
2.3 The poor are a highly heterogeneous group. Deprivations come in many forms, and not all poorhouseholds are deprived in the same ways. Poor households differ with respect to the depth of povertythey experience, the material, human, and social resources they can marshal, the opportunities offered bytheir environment, and the strategies they employ in their struggles against poverty. Efforts to combatpoverty will be more effective if these differences are recognized in the design of policies and programs.
B. Voices of the Poor
2.4 The poverty profile and diagnostic work presented in this paper draws not only on conventionalquantitative data, but also is informed by consultations carried out in poor communities (Chapter 1). Theconsultations enrich a conventional profile by providing information on the how the poor themselvesdefine their situation, their priorities, and the constraints and opportunities they face. Poor men andwomen give voice and context to the story that emerges from the statistical analysis - they highlightconcerns about lack of land, security of tenure, lack of skills and good education, lack of social networksand lack of access to stable employment. As well they speak of poverty in terms of risks -- linked tohealth shocks, debt, and desertion. The importance of social identity is sharply evident: in rural areas,low caste status was cited as one of the strongest indicators of poverty.

34 Chapter 2: Profile of the Poor: Poverty of Resources, Access, and Relationships
Box 2.1 People's Perceptions of Poverty in UP
Discussions were held with people in UP, both poor and non-poor, on their perceptions ot poverty and the factors that contribute toupward or downward mobility Rural respondents cited a range of factors:
* Landlessness or possession of only poor quality, non-irrigated lands,* Dependency on intermittent casual wage labor, especially in the agriculture sector, dependency on foraging or begging;* Lack of basic literacy, job skills,* Umited access to social networks, particularly networks that extend outside the village and help residents find better jobs,
particularly jobs in the non-farm sector,* Chronic indebtedness,* Desertion, widows, or women living alone without an adult male,* A high dependency ratio, many daughters, also lack of sons,* III health or disability, particularly of the primary breadwinner,* Poor quality mud and thatch housing, insecurity of tenure* Social or caste identity: in several villages, low-caste informants assumed all high-caste households to be rich, while they
carefully ranked lower caste households by various economic criteria. Among the higher castes, low caste status wasassumed to be a strong indicator of poverty.
Less tangible factors such as dignity and autonomy were often mentioned. One group of low-caste informants reported that theyhad moved from the central village, where they had lived on lands belonging to wealthy traditional patrons, to marginal and non-productive lands on the village periphery. Although they had gained nothing economically by the move and may even have lost aninformal safety net, they felt they were better off by virtue of having escaped a demeaning, demoralizing, and potentially threateningrelationship of dependency.
Urban poverty has a distinctly different face than rural poverty. Many of the urban poor included in the consultations were firstgeneration migrants, and the majority felt that migration had improved their economic position. In urban areas, unlike rural villages,employment opportunities - if only scavenging, petty hawking, and begging - are available year round, typically at higher wagesthan paid in rural areas. Furthermore, many of the urban poor said they preferred working in urban areas not only because theyeamed higher and more regular wages but also because they were 'free' (free of the pressure exerted by a powerful patronemployer). Caste was far less frequently mentioned as a barrier to economic mobility. Many also complained about lack of jobsecurity and most aspired to more permanent salaried jobs.
Additional factors cited include:
* Very poor housing, lack of secure tenure (extremely important in the eyes of the urban poor), polluted and inadequate waterand sanitation services,
* Lack of appropriate job skills and connections - surprisingly, few of the poor in illegal settlements cited formal education as animportant factor in determining access to employment, although virtually all respondents felt that basic literacy, including forgirls, was important,
* The household's asset base at the time of migration was frequently mentioned; households that brought start-up money or hadjob connections were typically better off than households that come to the city with nothing,
* More than in rural areas, behavioral factors were cited frequently as critical for upward mobility. The poor were consideredless industrious", less hard working, more prone to alcohol or drug abuse.
* High dependency ratios, particularly young children, widows without sons or with young children,* Serious illnesses (TB, cancer, mental illness) disability of working aged adults,
Source: Field notes, UP/Bihar Rural Poverty Study, 1998; Parker, Kukreja, and Kozel, 2001
C. Private, Public, and Social Assets
Private Assets
2.5 Labor, the most important asset of the poor, provides the overwhelming majority of poor peoplein UP with only low-skill, low-paid jobs with no permanent tenure. In consultations with the poor donein preparation for this report, better jobs - especially jobs outside the agriculture sector and with securityof tenure -- were cited repeatedly as the most important priority for urban and rural poor households alike.The reality, however, is that agricultural employment - rising in recent years - occupies three-quarters of
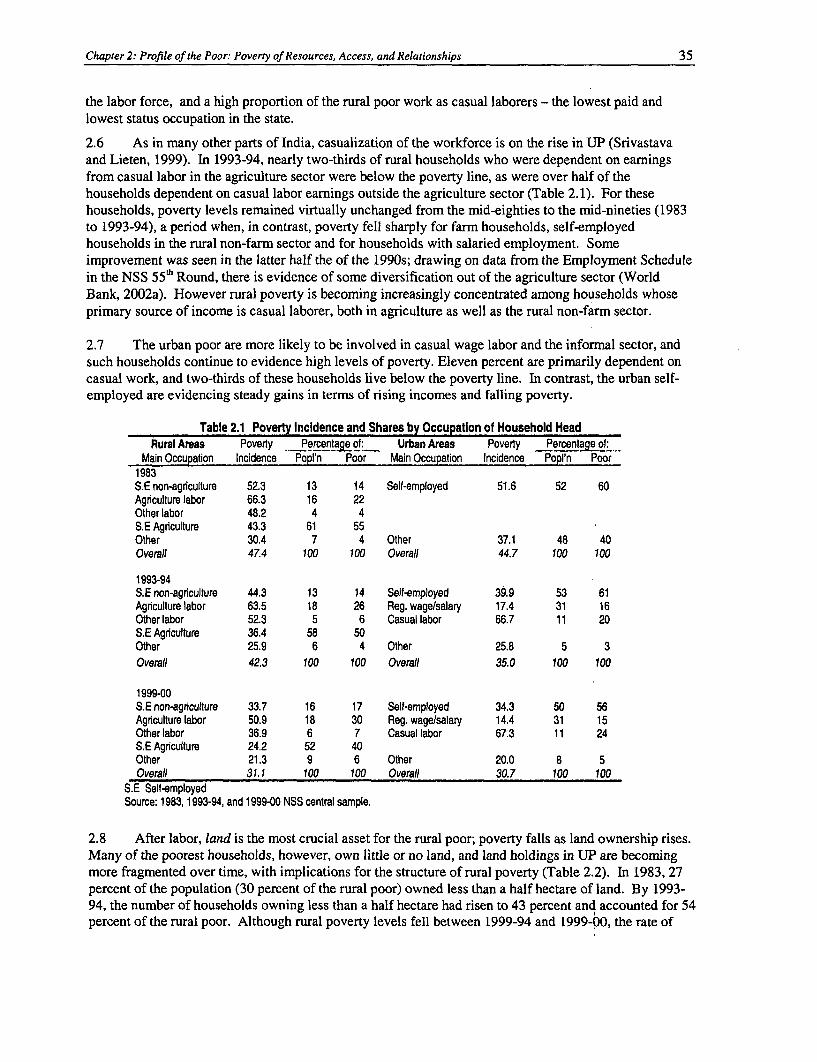
Chapter 2: Profile of the Poor: Poverty of Resources, Access, and Relationships 35
the labor force, and a high proportion of the rural poor work as casual laborers - the lowest paid andlowest status occupation in the state.
2.6 As in many other parts of India, casualization of the workforce is on the rise in UP (Srivastavaand Lieten, 1999). In 1993-94, nearly two-thirds of rural households who were dependent on earningsfrom casual labor in the agriculture sector were below the poverty line, as were over half of thehouseholds dependent on casual labor earnings outside the agriculture sector (Table 2.1). For thesehouseholds, poverty levels remained virtually unchanged from the mid-eighties to the mid-nineties (1983to 1993-94), a period when, in contrast, poverty fell sharply for farm households, self-employedhouseholds in the rural non-farm sector and for households with salaried employment. Someimprovement was seen in the latter half the of the 1990s; drawing on data from the Employment Schedulein the NSS 55' Round, there is evidence of some diversification out of the agriculture sector (WorldBank, 2002a). However rural poverty is becoming increasingly concentrated among households whoseprimary source of income is casual laborer, both in agriculture as well as the rural non-farm sector.
2.7 The urban poor are more likely to be involved in casual wage labor and the informal sector, andsuch households continue to evidence high levels of poverty. Eleven percent are primarily dependent oncasual work, and two-thirds of these households live below the poverty line. In contrast, the urban self-employed are evidencing steady gains in terms of rising incomes and falling poverty.
Table 2.1 Poverty Incidence and Shares by Occupation of Household HeadRural Areas Poverty Pe_rcentage of: Urban Areas Poverty Percentage o
Main Occupation Incidence Popl'n Poor Main Occupation Incidence Popl'n Poor1983S.E non-agriculture 52.3 13 14 Self-employed 51.6 52 60Agriculture labor 66.3 16 22Other labor 48.2 4 4S.E Agriculture 43.3 61 55Other 30.4 7 4 Other 37.1 48 40Overall 47.4 100 100 Overall 44.7 100 100
1993-94S.E non-agriculture 44.3 13 14 Self-employed 39.9 53 61Agriculture labor 63.5 18 26 Reg. wage/salary 17.4 31 16Other labor 52.3 5 6 Casual labor 66.7 11 20S.E Agriculture 36.4 58 50Other 25.9 6 4 Other 25.8 5 3Overall 42.3 100 100 Overall 35.0 100 100
1999-00S.E non-agriculture 33.7 16 17 Sell-employed 34.3 50 56Agriculture labor 50.9 18 30 Reg. wage/salary 14.4 31 15Other labor 36.9 6 7 Casual labor 67.3 11 24S.E Agriculture 24.2 52 40Other 21.3 9 6 Other 20.0 8 5Overall 31.1 100 100 Overall 30.7 100 100
S.E Self-employedSource: 1983,1993-94, and 1999-00 NSS central sample.
2.8 After labor, land is the most crucial asset for the rural poor; poverty falls as land ownership rises.Many of the poorest households, however, own little or no land, and land holdings in UP are becomingmore fragmented over time, with implications for the structure of rural poverty (Table 2.2). In 1983, 27percent of the population (30 percent of the rural poor) owned less than a half hectare of land. By 1993-94, the number of households owning less than a half hectare had risen to 43 percent and accounted for 54percent of the rural poor. Although rural poverty levels fell between 1999-94 and 1999-00, the rate of
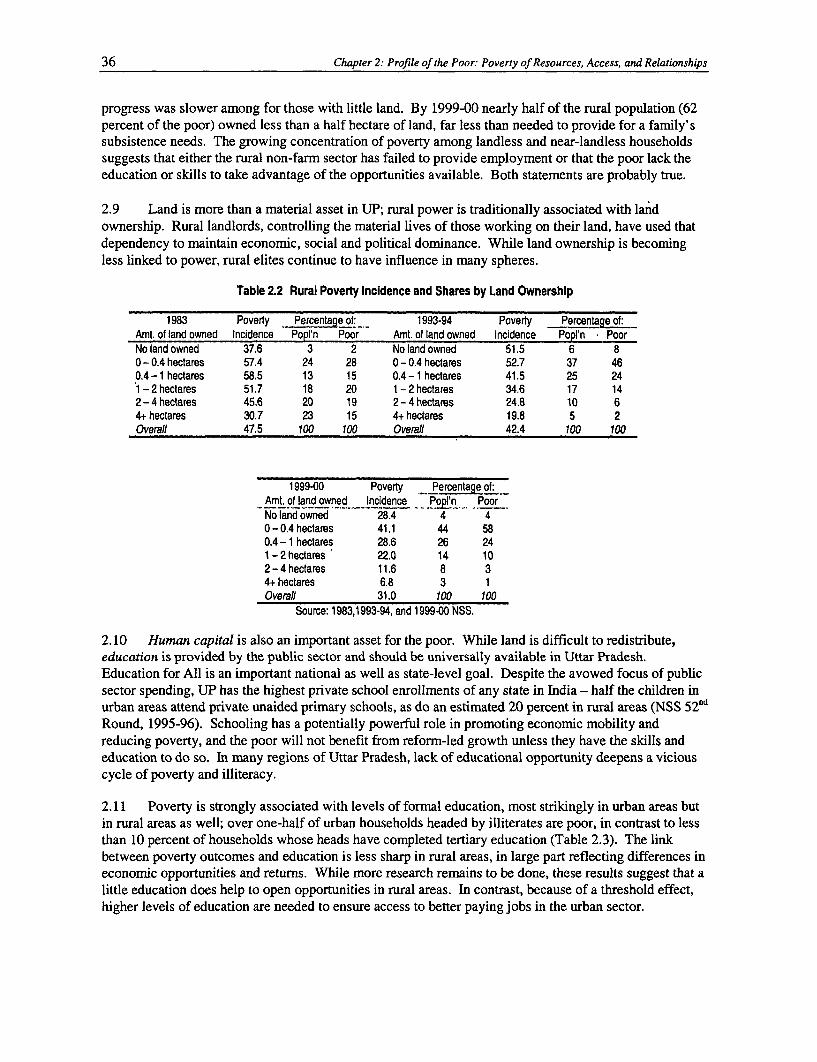
36 Chapter 2: Profile of the Poor: Poverty of Resources, Access, and Relationships
progress was slower among for those with little land. By 1999-00 nearly half of the rural population (62percent of the poor) owned less than a half hectare of land, far less than needed to provide for a family'ssubsistence needs. The growing concentration of poverty among landless and near-landless householdssuggests that either the rural non-farm sector has failed to provide employment or that the poor lack theeducation or skills to take advantage of the opportunities available. Both statements are probably true.
2.9 Land is more than a material asset in UP; rural power is traditionally associated with landownership. Rural landlords, controlling the material lives of those working on their land, have used thatdependency to maintain economic, social and political dominance. While land ownership is becomingless linked to power, rural elites continue to have influence in many spheres.
Table 2.2 Rural Poverty Incidence and Shares by Land Ownership
1983 Poverty Percentage of: 1993-94 Poverty Percentage of:Amt. of land owned Incidence Popl'n Poor Amt. of land owned Incidence Popl'n PoorNo land owned 37.6 3 2 No land owned 51.5 6 80 - 0.4 hectares 57.4 24 28 0 - 0.4 hectares 52.7 37 460.4- 1 hectares 58.5 13 15 0.4 - 1 hectares 41.5 25 241 -2hectares 51.7 18 20 1 -2hectares 34.6 17 142 - 4 hectares 45.6 20 19 2 - 4 hectares 24.8 10 64+ hectares 30.7 23 15 4+ hectares 19.8 5 2Overall 47.5 100 100 Overall 42.4 100 100
1999-00 Poverty Percenta e of:Amt. of land owned Incidence PopUn PoorNo land owned 28.4 4 40 - 0.4 hectares 41.1 44 580.4- 1 hectares 28.6 26 241 - 2 hectares 22.0 14 102 - 4 hectares 11.6 8 34+ hectares 6.8 3 1Overall 31.0 100 100
Source: 1983,1993-94, and 1999-00 NSS.
2.10 Human capital is also an important asset for the poor. While land is difficult to redistribute,education is provided by the public sector and should be universally available in Uttar Pradesh.Education for All is an important national as well as state-level goal. Despite the avowed focus of publicsector spending, UP has the highest private school enrollments of any state in India - half the children inurban areas attend private unaided primary schools, as do an estimated 20 percent in rural areas (NSS 52nd
Round, 1995-96). Schooling has a potentially powerful role in promoting economic mobility andreducing poverty, and the poor will not benefit from reform-led growth unless they have the skills andeducation to do so. In many regions of Uttar Pradesh, lack of educational opportunity deepens a viciouscycle of poverty and illiteracy.
2.11 Poverty is strongly associated with levels of formal education, most strikingly in urban areas butin rural areas as well; over one-half of urban households headed by illiterates are poor, in contrast to lessthan 10 percent of households whose heads have completed tertiary education (Table 2.3). The linkbetween poverty outcomes and education is less sharp in rural areas, in large part reflecting differences ineconomic opportunities and returns. While more research remains to be done, these results suggest that alittle education does help to open opportunities in rural areas. In contrast, because of a threshold effect,higher levels of education are needed to ensure access to better paying jobs in the urban sector.

Chapter 2: Profile of the Poor: Poverty of Resources, Access, and Relationships 37
Table 2.3 Poverty Incidence and Shares by Level of Education of the Household Head
1993-94Highest Educational Incidence of Poverty Percentage of:Attainment of Head Urban Rural Overall Population Poor
Not literate 58.6 50.6 51.6 53 66Less than Pnmary 43.1 36.7 37.9 11 11Completed Pnmary 46.3 33.5 35.9 10 9Completed Middle 26.5 32.3 31.0 10 7Completed Secondary 18.9 25.6 23.3 6 4Completed Higher level 6.8 19.6 13.4 10 3Overall 35.0 42.4 40.9 100 100
1999-00Highest Educational Incidence of Poverty Percentage of:Attainment of Head Urban Rural Overall Population Poor
Not literate 50.3 37.5 39.2 48 61Less than Pnmary 42.8 33.2 35.1 10 12Completed Pnmary 30.2 26.3 27.1 10 9Completed Middle 22.4 24.1 23.8 12 9Completed Secondary 22.8 19.1 20.2 8 5Completed Higher level 9.0 14.0 11.9 12 4Overall 30.7 31.1 31.0 100 100Note: Less than prmary includes those who are literate, but have no formal schoolingSource: 1993-94,1999-00 NSS
2.12 Consultations carried out in poor, unrecognized settlements, including focus groyps with urbanyouths, help to explain these findings. While many young people were literate, surprisingly few aspiredto more education, and many did not see how having more education would help them get better jobs.Rather, respondents stressed the importance of work skills, informal training, and personal contacts. Itwas not that education did not matter, but rather that the kinds of jobs open to young people living in verypoor and marginalized urban settings did not require or reward higher levels of education. Poor parents insome of the rural consultations voiced similar views.
2.13 An individual attribute but also a public concem, good health is another asset that can be hard forthe poor to attain or maintain. Often linked to inadequate calories and malnutrition, poverty increases therisk of getting sick and of exacerbating illness. For example, lower-income settlements in urban areas areoften clustered in waterlogged, malarial zones or in areas where poor sanitation makes exposure to wastewater and raw sewage all but inevitable. A recent study in a very poor area of eastern UP (Parker, 1999)found that low-income informants know little of disease etiology and prevention, even by developing-country standards. Health services need to take into account the likelihood among the poor of increasedtransmission of infectious diseases and disrupted medical care. The cost of treating major illnesses is oneof the shocks that plunges many into poverty.
2.14 The higher risks associated with poverty are reflected in the gap between health status indicatorsfor the rich and poor in the nation as a whole. Women and children are particularly at risk. Survey datafrom the first National Family Health Survey (NFHS- 1) in 1992-93 indicates that infant and childmortality rates among the poorest 20 percent of the Indian population are 2/2 times higher than among thewealthiest 20 percent. Moreover, the incidence of disease and debilitating health conditions is sharplyhigher among poorer segments of the population (Figure 2.1).
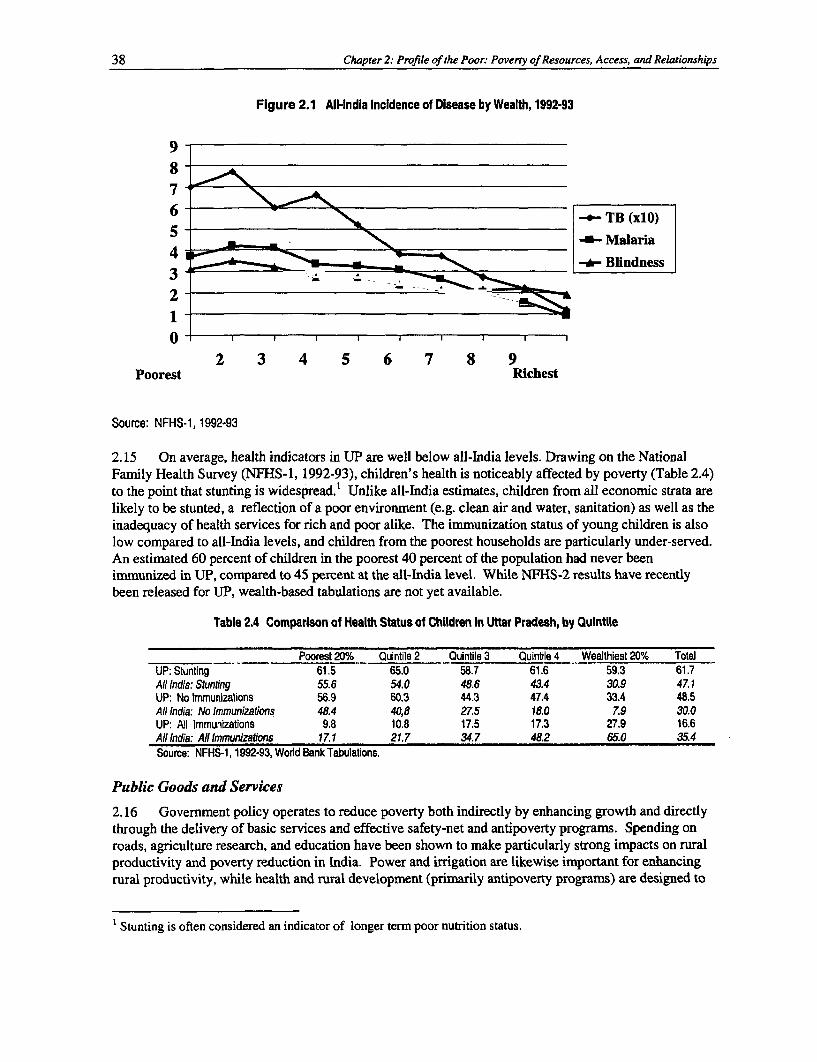
38 Chapter 2: Profile of the Poor: Poverty of Resources, Access, and Relationships
Figure 2.1 All-India Incidence of Disease by Wealth, 1992-93
9
8-
6 - TB (x10)
5 ~~~~~~~~~~~~~~Malaria
34 - Blindness
2 -_ . - Ei2'1 ' 0- l l l l l l
2 3 4 5 6 7 8 9Poorest Richest
Source: NFHS-1, 1992-93
2.15 On average, health indicators in UP are well below all-India levels. Drawing on the NationalFamily Health Survey (NFHS-1, 1992-93), children's health is noticeably affected by poverty (Table 2.4)to the point that stunting is widespread.1 Unlike all-India estimates, children from all economic strata arelikely to be stunted, a reflection of a poor environment (e.g. clean air and water, sanitation) as well as theinadequacy of health services for rich and poor alike. The immunization status of young children is alsolow compared to all-India levels, and children from the poorest households are particularly under-served.An estimated 60 percent of children in the poorest 40 percent of the population had never beenimmunized in UP, compared to 45 percent at the all-India level. While NFHS-2 results have recentlybeen released for UP, wealth-based tabulations are not yet available.
Table 2.4 Comparlson of Health Status of Children In Uttar Pradesh, by Quintlile
Poorest 20% Quintile 2 Quintile 3 Quintile 4 Wealthiest 20% TotalUP: Stunting 61.5 65.0 58.7 61.6 59.3 61.7All India: Stunting 55.6 54.0 48.6 43.4 30.9 47.1UP: No immunizations 56.9 60.3 44.3 47.4 33.4 48.5All India: No lmmunizations 48.4 40,8 27.5 18.0 7.9 30.0UP: All tmmunizations 9.8 10.8 17.5 17.3 27.9 16.6Al India: All lmmunizations 171 21.7 34.7 48.2 65.0 35.4Source: NFHS-1, 1992-93, Wodd Bank Tabulations.
Public Goods and Services
2.16 Government policy operates to reduce poverty both indirectly by enhancing growth and directlythrough the delivery of basic services and effective safety-net and antipoverty programs. Spending onroads, agriculture research, and education have been shown to make particularly strong impacts on ruralproductivity and poverty reduction in India. Power and irrigation are likewise important for enhancingrural productivity, while health and rural development (primarily antipoverty programs) are designed to
' Stunting is often considered an indicator of longer term poor nutrition status.
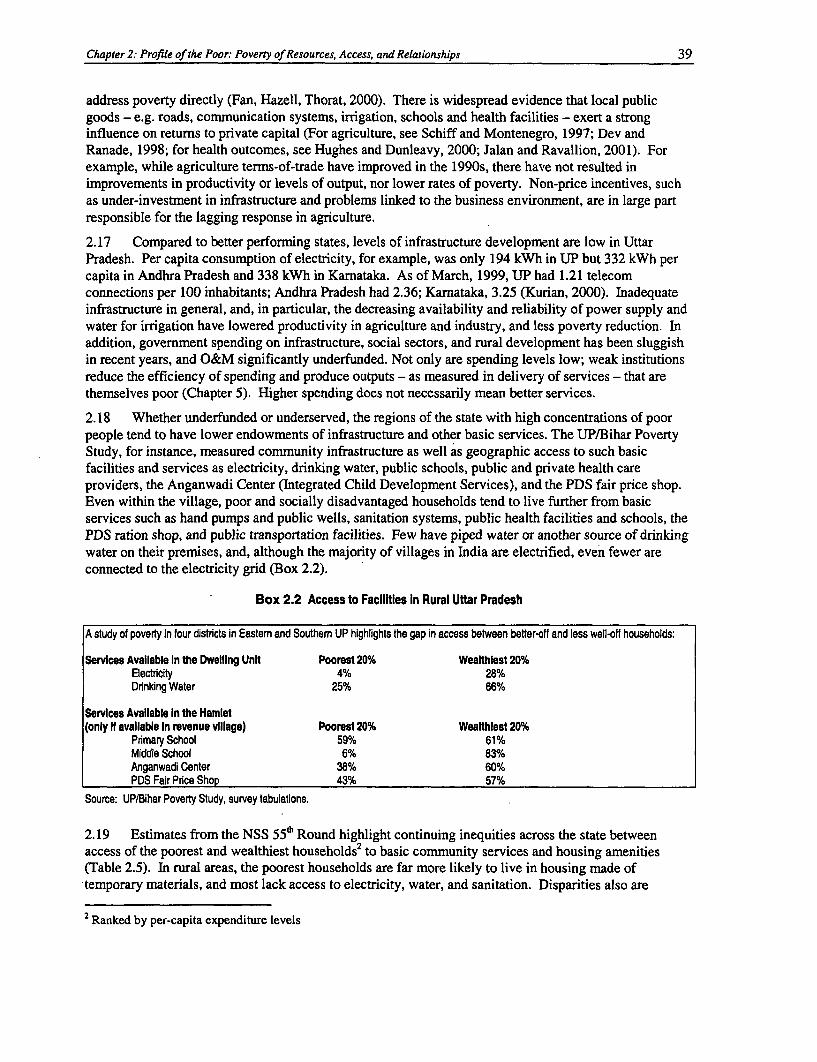
Chapter 2: Profile of the Poor: Poverty of Resources, Access, and Relationships 39
address poverty directly (Fan, Hazell, Thorat, 2000). There is widespread evidence that local publicgoods - e.g. roads, communication systems, irrigation, schools and health facilities - exert a stronginfluence on returns to private capital (For agriculture, see Schiff and Montenegro, 1997; Dev andRanade, 1998; for health outcomes, see Hughes and Dunleavy, 2000; Jalan and Ravallion, 2001). Forexample, while agriculture terms-of-trade have improved in the 1990s, there have not resulted inimprovements in productivity or levels of output, nor lower rates of poverty. Non-price incentives, suchas under-investment in infrastructure and problems linked to the business environment, are in large partresponsible for the lagging response in agriculture.
2.17 Compared to better performing states, levels of infrastructure development are low in UttarPradesh. Per capita consumption of electricity, for example, was only 194 kWh in UP but 332 kWh percapita in Andhra Pradesh and 338 kWh in Karnataka. As of March, 1999, UP had 1.21 telecomconnections per 100 inhabitants; Andhra Pradesh had 2.36; Karnataka, 3.25 (Kurian, 2000). Inadequateinfrastructure in general, and, in particular, the decreasing availability and reliability of power supply andwater for irrigation have lowered productivity in agriculture and industry, and less poverty reduction. Inaddition, government spending on infrastructure, social sectors, and rural development has been sluggishin recent years, and O&M significantly underfunded. Not only are spending levels low; weak institutionsreduce the efficiency of spending and produce outputs - as measured in delivery of services - that arethemselves poor (Chapter 5). Higher spending does not necessarily mean better services.
2.18 Whether underfunded or underserved, the regions of the state with high concentrations of poorpeople tend to have lower endowments of infrastructure and other basic services. The UP/Bihar PovertyStudy, for instance, measured community infrastructure as well as geographic access to such basicfacilities and services as electricity, drinking water, public schools, public and private health careproviders, the Anganwadi Center (Integrated Child Development Services), and the PDS fair price shop.Even within the village, poor and socially disadvantaged households tend to live further from basicservices such as hand pumps and public wells, sanitation systems, public health facilities and schools, thePDS ration shop, and public transportation facilities. Few have piped water or another source of drinkingwater on their premises, and, although the majority of villages in India are electrified, even fewer areconnected to the electricity grid (Box 2.2).
Box 2.2 Access to Facilities In Rural Uttar Pradesh
A study of poverty in four districts in Eastern and Southem UP highlights the gap in access between better-off and less well-off households:
Services Available In the Dwelling Unit Poorest 20% WealthIest 20%Electricity 4% 28%Drinking Water 25% 66%
Services Available In the Hamlet(only If available In revenue village) Poorest 20% Wealthiest 20%
Primary School 59% 61%Middle School 6% 83%Anganwadi Center 38% 60%PDS Fair Price Shop 43% 57%
Source: UP/Bihar Poverty Study, survey tabulations.
2.19 Estimates from the NSS 55h Round highlight continuing inequities across the state betweenaccess of the poorest and wealthiest households2 to basic community services and housing amenities(Table 2.5). In rural areas, the poorest households are far more likely to live in housing made oftemporary materials, and most lack access to electricity, water, and sanitation. Disparities also are
2 Ranked by per-capita expenditure levels
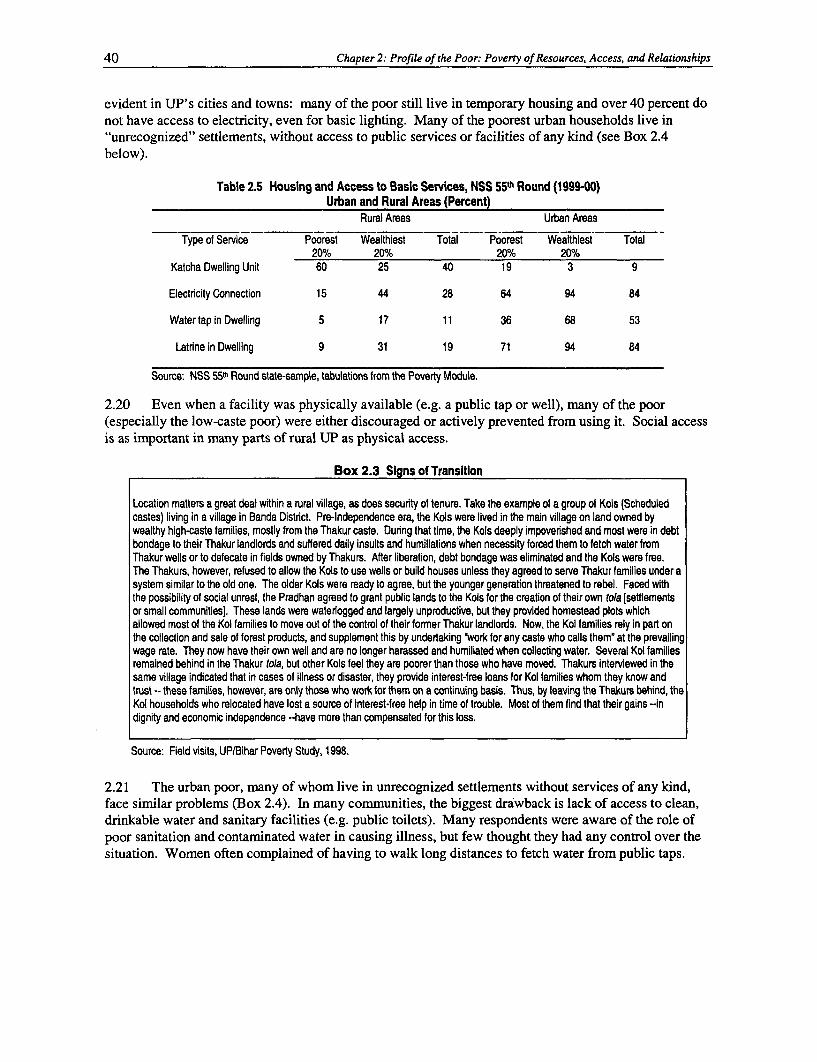
40 Chapter 2: Profile of the Poor: Poverty of Resources, Access, and Relationships
evident in UP's cities and towns: many of the poor still live in temporary housing and over 40 percent donot have access to electricity, even for basic lighting. Many of the poorest urban households live in"unrecognized" settlements, without access to public services or facilities of any kind (see Box 2.4below).
Table 2.5 Housing and Access to Basic Services, NSS 55th Round (1999-00)Urban and Rural Areas (Percent)
Rural Areas Urban Areas
Type of Service Poorest Wealthiest Total Poorest Wealthiest Total20% 20% 20% 20%
Katcha Dwelling Unit 60 25 40 19 3 9
Electrcity Connection 15 44 28 64 94 84
Water tap in Dwelling 5 17 11 36 68 53
Latrne in Dwelling 9 31 19 71 94 84
Source: NSS 55th Round state-sample, tabulations from the Poverty Module.
2.20 Even when a facility was physically available (e.g. a public tap or well), many of the poor(especially the low-caste poor) were either discouraged or actively prevented from using it. Social accessis as important in many parts of rural UP as physical access.
Box 2.3 Signs of Transition
Location matters a great deal within a rural village, as does security of tenure. Take the example of a group of Kols (Scheduledcastes) living in a village in Banda District. Pre-Independence era, the Kols were lived in the main village on land owned bywealthy high-caste families, mostly from the Thakur caste. During that time, the Kols deeply impoverished and most were in debtbondage to their Thakur landlords and suffered daily insults and humiliations when necessity forced them to fetch water fromThakur wells or to defecate in fields owned by Thakurs. After liberation, debt bondage was eliminated and the Kols were free.The Thakurs, however, refused to allow the Kols to use wells or build houses unless they agreed to serve Thakur families under asystem similar to the old one. The older Kols were ready to agree, but the younger generation threatened to rebel. Faced withthe possibility of social unrest, the Pradhan agreed to grant public lands to the Kols for the creation of their own tola [settlementsor small communities]. These lands were waterlogged and largely unproductive, but they provided homestead plots whichallowed most of the Kol families to move out of the control of their former Thakur landlords. Now, the Kol families rely in part onthe collection and sale of forest products, and supplement this by undertaking 'work for any caste who calls them" at the prevailingwage rate. They now have their own well and are no longer harassed and humiliated when collecting water. Several Kol familiesremained behind in the Thakur tola, but other Kols feel they are poorer than those who have moved. Thakurs interviewed in thesame village indicated that in cases of illness or disaster, they provide interest-free loans for Kol families whom they know andtrust -- these families, however, are only those who work for them on a continuing basis. Thus, by leaving the Thakurs behind, theKol households who relocated have lost a source of interest-free help in time of trouble. Most of them find that their gains --indignity and economic independence --have more than compensated for this loss.
Source: Field visits, UP/Bihar Poverty Study, 1998.
2.21 The urban poor, many of whom live in unrecognized settlements without services of any kind,face similar problems (Box 2.4). In many communities, the biggest drawback is lack of access to clean,drinkable water and sanitary facilities (e.g. public toilets). Many respondents were aware of the role ofpoor sanitation and contaminated water in causing illness, but few thought they had any control over thesituation. Women often complained of having to walk long distances to fetch water from public taps.
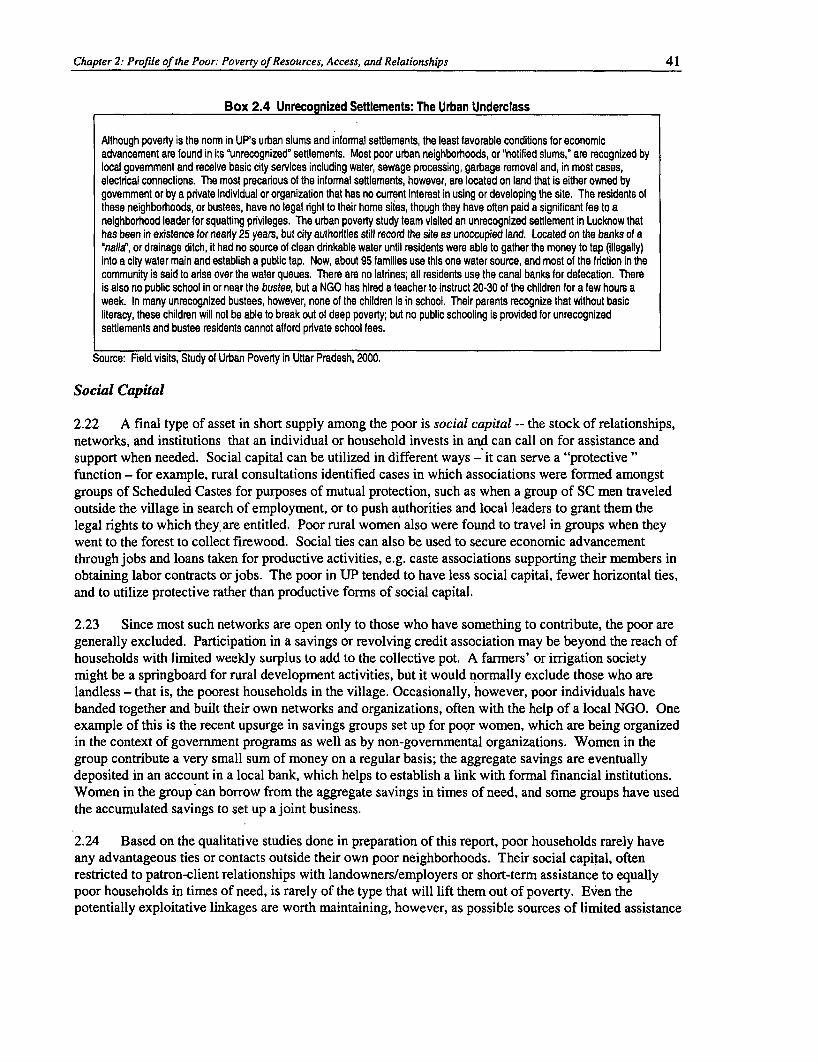
Chapter 2: Profile of the Poor: Poverty of Resources, Access, and Relationships 41
Box 2.4 Unrecognized Settlements: The Urban Underclass
Although poverty is the norm in UP's urban slums and informal settlements, the least favorable conditions for economicadvancement are found in its 'unrecognized" settlements. Most poor urban neighborhoods, or "notified slums," are recognized bylocal govemment and receive basic city services including water, sewage processing, garbage removal and, in most cases,electrical connections. The most precarious of the informal settlements, however, are located on land that is either owned bygovemment or by a private individual or organization that has no current interest in using or developing the site. The residents ofthese neighborhoods, or bustees, have no legal right to their home sites, though they have often paid a significant fee to aneighborhood leader for squatting privileges. The urban poverty study team visited an unrecognized settlement in Lucknow thathas been in existence for nearly 25 years, but city authorities still record the site as unoccupied land. Located on the banks of a'nalla", or drainage ditch, it had no source of clean drinkable water until residents were able to gather the money to tap (illegally)into a city water main and establish a public tap. Now, about 95 families use this one water source, and most of the friction in thecommunity is said to arise over the water queues. There are no latrines; all residents use the canal banks for defecation. Thereis also no public school in or near the bustee, but a NGO has hired a teacher to instruct 20-30 of the children for a few hours aweek. In many unrecognized bustees, however, none of the children is in school. Their parents recognize that without basicliteracy, these children will not be able to break out of deep poverty; but no public schooling is provided for unrecognizedsettlements and bustee residents cannot afford private school fees.
Source: Field visits, Study of Urban Poverty in Uttar Pradesh, 2000.
Social Capital
2.22 A final type of asset in short supply among the poor is social capital -- the stock of relationships,networks, and institutions that an individual or household invests in and can call on for assistance andsupport when needed. Social capital can be utilized in different ways - it can serve a "protective"function - for example, rural consultations identified cases in which associations were formed amongstgroups of Scheduled Castes for purposes of mutual protection, such as when a group of SC men traveledoutside the village in search of employment, or to push authorities and local leaders to grant them thelegal rights to which they. are entitled. Poor rural women also were found to travel in groups when theywent to the forest to collect firewood. Social ties can also be used to secure economic advancementthrough jobs and loans taken for productive activities, e.g. caste associations supporting their members inobtaining labor contracts or jobs. The poor in UP tended to have less social capital, fewer horizontal ties,and to utilize protective rather than productive forms of social capital.
2.23 Since most such networks are open only to those who have something to contribute, the poor aregenerally excluded. Participation in a savings or revolving credit association may be beyond the reach ofhouseholds with limited weekly surplus to add to the collective pot. A farmers' or irrigation societymight be a springboard for rural development activities, but it would normally exclude those who arelandless - that is, the poorest households in the village. Occasionally, however, poor individuals havebanded together and built their own networks and organizations, often with the help of a local NGO. Oneexample of this is the recent upsurge in savings groups set up for poor women, which are being organizedin the context of government programs as well as by non-governmental organizations. Women in thegroup contribute a very small sum of money on a regular basis; the aggregate savings are eventuallydeposited in an account in a local bank, which helps to establish a link with formal financial institutions.Women in the group can borrow from the aggregate savings in times of need, and some groups have usedthe accumulated savings to set up a joint business.
2.24 Based on the qualitative studies done in preparation of this report, poor households rarely haveany advantageous ties or contacts outside their own poor neighborhoods. Their social capital, oftenrestricted to patron-client relationships with landowners/employers or short-term assistance to equallypoor households in times of need, is rarely of the type that will lift them out of poverty. Even thepotentially exploitative linkages are worth maintaining, however, as possible sources of limited assistance
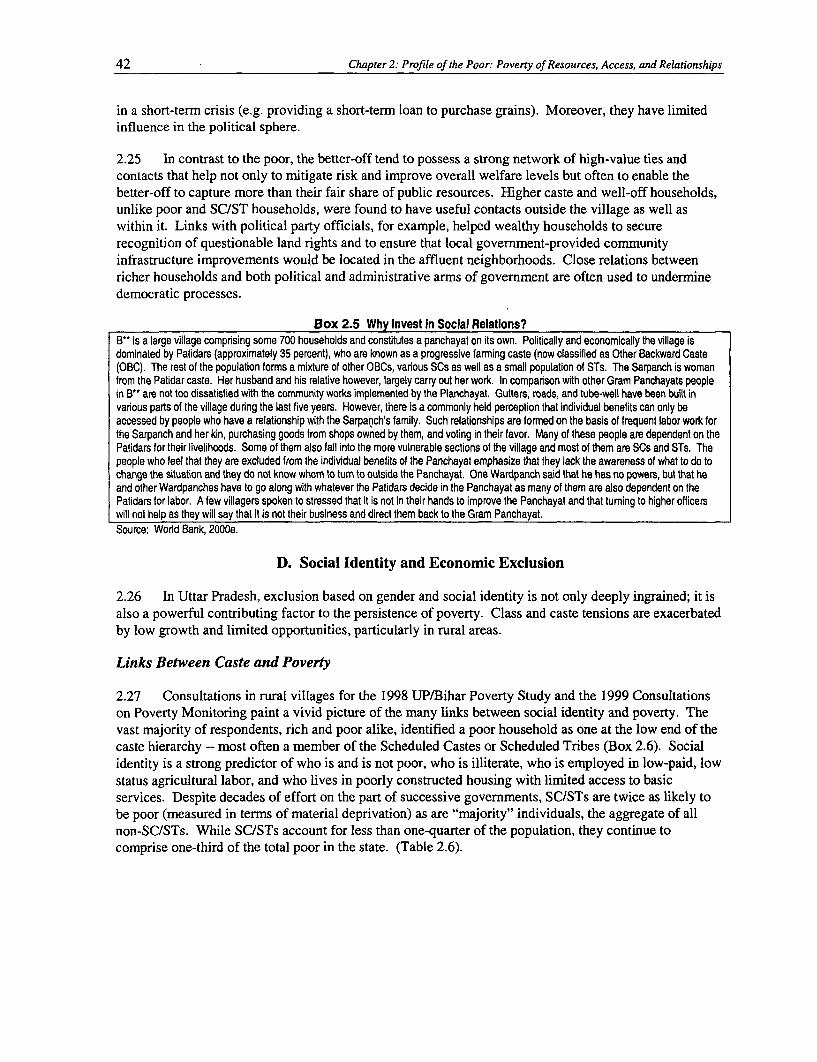
42 Chapter 2: Profile of the Poor: Poverty of Resources, Access, and Relationships
in a short-term crisis (e.g. providing a short-term loan to purchase grains). Moreover, they have limitedinfluence in the political sphere.
2.25 In contrast to the poor, the better-off tend to possess a strong network of high-value ties andcontacts that help not only to mitigate risk and improve overall welfare levels but often to enable the
better-off to capture more than their fair share of public resources. Higher caste and well-off households,unlike poor and SC/ST households, were found to have useful contacts outside the village as well as
within it. Links with political party officials, for example, helped wealthy households to secure
recognition of questionable land rights and to ensure that local government-provided community
infrastructure improvements would be located in the affluent neighborhoods. Close relations between
richer households and both political and administrative armns of government are often used to undermine
democratic processes.
Box 2.5 Why Invest in Social Relations?B13 is a large village comprsing some 700 households and constitutes a panchayat on its own. Politically and economically the village isdominated by Patidars (approximately 35 percent), who are known as a progressive farming caste (now classified as Other Backward Caste(OBC). The rest of the population forms a mixture of other OBCs, varous SCs as well as a small population of STs. The Sarpanch is womanfrom the Patidar caste. Her husband and his relative however, largely carry out her work. In companson with other Gram Panchayats peoplein B* are not too dissatisfied with the community works implemented by the Planchayat. Gutters, roads, and tube-well have been built invarous parts of the village durng the last five years. However, there is a commonly held perception that individual benefits can only beaccessed by people who have a relationship with the Sarpanch's family. Such relationships are formed on the basis of frequent labor work forthe Sarpanch and her kin, purchasing goods from shops owned by them, and voting in their favor. Many of these people are dependent on thePatidars for their livelihoods. Some of them also fall into the more vulnerable sections of the village and most of them are SCs and STs. Thepeople who feel that they are excluded from the individual benefits of the Panchayat emphasize that they lack the awareness of what to do tochange the situation and they do not know whom to tum to outside the Panchayat. One Wardpanch said that he has no powers, but that heand other Wardpanches have to go along with whatever the Patidars decide in the Panchayat as many of them are also dependent on thePatidars for labor. A few villagers spoken to stressed that it is not in their hands to improve the Panchayat and that tuming to higher officerswill not help as they will say that it is not their business and direct them back to the Gram Panchayat.Source: Wodd Bank, 2000e.
D. Social Identity and Economic Exclusion
2.26 In Uttar Pradesh, exclusion based on gender and social identity is not only deeply ingrained; it is
also a powerful contributing factor to the persistence of poverty. Class and caste tensions are exacerbated
by low growth and limited opportunities, particularly in rural areas.
Links Between Caste and Poverty
2.27 Consultations in rural villages for the 1998 UP/Bihar Poverty Study and the 1999 Consultations
on Poverty Monitoring paint a vivid picture of the many links between social identity and poverty. The
vast majority of respondents, rich and poor alike, identified a poor household as one at the low end of the
caste hierarchy -- most often a member of the Scheduled Castes or Scheduled Tribes (Box 2.6). Social
identity is a strong predictor of who is and is not poor, who is illiterate, who is employed in low-paid, low
status agricultural labor, and who lives in poorly constructed housing with limited access to basic
services. Despite decades of effort on the part of successive governments, SC/STs are twice as likely tobe poor (measured in terms of material deprivation) as are "majority" individuals, the aggregate of allnon-SC/STs. While SC/STs account for less than one-quarter of the population, they continue tocomprise one-third of the total poor in the state. (Table 2.6).
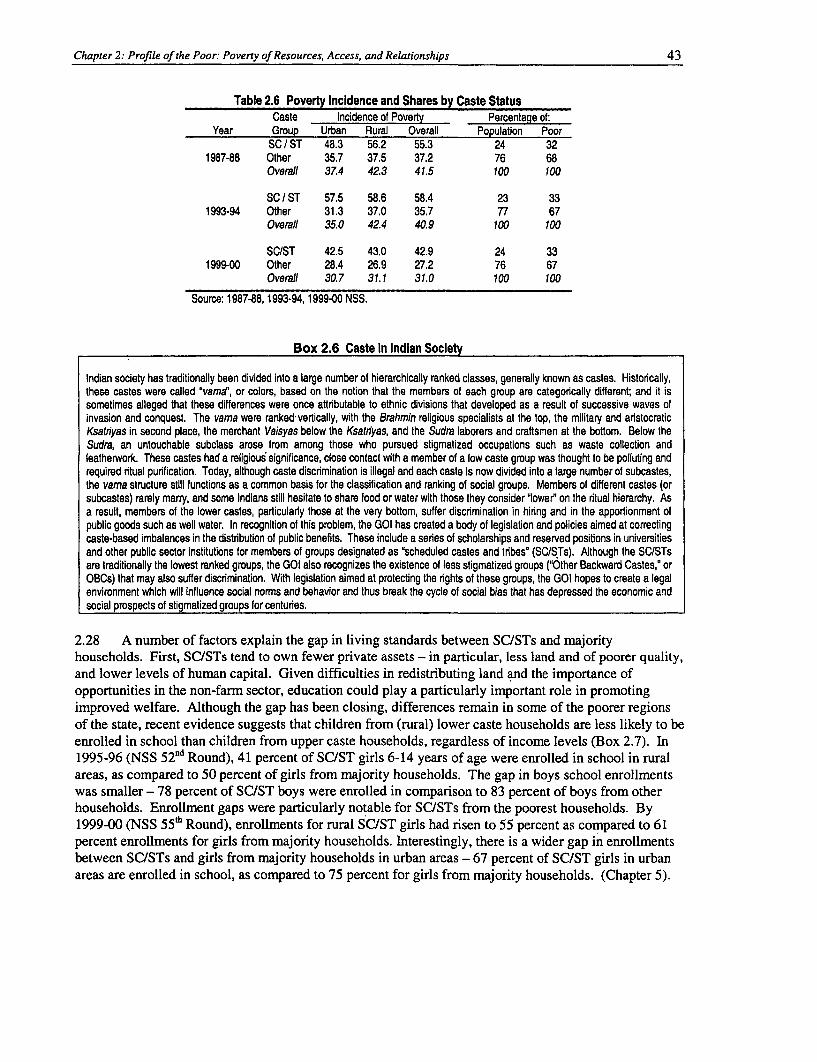
Chapter 2: Profile of the Poor: Poverty of Resources, Access, and Relationships 43
Table 2.6 Poverty Incidence and Shares by Caste StatusCaste Incidence of Poverty Percentage of:
Year Group Urban Rural Overall Population PoorSC /ST 48.3 56.2 55.3 24 32
1987-88 Other 35.7 37.5 37.2 76 68Overall 37.4 42.3 41.5 100 100
SC / ST 57.5 58.6 58.4 23 331993-94 Other 31.3 37.0 35.7 77 67
Overall 35.0 42.4 40.9 100 100
SC/ST 42.5 43.0 42.9 24 331999-00 Other 28.4 26.9 27.2 76 67
Overall 30.7 31.1 31.0 100 100
Source: 1987-88,1993-94,1999-00 NSS.
Box 2.6 Caste In Indian Soclety
Indian society has traditionally been divided into a large number of hierarchically ranked classes, generally known as castes. Historically,these castes were called 'vama', or colors, based on the notion that the members of each group are categorically different; and it issometimes alleged that these differences were once attributable to ethnic divisions that developed as a result of successive waves ofinvasion and conquest. The vama were ranked vertically, with the Brahmin religious specialists at the top, the military and aristocraticKsathyas in second place, the merchant Vaisyas below the Ksatryas, and the Sudra laborers and craftsmen at the bottom. Below theSudra, an untouchable subclass arose from among those who pursued stigmatized occupations such as waste collection andleatherwork. These castes had a religious significance, close contact with a member of a low caste group was thought to be polluting andrequired ritual purification. Today, although caste discrimination is illegal and each caste is now divided into a large number of subcastes,the vama structure still functions as a common basis for the classification and ranking of social groups. Members of different castes (orsubcastes) rarely marry, and some Indians still hesitate to share food or water with those they consider 'lower' on the ritual hierarchy. Asa result, members of the lower castes, particularly those at the very bottom, suffer discrimination in hiring and in the apportionment ofpublic goods such as well water. In recognition of this problem, the GOI has created a body of legislation and policies aimed at correctingcaste-based imbalances in the distribution of public benefits. These include a series of scholarships and reserved positions in universitiesand other public sector institutions for members of groups designated as 'scheduled castes and tribes' (SC/STs). Although the SC/STsare traditionally the lowest ranked groups, the GOI also recognizes the existence of less stigmatized groups ('Other Backward Castes,' orOBCs) that may also suffer discrimination. With legislation aimed at protecting the rights of these groups, the GOI hopes to create a legalenvironment which will influence social norms and behavior and thus break the cycle of social bias that has depressed the economic andsocial prospects of stigmatized groups for centuries.
2.28 A number of factors explain the gap in living standards between SC/STs and majorityhouseholds. First, SC/STs tend to own fewer private assets - in particular, less land and of poorer quality,
and lower levels of human capital. Given difficulties in redistributing land and the importance of
opportunities in the non-farm sector, education could play a particularly important role in promotingimproved welfare. Although the gap has been closing, differences remain in some of the poorer regions
of the state, recent evidence suggests that children from (rural) lower caste households are less likely to be
enrolled in school than children from upper caste households, regardless of income levels (Box 2.7). In1995-96 (NSS 52 nd Round), 41 percent of SC/ST girls 6-14 years of age were enrolled in school in rural
areas, as compared to 50 percent of girls from majority households. The gap in boys school enrollments
was smaller - 78 percent of SC/ST boys were enrolled in comparison to 83 percent of boys from otherhouseholds. Enrollment gaps were particularly notable for SC/STs from the poorest households. By1999-00 (NSS 55" Round), enrollments for rural SC/ST girls had risen to 55 percent as compared to 61
percent enrollments for girls from majority households. Interestingly, there is a wider gap in enrollments
between SC/STs and girls from majority households in urban areas - 67 percent of SC/ST girls in urban
areas are enrolled in school, as compared to 75 percent for girls from majority households. (Chapter 5).
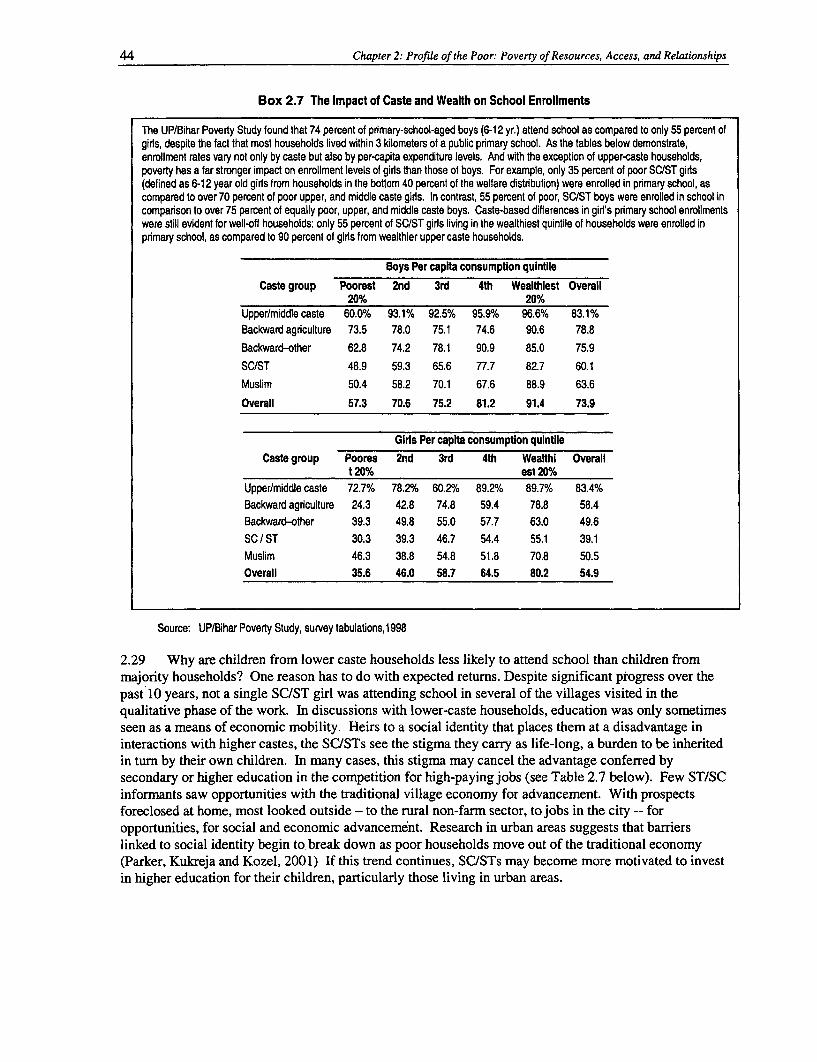
44 Chapter 2: Profile of the Poor: Poverty of Resources, Access, and Relationships
Box 2.7 The Impact of Caste and Wealth on School Enrollments
The UP/Bihar Poverty Study found that 74 percent of primary-school-aged boys (6-12 yr.) attend school as compared to only 55 percent ofgirls, despite the fact that most households lived within 3 kilometers of a public primary school. As the tables below demonstrate,enrollment rates vary not only by caste but also by per-capita expenditure levels. And with the exception of upper-caste households,poverty has a far stronger impact on enrollment levels of girls than those of boys. For example, only 35 percent of poor SC/ST girls(defined as 6-12 year old girls from households in the bottom 40 percent of the welfare distribution) were enrolled in primary school, ascompared to over 70 percent of poor upper, and middle caste girls. In contrast, 55 percent of poor, SC/ST boys were enrolled in school incomparison to over 75 percent of equally poor, upper, and middle caste boys. Caste-based differences in girls primary school enrollmentswere still evident for well-off households: only 55 percent of SC/ST girls living in the wealthiest quintile of households were enrolled inprimary school, as compared to 90 percent of girls from wealthier upper caste households.
Boys Per capita consumpton quintile
Caste group Poorest 2nd 3rd 4th Wealthiest Overall20% 20%
Upper/middle caste 60.0% 93.1% 92.5% 95.9% 96.6% 83.1%
Backward agriculture 73.5 78.0 75.1 74.6 90.6 78.8
Backward-other 62.8 74.2 78.1 90.9 85.0 75:9
SC/ST 48.9 59.3 65.6 77.7 82.7 60.1
Muslim 50.4 58.2 70.1 67.6 88.9 63.6
Overall 57.3 70.6 75.2 81.2 91.4 73.9
Girls Per capita consumpUon qulntile
Caste group Poores 2nd 3rd 4th Wealthi Overallt 20% est 20%
Upper/middle caste 72.7% 78.2% 60.2% 89.2% 89.7% 83.4%
Backward agriculture 24.3 42.8 74.8 59.4 78.8 58.4
Backward-other 39.3 49.8 55.0 57.7 63.0 49.6
SC / ST 30.3 39.3 46.7 54.4 55.1 39.1
Muslim 46.3 38.8 54.8 51.8 70.8 50.5
Overall 35.6 46.0 58.7 64.5 80.2 54.9
Source: UP/Bihar Poverty Study, survey tabulations,1998
2.29 Why are children from lower caste households less likely to attend school than children frommajority households? One reason has to do with expected returns. Despite significant progress over thepast 10 years, not a single SC/ST girl was attending school in several of the villages visited in thequalitative phase of the work. In discussions with lower-caste households, education was only sometimesseen as a means of economic mobility. Heirs to a social identity that places them at a disadvantage ininteractions with higher castes, the SCISTs see the stigma they carry as life-long, a burden to be inheritedin turn by their own children. In many cases, this stigma may cancel the advantage conferred bysecondary or higher education in the competition for high-paying jobs (see Table 2.7 below). Few ST/SCinformants saw opportunities with the traditional village economy for advancement. With prospectsforeclosed at home, most looked outside - to the rural non-farm sector, to jobs in the city -- foropportunities, for social and economic advancement. Research in urban areas suggests that barrierslinked to social identity begin to break down as poor households move out of the traditional economy(Parker, Kukreja and Kozel, 2001) If this trend continues, SC/STs may become more motivated to investin higher education for their children, particularly those living in urban areas.
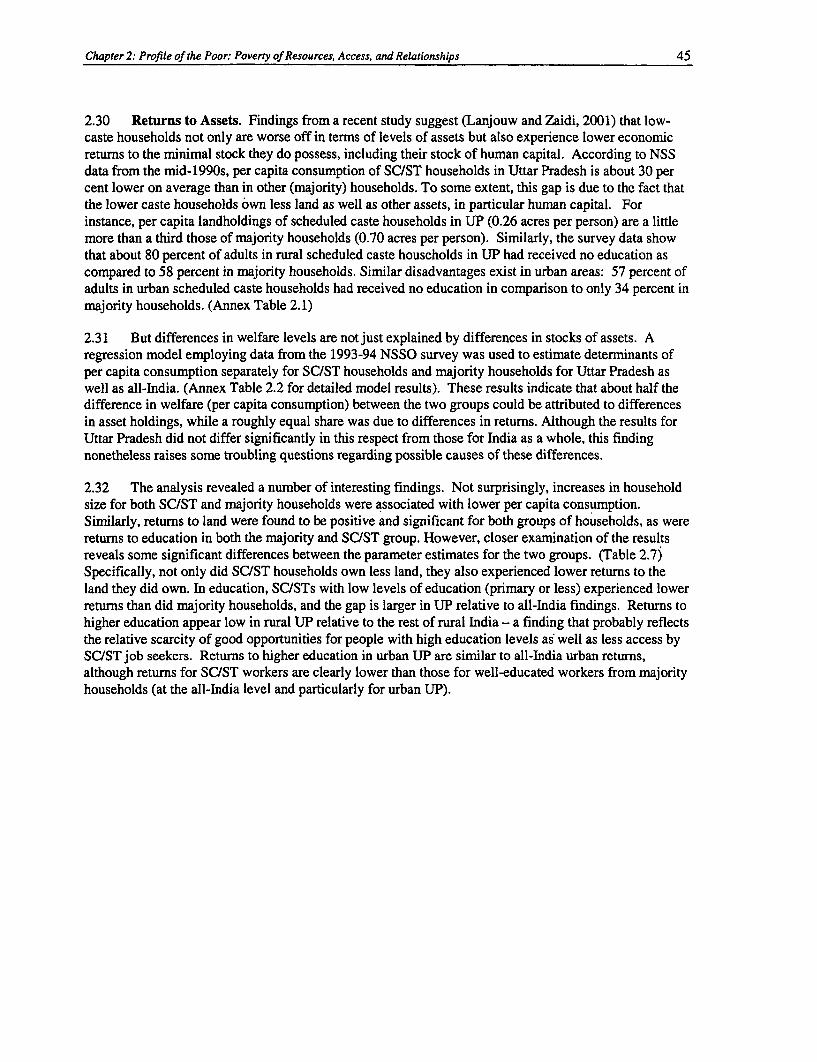
Chapter 2: Profile of the Poor: Poverty of Resources, Access, and Relationships 45
2.30 Returns to Assets. Findings from a recent study suggest (Lanjouw and Zaidi, 2001) that low-caste households not only are worse off in terms of levels of assets but also experience lower economicreturns to the minimal stock they do possess, including their stock of human capital. According to NSSdata from the mid-1990s, per capita consumption of SC/ST households in Uttar Pradesh is about 30 percent lower on average than in other (majority) households. To some extent, this gap is due to the fact thatthe lower caste households own less land as well as other assets, in particular human capital. Forinstance, per capita landholdings of scheduled caste households in UP (0.26 acres per person) are a littlemore than a third those of majority households (0.70 acres per person). Similarly, the survey data showthat about 80 percent of adults in rural scheduled caste households in UP had received no education ascompared to 58 percent in majority households. Similar disadvantages exist in urban areas: 57 percent ofadults in urban scheduled caste households had received no education in comparison to only 34 percent inmajority households. (Annex Table 2.1)
2.31 But differences in welfare levels are not just explained by differences in stocks of assets. Aregression model employing data from the 1993-94 NSSO survey was used to estimate determinants ofper capita consumption separately for SC/ST households and majority households for Uttar Pradesh aswell as all-India. (Annex Table 2.2 for detailed model results). These results indicate that about half thedifference in welfare (per capita consumption) between the two groups could be attributed to differencesin asset holdings, while a roughly equal share was due to differences in returns. Although the results forUttar Pradesh did not differ significantly in this respect from those for India as a whole, this findingnonetheless raises some troubling questions regarding possible causes of these differences.
2.32 The analysis revealed a number of interesting findings. Not surprisingly, increases in householdsize for both SC/ST and majority households were associated with lower per capita consumption.Similarly, returns to land were found to be positive and significant for both groups of households, as werereturns to education in both the majority and SC/ST group. However, closer examination of the resultsreveals some significant differences between the parameter estimates for the two groups. (Table 2.7jSpecifically, not only did SC/ST households own less land, they also experienced lower retums to theland they did own. In education, SC/STs with low levels of education (primary or less) experienced lowerreturns than did majority households, and the gap is larger in UP relative to all-India findings. Returns tohigher education appear low in rural UP relative to the rest of rural India - a finding that probably reflectsthe relative scarcity of good opportunities for people with high education levels as well as less access bySC/ST job seekers. Returns to higher education in urban UP are similar to all-India urban returns,although retums for SC/ST workers are clearly lower than those for well-educated workers from majorityhouseholds (at the all-India level and particularly for urban UP).
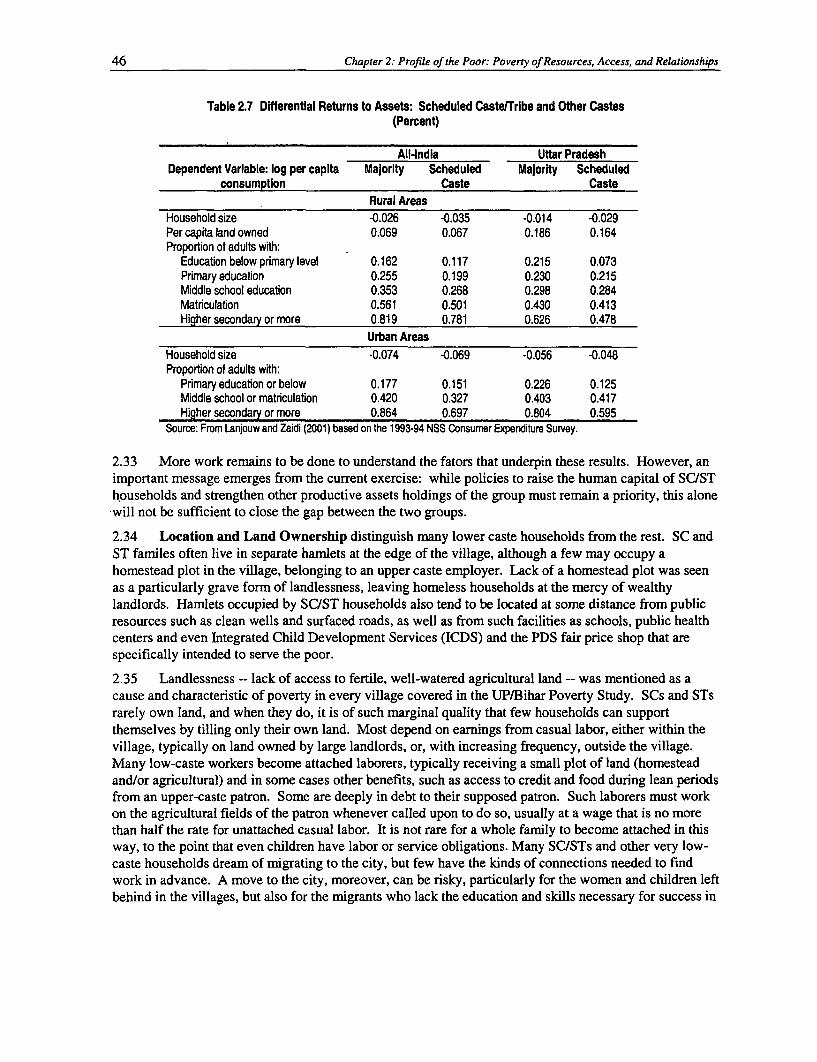
46 Chapter 2: Profile of the Poor: Poverty of Resources, Access, and Relationships
Table 2.7 Differential Returns to Assets: Scheduled Caste/Tribe and Other Castes(Percent)
All-India Uttar PradeshDependent Variable: log per capita Majority Scheduled Majority Scheduled
consumption Caste CasteRural Areas
Household size -0.026 -0.035 -0.014 -0.029Per capita land owned 0.069 0.067 0.186 0.164Proportion of adults with:
Education below primary level 0.162 0.117 0.215 0.073Primary education 0.255 0.199 0.230 0.215Middle school education 0.353 0.268 0.298 0.284Matrculation 0.561 0.501 0.430 0.413Higher secondary or more 0.819 0.781 0.626 0.478
Urban AreasHousehold size -0.074 -0.069 -0.056 -0.048Proportion of adults with:
Primary education or below 0.177 0.151 0.226 0.125Middle school or matriculation 0.420 0.327 0.403 0.417Higher secondary or more 0.864 0.697 0.804 0.595
Source: From Lanjouw and Zaidi (2001) based on the 1993-94 NSS Consumer Expenditure Survey.
2.33 More work remains to be done to understand the fators that underpin these results. However, animportant message emerges from the current exercise: while policies to raise the human capital of SC/SThouseholds and strengthen other productive assets holdings of the group must remain a priority, this alonewill not be sufficient to close the gap between the two groups.
2.34 Location and Land Ownership distinguish many lower caste households from the rest. SC andST familes often live in separate hamlets at the edge of the village, although a few may occupy ahomestead plot in the village, belonging to an upper caste employer. Lack of a homestead plot was seenas a particularly grave form of landlessness, leaving homeless households at the mercy of wealthylandlords. Hamlets occupied by SC/ST households also tend to be located at some distance from publicresources such as clean wells and surfaced roads, as well as from such facilities as schools, public healthcenters and even Integrated Child Development Services (ICDS) and the PDS fair price shop that arespecifically intended to serve the poor.
2.35 Landlessness -- lack of access to fertile, well-watered agricultural land -- was mentioned as acause and characteristic of poverty in every village covered in the UP/Bihar Poverty Study. SCs and STsrarely own land, and when they do, it is of such marginal quality that few households can supportthemselves by tilling only their own land. Most depend on earnings from casual labor, either within thevillage, typically on land owned by large landlords, or, with increasing frequency, outside the village.Many low-caste workers become attached laborers, typically receiving a small plot of land (homesteadand/or agricultural) and in some cases other benefits, such as access to credit and food during lean periodsfrom an upper-caste patron. Some are deeply in debt to their supposed patron. Such laborers must workon the agricultural fields of the patron whenever called upon to do so, usually at a wage that is no morethan half the rate for unattached casual labor. It is not rare for a whole family to become attached in thisway, to the point that even children have labor or service obligations. Many SC/STs and other very low-caste households dream of migrating to the city, but few have the kinds of connections needed to findwork in advance. A move to the city, moreover, can be risky, particularly for the women and children leftbehind in the villages, but also for the migrants who lack the education and skills necessary for success in

Chapter 2: Profile of the Poor: Poverty of Resources, Access, and Relationships 47
an urban setting. Earlier analysis showed that poverty rates among illiterates are higher in the city thanthe countryside (Chapter 1).
2.36 Employment Individuals from low-caste households also work disproportionately in low-paid,low-status jobs -- as agricultural laborers or low-skill laborers in the non-agriculture sector. Along withfemale workers, they form the mainstay of the agricultural labor force. And poor women from low-castehouseholds are invariably trapped in the lowest paid and least desirable kinds of work. Although thetraditional occupations associated with India's various castes and sub-castes generally do not determinethe livelihood of individuals in today's labor market, nevertheless members of lower caste groups are stillclustered in less desirable and lower paid activities (Box 2.8). Except in the case of agriculture labor,where all workers earn equally low wages, SC/STs earn less on average than do individuals from uppercastes in all other occupations in rural areas. Other Backward Castes (OBCs) and Muslims face similaralthough not as extreme earnings differentials (Srivastava, 2000).
Box 2.8 Patterns of Employment In Rural UP - Poverty and Caste
Unlike the NSS, the survey done for the UP/Bihar Poverty Study provides detailed information on time spent by varous householdmembers in income eaming activities. Based on this information, the poorest households were found to depend heavily on eaming fromcasual labor in both the farm and non-farm sectors. Few have salaried employment. Time spent on own-farm activities increases steadilywith income levels, the best oft among rural households combine eamings from salaried employment with farming.
Distribution of _ Per capita consumption quintile_..Employment Days 1" 2nd 3rd 4th 5th Overall
Self-emp: farming 14.6 27.8 30.5 37.4 49.9 33.4Self-emp: non-farm 21.5 19.3 22.1 19.6 14.4 19.1Agriculture laborer 23.7 11.9 15.1 9.1 6.0 12.5Non-farm laborer 25.9 25.0 18.9 19.3 5.0 18.0Salaried employment 8.8 13.1 9.5 12.2 22.8 13.8
Very low caste households (viz. SC/STs) also were heavily represented in the agriculture sector, particularly as casual labors. And thosewho did not work as casual laborers in agriculture were likely to be working as casual laborers In non-farm activities. Few of the lowercaste households had permanent or secure jobs.
Distribution ofEmployment Days Upper Other Backward SC/ST
Self emp: farming 39.1 42.2 20.5Self-emp: non-farm 14.8 19.9 11.8Agriculture laborer 1.5 7.6 29.4Non-farm laborer 11.0 17.5 23.6Salaried employment 31.6 11.2 12.0
Total 100 100 100
Source: UP/Bihar Poverty Study, survey tabulations
Further Links -- Gender and Poverty
2.37 Gender also is linked in many ways to poverty. A disproportionate number of the very poor anddestitute are in female-headed households, and many of these women are destitute because their genderforecloses many occupations and opportunities to participate equally with men in political and economiclife. When a village woman becomes her family's chief breadwinner, she may find work in agriculture,but she is commonly paid only a half to two-thirds of the wage a man receives for performing the samework. Particularly if her parents were poor, she is unlikely to be literate or to have any qualifications for
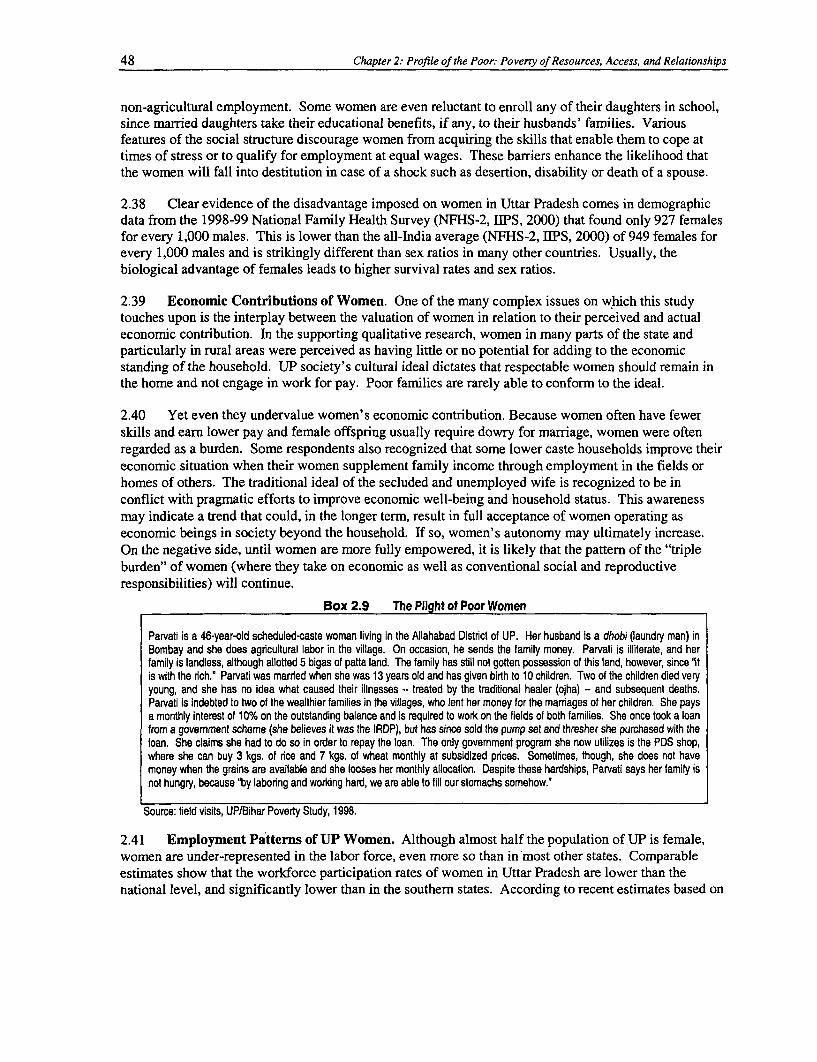
48 Chapter 2: Profile of the Poor: Poverty of Resources, Access, and Relationships
non-agricultural employment. Some women are even reluctant to enroll any of their daughters in school,since married daughters take their educational benefits, if any, to their husbands' families. Variousfeatures of the social structure discourage women from acquiring the skills that enable them to cope attimes of stress or to qualify for employment at equal wages. These barriers enhance the likelihood thatthe women will fall into destitution in case of a shock such as desertion, disability or death of a spouse.
2.38 Clear evidence of the disadvantage imposed on women in Uttar Pradesh comes in demographicdata from the 1998-99 National Family Health Survey (NFHS-2, IIPS, 2000) that found only 927 femalesfor every 1,000 males. This is lower than the all-India average (NFHS-2, IIPS, 2000) of 949 females forevery 1,000 males and is strikingly different than sex ratios in many other countries. Usually, thebiological advantage of females leads to higher survival rates and sex ratios.
2.39 Economic Contributions of Women. One of the many complex issues on which this studytouches upon is the interplay between the valuation of women in relation to their perceived and actualeconomic contribution. In the supporting qualitative research, women in many parts of the state andparticularly in rural areas were perceived as having little or no potential for adding to the economicstanding of the household. UP society's cultural ideal dictates that respectable women should remain inthe home and not engage in work for pay. Poor families are rarely able to conform to the ideal.
2.40 Yet even they undervalue women's economic contribution. Because women often have fewerskills and earn lower pay and female offspring usually require dowry for marriage, women were oftenregarded as a burden. Some respondents also recognized that some lower caste households improve theireconomic situation when their women supplement family income through employment in the fields orhomes of others. The traditional ideal of the secluded and unemployed wife is recognized to be inconflict with pragmatic efforts to improve economic well-being and household status. This awarenessmay indicate a trend that could, in the longer term, result in full acceptance of women operating aseconomic beings in society beyond the household. If so, women's autonomy may ultimately increase.On the negative side, until women are more fully empowered, it is likely that the pattern of the "tripleburden" of women (where they take on economic as well as conventional social and reproductiveresponsibilities) will continue.
Box 2.9 The Plight ot Poor Women
Parvati is a 46-year-old scheduled-caste woman living in the Allahabad District of UP. Her husband is a dhobi (laundry man) inBombay and she does agricultural labor in the village. On occasion, he sends the family money. Parvati is illiterate, and herfamily is landless, although allotted 5 bigas of patta land. The family has still not gotten possession of this land, however, since Itis with the rich.' Parvati was married when she was 13 years old and has given birth to 10 children. Two of the children died veryyoung, and she has no idea what caused their illnesses -- treated by the traditional healer (ojha) - and subsequent deaths.Parvati is indebted to two of the wealthier families in the villages, who lent her money for the marriages of her children. She paysa monthly interest of 10% on the outstanding balance and is required to work on the fields of both families. She once took a loanfrom a govemment scheme (she believes it was the IRDP), but has since sold the pump set and thresher she purchased with theloan. She claims she had to do so in order to repay the loan. The only government program she now utilizes is the PDS shop,where she can buy 3 kgs. of rice and 7 kgs. of wheat monthly at subsidized prices. Sometimes, though, she does not havemoney when the grains are available and she looses her monthly allocation. Despite these hardships, Parvati says her family isnot hungry, because 'by laboring and working hard, we are able to fill our stomachs somehow."
Source: field visits, UP/Bihar Poverty Study, 1998.
2.41 Employment Patterns of UP Women. Although almost half the population of UP is female,women are under-represented in the labor force, even more so than in most other states. Comparableestimates show that the workforce participation rates of women in Uttar Pradesh are lower than thenational level, and significantly lower than in the southern states. According to recent estimates based on
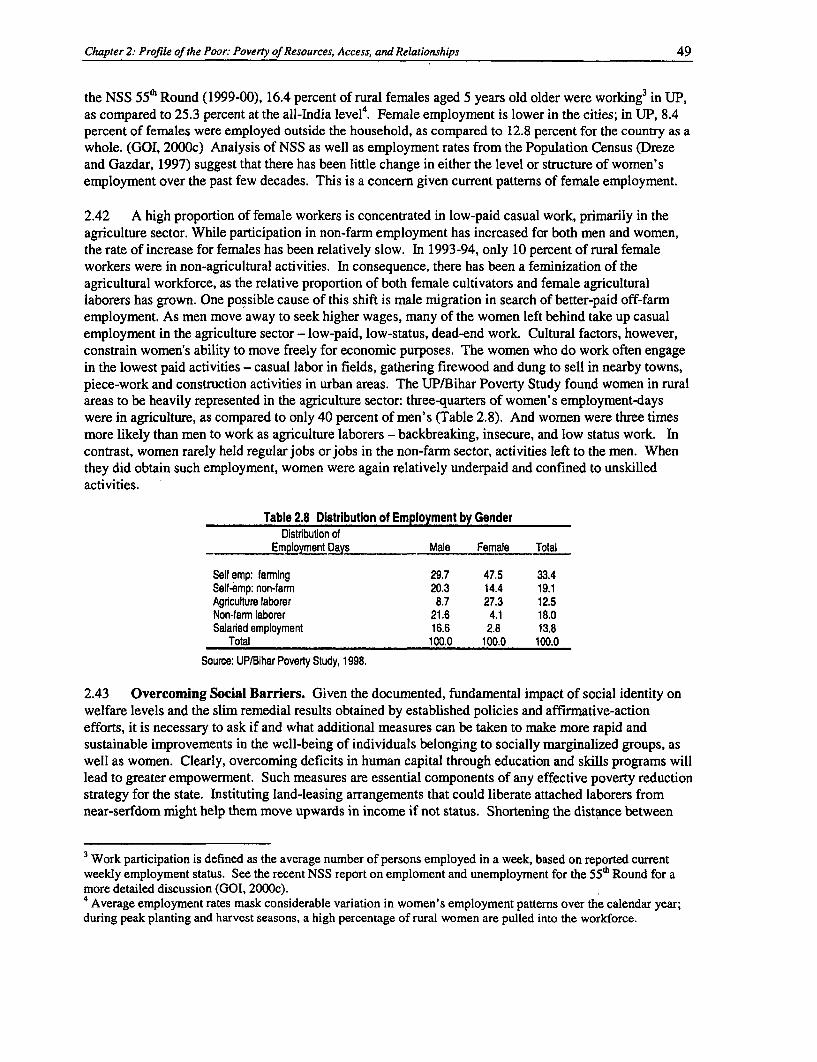
Chapter 2: Profile of the Poor: Poverty of Resources, Access, and Relationships 49
the NSS 55^ Round (1999-00), 16.4 percent of rural females aged 5 years old older were working3 in UP,as compared to 25.3 percent at the all-India level4. Female employment is lower in the cities; in UP, 8.4percent of females were employed outside the household, as compared to 12.8 percent for the country as awhole. (GOI, 2000c) Analysis of NSS as well as employment rates from the Population Census (Drezeand Gazdar, 1997) suggest that there has been little change in either the level or structure of women'semployment over the past few decades. This is a concern given current patterns of female employment.
2.42 A high proportion of female workers is concentrated in low-paid casual work, primarily in theagriculture sector. While participation in non-farm employment has increased for both men and women,the rate of increase for females has been relatively slow. In 1993-94, only 10 percent of rural femaleworkers were in non-agricultural activities. In consequence, there has been a feminization of theagricultural workforce, as the relative proportion of both female cultivators and female agriculturallaborers has grown. One possible cause of this shift is male migration in search of better-paid off-farmemployment. As men move away to seek higher wages, many of the women left behind take up casualemployment in the agriculture sector - low-paid, low-status, dead-end work. Cultural factors, however,constrain women's ability to move freely for economic purposes. The women who do work often engagein the lowest paid activities - casual labor in fields, gathering firewood and dung to sell in nearby towns,piece-work and construction activities in urban areas. The UP/Bihar Poverty Study found women in ruralareas to be heavily represented in the agriculture sector: three-quarters of women's employment-dayswere in agriculture, as compared to only 40 percent of men's (Table 2.8). And women were three timesmore likely than men to work as agriculture laborers - backbreaking, insecure, and low status work. Incontrast, women rarely held regular jobs or jobs in the non-farm sector, activities left to the men. Whenthey did obtain such employment, women were again relatively underpaid and confined to unskilledactivities.
Table 2.8 Distribution of Employment by GenderDistrbution of
Employment Days Male Female Total
Self emp: farming 29.7 47.5 33.4Self-emp: non-farm 20.3 14.4 19.1Agnculture laborer 8.7 27.3 12.5Non-farm laborer 21.6 4.1 18.0Salared employment 16.6 2.8 13.8
Total 100.0 100.0 100.0
Source: UP/Bihar Poverty Study, 1998.
2.43 Overcoming Social Barriers. Given the documented, fundamental impact of social identity onwelfare levels and the slim remedial results obtained by established policies and affirmative-actionefforts, it is necessary to ask if and what additional measures can be taken to make more rapid andsustainable improvements in the well-being of individuals belonging to socially marginalized groups, aswell as women. Clearly, overcoming deficits in human capital through education and skills programs willlead to greater empowerment. Such measures are essential components of any effective poverty reductionstrategy for the state. Instituting land-leasing arrangements that could liberate attached laborers fromnear-serfdom might help them move upwards in income if not status. Shortening the distance between
3 Work participation is defined as the average number of persons employed in a week, based on reported currentweekly employment status. See the recent NSS report on emploment and unemployment for the 55k" Round for amore detailed discussion (GOI, 2000c).4 Average employment rates mask considerable variation in women's employment patterns over the calendar year;during peak planting and harvest seasons, a high percentage of rural women are pulled into the workforce.
50 Chapter 2: Profile of the Poor: Poverty of Resources, Access, and Relationships
the habitations of low-caste villagers and a range of public facilities - water, schools, health care etc. -could improve access to and use of key anti-poverty interventions. These and other suggestions arediscussed at greater length in Chapters 4 and 5. Given the characteristic voicelessness of the poor and thelow-caste poor in particular, the leadership of Uttar Pradesh must find new means of helping thedisadvantaged to be heard and of mobilizing society to act on their concerns.
Welfare and Child Labor
2.44 Child labor has attracted a great deal of attention, both in the Indian literature and from the widerdevelopment community. Children comprise a large and vulnerable section of Indian society; in UP, anestimated 40 percent of the population are less than 15 years old. Discussions of child labor are markedby problems of definition and measurement, although statistics generally refer to the number of childrenaged 5-14 years of age working outside the domestic sphere, but including those who work in family-owned enterprises. According to the 1991 Census of India, more than 11 million children were workingin India, generally thought to be a conservative estimate. Among Indian states, UP accounts for thehighest number of working children - more than 1.4 million (3.8 percent of the age group) with anadditional 370,000 seeking or available for work.
2.45 Participation in the labor force compromises the welfare of children in numerous ways. Mostnotably, it cripples their future earning potential by preventing them from acquiring the education assetsthat open access to higher paying jobs. In addition, long hours and poor conditions can damage the healthand physical growth potential of a child. Of particular concern are the high numbers of children workingin more hazardous industries - e.g. tannery and leather works in Agra, the bidi industry in Amroha,Moradabad, and Gursahaigang, pottery and ceramic industries in Khruja, glass works in Ferozabad, andcarpet weaving in Varanasi, Mirzapur, and Badohi. Based on a survey of child labor in hazardousindustries in 1997, GOUP estimates that 200,000-250,000 are working in hazardous occupations in whichchildren's employment is prohibited by law, many of them, moreover, as bonded laborers.
2.46 Although children work for many reasons, poverty is clearly an important motivator. Childrenalso work for reasons linked to labor demand, discrimination and poor enforcement of laws. In somecases, children are withdrawn from school in response to shocks to income or families may be forced toput their children to work. But empirical work suggests (Bhatty, 1998, for a summary of the literature)that children enrolled in school do not work appreciably fewer hours (including domestic work) thanchildren not enrolled in school. Research undertaken as background to this report suggests that childlabor is disproportionately high among the poorest as well as low-caste households (Kriesel, 1999). Forexample, in the UP/Bihar Study districts, 7.3 percent of children aged 10-13 years reported working.5 Ofthese, forty-six percent were engaged in casual activities and 34 percent worked on the family farm. Thelikelihood of working fell sharply with levels of income - 13 percent of children from the poorest 20percent of households reported working, as compared to only 3 percent of children from the wealthiest 20percent of households. Children from SC/ST households were much more likely to be working (13percent) than those from upper and middle caste households (3 percent.)
2.47 The participatory study on urban poverty in UP suggests that child labor is more pervasive inurban areas, where many more employment opportunities are available outside the household.Withdrawing children from school is a common pattern among the poor. Many disadvantaged parentsfeel they can better prepare their children to earn an adequate income by ensuring that they learn a usefulskill such as carpentry, painting, bicycle repair etc. - either at home or in a workshop apprenticeship.
5 Includes working outside the household as well as in a family business or on agriculture lands operated by thehousehold.
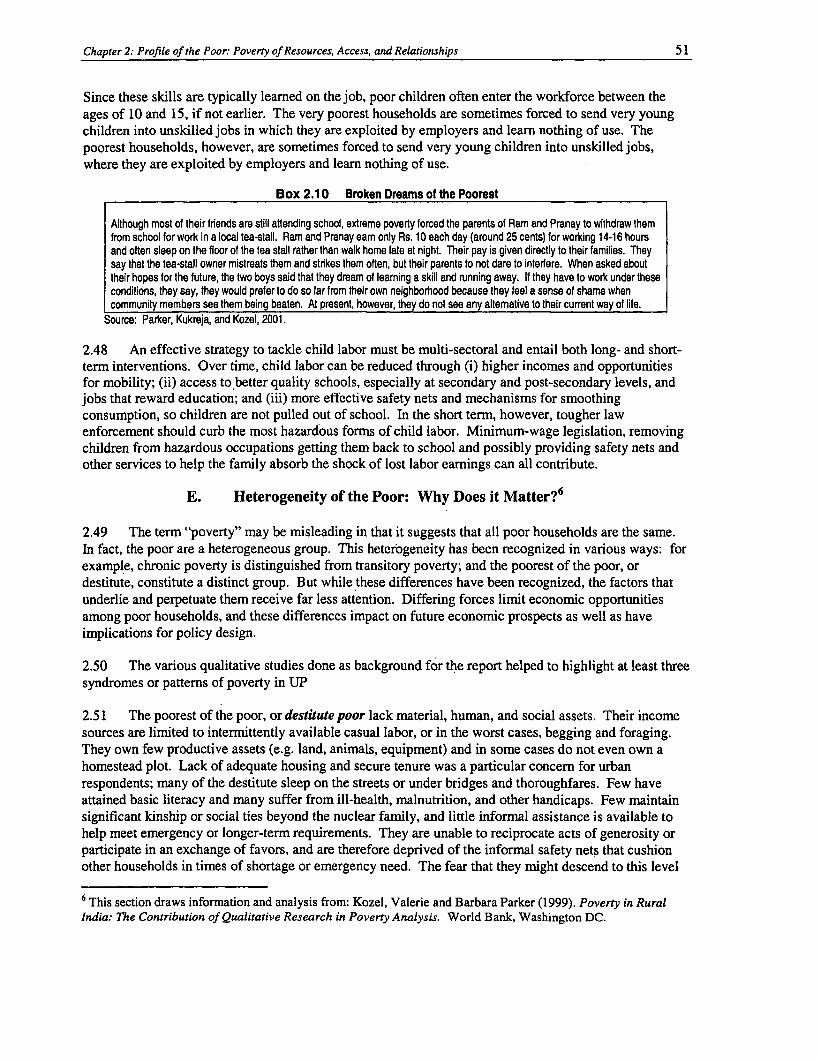
Chapter 2: Profile of the Poor: Poverty of Resources, Access, and Relationships 51
Since these skills are typically learned on the job, poor children often enter the workforce between theages of 10 and 15, if not earlier. The very poorest households are sometimes forced to send very youngchildren into unskilled jobs in which they are exploited by employers and learn nothing of use. Thepoorest households, however, are sometimes forced to send very young children into unskilled jobs,where they are exploited by employers and learn nothing of use.
Box 2.10 Broken Dreams of the Poorest
Although most of their friends are still attending school, extreme poverty forced the parents of Ram and Pranay to withdraw themfrom schoolforwork in alocal tea-stall. Ram and Pranayeam only Rs. 10 eachday (around 25 cents) forworking 14-16 hoursand often sleep on the floor of the tea stall rather than walk home late at night. Their pay is given directly to their families. Theysay that the tea-stall owner mistreats them and strikes them often, but their parents to not dare to interfere. When asked abouttheir hopes for the future, the two boys said that they dream of leaming a skill and running away. If they have to work under theseconditions, they say, they would prefer to do so far from their own neighborhood because they feel a sense of shame whencommunity members see them being beaten. At present, however, they do not see any altemative to their current way of life.
Source: Parker, Kukreja, and Kozel, 2001.
2.48 An effective strategy to tackle child labor must be multi-sectoral and entail both long- and short-term interventions. Over time, child labor can be reduced through (i) higher incomes and opportunitiesfor mobility; (ii) access to better quality schools, especially at secondary and post-secondary levels, andjobs that reward education; and (iii) more effective safety nets and mechanisms for smoothingconsumption, so children are not pulled out of school. In the short term, however, tougher lawenforcement should curb the most hazardous forms of child labor. Minimum-wage legislation, removingchildren from hazardous occupations getting them back to school and possibly providing safety nets andother services to help the family absorb the shock of lost labor earnings can all contribute.
E. Heterogeneity of the Poor: Why Does it Matter?6
2.49 The term "poverty" may be misleading in that it suggests that all poor households are the same.In fact, the poor are a heterogeneous group. This heterogeneity has been recognized in various ways: forexample, chronic poverty is distinguished from transitory poverty; and the poorest of the poor, ordestitute, constitute a distinct group. But while these differences have been recognized, the factors thatunderlie and perpetuate them receive far less attention. Differing forces limit economic opportunitiesamong poor households, and these differences impact on future economic prospects as well as haveimplications for policy design.
2.50 The various qualitative studies done as background for the report helped to highlight at least threesyndromes or patterns of poverty in UP
2.51 The poorest of the poor, or destitute poor lack material, human, and social assets. Their incomesources are limited to intermittently available casual labor, or in the worst cases, begging and foraging.They own few productive assets (e.g. land, animals, equipment) and in some cases do not even own ahomestead plot. Lack of adequate housing and secure tenure was a particular concern for urbanrespondents; many of the destitute sleep on the streets or under bridges and thoroughfares. Few haveattained basic literacy and many suffer from ill-health, malnutrition, and other handicaps. Few maintainsignificant kinship or social ties beyond the nuclear family, and little informal assistance is available tohelp meet emergency or longer-term requirements. They are unable to reciprocate acts of generosity orparticipate in an exchange of favors, and are therefore deprived of the informal safety nets that cushionother households in times of shortage or emergency need. The fear that they might descend to this level
6 This section draws information and analysis from: Kozel, Valerie and Barbara Parker (1999). Poverty in RuralIndia: The Contribution of Qualitative Research in Poverty Analysis. World Bank, Washington DC.

52 Chapter 2: Profile of the Poor: Poverty of Resources, Access, and Relationships
of destitution is an important component of the vulnerability experienced by other poor households; itleads to risk adverse behavior.
2.52 Destitution is often linked to idiosyncratic shocks, in the form of the loss, desertion or incapacityof a breadwinner, a persistent and expensive illness in the family, mental illness or alcoholism. Systemicshocks such as droughts or floods also may be catastrophic for those without savings or safely nets. Insome cases, economic drains such as the dowry requirements attendant upon the marriage of daughterswere said to have driven a household into destitution. Since the poor have little in the way of savings orsaleable assets to provide a cushion, shocks may permanently destroy their resource base. If the family isforced into chronic debt or debt servitude, their ability to recover is likewise damaged. A large proportionof destitute households may thus be described as downwardly mobile, in that their economic well-beinghas deteriorated from previous levels as a result of misfortune or poor management. Their poverty isunlikely to be transitory, however, because the "traps" of destitution (such as the sale of assets andchronic indebtedness) prevent them from taking advantage of future opportunities. Self-support is thus nomore than a distant dream for the majority of the destitute poor.
2.53 Other very poor households were found to have maintained a basic equilibrium over long periods,even over generations. Of these households, informants said "what can be said of them other than thatthey are poor?" Many support themselves through casual agricultural labor, and few own significantassets beyond a household plot (if that). Literacy and school enrollments are low, and they tend to occupytemporary kacha housing with little access to clean water or sanitary facilities.
2.54 Social identity is a strong predictor of who exhibits these characteristics. Members of the lowestcastes and scheduled tribes often rely on low-pay, low status forms of employment, and, as discussedabove, they are less likely than upper caste households to obtain the training and education needed toboost them or their children out of poverty. In many rural villages, SC/STs reside in separate hamilets atthe edge of the village, and they are denied access to community infrastructure (especially clean water)and other common property resources shared by members of middle and upper castes. Access to well-watered and fertile lands is constrained by the fact that their hamlets tend to be located in marginal areasmore prone to flooding or salinity. In urban areas, lower caste households frequently live in unregisteredslums or shantytowns with no schools, water, transport or jobs. These disadvantages are multiple andmutually reinforcing, and many SC and ST households remain caught in a perpetual web of poverty.
2.55 The poor who are characterized by a stigmatized social identity may be described, for lack of abetter term, as the stigmatizedpoor. They are vulnerable to downward mobility, and many members ofstigmatized social or ethnic groups are also destitute. With few prospects for advancement, the best hopefor most is to maintain a steady state in which they do not descend into destitution, but retain the basicrequirements of survival, self-support, and human decency.
2.56 Not all poor households face such low expectations. Although technically low-income and livingunder housing and sanitary conditions little better than their neighbors, some poor households wereupwardly mobile. They were typically free of long-term debt and many possessed a small stock ofpotentially productive assets (such as dairy cattle, other livestock or a small amount of arable land). Theirincome sources were more diversified (e.g. from non-farm employment as well as agriculture) and manyhad members working in urban centers. Moreover, literacy was the norm and their children were morelikely to be enrolled in school. Caste still mattered, although relatively less in the urban environment;many of them were members of middle-to-lower caste groups (Other Backward Castes, OBCs) ratherthan SC/STs. Their relative advantage over other families in the same caste and income group was oftenattributed to having more than one earning member and relatively few dependents. These households,who may be termed the mobile poor, demonstrate the potential for accumulating surplus resources,
Chapter 2: Profile of the Poor: Poverty of Resources, Access, and Relationships 53
investing in productive enterprises, and, in the absence of unexpected shocks, eventually climbing out ofpoverty.
2.57 These categories overlap to some extent, and specific households may partake of thecharacteristics of more than one type. This should not obscure the important fact that various types ofpoor households - the poorest, the poor and the less poor - face differing sets of circumstances in terms ofthe barriers and possibilities they encounter; and that some households are doubly disadvantaged by socialand structural constraints. Household economic strategies will vary in consequence. Some householdsare able to strive for continuous, if gradual, economic improvement while others are preoccupied with thethreat of further impoverishment and destitution. Still others, already destitute, are too busy securing theday's basic consumption requirements to even imagine long-term strategies for economic betterment.
2.58 The implications for policy are clear. Needs are different, as are barriers and opportunities forupward mobility. Policies and programs designed to redress poverty must reflect these differences; astrategy for reducing poverty that fails to take account of this diversity in needs and constraints will surelyfail. For example, those hovering on the brink on destitution are likely to be risk-aversive while otherswho possess a small surplus may be willing to invest this surplus in productive (albeit risky) activities.Micro-credit is often seen as an important means to reduce poverty. Certainly the "less poor," whopossess at least minimal assets and are debt-free, are well-positioned to benefit from a micro-creditprogram. They are also more likely to use a micro-loan to invest in a productive enterprise than are thosewho are destitute and already laboring under a burden of debt. Destitute households are likely to utilizemicro-loans for emergency consumption purposes, thereby increasing their indebtedness. The poorest ofthe poor and destitute may receive greater benefit from safety-net programs such as food subsidies orfood-for-work initiatives. On the other hand, a destitute woman struggling to raise young children maynot be in a position to take up work under a rural employment scheme; her time is too limited, her needstoo basic. Moreover, for those whose poverty is reinforced and supported by social stigmatization, anti-discrimination legislation and other social interventions may be an unavoidable recourse if real change isto be achieved
The Challenges
2.59 The larger policy challenges for poverty reduction in Uttar Pradesh are of three kinds.
2.60 First, there is the challenge of developing a wider array of economic opportunities that will assistthe poor in their struggle to escape poverty and deprivation. By fostering a dynamic and growingeconomy, UP can create an environment conducive to the creation of jobs in many sectors and at alllevels. The state's poverty levels have fallen during periods of rapid growth and stagnated in periods ofslow growth. Recovering the growth momentum demonstrated in the 1960s and 1970s, therefore, is acritical concern if UP is to see significant progress in reducing poverty.
2.61 However, many of the poor are ill-equipped to take advantage of new employment opportunities,either because they lack job skills or because they are ill, disabled or elderly. Expansion of jobopportunities in high-tech sectors, for example, will be of little benefit to households unable to affordinvestments in education; and reforms in the agricultural sector will favor those with agricultural land.Even expansion of the industrial sector may bypass those workers whose deprivations include a paucity ofskills and education. A recent study of urban poverty in UP found although secondary growth thatbenefits unskilled workers is expected to develop in the vicinity of large factories, many modern factoriesare self-sufficient and isolated from the local economy. These factories may provide opportunities for jobseekers who are literate and skilled, but they employ few, if any, unskilled workers. Providing the
54 Chapter 2: Profile of the Poor: Poverty of Resources, Access, and Relationships
enabling factors - such as high-quality education and health care - that will permit a broader spectrum ofthe potential work force to participate in the fruits of accelerated growth is the second challenge faced byUP policy and decision makers.
2.62 Even if these challenges are met, there will always be a subset of the poor who are eithertemporarily or permanently unable to participate in the growth process. These individuals might includethe permanently disabled, single mothers of small children, the mentally ill, or simply those who havesuffered a series of shocks and setbacks that may have overwhelmed their coping capacity. The third andfinal challenge for UP, therefore, is to provide a more effective set of public safety nets that can protectthe most vulnerable from the impact of shocks and misfortunes.
Chapter 3
GOVERNANCE AND POVERTY REDUCTIONIN UTTAR PRADESH
A. Introduction
3.1 The most effective way to improve the way that government works for the poor is to improve theway govemment works. The Govemment of Uttar Pradesh serves India's largest state, and one of itspoorest. UP's development challenges loom large; the state administration has been slow to respond andthere has been a continuing decline in overall effectiveness.
3.2 The first part of this chapter explores what went wrong, focusing on the political and bureaucraticdynamics that have undercut good administrative practices and created systemic problems in howdelivery systems work. The constraint is rarely lack of funds, but instead a failure in management of thesesystems. The chapter then considers the impact that this failure has had on the poor. A number ofimportant service delivery failures in areas such as health, education, and safety nets are covered insubsequent chapters; thus this chapter pays particular attention to problems of justice and legal redress. Itconcludes by identifying some of the recent reforms that have sought to reverse this decline and ensurethat UP's public sector plays its proper part in realizing the ambitious agenda that India's foundersenvisioned.
B. The Failure of Public Services in UP
3.3 During the colonial period and the years immediately after independence, UP enjoyed a relativelyefficient administration. The state's civil service compiled an impressive record in the implementation ofland reforms, national extension and community development projects and programs, and districtplanning, among others. Unfortunately, this legacy has eroded in recent years. This deterioration isexemplified by the UP lrrigation Department's decline from a viable enterprise, listed on the LondonStock Exchange, to its current state (Box 3.1).
Box 3.1 Case Study: The Decline of the UP Irrigation Department
The Uttar Pradesh Irrigation Department Is one of the oldest and largest Govemment Departments within the State Govemment of UttarPradesh. It was once a proud Institution, not only making a full cost recovery but listed on the London Stock Exchange. It has sincefallen into decline.
This reflects the cumulative impact of a number of factors. First, there has been systematic under-pficing of water for certain majorclasses of user, including farmers. This has resulted in over-use of a scarce resource and has undermined the financial viability of thesector. Second, there has been gross overstaffing In the Department, with the salardes bill of the Deparment becoming an unsustainableburden and further undermining the viability of the Department. Third, the combination of under-pricing of water and the spiralingsalaries bill has left little money for investment in new Infrastructure, or for operation and maintenance expenditure, and what little therehas been has been poorly managed. Fourth, there has been systemic corruption and non-payment throughout the system, with non-payment partly a response to the poor service delivered to many customers.
A govemment strategy for the UP water sector has been developed based on an analysis of the current situation and a vision of a futureUP water sector that is cost effective, focused on the needs of the customers and sustainable in financial, social, and environmentalterms. The challenge now is to work out the implications for the UP Irrigation Department, as part of the process of implementing thisvision.
Source: World Bank staff assessment.
56 Chapter 3: Governance and Poverty Reduction in Uttar Pradesh
3.4 The reasons for this decline are complex and operate on multiple levels. There are four ofparticular importance: (1) the increasing politicization of administration, which has severely erodedstability of tenure and undercut managerial authority; (2) the fragmentation of the administrativeapparatus in the 1960s and 1970s, which has lead to a proliferation of senior positions and complicatedthe task of policy and administrative coordination; (3) a related growth in the number of civil servants,which-in light of weak revenue mobilization-has placed a squeeze upon the capital budget, andoperations and maintenance expenditures, and led to a growth in the wage bill that was unmatched by anyconcomitant growth in productivity; and (4) the failure due to poor expenditure management practices, toobtain maximum value for money from remaining resources.
Politicization of the Administration
3.5 There are three major political realities that fundamentally shape the exercise of political power inUttar Pradesh. The first is its size. At 160 million, it is the largest and politically the most importantstate within India. UP sends the largest number of representatives to the Lok Sabha or lower house ofParliament-85 members, or 16 percent of the total. Several Indian prime ministers, including the currentone, Atal Bihari Vajpayee are from UP. A large number of historic temples, mausoleums and sacredrivers can be found in the state, and it also contains dangerous flashpoints-such as the temple atAyodhya-that are deeply symbolic of broader Indian political hopes and fears. For all of these reasons,political developments in UP will always be of national significance.
3.6 Second, UP's political landscape is highly fragmented. Historically, the state has been at thecrossroads of India and witnessed frequent invasions and mass immigrations, resulting in a populace thatis highly diverse ethnically, religiously, and socially. UP did not exist as an integrated political entityprior to the British Raj, where it was first the North Western Provinces of Agra and Avadh andsubsequently renamed the United Provinces of Agra and Avadh in 1902, eventually shortened to theUnited Provinces in 1937. It did not receive its present name, Uttar Pradesh, until two and half years afterindependence. Even today, political allegiances and affiliations tend to run either to the national or locallevel or to be framed along tribal or ethnic lines, and there is no provincial name equivalent to Bengalis,Punjabis, etc., to identify the state's inhabitants.
3.7 This social fragmentation has strong manifestations in the political sphere. In the wake of theloosening of the Congress Party's grip upon power in the 1980s, UP has experienced chronic politicalupheaval and no fewer than eight separate Chief Minister tenures interspersed with periods of home rulefrom New Delhi. Following elections in February, 2002, UP's assembly contains 13 different parties and12 independents, with a tri-polar balance existing between the BJP (88 MLAs, with an additional 25 seatsheld by MLA allies), the Samajwadi Party (143 MLAs) and the Bahujan Samaj Party (98 MLSs). TheCongress Party holds only 25 seats and independents and others account for an additional 24 seats. Nosingle, broad-based party has arisen to dominate the political horizon within UP, with the result being thatfractious coalition politics has typically been the rule of the day.
3.8 The third important factor is the emerging role of caste in shaping UP's political landscape.Lower castes are becoming organized politically and voting in increasing numbers. As manyknowledgeable observers have noted, while India's founders had dreamed half a century ago of a castelesssociety, caste has proven a resilient force. Paradoxically, this hierarchical, hereditary system that hasoppressed the lower orders of society has also become an organizing principal that the marginalizedthemselves have seized on to forge their own political identity and to seek electoral power. This has beenparticularly pronounced in the rise of the Bahujan Samaj Party (Hindi for "Majority Society Party") orBSP, which has appealed primarily to the dalits or former "untouchables". Founded in 1984, the partyhas recently received support from as much as 20 percent of the electorate, including many of the middle
Chapter 3: Governance and Poverty Reduction in Uttar Pradesh 57
classes. But the role of caste is more subtle and pervasive, as a number of political parties have craftedtheir agendas-often successfully-to appeal to larger numbers of Scheduled Castes (SC), ScheduledTribes (ST), Other Backward Castes (OBC), women, and Muslim voters. Sub-castes within variousparties have not always agreed, and some have threatened or actually defected to parties perceived to bemore responsive to their concerns.
3.9 The result is a complicated m6lange of political maneuvering, in which short-term tacticalalliances are common and the defection of a few key coalition partners can bring down a government.Unlike West Bengal and Kerala, the left has never been able to gain a significant foothold in UP.Considerations of personality and patronage are more important than ideology, and politics is typicallymore about the division of the fruits of power rather than conflicting policy prescriptions and divergentviews about the optimal organization of society.
3.10 Political instability has been accompanied with the breakdown of political and administrativeboundaries. Frequent oscillations in political leadership have had a disruptive impact upon the state'sadministrative structures, for each new government has been followed by a period of consolidation andrealignment, in which new political leaders sought to reward friends, punish enemies, repay campaigndebts, and transfer supporters into positions of authority. Rather than focusing on defining policyobjectives and taking key strategic decisions, politicians in UP have increasingly intervened in day-to-daymanagement decisions (particularly those involving personnel), which in most countries are left foradministrators. In particular, there has been a rapid transfer of civil servants in top positions, resulting inpolicy instability and administrative discontinuity. According to one study, the tenure of districtmagistrates during the period 1972 to 1996 in U.P. varied from 12 to 18 months in 37 districts, 18 to 24months in 13 districts, 6 to 12 months in 11 districts, and less than six months in 6 districts. The tenure ofdivisional commissioners was 10 months on average, and secretaries to government about 10 months.The problem of transfers has become so serious that one senior GOUP official recently quipped to thepress, "the only thing which moves in UP is an officer."
3.11 Although a serious problem, political interference in senior transfers and postings is a particularlythorny issue to resolve. Under the Indian Constitution, the power to appoint civil servants is vestedclearly with political leadership and then delegated to senior administrative staff. Transfers are one of thefew tools that politicians have for ensuring the responsiveness of the administrative branch. However,excessive recourse to this instrument has had a corrosive effect upon staff morale and a debilitatingimpact upon managerial authority. In 1997, the High Court of Uttar Pradesh passed strictures against thestate government prohibiting mass transfers and directing the GOUP to issue objective guidelines fortransfer and ensure their enforcement by independent boards. This was appealed by the state governmentand the matter is currently pending before the Supreme Court. While particularly acute in UP, thisproblem is also present in other Indian states, and the Ninth Plan raises it as an important issue to beaddressed.
Administrative Fragmentation
3.12 The second fundamental problem with UP's administration relates to the expansion of posts andfragmentation of departments. One of the most important tasks that governments face is that oforganizing themselves to provide effective services for all of their citizens, particularly the mostvulnerable. Below is a brief overview of how the GoUP is structured to provide services to its citizens(Box 3.2). Formally, the arrangements are fairly straight-forward. Overall policy advice is centered in theCouncil of Ministers and the Secretariat. Budgets, policies, and major personnel decisions are all madeby the Department Secretariat in Lucknow. Responsibility for the delivery of different services lies with
58 Chapter 3: Governance and Poverty Reduction in Uttar Pradesh
the respective departments, many of which have field formations at the divisional, district, and(occasionally) tehsil level. Coordination at these various levels is the responsibility of the DivisionalCommissioner, the District Magistrate/Collector, and the Sub-Divisional Magistrate respectively. Inaddition to coordinating the work of various line departments, Divisional Commissioners and DistrictCollectors also have significant responsibility for law enforcement and revenue collection.
Box 3.2 General Overview of Government Organization in Uttar Pradesh
Under the Constitution of India, Utar Pradesh has a Governor and a bicameral Legislature. The lower house, consisting of 426members, is called the Vidhan Sabha. Members are elected for a five year term, unless the govemment is dissolved prior to thattime. The upper house, or Vidhan Pafshad, contains 108 members who are elected or nominated for a six year term, with one-sixth retiring every other year. With the exception of spending appropriations, which are the province of the Vidhan Sabha alone,no bill can become a law unless it is passed by both houses.
The Govemor is appointed by the President of India and serves as the Head of State. All govemment orders are issued on behalfof the Govemor, though they may be issued under signatures of officials. De facto leadership is provide by the Chief Minister andCouncil of Ministers, which currently consists of 91 Ministers: 37 Ministers, 11 State Ministers (Independent Charge); and 43 StateMinisters.
The Council of Ministers is assisted by the Secretafiat, which is headed by the Chief Secretary who also serves as CabinetSecretary. There are 83 departments in the govemment. Some, such as the Department of Personnel and Appointments and theDepartment of Administrative Reforms, report directly to the Chief Secretary. But the majority report to Cabinet through theirindividual ministers.
Uttar Pradesh is divided into 19 Administrative Divisions for purposes of operational convenience. All are headed by DivisionalCommissioners, who occupies an important place within UP's administration as the main coordinating link between the Secretariatand the field. This officer is fully responsible for law and order, revenue, administration, and other matters pertaining to his or herDivision, and exercises supervision over the district officers, local bodies, and planning and development works.
Typically, each division consists of 3-6 distficts, each of which is under the administrative charge of a District Magistrate/Collector.He or she has full responsibility for maintaining law and order in the district and has extensive administrative, police, and revenuepowers. In addition, the officer is responsible for maintaining revenue records and work related to planning, development, andland reform. Nearly all departments have offices in the district, with district level departmental officers acting as Heads of Offices.There are 83 districts in the state.
The districts are further sub-divided into tehsils, blocks, and revenue villages for administrative convenience and the collection ofrevenue. The tehsil is usually a part of a district for revenue administration, and usually there are 3 to 6 tehsils per district. Theyare headed by a Sub-Divisional Magistrate, a revenue officer who performs multiple tasks of revenue collection, maintenance oflaw and order, implementation of govemment schemes and coordination. (He is the mirror image of the Distfict Magistrate at thesub-district level.) Nearly all departments mirror officers at the sub-divisional level. The block is the unit for administeringdevelopment schemes. There are anywhere from 0 to 20 blocks in a district, and they are headed by a Block DevelopmentOfficer. Every village elects its headman, or Pradhan, who is responsive to the local council, or Gram Sabha. Throughout thestate of UP, there are 356 tehsiis, 904 blocks, and 123,950 revenue villages.
Chapter 3: Governance and Poverty Reduction in Uttar Pradesh 59
3.13 The requirements of coalition politics and the pressures of accommodating a host of seniorbureaucrats in a rank-in-position (as opposed to a position classification) scheme have taken a heavy tollupon the efficiency and effectiveness of UP's public sector, particularly since the mid-1980s. Theproliferation of departments and posts has been particularly deleterious upon the efficient delivery ofgoods and services. The expansion of the UP Secretariat provides a particularly telling example, for itserves as the clearing house of State Government and in many ways sets the tone for subordinate agencies(Dhar, 2000). In 1947, there were only 42 departments and sub-departments in the UP secretariat.Today, the departments number over 72 and the sub-departments are over 150. From 1965 to 1994, thenumber of sections in the Secretariat increased by about 50 percent, and the number of supervisoryofficers increased by more than seven-fold. In 1965, each secretary supervised 1.86 section officers. Bythe mid-1990's, this ratio had reversed itself to the point in which 1.14 secretaries were overseeing everysection officer.
3.14 UP's current organizational structure bears witness to decades of political and administrativecompromises. Assignments are parceled out to maintain fractious coalitions or to provide suitablepostings for senior staff in a fashion at variance with any rationale breakdown of functions andresponsibilities. There are four Ministers for Energy, and a Minister for Medical Education and CaneDevelopment. There are four Departments of Education (Basic, Higher, Adult/Non Fonnal andSecondary). In some cases, functions such as the maintenance of rural roads are split between a variety ofdepartments. In others, many different departments are operating in areas that are similar if not identical(there are, for example, at least five departments working on various social development issues). Anumber of departments are performing functions that have long ago been taken over wholly or in part bythe private sector.
3.15 The result has been a fragmentation of accountability and authority. The division between thesecretariat and field departments has become blurred, as the secretariat has expanded into areas previouslyreserved for the line departments. Coordination has suffered, and field departments have found theiroperational freedom increasingly circumscribed. This expansion has been accompanied by a proliferationin departmental rules and regulations, further expanding government's involvement into everyday life andcomplicating efficient service delivery.
Expansion in the Civil Service
3.16 One of the most vexing yet important questions with regard to poverty reduction is the role thatthe state should play in mobilizing human resources to deliver goods and services efficiently vis-h-vis itsrole in providing employment. UP has a long tradition of viewing the state as the main engine foremployment generation. The problems with this approach are well known. An increasingly highproportion of revenues are diverted to paying salaries and pensions, leaving limited resources for capitaland operations and maintenance expenditures. (In its 1998/99 fiscal year, for example, over 90 percent ofUP's own revenues went to pay salaries and wages.) Eventually, productivity and the quality of servicedelivery declines. Large public sector unions become a potent political force, championing parochialinterests and making it difficult to streamline and rationalize operations to deliver services moreeffectively.
3.17 Yet for many poor, the service that they desire most is a government job. The reasons underlyingthis preference are not difficult to fathom. The starting salary for a Class IV employee or peon is 2,575rupees per month, vis-a-vis 1,500 for a small farmer and 1,115 per month or less for the 41 percent ofUP's population estimated to live below the poverty line. Government work is easier physically. The payis steady. The prospects for at least one or two promotions during one's career are virtually guaranteed,and the chance of being removed for non-performance is almost nil. Even a low level government
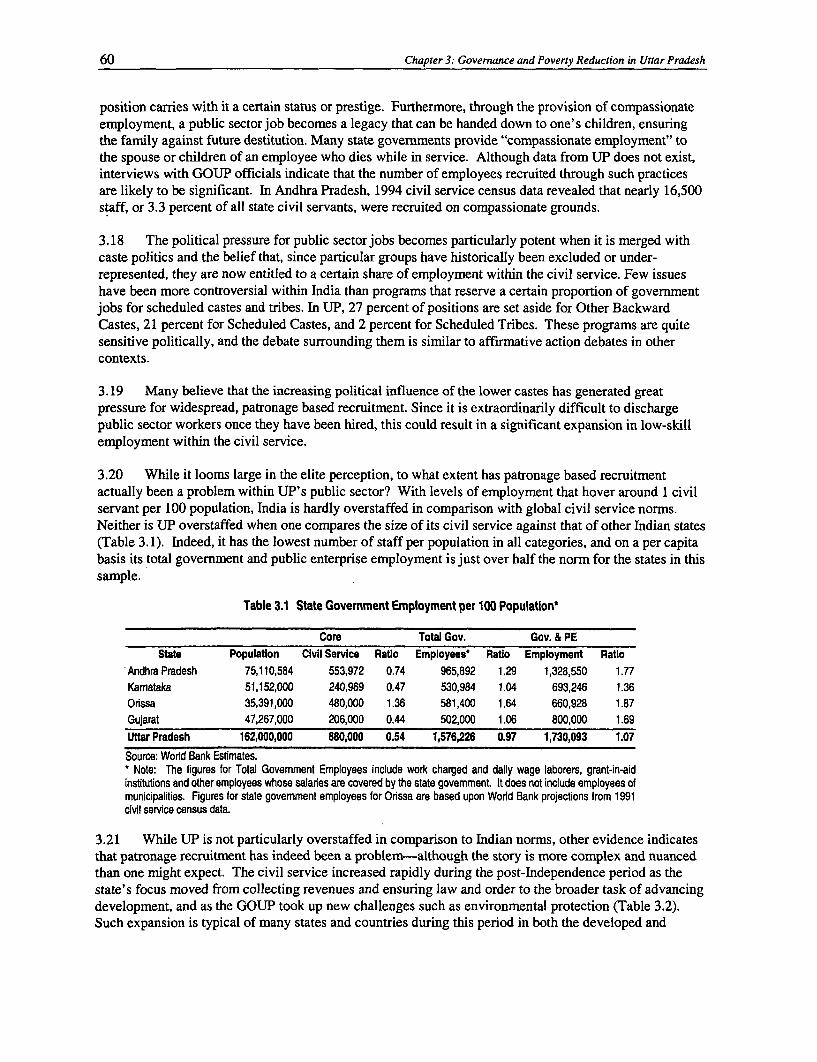
60 Chapter 3: Governance and Poverty Reduction in Uttar Pradesh
position carries with it a certain status or prestige. Furthermore, through the provision of compassionateemployment, a public sector job becomes a legacy that can be handed down to one's children, ensuringthe family against future destitution. Many state governments provide "compassionate employment" tothe spouse or children of an employee who dies while in service. Although data from UP does not exist,interviews with GOUP officials indicate that the number of employees recruited through such practicesare likely to be significant. In Andhra Pradesh, 1994 civil service census data revealed that nearly 16,500staff, or 3.3 percent of all state civil servants, were recruited on compassionate grounds.
3.18 The political pressure for public sector jobs becomes particularly potent when it is merged withcaste politics and the belief that, since particular groups have historically been excluded or under-represented, they are now entitled to a certain share of employment within the civil service. Few issueshave been more controversial within India than programs that reserve a certain proportion of governmentjobs for scheduled castes and tribes. In UP, 27 percent of positions are set aside for Other BackwardCastes, 21 percent for Scheduled Castes, and 2 percent for Scheduled Tribes. These programs are quitesensitive politically, and the debate surrounding them is similar to affirmative action debates in othercontexts.
3.19 Many believe that the increasing political influence of the lower castes has generated greatpressure for widespread, patronage based recruitment. Since it is extraordinarily difficult to dischargepublic sector workers once they have been hired, this could result in a significant expansion in low-skillemployment within the civil service.
3.20 While it looms large in the elite perception, to what extent has patronage based recruitmentactually been a problem within UP's public sector? With levels of employment that hover around 1 civilservant per 100 population, India is hardly overstaffed in comparison with global civil service norms.Neither is UP overstaffed when one compares the size of its civil service against that of other Indian states(Table 3.1). Indeed, it has the lowest number of staff per population in all categories, and on a per capitabasis its total government and public enterprise employment is just over half the norm for the states in thissample.
Table 3.1 State Govemment Employment per 100 Population*
Core Total Gov. Gov. & PEState Population Civil Service Ratio Employees* Ratio Employment Ratio
Andhra Pradesh 75,110,584 553,972 0.74 965,892 1.29 1,328,550 1.77Kamataka 51,152,000 240,969 0.47 530,984 1.04 693,246 1.36Orssa 35,391,000 480,000 1.36 581,400 1.64 660,928 1.87Gujarat 47,267,000 206,000 0.44 502,000 1.06 800,000 1.69Uttar Pradesh 162,000,000 880,000 0.54 1,576,226 0.97 1,730,093 1.07
Source: Word Bank Estimates.* Note: The figures for Total Govemment Employees include work charged and daily wage laborers, grant-in-aidinstitutions and other employees whose salaries are covered by the state government It does not include employees ofmunicipalities. Figures for state govemment employees for Orissa are based upon Worid Bank projections from 1991civil service census data.
3.21 While UP is not particularly overstaffed in comparison to Indian norms, other evidence indicatesthat patronage recruitment has indeed been a problem-although the story is more complex and nuancedthan one might expect. The civil service increased rapidly during the post-Independence period as thestate's focus moved from collecting revenues and ensuring law and order to the broader task of advancingdevelopment, and as the GOUP took up new challenges such as environmental protection (Table 3.2).Such expansion is typical of many states and countries during this period in both the developed and
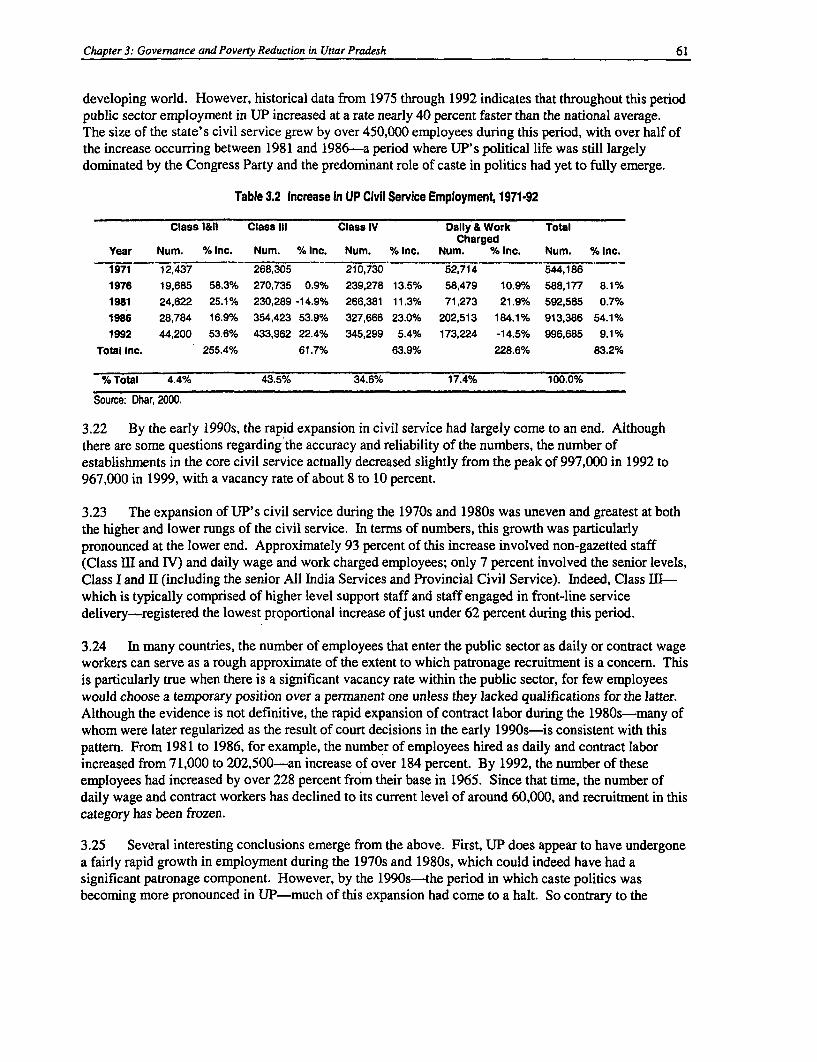
Chapter 3: Governance and Poverty Reduction in Uttar Pradesh 61
developing world. However, historical data from 1975 through 1992 indicates that throughout this periodpublic sector employment in UP increased at a rate nearly 40 percent faster than the national average.The size of the state's civil service grew by over 450,000 employees during this period, with over half ofthe increase occurring between 1981 and 1986-a period where UP's political life was still largelydominated by the Congress Party and the predominant role of caste in politics had yet to fully emerge.
Table 3.2 Increase In UP Clvil Service Employment, 1971-92
Class l&ll Class IlIl Class IV Daily & Work TotalCharged
Year Num. % Inc. Num. % Inc. Num. % Inc. Num. % Inc. Num. % Inc.
1971 12,437 268,305 210,730 52,714 544,1861976 19,685 58.3% 270,735 0.9% 239,278 13.5% 58,479 10.9% 588,177 8.1%1981 24,622 25.1% 230,289 -14.9% 266,381 11.3% 71,273 21.9% 592,565 0.7%1986 28,784 16.9% 354,423 53.9% 327,666 23.0% 202,513 184.1% 913,386 54.1%1992 44,200 53.6% 433,962 22.4% 345,299 5.4% 173,224 -14.5% 996,685 9.1%
Total Inc. 255.4% 61.7% 63.9% 228.6% 83.2%
%Total 4.4% 43.5% 34.6% 17.4% 100.0%
Source: Dhar, 2000.
3.22 By the early 1990s, the rapid expansion in civil service had largely come to an end. Althoughthere are some questions regarding the accuracy and reliability of the numbers, the number ofestablishments in the core civil service actually decreased slightly from the peak of 997,000 in 1992 to967,000 in 1999, with a vacancy rate of about 8 to 10 percent.
3.23 The expansion of UP's civil service during the 1970s and 1980s was uneven and greatest at boththe higher and lower rungs of the civil service. In terms of numbers, this growth was particularlypronounced at the lower end. Approximately 93 percent of this increase involved non-gazetted staff(Class III and IV) and daily wage and work charged employees; only 7 percent involved the senior levels,Class I and II (including the senior All India Services and Provincial Civil Service). Indeed, Class III-which is typically comprised of higher level support staff and staff engaged in front-line servicedelivery-registered the lowest proportional increase of just under 62 percent during this period.
3.24 In many countries, the number of employees that enter the public sector as daily or contract wageworkers can serve as a rough approximate of the extent to which patronage recruitment is a concern. Thisis particularly true when there is a significant vacancy rate within the public sector, for few employeeswould choose a temporary position over a pernanent one unless they lacked qualifications for the latter.Although the evidence is not definitive, the rapid expansion of contract labor during the 1980s-many ofwhom were later regularized as the result of court decisions in the early 1990s-is consistent with thispattern. From 1981 to 1986, for example, the number of employees hired as daily and contract laborincreased from 71,000 to 202,500-an increase of over 184 percent. By 1992, the number of theseemployees had increased by over 228 percent from their base in 1965. Since that time, the number ofdaily wage and contract workers has declined to its current level of around 60,000, and recruitment in thiscategory has been frozen.
3.25 Several interesting conclusions emerge from the above. First, UP does appear to have undergonea fairly rapid growth in employment during the 1970s and 1980s, which could indeed have had asignificant patronage component. However, by the 1990s-the period in which caste politics wasbecoming more pronounced in UP-much of this expansion had come to a halt. So contrary to the
62 Chapter 3: Governance and Poverty Reduction in Uuar Pradesh
popular perception, the rise in political instability and caste based politics does not coincide with the massrecruitmnent of large quantities of lower-caste employees into the civil service.
3.26 However, it has been a potent force in the transfer and posting of senior civil servants. Manyeducated SC/STs face persistent discrimination in business and are unable to establish a foothold inprofessions dominated by upper caste Hindus. For them, reservations within the public sector are theironly source of meaningful employment, and the activities of parties such as the BSP to ensure adequaterepresentation within the senior civil service are essential. Yet while such individuals have historicallysuffered discrimination, they are not among UP's poorest. Indeed, the BSP has recently experiencedsome internal conflict between its Scheduled Caste and Minority Backward Caste membership, with thelatter arguing that in some cases its poorer members were being neglected at the expense of policies thatfavored the Scheduled Castes.
Effective Use of Public Resources
3.27 In Uttar Pradesh, public spending has been far less effective at reducing poverty than it might be.First, the share of economic output taken in tax revenue has been relatively low by internationalstandards. This reflects the poor design of the tax system, poor administration, tax evasion and corruption.It also reflects the under-pricing of the outputs of many public utilities including power and irrigation.More effective resource mobilization is of critical importance in tackling poverty in UP.3.28 Furthermore, there has been mismanagement of the remaining resources. While UP's budgetprocesses are fundamentally sound, they have changed little since Independence and have failed to keeppace with developments in public expenditure management around the world. This, combined with thespiraling wage bill and the growing burden of debt interest, has contributed to a severe and growingdivergence between allocations of public spending on the one hand and the objectives of growth,development, and poverty reduction on the other (Chapter 5).
3.29 This is reflected in the proportion of public spending going to primary education and primaryhealth care, which is low compared with similar parts of the world. It is reflected in the below-averageservice standards and service outcomes in remote rural areas. It is reflected in the Public DistributionSystem (PDS), where support is not well targeted and the poorest people are often the least likely tobenefit. It is reflected in the high proportion of spending.on civil service salaries, pensions and debtinterest, and the low proportion of spending on operations and maintenance and capital which typicallyhave a greater impact on poverty reduction.
3.30 Weaknesses in public expenditure management - both budget programming and budget execution- have reduced the contribution that public spending can make to poverty reduction. Expenditureprogramming has been approached as an accounting exercise, rather than as a tool for achieving policyobjectives. The focus has been on inputs rather than outputs and outcomes, with departments asked toexplain in great detail what funds will be spent on but not asked to explain their program objectives orheld to account for delivery against performance indicators. The focus has been on efficiency rather thaneffectiveness, with departments challenged to make small cuts to existing programs rather than beingquestioned on whether the portfolio of programs is the most appropriate one for achieving policy goals.The plan to move to establish zero-based budgeting and to identify clearer performance indicators at locallevel are steps in the right direction. It is particularly important to evaluate the performance of the publicagencies in serving the needs of the poor; there is strong evidence that the needs of the poor are poorlyserved (Chapters 5 and 6).
3.31 Just as budget programming has failed to take account of policy objectives, it has failed to takeaccount of macroeconomic constraints. Budgets have historically been prepared without reference to a
Chapter 3: Governance and Poverty Reduction in Uuar Pradesh 63
medium-term fiscal framework, and with highly unrealistic assumptions about revenue receipts. Theresult of this has been management of expenditure "below the line", with capital investment andexpenditure on operations and maintenance the first items to be cut when revenues fail to materialize. Thelack of a multi-year perspective has meant that line departments have been unable to plan ahead with anydegree of certainty, and have not been able to plan for the recurrent cost implications of capitalexpenditure. The establishment of a multi-year Medium-Term Fiscal Framework and the plan to link thisto expenditure management through a medium-term expenditure framework are positive developmentsfor the state.
3.32 Budget execution has also been weak. In part, this is the inevitable consequence of poor budgetprogramming. The fact that budget plans have been based on unrealistic revenue forecasts make itinevitable that spending will be managed below the line and that supplementary budgets will benecessary. The fact that no clear objectives or performance indicators are specified makes monitoring andevaluation of outputs and outcomes impossible. As these problems are addressed, improvements tobudget execution will become possible. Expenditure control has been weak: until the practice wasterminated last year, drawing officers were able to create "Personal Ledger Accounts" in which unspentbalances were be deposited at the end of the financial year; until the computerization of the Treasuries,also last year, GOUP was not able to monitor expenditure in a timely fashion. Intemal audit has beenweak, although the appointment of a State Intemal Auditor and the allocation of responsibility for intemalaudit to the Financial Controllers in line departments are steps in the right direction.
C. The Impact of Declining Service Delivery on the Poor: the Case of Justice and LegalRedress
3.33 The deterioration in the quality of public services affects all citizens. However, the burden ofpoor governance falls disproportionately upon the poor. This burden can fall directly, in terms of greatervulnerability to predatory behavior on the part of government officials, and particularly the police; higherexposure to the costs of corruption; reduced access to goods and services, many of which are of lowerquality; the diversion of resources intended for poverty reduction to the wealthy and politically wellconnected; and a greater risk of prolonged incarceration. Or it can fall indirectly, in that the poor oftenlack the influence that will allow their interests to be reflected in public decision-making. They lack theresources that will allow them vote to with their feet and shift to private health or education providers,who themselves often provide services of poor quality. The poor are typically among the least likely toenjoy access to impartial institutions, such as the courts, who could help redress inequities. They areamong the most likely to lack information regarding the options and opportunities available to them.
3.34 Assessments of the problem of corruption indicate that it is a highly regressive tax whoseincidence falls most heavily upon the poor. Emerging research from elsewhere in India indicates that thepoor often have to work harder to get public institutions to be responsive to their concerns and enjoylower rates of success (Chapter 1). The proportion of bribes paid as a percentage of their income ishighest for urban slum dwellers, a higher proportion of whom pay bribes than general households (Sekharand Balakrishnan, 1999; Paul and Sekhar, 1999). Equally interesting is the dynamics of protest.Members of the middle and upper classes tended to pursue their protests individually, whereas most slumdwellers who complained did so in a group. These problems of inequities in the delivery of criticalservices (such as health, education, and potable water), as well as problems of access and quality, will beaddressed in greater detail in Chapter 5.
3.35 Perhaps one of the most powerful illustrations of the problems the poor can encounter involvesproblems related to public security and the right of legal redress. In India as in many countries, the policeare the most visible arm of the state, and the one that the poor are most likely to encounter in their day-to-
64 Chapter 3: Governance and Poverty Reduction in Uttar Pradesh
day lives. India's police practices are increasingly receiving international attention. This burden of poorpolicing falls disproportionately upon the poor. Amnesty International's Annual Report for 2000(Amnesty International, 2000) on India notes that the socially and economically weaker sections ofsociety continued to be particularly vulnerable to human rights abuses. The report went on to note thatattacks on dalit communities and tribal people, often with the apparent connivance of police and localauthorities, were commonplace. Women continued to be particularly vulnerable to abuse in thesecontexts. Access to justice for these victims remained problematic and those engaged in protecting therights of the most vulnerable groups also came under increasing pressure, often themselves becoming thevictims of abuses.
3.36 Anecdotal evidence abounds (including the story in Box 3.4) of cases when the police refused toinvestigate or file a charge sheet on behalf of a lower caste member who had suffered at the hands ofsomeone from the upper castes. In March 1999, the chairman of India's National Human RightsCommission stated that 60 percent of all police arrests were "unnecessary and unjustifiable," and that theincarceration of those wrongly arrested accounted for 43 percent of the total annual expenditure onprisons. Many of these are on trial for bailable offenses, but lack the wherewithal to afford it (HumanRights Reports for India, 1999).
3.37 Recent survey results from Uttar Pradesh confirm that the popular perception of the police isquite unfavorable (Aims Research Pvt Ltd., 2000). The police were ranked as the most corrupt institutionin Uttar Pradesh. About 16 percent of the survey sample claimed to have had personal interaction withthe police in the recent past, and of this figure more than three quarters claimed that they had to paybribes. A full 94 percent of respondents claimed that the police were very or fairly dishonest, and lessthan 1 percent claimed that they were honest or fairly honest.
3.38 The result of such practices is a growing alienation of the public from the departments that aresupposed to serve it. This alienation is particularly pronounced with regard to electricity utilities, aswitnessed both in survey data and the lack of public support for the recent strike. But the police are citedin second place, with about 13 percent of the population stating that in the recent past they felt a need butdid not contact the police department for reasons of corruption, inefficiency, and harassment. Had theychosen to come forward along with those who did have interaction with the department during this period,it would have represented an estimated increase in the police caseload of about 81 percent.
3.39 Turning to the courts, the judicial system is failing to provide swift and equitable resolution ofcriminal and civil disputes, and that the poor are most likely to suffer from its shortcomings. There are anumber of complex dynamics that limit the ability of the poor to receive timely legal redress. India'sjudicial back-up is reaching Herculean proportions. Nationally, some 25 million cases are pending. Byone expert's calculation, if no new actions are filed, it would take 324 years to clear the dockets(Gangopadhyay, Wadhwa, and Debroy, n.d.). The roots of these delays are pernicious and multifaceted.There is a chronic shortage of judges. India averages between 10 and 12 judges per million inhabitants,whereas many Western countries have between 5 to 10 times that number. There is an overlap ofantiquated and frequently conflicting legislation. In as many as 60 percent of the cases, a givengovernment entity is the major litigate as either plaintiff, defendant, appellant, or respondent, with thebulk of this legislation falling in the areas of taxation, credit, rent control, urban land ceiling, and laborrelations. Civil code procedures are antiquated and time consuming, and alternative forms of disputesettlement are in their nascent stages.
3.40 It is unlikely that efforts to redress the problems of insufficient judges, inadequate funding, andcomplex legislation will prove satisfactory in and of themselves, for comprehensive reform will require afundamental realignment of incentives. As one observer of UP has suggested, an internal balance of
Chapter 3: Governance and Poverty Reduction in Uttar Pradesh 65
power and interest between presiding officers, advocates, clerks, peons, process servers, judges andmunifs is at the core of many problems at the district court level, where the poor are most likely toencounter the legal system (Moog, 1997). The action of presiding officers, who are typically outsidersserving away from their home regions, is often constrained through the influence of more permanent localparties (advocates, clerks, etc.), whose interests lie in increasing filings and appearances, which providesopportunity for greater fees and facilitation payments. Judges and munifs value job security andpromotion, and they are generally unwilling to tackle powerful entrenched interests during their limitedtenure on any given bench. Frequent transfers and a policy of promotion based largely upon seniority canreduce the incentives for judges to clear their dockets and encourage them to leave the more difficultcases for their successor. Advocates bill by court appearance, they are often tightly organized andcohesive as an interest group, and they are capable of exerting pressure through boycotts and other meansthat can ultimately have an adverse impact upon a judge's career progression. The net result is foradvocate interests and concerns to dominate the judicial process.
3.41 Should the poor ever be unfortunate enough to find themselves in the grips of the Indian criminaljustice system, their fate could be uncertain. One expert of the judicial systems noted that people in Indiafrequently go on trial after they have already served the maximum sentence for their alleged crime.Obviously the poor are at a disadvantage; they are the ones who cannot afford to pay bail. India has arelatively low crime rate, with only 325,000 in prison for a nation with I billion people. However, in itsmost recent report, the National Commission on Human rights noted that nearly 80 percent of allprisoners held between April 1996 and March 1997 had yet to be convicted of a crime. These"undertrials" can spend years waiting for their day in court-a fact that is especially troubling because theacquittal rate can be as high as 90 percent.
3.42 Within India, criminal court congestion is particularly bad in Uttar Pradesh. In 1994, more than111,000 cases were pending before the Allahabad High Court, which enjoyed the most serious casebacklog in the country. Of these cases, nearly 29,000 had been pending for between 5 to 8 years.
3.43 The situation for civil cases is only slightly less grim, which makes it extremely difficult for thepoor to obtain legal judgments on enforcing contracts or damage awards. A.M. Ahmadi, a former ChiefJustice of the Supreme Court and one of the leading experts on court backlog, notes that barring expeditedcircumstances, it's unlikely a civil case would come to a decision in less than 10 years. Much longerdelays are common, as evidenced by a story (Box 3.3) of a minor tort case that has dragged through theUP court system for 39 years.
66 Chapter 3: Governance and Poverty Reduction in Uttar Pradesh
Box 3.3 Justice in Moradabad, UPIn 1961, an illiterate meat cutter filed a lawsuit against his next-door-neighbor, a milk merchant. The milkman had built a brick wallat the edge of his property, inserting two small drains that emptied into the meat cutter's front yard. Though only rainwaterescaped from the spouts, the meat cutter was furious. He had hopes of adding a third room to his modest cement house. Withthose new drains loomed the probability of irksome seepage.
That was over 39 years and several hundred court dates ago. The original plaintiff and defendant are long dead, but their litigationhas plodded onward. Those troublesome drains, while promptly ruled illegal, have remained open while the case continues alongon appeal.
The case would seem to be a straighfforward matter, and indeed the court decided in the meat cutters favor in 1963. Objectionswere filed by the merchant, and when those were rejected in 1966, the decision was appealed to the high court in Allahabad.There the case waited 13 years for a hearing, which would have been fine if the paperwork had only been allowed to gather dust.Instead, after the lawsuit's 15th birthday in 1976, a clerk performed his statutory obligation and 'weeded out' the less-importantdocuments. At the hearing, the judge then ruled he lacked enough information to decide.
For 21 years the case has been back in the lower court, which has been ordered to reconstruct the file. Each piece of paper isopen to challenge, an invitation for delays that makes the defense lawyergrin at the thought of it. The file will never becomplete,' he said confidently. Nevertheless, the case appears on the docket once or twice each month only to be adjoumed forthis or postponed for that. From 1979 to 1990, 15 hearing dates were wasted by lawyer strikes and 13 more when the judge tookan unscheduled holiday. Every time the case is scheduled, both the plaintiff and defendant feel obliged to go to court. Clientscannot depend on their lawyers to show up, and, if no one is present, the lawsuit may be forfeited entirely. It is a cumbersomeburden for the plaintiffs son, who has meat to cut and customers waiting. On occasion, he meets his opponent in court and theyshout at each other. The original defendant died in 1986, and his son now carries the burden of the bequeathed litigation.
Source: Adapted from Bearak, 2000
3.44 The filing of cases, which continues unabated, provides evidence that at least some citizens find
the court system to be useful. Yet there is also a broad consensus that it is failing in its mandate to
provide effective and timely relief to the poor. The poor seldom use the civil courts. Legal literacy is agreat barrier. People are often unaware that a wrong was commnitted and of potential recoursemechanisms. Within rural areas, caste differences play a huge role: lower castes face severe inhibition in
bringing civil action against upper castes, which can often take the form of physical intimidation. Thisintimidation is exacerbated by the bewildering and overwhelming state system with its formal and
informal rules and procedures. Access to the judicial process for the poor is also inhibited by their
inability to finance lengthy law suits and by the large distances to travel to reach the katcheri (district
court). As a result, one student of Indian judicial reform has concluded that, "there can be little doubt thatfor certain segments of the public and even for many advocates and presiding officers, these [district]
courts are often of little value in dispute settlement. For many people, they have effectively lost their
legitimacy in the performance of this function" (Moog, 1997).
D. Redressing the Imbalances
3.45 Nehru and the makers of the Constitution designed the Indian State with a clear developmental
focus in mind, and each year vast resources are expended with the goal of reducing poverty and protecting
the poor. The great majority of this effort takes place within the public sector. It is clear from the above
analysis that there is great scope for improvement in the performance of this task. What is less clear ishow these problems can best be remedied within a state such as Uttar Pradesh, and how donor agenciescan help to advance this process. Nevertheless, some conclusions can be drawn from our existingknowledge and UP' s nascent reform experience to date.
Reformns to Strengthen Voice and Participation
3.46 There is a consensus among political and social scientists and activists alike that one of the mostimportant ways for ensuring that the poor are adequately served by government is to ensure that they
Chapter 3: Governance and Poverty Reduction in Uttar Pradesh 67
participate meaningfully in political life. Participation can take many forms, from planning projects andforming budgets to monitoring implementation and expenditure. The modes of participation can alsovary, ranging from simple tools to improve government responsiveness (surveys, focus groups, effectivegrievance procedures, etc.) to participatory planning techniques ranging up through village counsels inwhich communal issues are discussed and decided.
3.47 In December 1992, the Government of India embarked upon one of the most radical initiatives forenhancing the access of the poor and disenfranchised to power ever implemented within a democraticpolitical system. It passed the 73rd Amendment to the Indian constitution, which established a uniform 3-tier Panchayat Raj Institutions (PRI) structure across the country, with the village, block and district as therelevant levels of government. The Act provided for direct election to all seats for members at all levels.It also provided that seats would be reserved for Scheduled Castes and Tribes in proportion to theirpopulation in the district, and that one third of the total seats would be reserved for women among boththe general population and the SC/STs.
3.48 In some respects, the 73rd and 74t Amendments were less a radical departure than an extension ofcertain practices and precedents that had existed within India prior to the December 1992 Act. Somestates, such as Kerala, had experimented with Panchayati Raj Institutions since the 1970s. Uttar Pradeshhad initially passed the Uttar Panchayati Raj Act in 1947, which allocated twenty-two designated welfare,regulatory, and developmental functions to the Gaon Panchayat, which also had limited capacity to levytaxes and fees. The 1947 Act was amended several times, however by the 1960s it had ceased to functionin practice.
3.49 This effort has not been without its complications in both Uttar Pradesh and other Indian states(Box 3.4). There is evidence, anecdotal and otherwise, of the system being manipulated to maintaintraditional authority relations, such as wives occupying positions that their husbands had recently vacated.Evolving survey work in other states (Madhya Pradesh and Rajasthan) indicates that, in spite of relativelyhigh levels of participation, many of the poor feel that Panchayat Raj institutions do not address theirneeds or reflect their views (World Bank, 1999b). The rewards from participation are perceived to bemodest in comparison with other participatory schemes, such as women's savings groups and the Pahalprojects, which provide employment. Many of the benefits are captured by local elites and those withpolitical connections, and the structure of meetings is such that the poor typically do not have theopportunity to voice their views in a meaningful fashion. Actual decisionmaking can be non-transparent.Critical information can be withheld on revenues, expenditures, and beneficiary selection. PRI's oftenhave only supervisory authority and have limited control over line departments. As a result, meetings ofthe local assembly, or Gram Sabha, are often poorly attended, with less than 7 percent of the populaceattending regularly. The 10 percent quorum requirement stipulated by law is often difficult to achieve.
3.50 Other assessments of India's decentralization effort raise similar cautionary notes (World Bank,2000c). Accountability mechanisms are weak, particularly those between the Sarpanches (or in UP, thePradhan or head man) and the village representatives at the lowest level, the Gram Panchayat.Provisions for recall, vigilance committees, or recourse to a higher authority are all problematic. Casteand gender bias pervade the workings of the PRIs, despite the reservations. The overpowering presenceof members of legislative assembles, legislative councils, members of parliament and senior bureaucratsin the District Planning Commission can threaten local decisionmaking. Fiscal and administrativedecentralization has not kept pace with political decentralization. Many PRI's lack the capacity toeffectively implement the responsibilities assigned to them, which remain under the defacto control ofthe state administration.
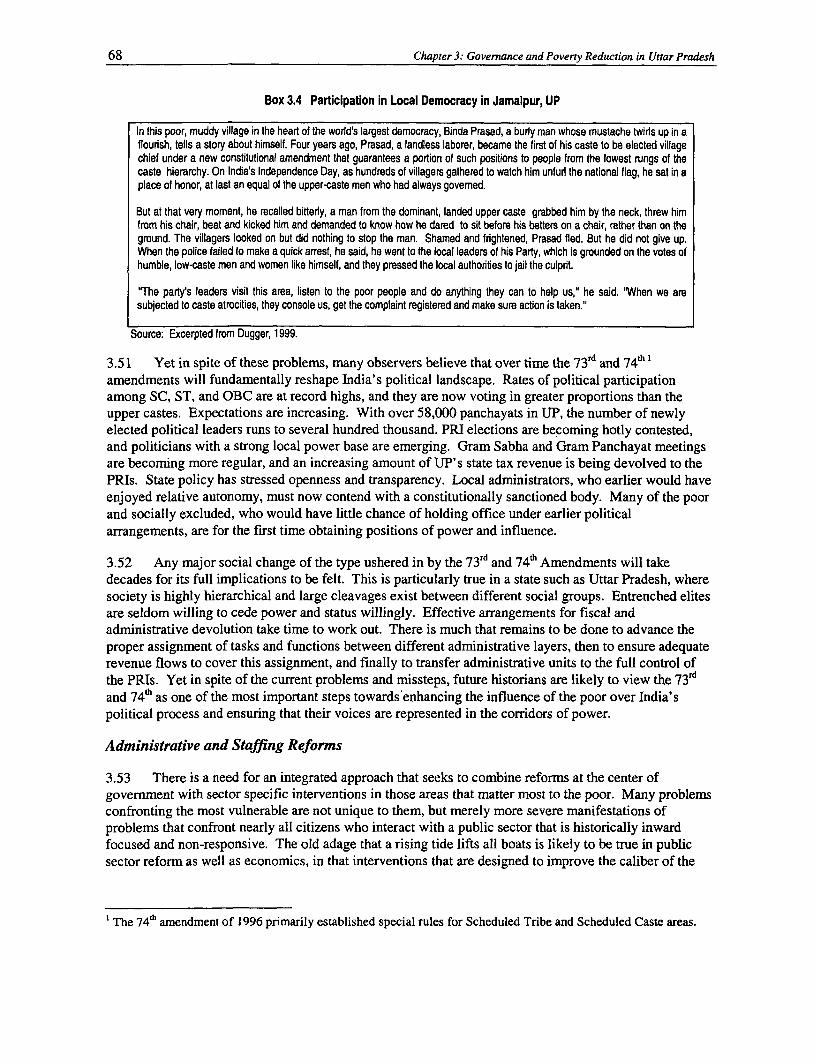
68 Chapter 3: Governance and Poverty Reduction in Uttar Pradesh
Box 3.4 Participation In Local Democracy In Jamalpur, UP
In this poor, muddy village in the heart of the world's largest democracy, Binda Prasad, a burly man whose mustache twirls up in aflourish, tells a story about himself. Four years ago, Prasad, a landless laborer, became the first of his caste to be elected villagechief under a new constitutional amendment that guarantees a portion of such positions to people from the lowest rungs of thecaste hierarchy. On India's Independence Day, as hundreds of villagers gathered to watch him unfurl the national flag, he sat in aplace of honor, at last an equal of the upper-caste men who had always governed.
But at that very moment, he recalled bitterly, a man from the dominant, landed upper caste grabbed him by the neck, threw himfrom his chair, beat and kicked him and demanded to know how he dared to sit before his beKters on a chair, rather than on theground. The villagers looked on but did nothing to stop the man. Shamed and frightened, Prasad fled. But he did not give up.When the police failed to make a quick arrest, he said, he went to the local leaders of his Party, which is grounded on the votes ofhumble, low-caste men and women like himself, and they pressed the local authorities to jail the culprit.
"The party's leaders visit this area, listen to the poor people and do anything they can to help us," he said. "When we aresubjected to caste atrocities, they console us, get the complaint registered and make sure action is taken."
Source: Excerpted from Dugger, 1999.
3.51 Yet in spite of these problems, many observers believe that over time the 73rd and 74th amendments will fundamentally reshape India's political landscape. Rates of political participationamong SC, ST, and OBC are at record highs, and they are now voting in greater proportions than theupper castes. Expectations are increasing. With over 58,000 panchayats in UP, the number of newlyelected political leaders runs to several hundred thousand. PRI elections are becoming hotly contested,and politicians with a strong local power base are emerging. Gram Sabha and Gram Panchayat meetingsare becoming more regular, and an increasing amount of UP' s state tax revenue is being devolved to thePRIs. State policy has stressed openness and transparency. Local administrators, who earlier would haveenjoyed relative autonomy, must now contend with a constitutionally sanctioned body. Many of the poorand socially excluded, who would have little chance of holding office under earlier politicalarrangements, are for the first time obtaining positions of power and influence.
3.52 Any major social change of the type ushered in by the 73rd and 74h Amendments will takedecades for its full implications to be felt. This is particularly true in a state such as Uttar Pradesh, wheresociety is highly hierarchical and large cleavages exist between different social groups. Entrenched elitesare seldom willing to cede power and status willingly. Effective arrangements for fiscal andadministrative devolution take time to work out. There is much that remains to be done to advance theproper assignment of tasks and functions between different administrative layers, then to ensure adequaterevenue flows to cover this assignment, and finally to transfer administrative units to the full control ofthe PRIs. Yet in spite of the current problems and missteps, future historians are likely to view the 73rdand 74th as one of the most important steps towards enhancing the influence of the poor over India'spolitical process and ensuring that their voices are represented in the corridors of power.
Administrative and Staffing Reforms
3.53 There is a need for an integrated approach that seeks to combine reforms at the center ofgovernment with sector specific interventions in those areas that matter most to the poor. Many problemsconfronting the most vulnerable are not unique to them, but merely more severe manifestations ofproblems that confront nearly all citizens who interact with a public sector that is historically inwardfocused and non-responsive. The old adage that a rising tide lifts all boats is likely to be true in publicsector reform as well as economics, in that interventions that are designed to improve the caliber of the
' The 7 4 h amendment of 1996 primarily established special rules for Scheduled Tribe and Scheduled Caste areas.
Chapter 3: Governance and Poverty Reduction in Uttar Pradesh 69
public sector as a whole are likely to generate positive externalities for those at the bottom of theeconomic and social hierarchy.
3.54 In an effort to stem excessive centralization and enhance responsiveness to local needs andcircumstances, as well as to replicate the popular decentralization initiatives taken in nearby MadhyaPradesh, the GOUP recently enacted some important initiatives in the overall context of implementing the73rd and 74h amendments. These measures were intended to increase the powers and administrativecapacity of the lowest rung of the three tier PRI structure, the Gram Panchayat. They were announced inmid-1999, and their essential features include:
* The transfer of functions to the Gram Panchayats, including (1) primary, upper primary andnon-formal education; (2) sports and youth welfare and school maintenance; (3) primaryhealth care, including mid-wives and female health workers; (4) women and child welfare,including Anganwadi workers and assistants; (5) maintenance of handpumps and publictubewells; (6) animal centers and D category veterinary centers; (7) agricultural works at thevillage level; (8) sanction and disbursement for all social assistance pensions; (9) sanctionand disbursement of student scholarships at the primary and upper primary level.
* The transfer of finance and assets necessary to fulfill the functions listed above.
* The provision of one executive functionary for each Gram Panchayat, totaling approximately58,650 workers, who will be drawn from the consolidated operations of eight departments(Rural Development, Panchayati Raj, Agriculture, Animal Husbandry, Health, Irrigation,Social Welfare, and Sugar Cane).
* The transfer of power to recruit teachers and pay salaries in the area of primary education.(Existing teachers will be paid by the state government until they retire.)
3.55 The implementation of these measures has not been without complications. Politicians at the statelevel and parliament have been reluctant to see a set of potential electoral competitors emerge at the PRIlevel. Line Departments have been unenthusiastic about the prospect of releasing finances and personnel,and lower level bureaucrats have resented the imposition of a new layer of accountability. Powerfulunions, such as those involving education, are resisting the transfer of recruitment and salary authority tothe PRIs. There are capacity problems regarding whether the multi-task employee at the Gram Panchayatlevel will have adequate training and capacity to fulfill all of his or her designated responsibilities.
3.56 In the face of such powerful entrenched interests, the GOUP recently has diluted or reversedsome of these proposed changes. Teachers unions have been particularly influential in blocking a numberof initiatives to transfer staff and oversight responsibilities to the PRIs. They halted efforts to turnrecruitment over to the local PRIs, and recently stopped an initiative to allow the PRIs to sign off onattendance before monthly salaries would be paid.
3.57 The GOUP has recently considered streamlining its secretariat by combining departments andsub-departments with similar functions under the overall leadership of a principal secretary, who wouldbe responsible for streamlining operations and coordinating service delivery. While limited progress hasbeen made to date in implementing this structure, it represents an important effort to halt theadministrative fragmentation and balkanization of the last two to three decades.
3.58 Turning to the question of staffing, the problem within the GoUP's civil service is notoverstaffing per se, but that of a high wage bill in comparison with weak revenue mobilization,inappropriate staffing and skills mix, and low productivity. The state has taken some initiatives to curb
70 Chapter 3: Governance and Poverty Reduction in Uttar Pradesh
these problems. A partial freeze on the creation of new posts was announced in 1986 and has beenperiodically reinstated. However, the perception is widespread that such restrictions have been routinelyflouted. Although the civil service numbers are not wholly reliable, it is likely-as discussed above-thatthe civil service has been steadily shrinking in size since its peak in 1990. To free up additional resourcesfor high priority development expenditures, the GOUP has agreed to pursue an annual reduction of 2percent per year for the next four years. It is also considering employment reduction schemes, such asVoluntary Retirement Schemes (VRS), for the core civil service. Furthermore, recruitment into UP'scivil service is currently overseen by the state Public Service Commission. There is a general consensusthat, while not perfect, at the present time recruitment is by and large open, fair and meritocratic(Yugandhar, 1999; also based on World Bank staff interviews with GOUP officials in autumn, 1999).
3.59 It is important that these macro or structural reforms are carefully integrated with sector specificinterventions to improve the quality of regulation and service delivery in areas that matter most for thepoor-policing, education, health care, and potable water. Many public sector reform issues, such asstreamlining court procedures or ensuring that hand pump mechanics have adequate training, are agencyspecific and require solutions at that level. The GOUP is currently moving forward with an integratedreform package that seeks to combine fiscal and public sector management reforms across governmentwith sector specific interventions. In light of the mutually reinforcing nature of these changes, this typeof intervention holds the greatest promise of success.
Improving the Efficiency of Public Expenditure
3.60 While both budget programming and budget execution have suffered from being over-centralizedand insufficiently transparent and participatory, the GOUP is ahead of most states in addressing thecentralization problem. Following the 73rd and 74" amendments to the constitution, UP was the first statein India to commit itself to a non-discretionary transfer of funds to the Gram Panchayats, by an amountequal to some 4 percent of tax revenues. However, capacity for expenditure management will need to bebuilt at local level before fiscal decentralization can go significantly further. In the meantime, greaterefforts should be made to increase the transparency of the budget and the extent of participation by thedifferent tiers of government, as well as other service providers in its preparation.
3.61 The Government has committed to increase expenditure on operations and maintenance and onservices that are particularly important for accelerating development and poverty reduction. To this end, ithas identified a series of High Priority Development Expenditures, to be protected and, where possible,increased. This is perhaps a worthwhile temporary measure to protect certain categories of expenditureduring fiscal adjustment, at a time when overall expenditure management systems are weak. However, inthe long term, identification of priority expenditure should not be allowed to become a distraction fromthe longer-term solution of strengthening overall public expenditure management systems. All decisionsabout public expenditure have implications for the poor, including low-priority expenditure which couldhave been spent in a more pro-poor way. GOUP needs to establish a Medium-Term ExpenditureFramework through which to monitor the poverty impact of public expenditure as a whole.
3.62 As core expenditure management processes are strengthened, GOUP should begin to considerhow budget processes can drive public spending proactively in more pro-poor directions. Targeted publicspending can be a powerful weapon for attacking poverty. For example, public spending can beconcentrated in service areas that are relatively more important to the poor, such as primary education,primary health care and water and sanitation. Spending can be focused geographically on areas where thepoor are concentrated, such as remote rural areas and urban slums. In addition, it is important to improvethe design, targeting and effectiveness of GOI' s Anti-Poverty Programs so that they better serve the needs
Chapter 3: Governance and Poverty Reduction in Utar Pradesh 71
of the poor in UP. Finally, by ensuring fiscal discipline and stability, governments can protect the poor,who are most likely to suffer when large deficits and high debt servicing costs require sudden cuts inexpenditure.
3.63 In the UK, the Prime Minister's Social Exclusion Unit played an important role in the 2000Spending Review, participating in the expenditure review committee so as to ensure that all publicexpenditure decisions were "poverty-proofed"; in Orissa, it has been suggested that the state's PovertyTask Force might play a similar role in poverty-proofing the next state Budget. Similar arrangementsshould be considered for UP.
3.64 There needs to be more emphasis on monitoring the outputs and outcomes of spending on thepoor, and not just monitoring the flow of funds. Even if funds reach poor communities, if spent on thewrong things or in an inefficient way, the impact on poverty outcomes may be minimal. Tying publicexpenditure allocations to outcomes is not an easy thing to do, but investing in the establishment ofcapacity for performance measurement is a necessary first step. Ongoing efforts to establish a Poverty andSocial Monitoring System, discussed in Chapter 1, are crucial if public expenditure is to become a moreeffective tool for reducing poverty. There are important lessons to be learned from other countries: theGovernment of Uganda has utilized expenditure tracking surveys to monitor the quality of governmentspending, for example, by comparing actual resources received at the level of district schools with formalbudget allocations. When the exercise was first initiated in 1991,.less than 2 percent of the funds intendedfor non-salary public spending actually reached schools in the districts being monitored. This increasedto nearly 30 percent during the five year time period of the study-still woefully inadequate, but asignificant improvement.
3.65 Even in situations where formal accountability mechanisms have been weak or non-existent, as isthe case with the U.K. Audit Commission, for example, the combination of careful monitoring ofperformance and publicity has served as a potent force in improving local government performance.
3.66 The GOUP is currently taking a number of important steps to enhance transparency andaccountability. It has drafted a Freedom of Information Act, and over sixteen line departments havedeveloped citizen's charters highlighting service delivery standards. The GOUP has issued orders ontransparency which makes the posting of work in progress, receipts and expenditure, certified copies ofmuster-rolls and a list of beneficiaries on bill boards outside the panchayat offices mandatory. Thecombination of robust performance measures and publicity will build upon this process and provideclearer benchmarks on which to evaluate performance. More importantly, since no government entitywishes to be at the bottom of the list, it will also create incentives for districts, Block DevelopmentOfficers (BDOs) and village officials to improve their functioning or come under increasingly pressurefrom their clientele.
3.67 None of these efforts can be divorced from the budget. UP is currently in a state of fiscal crisis,and there will not be large sums of money for major social welfare schemes. It is therefore imperativethat the state achieve significant gains in productivity throughout its public sector, which will enable it toredirect limited resources to high priority areas essential for rapid economic growth and povertyreduction. Even more importantly, it needs to ensure a higher rate of return in terms of povertyalleviation for every rupee invested in wages, operations and maintenance, and capital expenditure. Thestate has committed itself to a major program of public sector adjustment along these lines, whoseimplementation is still at an early stage. The success or failure of this program will have a significantimpact upon UP's ability to improve the plight of its poor.

Chapter 4
ECONOMIC OPPORTUNITIES FOR THE POOR
A. Introduction
4.1 Economic growth is the foundation stone of poverty reduction. Discussions aoout poverty inUttar Pradesh often focus on direct poverty interventions - policies and programs designed to uplift thepoor and socially marginalized. These programs too easily become the government's primary vehicle forpoverty reduction, and economic growth takes a secondary role. The danger is that this may lead to asituation in which major discussions and decisions on economic policy are made without any reference tothe interests of the poor.
4.2 A dynamic economy, growing well, is the strongest force for creating new and better economicopportunities for the poor, enabling greater empowerment, and reducing vulnerability. The key towidening opportunity in general is widening opportunity for women and socially marginalized groups inparticular. Where poverty is endemic in the countryside, as in Uttar Pradesh and in India more generally,accelerated growth in rural areas ranks as the first, though not only remedy. In UP's still heavily agrarianeconomy, a healthy agriculture sector is needed to power rural progress. But UP's economy is changingas India initiates a second wave of reforms - cuts in subsidies, better infrastructure, deregulation of goodsand factor markets, a better functioning financial system, higher and more effective spending on keyservices for the poor, and realigning government to focus on core public sector activities - andmomentum is gained in the state's own comprehensive program of reforms. Improvements in theinvestment climate will stimulate higher growth in the non-farm sector and create new opportunities forthe poor outside agriculture.
4.3 Growth can have a greater or lesser impact on poverty. Many of UP's poor still depend onagriculture where reform has been limited. While exchange-rate liberalization and the weakening ofindustrial protection have helped, agriculture is still highly constrained by state and central governmentregulations that limit price movement and intrastate commerce, public procurement, and canalization oftrade (World Bank, 1999a). Heavy reliance on subsidies to electricity and a large wage bill, moreover,have crowded out public investment in roads, irrigation, and agriculture technology, have limited fundsavailable for crucial spending on O&M; and have contributed to the low quality of rural power supply.As agriculture continues to stagnate, growth elsewhere has led to some improvement in the pace ofpoverty reduction statewide. Such a pattern, however, carries the threat of rising inequality, of greaterdivergence between urban and rural areas, between backward and more progressive regions and betweenthose equipped - with land, education, and access to public assets - to ride a rising tide and those whocannot sail or swim. For example, trade liberalization, combined with deregulation should work toincrease exports and imports and drive up the demand for labor. But recent analysis (Wood andCaladrino, 2000) suggests that the demand will be for relatively skilled labor; demand for unskilled and/orilliterate workers is likely to fall. The poverty-reducing impacts of reforms are highly contingent onactions taken now to help the poor acquire the skills they need, provide better access to public goods andservices, and remove barriers to using them.
74 Chapter 4: Economic Opportunities For The Poor
B. Improving the Climate for Private-Sector-Led Growth
Employment Situation
4.4 Three out of four UP workers are either self-employed or work as casual laborers in agriculture.Services, household enterprises and (non-household) manufacturing account for the rest, all activities thathave shown only marginal growth in employment in recent years. The service sector and householdenterprises account for the bulk of non-farm employment, especially among the poor. Although totalemployment in (non-household) manufacturing has grown somewhat, its share in total employmenthovers at only 5.3 percent. The share of the organized sector is only 6 percent (23 percent of the non-agriculture work force), and most of its increase has been due to the rapid expansion of public sectoremployment - 300 percent (0.75 million to 2.13 million) between 1960-61 and 1994. Private-sectoremployment in the same period grew only a modest 50 percent (from 0.35 million to 0.52 million.) Therecent slowdown in organized sector employment reflects the fiscal constraints on the state budget, aswell as continued sickness in public and private enterprises (Singh 1998). Despite high growth in the1980s, the structure of industry has become increasingly capital-intensive, restricting employment.
4.5 Rarely found in the formal sector, most of the urban poor are self-employed (56 percent in 1999-00) or casual laborers (24 percent, 1999-00) and involved in petty trade, home-based enterprises and arange of low-paid service activities. There has been a marked trend towards casualization of theworkforce, with the proportion of casual laborers in UP having more than doubled from around 11 percent in 1972/73 to almost 24 percent in 1999-00. Moreover, two-thirds of households that primarily earnincome from the casual wage sector number among the poor. While factors behind the growingcasualization of the urban workforce are not well understood, it is an important area for future urbanpoverty reduction efforts in the state.
4.6 Casual labor is the recourse of a large number of unskilled laborers, and consultations with anumber of the poor in illegal urban settlements found broad agreement that urban life offered a widerange of earning opportunities at wages higher than in the countryside. Informants who said they couldearn only Rs. 20 per day in the village are earning Rs. 50 in an urban setting. Many rural-to-urbanmigrants relocated to urban or industrial centers in search of jobs in manufacturing. A few weresuccessful but the low-skilled among them have little job security. Many older factories have closed dueto inefficiencies and are being replaced by modern, high-technology plants that do not employ low-literacy or poorly skilled workers. For men and women with no skills, no connections, and no education,scavenging or begging often provides a basic livelihood. Others used fruit-and-vegetable hawking as aroute to upward mobility. It requires little capital to hike or cycle to the suburbs at dawn to purchasevegetables to sell in urban markets. Some of these hawkers may be able to earn enough eventually topurchases a cart and transport more produce, or even set up a small shop.
4.7 Some low income villagers migrated to cities to escape feuds, debts, or oppressive attached laborrelationships with upper caste landlords or patrons. In urban areas, low-caste workers say they are lessconstrained by expectations associated with the traditional social hierarchy, and cities provide someopportunities to escape traditional caste occupations. Particularly those who have settled in mixed-casteneighborhoods and labor hungry employment environments have found employment in sectors and jobsnormally associated with higher castes. Many poor urbanites, however, still work in their traditional casteoccupations - dairying, leatherwork, musical performance - but, unlike the case in rural areas, have beenable to realize a small profit from these activities under the different economic conditions prevailing inthe town. An example of the strategic use of a traditional occupation in an urban setting as well as
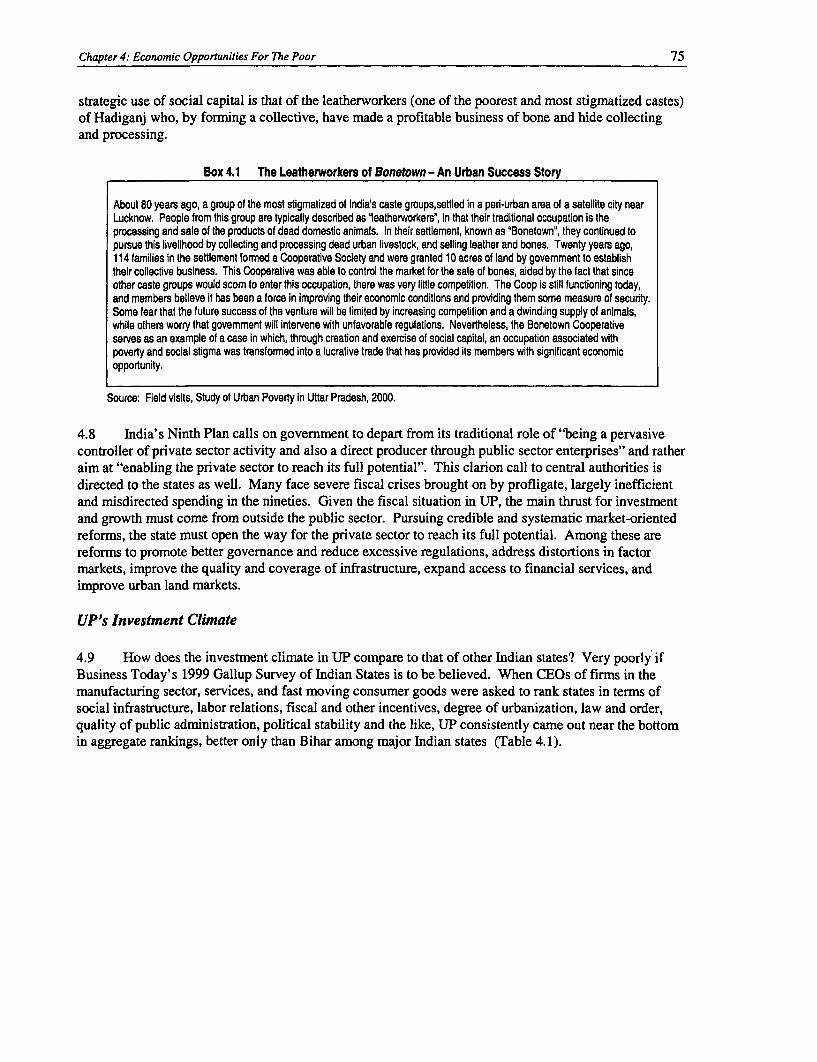
Chapter 4: Economic Opportunities For The Poor 75
strategic use of social capital is that of the leatherworkers (one of the poorest and most stigmatized castes)of Hadiganj who, by forming a collective, have made a profitable business of bone and hide collectingand processing.
Box 4.1 The Leatherworkers of Bonetown - An Urban Success Story
About 80 years ago, a group of the most stigmatized of India's caste groups,settled in a pen-urban area of a satellite city nearLucknow. People from this group are typically descrbed as leatherworkers', in that their traditional occupation is theprocessing and sale of the products of dead domestic animals. In their seKtlement, known as 'Bonetown", they continued topursue this livelihood by collecting and processing dead urban livestock, and selling leather and bones. Twenty years ago,114 families in the seKlement formed a Cooperative Society and were granted 10 acres of land by govemment to establishtheir collective business. This Cooperative was able to control the market for the sale of bones, aided by the fact that sinceother caste groups would scom to enter this occupation, there was very little competition. The Coop is still functioning today,and members believe it has been a force in improving their economic conditions and providing them some measure of securty.Some fear that the future success of the venture will be limited by increasing competition and a dwindling supply of animals,while others worry that govemment will intervene with unfavorable regulations. Nevertheless, the Bonetown Cooperativeserves as an example of a case in which, through creation and exercise of social capital, an occupation associated withpoverty and social stigma was transformed into a lucrative trade that has provided its members with significant economicopportunity.
Source: Field visits, Study of Urban Poverty in Uftar Pradesh, 2000.
4.8 India's Ninth Plan calls on government to depart from its traditional role of "being a pervasivecontroller of private sector activity and also a direct producer through public sector enterprises" and ratheraim at "enabling the private sector to reach its full potential". This clarion call to central authorities isdirected to the states as well. Many face severe fiscal crises brought on by profligate, largely inefficientand misdirected spending in the nineties. Given the fiscal situation in UP, the main thrust for investmentand growth must come from outside the public sector. Pursuing credible and systematic market-orientedreforns, the state must open the way for the private sector to reach its full potential. Among these arereforms to promote better governance and reduce excessive regulations, address distortions in factormarkets, improve the quality and coverage of infrastructure, expand access to financial services, andimprove urban land markets.
UP's Investment Climate
4.9 How does the investment climate in UP compare to that of other Indian states? Very poorly ifBusiness Today's 1999 Gallup Survey of Indian States is to be believed. When CEOs of firms in themanufacturing sector, services, and fast moving consumer goods were asked to rank states in terms ofsocial infrastructure, labor relations, fiscal and other incentives, degree of urbanization, law and order,quality of public administration, political stability and the like, UP consistently came out near the bottomin aggregate rankings, better only than Bihar among major Indian states (Table 4.1).
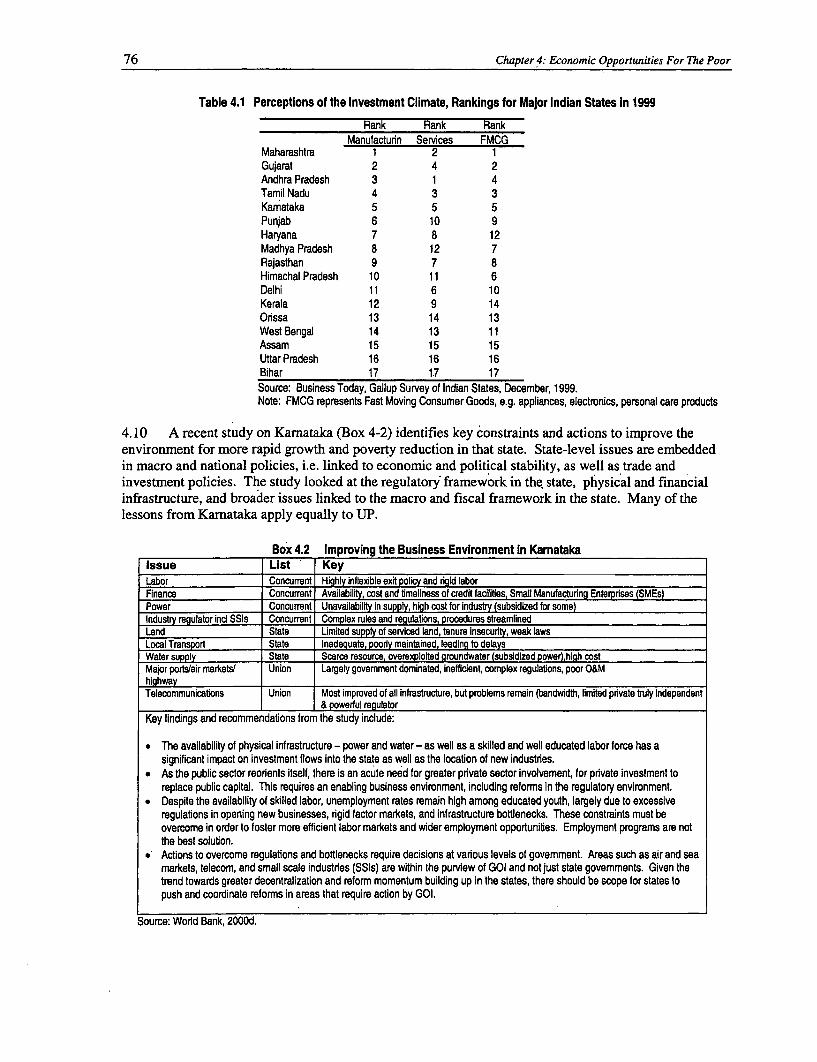
76 Chapter 4: Economic Opportunities For The Poor
Table 4.1 Perceptions of the Investment Climate, Rankings for Major Indian States In 1999
Rank Rank RankManufacturin Services FMCG
Maharashtra 1 2 1Gujarat 2 4 2Andhra Pradesh 3 1 4Tamil Nadu 4 3 3Kamataka 5 5 5Punjab 6 10 9Haryana 7 8 12Madhya Pradesh 8 12 7Rajasthan 9 7 8Himachal Pradesh 10 11 6Delhi 11 6 10Kerala 12 9 14Orssa 13 14 13West Bengal 14 13 11Assam 15 15 15Uttar Pradesh 16 16 16Bihar 17 17 17
Source: Business Today, Gallup Survey of Indian States, December, 1999.Note: FMCG represents Fast Moving Consumer Goods, e.g. appliances, electronics, personal care products
4.10 A recent study on Karnataka (Box 4-2) identifies key constraints and actions to improve theenvironment for more rapid growth and poverty reduction in that state. State-level issues are embeddedin macro and national policies, i.e. linked to economic and political stability, as well as trade andinvestment policies. The study looked at the regulatory framework in the, state, physical and financialinfrastructure, and broader issues linked to the macro and fiscal framework in the state. Many of thelessons from Karnataka apply equally to UP.
Box 4.2 Improving the Business Environment In KamatakaIssue List KeyLabor Concurrent Highly inflexible exit policy and rigid laborFinance Concurrent Availabilay, cost and timeliness of creda facilites, Small Manufacturing Enterpnses (SMEs)Power Concurrent Unavailability in supply, high cost for industry (subsidized for some)Industrv regulator ind SSls Concurrent Complex rules and regulations, procedures streamlinedLand State Limited supply of serviced land, tenure Insecurity, weak lawsLocal Transport State Inadequate, poorly maintained, leading to delaysWater supply State Scarce resource, overexploited groundwater (subsidized power),high costMajor ports/air markets/ Union Largely govemment dominated, inefficient, complex regulations, poor O&MhighwayTelecommunications Union Most improved of all infrastructure, but problems remain (bandwidth, limited private truly independent
& powerful regulatorKey findings and recommendations from the study include:
* The availability of physical infrastructure - power and water - as well as a skilled and well educated labor force has asignificant impact on investment flows into the state as well as the location of new industries.
* As the public sector reorents itself, there is an acute need for greater private sector involvement, for private investment toreplace public capital. This requires an enabling business environment, including reforms in the regulatory environment.
* Despite the availability of skilled labor, unemployment rates remain high among educated youth, largely due to excessiveregulations in opening new businesses, rigid factor markets, and infrastructure bottlenecks. These constraints must beovercome in order to foster more efficient labor markets and wider employment opportunities. Employment programs are notthe best solution.
* Actions to overcome regulations and bottlenecks require decisions at various levels of govemment. Areas such as air and seamarkets, telecom, and small scale industries (SSls) are within the purview of GOI and not just state govemments. Given thetrend towards greater decentralization and reform momentum building up in the states, there should be scope for states topush and coordinate reforms in areas that require action by GOI.
Source: World Bank, 2000d.
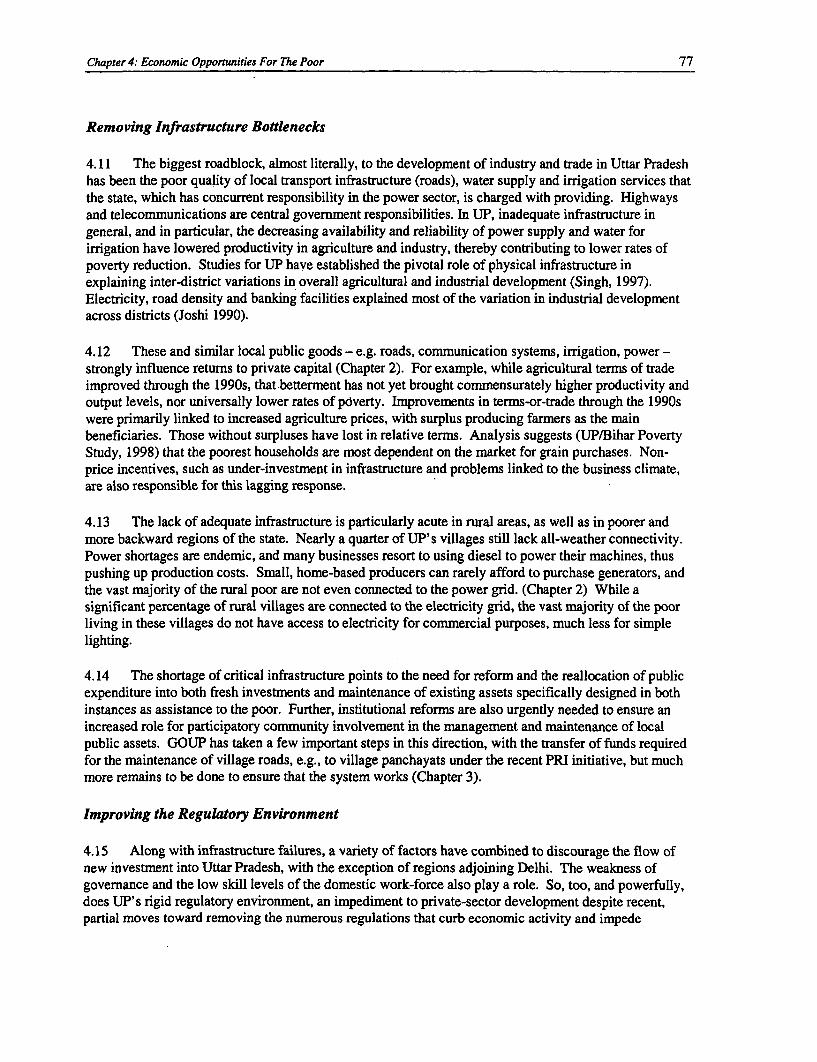
Chapter 4: Economic Opportunities For The Poor 77
Removing Infrastructure Bottlenecks
4.11 The biggest roadblock, almost literally, to the development of industry and trade in Uttar Pradeshhas been the poor quality of local transport infrastructure (roads), water supply and irrigation services thatthe state, which has concurrent responsibility in the power sector, is charged with providing. Highwaysand telecommunications are central government responsibilities. In UP, inadequate infrastructure ingeneral, and in particular, the decreasing availability and reliability of power supply and water forirrigation have lowered productivity in agriculture and industry, thereby contributing to lower rates ofpoverty reduction. Studies for UP have established the pivotal role of physical infrastructure inexplaining inter-district variations in overall agricultural and industrial development (Singh, 1997).Electricity, road density and banking facilities explained most of the variation in industrial developmentacross districts (Joshi 1990).
4.12 These and similar local public goods - e.g. roads, communication systems, irrigation, power -strongly influence returns to private capital (Chapter 2). For example, while agricultural terms of tradeimproved through the 1990s, that betterment has not yet brought commensurately higher productivity andoutput levels, nor universally lower rates of poverty. Improvements in terms-or-trade through the 1990swere primarily linked to increased agriculture prices, with surplus producing farmers as the mainbeneficiaries. Those without surpluses have lost in relative terms. Analysis suggests (UP/Bihar PovertyStudy, 1998) that the poorest households are most dependent on the market for grain purchases. Non-price incentives, such as under-investment in infrastructure and problems linked to the business climate,are also responsible for this lagging response.
4.13 The lack of adequate infrastructure is particularly acute in rural areas, as well as in poorer andmore backward regions of the state. Nearly a quarter of UP's villages still lack all-weather connectivity.Power shortages are endemic, and many businesses resort to using diesel to power their machines, thuspushing up production costs. Small, home-based producers can rarely afford to purchase generators, andthe vast majority of the rural poor are not even connected to the power grid. (Chapter 2) While asignificant percentage of rural villages are connected to the electricity grid, the vast majority of the poorliving in these villages do not have access to electricity for commercial purposes, much less for simplelighting.
4.14 The shortage of critical infrastructure points to the need for reform and the reallocation of publicexpenditure into both fresh investments and maintenance of existing assets specifically designed in bothinstances as assistance to the poor. Further, institutional reforms are also urgently needed to ensure anincreased role for participatory community involvement in the management and maintenance of localpublic assets. GOUP has taken a few important steps in this direction, with the transfer of funds requiredfor the maintenance of village roads, e.g., to village panchayats under the recent PRI initiative, but muchmore remains to be done to ensure that the system works (Chapter 3).
Improving the Regulatory Environment
4.15 Along with infrastructure failures, a variety of factors have combined to discourage the flow ofnew investment into Uttar Pradesh, with the exception of regions adjoining Delhi. The weakness ofgovernance and the low skill levels of the domestic work-force also play a role. So, too, and powerfully,does UP's rigid regulatory environment, an impediment to private-sector development despite recent,partial moves toward removing the numerous regulations that curb economic activity and impede

78 Chapter 4: Economic Opportunities For The Poor
production and investment. In the industrial sector, the government has liberalized land purchase forindustrial units and introduced a single window system for rapid clearances. It replaced the complex salestax with a simpler trade tax and modified procedures to discourage evasion. Government orders have alsorestricted discretionary inspections and streamlined the role of inspectors, reducing harassment toindustrial and trade establishments. Labor market rigidities are particularly problematic; these work toreduce formal sector employment and impede growth in exports. A recent study (Beschel and Sundaram,2002) looked at the causes of over-staffing in the formal sector in three states - Karnataka, AndhraPradesh, and Uttar Pradesh. In Karnataka and AP, both states with a reasonably good investment climate,many firms over-staffed in anticipation of higher growth in the future. Labor regulations were cited as acause in 25 percent of cases, and political pressure in 40 percent. In contrast, 100 percent of firmnsinterviewed in UP cited labor regulations as a cause of present overstaffing and 94 percent claimed to facepolitical opposition to laying off workers. While many good laws and measures have been passed orenacted, the main challenge ahead is to ensure effective implementation in practice.
4.16 A number of laws and regulations -- some of them recently revised - operate in particular againstthe interests of the poor and restrict economic mobility (Saxena, 1999). Officials urgently need toundertake a systematic evaluation of existing laws and regulations in order to do away with those thatcurb economic opportunities particularly for the poor. For instance, many of the urban poor live inunauthorized habitations in urban slums. When they engage in street vending and hawking, they aresubject to numerous regulations that the police invoke in a fashion that frequently amounts to harassment.Not only should more appropriate regulations be developed, sites need to be available for such pettycommerce. In numerous instances, other interests have usurped well-intentioned regulations meant toimprove participation by the poor. For example, middlemen have come to domirnate weavers' cooperativesocieties, for example, and provisions of the Cooperative Acts have made cooperatives heavilybureaucratized institutions (Saxena 1999). While licenses for sand quarrying on river beds must by lawbe given to fishermen, special provisions in the order have opened the room for large contractors to createmonopolies and reduce poor fishermen to the status of low-paid wage workers. In short, the better off andmore powerful too often can use laws and regulations to do as they like.
Financial Services for the Poor
4.17 India's financial system plays a key role in mobilizing as well as allocating resources for thepzivate sector. Access to financial services is an important means of helping the poor pursue a betterlivelihood -- to invest, to smooth consumption, and to cope with risk. Access to India's formal financialinstitutions, however, is far from easy, and borrowing can itself be risky. Getting credit through informalchannels, many of the (especially rural) poor are highly indebted, and their responses when asked aboutbetter access to credit are enlightening "We don't want a loan. We don't want to take the risk We willget half of what we askfor and have to repay everything", (Consultations in Allahabad district,Srivastava, 1996). In contrast, focus group discussions in urban slum areas suggest there may be greaterinterest among the urban poor in obtaining credit for productive purposes (Parker, Kukreja, and Kozel,2001). Although some informants expressed credit wariness, many others were well aware that starting asmall business (typically a shop) could improve their economic well-being and were willing to borrow inorder to do so. Their statements differed markedly from those heard in similar rural consultations, wherevillagers have less access to markets and far greater wariness about debt. The urban poor, whoseenvironment is richer in commercial and entrepreneurial opportunities, may be better positioned toproductively utilize financial services than their rural counterparts.
4.18 High transaction costs along with absence of suitable collateral are two important reasons whythe poor in Uttar Pradesh often have been unable to access credit from institutional agencies. Poor
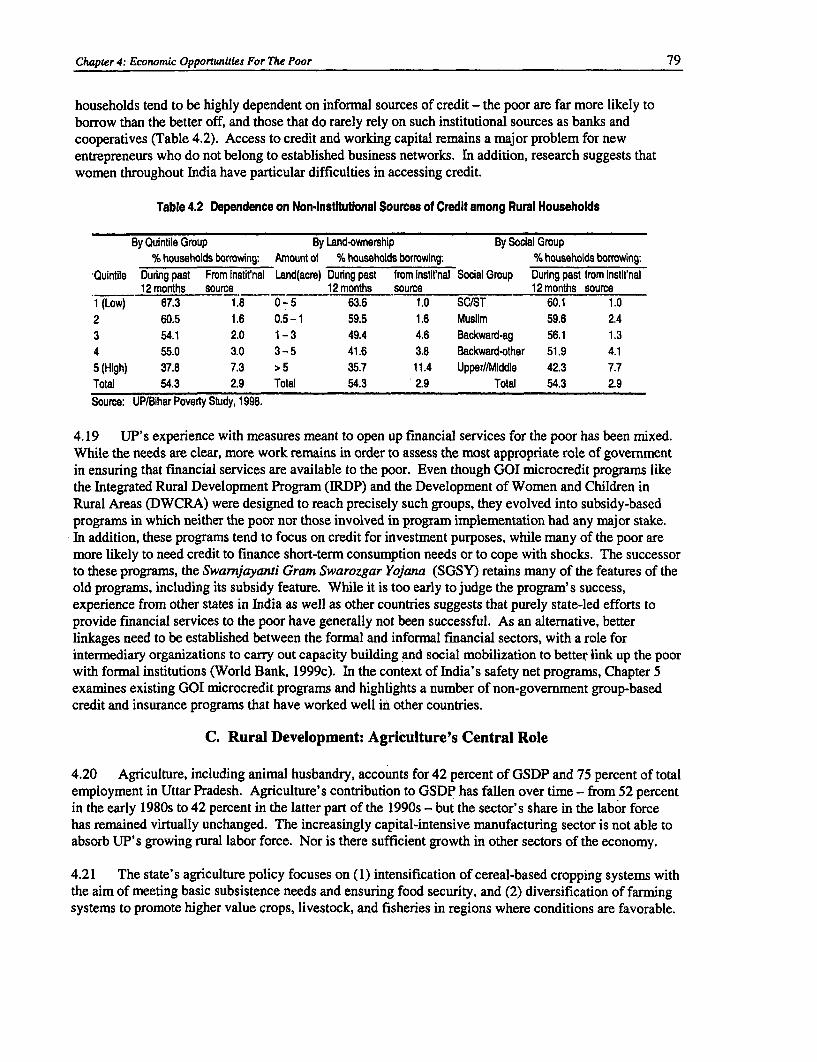
Chapter 4: Economic Opportunities For The Poor 79
households tend to be highly dependent on informal sources of credit - the poor are far more likely toborrow than the better off, and those that do rarely rely on such institutional sources as banks andcooperatives (Table 4.2). Access to credit and working capital remains a major problem for newentrepreneurs who do not belong to established business networks. In addition, research suggests thatwomen throughout India have particular difficulties in accessing credit.
Table 4.2 Dependence on Non-Institutional Sources of Credit among Rural Households
By Quintile Group By Land-ownership By Social Group% households borrowing: Amount of % households borrowing: % households borrowing:
Quintile During past From instit'nal Land(acre) During past from instifnal Social Group During past from instit'nal12 months source 12 months source 12 months source
1 (Low) 67.3 1.8 0-5 63.6 1.0 SC/ST 60.1 1.02 60.5 1.6 0.5 -1 59.5 1.6 Muslim 59.6 2.43 54.1 2.0 1 - 3 49.4 4.6 Backward-ag 56.1 1.34 55.0 3.0 3 - 5 41.6 3.8 Backward-other 51.9 4.15 (High) 37.8 7.3 > 5 35.7 11.4 Upper//Middle 42.3 7.7Total 54.3 2.9 Total 54.3 2.9 Total 54.3 2.9Source: UP/Bihar Poverty Study, 1998.
4.19 UP' s experience with measures meant to open up financial services for the poor has been mixed.While the needs are clear, more work remains in order to assess the most appropriate role of governmentin ensuring that financial services are available to the poor. Even though GOI microcredit programs likethe Integrated Rural Development Program (IRDP) and the Development of Women and Children inRural Areas (DWCRA) were designed to reach precisely such groups, they evolved into subsidy-basedprograms in which neither the poor nor those involved in program implementation had any major stake.In addition, these programs tend to focus on credit for investment purposes, while many of the poor aremore likely to need credit to finance short-term consumption needs or to cope with shocks. The successorto these programs, the Swamjayanti Gram Swarozgar Yojana (SGSY) retains many of the features of theold programs, including its subsidy feature. While it is too early to judge the program's success,experience from other states in India as well as other countries suggests that purely state-led efforts toprovide financial services to the poor have generally not been successful. As an alternative, betterlinkages need to be established between the formal and informal financial sectors, with a role forintermediary organizations to carry out capacity building and social mobilization to better link up the poorwith formal institutions (World Bank, 1999c). In the context of India's safety net programs, Chapter 5examines existing GOI microcredit programs and highlights a number of non-government group-basedcredit and insurance programs that have worked well in other countries.
C. Rural Development: Agriculture's Central Role
4.20 Agriculture, including animal husbandry, accounts for 42 percent of GSDP and 75 percent of totalemployment in Uttar Pradesh. Agriculture's contribution to GSDP has fallen over time - from 52 percentin the early 1980s to 42 percent in the latter part of the 1990s - but the sector's share in the labor forcehas remained virtually unchanged. The increasingly capital-intensive manufacturing sector is not able toabsorb UP's growing rural labor force. Nor is there sufficient growth in other sectors of the economy.
4.21 The state's agriculture policy focuses on (1) intensification of cereal-based cropping systems withthe aim of meeting basic subsistence needs and ensuring food security, and (2) diversification of farmingsystems to promote higher value crops, livestock, and fisheries in regions where conditions are favorable.
80 Chapter 4: Economic Opportunities For The Poor
The aim is to expand employment opportunities for the landless and near-landless, thereby helping toreduce poverty. With foodgrains currently receiving over 80 percent of the allocation of public funding,there is an urgent need to mobilize more public as well as private support for agricultural diversification(Sharma, 1996).
4.22 Agriculture in Uttar Pradesh has rich albeit largely unrealized potential. Except for the Hills(excluding its Terai areas) and the Southern region, which are rain-fed and semi-arid, most of the Statelies in the fertile Indo-Gangetic Plain with high natural soil fertility and abundant rainfall, and surface andgroundwater resources. The significant regional variation in levels of agricultural development andgrowth over the past three decades is reflected in differential levels of and declines in poverty (Chapter 2).The Western region dominates, both in terms of food grain production (although the gap with otherregions has been narrowing) as well as production of other, higher-value crops. History plays a role inthis; the Western region was the springboard of the green revolution in Uttar Pradesh, which was biasedtowards crops such as wheat and sugarcane, already prevalent in the West. Agriculture growth rates wereparticularly high in the Western region through the sixties and seventies, bolstered by extensive publicand private investment in irrigation.
4.23 Due in part to renewed policy concerns with the growing disparities within the state andconcomitant increases in public spending, foodgrain production (primarily rice) in the Central and Easternregions picked up in the eighties. However, progress has remained slow in the poorer Bundelkhandregion, and gaps between Bundelkhand and the rest of the state are continuing to widen. By the mid-1990s, crop value per acre in Bundelkhand was on average less than half that for the Western region,while crop value per acre in both the Eastern and Central regions averaged two-thirds that of the West(Bhalla and Singh, 1996). At present, the Western region still dominates in terms of foodgrainproduction: despite some catch-up in the seventies and eighties, foodgrain yield per acre in the Easternregion is only 80 percent of the yield in the Western region. And the west-to-east gap widens when oneconsiders all crops: the West has witnessed greater diversification of output and has more area underhigh-value commercial crops.
Effect on Poverty
4.24 Currently and for the foreseeable future, agriculture plays an important role in combating povertyin the state. Its growth not only has a direct impact on incomes of rural farming households; it alsostimulates growth in the non-agricultural sector through demand as well as supply linkages and elevatesrural wages both directly through increased demand for labor and indirectly through higher demand fornon-agriculture labor. Strong production and consumption linkages connect agricultural growth and thenon-farm sector, including growth in demand for inputs, services, distribution, and consumer goods. Theimpact of agricultural growth on non-farm incomes in UP -- already quite substantial - has beenincreasing over ,ime, particularly in areas with high incomes from agriculture, better infrastructure, andhigh rural densities, leading to a high growth of employment in the non-farm economy (Singh, 1998).
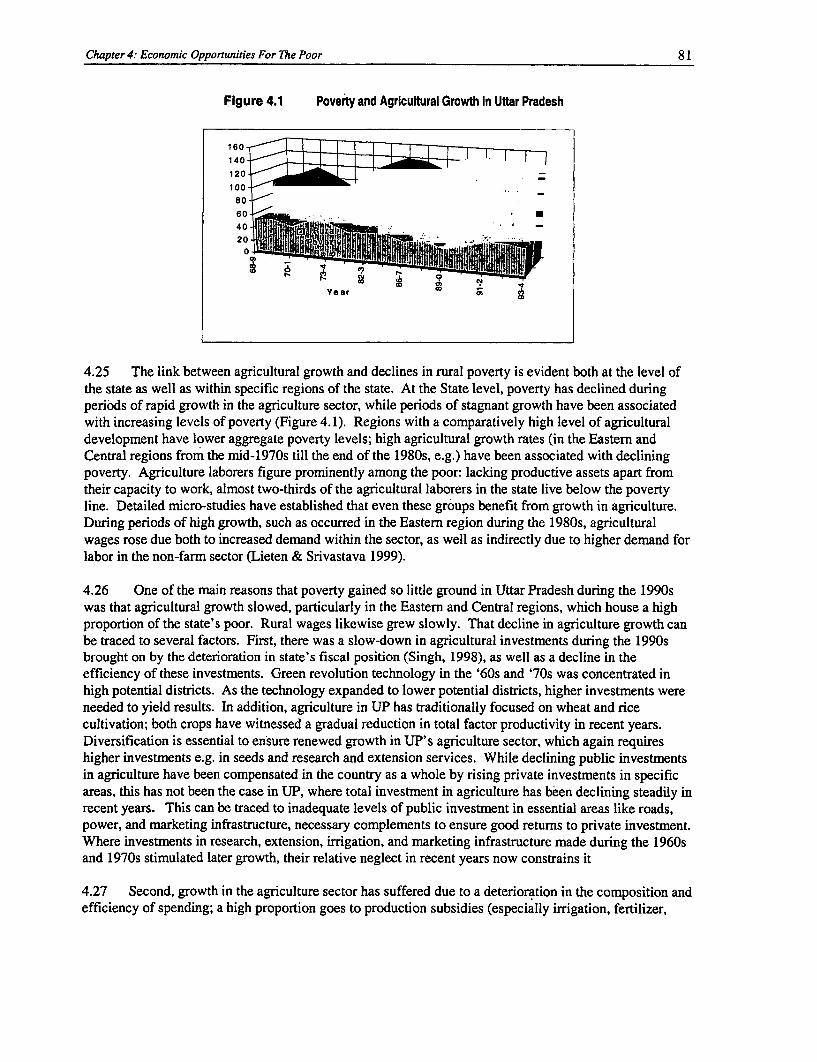
Chapter 4: Economic Opportunities For The Poor 81
Figure 4.1 Poverty and Agricultural Growth In Uttar Pradesh
160140
80-_
e~~~~~y ar
Yeanr -
4.25 The link between agricultural growth and declines in rural poverty is evident both at the level ofthe state as well as within specific regions of the state. At the State level, poverty has declined duringperiods of rapid growth in the agriculture sector, while periods of stagnant growth have been associatedwith increasing levels of poverty (Figure 4.1). Regions with a comparatively high level of agriculturaldevelopment have lower aggregate poverty levels; high agricultural growth rates (in the Eastern andCentral regions from the mid-1970s till the end of the 1980s, e.g.) have been associated with decliningpoverty. Agriculture laborers figure prominently among the poor: lacking productive assets apart fromtheir capacity to work, almost two-thirds of the agricultural laborers in the state live below the povertyline. Detailed micro-studies have established that even these groups benefit from growth in agriculture.During periods of high growth, such as occurred in the Eastern region during the 1980s, agriculturalwages rose due both to increased demand within the sector, as well as indirectly due to higher demand forlabor in the non-farm sector (Lieten & Srivastava 1999).
4.26 One of the main reasons that poverty gained so little ground in Uttar Pradesh during the 1990swas that agricultural growth slowed, particularly in the Eastern and Central regions, which house a highproportion of the state's poor. Rural wages likewise grew slowly. That decline in agriculture growth canbe traced to several factors. First, there was a slow-down in agricultural investments during the 1990sbrought on by the deterioration in state's fiscal position (Singh, 1998), as well as a decline in theefficiency of these investments. Green revolution technology in the '60s and '70s was concentrated inhigh potential districts. As the technology expanded to lower potential districts, higher investments wereneeded to yield results. In addition, agriculture in UP has traditionally focused on wheat and ricecultivation; both crops have witnessed a gradual reduction in total factor productivity in recent years.Diversification is essential to ensure renewed growth in UP's agriculture sector, which again requireshigher investments e.g. in seeds and research and extension services. While declining public investmentsin agriculture have been compensated in the country as a whole by rising private investments in specificareas, this has not been the case in UP, where total investment in agriculture has been declining steadily inrecent years. This can be traced to inadequate levels of public investment in essential areas like roads,power, and marketing infrastructure, necessary complements to ensure good returns to private investment.Where investments in research, extension, irrigation, and marketing infrastructure made during the 1960sand 1970s stimulated later growth, their relative neglect in recent years now constrains it
4.27 Second, growth in the agriculture sector has suffered due to a deterioration in the composition andefficiency of spending; a high proportion goes to production subsidies (especially irrigation, fertilizer,
82 Chapter 4:. Economic Opportunities For The Poor
credit, and power) that lead to inefficiencies without generating positive effects on poverty and thedemand for labor. Government has allowed these subsidies to crowd out crucial investments in roads andirrigation, impact on operations and maintenance, and ultimately squeeze spending in key social sectorsand the provision of basic services (World Bank, 1999c).
4.28 In addition, over-regulation in agriculture as well as agro-processing contributes to low growth inthe agriculture sector; the regulatory environment is characterized by poor management and pervasivecontrols on the marketing of agriculture commodities, a situation that taxes farmers as well as consumers.These regulations, lifted when supply conditions are favorable, increase uncertainty and transaction costsin marketing, encourage rent-seeking on the part of officials, and discourage investments and entry by theprivate sector. Food prices rose in the nineties, which hurt the poor (net purchasers of food grains) in theshort run. And inefficiencies in agricultural markets, exposed to external competition, lowered farm gateprices and reduced market opportunities, which served to discourage private investment at a time whenpublic investment was also being squeezed. For rice and wheat in particular, the combined impact oflarge consumer-price subsidies and buffer-stock costs (India currently has a buffer stock estimated at 50million tons), inefficient public-sector marketing channels, and highly regulated markets impose heavyfiscal and social costs (World Bank, 1999d). As noted above, diversification into higher value crops hasalso been taking place only slowly, due to lack of adequate investments in agriculture research andextension, marketing support and infrastructure, and expansion in credit facilities.
4.29 Reversing this trend -as well as improving quality and efficiency to restore high rates ofagricultural growth-will require bold thrusts in public investments as well as public policy. A recentWorld Bank report (World Bank, 1999c) on rural development and poverty reduction India-widehighlights the need for critical action along a number of fronts. In addition, a background paper preparedin support of India's Tenth Five Year Plan (Saxena, 2001) raises similar concerns and notes actions to putagriculture on a higher growth trajectory. These include:
* Cut spending on input subsidies which rarely benefit the poor and impose increasingly seriousdistortions in agriculture;
* Increase investments in irrigation, seeds, power and roads;* Improve the use of groundwater, especially in Eastern states like UP. Also improve operations
and maintenance of canal systems, involve users groups in management, price water to coverO&M costs;
* Strengthen post-harvest handling and processing, storage/cold storage facilities;* Support broader provision of more effective and equitable rural services;* Reanimate the rural financial system, make it more efficient and market-oriented; also improve
the state cooperative laws;* Adjust agriculture price policies, as well as those influencing the rural non-farm economy to
encourage growth, diversification, and private investment in agriculture.
4.30 While GOI has a role in developing policies and regulations for the agriculture sector, stategovernments have an essential role in implementation and enforcement. State involvement has focusedon technology development and transfer, delivery of (primarily surface) irrigation, and power. Irrigationand other physical infrastructure are in urgent need of higher and more efficient public investment, inparticular for power (for irrigation) and market roads, as well as agricultural research and extension.Steps should be taken to deregulate in favor of the poor, improve access to credit and financial services,and undertake institutional as well as land reforms. The discussion in the remainder of the section focusesprimarily on priority measures for the state.
Chapter 4: Economic Opportunities For The Poor 83
4.31 Irrigation has a strong impact on agricultural productivity and growth. An estimated 70 percentof the state's total cropped areas is irrigated. The highest proportion of irrigated area is in the Westernregion (81 percent), followed by the Central region (66 percent), the Eastern region (61 percent), and theBundelkhand and Hills (38 and 35 percent, respectively.) Both canal irrigation and use of privatetubewells expanded rapidly through the eighties in UP's poorer regions, helping to close the gap with theWest. However, total public investments in irrigation in Uttar Pradesh have fallen in the past few yearswithout private action taking up the shortfall. Private investment is essential for groundwater irrigation,while public investment supports surface irrigation. The number of private pump-sets and tube-wellsinstalled since 1990 and additional irrigation potential created in medium and large projects has declined,particularly in the latter part of the nineties due in large part to the worsening fiscal situation.
4.32 Water management is a particular problem; the utilization rate of the canal irrigation system hasfallen over time, groundwater resources are inefficiently exploited and inequitably shared. Powershortages that have made irrigated agriculture highly risky in areas primarily dependent on groundwatersupplies have resulted in lower yields and overall productivity. More effective management ofgroundwater exploitation is essential throughout the state, but particularly in Eastern UP where povertylevels are high, average land holdings are falling, and small and marginal farmers currently account forover 80 percent of agricultural households.
4.33 While UP's current fiscal crisis makes it unlikely that public investments in irrigation willincrease dramatically in the short run, a number of important cost-saving and revenue-enhancingmeasures can markedly improve public irrigation infrastructure in the state. An example: giving priorityto better system maintenance, particularly canal irrigation, can lead to substantial water savings. Byraising more resources through user charges in public irrigation from those who benefit from itsprovision, the government would be better placed to cover critical O&M expenditures. Finally, moreefficient local water markets as well as effective community management of irrigation resources couldbypass bureaucratic problems and overcome free-rider issues inherent in such management. Carefulattention in the course of such a transition needs to be directed to institutional design and incentive issuesto ensure that bodies such as Water Users Associations (WUAs) in the state function effectively on a self-sustaining basis. Critical problems of water and land management in several regions of UP requiresupporting public investment and institutional structure. Where some of these problems have beenaddressed (as in the UP Sodic Lands Project, Box 4.3), there has been a significant impact on productionand productivity even on very marginal lands.
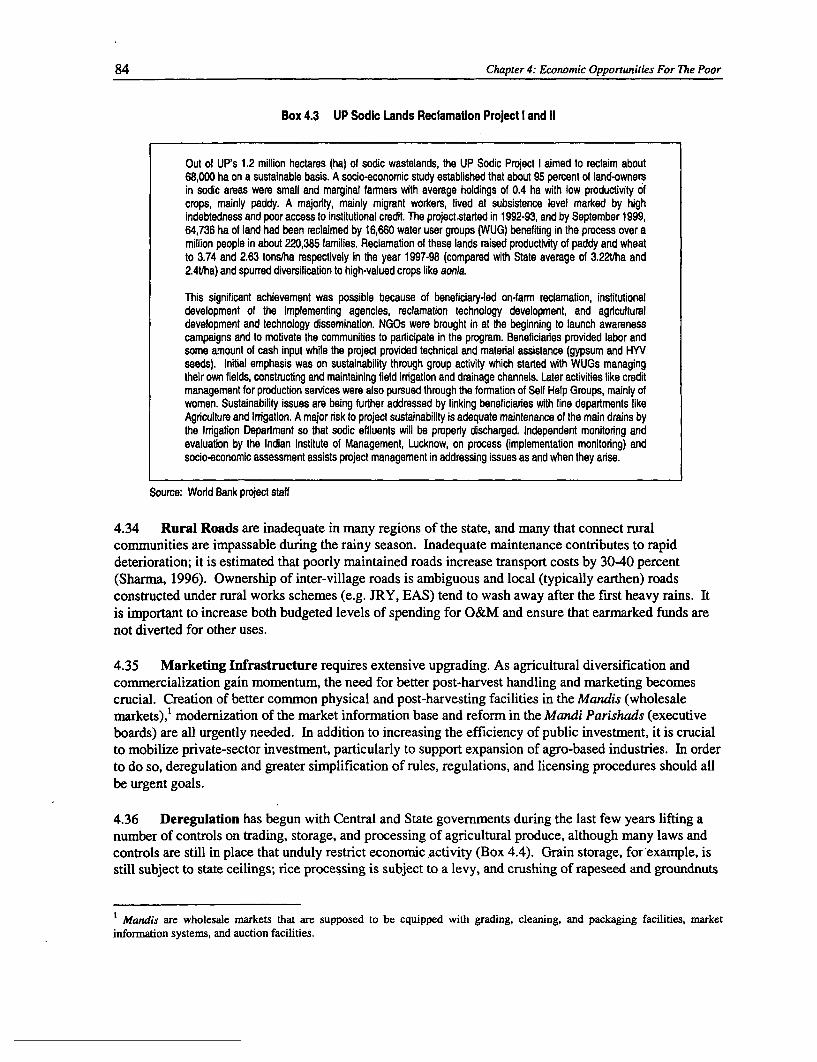
84 Chapter 4: Economic Opportunities For The Poor
Box 4.3 UP Sodic Lands Reclamation Project I and 11
Out of UP's 1.2 million hectares (ha) of sodic wastelands, the UP Sodic Project I aimed to reclaim about68,000 ha on a sustainable basis. A socio-economic study established that about 95 percent of land-ownersin sodic areas were small and marginal farmers with average holdings of 0.4 ha with low productivity ofcrops, mainly paddy. A majority, mainly migrant workers, lived at subsistence level marked by highindebtedness and poor access to institutional credit. The projectstarted in 1992-93, and by September 1999,64,736 ha of land had been reclaimed by 16,660 water user groups (WUG) benefiting in the process over amillion people in about 220,385 families. Reclamation of these lands raised productivity of paddy and wheatto 3.74 and 2.63 tons/ha respectively in the year 1997-98 (compared with State average of 3.22t/ha and2.4t/ha) and spurred diversification to high-valued crops like aonla.
This significant achievement was possible because of beneficiary-led on-farm reclamation, institutionaldevelopment of the implementing agencies, reclamation technology development, and agriculturaldevelopment and technology dissemination. NGOs were brought in at the beginning to launch awarenesscampaigns and to motivate the communities to participate in the program. Beneficiaries provided labor andsome amount of cash input while the project provided technical and material assistance (gypsum and HYVseeds). Initial emphasis was on sustainability through group activity which started with WUGs managingtheir own fields, constructing and maintaining field irrigation and drainage channels. Later activities like creditmanagement for production services were also pursued through the formation of Self Help Groups, mainly ofwomen. Sustainability issues are being further addressed by linking beneficiaries with line departments likeAgriculture and Irrigation. A major risk to project sustainability is adequate maintenance of the main drains bythe Irrigation Department so that sodic effluents will be properiy discharged. Independent monitoring andevaluation by the Indian Institute of Management, Lucknow, on process (implementation monitoring) andsocio-economic assessment assists project management in addressing issues as and when they arise.
Source: World Bank project staff
4.34 Rural Roads are inadequate in many regions of the state, and many that connect ruralcommunities are impassable during the rainy season. Inadequate maintenance contributes to rapiddeterioration; it is estimated that poorly maintained roads increase transport costs by 30-40 percent(Sharma, 1996). Ownership of inter-village roads is ambiguous and local (typically earthen) roadsconstructed under rural works schemes (e.g. JRY, EAS) tend to wash away after the first heavy rains. Itis important to increase both budgeted levels of spending for O&M and ensure that earmarked funds arenot diverted for other uses.
4.35 Marketing Infrastructure requires extensive upgrading. As agricultural diversification andcommercialization gain momentum, the need for better post-harvest handling and marketing becomescrucial. Creation of better common physical and post-harvesting facilities in the Mandis (wholesalemarkets),' modernization of the market information base and reform in the Mandi Parishads (executiveboards) are all urgently needed. In addition to increasing the efficiency of public investment, it is crucialto mobilize private-sector investment, particularly to support expansion of agro-based industries. In orderto do so, deregulation and greater simplification of rules, regulations, and licensing procedures should allbe urgent goals.
4.36 Deregulation has begun with Central and State governments during the last few years lifting anumber of controls on trading, storage, and processing of agricultural produce, although many laws andcontrols are still in place that unduly restrict economic activity (Box 4.4). Grain storage, for example, isstill subject to state ceilings; rice processing is subject to a levy, and crushing of rapeseed and groundnuts
Mandis are wholesale markets that are supposed to be equipped with grading, cleaning, and packaging facilities, marketinformation systems, and auction facilities.
Chapter 4: Economic Opportunities For The Poor 85
is still subject to small-scale reservation. Regulated markets, moreover, impose a mandi tax every timegrain is resold, sometimes resulting in multiple taxation.
Box 4.4 Llcensing Laws In Uttar Pradesh
The UP Scheduled Commodity Dealers (Licensing and Restriction) Order, 1989, requires a dealer to obtain a license if s/hecames on the business of sale/purchase of certain scheduled commodities in specified quantities (for example 10 quintals ormore of foodgrains of any kind). It also restrcts forward trading in such commodities.The UP. Flour Mills Licensing Order, 1966, requires the owners or persons-in-charge of a flour mill, if operated by electricity ormineral oil, to obtain a license from the District Magistrate. The power of entry, search, and seizure has been given to FoodOfficers.UP Rice and Paddy (Levy and Regulation or Trade) Order, 1985. As per this order, every licensed miller shall sell and deliverto the govemment, at the notified price, sixty percent of each variety of rice (relaxed to 40 percent in the Varanasi andGorakhpur zones). The movement of rice or sale of rice can be done only after obtaining a release certificate from thegovemment.U.P. Regulation of Rice Hullers Order, 1975. Under the order, a permit or license has to be obtained under the Rice-MillingIndustry (Regulation) Act, 1958, for running a rice milling operation. Additionally, the miller has to comply with the provisions ofthe UP Rice and Paddy (Levy) Order, 1985.
Source: Wordd Bank 1 999d.
4.37 Removing obstacles that hinder the poor as well as deregulating markets that work in favor of thepoor would also help expand economic opportunities. For example, easing licensing restrictions on milk-processing capacity in Uttar Pradesh has led to a doubling of such capacity within four years. This hashad a tremendously beneficial impact on the livestock economy in the state, which has been largelydependent upon female labor; yields and returns have increased along the milk routes and collectioncenters. In addition, research suggests that maintaining livestock, and in particular milch animals, canprovide informal insurance and thus help poor households cope with unanticipated shocks.
4.38 Second-Generation Agrarian Reforms that impact on the structure and regulation of the landmarket could aid the landless and near-landless. Poverty is strongly associated with the total amount ofagricultural land owned by a household; farmers owning less than 0.4 hectares of land are more thantwice as likely to be poor as those with two or more hectares (Chapter 2). With increased subdivision andfragmentation of landholdings over the years, nearly three-quarters of households in 1999-00 owned lessthan 1 hectare of land (Table 4.3) as compared to two-thirds of households in 1993-94. To put this inperspective, the minimum viable economic landholding in the state is estimated to be 1-1.5 hectares onaverage 2. State-wide, land holdings average only .7 hectares per household; there is not enough land toensure dramatically improved incomes for the poor through large-scale land redistribution. In any case,large-scale land redistribution has proven to be politically and socially unfeasible in Uttar Pradesh, as in anumber of Indian states.
2These figures represent state-level averages. Less land would be needed in fertile areas with good access toirrigation.
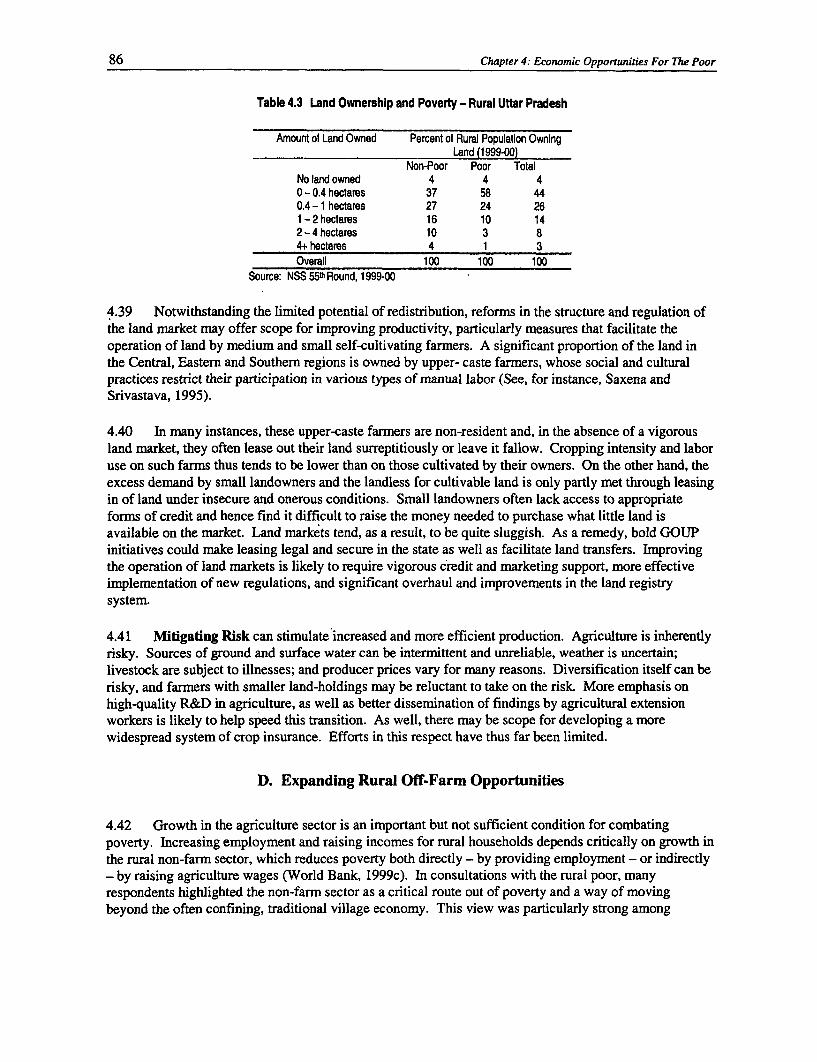
86 Chapter 4: Economic Opportunities For The Poor
Table 4.3 Land Ownership and Poverty - Rural Uttar Pradesh
Amount of Land Owned Percent of Rural Population OwningLand (1999-00)
Non-Poor Poor TotalNo land owned 4 4 40 - 0.4 hectares 37 58 440.4-1 hectares 27 24 261-2hectares 16 10 142-4hectares 10 3 84+ hectares 4 1 3Overall 100 100 100
Source: NSS 5512 Round, 1999-00
4.39 Notwithstanding the limited potential of redistribution, reforms in the structure and regulation ofthe land market may offer scope for improving productivity, particularly measures that facilitate theoperation of land by medium and small self-cultivating farmers. A significant proportion of the land inthe Central, Eastern and Southern regions is owned by upper- caste farmers, whose social and culturalpractices restrict their participation in various types of manual labor (See, for instance, Saxena andSrivastava, 1995).
4.40 In many instances, these upper-caste farmers are non-resident and, in the absence of a vigorousland market, they often lease out their land surreptitiously or leave it fallow. Cropping intensity and laboruse on such farms thus tends to be lower than on those cultivated by their owners. On the other hand, theexcess demand by small landowners and the landless for cultivable land is only partly met through leasingin of land under insecure and onerous conditions. Small landowners often lack access to appropriateforms of credit and hence find it difficult to raise the money needed to purchase what little land isavailable on the market. Land markets tend, as a result, to be quite sluggish. As a remedy, bold GOUPinitiatives could make leasing legal and secure in the state as well as facilitate land transfers. Improvingthe operation of land markets is likely to require vigorous credit and marketing support, more effectiveimplementation of new regulations, and significant overhaul and improvements in the land registrysystem.
4.41 Mitigating Risk can stimulate increased and more efficient production. Agriculture is inherentlyrisky. Sources of ground and surface water can be intermittent and unreliable, weather is uncertain;livestock are subject to illnesses; and producer prices vary for many reasons. Diversification itself can berisky, and farmers with smaller land-holdings may be reluctant to take on the risk. More emphasis onhigh-quality R&D in agriculture, as well as better dissemination of findings by agricultural extensionworkers is likely to help speed this transition. As well, there may be scope for developing a morewidespread system of crop insurance. Efforts in this respect have thus far been limited.
D. Expanding Rural Off-Farm Opportunities
4.42 Growth in the agriculture sector is an important but not sufficient condition for combatingpoverty. Increasing employment and raising incomes for rural households depends critically on growth inthe rural non-farm sector, which reduces poverty both directly - by providing employment - or indirectly- by raising agriculture wages (World Bank, 1999c). In consultations with the rural poor, manyrespondents highlighted the non-farm sector as a critical route out of poverty and a way of movingbeyond the often confining, traditional village economy. This view was particularly strong among

Chapter 4: Economic Opportunities For The Poor 87
individuals at the bottom of the caste hierarchy. In recent years, a growing number of agriculturalhouseholds have diversified into small, part-time or seasonal activities and even full-time salaried orprofessional jobs and businesses, often as a complement to farming. Wealthier households earn incomeprimarily from farming and salaried employment; for the poorest households with little or no land, non-farm casual employment can provide a last-resort source of income - e.g. due to seasonal fluctuations inagriculture employment. However, no matter what the nature of work undertaken, non-agriculturalopportunities are valued highly by households, as they allow them to increase incomes at the margin, aswell as minimize risk through diversification. As the rural economy becomes more diversified, the shareof income derived from non-farm employment has been rising in recent years for both the poor and thebetter-off.
4.43 The UP-Bihar Poverty Study provides some recent evidence. In this sample, average returns fromnon-farm activities are generally higher than wages paid to agricultural laborers (Table 4.4). It is clearthat those fortunate enough to obtain good off-farm opportunities -- salaried jobs in particular -- are likelyto see their economic conditions improve significantly. Even in the case of casual non-farm work,however, earnings per day for work outside agriculture were almost twice those of agricultural workers.In Uttar Pradesh, however, opportunities are not growing as rapidly as they might. The process ofdiversification towards non-agricultural employment has been much slower than in several other Indianstates.
Table 4.4 Work Intensity and Earnings - Rural Uttar Pradesh
Type of Work Average number of Average.EamingsDays worked per year RsJday
Agrcultural labor 83 24Non-agrculture labor 131 44Salared employment 246 117Self-employed 134 114
Source: UP-Bihar Poverty Study, 1998, survey tabulations.
4.44 Research (Lanjouw and Sharriff, 2001) offers additional insights into the importance of the non-farm sector to rural poverty reduction in UP and throughout India. According to data collected by theNational Center forApplied Economic Research (NCAER) in rural India in 1993/94, non-agricultureincome accounts for roughly 40 percent of total rural income in UP. This compares to about a third ofincome for rural India as a whole. Households in the top 20 percent of the per capita income distributionin rural Uttar Pradesh were mainly dependent on cultivation incomes (61 percent) and salaried non-farmemployment (26 percent) The poorest households, in contrast, received less than half of their incomefrom cultivation, and were also heavily reliant on casual agricultural wage employment (contributing 14percent of total income) and casual non-farm wage employment (16%.) For the poor, salaried employedaccounted for barely 5 percent of total income.
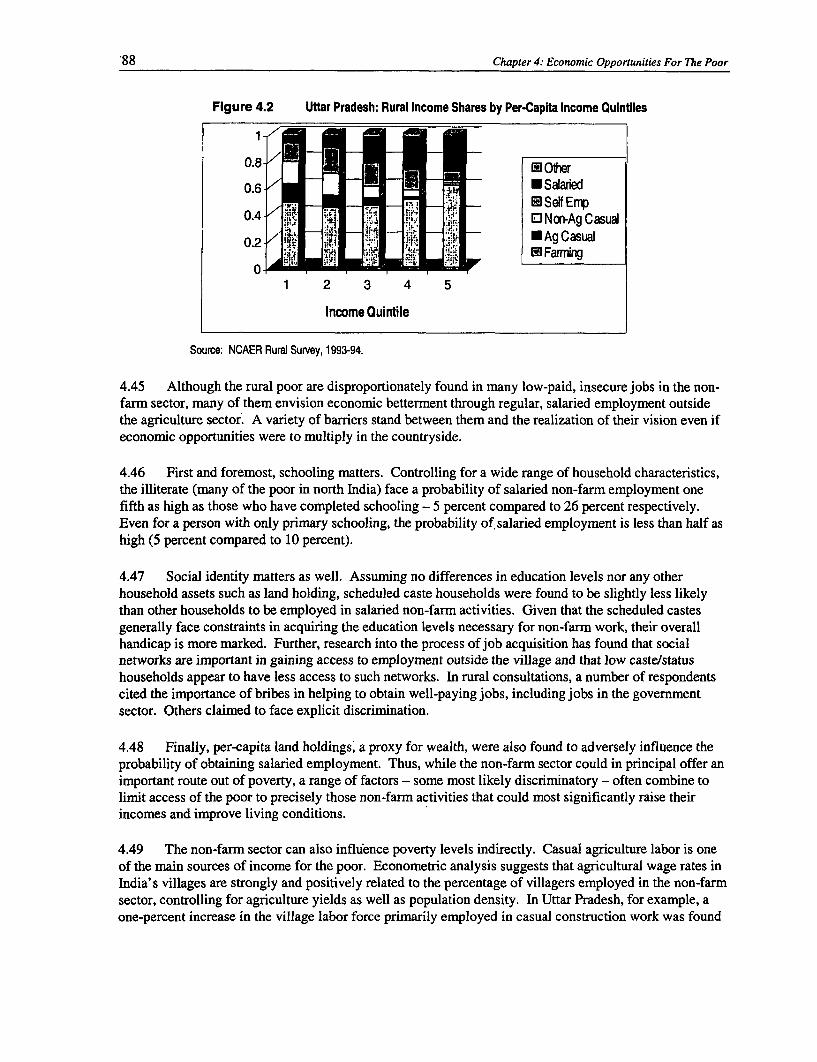
88 Chapter 4: Economic Opportunities For The Poor
Figure 4.2 Uttar Pradesh: Rural Income Shares by Per-Capita Income Quintiles
1- a
0.8- / O__3
0.6- / SalaredEl Self Ei
0.4 - / !_M* _ri ir iiSHET°0. - '- 7 -; _0 Non-Ag Casual
0.2 fl~~~~~~~~~~0Ag Casual02
1 2 3 4 5
Income Quintile
Source: NCAER Rural Survey, 1993-94.
4.45 Although the rural poor are disproportionately found in many low-paid, insecure jobs in the non-farm sector, many of them envision economic betterment through regular, salaried employment outsidethe agriculture sector. A variety of barriers stand between them and the realization of their vision even ifeconornic opportunities were to multiply in the countryside.
4.46 First and foremost, schooling matters. Controlling for a wide range of household characteristics,the illiterate (many of the poor in north India) face a probability of salaried non-farm employment onefifth as high as those who have completed schooling - 5 percent compared to 26 percent respectively.Even for a person with only primary schooling, the probability of salaried employment is less than half ashigh (5 percent compared to 10 percent).
4.47 Social identity matters as well. Assuming no differences in education levels nor any otherhousehold assets such as land holding, scheduled caste households were found to be slightly less likelythan other households to be employed in salaried non-farm activities. Given that the scheduled castesgenerally face constraints in acquiring the education levels necessary for non-farm work, their overallhandicap is more marked. Further, research into the process of job acquisition has found that socialnetworks are important in gaining access to employment outside the village and that low caste/statushouseholds appear to have less access to such networks. In rural consultations, a number of respondentscited the importance of bribes in helping to obtain well-paying jobs, including jobs in the governmentsector. Others claimed to face explicit discrimination.
4.48 Finally, per-capita land holdings, a proxy for wealth, were also found to adversely influence theprobability of obtaining salaried employment. Thus, while the non-farm sector could in principal offer animportant route out of poverty, a range of factors - some most likely discriminatory - often combine tolimit access of the poor to precisely those non-farm activities that could most significantly raise theirincomes and improve living conditions.
4.49 The non-farm sector can also influence poverty levels indirectly. Casual agriculture labor is oneof the main sources of income for the poor. Econometric analysis suggests that agricultural wage rates inIndia's villages are strongly and positively related to the percentage of villagers employed in the non-farmsector, controlling for agriculture yields as well as population density. In Uttar Pradesh, for example, aone-percent increase in the village labor force primarily employed in casual construction work was found
Chapter 4: Economic Opportunities For The Poor 89
to be associated with raises in average daily agricultural wage rates from Rs 22 to Rs 25 and from Rs 25to Rs 30 in sowing and harvesting activities, respectively. The linkage suggests that by tightening villagelabor markets and raising wage rates in agriculture labor, an expanding non-farm sector can help toreduce poverty even for those poor not directly employed off the farm. This finding also gains supportfrom village studies that have documented the expansion of non-farm activities occurring alongside ageneral rise of agricultural wage rates (Jayaraman and Lanjouw, 1999, and Lanjouw and Stem, 1998).
Priorities forAction
4.50 Three main factors determine whether the non-farm sector can grow and work to reduce poverty.First, ensuring high rates of growth and surpluses in the agriculture sector will stimulate growth in therural non-agriculture sector due to multiple and strong production and consumption linkages. Second,there is a need for adequate social and physical infrastructure to ensure the conditions for broad-basedgrowth and good investment opportunities. And third, policies and spending patterns must be put in placeto ensure that the rural non-farm sector has the capacity to adjust and modernize in response to conditionsbrought about by globalization, increasing competition, and changing demands from consumers (WorldBank, 1999c).
E. Widening Opportunities for the Socially Excluded
4.51 Social identity has fundamental effects on welfare levels but, since its impact through theeconomy is less clear, it is uncertain what measures would ensure more equitable outcomes for thesocially stigmatized - in particular women and lower caste individuals. The issues are complex andbeyond the scope of the present report. This section merely highlights some key concerns and suggestsdirections for policy change.
Expanding Opportunities for Women
4.52 With a significantly larger proportion of female workers concentrated in low-paid casual work,primarily in the agriculture sector, compared to men, the rate of female increase in labor forceparticipation in the non-farm sector has been relatively slow. As of 1993-94, only 10 percent of ruralfemale workers were engaged in non-agricultural activities. In consequence, there has been afeminization of the agricultural workforce, and the proportion of both female cultivators and femaleagricultural laborers has grown. One possible cause of this shift is male migration in search of better-paidoff-farm employment. As men leave their areas of origin to seek higher wages, many women are leftbehind to take up casual employment in the agriculture sector -- low paid, low status, dead-end work (Box4.5). Cultural factors constrain women's ability to move freely for economic purposes.
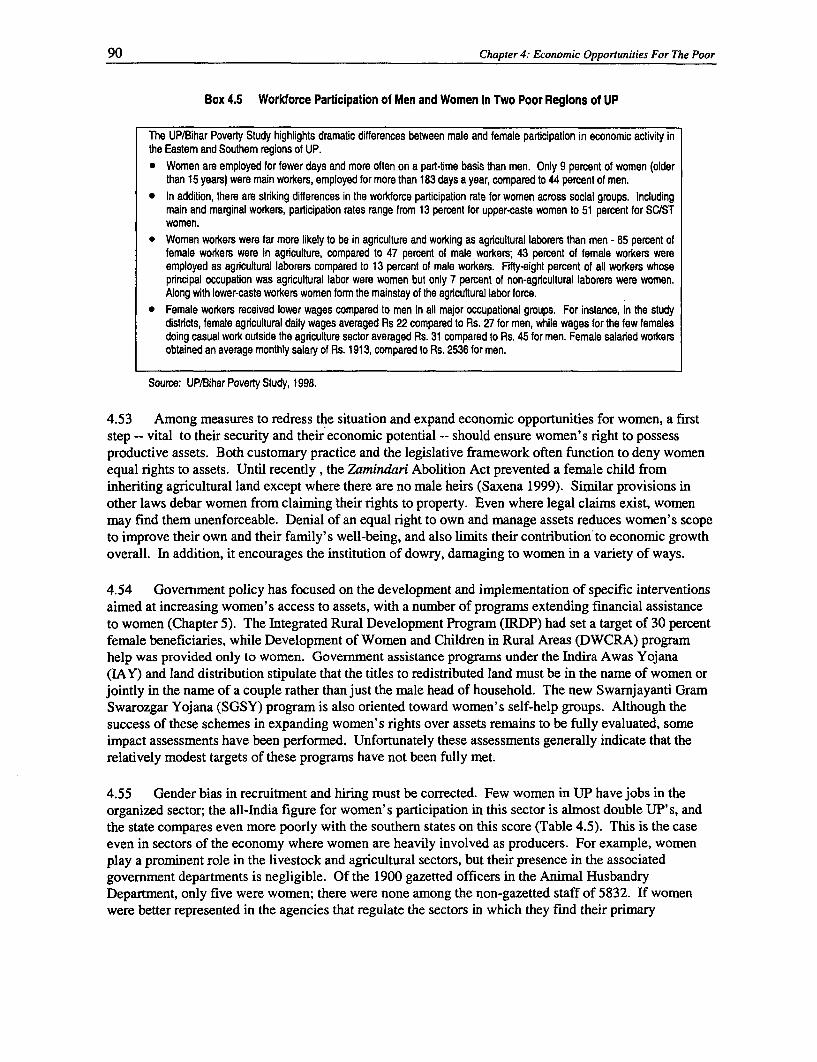
90 Chapter 4: Economic Opportunities For The Poor
Box 4.5 Workforce Participation of Men and Women in Two Poor Regions of UP
The UP/Bihar Poverty Study highlights dramatic differences between male and female participation in economic activity inthe Eastern and Southem regions of UP.* Women are employed for fewer days and more often on a part-time basis than men. Only 9 percent of women (older
than 15 years) were main workers, employed for more than 183 days a year, compared to 44 percent of men.* In addition, there are strking differences in the workforce participation rate for women across social groups. Including
main and marginal workers, participation rates range from 13 percent for upper-caste women to 51 percent for SC/STwomen.
* Women workers were far more likely to be in agrculture and working as agricultural laborers than men - 85 percent offemale workers were in agriculture, compared to 47 percent of male workers; 43 percent of female workers wereemployed as agricultural laborers compared to 13 percent of male workers. Fifty-eight percent of all workers whoseprincipal occupation was agricultural labor were women but only 7 percent of non-agricultural laborers were women.Along with lower-caste workers women form the mainstay of the agricultural labor force.
* Female workers received lower wages compared to men in all major occupational groups. For instance, in the studydistricts, female agricultural daily wages averaged Rs 22 compared to Rs. 27 for men, while wages for the few femalesdoing casual work outside the agriculture sector averaged Rs. 31 compared to Rs. 45 for men. Female salaried workersobtained an average monthly salary of Rs. 1913, compared to Rs, 2536 for men.
Source: UP/Bihar Poverty Study, 1998.
4.53 Among measures to redress the situation and expand economic opportunities for women, a firststep -- vital to their security and their economic potential -- should ensure women's right to possessproductive assets. Both customary practice and the legislative framework often function to deny womenequal rights to assets. Until recently , the Zamindari Abolition Act prevented a female child frominheriting agricultural land except where there are no male heirs (Saxena 1999). Similar provisions inother laws debar women from claiming their rights to property. Even where legal claims exist, womenmay find them unenforceable. Denial of an equal right to own and manage assets reduces women's scopeto improve their own and their family's well-being, and also limits their contribution to economic growthoverall. In addition, it encourages the institution of dowry, damaging to women in a variety of ways.
4.54 Government policy has focused on the development and implementation of specific interventionsaimed at increasing women's access to assets, with a number of programs extending financial assistanceto women (Chapter 5). The Integrated Rural Development Program (IRDP) had set a target of 30 percentfemale beneficiaries, while Development of Women and Children in Rural Areas (DWCRA) programhelp was provided only to women. Government assistance programs under the Indira Awas Yojana(IAY) and land distribution stipulate that the titles to redistributed land must be in the name of women orjointly in the name of a couple rather than just the male head of household. The new Swarnjayanti GramSwarozgar Yojana (SGSY) program is also oriented toward women's self-help groups. Although thesuccess of these schemes in expanding women's rights over assets remains to be fully evaluated, someimpact assessments have been performed. Unfortunately these assessments generally indicate that therelatively modest targets of these programs have not been fully met.
4.55 Gender bias in recruitment and hiring must be corrected. Few women in UP have jobs in theorganized sector; the all-India figure for women's participation in this sector is almost double UP's, andthe state compares even more poorly with the southern states on this score (Table 4.5). This is the caseeven in sectors of the economy where women are heavily involved as producers. For example, womenplay a prominent role in the livestock and agricultural sectors, but their presence in the associatedgovernment departments is negligible. Of the 1900 gazetted officers in the Animal HusbandryDepartment, only five were women; there were none among the non-gazetted staff of 5832. If womenwere better represented in the agencies that regulate the sectors in which they find their primary
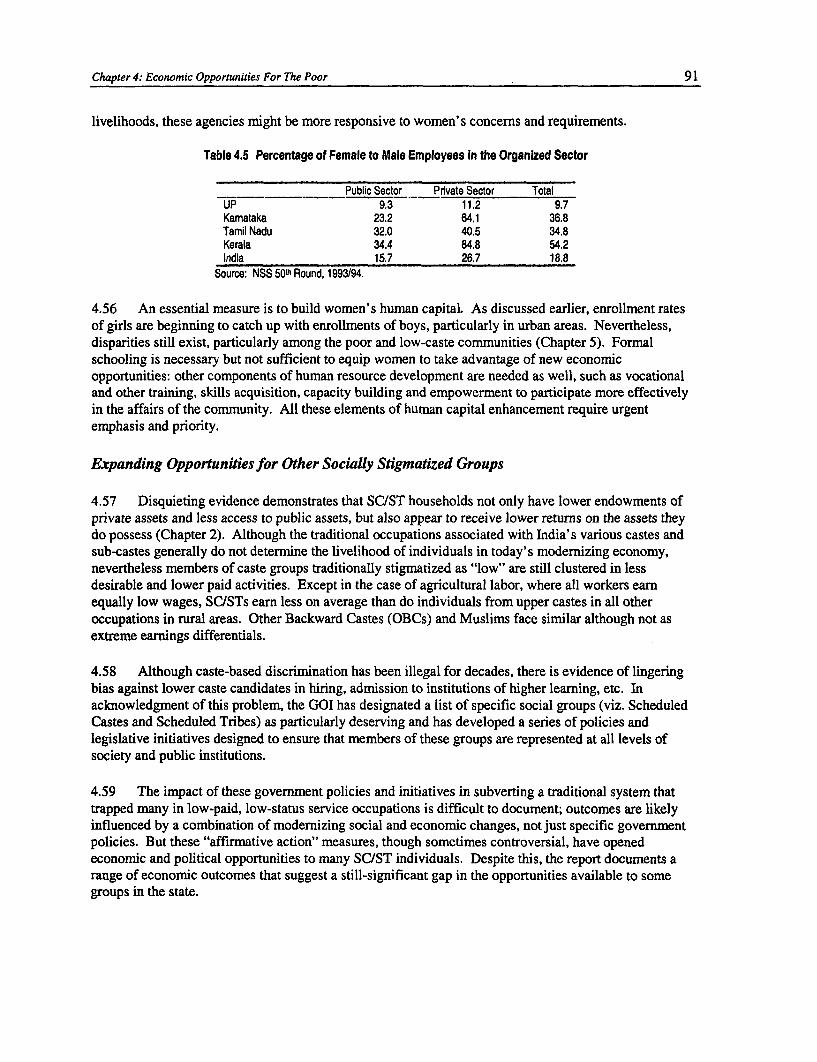
Chapter 4: Economic Opportunities For The Poor 91
livelihoods, these agencies might be more responsive to women's concems and requirements.
Table 4.5 Percentage of Female to Male Employees In the Organized Sector
Public Sector Pnvate Sector TotalUP 9.3 11.2 9.7Kamataka 23.2 64.1 36.8Tamil Nadu 32.0 40.5 34.8Kerala 34.4 84.8 54.2India 15.7 26.7 18.8
Source: NSS 50>' Round, 1993/94.
4.56 An essential measure is to build women's human capitaL As discussed earlier, enrollment ratesof girls are beginning to catch up with enrollments of boys, particularly in urban areas. Nevertheless,disparities still exist, particularly among the poor and low-caste communities (Chapter 5). Formalschooling is necessary but not sufficient to equip women to take advantage of new economicopportunities: other components of human resource development are needed as well, such as vocationaland other training, skills acquisition, capacity building and empowerment to participate more effectivelyin the affairs of the community. All these elements of human capital enhancement require urgentemphasis and priority.
Expanding Opportunities for Other Socially Stigmatized Groups
4.57 Disquieting evidence demonstrates that SC/ST households not only have lower endowments ofprivate assets and less access to public assets, but also appear to receive lower returns on the assets theydo possess (Chapter 2). Although the traditional occupations associated with India's various castes andsub-castes generally do not determine the livelihood of individuals in today's modernizing economy,nevertheless members of caste groups traditionally stigmatized as "low" are still clustered in lessdesirable and lower paid activities. Except in the case of agricultural labor, where all workers earnequally low wages, SC/STs earn less on average than do individuals from upper castes in all otheroccupations in rural areas. Other Backward Castes (OBCs) and Muslims face similar although not asextreme earnings differentials.
4.58 Although caste-based discrimination has been illegal for decades, there is evidence of lingeringbias against lower caste candidates in hiring, admission to institutions of higher learning, etc. Inacknowledgment of this problem, the GOI has designated a list of specific social groups (viz. ScheduledCastes and Scheduled Tribes) as particularly deserving and has developed a series of policies andlegislative initiatives designed to ensure that members of these groups are represented at all levels ofsociety and public institutions.
4.59 The impact of these government policies and initiatives in subverting a traditional system thattrapped many in low-paid, low-status service occupations is difficult to document; outcomes are likelyinfluenced by a combination of modernizing social and economic changes, not just specific governmentpolicies. But these "affirmative action" measures, though sometimes controversial, have openedeconomic and political opportunities to many SC/ST individuals. Despite this, the report documents arange of economic outcomes that suggest a still-significant gap in the opportunities available to somegroups in the state.
92 Chapter 4: Economic Opportunities For The Poor
4.60 In addition, it is not certain that affirmative action policies will have indefinite political support.The question of whether quotas and reservations should be temporary or permanent and if temporary, howlong they should continue, has been raised in recent political debates. In some quarters, affirmative actionis thought to be ineffective and even counterproductive if it does' not lead in time to a system of opencompetition. Affirmative action in hiring, in fact, is unlikely to fully solve the problem of differentialaccess to opportunities based on social identity, unless matching initiatives improve individuals'qualifications and preparedness. Some evidence suggests, for example, that certain types of positionsreserved for SC/STs are perpetually vacant. The advocates of affirmative action see in this a result ofofficial negligence, but another explanation commonly advanced is that the pool of highly educated andexperienced SC/STs who are qualified for these positions is actually very small.
4.61 These questions will not be resolved here. However, it is clear that if SC/ST households do notinvest more heavily in education, relatively few of their members will ever enter or remain in theeducational system long enough to take advantage of current reservations in the university or publicsector employment. The failure to develop their human capital is part of a vicious circle. Because ofdiscrimination, either perceived or actual, SC/ST households do not expect returns to investments ineducation commensurate with those of other households. Discrimination, then, serves as a constraint toinvestments in education. To the extent that affirmative action ameliorates the effects of caste bias, itmay motivate the disadvantaged to invest in education. To be most effective, however, measures aimedat improving the enrollment and retention rates of SC/ST children must begin very early in life, focusingat the local level. The actions could include (i) special scholarship programs (existing programs areineffective); (ii) early childhood education programs targeted to at-risk children; and (iii) stipends andother special incentives.
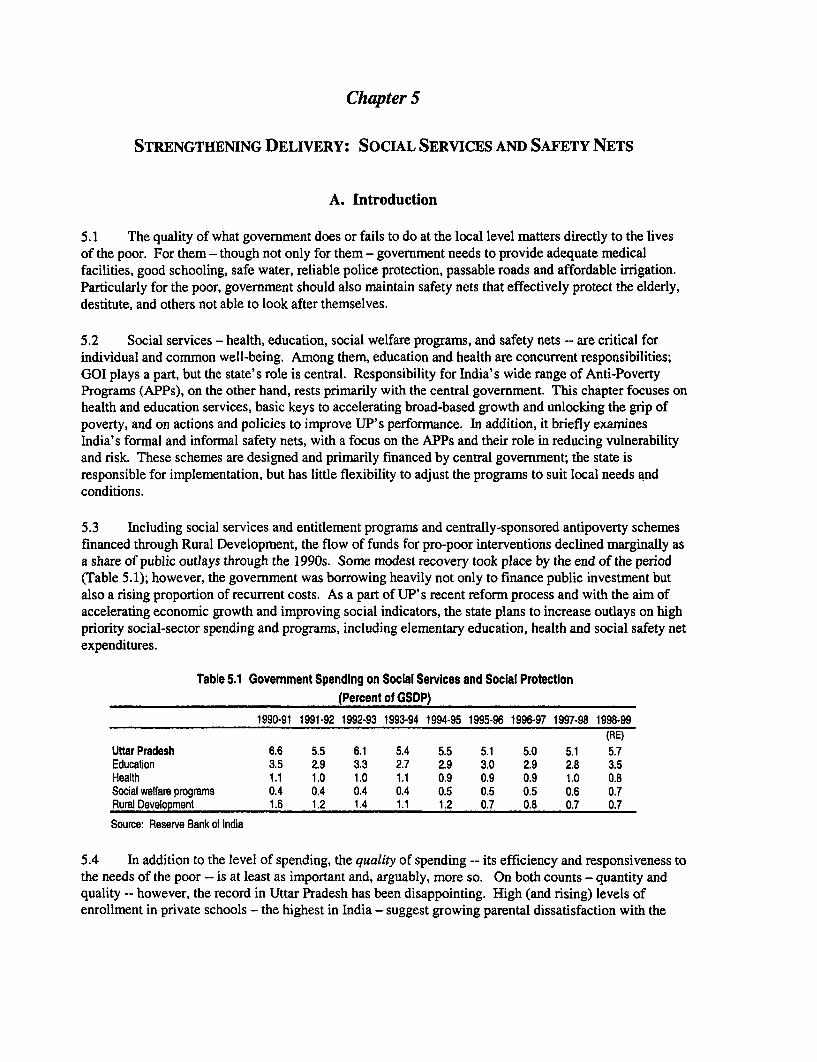
Chapter 5
STRENGTHENING DELIVERY: SOCIAL SERVICES AND SAFETY NETS
A. Introduction
5.1 The quality of what government does or fails to do at the local level matters directly to the livesof the poor. For them - though not only for them - government needs to provide adequate medicalfacilities, good schooling, safe water, reliable police protection, passable roads and affordable irrigation.Particularly for the poor, government should also maintain safety nets that effectively protect the elderly,destitute, and others not able to look after themselves.
5.2 Social services - health, education, social welfare programs, and safety nets -- are critical forindividual and common well-being. Among them, education and health are concurrent responsibilities;GOI plays a part, but the state's role is central. Responsibility for India's wide range of Anti-PovertyPrograms (APPs), on the other hand, rests primarily with the central government. This chapter focuses onhealth and education services, basic keys to accelerating broad-based growth and unlocking the grip ofpoverty, and on actions and policies to improve UP's performance. In addition, it briefly examinesIndia's formal and informal safety nets, with a focus on the APPs and their role in reducing vulnerabilityand risk. These schemes are designed and primarily financed by central government; the state isresponsible for implementation, but has little flexibility to adjust the programs to suit local needs andconditions.
5.3 Including social services and entitlement programs and centrally-sponsored antipoverty schemesfinanced through Rural Development, the flow of funds for pro-poor interventions declined marginally asa share of public outlays through the 1990s. Some modest recovery took place by the end of the period(Table 5.1); however, the government was borrowing heavily not only to finance public investment butalso a rising proportion of recurrent costs. As a part of UP' s recent reform process and with the aim ofaccelerating economic growth and improving social indicators, the state plans to increase outlays on highpriority social-sector spending and programs, including elementary education, health and social safety netexpenditures.
Table 5.1 Government Spending on Social Services and Social Protection(Percent of GSDP)
1990-91 1991-92 1992-93 1993-94 1994-95 1995-96 1996-97 1997-98 1998-99(RE)
Uttar Pradesh 6.6 5.5 6.1 5.4 5.5 5.1 5.0 5.1 5.7Educalion 3.5 2.9 3.3 2.7 2.9 3.0 2.9 2.8 3.5Health 1.1 1.0 1.0 1.1 0.9 0.9 0.9 1.0 0.8Social welfare programs 0.4 0.4 0.4 0.4 0.5 0.5 0.5 0.6 0.7Rural Development 1.6 1.2 1.4 1.1 1.2 0.7 0.8 0.7 0.7
Source: Reserve Bank of India
5.4 In addition to the level of spending, the quality of spending -- its efficiency and responsiveness tothe needs of the poor -- is at least as important and, arguably, more so. On both counts - quantity andquality -- however, the record in Uttar Pradesh has been disappointing. High (and rising) levels ofenrollment in private schools - the highest in India - suggest growing parental dissatisfaction with the
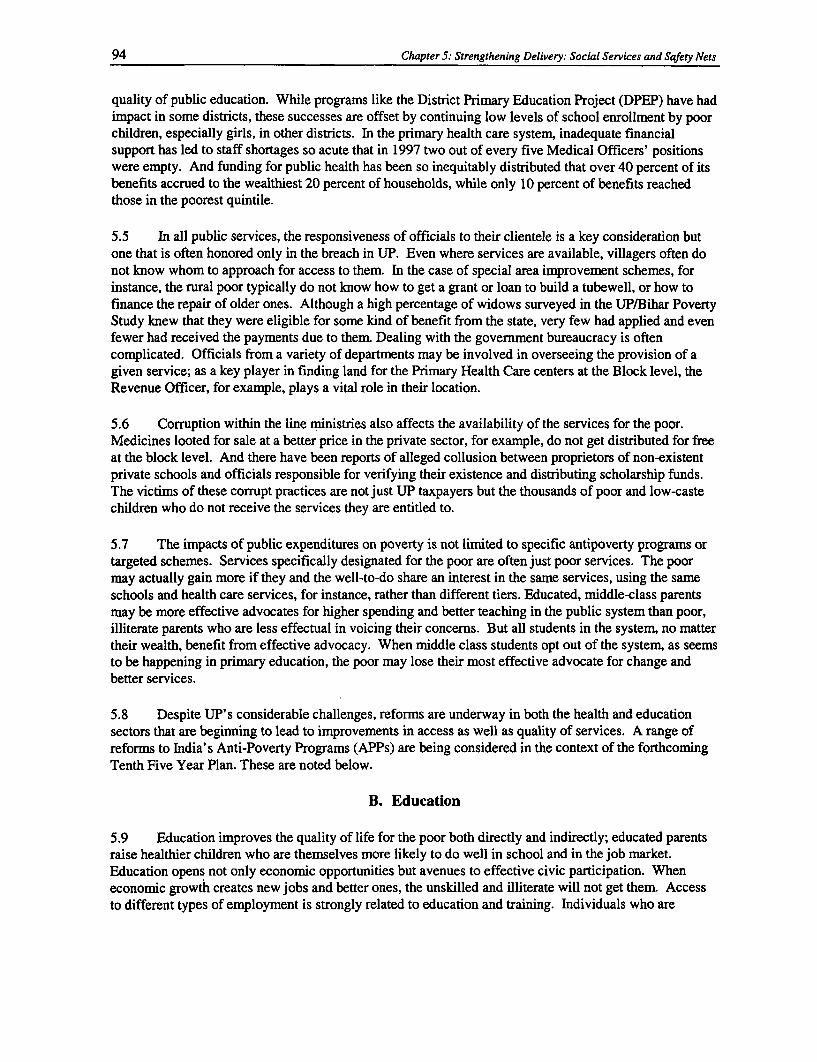
94 Chapter 5: Strengthening Delivery: Social Services and Safety Nets
quality of public education. While programs like the District Primary Education Project (DPEP) have hadimpact in some districts, these successes are offset by continuing low levels of school enrollment by poorchildren, especially girls, in other districts. In the primary health care system, inadequate financialsupport has led to staff shortages so acute that in 1997 two out of every five Medical Officers' positionswere empty. And funding for public health has been so inequitably distributed that over 40 percent of itsbenefits accrued to the wealthiest 20 percent of households, while only 10 percent of benefits reachedthose in the poorest quintile.
5.5 In all public services, the responsiveness of officials to their clientele is a key consideration butone that is often honored only in the breach in UP. Even where services are available, villagers often donot know whom to approach for access to them. In the case of special area improvement schemes, forinstance, the rural poor typically do not know how to get a grant or loan to build a tubewell, or how tofinance the repair of older ones. Although a high percentage of widows surveyed in the UP/Bihar PovertyStudy knew that they were eligible for some kind of benefit from the state, very few had applied and evenfewer had received the payments due to them. Dealing with the government bureaucracy is oftencomplicated. Officials from a variety of departments may be involved in overseeing the provision of agiven service; as a key player in finding land for the Primary Health Care centers at the Block level, theRevenue Officer, for example, plays a vital role in their location.
5.6 Corruption within the line ministries also affects the availability of the services for the poor.Medicines looted for sale at a better price in the private sector, for example, do not get distributed for freeat the block level. And there have been reports of alleged collusion between proprietors of non-existentprivate schools and officials responsible for verifying their existence and distributing scholarship funds.The victims of these corrupt practices are not just UP taxpayers but the thousands of poor and low-castechildren who do not receive the services they are entitled to.
5.7 The impacts of public expenditures on poverty is not limited to specific antipoverty programs ortargeted schemes. Services specifically designated for the poor are often just poor services. The poormay actually gain more if they and the well-to-do share an interest in the same services, using the sameschools and health care services, for instance, rather than different tiers. Educated, middle-class parentsmay be more effective advocates for higher spending and better teaching in the public system than poor,illiterate parents who are less effectual in voicing their concerns. But all students in the system, no mattertheir wealth, benefit from effective advocacy. When middle class students opt out of the system, as seemsto be happening in primary education, the poor may lose their most effective advocate for change andbetter services.
5.8 Despite UP's considerable challenges, reforms are underway in both the health and educationsectors that are beginning to lead to improvements in access as well as quality of services. A range ofreforms to India's Anti-Poverty Programs (APPs) are being considered in the context of the forthcomingTenth Five Year Plan. These are noted below.
B. Education
5.9 Education improves the quality of life for the poor both directly and indirectly; educated parentsraise healthier children who are themselves more likely to do well in school and in the job market.Education opens not only economic opportunities but avenues to effective civic participation. Wheneconomic growth creates new jobs and better ones, the unskilled and illiterate will not get them. Accessto different types of employment is strongly related to education and training. Individuals who are
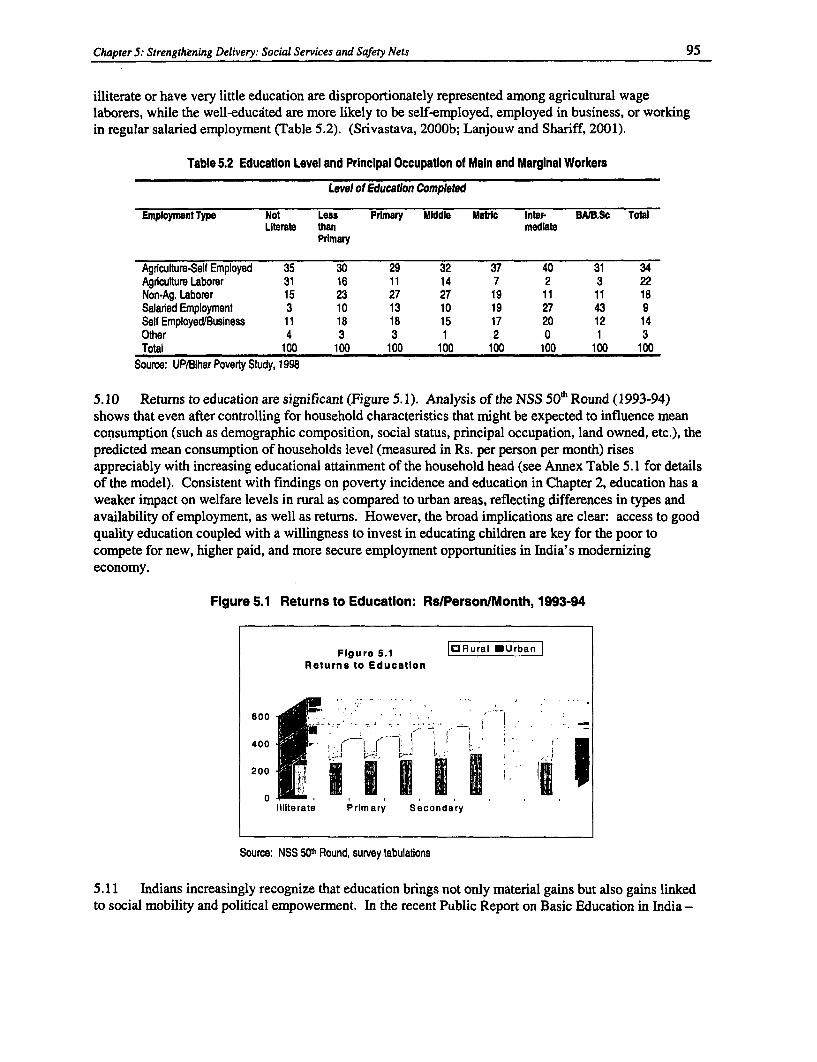
Chapter 5: Strengthening Delivery: Social Services and Safety Nets 95
illiterate or have very little education are disproportionately represented among agricultural wagelaborers, while the well-educated are more likely to be self-employed, employed in business, or workingin regular salaried employment (Table 5.2). (Srivastava, 2000b; Lanjouw and Shariff, 2001).
Table 5.2 Education Level and Principal Occupation of Main and Marginal Workers
Level of Educaion Completed
Employment Type Not Less Primary Mddle Mairic Inter- BAIB.Sc TotalLiterate than mediate
Primary
Agriculture-Self Employed 35 30 29 32 37 40 31 34Agriculture Laborer 31 16 11 14 7 2 3 22Non-Ag. Laborer 15 23 27 27 19 11 11 18Salaried Employment 3 10 13 10 19 27 43 9Self EmployedtBusiness 11 18 18 15 17 20 12 14Other 4 3 3 1 2 0 1 3Total 100 100 100 100 100 100 100 100
Source: UP/Bihar Poverty Study, 1998
5.10 Returns to education are significant (Figure 5. 1). Analysis of the NSS 50'h Round (1993-94)shows that even after controlling for household characteristics that might be expected to influence meanconsumption (such as demographic composition, social status, principal occupation, land owned, etc.), thepredicted mean consumption of households level (measured in Rs. per person per month) risesappreciably with increasing educational attainment of the household head (see Annex Table 5.1 for detailsof the model). Consistent with findings on poverty incidence and education in Chapter 2, education has aweaker impact on welfare levels in rural as compared to urban areas, reflecting differences in types andavailability of employment, as well as returns. However, the broad implications are clear: access to goodquality education coupled with a willingness to invest in educating children are key for the poor tocompete for new, higher paid, and more secure employment opportunities in India's modernizingeconomy.
Figure 5.1 Returns to Education: Rs/PersonNlonth, 1993-94
Figure 5.1 DORural *Urban Returns to Education
600 ix. :
400 1 K
20001 V-
liliterate Primary Secondary
Source: NSS 50"' Round, survey tabulations
5.11 Indians increasingly recognize that education brings not only material gains but also gains linkedto social mobility and political empowerment. In the recent Public Report on Basic Education in India -
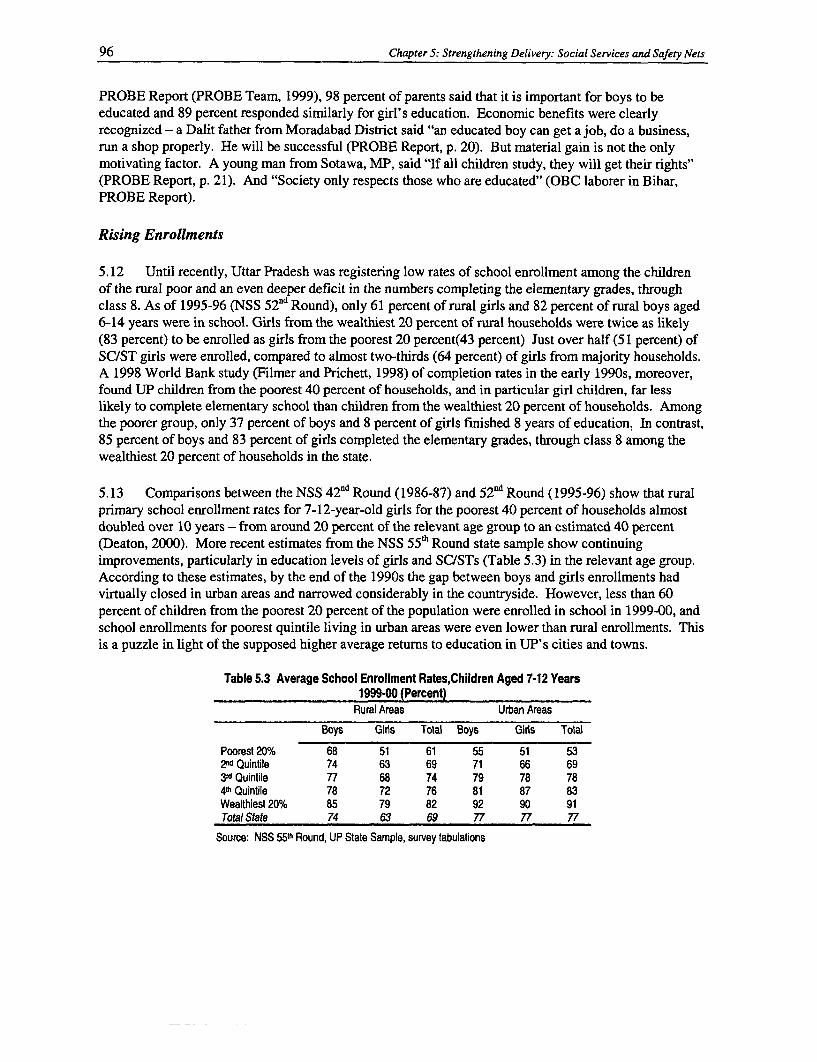
96 Chapter 5: Strengthening Delivery: Social Services and Safety Nets
PROBE Report (PROBE Team, 1999), 98 percent of parents said that it is important for boys to beeducated and 89 percent responded similarly for girl's education. Economic benefits were clearlyrecognized - a Dalit father from Moradabad District said "an educated boy can get a job, do a business,run a shop properly. He will be successful (PROBE Report, p. 20). But material gain is not the onlymotivating factor. A young man from Sotawa, MP, said "If all children study, they will get their rights"(PROBE Report, p. 21). And "Society only respects those who are educated" (OBC laborer in Bihar,PROBE Report).
Rising Enrollments
5.12 Until recently, Uttar Pradesh was registering low rates of school enrollment among the childrenof the rural poor and an even deeper deficit in the numbers completing the elementary grades, throughclass 8. As of 1995-96 (NSS 52nd Round), only 61 percent of rural girls and 82 percent of rural boys aged6-14 years were in school. Girls from the wealthiest 20 percent of rural households were twice as likely(83 percent) to be enrolled as girls from the poorest 20 percent(43 percent) Just over half (51 percent) ofSC/ST girls were enrolled, compared to almost two-thirds (64 percent) of girls from majority households.A 1998 World Bank study (Filmer and Prichett, 1998) of completion rates in the early 1990s, moreover,found UP children from the poorest 40 percent of households, and in particular girl children, far lesslikely to complete elementary school than children from the wealthiest 20 percent of households. Amongthe poorer group, only 37 percent of boys and 8 percent of girls finished 8 years of education. In contrast,85 percent of boys and 83 percent of girls completed the elementary grades, through class 8 among thewealthiest 20 percent of households in the state.
5.13 Comparisons between the NSS 42d Round (1986-87) and 52nd Round (1995-96) show that ruralprimary school enrollment rates for 7-12-year-old girls for the poorest 40 percent of households almostdoubled over 10 years - from around 20 percent of the relevant age group to an estimated 40 percent(Deaton, 2000). More recent estimates from the NSS 55th Round state sample show continuingimprovements, particularly in education levels of girls and SC/STs (Table 5.3) in the relevant age group.According to these estimates, by the end of the 1990s the gap between boys and girls enrollments hadvirtually closed in urban areas and narrowed considerably in the countryside. However, less than 60percent of children from the poorest 20 percent of the population were enrolled in school in 1999-00, andschool enrollments for poorest quintile living in urban areas were even lower than rural enrollments. Thisis a puzzle in light of the supposed higher average returns to education in UP's cities and towns.
Table 5.3 Average School Enrollment Rates,Children Aged 7-12 Years1999-00 (Percent)
Rural Areas Urban Areas
Boys Girls Total Boys Gids Total
Poorest 20% 68 51 61 55 51 532nd Quintile 74 63 69 71 66 693id Quintile 77 68 74 79 78 784th Quintile 78 72 76 81 87 83Wealthiest 20% 85 79 82 92 90 91Total State 74 63 69 77 77 77
Source: NSS 55th Round, UP State Sample, survey tabulations
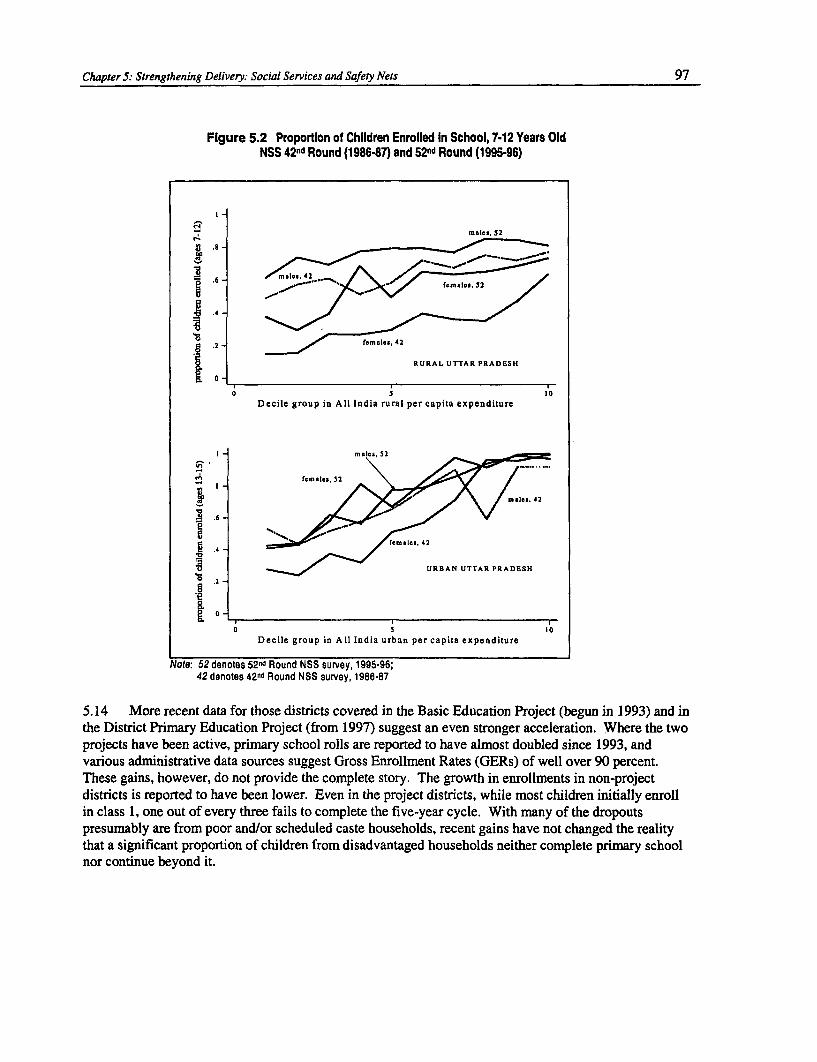
Chapter 5: Strengthening Delivery. Social Services and Safety Nets 97
Figure 5.2 Proportion of Children Enrolled In School, 7-12 Years OldNSS 42nd Round (198647) and 52nd Round (1995-96)
males, 52C-
.6
.4-
0n3 .2 -m es,42
O0 RURAL UTTAR PRADESH
110Decile group in All India rural per capita expenditure
Iv m lD<,52
^ ~~~~~females 52 \ /
8 .2- ~~~~~~~URBAN UTTAR PRADESH.6
.2-
0 5 10Decile group in All India urban per capita expenditure
Note: 52 denotes 52nd Round NSS survey, 1995-96;42 denotes 42nd Round NSS survey, 1986-87
5.14 More recent data for those districts covered in the Basic Education Project (begun in 1993) and inthe District Primary Education Project (from 1997) suggest an even stronger acceleration. Where the twoprojects have been active, primary school rolls are reported to have almost doubled since 1993, andvarious administrative data sources suggest Gross Enrollment Rates (GERs) of well over 90 percent.These gains, however, do not provide the complete story. The growth in enrollments in non-projectdistricts is reported to have been lower. Even in the project districts, while most children initially enrollin class 1, one out of every three fails to complete the five-year cycle. With many of the dropoutspresumably are from poor and/or scheduled caste households, recent gains have not changed the realitythat a significant proportion of children from disadvantaged households neither complete primary schoolnor continue beyond it.
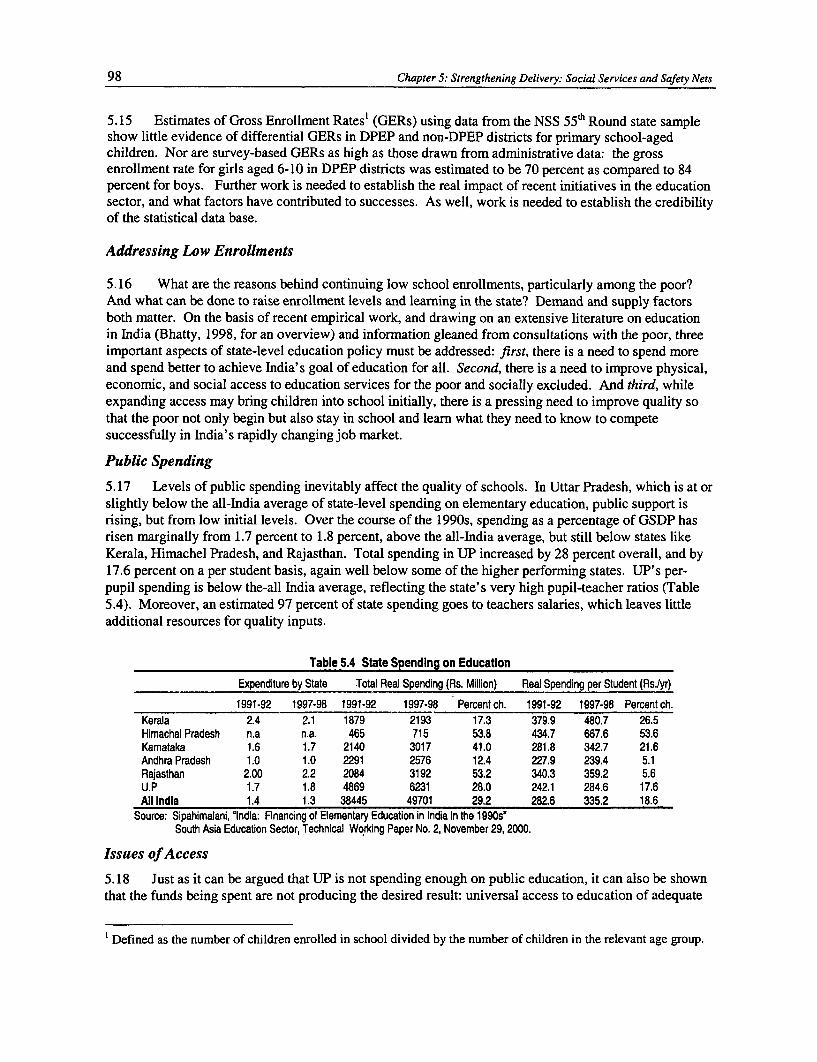
98 Chapter 5: Strengthening Delivery: Social Services and Safety Nets
5.15 Estimates of Gross Enrollment Rates' (GERs) using data from the NSS 55" Round state sampleshow little evidence of differential GERs in DPEP and non-DPEP districts for primary school-agedchildren. Nor are survey-based GERs as high as those drawn from administrative data: the grossenrollment rate for girls aged 6-10 in DPEP districts was estimated to be 70 percent as compared to 84percent for boys. Further work is needed to establish the real impact of recent initiatives in the educationsector, and what factors have contributed to successes. As well, work is needed to establish the credibilityof the statistical data base.
Addressing Low Enrollments
5.16 What are the reasons behind continuing low school enrollments, particularly among the poor?And what can be done to raise enrollment levels and learning in the state? Demand and supply factorsboth matter. On the basis of recent empirical work, and drawing on an extensive literature on educationin India (Bhatty, 1998, for an overview) and information gleaned from consultations with the poor, threeimportant aspects of state-level education policy must be addressed: first, there is a need to spend moreand spend better to achieve India's goal of education for all. Second, there is a need to improve physical,economic, and social access to education services for the poor and socially excluded. And third, whileexpanding access may bring children into school initially, there is a pressing need to improve quality sothat the poor not only begin but also stay in school and learn what they need to know to competesuccessfully in India's rapidly changing job market.
Public Spending
5.17 Levels of public spending inevitably affect the quality of schools. In Uttar Pradesh, which is at orslightly below the all-India average of state-level spending on elementary education, public support isrising, but from low initial levels. Over the course of the 1990s, spending as a percentage of GSDP hasrisen marginally from 1.7 percent to 1.8 percent, above the all-India average, but still below states likeKerala, Himnachel Pradesh, and Rajasthan. Total spending in UP increased by 28 percent overall, and by17.6 percent on a per student basis, again well below some of the higher performing states. UP's per-pupil spending is below the-all India average, reflecting the state's very high pupil-teacher ratios (Table5.4). Moreover, an estimated 97 percent of state spending goes to teachers salaries, which leaves littleadditional resources for quality inputs.
Table 5.4 State Spending on Education
Expenditure by State Total Real Spending (Rs. Million) Real Spending per Student (Rs./yr)
1991-92 1997-98 1991-92 1997-98 Percent ch. 1991-92 1997-98 Percent ch.Kerala 2.4 2.1 1879 2193 17.3 379.9 480.7 26.5Himachal Pradesh n.a n.a. 465 715 53.8 434.7 667.6 53.6Kamataka 1.6 1.7 2140 3017 41.0 281.8 342.7 21.6Andhra Pradesh 1.0 1.0 2291 2576 12.4 227.9 239.4 5.1Rajasthan 2.00 2.2 2084 3192 53.2 340.3 359.2 5.6U.P 1.7 1.8 4869 6231 28.0 242.1 284.6 17.6All India 1.4 1.3 38445 49701 29.2 282.6 335.2 18.6
Source: Sipahimalani, 'India: Financing of Elementary Education in India in the 1 990s'South Asia Education Sector, Technical Working Paper No. 2, November 29, 2000.
Issues of Access
5.18 Just as it can be argued that UP is not spending enough on public education, it can also be shownthat the funds being spent are not producing the desired result: universal access to education of adequate
' Defined as the number of children enrolled in school divided by the number of children in the relevant age group.
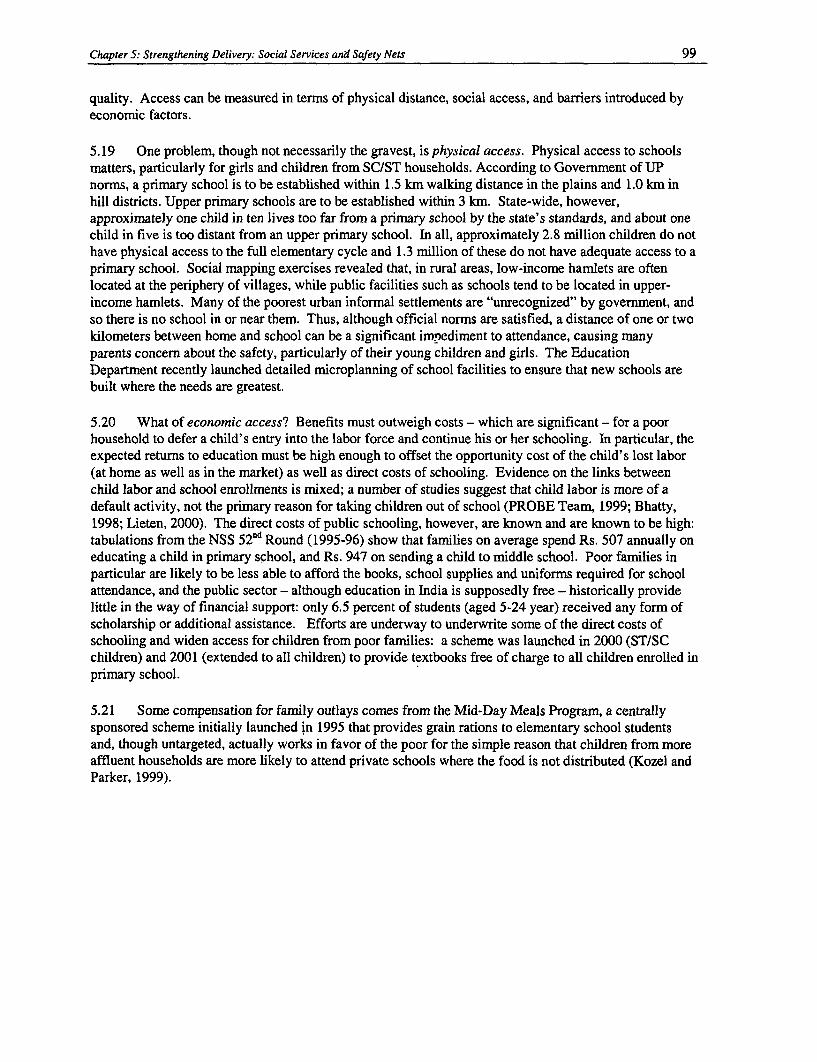
Chapter 5: Strengthening Delivery: Social Services and Safety Nets 99
quality. Access can be measured in terms of physical distance, social access, and barriers introduced byeconomic factors.
5.19 One problem, though not necessarily the gravest, is physical access. Physical access to schoolsmatters, particularly for girls and children from SC/ST households. According to Government of UPnorms, a primary school is to be established within 1.5 km walking distance in the plains and 1.0 km inhill districts. Upper primary schools are to be established within 3 km. State-wide, however,approximately one child in ten lives too far from a primary school by the state's standards, and about onechild in five is too distant from an upper primary school. In all, approximately 2.8 million children do nothave physical access to the full elementary cycle and 1.3 million of these do not have adequate access to aprimary school. Social mapping exercises revealed that, in rural areas, low-income hamlets are oftenlocated at the periphery of villages, while public facilities such as schools tend to be located in upper-income hamlets. Many of the poorest urban informal settlements are "unrecognized" by government, andso there is no school in or near them. Thus, although official norms are satisfied, a distance of one or twokilometers between home and school can be a significant impediment to attendance, causing manyparents concern about the safety, particularly of their young children and girls. The EducationDepartment recently launched detailed microplanning of school facilities to ensure that new schools arebuilt where the needs are greatest.
5.20 What of economic access? Benefits must outweigh costs - which are significant - for a poorhousehold to defer a child's entry into the labor force and continue his or her schooling. In particular, theexpected returns to education must be high enough to offset the opportunity cost of the child's lost labor(at home as well as in the market) as well as direct costs of schooling. Evidence on the links betweenchild labor and school enrollments is mixed; a number of studies suggest that child labor is more of adefault activity, not the primary reason for taking children out of school (PROBE Team, 1999; Bhatty,1998; Lieten, 2000). The direct costs of public schooling, however, are known and are known to be high:tabulations from the NSS 52nd Round (1995-96) show that families on average spend Rs. 507 annually oneducating a child in primary school, and Rs. 947 on sending a child to middle school. Poor families inparticular are likely to be less able to afford the books, school supplies and uniforms required for schoolattendance, and the public sector - although education in India is supposedly free - historically providelittle in the way of financial support: only 6.5 percent of students (aged 5-24 year) received any form ofscholarship or additional assistance. Efforts are underway to underwrite some of the direct costs ofschooling and widen access for children from poor families: a scheme was launched in 2000 (ST/SCchildren) and 2001 (extended to all children) to provide textbooks free of charge to all children enrolled inprimary school.
5.21 Some compensation for family outlays comes from the Mid-Day Meals Program, a centrallysponsored scheme initially launched in 1995 that provides grain rations to elementary school studentsand, though untargeted, actually works in favor of the poor for the simple reason that children from moreaffluent households are more likely to attend private schools where the food is not distributed (Kozel andParker, 1999).
100 Chapter 5: Strengthening Delivery: Social Services and Safety Nets
Box 5.1 The Midday Meals Program: Who Benefits?
In districts covered under the UP/Bihar Poverty Study, only 17 percent of students between the ages of 6 and 12 years reportedreceiving grain rations through the Mid-Day Meals Program in Bihar, in comparson to 57 percent of similarly aged students ineastern and southem regions of UP. While the program is not targeted towards the poor and regional coverage remains uneven,survey tabulations from the recent UP/Bihar household survey suggest that the midday meals program is actually mildlyprogressive. This is in large part due to the, fact that many children from upper caste andlor better off households in rural UP attendprvate schools (an estimated 25 percent of students in the study area did not attend govemment schools) and therefore do notreceive grain rations. Interestingly, the incidence of the Mid-Day Meals program was extremely high (over 65 percent) for childrenfrom SC/ST households who were enrolled in school and low for Muslim households (ust over 25 percent), who typically attendreligious schools.
Percent of Children Receiving Grain Rations In Past 30 Days - 1998, By Quintile
Per capita consumption qulntile1st 2nd 3rd 4th 5th Ovrall
All Children 18A 20.8 32.0 25.6 25.9 24.2Upper/middle caste 12.4 28.7 29.6 19.2 24.9 24.0SCIST 18.0 22.2 35.3 41.3 44.3 26.2Muslim 11.2 6.0 9.8 12.8 0.0 8.6
Children Currently 39.5 34.5 47.2 35.2 30.0 37.1Enrolted
Upper/middle caste 18.4 32.7 37.3 20.9 26.7 27.SC/ST 45.2 44.6 61.8 61.0 61.9 52.2Muslim 23.1 11.8 15.8 21.1 0.0 14.9
Source: UP/Bihar Poverty Study, 1998
5.22 Social Access. Those at the bottom of the caste system - children most in need of the economicand social lift that education can bestow - are less likely to attend school than children with higher castestatus (Chapter 2). This is in part due to perceived lack of economic opportunities, but they face otherbarriers as well. In field consultations undertaken as background for the report, stories of both covert andovert discrimination in the classrooms were frequent. In some cases, SC/ST children were made to sit ina corner of the classroom or outside the door. Teachers tended to pay less attention to children fromlower castes, and both teachers and peers often treated them as social inferiors (PROBE Team, 1999).
Quality Matters Enormnously
5.23 Past efforts to spread education more widely have emphasized increasing the number of schoolsand special incentive schemes (e.g. the Midday Meals Program) to boost attendance. Recently, however,attention has shifted to improvements in the quality of education (e.g. the District Primary EducationProgram), a response in part to evidence that poor and socially disadvantaged parents, who have to makeconsiderable sacrifices to send their children to school, care very much about the strength or weakness ofthe school. The new approach, however, has had little impact so far on the often low levels ofachievement and skills acquisition in the remote rural schools of Uttar Pradesh.
5.24 Physical infrastructure is important, as is management and staffing of schools. Surveysconducted by the Govemment of UP revealed that of the 73,000 public primary schools in the state, 43percent lacked a water supply, 64 percent lacked latrines, and 10 percent were in need of significant repairand rehabilitation. In most ministries, staffing at the local level is also a concem. Teacher absenteeismand transfers are major problems. Teachers' eligibility for re-posting every two years leads to tremendouspressure to be assigned to more attractive areas rather than poor rural ones. Transfers, in turn, reduce thenecessary continuity of teacher service in any given school. Teachers virtually lack public accountability.
Chapter 5: Strengthening Delivery: Social Services and Safety Nets 101
Monitoring of school and teacher performance rarely involves parents, although effort are underway tochange this (para 5.34). Despite a dual hierarchy of administrative and academic supervision, manyinspectors are subject to carefully orchestrated visits and are not required to provide substantive inputs aspart of their reports. In any case, there few punitive measures that can be taken against teachers, whocomprise a strong political lobby in the state (PROBE Report 1999). As a result, the PROBE report statesthat from a survey of schools in UP, MP, Bihar, and Rajasthan that only one-quarter of teachers wereactually involved in teaching activities when the PROBE investigators visited.
5.25 Staffing levels are problematic. Although the official norm is 40 pupils per teacher, estimatedpupil-teacher ratios in public primary schools range from 25-30 in hill districts to 74 pupils per teacher inAllahabad District and 79 pupils per teacher in Bhadohi District.2 The ratios, moreover, have been risingfrom 40 pupils per teacher in 1980-81, to 56 by 1990-9 1 and 59 by 1995-96, according to statisticsprovided by the Department of Education. Since trained teachers are reluctant to accept positions inpoorer areas, it is often the least qualified who are forced to do so. In recent months the state decided torecruit over 20,000 Shiksha Mitras/para-teachers with the aim of reducing pupil-teacher ratios andimproving education quality. While encouraging, the success of these efforts must ultimately be judgedby the numbers of teachers that are actually appointed, where they are placed, how well they teach, andwhether the state ultimately achieves better education outcomes.
5.26 Under current conditions, children enrolled in the public school system may not even attain basicliteracy, much less more advanced capabilities that could prepare them for employment in the modemsector. The better off, by contrast, can afford private education or travel to more distant albeit betterquality public schools if warranted by the poor quality of their local school.
Private Schooling
5.27 Among Indian states, UP has one of the highest levels of private school enrollments - one-fourthof all rural students and 70 percent of their urban counterparts. And private enrollment rates are rising,particularly in the unaided sector. At present, the private sector alone accounts for nearly 50 percent oftotal primary school enrollments in UP' s cities and towns, despite the fact that the cost of sendingchildren to private schools is almost twice as high as outlays for public education (Sipahimalani, 2000).Private unrecognized schools comprise a very heterogeneous group: many are neither certified norrecognized. The private recognized sector is large as well; aided schools represent a public-privatecollaboration in that they are managed privately but subsidized by the government.
5.28 Patterns of enrollments by wealth and social group raise concerns; the privileged - urban, uppercaste - are more likely to attend private schools, particularly "recognized" private schools. In fourdistricts in Eastern and Southern UP, for instance, nearly 80 percent of primary-aged children from thepoorest 20 percent of the rural population are enrolled in government schools, as well as over 85 percentof low-caste children. Those same schools take 64 percent of youngsters from the wealthiest quintile andan estimated 70 percent from the non-SC/ST population. And only half the children from Muslimhouseholds attended public schools.
5.29 The findings described above have broader applicability; early estimates from the NSS 55thRound highlight the strong relationship between wealth and private school enrollment (Table 5.5).Students from the wealthiest quintile are much more likely to be enrolled in private, recognized schools
2Basic Primary Education Project (BPEP) staff estimates.
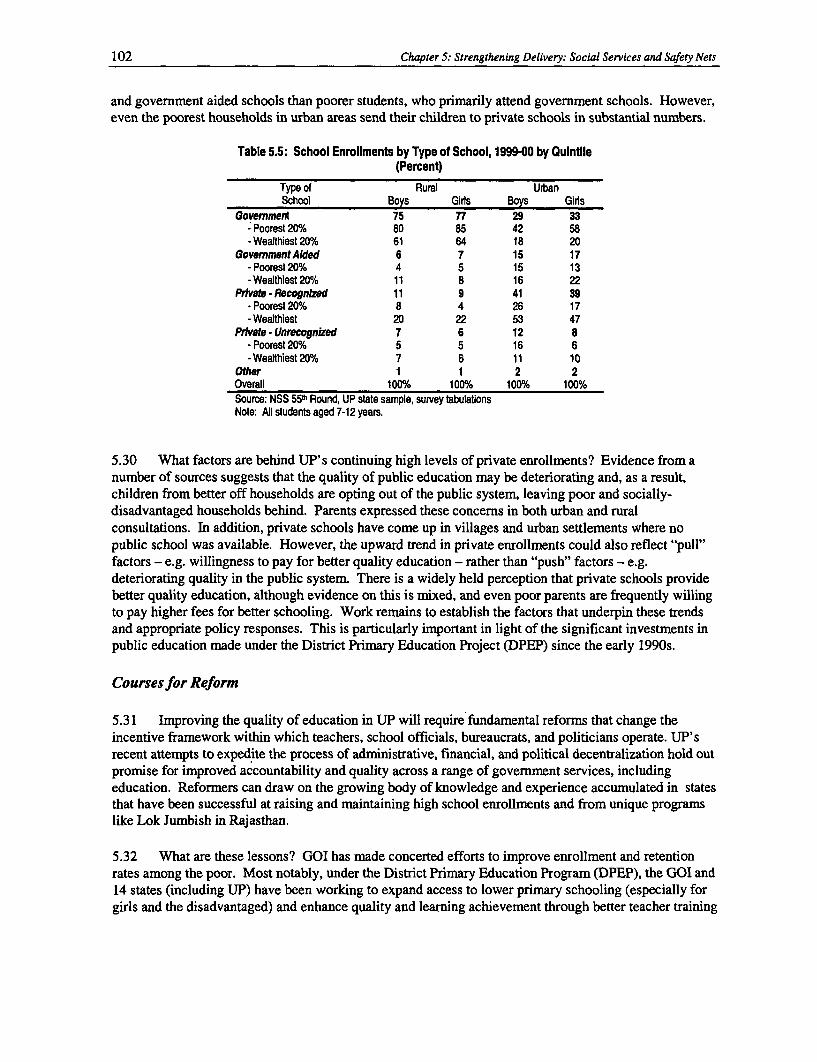
102 Chapter 5: Strengthening Delivery: Social Services and Safety Nets
and government aided schools than poorer students, who primarily attend government schools. However,even the poorest households in urban areas send their children to private schools in substantial numbers.
Table 5.5: School Enrollments by Type of School, 1999-00 by Quintile(Percent)
Type of Rural UrbanSchool Boys Girts Boys Girs
Govemment 75 77 29 33Poorest 200% 80 85 42 58
-Wealthiest 20% 61 64 18 20GovemmentAided 6 7 15 17
-Poorest20% 4 5 15 13-Wealthiest20°h 11 8 16 22
Private -Recognized 11 9 41 39-Poorest20% 8 4 26 17-Wealthiest 20 22 53 47
Private - Unrecognked 7 6 12 8-Poorest 20% 5 5 16 6-Wealthiest2O%/o 7 6 11 10
Other 1 1 2 2Overall 100% 100% 100% 100%Source: NSS 55"' Round, UP state sample, survey tabulationsNote: All students aged 7-12 years.
5.30 What factors are behind UP's continuing high levels of private enrollments? Evidence from anumber of sources suggests that the quality of public education may be deteriorating and, as a result,children from better off households are opting out of the public system, leaving poor and socially-disadvantaged households behind. Parents expressed these concerns in both urban and ruralconsultations. In addition, private schools have come up in villages and urban settlements where nopublic school was available. However, the upward trend in private enrollments could also reflect "pull"factors - e.g. willingness to pay for better quality education - rather than "push" factors - e.g.deteriorating quality in the public system. There is a widely held perception that private schools providebetter quality education, although evidence on this is mixed, and even poor parents are frequently willingto pay higher fees for better schooling. Work remains to establish the factors that underpin these trendsand appropriate policy responses. This is particularly important in light of the significant investments inpublic education made under the District Primary Education Project (DPEP) since the early 1990s.
Courses for Reform
5.31 Improving the quality of education in UP will require fundamental reforms that change theincentive framework within which teachers, school officials, bureaucrats, and politicians operate. UP'srecent attempts to expedite the process of administrative, financial, and political decentralization hold outpromise for improved accountability and quality across a range of government services, includingeducation. Reformers can draw on the growing body of knowledge and experience accumulated in statesthat have been successful at raising and maintaining high school enrollments and from unique programslike Lok Jumbish in Rajasthan.
5.32 What are these lessons? GOI has made concerted efforts to improve enrollment and retentionrates among the poor. Most notably, under the District Primary Education Program (DPEP), the GOI and14 states (including UP) have been working to expand access to lower primary schooling (especially forgirls and the disadvantaged) and enhance quality and learning achievement through better teacher training
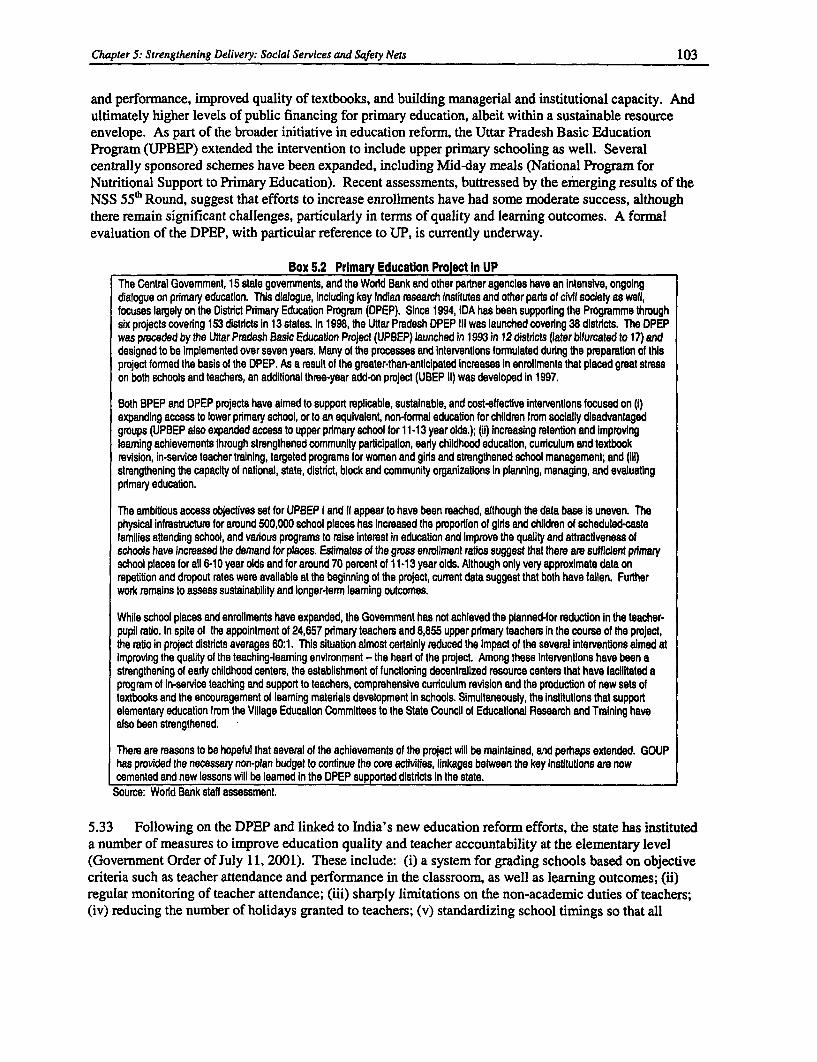
Chapter 5: Strengthening Delivery: Social Services and Safety Nets 103
and performance, improved quality of textbooks, and building managerial and institutional capacity. Andultimately higher levels of public financing for primary education, albeit within a sustainable resourceenvelope. As part of the broader initiative in education reform, the Uttar Pradesh Basic EducationProgram (UPBEP) extended the intervention to include upper primary schooling as well. Severalcentrally sponsored schemes have been expanded, including Mid-day meals (National Program forNutritional Support to Primary Education). Recent assessments, buttressed by the emerging results of theNSS 55h Round, suggest that efforts to increase enrollments have had some moderate success, althoughthere remain significant challenges, particularly in terms of quality and learning outcomes. A formalevaluation of the DPEP, with particular reference to UP, is currently underway.
Box 5.2 Prlmary Education Project In UPThe Central Govemment, 15 state govemments, and the World Bank and other partner agencies have an intensive, ongoingdialogue on primary education. This dialogue, including key Indian research institutes and other parts of civil society as well,focuses largely on the District Primary Education Program (DPEP). Since 1994, IDA has been supponing the Programme throughsix projects covering 153 districts in 13 states. In 1998, the Uttar Prmdesh DPEP IlIl was launched coverng 38 distrcts. The DPEPwas preceded by the Uttar Pradesh Basic Education Project (UPSEP) launched In 1993 in 12 districts (later bifurcated to 17) anddesigned to be implemented over seven years. Many of the processes and interventions formulated durlng the preparation of thisproject formed the basis of the DPEP. As a result of the greater-than-anticipated Increases In enrollments that placed great stresson both schools and teachers, an additional three-year add-on project (UBEP II) was developed in 1997.
Both BPEP and DPEP projects have almed to support replicable, sustainable, and cost-effective interventions focused on (i)expanding access to lower primary school, or to an equivalent, non-formal education for children frm socially disadvantagedgroups (UPBEP also expanded access to upper primary school for 11-13 year olds.); (ii) increasing retention and improvingleaming achievements Ihrough strengthened community participation, eady childhood educaHon, curriculum and textbookrevision, in-service teacher tralning, targeted programs for women and girls and strengthened school management; and (iiI)strengthening the capacity of naflonal, state, district, block and community organizations In planning, managing, and evaluatingprimary education.
The ambitious access objectives set for UPPEP I and If appear to have been reached, although the data base is uneven. Thephysical infrastructure for around 500,000 school places has Increased the proportion of girts and children of scheduled-castefamilies attending school, and various programs to raise Interest in education and improve the quality and attracUveness ofschools have increased the demand for places. Estimates of the gross enrollment ratios suggest thal there are sufficient primaryschool places for all 6-10 year olds and for around 70 percent of 11-13 year olds. Although only very approximate data onrepetition and dropout rates were available at the beginning of the project, current data suggest that both have fallen. Furtherwork remains to assess sustainability and longer-term leaming outcomes.
While school places and enrollments have expanded, the Govemment has not achieved the planned-for reduction in the teacher-pupil ratio. In spite of the appointment of 24,657 primary teachers and 8,855 upper primary teachers in the course of the proJect,the ratio in project districts averages 60:1. This situation almost certalnly reduced the impact of the several intervenfHons aimed atimproving the quality of the teaching-leaming environment -- the heart of the project. Among these interventons have been astrengthening of early childhood centers, the establishment of funcHoning decentralized resource centers that have facilitated aprogram of in-service teaching and support to teachers, comprehensive curriculum revision and the production of new sets oftextbooks and the encouragement of leaming materials development in schools. Simultaneously, the insHitutions that supportelementary education from the Village Education Committees to the State Council of Educational Research and Training havealso been strengthened.
There are reasons to be hopeful that several of the achievements of the project will be maintained, and perhaps extended. GOUPhas provided the necessary non-plan budget to continue the core activities, linkages between the key institutions are nowcemented and new lessons will be leamed In the DPEP supported distrcts in the state.
Source: Wodd Bank staff assessment.
5.33 Following on the DPEP and linked to India's new education reform efforts, the state has instituteda number of measures to improve education quality and teacher accountability at the elementary level(Government Order of July 11, 2001). These include: (i) a system for grading schools based on objectivecriteria such as teacher attendance and performance in the classroom, as well as learning outcomes; (ii)regular monitoring of teacher attendance; (iii) sharply limitations on the non-academic duties of teachers;(iv) reducing the number of holidays granted to teachers; (v) standardizing school timings so that all
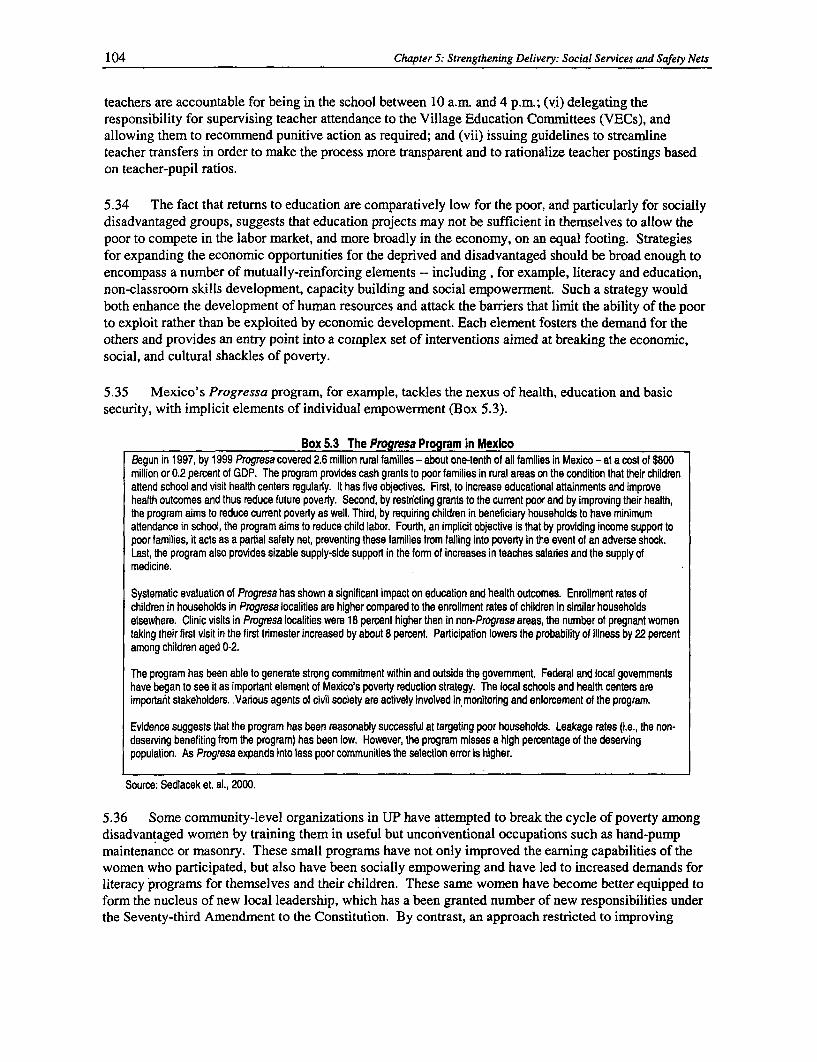
104 Chapter 5: Strengthening Delivery: Social Services and Safety Nets
teachers are accountable for being in the school between 10 a.m. and 4 p.m.; (vi) delegating theresponsibility for supervising teacher attendance to the Village Education Committees (VECs), andallowing them to recommend punitive action as required; and (vii) issuing guidelines to streamlineteacher transfers in order to make the process more transparent and to rationalize teacher postings basedon teacher-pupil ratios.
5.34 The fact that returns to education are comparatively low for the poor, and particularly for sociallydisadvantaged groups, suggests that education projects may not be sufficient in themselves to allow thepoor to compete in the labor market, and more broadly in the economy, on an equal footing. Strategiesfor expanding the economic opportunities for the deprived and disadvantaged should be broad enough toencompass a number of mutually-reinforcing elements -- including , for example, literacy and education,non-classroom skills development, capacity building and social empowerment. Such a strategy wouldboth enhance the development of human resources and attack the barriers that limit the ability of the poorto exploit rather than be exploited by economic development. Each element fosters the demand for theothers and provides an entry point into a complex set of interventions aimed at breaking the economic,social, and cultural shackles of poverty.
5.35 Mexico's Progressa program, for example, tackles the nexus of health, education and basicsecurity, with implicit elements of individual empowerment (Box 5.3).
Box 5.3 The Progresa Program in MexicoBegun in 1997, by 1999 Progresa covered 2.6 million rural families - about one-tenth of all families in Mexico - at a cost of $800million or 0.2 percent of GDP. The program provides cash grants to poor families in rural areas on the condition that their childrenattend school and visit health centers regularly. It has five objectives. First, to increase educational aKtainments and improvehealth outcomes and thus reduce future poverty. Second, by restricting grants to the current poor and by improving their health,the program aims to reduce current poverty as well. Third, by requiring children in beneficiary households to have minimumattendance in school, the program aims to reduce child labor. Fourth, an implicit objective is that by providing income support topoor families, it acts as a partial safety net, preventing these families from falling into poverty in the event of an adverse shock.Last, the program also provides sizable supply-side support in the form of increases in teaches salaries and the supply ofmedicine.
Systematic evaluation of Progresa has shown a significant impact on education and health outcomes. Enrollment rates ofchildren in households in Progresa localities are higher compared to the enrollment rates of children in similar householdselsewhere. Clinic visits in Progresa localities were 18 percent higher then in non-Progresa areas, the number of pregnant womentaking their first visit in the first trimester increased by about 8 percent. Participation lowers the probability of illness by 22 percentamong children aged 0-2.
The program has been able to generate strong commitment within and outside the govemment. Federal and local govemmentshave began to see it as important element of Mexico's poverty reduction strategy. The local schools and health centers areimportant stakeholders. Various agents of civil society are actively involved in monitoring and enforcement of the program.
Evidence suggests that the program has been reasonably successful at targeting poor households. Leakage rates (i.e., the non-deserving benefiting from the program) has been low. However, the program misses a high percentage of the deservingpopulation. As Progresa expands into less poor communities the selection error is higher.
Source: Sedlacek et. al., 2000.
5.36 Some community-level organizations in UP have attempted to break the cycle of poverty amongdisadvantaged women by training them in useful but unconventional occupations such as hand-pumpmaintenance or masonry. These small programs have not only improved the earning capabilities of thewomen who participated, but also have been socially empowering and have led to increased demands forliteracy programs for themselves and their children. These same women have become better equipped toform the nucleus of new local leadership, which has a been granted number of new responsibilities underthe Seventy-third Amendment to the Constitution. By contrast, an approach restricted to improving
Chapter 5: Strengthening Delivery: Social Services and Safety Nets 105
formal education alone may be less effective in breaching cultural barriers that prevent poor women fromlearning useful skills and earning a living wage.
5.37 As UP examines alternative options to improve education within a comprehensive strategy forreducing poverty, it should gauge the significance for public education of the decisions by manyhouseholds, including those among the poor, to send children to private schools, despite the high relativecosts of such education. Since parents pay considerable sums even when children are enrolled in thepublic sector, policy-makers should weigh the question of public provision versus publicfinancing ofeducation. One can argue for government financing for primary education, especially for children frompoor households, but it is not clear why these schools need to be provided by the government. Variousalternatives have been tried in other countries. One interesting option that has worked with some measureof success in a number of countries is to give parents cash subsidies or vouchers and let them choose thetype of school their child will attend. Other countries (e.g., some states in the United States) haveexperimented with contracting for the delivery of education services by private providers, includingNGOs. There have been numerous successes and there are important lessons for states like UP, whereboth resources and institutional capacity are limited.
C. Health
5.38 This section focuses primarily on health services. However, poor public health conditions thatplague the better off as well as the poor are particularly acute in rural areas, where the quality of curativecare drops off sharply and environmental factors - unclean water, lack of adequate sanitation, airpollution due to cooking fuels - exert a significant impact on quality of life. Environmental factors werefound to account for 15-20 percent of the total burden of disease in a recent study for Andhra Pradesh(Hughes, G., K. Lvovsky, and M. Dunleavy, 2001), and women and children, given the range of otherfactors that impinge on their health status, were found to be particularly at risk.
Drinking Water and Sanitation
5.39 In recent years, the state of UP has made significant progress in providing access to safe drinkingwater in rural areas. Basic needs have been met, with the exception of a few chemically affected areas.More than 1 million handpumps have been installed for a rural population of 130 million. This average ofone handpump per 130 persons is well within the minimum need criteria of one handpump per 250persons set by the Government of India. Increased access to safe drinking water has generated positivehealth impacts in rural areas; there is early evidence of a decrease in infant mortality in areas whereaccess to potable water has improved. The state has also taken initiatives in involving communities indeveloping and managing their water supply, currently through the World Bank funded Swajal Projectand the sector reform program of the Accelerated Rural Water Supply Programme (DHV Consultants,2001). Despite progress in providing community access to drinking water, coverage of sanitation(particularly sanitary latrines) remains very low.
5.40 In spite of these achievements, the UP Rural Poverty Study still found evidence that the poor andsocially disadvantaged lack access to clean drinking water in some regions. This was due to deep rootedcaste divisions that hinder, and in some cases, prohibit lower caste households from accessing watersources controlled by dominant upper castes. During summer, these caste tensions intensify due to thescarce availability of water. For example, the hamlet inhabited by the Malhan (poor backward caste boatpeople) bustee of Bikar Village in Allahabad has access to a single hand pump. On days when their handpump fails to work, the villagers said that they were forced to drink contaminated water from the river or
106 Chapter 5: Strengthening Delivery: Social Services and Safety Nets
face abuse from the upper caste households when tried to get water from wells in an nearby hamlet. Therewere numerous reported cases where hand pumps meant for Dalit (Scheduled Caste) hamlets wereinstalled in hamlets occupied by the better off. This is in violation of the Central government norm thatstipulates that every Scheduled Caste village should have its own hand pump.
UP's Health Services Strategy
5.41 India's strategy toward both rural health services and nutrition puts almost exclusive emphasis onthe public provision of such services as fixed-site dispensaries in local communities, sub-centers, PrimaryHealth Centers (PHCs), Community Health Centers (CHCs) and block-level and District Hospitals.Visiting Auxiliary Nurse Midwives (ANMs) stationed at sub-centers and PHCs provide outreach servicesto children and pregnant women, and Anganwadi workers also provide nutrition services and assist withimmunizations and preventive care. Services to the poor at all facilities are provided free, though nominaluser fees have been introduced for the non-poor at CHC level and above.
5.42 Despite this extensive network of free public health facilities, however, private expenditures onhealth care, mostly due to catastrophic illnesses or minor illnesses that become catastrophic due to poortreatment, are frequently cited as a common cause of rural impoverishment and destitution. This is in partbecause the poor consult more costly private sector practitioners with far greater frequency than publicsector practitioners. According to the NSS 52nd Round (1995-96) 91 percent of outpatient visits in UPwere to private practitioners. Among the poor, these practitioners are likely to be "Rural MedicalPractitioners"(RMPs) or Jhola Chap "doctors" whose level of effectiveness is unknown. Various studieshave revealed a high level of patient dissatisfaction with public facilities, based on a number ofshortcomings. A survey of patients from public facilities revealed that they are dissatisfied with thefinancial burden of care, the lack of cleanliness in facilities, and the behavior and attitudes of the staff(STEM, 2000). These problems are highlighted in a recent district-level health assessment done asbackground for this report (Parker, 1999).
Box 5.4 The Health Situation In Chitrakot DistrictDuring September 1998, a small study was undertaken of the health problems experienced by the poor in Chitrakot Distict (southem
UP), and of the various health care and treatment options they utilize. Qualitative methods, including semi-structured interviews, casehistory interviews, key informant interviews and focus group discussions, were used to explore a key question: why, when the Govemmentof India provides free primary health care at the village level, are the poor are suffering a high disability and illness burden and oftenspending a large proportion of their very limited resources on health care and treatment?
The study's results indicated that the poor are bypassing village-level fixed site primary health care facilities provided by govemmentin favor of jhola chap doctors and the local chemist. This is largely because the former are chronically short of medicines, supplies, andequipment while the latter are fully stocked. Ineffective treatment by untrained practioners can lead to several consecutive (and expensive)consultations, which may propel a poor household into destitution and chronic debt. The problem is compounded by the fact thatknowledge of disease etiology and prevention among Chitrakofs poor is low even by developing country standards. Contact betweenvillagers and GOI outreach workers, such as the Auxiliary Nurse Midwives (ANMs), however, is relatively frequent and may determinewhether or not the disadvantaged receive any immunizations. Although corruption was mentioned by many informants as a barrier toeffective care, the principal cause of the primary health care system's shortcomings appears to be under-financing.
Source: Parker, 1999.
5.43 A recent study (Ramana et. al., 2002) highlights the stark inequities in access to essentialreproductive and child health services in rural India. UP compares poorly to many states along a numberof dimensions - use of modern contraceptives, antenatal care, safe births, and extent of childhoodimmunizations. Not only are levels of access low but there remain stark inequities between the poorest 20percent of the rural population and the wealthiest 20 percent. In contrast to states like UP, Bihar, andRajasthan, many of India's southern states have achieved higher and more equitable levels of access.
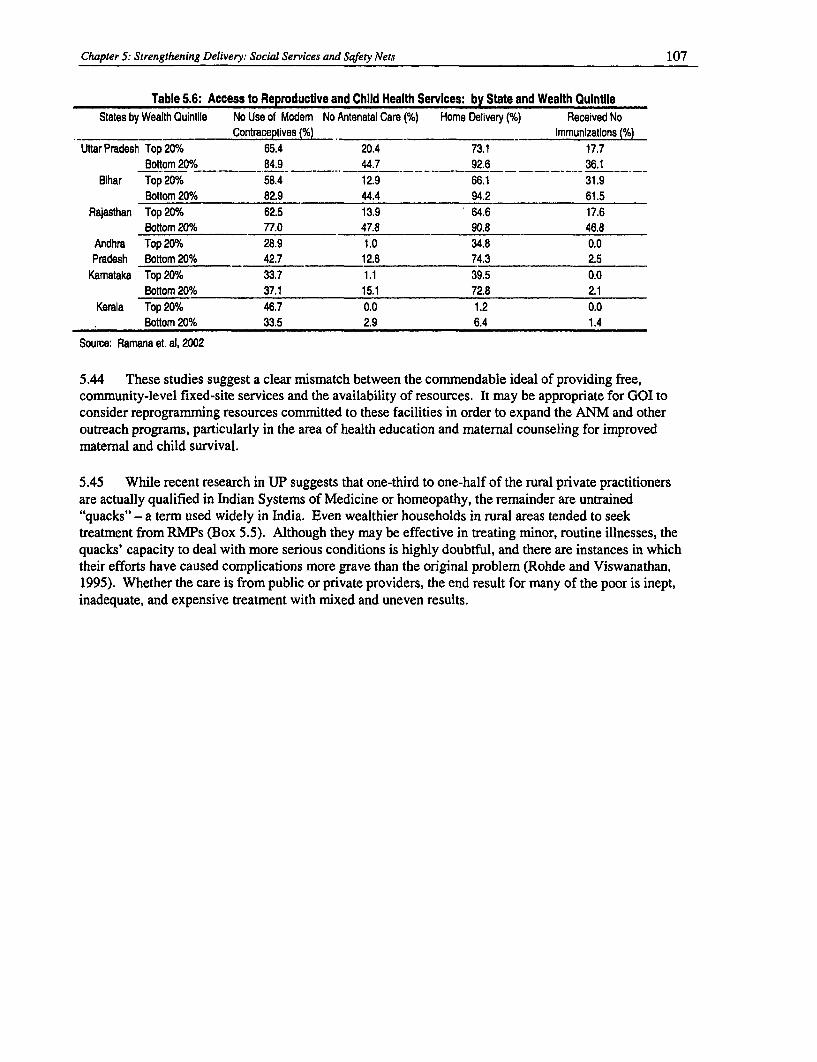
Chapter 5: Strengthening Delivery: Social Services and Safety Nets 107
Table 5.6: Access to Reproductive and Child Health Services: by State and Wealth QuintileStates by Wealth Quintile No Use of Modem No Antenatal Care (%) Home Delivery (%) Received No
Contraceptives (%) Immunizations (%)Uttar Pradesh Top 20% 65.4 20.4 73.1 17.7
Bottom 20% 84.9 44.7 92.6 _ _ 36.1Bihar Top 20% 58.4 12.9 66.1 31.9
Bottom 20% 82.9 44.4 94.2 61.5Rajasthan Top 20% 62.5 13.9 64.6 17.6
Bottom 20% 77.0 47.8 90.8 46.8Andhra Top 20% 28.9 1.0 34.8 0.0Pradesh Bottom 20% 42.7 12.8 74.3 2.5
Kamataka Top 20% 33.7 1.1 39.5 0.0Bottom 20% 37.1 15.1 72.8 2.1
Kerala Top 20% 46.7 0.0 1.2 0.0Bottom 20% 33.5 2.9 6.4 1.4
Source: Ramana et. al, 2002
5.44 These studies suggest a clear mismatch between the commendable ideal of providing free,community-level fixed-site services and the availability of resources. It may be appropriate for GOI toconsider reprogramming resources commnitted to these facilities in order to expand the ANM and otheroutreach programs, particularly in the area of health education and maternal counseling for improvedmaternal and child survival.
5.45 While recent research in UP suggests that one-third to one-half of the rural private practitionersare actually qualified in Indian Systems of Medicine or homeopathy, the remainder are untrained"quacks" - a term used widely in India. Even wealthier households in rural areas tended to seektreatment from RMPs (Box 5.5). Although they may be effective in treating minor, routine illnesses, thequacks' capacity to deal with more serious conditions is highly doubtful, and there are instances in whichtheir efforts have caused complications more grave than the original problem (Rohde and Viswanathan,1995). Whether the care is from public or private providers, the end result for many of the poor is inept,inadequate, and expensive treatment with mixed and uneven results.
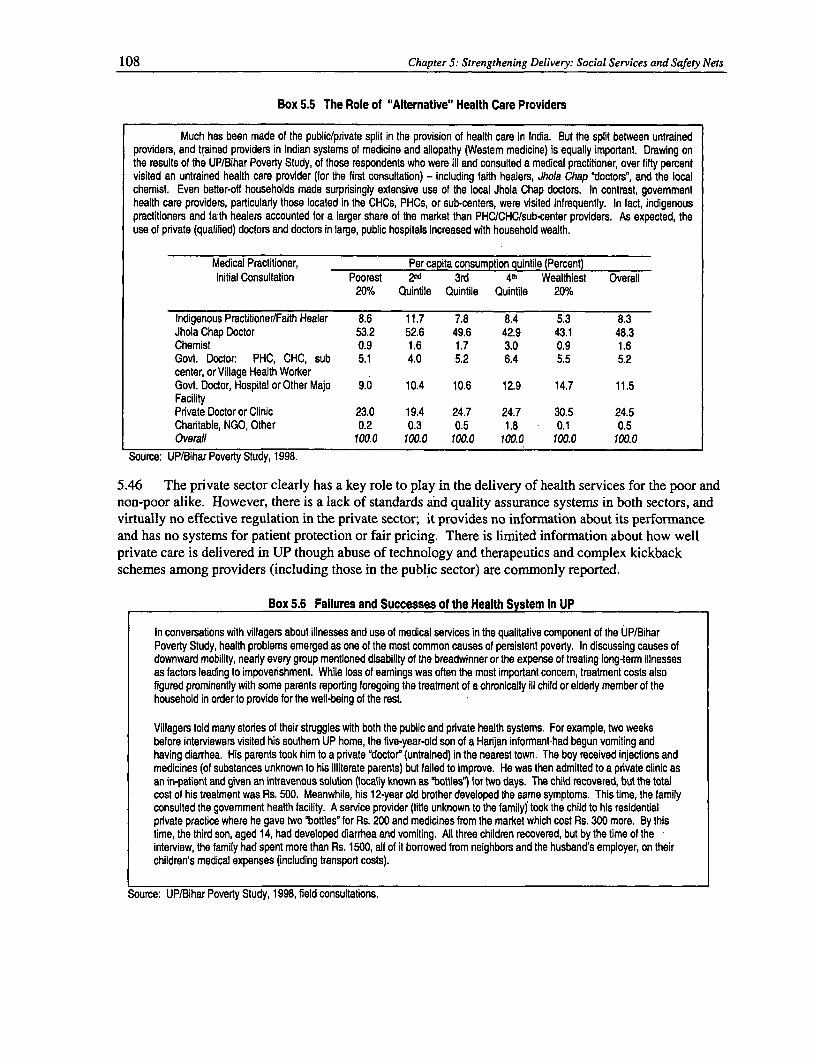
108 Chapter 5: Strengthening Delivery: Social Services and Safety Nets
Box 5.5 The Role of "Alternative" Health Care Providers
Much has been made of the public/prvate split in the provision of health care in India. But the split between untrainedproviders, and trained providers in Indian systems of medicine and allopathy (Westem medicine) is equally important. Drawing onthe results of the UP/Bihar Poverty Study, of those respondents who were ill and consulted a medical practitioner, over fifty percentvisited an untrained health care provider (for the first consultation) - including faith healers, Jhola Chap 'doctors", and the localchemist. Even better-off households made surprisingly extensive use of the local Jhola Chap doctors. In contrast, govemmenthealth care providers, particularly those located in the CHCs, PHCs, or sub-centers, were visited infrequently. In fact, indigenouspractitioners and faith healers accounted for a larger share of the market than PHCICHC/sub-center providers. As expected, theuse of private (qualified) doctors and doctors in large, public hospitals increased with household wealth.
Medical Practitioner, Per capita consumption quintile (Percent)Initial Consultation Poorest 2nd 3rd 4fl Wealthiest Overall
20% Quintile Quintile Quintile 20%
Indigenous Practitioner/Faith Healer 8.6 11.7 7.8 8.4 5.3 8.3Jhola Chap Doctor 53.2 52.6 49.6 42.9 43.1 48.3Chemist 0.9 1.6 1.7 3.0 0.9 1.6Govt. Doctor: PHC, CHC, sub 5.1 4.0 5.2 6.4 5.5 5.2center, or Village Health WorkerGovt. Doctor, Hospital or Other Majo 9.0 10.4 10.6 12.9 14.7 11.5FacilityPrivate Doctor or Clinic 23.0 19.4 24.7 24.7 30.5 24.5Charitable, NGO, Other 0.2 0.3 0.5 1.8 0.1 0.5Overall 100.0 100.0 100.0 100.0 100.0 100.0
Source: UP/Bihar Poverty Study, 1998.
5.46 The private sector clearly has a key role to play in the delivery of health services for the poor andnon-poor alike. However, there is a lack of standards and quality assurance systems in both sectors, andvirtually no effective regulation in the private sector; it provides no information about its performanceand has no systems for patient protection or fair pricing. There is limited information about how wellprivate care is delivered in UP though abuse of technology and therapeutics and complex kickbackschemes among providers (including those in the public sector) are commonly reported.
Box 5.6 Failures and Successes of the Health System in UP
In conversations with villagers about illnesses and use of medical services in the qualitative component of the UP/BiharPoverty Study, health problems emerged as one of the most common causes of persistent poverty. In discussing causes ofdownward mobility, nearly every group mentioned disability of the breadwinner or the expense of treating long-term illnessesas factors leading to impoverishment. While loss of eamings was often the most important concem, treatment costs alsofigured prominently with some parents reporting foregoing the treatment of a chronically ill child or elderly member of thehousehold in order to provide for the well-being of the rest.
Villagers told many stories of their struggles with both the public and private health systems. For example, two weeksbefore interviewers visited his southem UP home, the five-year-old son of a Harijan informant-had begun vomiting andhaving diarrhea. His parents took him to a private 'doctor' (untrained) in the nearest town. The boy received injections andmedicines (of substances unknown to his illiterate parents) but failed to improve. He was then admitted to a private clinic asan in-patient and given an intravenous solution (locally known as bottles") for two days. The child recovered, but the totalcost of his treatment was Rs. 500. Meanwhile, his 12-year old brother developed the same symptoms. This time, the familyconsulted the govemment health facility. A service provider (title unknown to the family) took the child to his residentialprivate practice where he gave two bottles' for Rs. 200 and medicines from the market which cost Rs. 300 more. By thistime, the third son, aged 14, had developed diarrhea and vomiting. All three children recovered, but by the time of theinterview, the family had spent more than Rs. 1500, all of it borrowed from neighbors and the husband's employer, on theirchildren's medical expenses (including transport costs).
Source: UP/Bihar Poverty Study, 1998, field consultations.

Chapter 5: Strengthening Delivery: Social Services and Safety Nets 109
Courses of Reform
5.47 A number of measures could be taken to improve the effectiveness of the health care servicesoffered to the poor, including (i) improving consumer responsiveness; (ii) providing more effectivefinancial protection, particularly for the poor; and (iii) improving the quality and value of services.Options include:
* Rejuvenating the public sector to better deliver its core functions. It is not enough toimproving the quality of public service delivery, the early focus of the UP Health SystemsDevelopment Project (HPHSDP); the public sector needs to improve policy-setting, regulation,networking, and financing in the health field. In the long run, greater public financing ofhealth, as distinct from its delivery, and pooling of risks through health insurance, should beobjectives. There is a growing consensus that these measures improve the efficiency andequity of health financing (WHO 2000).
* Taking greater advantage of the private sector and ensuring quality care. A strategy isdesperately needed to provide oversight of the private se.ctor, focusing on improving qualityand equity, and countering the many private market failures. Such a strategy should includenot only government regulation, but facilitate self-regulation as well, make informationavailable to the public, contract with the private sector, and develop other types of partnerships.The UPHSDP has initiated this partnership and is developing the capabilities of governmentand other institutions to carry out the types of functions needed.
* Using public information to empower people to better manage their own health care andto be better consumers of health care. This is another public function that governmentshould oversee, though not necessarily deliver directly. Communications and social marketingis often best implemented through more professional, non- bureaucratic approach of the privatesector. The purpose is not merely to build up demand, but also to enable people to maintaintheir health, prevent illness, and treat disease.
* Focusing on the needs of the most vulnerable. While in some cases this may mean directlytargeting health services for the poor, women and deprived groups, it also calls for betterpooling of funds between the rich and the poor, to ensure that the same facilities available tothe rich are also available to the poor. It also suggests that government should find ways tobetter monitor health resources and outcomes for vulnerable groups. At the very least, policychanges should be assessed in terms of their impact on inequalities in health impacts.
* Supporting health promotion. Some of the best investments in health in the long term aremade through investments in education, particularly for girls. Though there are many routes todevelopment and low mortality, educating and empowering people to make better decisionsabout health is a common pathway. Similarly, improvements in sanitation, water supply,agriculture, and income generation will contribute to improved health.
Higher Public Spending
5.48 Improving access to and quality of services for the poor often requires systemic improvementsthat ultimately upgrade service quality for all. Primary among these is an increase not only in publicfunding but also in its effectiveness at reaching the poor. The proportion of public resources UP commitsto health is low by both Indian and international standards. However, increased spending must be withina sustainable resource envelope for the state. Though the public sector does act as a safety net for thepoor, overall public expenditures on health do not effectively reach the poor. An analysis of governmentexpenditure on health care indicates that it is largely pro-rich (Table 5.7), though some services, such asimmunizations and non-hospital outpatient care are pro-poor. Out of every 100 rupees spent in the publicsector on curative health care services in UP, the poorest 20 percent of the population receives 10 rupees
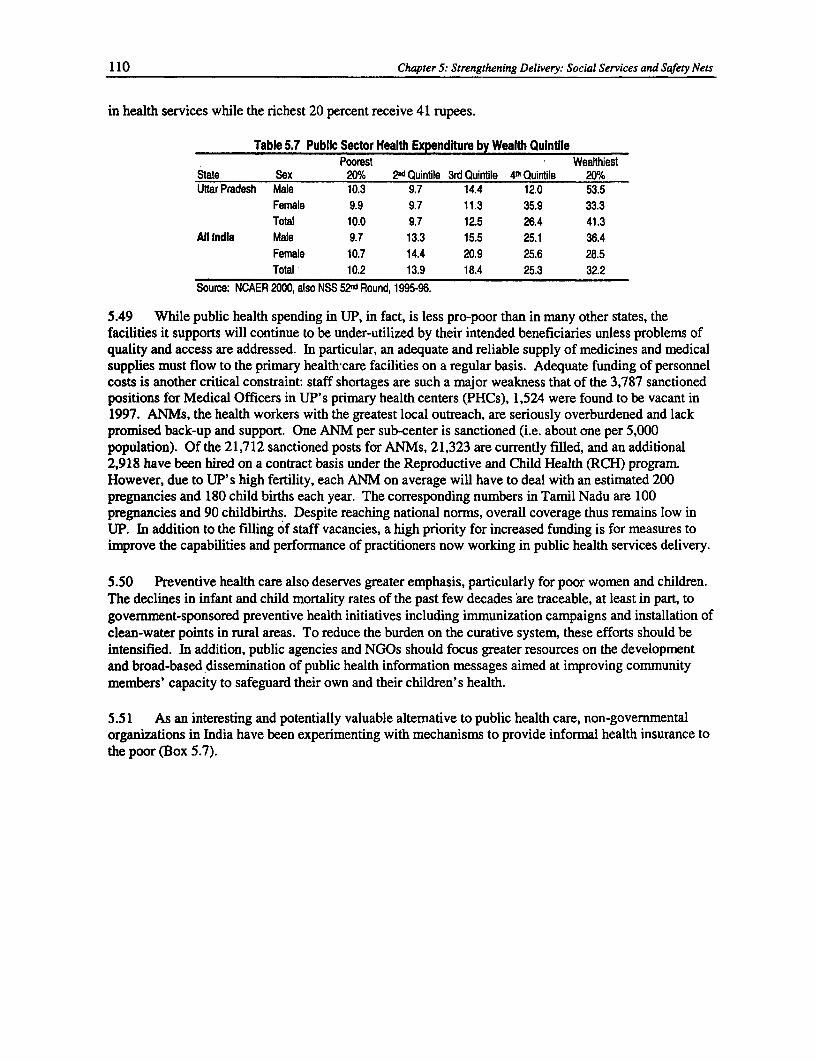
110 Chapter 5: Strengthening Delivery: Social Services and Safety Nets
in health services while the richest 20 percent receive 41 rupees.
Table 5.7 Public Sector Health Expenditure by Wealth QuintilePoorest Wealthiest
State Sex 200/% 2"d Quinfile 3rd Quintile 4tt Quintile 20%Uttar Pradesh Male 10.3 9.7 14.4 12.0 53.5
Female 9.9 9.7 11.3 35.9 33.3Total 10.0 9.7 12.5 26.4 41.3
All Indla Male 9.7 13.3 15.5 25.1 36.4Female 10.7 14.4 20.9 25.6 28.5Total 10.2 13.9 18.4 25.3 32.2
Source: NCAER 2000, also NSS 52"" Round, 1995-96.
5.49 While public health spending in UP, in fact, is less pro-poor than in many other states, thefacilities it supports will continue to be under-utilized by their intended beneficiaries unless problems ofquality and access are addressed. In particular, an adequate and reliable supply of medicines and medicalsupplies must flow to the primary health-care facilities on a regular basis. Adequate funding of personnelcosts is another critical constraint: staff shortages are such a major weakness that of the 3,787 sanctionedpositions for Medical Officers in UP's primary health centers (PHCs), 1,524 were found to be vacant in1997. ANMs, the health workers with the greatest local outreach, are seriously overburdened and lackpromised back-up and support. One ANM per sub-center is sanctioned (i.e. about one per 5,000population). Of the 21,712 sanctioned posts for ANMs, 21,323 are currently filled, and an additional2,918 have been hired on a contract basis under the Reproductive and Child Health (RCH) progran.However, due to UP' s high fertility, each ANM on average will have to deal with an estimated 200pregnancies and 180 child births each year. The corresponding numbers in Tamil Nadu are 100pregnancies and 90 childbirths. Despite reaching national norms, overall coverage thus remains low inUP. In addition to the filling of staff vacancies, a high priority for increased funding is for measures toimprove the capabilities and performance of practitioners now working in public health services delivery.
5.50 Preventive health care also deserves greater emphasis, particularly for poor women and children.The declines in infant and child mortality rates of the past few decades are traceable, at least in part, togovernment-sponsored preventive health initiatives including immunization campaigns and installation ofclean-water points in rural areas. To reduce the burden on the curative system, these efforts should beintensified. In addition, public agencies and NGOs should focus greater resources on the developmentand broad-based dissemination of public health information messages aimed at improving communitymembers' capacity to safeguard their own and their children's health.
5.51 As an interesting and potentially valuable altemative to public health care, non-governmentalorganizations in India have been experimenting with mechanisms to provide informal health insurance tothe poor (Box 5.7).
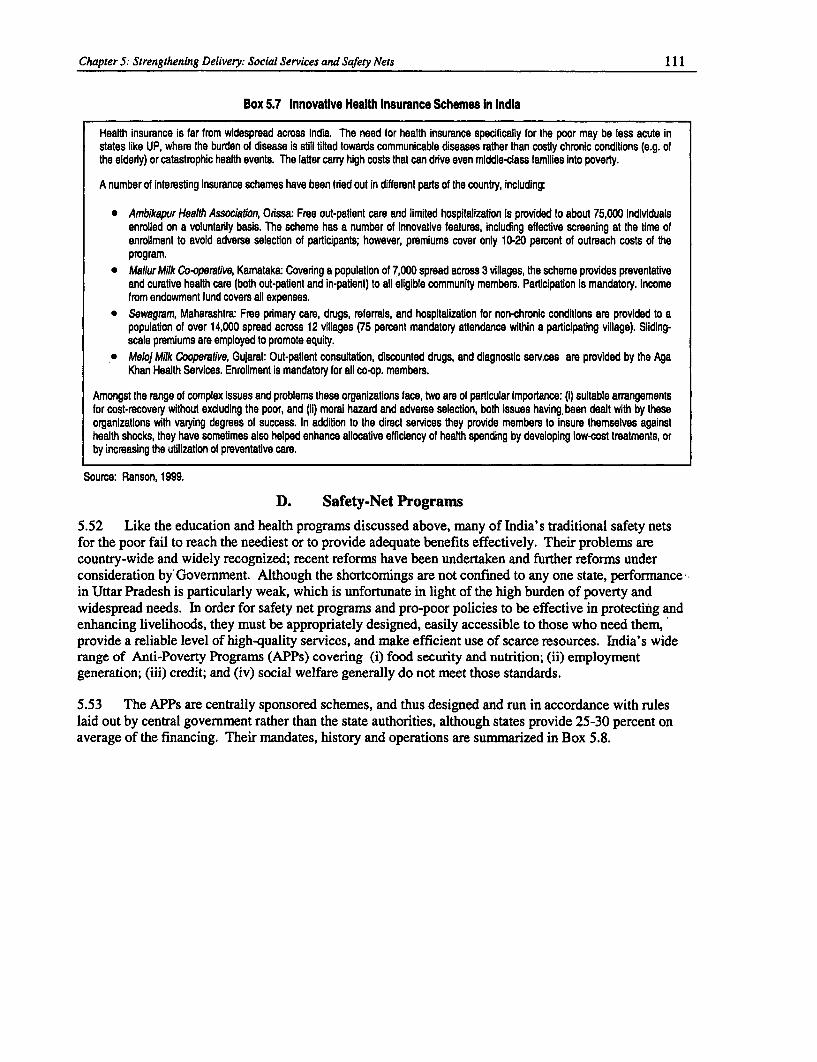
Chapter 5: Strengthening Delivery: Social Services and Safety Nets 111
Box 5.7 Innovative Health Insurance Schemes In India
Health insurance is far from widespread across India. The need for health insurance specifically for the poor may be less acute instates like UP, where the burden of disease Is still tilted towards communicable diseases rather than costly chronic conditions (e.g. ofthe elderly) or catastrophic health events. The latter carry high costs that can drive even middle-class families Into poverty.
A number of interesting Insurance schemes have been tried out in different parts of the country, including:
* Ambikapur Health Associaton, Orissa: Free out-patient care and limited hospitalization Is provided to about 75,000 individualsenrolled on a voluntarily basis. The scheme has a number of Innovative features, including effective screening at the time ofenrollment to avoid adverse selection of participants; however, premiums cover only 10-20 percent of outreach costs of theprogram.
* Mallur Milk Co-operaUve, Kamataka: Covering a population of 7,000 spread across 3 villages, the scheme provides preventativeand curative health care (both out-patient and in-patient) to all eligible community members. Participation is mandatory. Incomefrom endowment fund covers all expenses.
* Sewagram, Maharashtra: Free primary care, drugs, referrals, and hospitalization for non-chronic conditions are provided to apopulation of over 14,000 spread across 12 villages (75 percent mandatory attendance within a participating village). Sliding-scale premiums are employed to promote equity.
* Meloj Milk Cooperatve, Gujarat: Out-patient consultation, discounted drugs, and diagnostic services are provided by the AgaKhan Health Services. Enrollment is mandatory for all co-op. members.
Amongst the range of complex issues and problems these organizations face, two are of particular importance: (i) suitable arrangementsfor cost-recovery without excluding the poor, and (ii) moral hazard and adverse selection, both issues having, been dealt with by theseorganizations with varying degrees of success. In addition to the direct services they provide members to insure themselves againsthealth shocks, they have sometimes also helped enhance allocative efficiency of health spending by developing low-cost treatments, orby increasing the utilization of preventative care.
Source: Ranson, 1999.
D. Safety-Net Programs
5.52 Like the education and health programs discussed above, many of India's traditional safety netsfor the poor fail to reach the neediest or to provide adequate benefits effectively. Their problems arecountry-wide and widely recognized; recent reforms have been undertaken and further reforms underconsideration by Government. Although the shortcomings are not confined to any one state, performancein Uttar Pradesh is particularly weak, which is unfortunate in light of the high burden of poverty andwidespread needs. In order for safety net programs and pro-poor policies to be effective in protecting andenhancing livelihoods, they must be appropriately designed, easily accessible to those who need them,provide a reliable level of high-quality services, and make efficient use of scarce resources. India's widerange of Anti-Poverty Programs (APPs) covering (i) food security and nutrition; (ii) employmentgeneration; (iii) credit; and (iv) social welfare generally do not meet those standards.
5.53 The APPs are centrally sponsored schemes, and thus designed and run in accordance with ruleslaid out by central government rather than the state authorities, although states provide 25-30 percent onaverage of the financing. Their mandates, history and operations are summarized in Box 5.8.
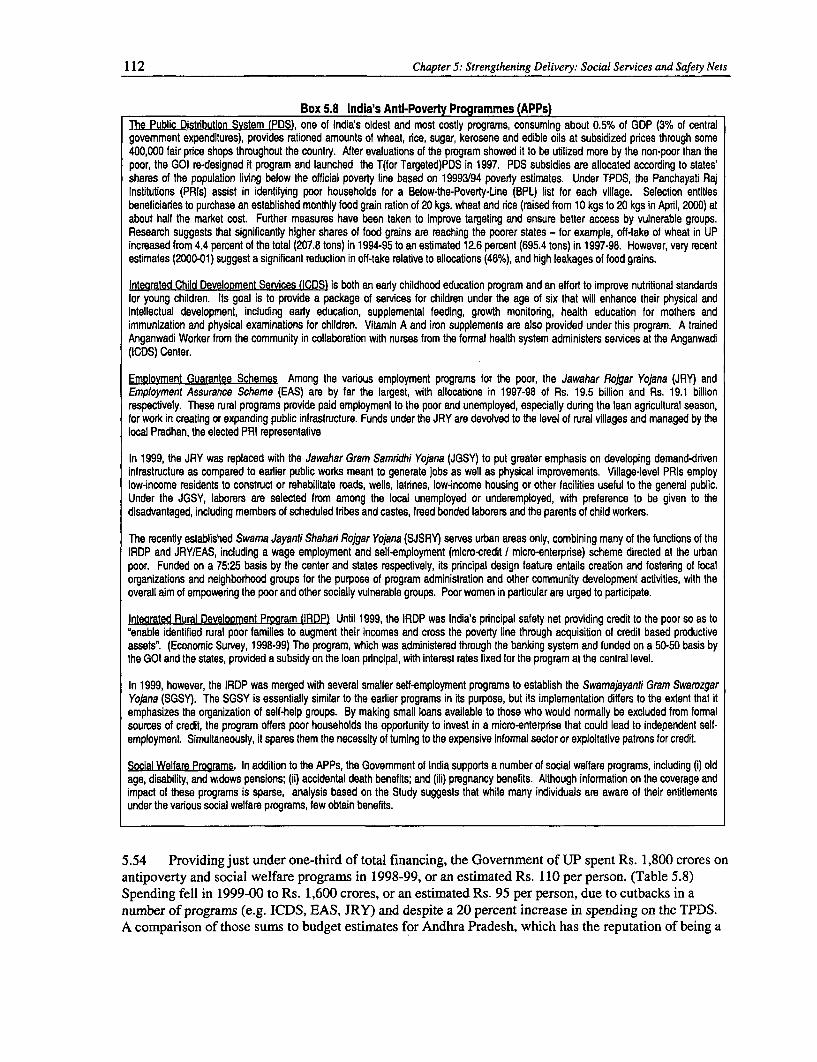
112 Chapter 5: Strengthening Delivery: Social Services and Safety Nets
Box 5.8 India's Anti-Poverty Programmes (APPs)The Public Distfibution System (PDS), one of India's oldest and most costly programs, consuming about 0.50% of GDP (3% of centralgovemment expenditures), provides rationed amounts of wheat, rice, sugar, kerosene and edible oils at subsidized prices through some400,000 fair price shops throughout the country. After evaluations of the program showed it to be utilized more by the non-poor than thepoor, the GOI re-designed it program and launched the T(for Targeted)PDS in 1997. PDS subsidies are allocated according to states'shares of the population living below the official poverty line based on 19993/94 poverty estimates. Under TPDS, the Panchayati RajInstitutions (PRIs) assist in identifying poor households for a Below-the-Poverty-Line (BPL) list for each village. Selection entitlesbeneficiaries to purchase an established monthly food grain ration of 20 kgs. wheat and rice (raised from 10 kgs to 20 kgs in April, 2000) atabout half the market cost. Further measures have been taken to improve targeting and ensure better access by vulnerable groups.Research suggests that significantly higher shares of food grains are reaching the poorer states - for example, off-take of wheat in UPincreased from 4.4 percent of the total (207.8 tons) in 1994-95 to an estimated 12.6 percent (695.4 tons) in 1997-98. However, very recentestimates (2000-01) suggest a significant reduction in off-take relative to allocations (46%), and high leakages of food grains.
Integrated Child Development Services (ICDS) is both an early childhood education program and an effort to improve nutritional standardsfor young children. Its goal is to provide a package of services for children under the age of six that will enhance their physical andintellectual development, including early education, supplemental feeding, growth monitoring, health education for mothers andimmunization and physical examinations for children. Vitamin A and iron supplements are also provided under this program. A trainedAnganwadi Worker from the community in collaboration with nurses from the formal health system administers services at the Anganwadi(ICDS) Center.
Emplovment Guarantee Schemes Among the various employment programs for the poor, the Jawahar Roigar Yojana (JRY) andEmployment Assurance Scheme (EAS) are by far the largest, with allocations in 1997-98 of Rs. 19.5 billion and Rs. 19.1 billionrespectively. These rural programs provide paid employment to the poor and unemployed, especially during the lean agricultural season,for work in creating or expanding public infrastnucture. Funds under the JRY are devolved to the level of rural villages and managed by thelocal Pradhan, the elected PRI representative
In 1999, the JRY was replaced with the Jawahar Gram Samridhi Yojana (JGSY) to put greater emphasis on developing demand-driveninfrastructure as compared to earlier public works meant to generate jobs as well as physical improvements. Village-level PRIs employlow-income residents to construct or rehabilitate roads, wells, latrines, low-income housing or other facilities useful to the general public.Under the JGSY, laborers are selected from among the local unemployed or underemployed, with preference to be given to thedisadvantaged, including members of scheduled tribes and castes, freed bonded laborers and the parents of child workers.
The recently established Swama Jayangi Shahari Rojgar Yojana (SJSRY) serves urban areas only, combining many of the functions of theIRDP and JRYIEAS, including a wage employment and self-employment (micro-credit / micro-enterprise) scheme directed at the urbanpoor. Funded on a 75:25 basis by the center and states respectively, its principal design feature entails creation and fostering of localorganizations and neighborhood groups for the purpose of program administration and other community development activities, with theoverall aim of empowering the poor and other socially vulnerable groups. Poor women in particular are urged to participate.
Integrated Rural Development Program (IRDP) Until 1999, the IRDP was India's principal safety net providing credit to the poor so as to'enable identified rural poor families to augment their incomes and cross the poverty line through acquisition of credit based productiveassets". (Economic Survey, 1998-99) The program, which was administered through the banking system and funded on a 50-50 basis bythe GOI and the states, provided a subsidy on the loan principal, with interest rates fixed for the program at the central level.
In 1999, however, the IRDP was merged with several smaller self-employment programs to establish the Swamajayanti Gram SwarozgarYojana (SGSY). The SGSY is essentially similar to the earlier programs in its purpose, but its implementation differs to the extent that itemphasizes the organization of self-help groups. By making small loans available to those who would normally be excluded from formalsources of credit, the program offers poor households the opportunity to invest in a micro-enterprise that could lead to independent self-employment. Simultaneously, it spares them the necessity of tuming to the expensive informal sector or exploitative patrons for credit.
Social Welfare Programs. In addition to the APPs, the Govemment of India supports a number of social welfare programs, including (i) oldage, disability, and widows pensions; (ii) accidental death benefits; and (iii) pregnancy benefits. Although information on the coverage andimpact of these programs is sparse, analysis based on the Study suggests that while many individuals are aware of their entitlementsunder the varous social welfare programs, few obtain benefits.
5.54 Providing just under one-third of total financing, the Government of UP spent Rs. 1,800 crores onantipoverty and social welfare programs in 1998-99, or an estimated Rs. 110 per person. (Table 5.8)Spending fell in 1999-00 to Rs. 1,600 crores, or an estimated Rs. 95 per person, due to cutbacks in anumber of programs (e.g. ICDS, EAS, JRY) and despite a 20 percent increase in spending on the TPDS.A comparison of those sums to budget estimates for Andhra Pradesh, which has the reputation of being a
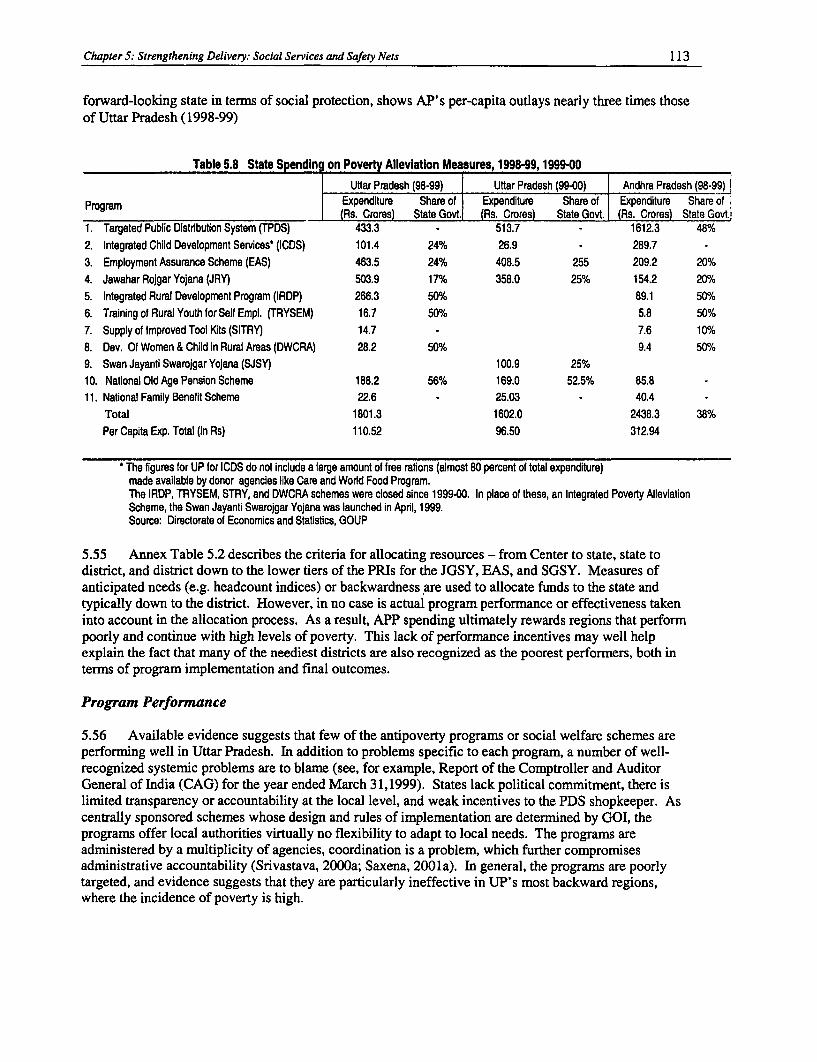
Chapter 5: Strengthening Delivery: Social Services and Safety Nets 113
forward-looking state in terms of social protection, shows AP's per-capita outlays nearly three times thoseof Uttar Pradesh (1998-99)
Table 5.8 State Spending on Poverty Alleviation Measures, 1998-99,1999-00
Uttar Pradesh (98-99) Uttar Pradesh (99-00) Andhra Pradesh (98-99)gram Expenditure Share of Expenditure Share of Expenditure Share of
rog___________________________________ (Rs. Crores) State Govt. (Rs. Crores) State Govt. (Rs. Crores) State Govt.1. Targeted Public Distribution System (TPDS) 433.3 513.7 - 1612.3 48%2. Integrated Child Development Services* (ICDS) 101.4 24% 26.9 - 289.73. Employment Assurance Scheme (EAS) 463.5 24% 408.5 255 209.2 20%4. Jawahar Rojgar Yojana (JRY) 503.9 17% 358.0 25% 154.2 20%5. Integrated Rural Development Program (IRDP) 266.3 50%/0 89.1 50%6. Training of Rural Youth for Self Empl. (TRYSEM) 16.7 50% 5.8 50%7. Supply of Improved Tool Kits (SITRY) 14.7 7.6 10%8. Dev. Of Women & Child in Rural Areas (DWCRA) 28.2 50% 9.4 50%9. Swan Jayanti Swarojgar Yojana (SJSY) 100.9 25%10. National Old Age Pension Scheme 188.2 56% 169.0 52.5% 85.811. National Family Benefit Scheme 22.6 - 25.03 - 40.4
Total 1801.3 1602.0 2438.3 38%Per Capita Exp. Total (in Rs) 110.52 96.50 312.94
The figures for UP for ICDS do not include a large amount of free rations (almost 80 percent of total expenditure)made available by donor agencies like Care and Wordd Food Program.The IRDP, TRYSEM, STRY, and DWCRA schemes were closed since 1999-00. In place of these, an Integrated Poverty AlleviationScheme, the Swan Jayanti Swarojgar Yojana was launched in April, 1999.Source: Directorate of Economics and Statistics, GOUP
5.55 Annex Table 5.2 describes the criteria for allocating resources - from Center to state, state todistrict, and district down to the lower tiers of the PRIs for the JGSY, EAS, and SGSY. Measures ofanticipated needs (e.g. headcount indices) or backwardness are used to allocate funds to the state andtypically down to the district. However, in no case is actual program performance or effectiveness takeninto account in the allocation process. As a result, APP spending ultimately rewards regions that performpoorly and continue with high levels of poverty. This lack of performance incentives may well helpexplain the fact that many of the neediest districts are also recognized as the poorest performers, both interms of program implementation and final outcomes.
Program Performance
5.56 Available evidence suggests that few of the antipoverty programs or social welfare schemes areperforming well in Uttar Pradesh. In addition to problems specific to each program, a number of well-recognized systemic problems are to blame (see, for example, Report of the Comptroller and AuditorGeneral of India (CAG) for the year ended March 31,1999). States lack political commitment, there islimited transparency or accountability at the local level, and weak incentives to the PDS shopkeeper. Ascentrally sponsored schemes whose design and rules of implementation are determined by GOI, theprograms offer local authorities virtuaUy no flexibility to adapt to local needs. The programs areadmninistered by a multiplicity of agencies, coordination is a problem, which further compromisesadministrative accountability (Srivastava, 2000a; Saxena, 2001a). In general, the programs are poorlytargeted, and evidence suggests that they are particularly ineffective in UP's most backward regions,where the incidence of poverty is high.
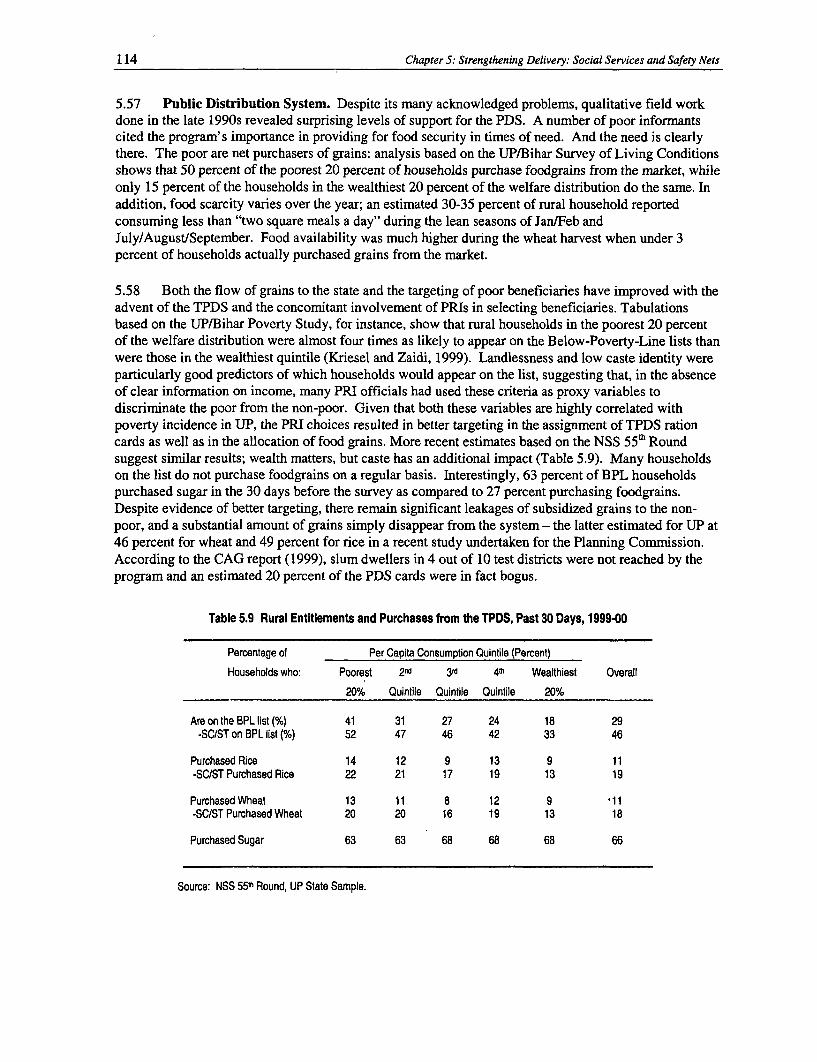
114 Chapter 5: Strengthening Delivery: Social Services and Safety Nets
5.57 Public Distribution System. Despite its many acknowledged problems, qualitative field workdone in the late 1990s revealed surprising levels of support for the PDS. A number of poor informantscited the program's importance in providing for food security in times of need. And the need is clearlythere. The poor are net purchasers of grains: analysis based on the UP/Bihar Survey of Living Conditionsshows that 50 percent of the poorest 20 percent of households purchase foodgrains from the market, whileonly 15 percent of the households in the wealthiest 20 percent of the welfare distribution do the same. Inaddition, food scarcity varies over the year; an estimated 30-35 percent of rural household reportedconsuming less than "two square meals a day" during the lean seasons of Jan/Feb andJuly/August/September. Food availability was much higher during the wheat harvest when under 3percent of households actually purchased grains from the market.
5.58 Both the flow of grains to the state and the targeting of poor beneficiaries have improved with theadvent of the TPDS and the concomitant involvement of PRIs in selecting beneficiaries. Tabulationsbased on the UP/Bihar Poverty Study, for instance, show that rural households in the poorest 20 percentof the welfare distribution were almost four times as likely to appear on the Below-Poverty-Line lists thanwere those in the wealthiest quintile (Kriesel and Zaidi, 1999). Landlessness and low caste identity wereparticularly good predictors of which households would appear on the list, suggesting that, in the absenceof clear information on income, many PRI officials had used these criteria as proxy variables todiscriminate the poor from the non-poor. Given that both these variables are highly correlated withpoverty incidence in UP, the PRI choices resulted in better targeting in the assignment of TPDS rationcards as well as in the allocation of food grains. More recent estimates based on the NSS 55t Roundsuggest similar results; wealth matters, but caste has an additional impact (Table 5.9). Many householdson the list do not purchase foodgrains on a regular basis. Interestingly, 63 percent of BPL householdspurchased sugar in the 30 days before the survey as compared to 27 percent purchasing foodgrains.Despite evidence of better targeting, there remain significant leakages of subsidized grains to the non-poor, and a substantial amount of grains simply disappear from the system - the latter estimated for UP at46 percent for wheat and 49 percent for rice in a recent study undertaken for the Planning Commission.According to the CAG report (1999), slum dwellers in 4 out of 10 test districts were not reached by theprogram and an estimated 20 percent of the PDS cards were in fact bogus.
Table 5.9 Rural Entitlements and Purchases from the TPDS, Past 30 Days, 1999-00
Percentage of Per Capita Consumption Quintile (Percent)
Households who: Poorest 2nd 3d 4w" Wealthiest Overall
20% Quintile Quintile Quintile 20%
Are on the BPL list (%) 41 31 27 24 18 29-SC/ST on BPL list (%) 52 47 46 42 33 46
Purchased Rice 14 12 9 13 9 11-SC/ST Purchased Rice 22 21 17 19 13 19
Purchased Wheat 13 11 8 12 9 *11-SC/ST Purchased Wheat 20 20 16 19 13 18
Purchased Sugar 63 63 68 68 68 66
Source: NSS 551f Round, UP State Sample.
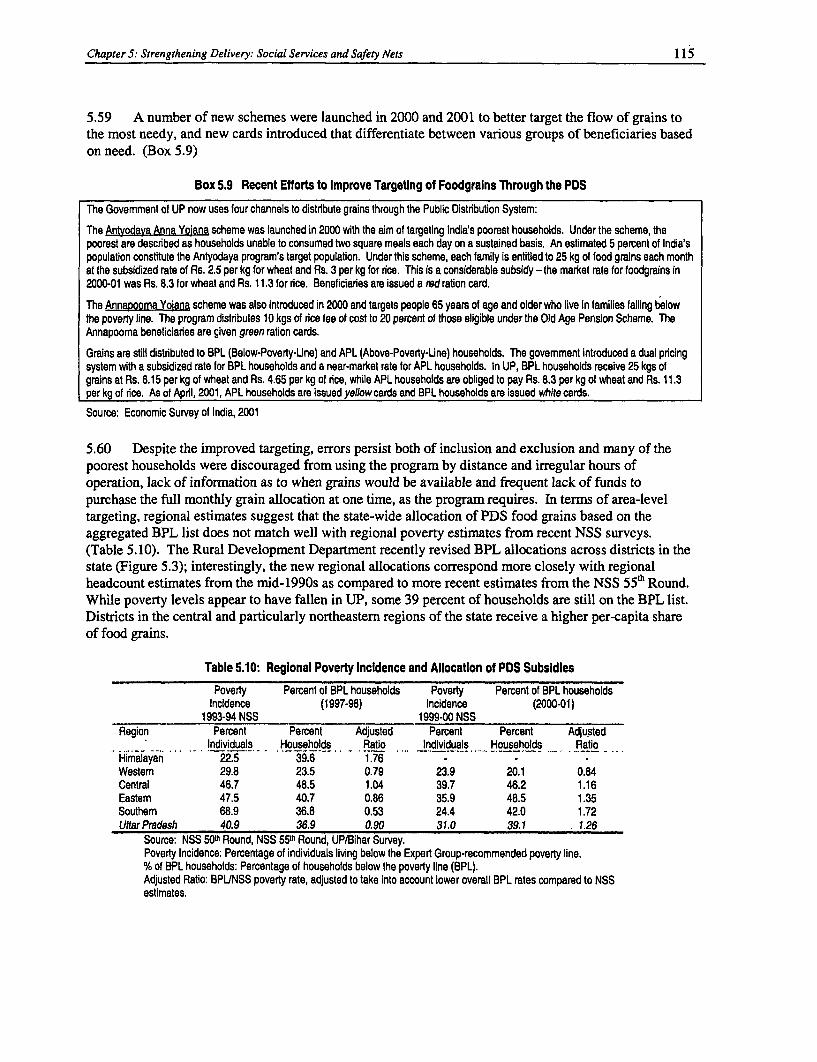
Chapter 5: Strengthening Delivery: Social Services and Safety Nets 115
5.59 A number of new schemes were launched in 2000 and 2001 to better target the flow of grains tothe most needy, and new cards introduced that differentiate between various groups of beneficiaries basedon need. (Box 5.9)
Box 5.9 Recent Efforts to Improve Targeting of Foodgrains Through the PDS
The Govemment of UP now uses four channels to distribute grains through the Public Distribution System:
The Antyodaya Anna Yojana scheme was launched in 2000 with the aim of targeting India's poorest households. Under the scheme, thepoorest are described as households unable to consumed two square meals each day on a sustained basis. An estimated 5 percent of India'spopulation constitute the Antyodaya program's target population. Under this scheme, each family is entitled to 25 kg of food grains each monthat the subsidized rate of Rs. 2.5 per kg for wheat and Rs. 3 per kg for rice. This is a considerable subsidy - the market rate for foodgrains in2000-01 was Rs. 8.3 for wheat and Rs. 11.3 for dce. Beneficiaries are issued a red ration card.
The Annapooma Yojana scheme was also introduced in 2000 and targets people 65 years of age and older who live in families falling belowthe poverty line. The program distributes 10 kgs of rice fee of cost to 20 percent of those eligible under the Old Age Pension Scheme. TheAnnapooma beneficiaries are given green ration cards.
Grains are still distributed to BPL (Below-Poveny-Line) and APL (Above-Poverty-Line) households. The govemment introduced a dual prcingsystem with a subsidized rate for BPL households and a near-market rate for APL households. In UP, BPL households receive 25 kgs ofgrains at Rs. 6.15 per kg of wheat and Rs. 4.65 per kg of rice, while APL households are obliged to pay Rs. 8.3 per kg of wheat and Rs. 11.3per kg of rice. As of April, 2001, APL households are issued yellow cards and BPL households are issued white cards.
Source: Economic Survey of India, 2001
5.60 Despite the improved targeting, errors persist both of inclusion and exclusion and many of thepoorest households were discouraged from using the program by distance and irregular hours ofoperation, lack of information as to when grains would be available and frequent lack of funds topurchase the full monthly grain allocation at one time, as the program requires. In terms of area-leveltargeting, regional estimates suggest that the state-wide allocation of PDS food grains based on theaggregated BPL list does not match well with regional poverty estimates from recent NSS surveys.(Table 5. 10). The Rural Development Department recently revised BPL allocations across districts in thestate (Figure 5.3); interestingly, the new regional allocations correspond more closely with regionalheadcount estimates from the mid-1990s as compared to more recent estimates from the NSS 55h Round.While poverty levels appear to have fallen in UP, some 39 percent of households are still on the BPL list.Districts in the central and particularly northeastern regions of the state receive a higher per-capita shareof food grains.
Table 5.10: Regional Poverty Incidence and Allocation of PDS Subsidies
Poverty Percent of BPL households Poverty Percent of BPL householdsIncidence (1997-98) Incidence (2000-01)
1993-94 NSS 1999-00 NSSRegion Percent Percent Adjusted Percent Percent Adjusted
Individuals Households Ratio Individuals Households RatioHimalayan 22.5 39.6 1.76 - - -
Westem 29.8 23.5 0.79 23.9 20.1 0.84Central 46.7 48.5 1.04 39.7 46.2 1.16Eastem 47.5 40.7 0.86 35.9 48.5 1.35Southem 68.9 36.8 0.53 24.4 42.0 1.72UttarPradesh 40.9 36.9 0.90 31.0 39.1 1.26
Source: NSS 50u Round, NSS 55th Round, UP/Bihar Survey.Poverty Incidence: Percentage of individuals living below the Expert Group-recommended poverty line.% of BPL households: Percentage of households below the poverty line (BPL).Adjusted Ratio: BPL/NSS poverty rate, adjusted to take into account lower overall BPL rates compared to NSSestimates.
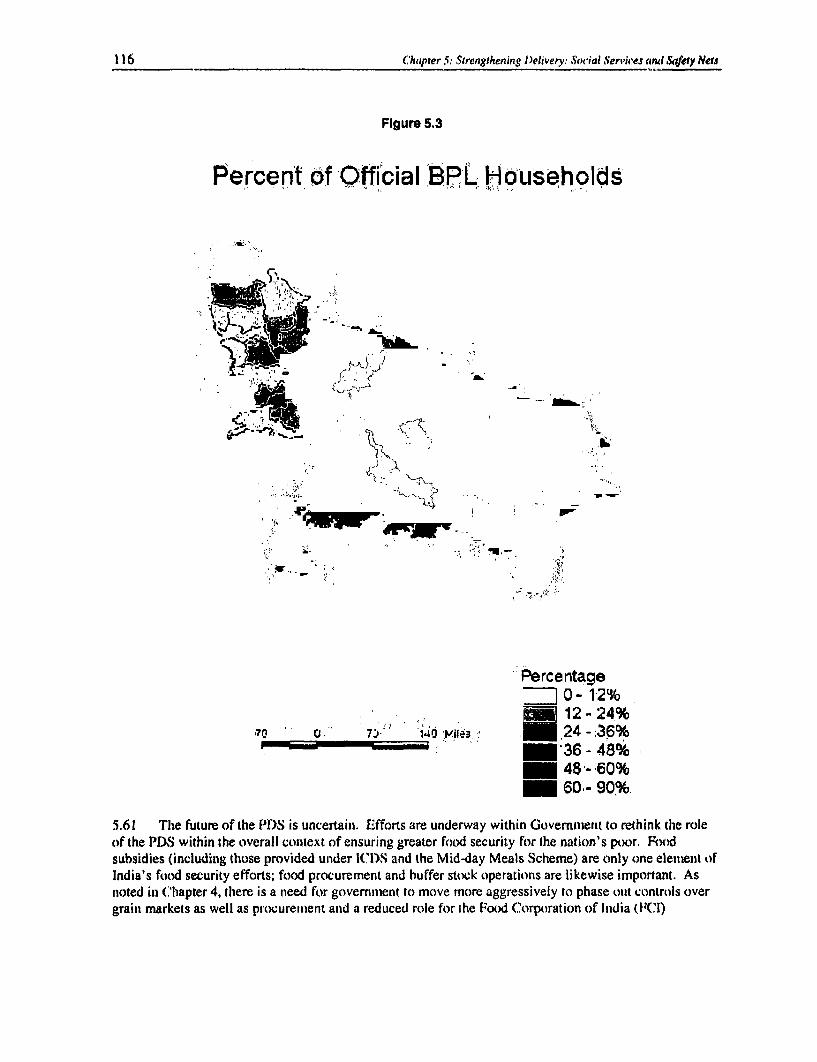
116 :hapter 5: Strengthenin8g l)eivery: .Social Sen'ives mnl WSfe!y Ness
Figure 5.3
Percent Of Official BPL Hluseholds, .,~~~~~~~~~~~~~~~~~~~~~~~~~~~~~~~~~~p
) ~ ~~~ A$gj- '
I -IL
.'~~~~~~~~~~~~~~~~~. ''"'
Percentage0- 1-2%12 - 24%
70. 140 , .;36 - 48%48- 60%60-- 90%.
5.61 The future of the PD)S is uncertain. Efforts are underway within Government to rethink the roleof the PD)S within the overall context of ensuring greater foxxd security for the nation's poxor. Foxodsubsidies (including those provided under WCI)S and the Mid-day Meals Scheme) are only one eleimenit ofIndia's food security efforts; food prcxurement and buffer stock operationis are likewise important. Asnoted in ("hapter 4, there is a need for government to move more aggressively to phase oUt controls overgrain markets as well as procurement and a reduced role for the P(xxi Corporation of India (Wi)
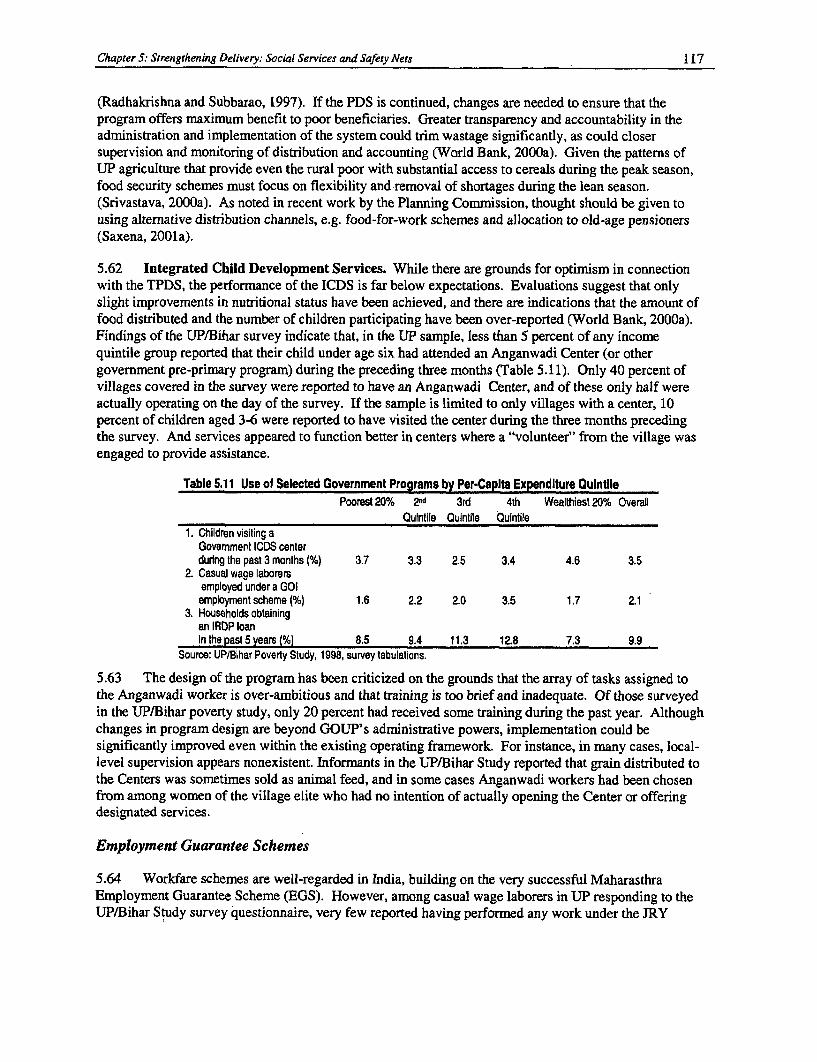
Chapter 5: Strengthening Delivery: Social Services and Safety Nets 117
(Radhakrishna and Subbarao, 1997). If the PDS is continued, changes are needed to ensure that theprogram offers maximum benefit to poor beneficiaries. Greater transparency and accountability in theadministration and implementation of the system could trim wastage significantly, as could closersupervision and monitoring of distribution and accounting (World Bank, 2000a). Given the patterns ofUP agriculture that provide even the rural poor with substantial access to cereals during the peak season,food security schemes must focus on flexibility and removal of shortages during the lean season.(Srivastava, 2000a). As noted in recent work by the Planning Commission, thought should be given tousing alternative distribution channels, e.g. food-for-work schemes and allocation to old-age pensioners(Saxena, 2001a).
5.62 Integrated Child Development Services. While there are grounds for optimism in connectionwith the TPDS, the performance of the ICDS is far below expectations. Evaluations suggest that onlyslight improvements in nutritional status have been achieved, and there are indications that the amount offood distributed and the number of children participating have been over-reported (World Bank, 2000a).Findings of the UP/Bihar survey indicate that, in the UP sample, less than 5 percent of any incomequintile group reported that their child under age six had attended an Anganwadi Center (or othergovernment pre-primary program) during the preceding three months (Table 5.11). Only 40 percent ofvillages covered in the survey were reported to have an Anganwadi Center, and of these only half wereactually operating on the day of the survey. If the sample is limited to only villages with a center, 10percent of children aged 3-6 were reported to have visited the center during the three months precedingthe survey. And services appeared to function better in centers where a "volunteer" from the village wasengaged to provide assistance.
Table 5.11 Use of Selected Government Programs by Per-Capita Expenditure QuintilePoorest 20% 2nd 3rd 4th Wealthiest 20% Overall
Qulntile Quintile Quintile1. Children visiting a
Govemment ICDS centerduring the past 3 months (%) 3.7 3.3 2.5 3.4 4.6 3.5
2. Casual wage laborersemployed under a GOI
employment scheme (%) 1.6 2.2 2.0 3.5 1.7 2.13. Households obtaining
an IRDP loanin the past 5 years (%) 8.5 9.4 11.3 12.8 7.3 9.9
Source: UP/Bihar Poverty Study, 1998, survey tabulations.
5.63 The design of the program has been criticized on the grounds that the array of tasks assigned tothe Anganwadi worker is over-ambitious and that training is too brief and inadequate. Of those surveyedin the UP/Bihar poverty study, only 20 percent had received some training during the past year. Althoughchanges in program design are beyond GOUP's administrative powers, implementation could besignificantly improved even within the existing operating framework. For instance, in many cases, local-level supervision appears nonexistent. Infonnants in the UP/Bihar Study reported that grain distributed tothe Centers was sometimes sold as animal feed, and in some cases Anganwadi workers had been chosenfrom among women of the village elite who had no intention of actually opening the Center or offeringdesignated services.
Employment Guarantee Schemes
5.64 Workfare schemes are well-regarded in India, building on the very successful MaharasthraEmployment Guarantee Scheme (EGS). However, among casual wage laborers in UP responding to theUP/Bihar Study survey questionnaire, very few reported having performed any work under the JRY
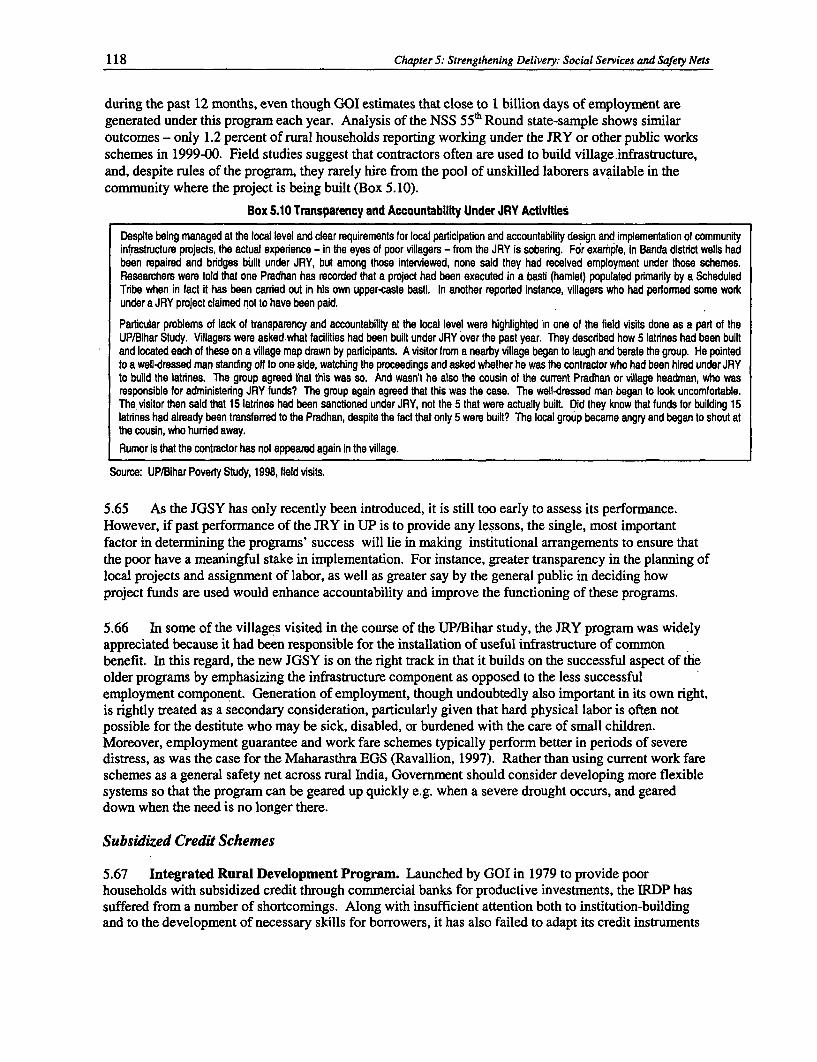
118 Chapter 5: Strengthening Delivery: Social Services and Safety Nets
during the past 12 months, even though GOI estimates that close to 1 billion days of employment aregenerated under this program each year. Analysis of the NSS 55h Round state-sample shows similaroutcomes - only 1.2 percent of rural households reporting working under the JRY or other public worksschemes in 1999-00. Field studies suggest that contractors often are used to build village.infrastructure,and, despite rules of the program, they rarely hire from the pool of unskilled laborers available in thecommunity where the project is being built (Box 5.10).
Box 5.10 Transparency and Accountabillty Under JRY Activities
Despite being managed at the focal level and clear requirements for local participation and accountability design and implementation of communityinfrastructure projects, the actual expedence - in the eyes of poor villagers - from the JRY is soberng. For example, in Banda distridct wells hadbeen repaired and bridges built under JRY, but among those interviewed, none said they had received employment under those schemes.Researchers were told that one Pradhan has recorded that a project had been executed in a basti (hamlet) populated primarily by a ScheduledTribe when in fact it has been carried out in his own upper-caste basti. In another reported instance, villagers who had performed some workunder a JRY project claimed not to have been paid.
Particular proMblems of lack of transparency and accountability at the local level were highlighted in one of the field visits done as a part of theUP/Bihar Study. Villagers were asked,what facilities had been built under JRY over the past year. They described how 5 latrines had been builtand located each of these on a village map drawn by participants. A visitor from a nearby village began to laugh and berate the group. He pointedto a well-dressed man standing off to one side, watching the proceedings and asked whether he was the contractor who had been hired under JRYto build the latrines. The group agreed that this was so. And wasn't he also the cousin of the current Pradhan or village headman, who wasresponsible for administering JRY funds? The group again agreed that this was the case. The well-dressed man began to look uncomfortable.The visitor then said that 15 latrines had been sanctioned under JRY, not the 5 that were actually built. Did they know that funds for building 15latrines had already been transferred to the Pradhan, despite the fact that only 5 were built? The local group became angry and began to shout atthe cousin, who hurried away.Rumor is that the contractor has not appeared again in the village.
Source: UP/Bihar Poverty Study, 1998, field visits.
5.65 As the JGSY has only recently been introduced, it is still too early to assess its performance.However, if past performance of the JRY in UP is to provide any lessons, the single, most importantfactor in determining the programs' success will lie in making institutional arrangements to ensure thatthe poor have a meaningful stake in implementation. For instance, greater transparency in the planning oflocal projects and assignment of labor, as well as greater say by the general public in deciding howproject funds are used would enhance accountability and improve the functioning of these programs.
5.66 In some of the villages visited in the course of the UP/Bihar study, the JRY program was widelyappreciated because it had been responsible for the installation of useful infrastructure of commonbenefit. In this regard, the new JGSY is on the right track in that it builds on the successful aspect of theolder programs by emphasizing the infrastructure component as opposed to the less successfulemployment component. Generation of employment, though undoubtedly also important in its own right,is rightly treated as a secondary consideration, particularly given that hard physical labor is often notpossible for the destitute who may be sick, disabled, or burdened with the care of small children.Moreover, employment guarantee and work fare schemes typically perform better in periods of severedistress, as was the case for the Maharasthra EGS (Ravallion, 1997). Rather than using current work fareschemes as a general safety net across rural India, Government should consider developing more flexiblesystems so that the program can be geared up quickly e.g. when a severe drought occurs, and geareddown when the need is no longer there.
Subsidized Credit Schemes
5.67 Integrated Rural Development Program. Launched by GOI in 1979 to provide poorhouseholds with subsidized credit through commercial banks for productive investments, the IRDP hassuffered from a number of shortcomings. Along with insufficient attention both to institution-buildingand to the development of necessary skills for borrowers, it has also failed to adapt its credit instruments
Chapter S: Strengthening Delivery: Social Services and Safety Nets 119
to serve the real financial needs of the poor.
5.68 A major, built-in problem with subsidizing credit is the artificial limit it imposes on the totalvolume of loans the government can afford. Rather than being responsive to demand, lending isconstrained by the total budget available for the subsidy. Households suffer when they are unable toborrow what they want at the prevailing interest rates. Additionally, the limit opens the door todiscretionary action and corruption on the part of program administrators who determine who does anddoes not get access to loans. Further, the ceiling placed on the maximum interest rate also limits the ratesthat bank managers can offer on savings deposits, thus undermnining savings mobilization in the ruraleconomy. There is an urgent need to raise interest rates, at least match those prevailing in the market, andreduce distortions and corruption.
5.69 The findings of the UP/Bihar study confirmed the prevalence of these problems. As shown inTable 5.10, less than 10 percent of the poor took an IRDP loan in the past five years, despite the fact thatabout two-thirds of households in the lowest consumption quintile reported that they were in debt at thetime of the survey. Over 85 percent of the households that had borrowed from the IRDP reported havingto pay someone else to receive the loan, with the amount of payment averaging over 20 percent of thetotal borrowed. Furthermore, during the qualitative interviews and focus group discussions, complaintssurfaced about the terms of the contract and repayment schedules, which illiterate borrowers, especially,thought unclear, and about officials' often skimming the govemment subsidy.
5.70 Moreover, when asked why they did not seek an IRDP loan, some said the loans actually increasea household's debt burden without improving its earning potential. Many of the loans were used tofinance marriages or consumption shortfalls rather than for investment or self-employment. The fact thatthe loans were used to finance consumption rather than investments is not cause for concem per se; creditplays an important role in reducing vulnerability of poor households by helping them smoothconsumption over time. The practice does, however, highlight the diversity of the-poor's credit needs andsuggests that not all poor households have the entrepreneurial experience or business expertise to use suchloans more productively. There is a pressing need for better access to credit for consumption smoothing,especially for the very poor.
5.71 The new SGSY attempts to redress this shortcoming by offering training in technical andmanagement skills to borrowers, as well as marketing support where needed. These additions maycorrect some of the deficiencies of the micro-credit/self-employment program strategy, but bettersupervision and accountability in program operations will remain a critical determinant of success.Without improvement in that area, potential borrowers may still be discouraged by various barriers toaccess as well as by corrupt administration of loans.
Micro-credit Alternatives
5.72 Experiences with micro-credit, both within the region as well as in other parts of the worldsuggest that group-based lending programs with active community participation have far higher, long-term chances of success than conventional government-run initiatives. Even after the introduction of theSGSY program, anti-poverty policy-makers in India urgently need to work on designing - and moreappropriately, facilitating implementation of programs -- that can capitalize on informal social networksand local knowledge to provide financial services to the poor and help raise local savings. Four examplesbelow (Box 5.11) illustrate some of the innovative design features of alternative credit programs.
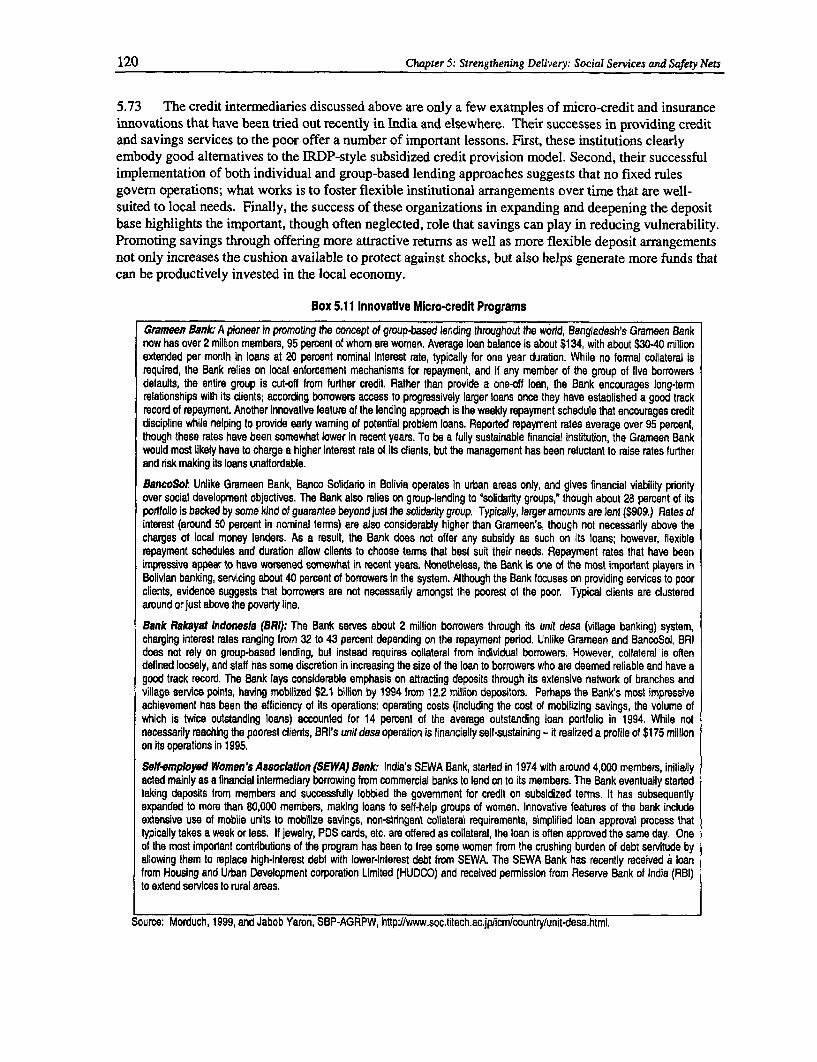
120 Chapter 5: Strengthening Delivery: Social Services and Safety Nets
5.73 The credit intermediaries discussed above are only a few examples of micro-credit and insuranceinnovations that have been tried out recently in India and elsewhere. Their successes in providing creditand savings services to the poor offer a number of important lessons. First, these institutions clearlyembody good alternatives to the IRDP-style subsidized credit provision model. Second, their successfulimplementation of both individual and group-based lending approaches suggests that no fixed rulesgovem operations; what works is to foster flexible institutional arrangements over time that are well-suited to local needs. Finally, the success of these organizations in expanding and deepening the depositbase highlights the important, though often neglected, role that savings can play in reducing vulnerability.Promoting savings through offering more attractive returns as well as more flexible deposit arrangementsnot only increases the cushion available to protect against shocks, but also helps generate more funds thatcan be productively invested in the local economy.
Box 5.11 Innovative Micro-credit Programs
Gvmewn Bank: A pioneer in promoting the concept of group-based lending throughout the wodd, Bangladesh's Grameen Banknow has over 2 million members, 95 percent of whom are women. Average loan balance is about $134, with about $3040 millionextended per mronth in loans at 20 percent nominal interest rate, typically for one year duration. While no formal collateral isrequired, the Bank relies on local enforcement mechanisms for repayment, and if any member of the group of five borrowersdefaults, the entire group is cut-off from further credit. Rather than provide a one-off loan, the Bank encourages long-termrelationships with its clients; according borrowers access to progressively larger loans once they have established a good trackrecord of repayment. Another innovative feature of the lending approach is the weekly repayment schedule that encourages creditdiscipline while helping to provide early waming of potential problem loans. Reported repayment rates average over 95 percent,though these rates have been somewhat lower in recent years. To be a fully sustainable financial institution, the Grameen Bankwould most likely have to charge a higher interest rate of its clients, but the management has been reluctant to raise rates furtherand risk making its loans unaffordable.
BsencoSot Unlike Grameen Bank, Banco Solidado in Bolivia operates in urban areas only, and gives financial viability priorityover social development objectives. The Bank also relies on group-lending to 'solidarity groups," though about 28 percent of itsportfolio is backed by some kind of guarantee beyond just the solidarity group. Typically, larger amounts are lent ($909.) Rates ofinterest (around 50 percent in nominal terms) are also considerably higher than Grameen's, though not necessarily above thecharges ot local money lenders. As a result, the Bank does not offer any subsidy as such on its loans; however, flexiblerepayment schedules and duration allow clients to choose terms that best suit their needs. Repayment rates that have beenimpressive appear to have worsened somewhat in recent years. Nonetheless, the Bank is one of the most important players inBolivian banking, servicing about 40 percent of borrowers in the system. Although the Bank focuses on providing services to poorclients, evidence suggests that borrowers are not necessarily amongst the poorest of the poor. Typical clients are clusteredaround or just above the poverty line.
Bank Rskeyat Indonesie (BRI): The Bank serves about 2 million borrowers through its unit desa (village banking) system,charging interest rates ranging from 32 to 43 percent depending on the repayment period. Unlike Grameen and BancoSol, BRIdoes not rely on group-based lending, but instead requires collateral from individual borrowers. However, collateral is oftendefined loosely, and staff has some discretion in increasing the size of the loan to borrowers who are deemed reliable and have agood track record. The Bank lays considerable emphasis on attracting deposits through its extensive network of branches andvillage service points, having mobilized $2.1 billion by 1994 frorn 12.2 million depositors. Perhaps the Bank's most impressiveachievement has been the efficiency o1 its operations: operating costs (including the cost of mobilizing savings, the volume ofwhich is twice outstanding loans) accounted for 14 percent of the average outstanding loan portfolio in 1994. While notnecessarily reaching the poorest clients, BRI's unit desa operation is financially self-sustaining - it realized a profile of $175 millionon its operations in 1995.
Self-employed Women's Associatfon (SEWA) Bank: India's SEWA Bank, started in 1974 with around 4,000 members, initiallyacted mainly as a financial intermediary borrowing from commercial banks to lend on to its members. The Bank eventually startedtaking deposits 1rom members and successfully lobbied the govemment for credit on subsidized terms. It has subsequentlyexpanded to more than 80,000 members, making loans to self-help groups of women. Innovative features of the bank includeextensive use of mobile units to mobilize savings, non-stringent collateral requirements, simplified loan approval process thaltypically takes a week or less. If jewelry, POS cards, etc. are oflered as collateral, the loan is often approved the same day. Oneof the most important contributions of the program has been to tree some women from the crushing burden of debt servitude byallowing them to replace high-interest debt with lowerinterest debt from SEWA. The SEWA Bank has recently received a loanfrom Housing and Urban Development corporation Limited (HUDCO) and received permission from Reserve Bank of India (RBI)to extend services to rural areas.
Source: Morduch, 1999, and Jabob Yaron, SBP-AGRPW, http-Jlwww.soc.titech.acjpfricmlcountry/unit-desa.html.
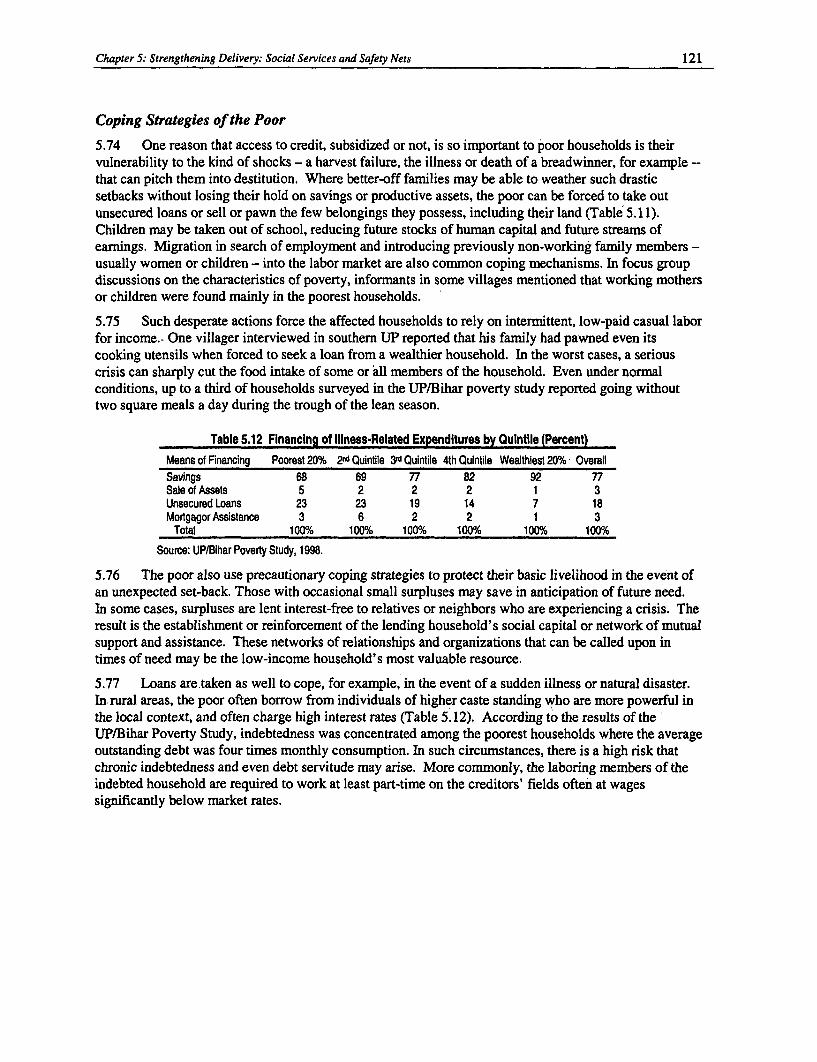
Chapter 5: Strengthening Delivery: Social Services and Safety Nets 121
Coping Strategies of the Poor
5.74 One reason that access to credit, subsidized or not, is so important to poor households is theirvulnerability to the kind of shocks - a harvest failure, the illness or death of a breadwinner, for example --that can pitch them into destitution. Where better-off families may be able to weather such drasticsetbacks without losing their hold on savings or productive assets, the poor can be forced to take outunsecured loans or sell or pawn the few belongings they possess, including their land (Table 5.11).Children may be taken out of school, reducing future stocks of human capital and future streams ofearnings. Migration in search of employment and introducing previously non-working family members -usually women or children - into the labor market are also common coping mechanisms. In focus groupdiscussions on the characteristics of poverty, informants in some villages mentioned that working mothersor children were found mainly in the poorest households.
5.75 Such desperate actions force the affected households to rely on intermittent, low-paid casual laborfor income.. One villager interviewed in southern UP reported that his family had pawned even itscooking utensils when forced to seek a loan from a wealthier household. In the worst cases, a seriouscrisis can sharply cut the food intake of some or all members of the household. Even under normalconditions, up to a third of households surveyed in the UP/Bihar poverty study reported going withouttwo square meals a day during the trough of the lean season.
Table 5.12 Financing of Illness-Related Expenditures by Qulntile (Percent)
Means of Financing Poorest 20% 2nrd Quintile 3rd Quintile 4th Quintile Wealthiest 20% OverallSavings 68 69 77 82 92 77Sale of Assets 5 2 2 2 1 3Unsecured Loans 23 23 19 14 7 18Mortgagor Assistance 3 6 2 2 1 3
Total 100% 100% 100% 100% 100% 100%
Source: UP/Bihar Poverty Study, 1998.
5.76 The poor also use precautionary coping strategies to protect their basic livelihood in the event ofan unexpected set-back. Those with occasional small surpluses may save in anticipation of future need.In some cases, surpluses are lent interest-free to relatives or neighbors who are experiencing a crisis. Theresult is the establishment or reinforcement of the lending household's social capital or network of mutualsupport and assistance. These networks of relationships and organizations that can be called upon intimes of need may be the low-income household's most valuable resource.
5.77 Loans are taken as well to cope, for example, in the event of a sudden illness or natural disaster.In.rural areas, the poor often borrow from individuals of higher caste standing who are more powerful inthe local context, and often charge high interest rates (Table 5.12). According to the results of theUP/Bihar Poverty Study, indebtedness was concentrated among the poorest households where the averageoutstanding debt was four times monthly consumption. In such circumstances, there is a high risk thatchronic indebtedness and even debt servitude may arise. More commonly, the laboring members of theindebted household are required to work at least part-time on the creditors' fields often at wagessignificantly below market rates.
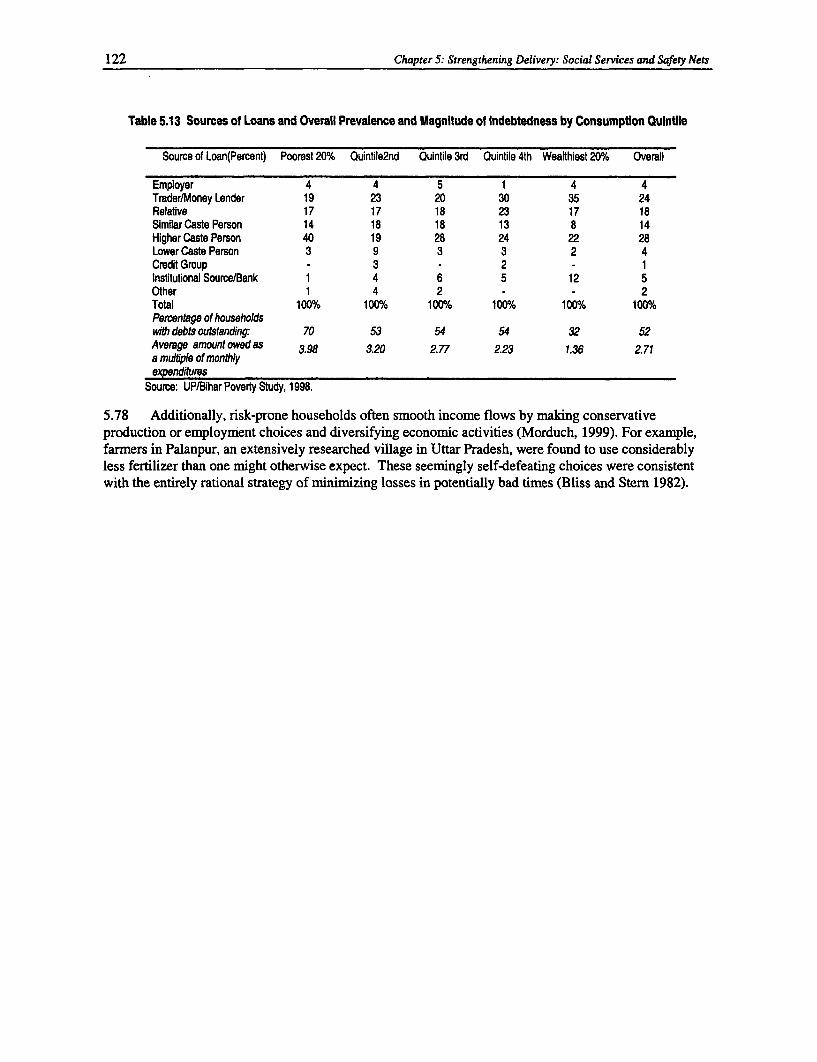
122 Chapter 5: Strengthening Delivery: Social Services and Safety Nets
Table 5.13 Sources of Loans and Overall Prevalence and Magnitude of Indebtedness by Consumption Quintile
Source of Loan(Percent) Poorest 20% Quintile2nd Quintile 3rd Quintile 4th Wealthiest 20% Overall
Employer 4 4 5 1 4 4Trader/Money Lender 19 23 20 30 35 24Relative 17 17 18 23 17 18Similar Caste Person 14 18 18 13 8 14Higher Caste Person 40 19 28 24 22 28Lower Caste Person 3 9 3 3 2 4Credit Group - 3 2 - 1Institutional Source/Bank 1 4 6 5 12 5Other 1 4 2 - 2Total 100% 100% 100%o 100% 100%h 100YoPercentage of householdswith debts outstanding: 70 53 54 54 32 52Average amount owed as 3.98 3.20 2.77 2.23 1.36 2.71a multiple of monthlyexpenditures
Source: UP/Bihar Poverty Study, 1998.
5.78 Additionally, risk-prone households often smooth income flows by making conservativeproduction or employment choices and diversifying economic activities (Morduch, 1999). For example,farmers in Palanpur, an extensively researched village in Uttar Pradesh, were found to use considerablyless fertilizer than one might otherwise expect. These seemingly self-defeating choices were consistentwith the entirely rational strategy of minimizing losses in potentially bad times (Bliss and Stem 1982).
ANNEX ICORRECTING OFFICIAL 55TH ROUND POVERTY ESTIMATES
1. Deaton (2001) has developed a procedure for adjusting the poverty estimates from the55* Round to make them comparable with earlier large rounds, particularly with the 50' Round.The method is needed due to changes in survey methodololgy - in particular, changes in therecall period for some food and non-food items - that renders 55"b round estimates inconsistentwith poverty estimates from earlier rounds of the NSS.
2. The method exploits certain regularities in the data over time. In particular, there is agroup of goods where are measured the same way across all rounds of the NSS that fall into sixbroad categories: fuel and light, miscellaneous goods, miscellaneous services, non-institutionalmedical services, rent, and consumer cesses and taxes. Information on these items has alwaysbeen collected using the 30-day reporting period. The first four are important items, andexpenditures on the first three are reported by virtually all households. Non-institutional medicalexpenditures are also important on average, with a mean that is comparable in size toexpenditures on miscellaneous goods or expenditures on miscellaneous services, but they areincurred by less than half of households over a 30-day period. Taken together, expenditures onthe six broad categories account for more than 20 percent of all expenditures, and more in urbanareas. Moreover, total expenditure on these "30-day" goods is also highly correlated with totalhousehold expenditure; in the 50th Round, the correlation between the logarithm of totalhousehold per capita expenditure and the logarithm of per capita expenditure on these 30-daygoods is 0.79 and 0.86 in the rural and urban sectors respectively. Therefore, the paper uses theexpenditures on these comparably surveyed goods to get an idea of trends in total expenditures,and therefore, of trends in poverty.
3. Rather than estimating per capita expenditure as a first stage and then going on toestimate poverty, the paper uses a more direct procedure. Denote the logarithm of householdtotal expenditure per head by x, and the logarithm of total expenditure per head on "30-day"goods by m. The logarithm of the poverty line is written z, and everything is measured in constantprice rupees. If the headcount ratio is denoted by P, the equation can be written as:
zP = ff(x)dx = F(z), (1)
0
where f (x) is the density function of the logarithm of per capita expenditure and F(x) is its cdf.If Instead of the marginals of x, the distributions conditional on m are used, Equation (1) can berewritten as
P = fff(x/m)g(m)dxdm = fF(Z I m)g(m)dm, (2)0 0 0
where g(m) is the density function of the logarithm of expenditure on 30-day goods m.
4. Equation (2) cannot be evaluated using data from the 55th Round any more than canequation (1). However, if there are grounds to suppose that the headcount ratio conditional on m,F(z lm),is constant over time, and if the density of m, g(m), is the same in the 55th Round as itwould have been with a traditional schedule, then we can use the marginal of m from the 55th
124 Annex I
Round together with the conditional headcount function from an earlier round to compute F(z Im)to compute headcount estimates. In particular, the paper uses the 50th Round to compute theheadcount conditional on m and estimate the 55th Round poverty rate according to
A55 =Jf5a (z m)§,5 (m)dm, (3)0
where the "hats" denote estimates, and the subscripts denote the relevant NSS rounds.
5. Why mnight the assumptions be valid? The easiest of the two is that the density of m is thesame in the 55th Round as it was actually conducted, as it would have been had the 55th Roundbeen run in the traditional way. Furthermore, the questionnaire for the 30-day goods is identicalto earlier questionnaires, so the issue is whether changes elsewhere in the questionnaire alteredthe responses to the parts that remained the same. This is certainly possible, although there is noreason to think so. There is also relevant evidence from the thin rounds, which can be used tocompare the distributions of 30-day goods in Schedule 1 and in Schedule 2, where the questionson all the other goods were different. Tarozzi (2001) runs these tests and is unable to reject thehypothesis that the distributions of reported expenditure on 30-day goods are the same in the twoSchedules.
6. The stability of the function F(z Jm) depends, among other things, on the stability of theEngel curve relating the logarithm of expenditures per capita on 30-day goods to the logarithm oftotal household expenditure per capita. If this Engel curve is stable over time, and the distributionof its error term does not change, then the fraction of people who are poor at any given level of mwill be constant. Note that it is not required that expenditure on 30-day goods be a fixed ratio oftotal expenditure, only that the relationship between them remain stable. To see how this works,and to see potential problems, suppose that the Engel curve can be written
m = '0(x) + u
where 27(x) is monotone increasing in x and the cdf of u, which is independent of x, can bewritten H(u). Then we have
F(zIm)=Pr(xSzJm)=Pr[u>m-(p(z)jm ]=1-H[m-q,(z)1 (5)
7. By (5), the regression of poverty on m, F(z Im), will be constant over time if the Engelcurve remains fixed, and if the distribution of u remains constant. The equation also highlights apotential source of difficulty. If the Engel curve depends on other variables, perhaps mostobviously on relative prices, and if these variables shift, the poverty regression will also shift, andthe estimates will likely be biased. If such variables are identifiable, and if the data are available,they can be used to condition the distribution of x along with m in equations (2) and (3). Notefinally that, while it is useful to consider the Engel curve when justifying the procedure, theestimation does not work with the Engel curve nor its inverse, the projection of total expenditureon 30-day expenditure, but directly with the regression of poverty on 30-day expendituresthrough equation (3).
8. Without the missing data from the 55th Round, there is no way of checking the validityof the assumption. But once again robustness can be checked by calculating the regression
Annex 1 125
functions F(z |m)from the thin rounds-albeit less precisely than for the 50th F(z Im)Round-andthe results inserted into (3) in place of the estimates from the 50th Round.
9. The method has been used to calculate the corrected poverty estimates presented inChapter 1 of this report. Using data from the 50th Round first, the paper calculates a dummyvariable for each household indicating whether its members are poor or not, according to whetherits household per capita expenditure is below the official poverty line for the 50th Round. Whenthe calculations are for all India, the all-India poverty line is used, and when they are for UP, theofficial UP poverty line is used. All calculations are done separately for urban and rural sectors.A locally weighted regression procedure is then used to locally regress the poverty dummy on thelogarithm of 30-day expenditures. The procedure is repeated at each point on a 50-point grid.These regressions are weighted by the NSS-supplied household inflation factors multiplied byhousehold size so that everything is effectively done at the individual, not household, level.
10. Turning to the 55th Round, the 30-day expenditures are deflated by the consumer priceindex implicit in the appropriate official poverty line. For example, the official poverty line forrural Bihar was 212.16 rupees in the 50th Round and 333.07 rupees in the 55th Round, so that thedeflator for rural Bihar is 333.07 divided by 212.16. While it might be preferable to work with aprice index for the 30-day goods, the real issue is the stability of the Engel curve with respect tochanges in relative prices, which the prelimninary calculations suggested was not too much of aproblem. After deflation, a kernel density estimate for the logarithm of deflated 30-dayexpenditures is estimated using the same grid points as in the 50th Round regression. Thecorrected poverty estimate is then a weighted average of the 50th Round regression predictionsusing the estimated density weights.

ANNEX IIAN ALTERNATIVE METHOD FOR ESTIMATING POVERTY LEVELS
1. As a complement to direct measurement, Chapter 1 also includes projections of poverty post1993-94 based on a model calibrated to the time series data of past NSS poverty headcount estimates.The procedure is outlined in Datt and Ravallion (2002) and empirical work presented in Datt, Kozel, andRavallion (2001). The essential features are that (i) the model is calibrated on state-wide povertymeasures and (ii) it relaxes the almost universal assumption in past work that poverty responses to growthare the same across all states. Thus it allows for state-specific growth elasticities of poverty. In an earlierstudy, Ravallion and Datt (2001) attempt to explain the inter-state differences in growth elasticities interms of initial conditions at state level. The paper conditions out interstate differences in the levels ofpoverty, by including state fixed effects. It also alows for state-specific time trends as well as stateeffects in other time-varying factors that could well bias the results if they were omitted.
4. The Model. In modeling the impact of growth on poverty in India, the simplest starting pointwould be a regression of the poverty measure on mean income or consumption.' This is too simple amodel to capture the many factors that influence poverty outcomes. It is extended to allow for inter-stateand inter-sectoral differences in the growth elasticities of poverty, and for differences in the sectoralcomposition of growth. Recent research has shown that India's states vary enormously in terms of initialconditions that are relevant to how much impact economic growth will have on poverty (Ravallion andDatt, 2001). Those differences also lead one to expect that the sectoral composition of growth will mattermore in some states than others; in a state with high literacy, for example, there could be more scope forreducing poverty through non-agricultural growth.
5. The method also allows for differences in state development spending, which can have a differingimpact across states. And it allows for the differing effects of inflation across states. Datt and Ravallion(1998) argued that the main channel through which inflation mattered to India's poor was through itsshort-term adverse effect on the real wage rate for unskilled labor. While the rate of inflation varies littlebetween states, it might also have a differing impact in different states, according to differences in labormarket conditions.
6. Because the objective is to model the evolution of poverty over time rather than levels, themethod controls for differences between states in the initial level of poverty, i.e., by including statedummy variables in all regressions.2 As usual in fixed-effects regressions, this also means that the resultswill be robust to endogeneity introduced by the correlation of the explanatory variables with the time-invariant state-specific effects. To allow for any omitted (time-trended) variables state-specific trends areincluded.
' Another possibility is to use the analytic properties of poverty measures to derive the changes in measured povertywith growth in the mean. However, this has two problems for our purposes. Firstly, it also requires an assumptionabout how the Lorenz curve is going to shift; distribution neutrality is a common assumption, but in practicedistributions do change from one survey to another - even when there is little long-run trend. Secondly, it requiresan assumption about how much the growth in aggregate output will be passed onto the survey mean consumption.Our approach effectively "solves out" these problems, by looking directly at how the poverty measures move withfrowth in output.
Alternatively one can interpret the regressions as models of the deviations from time mean or the rates of povertyreduction (difference in logs) as functions of the similarly transformed (state- and time-specific) explanatoryvariables.
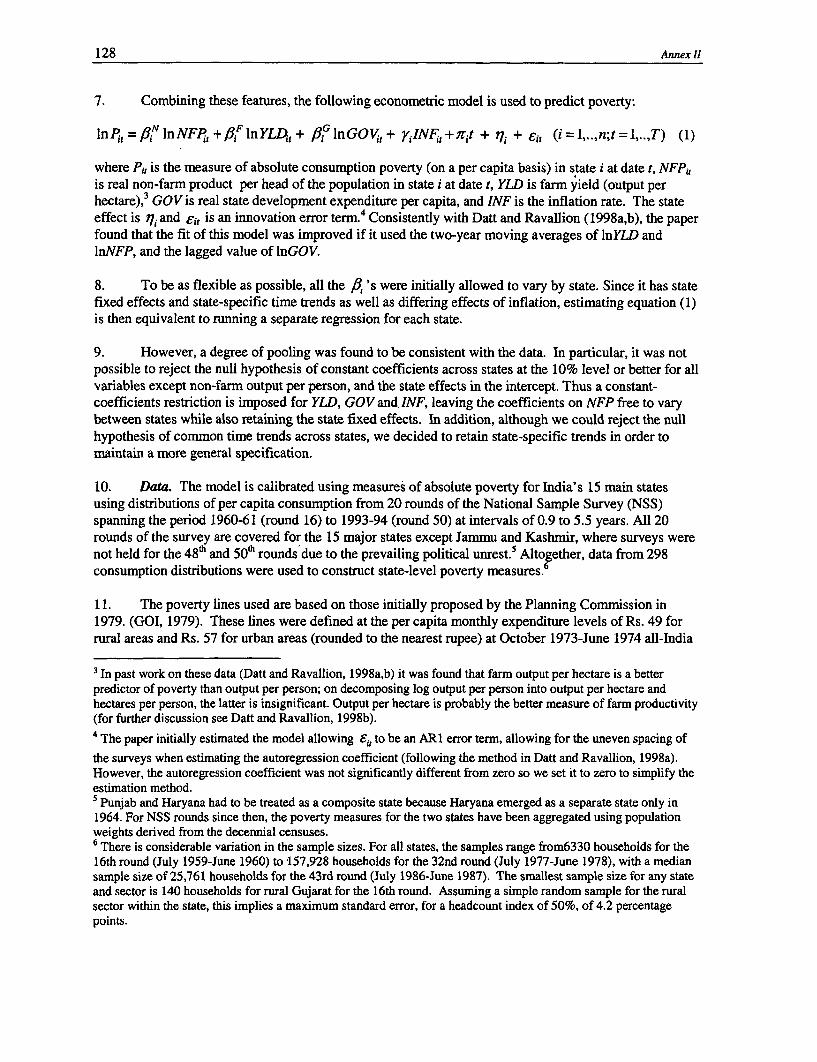
128 Annex II
7. Combining these features, the following econometric model is used to predict poverty:
lnPif=,=3lnNFPi,+flF1nYLDiJ+ 83G1nGOVM,+ yiINFit+git + Vi + esi (i=L.,n;t=1..,T) (1)
where Pi, is the measure of absolute consumption poverty (on a per capita basis) in state i at date t, NFPi,is real non-farm product per head of the population in state i at date t, YLD is farm yield (output perhectare),3 GOV is real state development expenditure per capita, and INF is the inflation rate. The stateeffect is )7i and Fit is an innovation error term.4 Consistently with Datt and Ravallion (1998a,b), the paperfound that the fit of this model was improved if it used the two-year moving averages of InYLD andInNFP, and the lagged value of InGOV.
8. To be as flexible as possible, all the fi 's were initially allowed to vary by state. Since it has statefixed effects and state-specific time trends as well as differing effects of inflation, estimating equation (1)is then equivalent to running a separate regression for each state.
9. However, a degree of pooling was found to be consistent with the data. In particular, it was notpossible to reject the null hypothesis of constant coefficients across states at the 10% level or better for allvariables except non-farm output per person, and the state effects in the intercept. Thus a constant-coefficients restriction is imposed for YLD, GOV and INF, leaving the coefficients on NFP free to varybetween states while also retaining the state fixed effects. In addition, although we could reject the nullhypothesis of common time trends across states, we decided to retain state-specific trends in order tomaintain a more general specification.
10. Data. The model is calibrated using measures of absolute poverty for India's 15 main statesusing distributions of per capita consumption from 20 rounds of the National Sample Survey (NSS)spanning the period 1960-61 (round 16) to 1993-94 (round 50) at intervals of 0.9 to 5.5 years. All 20rounds of the survey are covered for the 15 major states except Jammu and Kashmir, where surveys werenot held for the 48h' and 50'h rounds due to the prevailing political unrest.5 Altogether, data from 298consumption distributions were used to construct state-level poverty measures. 6
11. The poverty lines used are based on those initially proposed by the Planning Commission in1979. (GOI, 1979). These lines were defined at the per capita monthly expenditure levels of Rs. 49 forrural areas and Rs. 57 for urban areas (rounded to the nearest rupee) at October 1973-June 1974 all-India
3 In past work on these data (Datt and Ravallion, 1998a,b) it was found that farm output per hectare is a betterpredictor of poverty than output per person; on decomposing log output per person into output per hectare andhectares per person, the latter is insignificant. Output per hectare is probably the better measure of farm productivity(for further discussion see Datt and Ravallion, 1998b).4 The paper initially estimated the model allowing E,, to be an AR1 error term, allowing for the uneven spacing ofthe surveys when estimating the autoregression coefficient (following the method in Datt and Ravallion, 1998a).However, the autoregression coefficient was not significantly different from zero so we set it to zero to simplify theestimation method.5 Punjab and Haryana had to be treated as a composite state because Haryana emerged as a separate state only in1964. For NSS rounds since then, the poverty measures for the two states have been aggregated using populationweights derived from the decennial censuses.6 There is considerable variation in the sample sizes. For all states, the samples range from6330 households for the16th round (July 1959-June 1960) to 157,928 households for the 32nd round (July 1977-June 1978), with a mediansample size of 25,761 households for the 43rd round (July 1986-June 1987). The smallest sample size for any stateand sector is 140 households for rural Gujarat for the 16th round. Assuming a simple random sample for the ruralsector within the state, this implies a maximum standard error, for a headcount index of 50%, of 4.2 percentagepoints.
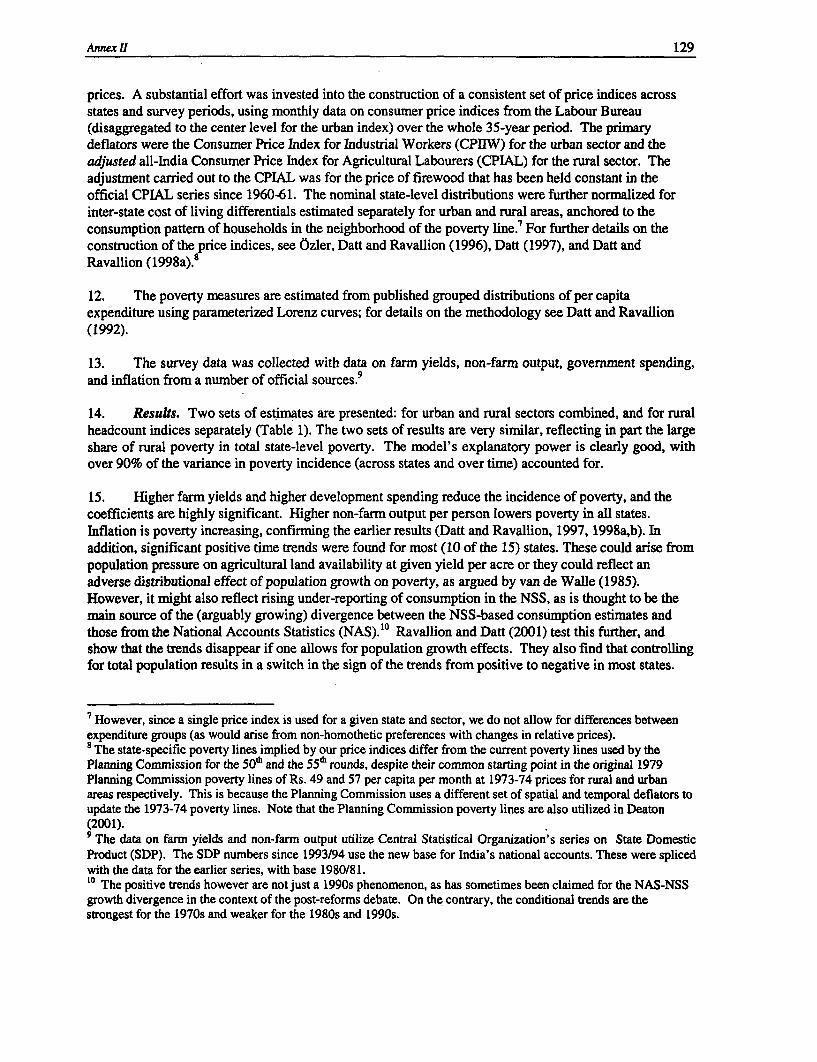
Annex 11 129
prices. A substantial effort was invested into the construction of a consistent set of price indices acrossstates and survey periods, using monthly data on consumer price indices from the Labour Bureau(disaggregated to the center level for the urban index) over the whole 35-year period. The primarydeflators were the Consumer Price Index for Industrial Workers (CPIIW) for the urban sector and theadjusted all-India Consumer Price Index for Agricultural Labourers (CPLIL) for the rural sector. Theadjustment carried out to the CPIAL was for the price of firewood that has been held constant in theofficial CPLAL series since 1960-61. The nominal state-level distributions were further normalized forinter-state cost of living differentials estimated separately for urban and rural areas, anchored to theconsumption pattern of households in the neighborhood of the poverty line.' For further details on theconstruction of the price indices, see Ozler, Datt and Ravallion (1996), Datt (1997), and Datt andRavallion (1998a). 8
12. The poverty measures are estimated from published grouped distributions of per capitaexpenditure using parameterized Lorenz curves; for details on the methodology see Datt and Ravallion(1992).
13. The survey data was collected with data on farm yields, non-farm output, govermment spending,and inflation from a number of official sources.9
14. Results. Two sets of estimates are presented: for urban and rural sectors combined, and for ruralheadcount indices separately (Table 1). The two sets of results are very similar, reflecting in part the largeshare of rural poverty in total state-level poverty. The model's explanatory power is clearly good, withover 90% of the variance in poverty incidence (across states and over time) accounted for.
15. Higher farm yields and higher development spending reduce the incidence of poverty, and thecoefficients are highly significant. Higher non-farm output per person lowers poverty in all states.Inflation is poverty increasing, confirming the earlier results (Datt and Ravallion, 1997, 1998a,b). Inaddition, significant positive time trends were found for most (10 of the 15) states. These could arise frompopulation pressure on agricultural land availability at given yield per acre or they could reflect anadverse distributional effect of population growth on poverty, as argued by van de Walle (1985).However, it might also reflect rising under-reporting of consumption in the NSS, as is thought to be themain source of the (arguably growing) divergence between the NSS-based consumption estimates andthose from the National Accounts Statistics (NAS).10 Ravallion and Datt (2001) test this further, andshow that the trends disappear if one allows for population growth effects. They also find that controllingfor total population results in a switch in the sign of the trends from positive to negative in most states.
7 However, since a single price index is used for a given state and sector, we do not allow for differences betweenexpenditure groups (as would arise from non-homothetic preferences with changes in relative prices).8 The state-specific poverty lines implied by our price indices differ from the current poverty lines used by thePlanning Commission for the 50 h and the 55h rounds, despite their common starting point in the original 1979Planning Commission poverty lines of Rs. 49 and 57 per capita per month at 1973-74 prices for rural and urbanareas respectively. This is because the Planning Commission uses a different set of spatial and temporal deflators toupdate the 1973-74 poverty lines. Note that the Planning Commission poverty lines are also utilized in Deaton(2001).9 The data on farm yields and non-farm output utilize Central Statistical Organization's series on State DomesticProduct (SDP). The SDP numbers since 1993/94 use the new base for India's national accounts. These were splicedwith the data for the earlier series, with base 1980/8 1.10 The positive trends however are not just a 1990s phenomenon, as has sometimes been claimed for the NAS-NSSgrowth divergence in the context of the post-reforms debate. On the contrary, the conditional trends are thestrongest for the 1970s and weaker for the 1980s and 1990s.
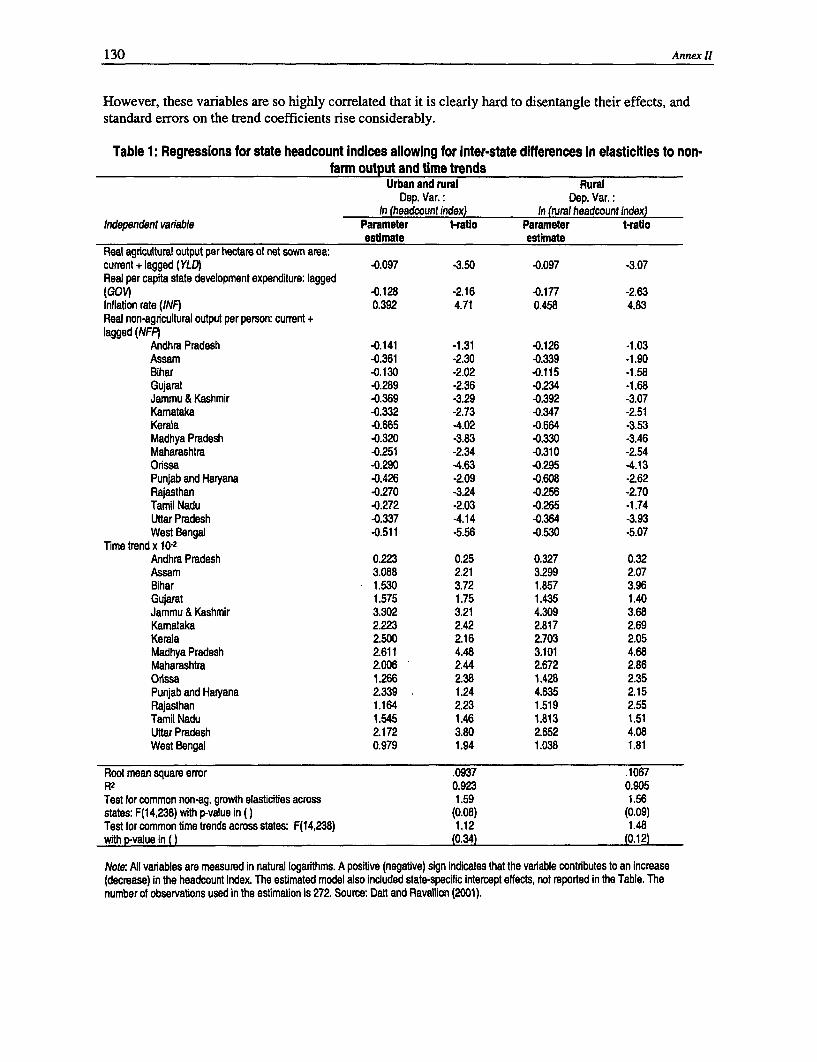
130 Annex 1I
However, these variables are so highly correlated that it is clearly hard to disentangle their effects, andstandard errors on the trend coefficients rise considerably.
Table 1: Regressions for state headcount indices allowing for inter-state differences in elasticities to non-farm output and time trends
Urban and rural RuralDep. Var.: Dep. Var.:
In (headcount index) In (nural headcount index)Independent variable Parameter t-raio Parameter t-ratio
estimate estimateReal agrcultural output per hectare of net sown area:current + lagged (YLD) *0.097 -3.50 -0.097 -3.07Real per capita state development expenditure: lagged(GOvQ 0.128 -2.16 -0.177 -2.63Inflation rate (INF) 0.392 4.71 0.458 4.83Real non-agricultural output per person: current +lagged (NFP)
Andhra Pradesh -0.141 -1.31 -0.126 -1.03Assam *0.361 -2.30 -0.339 -1.90Bihar -0.130 -2.02 -0.115 -1.58Gujarat -0.289 -2.36 -0.234 -1.68Jammu & Kashmir -0.369 -3.29 -0.392 -3.07Kamataka -0.332 -2.73 -0.347 -2.51Kerala -0.665 -4.02 -0.664 -3.53Madhya Pradesh -0.320 -3.83 -0.330 -3.46Maharashtra -0.251 -2.34 -0.310 -2.54Orissa -0.290 -4.63 -0.295 -4.13Punjab and Haryana -0.426 -2.09 -0.608 -2.62Rajasthan -0.270 -3.24 -0.256 -2.70Tamil Nadu -0.272 -2.03 -0.265 -1.74Uttar Pradesh -0.337 -4.14 -0.364 -3.93West Bengal -0.511 -5.56 -0.530 -5.07
Time trend x 10.2Andhra Pradesh 0.223 0.25 0.327 0.32Assam 3.088 2.21 3.299 2.07Bihar 1.530 3.72 1.857 3.96Gujarat 1.575 1.75 1.435 1.40Jammu & Kashmir 3.302 3.21 4.309 3.68Kamataka 2.223 2.42 2.817 2.69Kerala 2.500 2.16 2.703 2.05Madhya Pradesh 2.611 4.48 3.101 4.68Maharashtra 2.006 2.44 2.672 2.86Orissa 1.266 2.38 1.428 2.35Punjab and Haryana 2.339 1.24 4.635 2.15Rajasthan 1.164 2.23 1.519 2.55Tamil Nadu 1.545 1.46 1.813 1.51Uttar Pradesh 2.172 3.80 2.652 4.08West Bengal 0.979 1.94 1.038 1.81
Root mean square error .0937 .1067R2 0.923 0.905Test for common non-ag. growth elasticities across 1.59 1.56states: F(1 4,238) with p-value in () (0.08) (0.09)Test for common time trends across states: F(14,238) 1.12 1.48with P-value in ( ) (0.34) (0.12)
Note, All variables are measured in natural logarithms. A positive (negative) sign indicates that the variable contributes to an Increase(decrease) in the headcount index. The estimated model also included state-specific intercept effects, not reported in the Table. Thenumber of observations used in the estimation is 272. Source: Datt and Ravallion (2001).
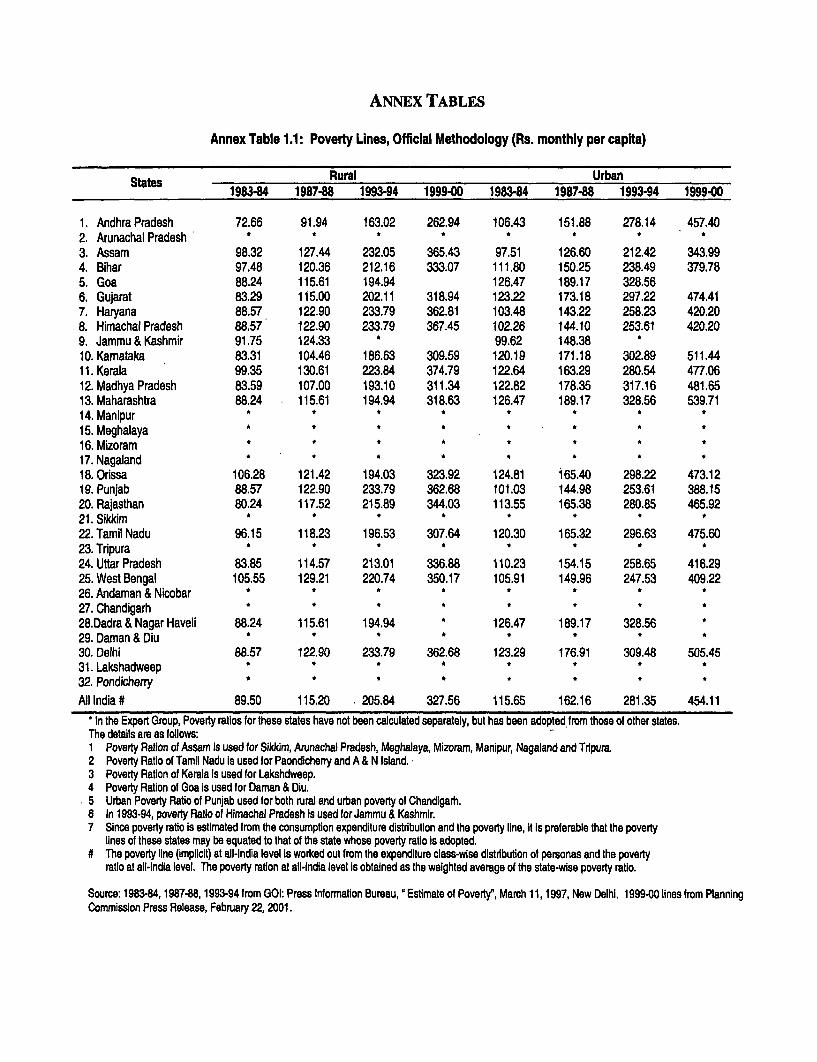
ANNEX TABLES
Annex Table 1.1: Poverty Lines, Official Methodology (Rs. monthly per capita)
States Rural Urban198384 1987-88 1993-94 1999-00 198344 1987488 1993-94 1999.00
1. Andhra Pradesh 72.66 91.94 163.02 262.94 106.43 151.88 278.14 457.402. Arunachal Pradesh * * * * * * *3. Assam 98.32 127.44 232.05 365.43 97.51 126.60 212.42 343.994. Bihar 97.48 120.36 212.16 333.07 111.80 150.25 238.49 379.785. Goa 88.24 115.61 194.94 126.47 189.17 328.566. Gujarat 83.29 115.00 202.11 318.94 123.22 173.18 297.22 474.417. Haryana 88.57 122.90 233.79 362.81 103.48 143.22 258.23 420.208. Himachal Pradesh 88.57 122.90 233.79 367.45 102.26 144.10 253.61 420.209. Jammu & Kashmir 91.75 124.33 * 99.62 148.3810. Karnataka 83.31 104.46 186.63 309.59 120.19 171.18 302.89 511.4411. Kerala 99.35 130.61 223.84 374.79 122.64 163.29 280.54 477.0612. Madhya Pradesh 83.59 107.00 193.10 311.34 122.82 178.35 317.16 481.6513. Maharashtra 88.24 115.61 194.94 318.63 126.47 189.17 328.56 539.7114. Manipur * * * * * t *
15. Meghalaya * * * * * * * *16. Mizoram * * * * * * * *17. Nagaland * * * * *18. Orissa 106.28 121.42 194.03 323.92 124.81 165.40 298.22 473.1219. Punjab 88.57 122.90 233.79 362.68 101.03 144.98 253.61 388.1520. Rajasthan 80.24 117.52 215.89 344.03 113.55 165.38 280.85 465.9221. Sikkim * * * * * *22. Tamil Nadu 96.15 118.23 196.53 307.64 120.30 165.32 296.63 475.6023. Tripura * * * * * *24. Uttar Pradesh 83.85 114.57 213.01 336.88 110.23 154.15 258.65 416.2925. West Bengal 105.55 129.21 220.74 350.17 105.91 149.96 247.53 409.2226. Andaman & Nicobar * * * * * * * *27. Chandigarh * * * * * * * *28.Dadra & Nagar Haveli 88.24 115.61 194.94 126.47 189.17 328.56 *29. Daman & Diu * * * * * * *30. Delhi 88.57 122.90 233.79 362.68 123.29 176.91 309.48 505.4531. Lakshadweep * * * * * * * t
32. Pondicherry * * * * *
All India # 89.50 115.20 205.84 327.56 115.65 162.16 281.35 454.11* In the Expert Group, Poverty ratios for these states have not been calculated separately, but has been adopted from those of other states.The details are as follows:1 Poverty Ration of Assam is used for Sikkim, Arunachal Pradesh, Meghalaya, Mizoram, Manipur, Nagaland and Tripura.2 Poverty Ratio of Tamil Nadu is used for Paondicheny and A & N Island.3 Poverty Ration of Kerala is used for Lakshdweep.4 Poverty Ration of Goa is used for Daman & Diu.5 Urban Poverty Ratio of Punjab used for both rural and urban poverty of Chandigarh.6 In 1993-94, poverty Ratio of Himachal Pradesh Is used for Jammu & Kashmir.7 Since poverty ratio is estimated from the consumption expenditure distribution and the poverty line, it is preferable that the poverty
lines of these states may be equated to that of the state whose poverty ratio Is adopted.# The poverty line (implicit) at all-India level is worked out from the expenditure class-wise distfibution of personas and the poverty
ratio at all-India level, The poverty raton at all-India level is obtained as the weighted average of the state-wise poverty ratio.
Source: 1983-84,1987-88,1993-94 from GOI: Press Information Bureau, 'Estimate of Pover, March 11,1997, New Delhi. 1999-00lines from PlanningCommission Press Release, February 22, 2001.
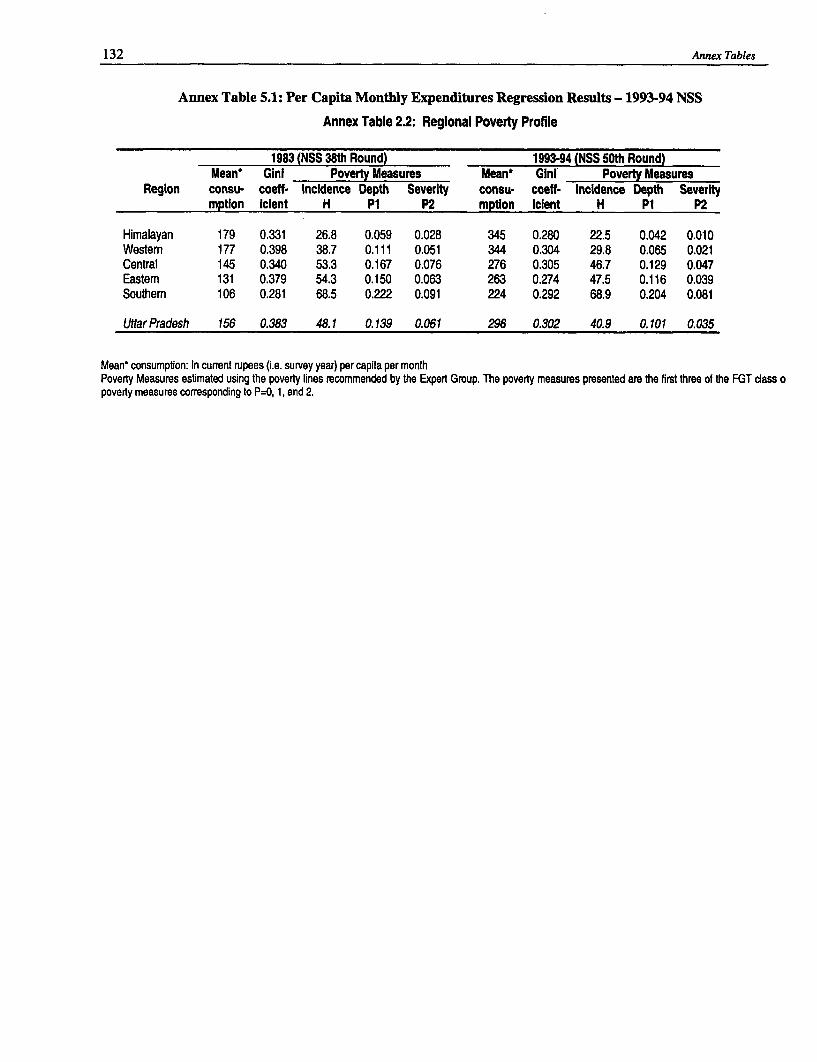
132 Annex Tables
Annex Table 5.1: Per Capita Monthly Expenditures Regression Results - 1993-94 NSS
Annex Table 2.2: Regional Poverty Profile
1983 (NSS 38th Round) 1993-94 (NSS 50th Round)Mean* Ginl Poverty Measures Mean* Gini' Poverty Measures
Region consu- coeff- Incidence Depth Severity consu- coeff- Incidence Depth Severitymption Ilent H P1 P2 mption Icient H P1 P2
Himalayan 179 0.331 26.8 0.059 0.028 345 0.280 22.5 0.042 0.010Western 177 0.398 38.7 0.111 0.051 344 0.304 29.8 0.065 0.021Central 145 0.340 53.3 0.167 0.076 276 0.305 46.7 0.129 0.047Eastem 131 0.379 54.3 0.150 0.063 263 0.274 47.5 0.116 0.039Southem 106 0.281 68.5 0.222 0.091 224 0.292 68.9 0.204 0.081
Ultar Pradesh 156 0.383 48.1 0.139 0.061 296 0.302 40.9 0.101 0.035
Mean' consumption: In current rupees (i.e. survey year) per capita per monthPoverty Measures estimated using the poverty lines recommended by the Exped Group. The poverty measures presented are the first three of the FGT class opoverty measures corresponding to P=o, 1, and 2.
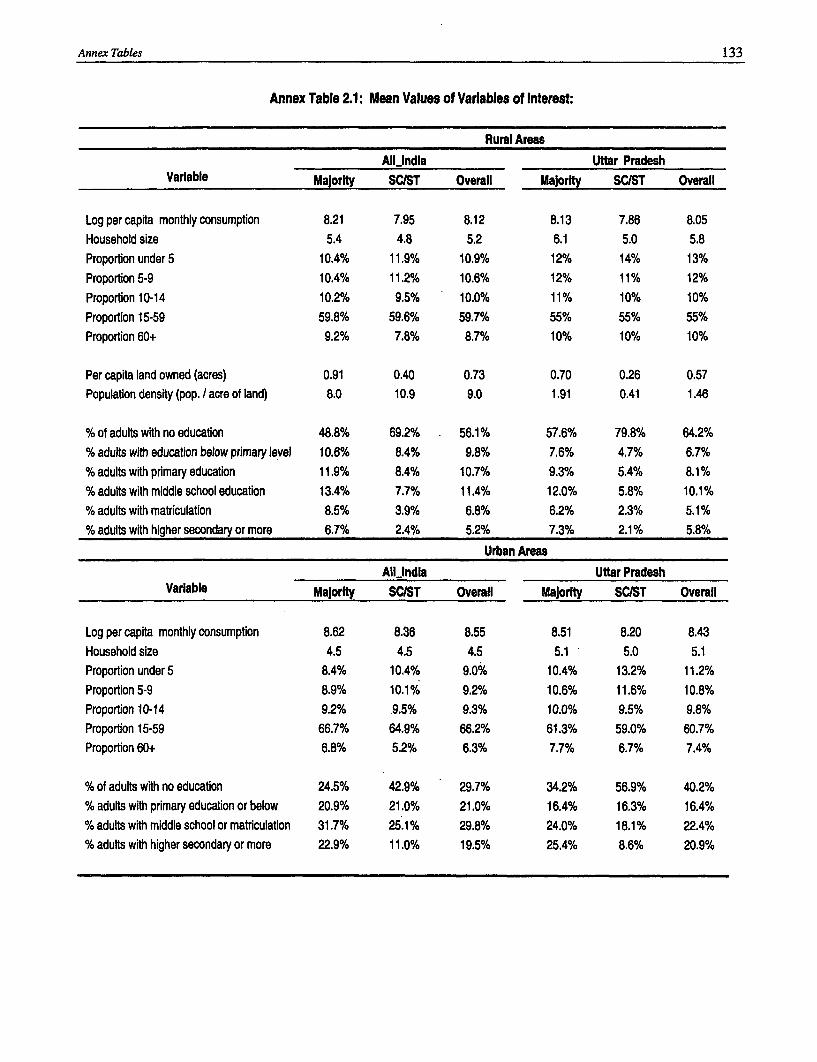
Annex Tables 133
Annex Table 2.1: Mean Values of Variables of Interest:
Rural AreasAlI_ndla Uttar Pradesh
Variable Majority SC/ST Overall Majority SCIST Overall
Log per capita monthly consumption 8.21 7.95 8.12 8.13 7.86 8.05Household size 5.4 4.8 5.2 6.1 5.0 5.8Proportion under 5 10.4% 11.9% 10.9% 12% 14% 13%Proportion5-9 10.4% 11.2% 10.6% 12% 11% 12%Proportion 10-14 10.2% 9.5% 10.0% 11% 10% 10%Proportion 15-59 59.8% 59.6% 59.7% 55% 55% 55%Proportion 60+ 9.2% 7.8% 8.7% 10% 10% 10%
Per capita land owned (acres) 0.91 0.40 0.73 0.70 0.26 0.57Population density (pop. I acre of land) 8.0 10.9 9.0 1.91 0.41 1.46
% of adults with no education 48.8% 69.2% 56.1% 57.6% 79.8% 64.2%% adults with education below primary level 10.6% 8.4% 9.8% 7.6% 4.7% 6.7%% adults wfth primary education 11.9% 8.4% 10.7% 9.3% 5.4% 8.1%% adults with middle school education 13.4% 7.7% 11.4% 12.0% 5.8% 10.1%% adults with matriculation 8.5% 3.9% 6.8% 6.2% 2.3% 5.1%% adults with higher secondary or more 6.7% 2.4% 5.2% 7.3% 2.1% 5.8%
Urban AreasAllIndla UttarPradesh
Variable Majority SC1ST Overall Majority SCIST Overall
Log per capita monthly consumption 8.62 8.36 8.55 8.51 8.20 8.43Household size 4.5 4.5 4.5 5.1 5.0 5.1Proportion under 5 8.4% 10.4% 9.0% 10.4% 13.2% 11.2%Proportion 5-9 8.9% 10.1% 9.2% 10.6% 11.6% 10.8%Proportion 10-14 9.2% .9.5% 9.3% 10.0% 9.5% 9.8%Proportion 15-59 66.7% 64.9% 66.2% 61.3% 59.0% 60.7%Proportion 60+ 6.8% 5.2% 6.3% 7.7% 6.7% 7.4%
% of adults with no education 24.5% 42.9% 29.7% 34.2% 56.9% 40.2%% adults with primary education or below 20.9% 21.0% 21.0% 16.4% 16.3% 16.4%% adufts with middle school or matriculation 31.7% 25.1% 29.8% 24.0% 18.1% 22.4%% adults with higher secondary or more 22.9% 11.0% 19.5% 25.4% 8.6% 20.9%
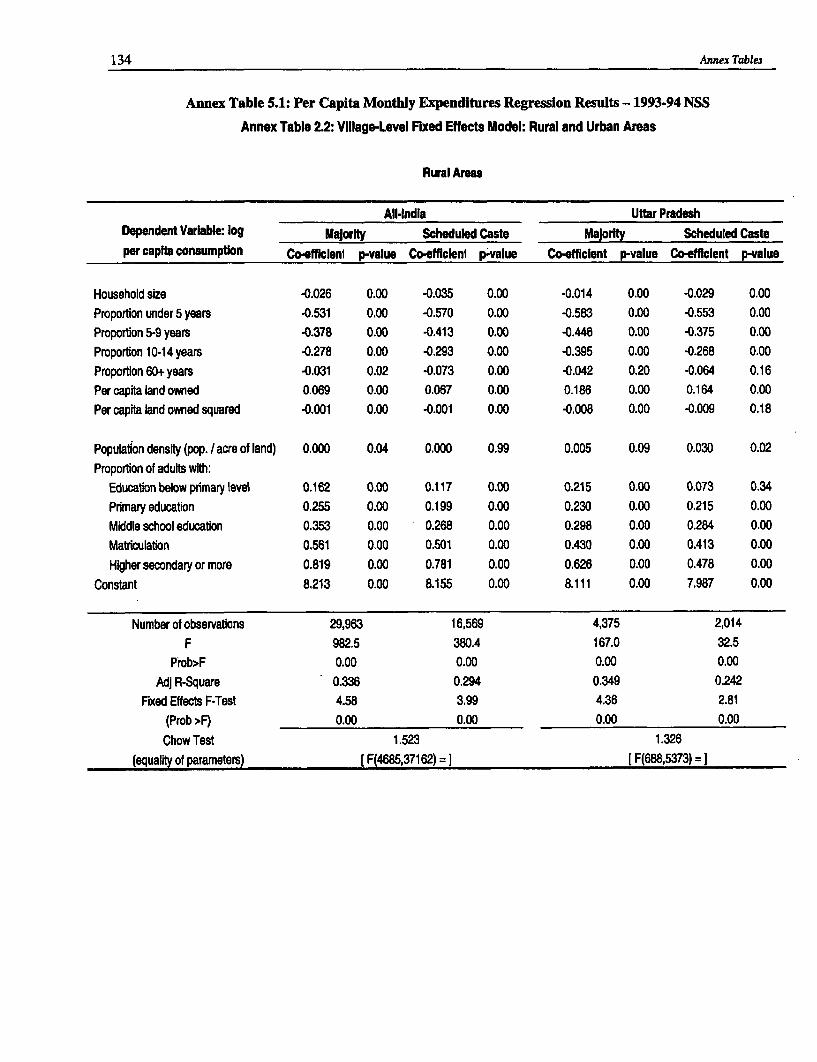
134 Annex Tables
Annex Table 5.1: Per Capita Monthly Expenditures Regression Results - 1993-94 NSS
Annex Table 2.2: Village-Level Fixed Effects Model: Rural and Urban Areas
Rural Areas
All-India Uttar PradeshDependent Variable: log Majority Scheduled Caste Majority Scheduled Caste
per capita consumption Co-effklenl p-value Co-efficieni p-value Co-efficient p-value Co-efficient p-value
Household size *0.026 0.00 *0.035 0.00 -0.014 0.00 -0.029 0.00
Proportion under 5 years -0.531 0.00 -0.570 0.00 -0.583 0.00 -0.553 0.00
Proportion 5-9 years -0.378 0.00 -0.413 0.00 -0.446 0.00 -0.375 0.00
Proportion 10-14 years -0.278 0.00 -0.293 0.00 -0.395 0.00 -0.268 0.00
Proportion 60+ years -0.031 0.02 -0.073 0.00 -0.042 0.20 -0.064 0.16
Per capita land owned 0.069 0.00 0.067 0.00 0.186 0.00 0.164 0.00
Per caprta land owned squared -0.001 0.00 -0.001 0.00 -0.008 0.00 -0.009 0.18
Population density (pop. / acre of land) 0.000 0.04 0.000 0.99 0.005 0.09 0.030 0.02
Proportion of aduts with:
Educaton below primary level 0.162 0.00 0.117 0.00 0.215 0.00 0.073 0.34
Primary educaton 0.255 0.00 0.199 0.00 0.230 0.00 0.215 0.00
Middle school educaton 0.353 0.00 0.268 0.00 0.298 0.00 0.284 0.00
Matriculaton 0.561 0.00 0.501 0.00 0.430 0.00 0.413 0.00
Higher secondary or more 0.819 0.00 0.781 0.00 0.626 0.00 0.478 0.00
Constant 8.213 0.00 8.155 0.00 8.111 0.00 7.987 0.00
Number of observations 29,963 16,569 4,375 2,014
F 982.5 380.4 167.0 32.5
Prob>F 0.00 0.00 0.00 0.00
Adj R-Square 0.336 0.294 0.349 0.242
Fixed Effects F-Test 4.58 3.99 4.36 2.81
(Prob >F) 0.00 0.00 0.00 0.00
Chow Test 1.523 1.326
(equality of parameters) [F(4685,37162) = ] [F(688,5373) =
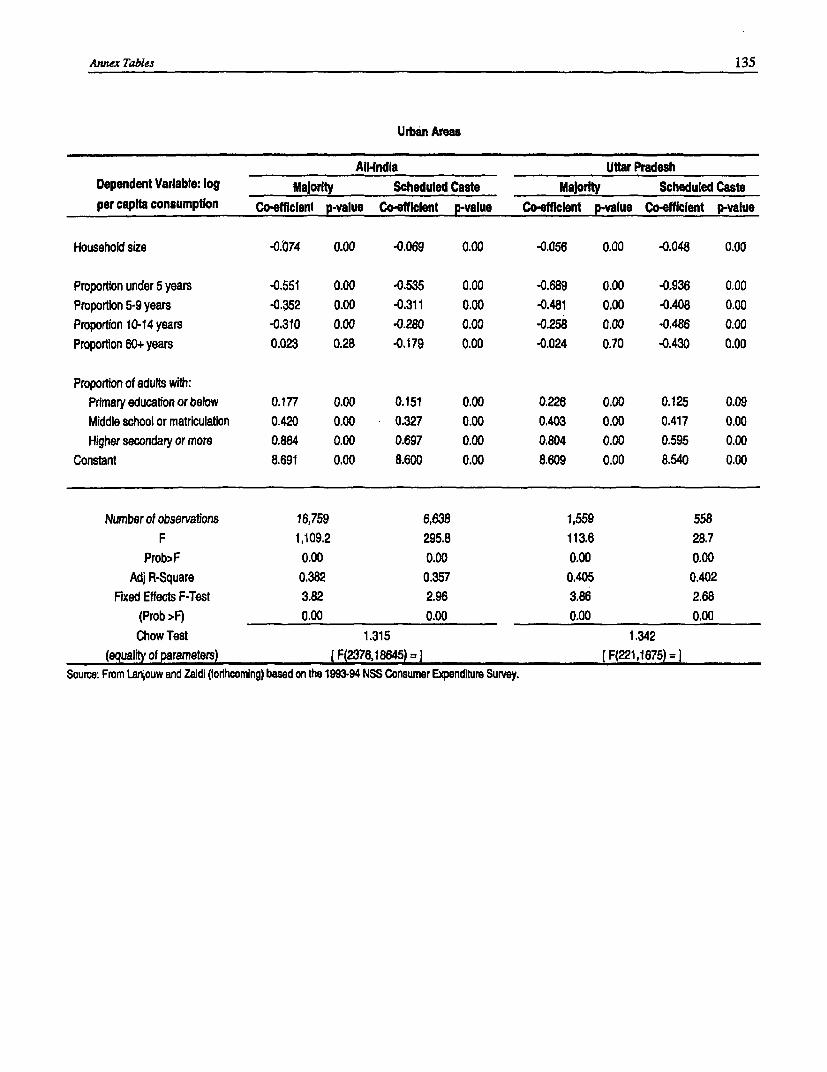
Annex Tables 135
Urban Ameas
All-indla Uttar PradeshDependent Variable: log Majority Scheduled Caste Majority Scheduled Casteper capita consumption Co-eficient p-value Co-efficient p-value Co-efficient p-value Co-efflelent p-value
Household size -0.1074 0.00 -0.069 0.00 -0.056 0.00 -0.048 0.00
Proportion under 5 years -0.551 0.00 -0.535 0.00 -0.689 0.00 -0.936 o.aoProportion 5-9 years -0.352 0.00 -0.311 0.00 -0.481 0.00 -0.408 0.00Proportion 10-14 years -0.310 0.00 -0.280 0.00 -0.258 0.00 -0.486 0.00Proportion 60+ years 0.023 0.28 4.179 0.00 -0.024 0.70 -0.430 0.00
Proportion of adults with:Primary education or below 0.177 0.00 0.151 0.00 0.226 0.00 0.125 0.09Middle school or matriculation 0.420 0.00 0.327 0.00 0.403 0.00 0.417 0.00Higher secondary or more 0.864 0.00 0.697 0.00 0.804 0.00 0.595 0.00
Constant 8.691 0.00 8.600 0.00 8.609 0.00 8.540 0.00
Nunber of observations 16,759 6,638 1,559 558F 1,109.2 295.8 113.6 28.7
Prob>F 0.00 0.00 0.00 0.00Adj R-Square 0.382 0.357 0.405 0.402
Fixed Effects F-Test 3.82 2.96 3.86 2.68(Prob >F) 0.00 0.00 0.00 0.00Chow Test 1.315 1.342
(equality of parameters) [F(2376,18645) = ]F(221,1675) =]Source: From Lanjouw and Zaidi (lorihooming) based on the 1993-94 NSS Consumer Expenditure Survey.
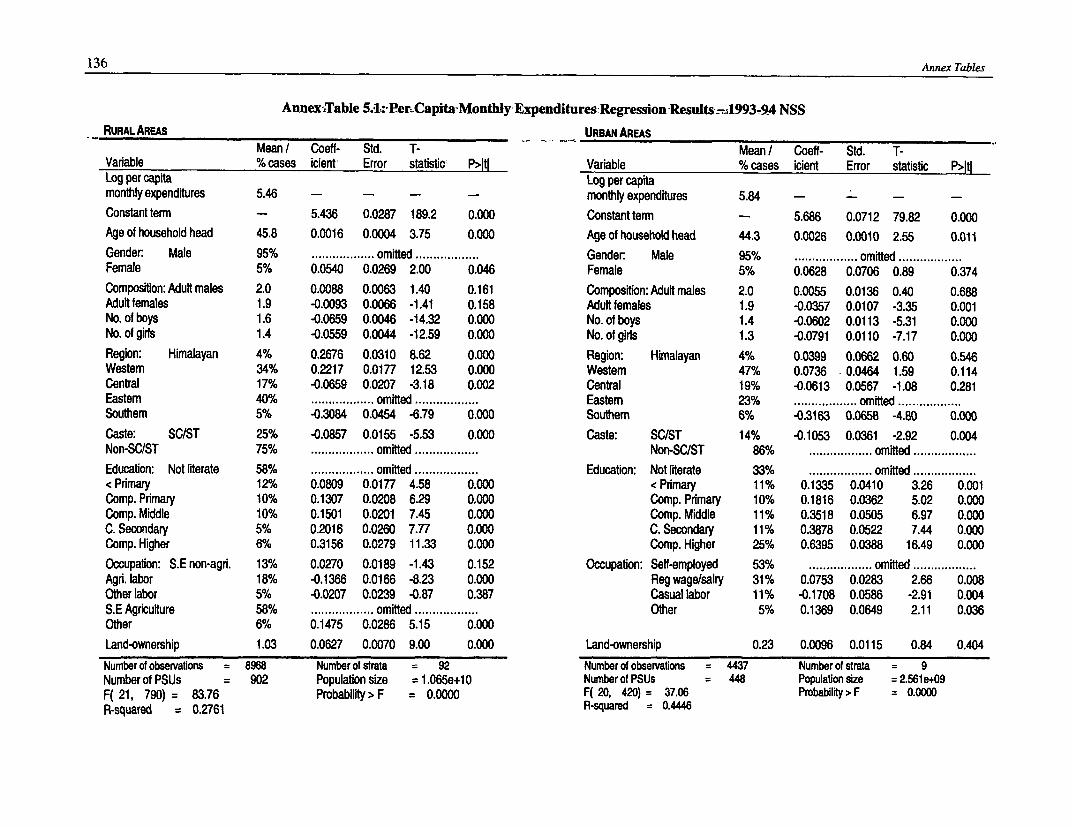
136 Annex Tables
AnnexrTable 5.1.: Per..Capita-Monthly Expenditures:Regression-Results -A1993-94 NSS
RURAL AREAS URBAN AREASMean I Coeff- Std. T- Mean/ Coeff- Std. T-
Variable % cases icient Error statistic- P>Itl Variable % cases icient Error statistic P>ItlLog per capita Log per capitamonthly expenditures 5.46 - - - - monthly expenditures 5.84 - - -
Constant term - 5.436 0.0287 189.2 0.000 Constant term - 5.686 0.0712 79.82 0.000
Age of household head 45.8 0.0016 0.0004 3.75 0.000 Age of household head 44.3 0.0026 0.0010 2.55 0.011
Gender: Male 95% . ............ .... omitted Gender: Male 95%. .................. omitted .Female 5% 0.0540 0.0269 2.00 0.046 Female 5% 0.0628 0.0706 0.89 0.374
Composition: Adult males 2.0 0.0088 0.0063 1.40 0.161 Composition: Adult males 2.0 0.0055 0.0136 0.40 0.688Adult females 1.9 -0.0093 0.0066 -1.41 0.158 Adult females 1.9 -0.0357 0.0107 -3.35 0.001No. of boys 1.6 -0.0659 0.0046 -14.32 0.000 No. of boys 1.4 -0.0602 0.0113 -5.31 0.000No. of girls 1.4 -0.0559 0.0044 -12.59 0.000 No. of girls 1.3 -0.0791 0.0110 -7.17 0.000
Region: Himalayan 4% 0.2676 0.0310 8.62 0.000 Region: Himalayan 4% 0.0399 0.0662 0.60 0.546Westem 34% 0.2217 0.0177 12.53 0.000 Westem 47% 0.0736 - 0.0464 1.59 0.114Central 17% -0.0659 0.0207 -3.18 0.002 Central 19% -0.0613 0.0567 -1.08 0.281Eastem 40% . ................. omitted ...... Eastem 23%. .................. omitted .Southem 5% -0.3084 0.0454 -6.79 0.000 Southem 6% . -0.3163 0.0658 -4.80 0.000
Caste: SC/ST 25% -0.0857 0.0155 -5.53 0.000 Caste: SC/ST 14% -0.1053 0.0361 -2.92 0.004Non-SC/ST 75% .................. omitted ........... Non-SC/ST 86%. .................. omitted .
Education: Not literate 58% .................. omitted ........... Educaton: Not literate 33%. .................. omitted .< Primary 12% 0.0809 0.0177 4.58 0.000 < Primary 11% 0.1335 0.0410 3.26 0.001Comp. Primary 10% 0.1307 0.0208 6.29 0.000 Comp. Primary 10% 0.1816 0.0362 5.02 0.000Comp. Middle 10% 0.1501 0.0201 7.45 0.000 Comp. Middle 11% 0.3518 0.0505 6.97 0.000C. Secondary 5% 0.2016 0.0260 7.77 0.000 C. Secondary 11% 0.3878 0.0522 7.44 0.000Comp. Higher 6% 0.3156 0.0279 11.33 0.000 Comp. Higher 25% 0.6395 0.0388 16.49 0.000
Occupation: S.E non-agri. 13% 0.0270 0.0189 -1.43 0.152 Occupation: Self-employed 53%.omtted .................Agri. abor 18% -0.1366 0.0166 -8.23 0.000 Reg wage/salry 31% 0.0753 0.0283 2.66 0.008Other labor 5% -0.0207 0.0239 -0.87 0.387 Casual labor 11% -0.1708 0.0586 -2.91 0.004S.E Agriculture 58% .................. omitted Other 5% 0.1369 0.0649 2.11 0.036Other 6% 0.1475 0.0286 5.15 0.000
Land-ownership 1.03 0.0627 0.0070 9.00 0.000 Land-ownership 0.23 0.0096 0.0115 0.84 0.404
Number of observations = 8968 Number of strata 92 Number of observations = 4437 Number of strata = 9Number of PSUs = 902 Population size =1.065e+10 Number of PSUs = 448 Population size = 2.561e+09F( 21, 790) = 83.76 Probability> F = 0.0000 F( 20, 420) = 37.06 Probability> F = 0.0000R-squared = 0.2761 R-squared = 0.4446
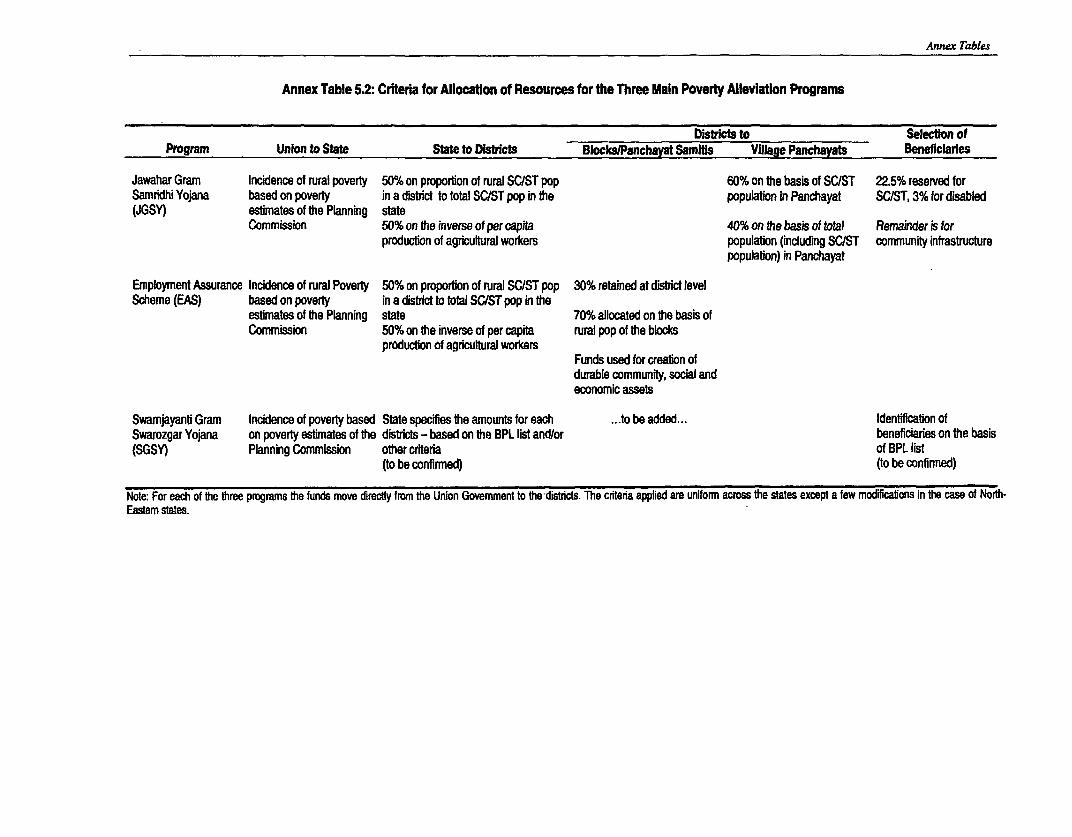
Annex Tabks
Annex Table 5.2: Criteria for Allocation of Resources for the Three Main Poverty Alleviation Programs
Districts to Selection ofProgram Union to State State to Districts Blocks/Panchayat Samitfs Village Panchayats Beneficiaries
Jawahar Gramn Incidence of rural poverty 50% on proportion of rural SC/ST pop 60% on the basis of SC/ST 22.5% reserved forSamnridhi Yojana based on poverty in a district to total SUST pop in the population in Panchayat SC/ST 3% for disabled(JGSY) estimates of the Planning stateCommission 50% on the inverse of per capita 40% on the basis of total Remainder is for
production of agricultural workers populabon (including SC/ST community infrastructurepopulation) in Panchayat
Employment Assurance Incidence of rural Poverty 50% on proportion of rural SC/ST pop 30% retained at distric levelScheme (EAS) based on poverty in a district to total SC/ST pop in the
estimates of the Planning state 70% allocated on the basis ofCommission 50% on the inverse of per capita rural pop of the blocks
production of agricultural workersFunds used for creation ofdurable community, social andeconomic assets
Swamjayanb Gram Incidence of poverty based State specifies the amounts for each ... to be added... Identfication ofSwarozgar Yojana on poverty estimates of the districts - based on the BPL list and/or beneficiaries on the basis(SGSY) Planning Commission other criteria of BPL list(to be confimned) (to be confirmed)
Note: For each of the three programs the funds move direedy from the Union Govermment to the districts. The crtera appied are uniform acmss the states except a few morifications in the case of North-Eastem states.

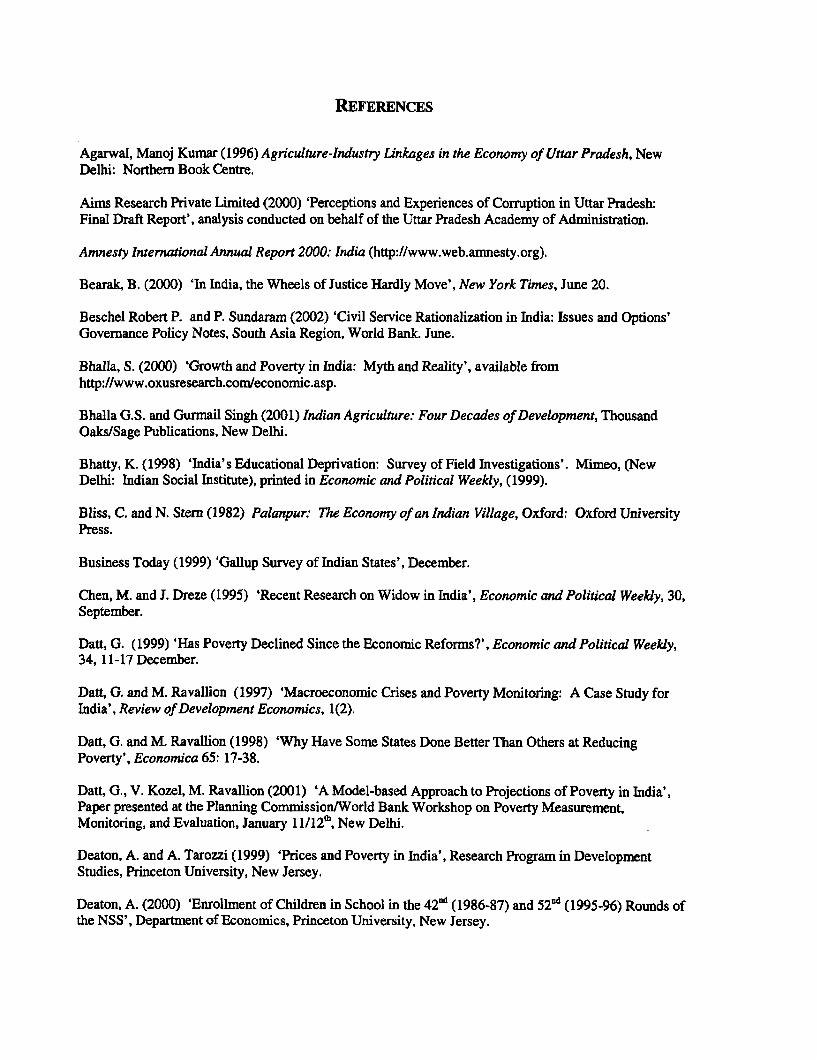
REFERENCES
Agarwal, Manoj Kumar (1996) Agriculture-Industry Linkages in the Economy of Uttar Pradesh, NewDelhi: Northem Book Centre.
Aims Research Private Limited (2000) 'Perceptions and Experiences of Corruption in Uttar Pradesh:Final Draft Report', analysis conducted on behalf of the Uttar Pradesh Academy of Administration.
Amnesty International Annual Report 2000: India (http://www.web.amnesty.org).
Bearak, B. (2000) 'In India, the Wheels of Justice Hardly Move', New York Times, June 20.
Beschel Robert P. and P. Sundaramn (2002) 'Civil Service Rationalization in India: Issues and Options'Govemance Policy Notes, South Asia Region, World Bank. June.
Bhalla, S. (2000) 'Growth and Poverty in India: Myth and Reality', available fromhttp:flwww.oxusresearch.com/economic.asp.
Bhalla G.S. and Gurmail Singh (2001) Indian Agriculture: Four Decades of Development, ThousandOaks/Sage Publications, New Delhi.
Bhatty, K. (1998) 'India's Educational Deprivation: Survey of Field Investigations'. Mimeo, (NewDelhi: Indian Social Institute), printed in Economic and Political Weekly, (1999).
Bliss, C. and N. Stern (1982) Palanpur: The Economy of an Indian Village, Oxford: Oxford UniversityPress.
Business Today (1999) 'Gallup Survey of Indian States', December.
Chen, M. and J. Dreze (1995) 'Recent Research on Widow in India', Economic and Political Weekly, 30,September.
Datt, G. (1999) 'Has Poverty Declined Since the Econornic Reforms?', Economic and Political Weekly,34, 11-17 December.
Datt, G. and M. Ravallion (1997) 'Macroeconomic Crises and Poverty Monitoring: A Case Study forIndia', Review of Development Economics, 1(2).
Datt, G. and M. Ravallion (1998) 'Why Have Some States Done Better Than Others at ReducingPoverty', Economica 65: 17-38.
Datt, G., V. Kozel, M. Ravallion (2001) 'A Model-based Approach to Projections of Poverty in India',Paper presented at the Planning Commission/World Bank Workshop on Poverty Measurement,Monitoring, and Evaluation, January 11/ 12Ih, New Delhi.
Deaton, A. and A. Tarozzi (1999) 'Prices and Poverty in India', Research Program in DevelopmentStudies, Princeton University, New Jersey.
Deaton, A. (2000) 'Enrollment of Children in School in the 42nd (1986-87) and 5 2Vd (1995-96) Rounds ofthe NSS', Department of Economics, Princeton University, New Jersey.
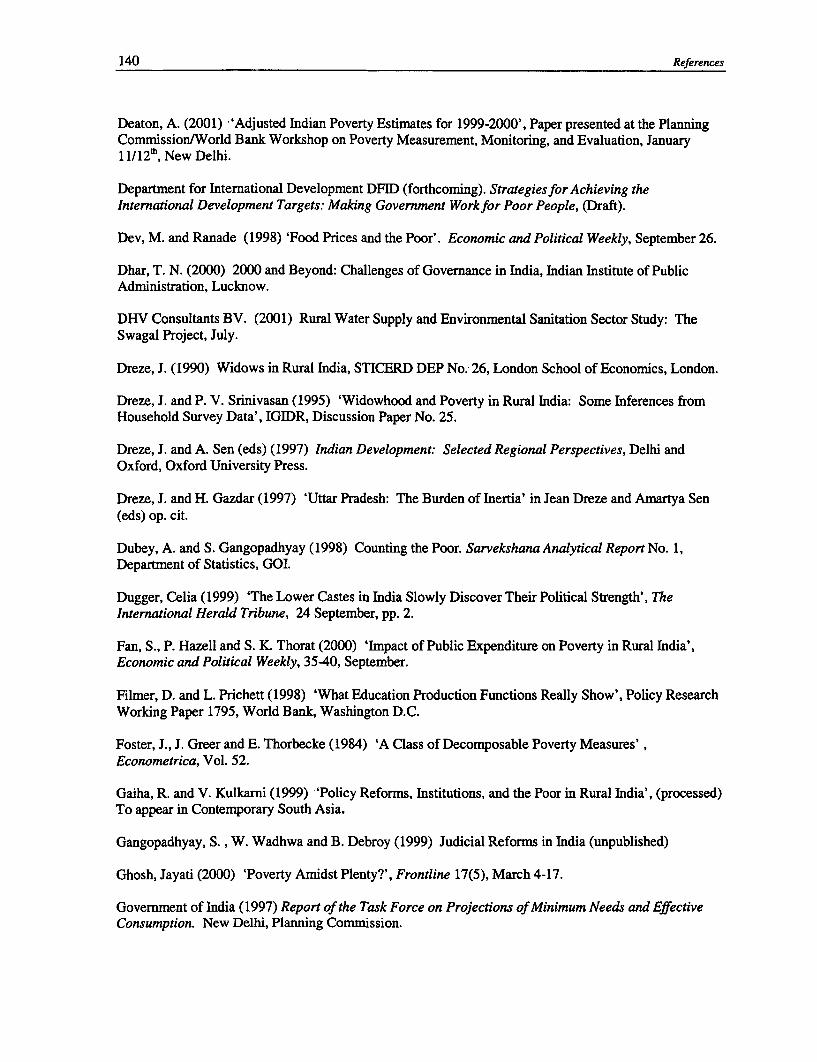
140 References
Deaton, A. (2001) 'Adjusted Indian Poverty Estimates for 1999-2000', Paper presented at the PlanningCommission/World Bank Workshop on Poverty Measurement, Monitoring, and Evaluation, January11/12'h, New Delhi.
Department for Intemational Development DFID (forthcoming). Strategies for Achieving theInternational Development Targets: Making Government Work for Poor People, (Draft).
Dev, M. and Ranade (1998) 'Food Prices and the Poor'. Economic and Political Weekly, September 26.
Dhar, T. N. (2000) 2000 and Beyond: Challenges of Govemance in India, Indian Institute of PublicAdministration, Lucknow.
DHV Consultants BV. (2001) Rural Water Supply and Environmental Sanitation Sector Study: TheSwagal Project, July.
Dreze, J. (1990) Widows in Rural India, STICERD DEP No. 26, London School of Economics, London.
Dreze, J. and P. V. Srinivasan (1995) 'Widowhood and Poverty in Rural India: Some Inferences fromHousehold Survey Data', IGIDR, Discussion Paper No. 25.
Dreze, J. and A. Sen (eds) (1997) Indian Development: Selected Regional Perspectives, Delhi andOxford, Oxford University Press.
Dreze, J. and H. Gazdar (1997) 'Uttar Pradesh: The Burden of Inertia' in Jean Dreze and Amartya Sen(eds) op. cit.
Dubey, A. and S. Gangopadhyay (1998) Counting the Poor. Sarvekshana Analytical Report No. 1,Department of Statistics, GOI.
Dugger, Celia (1999) 'The Lower Castes in India Slowly Discover Their Political Strength', TheInternational Herald Tribune, 24 September, pp. 2.
Fan, S., P. Hazell and S. K. Thorat (2000) 'Impact of Public Expenditure on Poverty in Rural India',Economic and Political Weekly, 3540, September.
Filmer, D. and L. Prichett (1998) 'What Education Production Functions Really Show', Policy ResearchWorking Paper 1795, World Bank, Washington D.C.
Foster, J., J. Greer and E. Thorbecke (1984) 'A Class of Decomposable Poverty Measures',Econometrica, Vol. 52.
Gaiha, R. and V. Kulkarni (1999) 'Policy Reforms, Institutions, and the Poor in Rural India', (processed)To appear in Contemporary South Asia.
Gangopadhyay, S., W. Wadhwa and B. Debroy (1999) Judicial Reforms in India (unpublished)
Ghosh, Jayati (2000) 'Poverty Amidst Plenty?', Frontline 17(5), March 4-17.
Government of India (1997) Report of the Task Force on Projections of Minimum Needs and EffectiveConsumption. New Delhi, Planning Commission.
References 141
(1998) Attending an Educational Institution in India: Its Level, Nature, and Cost, based ontabulations from the NSS 52nd round, 1995-96, Ministry of Statistics and Programme Implementation,National Sample Survey Organization, New Delhi.
(2000) Economic Survey 1999-00, Ministry of Finance.
(2000a) Choice of Reference Periodfor Consumption Data, National Sample SurveyOrganization, March.
_________(2000b) Household Consumer Expenditure in India: 1999-2000: Key Results, NSS 55h Round(July 1999 - June 2000), Ministry of Statistics and Program Implementation, National Sample SurveyOrganization, New Delhi, December.
(2000c) Employment and Unemployment in India: 1999-2000 - Key Result, NSS 55th Round(July 1999 - June 2000), Ministry of Statistics and Program Implementation, National Sample SurveyOrganization, New Delhi, December.
______ (2001) Press Release, Feb 22, 2001, 'Official Poverty Estimates for 1999-00', PlanningCommission, New Delhi.
Govemment of India (2001a) Provisional Population Totals, Census of India 2001;(http://www.censusindia.net)
Government of Uttar Pradesh (1.999) Report of the Comptroller and Auditor General of India (CAG), forthe year ended March 31, 1999, No. 3, (Civil).
(1999a) 'Nutritional Status of Women and Children in Uttar Pradesh', Department of Womenand Child Development, January.
Hasan, Z. (2001) 'Transfer of Power: Politics of Mass Mobilization in UP', Economic and PoliticalWeekly, 24 March.
Hughes, G., K. Lvovsky, and M. Dunleavy. (2000) 'Environmental Health in India: Priorities in AndhraPradesh', Environment and Social Development Unit, South Asia Region, World Bank, July.
Intemational Institute for Population Studies, BIPS (1995) National Family Health Survey (NFHS-1):1992-93. Bombay.
(2001) National Family Health Survey (NFHS-2): 1998-99. Maryland: ORC Macro.
Jalan, J and M. Ravallion (2001) 'Does Piped Water Improve Child Health for Poor Families in RuralIndia', Policy Research Working Paper 2664. World Bank, Washington D.C.
Jayaram, R. and P. Lanjouw (1999) 'The Evolution of Poverty and Inequality in Indian Villages', PolicyResearch Working Paper 1870. World Bank, Washington D.C.
Jha, R. (2000) 'Reducing Poverty and Inequality in India: Has Liberalization Helped?', Indira GhandiInstitute of Development Research, Bombay, India.
142 References
Joshi, B.M. (1990) Infrastructure and Economic Development in India, New Delhi: Ashish PublishingHouse.
Kozel, V. and B. Parker (1999) 'Poverty in Rural India: The Contribution of Qualitative Research inPoverty Analysis', Poverty Reduction and Economic Management, South Asia Region, World Bank,Washington, D.C.
Kriesal, S. (1999) 'Child Labor in Rural Uttar Pradesh: The Burden of Caste and Poor Education',Poverty Reduction and Economic Management, South Asia Region, World Bank, Washington DC.
Kriesel, Stephan and Salman Zaidi (1999) 'The Targeted Public Distribution System in Uttar Pradesh,India - An Evaluation', Poverty Reduction and Economic Management, South Asia Region, World Bank,Washington DC.
Krishnan, T. N. (1995) 'Access and Burden of Treatment: An Inter-State Comparison',Thiruvananthapuran: Center for Development Studies.
Kuckreja, M. (1996) Agricultural Reforms and the Rural Poor in Bundelkhand, draft report prepared forthe World Bank, South Asia Region, May.
Kumar, R. (1988) 'Inter-regional Pattern of Industrialization and Growth of Factory Sector in U.P.: 1967-83', in Tewari and Joshi (eds.) Development and Change in India, New Delhi: New Delhi: AshisPublishing House.
Kurian, N. J. (2000) 'Widening Regional Disparities in India: Some Indicators', Economic and PoliticalWeekly, 12 February.
Lall, S. V. (1999) 'The Role of Public Infrastructure Investments in Regional Development: Experienceof Indian States', Economic and Political Weekly, 2-26 March.
Lanjouw, J.O. and Peter Lanjouw (2001) 'Can We Compare Apples and Oranges?: Poverty Measurementbased on Different Definitions of Consumption," The Review of lncome and Wealth, 47(l):2542.
Lanjouw, P. (1999) 'Economic Development in Palanpur 1957-1993: A Sort of Growth', paperpresented at the Conference on Economnic Development and Quality of Life in South Asia, 27-28November, Hiroshima, Japan.
Lanjouw, P. and M. Ravallion. (1998) 'Benefit Incidence and Timing of Program Capture', DevelopmentResearch Group, World Bank, Washington, D.C.
Lanjouw, P. and N. Stern. (1998) Economic Development in Palanpur Over Five Decades, London:Oxford University Press.
Lanjouw, P. and A. Shariff (2001) 'Rural Poverty and the Non-Farm Sector in India: Evidence fromHousehold Survey Data', mimeo.
Lanjouw, P. and S. Zaidi (2001) 'Determinates of Household Welfare in India: The Differential Returnsof Scheduled Castes', World Bank Poverty Policy Note, Poverty and Economic Management, South AsiaRegion, Washington D.C..
References 143
Lieten, G.K. (2000) 'Children, Work and Education - Fieldwork in two UP villages', Economic andPolitical Weekly, 17 June.
Lieten, G.K. and R. Srivastava (1999) Power Relations, Devolution, and Development in Uttar Pradesh,Indo-Dutch Studies on Development Alternatives No. 23, Sage Publications.
Ministry of Health and Family Welfare (June, 2000) 'Bulletin of Rural Health Statistics in India',Directorate General of Health Statistics, New Delhi.
Moog, R. (1992) 'Delays in Indian Courts: Why the Judges Don't Take Control', The Justice SystemJournal, vol. 16, no. 12, pp. 19-36.
Moog, R. (1997) 'Whose Interests are Supreme? Organizational Politics in the Civil Courts in India'.Association for Asian Studies, Michigan.
Morduch, J. (1999) 'The Microfinance Promise', Journal of Economic Literature, Vol. 32.
National Council for Applied Economic Research (1994) 'NCAER Rural Survey 1993-94' New Delhi,India.
Parker, B. (1999) 'A Study of Health Conditions in Chitrakoot District', background study, Poverty andEconomic Management, South Asia Region, World Bank.
Parker, B., M. Kukreja, and V. Kozel (2001). 'In Search of a Chance: A Qualitative Study of UrbanPoverty in Uttar Pradesh', World Bank Poverty Policy Note, Poverty Reduction and EconomicManagement, South Asia Region, Washington D.C.
Paul, S., and S. Sekhar, (1999) The Second Report Card on Bangalore's Public Services, Public AffairsCenter, Bangalore, November.
Probe Team. (1999) Public Report on Basic Education in India, 1999. Prepared in association with theCentre for Development Economics, Delhi School of Economics. Delhi: Oxford University Press.
Radhakrishna, R. and K. Subbarao, with S. Indrakant and C. Ravi. (1997) 'India's Public DistributionSystem: A National and International Perspective', World Bank Discussion Paper 380, Washington, D.C.
Ramana, G.N.V., P. Chhabra, S. Chaudhury, G. Basu (2002) 'How Equitable are Essential RCHServices? - A Case Study of Rural India', World Bank, Washington D.C (processed)
Ramesh, J. (1999) 'Future of Uttar Pradesh: Need for a New Political Mindset', Economic and PoliticalWeekly, July 31-Aug 6.
Ranson, K. (1999) Review of Insurance Schemes in the Informal Sector, mimeo.
Rao, V. M., A. N. Sharma and R. Srivastava (1999) Voices of the Poor: Poverty in People'sPerceptions in India, Institute for Human Development, New Delhi.
Ravallion, M. (1994) Poverty Comparisons. Harwood Academic Publishers, Switzerland
Ravallion, M. (1997) "Famines and Economics", Journal of Economic Literature, Vol. 35, Issue 3, 1205-1242.
144 References
Ravallion, M. (2000) "Nhat is Needed for a More Pro-Poor Growth Process in India", Economic andPolitical Weekly, 35, 25-31 March.
Ravallion, M. and G. Datt (2001a) 'When is Growth Pro-Poor? The Diverse Experience of India'sStates', Policy Research Working Paper 2263, World Bank, Washington D.C., February.
Rohde J.E. and Hema Viswanathan (1995) The Rural Private Practitioner. Oxford University Press,New Delhi.
Saxena N. C. (1999) 'Anti-Poor Laws', Planning Commission, Government of India, New Delhi.
Saxena, N. C. (2001) 'Poverty Alleviation During the Tenth Plan - Policy Issues', draft paper preparedfor the Planning Commission, Government of India.
Saxena, N. C. (2001a) 'Public Distribution System and Food Security', draft paper prepared for thePlanning Commission, Government of India.
Saxena N. C. and Srivastava, Ravi. (1995) 'Tree, Growing as an Option for Supervision ConstrainedFarmers in North-West India', in N. C. Saxena and Vishwa Ballabh (ed.) Farm Forestry in South Asia,New Delhi/ Thousand Oaks/ London: Sage Publications.
Schiff and Montenegro (1997). 'Aggregate Agricultural Supply Response in Developing Countries: ASurvey of Selected Issues,' Economic Development and Cultural Change, V. 45 N. 2, pp. 393-410.
Sedlacek, et al. (2000) Based on information at www.fonart.gob.mx/html2/progresa/progresa.htm.
Sekhar, S. and S. Balakrishnan (1999) Voices from the Capital: A Report Card on Public Service inDelhi, Public Affairs Center, Bangalore, June.
Sen, Abhijit (2001) 'Estimates of Consumer Expenditure and its Distribution: Statistical Priorities Afterthe NSS 55t Round', Economic and Political Weekly.
Shariff, A. (1997) 'Human Development Profile of Rural India: Inter-State and Inter-Group Differentials:A Summary', NCAER, New Delhi.
Sharma, R. and T. Poleman (1994) The New Economics of India's Green Revolution: Income andEmployment Diffusion in Uttar Pradesh. New Delhi: Vikas.
Sharma, R. (1996) 'Strategy for Agricultural Development in UP - Post Reform Period', Department ofCoordination (APC Branch), GoUP, December.
Singh, A. K. (1997) 'Agriculture Growth, Employment and Poverty in Uttar Pradesh: Some RecentTrends'. In G. K. Chaddha and A. N. Sharma (eds.) New Delhi: Vikas.
Singh, A. K. (1998) Constraints to Accelerated Economic Growth in Uttar Pradesh, report prepared forthe World Bank. Processed.
References 145
Sipahimalani, V. (2000) 'India: Financing of Elementary Education in India in the 1990s', South AsiaEducation Sector, Technical Working Paper no. 2, 29 November.
Srinivasan, T. N. (2000) 'Growth and Poverty Alleviation: Lessons from Development Experience',processed, Yale University.
Srivastava, R. (1996) Agricultural Reforms and the Rural Poor in Eastern Uttar Pradesh, Draft Reportprepared for World Bank, 27 March.
(1998) 'Devolution in India Since the 73rd Amendment: Impact on Safety Nets and the SocialSector'. Processed.
(2000a) 'Food Security and the Targeted Public Distribution System in Uttar Pradesh', Instituteof Human Development, Center for Economic and Social Studies, Hyderabad.
(2000b) 'Inequality and Security through Education in India: Linking Two Sides of the SameCoin', Centre for the Study of Regional Development, Jawaharlal Nehru University.
(2000c) 'A Descriptive Note on the Pattern of Non-farm Employment in Uttar Pradesh', basedon the UP/Bihar Living Standards Survey, processed
Sahbhagi Shikshan Kendra (2000) Report on Consultations Over Monitoring Poverty and Vulnerabilityin Uttar Pradesh, draft report prepared for the World Bank.
STEM (2000) 'Baseline Survey for Uttar Pradesh Health Systems Development Project'.
Sundaram K. and Suresh D. Tendulkar (2001) 'Recent Debates for Data Base for Measurement ofPoverty in India: Some Fresh Evidence' Delhi School of Economics, India.
Tarozzi, A. (2001) "Estimating Comparable Poverty Counts from Incomparable Surveys: MeasuringPoverty in India", Princeton University, processed.
United States Department of State (1999) Human Rights Reports for 1999: India, Washington DC.
Unni, J. (1998) Gender Dimensions of Poverty, Informal Sector Unit, Self-employed Women'sAssociation (SEWA) and Gujarat Institute of Development Research, processed.
Visaria, Pravin (2000) 'Poverty in India During 1994-98: Alternative Estimates', processed, Institute ofEconomic Growth, Delhi.
Wood, A. and M. Calandrino (2000) 'When the Other Giant Wakens: Trade and Human Resources inIndia', Institute of Development Studies, University of Sussex.
World Bank (1997) India: Achievements and Challenges in Reducing Poverty, World Bank,Washington, DC.
(1998a) Reducing Poverty in India: Options for Move Effective Public Services, World Bank,Report No. 17881-IN, Washington, DC.
(1998b) Uttar Pradesh: From Fiscal Crisis to Renewed Growth, Poverty Reduction andEconomic Management Unit, South Asia Region, Washington DC.
146 References
(1999a) India: Reducing Poverty, Accelerating Development, A World Bank Country Study,Washington DC.
-~ (1999b) 'Panchayats as Inclusive Organizations: Report of a Study Conducted in Rajasthan andMadhya Pradesh', Social Development Unit, South Asia Region, World Bank.
(1999c) India: Towards Rural Development and Poverty Reduction, Report No. 18921-IN,Rural Development Sector Unit, South Asia Region.
(1999d) India: Food Grain Marketing Policies: Reforming to Meet Food Security Needs,Rural Development Sector Unit, South Asia Region.
(2000a) Improving Household Food and Nutrition Security in India: Achievements andChallenges Ahead, vols. 1 and 2, Rural Development, South Asia Region, Washington DC
(2000b) Attacking Poverty, World Development Report 2000/1, World Bank, Washington D.C.
(2000c) 'Overview of Rural Decentralization in India', processed.
(2000d) 'Karnataka: Improving the Business Environment for Sustained Growth and PovertyReduction', SASPR background paper, South Asia Region, World Bank. August.
(2002) Better Health Systems for India's Poor: Findings, Analysis, and Options, prepared byD. Peters, A. Yazbeck, R. Sharma, G.N.V. Ramana, L. Pritchett, A. Wagstaff. Health, Nutrition, andPopulation Series, Human Development Network, World Bank, Washington D.C.
(2002a) 'Monitoring Poverty in Uttar Pradesh: Developing a Baseline of Poverty and SocialImpact Indicators', SASPR Poverty Policy Note, Poverty and Economic Management, South AsiaRegion.
Yaron Jacob, SBP - AGRPW (http://www.soctitechjp/em/country/unit-desa.html)
Yugandhar, B. (1999) 'Improving Governance and Public Services in UttarPradesh', World Bankbackground study.


IMAGING
Report No.: 22323 IN
Type: ER