In response to information provided by the competent authority ...
Upload
khangminh22Category
view
0download
0
Independent Competent Person’s Report for the Vele
Colliery operated by Coal of Africa Limited in the
Limpopo Province, South Africa
Effective date of CPR: 15 January 2016

Coal of Africa Limited – Vele Colliery – Independent Competent Person’s Report ii
VBKom Consulting (Pty) Ltd prepared this Independent Competent Person’s Report for Coal of Africa Limited’s Vele Colliery.
Authors: 15.01.2016
B Botha: Principal Consultant – Geology
MSc (ESPM); M(MRM); Pri.Sci.Nat
In his capacity as:
Competent Person: Resources
Competent Evaluator
Signature Date
15.01.2016
B Bruwer: Principal Consultant – Mining
B.Eng (Mining); MSAIMM
In his capacity as:
Competent Person: Reserves
Signature Date
15.01.2016
B Steyn: Consultant - Mining
B.Eng (Mining)
In his capacity as:
Technical Specialist: Reserves
Signature Date
Distribution List:
Coal of Africa Limited (CoAL) (1 Copy) (1 Electronic copy transmitted via e-mail)
Peel Hunt LLP (1 Copy) (1 Electronic copy transmitted via e-mail)
VBKom Consulting (Pty) Ltd (1 Copy) (Electronic Copy Saved on Database)

Coal of Africa Limited – Vele Colliery – Independent Competent Person’s Report iii
Table of Contents
Introduction .......................................................................................................................................................................................... 1
1.1 Scope of Work............................................................................................................................................................................................ 1
1.2 Source of Information ................................................................................................................................................................................ 1
1.3 Units and Currency .................................................................................................................................................................................... 2
1.4 Site Visit ..................................................................................................................................................................................................... 2
1.5 Participants ................................................................................................................................................................................................ 2
1.6 Statement of Independence ...................................................................................................................................................................... 2
1.7 Responsibility Statement ........................................................................................................................................................................... 3
Project Outline ...................................................................................................................................................................................... 4
2.1 Project Description .................................................................................................................................................................................... 4
2.2 Project Location ......................................................................................................................................................................................... 4
2.3 Country Profile ........................................................................................................................................................................................... 5
2.4 Legal Aspects and Permitting ..................................................................................................................................................................... 5
2.4.1 Mineral Tenure ............................................................................................................................................................................. 5
2.4.2 Surface Rights ............................................................................................................................................................................... 6
2.4.3 Land Claims ................................................................................................................................................................................... 7
2.4.4 Prospecting Right granted to Dinokeng Mining Proprietary Limited ............................................................................................ 7
2.4.5 Litigation ....................................................................................................................................................................................... 7
2.4.6 Heritage Sites ................................................................................................................................................................................ 7
2.4.7 De-Proclamation of Nature Reserves ........................................................................................................................................... 8
2.5 Royalties and Liabilities .............................................................................................................................................................................. 8
Accessibility, Physiography, Climate, Local Resources and Infrastructure .............................................................................................. 9
3.1 Topography, Elevation and Vegetation ...................................................................................................................................................... 9
3.2 Climate and Weather ................................................................................................................................................................................. 9
3.3 Access ........................................................................................................................................................................................................ 9
3.4 Proximity to population centres and nature of transport.......................................................................................................................... 9
3.5 General infrastructure ............................................................................................................................................................................. 10
Project History ..................................................................................................................................................................................... 11
4.1 Previous Ownership ................................................................................................................................................................................. 11
4.2 Previous Exploration and / or Development ............................................................................................................................................ 11
4.3 Previous Coal Resource Estimates ........................................................................................................................................................... 11
4.4 Previous Coal Reserve Estimates ............................................................................................................................................................. 13
4.5 Previous Production ................................................................................................................................................................................. 13
Geological Setting, Mineralisation and Deposit Types .......................................................................................................................... 14
5.1 Geological setting .................................................................................................................................................................................... 14

Coal of Africa Limited – Vele Colliery – Independent Competent Person’s Report iv
5.1.1 Regional Geology ........................................................................................................................................................................ 14
5.1.2 Local Geology.............................................................................................................................................................................. 14
5.2 Structure and Tectonic setting ................................................................................................................................................................. 15
5.3 Coal Deposit Characteristics .................................................................................................................................................................... 16
Exploration Data .................................................................................................................................................................................. 20
6.1 Geophysics ............................................................................................................................................................................................... 20
6.2 Drilling ...................................................................................................................................................................................................... 20
6.2.1 Drilling Method ........................................................................................................................................................................... 20
6.2.2 Sample Recovery ........................................................................................................................................................................ 22
6.2.3 Logging ....................................................................................................................................................................................... 22
6.2.4 Orientation of data in relation to geological structure ............................................................................................................... 24
6.2.5 Drill hole information ................................................................................................................................................................. 24
6.3 Sampling .................................................................................................................................................................................................. 24
6.3.1 Sampling ..................................................................................................................................................................................... 24
6.3.2 Sample Preparation .................................................................................................................................................................... 24
6.4 Database Management ........................................................................................................................................................................... 25
6.5 QA/QC Analysis ........................................................................................................................................................................................ 25
6.6 Spatial Data .............................................................................................................................................................................................. 25
6.6.1 Survey Information ..................................................................................................................................................................... 25
6.6.2 Data spacing & Distribution ........................................................................................................................................................ 26
6.7 Data Verification, Audits and Reviews ..................................................................................................................................................... 26
Coal Resource Estimates ...................................................................................................................................................................... 27
7.1 Estimation and Modelling Techniques ..................................................................................................................................................... 27
7.1.1 Coal Deposit Modelling ............................................................................................................................................................... 27
7.1.2 Structural Interpretation ............................................................................................................................................................ 28
7.1.3 Quality Model ............................................................................................................................................................................. 31
7.1.4 Cut-offs Applied in the Calculation of Resources ........................................................................................................................ 39
7.2 Coal Resource Classification Criteria ........................................................................................................................................................ 40
7.3 Reasonable and Realistic Prospects for Eventual Economic Extraction ................................................................................................... 40
7.4 Coal Resource Statement......................................................................................................................................................................... 40
7.5 Coal Resource Reconciliation ................................................................................................................................................................... 45
Technical Studies.................................................................................................................................................................................. 46
8.1 Geotechnical and Geohydrological Studies ............................................................................................................................................. 46
8.1.1 Geotechnical Studies .................................................................................................................................................................. 46
8.1.2 Geohydrological Studies ............................................................................................................................................................. 46
8.2 Mine Design and Schedule ....................................................................................................................................................................... 47
8.2.1 Cut-offs applied .......................................................................................................................................................................... 47
8.2.2 Mining method ........................................................................................................................................................................... 48
8.2.3 Optimisation ............................................................................................................................................................................... 50

Coal of Africa Limited – Vele Colliery – Independent Competent Person’s Report v
8.2.4 Modifying Factors ....................................................................................................................................................................... 50
8.2.5 Infrastructure requirements ....................................................................................................................................................... 51
8.3 Coal Processing ........................................................................................................................................................................................ 52
8.3.1 Process design ............................................................................................................................................................................ 52
8.4 Project Infrastructure .............................................................................................................................................................................. 56
8.5 Market Studies and Contracts ................................................................................................................................................................. 58
8.5.1 Thermal Coal ............................................................................................................................................................................... 58
8.5.2 Domestic Demand ...................................................................................................................................................................... 59
8.5.3 Coking Coal ................................................................................................................................................................................. 60
8.5.4 Exchange rates ............................................................................................................................................................................ 60
8.5.5 Future prices ............................................................................................................................................................................... 60
8.6 Legal and permitting ................................................................................................................................................................................ 62
8.6.1 Mineral and Petroleum Resources Development Act, 28 of 2008 (MPRDA) .............................................................................. 62
8.6.2 National Environmental Management Act, 109 of 1998 (NEMA) ............................................................................................... 62
8.6.3 National Water Act, 36 of 1998 (NWA) ...................................................................................................................................... 62
8.6.4 National Environmental Management Waste Act, 59 of 2008 (NEMWA) .................................................................................. 62
8.7 Environmental Management ................................................................................................................................................................... 62
8.7.1 Rehabilitation Plan...................................................................................................................................................................... 64
8.7.2 Environmental Monitoring Committees ..................................................................................................................................... 65
8.7.3 Biodiversity Offset Agreement ................................................................................................................................................... 65
8.8 Risk Assessment ....................................................................................................................................................................................... 66
8.8.1 Groundwater Pollution and Acid Mine Drainage ........................................................................................................................ 66
8.8.2 Plant Modification Project .......................................................................................................................................................... 66
8.8.3 Risk to be investigated ................................................................................................................................................................ 67
8.9 Taxation ................................................................................................................................................................................................... 67
8.10 Social and community impact .............................................................................................................................................................. 67
8.10.1 Public Participation ..................................................................................................................................................................... 67
8.10.2 Social & Labour Plant (SLP) ......................................................................................................................................................... 68
8.11 Mine closure ........................................................................................................................................................................................ 68
8.11.1 Mine residue management ........................................................................................................................................................ 69
8.11.2 Closure or End-Use Objectives ................................................................................................................................................... 69
8.11.3 Financial Liability Assessment 2015: ........................................................................................................................................... 69
8.12 Capital and operating costs ................................................................................................................................................................. 70
8.12.1 Capital ......................................................................................................................................................................................... 70
8.12.2 Operating Costs .......................................................................................................................................................................... 70
8.13 Economic criteria ................................................................................................................................................................................. 71
8.14 Financial analysis ................................................................................................................................................................................. 74
Coal Reserve Estimate .......................................................................................................................................................................... 75
9.1 Estimation and modelling techniques...................................................................................................................................................... 75

Coal of Africa Limited – Vele Colliery – Independent Competent Person’s Report vi
9.2 Coal Reserve classification criteria ........................................................................................................................................................... 76
9.3 Coal Reserve statement ........................................................................................................................................................................... 76
9.4 Coal Reserve reconciliation ...................................................................................................................................................................... 80
Mineral Asset Valuation ....................................................................................................................................................................... 82
10.1 Market Approach ................................................................................................................................................................................. 82
10.2 Discounted Cash Flow .......................................................................................................................................................................... 83
10.3 Total Asset Value ................................................................................................................................................................................. 83
Interpretation and Conclusions ............................................................................................................................................................ 84
Recommendations ............................................................................................................................................................................... 85
References ........................................................................................................................................................................................... 86
Appendices .......................................................................................................................................................................................... 87
Appendix 1: JORC Code, 2012 Edition – Table 1 report template ........................................................................................................... 88
Appendix 2: Country Profile ................................................................................................................................................................ 101
Appendix 3: Drill holes used in geological model: ................................................................................................................................ 104

Coal of Africa Limited – Vele Colliery – Independent Competent Person’s Report vii
List of Tables
Table 1.1.1 – Resource categories totals (all tonnages reported is 100% attributable to CoAL) – extract from resource statement .................... xiii
Table 1.1.2 Reserve categories totals (all tonnages reported is 100% attributable to CoAL) – extract from resource statement .......................... xv
Table 2.1.1 Summary Table of Assets ........................................................................................................................................................................ 4
Table 2.4.1: A summary of the Mineral Rights approved for the Vele Colliery.......................................................................................................... 6
Table 4.3.1: Previous Coal Resource estimation completed in 2010 and 2012 by The Mineral Corporation and Venmyn respectively. The reason
for changes between the two estimates is also provided. ...................................................................................................................................... 12
Table 4.4.1: Coal Reserves as reported on 30 September 2012 (Venmyn Rand) .................................................................................................... 13
Table 5.3.1 - Thickness Parameters for the coal zone and seam within the Vele Colliery area ............................................................................... 17
Table 6.2.1: Summary of historic and recent drilling on the Vele Colliery area ....................................................................................................... 20
Table 7.4.1: Coal Resource Statement for the Vele Colliery at 30 November 2015. Resource reported as TTIS (based on 0.5m cut-off) ............. 41
Table 7.4.2: Coal Resource Statement for the Vele Colliery at 30 November 2015. Resource reported as MTIS (resources) (based on minimum
seam thickness of 1.4m and a maximum seam thickness of 4.5m for the underground Bottom Lower resources) ............................................... 43
Table 8.2.1: Calculation of RoM in designed mining blocks of DCF model: ............................................................................................................. 50
Table 8.5.1 Mean forecasted exchange rate from reputable financial institutions ................................................................................................. 60
Table 8.5.2 Coke, Coal and Carbon forecasts mean values from reputable sources ............................................................................................... 61
Table 8.7.1: Continuous studies currently conducted ............................................................................................................................................. 63
Table 8.12.1 Capital Cost Estimate .......................................................................................................................................................................... 70
Table 8.12.2 Estimated RoM Operating Costs: ........................................................................................................................................................ 71
Table 8.13.1 - Financial Model Adjusted Input Parameters ..................................................................................................................................... 72
Table 8.14.1 - Vele Discounted Cash Flow ............................................................................................................................................................... 74
Table 9.3.1 Reserve tonnes for Vele Colliery ........................................................................................................................................................... 78
Table 9.3.2 Primary product, yield - 1.4m Minimum mining height and 4.5m max mining height (U/G mining of Bottom Lower coal seam only)
................................................................................................................................................................................................................................. 79
Table 9.3.3 Secondary product, yield - 1.4m Minimum mining height and 4.5m max mining height (U/G mining of Bottom Lower coal seam
only) ......................................................................................................................................................................................................................... 79
Table 9.4.1 Vele Reserves - Venmyn 2012 ............................................................................................................................................................... 80
Table 9.4.2 Vele Reserves - CoAL 30 June 2015 ....................................................................................................................................................... 80
Table 9.4.3 Reconciliation in Reserve Tonnes: ........................................................................................................................................................ 81
Table 10.1.1 Market approach evaluation of the Vele Colliery’s additional RoM ................................................................................................... 83

Coal of Africa Limited – Vele Colliery – Independent Competent Person’s Report viii
Table of Figures
Figure 2.2.1: Locality of the Vele Colliery in the Limpopo Province, South Africa (source Google MapsTM – 18.11.2015) ........................................ 5
Figure 2.4.1: Locality map of Prospecting Rights, Mining Rights and Surface Rights for the Vele Colliery ................................................................ 6
Figure 3.2.1: Distribution of monthly temperatures and rainfall for the Vele Colliery area (source: Climate-data.org) ........................................... 9
Figure 5.1.1: General Geological Map for the Vele Colliery Area ............................................................................................................................ 14
Figure 5.1.2: Stratigraphic Column as observed in the Vele Colliery opencast (B. Botha (26.11.2015) taken on the Vele Colliery Site Visit) ......... 14
Figure 5.2.1: Structural and Tectonic map of the Vele Colliery area ....................................................................................................................... 16
Figure 5.3.1: Thickness plot for the Top Lower Seam .............................................................................................................................................. 17
Figure 5.3.2: Thickness plots for the Middle Seam .................................................................................................................................................. 18
Figure 5.3.3: Thickness plots of the Bottom Upper Seam........................................................................................................................................ 18
Figure 5.3.4: Thickness plot for the Bottom Lower Seam ........................................................................................................................................ 19
Figure 5.3.5: Classification of the coal at Vele Colliery (Highlighted section in red indicates typical Vele coal category) ....................................... 19
Figure 6.2.1: Distribution of drill holes used in the geological model at Vele Colliery ............................................................................................ 21
Figure 6.2.2: Localities of LDD holes on the Vele Colliery area (created by Coal of Africa Limited) ........................................................................ 22
Figure 6.2.3: Interpreted down-hole geophysical log with associated geology ....................................................................................................... 23
Figure 6.6.1: Closely spaced cross drilling to investigate structural and quality continuity .................................................................................... 26
Figure 7.1.1: DTM used as the upper surface (topography) for geological modelling ............................................................................................. 27
Figure 7.1.2: Rainbow plot of the Bottom Lower Seam floor elevation .................................................................................................................. 28
Figure 7.1.3: Rainbow plot of the Top Lower Seam depth from surface ................................................................................................................. 29
Figure 7.1.4: Rainbow plot of the Middle Seam depth from surface ....................................................................................................................... 29
Figure 7.1.5: Rainbow plot of the Bottom Upper Seam from surface ..................................................................................................................... 30
Figure 7.1.6: Rainbow plot of the Bottom Lower Seam depth below surface ......................................................................................................... 30
Figure 7.1.7: Raw ash distribution of the Top Lower Seam ..................................................................................................................................... 31
Figure 7.1.8: Raw ash distribution for the Middle Seam ......................................................................................................................................... 32
Figure 7.1.9: Raw ash distribution for the Bottom Upper Seam .............................................................................................................................. 32
Figure 7.1.10: Raw ash distribution of the Bottom Lower Seam ............................................................................................................................. 33
Figure 7.1.11: Raw volatile distribution for the Top Lower Seam ............................................................................................................................ 33
Figure 7.1.12: Raw volatile distribution for the Middle Seam ................................................................................................................................. 34
Figure 7.1.13: Raw volatile distribution for the Bottom Upper Seam ..................................................................................................................... 34
Figure 7.1.14: Raw volatile distribution for the Bottom Lower Seam...................................................................................................................... 35
Figure 7.1.15: Raw CV distribution for the Top Lower Seam ................................................................................................................................... 35
Figure 7.1.16: Raw CV distribution for the Middle Seam......................................................................................................................................... 36
Figure 7.1.17: Raw CV distribution for the Bottom Upper Seam ............................................................................................................................. 36
Figure 7.1.18: Raw CV distribution for the Bottom Lower Seam ............................................................................................................................. 37
Figure 7.1.19: Yield distribution for the Top Lower Seam based on metallurgical test work .................................................................................. 37

Coal of Africa Limited – Vele Colliery – Independent Competent Person’s Report ix
Figure 7.1.20: Yield distribution for the Middle Seam based on metallurgical test work ........................................................................................ 38
Figure 7.1.21: Yield distribution for the Bottom Upper Seam based on metallurgical test work ............................................................................ 38
Figure 7.1.22: Yield distribution for the Bottom Lower Seam based on metallurgical test work ............................................................................ 39
Figure 7.2.1: Resource classification of the Vele Colliery. Areas within the Blue is categorised as Measured Coal Resources and areas outside
the blue and inside the green is categorised as Indicated Coal Resources .............................................................................................................. 40
Figure 8.2.1: Different mining blocks – the PMP mining area is indicated .............................................................................................................. 47
Figure 8.2.2: Vele Plant Modification Project opencast RoM and waste mining profile ......................................................................................... 49
Figure 8.2.3: Existing opencast with open benches indicated by red lines, and carbonaceous backfilling in foreground ...................................... 49
Figure 8.2.4 Power line has bene extended to the contractor’s yard. Existing plant in background ....................................................................... 51
Figure 8.2.5: Rail siding stockpile area in Musina with concrete base ..................................................................................................................... 51
Figure 8.3.1: Existing Coal processing plant module ............................................................................................................................................... 53
Figure 8.3.2: (a) Existing stockpile facility (lined, with rathole) (b) Cyclone and thickener module ........................................................................ 53
Figure 8.3.3 Process flow sheet for the Plant Modification Project (Source: Sedgman FEED study) ....................................................................... 55
Figure 8.4.1: Vele infrastructure and lease boundaries (Venmyn, 2012) ................................................................................................................ 56
Figure 8.4.2 Clean water reservoir and dust suppressant storage .......................................................................................................................... 57
Figure 8.4.3: 22kV substation, transformer and switchgear installation (Left Hand Side) and existing main diesel generator house (RHS) .......... 57
Figure 8.5.1: Demand for coal as an energy source for different world regions for the next 25 year (World Energy Outlook, 2015(www.iea.org))
................................................................................................................................................................................................................................. 58
Figure 8.5.2: Expected growth or decline of electricity generation sources from 2014 to 2040 (World Energy Outlook, 2015 (www.iea.org)) .... 58
Figure 8.5.3: Proposed sources for electricity generation in South Africa. The base load of 45 000MW is still made up of coal ........................... 59
Figure 8.5.4: Coal requirement to ensure electricity generation at Eskom’s power stations .................................................................................. 60
Figure 8.7.1: (a) Successful Boaboab and (b) Shepard’s bush tree replanted ......................................................................................................... 64
Figure 8.12.1 The percentage split of operational costs .......................................................................................................................................... 71
Figure 8.13.1 - Trigen Distribution ........................................................................................................................................................................... 72
Figure 8.13.2 - Financial Model NPV Probability Distribution (2017 Onwards) ....................................................................................................... 73
Figure 8.13.3- NPV Spider Diagram, Sensitivity ....................................................................................................................................................... 73
Figure 9.1.1 Diagram that illustrates the sequential calculation of coal resources and coal reserves from gross in situ tonnes (as modelled) to
saleable tonnes by the application of key cut-off criteria and discount factors associated with modifying factors (SOURCE: SANS 10320:2004) 75
Figure 9.2.1 Resource to Reserve category conversion as per JORC ....................................................................................................................... 76
Figure 9.3.1 Graphical representation of RoM tonnes conversion from GTIS tonnes ............................................................................................. 77

Coal of Africa Limited – Vele Colliery – Independent Competent Person’s Report x
List of Abbreviations and Acronyms
Abbreviations and Acronyms
3D Three Dimensional
BCM Bulk cubic meters
CAPEX Capital Expenditure
cm Centimetres
CoAL Coal of Africa Limited
CRM Certified Reference Materials
CV Calorific Value
DCF Discounted cash flow
DD Diamond Drilling
DEA Department of Environmental Affairs
DMS Dense Medium Separation
DTM Digital Terrain Model
EMC Environmental Management Committee
ESKOM Electricity Supply Commission of South Africa
GPS Global Positioning System
HIA Heritage Impact Assessment
IAP Interested and Affected Parties
IWUL Integrated Water Use License
JORC Australian Code for Reporting of Exploration Results, Coal Resources and Ore Reserves of 2012 (JORC Code)
kcal Kilo calorie
kg Kilogramme
ktpa Kilo tonne per annum
LDD Large diameter drill hole
LIDAR Laser Imaging Detection and Ranging
M Million
MCL Mapungubwe Cultural Landscape
MJ/kg Mega joule per kilogram
MPRDA Mineral & Petroleum Resources Development Act
Mtpa Million tonnes per annum
NAR Nett as received
NEMA National Environmental Management Act
NEMWA National Environmental Management Waste Act
NWA National Water Act
O/C Opencast
OPEX Operational Expenditure
PMP Plant Modification Project
QA/QC Quality Assurance / Quality Control
RC Reverse Circulation
RD Relative density
RoM Run-of-Mine
t/cub m Tonne per cubic meter
U/G Underground
UNESCO United Nations Educations, Social and Cultural Organisation
VBKom VBKom Consulting (Pty) Ltd
WHS World Heritage Site

Coal of Africa Limited – Vele Colliery – Independent Competent Person’s Report xi
Executive Summary The purpose of the Competent Person’s Report (CPR) is to identify the current value of the Vele Colliery and describes the asset in terms of
historic and resent exploration and mining data, which has a bearing on the techno-economic evaluation of the Vele Colliery.
VBKOM understands that this CPR will form part of the documentation in support of readmission of CoAL to the Alternate Investment Market
(AIM) of the London Stock Exchange (LSE). The readmission of CoAL to AIM is in preparation for a merger with Universal Coal Plc (Universal
Coal). The Independent Report is in accordance with AIM Rules in connection with the Admission (Admission Document). The CPR has been
compiled generally in accordance with the AIM Note for Mining and Oil & Gas Companies dated June 2009.
The Independent Report also provides a financial evaluation (in accordance to the VALMIN Code of 2005) of the Vele Colliery and all references
made in the report is in South African Rand (ZAR) unless otherwise mentioned.
The CPR has been prepared according to the guidelines presented in the Australian Code for Reporting of Exploration Results, Coal Resources
and Ore Reserves of 2012 (JORC Code).
Project
The Vele Coal Operation is located in South Africa, 40km west from the town of Musina, the last major town before the Beitbridge border
crossing between South Africa and Zimbabwe. South Africa is the second largest economy in Africa with the key economic sectors being mining
services and transport, energy, manufacturing, tourism and agriculture. The country has excellent transportation infrastructure and well
developed telecommunication infrastructure.
CoAL of Africa Limited started with mining activities in late 2011 and produced for a year before the mine was placed under care and
maintenance. The mine stoppage was due to the fact that the predicted yields were not obtainable through the plant configuration. It was
decided to re-evaluate the analytical methods used to define product recoveries and to optimise the plant accordingly.
A programme of large diameter drilling was initiated on the two areas targeted for opencast mining. The samples gathered for these
campaigns were sent for drop shatter and wet tumble test to determine the particle size distribution on the material after mining, crushing
and beneficiation. Different yields for different product scenarios were evaluated to determine a new process design that is better aligned with
the inherent properties of the coal resource.
A semi-soft coking coal with a 10% ash content and a 5500kcal (NAR) thermal coal product will be produced after the plant upgrade is
completed.
Ownership & Mineral Tenure
The extent of the mineral tenement, Prospecting and Mining Rights, is approximately 10,755Ha over 11 farms. CoAL, through its wholly owned
subsidiary, Harrissia Investments Holdings (Pty) Ltd, is the surface right owners of the areas considered for opencast mining. For the remainder
of farms within the Vele Colliery area CoAL has compensation agreements in place.
Summary of the Mineral Right approved for the Vele Colliery
Farm Name Portion Area (Ha) Company Type Permit
Number Date Issued Expiry Date Renewed
Surface Rights
Alyth 837MS
N/A 2 092.95 Silkwood Trading 14
(Pty) Ltd Prospecting
Right LP 1136
PR 25.03.2008 24.03.2013 Yes No
Bergen op Zoom 124MS
N/A 2 078.13
Limpopo Coal Company (Pty) Ltd
Mining Right
LP 103 MR
19.03.2010 18.03.2040 N/A
Yes
Overvlakte 125MS
Portion 3, 4, 5, 6, 13, 14 & RE
3 554.48 Partial:
portion 3, 4 & 5
Semple 155MS
N/A 942.91 No
Voorspoed 836MS
N/A 2 087.22 No
The Alyth Prospecting Right was renewed in 2013 but the approval for the renewal has not yet been received by CoAL.
The company also has an approved Environmental Management Programme under the National Environmental Management Act (NEMA), an
approved Water Use License under the Department of Water Affairs and Forestry (DWAF) and an approved Social and Labour Plan under the
MRPDA.

Coal of Africa Limited – Vele Colliery – Independent Competent Person’s Report xii
Accessibility, Physiography, Climate, Local Resources and Infrastructure
The area that the Vele Colliery occupies is generally flat with a gentle northward slope towards the Limpopo River. The average elevation is
550m amsl. The climate is classified as semi-arid with an annual rainfall of about 238mm per year occurs mostly during summer. No climate
factors occur that will influence exploration or mining activities in the Vele area.
Geological setting
The Karoo age Limpopo Coalfield is generally fault bounded, with the southern extent of the basin controlled by erosion. The Main Coal Zone is
present in the Madzaringwe Formation, which is approximately 15m thick. Three distinct coal horizons occur in the Middle Ecca Group, locally
referred to the Top, Middle and Bottom Coal Horizons. All three coal horizons comprise interbedded coal and mudstone units with varying coal
quantities and qualities.
The coal deposition of the Vele Colliery occurred within and intra-continental basin bounded by extensional faulting. Major faults have been
interpreted, through field observations and geophysics, for the area. The faults divide the deposit in blocks with varying seam depths.
A serious of dolerite dykes trend predominantly east west across the project Colliery area, the largest is estimated to be more than 15m thick.
These dykes were emplaced during the extension tectonics that formed the intra continental basin. The dykes did not have significant
displacement associated with their emplacement but have resulted in minor de-volatilisation of coal in the immediate contact.
The Top, Middle and Bottom seams were all intersected through drilling and mining activities within the Vele Colliery area. Top and Bottom
seams can further be differentiated into a Top Lower, Top Middle, Top Upper, Bottom Lower and Bottom Upper. The Top Middle and Top
Upper are not considered economic.
Exploration
Prior to CoAL’s involvement in the project all historic exploration activities was undertaken by Southern Sphere, a reputable exploration
company, and it can be expected that best practices were followed and that the data can be regarded as acceptable for Coal Resource
estimation.
Two previous Coal Resource estimates were compiled for the Vele Colliery. By The Mineral Corporation (Pty) Ltd in 2010 and by Venmyn Rand
(Pty) Ltd (Venmyn) in 2012. Both these Coal Resource estimates are in accordance to the JORC Code (2007). Comparisons between the various
models are reported in the CPR.
In 2008, CoAL undertook high-resolution airborne magnetic and radiometric surveys over an area of 111km2 over the Vele Colliery area. The
images were further interpreted and a geological map was generated indicating major structures in the area.
Drill holes incorporated into the geological model are primarily diamond core drilling with secondary percussion drilling to verify the structure
of the boxcut area, as well as understanding the structural and quality continuity. The last phase of drilling was Large Diameter Drill holes for
metallurgical test work for the plant modification project.
All logging of drill hole data was done in accordance to best practices and has been consistence since CoAL’s involvement in the project. The
data is capture on a SABLETM Database, which is checked by a competent geologist on a regular basis. All holes drilled during CoAL’s
involvement has down-hole geophysics for seam correlation and structural interpretations.
A total of 573 drill holes have been used in the geological model and the Coal Resource estimation. VBKom is of the opinion that the dataset is
robust and sufficient to be used for geological modelling and resource estimation.
Sampling
Sampling of whole core samples (in accordance to SANS10320:2004) was done in intervals of between 50cm and 150cm. Samples were initially
sent to the South African Bureau of Standards (SABS) laboratory in Secunda, then to Inspectorate M&L, and since December 2008, all samples
have been sent to the CAM Analytical Laboratories (Pty) Ltd (CAM) in Polokwane, Limpopo Province. All the laboratories are SANAS accredited
for coal analyses.
CoAL geologists do random validations of the results by doing basic tests on cumulative results and testing the values with neighbouring drill
holes and the seam characteristics.
The dataset has been subjected to various audits and reviews to check discrepancies in drill hole collar coordinates, seam depths, sample
intervals and end-of hole depths and verified captured analytical results with original laboratory certificates.

Coal of Africa Limited – Vele Colliery – Independent Competent Person’s Report xiii
Coal Resource
The latest geological model was created in Minex TM software. The model incorporates all available historical and recent drilling and other
geological information up to January 2015. The model is based on the Mineral Corporation’s model of 2010, with minor changes based on
geological information collected subsequently to the completion of the Mineral Corporation’s model. From previous audits and reviews there
is a high level of confidence in the current geological model and Coal Resource estimate.
The upper surface of the model is a digital terrain model (DTM) based on the LIDAR survey conducted with a high level of spatial accuracy. The
physical parameters namely elevation (asml), and depth from surface for the floor and roof of each seam was modelled. The coal seam
thickness is also modelled and forms the basis for the calculation of the Coal Resource volumes.
The yields in the model are based on a factorisation exercise based on the information gathered from the metallurgical test work. It is a
composite yield for the 10% ash product and the 5500kcal (NAR) product that is the business base case of the PMP (Plant Modification
Project).
The following cut-offs were applied before the gross in situ tonnes (GTIS) were calculated for the Vele Colliery:
The coal was reported separately for the mining right and prospecting right respectively
The Coal Resource Blocks were limited to the Mineral Right boundaries
The Coal Resources are limited to the seam sub-crop
Coal Resource blocks are limited to the extrapolation limits in the model
Boundary pillars of 50m wide on either side of geological structures and dykes
Coal Resource blocks are limited to the base of oxidation
Coal Resource blocks are limited to the 100m year flood line for the Limpopo River
A seam thickness cut-off of 0.5m are applied
The following cut-off was applied to calculate total tonnes in situ (TTIS):
Geological losses (confidence in structural continuity and oxidation profiles) of 10%, 15% and 20% are applied to Measured, Indicated
and Inferred Coal Resources respectively.
The following cut-off was applied to calculate mineable tonnes in situ (MTIS) resources:
A minimum seam height of 1.4m and a maximum seam height of 4.5m have been applied to the Bottom Lower Seam for the
underground resources
Coal Resource Statement and Classification
The first Coal Resource classification criteria were based on the spacing between points of observation. This method stated that points of
observation spaced at 500m are Measured Resources, Indicated Resources were spaced at 1000m and Inferred Resources the spacing was
3km.
In order to bring the resources in line with the guidelines of the JORC Code 2012 a correlation cross was drilled to determine the optimal
spacing between drill holes to determine lateral continuity. It was determined that 500m is sufficient for structural estimation and 1000m for
quality estimations. This indicates that the current classification used by Vele Colliery is a conservative approach and is acceptable for the
current Resource Reporting cycle.
Other criteria was also considered for the Coal Resource Classification criteria, i.e. confidence in drill hole position, confidence in coal analyses
and confidence in structural interpretation of a drill hole.
Various economic studies with the consideration of mining metallurgical and environmental modifying factors have been concluded. The
factors in these studies form the basis for the reasonable prospect for economic extraction for the resources reported. No resources have
been excluded due to this process.
The resource summary in Table 1.1.1 is an extract of the totals from the resource statement.
Table 1.1.1 – Resource categories totals (all tonnages reported is 100% attributable to CoAL) – extract from resource statement
Vele Colliery
Resource Category Gross Tonnes in Situ (GTIS) Mt Total Tonnes in Situ (TTIS) Mt
Mineable Tonnes in Situ (MTIS) Mt
Total Measured Resources 148.17 133.35 86.11
Total Indicated Resources 426.85 362.83 200.3
Total Inferred Resources 218.93 175.15 75.15
Grand Total Resources 793.95 671.32 361.57

Coal of Africa Limited – Vele Colliery – Independent Competent Person’s Report xiv
Variation between the 2012 Coal Resource statements and the 2015 Coal Resource statements is the result of depletion that occurred during
the operational period of Vele Colliery.
Mining
Vele Colliery is an existing operation with Coal Reserves reported for an opencast mine plan and an underground mine plan. It is important to
note that the current business case is only considering a portion of the opencast reserve blocks (16 years LoM) for financial modelling. The
additional Coal Reserves outside the 16-year period does not significantly influence the NPV of the project. The current business case scenario
is referred to as the Plant Modification Project (PMP).
In addition to the PMP business case, a high-level financial model was compiled for the mining areas that were “additional” RoM reserve
tonnes (excluded from the financial model). The reserves are scheduled consecutively and the results indicated viability with long-term price
forecasts. Due to the planned mining rate of 2.7Mpta ROM feed to the plant, the mining of the “additional” reserve tonnages will be only after
the PMP’s 16 year LoM.
Mining, which will be contracted out, is a truck and shovel operation by using the modified strip-mining technique previously employed where
rollover mining was achieved. Existing pre-stripped mining blocks will be utilised and additional pre-stripping done to create sufficient exposed
benches to achieve the mining rate.
Environmental
Vele Colliery complies to regulatory requirements under the Mining Right allocated with environmental impact and baseline studies done in
2009 prior to the start of mining in 2011. An approved Environmental Management Programme under National Environmental Management
Act (NEMA), an approved Water Use License under the Department of Water Affairs and Forestry (DWAF) and an approved Social and Labour
Plan under the MRPDA exists for the colliery. Continuous assessment and monitoring feedback is provided to an Environmental Management
Committee (EMC) that include all relevant government departments. On 13 Jan 2016 the an Integrated Water Use License (IWUL) was
renewed (for a further 20 years) and amended.
Processing
The coal plant upgrade aims to produce a semi-soft coking coal (SSCC) to be sold locally as well as a thermal coal for the export market.
Sedgeman did the plant upgrade design and cost based on proven technology. The 10% ash SSCC and 30% ash thermal coal product is based
on parallel processing, and not a middling product washed from a primary product. Rail, siding and harbour capacity has been allocated to
CoAL.

Coal of Africa Limited – Vele Colliery – Independent Competent Person’s Report xv
Reserves
The conversion of Coal Resources to Coal Reserves is based on technical studies. It is the opinion of VBKom that the various studies CoAL has
done in addition to the existing infrastructure and opencast mine, are sufficient in detail to warrant the conversion of Coal Resources to Coal
Reserves.
Table 1.1.2 Reserve categories totals (all tonnages reported is 100% attributable to CoAL) – extract from resource statement
Operation Reserve Category Mineable Tonnes in
situ Reserve (Mt) Run Of Mine Tonnes
(ROM) (Mt) Saleable Primary
Product Tonnes (Mt) Saleable Secondary
Product Tonnes (Mt)
Opencast Proven 23.81 25.28 2.70 8.34
Opencast & Underground Probable 301.37 266.11 28.47 87.82
Grand Total Reserves 325.18 291.39 31.18 96.16
Valuation Summary
The valuation of Vele Colliery was done using a combination of the Market Approach and Discounted Cash Flow (DCF) methods. The DCF
valuation is only applicable to the Plant Modification Project and Market Approach method applicable to the “additional” RoM reserve
tonnage, not included in the DCF model.
A Monte Carlo simulation indicated that the project is robust, and will still be profitable under various scenarios. The DCF NPV (NPV calculated
at 10% discount rate) provides a value of ZAR 889.3M.
The market method valuation of “additional” RoM to Vele Colliery is ZAR837.3M.
Conclusion
In considering the result of both methods, the terminal value for the Vele Colliery is ZAR 1726.6M. In the opinion of VBKom, this value is a fair
value for the asset considering the current market demand and export coal prices.

Coal of Africa Limited – Vele Colliery – Competent Person’s Report Page 1 of 116
Introduction
1.1 Scope of Work
Coal of Africa Limited requested VBKom Consultancy (Pty) Limited (VBKom) to provide them with an Independent Technical Report, in the
form of a Competent Persons Report (CPR) for their Vele Colliery in the Limpopo Province of South Africa.
CoAL is currently listed on the Australian Securities Exchange (ASX), the AIM market of the London Stock Exchange (AIM) and the Johannesburg
Stock Exchange (JSE). The purpose of the CPR is to identify the current value of the Vele Colliery and describes the asset in terms of historic
and recent exploration and mining data, which has a bearing on the techno-economic evaluation of the Vele Colliery.
VBKOM understands that this CPR will form part of the documentation in support of readmission of CoAL to the Alternate Investment Market
(AIM) of the London Stock Exchange (LSE). The readmission of CoAL to AIM is in preparation for a merger with Universal Coal Plc (Universal
Coal).The Independent Report is in accordance with AIM Rules in connection with the Admission (Admission Document). The CPR has been
compiled generally in accordance with the AIM Note for Mining and Oil & Gas Companies dated June 2009. The Independent Report also
provides an evaluation of the Vele Colliery
The CPR has been prepared according to the guidelines presented in the Australian Code for Reporting of Exploration Results, Coal Resources
and Ore Reserves of 2012 (JORC Code), prepared by the Joint Ore Reserves Committee (JORC) of the Australasian Institute of Mining and
Metallurgy (AusIMM), Australasian Institute of Geoscientists and the Mineral Council of Australia. The Mineral Asset Evaluation included in the
CPR has been prepared in compliance with The Code and Guidelines for Assessment and Valuation of Mineral Assets and Mineral Securities for
Independent Expert Reports 2005 (VALMIN Code). The code was prepared by the VALMIN Committee, a joint committee of the Australian
Institute of Mining and Metallurgy, the Australasian Institute for Geoscientists and the Mineral Industry Consultants Association with the
participation of the Australian Securities and Investment Commission, the ASX, the Mineral Council of Australia, the Petroleum Exploration
Society of Australia, the Securities Association of Australia and representatives from the Australian finance sector.
1.2 Source of Information
All information used to complete the CPR was provided by CoAL to VBKom. VBKom reviewed the data presented and assessed it in terms of
the JORC Code (2012). VBKom could not verify all third party information as most of the work completed for the Vele Colliery pre-dates the
appointment of VBKom. Information provide for review is contained in the following list:
The Mineral Corporation (Pty) Ltd’s Independent Competent Persons Report dated 2010
The Independent Competent Persons ‘ Report on the Principle Coal Assets of CoAL Limited by Venmyn Rand (Pty) Ltd
Independent Assessment and Evaluation of CoAL by Venmyn Deloitte (Pty) Ltd
Sedgman report on the Process Plant Modifications
Integrated Environmental Management Plan
MRM Runge report on the Mine Optimisation and Mine Planning Study

Coal of Africa Limited – Vele Colliery – Competent Person’s Report Page 2 of 116
1.3 Units and Currency
All currency references made in the report is South African Rand’s (ZAR) unless otherwise mentioned. All units used in the report is metric,
unless otherwise stated i.e. tonnes are reported as metric tonnes, all tonnages are quoted on an air-dry basis.
1.4 Site Visit
Mr’s B.W. Botha and B.Steyn visited the site on 25 November 2015. The reason for the visit was to inspect the assets reported on in the
Competent Person’s Report. This included:
Verification of randomly selected drill hole collars
Inspection of the current plant and associated infrastructure
Visit to the section of the eastern opencast that has been excavated
1.5 Participants
The participants consist of technical experts who are in the employment of VBKom to complete the 2015 CPR on the Vele Colliery for Coal of
Africa Limited. They are the “Competent Persons” as defined in Section 10 and 11 of the JORC Code (2012) and the AIM Note for Mining and
Oil & Gas Companies (2009) (AIM Note).
VBKom has 20 professional mining engineers and geologist in their employment and has offered professional consulting services since 2008.
The team has been involved in numerous technical mining studies, project development studies, Mineral Resource and Ore Reserve
estimations, due diligence studies and technical reviews in a variety of commodities.
The Competent Persons who have compiled the CPR are as follows:
Brendan Botha, Principle Consultant (Geology) – Competent Person Coal Resources and Evaluation
BSc (Hons) Geology, MSc (ESPM), M(MRM), Pri.Sci.Nat (400224/09)
Brendan Botha has more than 16 years’ experience in the field of exploration, production geology, geological modelling and Mineral Resource
Estimation. He is a Competent Person under Section 10 and 11 of the JORC Code (2012) and the AiM Note. He is a standing member of the
South African Council for Natural Scientific Professions (SACNASP), which is a “Recognised Professional Organisation’ under the JORC Code
(2012). He has more than 10 years’ experience in thermal and coking coal with reference to the estimation, assessment and evaluation of Coal
Resources.
Ben Bruwer, Principle Consultant (Mining) – Competent Person Coal Reserves
BEng (Mining), MSAIMM
Ben Bruwer has over 17 years’ experience as a mining engineer and has experience in technical studies, project evaluations and Ore Reserve
estimations. He is a Competent Person under Section 10 and 11 of the JORC Code (2012) and the AIM Note. He is a standing member of the
South African Institute of Mining and Metallurgy (SAIMM), which is a “Recognised Professional Organisation’ under the JORC Code (2012). He
has more than 5 years’ experience in thermal and coking coal with reference to the estimation, assessment, evaluation and economic
extraction of Coal Reserves.
The Competent Person’s Report was subjected to an internal peer review process to ensure objectivity in the reporting of Coal Resource and
Coal Reserve Statements, the Independent Evaluation, and that the report complies with the guidelines of the JORC Code (2012).
1.6 Statement of Independence
VBKom Consulting (Pty) Ltd was contracted by Coal of Africa Limited in its capacity as independent consultancy firm to prepare this report in
accordance with the JORC Code (2012) (the Australian Code for Reporting of Exploration Results, Coal Resources and Ore Reserves). VBKOm
and its employees are independent of Coal of Africa Limited, its directors, senior management and advisors. VBKom was remunerated on
agreed time-based rates, which is not linked to the” Admission” or the value of the assets owned by Coal of Africa Limited.
Coal of Africa Limited – Vele Colliery – Competent Person’s Report Page 3 of 116
1.7 Responsibility Statement
For the purpose of the AIM Rules, VBKom (Pty) Ltd accept responsibility for the information contained in this report and declares that it has
taken all reasonable care to ensure that the information in this report is to the best of our knowledge and belief in accordance with the facts
and makes no omission likely to effect its import.

Coal of Africa Limited – Vele Colliery – Independent Competent Person’s Report Page 4 of 116
Project Outline
2.1 Project Description
Southern Sphere commenced the first noted exploration from 1973 to 1983. After a hiatus of 22 years, Limpopo Coal acquired the prospecting
rights to various properties within the current Vele Colliery tenure. Coal of Africa Limited acquired a 78% stake in Limpopo Coal in 2006. In
2008 Silkwood (Pty) Ltd obtained additional Prospecting Right on the Vele Colliery are, but was subsequently acquired by CoAL in the same
year. In 2011, CoAL was awarded a Mining Right over a greater part of the Vele Colliery area.
The geological and metallurgical investigation was geared to produce a single product with a clean coal ash value of 12% for metallurgical use.
Coal of Africa Limited started with mining activities in late 2011 and produced for a year before the mine was placed under care and
maintenance. The collapse of a bridge on the Matola railway line and predicted yields were not obtainable through the current plant
configuration. It was decided to re-evaluate the analytical methods used to define product recoveries and to optimise the plant accordingly.
A programme of large diameter drilling was initiated on the two areas targeted for opencast (O/C) mining. The samples gathered for these
campaigns were sent for drop shatter and wet tumble test to determine the particle size distribution on the material after mining, crushing
and beneficiation. Different yields for different product scenarios were evaluated to determine a new process design that is better aligned with
the inherent properties of the coal deposit.
The new plant up-grade is based on a 10% ash semi-soft coking product and a 5500kcal (NAR) thermal coal product.
CoAL has a 100% stake in the Vele Colliery and the details are presented in Table 2.1.1
Table 2.1.1 Summary Table of Assets
Asset Holder
CoAL’s
attributable
Interest
Status Licence
expiry date
License area
(km2) Comments
1. Vele
Colliery
Mining
Right
Limpopo Coal
Company (Pty)
Ltd
100% Development 18 March
2040 86.63
A total 573 drill holes have been drilled
and used in the geological modelling
and Coal Resource estimation. A total
of 39 LDD holes have been drilled in
the Plant Modification Project Area and
submitted for metallurgical test work.
The result of the test work has
indicated that the current plant has to
be reconfigured to be alighned with
the caracteristics of the deposit. The
plant upgrades and changes are
required before Vele Colliery will
return to operation
2. Vele
Colliery
Prospecting
Right
Silkwood
Trading 14
(Pty) Ltd
100% Develoment 24 March
2013* 20.92
*Note: The renewal of the Prospecting Right was submitted and approval by the Department of Mineral Resources is still being
awaited
2.2 Project Location
The Vele Colliery is located 40km west from the town of Musina and 100km north of the town Alldays in the Limpopo Province, Republic of
South Africa. Musina is the last major town before the Beitbridge border crossing between South Africa and Zimbabwe and lies 520km north of
Pretoria, the capital of South Africa.
The Limpopo River is the international border between South Africa and Zimbabwe bound the operations to the north. The Mapungubwe
National Park’s eastern border is 5km west of the western boundary of the Vele Colliery. The Mapungubwe Hills within the park is a World
Heritage Site.
The extent of the mineral tenement, prospecting and mining rights, is approximately 10,755Ha over 11 farms.

Coal of Africa Limited – Vele Colliery – Independent Competent Person’s Report Page 5 of 116
The locality of the Vele Coal Operation is provided in Figure 2.2.1.
Figure 2.2.1: Locality of the Vele Colliery in the Limpopo Province, South Africa (source Google MapsTM – 18.11.2015)
2.3 Country Profile
The Republic of South Africa (South Africa) is located on the southern tip of Africa with a land surface area 1.2Mkm2. South Africa is the second
largest economy in Africa with the key economic sectors being mining services and transport, energy, manufacturing, tourism and agriculture.
South Africa has a constitutional multiparty democracy with three levels, namely local, provincial and national government). The current Ruling
party is the African National Congress with the Democratic Alliance the official opposition. Legislation regarding Mineral Rights and tenure is
also well established.
The country has an excellent transportation infrastructure with regards to rail, road and air transportation facilities (international and
domestic). There is also very well developed telecommunication infrastructure through the country with easy accessible internet in most major
cities and towns. Appendix 2 provides a detailed country profile for South Africa.
2.4 Legal Aspects and Permitting
2.4.1 Mineral Tenure
The application and approval of mining rights falls under the Department of Mineral Resources and is governed by the Mineral Resources and
Petroleum Development Act 28 of 2002 (MRPDA). Entities (individuals or companies) apply through regional offices for Prospecting or Mining
Rights.
Prospecting Rights are granted for an initial five year period where after is can be renewed for an additional three years. Mining rights are
applied for the period of operation up to final closure for a maximum period of 30 years.
A summary of the rights obtained by CoAL for the Vele Colliery and surrounding properties are presented in Table 2.4.1. A diagram indicating
the mineral right and the surface rights of the Vele Colliery area is presented in Figure 2.4.1.

Coal of Africa Limited – Vele Colliery – Independent Competent Person’s Report Page 6 of 116
Table 2.4.1: A summary of the Mineral Rights approved for the Vele Colliery
Farm Name Portion Area (Ha) Company Type Permit
Number Date Issued Expiry Date Renewed
Surface Rights
Alyth 837MS
N/A 2 092.95 Silkwood
Trading 14 (Pty) Ltd
Prospecting Right
LP 1136 PR 25.03.2008 24.03.2013 Yes No
Bergen op Zoom 124MS
N/A 2 078.13
Limpopo Coal
Company (Pty) Ltd
Mining Right LP 103 MR 19.03.2010 18.03.2040 N/A
Yes
Overvlakte 125MS
Portion 3, 4, 5, 6, 13, 14 & RE
3 554.48 Partial:
portion 3, 4 & 5
Semple 155MS
N/A 9 421.91 No
Voorspoed 836MS
N/A 2 087.22 No
The Alyth Prospecting Right was renewed in 2013 but the approval for the renewal has not yet been received by CoAL.
The company also has an approved Environmental Management Programme under the National Environmental Management Act (NEMA), an
approved Water Use License under the Department of Water Affairs and Forestry (DWAF) and an approved Social and Labour Plan under the
MRPDA.
Figure 2.4.1: Locality map of Prospecting Rights, Mining Rights and Surface Rights for the Vele Colliery
2.4.2 Surface Rights
CoAL, through its wholly owned subsidiary, Harrissia Investments Holdings (Pty) Ltd, is the surface right owners of:
Erfrust 123MS (100% interest)
Portion 3, 4 and 5 of the farm Overvlakte 125MS (100% interest)
Bergen Op Zoom 124MS (100% interest)

Coal of Africa Limited – Vele Colliery – Independent Competent Person’s Report Page 7 of 116
These farms constitute the areas for opencast mining.
For the remainder of farms within the Vele Colliery area CoAL has compensation agreements in place. The agreements provide CoAL with
sufficient access to undertake all activities associated with the Prospecting and Mining Rights. The exception is the northwestern corner of the
farm Alyth 837MS where the landowner has not permitted CoAL to do any coal resource drilling. The objection does not include the remainder
of the farm.
2.4.3 Land Claims
There are potential land claims on the farms Farm Bergen Op Zoom 124 MS and Farm Semple 155 MS. The land claims on the various
properties have not been gazetted by the Department of Rural Development and Land Reform (DRDLR). CoAL recognises land claimants as key
stakeholders. The company’s stakeholder engagement strategy ensures that regular, meaningful and transparent engagement does occur with
the stakeholders. Land Claims do not affect the Mining Right, but may influence surface access once successful; which in turn may influence
time lines and costs. The time required to finalise a land claims process is unknown as the DRDLR (through the Land Claims Commissioner) and
the relevant claimant/community will determine the unfolding and progressing of the process to finalise security of surface tenure.
2.4.4 Prospecting Right granted to Dinokeng Mining Proprietary Limited
A Prospecting Right; in respect of Chrome, Lead, Iron and Manganese over the farms Bergen op Zoom 124 & Beskow 126 MS was granted to
Dinokeng Mining Proprietary Limited (Dinokeng). The prospecting right lapsed on 3 November 2014 and it is uncertain if Dinokeng has applied
for the extension of the right.
This Prospecting Right overlaps with the Limpopo Coal Company (Pty) Ltd Mining Right (LP 103 MR) in respect of the farm Bergen op Zoom, on
which the processing plant is situated. The MPRDA does not prohibit the granting of rights to different parties in respect of the same
properties, where the different entities have applied for different commodities. CoAL’s strategy has been to deal with this issue on the basis of
geological studies which indicated that very little Chrome, Lead, Iron and Manganese is found in the prospecting area to which Dinokeng’s
prospecting right relates. CoAL considers that access to the processing plant at the Vele Colliery will not be affected as the chances of any
significant base metal find is very limited.
2.4.5 Litigation
Various non-governmental organisations (The Save Mapungubwe Coalition) appealed against the approval of the Mining Right for the Vele
Colliery, the approved environmental management plan and the approved water use license. The group initiated court proceedings to stop the
project and proposed mining. The High Court has subsequently moved in favour of CoAL and the claims of the Coalition Group were discarded.
2.4.6 Heritage Sites
A total of 48 heritage sites have been identified on the Vele Colliery area. These sites have to be catalogued and excavated before mining can
commence in these areas. The current plan is to systematically remove the sites, which can take up to three years, to ensure that the sites do
not interfere with the mining operations.

Coal of Africa Limited – Vele Colliery – Independent Competent Person’s Report Page 8 of 116
2.4.7 De-Proclamation of Nature Reserves
Two previously proclaimed nature reserves, Sighetti Nature Reserve and Skutwater Nature Reserve, are located on the prospecting right on
the Farm Alyth 837MS.
Nature reserves proclaimed in terms of the National Environmental Management: Protected Areas Act, No. 57 of 2003 ("Protected Areas Act")
and the Limpopo Environmental Management Act, No. 7 of 2003 ("Limpopo EMA") provide for de-proclamation.
Applications of de- proclamations was submitted to the relevant departments and is still pending. This only affects the Prospecting Right,
which is also pending renewal. No Coal Reserves were declared on the Farm Alyth 837MS.
2.5 Royalties and Liabilities
The Mineral and Petroleum Resources Royalty Act (2008) (Royalty Act) imposes a royalty for the benefit of the National Revenue Fund in
respect to the transfer of a mineral resources extracted from within the Republic. According to Schedule 2 of the Royalty Act, coal between
19.0MJ/kg and 27.0MJ/kg is categorised as unrefined mineral resources.
The royalty payable for an unrefined mineral resource is calculated through the following formula:
0.5 + [earnings before interest and taxes/(gross sales in respect of unrefined mineral resource x 9)] x 100
The royalty payment is required bi-annually with the deficit between forecasted sales and actual sales payable in a third payment.
No other private royalties or liabilities are payable by CoAL.

Coal of Africa Limited – Vele Colliery – Independent Competent Person’s Report Page 9 of 116
Accessibility, Physiography, Climate, Local Resources and
Infrastructure
3.1 Topography, Elevation and Vegetation
The regional topography varies from gently undulating to areas with more rugged relief characterised by steep-sided hills and narrow, boulder-
strewn valleys. The area that the Vele Colliery occupy is generally flat with a gentle northward slope towards the Limpopo River. The average
elevation is 550m amsl.
The Vele Colliery falls within the Savannah biome, which is characterised by grass ground layer and an upper layer of woody plants dominated
by thorn and Mopani trees. A riverine forest is developed along the banks of the Limpopo River.
3.2 Climate and Weather
The climate within the northern parts of South Africa is classified as semi-arid with an annual rainfall of about 255mm per year. Most of the
rainfall occurs during the summer months between November and March.
The average temperatures in summer are 26.5 ᵒC with the highest temperatures in January (above 32ᵒC) and the lowest temperatures in July
(below 17ᵒC). A graph of monthly temperatures and rainfall is presented in Figure 3.2.1.
Figure 3.2.1: Distribution of monthly temperatures and rainfall for the Vele Colliery area (source: Climate-data.org)
Exploration and mining activities will not be effected by any climatic conditions.
3.3 Access
The Vele Colliery is well situated with respect to infrastructure such as rail and road. The main South-Africa Zimbabwe road and rail routes pass
through Musina. The R572 tarred road from Pontdrift to Musina is located adjacent to the Vele Colliery on the southern boundary.
3.4 Proximity to population centres and nature of transport
The Vele Colliery is 40km west from Musina, which is the where the population within the area is concentrated due to the cross-border
activities. There are other smaller towns and villages close to the mine from where the local element of employees will be sourced. The mine
can easily be reached through tarred roads and secondary dirt roads.

Coal of Africa Limited – Vele Colliery – Independent Competent Person’s Report Page 10 of 116
Musina is the regional centre and provides modern conveniences, including accommodation and services. The town is also a source of fuel and
labour with a police station, a number of schools and a hospital. The town has a history of mining and experienced staff and labour will be
sourced from here.
3.5 General infrastructure
Due to the proximity of the Vele Colliery to the Mapungubwe National Park all infrastructure on the mine site is limited to a maximum height
of 20m. This is to ensure that the visible impact of the mine is minimised as much as practical.
Currently water is supplied to site from a pumping station on the Limpopo River. The amount that can be abstracted is limited to 4.2 mega-
litres per day. The current supply is adequate for the current operations. Two potable water treatment plants have been provided for in the
capital budget. The first is for the future underground mining area and the second one to serve the current main site infrastructure.
On site offices, include office block, a laboratory, workshops, stores and change houses.

Coal of Africa Limited – Vele Colliery – Independent Competent Person’s Report Page 11 of 116
Project History
4.1 Previous Ownership
Southern Sphere Mining and Development Company Limited, a division of BHP-Utah Mining, historically investigated the project from 1973 to
1983. After a hiatus of 22 years, Limpopo Coal obtained a Prospecting Right in 2005 over certain portions of the Vele project. GVM (now Coal
of Africa Limited) obtained a 74% in Limpopo Coal. In 2008, Silkwood obtained a prospecting right over the farm Alyth 837MS and later that
same year CoAL acquired 100% of Silkwoord.
4.2 Previous Exploration and / or Development
Prior to CoAL’s involvement in the project Southern Sphere undertook all historic exploration activities.
A total of 61 drill holes were drilled and core recovered through air flush coring. The recovered core is comparable with TNW core size
(16.8mm). Further information regarding the drilling process, assurance of quality and sampling protocols used by Southern Sphere is not
available for review. Southern Sphere is a reputable exploration company and it can be expected that best practices were followed and that
the data can be regarded as acceptable for CoAL Resource estimation. The samples were analysed by McLachlan and Lazar Laboratory (now
known as Inspectorate).
Southern Sphere also drilled 36 Large Diameter Drill (LDD) holes in 1984 at three sites on the farm Overvlakte 125MS, portion 5. The coal was
send to the Iscor Ltd coal laboratory for washability and coking tests. The results of the test work are not available for review.
4.3 Previous Coal Resource Estimates
Two previous Coal Resource estimates were compiled for the Vele Colliery. The Mineral Corporation (Pty) Ltd in 2010 and by Venmyn Rand
(Pty) Ltd (Venmyn) in 2012. Both these Coal Resource estimates are in accordance to the JORC Code (2007). A comparison between the 2010
and 2012 Coal Resource estimates, with a reason of any deviations, were produced by Venmyn and is presented in Table 4.3.1.

Coal of Africa Limited – Vele Colliery – Independent Competent Person’s Report Page 12 of 116
Table 4.3.1: Previous Coal Resource estimation completed in 2010 and 2012 by The Mineral Corporation and Venmyn respectively. The reason for changes between the two estimates is also provided.
2010 2012 DIFFERENCE
Project Resource Category
Seam
GROSS TONNES IN SITU (GTIS) (Mt)
MINEABLE TONNES IN
SITU (MTIS) (Mt)*
GROSS TONNES IN SITU (GTIS) (Mt)
TMC COMPARABLE
TONNES IN SITU*
MINEABLE TONNES IN
SITU (MTIS) (Mt)**
GROSS TONNES IN SITU (GTIS)
(Mt)
MINEABLE TONNES IN
SITU (MTIS) (Mt)
COMMENTS
VEL
E C
OLL
IER
Y
Measured
Top Lower 18.603 16.743 17.110 15.093 8.379 -1.493 -8.364 Decrease of 13.4Mt GTIS due to refined geological model. Decrease of 70.7Mt MTIS due to application of 0.5m thickness cut-off, maximum mining height of 4.5m for underground mining and only Bottom Lower Seam considered for underground mining. There is only a 25.8Mt difference between the 2010 MTIS and the TMC Comparable Tonnes for 2011.
Middle 16.140 14.527 14.275 12.922 7.220 -1.865 -7.307
Bottom Upper 44.553 40.097 40.818 31.137 16.240 -3.735 -23.858
Bottom Lower 92.127 82.914 85.832 69.329 62.403 -6.295 -20.511
TOTAL/AVERAGE MEASURED RESOURCES
171.423 154.281 158.035 128.482 94.241 -13.388 -60.040
Indicated
Top Lower 74.969 63.724 72.023 59.113 20.091 -2.946 -43.633 Decrease of 26.1Mt GTIS due to refined geological model. Decrease of 219.1Mt MTIS due to application of 0.5m thickness cut-off, maximum mining height of 4.5m for underground mining and only Bottom Lower Seam considered for underground mining. There is only a 22.1Mt difference between the 2010 MTIS and the TMC Comparable Tonnes for 2011.
Middle 49.144 41.772 42.397 36.592 11.662 -6.747 -30.110
Bottom Upper 107.973 91.777 102.442 88.249 25.010 -5.531 -66.767
Bottom Lower 220.849 187.721 209.992 178.959 143.535 -10.857 -44.186
TOTAL/AVERAGE INDICATED RESOURCES
452.935 384.994 426.854 362.912 200.298 -26.081 -184.696
Inferred
Top Lower 58.317 46.654 57.309 41.948 16.920 -1.008 -29.734 Increase of 29.8Mt GTIS due to refined geological model. Decrease of 84.7Mt MTIS due to application of 0.5m thickness cut-off, maximum mining height of 4.5m for underground mining and only Bottom Lower Seam considered for underground mining. There is only a 12.9Mt difference between the 2010 MTIS and the TMC Comparable Tonnes for 2011.
Middle 33.597 26.878 28.333 19.511 7.380 -5.264 -19.498
Bottom Upper 45.362 36.289 57.411 37.440 12.520 12.049 -23.769
Bottom Lower 51.834 41.467 75.879 39.840 38.270 24.045 -3.197
TOTAL/AVERAGE INFERRED RESOURCES
189.110 151.288 218.932 138.380 75.090 29.822 -76.198
GRAND TOTAL/AVERAGE OPENCAST 332.767 285.632 N/A 250.867 229.642 N/A -55.990 N/A -20%
GRAND TOTAL/AVERAGE UNDERGROUND
480.701 404.931 N/A 378.907 139.988 N/A -264.943 N/A -65%
GRAND TOTAL/AVERAGE VELE COLLIERY
813.468 690.563 803.821 629.774 369.626 -9.647 -320.934 -1% -46%
Notes: *All seams not at opencastable depths were considered as underground resources by The Mineral Corporation (TMC) in the reporting of MTIS ** Only the Bottom Lower Seam was considered by Venmyn for the underground resources in the reporting of MTIS. In addition a minimum and maximum seam height of 1.4m and 4.5m, respectively were applied # Tonnages reported in order to make a direct comparison with the TMC MTIS values, and to demonstrate that while the geological model has not changed, the calculation of MTIS has, in consideration of a number of additional modifying factors. These tonnages are not MTIS tonnes. TMC did report Total Selected Resources of 466.111Mt MTIS in its September 2011 report, presumably only considering Bottom Lower for underground mining

Coal of Africa Limited – Vele Colliery – Independent Competent Person’s Report Page 13 of 116
4.4 Previous Coal Reserve Estimates
Venmyn Rand compiled the previous Coal Reserves in 2012.
Table 4.4.1 provides the Coal Reserve estimate as published by Venmyn Rand in 2012.
Table 4.4.1: Coal Reserves as reported on 30 September 2012 (Venmyn Rand)
Mining Block OC \ UG
Reserve Category
Mineable Insitu Reserve (Mt)
RoM Tonnage (Mt)
Primary Product Practical Yield (%)
Primary Product Saleable Tonnes (Mt)
Secondary Product Practical Yield (%)
Secondary Product Saleable Tonnes (Mt)
OC central OC Proven 24.199 25.697 18.5% 4.743 38.3% 9.842
Total Proved OC 24.199 25.697 18.5% 4.743 38.3% 9.842
OC North OC
Probable
67.895 72.099 18.3% 13.167 43.8% 31.584
OC South OC 25.062 26.614 18.4% 4.908 44.0% 11.705
OC west OC 76.870 81.629 17.8% 14.555 45.7% 37.281
Total Probable OC 169.828 180.342 18.1% 32.630 44.7% 80.570
Total Opencast 194.027 206.039 18.1% 37.372 43.9% 90.412
UG North UG
Probable
38.335 24.996 18.9% 4.714 40.8% 10.208
UG South UG 30.317 19.768 17.8% 3.524 39.4% 7.794
UG West UG 62.891 41.008 17.0% 6.980 46.8% 19.179
Total Probable Underground 131.544 85.773 17.7% 15.218 43.3% 37.181
Grand Total Vele project 325.570 291.812 18.0% 52.590 43.7% 127.593
4.5 Previous Production
The Vele Colliery was only in operation for a short period before it was placed under care and maintenance. A total of 417kt was mined during
this period.

Coal of Africa Limited – Vele Colliery – Independent Competent Person’s Report Page 14 of 116
Geological Setting, Mineralisation and Deposit Types
5.1 Geological setting
5.1.1 Regional Geology
A regional geological map of the Vele Colliery area is presented in Figure 5.1.1.
Figure 5.1.1: General Geological Map for the Vele Colliery Area
The Karoo age Limpopo Coalfield is generally fault bounded, with the southern extent of the basin controlled by erosion. The deposition of the
Karoo sediments occurred concurrently with movement on pre-existing fault planes. The result is a truncated sequence of lithologies that are
distinctly different to those that are encountered in the main Karoo basin to the south in the Mpumalanga Province. The structure of the Tuli
Basin reflects the east west regional structural trend of the Limpopo Mobile Belt.
Dwyka-aged glacial deposits of the Karoo Supergroup have been deposited on the irregular Archean basement and overlain by Ecca-equivalent
arenaceous mudstone and laminated sandstones. The general stratigraphy of the area can be correlated to the Moltena, Beaufort, and of the
main Karoo Sequence. The primary lithologies in the region range from pebbly, coarse, arkosic sandstones to carbonaceous mudstones and
coal.
The Main Coal Zone is present in the Madzaringwe Formation, which is approximately 15m thick. Three distinct coal horizons occur in the
Middle Ecca Group, locally referred to the Top, Middle and Bottom Coal Horizons. All three coal horizons comprise interbedded coal and
mudstone units with varying coal quantities and qualities.
5.1.2 Local Geology
The Main Coal Zone consists of interlaminated carbonaceous shale, mudstones and coal plies. Figure 5.1.2 provides a local stratigraphic
column of the area as observed in the current Vele Colliery. The Top, Middle and Bottom seams were all intersected through drilling and
mining activities within the Vele Colliery area. The Top and Bottom seams can further be differentiated into a Top Lower, Top Middle, Top
Upper, Bottom Lower and Bottom Upper. The Top Middle and Top Upper are not considered economic.
Figure 5.1.2: Stratigraphic Column as observed in the Vele Colliery opencast (B. Botha (26.11.2015) taken on the Vele Colliery Site Visit)

Coal of Africa Limited – Vele Colliery – Independent Competent Person’s Report Page 15 of 116
Individual sub-seams can be correlated over the entire area. Correlation is assisted by a distinctly bioturbated marker between the Bottom and
Middle seams. The Bottom seam lies directly over the glacial Dwyka-aged sediments or granite-gneiss basement. The coal seams generally dip
with no more than 2ᵒ north, but can increase to 10ᵒ in the vicinity of faults. A series of dolerite dykes occurs in the area and does not appear to
have caused any displacement but have devolatilise the coal bordering them.
5.2 Structure and Tectonic setting
The coal deposition of the Vele Colliery occurred within and intra-continental basin bounded by extensional faulting. Major faults have been
interpreted, through field observations and geophysics, for the area. The faults divide the deposit in blocks with varying seam depths.
A serious of dolerite dykes trend predominantly east west across the project Colliery area, the largest is estimated to be more than 15m thick.
These dykes were emplaced during the extension tectonics that formed the intra continental basin. The dykes did not have significant
displacement associated but have resulted in minor de-volatilisation of coal in the immediate contact.
Figure 5.2.1 provides the localities of the interpreted faults and dykes within the Colliery area.

Coal of Africa Limited – Vele Colliery – Independent Competent Person’s Report Page 16 of 116
Figure 5.2.1: Structural and Tectonic map of the Vele Colliery area
5.3 Coal Deposit Characteristics
The three coal horizons are interbedded coal and mudstone units with varying coal quantities and qualities. The coal zones can be subdivided
into four coal sections or composite seams, namely:
Inconsistently formed Top Seam, which is 0 – 7.66m thick and contains 55% to 65% coal
The Middle Seam, which is 0 – 2.19m thick and contains 20% to 45% coal
The Bottom Upper Seam, which is 0 – 5.48m thick and contains 65% to 80% coal
The Bottom Lower Seam, which is 0 – 7.87m thick and contains 65% to 80% coal
The deposits outcrops in the east and the southern part of the deposit. The coal seams have been removed during post Karoo erosion towards
the south. The seams occur in blocks with different seam floor and roof elevations due to the prevalent faulting within the area. The faulting
divided the deposit into opencast minable coal and underground exploitable coal sections.
The deposit covers an area of 4 502.7ha and the floor of the Bottom Lower seam varies between 340m amsl and 480m amsl.
The typical seam coal zone and seam thickness is presented in Table 5.3.1.

Coal of Africa Limited – Vele Colliery – Independent Competent Person’s Report Page 17 of 116
Table 5.3.1 - Thickness Parameters for the coal zone and seam within the Vele Colliery area
Seam or Zone Average Thickness (m) Maximum Thickness (m) Minimum Thickness (m)
Coal Zone 16.42 31.95 0.25
Top Lower seam 1.52 7.66 0
Middle seam 1.05 2.19 0
Bottom Upper seam 1.98 5.48 0
Bottom Lower seam 3.68 7.87 0
The thickness contours for the different seams is presented in Figure 5.3.1 to Figure 5.3.4.
Figure 5.3.1: Thickness plot for the Top Lower Seam

Coal of Africa Limited – Vele Colliery – Independent Competent Person’s Report Page 18 of 116
Figure 5.3.2: Thickness plots for the Middle Seam
Figure 5.3.3: Thickness plots of the Bottom Upper Seam

Coal of Africa Limited – Vele Colliery – Independent Competent Person’s Report Page 19 of 116
Figure 5.3.4: Thickness plot for the Bottom Lower Seam
Coal petrography was done on the coal seams from the Vele Colliery and it indicates that the coal is a medium rank, high vitrinite content, and
C-grade bituminous coal. The coal falls into a semi-soft coking coal category. Figure 5.3.5 indicates the coal quality of the Vele Colliery in
relation to petrographic images.
Figure 5.3.5: Classification of the coal at Vele Colliery (Highlighted section in red indicates typical Vele coal category)

Coal of Africa Limited – Vele Colliery – Independent Competent Person’s Report Page 20 of 116
Exploration Data
6.1 Geophysics
In 2008, CoAL commissioned Furgo Airborne Surveys (Pty) Ltd to undertake a high-resolution airborne magnetic and radiometric survey over
an area of 111km2 over the Vele Colliery area. The survey was done at a line spacing of 50m and covered 2 431 line kilometres. The raw data
was processed by GAP Geophysics (Pty) Ltd (GAP) in 2009 and presented as a set of plans showing radiometric total counts, ternary K-U-Th
counts, a digital terrain model, terrain clearance data and both total and vertical magnetic fields. The images were further interpreted and a
geological map was drawn up by GAP.
6.2 Drilling
6.2.1 Drilling Method
Drill holes incorporated into the geological model are primarily diamond core drilling with secondary percussion drilling to verify the structure
of the boxcut area, as well as understanding the structural and quality continuity. The last phase of drilling was Large Diameter Drill holes for
metallurgical test work for the Plant Modification Project. Table 6.2.1 provides a summary of the drilling completed at the Vele Colliery and the
distribution of these drill holes is presented in Figure 6.2.1.
Table 6.2.1: Summary of historic and recent drilling on the Vele Colliery area
Date Company Property Purpose Drilling Method Drill hole Size Total Number of
Drill Holes
Pre 2008 Southern Sphere
Overvlakte 125MS, Amond 120MS
Early Exploration Diamond core
TNW 61
Overvlakte 125MS Quality Sampling LDD 36
2008 CoAL. Supervised by MSA
Overvlakte 125MS, Amond 120MS, Semple 119MS, Alyth 837MS, Voorspoed 836MS
Infill drilling and Resource Estimation
Diamond Core
HQ3, PQ3 73
2008-2010
CoAL
Infill drilling and Resource Estimation
PQ3 115
Quality Sampling T6 31
2010 Overvlakte 125MS Redefining structural model in area of boxcut
Percussion 8
Inch 236
2013 Overvlakte 125MS LDD for metallurgical test work as part of PMP
Diamond core PQ3 39

Coal of Africa Limited – Vele Colliery – Independent Competent Person’s Report Page 21 of 116
Figure 6.2.1: Distribution of drill holes used in the geological model at Vele Colliery
6.2.1.1 Diamond Core Drilling
Diamond Core Drilling is the industry acceptable method to collect coal intersections for quality test work. The drilling method provides an
uncontaminated sample, without the loss of fine coal particles like vitrinite, which is important to determine the coking properties of coal.
Before CoAL started with exploration in the area, Southern Sphere completed 96 diamond core holes, with the structure verified through wire-
line geophysics, was sampled and analysed.
After the acquisition of the project by CoAL, they embarked on two separate exploration projects. In the first managed by MSA 73 diamond
core holes with wire-line geophysics and samples for quality test work was completed. Subsequently to the MSA programme, CoAL drilled
another 146 diamond core holes with wire-line geophysics and samples for quality test work. All diamond core holes were logged and sampled
according to the protocol set out in this document.
6.2.1.2 Percussion Drilling
In 2010, CoAL drilled ten percussion boreholes in the area that was earmarked for the initial boxcut to get an understanding of the fault within
the area. Percussion drilling is a cost effective method to obtain structural data from coal deposits. The samples (chips) are of inadequate
quality to be used for quality analyses. All of the percussion holes were subjected to wire-line geophysics to obtain the structural data.
A series of 247 blast boreholes were drilled around the boxcut. The purpose of the drilling was to identify structures in the current mining area,
as well as for quality control purposes. All the holes have wire-line geophysical logs for structural data and was not sampled.
As part of this drilling campaign, a closely spaced correlation cross was drilled in the opencast areas. The aim of the drilling was to determine
the optimal drill hole spacing for the deposit concerning structure and quality.
6.2.1.3 Large Diameter Drill Holes (LDD)
A total of 39 PQ3 (85.7mm) drill holes were drilled to preform drop shatter test and wet tumble tests on at ACT Laboratories. The LDD holes
were distributed over the Central Mining Area and the Northern Mining Area (Figure 6.2.2). In the Central Mining Area 18 drill holes were
drilled with an average spacing of 187m. In the Northern Mining Area 21 drill holes were drilled with an average spacing of 250m between drill
holes. The drill holes were logged according to the protocols and sampled. The drill holes also have down-hole geophysical logs. The drill holes
and analytical results were included into the geological model.

Coal of Africa Limited – Vele Colliery – Independent Competent Person’s Report Page 22 of 116
Figure 6.2.2: Localities of LDD holes on the Vele Colliery area (created by Coal of Africa Limited)
6.2.2 Sample Recovery
In accordance to SANS10320:2004 a minimum 95% recovery on coal seams are required to ensure that the sample is representative. During
the MSA managed drilling programme core recoveries were recorded in the field by the responsible geologist. Instances when recovery within
the coal horizons did not achieve the minimum of 95% recovery, and the reason could be contributed to poor drilling practices, a re-drill of the
whole drill hole was required. Instances were badly fractured or faulted ground was encountered the drilling contractor was instructed to take
all necessary steps to ensure maximum core recovery.
During the CoAL managed drilling campaign a minimum core recovery of 98% in coal horizons and 95% in non-coal sediments were stipulated.
Core recoveries were recorded by the driller through the comparison of run lengths against recovered core lengths. However, CoAL geologists
calculated core recoveries by comparing the seam thickness between the down-hole geophysical survey and the actual core recovered. Drill
holes that did not meet the criteria were then re-drilled.
6.2.3 Logging
6.2.3.1 Core Logging
The logging protocols used by Southern Sphere are not available for review.
The logging procedures employed by MSA during the first drilling campaign initialised by CoAL are as follows:
In the beginning of the project core was laid down on 10m plastic sheets, but as the project progressed the core was packed into 1m
or 1,5m long core trays
Coal intersections were split lengthwise with a hammer and a chisel so that the cross section of the core could be described
For each lithological unit the rock type, colour, grain size, fabric, core bedding angle, mineralisation and other characteristics were
noted
Thin coal intersections (<30cm) were recorded as coal bands and thicker intersections were recorded as coal seams and described in
detail on a separate log sheet.
The ‘from-to’ depths of each unit was reconciled with down-hole geophysical logs
In later drilling campaigns, the core was not split in two along the extent of the coal zone. This was done to minimise fine generation and
provide intact core for tumble tests (drop shatter load tests).

Coal of Africa Limited – Vele Colliery – Independent Competent Person’s Report Page 23 of 116
During the drilling managed by CoAL a similar logging protocol was adhered to. The difference was that the lithology and coal seams were
described on the same log sheet. CoAL also endeavoured to split the core, log it and sample it on the same day to minimise possible oxidation
that can influence the coking properties of the coal for testing.
The data from hand written logs were captured on MS ExcelTM and subsequently imported into a SABLETM Database.
The entire core length recovered per drill hole was photographed at the core shed prior to sampling during the CoAL managed drilling
campaign. No core photography was done during the MSA managed drilling campaign.
The 5m preceding the Bottom Lower Seam and following the seam was geotechnically logged according to the modified rock mass rating
system that is commonly employed by South African geotechnical engineers.
6.2.3.2 Downhole Geophysical Logging
During both of CoAL’s exploration programmes, Weatherford UK Limited undertook down-hole geophysical wire-line on a routine basis.
Geophysical methods employed include dual-density and gamma. Calliper measurements was also undertaken to determine the rugosity of
the drilled hole. Additional to the techniques mentioned tools such as acoustic televiewer, magnetic susceptibility and electrical resistivity
were used occasionally to assist with structural interpretations. Figure 6.2.3 provides and illustration of the results of geological logging and
the down-hole geophysical logging.
Figure 6.2.3: Interpreted down-hole geophysical log with associated geology

Coal of Africa Limited – Vele Colliery – Independent Competent Person’s Report Page 24 of 116
6.2.4 Orientation of data in relation to geological structure
The coal seams present at Vele Colliery dips at 2ᵒ to the north. All the drill holes drilled in the area and used for geological modelling and Coal
Resource estimation is vertical and intersects the seams at approximately 90ᵒ. No thickness adjustments were required to calculate the true
thickness of the coal seams.
6.2.5 Drill hole information
The drill holes used in the geological modelling and Coal Resource estimation is tabulated in Appendix 3. A total of 573 drill holes were used in
geological modelling and Coal Resource estimation. Seventeen drill holes were excluded from the modelling and estimation. These drill holes
are primarily water drill holes or drill holes without geology or data.
It is the opinion of VBKom that the drill holes excluded from the geological modelling and Coal Resource estimation will not affect the results
materially.
6.3 Sampling
6.3.1 Sampling
The sampling protocols employed by Southern Sphere during their activities are not documented. The sampling techniques employed by MSA
and CoAL are described in the following text. In both cases, sample intervals usually ranged between 50cm and 150cm and the whole core was
sampled (as prescribed by SANS10320:2004) to minimise any bias.
Samples collected by MSA were packed into double plastic bags, which were sealed with staples. The samples were labelled using pre-
numbered sequential cable ties.
Samples collected by CoAL in the subsequent exploration phase were similarly packed, with sample numbers written with a black permanent
marker on the outside of the bag and manila tags (with the corresponding sample number) placed inside and outside the bag, which was
closed with staples. Sample inventories, recording the batch number, individual sample numbers and the number of samples in each batch,
accompanied samples sent to the laboratory.
During the MSA exploration programme, the bagged samples were stored in a locked core shed prior to dispatch to the laboratory. Coal and
core from the CoAL managed exploration programme were stored in a secure refrigerated container on site before being dispatched to the
laboratory every fortnight. The laboratory was provided with written instructions, in advance, regarding sample preparation and the specific
test work required.
6.3.2 Sample Preparation
During the MSA managed programme, all samples were initially sent to the South African Bureau of Standards (SABS) laboratory in Secunda,
Mpumalanga Province. The laboratory is accredited through the South African National Accreditation System (SANAS) and SABS/ISO/IEC
17025:2005. Due to long turnaround times for the reporting of results, CoAL relocated all unprocessed samples to Inspectorate M&L, which is
also a SANAS accredited laboratory.
Since December 2008, all samples were sent to the CAM Analytical Laboratories (Pty) Ltd laboratory (CAM) in Polokwane, Limpopo Province.
The laboratory is a joint venture between CoAL and Arcelor Mittal and is managed by Inspectorate. CAM is also an accredited laboratory under
SANAS.
All analytical test work and associated sample preparation is preformed to internationally acceptable standards. All starnd proceduers are
available on request.
In short, the following processes were followed by the laboratories for the preparation and analysis of slim core samples:
Air dry samples received
Determine the raw relative density (RD) of the sample
Crush sample to -25mm and screen out the -0.5mm
Preform a raw coal proximate analysis, calorific value (CV) and total Sulphur (S) on the +0.5mm and -0.5mm size fractions
Analyse the +0.5mm to -25mm fraction for phosphorous (P2O5)
Conduct float/sink analyses on the +0.5mm to -25mm size fraction at densities ranging from 1,30t/m3 to 1.80t/m3 in increments of
0.05t/m3.
Preform proximate analyses, CV, total sulphur and phosphorous for each float fraction and the sink product from the 1.80 RD
fraction
The float fractions at RD 1.30, 1.35, 1.40 and 1.45 the Free Swelling Index (FSI) and Roga Index was determined

Coal of Africa Limited – Vele Colliery – Independent Competent Person’s Report Page 25 of 116
Drop shatter tests and wet tumble tests are methods to simulate the breakage that occurs in coal processing, prior to classification (separation
into different size fractions) and washing in the preparation plant. The process applies repeated dropping of lump coal to establish a RoM size
description, followed by a wet tumbling phase where the RoM coal is tumbled in a drum with steel blocks and water to simulate the breakage,
which occurs in pumping, cycloning, and screening phases in the preparation plant. The procedure is as follows
Standard 20 drops of unbroken coal from two meters
Dry tumble broken coal with 10 steel cubes for three minutes
Wet tumble coal with 18 steel cubes (for a 50kg sample mass) for five minutes
Thereafter the resulting coal package was screened into a +0.25mm to -2mm, +2mm to -12.5mm, +12.5mm to -25mm and +25mm to -50mm
size fractions. Each fraction was submitted for float/sink analyses. The float/sink analyses was performed on the following RD’s (t/m3); 1.35,
1.38, 1.40, 1.42, 1.45, 1.50, 1.60, 1.80, 2.00 and 2.30. Proximate analyses were performed on each float fraction.
6.4 Database Management
Coal uses SABLE DatabaseTM for the storage of drill hole information and analytical results. SABLE provides the user to store data on a server
onsite and off-site and the printing of hard copy logs for safe keeping. The database system has built in data verification tools and Sequel
queries can be executed to do various validations. Typical validation of the SABLE Database package is as follows:
“From-to” depths. Ensures there are no gaps or overlaps within sequentially logged borehole
Standardised code for description fields to ensure standardisation of descriptions in logs
Ensure end of hole correlates with down-hole survey depth
Preforms various correlations and checks on cumulative wash tables
Various checks have been done on the dataset by reputable consultancies and they found no major discrepancies in the database.
6.5 QA/QC Analysis
Laboratories are required to calibrate their coal analytical equipment daily and is required to partake in round robin proficiency tests to ensure
a high level of analytical accuracy. The laboratory manager verify all result reports and any inconsistencies or variations about the laboratory’s
specifications are re-analysed. CoAL has requested that the laboratories plot ash% versus CV curves for all samples. Any sample with a
correlation outside a 10% deviation line is re-analysed.
Inspectorate undertakes the following measures to ensure accuracy of analytical results:
25% of all samples are analysed in duplicate, and any sample outside the tolerance levels are re-analysed
They partake in monthly and quarterly proficiency tests
They partake in monthly internal round robin tests
A certified reference material is tested every shifts and result are evaluated
A hidden duplicate is inserted in every batch of ten samples
One in every 20 samples is screened at 212microns to confirm that the oversize is less than 95%
The records of the validation methods and result are available for scrutiny
CoAL geologists also do random validations of the results by doing basic tests on cumulative results and testing the values with neighbouring
drill holes and the seam characteristics.
6.6 Spatial Data
6.6.1 Survey Information
It cannot be confirmed what method Southern Sphere used to survey their drill holes. It can be accepted that they did use the services of a
professional surveyor as most of the work was done before hand-held GPS systems become popular.
In the drilling campaigns managed by CoAL all drill holes were sited with a hand-held GPS. After the drilling was completed the collars were
accurately surveyed using LeicaTM GPS equipment. P. Matibe and Associates did the final survey, whose surveyors are registered with the
South African Council for Professional and Technical Surveyors (PLATO).

Coal of Africa Limited – Vele Colliery – Independent Competent Person’s Report Page 26 of 116
A LIDAR survey has been flown over the Vele Colliery area providing elevation data of the topography with a 15cm vertical and 30cm
horizontal accuracy.
VBKom is of the opinion that the survey methods used for the drill hole collars and the confidence in the topography is suitable for Coal
Resource estimation with a high confidence in the spatial distribution of data points.
6.6.2 Data spacing & Distribution
Drill holes are variably spaced throughout the project area. Figure 6.6.1 provides a diagram that indicates the distribution of drill hole data in
the colliery area. The distances between the drill holes in certain areas is less that 250m and in other areas it can go up to 500m. The areas
were the drilling is more closely spaced is the areas were the first mining operations started.
A correlation cross of closely spaced drill holes were drilled to determine the drill spacing for long, medium and short term planning (Figure
6.6.1). The results were as follows:
For long term planning 500m is adequate for structural continuity
For long term planning 1000m is adequate for quality continuity
Therefore, the current data point spacing is adequate to prove continuity of the deposit structure and quality and to be used in geological
modelling and subsequent Coal Resource estimation.
Figure 6.6.1: Closely spaced cross drilling to investigate structural and quality continuity
6.7 Data Verification, Audits and Reviews
The dataset has been subjected to various audits and reviews.
During the Mineral Corporation’s Coal Resource Estimation process in 2010, the datasets supplied to the Mineral Corporation by CoAL were
checked for any discrepancies in drill hole collar coordinates, seam depths, sample intervals and end-of hole depths. Approximately 10% of
entries were checked against the original laboratory reports and no significant differences were found.
Venmyn Rand (Venmyn Deloitte) has randomly selected 10 drill hole logs and associated laboratory certificates with the Access database and
no errors were found.

Coal of Africa Limited – Vele Colliery – Independent Competent Person’s Report Page 27 of 116
Coal Resource Estimates
7.1 Estimation and Modelling Techniques
7.1.1 Coal Deposit Modelling
Over the existence of the project, various coal deposit models have been prepared for the Vele Colliery. In September 2010, The Mineral
Corporation constructed a 3D Minex TM digital model.
Mr J Sparrow, a competent geologist, prepared the current model used for resource estimation and mine planning and designs. Mr Sparrow is
CoAL’s chief consulting geologist and has been involved in the project since 2011. The latest geological model was created in Minex TM
software. The model incorporates all available historical and recent drilling and other geological information up to January 2015. The model is
based on the Mineral Corporation’s model of 2010, with minor changes based on geological information collected subsequently to the
completion of the Mineral Corporation’s model. From previous audits and reviews by reputable independent consultants, there is a high level
of confidence in the geological model.
The upper surface of the model is a digital terrain model (DTM) based on the LIDAR survey conducted with a high level of spatial accuracy.
Figure 7.1.1 provides the topography as a DTM. Dolerite dykes and fault planes were incorporated in the 3D structural model. The structural
model assisted in identifying areas for opencast mining and underground mining.
Figure 7.1.1: DTM used as the upper surface (topography) for geological modelling
Both the physical and quality parameters of the various seams were modelled. Grids with a 25m mesh were estimated using Minex’sTM
general-purpose gridding function using a 3km search radius. The model of the physical parameters of the seam was cut along any significant
structures but the quality data was modelled across these structures. All the physical and quality parameters modelled was plotted and
inspected to ensure coherence to the geological interpretation and understanding.

Coal of Africa Limited – Vele Colliery – Independent Competent Person’s Report Page 28 of 116
7.1.2 Structural Interpretation
The physical parameters namely elevation (asml), and depth from surface for the floor and roof of each seam was modelled. The coal seam
thickness was also modelled and forms the basis for the calculation of the Coal Resource volumes. Only the modelling of the seam floor
elevation, depth from surface and seam thickness will be discussed as it has the biggest influence on the mine design criteria and Coal
Resource estimation.
7.1.2.1 Seam Floor Elevation
The Top Lower, Middle, Bottom Upper and Bottom Lower Seam floor elevations were modelled to identify any sudden changes in elevation,
which indicates the presence of faulting, as well as to obtain the general dip of the deposit. Only the seam floor elevation of the Bottom Lower
Seam is presented in Figure 7.1.2. The Figure indicates the effect faulting had on the area by sub dividing the deposit into various block with
different elevations. The faulting was also a driver in discriminating between opencast mining blocks and underground mining blocks.
The seam floor elevation plot also indicates that the coal generally dips to the north and sub-outcrops in the south in the Vele Colliery area.
Figure 7.1.2: Rainbow plot of the Bottom Lower Seam floor elevation
7.1.2.2 Depth from surface
The seam depth from surface has an impact on the economic viability of the extraction of the coal seams. For underground mines, the depth
from surface also plays a critical role in the design criteria to safely extract the coal. Figure 7.1.3 to Figure 7.1.6 provides plots of the depth
below surface of the various seams. The plots indicate the areas were the coal could be extracted through opencast mining and underground
mining. For the underground mining, only the Bottom Lower Seam is targeted.

Coal of Africa Limited – Vele Colliery – Independent Competent Person’s Report Page 29 of 116
Figure 7.1.3: Rainbow plot of the Top Lower Seam depth from surface
Figure 7.1.4: Rainbow plot of the Middle Seam depth from surface

Coal of Africa Limited – Vele Colliery – Independent Competent Person’s Report Page 30 of 116
Figure 7.1.5: Rainbow plot of the Bottom Upper Seam from surface
Figure 7.1.6: Rainbow plot of the Bottom Lower Seam depth below surface
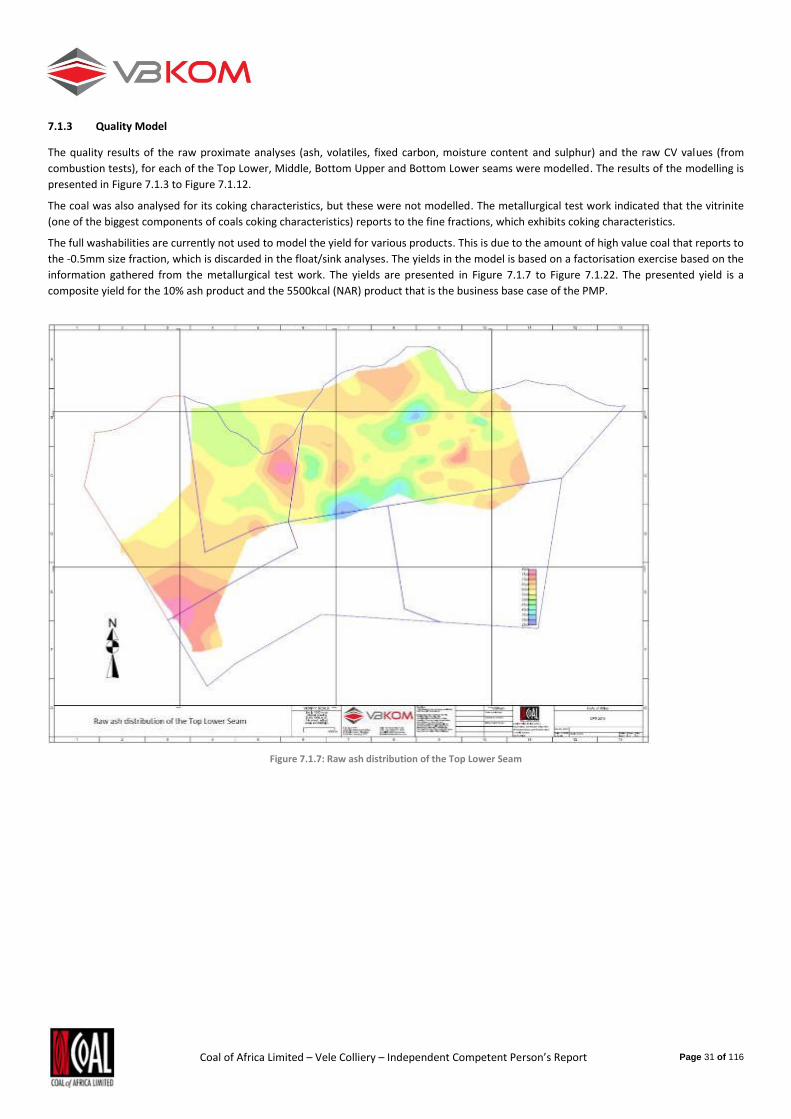
Coal of Africa Limited – Vele Colliery – Independent Competent Person’s Report Page 31 of 116
7.1.3 Quality Model
The quality results of the raw proximate analyses (ash, volatiles, fixed carbon, moisture content and sulphur) and the raw CV values (from
combustion tests), for each of the Top Lower, Middle, Bottom Upper and Bottom Lower seams were modelled. The results of the modelling is
presented in Figure 7.1.3 to Figure 7.1.12.
The coal was also analysed for its coking characteristics, but these were not modelled. The metallurgical test work indicated that the vitrinite
(one of the biggest components of coals coking characteristics) reports to the fine fractions, which exhibits coking characteristics.
The full washabilities are currently not used to model the yield for various products. This is due to the amount of high value coal that reports to
the -0.5mm size fraction, which is discarded in the float/sink analyses. The yields in the model is based on a factorisation exercise based on the
information gathered from the metallurgical test work. The yields are presented in Figure 7.1.7 to Figure 7.1.22. The presented yield is a
composite yield for the 10% ash product and the 5500kcal (NAR) product that is the business base case of the PMP.
Figure 7.1.7: Raw ash distribution of the Top Lower Seam

Coal of Africa Limited – Vele Colliery – Independent Competent Person’s Report Page 32 of 116
Figure 7.1.8: Raw ash distribution for the Middle Seam
Figure 7.1.9: Raw ash distribution for the Bottom Upper Seam

Coal of Africa Limited – Vele Colliery – Independent Competent Person’s Report Page 33 of 116
Figure 7.1.10: Raw ash distribution of the Bottom Lower Seam
Figure 7.1.11: Raw volatile distribution for the Top Lower Seam
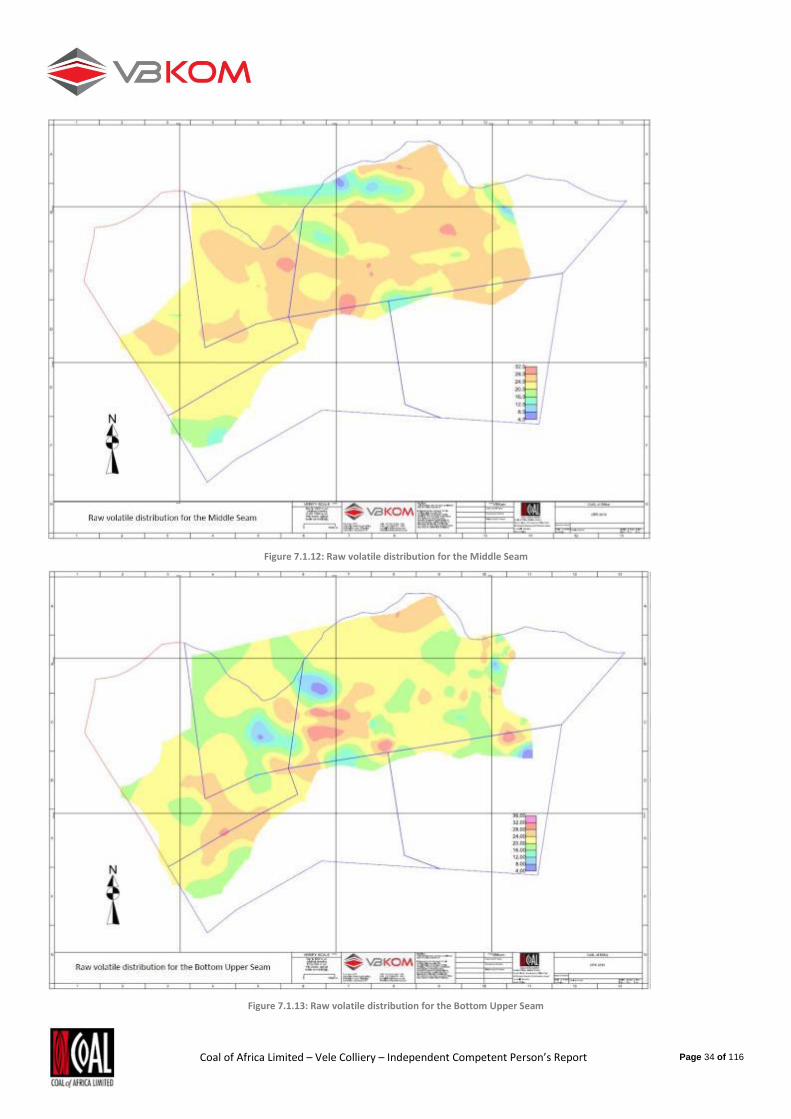
Coal of Africa Limited – Vele Colliery – Independent Competent Person’s Report Page 34 of 116
Figure 7.1.12: Raw volatile distribution for the Middle Seam
Figure 7.1.13: Raw volatile distribution for the Bottom Upper Seam

Coal of Africa Limited – Vele Colliery – Independent Competent Person’s Report Page 35 of 116
Figure 7.1.14: Raw volatile distribution for the Bottom Lower Seam
Figure 7.1.15: Raw CV distribution for the Top Lower Seam

Coal of Africa Limited – Vele Colliery – Independent Competent Person’s Report Page 36 of 116
Figure 7.1.16: Raw CV distribution for the Middle Seam
Figure 7.1.17: Raw CV distribution for the Bottom Upper Seam

Coal of Africa Limited – Vele Colliery – Independent Competent Person’s Report Page 37 of 116
Figure 7.1.18: Raw CV distribution for the Bottom Lower Seam
Figure 7.1.19: Yield distribution for the Top Lower Seam based on metallurgical test work

Coal of Africa Limited – Vele Colliery – Independent Competent Person’s Report Page 38 of 116
Figure 7.1.20: Yield distribution for the Middle Seam based on metallurgical test work
Figure 7.1.21: Yield distribution for the Bottom Upper Seam based on metallurgical test work

Coal of Africa Limited – Vele Colliery – Independent Competent Person’s Report Page 39 of 116
Figure 7.1.22: Yield distribution for the Bottom Lower Seam based on metallurgical test work
7.1.4 Cut-offs Applied in the Calculation of Resources
The following cut-offs were applied before the gross tonnes in situ (GTIS) were calculated for the Vele Colliery:
The coal was reported separately for the mining right and prospecting right respectively
The Coal Resource Blocks were limited to the Mineral Right boundaries
The Coal Resources are limited to the seam sub-crop
Coal Resource blocks are limited to the extrapolation limits in the model
Boundary pillars of 50m wide on either side of geological structures and dykes
Coal Resource blocks are limited to the base of oxidation
Coal Resource blocks are limited to the 100m year flood line for the Limpopo River
A seam thickness cut-off of 0.5m are applied
Volatiles less than 18% (dry ash free) to ensure devolatilised coal was excluded
The following cut-off was applied to calculate total tonnes in situ (TTIS):
Geological losses (confidence in structural continuity and oxidation profiles) of 10%, 15% and 20% are applied to Measured, Indicated
and Inferred Coal Resources respectively.
The following cut-off was applied to calculate mineable tonnes in situ (MTIS) resources:
A minimum seam height of 1.4m and a maximum seam height of 4.5m have been applied to the Bottom Lower Seam for the
underground resources

Coal of Africa Limited – Vele Colliery – Independent Competent Person’s Report Page 40 of 116
7.2 Coal Resource Classification Criteria
The first Coal Resource classification was based on the spacing between points of observation (point with structural and / or quality data). This
method stated that points of observation spaced at 500m are Measured Resources, Indicated Resources were spaced at 1000m and Inferred
Resources the spacing was 3km.
In order to bring the Coal Resource statement in line with the guidelines of the JORC Code 2012 a correlation cross was drilled to determine
the optimal spacing between drill holes to determine lateral continuity. It was determined that 500m is sufficient for structural estimation and
1000m for quality estimations. No variography was done, but resource estimation were done at different grid spacing, which indicated little
change to the resource tonnage and quality within the advised spacing. This indicates that the current classification used by Vele Colliery is a
conservative approach and is acceptable for the current Resource Reporting cycle.
Other criteria was also considered for the Coal Resource Classification criteria, i.e. confidence in drill hole position, confidence in coal analyses
and confidence in structural interpretation of a drill hole.
Figure 7.2.1 provides the Resource Classification for the Vele Colliery area.
Figure 7.2.1: Resource classification of the Vele Colliery. Areas within the Blue is categorised as Measured Coal Resources and areas outside the blue and
inside the green is categorised as Indicated Coal Resources
7.3 Reasonable and Realistic Prospects for Eventual Economic Extraction
Mining, Processing and Environmental factors as per the studies discussed under Technical studies have been applied to determine the
reasonable and realistic prospects for eventual economic extraction. No resources were excluded based on these criteria.
7.4 Coal Resource Statement
The updated Coal Resource statement is reported in two statements. The first Coal Resource statement provides only the TTIS based on the
0.5m seam thickness cut-off. The second statement reports the MTIS resource based on the minimum seam thickness of 1.4m and the
maximum seam thickness of 4.5m (theoretical mining height) for the underground resources.
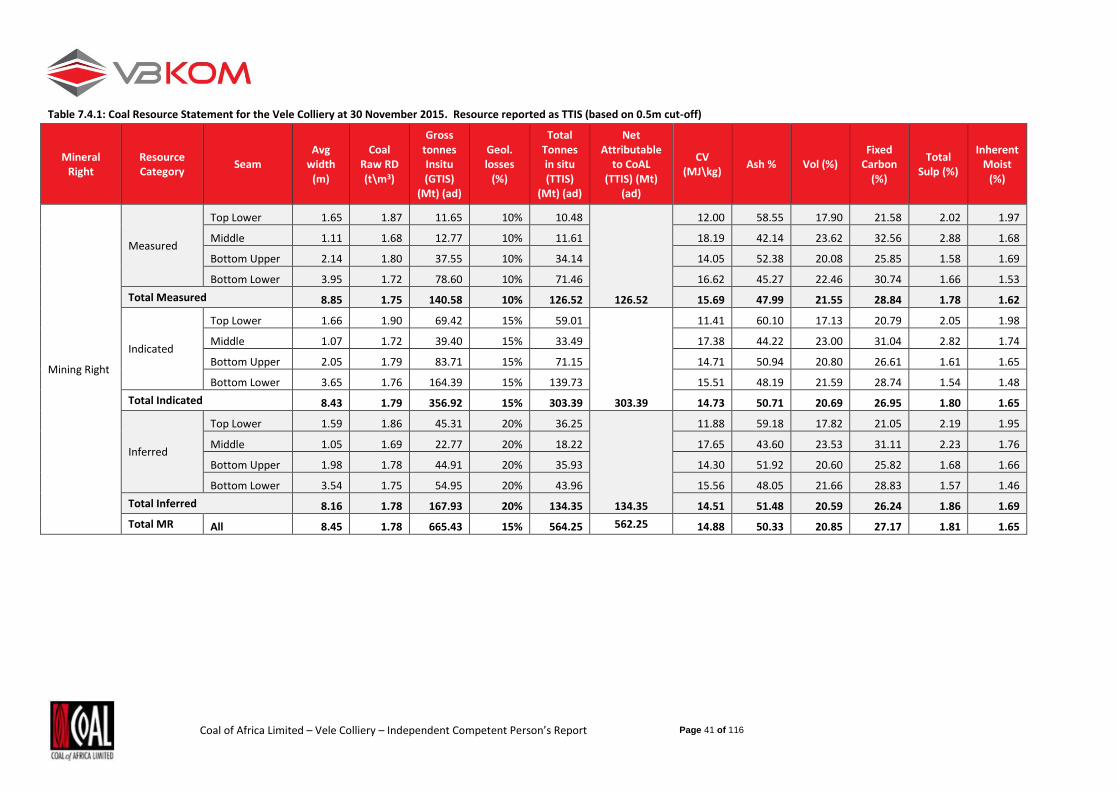
Coal of Africa Limited – Vele Colliery – Independent Competent Person’s Report Page 41 of 116
Table 7.4.1: Coal Resource Statement for the Vele Colliery at 30 November 2015. Resource reported as TTIS (based on 0.5m cut-off)
Mineral Right
Resource Category
Seam Avg
width (m)
Coal Raw RD (t\m3)
Gross tonnes Insitu (GTIS)
(Mt) (ad)
Geol. losses
(%)
Total Tonnes in situ (TTIS)
(Mt) (ad)
Net Attributable
to CoAL (TTIS) (Mt)
(ad)
CV (MJ\kg)
Ash % Vol (%) Fixed
Carbon (%)
Total Sulp (%)
Inherent Moist
(%)
Mining Right
Measured
Top Lower 1.65 1.87 11.65 10% 10.48
126.52
12.00 58.55 17.90 21.58 2.02 1.97
Middle 1.11 1.68 12.77 10% 11.61 18.19 42.14 23.62 32.56 2.88 1.68
Bottom Upper 2.14 1.80 37.55 10% 34.14 14.05 52.38 20.08 25.85 1.58 1.69
Bottom Lower 3.95 1.72 78.60 10% 71.46 16.62 45.27 22.46 30.74 1.66 1.53
Total Measured 8.85 1.75 140.58 10% 126.52 15.69 47.99 21.55 28.84 1.78 1.62
Indicated
Top Lower 1.66 1.90 69.42 15% 59.01
303.39
11.41 60.10 17.13 20.79 2.05 1.98
Middle 1.07 1.72 39.40 15% 33.49 17.38 44.22 23.00 31.04 2.82 1.74
Bottom Upper 2.05 1.79 83.71 15% 71.15 14.71 50.94 20.80 26.61 1.61 1.65
Bottom Lower 3.65 1.76 164.39 15% 139.73 15.51 48.19 21.59 28.74 1.54 1.48
Total Indicated 8.43 1.79 356.92 15% 303.39 14.73 50.71 20.69 26.95 1.80 1.65
Inferred
Top Lower 1.59 1.86 45.31 20% 36.25
134.35
11.88 59.18 17.82 21.05 2.19 1.95
Middle 1.05 1.69 22.77 20% 18.22 17.65 43.60 23.53 31.11 2.23 1.76
Bottom Upper 1.98 1.78 44.91 20% 35.93 14.30 51.92 20.60 25.82 1.68 1.66
Bottom Lower 3.54 1.75 54.95 20% 43.96 15.56 48.05 21.66 28.83 1.57 1.46
Total Inferred 8.16 1.78 167.93 20% 134.35 14.51 51.48 20.59 26.24 1.86 1.69
Total MR All 8.45 1.78 665.43 15% 564.25 562.25 14.88 50.33 20.85 27.17 1.81 1.65

Coal of Africa Limited – Vele Colliery – Independent Competent Person’s Report Page 42 of 116
Mineral Right Resource Category
Seam Avg
width (m)
Coal Raw RD (t\m3)
Gross tonnes Insitu (GTIS) (Mt) (ad)
Geol. losses
(%)
Total Tonnes in situ (TTIS) (Mt) (ad)
Net Attributable
to CoAL (TTIS) (Mt) (ad)
CV (MJ\kg)
Ash % Vol (%) Fixed
Carbon (%)
Total Sulp (%)
Inherent Moist
(%)
Prospecting Right
Measured
Top Lower
6.831
Middle
Bottom Upper 2.22 1.77 2.509 10% 2.258 14.05 52.38 20.08 25.85 1.58 1.69
Bottom Lower 4.49 1.78 5.081 10% 4.573 16.62 45.27 22.46 30.74 1.66 1.53
Total Measured 6.71 1.78 7.590 10% 6.831 15.69 47.99 21.55 28.84 1.78 1.62
Indicated
Top Lower 1.32 2.09 2.599 15% 2.209
59.440
11.41 60.10 17.13 20.79 2.05 1.98
Middle 0.76 1.73 2.994 15% 2.545 17.38 44.22 23.00 31.04 2.82 1.74
Bottom Upper 1.87 1.77 18.732 15% 15.922 14.71 50.94 20.80 26.61 1.61 1.65
Bottom Lower 3.79 1.72 45.605 15% 38.764 15.51 48.19 21.59 28.74 1.54 1.48
Total Indicated 7.74 1.75 69.929 15% 59.440 14.73 50.71 20.69 26.95 1.80 1.65
Inferred
Top Lower 1.12 1.95 12.002 20% 9.602
40.800
11.88 59.18 17.82 21.05 2.19 1.95
Middle 0.79 1.74 5.563 20% 4.450 17.65 43.60 23.53 31.11 2.23 1.76
Bottom Upper 1.70 1.76 12.505 20% 10.004 14.30 51.92 20.60 25.82 1.68 1.66
Bottom Lower 3.67 1.75 20.931 20% 16.745 15.56 48.05 21.66 28.83 1.57 1.46
Total Inferred 7.28 1.80 51.000 20% 40.800 14.51 51.48 20.59 26.24 1.86 1.69
Total PR All 7.49 1.77 128.520 17% 107.071 107.071 14.88 50.33 20.85 27.17 1.81 1.65
Vele Colliery 8.30 1.78 793.95 15% 671.32 671.32 14.80 50.43 20.86 27.05 1.81 1.66

Coal of Africa Limited – Vele Colliery – Independent Competent Person’s Report Page 43 of 116
Table 7.4.2: Coal Resource Statement for the Vele Colliery at 30 November 2015. Resource reported as MTIS (resources) (based on minimum seam thickness of 1.4m and a maximum seam
thickness of 4.5m for the underground Bottom Lower resources)
Mineral Right Resource Category
Seam
Avg
wid
th (
m)
Co
al R
aw R
D
(t\m
3 )
Gro
ss t
on
ne
s
Insi
tu G
TIS
(Mt)
(ad
)
Ge
ol.
loss
es
(%)
Tota
l To
nn
es
in
situ
TTI
S (M
t)
(ad
)
Min
ing
Me
tho
d
Min
ing
Layo
ut
Loss
es
Min
eab
le
ton
ne
s in
sit
u
MTI
S (M
t) (
ad)
Ne
t A
ttri
bu
tab
le
to C
oA
L (M
TIS)
(Mt)
(ad
)
CV
(M
J\kg
)
Ash
%
Vo
l (%
)
Fixe
d C
arb
on
(%)
Tota
l Su
lp (
%)
Inh
ere
nt
Mo
ist
(%)
Mining Right
Measured
Top Lower 1.76 1.88 4.040 10% 3.636 OC 2% 3.563
83.271
11.78 59.0 17.8 21.32 2.14 1.9
Middle 1.17 1.66 6.742 10% 6.129 OC 2% 6.009 18.54 41.1 24.6 32.60 3.02 1.7
Bottom Upper 1.90 1.80 17.853 10% 16.230 OC 2% 15.912 14.10 52.1 19.9 26.28 1.61 1.7
Bottom Lower 3.88 1.70 39.817 10% 36.197 OC 2% 35.487 16.98 44.3 22.7 31.45 1.62 1.6
3.85 1.72 28.267 10% 25.440 UG 10% 22.896 16.62 45.6 22.5 30.44 1.76 1.5
Total Measured 8.71 1.73 96.719 10% 87.047
4% 83.271 16.23 46.5 22.1 29.86 1.78 1.6
Indicated
Top Lower 1.69 1.87 23.104 15% 19.639 OC 2% 19.246
163.724
12.03 57.9 18.1 22.02 2.46 1.9
Middle 1.06 1.67 13.389 15% 11.381 OC 2% 11.153 18.53 41.0 24.6 32.68 2.92 1.7
Bottom Upper 1.81 1.77 27.804 15% 23.633 OC 2% 23.161 15.63 48.2 21.8 28.39 1.70 1.6
Bottom Lower 3.47 1.70 54.526 15% 46.347 OC 2% 45.421 17.05 44.2 22.9 31.44 1.45 1.5
3.59 1.77 84.632 15% 71.937 UG 10% 64.743 15.31 48.8 21.2 28.52 1.67 1.5
Total Indicated 8.03 1.76 203.456 15% 172.938
5% 163.724 15.66 48.0 21.6 28.82 1.79 1.5
Inferred
Top Lower 1.62 1.88 19.169 20% 15.335 OC 2% 15.029
58.671
11.89 58.4 18.1 21.54 2.52 1.9
Middle 1.02 1.68 8.081 20% 6.465 OC 2% 6.335 18.14 41.8 24.4 32.11 2.35 1.7
Bottom Upper 1.72 1.75 13.277 20% 10.622 OC 2% 10.409 16.29 46.5 22.5 29.45 1.95 1.6
Bottom Lower 3.60 1.71 19.407 20% 15.526 OC 2% 15.215 16.81 44.8 22.8 30.96 1.52 1.5
3.27 1.77 16.226 20% 12.980 UG 10% 11.682 14.57 50.6 20.8 27.17 1.63 1.4
Total Inferred 7.96 1.77 76.160 20% 60.928
4% 58.671 15.14 49.4 21.3 27.64 1.96 1.6
Total MR All 8.19 1.75 376.335 15% 320.913 5% 305.686 305.686 15.70 47.92 21.67 28.85 1.82 1.57

Coal of Africa Limited – Vele Colliery – Independent Competent Person’s Report Page 44 of 116
Mineral Right
Resource Category
Seam
Avg
wid
th (
m)
Co
al R
aw R
D
(t\m
3 )
Gro
ss t
on
ne
s
Insi
tu G
TIS
(Mt)
(ad
)
Ge
ol.
loss
es
(%)
Tota
l To
nn
es
in
situ
TTI
S (M
t)
(ad
)
Min
ing
Me
tho
d
Min
ing
Layo
ut
Loss
es
Min
eab
le
ton
ne
s in
sit
u
MTI
S (M
t) (
ad)
Ne
t A
ttri
bu
tab
le
to C
oA
L (M
TIS)
(Mt)
(ad
)
CV
(M
J\kg
)
Ash
%
Vo
l (%
)
Fixe
d C
arb
on
(%
)
Tota
l Su
lp (
%)
Inh
ere
nt
Mo
ist
(%)
Pro
spec
tin
g R
igh
t
Measured
Top Lower
2.841
Middle
Bottom Upper
Bottom Lower
3.76 1.66 3.507 10% 3.156 UG 10% 2.841 16.72 44.33 23.20 30.95 1.20 1.52
Total Measured 3.76 1.66 3.507 10% 3.156 10% 2.841 16.72 44.33 23.20 30.95 1.20 1.52
Indicated
Top Lower 1.05 1.96 1.016 15% 0.863 OC 2% 0.846
36.579
9.48 64.54 14.75 18.85 2.33 1.86
Middle 0.76 1.72 0.611 15% 0.519 OC 2% 0.509 18.01 42.46 22.96 32.66 3.74 1.92
Bottom Upper 1.66 1.78 2.222 15% 1.889 OC 2% 1.851 14.95 48.14 21.40 29.04 1.34 1.42
Bottom Lower 2.28 1.65 5.732 15% 4.872 OC 2% 4.775 18.95 39.36 24.25 35.01 1.57 1.38
3.98 1.73 37.384 15% 31.776 UG 10% 28.599 15.25 48.73 21.44 28.23 1.62 1.60
Total Indicated 5.75 1.73 46.964 15% 39.920 8% 36.579 15.60 47.82 21.66 28.95 1.64 1.57
Inferred
Top Lower 1.08 1.96 2.433 20% 1.947 OC 2% 1.908
16.483
10.12 62.01 16.70 19.66 3.84 1.63
Middle 0.76 1.73 1.349 20% 1.079 OC 2% 1.057 15.82 46.99 22.19 28.90 2.24 1.92
Bottom Upper 1.39 1.76 2.712 20% 2.170 OC 2% 2.126 15.79 46.54 22.76 29.17 1.45 1.53
Bottom Lower 2.65 1.68 2.744 20% 2.195 OC 2% 2.151 17.92 41.56 23.65 33.38 1.51 1.41
3.88 1.77 12.833 20% 10.266 UG 10% 9.240 14.36 50.82 20.76 26.86 1.94 1.56
Total Inferred 5.88 1.78 22.071 20% 17.657 7% 16.483 14.60 50.14 21.00 27.29 2.05 1.57
Total PR All 5.70 1.74 72.542 16% 60.733 8% 55.920 55.920 15.35 48.36 21.53 28.54 1.75 1.57
Vele Project 7.79 1.75 448.877 15% 381.646 5% 361.576 361.576 15.65 47.99 21.65 28.80 1.81 1.57

Coal of Africa Limited – Vele Colliery – Independent Competent Person’s Report Page 45 of 116
7.5 Coal Resource Reconciliation
The variation between the 2012 Coal Resource statements and the 2015 Coal Resource statements is the result of depletion that occurred
during the operational period of Vele Colliery.

Coal of Africa Limited – Vele Colliery – Independent Competent Person’s Report Page 46 of 116
Technical Studies The conversion of Coal Resources to Coal Reserves is based on technical studies, which is to the same level of a pre-feasibility study or
feasibility study. The studies must have investigated the modifying factors, which are required to convert a Coal Resource to a Coal Reserve.
These modifying factors can be divided in to cost drivers, income drivers, legislative constraints, environmental constraints and community
factors.
These modifying factors are normally addressed under the following headings
Geotechnical and Geohydrological Studies
Mine design and scheduling
Process Engineering
Infrastructure
Market analyses
Legislative and Regulatory requirements
Market analyses
Environmental
Social and Labour
Economic criteria
And is concluded in the financial model
CoAL has done various studies to different degrees of detail, but it is the opinion of VBKom that the studies are sufficient in detail to warrant
the conversion of Coal Resources to Coal Reserves.
Vele Colliery is an existing operation with Coal Reserves reported for an opencast mine plan and an underground mine plan. It is important to
note that the current business case is only considering a portion of the opencast reserve blocks (16 years LoM) for financial modelling. The
additional Coal Reserves outside the 16-year period does not significantly influence the NPV of the project. The current business case scenario
is referred to as the Plant Modification Project (PMP).
A high-level financial model was completed where the mining areas that were additional RoM reserve tonnes (excluded from the financial
model). The additional reserves were scheduled consecutively and the results indicated viability with long-term price forecasts. Due to the
planned mining rate, mining the additional reserve tonnages will be only after the Plant Modification Project’s 16 year LoM.
8.1 Geotechnical and Geohydrological Studies
8.1.1 Geotechnical Studies
Geopractica performed a geotechnical study in 2009 prior to the erection of the modular plant to assess the soil, for civil foundation
requirements and to comment on any possible geotechnical risks to construction around the plant area. Data from drill holes, core samples,
dynamic probing, and laboratory test work and trial pits was interpreted and the bedrock reported as geotechnically sound. The report
considered the site suitable for the proposed development. Further Geotechnical investigation was recommended for other surface
infrastructure to be constructed beyond the area investigated (e.g. access roads, power lines, water pipes, waste dumps).
Saxum Mining and Trading conducts routine bi-annual rock engineering assessments. This includes geotechnical high wall risks in the existing
opencast (Central pit) area. Specialist reports and risk assessments were also done during active mining to ensure slope angles were within
design parameters. A site-specific physical and performance risk rating form for easy tracking was developed and tracking in 2012 and 2015
rated Vele Central Pit on their own parameters as “Moderate” Physical Risk, and “Good” high wall performance risk.
Underground designs done by MRM Mining Services used the Salamon formula for mine design criteria, as the coal strength was not known at
the time. The influence of the overlaying rock strata and its ability to create a beam and width of the beam, as well as additional rock
mechanical support and cost required was not investigated in detail. The Salamon formula is normally a conservative estimation of the rock
strength and a more detailed study, closer to the commissioning of the underground areas can unlock additional resources.
8.1.2 Geohydrological Studies
WSM Leshika Consulting (Pty) Ltd. completed surface and Groundwater Geohydrological studies as part of the EIA in 2009. The results of the
investigations were used in the preparation of the EMPr and monitoring and managements systems were put in place. The water use
requirements of the DWS and DEA were met, with the amended Integrated Water Use License (IWUL) renewed for a further 20 years On 13
January 2016. The Environmental Authorisation Amendment was granted in January 2015.

Coal of Africa Limited – Vele Colliery – Independent Competent Person’s Report Page 47 of 116
The studies indicated insignificant risk of water inflow into the opencast areas, which is manageable, except in the event of exceptional
climatic conditions.
The influence of the Limpopo aquifer, which is on top of the underground reserves, on the underground mining is not currently seen as a risk
due to the presence of an aquitard in the stratigraphic sequences following the coal zone.
8.2 Mine Design and Schedule
There are two types of mine designs for the Vele Colliery. The first is the opencast (o/c) mines on which the Plant Modification Project’s
financial modelling is based. VBKom completed this design and associated schedule. The second design is the underground mine. MRM Runge
did the design and VBKom reviewed the design parameters.
The opencast mine has a detailed schedule for the first 16 years (mineable reserves until the west opencast will be accessed), where after it is
a straight-line production approach.
Venmyn Rand has also audited the underground reserves in 2012 who found the design criteria robust and acceptable. Here the underground
design will be summarised, but the focus will be more on the modifying factors that influences the opencast reserves that forms the basis of
the financial model.
The PMP opencast mining area as identified in Figure 8.2.1 targets high value areas in the opencast Central and opencast North mining blocks.
Figure 8.2.1: Different mining blocks – the PMP mining area is indicated
8.2.1 Cut-offs applied
The conversion of Coal Resources to Coal Reserves includes the application of cut-offs. The cut-offs can be geological, mining related or related
to the processing plant. Here only the mining cut-offs will be discussed.
Mining related cut-offs are as follows for the underground mine at Vele Colliery:
Bord and pillar dimensions (65% coal extraction)
Minimum seam thickness of 1.4m and a maximum seam thickness of 4.5m

Coal of Africa Limited – Vele Colliery – Independent Competent Person’s Report Page 48 of 116
Cut-offs related to the opencast mining:
Mining layout
No other cut-offs were applied to the opencast mine areas. Mining layouts were constrained by major faults and the sub-outcrop of the
resource.
8.2.2 Mining method
After various trade-of studies between only opencast mining, combination of opencast and underground mining and underground mining the
best option was the combination of the two methods. The opencast mining was seen as a concern in such an environmentally sensitive area,
but was opted for due to the economics of the opencast reserves.
The underground mining method and design criteria is summarised as follows:
Underground mining will target the Bottom Lower Seam only, using a bord and pillar mining pattern. Underground mining has only
been considered suitable in those areas where the depth of the roof of the Lower Seam generally exceeds 60m in depth due to the
weak coal strength and poor overburden stability. The bord and pillar mining layout should be achieving a relatively high extraction
rate of approximately 65% by virtue of the low seam height to depth ratio.
For underground access, a decline is to be sunken on the border with the opencast Coal Reserves. Staff and material will be
transported by trackless vehicles (tractor and trailer or light delivery vehicles), while coal is transported out of the mine on
conveyors. Ventilation will be by means of up-cast ventilation shafts, with intake air provided through the decline shafts.
The underground development will continue in a northerly direction and have main developments mining east and west. The East
underground mining area will need to negotiate a downthrown fault to access the Coal Reserves in the central graben area.
For the underground mining, five continuous miner sections will be required. Each section will be equipped with a high seam
continuous miner, four coal haulers, two roof bolters, a feeder breaker and an LHD. Five continuous miner sections with shuttle cars
are planned to meet the production requirements, utilising five Joy 12 HM 31 AAA high seam production sections at an average of
75,000tpm of RoM coal. Pillars will be designed using the Salamon and Munro formula.
The opencast mine will be accessed through two separate boxcuts, one in the central pit and one in the northern pit. The opencast mining
process as designed will not significantly differ change after the plant modification process is implemented. The process can be described as
follows:
Base case after Plant Modification Project is 2.6Mtpa of RoM at an average strip ratio of 3.6 over a period of 16 years
The Top Lower, Middle, Bottom Upper and Bottom Lower seams will be extracted
Mining is based on a truck and shovel operation (contract mining) with the following equipment (as used for the boxcut):
o A 9350 Liebherr excavator
o A 974 Liebherr excavator (or CAT 988 loader)
o Four CAT 785 trucks ad four CAT 773 trucks
o A watercart
o A D10 dozer
o A grader
The opencast strip and block design was based on the following criteria:
o Block lengths of 100m
o Block widths of 50m
o Strip lengths are variable and based on the geometry of the design
A total of 1m of topsoil has to be stripped and stockpiled separately
Overburden is blasted using electronic detonation to minimise air blast
To maintain the required production rates, inclusive of ramps and free faces, a stripping ratio of 3.6 BCM is required per tonne of
RoM over the current planned 16 years of operations in the Central Pit
The overburden will be truck around the pit to backfill the void over the discard from the plant as part of the roll over rehabilitation
The coal seams are free dig by backhoe excavators
The production profile for the first 16 years from the Central pit is presented in Figure 8.2.2.

Coal of Africa Limited – Vele Colliery – Independent Competent Person’s Report Page 49 of 116
Figure 8.2.2: Vele Plant Modification Project opencast RoM and waste mining profile
The schedule for the first 16 years has parameters constraints build in to open strips sufficiently to cater for drilling, blasting, loading and in-pit
stockpiling, which translates into additional pre-strip mining in the schedule.
Since the mine schedule Vele Colliery depleted 417kt RoM from the opencast before the operations were halted in 2013. Figure 8.2.3 depicts
the current pit (As seen on the site visit of 26 November 2015) and indicates the faces open and rollover rehabilitation with carbonaceous
discard up to the original level of the coal zone.
Figure 8.2.3: Existing opencast with open benches indicated by red lines, and carbonaceous backfilling in foreground
The North Pit boxcut plan has a small footprint, which will influence extraction and start-up from the mining area. Overlap exists between
mining in the Central and Northern Pit. The schedule is based on annual tonnages, and the stockpile capacity at the plant and in-pit stockpiles
(exposed coal) will assist in mitigating the influence of the ramp down of the Central Pit and the start-up of the Northern Pit on the planned
annual production.
0
500
1 000
1 500
2 000
2 500
3 000
0
2
4
6
8
10
12
1 2 3 4 5 6 7 8 9 10 11 12 13 14 15 16 17
Ro
M/P
lan
t fe
ed
(kt
pa)
Was
te (
m³/
ann
um
) M
illio
ns
Years
Vele - Plant Modification Project- Schedule in Years
ROM Waste Plant Feed

Coal of Africa Limited – Vele Colliery – Independent Competent Person’s Report Page 50 of 116
8.2.3 Optimisation
8.2.3.1 Major Assumptions and Coal Resource model used for Optimisation
The resource model used for identifying the target mining area for the PMP schedule was constrained to the Central and North pit, due to the
existing box-cut and mining operation, infrastructure, haul roads, and proximity to the plant. This area contained primarily measured resource
and 25mx25m blocks were used to rank areas concerning strip ratio and yield combined.
A high level evaluation in a 25 x25m grid using contractor costing quotes, averaged fixed costs and owner costs versus producing either SSCC
(10% Ash) with either a 23.4% Ash (5500kCal) or a 26.75% Ash (5200kCal) product was traded off in July 2013 by VBKom using the same input
parameters as in the financial model.
The evaluation indicated areas where higher profit can be achieved, and were scheduled to form the basis of the Plant Modification Project
LoM. The evaluation is not a full optimisation study, but a long term planning schedule for an operational opencast mine on care and
maintenance. Coal Resource with relative lower revenue values were excluded from the Plant Modification Project LoM schedule.
The Mineable Resource Tonnes in-Situ (MTIS) resource which is not in the initial target area of the Plant Modification Project LoM is included
in the reserve statement as “additional RoM”, as it is still part of previous studies and deemed viable to mine when prices for coking- and
thermal coal increases according to forecasted averages. These “additional RoM” tonnages (in the U/G and O/C mining blocks) were evaluated
with a high-level complete LoM financial evaluation subsequent to the Plant Modification Project.
8.2.4 Modifying Factors
8.2.4.1 Mining Dilution Factors
The Practical yield includes organic plant efficiencies and yield reduction due to dilution for the different streams to be produced.
8.2.4.2 Mining recovery factors used (DCF mining layout only)
Additional Geological losses of 5% was subtracted from resource tonnes in the Plant Modification Project opencast layout plan, as coal
affected by small dykes and faults has been identified and removed from the plan, as well as possible oxidised coal mining strips near the sub-
outcrop.
A mining recovery of 92% was used in the Phase 1 opencast plan, as an existing opencast exists, with proven extraction. The high recovery is
also possible due to free digging of the coal using a backhoe excavator, enabling lower losses and dilution from blasting.
The in situ Coal to RoM calculation for mining blocks inside the optimisation layout of the PMP schedule is presented in Table 8.2.1.
Table 8.2.1: Calculation of RoM in designed mining blocks of DCF model:
Description: Factor Value Unit
In Situ Tonnes (> 0.5m seam width): 100 t
After geological losses: × 0.95 95 t
After mining losses: × 0.92 87.4 t
RoM:
91.8 t
Primary product:
9.8 t
Primary Product effective yield: 10.7 %
Secondary Product:
30.3 T
Secondary Product effective yield:
33 %
8.2.4.3 Minimum mining widths used
A minimum mining width of 0.5m of coal seam was used, as multiple layers of seam exist, and blasting of waste and selective loading methods,
enabled the selectivity in seam mining. The PMP LoM schedule accommodated multiple active coaling seams, requiring more active strips, and
the extra waste stripping required to achieve this is included in the mining plan.
Mining strips of varying length were divided into blocks with a width of 50m and length varying between 50-100m. Blasting blocks were
identified based on seam contacts, and no SMU or bench height or bench elevation was traded off.

Coal of Africa Limited – Vele Colliery – Independent Competent Person’s Report Page 51 of 116
The underground mine tonnages that was reported by CoAL applied a minimum 1.4m mining height and 4.5m maximum mining height for
underground mining of Bottom Lower coal seam.
8.2.5 Infrastructure requirements
Vele Colliery is an existing opencast operation, currently under care and maintenance. Coal is delivered to customers through the existing
infrastructure, available in Musina, which is able to support the operation.
The nearest town is Musina, which is the seat of the local Municipality with a history of mining activity and there are active mines in the
region. Services include schools, rail linkage, a hospital, wide tar roads and electricity from the national grid.
8.2.5.1 Accommodation:
No accommodation is provided on site. Accommodation for employees is currently provided at the CoAL owned Dongola Lodge, which also
serves as the administrative centre for the Vele Colliery. It is accepted that employees will require their own accommodation in Musina.
8.2.5.2 Mining and plant Equipment:
Vele Colliery has an existing opencast mine, a laboratory, contractors yard, workshops, change houses, processing plant and RoM stockpile,
transportation infrastructure, a wash bay, tyres storage yard, various stores and pollution control dams, with fencing and security in place.
8.2.5.3 Contractor’s yard:
The contractor’s yard was constructed by MCC, which included a tyre, oil and general servicing yards, bunded, and with dirty water drains.
Figure 8.2.4 Power line has bene extended to the contractor’s yard. Existing plant in background
8.2.5.4 Transport of Coal:
Coal is transported from the mine to an existing and upgraded rail siding in Musina approximately 50km from the colliery by tar road. CoAL has
upgraded a bypass road to the siding whereby the route does not pass through Musina town anymore. A concrete base has also been casted at
the siding with pollution control drains.
Figure 8.2.5: Rail siding stockpile area in Musina with concrete base

Coal of Africa Limited – Vele Colliery – Independent Competent Person’s Report Page 52 of 116
Hauling of coal product to the siding is done by a contractor using road link trucks and placed on the siding according to coal quality. Front End
loader performs loading of train wagons. The siding has sufficient capacity. Additional capacity is available due to the closure of Tshikondeni
Coal Mine who also utilised the siding.
A rail transport option from the colliery has been investigated should the colliery be expanded beyond the PMP project product capacity. The
construction of a rail link and spurs to the colliery will be a second phase of plant modifications and will be determined by quantities moved,
which is linked to prevailing market conditions.
CoAL has secured 3Mtpa allocation through the Matola terminal in Maputo, Mozambique. CoAL has secured the option of taking up a hundred
per cent of the increased capacity due to the planned expansion at the port.
Further infrastructure, except for the Plant Modification project, is only planned after the Plant Modification Project, before starting the
underground mining, or other opencast mining areas.
It is noted that almost all the main infrastructure required for the initial Phase 1 of the Vele Colliery, as outlined in the surface layout plan, has
been constructed. The following are however scheduled and expected to be constructed in the next phases; the sewage plant facility, the
‘permanent’ mine access road, the above ground bulk storage facility, ventilation shafts, an extension of the haul roads and the construction of
water containment structures.
Current ongoing infrastructure work done on the mining side includes the fixing of internal berms used on haul roads, which segregates
production and support equipment. The repairs on berms will include an erosion resistant polymer, thus reducing maintenance in the future.
Weighbridge and road access to the colliery has been built. The access road will still be moved, as per the amended IWUL application.
An existing contract on all CoAL’s coal product trucking is in place with MAC Transco and the contract includes the possible enlargement of the
siding at Musina by Mac Transco, against a transport agreement for future coal. This enlargement also includes the construction of concrete
pads and drainage channels to improve on the environmental footprint of the existing Transnet siding used by CoAL and previously Exxaro’s
Tshikondeni Coal Mine.
8.3 Coal Processing
The plant was put on care and maintenance to allow for the plant modification. The objective of the plant modification is to create capability
to produce multiple products, reduce the amount of fines generated through materials crushing and handling, improving product yield by
introducing a higher efficiency reflux classifier to complement the current spiral concentrators and reducing operational costs by improving
materials handling systems in the plant. The plant also produced a 10% ash semi-soft coking coal on a test basis to produce a sample coking
tests at ArcelorMittal South Africa’s Newcastle steel plant.
Previously, coal produced at Vele Colliery coal sold to customers was a blend of Vele and Mooiplaats coal at the Matola harbour.
8.3.1 Process design
8.3.1.1 Metallurgical Processing – Existing plant
The existing plant design was based on a production rate of 2.7Mtpa RoM, producing a single product (semi-soft coking coal). Coal
beneficiation through the existing plant started in February 2012 and a thermal export product (18% Ash) was produced at an average yield of
32% (February – September 2012), using temporary equipment in certain sections, which resulted in sub-optimal design (performance) in
terms of RoM handling and throughput, product recovery, slurry management and operational costs.
Vele utilised a contractor, Minopex (Pty) Ltd (Minopex), to operate the CoAL owned plant. The current plant consists of the following main
sections:
Temporary crushing and screening plant;
de-stoning plant (modular);
secondary washing plant (modular);
spiral plant (modular); and
product and discard stockpiles
general plant services and
a slurry pond
RoM consists of material supplied from the opencast mining activities with a top size of 300mm. The plant was designed for a RoM feed of
500tph into the crushing and screening plant and is depicted in Figure 8.3.1 and Figure 8.3.2 below. The temporary crushing and screening
plant in use could only produce a maximum of 300tph RoM due to inefficient materials handling around it.
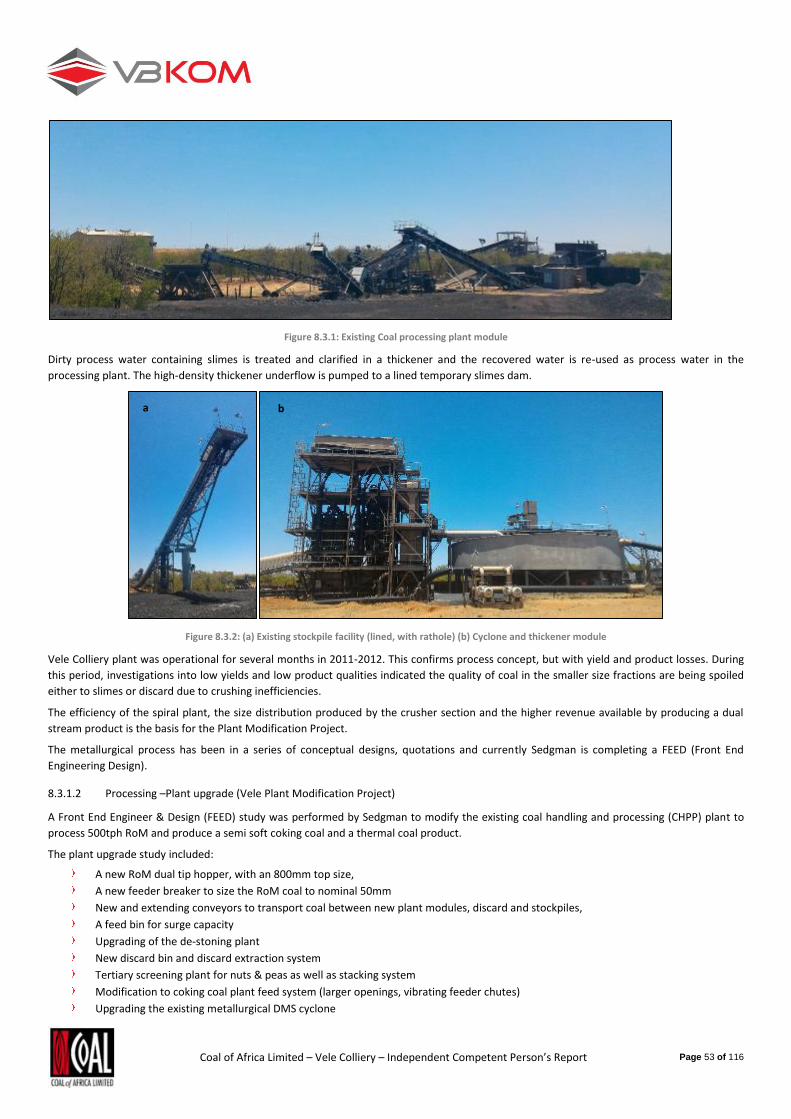
Coal of Africa Limited – Vele Colliery – Independent Competent Person’s Report Page 53 of 116
Figure 8.3.1: Existing Coal processing plant module
Dirty process water containing slimes is treated and clarified in a thickener and the recovered water is re-used as process water in the
processing plant. The high-density thickener underflow is pumped to a lined temporary slimes dam.
Figure 8.3.2: (a) Existing stockpile facility (lined, with rathole) (b) Cyclone and thickener module
Vele Colliery plant was operational for several months in 2011-2012. This confirms process concept, but with yield and product losses. During
this period, investigations into low yields and low product qualities indicated the quality of coal in the smaller size fractions are being spoiled
either to slimes or discard due to crushing inefficiencies.
The efficiency of the spiral plant, the size distribution produced by the crusher section and the higher revenue available by producing a dual
stream product is the basis for the Plant Modification Project.
The metallurgical process has been in a series of conceptual designs, quotations and currently Sedgman is completing a FEED (Front End
Engineering Design).
8.3.1.2 Processing –Plant upgrade (Vele Plant Modification Project)
A Front End Engineer & Design (FEED) study was performed by Sedgman to modify the existing coal handling and processing (CHPP) plant to
process 500tph RoM and produce a semi soft coking coal and a thermal coal product.
The plant upgrade study included:
A new RoM dual tip hopper, with an 800mm top size,
A new feeder breaker to size the RoM coal to nominal 50mm
New and extending conveyors to transport coal between new plant modules, discard and stockpiles,
A feed bin for surge capacity
Upgrading of the de-stoning plant
New discard bin and discard extraction system
Tertiary screening plant for nuts & peas as well as stacking system
Modification to coking coal plant feed system (larger openings, vibrating feeder chutes)
Upgrading the existing metallurgical DMS cyclone
a b

Coal of Africa Limited – Vele Colliery – Independent Competent Person’s Report Page 54 of 116
New thermal coal stockpile facilities
The upgrade for the fines beneficiation by incorporation of reflux classifier and flotation circuit, and
Dewatering using a high frequency screen for thermal coal and screen bowl centrifuge for coking coal.
Dust and fire suppressing systems as well as integrated control and communication system.
The nominal capital cost estimate accuracy was considered at ±10%, based on the methods and basis of the capital cost estimate. Qualification
of the estimate assumes the adequate capacity of electrical supply and reticulation, and an agreed exclusion list regarding environmental
issues and existing plant.
The general arrangement process flow diagram for the planned upgrade is presented in Figure 8.3.3.

Coal of Africa Limited – Vele Colliery – Independent Competent Person’s Report Page 55 of 116
Figure 8.3.3 Process flow sheet for the Plant Modification Project (Source: Sedgman FEED study)

Coal of Africa Limited – Vele Colliery – Independent Competent Person’s Report Page 56 of 116
8.4 Project Infrastructure
Infrastructure required for Phase 1 of Vele Colliery is completed, except for structures that still required approval under the IWUL application
(granted in January 2016) and the beneficiation plant upgrade (Vele Plant Modification Project).
The following capital infrastructure is scheduled and expected to be constructed as the basis of the Plant Modification Project:
The upgrading of the plant to produce two product streams,
construction of sewage system and bulk fuel storage
Construction of the remaining 5km of power line to Pontdrift substation
River diversion and pollution control dam construction
The Vele infrastructure and lease boundaries are indicated in Figure 8.4.1.
Figure 8.4.1: Vele infrastructure and lease boundaries (Venmyn, 2012)
8.4.1.1 Water
Water to Vele Colliery is provided by pumping from the Limpopo River and abstraction in from the eight boreholes in the Limpopo aquifer is
sufficient for the current operations and below the IWUL approved 6.7Ml per day.
The Company submitted the succesful application in August 2014 to amend and renew Vele’ previous IWUL.. The Vele Colliery IWUL was
awarded on 13 January 2016 (which is valid to 2036). During the second half of 2015, the Company commenced a process to obtain approval
relating to non-perennial stream diversion. This decision is anticipated in H2 2016.The Company delayed the plant modification construction
pending the ammendment of the IWUL as well as an assessment of forecast global coal prices.

Coal of Africa Limited – Vele Colliery – Independent Competent Person’s Report Page 57 of 116
Figure 8.4.2 Clean water reservoir and dust suppressant storage
8.4.1.2 Electricity
Two diesel generators supply electrical power for the existing plant. There is a 132kV power line south of the property, there is approved
feasibility, and budget quotes from ESKOM in place for the connection. Vele Colliery applied for a 10 MVA connection to the Pontdrift
substation via a 22kV overhead line to the mine consumer substation. The overhead line construction has been partially completed and
finalisation of servitudes along the remainder of the route is in progress.
Figure 8.4.3: 22kV substation, transformer and switchgear installation (Left Hand Side) and existing main diesel generator house (RHS)
The 22kV line to connect at Pontdrift substation has been built 78% of the way (18km of 23km) with the substation and transformers on site
already installed with bunt walls and fences as shown in Figure 8.4.3. The power line is also erected up to the contractor’s camp. The poles and
cabling required to complete the line is on site at Vele Colliery. The existing ESKOM servitude will be used to construct the last portion of the
line. Only a connection fee (paid to ESKOM) is still outstanding, and will only be done once the PMP is commissioned.
The Vele Colliery Project Phase 2 & 3 will consist of opencast and underground mining operations, associated workshops and stores. Other
facilities required only at the start of these Phases on the mine site will include the following:
Ventilation shafts
Additional Topsoil and overburden stockpiles
Rapid load-out terminal with the proposed railway loop.
Additional haul roads and service roads

Coal of Africa Limited – Vele Colliery – Independent Competent Person’s Report Page 58 of 116
8.5 Market Studies and Contracts
8.5.1 Thermal Coal
8.5.1.1 Global Demand
According the World Energy Outlook for 2015 (published by the International Energy Association) growth in coal supply will be driven primarily
by India. Figure 8.5.1 indicates the demand by world economies for the next 25 years.
Figure 8.5.1: Demand for coal as an energy source for different world regions for the next 25 year (World Energy Outlook, 2015(www.iea.org))
The energy outlook also indicates that there will be a growth in renewable energy source over the next 25 years but coal will still play an
important role with growth potential. Figure 8.5.2 indicates the 2014 sources of energy generation with an estimated growth or shrinkage of
each source up to 2040.
Figure 8.5.2: Expected growth or decline of electricity generation sources from 2014 to 2040 (World Energy Outlook, 2015 (www.iea.org))
Vele Colliery will be producing a 5500kcal (NAR) thermal product that can easily be placed in the Indian market through the Matola Coal
terminal in Maputo, Mozambique.

Coal of Africa Limited – Vele Colliery – Independent Competent Person’s Report Page 59 of 116
8.5.2 Domestic Demand
The South African domestic market is dominated by ESKOM, a State owned Company, which is currently the sole electricy generation
consumer of coal. The current energy road map for South Africa indicates that there will be a move to renewable energy sources, nuclear
power and gas. This said coal-burning power stations would still supply the base load capacity of 45 000MW in the near future. Figure 8.5.3
provides the electricity generation graph per source for the next 35 years.
Figure 8.5.3: Proposed sources for electricity generation in South Africa. The base load of 45 000MW is still made up of coal
Figure 8.5.4 provides the coal requirement for the next 35 years to sustain the base load. From the graph it can be seen that the new Madupi
and Kusile power stations only replaces capacity of power stations that will be decommissioned over time. Most of the power stations
indicated in the graph is located in the Witbank Coalfield in Mpumalanga were the coal resource are being depleted. The scenarios, as
illustrated, indicates additional source of thermal coal will have to be acquired by ESKOM to sustain their electricity generation capacity.

Coal of Africa Limited – Vele Colliery – Independent Competent Person’s Report Page 60 of 116
Figure 8.5.4: Coal requirement to ensure electricity generation at Eskom’s power stations
Vele Colliery has submitted samples to ESKOM for combustion test work to determine the application of the Vele coal to power stations for
electricity generation. The conclusion of the study is summarised as follows:
The Vele Colliery coal reacts similarly to Seam 5 coal (Witbank Coalfield) and the upper benches of the Waterberg Coalfields
Is categorised by low inherent moisture, high CV’s, good combustion, low abrasion index, low slagging propensity and relatively low
SO2 emissions
8.5.3 Coking Coal
Metalreal (2010) forecasted that the economies that have been traditionally large consumers of coking coal (Japan, the European Union (EU)
and Korea) including will continue to be so and is expected to grow, as will India and China’s imports.
Steel production in China year-on-year percentage growth was negative in 2010 but other producers made up the shortfall of the Chinese
production (Worldsteel, 2011). The subdued market conditions is expected to change according to analysts with price increases indicated by
various financial institutions in beyond 2015.
Material was sent to Arcellor Mittal’s New Castle plant to test for viability of the Vele Colliery SSCC in South African blast furnaces. A
memorandum of undertaking with Arcellor Mittal was signed, although no take off agreement was signed.
8.5.4 Exchange rates
An average forecasted ZAR/US$ exchange rate and long term view was used in the financial model based on September 2015 forecasts by
Morgan Stanley, RBC, Macquarie, Merrills, UBS and Citi.
Table 8.5.1 Mean forecasted exchange rate from reputable financial institutions
ZAR /US$ Exchange: 2016 2017 2018 2019 LT
Consensus 13.59 13.52 13.43 13.42 13.82
8.5.5 Future prices
International coal price forecasts indicate that various financial institutions (Bloomberg, Investec, UBS, Morgan Stanley, Goldman Sachs,
Merrills, RBC, Macquarie and Credit Suisse) in September 2015 forecast different coal prices have a strong relationship with each other and
price increases.

Coal of Africa Limited – Vele Colliery – Independent Competent Person’s Report Page 61 of 116
Table 8.5.2 Coke, Coal and Carbon forecasts mean values from reputable sources
Consensus Currrency: 2016 2017 2018 2019 LT Growth Geometric μ Growth Arithmetic μ
Hard coking coal US$/tonne 92 99 110 120 132 4.6% 5.1%
Semi soft coking US$/tonne 69 75 81 86 91 3.2% 3.4%
Low Volatile PCI US$/tonne 73 80 89 96 100 4.4% 4.8%
Thermal coal US$/tonne 60 62 66 71 73 2.4% 2.5%

Coal of Africa Limited – Vele Colliery – Independent Competent Person’s Report Page 62 of 116
8.6 Legal and permitting
8.6.1 Mineral and Petroleum Resources Development Act, 28 of 2008 (MPRDA)
Vele Colliery was granted its New Order Mining Right (NOMR) on 19 March 2010, on the following farms:
Overvlakte 125 MS (Portions 3, 4, 5, 6, 13 and Remaining Extent)
Bergen Op Zoom 124 MS
Semple 145 MS
Voorspoed 836 MS
Vele Colliery is in possession of an approved Environmental Management Programme (EMPr) in terms of Section 39 of the MPRDA.
8.6.2 National Environmental Management Act, 109 of 1998 (NEMA)
In July and October 2011, Vele Colliery was granted Section 24G Environmental Authorisations, in terms of the NEMA.
In 2014 the company applied for an amendment to the Environmental Authorisation, which was approved as granted on 16 January 2015, and
subsequently appealed. On 19 November 2015, the Minister dismissed the appeal lodged against the Vele Colliery’s amended Environmental
Authorisation.
8.6.3 National Water Act, 36 of 1998 (NWA)
In terms of the NWA, On 13 Jan 2015 the water use licence was renewed (for a further 20 years) and amended.
Furthermore, the IWUL has been amended in line with the requirements for the Plant Modification Project (PMP) at the Colliery. During H2
2015, the Company commenced a process to obtain approval relating to a non-perennial stream diversion. This decision is anticipated in H2
2016. Once this regulatory approval in respect of the Colliery has been received, the final decision to proceed with the PMP will be placed
before the
board, which will include an assessment of forecast global coal prices.
8.6.4 National Environmental Management Waste Act, 59 of 2008 (NEMWA)
The DEA has confirmed that no NEMWA authorisations are required for Vele Colliery.
All licences and permits are in place at Vele Colliery, and the colliery continues to meet all its regulatory obligations while during operations
and under the current care and maintenance scenario, while the upgrade to the plant via the PMP is being planned.
8.7 Environmental Management
Notwithstanding that Vele Colliery was placed on Care & Maintenance in October 2015, the colliery continues to meet all its regulatory
obligations as it would under operational status. As such, continuous assessments, inspections and monitoring and site visits continue as
required. (Refer to Table 8.7.1).
The following continuous studies, assessments, inspections and monitoring meetings are currently conducted/undertaken by
specialists/appointed teams and reported to the relevant licencing and permitting authorities, where required:

Coal of Africa Limited – Vele Colliery – Independent Competent Person’s Report Page 63 of 116
Table 8.7.1: Continuous studies currently conducted
Monitoring/Assessment/
Inspection/Meeting
Conducted by Notes/Comments Frequency
Surface Water Tests Sampling conducted by CoAL – in house
Analysis conducted by independent lab
14 sites, full chemical analysis Monthly
Ground Water Tests GPT – Geo-Pollution Technology Monitoring boreholes around mine, as
well as Limpopo river
Quarterly
Geochemistry database and
groundwater model review
GPT Review and update of the geochemical
model and geochemistry database
Five-yearly
Ecotoxicology and Bio-
monitoring
SAS – Specialist Aquatic Solutions Trace elements analysed as well Bi-annual
Geotechnical SAXUM Mining & Trading Highwall & failure risk analysis Bi-Annual
Dust Sampling conducted by CoAL – in house
Analysis conducted by SGS
Sensors around site Monthly
PM10 Monitoring Rayten Engineering Air quality Monthly
Heritage Monitoring Vhufa Hashu Heritage resources Monthly
EMP Performance
Assessment
ENVASS Assess compliance to the EMPr Annually
Closure Cost Assessment ENVASS Financial Closure Cost Liability Annually
External IWUL Audit ENVASS Assess compliance to the IWUL Two-yearly
Legal Compliance Audit L. Uys Consultants Assess compliance to applicable legislation Annually
Departments of Water &
Sanitation
DWS team Site Visit, Inspection Quarterly
DEA – Environmental
Authorisation continual
monitoring
Independent Environmental Control Officer – Ecko Green Site inspection, compliance monitoring in
respect of the EA, EMPr and IWUL
Daily, Quarterly
Reports submitted
to the DEA
Water Monitoring
Committee
Depts. DWS, DAFF, Municipality, Save Mapungubwe
Coalition (WWF, Birdlife SA, Wilddog action team, et al),
Municipalities, Farming Community Rep and other
Interested and Affected Parties (I&APS)
Monitoring Committee to assess
compliance to the IWUL and water-related
requirements of the EMPr
Quarterly
Environment Monitoring
Committee (EMC)
Depts. DEA, DWS, DAFF, Local Municipalities, South
African Heritage Resources Agency (SAHRA), Limpopo
Heritage Resources Agency (LIHRA) Save Mapungubwe
Coalition, Farming Community Rep and other IAP’s
Monitoring Committee to assess
compliance to the conditions of the
Environmental Authorisation and EMPr
Quarterly
Heritage and Biodiversity
Subcommittee
Depts. DEA, DAFF, Local Municipalities, SAHRA, LIHRA,
Save Mapungubwe Coalition, Farming Community Rep
and other IAP’s
Monitoring Committee (subcommittee to
the EMC) to assess compliance to the
conditions of the Environmental
Authorisation and EMPr as these relate to
biodiversity and heritage resources
Quarterly
Environmental Management
System (EMS) Audits
L. Uys Consultants Auditing the Colliery’s EMS to assess
compliance to the requirements of the ISO
14001 EMS
Quarterly
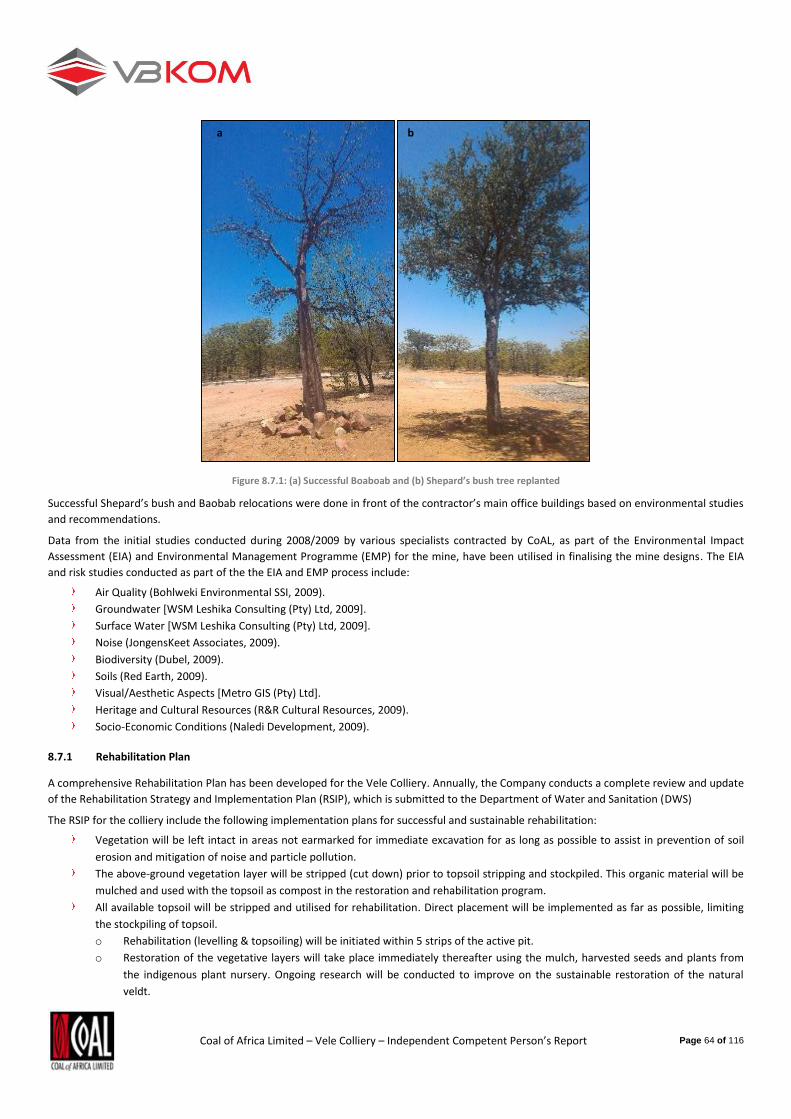
Coal of Africa Limited – Vele Colliery – Independent Competent Person’s Report Page 64 of 116
Figure 8.7.1: (a) Successful Boaboab and (b) Shepard’s bush tree replanted
Successful Shepard’s bush and Baobab relocations were done in front of the contractor’s main office buildings based on environmental studies
and recommendations.
Data from the initial studies conducted during 2008/2009 by various specialists contracted by CoAL, as part of the Environmental Impact
Assessment (EIA) and Environmental Management Programme (EMP) for the mine, have been utilised in finalising the mine designs. The EIA
and risk studies conducted as part of the the EIA and EMP process include:
Air Quality (Bohlweki Environmental SSI, 2009).
Groundwater [WSM Leshika Consulting (Pty) Ltd, 2009].
Surface Water [WSM Leshika Consulting (Pty) Ltd, 2009].
Noise (JongensKeet Associates, 2009).
Biodiversity (Dubel, 2009).
Soils (Red Earth, 2009).
Visual/Aesthetic Aspects [Metro GIS (Pty) Ltd].
Heritage and Cultural Resources (R&R Cultural Resources, 2009).
Socio-Economic Conditions (Naledi Development, 2009).
8.7.1 Rehabilitation Plan
A comprehensive Rehabilitation Plan has been developed for the Vele Colliery. Annually, the Company conducts a complete review and update
of the Rehabilitation Strategy and Implementation Plan (RSIP), which is submitted to the Department of Water and Sanitation (DWS)
The RSIP for the colliery include the following implementation plans for successful and sustainable rehabilitation:
Vegetation will be left intact in areas not earmarked for immediate excavation for as long as possible to assist in prevention of soil
erosion and mitigation of noise and particle pollution.
The above-ground vegetation layer will be stripped (cut down) prior to topsoil stripping and stockpiled. This organic material will be
mulched and used with the topsoil as compost in the restoration and rehabilitation program.
All available topsoil will be stripped and utilised for rehabilitation. Direct placement will be implemented as far as possible, limiting
the stockpiling of topsoil.
o Rehabilitation (levelling & topsoiling) will be initiated within 5 strips of the active pit.
o Restoration of the vegetative layers will take place immediately thereafter using the mulch, harvested seeds and plants from
the indigenous plant nursery. Ongoing research will be conducted to improve on the sustainable restoration of the natural
veldt.
a
b

Coal of Africa Limited – Vele Colliery – Independent Competent Person’s Report Page 65 of 116
o Soil analysis to provide corrective fertilisation regimes will be an ongoing procedure to facilitate vigorous plant growth.
o Until the herbaceous (shorter period) and woody (longer period) vegetation layer is established, artificial watering of reclaimed
areas will be applied.
o Erosion control measures will be implemented where necessary.
o The final profile will be free-draining. Ponding will be prevented as far as practically possible.
o The end land use will reflect the initial land capability as far as possible. As a minimum, the end land use should be grazing
(topsoil depth = 0.25m).
o All rehabilitation programmes will be properly monitored and documented for future referencing on the impacts, restoration
and rehabilitation programs within semi-arid areas.
The implementation of the rehabilitation plan is coordinated by a team of professionals including environmental, engineering and geology
department, and is supervised by the on-site Environmental Officer. Furthermore, external specialist skills are employed as required.
Additional mitigation measures for rehabilitation, according to the EMPr include:
The entire designated infrastructure and mining areas will be fenced off to keep animals out of the area and to prevent theft /
poaching.
Management agreement will be initiated with adjacent landowners to create animal corridors.
A comprehensive environmental monitoring programme will be implemented prior to commencement of site activities.
Environmental educational and awareness programmes will be developed and implemented as part of the employee and contractor
induction programme. Similar programmes will be initiated within surrounding communities.
8.7.2 Environmental Monitoring Committees
The Water Monitoring Committee (WMC) and Environmental Monitoring Committee (EMC) was established as oversight mechanisms in terms
of Vele Colliery’s IWUL and EA respectively. The WMC and EMC has the mandate to monitor Vele’s compliance in respect of its IWUL, EA and
EMPr respectively The Vele Colliery (CoAL and all affiliates) continue to participate in both committees which meets on a quarterly basis with
annual visits to the Vele Colliery as well.
In addition to these committees, Vele Colliery has established a Heritage and Biodiversity Subcommittee, reporting into the EMC and
mandated to monitor compliance to biodiversity and heritage resources management and preservation.
The membership of the WMC and EMC includes a combination of the following, as required by the IWUL and EA:
Department of Environmental Affairs
Department of Water and Sanitation (National and Regional)
Department of Agriculture, Forestry and Fisheries
Department of Mineral Resources
Limpopo Department of Economic Development, Environment and Tourism (LEDET)
Musina Local Municipality
Vhembe District Municipality
Capricorn District Municipality
Blouberg Local Municipality
South African National Parks (SANParks)
South African Heritage Resources Agency (SAHRA)
Limpopo Heritage Resources Agency (LIHRA)
Mapungubwe National Park and World Heritage Site
Weipi Farmers’ Association
Save Mapungubwe Coalition
Coal of Africa Limited (CoAL) and Limpopo Coal Company
8.7.3 Biodiversity Offset Agreement
The inscription of Mapungubwe World Heritage Site (WHS) on the World Heritage List in March 2003 recognised the importance of the rich
culture history of the Mapungubwe Cultural Landscape (MCL). However, the area in which the WHS is situation is also geologically rich in
mineral resources such as coal and diamonds, which for a developing nation like South Africa, stimulates and enables economic growth,
poverty alleviation and social upliftment. There was a recognition of the need to balance the extraordinary potential of the mining
development to drive socio-economic change, and the potential impact of mining practices on the Outstanding Universal Value (OUV) on the
Mapungubwe WHS.

Coal of Africa Limited – Vele Colliery – Independent Competent Person’s Report Page 66 of 116
In September 2011, CoAL signed a Memorandum of Agreement (MoA) with the Department of Environmental Affairs (DEA) and South African
National Parks (SANParks), which commits the parties to maintain the integrity of the Mapungubwe WHS and Cultural Landscape, ensuring
that the potential negative impacts of development are avoided, minimised or remedied in pursuit of sustainable development .
In 2012, the DEA and CoAL commissioned a Heritage Impact Assessment on behalf of the United Nations Educations, Social and Cultural
Organisation (UNESCO) to determine the impact of the mining activities at Vele Colliery on the Mapungubwe Cultural Landscape. The results of
the HIA concluded that the impacts of mining on the Mapungubwe Cultural Landscape (MCL) were minimal. These results were presented to
UNESCO’s 38th session in Russia, and were unanimously accepted.
In October 2014, CoAL signed a Biodiversity Offset Agreement, the first of its kind in South Africa, with the DEA and SANParks, which strive to
ensure the integrity of the World Heritage Site, by ensuring sustainable development practices and operation of Vele Colliery, so that it
benefits the receiving environment, the local economy and resident communities.
The BOA commits the Company to pay R55million to SANParks over a period of 25 years for different biodiversity and heritage programmes.
This agreement includes the establishment of a Project Steering Committee (PSC) comprising representatives from CoAL, DEA and SANParks to
oversee the implementation of the agreement, with SANParks as the implementing agency. The PSC is fully functional and meets on a
quarterly basis.
The first project is the restoration and rehabilitation of heritage resources. CoAL has also adopted a heritage project in the form of the
Mapungubwe Archaeological and Artefact Storage facility, which will ensure the protection of heritage resources.
To address the consolidation and incorporation of privately owned properties included in the revised Mapungubwe buffer zone, the parties to
the BOA have commenced engagements with the landowners to devise a mutually beneficial arrangement
Other biodiversity-offset programmes could include, but is not limited to:
Restoration of degraded riparian wetlands
Funding support for the Limpopo Valley Herb Project
Co-funding / improvement of the conservation contribution of land and/or land use activities within the Transfrontier Conservation
Areas (TFCA)
Establishment of a herbarium at Mapungubwe
Support of other conservation initiatives, e.g. Ground Hornbill Research and Conservation Project
8.8 Risk Assessment
8.8.1 Groundwater Pollution and Acid Mine Drainage
Vele Colliery Quarterly Groundwater Report – October 2015: “The potential contaminant sources related to the operations at the Vele Colliery
include inflows through the coal horizon, discard dumps, coal stockpiling, and pollution control dams. However, due to secondary containment
the evaporation dams are considered sanitary and unlikely sources of pollution. The overburden dump is also considered an unlikely source of
pollution due to low leaching and acid generation potential.”
The report on the hydrogeological study, including numeric groundwater modelling and assessment of the acid generation potential by
contaminated water from the opencast pit, stockpiles, slurry dams and PCDs was conducted in 2009, and concluded that while acid generation
potential was “possible” it was negligible and mitigation measures, implemented and planned, further reduced the potential for Acid Mine
Drainage (AMD). The potential of acid generation on hard dumps and current waste dumps was deemed unlikely.
This position was verified and supported during the review and revision of the geochemistry database and groundwater model conducted by
Geo Pollution Technology (Hydrogeological Report for Specialist Groundwater Studies – Vele Colliery - January 2015).
8.8.2 Plant Modification Project
The highest environmental risks identified in a previous CPR is the impact of mining on the Mapungubwe WHS, the long term impacts of
ground water quality as well as surface water.
Mitigation and management systems have been put in place to address potential risks identified in the previous CPR conducted in in 2011. The
Heritage Impact Assessment and submission to UNESCO regarding Mapungubwe deemed the influence of mining on the WHS to be minimal.
Concerning groundwater pollution, the colliery continues to conduct quarterly groundwater monitoring. Furthermore, a review and revision of
the geochemical database groundwater model was undertaken in 2014, the results of which indicated a significant unlikelihood of AMD from
the Vele Colliery operations.

Coal of Africa Limited – Vele Colliery – Independent Competent Person’s Report Page 67 of 116
Regarding surface water, monthly monitoring is conducted, the results of which indicate no threat from Vele Colliery to the Limpopo River and
surface water streams. To date, no surface water pollution has occurred.
8.8.3 Risk to be investigated
The following risks are recommended to be further investigated:
The potential impacts of a successful land claim that was only deemed not quantifiable by the IMR report.
The influence of holder of other prospecting and mineral rights for other minerals over the same mining area.
Potential influence of major weather events; drainage channels around the pit and free-draining rollover rehabilitation will be
required to minimise the influence of extreme climatic events as was experienced during the abnormal flooding event of 2012
Risks associated with permits/rights
o The renewal of the Prospecting Right previously held by Silkwood Trading 14. The prospecting right remains valid until a
decision to grant or refuse has been taken by DMR. The application process is still in progress and therefore the prospecting
right remains valid
Risks associated with the land claims and prospecting permits on some of the farms of the Vele Colliery.
8.9 Taxation
Vele is subject to:
South Africa Taxation laws and all Tax returns are currently up to date. Company tax in South Africa is 28% after all capital
expenditure is recovered in the year it is incurred.
South Africa VAT registered – due to the fact that the company has not made any Vatable supplies in 2 years SARS might suspend the
VAT number until commercial production.
South Africa’s Mineral Royalty Tax Acts are applicable – all returns are up to date. A formula supplied by the MPRDA (2002) is applied
and used in all DCF calculations.
There is no private royalties’ payable for Vele Colliery, only State Royalties.
8.10 Social and community impact
8.10.1 Public Participation
The Public Participation Process has been designed in terms of the NEMA Public Participation Guideline and the extent of the Environmental
Authorisation Amendment required. Public participation is a process and vehicle to provide sufficient and accessible information to registered
Interested and Affected Parties (IAPs) in an objective manner to assist them to identify issues of concern, to identify alternatives, to suggest
opportunities to reduce potentially negative or enhance potentially positive impacts, and to verify that issues and/or inputs have been
captured and addressed during the assessment process. This chapter of the report provides an overview of the tasks undertaken for the public
participation process prior and post the release of the Draft Amendment Report.
CoAL has developed and implemented a comprehensive Stakeholder Engagement Process that is pursuant of inclusive and transparent
engagement at all levels.
8.10.1.1 Interested and Affected Party Database
This database was established to ensure a comprehensive stakeholder and IAP database for stakeholder engagement. IAPs were contacted to
confirm their wish to remain a registered IAP and additional stakeholders were added throughout the process when they requested to be
registered. A total of 785 I&AP’s are registered on the IAP database and include parties from the following categories:
National, Provincial and Local Government
Business and Commerce
Environmental NGOs and Consultancy companies
Research Organisations
Education Institutions
Community Based Organisation and Structures
Regional and Neighbouring Landowners

Coal of Africa Limited – Vele Colliery – Independent Competent Person’s Report Page 68 of 116
Tourism Organisations and Operators
Media
An IAP database was developed throughout the Public Participation for the New Order Mining Right Application, Integrated Water Use License
Process as well as the Environmental Authorisation process and additional stakeholders were added throughout the process when they
requested to be registered. The original EIA Process followed a rigorous Public Participation Process and established an Environmental
Monitoring Committee (EMC) with local stakeholders. The EMC has been engaged regarding the amendment to the EA.
8.10.2 Social & Labour Plant (SLP)
A socio-economic specialist has identified a number of mitigation measures, which include:
Participation in regional structures
Maximise local employment
Provision of infrastructure and housing for construction workforce on site to alleviate the short term impact on Musina
Support in the maintenance of the R572 road into Musina
Implement programmes identified and included in the Social and Labour Plan (SLP)
Facilitation with existing housing developments for external workforce is also part of the mitigation, which plans to:
Maximize employment of local people
Skill programmes to equip workforce (Mining-related and portable)
Investigate and finalize alternative transport methods
Construction policy and procedures – control access, conduct and identification
HIV/AIDS and health related awareness programmes
Potential workforce skills & SMME database
Make available bursary opportunities to build skill capital in the region
Design and implement economic development programmes
Minimize surface areas through planning of infrastructure lay-out and mine method alternatives
Communication channel with direct adjacent land owners and key stakeholders to address impacts and grievances
A transparent recruitment drive aimed at locals, including existing SMMEs and notably HDSAs
A recruitment drive aimed at legitimate foreigners with scarce skills
Costs for the implementation of the socio-economic mitigation measures have been allowed for in the Social and Labour Plan (SLP) of the
mine.
The farmers whose farms (surface rights) were bought by CoAL have rental agreements with CoAL, which include the making of Lucerne bales
and delivery to CoAL’s game farms on other properties.
The first project is the restoration and rehabilitation of heritage resources and was scheduled for completion at the end of September 2015.
8.11 Mine closure
an initial mine closure plan must be prepared with every environmental management programme lodged for approval with an application for a
mining right. In terms of the now repealed provision of the MPRDA, a final closure plan had to be developed and application for a closure
certificate had to be made within 180 days from cessation of operations. In terms of the recently promulgated regulations, a final closure plan
will to be prepared for each application for a mining right and will have to be updated annually and financial provision will have to be made
and adjusted accordingly. Existing mine companies will have to prepare such a plan (which will need to comply with the new requirements)
and will have to review its existing financial provision accordingly within three months after the end of the financial year within which the new
regulations were promulgated.
Currently, rehabilitation and other work done on site to minimise closure cost include:
The backfilling of carbonaceous discard material into the pit up to the pre mining level of carbonaceous material.
The rehabilitation of the boxcut ramp area and ex-pit waste dump.
Rollover mining in the opencast, thus not requiring the movement of waste to external waste dump or increasing the waste dump
footprint.
Minimising the North Pit of the Plant Modification Project boxcut volumes and rampup period, to accommodate the volumes on the
existing waste dumps footprint and capacity.
The skyline of the area has not been influenced by mining, and will not require additional costs to reshape.

Coal of Africa Limited – Vele Colliery – Independent Competent Person’s Report Page 69 of 116
Capital expenditure planned for the PMP include plant upgrades, electricity lines, sewage facilities, bulk storage facilities, perennial stream
diversion and PCD which, because it was not constructed at the time of the Financial Liability assessment, was not included in the assessment.
Underground surface infrastructure, which is expected to be constructed in the next phases (including ventilation shafts, stone dust and
stores), was also not included in the assessment.
Recommendations from the Financial Liability assessment is to draft an interim closure plan, containing short, medium and long-term closure
measures and targets against which the quantified closure components can be managed, ultimately creating a progressive closure liability
control locus.
8.11.1 Mine residue management
Three options were evaluated for the management of the mine residue (discard and slurry) during the drafting of the EMP. Two surface
facilities were looked at, namely surface discard dumps, slurry facilities, and a co-disposal facility catering for both. The third option that was
evaluated is in-pit disposal of mine residue during rehabilitation of the opencast pits.
From a groundwater perspective, the in-pit disposal was deemed the option that would cause the least impact owing to the fact that the
residue could be placed at the bottom of the pit, allowing the residue to be covered with water. This would reduce the potential for oxidation
and the formation of acid-mine drainage.
In-pit disposal would also facilitate a free-draining final profile (from a visual and end land use perspective the preferred option). Surface
residue facilities were seen to also have a large visual impact and long-term maintenance issues.
8.11.2 Closure or End-Use Objectives
To rehabilitate disturbed areas to sustainable end land use, as close as possible to the original conditions
To promote the rapid re-establishment of natural vegetation and restoration of site ecology
To implement a sustainable long-term water management plan to deal with potential decant
8.11.3 Financial Liability Assessment 2015:
The Plant Modification Project aims to restart opencast activities refurbishing the plant to accommodate two (2) types of coal products.
Other expansions are dependent on pending authorisations and the economic status of South Africa, as wells as the current demand. This
condition is also used as a qualification for the report. The underground mining sections are scheduled to take place 16 years after the
commencement of the opencast activities. No other profound expansions and/or operations are scheduled to take place in the near future.
The pit has not yet developed to the extent where the stream diversion is necessary. No cost associated with the rehabilitation of the stream
diversion has been included in the 2015 Financial Liability Assessment. The stream diversion plan has been finalised, but the stream diversion
infrastructure is still to be constructed as per the amended IWUL, expected in H2 2016.
The new overhead power line from Pontdrift substation to the mine is in the process of being constructed and will impose an additional
closure liability on CoAL. However, since it has not yet been handed over it is not considered CoAL’s responsibility and is therefore not included
in the closure cost liability for March 2015.
The assessment does not provide detailed closure objectives, but presents accurate and process orientated costing escalations. This report
should in the future, further to the mentioned recommendations be supported by an interim closure plan, containing short, medium and long
term closure measures and targets against which the quantified closure components can be managed, ultimately creating a progressive
closure liability control locus.
The closure costs reflect the costs for unscheduled closure situations, based on known and itemised components within the current context of
the mining operations and its interactions.
An allocation of 12% was made for preliminary and general costs, as well as a 10% provision for contingencies. (Provisions were
made in accordance with the DMR guideline). The total unscheduled closure cost is calculated at R 50 525 566.40 (DMR applied
rates, including VAT).
Thereby, the closure costs adequately reflect the costs for unscheduled closure situations, based on known and itemised
components within the current context of the mining operations and its interactions.
An allocation of 12% was made for preliminary and general costs, as well as a 10% provision for contingencies.
Both of these provisions were made in accordance with the DMR guideline.
The total unscheduled closure cost is calculated at R 50 525 566.40 (DMR applied rates, including VAT).

Coal of Africa Limited – Vele Colliery – Independent Competent Person’s Report Page 70 of 116
8.12 Capital and operating costs
8.12.1 Capital
The capital expenditure documented in this report is for the Plant Modification Project and only at completing the project development and
initiating production as indicated in the Capital Cost Estimate in Table 8.12.1. Underground and other infrastructure is only anticipated after
opencast activities concluded, estimated at 30 years after production from the PMP starts.
The capital estimate for the plant is an agglomeration of construction with foreign exchange component, owners cost, professional fees,
contingencies and escalation. All construction costs (commissioning and other activities) are included with subsequent related costs treated as
operational costs.
With an established opencast, with ramps and blasting blocks available, mining costs and the additional pre stripping to enable a 2.7Mtpa
mining rate from part of the operating expenditures.
Table 8.12.1 Capital Cost Estimate
Financing requirement = Plant Modification Project ZAR (Millions)
Plant Infrastructure Area and contingency 150.0
Plant Contingency 14.0
Mine Development(Sewage R1.2m and Bulk Fuel R3m) 4.2
Power Generation 15.4
Powerline Servitude 3.0
Perennial stream Diversion and PCD 7.5
Contingencies on Mine infrastructure 0.0
Project Link 0.0
Total: R 194.1
The capital costs are estimated in ZAR, and will be funded by loans or shareholder funding. For the DCF calculation, the value was amortised. A
total of R194.1M is budgeted for.
8.12.2 Operating Costs
Operating costs for Vele Colliery is based on outsourcing to specialists in mining and processing operations, but to maintain a small
management team to assist with direct operations as shown in the Estimated Operating costs in Table 8.12.2.
Mining, Processing and Engineering costs are based on established contractor quotations received by CoAL in 2014, for operations of the
different sectors. This includes specific requirements including wirehole logging, electronic blasting, transporting discard from the plant, dust
suppressant, electricity, spares, fixed costs (to contractor), consumables and site establishment. Electricity costs assumes the successful
connection to the ESKOM grid.
Distribution costs include Trucking to siding, FEL (Front End Loader) costs to load the train trucks, rail costs, agent fees and port charges. The
product investigated was selling a SSCC product to a local (South African client) where transport is provided to the siding at Musina, and
Thermal export coal (FOB at Maputo harbour).
Overheads include SLP (Social & Labour plan costs), safety and Environmental costs (full time employees overseeing contractor as well as
specialist reports), HR and head office cost, fixed overheads and additional construction charges to lodge the workers while building the plant.

Coal of Africa Limited – Vele Colliery – Independent Competent Person’s Report Page 71 of 116
Table 8.12.2 Estimated RoM Operating Costs:
R/t 2017 2018 2019 2020 2021 2022 2023
Mining Cost R 155 R 160 R 194 R 160 R 166 R 189 R 230
Processing Cost R 76 R 17 R 19 R 20 R 21 R 23 R 24
Engineering Cost R 6 R 9 R 10 R 11 R 12 R 13 R 14
Distribution Cost R 28 R 144 R 170 R 179 R 187 R 199 R 209
Overheads (Fixed) R 93 R 10 R 18 R 23 R 21 R 27 R 24
Total Operating Costs R 357 R 339 R 412 R 393 R 407 R 450 R 501
The Average operating cost, not discounted or inflated, is R361/RoM tonne over the Plant modification project. This includes distribution (rail
& trucking) costs, production of two product streams and all other costs.
Figure 8.12.1 The percentage split of operational costs
The operating cost in year 1 (2017) of the Plant Modification project is mainly additional pre-stripping of waste, plant establishment and the
building of plant and in-pit stockpiles. Varying mining cost percentage is due to fluctuations in strip ratio due to geology and the establishment
of the North Pit.
8.13 Economic criteria
Exchange rates and prices used in forecasts are summarised in Table 8.5.1 and Table 8.5.2 as part of market studies. United States of America
(USA) inflation forecasts are based on four-year historic averages supplied by Statista.
South African inflation was calculated on indexes for the specific escalation bucket, with historic values from Statistics South Africa. A factor
was applied to relevant costs based on Mining PPI (6% p.a.), CPI (6% p.a.) and Labour inflation rate (CPI +2.5%) as well as a diesel cost (3% p.a.
– Investec oil price growth forecast) and electricity (CPI + 3%).
The values used for South African CPI are conservative, viewed based on current SA Reserve bank target of between 3% and 6%.
Coal of Africa Limited provided the financial model used to calculate the viability of the Vele reserve. To understand the variability within the
cost model the following inputs, represented in Table 8.13.1, from the financial model were adjusted to align the financial model with the 2017
start date of the PMP.
0%
10%
20%
30%
40%
50%
60%
70%
80%
90%
100%
2017 2018 2019 2020 2021 2022 2023 2024 2025 2026 2027 2028 2029 2030 2031 2032 2033
Operating Cost Breakdown
Mining Cost Processing Cost Engineering Cost Distribution Cost Overheads (Fixed)

Coal of Africa Limited – Vele Colliery – Independent Competent Person’s Report Page 72 of 116
Table 8.13.1 - Financial Model Adjusted Input Parameters
All variability distributions were based on a trigen distribution, as described in Figure 8.13.1 below. A trigen distribution uses 3 main input
metrics, a Min, Mean and Max which is estimated. An addition two metrics describes sizes of the distribution’s “overflow past the Min and
Max, above and below. Within all of the above input distribution estimations a fixed value of 10% was used.
Figure 8.13.1 - Trigen Distribution
A Monte Carlo simulation, using 10,000 iterations, was used to determine the probability of achieving a positive NPV. Figure 8.13.2 indicates
Vele’s NPV Probability Distribution in ZAR Billions, from the year 2017 onwards. Projected 2017 prices (see Table 8.5.2 Coke, Coal and Carbon
forecasts mean values from reputable sources) were used a base case.
Unit Original Model Fixed Input Distribution @Risk Min Most Likely Max
Selling Price
Middlings Product Calorific Value MJ/Kg GAD 23.5 Trigen 23.50 18 23.5 24
API4 (Export Coal, RBCT) US$/t 61.81 Trigen 61.81 59 61.81 65
HCC (Hard Coking Coal) US$/t 99.57 Trigen 99.57 90 99.57 110
SSCC (Semi Soft Coking Coal) % of HCC % 25% Trigen 0.25 0.2 0.25 0.3
Currency
Dollar Start out ZAR/US$ 13.52 Trigen 13.52 13 13.52 13.6
Nominal increase in Price - Dollar Terms % pa 2.50% Trigen 0.025 0.02 0.025 0.04
Economic Parameters
CPI (Consumer Price Index) % pa 6.00% Trigen 0.06 0.05 0.06 0.065
PPI (Production Price Index) % pa 6.00% Trigen 0.06 0.05 0.06 0.065
Labour inflation rate % pa 9.00% Trigen 0.09 0.05 0.09 0.1
Consumables
Diesel Inflation % pa 3.00% Trigen 0.03 0.02 0.03 0.06
Electricity Cost % pa 12.50% Trigen 0.125 0.1 0.125 0.2
Yields
SSCC Yield %/t 10.70% Trigen 0.107 0.08 0.107 0.15
Average Eskom Yield %/t 33.00% Trigen 0.33 0.25 0.33 0.4
MaxP90
MinP10
Mean
10%
10%

Coal of Africa Limited – Vele Colliery – Independent Competent Person’s Report Page 73 of 116
Figure 8.13.2 - Financial Model NPV Probability Distribution (2017 Onwards)
Figure 8.13.3- NPV Spider Diagram, Sensitivity

Coal of Africa Limited – Vele Colliery – Independent Competent Person’s Report Page 74 of 116
Figure 8.13.3 indicates the sensitivity of the most sensitive input parameters namely:
Selling cost of coal
Labour inflation rate
South African Inflation
Rand / US Dollar exchange rate
The following breakdown of the Discounted Cash Flow (DCF) was taken from the cost model to illustrate the mean NPV calculated for 2017
onwards. The difference between the Mean in Table 8.14.1 and the NPV calculated in the Monte Carlo Simulation can be attributed to the
variance ranges used on the input sheet of the simulation.
8.14 Financial analysis
From the financial analysis, as discussed in the economic criteria, it is evident that the financial model’s NPV can be predicted to be positive
with a certainty of 91.7 %.
The DCF indicates an NPV for the Vele Colliery of ZAR889.3M over a 16-year period
Table 8.14.1 - Vele Discounted Cash Flow
NET PRESENT VALUE CALCULATION: VELE
R'000 2016 2017 2018 2019 2020 2021 2022 2023 2024
Revenue - 38 298 1 081 423 1 235 891 1 380 647 1 465 172 1 554 859 1 650 023 1 750 998
Cash Costs - (194 037) (985 455) (1 108 380) (1 070 198) (1 120 546) (1 237 920) (1 395 451) (1 507 865)
EBITDA - (155 739) 95 968 127 512 310 449 344 626 316 939 254 572 243 133
Movement in Working Capital - 12 857 (19 176) (651) (12 829) (537) 4 753 7 824 3 875
Capital Expenditure - (194 085) (2 458) (2 641) (2 826) (3 025) (3 238) (3 468) (3 714)
Tax (including Royalties) - (131) (3 758) (4 281) (6 604) (69 593) (70 009) (62 006) (59 485)
Free Cash Flow (annually) - (337 097) 70 575 119 939 288 191 271 471 248 445 196 922 183 809
NPV Discount Rate 10.00%
Net Present Value 889 305.34
2025 2026 2027 2028 2029 2030 2031 2032 2033 TOTAL
1 858 139 1 971 821 2 092 443 2 220 429 2 356 227 2 500 314 2 653 195 2 815 406 1 288 942 29 914 227
(1 617 129) (1 772 110) (1 814 746) (1 909 384) (2 030 049) (2 243 178) (2 487 312) (2 550 274) (1 398 074) (26 442 106) -
241 010 199 711 277 697 311 045 326 178 257 136 165 883 265 132 (109 132) 3 472 121 -
3 362 6 854 (2 660) 1 320 3 150 10 424 12 631 (2 619) 4 701 33 278
(3 978) (4 263) (4 569) (4 897) (5 251) (5 631) (6 040) (6 480) (6 487) (263 049)
(57 807) (51 567) (73 347) (75 016) (78 953) (72 150) (60 306) (62 499) (14 672) (822 183) 0
182 587 150 735 197 122 232 452 245 124 189 780 112 168 193 534 (125 590) 2 420 167

Coal of Africa Limited – Vele Colliery – Independent Competent Person’s Report Page 75 of 116
Coal Reserve Estimate
9.1 Estimation and modelling techniques
Conversion of the MTIS (Mineable Tonnes In-Situ) resource to reserve was based on SANS10324:2004 guidelines for the evaluation of coal
resources and coal reserves.
Figure 9.1.1 Diagram that illustrates the sequential calculation of coal resources and coal reserves from gross in situ tonnes (as modelled) to saleable tonnes
by the application of key cut-off criteria and discount factors associated with modifying factors (SOURCE: SANS 10320:2004)

Coal of Africa Limited – Vele Colliery – Independent Competent Person’s Report Page 76 of 116
The steps used in Figure 9.1.1 for the incremental calculation of coal reserves was applied to the MTIS Resource, as constrained by mining
widths and seams per the resource declaration for Mineable tonnes in situ Resource.
The resource was depleted with mining that occurred up to 31 October 2013, and weathered coal was excluded from the mining layout.
9.2 Coal Reserve classification criteria
The basis of classification of reserves and confidence categories are based on the guidelines as provided in the Australian guidelines for
estimation and classification of coal resources.
Figure 9.2.1 Resource to Reserve category conversion as per JORC
General relationship between Exploration Results, Coal Resources and Ore Reserves as shown in Figure 9.2.1 with the word mineral and ore
exchanged with coal.
The mining methods proposed as well as the recovery rates are clearly understood and quantified. The confidence from the resource
classification was used to classify the RoM reserves and saleable tonnes by factoring of predicted and practical yields. This classification was
based on sound economic future view on demand, prices and exchange rates as well as costs from well-established contractors in a financial
model.
9.3 Coal Reserve statement
The updated Coal Reserve Statement is reported in two statements. The first reserve statement MTIS reserve based on the minimum seam
thickness of 1.4m and the maximum seam thickness of 4.5m (theoretical mining height) for the underground resources.

Coal of Africa Limited – Vele Colliery – Independent Competent Person’s Report Page 77 of 116
Figure 9.3.1 Graphical representation of RoM tonnes conversion from GTIS tonnes
21 11
121
290
20 69
794
673
363 325
39
100
200
300
400
500
600
700
800
Mill
ion
To
nn
es
Resource to RoM Tonnes

Coal of Africa Limited – Vele Colliery – Independent Competent Person’s Report Page 78 of 116
Table 9.3.1 Reserve tonnes for Vele Colliery
Mining Block OC \ UG Reserve Category
Mineable Insitu Reserve MTIS (Mt) (ad)
Min
ing
Extr
acti
on
fact
or
(%)
Dilu
tio
n (
%)
Exte
rnal
Mo
istu
re (
%)
RoM Tonnage (Mt)
Ne
t A
ttri
bu
tab
le t
o
Co
AL
Ro
m T
ann
age
(Mt)
Pri
mar
y P
rod
uct
Stre
am P
ract
ical
Yie
ld
(%)
Pri
mar
y P
rod
uct
Sale
able
To
nn
es
(Mt)
Seco
nd
ary
Pro
du
ct
Stre
am P
ract
ical
Yie
ld
(%)
Seco
nd
ary
Pro
du
ct
Sale
able
To
nn
es
(Mt)
Co
mb
ine
d Y
ield
(%
)
OC central OC Proven 23.806 95% 8% 3.5% 25.280
25.280
10.7% 2.705 33.0% 8.342 43.7%
Total Proved OC 23.806 95% 8% 3.5% 25.280 10.7% 2.705 33.0% 8.342 43.7%
OC North OC
Probable
67.895 95% 8% 3.5% 72.099
180.342
10.7% 7.715 33.0% 23.793 43.7%
OC South OC 25.062 95% 8% 3.5% 26.614 10.7% 2.848 33.0% 8.783 43.7%
OC west OC 76.870 95% 8% 3.5% 81.629 10.7% 8.734 33.0% 26.938 43.7%
Total Probable OC 169.828 95% 8% 3.5% 180.342 10.7% 19.297 33.0% 59.513 43.7%
Total Opencast 193.634 95% 8% 3.5% 205.622 205.662 10.7% 22.002 33.0% 67.855 43.7%
UG North UG
Probable
38.335 60% 5% 3.5% 24.996
85.773
10.7% 2.675 33.0% 8.249 43.7%
UG South UG 30.317 60% 5% 3.5% 19.768 10.7% 2.115 33.0% 6.524 43.7%
UG West UG 62.891 60% 5% 3.5% 41.008 10.7% 4.388 33.0% 13.533 43.7%
Total Probable Underground 131.544 60% 5% 3.5% 85.773 10.7% 9.178 33.0% 28.305 43.7%
Grand Total Vele project 325.178 80.8% 7.1% 3.5% 291.395 291.395 10.7% 31.179 33.0% 96.160 43.7%

Coal of Africa Limited – Vele Colliery – Independent Competent Person’s Report Page 79 of 116
Table 9.3.2 Primary product, yield - 1.4m Minimum mining height and 4.5m max mining height (U/G mining of Bottom Lower coal seam
only)
Primary Product, Air dried qualities
Mining Block
OC \ UG
Res
erve
C
ateg
ory
RoM Tonnage (Mt)
Pri
mar
y P
rod
uct
Stre
am P
ract
ical
Yiel
d (
%)
Pri
mar
y P
rod
uct
Sale
able
To
nn
es
(Mt)
CV
(M
J\kg
)
Ash
%
Vo
l (%
)
Fixe
d C
arb
on
(%)
Tota
l Su
lp (
%)
Inh
eren
t M
ois
t
(%)
OC Central OC Proved 25.280 10.7% 2.70 30.19 10.00 34.99 53.07 1.10 1.94
Total Proved OC 25.280 10.7% 25.280 30.19 10.00 34.99 53.07 1.10 1.94
OC North OC
Probable
72.099 10.7% 7.71 30.87 10.00 35.45 52.71 1.08 1.84
OC South OC 26.614 10.7% 2.85 30.38 10.00 33.65 54.43 1.00 1.92
OC West OC 81.629 10.7% 8.73 30.88 10.00 35.33 52.91 1.17 1.76
Total Probable OC 180.342 10.7% 180.342 30.80 10.00 35.13 53.05 1.11 1.82
Total Opencast 205.622 10.7% 205.622 30.73 10.00 35.11 53.06 1.11 1.83
UG North UG
Probable
24.996 10.7% 2.67 30.89 10.00 33.71 54.52 0.96 1.77
UG South UG 19.768 10.7% 2.12 30.24 10.00 35.82 52.40 1.25 1.78
UG West UG 41.008 10.7% 4.39 30.76 10.00 35.99 52.33 1.17 1.68
Total Probable Underground 85.773 10.7% 85.773 30.68 10.00 35.29 52.98 1.13 1.73
Grand Total Vele project 291.395 10.7% 291.395 30.71 10.00 35.16 53.04 1.11 1.80
Table 9.3.3 Secondary product, yield - 1.4m Minimum mining height and 4.5m max mining height (U/G mining of Bottom Lower coal seam
only)
Secondary Product, Air dried qualities
Mining Block
OC \ UG
Res
erve
Cat
ego
ry
RoM Tonnage (Mt)
Seco
nd
ary
Pro
du
ct S
trea
m
Pra
ctic
al Y
ield
(%)
Seco
nd
ary
Pro
du
ct S
alea
ble
Ton
nes
(M
t)
CV
(M
J\kg
)
Ash
%
Vo
l (%
)
Fixe
d C
arb
on
(%
)
Tota
l Su
lph
ur
(%)
Inh
eren
t M
ois
t
(%)
OC Central OC Proved 25.280 33.0% 8.34 25.32 23.7 31.6 43.00 1.10 1.70
Total Proved OC 25.280 33.0% 25.280 25.32 23.7 31.6 43.00 1.10 1.70
OC North OC
Probable
72.099 33.0% 23.79 25.32 23.7 31.6 43.00 1.10 1.70
OC South OC 26.614 33.0% 8.78 25.32 23.7 31.6 43.00 1.10 1.70
OC West OC 81.629 33.0% 26.94 25.32 23.7 31.6 43.00 1.10 1.70
Total Probable OC 180.342 33.0% 180.342 25.32 23.7 31.6 43.00 1.10 1.70
Total Opencast 205.622 33.0% 205.622 25.32 23.7 31.6 43.00 1.10 1.70
UG North UG
Probable
24.996 33.0% 8.25 25.32 23.7 31.6 43.00 1.10 1.70
UG South UG 19.768 33.0% 6.52 25.32 23.7 31.6 43.00 1.10 1.70
UG West UG 41.008 33.0% 13.53 25.32 23.7 31.6 43.00 1.10 1.70
Total Probable Underground 85.773 33.0% 85.773 25.32 23.7 31.6 43.00 1.10 1.70
Grand Total Vele project 291.395 33.0% 291.395 25.32 23.7 31.6 43.00 1.10 1.70

Coal of Africa Limited – Vele Colliery – Independent Competent Person’s Report Page 80 of 116
9.4 Coal Reserve reconciliation
The decrease in reserves and saleable tonnes are presented in Table 9.4.1 to Table 9.4.3 with variance from 2012 to 2015 tonnes indicated in
red.
Table 9.4.1 Vele Reserves - Venmyn 2012
Mining Block OC \ UG
Reserve Category
Mineable Insitu Reserve (Mt)
RoM Tonnage (Mt)
Primary Product Practical Yield (%)
Primary Product Saleable Tonnes (Mt)
Secondary Product Practical Yield (%)
Secondary Product Saleable Tonnes (Mt)
OC central OC Proven 24.199 25.697 18.5% 4.743 38.3% 9.842
Total Proved OC 24.199 25.697 18.5% 4.743 38.3% 9.842
OC North OC
Probable
67.895 72.099 18.3% 13.167 43.8% 31.584
OC South OC 25.062 26.614 18.4% 4.908 44.0% 11.705
OC west OC 76.870 81.629 17.8% 14.555 45.7% 37.281
Total Probable OC 169.828 180.342 18.1% 32.630 44.7% 80.570
Total Opencast 194.027 206.039 18.1% 37.372 43.9% 90.412
UG North UG
Probable
38.335 24.996 18.9% 4.714 40.8% 10.208
UG South UG 30.317 19.768 17.8% 3.524 39.4% 7.794
UG West UG 62.891 41.008 17.0% 6.980 46.8% 19.179
Total Probable Underground 131.544 85.773 17.7% 15.218 43.3% 37.181
Grand Total Vele project 325.570 291.812 18.0% 52.590 43.7% 127.593
Table 9.4.2 Vele Reserves - CoAL 30 June 2015
Mining Block OC \ UG
Reserve Category
Mineable Insitu Reserve MTIS (Mt) (ad)
RoM Tonnage (Mt)
Primary Product Stream Practical Yield (%)
Primary Product Saleable Tonnes (Mt)
Secondary Product Stream Practical Yield (%)
Secondary Product Saleable Tonnes (Mt)
OC central OC Proven 23.806 25.280 10.7% 2.705 33.0% 8.342
Total Proved OC 23.806 25.280 10.7% 2.705 33.0% 8.342
OC North OC
Probable
67.895 72.099 10.7% 7.715 33.0% 23.793
OC South OC 25.062 26.614 10.7% 2.848 33.0% 8.783
OC west OC 76.870 81.629 10.7% 8.734 33.0% 26.938
Total Probable OC 169.828 180.342 10.7% 19.297 33.0% 59.513
Total Opencast 193.634 205.622 10.7% 22.002 33.0% 67.855
UG North UG
Probable
38.335 24.996 10.7% 2.675 33.0% 8.249
UG South UG 30.317 19.768 10.7% 2.115 33.0% 6.524
UG West UG 62.891 41.008 10.7% 4.388 33.0% 13.533
Total Probable Underground 131.544 85.773 10.7% 9.178 33.0% 28.305
Grand Total Vele project 325.178 291.395 10.7% 31.179 33.0% 96.160

Coal of Africa Limited – Vele Colliery – Independent Competent Person’s Report Page 81 of 116
Table 9.4.3 Reconciliation in Reserve Tonnes:
Mining Block OC \ UG
Reserve Category
Mineable Insitu Reserve MTIS (Mt) (ad)
RoM Tonnage (Mt)
Primary Product Stream Practical Yield (%)
Primary Product Saleable Tonnes (Mt)
Secondary Product Stream Practical Yield (%)
Secondary Product Saleable Tonnes (Mt)
OC central OC Proven -0.393 -0.417 -8% -2.038 -5% -1.500
Total Proved OC -0.393 -0.417 -8% -2.038 -5% -1.500
OC North OC
Probable
0.000 0.000 -8% -5.452 -11% -7.791
OC South OC 0.000 0.000 -8% -2.060 -11% -2.922
OC west OC 0.000 0.000 -7% -5.821 -13% -10.344
Total Probable OC 0.000 0.000 -7% -13.333 -12% -21.057
Total Opencast -0.393 -0.417 -7% -15.371 -11% -22.557
UG North UG
Probable
0.000 0.000 -8% -2.040 -8% -1.959
UG South UG 0.000 0.000 -7% -1.409 -6% -1.270
UG West UG 0.000 0.000 -6% -2.592 -14% -5.646
Total Probable Underground 0.000 0.000 -7% -6.040 -10% -8.876
Grand Total Vele project -0.393 -0.417 -7% -21.411 -11% -31.433
The reduction In RoM tonnes is due to mining depletion in the central opencast mine. Reduction in effective yield is due to the product
specification change and the planned plant setup that will change.
In 2012 a 12% Ash primary product with Middlings was targeted, the Plant Modification Project splits the plant feed directly after the destining
module into two streams: a 10% Ash SSCC and a 30% Ash Export Thermal product.

Coal of Africa Limited – Vele Colliery – Independent Competent Person’s Report Page 82 of 116
Mineral Asset Valuation The evaluation of the Vele Colliery is done in accordance to the VALMIN Code (2005), which provides a standardised approach to evaluation of
mineral assets.
The evaluation consist of two parts. The first part is a market-approached evaluation of the RoM tonnes outside the current Proven Coal
Reserves of the Vele Colliery. The additional RoM is evaluated against sales of project and operations with similar resources and activities. The
second part is the evaluation of the Proven Coal Reserves and this is accomplished through the calculation of the discounted cash flow (DCF)
for the current financial model. The terminal value of the deposit will be the addition of the fair value according to the market approached
with the DCF value.
10.1 Market Approach
To determine the fair attributable value of the additional RoM (outside current financial model) the value is determined by comparing it with
recent sales and acquisitions in the market. For the evaluation three transactions were used to determine lower and upper ZAR ranges per
resource ton.
In 2014 there has been three major transactions namely:
The acquisition of New Clydesdale Colliery (NCC) from Exarro Resources to Universal Coal (Underground Mine)
− Year of acquisition: 2014
− Estimated RoM: 70 Million Tonnes
− Acquisition Price: 170 ZARm
− Acquisition Unit Value: 2.43 ZAR/t
The sale of Benga, managed byRio Tinto to International Coal Ventures Limited (ICVL)
− Year of acquisition: 2014
− Estimated RoM: 1,900 Million Tonnes
− Acquisition Price: $ 50 Million (US dollar) @ Average 2014 exchange rate: ZAR 11.286
− Acquisition Unit Value: 0.297 ZAR/t
The acquisition of Benga is heavily deflated as major impairments due to production losses and the high cost of transport to local harbours
made the project not profitable. The value is presented to indicate the extreme lower limit ZAR/t value
The acquisition of Total Coal South Africa (TCSA) by Exxaro Resources
− Year of acquisition: 2014
− Estimated RoM: 474 Million Tonnes (Minable tonnes in situ ) (1,498 Million GTIS resources)
− Acquisition Price: $ 472 Million (US dollar) @ Average 2014 exchange rate: ZAR 11.286
− Acquisition Unit Value: 11.24ZAR/t
With the acquisition of the TCSA asset one of the main drivers is the Richards Bay Coal Terminal allocation that TCSA has access too. The price
provides the extreme upper limit for the ZAR/t value. Even though the sale of Benga and the acquisition of TCSA are extremes, the midpoint of
the two transaction does provide an acceptable value for resources per ton.
For the determination of the lower and upper ZAR/t values for the market approach evaluation, the following adjustments were made to the
transactions of 2014:
An additional 1.50ZAR/t was added to the NCC underground mine’s resource per ton value
Two of the acquisitions a primary thermal coal mines in the Witbank Coalfields in Mpumalanga. Vele Colliery also produces a semi-
soft coking coal that adds to the lower limit and upper limit values.

Coal of Africa Limited – Vele Colliery – Independent Competent Person’s Report Page 83 of 116
Table 10.1 provides a summary of the evaluation parameters by mining method and resource category.
Table 10.1.1 Market approach evaluation of the Vele Colliery’s additional RoM
Project O/C or U/G Reserve Category
"Excess" RoM Tonnage (t)
Lower Unit Value (ZAR/t)
Upper Unit Value (ZAR/t)
Min Project Value (ZARm)
Max Project Value (ZARm)
Mean Project Value (ZARm)
Vele O/C Probable 133 939 947.00 3.5 5 468.79 669.70 569.24
U/G Probable 85 772 992.00 2.5 3.75 214.43 321.65 268.04
Vele Total: 219 712 939.00 683.22 991.35 837.29
The market approach evaluation of the additional RoM tonnes provides an attributable fair value of ZAR 837.3M.
10.2 Discounted Cash Flow
The information represented in the CPR provides verification of all financial inputs in to the financial model. The financial model is based on
the PMP mining operation and the DCF provides an attributable value of ZAR 889.3M (based on the nett present value (NPV)) and the
calculation is presented in Table 10.2.
Table 10.2: Discounted Cash Flow for the Vele Colliery
10.3 Total Asset Value
In considering the result of both methods, the terminal value for the Vele Colliery is ZAR 1,726.6m. In the opinion of VBKom this value is a fair
value for the asset considering the current market demand and export coal prices.
NET PRESENT VALUE CALCULATION: VELE
R'000 2016 2017 2018 2019 2020 2021 2022 2023 2024
Revenue - 38 298 1 081 423 1 235 891 1 380 647 1 465 172 1 554 859 1 650 023 1 750 998
Cash Costs - (194 037) (985 455) (1 108 380) (1 070 198) (1 120 546) (1 237 920) (1 395 451) (1 507 865)
EBITDA - (155 739) 95 968 127 512 310 449 344 626 316 939 254 572 243 133
Movement in Working Capital - 12 857 (19 176) (651) (12 829) (537) 4 753 7 824 3 875
Capital Expenditure - (194 085) (2 458) (2 641) (2 826) (3 025) (3 238) (3 468) (3 714)
Tax (including Royalties) - (131) (3 758) (4 281) (6 604) (69 593) (70 009) (62 006) (59 485)
Free Cash Flow (annually) - (337 097) 70 575 119 939 288 191 271 471 248 445 196 922 183 809
NPV Discount Rate 10.00%
Net Present Value 889 305.34
2025 2026 2027 2028 2029 2030 2031 2032 2033 TOTAL
1 858 139 1 971 821 2 092 443 2 220 429 2 356 227 2 500 314 2 653 195 2 815 406 1 288 942 29 914 227
(1 617 129) (1 772 110) (1 814 746) (1 909 384) (2 030 049) (2 243 178) (2 487 312) (2 550 274) (1 398 074) (26 442 106) -
241 010 199 711 277 697 311 045 326 178 257 136 165 883 265 132 (109 132) 3 472 121 -
3 362 6 854 (2 660) 1 320 3 150 10 424 12 631 (2 619) 4 701 33 278
(3 978) (4 263) (4 569) (4 897) (5 251) (5 631) (6 040) (6 480) (6 487) (263 049)
(57 807) (51 567) (73 347) (75 016) (78 953) (72 150) (60 306) (62 499) (14 672) (822 183) 0
182 587 150 735 197 122 232 452 245 124 189 780 112 168 193 534 (125 590) 2 420 167

Coal of Africa Limited – Vele Colliery – Independent Competent Person’s Report Page 84 of 116
Interpretation and Conclusions
The data used in the geological modelling and Coal Resource estimation was done in accordance too the JORC Code (2012). All data used are of
a sufficient quality to assist in a Coal Resource estimation with a high level of confidence.
Mineral tenure is secured through a mining right over most of the Vele Colliery area. All other regulatory requirement for the commencement
of mining activities are in place.
All the resource included in the resources falls within the reasonable prospect for eventual economic extraction. This is based on the technical
studies completed to convert the Coal Resources into Coal Reserves.
It is the opinion of VBKom that the Coal Resource Estimate and Statement is a reasonable representation of the coal deposit.
Since mine has been out onto care and maintenance the plant design and product mix was further investigated. A plant modification project
was started to re-configure the current plant at the mine to produce a 10% ash semi-soft coking coal and a 5500kcal (NAR) thermal coal
product. This is because the fine fraction, which got lost to the slimes, contained most of the vitrinite rich coals.
The business case for the PMP is a 16-year opencast design and schedule, which makes out a part of the Central – and Northern Pit. The
remainder of the additional RoM will be extracted through opencast and underground methods.
Although the current business case only includes the PMP sufficient studies, which corresponds to pre-feasibility and feasibility study levels,
have been conducted on the additional RoM. It is the opinion of VBKom that these studies are sufficient in nature to convert the Coal Resource
to Coal Reserves.
The economical criteria and financial modelling of the Vele Colliery indicates a that the project will be NPV positive with a relative high
confidence level. The DCF indicates a NPV for the project of ZAR 889.3M over the 16-year period.
An evaluation of the Vele Colliery was based on the DCF and a market approach for the “additional” RoM. The two methods provide the
terminal value for the project.
The market approach provides an attributable value of ZAR 837.3M for the “additional“ RoM and the DCF value is ZAR 889.3M. The terminal
value for the project is ZAR 1,726.6M, which is considered a fair value by VBKom

Coal of Africa Limited – Vele Colliery – Independent Competent Person’s Report Page 85 of 116
Recommendations
Additional work recommended too increasing the confidence in the Coal Resource and Coal Reserve estimate is:
To have a reconciliation process in place when the new plant is commissioned to verify estimated tonnages and qualities
Ongoing LDD campaigns to determine the yield for the PMP plant setup to reduce risk in yield variation
Re-evaluate underground mine design criteria and layout as the mine progresses closed to the completion of the opencast areas.

Coal of Africa Limited – Vele Colliery – Independent Competent Person’s Report Page 86 of 116
References Geopractica. 2009. GEOTECHNICAL INVESTIGATION for PROPOSED COAL PROCESSING PLANT at VELE COAL PROJECT. Prepare for: ELB
Engineernig Services. Job No. 09133. June 2009.
Independent Competent Report on the Coal of Africa Limited Assets, 2010 – Mineral Corporation
Competent Persons Report on the Assets of Coal of Africa Limited, 2012 – Venmyn Rand
Independent Evaluation of the Coal of Africa Limited Assets, 2013 – Venmyn Rand
MRM Rounge Mining Soulution’s report on the mine design for the Vele Colliery
Front End Feed Report on the Plant Modification Project for Vele Colliery – Sedgman
Environmental Management Programme for the Vele Colliery
Integrated Management Report – Coal of Africa Limited

Coal of Africa Limited – Vele Colliery – Independent Competent Person’s Report Page 87 of 116
Appendices

Coal of Africa Limited – Vele Colliery – Independent Competent Person’s Report Page 88 of 116
APPENDIX 1: JORC CODE, 2012 EDITION – TABLE 1 REPORT TEMPLATE
Section 1 Sampling Techniques and Data
(Criteria in this section apply to all succeeding sections.)
Criteria JORC Code explanation Commentary
Sampling
techniques
Nature and quality of sampling (eg cut channels, random chips, or specific
specialised industry standard measurement tools appropriate to the minerals
under investigation, such as down hole gamma sondes, or handheld XRF
instruments, etc). These examples should not be taken as limiting the broad
meaning of sampling.
Include reference to measures taken to ensure sample representivity and the
appropriate calibration of any measurement tools or systems used.
Aspects of the determination of mineralisation that are Material to the Public
Report.
In cases where ‘industry standard’ work has been done this would be
relatively simple (eg ‘reverse circulation drilling was used to obtain 1 m
samples from which 3 kg was pulverised to produce a 30 g charge for fire
assay’). In other cases more explanation may be required, such as where there
is coarse gold that has inherent sampling problems. Unusual commodities or
mineralisation types (eg submarine nodules) may warrant disclosure of
detailed information.
All samples from the deposit was taken through diamond core drilling.
All cored boreholes and open holes were has downhole geophysical data. All
sondes and equipment used for downhole geophysics was calibrated at
regular intervals.
All samples were taken across the coal seam and the sample sizes depended
on the ply thickness
To ensure that sampling bias was minimised the whole core was sampled as
per SANS 10320:2004
Drilling
techniques
Drill type (eg core, reverse circulation, open-hole hammer, rotary air blast,
auger, Bangka, sonic, etc) and details (eg core diameter, triple or standard
tube, depth of diamond tails, face-sampling bit or other type, whether core is
oriented and if so, by what method, etc).
The project was evaluated through diamond core drill holes (slim and large
diameter) as well as percussion drill holes. Details of the drilling is presented
in the report
Drill sample
recovery
Method of recording and assessing core and chip sample recoveries and
results assessed.
Measures taken to maximise sample recovery and ensure representative
nature of the samples.
Whether a relationship exists between sample recovery and grade and
whether sample bias may have occurred due to preferential loss/gain of
fine/coarse material.
Sample recovery through diamond drilling has to more than 95% for coal
intersections. This is closely monitored by field geologist. If the recovery is not
obtained then a re-drill of the drill hole is required.
As the whole core is sampled the bias associated with sampling is minimised
Logging Whether core and chip samples have been geologically and geotechnically The core is logged in detail according to specified procedures drafted by MSA

Coal of Africa Limited – Vele Colliery – Independent Competent Person’s Report Page 89 of 116
Criteria JORC Code explanation Commentary
logged to a level of detail to support appropriate Mineral Resource estimation,
mining studies and metallurgical studies.
Whether logging is qualitative or quantitative in nature. Core (or costean,
channel, etc) photography.
The total length and percentage of the relevant intersections logged.
and adopted by CoAL. The logging is of sufficient detail to support Coal
Resource Estimation, mining studies and processing studies.
The logging is quantitative and qualitative and the core has been
photographed since CoAL has been involved in the project
Sub-sampling
techniques and
sample
preparation
If core, whether cut or sawn and whether quarter, half or all core taken.
If non-core, whether riffled, tube sampled, rotary split, etc and whether
sampled wet or dry.
For all sample types, the nature, quality and appropriateness of the sample
preparation technique.
Quality control procedures adopted for all sub-sampling stages to maximise
representivity of samples.
Measures taken to ensure that the sampling is representative of the in situ
material collected, including for instance results for field duplicate/second-half
sampling.
Whether sample sizes are appropriate to the grain size of the material being
sampled.
All the core that intersected coal seams were sampled
All sample preparation techniques are done in accordance to internationally
accepted standards
Whole core is sampled and samplers have to ensure that all material,
especially fines, are collected with the core sample
The sample sizes are adequate for the grain sizes of the material being
sampled
Quality of assay
data and
laboratory tests
The nature, quality and appropriateness of the assaying and laboratory
procedures used and whether the technique is considered partial or total.
For geophysical tools, spectrometers, handheld XRF instruments, etc, the
parameters used in determining the analysis including instrument make and
model, reading times, calibrations factors applied and their derivation, etc.
Nature of quality control procedures adopted (eg standards, blanks,
duplicates, external laboratory checks) and whether acceptable levels of
accuracy (ie lack of bias) and precision have been established.
All laboratories used are accredited with SANAS and all assay techniques are
done in accordance to internationally accepted standards
Internal laboratory control measures are in place. Duplicate samples are
analysed and if the difference between two duplicates are outside of
acceptable ranges. Analyses will be redone and instruments calibrated.
A reference sample is entered with each bath on each shift to verify analyses
Verification of
sampling and
assaying
The verification of significant intersections by either independent or
alternative company personnel.
The use of twinned holes.
Documentation of primary data, data entry procedures, data verification, data
storage (physical and electronic) protocols.
Discuss any adjustment to assay data.
Result can be verified against wire-line logs. The dataset has been audited on
two occasions by independent third parties
No twin drill holes have been used because with seam correlation typical
analysis for each seam intersection can be assessed
All data is stored on a SableTM database with a back-up stored at Coal head
offices
No adjustments to assay values have been made
Location of data Accuracy and quality of surveys used to locate drill holes (collar and down-
hole surveys), trenches, mine workings and other locations used in Mineral
All drill holes have been surveyed after they were completed from a fixed
point base station by registered surveyors. The method employed is adequate

Coal of Africa Limited – Vele Colliery – Independent Competent Person’s Report Page 90 of 116
Criteria JORC Code explanation Commentary
points Resource estimation.
Specification of the grid system used.
Quality and adequacy of topographic control.
for Coal Resource Estimations
The survey system is WGS Hartebeeshoek 84 LO29
The topography has been created through a LIDAR survey with a high spatial
accuracy
Data spacing
and distribution
Data spacing for reporting of Exploration Results.
Whether the data spacing and distribution is sufficient to establish the degree
of geological and grade continuity appropriate for the Mineral Resource and
Ore Reserve estimation procedure(s) and classifications applied.
Whether sample compositing has been applied.
Data points are spaced between 200m and 500m
Correlation cross drilling indicates that the spacing between data points are
sufficient knowledge regarding structural and quality continuity to be used in
Coal Resource and Coal Reserve estimations with a low level of risk
If more than one sample was taken across a composite coal seam the samples
were composited in to one sample representing the coal seam thickness
Orientation of
data in relation
to geological
structure
Whether the orientation of sampling achieves unbiased sampling of possible
structures and the extent to which this is known, considering the deposit type.
If the relationship between the drilling orientation and the orientation of key
mineralised structures is considered to have introduced a sampling bias, this
should be assessed and reported if material.
The coal seams have a very low dip angle of 2 degrees. Therefore horizontal
drilling achieves a unbiased sample intersection
The drilling orientation is parallel to faults and dolerite dykes. These structures
are normally identified through geophysical surveys and not exploration and
resource drilling
Sample security The measures taken to ensure sample security. Samples were locked up on site and transported by CoAL personnel to
assaying laboratories
Audits or
reviews
The results of any audits or reviews of sampling techniques and data. Previous reviews by the Mineral Corporation and Venmyn Rand did not
uncover any issues with the methodologies applied.

Coal of Africa Limited – Vele Colliery – Independent Competent Person’s Report Page 91 of 116
Section 2 Reporting of Exploration Results
(Criteria listed in the preceding section also apply to this section.)
Criteria JORC Code explanation Commentary
Mineral
tenement and
land tenure
status
Type, reference name/number, location and ownership including agreements
or material issues with third parties such as joint ventures, partnerships,
overriding royalties, native title interests, historical sites, wilderness or
national park and environmental settings.
The security of the tenure held at the time of reporting along with any known
impediments to obtaining a licence to operate in the area.
Refer to section for Details on Tenure
Currently there is no impediments of which VBKom is aware that is a risk to
the security of tenure for the Vele Colliery
Exploration
done by other
parties
Acknowledgment and appraisal of exploration by other parties. Previous exploration activities completed by Southern Sphere is adjudicated as
of sufficient quality to include in to the Coal Resource estimation
Geology Deposit type, geological setting and style of mineralisation. The deposit type and the controls on the deposit is very well understood
Drill hole
Information
A summary of all information material to the understanding of the exploration
results including a tabulation of the following information for all Material drill
holes:
easting and northing of the drill hole collar
elevation or RL (Reduced Level – elevation above sea level in metres) of the
drill hole collar
dip and azimuth of the hole
down hole length and interception depth
hole length.
If the exclusion of this information is justified on the basis that the information
is not Material and this exclusion does not detract from the understanding of
the report, the Competent Person should clearly explain why this is the case.
Refer to appendix 3 for the full details regarding the drill holes included in the
geological modelling and Coal Resource estimation
The drill holes excluded from the model and estimation will not have a
material effect on the model and estimation
Data
aggregation
methods
In reporting Exploration Results, weighting averaging techniques, maximum
and/or minimum grade truncations (eg cutting of high grades) and cut-off
grades are usually Material and should be stated.
Where aggregate intercepts incorporate short lengths of high grade results
and longer lengths of low grade results, the procedure used for such
aggregation should be stated and some typical examples of such aggregations
should be shown in detail.
The assumptions used for any reporting of metal equivalent values should be
Data is aggregated on tonnes
No other data manipulation is conducted
All sample lengths were controlled by seam thickness and aggregation
occurred based on length and mass
No other economic mineral occurs with the coal deposit so no equivalent
grades were reported

Coal of Africa Limited – Vele Colliery – Independent Competent Person’s Report Page 92 of 116
Criteria JORC Code explanation Commentary
clearly stated.
Relationship
between
mineralisation
widths and
intercept
lengths
These relationships are particularly important in the reporting of Exploration
Results.
If the geometry of the mineralisation with respect to the drill hole angle is
known, its nature should be reported.
If it is not known and only the down hole lengths are reported, there should
be a clear statement to this effect (eg ‘down hole length, true width not
known’).
The relationship with the seam geometry is well understood. The seams dips
at 2 degrees and it can be accepted for the purpose of modelling that the drill
hole intercept the seams at 90 degrees.
Diagrams Appropriate maps and sections (with scales) and tabulations of intercepts
should be included for any significant discovery being reported These should
include, but not be limited to a plan view of drill hole collar locations and
appropriate sectional views.
Appropriate maps and diagrams are presented that included drill hole collar
positions
Balanced
reporting
Where comprehensive reporting of all Exploration Results is not practicable,
representative reporting of both low and high grades and/or widths should be
practiced to avoid misleading reporting of Exploration Results.
The report is comprehensive with regards to reporting seam thicknesses and
qualities
Other
substantive
exploration data
Other exploration data, if meaningful and material, should be reported
including (but not limited to): geological observations; geophysical survey
results; geochemical survey results; bulk samples – size and method of
treatment; metallurgical test results; bulk density, groundwater, geotechnical
and rock characteristics; potential deleterious or contaminating substances.
All material and meaning full data is reported on in the report
Further work The nature and scale of planned further work (eg tests for lateral extensions
or depth extensions or large-scale step-out drilling).
Diagrams clearly highlighting the areas of possible extensions, including the
main geological interpretations and future drilling areas, provided this
information is not commercially sensitive.
The area is constrained to the north by and international border between
South Africa and Zimbabwe. The deposit out crops to the south and east. A
national park border to the west.

Coal of Africa Limited – Vele Colliery – Independent Competent Person’s Report Page 93 of 116
Section 3 Estimation and Reporting of Mineral Resources
(Criteria listed in section 1, and where relevant in section 2, also apply to this section.)
Criteria JORC Code explanation Commentary
Database
integrity
Measures taken to ensure that data has not been corrupted by, for example,
transcription or keying errors, between its initial collection and its use for
Mineral Resource estimation purposes.
Data validation procedures used.
Hand written data was captured into electronic format by CoAL personnel.
Random checks were done to ensure data was correctly captured. The process
has also been submitted for auditing by independent third parties
Data was validated by CoAL’s Chief geologist.
Site visits Comment on any site visits undertaken by the Competent Person and the
outcome of those visits.
If no site visits have been undertaken indicate why this is the case.
The site was visited by Mr B.W. Botha on 26 November 2015 to validate the
asset mentioned in the report
Geological
interpretation
Confidence in (or conversely, the uncertainty of) the geological interpretation
of the mineral deposit.
Nature of the data used and of any assumptions made.
The effect, if any, of alternative interpretations on Mineral Resource
estimation.
The use of geology in guiding and controlling Mineral Resource estimation.
The factors affecting continuity both of grade and geology.
There is a high confidence in the geological model as stratified coal deposits
are very well understood deposits.
Only data gathered from drill holes (diamond and percussion) was used to
construct the geological model
No other geological interpretation is feasible for the deposit type and there
will have no bearing on the Mineral Resource Estimation.
The Coal Resource estimation is controlled by the geology i.e. constrained
within
Dimensions The extent and variability of the Mineral Resource expressed as length (along
strike or otherwise), plan width, and depth below surface to the upper and
lower limits of the Mineral Resource.
The dimensions of the deposit is documented and illustrated with the aid of
diagrams in the text
Estimation and
modelling
techniques
The nature and appropriateness of the estimation technique(s) applied and
key assumptions, including treatment of extreme grade values, domaining,
interpolation parameters and maximum distance of extrapolation from data
points. If a computer assisted estimation method was chosen include a
description of computer software and parameters used.
The availability of check estimates, previous estimates and/or mine
production records and whether the Mineral Resource estimate takes
appropriate account of such data.
The assumptions made regarding recovery of by-products.
Estimation of deleterious elements or other non-grade variables of economic
significance (eg sulphur for acid mine drainage characterisation).
In the case of block model interpolation, the block size in relation to the
average sample spacing and the search employed.
The Coal Resource estimation is done by the gridding algorithm that is part of
the MINEXtm, which is a well-established method for estimation in the coal
industry. No domaining was done for the quality estimate, but was applied
with the seam thickness estimation based on faults and dykes
The Mineral Resource estimate was previously done by the Mineral
Corporation and Venmyn Rand and was reviewed by VBKom. The mine
extracted 144kt of coal and this was considered in the estimation of the Coal
Resources.
There is no by-products present in the coal deposit
Sulphur and phosphorous was analysed for and is estimated within the
geological model. Sulphur is reported in the Coal Resource Statement, but
phosphorous is excluded due to the low concentrations present.
The model is based on a grid and not blocks

Coal of Africa Limited – Vele Colliery – Independent Competent Person’s Report Page 94 of 116
Criteria JORC Code explanation Commentary
Any assumptions behind modelling of selective mining units.
Any assumptions about correlation between variables.
Description of how the geological interpretation was used to control the
resource estimates.
Discussion of basis for using or not using grade cutting or capping.
The process of validation, the checking process used, the comparison of model
data to drill hole data, and use of reconciliation data if available.
All units i.e. seams are modelled based on drill hole seam intersections and
down-hole geophysical survey
There is a correlation between ash and CV in the deposit and is used as
verification of estimated results
All estimations were constrained within the defined coal seams
Coal is defined as material below 60% ash content. This is the only form of
capping applied
The data is validated through cross sections and various coal quality plots
Moisture Whether the tonnages are estimated on a dry basis or with natural moisture,
and the method of determination of the moisture content.
Tonnages are reported as air dried inclusive of the inherent moisture
Cut-off
parameters
The basis of the adopted cut-off grade(s) or quality parameters applied. Volatile less than 18 (dried ash free) was excluded to ensure no devolatilised
coal was included in the geological model
Mining factors
or assumptions
Assumptions made regarding possible mining methods, minimum mining
dimensions and internal (or, if applicable, external) mining dilution. It is always
necessary as part of the process of determining reasonable prospects for
eventual economic extraction to consider potential mining methods, but the
assumptions made regarding mining methods and parameters when
estimating Mineral Resources may not always be rigorous. Where this is the
case, this should be reported with an explanation of the basis of the mining
assumptions made.
The project has been commissioned, but is now under care and maintenance.
Studies have been done to convert the Coal Resources to Coal Reserves and
the conclusion was that most of the resource is economically extractable
Metallurgical
factors or
assumptions
The basis for assumptions or predictions regarding metallurgical amenability.
It is always necessary as part of the process of determining reasonable
prospects for eventual economic extraction to consider potential metallurgical
methods, but the assumptions regarding metallurgical treatment processes
and parameters made when reporting Mineral Resources may not always be
rigorous. Where this is the case, this should be reported with an explanation
of the basis of the metallurgical assumptions made.
The project has been commissioned, but is now under care and maintenance.
Studies have been done to convert the Coal Resources to Coal Reserves and
the conclusion was that most of the resource is beneficiatable to a saleable
product either in the domestic market or international market
Environmental
factors or
assumptions
Assumptions made regarding possible waste and process residue disposal
options. It is always necessary as part of the process of determining
reasonable prospects for eventual economic extraction to consider the
potential environmental impacts of the mining and processing operation.
While at this stage the determination of potential environmental impacts,
particularly for a greenfields project, may not always be well advanced, the
The area under the current mining Right has an approved Environmental
Management Programme based on an Environmental Impact Assessment
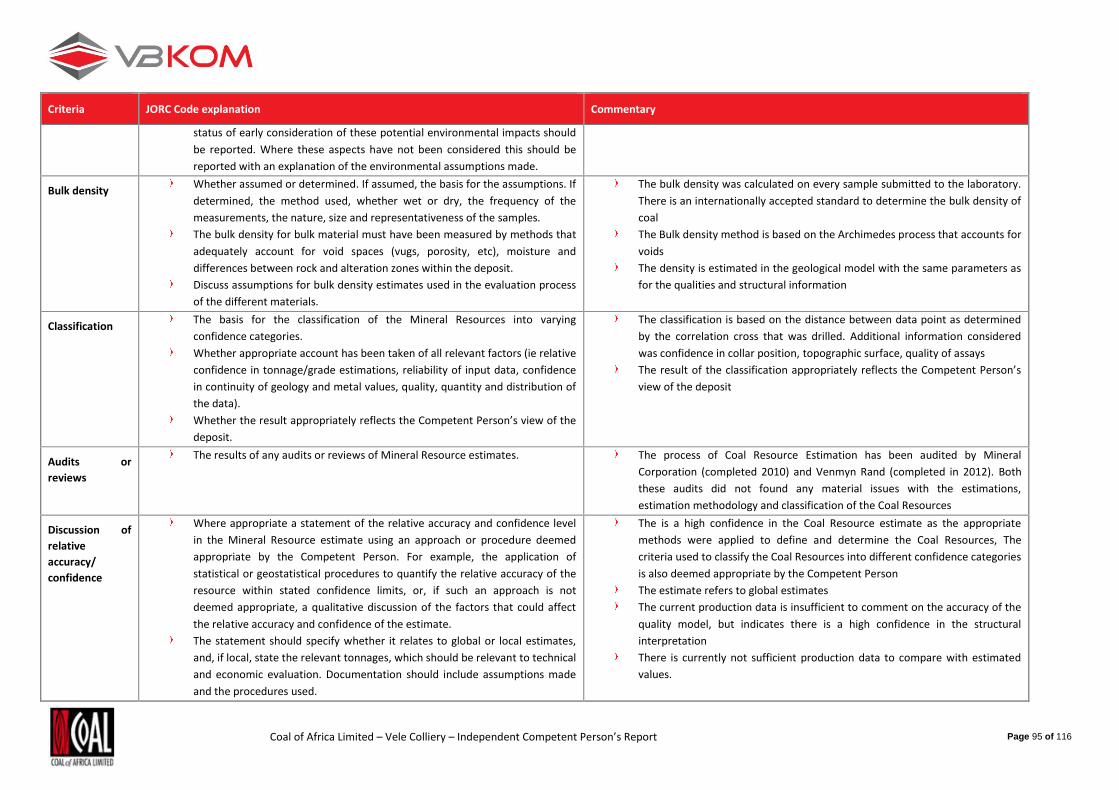
Coal of Africa Limited – Vele Colliery – Independent Competent Person’s Report Page 95 of 116
Criteria JORC Code explanation Commentary
status of early consideration of these potential environmental impacts should
be reported. Where these aspects have not been considered this should be
reported with an explanation of the environmental assumptions made.
Bulk density Whether assumed or determined. If assumed, the basis for the assumptions. If
determined, the method used, whether wet or dry, the frequency of the
measurements, the nature, size and representativeness of the samples.
The bulk density for bulk material must have been measured by methods that
adequately account for void spaces (vugs, porosity, etc), moisture and
differences between rock and alteration zones within the deposit.
Discuss assumptions for bulk density estimates used in the evaluation process
of the different materials.
The bulk density was calculated on every sample submitted to the laboratory.
There is an internationally accepted standard to determine the bulk density of
coal
The Bulk density method is based on the Archimedes process that accounts for
voids
The density is estimated in the geological model with the same parameters as
for the qualities and structural information
Classification The basis for the classification of the Mineral Resources into varying
confidence categories.
Whether appropriate account has been taken of all relevant factors (ie relative
confidence in tonnage/grade estimations, reliability of input data, confidence
in continuity of geology and metal values, quality, quantity and distribution of
the data).
Whether the result appropriately reflects the Competent Person’s view of the
deposit.
The classification is based on the distance between data point as determined
by the correlation cross that was drilled. Additional information considered
was confidence in collar position, topographic surface, quality of assays
The result of the classification appropriately reflects the Competent Person’s
view of the deposit
Audits or
reviews
The results of any audits or reviews of Mineral Resource estimates. The process of Coal Resource Estimation has been audited by Mineral
Corporation (completed 2010) and Venmyn Rand (completed in 2012). Both
these audits did not found any material issues with the estimations,
estimation methodology and classification of the Coal Resources
Discussion of
relative
accuracy/
confidence
Where appropriate a statement of the relative accuracy and confidence level
in the Mineral Resource estimate using an approach or procedure deemed
appropriate by the Competent Person. For example, the application of
statistical or geostatistical procedures to quantify the relative accuracy of the
resource within stated confidence limits, or, if such an approach is not
deemed appropriate, a qualitative discussion of the factors that could affect
the relative accuracy and confidence of the estimate.
The statement should specify whether it relates to global or local estimates,
and, if local, state the relevant tonnages, which should be relevant to technical
and economic evaluation. Documentation should include assumptions made
and the procedures used.
The is a high confidence in the Coal Resource estimate as the appropriate
methods were applied to define and determine the Coal Resources, The
criteria used to classify the Coal Resources into different confidence categories
is also deemed appropriate by the Competent Person
The estimate refers to global estimates
The current production data is insufficient to comment on the accuracy of the
quality model, but indicates there is a high confidence in the structural
interpretation
There is currently not sufficient production data to compare with estimated
values.

Coal of Africa Limited – Vele Colliery – Independent Competent Person’s Report Page 96 of 116
Criteria JORC Code explanation Commentary
These statements of relative accuracy and confidence of the estimate should
be compared with production data, where available.

Coal of Africa Limited – Vele Colliery – Independent Competent Person’s Report Page 97 of 116
Section 4 Estimation and Reporting of Ore Reserves
(Criteria listed in section 1, and where relevant in sections 2 and 3, also apply to this section.)
Criteria JORC Code explanation Commentary
Coal Resource estimate for conversion to Ore Reserves
Description of the Coal Resource estimate used as a basis for the conversion
to an Ore Reserve.
Clear statement as to whether the Coal Resources are reported additional to,
or inclusive of, the Ore Reserves.
Coal Resource Statement are MTIS resource.
Coal Resources are reported inclusive of Coal Reserves
Site visits Comment on any site visits undertaken by the Competent Person and the
outcome of those visits.
If no site visits have been undertaken indicate why this is the case.
Mr’s BW Botha and B Steyn undertook a site visit on 26 November 2015.
Assets of the Vele Colliery were verified
Study status The type and level of study undertaken to enable Coal Resources to be
converted to Ore Reserves.
The Code requires that a study to at least Pre-Feasibility Study level has been
undertaken to convert Coal Resources to Ore Reserves. Such studies will have
been carried out and will have determined a mine plan that is technically
achievable and economically viable, and that material Modifying Factors have
been considered.
Vele Colliery has completed various studies on the mining and processing
plant of sufficient levels (comparable with pre-feasibility studies) to justify the
conversion from Coal Resources to Coal Reserves.
Cut-off parameters
The basis of the cut-off grade(s) or quality parameters applied. Most of the cut-off grades were applied to the Coal Resource in the
calculation MTIS resources. The only other mining cut-off applied is that the
Bottom Lower Seam has to be more than 60m underground to be extracted.
This is required to extract the Coal Reserves safely.
Mining factors or assumptions
The method and assumptions used as reported in the Pre-Feasibility or
Feasibility Study to convert the Coal Resource to an Ore Reserve (i.e. either by
application of appropriate factors by optimisation or by preliminary or
detailed design).
The choice, nature and appropriateness of the selected mining method(s) and
other mining parameters including associated design issues such as pre-strip,
access, etc.
The assumptions made regarding geotechnical parameters (eg pit slopes,
stope sizes, etc), grade control and pre-production drilling.
The major assumptions made and Coal Resource model used for pit and stope
optimisation (if appropriate).
The mining dilution factors used.
For the PMP design localised optimisation was achieved through mine lay-out
and scheduling of the col to the plant.
The additional RoM was based on opencastable reserves and underground
designs based on the Salamon formula.
The mining methods chosen is well known and applicable to this type of
deposit
Geotechnical studies was used to define the opencast pit geometry. The open
pit is also regularly inspected to ensure compliance to the design criteria
The Salamon formula was used for the underground design
An additional 5% geological loss was applied
Mining recovery of 92% applied
Minimum seam thickness for the opencast is 0.5m and 1.4m for the

Coal of Africa Limited – Vele Colliery – Independent Competent Person’s Report Page 98 of 116
Criteria JORC Code explanation Commentary
The mining recovery factors used.
Any minimum mining widths used.
The manner in which Inferred Coal Resources are utilised in mining studies
and the sensitivity of the outcome to their inclusion.
The infrastructure requirements of the selected mining methods.
underground sections
Inferred Resource are not present in the PMP on which the business case is
build. Inferred Resources occur only much later in the LoM, and can be
addressed with infill drilling
All infrastructure for the PMP is already been built when the mine was in
operation
Grade control drilling will 50m x 100m and has been planned for in the mining
schedule
Metallurgical factors or assumptions
The metallurgical process proposed and the appropriateness of that process to
the style of mineralisation.
Whether the metallurgical process is well-tested technology or novel in
nature.
The nature, amount and representativeness of metallurgical test work
undertaken, the nature of the metallurgical domaining applied and the
corresponding metallurgical recovery factors applied.
Any assumptions or allowances made for deleterious elements.
The existence of any bulk sample or pilot scale test work and the degree to
which such samples are considered representative of the orebody as a whole.
For minerals that are defined by a specification, has the ore reserve estimation
been based on the appropriate mineralogy to meet the specifications?
The current process plant and the proposed modification to the plant is well
known technology in the coal mining industry
A total of 39 LDD holes have been drilled over the Central – and Northern Pit
to provide a high confidence in the yield for the PMP mining operation
There are no deleterious elements occurring within the coal deposit with
significant amount to warrant allowances for such elements
The metallurgical test work is based on drop shatter and wet tumble test. The
yield distribution per sixe fraction was used to optimise the product mix and
the coal preparation plant. The samples tested is representative for the PMP
project.
The Coal Reserves are based saleable product
Environmental The status of studies of potential environmental impacts of the mining and
processing operation. Details of waste rock characterisation and the
consideration of potential sites, status of design options considered and,
where applicable, the status of approvals for process residue storage and
waste dumps should be reported.
Huge amount of environmental studies have been undertaken on the Vele
Colliery.
All requirement of the Department of Environmental Affairs have been met
and the mine has an approved EMP as well as an updated IWUL [January
2016].
Infrastructure The existence of appropriate infrastructure: availability of land for plant
development, power, water, transportation (particularly for bulk
commodities), labour, accommodation; or the ease with which the
infrastructure can be provided, or accessed.
Most of the required infrastructure has already been constructed on site. The
power lines from Pontdrift is 78% completed with some servitudes still
pending.
All labour will be sourced from local communities and towns and no
accommodation will be provided
Infrastructure for the underground sections will only be constructed when the
mine moves into these areas
Costs The derivation of, or assumptions made, regarding projected capital costs in
the study.
Capital cost are based on tendered quotations
The mine and process plant will be operated by contractors who provided

Coal of Africa Limited – Vele Colliery – Independent Competent Person’s Report Page 99 of 116
Criteria JORC Code explanation Commentary
The methodology used to estimate operating costs.
Allowances made for the content of deleterious elements.
The source of exchange rates used in the study.
Derivation of transportation charges.
The basis for forecasting or source of treatment and refining charges,
penalties for failure to meet specification, etc.
The allowances made for royalties payable, both Government and private.
tendered quotations
There is no deleterious elements present in significant concentrations to be
considered
Exchange rates is based on the financial forecast of varies financial
institutions.
The South African government requires the payment of a royalty in accordance to the
Mineral Resource and Petroleum Development Royalty Act. Provisions for the royalties
have been made based on estimated profit per year
Revenue factors The derivation of, or assumptions made regarding revenue factors including
head grade, metal or commodity price(s) exchange rates, transportation and
treatment charges, penalties, net smelter returns, etc.
The derivation of assumptions made of metal or commodity price(s), for the
principal metals, minerals and co-products.
Product prices is based on the long term estimations of various financial
institutions
All revenue factors were considered and forms part of the Monte Carlo
simulation and the financial model
Market assessment
The demand, supply and stock situation for the particular commodity,
consumption trends and factors likely to affect supply and demand into the
future.
A customer and competitor analysis along with the identification of likely
market windows for the product.
Price and volume forecasts and the basis for these forecasts.
For industrial minerals the customer specification, testing and acceptance
requirements prior to a supply contract.
Market assessment shows thermal coal requirements will increase in India and
South Africa. India will show the most growth in the international thermal coal
market. Eskom, the sole electricity provider in South Africa, will also require
more coal reserves as the reserves in the Mpumalanga Province is almost
depleted.
For coking coal there is a demand locally with Accertol Mital has tested the
SSCC with positive results
Economic The inputs to the economic analysis to produce the net present value (NPV) in
the study, the source and confidence of these economic inputs including
estimated inflation, discount rate, etc.
NPV ranges and sensitivity to variations in the significant assumptions and
inputs.
Monti Carlo analyses has been done with 10 000 integrations. The results of
the Monte Carlo simulation proves the project robust with more than 71.5%
of the integrations with a positive NPV.
All major drivers were identified and used for the simulation
Social The status of agreements with key stakeholders and matters leading to social
licence to operate.
CoAL has endeavoured to include the local communities in the Vele project.
Vele has an approved Social and Labour Plan under the MRPDA, which is
geared to assist the local communities around the mine.
Other To the extent relevant, the impact of the following on the project and/or on
the estimation and classification of the Ore Reserves:
Any identified material naturally occurring risks.
The status of material legal agreements and marketing arrangements.
Vele Colliery was an operating mine and most of the risk to the operation has
been addressed
Significant risk that still remain is the renewal of the Prospecting Right, the
PMP project implementation timeline, and the application for the relocation

Coal of Africa Limited – Vele Colliery – Independent Competent Person’s Report Page 100 of 116
Criteria JORC Code explanation Commentary
The status of governmental agreements and approvals critical to the viability
of the project, such as mineral tenement status, and government and
statutory approvals. There must be reasonable grounds to expect that all
necessary Government approvals will be received within the timeframes
anticipated in the Pre-Feasibility or Feasibility study. Highlight and discuss the
materiality of any unresolved matter that is dependent on a third party on
which extraction of the reserve is contingent.
of a water coarse
Classification The basis for the classification of the Ore Reserves into varying confidence
categories.
Whether the result appropriately reflects the Competent Person’s view of the
deposit.
The proportion of Probable Ore Reserves that have been derived from
Measured Coal Resources (if any).
The Coal Reserve are classified in to different classes based on the level of
confidence in the studies done. For the PMP, which has a detailed mine design
and mine schedule, the Coal Reserves are classified as Proven. For the rest of
the reserves the confidence in the studies are less and these reserves are
classified as Probable Reserves
Audits or reviews The results of any audits or reviews of Ore Reserve estimates. The Coal Reserves were audit by Venmyn Rand in 2012. They found no major
issues in the Coal Reserve Statement
Discussion of relative accuracy/ confidence
Where appropriate a statement of the relative accuracy and confidence level
in the Ore Reserve estimate using an approach or procedure deemed
appropriate by the Competent Person. For example, the application of
statistical or geostatistical procedures to quantify the relative accuracy of the
reserve within stated confidence limits, or, if such an approach is not deemed
appropriate, a qualitative discussion of the factors which could affect the
relative accuracy and confidence of the estimate.
The statement should specify whether it relates to global or local estimates,
and, if local, state the relevant tonnages, which should be relevant to technical
and economic evaluation. Documentation should include assumptions made
and the procedures used.
Accuracy and confidence discussions should extend to specific discussions of
any applied Modifying Factors that may have a material impact on Ore
Reserve viability, or for which there are remaining areas of uncertainty at the
current study stage.
It is recognised that this may not be possible or appropriate in all
circumstances. These statements of relative accuracy and confidence of the
estimate should be compared with production data, where available.
Based on the information presented and the results of previous audits a high
level of confidence can be placed on the Coal Reserve estimation
The reserves are based on global estimates
There is not sufficient production data available to verify the Coal Reserve
estimation with actual production data

Coal of Africa Limited (CoAL) – Vele Colliery – Competent Person’s Report Page 101 of 116
APPENDIX 2: COUNTRY PROFILE
Republic of South Africa
South Africa gained independence from Britain on 31st May 1910 and was declared a republic in 1961. From 1948 until 1990, the South
African political and legal system was based upon apartheid, a philosophy of separate racial development, underwritten and enforced by
white minority governments. After an extended period of international political pressure and economic sanctions against South Africa’s
policies, the South African government agreed to negotiate a new democratic constitution. In April 1994, the African National Congress
(ANC) became the first democratically elected ruling party. The new constitutional Bill of Rights provides extensive guarantees, including
equality before the law and a prohibition against discrimination; the right to life, privacy, property, freedom and security of the person, a
prohibition against forced labour; and the freedom of speech.
Economy
South Africa is considered to have the most advanced economy on the African continent and it also provides the gateway to Sub-Saharan
Africa. It is classified as a middle-income emerging market with well-developed financial, legal and judicial systems and modern
infrastructure.
South Africa’s gross domestic product is estimated at US$527.4bn for 2005 with an annual real growth rate of 4.5 per cent. South Africa’s
inflation rate has decreased over the last ten years and is estimated at 4.6 per cent for 2005. South Africa’s exports amounted to
US$50.9bn for 2005.
Minerals Industry
South Africa has a mature minerals industry developed from gold and diamond discoveries in the late 1800’s. The country is the world’s
largest producer of platinum, gold, chrome and vanadium and ranks highly in the production of coal, diamonds, iron ore and other base
metals. The country’s minerals industry has primarily been developed by large mining houses over the last century. South Africa hosts a
number of large ore bodies, such as the Bushveld Igneous Complex and Witwatersrand Basin, as well as extensive coal fields. In terms of
the Mineral and Petroleum Resources Development Act 280 of 2002 (“MPRDA”) are owned by the State. Currently, the greatest risks
pertaining to the mining industry in South Africa are the uncertainties arising from the new legislation. These uncertainties relate to
security of tenure i.e. the issuing of new order rights and the conversion of old order rights, as well as meeting the Black Economic
Empowerment (“BEE”) requirements.
Mining Title
The mining industry in South Africa has traditionally been controlled by the “big six” mining houses: Anglo American - De Beers, Gencor -
Billiton, Goldfields, JCI, Anglovaal and Rand Mines, which dominated gold, platinum, chrome, coal and base metal production in South
Africa. With a new democratic constitution and rising costs from ageing mines came sweeping changes in the industry.
Historical Perspective - Legislative Development
Since about 1860, mining regulation in South Africa has continuously evolved to keep pace with changing technological, economic, and
socio-political needs to grow and sustain the country’s world-class mining industry.
Enactment of the Minerals Act, No. 50 of 1991 (Minerals Act) marked the consolidation of a substantial legislative modernisation that
began in the 1960s. After the first democratic elections in 1994, all government policies and legislation were subject to fundamental
review. A White Paper (governmental discussion document) on minerals and mining policy was published in October 1998. Mine health
and safety was given first priority with enactment of The Mine Health and Safety Act, 1996 (Act No 29 of 1996). The Parliament of South
Africa passed The Mineral and Petroleum Resources Development Act, 2002 (MPRDA) in August 2002, which was subsequently
promulgated by the State President (Government Gazette, 1 May 2004). The MPRDA accordingly took effect from 1 May 2004 onward.
Mineral and Petroleum Resources Development Act, 2002
The MPRDA sets out the mechanics for converting mineral rights previously held under the Minerals Act to mineral rights recognised
under the MPRDA. Accordingly, in addition to describing the new legislation, the following sections also refer to relevant background and
provisions of the Minerals Act.
From Private Ownership to State Custodianship
Unique features of the Minerals Act were that it allowed mineral rights to be held privately and that these rights were severable from
rights to particular minerals and surface rights in a particular property. Over the years, the South African system of mineral rights had
consequently developed into a dual system in which some mineral rights were owned by the State and some by private holders (mostly
farmers). This was on the basis that, in the South African context, mineral rights are a common-law concept as opposed to the situation in
most other countries where mineral rights are granted by the State in terms of mineral legislation.

Coal of Africa Limited (CoAL) – Vele Colliery – Competent Person’s Report Page 102 of 116
This concept of state custodianship of mineral rights (now embodied in the MPRDA) has now replaced the common law principles
previously embodied in the Minerals Act. Enactment of the MPRDA now places South Africa in line with global mineral ownership
principles.
MPRDA - Mechanics
The two-stage system under the Minerals Act, that required consent from the mineral owner and subsequent application to the state for
a prospecting or mining authorisation, has now been replaced under the MPRDA by providing for the Minister to grant prospecting and
mining rights directly.
Prospecting and mining rights are limited real rights in respect of the minerals and the land concerned, which entitle the holder not only
to prospect or mine but to carry out all other activities incidental to prospecting or mining. These rights can also generally be traded with
the consent of the Minister.
A prospecting right may be granted for up to five years and may be renewed once for a period not exceeding three years. Mining rights
are granted for a maximum of 30 years but are renewable for an indefinite number of further periods, each of which may not exceed 30
years. Security in the transition between prospecting and mining is enhanced in that the MPRDA stipulates that the holder of a
prospecting right has the exclusive right to apply for and be granted a mining right.
Unlike the Minerals Act, in terms of which all applications for the same mineral on the same land have to be treated as competing
applications, the new MPRDA provides that applications received on different dates will be dealt with in order of receipt. Only those
received on the same day will consequently become competing applications. Another important improvement over the Minerals Act is
the provision for the disclosure of prospecting information once prospecting has been completed. This requirement should significantly
reduce exploration costs in previously explored areas.
The MPRDA has allowed a significant number of international junior mining and exploration companies to become active in the country
for the first time.
Transitional Arrangements
The objects of Schedule II of the MPRDA are to:-
ensure that security of tenure is protected in respect of prospecting and mining operations being undertaken;
give the holder of an old-order right an opportunity to comply with the new MPRDA; and
promote equitable access to the nation’s mineral resources;
In order to ensure a smooth transition, all applications for Prospecting Rights, mining authorisations, consent to prospect or mine, and all
environmental management programmes which had been lodged in terms of the Minerals Act, but not finalised or approved before 1
May 2004 (the date on which the new MPRDA took effect), are regarded as having been lodged in terms of the MPRDA.
Schedule II of the MPRDA places rights previously recognised under the Minerals Act into four main categories.
The following definitions stated in Schedule II of the MPRDA are important:-
‘“old order prospecting right” – means any prospecting lease, permission, consent, permit or licence, and the rights attached
thereto, listed in Table 1 to this Schedule in force immediately before the date on which this Act took effect (1 May 2004) and in
respect of which prospecting is being conducted;
“old order right” – means an old order mining right, old order prospecting right or unused old order right, as the case may be;
“unused old order right” – means any right, entitlement, permit or license listed in Table 3 to this Schedule in respect of which
no prospecting or mining was conducted before this Act took effect;
Any old-order prospecting right, as substantiated by a valid Prospecting Right issued in terms of the Minerals Act, continued to be in force
until 1 May 2006, subject to the terms and conditions under which it was granted, provided that the holder lodged the right for
conversion within the preceding two-year period together with certain prescribed information. A specific requirement for conversion was
that prospecting operations must have been conducted on the property prior to conversion and certified that the intention to continue
prospecting existed.
Similarly, any old-order mining right, as substantiated by a valid mining authorisation issued in terms of the Minerals Act, continued to be
in force for a period of five years until 1 May 2009 (the effective date of MPRDA), subject to the terms and conditions under which it was
granted, provided that the holder lodges the right for conversion within a five-year period together with certain prescribed information.
Of special importance are the requirements that mining operations must have been conducted on the property, the intention to continue
mining, as well as submission of a prescribed social and labour plan. The applicant for conversion must also provide an undertaking that,
with details of the manner in which, he or she will give effect to the objects of the MPRDA pertaining to empowerment of HDSA and
economic growth and development.
Unused old-order rights, i.e. rights in respect of which no prospecting or mining was being conducted immediately before 1 May 2004,
continued to be in force for up to one year until 1 May 2005. Within this period of one year, the holder of such an unused old-order right
had the exclusive right to apply for a prospecting or mining right in terms of the MPRDA.

Coal of Africa Limited (CoAL) – Vele Colliery – Competent Person’s Report Page 103 of 116
Environmental management programmes approved in terms of the Minerals Act will remain in force under the MPRDA.
Empowerment Charter and Scorecard
Recognising South Africa’s unique history and in pursuance of the objects of the MPRDA, Section 100 requires the Minister to develop a
broad-based Socio-Economic Empowerment Charter that will set the framework, targets and timetable for effecting the entry of HDSA
into the mining industry. Since it is a specific requirement of the MPRDA that the granting of a mining right will expand opportunities for
HDSA, this important Charter was released in October 2002, well in advance of the coming into operation of the MPRDA.
Targets, timeframes and commitments are discussed in respect of each of the following facets of empowerment:-
Human resource development.
Employment equity (target: 40% participation in management by HDSA in 5 years).
Non-discrimination against foreign migrant labour.
Mine community and rural development.
Housing and living conditions.
Procurement.
Ownership and joint ventures (target: 26% ownership by HDSA in 10 years).
Beneficiation.
A scorecard has been developed to measure the performance of each mining company in respect of each of these facets. In practice, this
will be used to judge applications for mining rights as well as applications for converting old-order mining licenses into new-order mining
rights.
Environmental Management
The MPRDA’s requirements for environmental management during prospecting and mining operations are largely similar to those
contained in the Minerals Act. However, now they have been aligned with the principles and objectives of the National Environmental
Management Act, 1998 (Act No 107 of 1998), which is the principal Act governing all environmental matters in South Africa.
Applicants for a mining right are required to conduct an environmental impact assessment and submit an environmental management
programme, while applicants for a prospecting right, mining permit or reconnaissance permission have to submit an environmental
management plan. Prospecting and mining rights only become effective on the date that the corresponding environmental management
plan or programme has been approved.
In view of long delays, that have often been experienced during the processing of environmental management programmes in terms of
the Minerals Act, new time limits for consultation and approval, stipulated by the MPRDA, are to be welcomed. Other government
departments now have 60 days in which to comment on environmental management plans or programmes and approval must be done
within 120 days from lodgement of the plan or programme.
Requirements for making financial provision for the remediation of environmental damage, as well as for the issuing of a closure
certificate, are now included in the MPRDA as opposed to the situation under the Minerals Act where they were dealt with in terms of
regulations issued under the Minerals Act. New features include the requirement that financial provision must be in place before
approval of the environmental management plan or programme and the fact that application for a closure certificate now becomes
compulsory upon lapsing of the right or cessation of activities.
The Mineral and Petroleum Royalty Bill
The logical conclusion of the South African Government’s programme to reform the existing minerals and mining laws is that the State,
now the custodian of those minerals, will impose a royalty. This will bring the South African dispensation in line with most of the other
major mining jurisdictions in the world, e.g. Canada, Australia, USA. The Government intends to provide for imposition of royalties in the
Mineral and Petroleum Royalty Bill.
The revised bill defines the base of the royalty as “the aggregate of amounts received by or accrued to the extractor” minus beneficiation
cost and transport charges between seller and buyer of the concentrate. The off-mine charges are therefore been deductible from the
royalty base. The implementation date of the Royalty Bill was 1 May 2009, but this has been deferred to 2010.
Electronic copies of the MPRDA and other regulations can be found at the DMR’s website:
www.dmr.gov.za.

Coal of Africa Limited (CoAL) – Vele Colliery – Competent Person’s Report Page 104 of 116
APPENDIX 3: DRILL HOLES USED IN GEOLOGICAL MODEL: Drill Hole Name Easting Northing Elevation Depth (m) Azimuth Dip Type
AL120001 63522.06 -2451882.07 486.95 128.65 0 -90 CZA
AL837001 62906.88 -2454307.21 510.11 51.28 0 -90 CZA
AL837002 61800.69 -2455003.72 522.40 57.47 0 -90 CZA
AL837003 61457.40 -2455649.81 530.51 72.35 0 -90 CZA
AL837004 59544.55 -2456400.29 526.99 123.23 0 -90 CZA
AL837005 59558.97 -2455665.57 520.20 84.25 0 -90 CZA
AL837007 60374.35 -2454705.73 513.29 87.29 0 -90 CZA
AL837008 59673.56 -2454983.19 512.86 67.47 0 -90 CZA
AL837009 58872.08 -2455255.98 513.09 102.16 0 -90 CZA
AL837010 58779.09 -2454599.78 506.96 108.25 0 -90 CZA
AL837011 58344.51 -2454348.12 504.11 111.28 0 -90 CZA
AL837012 59201.05 -2453872.80 502.24 94.75 0 -90 CZA
AL837013 60293.18 -2454064.81 506.97 69.25 0 -90 CZA
AL837014 60608.74 -2452806.30 495.62 111.34 0 -90 CZA
AL837015 59539.08 -2453460.45 499.73 105.18 0 -90 CZA
AL837016 59660.34 -2452892.91 495.37 120.99 0 -90 CZA
BS10SL18 69387.65 -2449571.93 485.66 50.88 0 -90 SBL
BS10SM07 61863.72 -2453387.89 503.76 87.35 0 -90 CBS
BS11SL18 69387.65 -2449571.93 485.66 50.70 0 -90 SBL
BS12SL32 68950.45 -2449999.13 481.22 43.25 0 -90 SBL
BS12SM07 61864.06 -2453393.86 503.93 87.35 0 -90 CBS
BS13SL32 68950.45 -2449999.13 481.22 49.96 0 -90 SBL
BS13SM07 61869.13 -2453372.84 503.56 87.35 0 -90 CBS
BS14SL32 68950.45 -2449998.93 481.22 48.69 0 -90 SBL
BS14SM07 61869.72 -2453383.52 503.79 87.35 0 -90 CBS
BS15SL32 68950.45 -2449999.13 481.22 49.70 0 -90 BLB
BS15SM07 61874.18 -2453383.48 503.77 87.35 0 -90 CBS
BS16SL32 68950.45 -2449999.13 481.22 49.70 0 -90 SBL
BS17SL32 68950.45 -2449999.13 481.22 50.20 0 -90 BLB
BS18SL32 68950.45 -2449999.13 481.22 50.47 0 -90 BLB
BS19SL32 68950.45 -2449999.13 481.22 48.57 0 -90 BLB
BS1OV13 66026.25 -2451984.91 511.20 78.09 0 -90 CBS
BS1OV24 68844.02 -2450754.26 491.86 77.75 0 -90 CBS
BS1SM07 61870.63 -2453378.73 503.51 87.35 0 -90 CBS
BS20SL32 68950.45 -2449999.13 481.22 47.80 0 -90 SBL
BS21SL32 68950.45 -2449999.13 481.22 49.10 0 -90 BLB
BS22SL32 68950.45 -2449999.13 481.22 52.30 0 -90 SBL
BS25SL32 68950.45 -2449999.13 481.22 49.42 0 -90 BLB
BS28SL32 68950.45 -2449999.13 481.22 49.70 0 -90 SBL
BS2OV13 66028.46 -2451980.55 511.26 78.09 0 -90 CBS
BS2OV24 68843.60 -2450747.90 491.84 77.75 0 -90 CBS
BS2SM07 61858.21 -2453381.03 503.73 87.35 0 -90 CBS
BS31SL31 69683.55 -2450340.22 495.80 58.90 0 -90 BLB
BS32SL31 69683.55 -2450340.22 495.80 58.60 0 -90 SBL
BS33SL31 69683.55 -2450340.22 495.80 58.10 0 -90 SBL
BS34SL31 69683.55 -2450340.22 495.80 57.48 0 -90 SBL
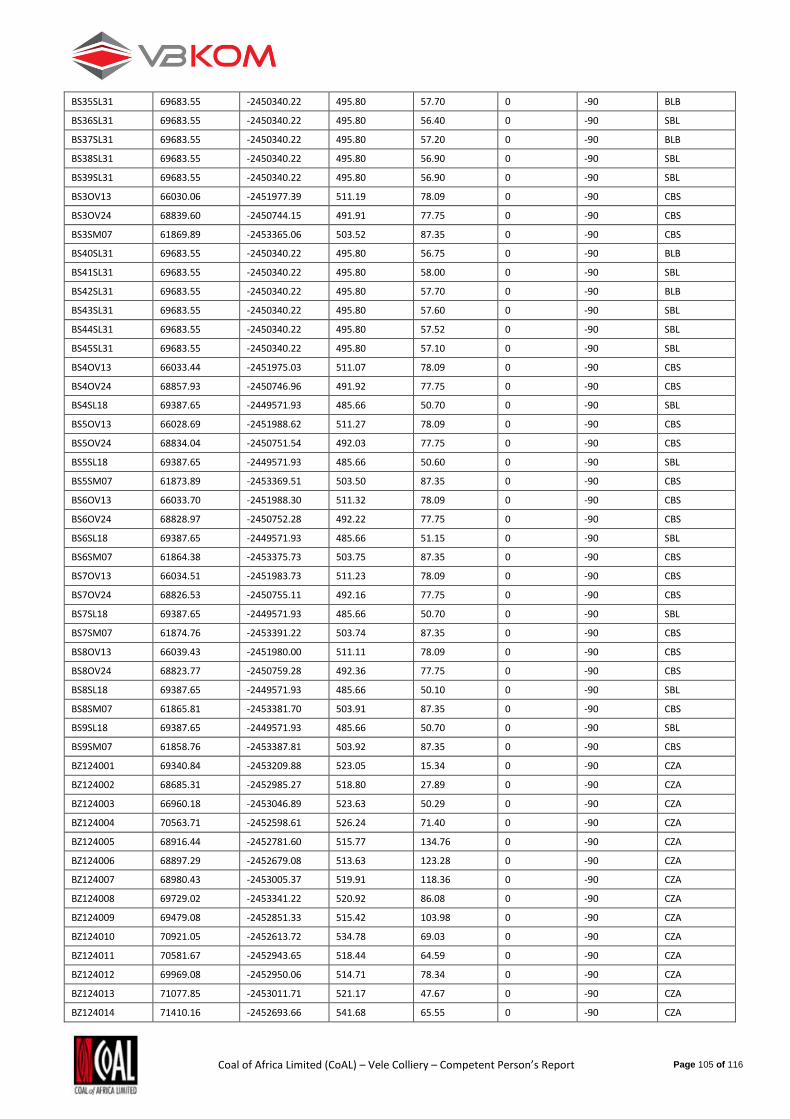
Coal of Africa Limited (CoAL) – Vele Colliery – Competent Person’s Report Page 105 of 116
BS35SL31 69683.55 -2450340.22 495.80 57.70 0 -90 BLB
BS36SL31 69683.55 -2450340.22 495.80 56.40 0 -90 SBL
BS37SL31 69683.55 -2450340.22 495.80 57.20 0 -90 BLB
BS38SL31 69683.55 -2450340.22 495.80 56.90 0 -90 SBL
BS39SL31 69683.55 -2450340.22 495.80 56.90 0 -90 SBL
BS3OV13 66030.06 -2451977.39 511.19 78.09 0 -90 CBS
BS3OV24 68839.60 -2450744.15 491.91 77.75 0 -90 CBS
BS3SM07 61869.89 -2453365.06 503.52 87.35 0 -90 CBS
BS40SL31 69683.55 -2450340.22 495.80 56.75 0 -90 BLB
BS41SL31 69683.55 -2450340.22 495.80 58.00 0 -90 SBL
BS42SL31 69683.55 -2450340.22 495.80 57.70 0 -90 BLB
BS43SL31 69683.55 -2450340.22 495.80 57.60 0 -90 SBL
BS44SL31 69683.55 -2450340.22 495.80 57.52 0 -90 SBL
BS45SL31 69683.55 -2450340.22 495.80 57.10 0 -90 SBL
BS4OV13 66033.44 -2451975.03 511.07 78.09 0 -90 CBS
BS4OV24 68857.93 -2450746.96 491.92 77.75 0 -90 CBS
BS4SL18 69387.65 -2449571.93 485.66 50.70 0 -90 SBL
BS5OV13 66028.69 -2451988.62 511.27 78.09 0 -90 CBS
BS5OV24 68834.04 -2450751.54 492.03 77.75 0 -90 CBS
BS5SL18 69387.65 -2449571.93 485.66 50.60 0 -90 SBL
BS5SM07 61873.89 -2453369.51 503.50 87.35 0 -90 CBS
BS6OV13 66033.70 -2451988.30 511.32 78.09 0 -90 CBS
BS6OV24 68828.97 -2450752.28 492.22 77.75 0 -90 CBS
BS6SL18 69387.65 -2449571.93 485.66 51.15 0 -90 SBL
BS6SM07 61864.38 -2453375.73 503.75 87.35 0 -90 CBS
BS7OV13 66034.51 -2451983.73 511.23 78.09 0 -90 CBS
BS7OV24 68826.53 -2450755.11 492.16 77.75 0 -90 CBS
BS7SL18 69387.65 -2449571.93 485.66 50.70 0 -90 SBL
BS7SM07 61874.76 -2453391.22 503.74 87.35 0 -90 CBS
BS8OV13 66039.43 -2451980.00 511.11 78.09 0 -90 CBS
BS8OV24 68823.77 -2450759.28 492.36 77.75 0 -90 CBS
BS8SL18 69387.65 -2449571.93 485.66 50.10 0 -90 SBL
BS8SM07 61865.81 -2453381.70 503.91 87.35 0 -90 CBS
BS9SL18 69387.65 -2449571.93 485.66 50.70 0 -90 SBL
BS9SM07 61858.76 -2453387.81 503.92 87.35 0 -90 CBS
BZ124001 69340.84 -2453209.88 523.05 15.34 0 -90 CZA
BZ124002 68685.31 -2452985.27 518.80 27.89 0 -90 CZA
BZ124003 66960.18 -2453046.89 523.63 50.29 0 -90 CZA
BZ124004 70563.71 -2452598.61 526.24 71.40 0 -90 CZA
BZ124005 68916.44 -2452781.60 515.77 134.76 0 -90 CZA
BZ124006 68897.29 -2452679.08 513.63 123.28 0 -90 CZA
BZ124007 68980.43 -2453005.37 519.91 118.36 0 -90 CZA
BZ124008 69729.02 -2453341.22 520.92 86.08 0 -90 CZA
BZ124009 69479.08 -2452851.33 515.42 103.98 0 -90 CZA
BZ124010 70921.05 -2452613.72 534.78 69.03 0 -90 CZA
BZ124011 70581.67 -2452943.65 518.44 64.59 0 -90 CZA
BZ124012 69969.08 -2452950.06 514.71 78.34 0 -90 CZA
BZ124013 71077.85 -2453011.71 521.17 47.67 0 -90 CZA
BZ124014 71410.16 -2452693.66 541.68 65.55 0 -90 CZA

Coal of Africa Limited (CoAL) – Vele Colliery – Competent Person’s Report Page 106 of 116
BZ124015 68408.36 -2452923.52 516.87 29.60 0 -90 CZA
BZ124016 68300.14 -2452781.61 514.18 119.00 0 -90 CZA
CP09BS02 69581.74 -2451199.03 479.05 23.07 0 -90 MA
CP10BS01 69877.42 -2450921.26 493.75 28.87 0 -90 MA
CP10BS02 69751.71 -2451080.14 490.90 26.22 0 -90 MA
CP10BS03 69647.60 -2451222.15 492.25 32.33 0 -90 MA
CP10BS04 69566.59 -2451277.76 491.63 35.26 0 -90 MA
CP11BS01 69589.02 -2451347.61 493.34 31.50 0 -90 CZBS
CP11BS02 69593.27 -2451347.37 493.24 33.50 0 -90 CZBS
CP12BS01 69895.85 -2451077.08 502.29 34.40 0 -90 CZBS
CP17BS01 69620.23 -2451759.99 508.32 55.88 0 -90 CZBS
CP17BS02 69625.08 -2451762.57 508.17 55.45 0 -90 CZBS
CP17BS03 69624.37 -2451753.22 508.15 65.14 0 -90 CZBS
CP17BS04 69625.99 -2451757.12 507.88 65.21 0 -90 CZBS
MB001 69559.58 -2451105.22 474.61 17.67 0 -90 MA
MB002 69544.21 -2451097.41 475.26 16.37 0 -90 MA
MB003 69517.21 -2451131.24 475.63 17.88 0 -90 MA
MB004 69500.44 -2451156.24 475.70 21.11 0 -90 MA
MB006 69523.76 -2451176.89 477.40 27.35 0 -90 MA
MB008 69543.94 -2451153.36 475.22 22.41 0 -90 MA
MB009 69572.83 -2451126.72 474.77 20.77 0 -90 MA
MB010 69537.73 -2451128.29 475.60 16.50 0 -90 MA
MB011 69591.94 -2451108.90 474.64 19.27 0 -90
MB012 69584.80 -2451085.75 473.28 17.16 0 -90 MA
MB013 69679.72 -2451049.36 480.51 27.32 0 -90 MA
MB013A 69690.23 -2451035.53 480.73 27.31 0 -90 MA
MB014 69708.59 -2451062.92 480.77 19.41 0 -90 MA
MB015 69697.93 -2451075.46 480.67 26.60 0 -90 MA
MB016 69663.03 -2451078.05 479.95 27.24 0 -90 MA
MB017 69676.77 -2451100.47 479.49 27.65 0 -90 MA
MB018 69644.72 -2451095.46 479.18 27.24 0 -90 MA
MB019 69659.28 -2451121.64 478.88 27.57 0 -90 MA
MB020 69617.08 -2451117.49 478.31 26.99 0 -90 MA
MB021 69641.98 -2451141.86 478.88 27.25 0 -90 MA
MB022 69593.64 -2451138.71 480.11 27.70 0 -90 MA
MB023 69570.02 -2451164.41 479.39 27.24 0 -90 MA
MB025 69559.88 -2451179.05 481.08 27.24 0 -90 MA
MB027 69544.94 -2451210.41 485.83 26.07 0 -90 MA
MB028 69566.69 -2451219.63 485.16 26.39 0 -90 MA
MB029 69557.46 -2451228.49 486.83 26.27 0 -90 MA
MB030 69732.83 -2451048.99 490.76 25.78 0 -90 MA
MB031 69739.00 -2451041.06 490.46 26.29 0 -90 MA
MB032 69743.82 -2451035.49 490.70 27.68 0 -90 MA
MB033 69751.67 -2451025.93 491.18 26.84 0 -90 MA
MB034 69761.50 -2451014.49 491.94 27.35 0 -90 MA
MB035 69711.78 -2451026.59 489.69 26.99 0 -90 MA
MB036 69725.47 -2451010.07 489.78 27.68 0 -90 MA
MB037 69732.05 -2451002.31 490.07 25.96 0 -90 MA
MB038 69696.31 -2451014.99 488.75 25.04 0 -90 MA

Coal of Africa Limited (CoAL) – Vele Colliery – Competent Person’s Report Page 107 of 116
MB039 69704.22 -2451004.95 488.70 27.24 0 -90 MA
MB041 69717.40 -2450989.74 489.81 14.54 0 -90 MA
MB042 69683.42 -2450999.43 488.95 26.70 0 -90 MA
MB043 69696.69 -2450984.23 489.40 27.78 0 -90 MA
MB044 69702.39 -2450977.75 489.48 26.90 0 -90 MA
MB045 69659.77 -2450980.79 488.81 24.73 0 -90 MA
MB046 69664.87 -2450974.14 488.92 26.25 0 -90 MA
MB047 69672.85 -2450964.29 488.98 24.54 0 -90 MA
MB048 69679.14 -2450957.08 489.07 23.94 0 -90 MA
MB049 69685.38 -2450949.69 489.36 27.78 0 -90 MA
MB050 69693.73 -2450939.81 490.08 14.23 0 -90 MA
MB051 69777.42 -2450995.50 492.65 20.55 0 -90 MA
MB052 69666.51 -2451209.19 492.92 17.02 0 -90 MA
MB053 69658.68 -2451218.93 492.57 27.49 0 -90 MA
MB054 69658.42 -2451228.90 492.37 20.17 0 -90 MA
MB055 69885.68 -2450948.92 494.35 23.84 0 -90 MA
MB056 69633.16 -2451248.95 492.58 25.45 0 -90 MA
MB057 69861.49 -2450977.49 493.72 26.36 0 -90 MA
MB058 69617.39 -2451268.22 493.11 25.15 0 -90 MA
MB059 69609.39 -2451277.76 492.77 26.85 0 -90 MA
MB060 69600.61 -2451288.34 492.32 27.48 0 -90 MA
MB061 69592.45 -2451297.45 491.89 27.46 0 -90 MA
MB062 69584.44 -2451307.37 491.92 20.91 0 -90 MA
MB063 69576.24 -2451316.91 491.76 27.15 0 -90 MA
MB064 69569.86 -2451327.19 491.67 16.96 0 -90 MA
MB065 69559.64 -2451336.99 491.57 17.74 0 -90 MA
MB066 69835.95 -2451008.27 493.31 18.19 0 -90 MA
MB067 69805.30 -2451044.66 492.96 21.20 0 -90 MA
MB068 69750.95 -2451109.58 491.92 19.46 0 -90 MA
MB069 69726.37 -2450906.75 490.23 27.50 0 -90 MA
MB070 69737.36 -2450892.89 489.80 26.10 0 -90 MA
MB071 69744.91 -2450883.94 489.80 24.40 0 -90 MA
MB072 69761.59 -2450937.47 490.66 25.77 0 -90 MA
MB073 69773.62 -2450923.31 489.50 25.15 0 -90 MA
MB074 69781.15 -2450914.40 489.02 27.50 0 -90 MA
MB075 69796.20 -2450968.07 489.43 26.60 0 -90 MA
MB076 69808.58 -2450953.81 489.86 27.10 0 -90 MA
MB077 69816.31 -2450944.69 490.56 26.90 0 -90 MA
MB078 69737.63 -2451094.23 491.13 27.48 0 -90 MA
MB079 69749.84 -2451079.53 490.98 27.51 0 -90 MA
MB080 69762.25 -2451064.64 491.18 27.26 0 -90 MA
MB081 69774.77 -2451049.80 491.36 27.17 0 -90 MA
MB082 69769.81 -2451045.20 490.87 10.61 0 -90 MA
MB083 69787.62 -2451057.20 492.23 24.04 0 -90 MA
MB084 69771.39 -2451076.02 491.53 27.43 0 -90 MA
MB085 69762.16 -2451086.28 491.55 27.60 0 -90 MA
MB086 69747.68 -2451094.27 491.08 27.42 0 -90 MA
MB087 69697.03 -2450961.27 467.18 9.46 0 -90 MA
MB088 69688.43 -2450971.73 466.55 7.54 0 -90 MA

Coal of Africa Limited (CoAL) – Vele Colliery – Competent Person’s Report Page 108 of 116
MB089 69682.31 -2450979.94 465.63 6.81 0 -90 MA
MB090 69819.10 -2450808.56 491.66 26.59 0 -90 MA
MB091 69893.00 -2450756.94 492.52 27.42 0 -90 MA
MB092 69871.76 -2450779.21 493.48 27.51 0 -90 MA
MB093 69851.37 -2450803.11 492.33 21.92 0 -90 MA
MB094 69832.71 -2450823.15 491.07 21.92 0 -90 MA
MB096 69899.14 -2450785.33 493.12 25.38 0 -90 MA
MB097 69887.14 -2450802.69 493.22 26.96 0 -90 MA
MB098 69874.19 -2450816.80 492.64 25.24 0 -90 MA
MB099 69837.21 -2450789.48 492.48 26.69 0 -90 MA
MB100 69856.58 -2450774.66 493.00 27.57 0 -90 MA
MB101 69868.68 -2450763.19 492.92 26.47 0 -90 MA
MB102 69877.24 -2450753.53 492.62 26.47 0 -90 MA
MB103 69885.81 -2450833.17 492.35 27.05 0 -90 MA
MB104 69866.36 -2450855.24 492.67 24.50 0 -90 MA
MB105 69890.45 -2450862.16 493.93 27.73 0 -90 MA
MB106 69579.74 -2451254.19 492.14 27.62 0 -90 MA
MB107 69601.07 -2451236.44 491.95 22.44 0 -90 MA
MB108 69629.81 -2451209.22 491.96 25.23 0 -90 MA
MB109 69644.54 -2451191.38 492.68 27.00 0 -90 MA
MB110 69671.46 -2451160.45 493.09 26.79 0 -90 MA
MB111 69710.19 -2451114.92 490.82 24.78 0 -90 MA
MB112 69722.94 -2451099.75 490.92 27.18 0 -90 MA
MB113 69742.43 -2451115.85 492.10 27.08 0 -90 MA
MB114 69730.84 -2451129.81 492.58 27.08 0 -90 MA
MB115 69716.82 -2451146.20 493.58 26.88 0 -90 MA
MB116 69704.17 -2451161.63 493.82 27.35 0 -90 MA
MB117 69690.89 -2451176.05 493.57 25.17 0 -90 MA
MB118 69678.49 -2451190.28 493.18 25.17 0 -90 MA
MB119 69665.27 -2451205.79 492.98 27.02 0 -90 MA
MB120 69564.57 -2451253.10 490.26 23.90 0 -90 MA
MB121 69583.52 -2451268.90 489.96 26.30 0 -90 MA
MB122 69549.13 -2451271.46 490.02 25.70 0 -90 MA
MB123 69529.35 -2451295.05 490.69 26.10 0 -90 MA
MB124 69546.17 -2451309.24 491.17 26.60 0 -90 MA
MB125 69514.60 -2451312.92 491.60 23.60 0 -90 MA
MB126 69564.80 -2451287.20 491.40 25.50 0 -90 MA
MB127 69744.37 -2451194.48 493.21 27.09 0 -90 MA
MB128 69765.20 -2451169.43 492.48 27.43 0 -90 MA
MB129 69784.41 -2451146.33 492.76 25.98 0 -90 MA
MB130 69800.50 -2451127.31 492.94 21.22 0 -90 MA
MB131 69816.22 -2451108.19 493.12 27.65 0 -90 MA
MB132 69834.00 -2451087.14 493.52 24.93 0 -90 MA
MB133 69853.63 -2451064.29 494.27 27.07 0 -90 MA
MB134 69867.95 -2451046.79 495.08 27.45 0 -90 MA
MB135 69886.57 -2451003.56 494.70 27.41 0 -90 MA
MB136 69908.92 -2450976.28 494.02 24.90 0 -90 MA
MB137 69612.48 -2451320.74 492.13 26.34 0 -90 MA
MB138 69636.63 -2451294.23 489.86 27.37 0 -90 MA

Coal of Africa Limited (CoAL) – Vele Colliery – Competent Person’s Report Page 109 of 116
MB139 69660.06 -2451267.88 489.78 27.59 0 -90 MA
MB140 69686.77 -2451237.74 490.24 27.49 0 -90 MA
MB141 69707.53 -2451214.67 490.57 27.33 0 -90 MA
NPS1A 69255.81 -2450459.99 491.48 66.84 0 -90 CZBS
NPS1B 69261.25 -2450460.51 491.58 55.50 0 -90 CZBS
OV125001 64260.50 -2451695.69 494.42 108.20 0 -90 CZA
OV125002 64226.19 -2453414.88 510.54 74.72 0 -90 CZA
OV125003 64266.58 -2452307.19 498.22 89.75 0 -90 CZA
OV125004 63842.57 -2451270.77 487.73 89.71 0 -90 CZA
OV125005 63552.95 -2452768.66 493.57 83.75 0 -90 CZA
OV125006 64989.55 -2452110.40 502.53 80.40 0 -90 CZA
OV125007 65261.01 -2451569.86 501.09 86.75 0 -90 CZA
OV125008 66129.24 -2453079.26 524.08 48.15 0 -90 CZA
OV125009 65204.26 -2453238.31 513.87 56.65 0 -90 CZA
OV125010 65901.87 -2451506.10 504.51 172.69 0 -90 CZA
OV125011 67887.05 -2452112.88 510.34 145.13 0 -90 CZA
OV125012 67764.70 -2451256.37 501.97 106.42 0 -90 CZA
OV125013 66032.31 -2451983.23 510.79 78.09 0 -90 CZA
OV125014 65892.37 -2450526.72 493.97 123.24 0 -90 CZA
OV125015 65877.48 -2449481.13 485.80 163.64 0 -90 CZA
OV125016 66892.71 -2452485.36 516.62 66.33 0 -90 CZA
OV125017 66883.74 -2451540.69 507.10 158.00 0 -90 CZA
OV125018 66900.46 -2450741.74 498.31 130.27 0 -90 CZA
OV125019 66867.51 -2449479.67 487.53 136.05 0 -90 CZA
OV125020 67648.30 -2450501.59 493.23 93.14 0 -90 CZA
OV125021 67903.73 -2449492.97 483.03 130.18 0 -90 CZA
OV125022 68893.47 -2452484.20 509.95 105.60 0 -90 CZA
OV125023 68941.02 -2451537.33 497.65 65.52 0 -90 CZA
OV125024 68840.05 -2450753.60 491.63 77.75 0 -90 CZA
OV125025 68798.40 -2449493.18 478.99 69.10 0 -90 CZA
OV125026 69897.67 -2452502.60 509.18 84.65 0 -90 CZA
OV125027 69888.43 -2451480.53 503.93 50.72 0 -90 CZA
OV125028 69886.19 -2450446.55 499.65 81.60 0 -90 CZA
OV125029 69916.68 -2449515.97 488.54 65.55 0 -90 CZA
OV125031 70895.00 -2451445.00 495.21 29.16 0 -90 CZA
OV125032 70894.01 -2450450.60 486.39 14.78 0 -90 CZA
OV125033 71024.31 -2449588.80 476.56 23.70 0 -90 CZA
OV125034 64956.91 -2450291.61 487.18 156.77 0 -90 CZA
OV125035 68620.00 -2450083.99 486.83 69.28 0 -90 CZA
OV125036 67996.00 -2452793.99 515.58 119.75 0 -90 CZA
OV125037 64564.88 -2451046.84 491.67 112.24 0 -90 CZA
OV125038 68002.00 -2448597.00 481.07 91.18 0 -90 BLB
OV125039 63042.87 -2453360.23 501.84 65.78 0 -90 CZA
OV125040 66950.48 -2448779.29 484.10 106.23 0 -90 CZA
OV125041 62889.34 -2451615.29 486.45 107.55 0 -90 CZA
OV125042 65817.66 -2448918.52 483.21 82.28 0 -90 CZA
OV125043 64914.03 -2449420.23 484.36 119.80 0 -90 CZA
OV125044 62536.91 -2452566.28 493.35 98.65 0 -90 CZA
OV125045 68513.59 -2452725.59 514.93 139.27 0 -90 CZA

Coal of Africa Limited (CoAL) – Vele Colliery – Competent Person’s Report Page 110 of 116
OV125046 71176.33 -2452299.12 537.38 69.74 0 -90 CZA
OV125047 66105.13 -2451859.21 509.36 28.81 0 -90 CZA
OV125048 66305.26 -2451867.04 510.02 163.78 0 -90 CZA
OV125049 66636.37 -2451966.93 511.58 160.50 0 -90 CZA
OV125051 66405.58 -2452106.16 512.68 73.56 0 -90 CZA
OV125052 66648.50 -2452319.73 515.84 61.56 0 -90 CZA
OV125053 66259.53 -2451970.04 511.13 83.52 0 -90 CZA
OV125054 66659.88 -2452179.60 513.67 71.50 0 -90 CZA
OV125055 66390.74 -2452291.49 514.35 69.40 0 -90 CZA
OV125056 66102.65 -2452175.47 512.73 72.46 0 -90 CZA
OV125060 66689.85 -2452076.99 513.22 139.60 0 -90 CZA
OV125063 66800.60 -2452288.60 515.46 66.22 0 -90 CZA
OV125064 66676.95 -2452799.05 521.11 61.56 0 -90 CZA
OV125065 66427.09 -2451028.28 501.47 127.32 0 -90 CZA
OV125066 67318.82 -2450995.14 500.01 129.06 0 -90 CZA
OV125067 67500.39 -2451747.59 506.26 155.55 0 -90 CZA
OV125068 67548.34 -2452741.32 516.42 46.05 0 -90 CZA
OV125069 65718.76 -2449938.00 489.50 127.61 0 -90 CZA
OV125070 66393.34 -2449990.57 492.52 128.60 0 -90 CZA
OV125071 65593.82 -2449096.62 482.73 101.55 0 -90 CZA
OV125072 66455.49 -2449193.88 485.57 114.63 0 -90 CZA
OV125073 69596.01 -2450821.95 492.90 91.61 0 -90 CZA
OV125074 70523.83 -2450796.45 492.22 63.89 0 -90 CZA
OV125075 70435.06 -2450747.12 502.25 25.61 0 -90 CZA
OV125076 70341.26 -2450707.17 510.94 29.26 0 -90 CZA
OV125077 70182.57 -2450813.94 530.03 53.06 0 -90 CZA
OV125078 70224.03 -2450758.99 532.08 54.03 0 -90 CZA
OV125079 70070.65 -2450631.02 530.08 56.06 0 -90 CZA
OV125080 70006.47 -2450706.99 528.89 56.16 0 -90 CZA
OV125081 69718.09 -2450929.93 502.83 57.29 0 -90 CZA
OV125082 69791.74 -2450901.41 510.26 60.02 0 -90 CZA
OV125083 70045.11 -2450938.97 512.18 38.21 0 -90 CZA
OV125084 69957.70 -2450905.85 514.83 54.25 0 -90 CZA
OV125085 70063.90 -2451031.20 518.55 44.21 0 -90 CZA
OV125086 69863.17 -2450913.02 512.52 60.08 0 -90 CZA
OV125087 69960.76 -2451229.27 520.24 65.01 0 -90 CZA
OV125088 69870.85 -2451126.99 506.12 46.99 0 -90 CZA
OV125089 69440.19 -2451346.99 502.94 56.11 0 -90 CZA
OV125090 67558.85 -2450052.78 489.53 92.86 0 -90 CZA
OV125091 67433.53 -2449080.45 484.39 103.67 0 -90 CZA
OV125092 66550.00 -2448650.00 485.29 100.30 0 -90 CZA
OV125093 67291.99 -2448273.13 482.77 93.25 0 -90 CZA
OV125094 68515.95 -2451865.31 502.98 99.88 0 -90 CZA
OV125095 68387.28 -2451061.74 497.74 90.15 0 -90 CZA
OV125096 68151.81 -2449857.68 485.70 75.00 0 -90 CZA
OV125097 67994.14 -2449021.90 481.31 23.33 0 -90 CZA
OV125098 68477.49 -2449303.91 479.48 63.21 0 -90 CZA
OV125099 70554.78 -2449968.21 492.89 22.17 0 -90 CZA
OV125100 70072.82 -2450157.69 503.43 77.11 0 -90 CZA

Coal of Africa Limited (CoAL) – Vele Colliery – Competent Person’s Report Page 111 of 116
OV125101 70362.96 -2449865.41 506.78 81.55 0 -90 CZA
OV125102 70246.05 -2450200.03 483.54 26.01 0 -90 CZA
OV125103 70363.47 -2450010.63 503.57 73.36 0 -90 CZA
OV125104 69473.69 -2452063.31 502.04 74.11 0 -90 CZA
OV125105 70402.76 -2451898.03 528.07 77.26 0 -90 CZA
OV125106 69774.70 -2450653.95 497.86 79.71 0 -90 CZA
OV125107 69594.92 -2450571.69 491.59 83.21 0 -90 CZA
OV125108 69724.40 -2450741.68 497.66 54.00 0 -90 CZA
OV125109 69129.86 -2451240.12 495.06 82.22 0 -90 CZA
OV125110 69371.65 -2451085.80 492.52 68.85 0 -90 CZA
OV125111 69436.68 -2451209.54 502.06 64.75 0 -90 CZA
OV125112 69248.72 -2450662.30 488.52 61.90 0 -90 CZA
OV125113 68996.01 -2450318.87 483.78 76.25 0 -90 CZA
OV125114 69423.29 -2450122.50 496.56 74.89 0 -90 CZA
OV125115 69338.06 -2449718.68 491.65 66.05 0 -90 CZA
OV125116 69780.14 -2449795.85 499.44 70.85 0 -90 CZA
OV125117 70205.15 -2449443.29 479.20 34.95 0 -90 CZA
OV125118 70250.63 -2449726.25 506.43 69.27 0 -90 CZA
OV125119 69596.66 -2450761.30 493.50 104.68 0 -90 CZA
OV125120 69692.45 -2450332.91 495.70 65.90 0 -90 CZA
OV125121 69419.44 -2450123.32 496.22 57.37 0 -90 CZA
OV125122 70091.46 -2450140.29 502.88 63.86 0 -90 CZA
OV125124 69846.73 -2451231.95 517.14 64.55 0 -90 CZA
OV125125 69568.45 -2451405.41 500.82 52.48 0 -90 CZA
OV125126 69625.88 -2451754.81 508.18 64.03 0 -90 CZA
OV125127 70403.62 -2451898.86 527.34 56.56 0 -90 CZA
OV125128 69887.18 -2451478.72 504.09 51.07 0 -90 CZA
OV125129 70177.96 -2451698.72 526.50 62.77 0 -90 CZA
OV125130 70082.48 -2451968.29 524.09 62.54 0 -90 CZA
OV125131 70424.22 -2451507.04 531.34 53.23 0 -90 CZA
OV125132 70663.66 -2451675.62 536.53 53.87 0 -90 CZA
OV125133 70791.50 -2451834.58 538.72 53.41 0 -90 CZA
OV125134 71048.68 -2452100.78 540.05 56.83 0 -90 CZA
OV125135 69625.06 -2451501.36 502.12 67.86 0 -90 CZA
OV125136 70064.02 -2451239.85 523.45 61.16 0 -90 CZA
OV125137 70291.14 -2451500.12 527.60 56.59 0 -90 CZA
OV12513R 66040.00 -2451983.00 510.50 61.46 0 -90 CZA
OV125140 69953.19 -2449894.62 500.17 53.25 0 -90 CZA
OV125145 70677.00 -2452036.02 533.19 55.40 0 -90 CZA
OV125146 71021.65 -2451885.55 542.44 56.80 0 -90 CZA
OV125147 69503.04 -2449747.43 492.87 53.79 0 -90 CZA
OV125148 69750.65 -2449744.89 498.06 54.97 0 -90 CZA
OV125149 70002.87 -2449747.10 499.94 59.80 0 -90 CZA
OV12514R 65900.00 -2450484.99 493.92 117.59 0 -90 CZA
OV125150 70250.85 -2449747.08 505.28 62.76 0 -90 CZA
OV125151 70472.66 -2449774.98 509.34 53.85 0 -90 CZA
OV125152 69254.40 -2449998.01 491.31 54.67 0 -90 CZA
OV125153 69756.28 -2449995.57 502.62 56.80 0 -90 CZA
OV125154 70002.11 -2449995.98 501.31 59.76 0 -90 CZA

Coal of Africa Limited (CoAL) – Vele Colliery – Competent Person’s Report Page 112 of 116
OV125155 69253.21 -2450250.81 489.44 62.56 0 -90 CZA
OV125156 69744.36 -2450244.58 496.98 59.80 0 -90 CZA
OV125157 69978.56 -2450252.00 502.29 59.72 0 -90 CZA
OV125158 69752.81 -2450497.62 494.06 65.80 0 -90 CZA
OV125159 69128.62 -2451283.55 494.22 65.74 0 -90 CZA
OV125160 69259.12 -2451325.92 493.79 45.14 0 -90 CZA
OV125161 69752.87 -2451370.19 507.99 53.66 0 -90 CZA
OV125162 69880.33 -2451372.84 511.61 52.77 0 -90 CZA
OV125163 70004.68 -2451369.59 517.31 58.97 0 -90 CZA
OV125164 69249.52 -2451498.90 495.27 53.78 0 -90 CZA
OV125165 69128.12 -2451619.49 497.09 65.70 0 -90 CZA
OV125166 69748.03 -2451624.49 503.38 50.74 0 -90 CZA
OV125167 69956.28 -2451604.24 506.00 44.78 0 -90 CZA
OV125168 69377.55 -2449874.33 493.30 60.00 0 -90 COH
OV125169 69627.27 -2449876.14 498.04 60.00 0 -90 COH
OV125170 69870.58 -2449872.69 500.87 60.00 0 -90 CZA
OV125171 70140.83 -2449877.14 501.20 60.00 0 -90 CZA
OV125172 69255.79 -2450119.77 491.24 60.00 0 -90 COH
OV125173 69258.34 -2450371.48 492.45 60.00 0 -90 COH
OV125174 69753.00 -2450371.66 494.94 60.00 0 -90 COH
OV12528R 69802.84 -2450122.07 494.33 77.65 0 -90 CZA
OV12530R 70988.00 -2452153.99 538.10 65.73 0 -90 CZA
OV12547R 66105.13 -2451859.21 509.36 84.30 0 -90 CZA
OV12550R 66176.11 -2452026.51 511.05 74.68 0 -90 CZA
OV125E01 69498.89 -2451499.56 501.69 79.00 0 -90 CZA
OV125E02 69562.33 -2451502.19 502.21 79.00 0 -90 CZA
OV125E04 69688.98 -2451501.95 500.93 67.00 0 -90 CZA
OV125E05 69750.07 -2451499.96 500.05 61.00 0 -90 CZA
OV125E06 69813.81 -2451500.06 501.53 61.00 0 -90 CZA
OV125E07 69880.17 -2451497.11 502.99 67.00 0 -90 CZA
OV125E08 69938.30 -2451500.27 505.70 53.00 0 -90 CZA
OV125E09 70000.13 -2451499.80 507.94 61.00 0 -90 CZA
OV125E12 70193.58 -2451502.57 522.49 60.00 0 -90 CZA
OV125E13 70249.53 -2451501.51 525.75 61.00 0 -90 CZA
OV125E14 70312.70 -2451500.20 527.73 60.00 0 -90 CZA
OV125E15 70375.01 -2451500.00 529.83 68.00 0 -90 CZA
OV125E16 70437.26 -2451499.55 531.81 55.00 0 -90 CZA
OV125E17 70500.01 -2451500.05 534.79 68.00 0 -90 CZA
OV125E18 70563.20 -2451499.39 536.41 55.00 0 -90 CZA
OV125N02 69500.02 -2450937.47 493.81 91.00 0 -90 CZA
OV125N03 69501.20 -2450875.28 493.25 96.00 0 -90 CZA
OV125N04 69500.65 -2450811.22 491.64 100.19 0 -90 CZA
OV125N05 69500.28 -2450749.70 491.37 90.00 0 -90 CZA
OV125N06 69499.74 -2450687.38 490.91 83.00 0 -90 CZA
OV125N07 69501.19 -2450626.91 490.42 66.00 0 -90 CZA
OV125N08 69500.66 -2450562.75 491.53 77.00 0 -90 CZA
OV125N09 69500.14 -2450500.07 491.80 79.00 0 -90 CZA
OV125N10 69500.16 -2450438.91 494.04 80.43 0 -90 CZA
OV125N11 69500.25 -2450374.68 495.63 70.00 0 -90 CZA

Coal of Africa Limited (CoAL) – Vele Colliery – Competent Person’s Report Page 113 of 116
OV125N12 69499.34 -2450312.22 497.79 67.00 0 -90 CZA
OV125N13 69500.68 -2450251.86 498.00 60.00 0 -90 CZA
OV125N14 69502.27 -2450125.50 498.85 61.00 0 -90 CZA
OV125N15 69499.73 -2449998.89 496.38 60.00 0 -90 CZA
OV125S01 69499.67 -2451374.74 500.09 61.00 0 -90 CZA
OV125S02 69499.82 -2451437.23 496.98 61.00 0 -90 CZA
OV125S03 69500.35 -2451562.72 504.06 61.00 0 -90 CZA
OV125S04 69500.02 -2451623.70 506.15 61.00 0 -90 CZA
OV125S05 69499.97 -2451687.61 505.72 61.00 0 -90 CZA
OV125S06 69499.65 -2451749.94 505.15 67.00 0 -90 CZA
OV125S07 69500.15 -2451811.72 502.02 61.00 0 -90 CZA
OV125S08 69500.17 -2451874.24 500.58 60.00 0 -90 CZA
OV125S09 69500.05 -2452075.38 501.57 66.00 0 -90 CZA
OV125S10 69499.90 -2452137.28 503.98 70.00 0 -90 CZA
OV125S11 69500.14 -2452199.71 504.90 70.00 0 -90 CZA
OV125S12 69499.74 -2452250.24 505.44 85.00 0 -90 CZA
OV125W01 69499.62 -2451003.03 494.06 86.00 0 -90 CZA
OV125W02 69437.61 -2450999.56 493.90 96.16 0 -90 CZA
OV125W04 69312.16 -2450999.98 490.99 96.61 0 -90 CZA
OV125W05 69248.41 -2451000.82 491.13 90.60 0 -90 CZA
OV125W06 69187.27 -2450999.91 491.28 70.40 0 -90 CZA
OV125W07 69124.87 -2451000.46 491.32 59.70 0 -90 CZA
OV125W08 69062.56 -2450999.95 491.70 77.00 0 -90 CZA
OV125W09 68999.48 -2451000.46 492.98 74.54 0 -90 CZA
OV125W10 68937.35 -2450999.44 491.99 85.00 0 -90 CZA
OV125W11 68875.30 -2450999.91 493.47 85.00 0 -90 CZA
OV125W12 68812.43 -2450999.21 494.17 85.00 0 -90 CZA
OV125W13 68748.61 -2451000.67 495.05 81.00 0 -90 CZA
OV125W14 68686.86 -2450999.80 495.68 81.00 0 -90 CZA
OV125W15 68625.59 -2450999.90 496.17 86.00 0 -90 CZA
OV125W16 68561.65 -2451000.03 495.43 91.00 0 -90 CZA
OV125W17 68498.03 -2450999.95 496.53 97.00 0 -90 CZA
OV125W18 68249.56 -2450999.65 496.79 97.00 0 -90 CZA
OV157 69997.14 -2450244.47 502.53 49.83 0 -90 CZA
OV160 69253.08 -2451324.58 493.91 44.64 0 -90 CZA
OV24BS01 68834.83 -2450762.05 491.76 63.54 0 -90 CZBS
OV24BS02 68838.39 -2450751.14 491.70 64.10 0 -90 CZBS
OV24BS03 68830.67 -2450762.06 491.80 66.15 0 -90 CZBS
OV24BS04 68837.39 -2450755.52 491.70 64.25 0 -90 CZBS
OV24BS05 68838.30 -2450763.37 491.81 65.27 0 -90 CZBS
OV24BS06 68840.50 -2450758.84 491.84 65.18 0 -90 CZBS
OVOC1 69580.46 -2451097.47 491.39 42.00 0 -90 OBLH
OVOC10 69722.18 -2451100.49 493.24 55.00 0 -90 OBLH
OVOC4 69603.83 -2451014.78 491.27 42.00 0 -90 OBLH
OVOC5 69582.27 -2451038.68 490.53 42.00 0 -90 OBLH
OVOC6 69529.36 -2451024.11 489.15 55.00 0 -90 OBLH
OVOC7 69625.52 -2451026.63 495.79 53.00 0 -90 OBLH
OVOC8 69634.74 -2451108.00 491.27 21.00 0 -90 OBLH
OVOC9 69685.07 -2451132.39 494.14 55.00 0 -90 OBLH

Coal of Africa Limited (CoAL) – Vele Colliery – Competent Person’s Report Page 114 of 116
SL18 69387.65 -2449571.93 485.66 53.00 0 -90 SSP
SL18BS1 69387.65 -2449571.93 485.66 53.58 0 -90 CZA
SL18BS2 69387.65 -2449571.93 485.66 51.12 0 -90 SBS
SL31 69683.55 -2450340.22 495.80 76.03 0 -90 SSP
SL31BS29 69683.55 -2450340.22 495.80 58.20 0 -90 BLB
SL31BS30 69683.55 -2450340.22 495.80 57.70 0 -90 SBS
SL32 68950.45 -2449999.13 481.22 69.84 0 -90 SSP
SL32BS23 68950.45 -2449999.13 481.22 52.00 0 -90 BLB
SL32BS24 68950.45 -2449999.13 481.22 50.50 0 -90 CZA
SL32BS26 68950.45 -2449999.13 481.22 49.80 0 -90 BLB
SL32BS27 68950.45 -2449999.13 481.22 49.66 0 -90 CZA
SL33 66013.06 -2452191.42 512.99 75.56 0 -90 SSP
SL34 68408.05 -2449715.53 482.30 57.79 0 -90 SSP
SL35 68009.95 -2448207.13 482.91 67.60 0 -90 SSP
SL36 65142.56 -2449280.13 483.73 151.97 0 -90 SSP
SL37 68752.05 -2451092.52 495.65 85.60 0 -90 SSP
SL38 68958.75 -2451889.42 500.42 73.55 0 -90 SSP
SL39 69843.45 -2452471.82 508.47 74.80 0 -90 SSP
SL40 64202.36 -2451558.92 492.83 71.71 0 -90 SSP
SL41 67965.45 -2452671.92 514.75 107.46 0 -90 SSP
SL42 64207.56 -2452034.82 493.68 73.07 0 -90 SSP
SL43 64938.36 -2453299.52 513.67 55.52 0 -90 SSP
SL44 66100.46 -2449382.03 485.69 166.21 0 -90 SSP
SL45 67795.45 -2451556.92 505.43 115.95 0 -90 BLB
SL46 65865.76 -2451122.22 500.13 144.07 0 -90 SSP
SL47 67589.75 -2450207.62 490.06 87.03 0 -90 SSP
SL48 67433.35 -2449370.33 485.58 103.27 0 -90 SSP
SL49 66992.65 -2452418.72 514.84 61.64 0 -90 SSP
SL50 70116.95 -2449425.13 480.23 55.11 0 -90 SSP
SL51 70266.65 -2449554.33 488.48 46.31 0 -90 SSP
SL52 70460.15 -2449486.33 487.11 39.29 0 -90 SSP
SL53 70218.55 -2449434.73 479.37 35.11 0 -90 SSP
SL54 70166.45 -2449424.53 479.96 51.09 0 -90 CZA
SL55 71056.14 -2452257.32 536.71 72.16 0 -90 SSP
SL56 70176.25 -2451695.82 526.50 68.68 0 -90 SSP
SL57 70195.35 -2449464.43 480.96 48.87 0 -90 SSP
SL58 70444.45 -2449907.93 506.71 56.45 0 -90 SSP
SL59 70491.85 -2449890.93 503.39 50.54 0 -90 BLB
SL60 62396.86 -2452809.52 495.79 89.77 0 -90 SSP
SL61 62469.36 -2453753.92 506.82 67.12 0 -90 SSP
SL62 70543.15 -2449890.13 497.22 41.41 0 -90 SSP
SL63 64937.96 -2452389.72 504.46 78.43 0 -90 SSP
SL64 70398.75 -2449921.93 506.30 61.47 0 -90 SSP
SL65 71303.54 -2452275.22 525.41 29.20 0 -90 SSP
SL66 71364.44 -2452238.82 517.76 22.63 0 -90 SSP
SL67 70268.75 -2450688.52 521.81 42.55 0 -90 SSP
SL68 70105.45 -2450208.82 503.70 55.05 0 -90 SSP
SL69 70106.75 -2450203.92 503.85 12.00 0 -90 SSP
SL70 70112.85 -2450186.22 504.17 61.76 0 -90 SSP

Coal of Africa Limited (CoAL) – Vele Colliery – Competent Person’s Report Page 115 of 116
SL71 70380.00 -2450568.00 492.45 36.75 0 -90 BLB
SL72 65173.00 -2451778.60 502.42 62.65 0 -90 SSP
SL73 65293.50 -2451603.80 501.84 86.75 0 -90 SSP
SM119001 61739.57 -2451343.06 485.99 92.80 0 -90 BLB
SM119002 61521.66 -2452870.67 497.20 99.55 0 -90 CZA
SM119003 60808.92 -2453378.29 500.94 91.81 0 -90 CZA
SM119004 60859.37 -2454326.14 510.75 72.65 0 -90 CZA
SM119005 61076.59 -2450577.76 489.74 103.23 0 -90 CZA
SM119006 60617.79 -2450124.95 489.23 111.54 0 -90 CZA
SM119007 61867.78 -2453376.54 503.62 87.35 0 -90 CZA
SM119008 60644.73 -2451373.62 489.33 127.23 0 -90 CZA
SM119009 60584.69 -2452369.71 492.12 141.29 0 -90 CZA
SM119010 61965.91 -2453966.75 510.61 68.75 0 -90 CZA
SM119011 61804.03 -2452270.66 490.37 119.85 0 -90 CZA
VS121001 60879.67 -2455988.74 530.86 83.75 0 -90 CZA
VS121002 62006.90 -2456301.07 539.11 57.70 0 -90 CZA
VS121003 60022.01 -2456497.06 531.37 112.43 0 -90 CZA
VS121004 61115.23 -2457405.89 548.63 81.40 0 -90 CZA
VS121005 62545.81 -2455227.15 522.89 42.55 0 -90 CZA
VS121006 63566.71 -2453791.99 508.44 23.70 0 -90 CZA
VS121007 66422.04 -2453989.05 535.32 20.59 0 -90 CZA
VS121008 65348.49 -2454141.95 539.22 31.04 0 -90 CZA
VS121009 64034.22 -2455466.34 542.36 27.35 0 -90 CZA
VS121010 63788.99 -2454423.02 523.84 38.75 0 -90 CZA
VS121011 64100.62 -2455292.56 544.47 43.38 0 -90 CZA
VS121012 66174.81 -2453414.75 529.98 43.57 0 -90 CZA
VS836001 59953.96 -2457119.12 537.48 87.32 0 -90 CZA
VS836002 60626.49 -2457530.09 546.18 81.05 0 -90 CZA
VS836003 60850.83 -2456577.89 537.24 105.35 0 -90 BLB
VS836004 61745.07 -2457883.95 557.10 42.04 0 -90 CZA
VS836005 62217.14 -2455667.05 531.00 45.03 0 -90 CZA
VS836006 63354.63 -2455299.72 540.25 30.30 0 -90 CZA
VS836007 63239.24 -2454714.75 521.13 18.07 0 -90 CZA
VS836008 62884.91 -2453696.37 507.31 34.75 0 -90 CZA
VS836009 64274.38 -2453736.04 516.07 54.32 0 -90 CZA
VS836010 64880.95 -2453557.40 516.75 48.26 0 -90 CZA
VS836011 65680.76 -2453553.61 531.87 24.25 0 -90 CZA

Coal of Africa Limited (CoAL) – Vele Colliery – Competent Person’s Report Page 116 of 116
Descriptions for “TYPE”
Acronym for “TYPE” Description
SBL Old drill holes with core data throughout
CBS Old drill holes with core data from above coal throughout all seams mostly and percussion from surface to coal
BLB Drill holes with core data
CZBS Drill holes with core data (exploration cored holes)
CZI One borehole does not have geology but seams are identified, the rest have data, inclined drill holes
COH Open holes with wireline data
OBLH Mine blast holes with wireline
SBS Old drill holes with core data
SSP Old drill holes with core data
Copyright © 2022 FDOKUMEN