Social movements amidst democratic transitions: Lessons from the Brazilian countryside
Increased Regulatory T-Cell Fraction Amidst a Diminished CD4
Compartment Explains Cellular Immune Defects in Patients
with Malignant Glioma
Peter E. Fecci,1,2Duane A. Mitchell,
1John F. Whitesides,
3Weihua Xie,
1Allan H. Friedman,
1
Gary E. Archer,1James E. Herndon II,
4Darell D. Bigner,
2Glenn Dranoff,
5and John H. Sampson
1,2
1Division of Neurosurgery, Departments of Surgery, 2Pathology, 3Medicine, and 4Biostatistics and Bioinformatics, Duke University MedicalCenter, Durham, North Carolina; and 5Department of Medical Oncology, Dana-Farber Cancer Institute, Department of Medicine,Brigham and Women’s Hospital and Harvard Medical School, Boston, Massachusetts
Abstract
Immunosuppression is frequently associated with malignancyand is particularly severe in patients with malignant glioma.Anergy and counterproductive shifts toward TH2 cytokineproduction are long-recognized T-cell defects in these patientswhose etiology has remained elusive for >30 years. We showhere that absolute counts of both CD4+ T cells andCD4+CD25+FOXP3+CD45RO+ T cells (Tregs) are greatly dimin-ished in patients with malignant glioma, but Tregs frequentlyrepresent an increased fraction of the remaining CD4compartment. This increased Treg fraction, despite reducedcounts, correlates with and is sufficient to elicit the charac-teristic manifestations of impaired patient T-cell responsive-ness in vitro . Furthermore, Treg removal eradicates T-cellproliferative defects and reverses TH2 cytokine shifts, allowingT cells from patients with malignant glioma to functionin vitro at levels equivalent to those of normal, healthycontrols. Such restored immune function may give license tophysiologic antiglioma activity, as in vivo, Treg depletion provespermissive for spontaneous tumor rejection in a murinemodel of established intracranial glioma. These findingsdramatically alter our understanding of depressed cellularimmune function in patients with malignant glioma andadvance a role for Tregs in facilitating tumor immune evasionin the central nervous system. (Cancer Res 2006; 66(6): 3294-302)
Introduction
Patients with malignant glioma exhibit a comprehensivedepression in cellular immune function that has been documentedfor more than three decades (reviewed in ref. 1). Althoughmalignant gliomas remain within the intracranial compartmentand rarely metastasize, immunosuppression in patients is bothsystemic and profound. Deficiencies in T-cell function areespecially well-documented and patient lymphocytes respondpoorly to T-cell mitogens, anti-CD3 monoclonal antibody, andT-dependent B-cell mitogens (2, 3). Although present, neitherlymphopenia nor immunosuppressive factors present in the sera ofpatients entirely explain these deficits, as purified T cells retain asignificant degree of nonresponsiveness even when cultured innormal sera (4, 5). A substantial measure of dysfunction is thereforeintrinsic to the T-cell compartment. More specifically, this
dysfunction seems manifested within the CD4+ T-cell subset (6),whose relative anergy is characterized most broadly by weakenedproliferative responses and insufficient synthesis of the TH1cytokine interleukin 2 (IL-2; refs. 7, 8). Production of other TH1-type cytokines also suffers, whereas TH2-type cytokines aretypically elaborated at elevated levels (9, 10). The etiology of theseT-cell proliferative defects and TH2 cytokine shifts remains poorlyunderstood.We noted that the cellular immune defects delineated for
patients with malignant glioma show remarkable overlap with thetypical consequences of regulatory T-cell (Treg) activity. Tregs are aphysiologic subset of CD4+ T cells expressing high levels of CD25(IL-2Ra; ref. 11), and they potently inhibit T-cell activation andproliferation. Some of this is achieved through down-regulation ofIL-2 production in their target cells (12), a predilection thatrecapitulates a central component of the T-cell anergy observed inpatients with malignant glioma (7, 8). Tregs also inhibit IFN-gproduction (13, 14) and prompt target cells to secrete predom-inantly TH2 cytokines (15), which can propagate the regulatoryphenotype (16, 17). Tregs may elicit tolerance to tumor antigens andsupraphysiologic Treg fractions have been found in the peripheralblood and tumors of patients with a variety of cancers (18–21).We examine the contribution made by Tregs to depressed cellular
immunity in patients with glioblastoma multiforme (GBM), themost common and malignant form of malignant glioma. We findthat Tregs are actually reduced in absolute number in thesepatients who exhibit a substantial reduction in the number ofcirculating CD4+ T cells. Tregs, however, come frequently torepresent an increased fraction of the remaining CD4 compart-ment. Patients with increased Treg fractions are those that showdiminished lymphocyte responsiveness in vitro , and increasingTreg fractions among normal lymphocytes to such elevated levelsproves sufficient to elicit the same impairments. Most importantly,removal of Tregs in vitro eradicates the differences in responsive-ness observed among CD4+ T cells isolated from patients andhealthy volunteers and reverses the predilection toward TH2cytokine production.Together, these results indicate that patient CD4+ T cells are
capable of normal immune function, but are instead hindered byTregs, increased fractions of which seem necessary and sufficient toproduce much of the ‘‘intrinsic’’ T-cell dysfunction in patients withGBM. Restored normal immune function may consist of physio-logic antiglioma activity, as the depletion of Tregs in vivo leadsfrequently to spontaneous tumor rejection in a murine model ofintracranial glioma. These data dramatically alter our approachtoward understanding and addressing depressed cellular immunefunction in patients with GBM.
Requests for reprints: John H. Sampson, Division of Neurosurgery, Department ofSurgery, Duke University Medical Center, 221 Sands Research Building, Durham, NC27710. Phone: 919-684-9041; Fax: 919-684-9045; E-mail: [email protected].
I2006 American Association for Cancer Research.doi:10.1158/0008-5472.CAN-05-3773
Cancer Res 2006; 66: (6). March 15, 2006 3294 www.aacrjournals.org
Research Article
Research. on March 24, 2016. © 2006 American Association for Cancercancerres.aacrjournals.org Downloaded from
Materials and Methods
Human samples. All samples were obtained at Duke University Medical
Center from individuals who had given written, informed consent.
Histopathologic diagnoses were established by the Department of
Pathology. Those eligible underwent 4-hour leukapheresis at the Duke
Apheresis Unit to obtain peripheral blood mononuclear cells (PBMC). All
studies were done with approval of the institutional review board.
Fluorescence-activated cell sorting analysis of whole blood. Whole
blood was incubated at room temperature for 15 minutes with
combinations of titrated antibodies to CD3 (UCHT1), CD4 (RPA-T4), CD8(RPA-T8), CD45RO (UCHL1), and CD25 (M-A251; BD Biosciences, San Jose,
CA). Following incubation, Optilyse B (Immunotech, Marseilles, France)
was added to each sample. Cells were reincubated at room temperature for15 minutes and diluted with distilled water. Samples were analyzed within
48 hours on a FACSVantage SE flow cytometer (BD Biosciences). Data
analysis was done using BD FloJo software.
Fluorescence-activated cell sorting analysis of tumor. Tumor
samples were subjected to overnight digestion at room temperature in
0.1% collagenase (Sigma, St. Louis, MO). Following digestion, RBCs were
lysed with 8.4 mg/mL NH4Cl (Sigma). Cells were washed, counted, and
labeled with biotinylated anti-(a)-CD45 (HI30; BD Biosciences), followed by
incubation with antibiotin microbeads (Miltenyi Biotec, Auburn, CA) and
positive selection using AUTOMACS (Miltenyi Biotec). Enriched CD45+ cells
(leukocytes) were subsequently stained with the same antibodies as those
for whole blood. Cells were analyzed as above.Treg retrieval from leukapheresis. Leukapheresis samples were diluted,
underlayered with Ficoll (Histopaque 1077, Sigma), and spun for 25 minutes.
Interphases were collected, washed extensively, and subjected to a 2-hour
adherence step to remove monocytes. Nonadherent PBMCs were frozen
until needed. Upon use, cells were rested overnight at 37jC, 5% CO2. A CD4+
T-Cell Isolation kit II (Miltenyi Biotec) was used to isolate untouched CD4+
cells according to the instructions of the manufacturer. Briefly, a
biotinylated antibody cocktail specific for non-CD4+ cells (CD8, CD14,
CD16, CD19, CD36, CD56, CD123, TCRg/y, and glycophorin A) was added,
followed 10 minutes later by antibiotin microbeads. Samples were washed
and run over AUTOMACS set to program DEPLETE. Nonlabeled fractions
(CD4+) were labeled with phycoerythrin-a-CD25 (M-A251) and FITC-a-
CD45RO (UCHL1) and sorted into CD25+CD45RO+ (Treg) and CD25�
populations on a FACSVantage SE flow cytometer. Purity of obtained
populations was always >98%.
FOXP3 reverse transcription-PCR. Purified Tregs and CD4+CD25� T
cells were retrieved from leukapheresis samples as above. cDNA was
synthesized from appropriate amounts of each cell type (stored at �137jC)by oligo(dT) with uMACS One-Step cDNA kit (Miltenyi Biotec) according to
the protocols of the manufacturer. Human FOXP3 (hFOXP3) mRNA
expression levels were measured by real-time PCR detected with SYBR
Green probe (Bio-Rad, Hercules, CA) on a Bio-Rad iCycler in 25 AL PCR
reaction at 40 cycles at 95jC for 15 seconds, 60jC for 1 minute, 72jC for 30
seconds. Each sample was run in triplicate and normalized with human
glyceraldehyde-3-phosphate dehydrogenase (hGAPDH). All primers
spanned intron/exon boundaries to minimize genomic DNA amplification.
hFOXP3 PCR products (100 bp) were amplified from hFOXP3-3 (5V-GAAACAGCACATTCCCAGAGTTC-3V) and hFOXP3-4 (5V-ATGGCCCAGCG-GATGAG-3V), and 114 bp hGAPDH were produced from hGAPDH-1 (5V-CCACATCGCTCAGACACCAT-3V) and hGAPDH-2 (5V-GGCAACAATATC-CACTTTACCAGAGT-3V). The PCR products were confirmed with melting
curve during real-time PCR and loaded onto a 2% agarose gel to verify size.
Intracellular staining for FOXP3. PBMCs were labeled with antibodiesto relevant surface markers (CD3, CD4, CD25, and CD45RO). Following
incubation, cells were washed and incubated for 1 hour with Fix/Perm
buffer (eBioscience, San Diego, CA). Cells were subsequently washed and
labeled with anti-FOXP3 (PCH101, eBioscience) for 30 minutes in the darkat 4jC in the presence of permeabilization buffer (eBioscience). Samples
were washed and analyzed on an LSRII flow cytometer (BD Biosciences).
Treg proliferation and suppression assays. To verify anergy (prolifer-ation assay) in the Treg population, 1 � 105 Tregs or CD4
+CD25� cells were
plated alone in triplicate wells using either immobilized or soluble a-CD3(OKT3) as stimulator at 2 Ag/mL. To verify suppressive capacity among Tregs(suppression assay), 5 � 104 CD4+CD25� responders were plated alone or
with varying doses of Tregs to a maximum ratio of 1:1 Tregs/responders.
Complete T-cell medium (CTM) consisted of RPMI + 10% FCS,supplemented with HEPES buffer, sodium pyruvate, penicillin/streptomy-
cin, L-glutamine, h-mercaptoethanol, and nonessential amino acids. After
72 hours of culture, levels of proliferation were assessed by [3H]thymidine
uptake.CD4+ T-cell cultures. Untouched CD4+ T cells were cultured in triplicate
in CTM (or in CTM with autologous serum substituted for FCS) at 5 � 104
to 2 � 105 per well in 96-well plates using either 0.4, 2, or 10 Ag/mL soluble
or plate-bound a-CD3 (OKT3); 0.1, 1, 5, 10, or 20 Ag/well solublephytohemagglutinin (PHA); or 0.1, 1, 5, 10, 20 Ag/well soluble concanavalin
A (ConA) as stimulator.
CD25+ cell depletion from CD4+ T cells. CD25+ depletion was doneusing CD25 Microbeads (Miltenyi Biotec) according to the instructions of
the manufacturer. Briefly, CD4+ T cells were incubated with 20 AL beads
per 107 cells for 15 minutes, washed, and depleted over AUTOMACS using
the program DEPLETES. Negative fractions (CD4+CD25�) were collectedfor parallel culture with CD4+ T cells.
[3H] counting. In all experiments assessing proliferation, after 72 hours
of culture, 1 ACi [3H]thymidine (Amersham, Piscataway, NJ) was added to
each well. Cells were cultured for an additional 16 hours and then harvestedon a FilterMate cell harvester (Perkin-Elmer, Boston, MA). [3H] counts were
done using a Wallac 1450 Microbeta Trilux Liquid Scintillation/Lumines-
cence Counter (Perkin-Elmer). Data were taken as means of triplicate wells.Cytokine analysis. CD4+ T cells were cultured in 96-well plates with 0, 5,
or 10 Ag PHA as stimulator. At time points following 16 and 72 hours of
culture, supernatants were harvested and processed in duplicate with a
custom Bio-Rad Bio-Plex 7-plex [IL-2, IL-4, IL-6, IL-10, IL-12 (p70), IFN-g,tumor necrosis factor-a (TNF-a)] Cytokine Reagent kit (Bio-Rad) according
to the instructions of the manufacturer. Briefly, supernatants were
incubated with anticytokine-conjugated beads, followed by incubation with
biotinylated detection antibody. Reaction mixture was detected withstreptavidin-phycoerythrin and analyzed on a Luminex 100 machine
(Luminex Corporation, Austin, TX). Unknown cytokine concentrations
were calculated by BioPlex Manager software using standard curves derivedfrom a recombinant cytokine standard.
Intracranial tumor implantation. SMA-560 tumor cells were harvested
in logarithmic growth phase. Tumor cells in PBS were then mixed 1:1 with
3% methylcellulose and loaded into a 250 AL syringe (Hamilton, Reno, NV).The needle was positioned 2 mm to the right of bregma and 4 mm below
the surface of the skull at the coronal suture using a stereotactic frame
(Kopf Instruments, Tujunga, CA). Cells (1 � 104) were delivered in a total
volume of 5 AL.Statistical analysis. For comparisons of means among groups (i.e., Treg
levels in patients versus healthy volunteers or proliferation levels in patients
with and without increased Treg fraction), unpaired t tests were used. A
paired t test was used to compare cytokine levels in patients before andafter CD25 depletion. For correlation between Treg levels and proliferation
levels, a Pearson coefficient was calculated using the null hypothesis that
the coefficient was equal to zero. To compare proliferative response curvesamong groups, a generalized linear model for normal data that accounted
for correlation of measurement replication within subjects was used. For
in vivo experiments, the survival experiences among defined experimental
groups were compared with a log-rank test. Within each experimentalgroup, the survival experience was described using the Kaplan-Meier
estimator.
Results
Treg fraction is increased in patients bearing GBM. Wedetermined the Treg fraction in the peripheral blood of patientswith GBM. Based on recent studies of FOXP3 expression in T-cellsubsets (22), ‘‘Tregs’’ were defined as lymphocytes that possessed the
Regulatory T Cells and Malignant Glioma
www.aacrjournals.org 3295 Cancer Res 2006; 66: (6). March 15, 2006
Research. on March 24, 2016. © 2006 American Association for Cancercancerres.aacrjournals.org Downloaded from
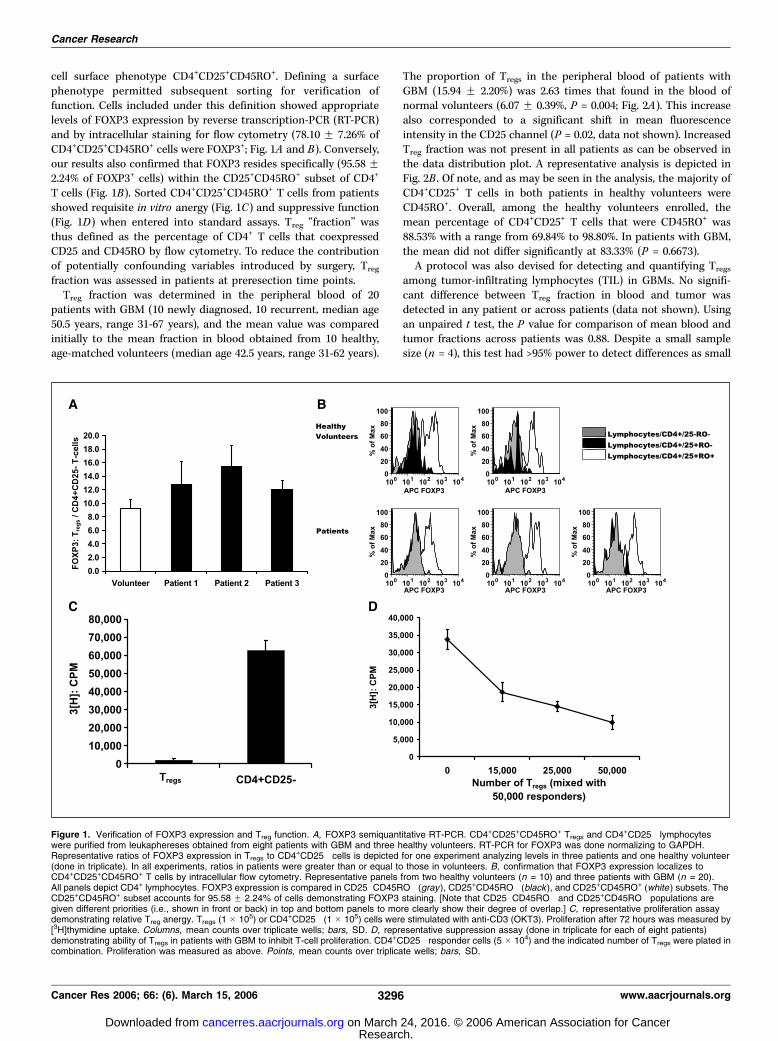
cell surface phenotype CD4+CD25+CD45RO+. Defining a surfacephenotype permitted subsequent sorting for verification offunction. Cells included under this definition showed appropriatelevels of FOXP3 expression by reverse transcription-PCR (RT-PCR)and by intracellular staining for flow cytometry (78.10 F 7.26% ofCD4+CD25+CD45RO+ cells were FOXP3+; Fig. 1A and B). Conversely,our results also confirmed that FOXP3 resides specifically (95.58 F2.24% of FOXP3+ cells) within the CD25+CD45RO+ subset of CD4+
T cells (Fig. 1B). Sorted CD4+CD25+CD45RO+ T cells from patientsshowed requisite in vitro anergy (Fig. 1C) and suppressive function(Fig. 1D) when entered into standard assays. Treg ‘‘fraction’’ wasthus defined as the percentage of CD4+ T cells that coexpressedCD25 and CD45RO by flow cytometry. To reduce the contributionof potentially confounding variables introduced by surgery, Treg
fraction was assessed in patients at preresection time points.Treg fraction was determined in the peripheral blood of 20
patients with GBM (10 newly diagnosed, 10 recurrent, median age50.5 years, range 31-67 years), and the mean value was comparedinitially to the mean fraction in blood obtained from 10 healthy,age-matched volunteers (median age 42.5 years, range 31-62 years).
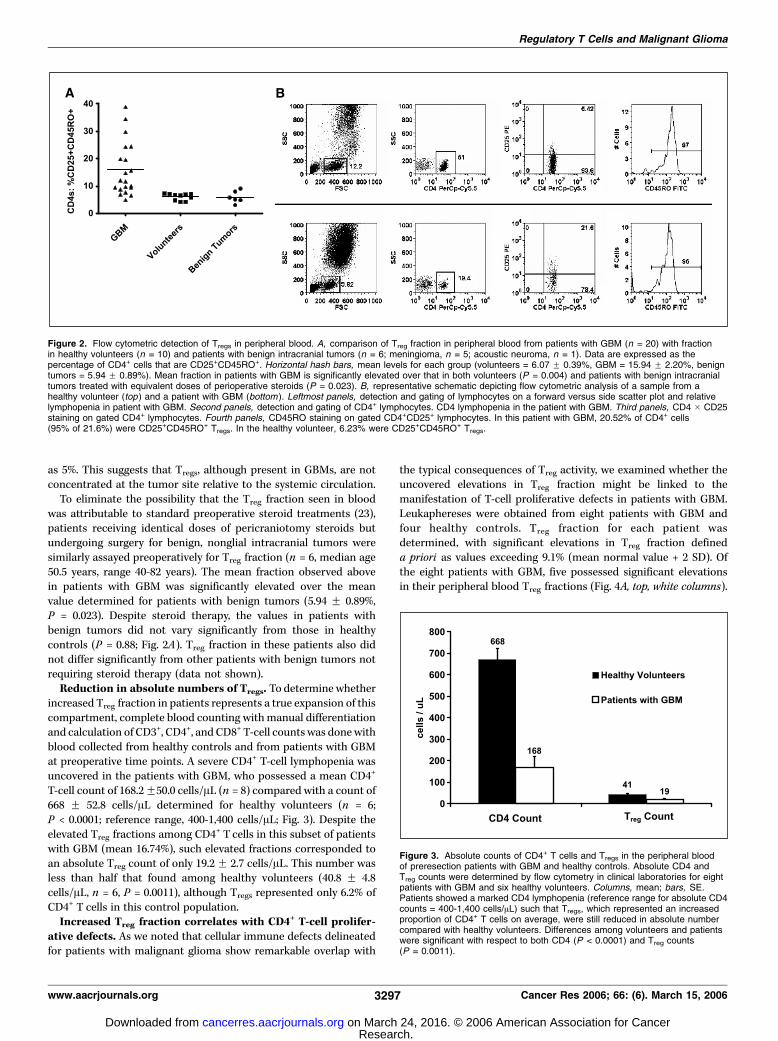
The proportion of Tregs in the peripheral blood of patients withGBM (15.94 F 2.20%) was 2.63 times that found in the blood ofnormal volunteers (6.07 F 0.39%, P = 0.004; Fig. 2A). This increasealso corresponded to a significant shift in mean fluorescenceintensity in the CD25 channel (P = 0.02, data not shown). IncreasedTreg fraction was not present in all patients as can be observed inthe data distribution plot. A representative analysis is depicted inFig. 2B . Of note, and as may be seen in the analysis, the majority ofCD4+CD25+ T cells in both patients in healthy volunteers wereCD45RO+. Overall, among the healthy volunteers enrolled, themean percentage of CD4+CD25+ T cells that were CD45RO+ was88.53% with a range from 69.84% to 98.80%. In patients with GBM,the mean did not differ significantly at 83.33% (P = 0.6673).A protocol was also devised for detecting and quantifying Tregs
among tumor-infiltrating lymphocytes (TIL) in GBMs. No signifi-cant difference between Treg fraction in blood and tumor wasdetected in any patient or across patients (data not shown). Usingan unpaired t test, the P value for comparison of mean blood andtumor fractions across patients was 0.88. Despite a small samplesize (n = 4), this test had >95% power to detect differences as small
Figure 1. Verification of FOXP3 expression and Treg function. A, FOXP3 semiquantitative RT-PCR. CD4+CD25+CD45RO+ Tregs and CD4+CD25� lymphocyteswere purified from leukaphereses obtained from eight patients with GBM and three healthy volunteers. RT-PCR for FOXP3 was done normalizing to GAPDH.Representative ratios of FOXP3 expression in Tregs to CD4+CD25� cells is depicted for one experiment analyzing levels in three patients and one healthy volunteer(done in triplicate). In all experiments, ratios in patients were greater than or equal to those in volunteers. B, confirmation that FOXP3 expression localizes toCD4+CD25+CD45RO+ T cells by intracellular flow cytometry. Representative panels from two healthy volunteers (n = 10) and three patients with GBM (n = 20).All panels depict CD4+ lymphocytes. FOXP3 expression is compared in CD25�CD45RO� (gray), CD25+CD45RO� (black ), and CD25+CD45RO+ (white ) subsets. TheCD25+CD45RO+ subset accounts for 95.58 F 2.24% of cells demonstrating FOXP3 staining. [Note that CD25�CD45RO� and CD25+CD45RO� populations aregiven different priorities (i.e., shown in front or back) in top and bottom panels to more clearly show their degree of overlap.] C, representative proliferation assaydemonstrating relative Treg anergy. Tregs (1 � 105) or CD4+CD25� (1 � 105) cells were stimulated with anti-CD3 (OKT3). Proliferation after 72 hours was measured by[3H]thymidine uptake. Columns, mean counts over triplicate wells; bars, SD. D, representative suppression assay (done in triplicate for each of eight patients)demonstrating ability of Tregs in patients with GBM to inhibit T-cell proliferation. CD4+CD25� responder cells (5 � 104) and the indicated number of Tregs were plated incombination. Proliferation was measured as above. Points, mean counts over triplicate wells; bars, SD.
Cancer Research
Cancer Res 2006; 66: (6). March 15, 2006 3296 www.aacrjournals.org
Research. on March 24, 2016. © 2006 American Association for Cancercancerres.aacrjournals.org Downloaded from
as 5%. This suggests that Tregs, although present in GBMs, are notconcentrated at the tumor site relative to the systemic circulation.To eliminate the possibility that the Treg fraction seen in blood
was attributable to standard preoperative steroid treatments (23),patients receiving identical doses of pericraniotomy steroids butundergoing surgery for benign, nonglial intracranial tumors weresimilarly assayed preoperatively for Treg fraction (n = 6, median age50.5 years, range 40-82 years). The mean fraction observed abovein patients with GBM was significantly elevated over the meanvalue determined for patients with benign tumors (5.94 F 0.89%,P = 0.023). Despite steroid therapy, the values in patients withbenign tumors did not vary significantly from those in healthycontrols (P = 0.88; Fig. 2A). Treg fraction in these patients also didnot differ significantly from other patients with benign tumors notrequiring steroid therapy (data not shown).Reduction in absolute numbers of Tregs. To determine whether
increased Treg fraction in patients represents a true expansion of thiscompartment, complete blood counting withmanual differentiationand calculation of CD3+, CD4+, and CD8+ T-cell countswas donewithblood collected from healthy controls and from patients with GBMat preoperative time points. A severe CD4+ T-cell lymphopenia wasuncovered in the patients with GBM, who possessed a mean CD4+
T-cell count of 168.2F50.0 cells/AL (n = 8) compared with a count of668 F 52.8 cells/AL determined for healthy volunteers (n = 6;P < 0.0001; reference range, 400-1,400 cells/AL; Fig. 3). Despite theelevated Treg fractions among CD4+ T cells in this subset of patientswith GBM (mean 16.74%), such elevated fractions corresponded toan absolute Treg count of only 19.2 F 2.7 cells/AL. This number wasless than half that found among healthy volunteers (40.8 F 4.8cells/AL, n = 6, P = 0.0011), although Tregs represented only 6.2% ofCD4+ T cells in this control population.Increased Treg fraction correlates with CD4+ T-cell prolifer-
ative defects. As we noted that cellular immune defects delineatedfor patients with malignant glioma show remarkable overlap with
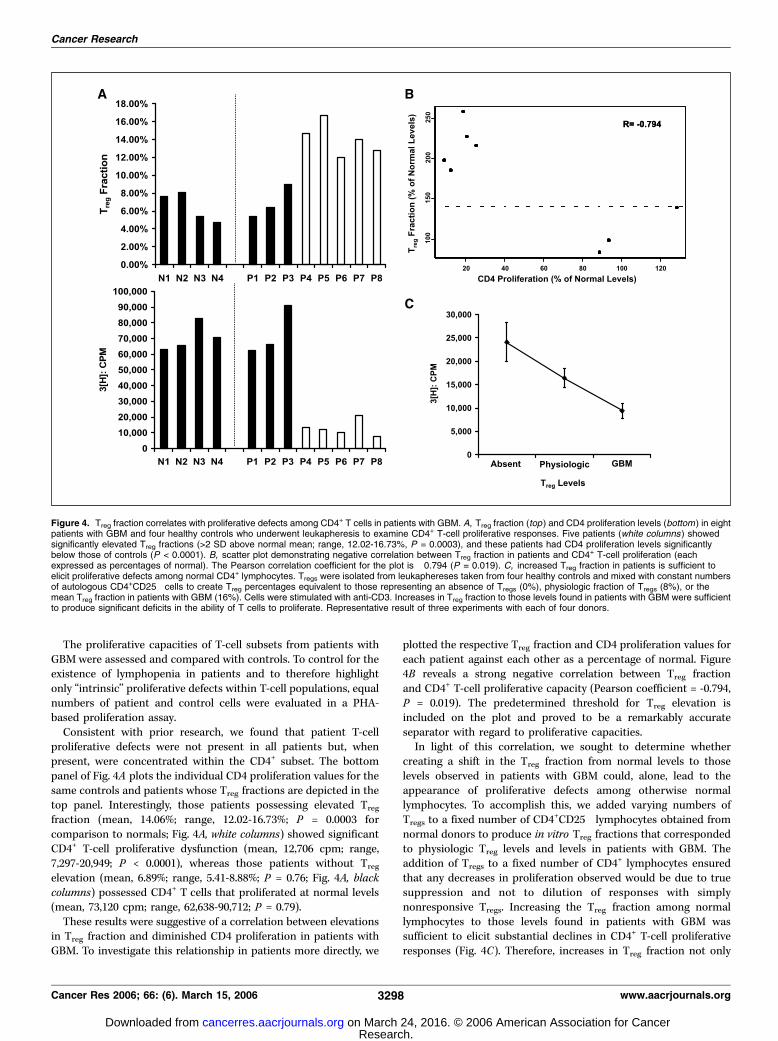
the typical consequences of Treg activity, we examined whether theuncovered elevations in Treg fraction might be linked to themanifestation of T-cell proliferative defects in patients with GBM.Leukaphereses were obtained from eight patients with GBM andfour healthy controls. Treg fraction for each patient wasdetermined, with significant elevations in Treg fraction defineda priori as values exceeding 9.1% (mean normal value + 2 SD). Ofthe eight patients with GBM, five possessed significant elevationsin their peripheral blood Treg fractions (Fig. 4A, top, white columns).
Figure 2. Flow cytometric detection of Tregs in peripheral blood. A, comparison of Treg fraction in peripheral blood from patients with GBM (n = 20) with fractionin healthy volunteers (n = 10) and patients with benign intracranial tumors (n = 6; meningioma, n = 5; acoustic neuroma, n = 1). Data are expressed as thepercentage of CD4+ cells that are CD25+CD45RO+. Horizontal hash bars, mean levels for each group (volunteers = 6.07 F 0.39%, GBM = 15.94 F 2.20%, benigntumors = 5.94 F 0.89%). Mean fraction in patients with GBM is significantly elevated over that in both volunteers (P = 0.004) and patients with benign intracranialtumors treated with equivalent doses of perioperative steroids (P = 0.023). B, representative schematic depicting flow cytometric analysis of a sample from ahealthy volunteer (top ) and a patient with GBM (bottom ). Leftmost panels, detection and gating of lymphocytes on a forward versus side scatter plot and relativelymphopenia in patient with GBM. Second panels, detection and gating of CD4+ lymphocytes. CD4 lymphopenia in the patient with GBM. Third panels, CD4 � CD25staining on gated CD4+ lymphocytes. Fourth panels, CD45RO staining on gated CD4+CD25+ lymphocytes. In this patient with GBM, 20.52% of CD4+ cells(95% of 21.6%) were CD25+CD45RO+ Tregs. In the healthy volunteer, 6.23% were CD25+CD45RO+ Tregs.
Figure 3. Absolute counts of CD4+ T cells and Tregs in the peripheral bloodof preresection patients with GBM and healthy controls. Absolute CD4 andTreg counts were determined by flow cytometry in clinical laboratories for eightpatients with GBM and six healthy volunteers. Columns, mean; bars, SE.Patients showed a marked CD4 lymphopenia (reference range for absolute CD4counts = 400-1,400 cells/AL) such that Tregs, which represented an increasedproportion of CD4+ T cells on average, were still reduced in absolute numbercompared with healthy volunteers. Differences among volunteers and patientswere significant with respect to both CD4 (P < 0.0001) and Treg counts(P = 0.0011).
Regulatory T Cells and Malignant Glioma
www.aacrjournals.org 3297 Cancer Res 2006; 66: (6). March 15, 2006
Research. on March 24, 2016. © 2006 American Association for Cancercancerres.aacrjournals.org Downloaded from
The proliferative capacities of T-cell subsets from patients withGBMwere assessed and compared with controls. To control for theexistence of lymphopenia in patients and to therefore highlightonly ‘‘intrinsic’’ proliferative defects within T-cell populations, equalnumbers of patient and control cells were evaluated in a PHA-based proliferation assay.Consistent with prior research, we found that patient T-cell
proliferative defects were not present in all patients but, whenpresent, were concentrated within the CD4+ subset. The bottompanel of Fig. 4A plots the individual CD4 proliferation values for thesame controls and patients whose Treg fractions are depicted in thetop panel. Interestingly, those patients possessing elevated Treg
fraction (mean, 14.06%; range, 12.02-16.73%; P = 0.0003 forcomparison to normals; Fig. 4A, white columns) showed significantCD4+ T-cell proliferative dysfunction (mean, 12,706 cpm; range,7,297-20,949; P < 0.0001), whereas those patients without Treg
elevation (mean, 6.89%; range, 5.41-8.88%; P = 0.76; Fig. 4A, blackcolumns) possessed CD4+ T cells that proliferated at normal levels(mean, 73,120 cpm; range, 62,638-90,712; P = 0.79).These results were suggestive of a correlation between elevations
in Treg fraction and diminished CD4 proliferation in patients withGBM. To investigate this relationship in patients more directly, we
plotted the respective Treg fraction and CD4 proliferation values foreach patient against each other as a percentage of normal. Figure4B reveals a strong negative correlation between Treg fractionand CD4+ T-cell proliferative capacity (Pearson coefficient = -0.794,P = 0.019). The predetermined threshold for Treg elevation isincluded on the plot and proved to be a remarkably accurateseparator with regard to proliferative capacities.In light of this correlation, we sought to determine whether
creating a shift in the Treg fraction from normal levels to thoselevels observed in patients with GBM could, alone, lead to theappearance of proliferative defects among otherwise normallymphocytes. To accomplish this, we added varying numbers ofTregs to a fixed number of CD4+CD25� lymphocytes obtained fromnormal donors to produce in vitro Treg fractions that correspondedto physiologic Treg levels and levels in patients with GBM. Theaddition of Tregs to a fixed number of CD4+ lymphocytes ensuredthat any decreases in proliferation observed would be due to truesuppression and not to dilution of responses with simplynonresponsive Tregs. Increasing the Treg fraction among normallymphocytes to those levels found in patients with GBM wassufficient to elicit substantial declines in CD4+ T-cell proliferativeresponses (Fig. 4C). Therefore, increases in Treg fraction not only
Figure 4. Treg fraction correlates with proliferative defects among CD4+ T cells in patients with GBM. A, Treg fraction (top ) and CD4 proliferation levels (bottom) in eightpatients with GBM and four healthy controls who underwent leukapheresis to examine CD4+ T-cell proliferative responses. Five patients (white columns ) showedsignificantly elevated Treg fractions (>2 SD above normal mean; range, 12.02-16.73%, P = 0.0003), and these patients had CD4 proliferation levels significantlybelow those of controls (P < 0.0001). B, scatter plot demonstrating negative correlation between Treg fraction in patients and CD4+ T-cell proliferation (eachexpressed as percentages of normal). The Pearson correlation coefficient for the plot is �0.794 (P = 0.019). C, increased Treg fraction in patients is sufficient toelicit proliferative defects among normal CD4+ lymphocytes. Tregs were isolated from leukaphereses taken from four healthy controls and mixed with constant numbersof autologous CD4+CD25� cells to create Treg percentages equivalent to those representing an absence of Tregs (0%), physiologic fraction of Tregs (8%), or themean Treg fraction in patients with GBM (16%). Cells were stimulated with anti-CD3. Increases in Treg fraction to those levels found in patients with GBM were sufficientto produce significant deficits in the ability of T cells to proliferate. Representative result of three experiments with each of four donors.
Cancer Research
Cancer Res 2006; 66: (6). March 15, 2006 3298 www.aacrjournals.org
Research. on March 24, 2016. © 2006 American Association for Cancercancerres.aacrjournals.org Downloaded from
correlate with the appearance of CD4 proliferative defects inpatients with GBM, but also prove sufficient to elicit the samedefects among normal lymphocytes.CD4+ T cells from patients function normally in the absence
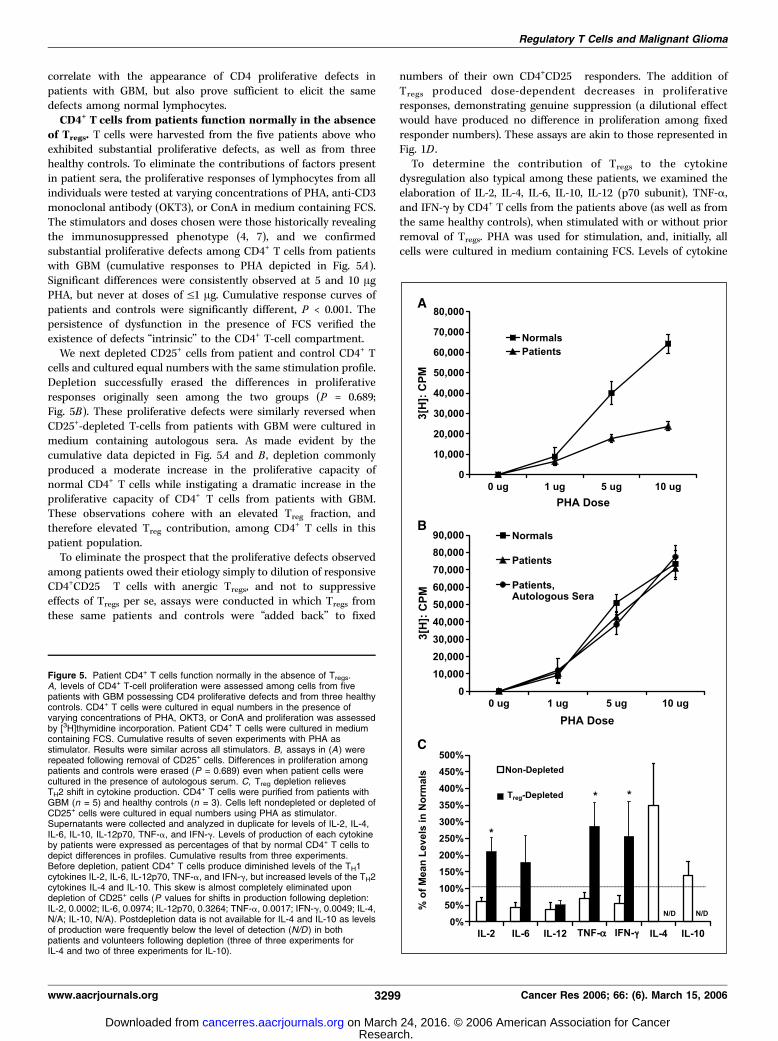
of Tregs. T cells were harvested from the five patients above whoexhibited substantial proliferative defects, as well as from threehealthy controls. To eliminate the contributions of factors presentin patient sera, the proliferative responses of lymphocytes from allindividuals were tested at varying concentrations of PHA, anti-CD3monoclonal antibody (OKT3), or ConA in medium containing FCS.The stimulators and doses chosen were those historically revealingthe immunosuppressed phenotype (4, 7), and we confirmedsubstantial proliferative defects among CD4+ T cells from patientswith GBM (cumulative responses to PHA depicted in Fig. 5A).Significant differences were consistently observed at 5 and 10 AgPHA, but never at doses of V1 Ag. Cumulative response curves ofpatients and controls were significantly different, P < 0.001. Thepersistence of dysfunction in the presence of FCS verified theexistence of defects ‘‘intrinsic’’ to the CD4+ T-cell compartment.We next depleted CD25+ cells from patient and control CD4+ T
cells and cultured equal numbers with the same stimulation profile.Depletion successfully erased the differences in proliferativeresponses originally seen among the two groups (P = 0.689;Fig. 5B). These proliferative defects were similarly reversed whenCD25+-depleted T-cells from patients with GBM were cultured inmedium containing autologous sera. As made evident by thecumulative data depicted in Fig. 5A and B , depletion commonlyproduced a moderate increase in the proliferative capacity ofnormal CD4+ T cells while instigating a dramatic increase in theproliferative capacity of CD4+ T cells from patients with GBM.These observations cohere with an elevated Treg fraction, andtherefore elevated Treg contribution, among CD4+ T cells in thispatient population.To eliminate the prospect that the proliferative defects observed
among patients owed their etiology simply to dilution of responsiveCD4+CD25� T cells with anergic Tregs, and not to suppressiveeffects of Tregs per se, assays were conducted in which Tregs fromthese same patients and controls were ‘‘added back’’ to fixed
numbers of their own CD4+CD25� responders. The addition ofTregs produced dose-dependent decreases in proliferativeresponses, demonstrating genuine suppression (a dilutional effectwould have produced no difference in proliferation among fixedresponder numbers). These assays are akin to those represented inFig. 1D .To determine the contribution of Tregs to the cytokine
dysregulation also typical among these patients, we examined theelaboration of IL-2, IL-4, IL-6, IL-10, IL-12 (p70 subunit), TNF-a,and IFN-g by CD4+ T cells from the patients above (as well as fromthe same healthy controls), when stimulated with or without priorremoval of Tregs. PHA was used for stimulation, and, initially, allcells were cultured in medium containing FCS. Levels of cytokine
Figure 5. Patient CD4+ T cells function normally in the absence of Tregs.A, levels of CD4+ T-cell proliferation were assessed among cells from fivepatients with GBM possessing CD4 proliferative defects and from three healthycontrols. CD4+ T cells were cultured in equal numbers in the presence ofvarying concentrations of PHA, OKT3, or ConA and proliferation was assessedby [3H]thymidine incorporation. Patient CD4+ T cells were cultured in mediumcontaining FCS. Cumulative results of seven experiments with PHA asstimulator. Results were similar across all stimulators. B, assays in (A ) wererepeated following removal of CD25+ cells. Differences in proliferation amongpatients and controls were erased (P = 0.689) even when patient cells werecultured in the presence of autologous serum. C, Treg depletion relievesTH2 shift in cytokine production. CD4+ T cells were purified from patients withGBM (n = 5) and healthy controls (n = 3). Cells left nondepleted or depleted ofCD25+ cells were cultured in equal numbers using PHA as stimulator.Supernatants were collected and analyzed in duplicate for levels of IL-2, IL-4,IL-6, IL-10, IL-12p70, TNF-a, and IFN-g. Levels of production of each cytokineby patients were expressed as percentages of that by normal CD4+ T cells todepict differences in profiles. Cumulative results from three experiments.Before depletion, patient CD4+ T cells produce diminished levels of the TH1cytokines IL-2, IL-6, IL-12p70, TNF-a, and IFN-g, but increased levels of the TH2cytokines IL-4 and IL-10. This skew is almost completely eliminated upondepletion of CD25+ cells (P values for shifts in production following depletion:IL-2, 0.0002; IL-6, 0.0974; IL-12p70, 0.3264; TNF-a, 0.0017; IFN-g, 0.0049; IL-4,N/A; IL-10, N/A). Postdepletion data is not available for IL-4 and IL-10 as levelsof production were frequently below the level of detection (N/D ) in bothpatients and volunteers following depletion (three of three experiments forIL-4 and two of three experiments for IL-10).
Regulatory T Cells and Malignant Glioma
www.aacrjournals.org 3299 Cancer Res 2006; 66: (6). March 15, 2006
Research. on March 24, 2016. © 2006 American Association for Cancercancerres.aacrjournals.org Downloaded from
production by patients were expressed as percentages of produc-tion by normal CD4+ T cells to permit depiction of relativedifferences in cytokine profiles. As seen in Fig. 5C , before depletion,CD4+ T cells from patients with GBM elaborated reduced quantitiesof the TH1 cytokines IL-2, IL-6, IL-12p70, TNF-a, and IFN-g, butabove-normal quantities of the TH2 cytokines IL-4 and IL-10, whencompared with controls.Among T-cell samples from patients with GBM that were
depleted of CD25+ cells, however, production of the TH1 cytokinesIL-2, IL-6, TNF-a, and IFN-g came generally to match or exceedthose levels produced by control CD4+ T-cells, similarly depleted(Fig. 5C). As with proliferation, shifts in TH1 cytokine productionamong CD4+ T cells from controls were moderate, whereas moresubstantial changes were seen among CD4+ T cells from patients.The postdepletion shifts in the production of IL-2, IFN-g, andTNF-a by T cells from patients were significant (P = 0.0002, 0.0499,and 0.0017, respectively). IL-12p70 was the only TH1 cytokine testedfor which a deficiency remained apparent (predepletion, 37.23% ofnormal; postdepletion, 50.96% of normal). Deficits were likewiseerased when cells were cultured in the presence of autologous sera(data not shown).Interestingly, postdepletion shifts in the production of TH2
cytokines proved dramatic for both patients and controls. WhereasIL-4 and IL-10 were initially elaborated in higher quantities bypatient CD4+ T cells, depletion of CD25+ cells brought their levels inboth patients and controls down to the limit of detection, such thatno statistical comparisons could be made between the twopopulations (Fig. 5C). The net results of depletion, then, wereelimination of TH2 cytokine production by both patient and controlCD4+ T cells and the normalization of patient TH1 cytokineproduction.Together, these data show that elevated fractions of Tregs
undermine the proliferative capacities and cytokine elaborationprofiles of CD4+ T cells from patients with GBM. The data alsoshow that these cells are not actually intrinsically defective butinstead are capable in vitro of essentially normal function when notinfluenced externally by an elevated Treg fraction.Treg depletion in vivo leads to glioma rejection. We verified
that Tregs in VM/Dk mice possess the appropriate traits reportedfor Tregs in in vitro functional assays. As CD45RO is not a murinephenotypic marker, Tregs were defined for this purpose asCD4+CD25+GITR+ T cells. Isolated CD4+CD25+GITR+ T cells fromthese mice expressed Foxp3, failed to respond to stimulation, andexhibited the expected dose-dependent capacity to suppress theproliferative responses of surrounding CD4+CD25� cells (data notshown). We also established our ability to successfully deplete Tregs
from VM/Dk mice. A single dose of 0.5 mg anti-CD25 (PC61)delivered i.p. successfully depleted CD25+ cells from mice, andthese levels did not recover for f30 days (data not shown).To assess the effects of Treg depletion when effected before any
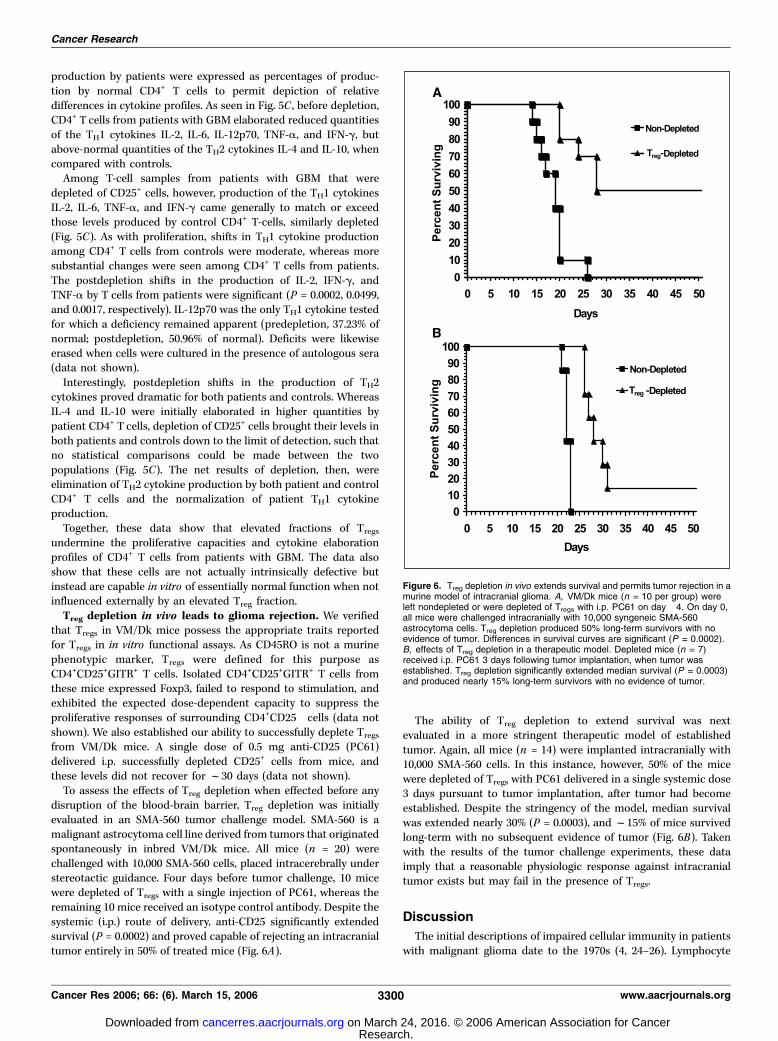
disruption of the blood-brain barrier, Treg depletion was initiallyevaluated in an SMA-560 tumor challenge model. SMA-560 is amalignant astrocytoma cell line derived from tumors that originatedspontaneously in inbred VM/Dk mice. All mice (n = 20) werechallenged with 10,000 SMA-560 cells, placed intracerebrally understereotactic guidance. Four days before tumor challenge, 10 micewere depleted of Tregs with a single injection of PC61, whereas theremaining 10 mice received an isotype control antibody. Despite thesystemic (i.p.) route of delivery, anti-CD25 significantly extendedsurvival (P = 0.0002) and proved capable of rejecting an intracranialtumor entirely in 50% of treated mice (Fig. 6A).
The ability of Treg depletion to extend survival was nextevaluated in a more stringent therapeutic model of establishedtumor. Again, all mice (n = 14) were implanted intracranially with10,000 SMA-560 cells. In this instance, however, 50% of the micewere depleted of Tregs with PC61 delivered in a single systemic dose3 days pursuant to tumor implantation, after tumor had becomeestablished. Despite the stringency of the model, median survivalwas extended nearly 30% (P = 0.0003), and f15% of mice survivedlong-term with no subsequent evidence of tumor (Fig. 6B). Takenwith the results of the tumor challenge experiments, these dataimply that a reasonable physiologic response against intracranialtumor exists but may fail in the presence of Tregs.
Discussion
The initial descriptions of impaired cellular immunity in patientswith malignant glioma date to the 1970s (4, 24–26). Lymphocyte
Figure 6. Treg depletion in vivo extends survival and permits tumor rejection in amurine model of intracranial glioma. A, VM/Dk mice (n = 10 per group) wereleft nondepleted or were depleted of Tregs with i.p. PC61 on day �4. On day 0,all mice were challenged intracranially with 10,000 syngeneic SMA-560astrocytoma cells. Treg depletion produced 50% long-term survivors with noevidence of tumor. Differences in survival curves are significant (P = 0.0002).B, effects of Treg depletion in a therapeutic model. Depleted mice (n = 7)received i.p. PC61 3 days following tumor implantation, when tumor wasestablished. Treg depletion significantly extended median survival (P = 0.0003)and produced nearly 15% long-term survivors with no evidence of tumor.
Cancer Research
Cancer Res 2006; 66: (6). March 15, 2006 3300 www.aacrjournals.org
Research. on March 24, 2016. © 2006 American Association for Cancercancerres.aacrjournals.org Downloaded from

dysfunction has since been progressively narrowed to the CD4+
T-cell subset (6), which exhibits substantial defects when cultureden masse . Attempts to understand and reverse such dysfunctionhave continued unremittingly.It is a therefore dramatic finding that upon removal of its Treg
constituent, the remaining CD4+ compartment of patients withGBM functions normally in vitro . This shows that ‘‘intrinsic’’ CD4+
T-cell functional deficits are neither cell inherent nor irreversible.Instead, they appear to be the product of an elevated Treg fractionand may be abrogated simply via depletion of Treg cells. We havenot overlooked the effects of factors present in patient serum;rather, we have focused on and uncovered the source of thosesubstantial defects that remain in their absence. Whereas theseintrinsic defects remained erased when Treg-depleted cells werecultured in autologous sera, such sera were not extensivelycharacterized and were retrieved from patients relatively early intheir disease course. It remains possible that sera obtained frompatients at later stages of disease would have had more substantialeffects.To our knowledge, absolute Treg counts have not previously been
reported in patients with malignancy. The increased Treg levelsreported in similar studies (18–21) more truly represent what wehave termed here the Treg fraction. Consequently, it is unclearwhether the elevated Treg levels previously reported among othercancer populations represent a veritable expansion of thiscompartment in vivo . We show, however, that Tregs substantiallycompromise T-cell function despite being reduced in absolutenumber in vivo . What appears of more pertinence than Treg
numbers, then, is the fraction that they represent of thesurrounding CD4 compartment. In our patients, this fraction issignificantly increased, and this increase is what correlates withT-cell dysfunction.We are also the first to report profoundly reduced CD4+ T-cell
counts in preresection patients with GBM. These patients exhibitedmean CD4 counts below 200 cells/AL, the demarcation forprogression to AIDS in HIV-infected individuals. The severity ofthis lymphopenia is perplexing, given the overwhelming absence ofsystemic disease in this population. Another group has reporteddiminished CD4 counts in patients with primary brain tumors whowere already undergoing radiotherapy (27). As cranial radiotherapyis a known contributor to myelosuppression (28), this previousstudy was examining the incidence of opportunistic infections inpatients subjected to long-term steroids and radiation. We do notoverlook the potential contributions of preoperative steroids in ourstudy, but such therapy was newly initiated, and we have not seensuch drops in CD4 counts in patients receiving identical steroidregimens before surgery for other conditions. The etiology of thisCD4+ T-cell lymphopenia therefore remains a logical direction forfuture research. The goal of this study was to examine the etiologyof ‘‘intrinsic’’ T-cell defects, but such a severe lymphopenia isclearly a contributor to depressed cellular immunity in patientswith GBM.
Also of interest is why Tregs might be differentially susceptibleto mechanisms reducing CD4+ T-cell numbers, leading toincreased Treg fractions. We have already ruled out thecontribution of steroids (Fig. 2A). Potential differences in ratesof emergence from a dysfunctional thymus (29) or in susceptibilityto apoptosis are under investigation. Another potential sourcethat deserves attention, however, is transforming growth factor-h(TGF-h). TGF-h is elaborated by gliomas and is one of thekey immunosuppressive factors often present in patient serum(30–32). Importantly, it has a proven role in facilitating thedevelopment and elaboration of Tregs (33, 34), including in vivo(35). These studies suggest TGF-h may be an ‘‘upstream’’participant in a cascade of events leading to Treg-mediatedimmunosuppression.A potential shortcoming of our findings might be a failure to
rectify the results of earlier studies demonstrating that inducibleIL-2R expression is hindered in lymphocytes from patients withGBM (36). These findings would initially seem to contradict ourobservation of an increased fraction of Tregs, whose most commonidentifying marker is the a chain of the high-affinity IL-2R (CD25).Upon closer examination, however, these previous studies reportonly IL-2R expression on lymphocytes following mitogenicstimulation, and no data are offered concerning resting levels onfreshly isolated cells. As CD25 is also a T-cell activation marker, it isthese preactivation levels that more accurately depict Tregs.Interestingly, one study in patients with malignant glioma,published before the current Treg literature, measured CD25 levelson freshly isolated TIL and reported that these levels weremarkedly elevated (9).Our results translate into a potential for therapeutic benefit, as
Treg depletion in mice proves permissive for glioma rejection in theintracranial compartment even in instances of established tumor.This rejection is notably effected following systemic delivery ofantibody and in the absence of additional therapeutic intervention.A salient implication is that in the absence of Tregs, the physiologicimmune response possesses some capacity to reject tumor locatedin the immunologically privileged central nervous system. Our datasuggest that a systemic immune response to tumors in the centralnervous system occurs and that peripheral Tregs are important inattenuating this response. Tumors situated intracranially are, inturn, clearly capable of modulating systemic immunity and mayderive some of their success in this endeavor from alterationselicited in the Treg fraction.
Acknowledgments
Received 10/19/2005; revised 1/9/2006; accepted 1/19/2006.Grant support: NIH Specialized Programs of Research Excellence grants 1P50
CA108786 (D.D. Bigner and J.H. Sampson), R01 CA09722 (J.H. Sampson), and MSTPT32 GM-07171 (P.E. Fecci), and grants from the Brain Tumor Society (J.H. Sampson)and Accelerate Brain Cancer Cure Foundation (J.H. Sampson and D.D. Bigner).
The costs of publication of this article were defrayed in part by the payment of pagecharges. This article must therefore be hereby marked advertisement in accordancewith 18 U.S.C. Section 1734 solely to indicate this fact.
Regulatory T Cells and Malignant Glioma
www.aacrjournals.org 3301 Cancer Res 2006; 66: (6). March 15, 2006
References1. Dix AR, BrooksWH, Roszman TL, Morford LA. Immunedefects observed in patients with primary malignantbrain tumors. J Neuroimmunol 1999;100:216–32.
2. McVicar DW, Davis DF, Merchant RE. In vitro analysisof the proliferative potential of T cells from patientswith brain tumor: glioma-associated immunosuppres-
sion unrelated to intrinsic cellular defect. J Neurosurg1992;76:251–60.
3. Ashkenazi E, Deutsch M, Tirosh R, Weinreb A,Tsukerman A, Brodie C. A selective impairment of theIL-2 system in lymphocytes of patients with glioblasto-mas: increased level of soluble IL-2R and reducedprotein tyrosine phosphorylation. Neuroimmunomodu-lation 1997;4:49–56.
4. Roszman TL, Brooks WH. Immunobiology of primaryintracranial tumours. III. Demonstration of a qualitativelymphocyte abnormality in patients with primary braintumours. Clin Exp Immunol 1980;39:395–402.
5. Morford LA, Elliott LH, Carlson SL, Brooks WH,Roszman TL. T cell receptor-mediated signaling isdefective in T cells obtained from patients with primaryintracranial tumors. J Immunol 1997;159:4415–25.
Research. on March 24, 2016. © 2006 American Association for Cancercancerres.aacrjournals.org Downloaded from

Cancer Research
Cancer Res 2006; 66: (6). March 15, 2006 3302 www.aacrjournals.org
6. Roszman TL, Brooks WH, Steele C, Elliott LH.Pokeweed mitogen-induced immunoglobulin secretionby peripheral blood lymphocytes from patients withprimary intracranial tumors. Characterization of Thelper and B cell function. J Immunol 1985;134:1545–50.
7. Elliott LH, Brooks WH, Roszman TL. Cytokinetic basisfor the impaired activation of lymphocytes frompatients with primary intracranial tumors. J Immunol1984;132:1208–15.
8. Ausiello CM, Palma C, Maleci A, et al. Cell mediatedcytotoxicity and cytokine production in peripheralblood mononuclear cells of glioma patients. Eur JCancer 1991;27:646–50.
9. Roussel E, Gingras MC, Grimm EA, Bruner JM, MoserRP. Predominance of a type 2 intratumoural immuneresponse in fresh tumour-infiltrating lymphocytes fromhuman gliomas. Clin Exp Immunol 1996;105:344–52.
10. Zou JP, Morford LA, Chougnet C, et al. Humanglioma-induced immunosuppression involves solublefactor(s) that alters monocyte cytokine profile andsurface markers. J Immunol 1999;162:4882–92.
11. Sakaguchi S, Sakaguchi N, Asano M, Itoh M, Toda M.Immunologic self-tolerance maintained by activated Tcells expressing IL-2 receptor a-chains (CD25). Break-down of a single mechanism of self-tolerance causesvarious autoimmune diseases. J Immunol 1995;155:1151–64.
12. Thornton AM, Shevach EM. CD4+CD25+ immunoreg-ulatory T cells suppress polyclonal T cell activationin vitro by inhibiting interleukin 2 production. J ExpMed 1998;188:287–96.
13. Camara NO, Sebille F, Lechler RI. Human CD4+CD25+
regulatory cells have marked and sustained effects onCD8+ T cell activation. Eur J Immunol 2003;33:3473–83.
14. Piccirillo CA, Shevach EM. Cutting edge: control ofCD8+ T cell activation by CD4+CD25+ immunoregulatorycells. J Immunol 2001;167:1137–40.
15. Dieckmann D, Bruett CH, Ploettner H, Lutz MB,Schuler G. Human CD4(+)CD25(+) regulatory, contact-dependent T cells induce interleukin 10-producing,contact-independent type 1-like regulatory T cells.J Exp Med 2002;196:247–53.
16. Zheng SG, Wang JH, Gray JD, Soucier H, HorwitzDA. Natural and induced CD4+CD25+ cells educate
CD4+CD25� cells to develop suppressive activity: therole of IL-2, TGF-h, and IL-10. J Immunol 2004;172:5213–21.
17. Chen ZM, O’Shaughnessy MJ, Gramaglia I, et al. IL-10 and TGF-h induce alloreactive CD4+CD25� T cellsto acquire regulatory cell function. Blood 2003;101:5076–83.
18. Liyanage UK, Moore TT, Joo HG, et al. Prevalence ofregulatory T cells is increased in peripheral blood andtumor microenvironment of patients with pancreas orbreast adenocarcinoma. J Immunol 2002;169:2756–61.
19. Ichihara F, Kono K, Takahashi A, Kawaida H, Sugai H,Fujii H. Increased populations of regulatory T cells inperipheral blood and tumor-infiltrating lymphocytes inpatients with gastric and esophageal cancers. ClinCancer Res 2003;9:4404–8.
20. Woo EY, Chu CS, Goletz TJ, et al. RegulatoryCD4(+)CD25(+) T cells in tumors from patients withearly-stage non-small cell lung cancer and late-stageovarian cancer. Cancer Res 2001;161:4766–72.
21. Curiel TJ, Coukos G, Zou L, et al. Specific recruitmentof regulatory T cells in ovarian carcinoma fostersimmune privilege and predicts reduced survival. NatMed 2004;10:942–9.
22. Yagi H, Nomura T, Nakamura K, et al. Crucial role ofFOXP3 in the development and function of humanCD25+CD4+ regulatory T cells. Int Immunol 2004;16:1643–56.
23. Chen X, Murakami T, Oppenheim JJ, Howard OM.Differential response of murine CD4+CD25+ andCD4+CD25� T cells to dexamethasone-induced celldeath. Eur J Immunol 2004;34:859–69.
24. Brooks WH, Roszman TL, Mahaley MS, Woosley RE.Immunobiology of primary intracranial tumours. II.Analysis of lymphocyte subpopulations in patients withprimary brain tumours. Clin Exp Immunol 1977;29:61–6.
25. Brooks WH, Roszman TL, Rogers AS. Impairment ofrosette-forming T lymphocytes in patients with primaryintracranial tumors. Cancer 1976;37:1869–73.
26. Mahaley MS, Jr., Brooks WH, Roszman TL, BignerDD, Dudka L, Richardson S. Immunobiology of primaryintracranial tumors. Part 1: studies of the cellular andhumoral general immune competence of brain-tumorpatients. J Neurosurg 1977;46:467–76.
27. Hughes MA, Parisi M, Grossman S, Kleinberg L.Primary brain tumors treated with steroids andradiotherapy: low CD4 counts and risk of infection. IntJ Radiat Oncol Biol Phys 2005;62:1423–6.
28. Kleinberg L, Grossman SA, Piantadosi S, ZeltzmanM, Wharam M. The effects of sequential versusconcurrent chemotherapy and radiotherapy on survivaland toxicity in patients with newly diagnosed high-grade astrocytoma. Int J Radiat Oncol Biol Phys 1999;44:535–43.
29. Wheeler CJ, Black KL, Liu G, et al. Thymic CD8+ T-cell production strongly influences tumor antigenrecognition and age-dependent glioma mortality.J Immunol 2003;171:4927–33.
30. de Martin R, Haendler B, Hofer-Warbinek R, et al.Complementary DNA for human glioblastoma-derived Tcell suppressor factor, a novel member of the trans-forming growth factor-h gene family. EMBO J 1987;6:3673–7.
31. Wrann M, Bodmer S, de Martin R, et al. T cellsuppressor factor from human glioblastoma cells is a12.5-kd protein closely related to transforming growthfactor-h. EMBO J 1987;6:1633–6.
32. Munz C, Naumann U, Grimmel C, Rammensee HG,Weller M. TGF-h-independent induction of immunoge-nicity by decorin gene transfer in human malignantglioma cells. Eur J Immunol 1999;29:1032–40.
33. Fantini MC, Becker C, Monteleone G, Pallone F, GallePR, Neurath MF. Cutting edge: TGF-h induces aregulatory phenotype in CD4+CD25� T cells throughFoxp3 induction and down-regulation of Smad7.J Immunol 2004;172:5149–53.
34. Yamagiwa S, Gray JD, Hashimoto S, Horwitz DA. Arole for TGF-h in the generation and expansion ofCD4+CD25+ regulatory T cells from human peripheralblood. J Immunol 2001;166:7282–9.
35. Schramm C, Huber S, Protschka M, et al. TGFhregulates the CD4+CD25+ T-cell pool and the expressionof Foxp3 in vivo . Int Immunol 2004;16:1241–9.
36. Elliott L, Brooks W, Roszman T. Role of interleukin-2(IL-2) and IL-2 receptor expression in the proliferativedefect observed in mitogen-stimulated lymphocytesfrom patients with gliomas. J Natl Cancer Inst 1987;78:919–22.
Research. on March 24, 2016. © 2006 American Association for Cancercancerres.aacrjournals.org Downloaded from
2006;66:3294-3302. Cancer Res Peter E. Fecci, Duane A. Mitchell, John F. Whitesides, et al. Patients with Malignant GliomaCD4 Compartment Explains Cellular Immune Defects in Increased Regulatory T-Cell Fraction Amidst a Diminished
Updated version
http://cancerres.aacrjournals.org/content/66/6/3294
Access the most recent version of this article at:
Cited articles
http://cancerres.aacrjournals.org/content/66/6/3294.full.html#ref-list-1
This article cites 36 articles, 17 of which you can access for free at:
Citing articles
http://cancerres.aacrjournals.org/content/66/6/3294.full.html#related-urls
This article has been cited by 66 HighWire-hosted articles. Access the articles at:
E-mail alerts related to this article or journal.Sign up to receive free email-alerts
Subscriptions
Reprints and
To order reprints of this article or to subscribe to the journal, contact the AACR Publications
Permissions
To request permission to re-use all or part of this article, contact the AACR Publications
Research. on March 24, 2016. © 2006 American Association for Cancercancerres.aacrjournals.org Downloaded from
Copyright © 2022 FDOKUMEN