Incomplete cryptic speciation between intertidal and subtidal morphs of Acrocnida brachiata...
16
Molecular Ecology (2006) 15, 3303–3318 doi: 10.1111/j.1365-294X.2006.03000.x © 2006 The Authors Journal compilation © 2006 Blackwell Publishing Ltd Blackwell Publishing Ltd Incomplete cryptic speciation between intertidal and subtidal morphs of Acrocnida brachiata (Echinodermata: Ophiuroidea) in the Northeast Atlantic D. MUTHS,*† D. DAVOULT,* F. GENTIL * and D. JOLLIVET † *Ecologie Benthique, UMR7144, CNRS-UPMC, B.P.74, 29682 Roscoff, France, †Evolution & Génétique des Populations Marines, UMR7144, CNRS-UPMC, B.P.74, 29682 Roscoff, France Abstract The brittle-star Acrocnida brachiata (Montagu) lives in sandy-bottom habitat of both intertidal and subtidal zones along the coasts of the northwestern Europe. An allozyme frequency-based survey (five enzyme loci) was combined with a mitochondrial (mt) COI haplotype analysis (598-bp sequences) on 17 populations to trace back past colonization pathways from the actual population structure of the species. Both genetic markers display a sharp genetic break between intertidal (clade I) and subtidal populations (clade S). This break corresponds to an allele frequency inversion at three enzyme loci (Hk, Pgm and Pgi) and a deep divergence of about 20% in mtCOI sequences between most of the intertidal populations and other samples. The geographic distribution of clade I seems to be more restricted than clade S as it is absent from the intertidal of the eastern English Channel and North Sea and may be replaced by clade S in south Brittany. Applying previously published rates of mutation, divergence between the two clades is estimated to pre-date 5 million years ago and may be due to allopatric speciation processes at the Mio–Pliocene transition. The occurrence of putative hybrids in a few localities, however, suggests incomplete cryptic speciation with secondary contact zones. The relative importance of colonization history vs. habitat specialization are discussed in the light of neutral evolution as tested from mtCOI gene sequences. While differential selection seems to have contributed little to the separa- tion of the lineages, it may have played a role in the emergence of adaptive polymorphisms in the hybrid zone. Furthermore, congruent spatial patterns of differentiation were observed in both clades suggesting a recent increase in population size. These findings are in agreement with a recent expansion of the populations during or after the formation of the English Channel, from a southern refuge for the subtidal clade whereas the intertidal clade may have persisted further north. As previously suspected for a species with a very short pelagic larval phase, contemporary gene flow between distant or adjacent populations appears to be extremely reduced or even absent. Keywords: allopatric speciation, allozyme, ecotypic specialization, hybridization, mtCOI Received 13 December 2005; revision received 21 April 2006; accepted 1 May 2006 Introduction Understanding by which processes and mechanisms speciation operates is of paramount importance and remains a major challenge facing evolutionists. Although there is still an open debate about the definition of a species (Wilson 1999) and on the relative contributions of allopatry (Mayr 1942; Turelli et al . 2001) and sympatry ( Johannesson 2001; Via 2001) on speciation processes, only few studies have attempted to infer probability and time to speciate (Gavrilets 2003). It appears that the time to speciate, which is driven by mutation and drift, is typically very long while the speciation transition is relatively short. When changes affect genes underlying speciation, species’ isolation occurs very rapidly. If selection contributes to speciation, time to Correspondence: Delphine Muths, Fax: (33) 2 98 29 23 24; E-mail: [email protected]
Transcript of Incomplete cryptic speciation between intertidal and subtidal morphs of Acrocnida brachiata...

Molecular Ecology (2006)
15
, 3303–3318 doi: 10.1111/j.1365-294X.2006.03000.x
© 2006 The AuthorsJournal compilation © 2006 Blackwell Publishing Ltd
Blackwell Publishing Ltd
Incomplete cryptic speciation between intertidal and subtidal morphs of
Acrocnida brachiata
(Echinodermata: Ophiuroidea) in the Northeast Atlantic
D . MUTHS,
*†
D . DAVOULT,
*
F . GENTIL
*
and D. JOLLIVET
†
*
Ecologie Benthique, UMR7144, CNRS-UPMC, B.P.74, 29682 Roscoff, France,
†
Evolution & Génétique des Populations Marines, UMR7144, CNRS-UPMC, B.P.74, 29682 Roscoff, France
Abstract
The brittle-star
Acrocnida brachiata
(Montagu) lives in sandy-bottom habitat of bothintertidal and subtidal zones along the coasts of the northwestern Europe. An allozymefrequency-based survey (five enzyme loci) was combined with a mitochondrial (mt) COIhaplotype analysis (598-bp sequences) on 17 populations to trace back past colonizationpathways from the actual population structure of the species. Both genetic markers displaya sharp genetic break between intertidal (clade I) and subtidal populations (clade S). Thisbreak corresponds to an allele frequency inversion at three enzyme loci (
Hk
,
Pgm
and
Pgi
)and a deep divergence of about 20% in mtCOI sequences between most of the intertidalpopulations and other samples. The geographic distribution of clade I seems to be morerestricted than clade S as it is absent from the intertidal of the eastern English Channel andNorth Sea and may be replaced by clade S in south Brittany. Applying previously publishedrates of mutation, divergence between the two clades is estimated to pre-date 5 millionyears ago and may be due to allopatric speciation processes at the Mio–Pliocene transition.The occurrence of putative hybrids in a few localities, however, suggests incomplete crypticspeciation with secondary contact zones. The relative importance of colonization history vs.habitat specialization are discussed in the light of neutral evolution as tested from mtCOIgene sequences. While differential selection seems to have contributed little to the separa-tion of the lineages, it may have played a role in the emergence of adaptive polymorphismsin the hybrid zone. Furthermore, congruent spatial patterns of differentiation were observedin both clades suggesting a recent increase in population size. These findings are in agreementwith a recent expansion of the populations during or after the formation of the EnglishChannel, from a southern refuge for the subtidal clade whereas the intertidal clade mayhave persisted further north. As previously suspected for a species with a very short pelagiclarval phase, contemporary gene flow between distant or adjacent populations appears tobe extremely reduced or even absent.
Keywords
: allopatric speciation, allozyme, ecotypic specialization, hybridization, mtCOI
Received 13 December 2005; revision received 21 April 2006; accepted 1 May 2006
Introduction
Understanding by which processes and mechanismsspeciation operates is of paramount importance andremains a major challenge facing evolutionists. Althoughthere is still an open debate about the definition of a species
(Wilson 1999) and on the relative contributions of allopatry(Mayr 1942; Turelli
et al
. 2001) and sympatry (Johannesson2001; Via 2001) on speciation processes, only few studieshave attempted to infer probability and time to speciate(Gavrilets 2003). It appears that the time to speciate, whichis driven by mutation and drift, is typically very long whilethe speciation transition is relatively short. When changesaffect genes underlying speciation, species’ isolation occursvery rapidly. If selection contributes to speciation, time to
Correspondence: Delphine Muths, Fax: (33) 2 98 29 23 24; E-mail:[email protected]

3304
D . M U T H S
E T A L .
© 2006 The AuthorsJournal compilation © 2006 Blackwell Publishing Ltd
speciate decreases significantly (Gavrilets 2003). An increas-ing number of authors appear to agree on the importanceof fluctuating environmental conditions in triggeringsympatric isolation (and maybe speciation) over very smallspatial scales (Wiens 2004). Data sets on the Carribeanlizard,
Anolis roquet
(Ogden & Thorpe 2002), or the roughperiwinkle,
Littorina saxatilis
(Cruz
et al
. 2004), supportlocal adaptation as the major evolutionary force acting onpopulation divergence and fit with previously proposedecological models of speciation (Orr & Smith 1998; Schluter2001). In such cases, adaptation and ecological specializationmay prevent gene flow (via differential mortality) betweenlineages that inhabit adjacent but contrasted microenviron-ments, thereby driving ecological speciation through thefixation of advantageous alleles (Bierne
et al
. 2003). Environ-mental selection is, however, not the only force facilitatingspeciation. Selective processes associated with localhybridization due to secondary contact zones are alsoknown to prevent neutral gene flow between previouslyisolated demes. Reinforcement has thus often been pro-posed to be another major evolutionary mechanism in themaintenance of discrete breeding units during the time ofspeciation, leading to stable clines of allele frequencies atloci directly involved in reproductive isolation (Barton &Hewitt 1989). The way ecological factors may impact speci-ation mechanisms is thus a multifaceted question implyinggenes involved in either pre- or postzygotic processes ofreproductive isolation (Palumbi 1992; Johannesson 2001).
The existence of sibling species provides means ofunderstanding how speciation may work. Recent advancesin development of the genetic markers help identify crypticspecies and may lead to understanding the relative contri-butions of evolutionary forces promoting towards. Manysibling species have been discovered within all majormarine taxa (Knowlton 2000). Genetic studies have inves-tigated possible causes of speciation in the case of marinecrypticism (Knowlton 1993). Recently, a study on the poly-chaete
Pectinaria koreni
revealed the existence of mono-phyletic lineages along the north coast of France (Jolly
et al
.2005) involving allopatric processes. Likewise, Kruse &Reise (2003) revealed that the polychaete
Scoloplos armiger
in the Wadden Sea was actually composed of two siblingspecies living in distinct intertidal and subtidal areas. Thegenetic break between populations of
P. koreni
matcheswith the biogeographic boundary between Lusitanian andBoreal provinces whereas the distribution of sibling lineagesin
S. armiger
coincides with a bathymetric preference. Theoccurrence of two opposing reproductive strategies (brood-ing vs. pelagic larvae) in this latter species has reinforcedthe lineages divergence, supporting the idea of an environ-mental role in speciation processes (Kruse
et al
. 2004).In marine habitats, recently colonized areas can also
be very informative in terms of mechanisms whereby aspecies expands and competes for space and thus to test
whether crypticism is reflecting overlapping ranges orhabitat specialization. Indeed colonization mainly dependson factors such as the dispersal ability of species (Goldson
et al
. 2001), local hydrodynamic regimes (Wares
et al
. 2001;Waters & Roy 2004) and ecological preferences (Wiens2004). The English Channel is a relatively young geographicarea, which was only completely open as a channel some10 000–8000 years ago (Smith 1989; Lambeck 1997). Sincethe last glacial maximum (18 000–24 000 years), many eco-logical niches became available for native species fromboth the Atlantic Ocean and the North Sea. Moreover, thewestern entrance of the English Channel is a well-knownbiogeographic limit between the Lusitanian and the Borealprovinces (Cabioch
et al
. 1977; see Dinter 2001 and citedreferences) and thus an interesting area to explore whenconsidering vicariance or ecotypic differentiation. The goalof this study is to examine how each of these processesmay have influenced speciation in invertebrates associatedwith highly fragmented habitats such as the sandy-bottomhabitat.
Sibling species have been massively reported within theechinoderm group (Matsuoka & Hatanaka 1991; Baric &Sturmbauer 1999) and even observed for a sea urchin spe-cies inhabiting sandy sediments along the coasts of north-western Europe (Chenuil & Féral 2003). Sibling specieshave also been observed in polychaete species of the
Abraalba–Pectinaria koreni
community (Jolly
et al
. 2006). Theselatter findings allowed us to focus on the most commonlyfound echinoderm in these sandy-bottom habitat commu-nity, the brittle-star
Acrocnida brachiata
(Montagu) (Gentil
et al
. 1986), which can be suspected to also hide crypticspecies. It is widely distributed at the subtidal level in theNortheast Atlantic, from the Mediterranean to the BritishIsles and to the North Sea, but is never encountered above56
°
N (Koehler 1921). This brittle star is often observed asdensely populated aggregates in sandy-bottom habitat insubtidal (i.e. 1000 individuals per m
2
in Ireland, Keegan &Konnecker 1979; 900 individuals per m
2
on the coasts ofNormandy, Gentil & Zakardjian 1989). Its presence at theintertidal level seems much more restricted, to the Irishand Brittany areas where populations are sparsely distrib-uted (less than 100 individuals per m
2
on the coasts ofBrittany, Bourgoin 1987; D. Muths, personal observation).Unlike the polychaete species
Pectinaria koreni
and
Oweniafusiformis
studied by Jolly
et al
. (2005, 2006), with which itco-occurs,
A. brachiata
is suspected to have poor dispersalcapacities.
A. brachiata
therefore constitutes an ideal candi-date to investigate whether taxa exhibiting differentlife-history traits but the same habitat share a vicarianthistory and possibly, to evaluate whether local adaptation(intertidal vs. subtidal habitats) or local hybridization couldinterfere with these historical patterns.
This study was conducted on 17 populations of
A. brachiata
sampled among subtidal and intertidal areas along the

E C O T Y P I C L I N E A G E S I N
A C R O C N I D A B R A C H I A T A
3305
© 2006 The AuthorsJournal compilation © 2006 Blackwell Publishing Ltd
coasts of Britanny, the English Channel and the Irishsea using five polymorphic enzyme loci and a 598-bpportion of the mitochondrial cytochrome oxydase I(mtCOI) gene.
Materials and methods
Larval development of
Acrocnida brachiata
To have a rough idea of real dispersal capacities, observa-tions of larval development in
Acrocnida brachiata
have beenperformed. They were made under a light microscope byF. Gentil in July 1993. Larvae were obtained in aquaria aftera spontaneous spawning of adults collected at low tide onthe shore of Morgat Bay (see Table 1 for site information).Larvae were regularly sampled from water collection during4 days to follow larval development until subsequentmetamorphosis.
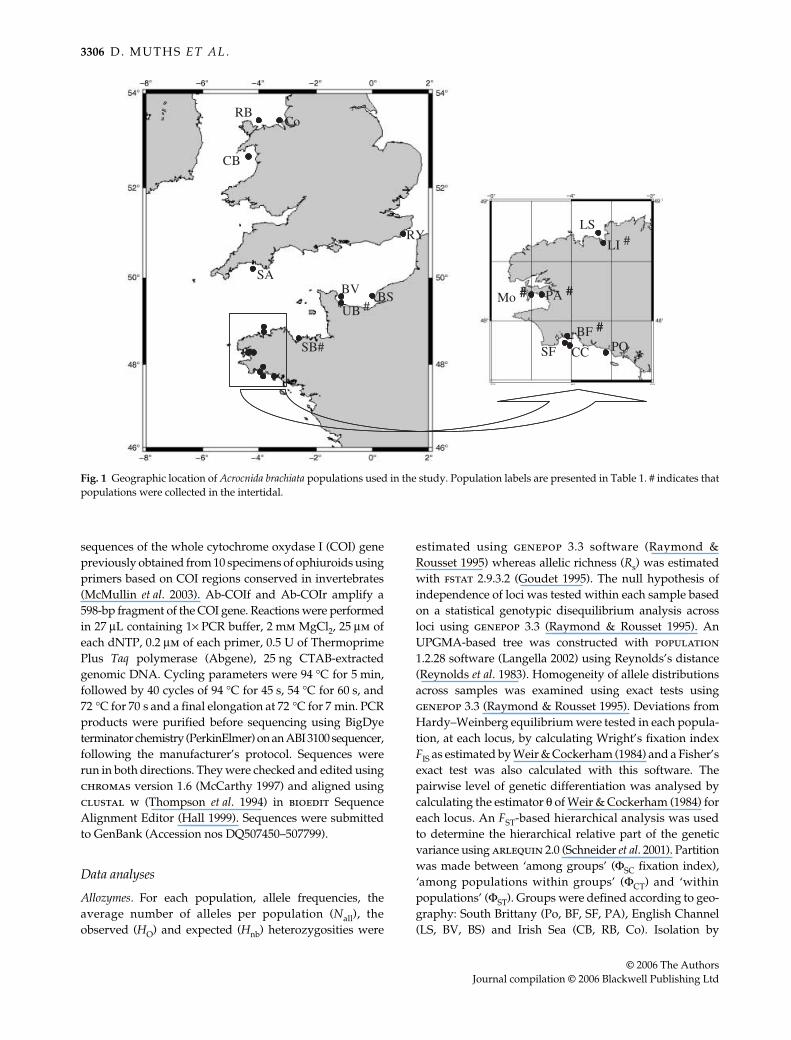
Sampling sites
Subtidal samples of
A. brachiata
were obtained by samplingthe top 10 cm of sediment with a 0.25 m
2
Hamon grab.Populations from the English Channel, the Irish Sea andSouth Brittany were sampled during the PECTGENE2000, the PECTIRL 2004, and the OPHIROIS 2005 cruises,respectively. All six intertidal populations were collectedalong Brittany and Normandy coasts at low tide in 2004 or2005. Geographic coordinates, sample labels and sizes aregiven in Table 1 and reported in Fig. 1. Individuals werefrozen in liquid nitrogen, except samples from southernEngland and Concarneau, which were stored at
−
32
°
C.
Enzyme electrophoresis
Each individual was divided into two parts: the disk-shapedbody for enzyme electrophoresis and arms for DNAextraction. Electrophoresis procedures were performedaccording to the methods described by Pasteur
et al
. (1987).Frozen samples of the body were homogenized using apotter with 250
µ
L of grinding buffer (10 m
m
Tris-HCl,2 m
m
EDTA, 0.05%
β
-mercaptoethanol, 0.1 m
m
PMSF,0.25 m
m
sucrose; pH 6.8), prior to centrifugation at 6500
g
for 12 min. The supernatant was stored at
−
80
°
C untilelectrophoresis. Horizontal enzyme electrophoresis wasconducted on 12% starch gels for the five enzyme systemsthat were found polymorphic using the following buffers:(1) Tris-Borate-EDTA, pH 8.6 for the glucose phosphateisomerase (
PGI
, E.C. 5.3.1.9), mannose phosphate isomerase(
MPI
, E.C. 5.3.1.8) and malic enzyme (
ME
, E.C. 1.1.1.40),and (2) Tris-HCl, pH 8.5 for the phosphoglucomutase(
PGM
, E.C. 5.4.2.2) and hexokinase (
HK
, E.C. 2.7.1.1). Buffersystems were run at constant amperage, during 5 h [160 V,35 mA for system (1) and at 150 V, 40 mA, for system (2)]. Themost frequent allele was called ‘100’ and other alleles werelabelled according to their relative mobility from allele 100.
Mitochondrial COI sequencing
Total genomic DNA was extracted according to the cetyl-trimethyl ammonium bromide (CTAB) extraction protocol asdescribed in Jolly
et al
. (2003). Specific polymerase chainreaction (PCR) primers (Ab-COIf: 5
′
-ATTTGGAAACTG-ACTYGTCC-3
′
and Ab-COIr: 5
′
-GTYGCTGCTGTRAAR-TAGG-3
′
) were designed from conserved regions of
Table 1 Geographic position and habitat of Acrocnida brachiata samples and sample sizes used in the allozymes and mitochondrial surveys
Population Label Habitat Latitude Longitude N allozymes N COI
Pouldu PO Subtidal 47°44.06′N 4°31.91′W 26 18Concarneau CC Subtidal 47°51.50′N 3°57.50′W — 7Bay Forest BF† Intertidal 47°53.42′N 3°57.48′W 48 25Sub Forest SF Subtidal 47°52.30′N 3°58.12′W 36 12Morgat Mo† Intertidal 48°13.54′N 4°30.30′W 35 26Aber PA† Intertidal 48°13.661′N 4°25.891′W 48 20Lannion-I LI† Intertidal 48°40.75′N 3°36.41′W 47 27Lannion-S LS Subtidal 48°44.95′N 3°36.50′W 11 9Saint Brieuc SB† Intertidal 48°33.08′N 02°41.24′W 48 15Baie des Veys BV Subtidal 49°32.00′N 1°15.50′W 48 26Utah Beach UB† Intertidal 49°25.04′N 1°10.32′W 48 23Baie de Seine BS Subtidal 49°28.30′N 0°02.28′E 35 31Cardigan Bay CB Subtidal 52°51.23′N 4°11.42′W 35 21Redwharf Bay RB Subtidal 53°20.10′N 4°07.13′W 48 39Colwyn Bay Co Subtidal 53°25.75′N 3°30.06′W 20 19Rye Bay RY Subtidal 50°53.44′N 0°53.45′E — 19St Austell Bay SA Subtidal 50°18.97′N 4°44.94′W — 21
†indicates that populations were collected in the intertidal zone.
3306 D . M U T H S E T A L .
© 2006 The AuthorsJournal compilation © 2006 Blackwell Publishing Ltd
sequences of the whole cytochrome oxydase I (COI) genepreviously obtained from 10 specimens of ophiuroids usingprimers based on COI regions conserved in invertebrates(McMullin et al. 2003). Ab-COIf and Ab-COIr amplify a598-bp fragment of the COI gene. Reactions were performedin 27 µL containing 1× PCR buffer, 2 mm MgCl2, 25 µm ofeach dNTP, 0.2 µm of each primer, 0.5 U of ThermoprimePlus Taq polymerase (Abgene), 25 ng CTAB-extractedgenomic DNA. Cycling parameters were 94 °C for 5 min,followed by 40 cycles of 94 °C for 45 s, 54 °C for 60 s, and72 °C for 70 s and a final elongation at 72 °C for 7 min. PCRproducts were purified before sequencing using BigDyeterminator chemistry (PerkinElmer) on an ABI 3100 sequencer,following the manufacturer’s protocol. Sequences wererun in both directions. They were checked and edited usingchromas version 1.6 (McCarthy 1997) and aligned usingclustal w (Thompson et al. 1994) in bioedit SequenceAlignment Editor (Hall 1999). Sequences were submittedto GenBank (Accession nos DQ507450–507799).
Data analyses
Allozymes. For each population, allele frequencies, theaverage number of alleles per population (Nall), theobserved (HO) and expected (Hnb) heterozygosities were
estimated using genepop 3.3 software (Raymond &Rousset 1995) whereas allelic richness (Rs) was estimatedwith fstat 2.9.3.2 (Goudet 1995). The null hypothesis ofindependence of loci was tested within each sample basedon a statistical genotypic disequilibrium analysis acrossloci using genepop 3.3 (Raymond & Rousset 1995). AnUPGMA-based tree was constructed with population1.2.28 software (Langella 2002) using Reynolds’s distance(Reynolds et al. 1983). Homogeneity of allele distributionsacross samples was examined using exact tests usinggenepop 3.3 (Raymond & Rousset 1995). Deviations fromHardy–Weinberg equilibrium were tested in each popula-tion, at each locus, by calculating Wright’s fixation indexFIS as estimated by Weir & Cockerham (1984) and a Fisher’sexact test was also calculated with this software. Thepairwise level of genetic differentiation was analysed bycalculating the estimator θ of Weir & Cockerham (1984) foreach locus. An FST-based hierarchical analysis was usedto determine the hierarchical relative part of the geneticvariance using arlequin 2.0 (Schneider et al. 2001). Partitionwas made between ‘among groups’ (ΦSC fixation index),‘among populations within groups’ (ΦCT) and ‘withinpopulations’ (ΦST). Groups were defined according to geo-graphy: South Brittany (Po, BF, SF, PA), English Channel(LS, BV, BS) and Irish Sea (CB, RB, Co). Isolation by
Fig. 1 Geographic location of Acrocnida brachiata populations used in the study. Population labels are presented in Table 1. # indicates thatpopulations were collected in the intertidal.
E C O T Y P I C L I N E A G E S I N A C R O C N I D A B R A C H I A T A 3307
© 2006 The AuthorsJournal compilation © 2006 Blackwell Publishing Ltd
distance was tested using a Mantel test with genepop 3.3(Raymond & Rousset 1995). Geographic distances betweenlocalities were estimated by calculating linear distancesalong the coastline using Great Circle Calculator (availableat www.gb3piorg.uk/great.html). Geographic distanceswere plotted against θ/(1 – θ) estimates to test for a linearrelationship following the recommendations of Rousset(1997).
Mitochondrial COI sequences. For each population, haplo-type (He-hap) and nucleotide (π) diversities were estimatedwith dnasp 4.0 (Rozas et al. 2003). A neighbour-joiningtree, based on Kimura 2-parameter distance was constructedusing mega 2.1 (Kumar et al. 2001), and Amphiura filiformis,its nearest related species, as the outgroup. Relativeconstancy rate of a molecular clock was tested and averagepairwise distances between populations were estimatedusing the same software. Pairwise values of geneticdifferentiation (ΦST) were calculated with arlequin 2.0(Schneider et al. 2001). This latter software was also usedto perform an analysis of molecular variance (amova) onpopulations. Partition of the data set was similar to thatperformed for allozymes with the St Austell Bay populationadded to the Irish Sea group and the Rye Bay one addedto the English Channel group. Median-joining networks(Bandelt et al. 1999) were constructed using network4.1.0.7 (available at www.fluxus-technology.com/).
Asymmetric gene flow and migration patterns amongpopulations were estimated using the coalescent approachas implemented in the software package migrate-n (Beerli& Felsenstein 2001). Past gene flow was obtained from an-island migration model using 10 short chains with 500steps and 3 long chains with 5000 steps, with 10 000 non-retained genealogies sampled at the beginning of each chain.A first run was made with our theta estimates (i.e. π values).A 10-replicate run was then conducted using results of thefirst run with random tree as data type option. Runs werecompared until results became convergent.
Tajima’s (1989) D statistic was calculated as an index ofdeparture from population equilibrium using dnasp 4.0(Rozas et al. 2003). Mismatch curves were created with thesame software package. A sliding-window analysis wasconducted along sequences to further examine the distri-
bution of nucleotide diversity (π) and Tajima’s D statisticover the sequences in order to localize local departuresfrom neutrality. Departure from neutral evolution wasexamined using a McDonald & Kreitman (1991) test, usingdnasp 4.0 (Rozas et al. 2003). This method compares thedistribution of synonymous and nonsynonymous differ-ences that have been fixed between two taxa (KN/KS ratio)and the distribution of synonymous and nonsynonymouspolymorphic sites accumulated within each species (θN/θSratio). If KN/KS is significantly greater than θN/θS then atleast one lineage may have evolved under positive Darwinianselection whereas, in the opposite case, it may indicateeither the selective maintenance of ancestral polymorph-ism between species or the emergence of an adaptivepolymorphism in one species.
Genetic markers were also used to perform assignmenttests in order to detect potential hybridization in A. brachiata.Assignment tests were done with the software geneclassversion 2 (Piry et al. 2004) using Rannala & Mountain’scriterion (1997) and Paetkau et al.’s simulation algorithm(2004) with 10 000 simulated individuals. First, partition ofthe data set was made on the basis of mtCOI signature (twogroups defined; see Results) and then assignment testswere performed on multilocus allozyme data. At the end ofthe first simulation, misassigned individuals (i.e. individualsdisplaying a mitochondrial signature characteristic fromone group and a nuclear genotype typical of the othergroup) were removed from the data set and additionalsimulations were carried out until all individuals weresuccessfully assigned.
Results
Larval development of Acrocnida brachiata
Observations of larval development of Acrocnida brachiataare presented in Fig. 2. The two-arm pluteus stage wasreached after only 6 h. The length of the arms rapidlyincreased then and was followed by the growth of the bodyuntil metamorphose. Because of abbreviated development,changes in the pluteus shape are very limited, e.g. post-erodorsal arms are absent, in comparison with otherechinoderms. Complete development occurred in 4 days
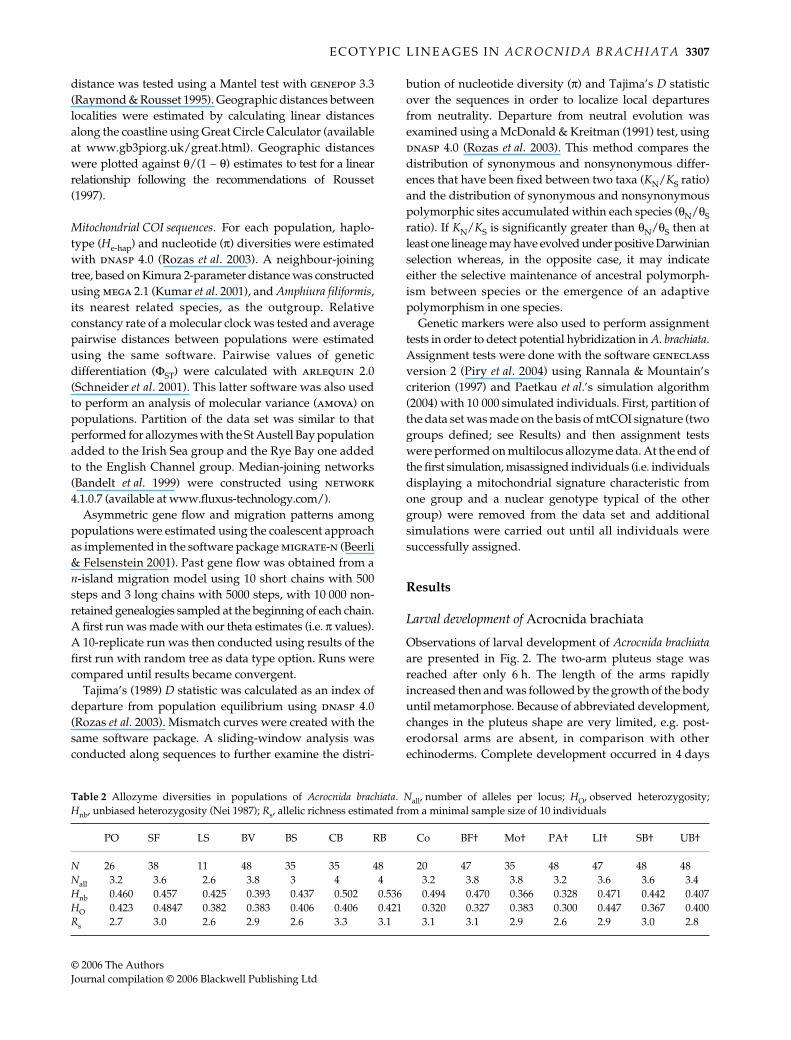
Table 2 Allozyme diversities in populations of Acrocnida brachiata. Nall, number of alleles per locus; HO, observed heterozygosity;Hnb, unbiased heterozygosity (Nei 1987); Rs, allelic richness estimated from a minimal sample size of 10 individuals
PO SF LS BV BS CB RB Co BF† Mo† PA† LI† SB† UB†
N 26 38 11 48 35 35 48 20 47 35 48 47 48 48Nall 3.2 3.6 2.6 3.8 3 4 4 3.2 3.8 3.8 3.2 3.6 3.6 3.4Hnb 0.460 0.457 0.425 0.393 0.437 0.502 0.536 0.494 0.470 0.366 0.328 0.471 0.442 0.407HO 0.423 0.4847 0.382 0.383 0.406 0.406 0.421 0.320 0.327 0.383 0.300 0.447 0.367 0.400Rs 2.7 3.0 2.6 2.9 2.6 3.3 3.1 3.1 3.1 2.9 2.6 2.9 3.0 2.8

3308 D . M U T H S E T A L .
© 2006 The AuthorsJournal compilation © 2006 Blackwell Publishing Ltd
in aquaria under in situ conditions (i.e. aquaria were directlysupplemented with nonfiltered open sea water) and is thusthought to be very reduced in natural conditions. Thiscoincides with the type II of ophiuroid developmental modewith a short-lived lecitotrophic larva (Mortensen 1921).
Allozymes
Five polymorphic enzyme loci were screened during thisstudy. The number of alleles varied from 3 to 7 (see Table 2),with an average of 5.4 (± 1.8). Allelic richness was quitesimilar between populations. Allele frequencies (f) highlightthe occurrence of a marked genetic structure for at leastthree out of five loci (Hk, Pgm, Pgi) and for two to four allelesper locus (Fig. 2). While five of the six intertidal populations(all except Bay Forest) were characterized by highfrequencies of alleles Hk-90 and Hk-95 (f > 0.95), the mostfrequent alleles in the subtidal populations were Hk-100and Hk-105 (f > 0.95). Although alleles Hk-95, Hk-100 andHk-105 appeared in nearly all populations, Hk-80 and Hk-90 were exclusive of intertidal populations whereas Hk-110was only found in subtidal ones. The Pgm and Pgi locishow similar, but less pronounced, patterns of frequencyinversions (see Fig. 3). Moreover, allele frequencies ofLannion-intertidal vs. Lannion-subtidal samples or UtahBeach vs. Baie des Veys samples clearly showed an allozymeprofile that was less similar between two close populationsinhabiting different bathymetric levels than between twopopulations of similar depth but distant by thousands ofkilometres. This important allele-frequency break betweenintertidal and subtidal populations suggests the existenceof two distinct genetic groups that does not correspond tothe geographic position of samples but to their bathymetryover the shore. However, unlike the other intertidal popu-lations, population from Bay Forest showed an allozymefrequency profile similar to that of the subtidal populations,which contrasted with the other intertidal populations.
The UPGMA tree obtained using Reynolds distanceshighlights a major genetic split between intertidal and
subtidal populations (Fig. 4), with the exception of theintertidal population from Bay Forest grouping within theclade S with subtidal populations. However most boot-strap values were weak. The position of Bay Forest insidethe subtidal clade may be indicative of a range limit of theintertidal clade in the Atlantic (one clade being replaced bythe other in this context). A hierarchical analysis of vari-ance was used to test the significance of the clustering bypartitioning the genetic variance between and within thesetwo clades. Although most of the genetic variation wasexplained by population heterogeneity (76.02% of the totalvariation: ΦST = 0.24; P < 0.01), variations between clades(18.90%) or between populations within clades (5.08%)were also significant (ΦCT = 0.19 and ΦSC = 0.06; P < 0.01).
Genotypic disequilibrium was not detected across lociwhen calculated within each clade (P > 0.05), indicatingthat loci give independent information. Association amongloci was, however, detected at some subtidal populationslocated in the Irish Sea and some intertidal populationsalong the Brittany coastline: Me-Mpi in Colwyn Bay, Car-digan Bay and Redwharf Bay populations (P < 0.05), forHk-Pgi at Redwharf Bay (P < 0.05), for Pgm-Pgi at Morgat(P < 0.01) and Pgi-Me at Lannion-I (P < 0.01). Monolocusand multilocus FIS values are presented separately for eachclade in Table 3 (A, B). Heterozygote deficiencies wereobserved in all populations. These departures fromHardy–Weinberg proportions were highly significant forsix out of the nine populations of clade S and four out offive populations of clade I. Values in clade S ranged from−0.048 for Sub Forest to 0.416 for Colwyn Bay. The threeIrish Sea populations together with Bay Forest displayedthe highest FIS values compared to the five other popula-tions. Values in clade I ranged from −0.003 for UtahBeach to 0.241 for Saint Brieuc and were highest along theBrittany coast.
Using Weir & Cockerham’s (1984) estimator θ, pairwisegenetic differentiation was calculated separately for eachclade; values are presented in Table 4 (A, B). All pairwiseθ values were significantly different from zero in clade I
Fig. 2 Photographs depicting the larvaldevelopment of intertidal specimens of A.brachiata made under light microscope. Lessthan three days separate the 1st from the3rd picture: (A) 6-h-old larva; (B) 36-hendotrophic pluteus with two arm; and (C)60-h-old pluteus, metamorphosis startedand the juvenile skeletal architecture isappearing.

E C O T Y P I C L I N E A G E S I N A C R O C N I D A B R A C H I A T A 3309
© 2006 The AuthorsJournal compilation © 2006 Blackwell Publishing Ltd
(0.04 < θ < 0.11; all P < 0.01) whereas several were not inclade S (0 < θ < 0.13; see P values in Table 4A). The overallmultilocus θ estimate was lower for clade S than for cladeI (0.051 and 0.071, respectively). An amova based on geog-raphy was performed for clade S but was not significant
across the three main geographic groups (ΦCT = 0.02; P >0.05). More variance was found ‘within populations’ than‘among populations’ (93.8% and 4.3%, respectively). Valuesof fixation indices were weak (ΦSC = 0.04 and ΦST = 0.06).Although marginally significant, a pattern of isolation bydistance was observed in clade S (P = 0.06, Mantel test; seeFig. 5), but not in clade I (P = 0.94).
Mitochondrial COI
The sequencing of the 598-bp mtCOI gene revealed a highlevel of nucleotide and haplotype polymorphism. Sequenceanalysis indicated the occurrence of 168 polymorphic sites,from which 151 different haplotypes could be detected.From this data set, 77.9% of the sites were parsimoniouslyinformative and 22.1% were singletons. A neighbour-joining tree based on average pairwise distances betweenmtCOI sequences across populations is presented in Fig. 6and shows a deep nucleotide divergence (19.6%) betweenintertidal populations (with the exception of Bay Forest)and subtidal populations. The Aber population was splitinto two subpopulations, each within one clade (PA-a in
Fig. 3 Allele frequencies at the five enzyme loci in populations ofAcrocnida brachiata sampled in subtidal and in intertidal habitats.
Fig. 4 UPGMA tree showing the genetic relationship betweenpopulations of Acrocnida brachiata using allozyme data andReynold et al.’s (1983) distance. The number above branchesindicates bootstrap confidence values, with 1000 resampling of thedata set.
Fig. 5 Isolation-by-distance graph showing pairwise geneticdistance θ/(1 – θ) plotted against geographical distances forpopulations of clade S of Acrocnida brachiata (test Mantel, P = 0.06)

3310 D . M U T H S E T A L .
© 2006 The AuthorsJournal compilation © 2006 Blackwell Publishing Ltd
clade S and PA-b in clade I). This deep divergencecontrasted greatly with the average pairwise distances:within each clade, populations showed less than 1% ofdivergence. Relative constancy rate of a molecular clockwas not rejected (P > 0.05) when considering the neighbour-joining tree, allowing us to estimate the time elapsed sincethe divergence of the two clades. Applying the substitutionrate previously published by Bermingham & Lessios (1993)
for sea urchins (i.e. 2% substitutions per million years), avalue commonly used for animals (Rand 1994), divergenceof 19.6% corresponds to a divergence time of about 5 millionyears. As a comparison, divergence between A. brachiataand Amphiura filiformis (the outgroup), its nearest relatedspecies, was about 29.8%.
Since divergence between groups was very deep, eachclade was analysed separately. Levels of genetic diversities
Table 3 Mono- and multilocus estimates of the fixation index FIS within each population of (A) the subtidal clade of Acrocnida brachiata and(B) the intertidal clade. Test of significance were performed with genepop 3.3 (Raymond & Rousset 1995), *P < 0.05; **P < 0.01; ***P < 0.001
A PO SF LS BV BS CB RB Co BF†
Hk −0.084 −0.143 −0.538 −0.121 0.299 0.273 0.193 −0.073 0.269***Pgm 0.232 0.053 −0.000 0.182* 0.004 0.269*** 0.270* 0.358 0.188Pgi 0.016 −0.138 0.484 −0.093 0.032* −0.074* 0.150 0.329* 0.290***Me — — — 0.305 −0.033 0.460* 0.377** 0.835** 0.299Mpi 0.143** −0.012 0.429 0.314 0.103 0.633* 0.567***Multilocus average 0.061* −0.048 0.075 0.055* 0.060 0.248*** 0.219** 0.416*** 0.323***
B Mo† PA† LI† SB† UB†
Hk −0.002 0.035 −0.032* 0.252* −0.021Pgm 0.022 −0.101 0.267* 0.053 −0.118Pgi −0.386** −0.033 −0.205 −0.386*** −0.167Me 0.238 0.567*** 0.284 0.732*** 0.350**Mpi 0.477** 0.032 −0.008* 0.554*** −0.061Multilocus average 0.070** 0.100* 0.061*** 0.241*** −0.003
Table 4 Pairwise values of genetic differentiation of Acrocnida brachiata clade S (A) and of clade I (B). Multilocus Weir & Cockerham’s (1984)θ values obtained from the enzyme data set are in bold, below the diagonal with test of significance performed with genepop 3.3 (Raymond& Rousset 1995) Pairwise ϕST values obtained from the mtCOI sequences data set are above the diagonal with test of significance performedwith arlequin 2.0 (Schneider et al. 2001). *P < 0.05; **P < 0.01; ***P < 0.001 (— indicates unavailable values)
A PO CC BF,4 SF LS BV BS CB RB Co SA RY
PO 0.000 0.000 0.017 0.000 0.007 0.011 0.000 0.009 0.000 0.029 0.003CC 0.005 0.048 0.003 0.000 0.009 0.000 0.012 0.000 0.000 0.000BF # 0.092*** — 0.002 0.000 0.021 0.019* 0.006 0.016 0004 0.046* 0.009SF 0.010 — 0.081*** 0.101** 0.140** 0.113** 0.100 0.082* 0.132 0.203* 0.106*LS 0.045* — 0.047*** 0.001 0.013 0.000 0.000 0.001 0.002 0.045 0.001BV 0.123*** — 0.091*** 0.067*** 0.013 0.018 0.000 0.011 0.000 0.000 0.004BS 0.131*** — 0.079*** 0.085*** 0.025* 0.023*** 0.000 0.000 0.002 0.042** 0.014CB 0.044*** — 0.056*** 0.025*** −−−−0.010 0.040*** 0.040*** 0.000 0.000 0.016 0.003RB 0.039*** — 0.067*** 0.034*** 0.021 0.048*** 0.031*** 0.014* 0.002 0.043 0.006Co 0.114*** — 0.032* 0.102*** 0.039 0.061*** 0.066*** 0.030*** 0.047*** 0.000 0.000SA — — — — — — — — — — — 0.027
B Mo† PA-b† Ll† SB† UB†
Mo # 0.100* 0.019 0.078* 0.045*PA-b # 0.105*** 0.036 0.066 0.005Ll # 0.080*** 0.043*** 0.029 0.005SB 9 0.090*** 0.092*** 0.065*** 0.011UB 9 0.074*** 0.043*** 0.057*** 0.060***

E C O T Y P I C L I N E A G E S I N A C R O C N I D A B R A C H I A T A 3311
© 2006 The AuthorsJournal compilation © 2006 Blackwell Publishing Ltd
within populations of each clade are provided in Table 5A(clade S) and Table 5B (clade I). For both clades, the meanhaplotype diversity (He-hap) and mean nucleotide diversity(π) were of the same order of magnitude, approximately0.92 and 0.005, respectively.
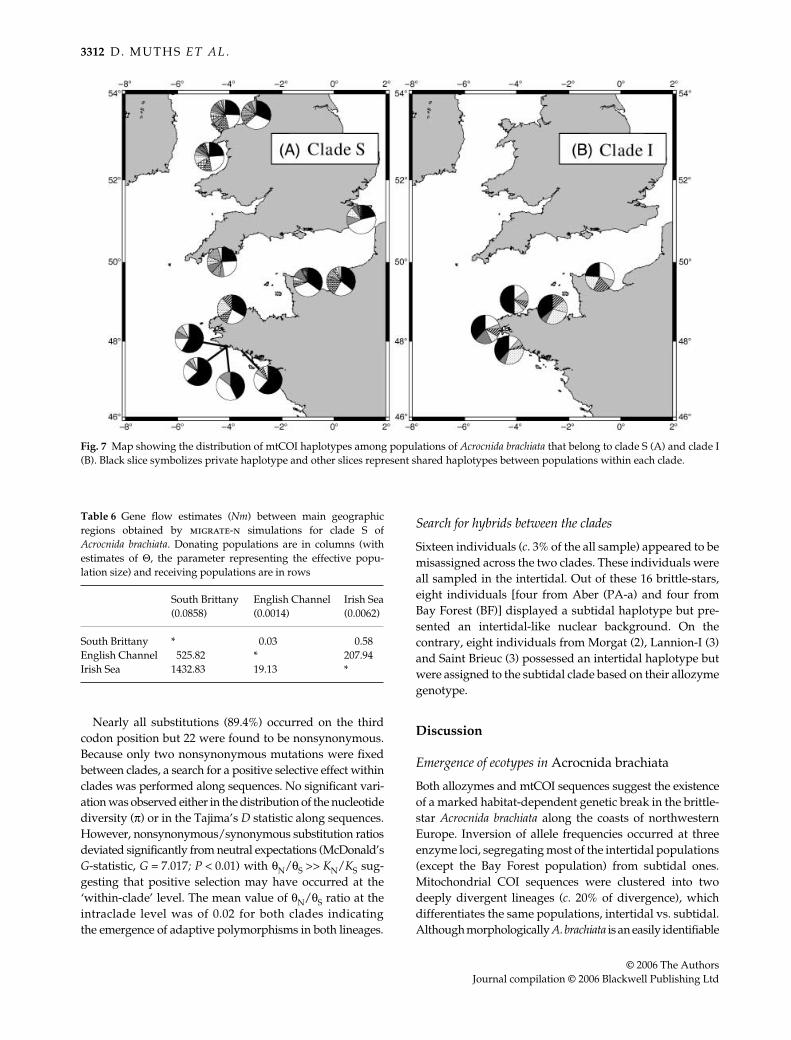
The haplotype distribution for each clade over thesampling area is shown in Fig. 7(A, B). Populations of cladeS only shared 20 haplotypes out of 104 although at very dif-ferent frequencies. The proportion of ‘private’ haplotypesvaried from 35% to 63% with smaller values in the Irish Seapopulations and higher values in South Brittany popula-tions. Populations from clade I shared 6 haplotypes out of47. Pairwise ΦST estimates obtained from mtCOI sequences
are presented in Table 4 (A, B). Most ΦST values were weakand nonsignificant in both clades. Sub Forest appeared verydifferent from other subtidal populations, mainly due to ahaplotype (HS1) for which the frequency was twice as lowas in the other populations. An amova was also performedaccording to geography within clade S. Even if most of thevariance (69%) was still associated with the ‘within popu-lation’ level (ΦST = 0.31, P < 0.01), differentiation was alsosignificant across geographic groups (ΦCT = 0.15, P < 0.05).
Estimated gene flows between the three geographicregions were very asymmetric (Table 6). Most migrantsoriginated from South Brittany with more individuals col-onizing the Irish Sea than the English Channel. Althoughslight, migrations appeared also asymmetric between theIrish Sea and the English Channel with gene flow orientatedtowards the English Channel by one order of magnitude.
Haplotype networks are presented in Fig. 8. The networkdrawn for the clade S revealed a ‘star-like distribution’ withone common haplotype (HS1), found in all populations(Fig. 8A). Most divergent haplotypes directly originatedfrom this haplotype with a maximum divergent branchlength of nine mutational steps. Nonsynonymous substitu-tions were homogeneously distributed over the network.The network drawn for clade I revealed a more complexstructure (Fig. 8B). The five intertidal populations sharedfour main haplotypes plus a highly divergent branch madeof eight haplotypes presenting a maximum length of 14mutational steps from haplotype HI1 that only occurred inLannion-I specimens. As opposed to clade S, nonsynonymousmutations were mostly found around haplotype HI2.
Mismatch distributions created for each clade are pre-sented in Fig. 9(A, B). Distributions were unimodal withnegative and significant Tajima’s D values (D = −2.455,P < 0.001 for clade S, and D = −1.956, P < 0.05 for clade I).These negative values indicated an excess of low frequencyvariants that could be due to either a selective sweep or apopulation size expansion.
Fig. 6 Neighbour-joining tree of Acrocnida brachiata populationsbased on average pairwise distances between mtCOI sequencesof A. brachiata individuals across populations using Kimura2-parameter distance method (Kimura 1980). Davg is the averagedivergence between the two clades using the same distance method.
Table 5 Mitochondrial COI gene diversities for the 13 populations of Acrocnida brachiata of clade S (A) and of clade I (B) (PA-a and PA-bcorresponds to individuals of the population from Aber that display, respectively, a subtidal or an intertidal mtCOI signature). N, numberof sequences; h, number of haplotypes by populations; He-hap, haplotype diversity; π, nucleotide diversity
A PO CC BF† SF PA-a† LS BV BS CB RB Co RY SA clade S
N 18 7 25 12 4 9 26 31 21 39 19 19 21 243h 15 S 20 11 3 7 14 18 14 21 13 9 13 104He-hap 0.961 0.857 0.973 0.985 0.833 0.944 0.874 0.916 0.938 0.938 0.906 0.778 0.929 0.927π 0.0064 0.0038 0.0060 0.0064 0.0047 0.0046 0.0054 0.0047 0.0068 0.0060 0.0041 0.0033 0.0015 0.0054
B Mo† PA-b† LI† SB† UB† clade I
N 26 16 27 15 23 107h 15 11 18 9 10 47He-hap 0.898 0.933 0.960 0.914 0.885 0.923π 0.0052 0.0047 0.0072 0.0051 0.0048 0.0058
3312 D . M U T H S E T A L .
© 2006 The AuthorsJournal compilation © 2006 Blackwell Publishing Ltd
Nearly all substitutions (89.4%) occurred on the thirdcodon position but 22 were found to be nonsynonymous.Because only two nonsynonymous mutations were fixedbetween clades, a search for a positive selective effect withinclades was performed along sequences. No significant vari-ation was observed either in the distribution of the nucleotidediversity (π) or in the Tajima’s D statistic along sequences.However, nonsynonymous/synonymous substitution ratiosdeviated significantly from neutral expectations (McDonald’sG-statistic, G = 7.017; P < 0.01) with θN/θS >> KN/KS sug-gesting that positive selection may have occurred at the‘within-clade’ level. The mean value of θN/θS ratio at theintraclade level was of 0.02 for both clades indicatingthe emergence of adaptive polymorphisms in both lineages.
Search for hybrids between the clades
Sixteen individuals (c. 3% of the all sample) appeared to bemisassigned across the two clades. These individuals wereall sampled in the intertidal. Out of these 16 brittle-stars,eight individuals [four from Aber (PA-a) and four fromBay Forest (BF)] displayed a subtidal haplotype but pre-sented an intertidal-like nuclear background. On thecontrary, eight individuals from Morgat (2), Lannion-I (3)and Saint Brieuc (3) possessed an intertidal haplotype butwere assigned to the subtidal clade based on their allozymegenotype.
Discussion
Emergence of ecotypes in Acrocnida brachiata
Both allozymes and mtCOI sequences suggest the existenceof a marked habitat-dependent genetic break in the brittle-star Acrocnida brachiata along the coasts of northwesternEurope. Inversion of allele frequencies occurred at threeenzyme loci, segregating most of the intertidal populations(except the Bay Forest population) from subtidal ones.Mitochondrial COI sequences were clustered into twodeeply divergent lineages (c. 20% of divergence), whichdifferentiates the same populations, intertidal vs. subtidal.Although morphologically A. brachiata is an easily identifiable
Fig. 7 Map showing the distribution of mtCOI haplotypes among populations of Acrocnida brachiata that belong to clade S (A) and clade I(B). Black slice symbolizes private haplotype and other slices represent shared haplotypes between populations within each clade.
Table 6 Gene flow estimates (Nm) between main geographicregions obtained by migrate-n simulations for clade S ofAcrocnida brachiata. Donating populations are in columns (withestimates of Θ, the parameter representing the effective popu-lation size) and receiving populations are in rows
South Brittany(0.0858)
English Channel(0.0014)
Irish Sea(0.0062)
South Brittany * 0.03 0.58English Channel 525.82 * 207.94Irish Sea 1432.83 19.13 *

E C O T Y P I C L I N E A G E S I N A C R O C N I D A B R A C H I A T A 3313
© 2006 The AuthorsJournal compilation © 2006 Blackwell Publishing Ltd
Fig. 8 Haplotype networks representing the evolutionary relationships between mitochondrial haplotypes within clade S (A) and clade I(B). Connecting lines correspond to the number of mutational steps between haplotypes. Red square represents hypothetical haplotype notdetected in the study. Red bar indicates a nonsynonymous mutation. Names of the most common haplotypes are indicated. The size of acircle is proportional to the number of individuals observed for a given haplotype and the colour of pie charts represents the regional originof the haplotype. For clade S, black corresponds to Irish populations (CB, Co, RB), yellow to South Brittany populations (Po, CC, SF, BF),blue to Eastern English Channel populations (BV, BS, RY), green to Western English Channel (SA, LS). For clade I, black corresponds toMorgat, yellow to Aber, blue to Utah Beach, grey to Lannion and green to Saint Brieuc.

3314 D . M U T H S E T A L .
© 2006 The AuthorsJournal compilation © 2006 Blackwell Publishing Ltd
species (Koehler 1921), with no reported plasticity, it isnow clear that this echinoderm species should not beregarded as a unique species but as a complex of two old‘sibling’ lineages. The average level of genetic differentiationbetween two populations from the same clade but fromdifferent localities is three to five times lower than thatfound between two populations of the same locality butinhabiting different bathymetric levels (e.g. θ = 0.22 betweenLannion-S and Lannion-I whereas θ = 0.02 and 0.06between Lannion and other populations of clade S and I,respectively). The same level of divergence was encounteredacross the whole sampling area. Hence, the divergencebetween these two lineages is probably due to an ancientunique speciation event followed by expansion rather thanthe result of local selective pressures acting independentlywithin each locality. This poses the intriguing questionabout speciation mechanisms leading to the emergence ofthese two lineages. Did populations separate geographically(i.e. allopatric speciation followed by secondary contacts),or did they progressively diverge from a single ancestralarea (i.e. sympatric speciation) in which contrasted habitatshave favoured reduced gene flow and local adaptation?
Based on previous published substitution rates in echin-oderms (Bermingham & Lessios 1993), the level of diver-gence found between the two clades was estimated to date
back to c. 5 million years ago (divergence of 20% with amutation rate of 2% per million years), approximately atthe time of the Mio–Pliocene transition. This period wascharacterized by a continentalization of Western Europe(Meulenkamp & Sissingh 2003) as well as major climaticand tectonic changes (Brault et al. 2004). During thisperiod, no marine corridors existed between the AtlanticOcean and the North Sea with the exception of a passagetowards the North of the British Isles. Haq et al. (1987)showed numerous sea level changes during this periodwith dramatic increases possibly reaching 100 m in ampli-tude, 6–5 and 4–3 million years ago, with a period of lowlevels in between. As a consequence, exchanges were tem-porarily reduced between the North Sea and the AtlanticOcean and may have greatly affected migration patterns ofmarine invertebrates. Continental uplift and decreases insea level may have influenced processes of differentiationbetween the two A. brachiata clades. One possible scenariois that genetic isolation started during a period of decreas-ing sea level: one group may have been isolated undercolder conditions whereas the other group took refugein warmer waters (i.e. in different latitudes or differentdepths). Secondary contacts between the two groups mayhave then been possible owing to an increase in sea level,the opening of the North Sea Basin and/or the opening ofthe English Channel (10 000–8000 years). In this case, theintroduction of each group to the other group’s habitatwould have led to local maladaptation, thus reinforcingeach clade at a given depth.
Polychaete genera associated with sandy-bottom habitatof Northeastern Atlantic exhibit a similar deep geneticbreak of about 20% either between closely related speciesof Pectinaria or between the subtidal and intertidal cladesof Owenia fusiformis (25.9% and 19.2%, respectively; Jollyet al. 2006). At present, A. brachiata clade I and O. fusiformisclade 3 seem to share the same geographic distribution,restricted in the intertidal (Jolly et al. 2006). Moreover,divergence of 20.6% was found between two well-identifiedtubeworm polychaete species from the genus Sabellariathat live separately in the subtidal or the intertidal area(F. Rigal, unpublished). The similar level of divergenceencountered within several species complexes of thesandy-bottom habitat suggests the occurrence of vicariantevents. These species seem to share a similar history at theMio–Pliocene transition, suggesting allopatric processesthrough an ancestral separation of the sandy-bottom habitatcommunities into two distinct refuges, one being probablyshallower than the other.
While the Mio–Pliocene transition may have played animportant role in allopatric speciation, sympatric differen-tial selective pressures could have contributed to the split-ting of A. brachiata lineages. Long-term adaptation of brittlestars to different environments may be associated withcontrasting levels of physiological tolerance to desiccation,
Fig. 9 Mismatch curves obtained for the two clades of Acrocnidabrachiata. Expected curve under a constant population size isrepresented by a continuous line and the observed one by a dottedline.

E C O T Y P I C L I N E A G E S I N A C R O C N I D A B R A C H I A T A 3315
© 2006 The AuthorsJournal compilation © 2006 Blackwell Publishing Ltd
temperature, or hypoxia, as it is the case for the polychaeteS. armiger (Kruse et al. 2004) and thus may reinforce habitatsegregation. However, the sympatric hypotheses could beconsidered if regarding only the allozyme data but not inthe light of our results on mitochondrial sequences. First,the McDonald and Kreitman test was significant butnonsynonymous substitutions accumulated within eachlineage, not between them. Second, no variation in thedistribution of the nucleotide diversity and of the Tajima’sD-statistic was detected along sequences. While bothfindings invalidate (1) the possibilities of ecotypic special-ization hypotheses and (2) the maintenance of ancestralpolymorphism, they strengthen the supposition of theemergence of adaptive polymorphisms within each lineageafter the splitting of the ancestral species. As a consequence,speciation in A. brachiata does not seem to have been drivenby diversifying selective processes on ecological interac-tions but is likely the reflection of allopatric events at theMio–Pliocene transition.
Nonetheless, ecological interactions were probably ofcrucial importance in the reinforcement and in the bathy-metric positioning of the two lineages after they separated.Even if not directly implicated in the emergence of thetwo lineages, ecological interactions may explain theirco-occurrence and relative differentiation within a givenlocality. A few studies have already shown the influence ofbathymetry on the spatial distribution of enzyme alleles(Kirby et al. 1994; Schmidt & Rand 2001; Veliz et al. 2004).Moreover, postzygotic selection by the way of local reten-tion of pre-adapted larvae or young settlers and selectiveelimination of nonadapted ones may reinforce the mainte-nance of the two clades (Bierne et al. 2003). A previous fine-scale survey of population dynamics in the Bay of Morgatrevealed subtle differences in recruitment periods andgamete maturation between intertidal and subtidal popu-lations (Bourgoin et al. 1991). Thus, mismatch in reproductiveperiods may also contribute to preferential reproductionwithin lineages and to the continuing isolation of the diver-gent lineages within a locality. However, ecophysiologicalexperiments are necessary to determine whether the main-tenance of A. brachiata ecotypes is favoured by differingenvironmental conditions (e.g. Gardner & Thompson 2001;Edmands & Deimler 2004).
In the present case, hybridization followed by selectionagainst hybrids could also explain the maintenance of bothclades at different bathymetric levels after secondary con-tact. Differences in allele frequencies between intertidaland subtidal ecotypes were quite modest for four allozymeloci (compared to locus Hk), possibly reflecting hybridiza-tion and different levels of introgression between lineagesdepending on localities. Moreover, the occurrence of 16individuals displaying a haplotype from one clade but anuclear background from the other clade strongly suggeststhat the splitting of the two lineages is incomplete. Varying
degrees of introgression may explain the observed geno-typic disequilibria and high heterozygote deficiencies thatwere found locally, especially in the Irish Sea (subtidal clade)and in South Brittany (intertidal clade). Furthermore, thelevel of gene introgression may also alter the patterns ofnuclear vs. cytoplasmic differentiation, possibly explain-ing the greater pairwise population differentiation forallozymes compared to the mitochondrial gene and thelack of clear evidence for an isolation-by-distance patternin either clade. In any case, the occurrence of hybridizationstrengthens our scenario of ancestral separation of two eco-typic lineages due to allopatry and reinforcement after sec-ondary contact — as it is the case for other hybrid zones (Kirbyet al. 1997) — rather than to sympatric differential selection.
Additional studies based on larger sample sizes at amicrospatial scale (e.g. in the Bay of Douarnenez) as well asreproductive compatibility trials between the two lineagesare now needed to evaluate the level of both hybridizationand environmental selection in the positioning of the clades.
Substantial geographic isolation of populations of both ecotypes since their recent range expansion
Analyses of allozyme and mtCOI polymorphisms providedinteresting information about the genetic structure andgeographic expansion within each clade. High percentageof singletons, low level of intraclade divergence amongand within populations (< 1%) and, as previously described,negative significant Tajima’s D values characterized eachclade. Under neutral hypotheses, these characteristicssuggest a recent increase in population sizes. The star-likedistribution of subtidal haplotypes with a few mutationsteps suggests that DNA sequences have diverged littleover the Quaternary ice ages, and that the observedmutations are mostly due to postglacial diversification(Hewitt 2000). Demographic explosion could be due tothe recent formation of the English Channel and to thecolonization of new territories. The catastrophic opening ofthe Dover Strait with a great volume of water spilled out ofthe North Sea (Smith 1989) could have promoted thespread of both A. brachiata lineages and their admixtureover the whole or part of the study area. Water originatingfrom melting ice did not enter directly into the ocean butwas accumulated over continental masses and releasedprecipitously into marine habitat (Pirazzoli 1998), drivingimportant sediment movements and the reorganization ofcommunities. However, the two lineages show differentcolonization patterns, with a more restricted expansion forthe clade I. Tajima’s D value is lower for clade S than forclade I (−2.46 and −1.96, respectively). Accordingly, clade Iappears to have a more limited range and may be restricted,in fact, to the western approach of the English Channel andpossibly the Irish Sea. Indeed, A. brachiata has never beenobserved in the intertidal area in the Eastern English Channel

3316 D . M U T H S E T A L .
© 2006 The AuthorsJournal compilation © 2006 Blackwell Publishing Ltd
and the North Sea (Ursin 1960). Furthermore, the intertidalpopulation from Bay Forest displayed a subtidal geneticsignature, which may suggest the replacement of clade I byclade S further south. In addition, because of its limitedrange, it might be possible that the actual distribution ofthe lineage also includes its initial location. The occurrenceof a large brackish lake (i.e. the Solent lake) prior to theopening of the English Channel could have played the roleof such a glacial refuge, as it has been proposed for otherintertidal species in the English Channel (Gysels et al. 2004;Provan et al. 2005). Conversely, the high proportions of‘private’ haplotypes in the subtidal populations from SouthBrittany are concordant with the patterns of asymmetricgene flow estimated using migrate-n towards the EnglishChannel (Table 6): both indicate the occurrence of a massivecolonization event of both the Irish Sea and the EnglishChannel from the south, suggesting that clade S may comefrom a more southern glacial refuge. This scenario fits theone revealed by the work of Jolly et al. (2006) where P. koreniclade 2 and O. fusiformis clade 1 may have persisted in asouthern glacial refuge during the last glacial maximum.
Most pairwise enzyme θ values between populationswithin clade S or within clade I were significantly differentfrom zero, with a high overall level of genetic differentia-tion. Even in light of some level of hybridization, geneticstructure of both clades strongly supports the fact thatA. brachiata populations are geographically isolated fromeach other. Despite the lack of isolation-by-distance pat-tern in clade I, there is a trend towards isolation by distancein clade S. Moreover, hierarchical analyses of differenti-ation clearly indicate that populations from the Irish Sea, theAtlantic Ocean and the English Channel are significantlyisolated from each other (ΦCT = 0.15, P < 0.05). The highproportions of ‘private’ haplotypes in all populations ofboth clades are congruent with a high degree of isolationbetween populations. Isolation may be promoted by weakdispersal capacities. Indeed, larval observations in aquariaindicate the occurrence of a very short pelagic develop-mental stage in A. brachiata, at least for clade I. Moreover,A. brachiata larvae are absent from plankton and previousstudies document low fecundities and large yolky eggs inthe species adults for both habitats (Webb & Tyler 1985;Bourgoin 1987; Gentil & Zakardjian 1990). All these obser-vations highlight the very restricted dispersal abilities ofthis brittle star, for both clade. The influence of the larvalplanktonic phase on population structuring is increasinglydocumented (e.g. Siegel et al. 2003). Many studies haveemphasized the relationship between larval pelagic phase,effective dispersal and population structure (McMillanet al. 1992; Hoskin 1997; Arndt & Smith 1998; Goldson et al.2001), even if some short-developing species present con-siderable levels of gene flow that contradicts such a dogma(Colson & Hughes 2004). As a short pelagic larval phase iscommonly known in gregarious species to represent an
advantage for not dispersing away from favourablehabitats (Pechenik 1999), it could minimize the risk thatnumerous A. brachiata populations become rapidly extinctas sandy-bottom habitat are highly fragmented andscattered along the European coastlines.
In A. brachiata, past glacial history, ecological selectionand dispersal capacities have together produced a verycontrasted and complex population structure. This studyposes intriguing questions about the origin of speciationfor the shallow-water endobenthic fauna in Europe duringthe last glacial episodes. As stated by Bermingham & Moritz(1998), comparative approaches using species sharing thesame kind of habitat but presenting contrasted life historytraits should be a valuable tool to better understand therelative importance of vicariance and local selection inshaping populations.
Acknowledgements
We are very grateful to people who helped us in the collection ofsamples, mainly the crew of the N/O Mysis, and to B. Sylvand andJ. Grall for precious information on the location of intertidal popu-lations. Special thanks to M. T. Jolly for his technical help in theearly stages of this work and, together with M. C. LeGoff-Vitryand C. Engel, for the improvement of the English of this manu-script. A tremendous thank you to anonymous reviewer #2, F.Viard and T. Comtet for their constructive remarks on the firstversion of the manuscript. Thanks to people of the GénopoleOuest/Genomer sequencing platform. This work was mainlyfinanced by PNEC-AT (Programme National d’EnvironnementCôtier) and the NoE ‘Marine genomics’ WP11 and supported by aPhD grant from the French Ministry of Research.
ReferencesArndt A, Smith MJ (1998) Genetic diversity and population structure
in two species of sea cucumber: differing patterns according tomode of development. Molecular Ecology, 7, 1053–1064.
Bandelt HJ, Forster P, Röhl A (1999) Median-joining networks forinferring intraspecific phylogenies. Molecular Biological Evolution,16, 37–48.
Baric S, Sturmbauer C (1999) Ecological parallelism and crypticspecies in the genus Ophiothrix derived from mitochondrial DNAsequences. Molecular Phylogenetics and Evolution, 11, 157–162.
Barton NH, Hewitt GM (1989) Adaptation, speciation and hybridzones. Nature, 341, 497–503.
Beerli P, Felsenstein J (2001) Maximum likelihood estimation of amigration matrix and effective population sizes in subpopu-lations using a coalescent approach. Proceedings of the NationalAcademy of Sciences, USA, 98, 4563–4568.
Bermingham E, Lessios HA (1993) Rate variation of protein andmitochondrial DNA evolution as revealed by sea urchinsseparated by the Isthmus of Panama. Proceedings of the NationalAcademy of Sciences, USA, 90, 2734–2738.
Bermingham E, Moritz C (1998) Comparative phylogeography:concepts and applications. Molecular Ecology, 7, 367–369.
Bierne N, Bonhomme F, David P (2003) Habitat preference and themarine-speciation paradox. Proceedings of the Royal Society ofLondon. Series B, Biological Sciences, 270, 1399–1406.

E C O T Y P I C L I N E A G E S I N A C R O C N I D A B R A C H I A T A 3317
© 2006 The AuthorsJournal compilation © 2006 Blackwell Publishing Ltd
Bourgoin A (1987) Ecologie et démographie d’Acrocnida brachiata(Montagu) (Echinodermata: Ophiuroidea) en baie de Douarnenez(Bretagne) Thesis, University of Occidental Brittany, Brest (France).
Bourgoin A, Guillou M, Glémarec M (1991) Environmentalinstability and demographic variability in Acrocnida brachiata(Echinodermata: Ophiuropidea) in Douarnenez Bay (Britanny:France). Marine Ecology, 12, 89–104.
Brault N, Bourquin S, Guillocheau F et al. (2004) Mio–Plioceneto Pleistocene paleotopographic evolution of Britanny (France)from a sequence stratigraphic analysis: relative influence oftectonics and climate. Sedimentary Geology, 163, 175–210.
Cabioch L, Gentil F, Glaçon R, Retière C (1977) Le Macrobenthosdes fonds meubles de la Manche: distribution générale et écologie.In: Biology of Benthic Organisms (eds Keegan BF, O’Cedigh P,Boaden PJS), pp. 115–128. Pergamon Press, Oxford.
Chenuil A, Féral JP (2003) Sequences of mitochondrial DNAsuggest that Echinocardium cordatum is a complex of severalsympatric or hybridizing species: a pilot study. In: EchinodermsResearch 2001 (eds Féral JP, David P), pp. 15–21. Swets &Zeitlinger, Lisse, The Netherlands.
Colson I, Hughes RN (2004) Rapid recovery of genetic diversity ofdogwhelk (Nucella lapillus L.) populations after local extinctionand recolonization contradicts predictions from life-historycharacteristics. Molecular Ecology, 13, 2223–2233.
Cruz R, Carballo M, Conde-Padin P, Rolan-Alvarez E (2004)Testing alternative models for sexual isolation in natural popu-lations of Littorina saxatilis: indirect support for by-productecological speciation? Journal of Evolutionary Biology, 17, 288–293.
Dinter WP (2001) Biogeography of the OSPAR Maritime Area. FederalAgency for Nature Conservation, Bonn, Germany.
Edmands S, Deimler JK (2004) Local adaptation, intrinsic co-adaptation and the effects of environmental stress on inter-population hybrids in the copepod Tigriopus californicus. Journalof Experimental Marine Biology and Ecology, 303, 183–196.
Gardner JPA, Thompson RJ (2001) The effects of coastal andestuarine conditions on the physiology and survivorship of themussels Mytilus edulis, M. trossulus and their hybrids. Journal ofExperimental Marine Biology and Ecology, 265, 119–140.
Gavrilets S (2003) Models of speciation: what have we learned in40 years? Evolution, 57, 2197–2215.
Gentil F, Zakardjian B (1989) Premières données sur la dynamiquede population d’Acrocnida brachiata (Montagu) en Baie de Seineorientale. Vie marine HS, 10, 148.
Gentil F, Zakardjian B (1990) Reproductive cycle of the ophiuroidAcrocnida brachiata (Montagu) in the Bay of Seine (EnglishChannel). In: Echinoderms Research (eds De Ridder C, Dubois P,Lahaye MC, Jangoux M), pp. 83–89. Balkema, Rotterdam, TheNetherlands.
Gentil F, Irlinger JP, Elkaim B, Proniewski F (1986) Premièresdonnées sur la dynamique du peuplement macrobenthique dessables fins envasés à Abra alba de la baie de Seine orientale. Actesde Colloques IFREMER, 4, 409–420.
Goldson AJ, Hughes RN, Gliddon CJ (2001) Population geneticconsequences of larval dispersal mode and hydrography: a casestudy with bryozoans. Marine Biology, 138, 1037–1042.
Goudet J (1995) fstat (version 1.2): a computer program to calcu-late F-statistics. Journal of Heredity, 86, 485–486.
Gysels ES, Hellemans B, Pampoulie C, Volckaert FAM (2004)Phylogeography of the common goby, Pomatoschistus microps,with particular emphasis on the colonization of the Mediterra-nean and the North Sea. Molecular Ecology, 13, 403–417.
Hall TA (1999) bioedit: a user-friendly biological sequence
alignment editor and analysis program for Windows 95/98/NT.Nucleic Acids Symposium Series, 41, 95–98.
Haq BU, Hardenbol J, Vail PR (1987) Chronology of fluctuatingsea levels since the Triassic. Science, 235, 1156–1166.
Hewitt G (2000) The genetic legacy of the Quaternary ice ages.Nature, 405, 907–913.
Hoskin MG (1997) Effects of contrasting modes of larval develop-ment on the genetic structures of populations of three species ofprosobranch gastropods. Marine Biology, 127, 647–656.
Johannesson K (2001) Parallel speciation: a key to sympatric diver-gence. Trends in Ecology & Evolution, 16, 148–153.
Jolly MT, Viard F, Weinmayr G et al. (2003) Does the genetic struc-ture of Pectinaria koreni (Polychaeta: Pectinariidae) conform to asource-sink metapopulation model at the scale of the Baie deSeine? Helgoland Marine Research, 56, 238–246.
Jolly MT, Jollivet D, Gentil F, Thiébaut E, Viard F (2005) Sharpgenetic break between Atlantic and English Channel popula-tions of the polychaete Pectinaria koreni, along the north coast ofBritanny, France. Heredity, 94, 23–32.
Jolly MT, Viard F, Gentil F, Thiébaut E, Jollivet D (2006) Compar-ative phylogeography of two coastal polychaete tubeworms inthe North East Atlantic supports shared history and vicariantevents. Molecular Ecology, 15, 1841–1855.
Keegan BF, Konnecker G (1979) Aggregation in echinoderms onthe West coast of Ireland. An ecological perspective. Proceedingsof the Royal Irish Academy, 86B, 199.
Kimura M (1980) A simple method for estimating evolutionaryrates of base substitutions through comparative studies ofnucleotide sequences. Journal of Molecular Evolution, 16, 111–120.
Kirby RR, Bayne BL, Berry RJ (1994) Phenotypic variation along acline in allozyme and karyotype frequencies, and its relation-ship with habitat, in the dog-whelk Nucella lapillus L. BiologicalJournal of the Linnean Society, 53, 255–275.
Kirby RR, Berry RJ, Powers DA (1997) Variation in mitochondrialDNA in a cline of allele frequencies and shell phenotype in thedog-whelk Nucella lapillus (L.). Biological Journal of the LinneanSociety, 62, 299–312.
Knowlton N (1993) Sibling species in the sea. Annual Review ofEcological System, 24, 186–216.
Knowlton N (2000) Molecular genetic analyses of species bound-aries in the sea. Hydrobiologia, 420, 73–90.
Koehler R (1921) Echinodermes. Faune de France, 1, 1–210.Kruse I, Reise K (2003) Reproductive isolation between intertidal
and subtidal Scoloplos armiger (Polychaeta, Orbiniidae) indicatessibling species in the North Sea. Marine Biology, 143, 511–517.
Kruse I, Strasser M, Thiermann F (2004) The role of ecological diver-gence in speciation between intertidal and subtidal Scoloplos armiger(Polychaeta, Orbiniidae). Journal of Sea Research, 51, 53–62.
Kumar S, Tamura K, Jakobsen I, Nei M (2001) mega 2: Molecular Evo-lutionary Genetics Analysis software. Bioinformatics, 17, 1244–1245.
Lambeck K (1997) Sea-level change along the French Atlantic andChannel coasts since the time of the Last Glacial Maximum.Palaeogeology, Palaeoclimatology, Palaeoecology, 129, 1–22.
Langella O (2002) POPULATION 1.2.28. Logiciel de génétique des popula-tions. Laboratoire Populations, génétique et évolution, CNRSUPR 9034, Gif sur Yvette, http://www.cnrs-gif.fr/pge/.
Matsuoka N, Hatanaka T (1991) Molecular evidence for the exist-ence of four sibling species within the sea-urchin, Echinometramathaei in Japanese waters and their evolutionary relationships.Zoological Science, 8, 121–133.
Mayr E (1942) Systematics and the Origin of Species. Columbia Uni-versity Press, New York.

3318 D . M U T H S E T A L .
© 2006 The AuthorsJournal compilation © 2006 Blackwell Publishing Ltd
McCarthy C (1997) Chromas, Version 1.41. Griffith University,Brisbane, Queensland.
McDonald JH, Kreitman M (1991) Adaptive protein evolution atthe Adh locus in Drosophila. Nature, 351, 652–654.
McMillan WO, Raff RA, Palumbi SR (1992) Population geneticconsequences of developmental evolution in sea urchins (genusHeliocidaris). Evolution, 46, 1299–1312.
McMullin ER, Hourdez S, Schaeffer SW, Fisher CR (2003)Phylogenetics and biogeography of deep-sea vestimentiferantuberworms and their bacterial symbionts. Symbiosis, 34, 1–41.
Meulenkamp JE, Sissingh W (2003) Tertiary palaeogeography andtectonostratigraphic Evolution of the Northern and SouthernPeri-Tethys platforms and the intermediate domains of theAfrican–Eurasian convergent plate boundary zone. Palaeogeo-graphy, Palaeoclimatology, Palaeoecology, 196, 209–228.
Mortensen T (1921) Studies of the Development and Larval Forms ofEchinoderms. Gotlieb Ernst Clausen Gad Publishers, Copenhagen.
Nei M (1987) Molecular Evolutionnary Genetics. Columbia UniversityPress, New York.
Ogden R, Thorpe RS (2002) Molecular evidence for ecological spe-ciation in tropical habitats. Proceedings of the National Academy ofSciences, USA, 99, 13612–13615.
Orr MR, Smith TB (1998) Ecology and speciation. Trends in Ecology& Evolution, 13, 502–506.
Paetkau D, Slade R, Burden M, Estoup A (2004) Genetic assign-ment methods for the direct, real-time estimation of migrationrate: a simulation-based exploration of accuracy and power.Molecular Ecology, 13, 55–65.
Palumbi SR (1992) Marine speciation on a small planet. Trends inEcology & Evolution, 7, 114–118.
Pasteur N, Pasteur G, Bonhomme F, Catalan J, Britton-Davidan J(1987) Manuel Technique de Génétique par Électrophorèse des Protéines.Lavoisier, Paris.
Pechenik JA (1999) On the advantages and disadvantages of larvalstages in benthic marine invertebrate life cycles. Marine EcologyProgress Series, 177, 269–297.
Pirazzoli P (1998) Sur la vitesse des variations du niveau de la mer.Annales de Géographie, 600, 220–232.
Piry S, Alapetite A, Cornuet J-M et al. (2004) geneclass 2: a softwarefor genetic assignment and first-generation migrant detection.Journal of Heredity, 95, 536–539.
Provan J, Wattier RA, Maggs CA (2005) Phylogeographic analysisof the red seaweed Palmaria palmata reveals a Pleistocene marineglacial refugium in the English Channel. Molecular Ecology, 14,793–803.
Rand DM (1994) Thermal habit, metabolic rate and the evolutionof mitochondrial DNA. Trends in Ecology & Evolution, 9, 125–131.
Rannala B, Mountain JL (1997) Detecting immigration by usingmultilocus genotypes. Proceedings of the National Academy ofSciences, USA, 94, 9197–9201.
Raymond M, Rousset F (1995) genepop (version 1.2): populationgenetics software for exact tests and ecumenicism. Journal ofHeredity, 86, 248–249.
Reynolds J, Weir BS, Cockerham CC (1983) Estimation of thecoancestry coefficient: basis for a short-term genetic distance.Genetics, 105, 767–779.
Rousset F (1997) Genetic differentiation and estimation of geneflow from F-statistics under isolation by distance. Genetics, 145,1219–1228.
Rozas J, Sanchez-DeI, Barrio JC, Messeguer X, Rozas R (2003)dnasp, DNA polymorphism analyses by the coalescent andother methods. Bioinformatics, 19, 2496–2497.
Schluter D (2001) Ecology and the origin of species. Trends in Ecology& Evolution, 16, 372–380.
Schmidt PS, Rand DM (2001) Adaptive maintenance of geneticpolymorphism in an intertidal barnacle: habitat- and life-stage-specific survivorship of Mpi genotypes. Evolution, 55, 1336–1344.
Schneider S, Roessli D, Excoffier L (2001) ARLEQUIN (version 2.0): Asoftware for population genetics data analysis. Genetics and BiometryLaboratory, Department of Anthropology, University ofGeneva, Geneva, Switzerland.
Siegel D, Kinlan B, Gaylord B, Gaines S (2003) Lagrangian descrip-tions of marine larval dispersion. Marine Ecology Progress Series,260, 83–96.
Smith AJ (1989) The English Channel — by geological design orcatastrophic accident? Proceedings of the Geological Association,100, 325–337.
Tajima F (1989) Statistical method for testing the neutral mutationhypothesis by DNA polymorphism. Genetics, 123, 585–595.
Thompson JD, Higgins DG, Gibson TJ (1994) clustal w: improv-ing the sensitivity of progressive multiple sequence alignmentthrough sequence weighting, positions-specific gap penaltiesand weight matrix choice. Nucleic Acids Research, 22, 4673–4680.
Turelli M, Barton NH, Coyne JA (2001) Theory and speciation.Trends in Ecology & Evolution, 16, 330–343.
Ursin E (1960) A quantitative investigation of the Echinodermfauna of the central North Sea. Meddelser fra Danmarks Fiskeri-ogHavundersogelser, 2, 1–204.
Veliz D, Bourget E, Bernatchez L (2004) Regional variation in thespatial scale of selection at MPI* and GPI* in the acorn barnacleSemibalanus balanoides (Crustacea). Journal of Evolutionary Biology,17, 953–966.
Via S (2001) Sympatric speciation in animals: the ugly ducklinggrows up. Trends in Ecology & Evolution, 16, 381–390.
Wares JP, Gaines SD, Cunningham CW (2001) A comparativestudy of asymmetric migration events across a marine biogeo-graphic boundary. Evolution, 55, 295–306.
Waters JM, Roy MS (2004) Phylogeography of a high-dispersalNew Zealand sea-star: does upwelling block gene-flow? MolecularEcology, 13, 2797–2806.
Webb CM, Tyler PM (1985) Post-larval development of the com-mon north-west European brittle-star Ophiura ophiura, O. Albidaand A. Brachiata (Echinodermata: Ophiuroidea). Marine Biology,89, 281–292.
Weir BS, Cockerham CC (1984) Estimating F-statistics for theanalysis of population structure. Evolution, 38, 1358–1370.
Wiens JJ (2004) Speciation and ecology revisited: phylogenetic nicheconservatism and the origin of species. Evolution, 58, 193–197.
Wilson RA (1999) Species. New Interdisciplinary Essays. MIT Press,Cambridge, Massachusetts.
This work is part of D. Muths’s doctoral research on populationstructure of two brittle-star species, A. brachiata and O. fragilis. Herresearch involves the use of various genetic markers to studyprocesses acting at different scales, from evolutionary history tofine scale spatio-temporal genetic structure, as well as demographicsurvey of several populations. This work was co-directed by DrD. Jollivet and Pr D. Davoult, from the ‘EGPM’ and the ‘BenthicEcology’ teams respectively at the Station Biologique de Roscoff(www.sb-roscoff.fr). This teams carry out wide ranging andinterconnected projects on coastal marine algae and invertebratesas well as hydrothermal vent fauna.