Incidental Harassment Authorization Application for Waterfront ...
106
pile driving 1002860.WE21.07 B4458 Incidental Harassment Authorization Application for Waterfront Improvement Projects at Portsmouth Naval Shipyard Kittery, Maine January 1, 2018, through December 31, 2018 October 2017 Revised November 7, 2017 Submitted to: Office of Protected Resources, National Marine Fisheries Service, National Oceanographic and Atmospheric Administration Prepared by: Cianbro Corporation For: For: U.S. Department of the Navy Commanding Officer, Portsmouth Naval Shipyard Kittery, Maine
-
Upload
khangminh22 -
Category
Documents
-
view
0 -
download
0
Transcript of Incidental Harassment Authorization Application for Waterfront ...

pile driving 1002860.WE21.07 B4458
Incidental Harassment Authorization Application for Waterfront Improvement
Projects at Portsmouth Naval Shipyard
Kittery, Maine
January 1, 2018, through December 31, 2018
October 2017 Revised November 7, 2017
Submitted to:
Office of Protected Resources, National Marine Fisheries Service,
National Oceanographic and Atmospheric Administration
Prepared by: Cianbro Corporation
For:
For:
U.S. Department of the Navy Commanding Officer, Portsmouth Naval Shipyard
Kittery, Maine

Waterfront Improvement Projects at Portsmouth Naval Shipyard Request for an Incidental Harassment Authorization
ii October 2017
Table of Contents
Chapter Page
1 Description of the Activity ....................................................... 1-1 1.1 Introduction ........................................................................................................ 1-1 1.2 Proposed Action (Year 2) 2018 Activity ............................................................ 1-1 1.3 Construction Methods and Descriptions ............................................................ 1-5
1.3.1 Pile Installation and Extraction with a Vibratory Hammer ............... 1-5 1.3.2 Pile Installation with an Impact Hammer .......................................... 1-6 1.3.3 Drilling .............................................................................................. 1-6 1.3.4 Dredging ............................................................................................ 1-7
2 Dates, Duration, and Region of Activity ................................... 2-1 2.1 Dates of Construction ......................................................................................... 2-1 2.2 Duration of Activities Year 2 ............................................................................. 2-3
2.2.1 Pile-Driving, Extraction, and Drilling Activity Description Summary for Year 2 .......................................................................... 2-5
2.2.2 Dredging ............................................................................................ 2-7 2.3 Project Area Description .................................................................................... 2-9
2.3.1 Bathymetric Setting ........................................................................... 2-9 2.3.2 Tides, Circulation, Temperature, and Salinity ................................... 2-9 2.3.3 Substrates and Habitats ..................................................................... 2-9 2.3.4 Vessel Traffic and Ambient Underwater Soundscape ..................... 2-10 2.3.5 Existing Airborne Noise .................................................................. 2-10
3 Marine Mammal Species and Numbers ................................... 3-1 3.1 Species Descriptions and Abundances ............................................................... 3-2
3.1.1 Harbor Porpoise ................................................................................. 3-2 3.1.2 Gray Seal ........................................................................................... 3-3 3.1.3 Harbor Seal ........................................................................................ 3-4 3.1.4 Hooded Seal ...................................................................................... 3-4 3.1.5 Harp Seal ........................................................................................... 3-5 3.1.6 Species Considered but Not Included in Analysis ............................ 3-5
3.2 Spatial Distribution ............................................................................................ 3-6 3.3 Submergence ...................................................................................................... 3-6
4 Status and Distribution of Marine Mammal Species or Stock that Could Potentially Be Affected ........................................... 4-1 4.1 Harbor Porpoise, Gulf of Maine/Bay of Fundy Stock ........................................ 4-1
4.1.1 Population Status ............................................................................... 4-1 4.1.2 Distribution ........................................................................................ 4-1 4.1.3 Behavior and Ecology ....................................................................... 4-1 4.1.4 Acoustics ........................................................................................... 4-2

Waterfront Improvement Projects at Portsmouth Naval Shipyard Request for an Incidental Harassment Authorization
iii October 2017
4.2 Gray Seal, Western North Atlantic Stock........................................................... 4-2 4.2.1 Population Status ............................................................................... 4-2 4.2.2 Distribution ........................................................................................ 4-2 4.2.3 Behavior and Ecology ....................................................................... 4-2 4.2.4 Acoustics ........................................................................................... 4-2
4.3 Harbor Seal, Western North Atlantic Stock ....................................................... 4-3 4.3.1 Population Status ............................................................................... 4-3 4.3.2 Distribution ........................................................................................ 4-3 4.3.3 Behavior and Ecology ....................................................................... 4-3 4.3.4 Acoustics ........................................................................................... 4-3
4.4 Hooded Seal, Western North Atlantic Stock ...................................................... 4-4 4.4.1 Population Status ............................................................................... 4-4 4.4.2 Distribution ........................................................................................ 4-4 4.4.3 Behavior and Ecology ....................................................................... 4-4 4.4.4 Acoustics ........................................................................................... 4-4
4.5 Harp Seal, Western North Atlantic Stock........................................................... 4-4 4.5.1 Population Status ............................................................................... 4-4 4.5.2 Distribution ........................................................................................ 4-5 4.5.3 Behavior and Ecology ....................................................................... 4-5 4.5.4 Acoustics ........................................................................................... 4-5
5 Harassment Authorization Requested ..................................... 5-7 5.1 Take Authorization Request ............................................................................... 5-7 5.2 Method of Incidental Taking .............................................................................. 5-8
6 Number and Species Exposed .................................................. 6-1 6.1 Introduction ........................................................................................................ 6-1 6.2 Fundamentals of Sound ...................................................................................... 6-1 6.3 Effects of Pile-installation Activities ................................................................. 6-2
6.3.1 Description of Noise Sources ............................................................ 6-2 6.3.2 Sound Exposure Criteria and Thresholds .......................................... 6-3 6.3.3 Limitations of Existing Noise Criteria .............................................. 6-9 6.3.4 Ambient Noise ................................................................................. 6-10
6.4 Distance to Sound Thresholds .......................................................................... 6-11 6.4.1 Underwater Sound Propagation Formula ........................................ 6-11 6.4.2 Underwater Noise from Pile Driving and Drilling .......................... 6-12 6.4.3 Airborne Sound from Pile Driving and Drilling .............................. 6-23 6.4.4 Auditory Masking ............................................................................ 6-23
6.5 Basis for Estimating Take by Harassment........................................................ 6-25 6.5.1 Harbor Porpoise – High Frequency Cetacean ................................. 6-25 6.5.2 Gray Seal – Phocid Pinniped ......................................................... 6-254 6.5.3 Harbor Seal - Phocid Pinniped ........................................................ 6-25 6.5.4 Hooded Seal - Phocid Pinniped ....................................................... 6-26 6.5.5 Harp Seal - Phocid Pinniped ........................................................... 6-26
6.6 Description of Take Calculation ....................................................................... 6-27 6.6.1 Harbor Porpoise ............................................................................... 6-28 6.6.2 Gray Seal ......................................................................................... 6-28 6.6.3 Harbor Seal ...................................................................................... 6-29 6.6.4 Hooded Seal .................................................................................... 6-30 6.6.5 Harp Seal ......................................................................................... 6-31

Waterfront Improvement Projects at Portsmouth Naval Shipyard Request for an Incidental Harassment Authorization
iv October 2017
6.7 Summary .......................................................................................................... 6-31
7 Impacts on Marine Mammal Species or Stocks ...................... 7-33 7.1 Potential Effects of Pile Driving and Drilling on Marine Mammals ................ 7-33
7.1.1 Underwater Noise Effects ............................................................... 7-33 7.1.2 Airborne Noise Effects .................................................................... 7-34 7.1.3 Conclusions Regarding Impacts to Species or Stocks ..................... 7-35
8 Impact on Subsistence Use ...................................................... 8-1
9 Impacts on the Marine Mammal Habitat and the Likelihood of Restoration ......................................................................... 9-1 9.1 Pile-driving and Drilling Effects on Potential Prey (Fish) ................................. 9-1 9.2 Pile-driving and Drilling Effects on Potential Foraging Habitat ........................ 9-1 9.3 Summary of Impacts on Marine Mammal Habitat ............................................. 9-2
10 Anticipated Impacts of Loss or Modification of Habitat ......... 10-1
11 Means of Effecting the Least Practicable Adverse Impacts – Mitigation Measures ............................................................. 11-1 11.1 Mitigation for Pile-driving Activities ............................................................... 11-1
11.1.1 Proposed Measures .......................................................................... 11-1 11.2 Mitigation Effectiveness ................................................................................... 11-3
12 Minimization of Adverse Effects on Subsistence Use .............. 12-1
13 Monitoring and Reporting Measures ..................................... 13-1 13.1 Monitoring Plan ................................................................................................ 13-1 13.2 Acoustic Monitoring ........................................................................................ 13-1
13.2.1 Visual Marine Mammal Observations ............................................. 13-1 13.2.2 Methods of Monitoring ................................................................... 13-1 13.2.3 Data Collection ................................................................................ 13-2
13.3 Reporting .......................................................................................................... 13-3
14 Research ............................................................................... 13-1
15 List of Preparers .................................................................. 13-1
16 Literature Cited .................................................................... 13-1

Waterfront Improvement Projects at Portsmouth Naval Shipyard Request for an Incidental Harassment Authorization
v October 2017
List of Tables
Table 1-1 Construction Timeframes for the Proposed Waterfront Improvement Projects
Table 2-1 Year 1 (2017) Planned Construction Activity
Table 2-2 Year 2 (2018) Planned Construction Activity – Days, Hours
Table 2-3 Ambient Sound Levels Recorded at Berths 11, 12, and 13
Table 3-1 Marine Mammal Species Potentially Present in the Piscataqua River in the Vicinity of the Shipyard
Table 4-1 Functional Hearing Groups: 2016 Acoustic Guidance
Table 6-1 Definition of Acoustical Terms
Table 6-2 Representative Noise Levels of Anthropogenic Sources
Table 6-3 Level A or PTS Onset Acoustic Thresholds from 2016 Guidance
Table 6-4 Level B Disturbance Thresholds for Underwater Sounds (* Year 1 estimated data)
Table 6-5 Radii to PTS Isopleths from Vibratory Pile Installation and Drilling Operations
Table 6-6 Radii to PTA Isopleths from Impact Hammer Pile Driving
Table 6-7 Data Input Review for PTS Isopleth Calculation
Table 6-8 Source Levels for In-Water Impact Hammer 14-inch Steel H-type (Sister)
Piles
Table 6-9 Source Levels for In-Water Vibratory Hammer 25-inch Steel Sheet Piles, 20-inch
Steel Sheet Piles and 15-inch Timber Pile
Table 6-10 Average Source Levels for Auger Drilling Activities During Pile Installation
Table 6-11 Average Source Level for Vibratory Pile Extraction15-inch Timber Fender Piles
Table 6-12 Pile-driving Sound Exposure Distances (In-water) Level B Zone of Influence
Table 6-13 Total Underwater Exposure Estimates by Species for Take Request
Year 2 – modeled data
Table 6-13B Total Underwater Exposure Estimates by Species for Take Request Year 2 -observational data

Waterfront Improvement Projects at Portsmouth Naval Shipyard Request for an Incidental Harassment Authorization
vi October 2017
List of Figures
Figure Page 1-1 Location Map, Portsmouth Naval Shipyard ........................................................................... 1-2
1-2 Dry Docks, Berths, and the Portal Crane Rail System, Portsmouth Naval Shipyard ............. 1-4
2-1 Berth 11 (A, B, and C) Bulkhead, Portsmouth Naval Shipyard . ........................................... 2-8
6-1 Zone of Influence for Underwater Vibratory Hammer and Underwater Impact Hammer at Berth 11 (A, B, and C), Portsmouth Naval Shipyard ....................................................... 6-22
6-2 Seal Haul-out Site at Hicks Rocks........................................................................................ 6-24

Waterfront Improvement Projects at Portsmouth Naval Shipyard Request for an Incidental Harassment Authorization
vii October 2017
Acronyms and Abbreviations
µ micro
µPa micro Pascals
°F degrees Fahrenheit
CeTAP Cetaceans and Turtle Assessment Program
CIA controlled industrial area
CNO Chief of Naval Operations
CV coefficient of variation
dB decibel
EA environmental assessment
ESA Endangered Species Act
HVAC heating, ventilation, and air conditioning
Hz hertz
km kilometer
Leq equivalent sound level
MMPA Marine Mammal Protection Act
NAVSEA Naval Sea Systems Command
NOAA National Oceanic and Atmospheric Administration
Pa Pascal
ppt parts per thousand
PTS permanent threshold shift
rms root-mean-squared
SEL sound exposure level
SELcum cumulative sound exposure level
SPL sound pressure level
TL transmission loss

Waterfront Improvement Projects at Portsmouth Naval Shipyard Request for an Incidental Harassment Authorization
viii October 2017
TTS temporary threshold shift
U.S.C. U.S. Code
USCG U.S. Coast Guard
ZOI zone of influence
Waterfront Improvement Projects at Portsmouth Naval Shipyard Request for an Incidental Harassment Authorization
1-1 October 2017
1 Description of the Activity This application continues work on the Portsmouth Naval Shipyard Waterfront Improvement Project. The project includes structural repairs at Berth 11 A, B and C which is the focus of this application. Year 1 issued IHA and associated application information is incorporated by reference into this application.
1.1 Introduction This IHA application covers the second year of activities (January 1, 2018 through December 31, 2018) associated with the Waterfront Improvement projects at the Portsmouth Naval Shipyard (the Shipyard) in Kittery, York County, Maine. The first IHA was issued in November 2016. The action as a whole includes two waterfront improvement projects, structural repairs to Berths 11, 12, and 13, and replacement of the Dry Dock 3 caisson. The waterfront improvement projects commenced in October 2016 and will occur in phases through 2023 (see Table 1-1). Because of mission requirements and operational schedules at the dry docks and berths, the general construction schedules are subject to change. The Navy prepared an environmental assessment (EA) to analyze the potential environmental consequences of the projects. The Finding of No Significant Impact (FONSI) was signed on October 18, 2016. This IHA application is for Year 2 of construction and includes continued structural repairs at Berths 11A, 11B and 11C. There will be a maximum of 100 days of pile driving/drilling during this period. The following section provides a brief overview of activities and work proposed for Year 2. The 2016 IHA application has been incorporated by reference into this document (Navy 2016).
1.2 Proposed Action (Year 2) 2018 Activity The Shipyard is located in Kittery, Maine, on Seavey Island in the Piscataqua River, which flows between Maine and New Hampshire (see Figure 1-1). The Shipyard occupies the whole of Seavey Island, encompassing 278 acres on what were originally five separate islands (Seavey, Pumpkin, Dennett’s, Clarks, and Jamaica). Over the past 200 years, as a result of expansion from land-making activity, four of these islands (Seavey, Pumpkin, Dennett’s, and Jamaica) were consolidated into one large island, which kept the name Seavey Island. Clarks Island is now attached to Seavey Island by a causeway. The purpose of the projects is to modernize and maximize dry dock capabilities for performing current and future missions efficiently and with maximum flexibility. The need for the projects is to correct deficiencies associated with the pier structure at Berths 11, 12, and 13 and the Dry Dock 3 caisson and concrete seats and ensure that the Shipyard can continue to support its primary mission to service, maintain, and overhaul submarines. By supporting the Shipyard’s mission, the proposed action would assist in meeting the larger need for the Navy to provide capabilities for training and equipping combat-capable naval forces ready to deploy worldwide. In this regard, the proposed action furthers the Navy’s execution of its congressionally mandated roles and responsibilities under 10 United States Code [U.S.C.] Section 5062. The Shipyard’s physical environment and industrial operations have evolved over its long history to meet changing mission requirements. The Shipyard’s dry docks were constructed between 1900 and 1943 and remain the core of the Shipyard’s operations today. The Shipyard’s dry docks are located in the controlled industrial area (CIA), which is fenced and has controlled access at several gates to provide security for dry dock operations. This application will focus on work proposed for 2018 at Berth 11A, 11B and 11C. A description of the status of those areas is included in the following section.

Waterfront Improvement Projects at Portsmouth Naval Shipyard Request for an Incidental Harassment Authorization
1-2 October 2017
1-1 Location Map, Portsmouth Naval Shipyard

Portsmouth NavalShipyard
P i s c a t a q u aR i v e r
T o w n o fP o r t s m o u t h
T o w n o fK i t t e r y
T o w n o fN e w c a s t l e
B a c k C h a n n e l
P i s c a t a q u aR i v e r
Path: \\prtbhp1\GIS\Buffalo\Portsmouth_Railway\Maps\MXD\Reports\IHA_Application\Figure_1-1_Regional Map.mxd
Figure 1-1Location Map
Portsmouth Naval ShipyardYork County, Maine
Source: ESRI 2013; Department of Defense 2014.
Legend
Installation Area
W0 1,000 2,000 3,000 4,000 Feet
WaterfrontImprovementProjects Location

Waterfront Improvement Projects at Portsmouth Naval Shipyard Request for an Incidental Harassment Authorization
1-3 October 2017
Berths 11, 12, and 13 The pier infrastructure at Berths 11, 12, and 13 supports part of the west circuit of the Shipyard’s portal crane rail system (see Figure 1-2). Portal cranes, which are track-mounted cranes on a central shaft atop four steel legs, are used to preassemble pieces of submarines, move them to a dry dock, and lift or reposition them as needed. Portal cranes also are used to lift and move large equipment. Age-related structural weaknesses in this pier, called the “fitting-out” pier, directly impact operation of the west circuit of the portal crane rail system—and consequently impact maintenance schedules and the associated costs of maintenance services at Dry Docks 1 and 3. The sides of the pier are open at Berths 11, 12, and 13, and water action has corroded the steel piles over the decades, weakening the overall structure that supports the portal crane rail system. Accelerated corrosion of the piles at Berths 11, 12, and 13 has reduced and will continue to reduce the rated load-bearing capacity of these piles—or the maximum weight they can support with limited risk of failure, which, in turn, prevents the Shipyard’s portal cranes from operating at their full 60-ton load-bearing capacity. The Shipyard has been maintaining the piles at the fitting-out pier by installing pile jackets (i.e., fabric pouches that are installed around a pile over steel reinforcing bars and then filled with mortar). However, when pile jackets are installed, the rated load-bearing capacity of the piles must be reduced because of a combination of the reduced strength of the piles and the added weight of the pile jackets. Erosion of soil from the open sides of the pier and age-related failure of the pier deck additionally affect the structural integrity of these berths.

Waterfront Improvement Projects at Portsmouth Naval Shipyard Request for an Incidental Harassment Authorization
1-4 October 2017
1-2 Dry Docks, Berths, and the Portal Crane Rail System, Portsmouth Naval Shipyard

CONSTITUTIONSQUARE
SARATOGASQUARE
MACDONOUGH AVE.
ISSAC HULL ST.
SICARD ST.
WYMAN AVE.
P i s c a t a q u aR i v e r
CRANE ST.
CHARLES MORRIS AVE.DD #3
DD #1
Flat-Iron Pier
DD #2
Crane Rail West Circuit
Cran
e Rail
East C
ircuit
Walker ST.
Gate 1
Fitting-OutPier
P o r t s m o u t h N a v a lS h i p y a r d
6B
6C
14
12
13B
11C1
13A
2A 2B
11B
6A
11A
Path: \\prtbhp1\GIS\Buffalo\Portsmouth_Railway\Maps\MXD\Reports\IHA_Application\Figure_1-2_DryDocks_PortalCraneRailSystem.mxd 1/21/2016
Figure 1-2Dry Docks, Berths, and thePortal Crane Rail System
Portsmouth Naval ShipyardYork County, Maine
Source: ESRI 2013; Department of Defense 2014.
Legend
Dry Dock
Berth
Installation Area
Portal Crane Rail
W0 250 500 750 Feet
MENH
WaterfrontImprovement
Projects Location

Waterfront Improvement Projects at Portsmouth Naval Shipyard Request for an Incidental Harassment Authorization
1-5 October 2017
This application focuses on the in-water construction activities that will occur during the second year of construction including completion of the King Pile and concrete shutter panel (pre-cast concrete panels that would be stacked on top of one another to form a wall) bulkhead at Berth 11. King Piles would be regularly spaced along the berths and grouted into rock sockets drilled into the bedrock (i.e. “rock-socketed”). The general construction timeframes for Year 2 work on Berth 11 is included in Table 1-1 (inclusive of start dates in 2017). It is important to note that these construction schedules are subject to change, depending on mission requirements and operational schedules at the affected dry docks and berths. Table 1-1 Construction Timeframes for the Proposed Waterfront Improvement Projects
Project Estimated Construction
Start Estimated
Construction End Berths 11, 12, and 13 Structural Repairs January 2017 October 2022 Phase 1 January 2017 June 2019 In-Water Work - Phase 1 (Berth 11) April 2017 December 2018 Dry Dock 3 Caisson Replacement (in progress)
February 2017 August 2018
In Water Work Phase 2 (Berths 12 and 13) To be determined based on availablity of Berths
To be determined based on availablity of berths
** Note: Due to mission requirements and operational schedules at the affected dry docks and berths, the general construction
schedules above are subject to change. This application covers Berth 11 2018 proposed work
1.3 Construction Methods and Descriptions This section describes the typical methods of pile installation and extraction and dredging that would be used to accomplish the work included as part of the project for Year 2.
1.3.1 Pile Installation and Extraction with a Vibratory Hammer Vibratory hammers are routinely used to install and extract smaller piles when permitted by the sediment type. Vibratory hammers typically produce lower source levels of noise than impact hammers, and they can be considered as an alternative to impact hammers in order to reduce underwater sound produced during construction activities (ICF Jones and Strokes and Illingworth and Rodkin, Inc. 2012). However, they are considered a non-impulsive noise source as the hammer continuously drives the pile into the substrate; therefore, the total sound energy imparted can be comparable to impact driving. A vibratory hammer operates by using counterweights that spin to create a vibration. The vibration of the hammer causes the pile to vibrate at a high speed. The vibrating pile then causes the soil underneath it to “liquefy” and allow the pile to move easily into or out of the sediment. The model of vibratory hammer likely to be used for the project is the APE vibratory hammer. Piles installed with a vibratory hammer would include:
• 15-inch timber piles used to reconstruct timber dolphins at the corners of Berth 11
• 25-inch steel sheet piles used for the bulkhead at Berth 11
• 14-inch H-Pile for Support of Excavation (SOE) system (road plate system) initial installation.
• 25-inch sheet pile used for SOE in areas where the road plate system is not appropriate.
• Rock Socket drilling activity for King Pile installation is considered similar to vibratory hammer use for purposes of this application and for consideration of take estimates later in this document. This is consistent with the Year 1 issued IHA.

Waterfront Improvement Projects at Portsmouth Naval Shipyard Request for an Incidental Harassment Authorization
1-6 October 2017
Extracted piles would include:
• 15-inch timber fender piles at Berth 11
• 15-inch timber piles making up the existing dolphins at the corner of Berth 11.
• 25-inch sheet pile and 14-inch H-pile road plate system for SOE. The temporary SOE system with the H-pile is required due to site sediment conditions becoming potentially unstable. The Navy’s contractor requested the use of alternative measures to provide a stable work area and protect worker safety. The SOE would be required to protect workers from underwater engulfment due to unstable sediments disturbed during drilling and dredging activity. The SOE will maintain an excavation face of up to ten feet to protect divers who must be in the area during installation of the shutter panel system. This system is discussed in more detail in Section 2.
1.3.2 Pile Installation with an Impact Hammer Impact hammers are the most common pile-driving method used to install piles of various sizes (ICF Jones and Strokes and Illingworth and Rodkin, Inc. 2012). Impact hammers typically produce greater source levels of noise than vibratory hammers and are an impulsive noise source. Impact pile drivers are piston-type drivers that use various means to lift a piston (ignition, hydraulics, or steam) to a desired height and drop the piston (via gravity) against the head of the pile in order to drive it into the substrate. The size and type of impact driver used depend on the energy needed to drive a certain type of pile in various substrates to the necessary depth. The magnitude and characteristics of underwater noise generated by a pile strike depend on the energy of the strike and the pile size and composition. The model of impact hammer likely to be used for the project is the ICE 80S impact hammer. Piles that would be installed through impact driving include 14-inch steel H-type piles used as sister piles at Berth 11. These piles must be fully installed with an impact hammer because the piles will not reach bearing depth or have the required load-bearing capacity if installed using vibratory methods only. The vibratory hammer will be used to set the pile with the impact hammer used to seat the pile for depth and assure load-bearing capacity. Estimated use of the impact hammer would be approximately 4 minutes per pile.
1.3.3 Drilling Drilling (rock socket and king pile installation) is considered an intermittent, non-impulsive noise source, similar to vibratory pile driving. Very little information is available regarding source levels for in-water drilling activities associated with nearshore pile installation. Dazey et al. (2012) attempted to characterize the source levels of several marine pile-drilling activities. One such activity was auger drilling (including installation and removal of the associated steel casing). Due to a lack of information regarding pile-drilling source levels, it is generally assumed that drilling would produce less in-water noise than both impact and vibratory pile driving. Due to unknown substrate conditions, drilling tools will be determined based on field conditions encountered. Three drill models are likely to be used in different applications during in-water construction at Berth 11:
• Drill attachment to the drill crane (Manitowoc 4100 Series II) Williams CLLDH for advancement of casing
• The DTH 51” full face roller bit for removal of rock/sediments
• DTH 48” DTH Cluster drill removal of rock
• Traditional sediment augur for sediment removal, bits/teeth for coarse material

Waterfront Improvement Projects at Portsmouth Naval Shipyard Request for an Incidental Harassment Authorization
1-7 October 2017
1.3.4 Dredging At the start of in-water construction, a level trench would be dredged along the footprint of the bulkhead. The dredged trench and the bottoms of the panels would be slightly lower than the Shipyard’s permitted dredge depth at these berths to prevent the bottom of the bulkhead from being undermined during future maintenance dredging. At locations where a bedrock layer occurs above the permitted dredge depth, the panels would be installed slightly above the bedrock (MN-FST 2015). The model of the dredge that would be used would be determined by the construction contractor. Dredge spoils would be disposed of at an upland licensed landfill facility.

Waterfront Improvement Projects at Portsmouth Naval Shipyard Request for an Incidental Harassment Authorization
2-1 October 2017
2 Dates, Duration, and Region of Activity The date(s) and duration of such activity and the specific geographical region where it would occur.
2.1 Dates of Construction This authorization request covers in-water construction associated with the Year 2 activity as described above to occur from January 1, 2018 – December 31, 2018. No seasonal limitations would be imposed on the construction timeline in 2018. Although in-water activities at Berths 11A and B commenced in 2017, the extent of work completed is yet to be determined. Based on construction and Shipyard schedules, the Navy anticipates that structural repairs at Berth 11 A, B and C will continue into 2018 as described in this IHA application. Therefore, this IHA application covers the in-water activities estimated to occur in 2018 at Berths 11 A, B and C. For reference the planned schedule of activity for 2017, Year 1, is included below (see Table 2-1). The schedule and activity estimates for Year 2 (see Table 2-2) are based on completion of the activity noted below for Year 1. *Schedule and quantities are subject to change Table 2-1: Year 1 (2017) Planned Construction Activity
Activity/Method Timing No. of Days Pile
Type No. of Piles Installed
No. of Piles Extracted
Production
Extract Timber Piles/Vibro
Feb 2017 to April 2017
4 15” Timber Piles
8 Estimated 2 piles per day. 8 piles along Berth 11A, Bents Q thru M.
Install/Remove Rock Socket Template Piles/Vibro
April 2017 to October 2017
8 14” H- Pile Steel
15 15 Estimated 3 piles per day to install and 6 piles per day to remove. There are 12 piles in Berth A and 3 Piles in Berth B.
Install Casing & Drill Sockets/Auger Drilling
April 2017 to October 2017
88 36” W- Section Steel
56 Estimated .636 piles per day. This includes setting the casing and drilling the sockets. There are 29 sockets in Berth B and 27 in Berth A

Waterfront Improvement Projects at Portsmouth Naval Shipyard Request for an Incidental Harassment Authorization
2-2 October 2017
Activity/Method Timing No. of Days Pile Type
No. of Piles
Installed
No. of Piles Extracted
Production
Install Sheet Pile(SKZ20) SOE Piles/Vibro
May 2017 to November 2017
11 24” Steel Sheet Piles
113 Estimated 11 sheets per shift. There are 37 sheets in Berth b and 76 in Berth A.
Remove Sheet Pile(SKZ20) SOE Piles/Vibro
May 2017 to November 2017
6 24” Steel Sheet Piles
113 Estimated 22 sheets per shift. There are 37 sheets in Berth b and 76 in Berth A.
Install Road Plate/H-Pile SOE-Vibro
May 2017 to November 2017
9 14” H- Pile
34 Estimated 4 road plates per shift. See Note 1 Below
Remove Road Plate/H-Pile SOE-Vibro
May 2017 to November 2017
5 14” H- Pile
34 Estimated 8 road plates per shift.
Install Support/Sister Piles – Vibro & Impact Hammer
August 2017
11 14” H- Pile
28 Estimated 2.6 piles per shift. The vibro would be used to stick the piles and the impact would drive the pile to refusal. See Note 2 below.
TOTALS 142 246 170
**Note: Depending on the soil conditions there is a possibility that the Road Plate/H-Pile SOE could at least partially installed by forcing the sheet down with an excavator vs using the vibratory hammer which could further reduce the number of vibratory hammer days.

Waterfront Improvement Projects at Portsmouth Naval Shipyard Request for an Incidental Harassment Authorization
2-3 October 2017
2.2 Duration of Activities Year 2 Table 2-2 summarizes the in-water construction activities for 2018, pile extraction, driving, and drilling, scheduled to take place during the timeframe covered by this IHA application. Note that pile- driving days are not necessarily consecutive. Also note that certain activities may occur at the same time, decreasing the total number of pile-driving days. The contractor could be working in more than one area of the berth at one time. Current schedule includes installation of King Pile simultaneously with other construction activity including use of the impact or vibratory hammer. This will be documented in the field during acoustic monitoring. Initial noise characterization of each activity will be completed individually. It is not possible to predict how often work will occur simultaneously. This is simply a reference which may occur as construction schedule allows. A summary report will be issued in 2017 with verified data of activity and days of duration of overlap. Additional discussion follows below.

Waterfront Improvement Projects at Portsmouth Naval Shipyard Request for an Incidental Harassment Authorization
2-4 October 2017
Table 2-2: Year 2 (2018) Planned Construction Activity and Hours by Activity
Activity/Method Number of
Days Pile Type No. Piles
Installed No.Piles Extracted
Overlap Days/Activity
Production Estimates
Extract Timber Piles/Vibratory
3 15" Timber Piles
18 Estimated 6 piles per day. These pile
Install Casing & Drill Sockets/Auger Drilling
56 36" W-Section Steel
35 Estimated .636 piles per day. This includes setting the casing and rock socket drilling activity. 2018 may include 16 pile from 2017 with potential of 66 days.
Install Sheet Pile(SKZ-20) Support of
12
24" Sheet Piles Steel
144
9/during rock sockets
Estimated 12 sheets per shift.
Remove Sheet Pile(SKZ-20) Support of
6
24" Sheet Piles Steel
144
4/during rock sockets
Estimated 24 sheets per shift.
Install Road Plate/H-Pile
3 12 2/during rock sockets
Estimated 4 ea. road plates per shift. Remove Road
Plate/H-Pile Support of Excav.
2
12
1/during rock sockets
Estimated 8 ea. road plates per shift.
Install Sheet Pile(AZ50) Sheetwall
6
24" Sheet Piles Steel
74
Estimated 13 sheets per shift.
Install H-Pile (AZ50) Bulkhead Return
2
14" H-Pile Steel
4
Estimated 2 piles per shift.
Install Sheet Pile (AZ50) Bulkhead Return
1
24" Sheet Piles Steel
2
Estimated 2 piles per shift.
Install Support/Sister Pile/ Vibro & Impact Hammer
9
14" H-Pile Steel
22
Estimated 2.6 piles per shift. The vibro would be used to stick the pile and the impact would drive the pile to refusal. See Note 2 below.
Totals
100 if you deduct the 16 days of overlap/concurrent work the new total is 84
293
174
16

Waterfront Improvement Projects at Portsmouth Naval Shipyard Request for an Incidental Harassment Authorization
2-5 October 2017
Hours Estimated for Each Pile Driving Activity
Impact 14” H-Pile (Sister Pile) 22 pile 9 days 72 hours Estimate of 16 minutes per day driving/ 1 hour set up/take down
Vibratory 24” & 36” sheet pile, 15” timber pile and 14” H-pile for SOE & Bulkhead Return
236 pile/sheet
27 install 8 remove
216 install 64 remove
Estimate of 4 hours per day due to set up/take down time
Drilling 36” Installation/Rock Sockets
35 casings 56 448
Drilling could be full 8 hours/day
Note 1 and
Concurrent Work Estimates
Concurrent work could include installation of the King Pile rock sockets by the drilling contractor while the vibratory hammer for installation of sheet and H-pile is ongoing at another location along the Berth. The overlap days/activity column indicates the possible overlap areas based on schedule and work areas. Concurrent activity will result in a wider ZOI calculation for observation of marine mammals, however the potential for concurrent activity was not figured into the take estimate for this application.
Note 2
Depending on when these pile are driven in the tide cycle there is potential to install all 22 of the support piles in the dry which would further reduce the number of vibratory and impact hammer days. This pile quantity includes all the Support Pile in Berth 11C as well as 8 Support Pile remaining from Berth 11A.
2.2.1 Pile-Driving, Extraction, and Drilling Activity Description Summary for Year 2 Pile driving activity to be completed in 2018 varies for different project elements and is subject to change based on site conditions at the time and work completion for 2017. The following description of construction methods applies to work planned for 2018 and includes a description of the SOE system utilized in 2017. The trestle system originally proposed for use in 2017 was removed from this application. In water work anticipated for Year 2 work is planned as follows and is summarized in Table 2-2 above. Work will continue from 2017 schedule with installation of the king pile template and SOE system along Berth 11C and any remaining sections of Berth 11B and 11A. The end sheet wall sections (returns) will also be completed. It is anticipated that a significant amount of the temporary pile extraction work will be completed from behind the new shutter panel wall, during low water situations which is anticipated to reduce the noise generated from use of the vibratory hammer during extraction; however, work to be conducted from behind the new shutter panel wall has not been included in the calculations for this application as it was not feasible to determine exact amounts of activity which would be accomplished from behind the new shutter panel wall during low water conditions. Overlap days were also not included in the calculations as schedule changes may impact the ability to perform work concurrently and reduce the overall duration of the sound producing activity. It is the intent of the contractor to reduce impacts to the greatest extent practicable throughout the duration of the project. As the work progresses the contractor will minimize impacts from sound pressure by conducting as much of the extraction work as possible from

Waterfront Improvement Projects at Portsmouth Naval Shipyard Request for an Incidental Harassment Authorization
2-6 October 2017
behind the new shutter panel wall and working drilling activities concurrently to reduce the overall duration of the exposure. Furthermore, the contractor will also attempt to install sister piles behind the shutter panel wall or at low tide to the greatest extent practical. The Year 1 monitoring report will indicate the amount of work completed in 2017 and the estimate of remaining work to be completed from behind the shutter panel wall and review of concurrent activities.
Berth 11 (A, B, and C) At the beginning of the in-water work, existing timber piles would be removed from the berth faces at the work location and the timber dolphin at the western end of the berth. The contractor will work from a jack-up barge alongside the berths to provide additional construction workspace to complete the project. Year 2 proposed work: Berth 11A completion, 11C: The Navy plans to continue the project in 2018 with the installation of a king pile and concrete shutter panel bulkhead at Berth 11C. The bulkhead would extend from the western end of Berth 11B to the southern end of Berth 12. The in-water construction process would be the same as the process described below and utilized in 2017. The contractor will install templates for the king pile and work in increments along the berth from a jack-up barge. The contractor will set the template (including temporary piles and horizontal members), which may take approximately 1 day. The contractor would then drill the rock sockets, which is estimated to take about one day per socket. King piles would be regularly spaced along the berths and grouted into sockets drilled into the bedrock (i.e. “rock-socketed”). Please refer to included set of issued for construction drawings for more information. The SOE system will then be installed within the current work area for the king pile (between king piles). The SOE system consists of an H-pile secured to a road plate. The H-pile will be placed utilizing the vibratory hammer to a depth sufficient to contain material, which could be dislodged during dredging activity, containing the activity to the permitted work area. The SOE system will not be utilized the full length of the berth. Soil borings and field conditions will determine need. The alternate SOE is use of 24-inch sheet pile. Table 2-2 noting the contractors planned activity and estimated days is included in this application. The days and pile number for SOE installation are conservatively estimated from soil boring data obtained in 2017. The concrete shutter panels would be installed in stacks between the king piles along most of the length of Berth 11C and remaining portions of 11A and 11B. Installation of the concrete piles is not included in the noise analysis because no pile driving would be required. Along an approximately 16-foot section at the eastern end of Berth 11A and an additional 101 feet between Berths 11A and 11B, the depth to bedrock is greater, thus allowing a conventional sheet-pile bulkhead to be constructed. The steel sheet-piles would be driven to bedrock using a vibratory hammer. This work, although discussed in the Year 1 application is currently planned for Year 2. Sheet piles installed with a vibratory hammer also would be used to construct “returns,” which would be shorter bulkheads connecting the new bulkheads to the existing bulkhead under the pier. Installation of the sheeting with a vibratory hammer is estimated to take less than one hour per pair of sheets. The contractor would probably install two sheets at a time, and so the time required to install the sheeting (10 pairs = 20 sheets) using vibratory hammers would only be about 8 hours per 10 pairs of sheets. The activity tables above (Tables 2-1 and 2-2) reflect those estimated installation durations. Time requirements for all other pile types were estimated based on information compiled from ICF Jones and Strokes and Illingworth and Rodkin, Inc. (2012) (reference Year 1 application).

Waterfront Improvement Projects at Portsmouth Naval Shipyard Request for an Incidental Harassment Authorization
2-7 October 2017
Additional in-water work would be required to install steel H-type sister piles at the location of the inboard portal crane rail beam at Berth 11, including Berth 11C. The sister piles would provide additional support for the portal crane rail system and restore its load-bearing capacity. The sister piles would be driven into the bedrock below the pier, in water generally less than 10 feet deep, using an impact hammer. The timing of this work depends on operational schedules at the berths. The sister piles may be installed either before or after the bulkheads are constructed. Twenty-two (22) sister piles are (11C, 11A) planned for 2018. It is anticipated that this work will also be conducted behind the new shutter panel wall, providing for additional sound attenuation or completion of the work during low tide or “out of water” conditions.
2.2.2 Dredging Dredging would be completed in a continuous sequenced operation along the entire berth as king-pile sockets are drilled in order to create the trench needed to seat the new shutter panel wall bulkhead. The project schedule will include dredging operations. Dredging will be observed by a monitor to assure compliance with ESA and MMPA requirements.

Waterfront Improvement Projects at Portsmouth Naval Shipyard Request for an Incidental Harassment Authorization
2-8 October 2017
2-1 Berth 11 (A, B, and C) Bulkhead, Portsmouth Naval Shipyard – see appendix for final drawings issued for construction.

DD #3
DD #1
Flat-Iron Pier
Crane Rail West Circuit
1195' ±
100' ±
Fitting-OutPier
Portsmouth NavalShipyard
EXISTING BULKHEAD
13A
11B
14
11C
1
11A
13B
12
2A 2B
Path: \\prtbhp1\GIS\Buffalo\Portsmouth_Railway\Maps\MXD\Reports\IHA_Application\Figure_2-1_BulkheadOption1_Phase_1.mxd 1/21/2016
Figure 2-1Berths 11 (A, B, and C) Bulkhead
Portsmouth Naval ShipyardYork County, Maine
Source: ESRI 2013; Department of Defense 2014.
LegendProposed Bulkhead Phase 1
Dry Dock
Berth
Existing Structures
Installation Area
Portal Crane Rail
W0 100 200 300 400 Feet
MENH
ProjectLocation

02:1002860.WE21.01 - PNSY Crane Rail System EA
Figure 2-2Berth 11 Bulkhead Conceptual Design
Portsmouth Naval ShipyardYork County, Maine

Waterfront Improvement Projects at Portsmouth Naval Shipyard Request for an Incidental Harassment Authorization
2-9 October 2017
2.3 Project Area Description The Shipyard is located in the Piscataqua River in Kittery, Maine. The Piscataqua River originates at the boundary of Dover, New Hampshire, and Elliot, Maine. The river flows in a southeasterly direction for 13 miles before entering Portsmouth Harbor and then emptying into the Atlantic Ocean. The lower Piscataqua River is part of the Great Bay Estuary system and varies in width and depth. Many large and small islands break up the straight-line flow of the river as it continues toward the Atlantic Ocean. Seavey Island, the location of the Proposed Action, is located in the lower Piscataqua River approximately 547 yards from its southwest bank, 219 yards from its north bank, and approximately 2.5 miles from the mouth of the river.
2.3.1 Bathymetric Setting Water depths in the Project area range from 21 feet to 39 feet at Berths 11, 12, and 13. Water depths in the lower Piscataqua River near the Project area range from 15 feet in the shallowest areas to 69 feet in the deepest areas. The river is approximately 3,300 feet wide near the Project area, measured from the Kittery shoreline north of Wattlebury Island to the Portsmouth shoreline west of Peirce Island. The furthest direct line of sight from the Project area would be 0.8 mile to the southeast and 0.26 mile to the northwest.
2.3.2 Tides, Circulation, Temperature, and Salinity The tides in the Piscataqua River are semi-diurnal, with two high tides and two low tides per day. The tidal range between low and high tides in the Piscataqua River near Portsmouth Harbor is about 7 feet to 8 feet (NOAA n.d.). The tidal flow in the lower portion of the river is rather strong, with currents ranging from 5 to 10 knots (5.8 to 11. 5 miles per hour [mph]) (Garman and Harris 1995). Tidal waters from the Atlantic Ocean enter the Great Bay Estuary through the Portsmouth River mouth at high tide (Jones 2000), flooding the three major portions of the estuary, the Piscataqua River, Little Bay, and Great Bay. Recent efforts have begun to model the hydrodynamics and current flow patterns in the Great Bay estuary as part of an effort to develop modeling capabilities for simulating hydrodynamic flows in estuaries with intertidal areas, but the Great Bay model has not yet been field-verified (Jones 2000). Water temperature varies with season, ranging between 33 degrees Fahrenheit (°F) and 42°F in the winter/spring months, and between 48°F and 66°F in the summer/fall months (NERACOOS n.d.). The salinity in the vicinity of the Project area is considered that of sea water, 25 parts per thousand (ppt) and greater (NOAA November 1985).
2.3.3 Substrates and Habitats Benthic sediments and substrates in the Project Area were characterized during a benthic survey completed in May 2014 (CR Environmental, Inc. 2014). Surficial sediments were characterized using video transects and grab samples captured at five locations along Berths 11, 12, and 13. Sediment characteristics varied between the five locations. At the sample locations at both the north and south sides of the fitting-out pier (Berths 11 and 13), where the current was generally low energy, sediment consisted of soft mud, sand, pebbles, and old mussel shells. At the end of the pier (Berth 12), in an area of higher current flow, the substrate consisted of hard sand, pebbles/cobbles, and small boulders (CR Environmental, Inc. 2014). Much of the shoreline in the Project area has been characterized as hard shores (rocky intertidal). In general, rocky intertidal areas consist of bedrock that alternates between marine and terrestrial habitats, depending on the tide (Department of the Navy 2013). Rocky intertidal areas are characterized by “bedrock, stones, or boulders that singly or in combination cover 75 percent or more of an area that is covered less than 30 percent by vegetation” (Navy 2013). The existing pier and hardened shoreline at the Shipyard provide substrate for the growth of algae and invertebrates.

Waterfront Improvement Projects at Portsmouth Naval Shipyard Request for an Incidental Harassment Authorization
2-10 October 2017
2.3.4 Vessel Traffic and Ambient Underwater Soundscape The lower Piscataqua River is home to Portsmouth Harbor and is used by commercial, recreational, and military vessels. Between 150 and 250 commercial shipping vessels transit the lower Piscataqua River each year (Magnusson et al. June 2012). The size of these vessels is limited by the 106-foot width of the river at the Sarah Long Bridge that spans the river (Magnusson et al. June 2012). Commercial fishing vessels are also very common in the river year round, as are recreational vessels, which are more common in the warmer summer months. The ambient underwater soundscape refers to noise that already exists in the environment prior to the introduction of another noise-generating activity. Ambient underwater sound can originate from a number of sources that are both natural and manmade. Natural sources of ambient sound include biological sources, such as various marine species, and physical sources, such as wind, waves, and rain (Richardson et al. 1995). Human-generated sound sources can include vessel noise (i.e., commercial shipping/container vessels, recreational vessels), seismic air guns, and marine construction (i.e., pile-driving or drilling). Understanding the overall impact that the introduction of additional noise could have on the marine mammals present in the area requires knowing the background noise of an area. If background noise levels in the vicinity of the project exceed those of the NOAA Fisheries Service thresholds, i.e., 120 decibel (dB) or greater, then marine mammals would not be affected by any sound less than the existing dominant noise levels. For example, if the background noise levels average 140 dB, then additional sounds less than 140 dB would not expose animals to harassing levels of noise. Any sounds less than 140 dB would become part of the background noise level and would not be audible above the dominant background noise. The Year 1 application included an ambient noise study conducted over the course of one day. That study indicated background noise levels would not mask the noise produced by a vibratory or impact hammer. A second ambient noise study has been completed during the initial phase of construction activity in 2017. This study revealed background noise levels at a mean RMS SPL of 131.06dB. Several points within the berth area were monitored resulting in little variation. Appendix A includes the summary report. Given the current background noise readings, the noise generated from vibratory or impact hammer use will be masked by the existing or ambient noise. Ambient readings will continue to be observed during acoustic monitoring days during 2017.
2.3.5 Existing Airborne Noise The Shipyard is a dynamic industrial facility situated on an island with a narrow separation of waterways between the installation and the communities of Kittery and Portsmouth. The predominant noise sources from Shipyard industrial operations consist of dry dock cranes; passing vessels; and industrial equipment (e.g., forklifts, loaders, rigs, vacuums, fans, dust collectors, blower belts, heating, air conditioning, and ventilation [HVAC] units, water pumps, and exhaust tubes and lids). Other components such as construction, vessel ground support equipment for maintenance purposes, vessel traffic across the Piscataqua River, and vehicle traffic on the Shipyard’s bridges and on local roads in Kittery and Portsmouth produce noise, but such noise generally represents a transitory contribution to the average noise level environment (Blue Ridge Research and Consulting [BRRC] 2015; ESS Group 2015). Airborne noise is not directly comparable to noise measured in water, due to differences in the reference pressures of air and water, and sound weighting conventions often applied by commercial sound measurement equipment. The reference pressure used when calculating SPL in dB depends on the medium in which the sound was measured. For airborne sounds, the reference value is 20 micropascals (μPa, or 10−6 pascals), expressed as “dB re 20 μPa.” For measurements of underwater sound, the

Waterfront Improvement Projects at Portsmouth Naval Shipyard Request for an Incidental Harassment Authorization
2-11 October 2017
standard reference pressure is 1 μPa, and is expressed as “dB re 1μPa.” Because sound levels measured in air and water are not directly comparable, it is important to include the correct reference pressure when giving a sound level in dB. Additionally, airborne sounds are commonly referenced to human hearing using a method which weights sound frequencies according to measures of human perception, de-emphasizing very low and very high frequencies which are not perceived well by humans. This is called A-weighting, and the decibel level measured is called the A-weighted sound level (dBA). Sounds given in dBA are assumed to be referenced to 20 μPa unless otherwise noted. Ambient airborne sound levels recorded at the Shipyard are considered typical of a large outdoor industrial facility and vary widely in space and time (ESS Group 2015). Table 2-3 summarizes in-air sound exposure and the average ambient sound levels recorded at Berth 11 in 2014 during normal operations (morning and afternoon hours), as well as the predominant operational and natural sound sources identified. Note that these levels are referenced to 20 μPa, the appropriate reference for in-air sound measurements as discussed above. They differ from most of the sound levels that appear in the rest of the document, which are referenced to 1 μPa, the appropriate reference for in-water sound measurements.
Table 2-3: Ambient Sound Levels Recorded at Berths 11, 12, and 13
Measurement Location
Sound Exposure Level (SEL) dBA re 20 μPa)
Equivalent Sound Level (Leq dBA re 20 μPa)
Predominant sources Morning Afternoon Morning Afternoon Berth 11 100.4 94.0 69.6 63.2 Operational sources: trucks and
forklifts passing, drilling rig, circular saw noise, passing boats, front-end loaders passing. Natural sources: wind noise and seagulls
Source: ESS Group 2014; BRRC 2015. Key: dBA = A-weighted decibel. Leq = Equivalent sound level. Leq is the continuous sound level that would be present if all of the variations in sound
occurring over a specified time period had the same total sound energy. It correlates reasonably well with the effects of noise on people, even for wide variations in environmental sound levels and time patterns.
SEL = Sound exposure level. It provides a measure of total sound energy of an acoustic event during a specified time period. It is commonly used for describing sound from passing vehicles.

Waterfront Improvement Projects at Portsmouth Naval Shipyard Request for an Incidental Harassment Authorization
3-1 October 2017
3 Marine Mammal Species and Numbers
The species and numbers of marine mammals likely to be found within the activity area.
Five marine mammal species, including one cetacean and four pinnipeds, may inhabit or transit the waters near the Shipyard in the lower Piscataqua River. These include the harbor porpoise (Phocoena phocoena), gray seal (Halichoerus grypus), harbor seal (Phoca vitulina), hooded seal (Crystphora cristata), and harp seal (Pagophilus groenlandicus). None of the marine mammals that may be found in the Piscataqua River are listed under the Endangered Species Act (ESA). All marine mammal species are protected under the Marine Mammal Protection Act (MMPA). Section 3 summarizes the population status and abundance of these species, while Section 4 contains detailed life history information for each. Table 3-1 lists the marine mammal species that could occur in the vicinity of the Shipyard and their estimated densities within the Project area. As there are no specific density data for any of the species in the Piscataqua River, density data from the nearshore zone outside the mouth the Piscataqua River in the Atlantic Ocean have been used instead. However, due to several factors, marine mammal densities within the river are expected to be lower. These factors include temperature and salinity differences, prey availability differences, and greater ambient noise values due to the existing boat traffic and human activity in the vicinity of Portsmouth Harbor. Anecdotal sighting evidence also indicates very low presence of marine mammals; however scientific data were used as a reasonable proxy to determine the number of takes, consistent with NMFS standards. Table 3-1: Marine Mammal Species Potentially Present in the Piscataqua River in the Vicinity of the Shipyard
Species Stock(s)
Abundance(1)
Relative Occurrence in
Piscataqua River
Season(s) of Occurrence
Approximate Density in the Vicinity of the Project Area
(individuals per km2)(3)
Winter Spring Summer Fall Harbor Porpoise Phocoena Gulf of Maine/Bay of Fundy stock
79,883 (CV= 0.32)
Occasional use Spring to Fall (April to December)4
1.2122 1.1705 0.7903 0.9125
Gray Seal Halichoerus grypus Western North Atlantic stock
331,000(2) Common Year-round 0.2202 0.2202 0.2202 0.2202
Harbor Seal Phoca vitulina Western North Atlantic stock
70,142 (CV= 0.29)
Common Year-round 0.1998 0.1998 0.1998 0.1998
Hooded Seal Crystphora cristata Western North Atlantic stock
592,900(2) Rare Winter to Spring (January – May)
N/A N/A N/A N/A

Waterfront Improvement Projects at Portsmouth Naval Shipyard Request for an Incidental Harassment Authorization
3-2 October 2017
Table 3-1: Marine Mammal Species Potentially Present in the Piscataqua River in the Vicinity of the Shipyard
Species Stock(s)
Abundance(1)
Relative Occurrence in
Piscataqua River
Season(s) of Occurrence
Approximate Density in the Vicinity of the Project Area
(individuals per km2)(3)
Winter Spring Summer Fall Harp Seal Pagophilus groenlandicus Western North Atlantic stock
71,000,000 Rare Winter to Spring (January – May)
0.0125 0.0125 0.0125 0.0125
Source: Waring et al. 2014, except where noted. Notes: (1) No population estimate is available for the U.S. western North Atlantic stock; therefore, the best population estimates are those for
the Canadian populations as reported in Waring et al. 2014. (2) Source: Waring et al. 2007. The population estimate for the Western North Atlantic hooded seal population was not updated in
Waring et al. 2014. (3) Density data are taken from the Navy Marine Species Density Database (Crain 2015; Krause 2015). It should be noted that these
data overestimate the potential species density in the Piscataqua River. The Navy Marine Species Density Database data presented in the table are based on a relative environmental suitability study and represent data with low confidence. These data are generally used for broad-scale offshore activities; however, due to a lack of any other data within the general Project area, these data are presented as the best available data for the Piscataqua River.
(4) Densities shown for all seasons, even when species are unlike to occur in the river Key: CV = coefficient of variation km2 = square kilometer
3.1 Species Descriptions and Abundances
3.1.1 Harbor Porpoise
Species Description The harbor porpoise is a member of the phocoenidae family. Adult harbor porpoises range from 5 to 5.5 feet in length and can weigh up to 170 pounds. They are a toothed whale species and can be recognized by their small, robust, dark gray body with grayish-white sides, triangular dorsal fin, and short rostrum. Harbor porpoises are considered sexually dimorphic, with females being slightly larger than males (NOAA Fisheries Service 2014a). Harbor porpoises are found commonly in coastal and offshore waters of both the Atlantic and Pacific Oceans. In the western North Atlantic, the species is found in both U.S. and Canadian waters. More specifically, the species can be found between West Greenland and Cape Hatteras, North Carolina (NOAA Fisheries Service 2014a). Based on genetic analysis, it is assumed that harbor porpoises in the U.S. and Canadian waters are divided into four populations, as follows: 1) Gulf of St. Lawrence; 2) Newfoundland; 3) Greenland; and 4) Gulf of Maine/Bay of Fundy. For management purposes in U.S. waters, harbor porpoises have been divided into 10 stocks along both the East and West Coasts. Of those 10 stocks, only one, the Gulf of Maine/Bay of Fundy stock, is found along the U.S. East Coast, and thus only individuals from this stock could be found in the Project area. The species is primarily found over the Continental Shelf in waters less than approximately 500 feet deep (Waring et al. 2014). In general, the species is commonly found in bays, estuaries, and harbors (NOAA Fisheries Service 2014a).

Waterfront Improvement Projects at Portsmouth Naval Shipyard Request for an Incidental Harassment Authorization
3-3 October 2017
Population Abundance Line-transect surveys have been conducted in the Gulf of Maine between 1991 and 2011. Based on the 2011 aerial surveys, the best abundance estimate for the Gulf of Maine/Bay of Fundy stock of harbor porpoise is 79,883 animals (CV=0.32). The aerial surveys included central Virginia to the lower Bay of Fundy. The minimum population estimate is 61,415 animals (Waring et al. 2014). Because no trend analysis has been conducted for this stock, no population trend is available. A Bayesian population model was used to determine the currently accepted population growth rate. Fertility data and age-at-death data from stranded animals and animals taken in gillnets were used for the model (Waring et al. 2014). It was then determined that the potential natural growth rate for the Gulf of Maine/Bay of Fundy stock of harbor porpoises was 0.046 (Waring et al. 2014). The harbor porpoise is likely the most abundant cetacean within the Piscataqua River (Smith n.d.).
3.1.2 Gray Seal
Species Description Gray seals, which are members of the “true seal” family (phocidae), are a coastal species that generally remains within the Continental Shelf region. However, they do venture into deeper water, as they have been known to dive up to 1,560 feet to capture prey during feeding (NOAA Fisheries Service 2013). Gray seals primarily feed on fish, squid, various crustacean species, and octopus. Adult gray seals are sexually dimorphic, with males generally being larger than females. Adult males can reach up to 10 feet in length and weigh up to 880 pounds (NOAA Fisheries Service 2013). Adult females can reach up to 7.5 feet in length and can weigh up to 550 pounds (NOAA Fisheries Service 2013). As a true seal, this species lacks external ear flaps, and its rear flippers do not rotate. Depending on its geographic location and sex, gray seal appearance and coloration varies. Adult females have a silver-gray coat with darker spots scattered over their body, and while males generally have similar color patterns, they have a prominent, long-arched nose (NOAA Fisheries Service 2013). Gray seals can be found on both sides of the North Atlantic. Within this area, the species is split into three primary populations: 1) eastern Canada, 2) northwestern Europe, and 3) the Baltic Sea (Katona et al. 1993). Gray seals within U.S. waters are considered the western North Atlantic stock and are expected to be part of the eastern Canadian population (Waring et al. 2014). In U.S. waters, year-round breeding of approximately 400 animals has been documented on areas of outer Cape Cod and Mukeget Island in Massachusetts. In general, this species can be found year-round in the coastal waters of the Gulf of Maine (Waring et al. 2014).
Population Abundance There are currently no population estimates for the western North Atlantic gray seal stock (Waring et al. 2014). However, estimates are available for portions of the total population for certain time periods (Waring et al. 2014). For example, between 1993 and 2004, the gray seal population in Canada was estimated at between 144,000 and 223,220 individuals. This estimate was based on three separate surveys and also depended on the population-estimation model that was used (Mohn and Bowen 1996; Department of Fisheries and Oceans 2003; Trzcinski et al. 2005). The most recent Canadian gray seal population estimate is 331,000. This estimate is based on surveys conducted during 2012 in the Gulf of St. Lawrence, Nova Scotia Eastern Shore, and Sable Island (Waring et al. 2014). In U.S. waters, gray seals are known to pup at three separate locations: 1) Muskeget Island, Massachusetts; 2) Green Island, Maine; and 3) Seal Island, Maine. Surveys of these areas indicate that in these colonies pup production is increasing, as are the colony populations. General population increases in U.S. waters are likely a result of this natural increase and immigration of individuals from Canadian populations (Waring et al. 2014).

Waterfront Improvement Projects at Portsmouth Naval Shipyard Request for an Incidental Harassment Authorization
3-4 October 2017
3.1.3 Harbor Seal
Species Description Harbor seals are also members of the true seal family (Phocidae) and can be found in nearshore waters along both the North Atlantic and North Pacific coasts, generally at latitudes above 30°N (Burns 2009). In the western Atlantic Ocean, the harbor seal’s range extends from the eastern Canadian Arctic to New York; however, they can be found as far south as the Carolinas (Waring et al. 2014). In New England, the species can be found in coastal waters year-round (Waring et al. 2014). Overall, there are five recognized subspecies of harbor seal, two of which occur in the Atlantic Ocean. The western Atlantic harbor seal (Phoca vitulina concolor) is the subspecies likely to occur in the Project area. There is some uncertainly about the overall population stock structure of harbor seals in the western North Atlantic Ocean. However, it is theorized that harbor seals along the eastern U.S. and Canada are all from a single population (Temte et al. 1991). Similar to gray seals, adult harbor seals are sexually dimorphic. Males are generally larger than females. Adult harbor seals can reach up to 6.3 feet in length and weigh up to 245 pounds (NOAA Fisheries Service 2014c). As with other members of the Phocidae family, harbor seals lack external ear flaps, and their rear flippers do not rotate. Harbor seals are commonly a blue-gray color on their back with a speckling of both light and darker colors; however, their coloration may vary. Their concave, dog-like snout and their “banana-like” position while hauled out aids in their identification (NOAA Fisheries Service 2014c).
Population Abundance An aerial abundance survey was conducted in 2012 during the pupping season along the entire Maine coast. As a result of this survey, the best estimate of abundance for the western North Atlantic stock of harbor seal was 70,142 animals. The minimum population was estimated as 55,409 animals (also based on the 2012 aerial abundance survey). No trend analysis has been conducted for this species, likely because of the long interval between the 2012 survey and the previous 2001 survey and the somewhat imprecise abundance estimates that were generated from them. In the Piscataqua River, harbor seals are the most abundant pinniped species (Smith n.d.).
3.1.4 Hooded Seal
Species Description Hooded seals are also members of the true seal family (phocidae) and are generally found in deeper waters or on drifting pack ice. The world population of hooded seals has been divided into three stocks, which coincide with specific breeding areas, as follows: 1) Northwest Atlantic, 2) Greenland Sea, and 3) White Sea (Waring et al. 2007). The hooded seal is a highly migratory species, and its range can extend from the Canadian arctic to Puerto Rico. In U.S. waters, the species has an increasing presence in the coastal waters between Maine and Florida (Waring et al. 2007). In the U.S., they are considered members of the western North Atlantic stock and generally occur in New England waters from January through May and further south in the summer and fall seasons (Waring et al. 2007). Similar to both the gray seal and harbor seal, hooded seals are also sexually dimorphic. Males are generally much larger than females, reaching up to 8 feet in length and weighing approximately 660 pounds (NOAA Fisheries Service 2012b). Females generally reach up to 7 feet in length and weigh up to 440 pounds (NOAA Fisheries Service 2012b). Adult hooded seals are a silver-gray color with dark marks in varying sizes and shapes on their coats. They also have a distinctive block-shaped head. As with other phocidae (true seal) species, hooded seals lack external ear flaps, and their rear flippers do not rotate (NOAA Fisheries Service 2012b).

Waterfront Improvement Projects at Portsmouth Naval Shipyard Request for an Incidental Harassment Authorization
3-5 October 2017
Population Abundance Population abundance of hooded seals in the western North Atlantic is derived from pup production estimates. These estimates are developed from whelping pack surveys. The most recent population estimate in the western North Atlantic was derived in 2005. There have been no recent surveys conducted or population estimates developed for this species. The 2005 best population estimate for hooded seals is 592,100 individuals, with a minimum population estimate of 512,000 individuals (Waring et al. 2007). Currently, not enough data are available to determine what percentage of this estimate may represent the population within U.S. waters. A population trend also cannot be developed for this species due to a lack of sufficient data. Hooded seals are known to occur in the Piscataqua River; however, they are not as abundant as the more commonly observed harbor seal. Anecdotal sighting information indicates that two hooded seals were observed from the Shipyard in August 2009, but no other observations have been recorded (Trefry November 20, 2015).
3.1.5 Harp Seal
Species Description Harp seals are also members of the true seal family and are classified into three stocks, which coincide with specific pupping sites on pack ice, as follows: 1) Eastern Canada, including the areas off the coast of Newfoundland and Labrador and the area near the Magdalen Islands in the Gulf of St. Lawrence; 2) the West Ice off eastern Greenland, and 3) the ice in the White Sea off the coast of Russia (Waring et al. 2014). The hooded seal is a highly migratory species, and its range can extend from the Canadian arctic to New Jersey. In U.S. waters, the species has an increasing presence in the coastal waters between Maine and New Jersey (Waring et al. 2014). In the U.S., they are considered members of the western North Atlantic stock and generally occur in New England waters from January through May in the winter and spring (Waring et al. 2014). The observed influx of harp seals and geographic distribution in New England to mid-Atlantic waters is based primarily on strandings and secondarily on fishery bycatch. Unlike the gray seal, harbor seal, and hooded seal, harp seals exhibit little sexual dimorphism. Males are generally only slightly larger than females, reaching up to 6’3” in length and weighing approximately 310 pounds (Reeves et al. 2002). Females generally reach up to 5’11” in length and weigh up to 290 pounds (Reeves et al. 2002). Adult harp seals are a light-gray color with black faces and a horseshoe-shaped black saddle on their back. They also have a distinctive block-shaped head. As with other true seal (phocidae) species, harp seals lack external ear flaps, and their rear flippers do not rotate (NOAA Fisheries Service 2015).
Population Abundance Population abundance of harp seals in the western North Atlantic is derived from aerial surveys and mark-recapture (Waring et al. 2014). The most recent population estimate in the western North Atlantic was derived in 2012 from an aerial harp seal survey. The 2012 best population estimate for hooded seals is 7.1 million individuals (Waring et al. 2014). Currently, not enough data are available to determine what percentage of this estimate may represent the population within U.S. waters. A population trend also cannot be developed for this species due to a lack of sufficient data, as recent increases in strandings may not be indicative of population size. Harp seals are known to occur in the Piscataqua River; however, they are not as abundant as the more commonly observed harbor seal (Crain 2015).
3.1.6 Species Considered but Not Included in Analysis
Bottlenose Dolphin (Tursiops truncatus) The western North Atlantic northern migratory stock of bottlenose dolphin (Tursiops truncatus) can be found between Long Island, New York, and Cape Hatteras, North Carolina, during summer months (July

Waterfront Improvement Projects at Portsmouth Naval Shipyard Request for an Incidental Harassment Authorization
3-6 October 2017
through September) (Cetacean and Turtle Assessment Program [CeTAP] 1982). During winter months, dolphins from this stock are rarely seen north of the North Carolina/Virginia border (Waring et al. 2014). Consequently, the range of this dolphin is well outside of the Project area. The estimated density of this species in the lower Piscataqua River reflects its rarity, with estimated densities ranging from 0.0664 to 0.1439 individuals per square kilometer (km2) for fall and summer (Crain 2015; Krause 2015). Based on the known occurrence of this species in warmer southern waters during the winter months and rare occurrence within the lower Piscataqua River during summer months, it is not expected that the bottlenose dolphin would occur within the vicinity of the Project area during the in-water construction period. Bottlenose dolphins are not listed as threatened or endangered under the ESA, and the western North Atlantic northern stock is not considered strategic under the MMPA. Because the occurrence of this species in the Project area is predicted to be rare, the potential for bottlenose dolphin takes are not analyzed in this application.
Atlantic White-sided dolphin (Lagenorhynchus acutus) Atlantic white-sided dolphins (Lagenorhynchus acutus) of the western North Atlantic stock inhabit waters from central west Greenland to North Carolina and as far east as the Mid-Atlantic ridge (Hamazaki 2002; Doksaeter et al. 2008; Waring et al. 2008). While members of Western North Atlantic stock of this dolphin do inhabit the Gulf of Maine, they are most common between Hudson Canyon and Georges Bank, which is approximately 70 miles (113 km) offshore of the Project area (Waring et al. 2014). Based on the known occurrence of this species in New England offshore waters east and north of the Project area during the spring, summer, and fall months, and their overall lack of presence throughout the region during winter months, it is not expected that the Atlantic white-sided dolphin would occur within the vicinity of the Project during the in-water construction period. White-sided dolphins are not listed as threatened or endangered under the ESA, and the Western North Atlantic stock is not considered strategic under the MMPA. As the occurrence of this species in the Project area is predicted to be rare, the potential for white-sided dolphin takes are not analyzed in this application.
3.2 Spatial Distribution Density assumes that marine mammals are uniformly distributed within a given area, although this is rarely the case. Marine mammals are usually concentrated in areas of greater importance--for example, areas of high productivity, lower predation, safe calving or pupping, and prime foraging. Density can occasionally be calculated for smaller areas that are used regularly by marine mammals, but more often than not scientific data are insufficient to represent the spatial distribution of animals for small regions such as the construction area encompassed by the Project. Therefore, given the lack of availability of specific marine mammal data for the Portsmouth Naval Shipyard, this IHA application assumes that marine mammals are uniformly distributed in the study area.
3.3 Submergence Cetaceans spend their entire lives in the water and spend most of their time (more than 90 percent for most species) entirely submerged below the surface. When at the surface, cetacean bodies are almost entirely below the water’s surface, with only the blowhole exposed to allow breathing. Occasionally the dorsal fin and back fin are visible. This makes cetaceans difficult to locate visually and also exposes them to underwater noise, both natural and anthropogenic, essentially 100 percent of the time because their ears are nearly always below the water’s surface. Seals spend significant amounts of time out of the water during breeding, molting, and “hauling out” (resting out of the water on land or marine structures) periods. When not actively diving, pinnipeds at the surface often orient their bodies vertically in the water column and often hold their heads above the water surface. Consequently, pinnipeds may not be exposed to underwater sounds to the same extent as cetaceans occurring in the same location.

Waterfront Improvement Projects at Portsmouth Naval Shipyard Request for an Incidental Harassment Authorization
3-7 October 2017
For the purpose of assessing impacts from underwater sound at the Shipyard, the Navy assumed that both cetaceans and pinnipeds that occur in the vicinity would be submerged 100 percent of the time. This approach could be considered conservative because seals spend a portion of their time hauled out, and the closest known haul-out site for seals within the Piscataqua River is 1.5 miles downstream of the Project area. Therefore, seals are expected to be exposed to less sound than is estimated by this approach.

Waterfront Improvement Projects at Portsmouth Naval Shipyard Request for an Incidental Harassment Authorization
4-1 October 2017
4 Status and Distribution of Marine Mammal Species or Stock that Could Potentially Be Affected
Five marine mammal species could occur within the waters adjacent to the Shipyard with confirmed or historic occurrence in the Project area. None of these species are listed under the ESA. The population status, distribution, behavior and ecology, and acoustics (uses of sound and hearing ability) of each species are described below. Background on acoustics and definitions of metrics are provided in Section 6 of this document.
4.1 Harbor Porpoise, Gulf of Maine/Bay of Fundy Stock
4.1.1 Population Status The Gulf of Maine/Bay of Fundy stock of the harbor porpoise is not categorized as depleted under the MMPA. The stock is considered a strategic stock as a result of the estimated average annual human-related mortality exceeding the potential biological removal for this stock.
4.1.2 Distribution The Gulf of Maine/Bay of Fundy stock of the harbor porpoise is generally found over the Continental Shelf, ranging from the Gulf of Maine/Bay of Fundy region to North Carolina, in varying abundance and depending on the season (Waring et al. 2014). July through September are the primary months this species can be found in the Gulf of Maine and the southern Bay of Fundy area (Waring et al. 2014). During this time, harbor porpoises are generally found in less than approximately 500 feet of water (Waring et al. 2014). During other times of year, this species is more dispersed throughout a larger region that includes Maine though New Jersey. Harbor porpoises are primarily found throughout this area during the fall months (October through December) and spring months (April through June) (Waring et al. 2014). During winter months (January through March), harbor porpoises are generally found in much lower densities between New York and Canada, as well as dispersed between New Jersey and North Carolina (Waring et al. 2014; CeTAP 1982). At this time, there has been no research that supports either a migration triggered by water temperature or a specific migration route through the species’ range. Harbor porpoises are known to occur in the Piscataqua River and are the most commonly observed cetacean species for the river (Smith n.d.).
4.1.3 Behavior and Ecology Harbor porpoises feed individually, with their primary prey consisting of demersal and benthic species such as schooling fish and cephalopods (Reeves et al. 2002; NOAA Fisheries Service 2014a). In the Bay of Fundy, harbor porpoises feed on Atlantic herring (Clupea harengus) during the summer months (Gannon et al. 1997). During fall months in the Gulf of Maine, harbor porpoises also primarily feed on Atlantic herring, along with silver hake (Merluccius bilinearis), red hake (Urophycis chuss), white hake (Urophycis tenuis), and pearlside (Maurolicus pennanti) (Gannon et al 1997). Harbor porpoises are most commonly found in bays, estuaries, and harbors and are generally solitary animals, usually observed either alone or in small groups (NOAA Fisheries Service 2014a; Reeves et al. 2002). The species in highly mobile, and individuals can travel many miles in one day within home ranges of thousands of square miles (Reeves et al. 2002). Harbor porpoises generally do not approach human activities and tend to be hard to follow because they spend little time at the surface. In the Gulf of Maine, a main issue of concern with this species is interaction with the gillnet fishery. As harbor porpoises commonly feed on small, schooling fish, such as those targeted by gillnets, they often become entangled in these nets when pursuing prey (NOAA Fisheries Service January 2010).

Waterfront Improvement Projects at Portsmouth Naval Shipyard Request for an Incidental Harassment Authorization
4-2 October 2017
4.1.4 Acoustics Harbor porpoises are considered high-frequency cetaceans, along with 19 other species and subspecies. In general, the estimated bandwidth for functional hearing in high-frequency cetaceans is 275 hertz (Hz) to 160 kilohertz (kHz) (Southall et al. 2007). Hearing capabilities for harbor porpoises have been tested both behaviorally and with the auditory evoked potential technique. Based on an audiogram developed from behavioral methods, detection thresholds were estimated between 250 Hz and 180 kHz. Within that, the range of best hearing was from 16 to 140 kHz, and maximum sensitivity was recorded at 100 to 140 kHz (Kastelein et al. 2002). Harbor porpoises are vocal animals, using echolocation for feeding and navigation and vocalizing for socialization (Southall et al. 2007).
4.2 Gray Seal, Western North Atlantic Stock
4.2.1 Population Status The western North Atlantic stock of the gray seal is not categorized as strategic or depleted under the MMPA.
4.2.2 Distribution The general range of the western North Atlantic stock of the gray seal is between New York and Labrador, Canada (Katona et al. 1993; Lesage and Hammill 2001). The western North Atlantic Ocean hosts three breeding colonies: 1) Sable Island; 2) Gulf of St. Lawrence; and 3) the coast of Nova Scotia (Laviguer and Hammill 1993 in Waring et al. 2014). No known haul-out sites for gray seals are in the immediate vicinity of the Project Area. The closest known haul-out site for seals within the Piscataqua River is 1.5 miles downstream of the Project area. Solitary seals could potentially haul out closer to the Project Area. In coastal Maine, gray seals are known to pup on Green Island and Sea Island and are year-round residents in southern Maine waters (Waring et al. 2014). Gray seals are known to occur within the Piscataqua River but are not as commonly observed as harbor seals (Smith n.d.). During spring and summer months, gray seals are most commonly observed on offshore ledges off the central coast of Maine (Richardson et al. 1995).
4.2.3 Behavior and Ecology Gray seals gather in large groups (often several hundred animals or more) for breeding, molting and resting. However, they are assumed to be solitary feeders, with some foraging in waters close to their haul-out colonies, while others travel great distances away from their colonies (Reeves et al. 2002). Foraging gray seals can remain at sea for up to 20 days (Reeves et al. 2002). Gray seals are opportunistic feeders whose primary food resources include fish, squid, various crustacean species, and octopus (NOAA Fisheries Service 2013). They can also dive deep (up to 1,560 feet) to capture prey when necessary (NOAA Fisheries Service 2013). Gray seals pups are generally born between January and February in the western Atlantic Ocean, and breeding rookeries generally consist of beaches, rocky islands, coasts, caves, and ice floes (NOAA Fisheries Service 2013).
4.2.4 Acoustics Gray seals, along with other members of the phocididae family, are capable of hearing in both air and water. In general, the estimated bandwidth for functional hearing for phocids in water is 50 Hz to 86 kHz and in air is 75 Hz to 30 kHz (Southall et al. 2007). Hearing capabilities for gray seals both in water and in air have been tested behaviorally and with the auditory evoked potential technique (Southall et al. 2007).

Waterfront Improvement Projects at Portsmouth Naval Shipyard Request for an Incidental Harassment Authorization
4-3 October 2017
4.3 Harbor Seal, Western North Atlantic Stock
4.3.1 Population Status The western North Atlantic stock of harbor seal is not categorized as strategic or depleted under the MMPA.
4.3.2 Distribution The western North Atlantic stock of harbor seal is primarily found along the coastal and inshore regions of the northeastern U.S. and Canada. The species primarily occupies bays, estuaries, and inlets and is rarely observed more than 7.7 miles from shore (Baird 2001). Harbor seals are also often found upstream in coastal rivers (Baird 2001). The greatest concentrations within this region occur in coastal Maine, where they reside year-round (Katona et al. 1993; Waring et al. 2014). In the western North Atlantic, the harbor seal is distributed from the eastern Canadian Arctic and Greenland south to the southern extent of New England and New York State, with more recent occurrences in Virginia and the Carolinas (Mansfield 1967; Baird 2001). While technically year round residents, harbor seals generally migrate out of Canadian and Maine waters toward southern New England during fall and early winter. This is followed by a northward movement back into Maine waters prior to the pupping season, which occurs between mid-May and June (Waring et al. 2014). Harbor seals are known to occur in the Piscataqua River and are the most commonly observed pinniped species for the river (Smith, n.d.). No known haul-out sites for harbor seals are in the immediate vicinity of the Project area, with the closest known haul-out site for seals within the Piscataqua River being 1.5 miles downstream from the Project area. Solitary seals could potentially haul out closer to the Project Area.
4.3.3 Behavior and Ecology Harbor seals gather in large groups of several hundred seals during molting season on sandy or cobble beaches or tidal sand bars (Reeves et al. 2002). While at sea, however, they are solitary and can spend up to several weeks at sea foraging. Harbor seals’ diet varies greatly. They feed on demersal fish, pelagic schooling fish, octopus, and squid, and their diet largely depends on what is available (Reeves et al.2002). In New England waters, harbor seals feed primarily on sandlance (Ammodytidae), silver hake, Atlantic herring, and redfish (Sebastes fasciatus). Other prey species include cod (Gadus morhua), haddock (Melanogrammus aeglefinus), pollock (Pollachius virens), flounders (Plueronectidae), mackerel (Scomber Scomrus), and squid. While feeding, harbor seals spend 85 percent of their time diving, sometimes reaching depths of up to 500 feet. In general, harbor seals mate at sea, and females give live birth during the spring and summer; however, the pupping season varies by latitude. Along the Maine coast, pupping season generally occurs from mid-May through June (Kenney 1994 in Waring et al. 2014; deHart 2002 in Waring et al. 2014) and to a much lesser extent at high-use haul-out sites off of Manomet, Massachusetts (Waring et al. 2014).
4.3.4 Acoustics Harbor seals are capable of hearing in both air and water. In general, the estimated bandwidth for functional hearing for phocid (true seals) seals in water is 50 Hz to 86 kHz and in air is 75 Hz to 30 kHz (Southall et al. 2007). In air, harbor seal males produce a variety of low-frequency (<4 kHz) vocalizations, including snorts, grunts, and growls. Male harbor seals produce communication sounds in the frequency range of 100 to 1,000 Hz (Richardson et al. 1995). Harbor seals hear nearly as well in air as underwater (Kastak and Schusterman 1998). Kastak and Schusterman (1998) reported airborne low-frequency (100 Hz) sound detection thresholds at 65.4 dB re 20 μPa for harbor seals. In air, they hear frequencies from 0.25 kHz to 30 kHz and are most sensitive to frequencies from 6 to 16 kHz (Richardson et al. 1995; Terhune and Turnbull 1995; Wolski et al. 2003).

Waterfront Improvement Projects at Portsmouth Naval Shipyard Request for an Incidental Harassment Authorization
4-4 October 2017
Adult males also produce underwater sounds during the breeding season that typically range from 0.025 to 4 kHz at a duration range of 0.1 second to multiple seconds (Hanggi and Schusterman 1994). Hanggi and Schusteman (1994) found that there is individual variation in the dominant frequency range of sounds between different males, and Van Parijs et al. (2003) reported oceanic, regional, population, and site-specific variation that could be vocal dialects. In water, the species hears frequencies from 1 to 75 kHz (Southall 2007) and can detect sound levels as weak as 60 to 85 dB re 1 μPa within that band. They are most sensitive at frequencies below 50 kHz; above 60 kHz, sensitivity rapidly decreases.
4.4 Hooded Seal, Western North Atlantic Stock
4.4.1 Population Status The western North Atlantic stock of the hooded seal is not categorized as strategic or depleted under the MMPA.
4.4.2 Distribution Hooded seals generally inhabit the Arctic Ocean and northern Atlantic Ocean. The western Atlantic stock is known to whelp in three locations off Canada’s east coast: 1) the area off the coast of Newfoundland and Labrador (the Front herd); 2) the Gulf of St. Lawrence (the Gulf herd); and 3) the Davis Strait (Waring et al. 2007). Hooded seals are observed within New England waters between January and May (Waring et al. 2007). Molting occurs between June and August in the Denmark Strait in Greenland. After this, they disperse widely (Waring et al. 2007). Breeding then occurs in February at the three whelping locations. Hooded seals are known to occur in the Piscataqua River; however, they are not as abundant as the more commonly observed harbor seal (Smith n.d.).
4.4.3 Behavior and Ecology With the exception of breeding and molting, hooded seals are primarily solitary (Reeves et al. 2002). Both males and females are aggressive during mating season and often vocalize loudly while on the ice. Breeding generally occurs in aggregations on pack ice (Reeves et al. 2002). Hooded seals feed primarily on squid and fish, particularly cod and redfish; however, they also feed on crustaceans, starfish, and mussels (Reeves et al. 2002; NOAA Fisheries Service 2012b). Hooded seals are deep divers and usually dive to depths of 325 to 1,900 feet for up to 15 minutes (NOAA Fisheries Service 2012b). There is no information on hooded seal behavior in the Piscataqua River.
4.4.4 Acoustics Along with other pinniped species and subspecies, hooded seals are capable of hearing in both air and water. Hearing capabilities of this species have not been directly tested as they have for other species. However, as hooded seals are within the phocididae family, the functional hearing limit of these is species is expected to be similar to that of other phocid seals. In general, the estimated bandwidth for functional hearing for phocids in water is 50 hertz (Hz) to 86 kHz and in air is 75 Hz to 30 kHz (Southall et al. 2007). Pinnipeds in general are also known to produce a wide variety of low-frequency social sounds, with varying hearing capabilities in air and in water (Southall et al. 2007).
4.5 Harp Seal, Western North Atlantic Stock
4.5.1 Population Status The western North Atlantic stock of the harp seal is not categorized under categorized under the MMPA as strategic or depleted (Waring et al. 2014).

Waterfront Improvement Projects at Portsmouth Naval Shipyard Request for an Incidental Harassment Authorization
4-5 October 2017
4.5.2 Distribution Harp seals generally inhabit the Arctic Ocean and northern Atlantic Ocean. The western Atlantic stock is known to whelp in three locations off Canada’s east coast: 1) Eastern Canada, including areas off the coast of Newfoundland and Labrador and the area near the Magdalen Islands in the Gulf of St. Lawrence; 2) the West Ice off eastern Greenland; and 3) the ice in the White Sea off the coast of Russia (Waring et al. 2014). Harp seals are observed within New England waters between January and May (Waring et al. 2014). Breeding occurs at different times at each whelping location, but generally between Late-February and April. Adults then assemble on suitable pack ice to undergo the annual molt; after which they migrate towards the Arctic feeding grounds (Waring et al. 2014). Harp seals are known to occur in the Piscataqua River; however, they are not as abundant as the more commonly observed harbor seal (Crain 2015).
4.5.3 Behavior and Ecology During breeding season, harp seals can be found in large numbers— up to several thousand seals— on the pack ice (NOAA Fisheries Service 2015). Harp seals feed primarily on a varied mix of species of finfish and invertebrates, particularly capelin, cod, and krill (NOAA Fisheries Service 2015). Harp seals are modest divers and usually dive to depths of up to 1,200 feet for up to 16 minutes (NOAA Fisheries Service 1015). There is no information on harp seal behavior in the Piscataqua River.
4.5.4 Acoustics Along with other pinniped species and subspecies, harp seals are capable of hearing in both air and water. Hearing capabilities of this species have not been directly tested as they have for other species. However, as harp seals are within the phocididae family, the functional hearing limit of these species is expected to be similar to that of other phocid seals. In general, the estimated bandwidth for functional hearing for phocids in water is 50 Hz to 86 kHz and in air is 75 Hz to 30 kHz (Southall et al. 2007). Pinnipeds in general are also known to produce a wide variety of low-frequency social sounds, with varying hearing capabilities in air and in water (Southall et al. 2007). 4.5.5 Reference to 2016 Acoustical Guidance The Addendum issued for the Year 1 application references the functional hearing groups each based on their hearing sensitivities and the cumulative effect of a noise over time and distance on that animals hearing capability. The information in the addendum was utilized to calculate PTS onset for Year 1 activity. That addendum is incorporated by reference into this application in a number of locations. As discussed in the following sections of this Year 2 application, the acoustical thresholds recommended in the 2016 guidance were utilized to determine PTS; harm or Level A take criteria. The 2016 guidance does not recommend revised methods for Level B or behavioral harassment assessment as the onset of TTS (temporary threshold shift), and no new data has been generated since the Year 1 application, therefore the Year 1 methods for calculating Level B harassment levels will remain the same. The functional hearing groups for the above species are as follows; Phocid Pinnipeds (Seals including gray, harbor, harp and hooded) and High Frequency Cetaceans (Porpoises). Table 4-1 identifies the generalized hearing range for each functional hearing group.

Waterfront Improvement Projects at Portsmouth Naval Shipyard Request for an Incidental Harassment Authorization
4-6 October 2017
Table 4-1: Functional Hearing Groups: 2016 Acoustic Guidance
Hearing Group Generalized Hearing Range*
Low-frequency (LF) cetaceans (baleen whales) 7 Hz to 35 kHz
Mid-frequency (MF) cetaceans (dolphins, toothed whales, beaked whales, bottlenose whales) 150 Hz to 160 kHz
High-frequency (HF) cetaceans (true porpoises, Kogia, river dolphins, cephalorhynchid, Lagenorhynchus cruciger & L. australis)
275 Hz to 160 kHz
Phocid pinnipeds (PW) (underwater) (true seals) 50 Hz to 86 kHz
Otariid pinnipeds (OW) (underwater) (sea lions and fur
60 Hz to 39 kHz
**Note: Represents the generalized hearing range for the entire group as a composite (i.e., all species within the group), where individual species’ hearing ranges are typically not as broad. Generalized hearing range chosen based on ~65 dB threshold from normalized composite audiogram, with the exception for lower limits for LF cetaceans (Southall et al. 2007) and PW pinniped (approximation).

Waterfront Improvement Projects at Portsmouth Naval Shipyard Request for an Incidental Harassment Authorization
5-7 October 2017
5 Harassment Authorization Requested Under Section 101 (a)(5)(D) of the MMPA, the Navy obtained in 2016 an Incidental Harassment Authorization (IHA) issued to cover January 1 through December 31, 2017 for the take of small numbers of marine mammals, by Level B and Level A harassment, incidental to pile driving and drilling operations associated with the Waterfront Improvement Project at Portsmouth Naval Shipyard, Kittery, Maine. Except with respect to certain activities not pertinent here, the MMPA defines “harassment” as:
Any act of pursuit, torment, or annoyance which (i) has the potential to injure a marine mammal or marine mammal stock in the wild [Level A harassment]; or (ii) has the potential to disturb a marine mammal or marine mammal stock in the wild causing disruption of behavioral patterns, including, but not limited to, migration, breathing, nursing, breeding, feeding, or sheltering [Level B harassment] (50 C.F.R, Part 126, Subpart A, Section 216.3-Definiations).
Level A harassment is the more severe form of harassment because it may result in injury, whereas Level B harassment may result in disturbance without the potential for injury. This application will request both Level B and minimal Level A harassment approval utilizing criteria discussed in the 2016 acoustical guidance. The Navy requests an IHA to cover Year 2 of the referenced project commencing January 1, 2018 (or the issuance date, whichever is later). In August of 2016, the 2016 Technical Guidance for assessing the Effects of Anthropogenic Sound on Marine Mammal Hearing was issued. The 2016 guidance was followed for determination of estimated Level A and Level B takes. The 2016 Technical Guidance utilizes auditory weighting functions to determine PTS onset. The estimated level B takes were determined utilizing the same species data and studies as the 2017 application with addition of actual construction equipment time use from the contractors proposed schedule and experience completing similar work activities.
5.1 Take Authorization Request Under Section 101(a)(5)(D) of the MMPA, the Navy requests an IHA from NOAA Fisheries Service for Level B take (behavioral harassment) of marine mammals described within this application as a result of in-water pile-driving, extraction, and drilling activities. The Navy requests coverage under the IHA to begin on January 1, 2018 for Year 2 of the project described in this application. The exposure assessment methodology in this IHA application attempts to quantify potential exposures to marine mammals resulting from pile driving, extraction, and drilling. Section 6 presents a detailed description of the acoustic exposure assessment methodology. Results from this approach tend to provide an overestimation of exposures because all animals are assumed to be available to be exposed 100 percent of the time, and the formulas used to estimate transmission loss used idealized parameters, which are unrealistic in nature. Modeling was conducted for a full year, covering all four seasons. The analysis for the Project 2018 scope predicts 137 total potential exposures (see Section 6 for estimates of exposures by species and activity type) that could be classified as Level B harassment as defined under MMPA over the course of the project. The project is requesting 222 total takes based on observational data as discussed in Part 6 of this application The Navy’s mitigation procedures, presented in Section 11, include monitoring of mitigation zones prior to initiating pile driving, extraction, or drilling; use of soft-start

Waterfront Improvement Projects at Portsmouth Naval Shipyard Request for an Incidental Harassment Authorization
5-8 October 2017
procedure and continued visual observation during activity for the presence of mammals. Noise producing activity will also be verified in the field at the initiation of Year 2 work activity. These mitigation measures would continue to be implemented to decrease the likelihood that marine mammals would be exposed to sound pressure levels that would cause Level B harassment. The Navy has also quantified the potential for Level A or injurious harassment (PTS Zone) as defined by the MMPA. As discussed further in this application, the Navy expects limited Level A takes due to review of work activity, continued implementation of work shutdown zones and calculation of estimated disturbance levels utilizing the SELcum metric from the 2016 Acoustic Guidance. For this application the Navy is requesting one Harbor Porpoise take.
5.2 Method of Incidental Taking Construction activities associated with the Project as outlined in Sections 1 and 2 have the potential to disturb or displace small numbers of marine mammals. Specifically, only underwater sounds generated from pile-driving activities (impact/vibratory pile installation, extraction, and drilling) may result in “take” in the form of Level B harassment (behavioral disturbance) or based on the new guidance criteria, potentially injurious take under Level A harassment. Level A harassment takes are not anticipated due to the mitigation measures in place to restrict construction activity should a mammal enter the shutdown zones discussed in the 2017 IHA. One level A “take” of Harbor Porpoise is estimated for 2018 related to impact hammer use. The attenuation distance to the isopleth is 140m which is within the B zone, but outside of our 75’ shutdown zone. Level B harassment is not anticipated from airborne sounds generated during pile installation or during other construction activities (see Section 6.3.4 below). Measures designed to minimize the possibility of injury to marine mammals have been developed. Specifically, use of vibratory hammers and drilling would be the primary methods of installation and are not expected to cause injury to marine mammals due to these methods’ relatively low source levels (≤ 180 dB re 1µPa rms). Also, pile driving would either not start or be halted if marine mammals approach the shutdown zone. See Section 11 for more details on the impact reduction and mitigation measures proposed. Furthermore, the pile-driving activities analyzed are similar to other construction activities which have occurred and been acoustically monitored along the East Coast and within Washington State and California, which have taken place with no reported injuries or mortality to marine mammals (e.g., ICF Jones and Stokes and Illingworth and Rodkin, Inc. 2012; and Navy Pile-Driving Noise Measurements Final Report January 2017). The contractor has also completed initial acoustic monitoring for Year 1 activity, a summary report is included in Appendix A. Chapter 6 discusses the numbers of takes requested for the marine mammal species in the Project area for this IHA.

Waterfront Improvement Projects at Portsmouth Naval Shipyard Request for an Incidental Harassment Authorization
6-1 October 2017
6 Number and Species Exposed
6.1 Introduction The NOAA Fisheries Service application for IHAs requires applicants to determine the number of marine mammals that are expected to be incidentally harassed by an action and the nature of the harassment (Level A or Level B). Section 5 defines MMPA Level A and Level B harassment. This section presents how these definitions informed the quantitative acoustic analysis methodologies used to assess the potential for the Proposed Action to affect marine mammals. The construction activities for the waterfront improvement projects outlined in Sections 1 and 2 have the potential to take marine mammals by Level B harassment only, primarily as a result of noise produced by in-water pile driving, extraction, and drilling. Other construction activities are not expected to result in takes as defined under the MMPA. In-water pile driving would temporarily increase the local underwater noise environment in the vicinity of the Project area. Research and review of the 2016 acoustical impacts guidance suggests that increased noise may impact marine mammals in several ways, dependent on many factors (see Section 7 for additional discussion). The following sections provide a background on underwater sound, description of noise sources in the Project area, applicable noise criteria, and the basis for the calculation to preclude take by Level A and quantify take by Level B harassment.
6.2 Fundamentals of Sound Sound is a physical phenomenon consisting of regular pressure oscillations that travel through a medium, such as air or water. Sound frequency is the rate of oscillation, measured in cycles per second, or Hz. The amplitude (loudness) of a sound is its pressure, whereas its intensity, or power, is its pressure squared. The standard international unit of measurement for pressure is the Pascal, which is a force of 1 Newton exerted over an area of 1 square meter; sound pressures are measured in micro Pascals (μPa). Due to the wide range of pressure and intensity encountered during measurements of sound, a logarithmic scale is used, based on the decibel, which, for sound intensity, is 10 times the log10 of the ratio of the measurement to reference value. For sound pressure level (SPL), the amplitude ratio in dB is 20 times the log10 ratio of measurement to reference. Hence, each increase of 20 dB in SPL reflects a 10-fold increase in signal amplitude (whether expressed in terms of pressure or particle motion). That is, 20 dB means 10 times the amplitude, 40 dB means 100 times the amplitude, 60 dB means 1,000 times the amplitude, and so on. Because the dB is a relative measure, any value expressed in dB is meaningless without an accompanying reference. In describing underwater sound pressure, the reference amplitude is usually 1 μPa and is expressed as “dB re 1 μPa.” For in-air sound pressure, the reference amplitude is usually 20 μPa and is expressed as “dB re 20 μPa.” The method commonly used to quantify airborne sounds consists of evaluating all frequencies of a sound according to a weighted filter that mimics human sensitivity to amplitude as a function of frequency. This is called A-weighting, and the decibel level measured is called the A-weighted sound level (dBA). Table 6-1 summarizes commonly used terms to describe underwater sounds. Two common descriptors are the instantaneous peak SPL and the root mean square (RMS) SPL. The peak pressure is the instantaneous maximum or minimum overpressure observed during each pulse or sound event and is presented in dB re 1 μPa. The RMS level is the square root of the mean of the squared pressure level (intensity) as measured over a specified time period.

Waterfront Improvement Projects at Portsmouth Naval Shipyard Request for an Incidental Harassment Authorization
6-2 October 2017
Table 6-1 Definition of Acoustical Terms
Term Definition Decibel, dB A unit describing the amplitude of sound, equal to 20 times the logarithm to the base 10 of
the ratio of the pressure of the sound measured to the reference pressure. The reference pressure for water is 1 micro Pascal (μPa) and for air is 20 μPa (approximate threshold of human audibility).
Sound Pressure Level, SPL
Sound pressure is the force per unit area, usually expressed in μPa (or 20 micro Newtons per square meter), where 1 Pascal is the pressure resulting from a force of 1 Newton exerted over an area of 1 square meter. The sound pressure level is expressed in decibels (dB) as 20 times the logarithm to the base 10 of the ratio between the pressure exerted by the sound to a reference sound pressure. Sound pressure level is the quantity that is directly measured by a sound level meter.
Frequency, Hz Frequency is expressed in terms of oscillations, or cycles, per second. Cycles per second are commonly referred to as hertz (Hz). Typical human hearing ranges from 20 Hz to 20,000 Hz.
Peak Sound Pressure (unweighted), dB re 1 μPa
Peak sound pressure level is based on the largest absolute value of the instantaneous sound pressure over the frequency range from 20 Hz to 20,000 Hz. This pressure is expressed in this application as dB re 1 μPa.
Root Mean Square (RMS), dB re 1 μPa
The RMS level is the square root of the energy divided by a defined time period. For pulses, the RMS has been defined as the average of the squared pressures over the time that comprises that portion of waveform containing 90 percent of the sound energy for one impact pile-driving impulse.
Sound Exposure Level (SEL), dB re 1 μPa2 sec
Sound exposure level is a measure of energy. Specifically, it is the dB level of the time integral of the squared-instantaneous sound pressure, normalized to a 1-second period. It can be an extremely useful metric for assessing cumulative exposure because it enables sounds of differing duration to be compared in terms of total energy.
Waveforms, μPa over time
A graphical plot illustrating the time history of positive and negative sound pressure of individual pile strikes shown as a plot of μPa over time (i.e., seconds).
Frequency Spectra, dB over frequency
A graphical plot illustrating the 6 to 12 Hz band-center frequency sound pressure over a frequency range (e.g., 10 to 5,000 Hz in this application).
A-Weighted Sound Level, dBA
The sound pressure level in decibels as measured on a sound level meter using the A- or C-weighting filter network. The A-weighting filter de-emphasizes the low and high frequency components of the sound in a manner similar to the frequency response of the human ear and correlates well with subjective human reactions to noise.
Ambient Noise Level
The background sound level, which is a composite of noise from all sources near and far, that serves as the baseline or existing level of environmental noise at a given location.
6.3 Effects of Pile-installation Activities
6.3.1 Description of Noise Sources Underwater sound levels are composed of multiple sources, including physical noise, biological noise, and anthropogenic noise. Physical noise sources include waves at the surface, earthquakes, ice movement, and atmospheric noise. Biological noise includes sounds produced by marine mammals, fish, and invertebrates. Anthropogenic noise consists of noise sources such as vessels (small and large), dredging, aircraft overflights, and construction activities. Known noise levels and frequency ranges associated with anthropogenic sources similar to the vessels and equipment that would be used for the Project are summarized in Table 6-2. Details of each of the sources are described in the following text.

Waterfront Improvement Projects at Portsmouth Naval Shipyard Request for an Incidental Harassment Authorization
6-3 October 2017
Table 6-2 Representative Noise Levels of Anthropogenic Sources
Noise Source Frequency Range
(Hz)1 Underwater Noise Level
(dB re 1 uPa)2 Reference Small vessels 250-1,000 151 dB rms at 1 meter (m) Richardson et al. 1995 Tug docking of a gravel barge
200-1,000 149 dB rms Blackwell and Greene 2002
Vibratory driving of 30-inch steel pipe pile
10-1,500 ~168 dB rms at 10m WSDOT 2010a, 2010b
Impact driving of 30-inch steel pipe pile
10-1,500 ~193 dB rms at 10m WSDO 2005, 2008; Caltrans 2007; Reyff 2005
Impact driving of 36-inch steel pipe pile
10-1,500 195 dB rms at 10m Hastings and Popper 2005
1 These are the dominant frequency ranges but there is often considerable energy outside these ranges. 2 These are average source SPLs at a particular location; site-specific bathymetry and substrate will affect SPLs.
In-water construction activities associated with the Project would include impact pile driving, drilling, and vibratory pile driving. The sounds produced by these activities fall into one of two sound types: impulsive and non-impulsive (defined below). Impact pile driving produces pulsed sounds, while vibratory pile driving produce non-pulsed (or continuous) sounds. The distinction between these two general sound types is important because they have differing potential to cause physical effects, particularly with regard to hearing (e.g., Ward 1997 as cited in Southall et al. 2007). Impulsive or pulsed sounds (e.g., explosions, gunshots, sonic booms, seismic airgun pulses, and impact pile driving) are brief, broadband, atonal transients (American National Standards Institute 1986; Harris 1998) and occur either as isolated events or are repeated in some succession (Southall et al. 2007). Pulsed sounds are characterized by a relatively rapid rise from ambient pressure to a maximal pressure value followed by a decay period that may include a period of diminishing, oscillating maximal and minimal pressures (Southall et al. 2007). Pulsed sounds generally have increased capacity to induce physical injury compared to sounds that lack these features (Southall et al. 2007). Non-impulsive (intermittent or continuous sounds) can be tonal, broadband, or both (Southall et al. 2007). Some non-impulsive sounds can be transient signals of short duration but without the essential properties of pulses (e.g., rapid rise time) (Southall et al. 2007). Examples of sources of non-impulsive sounds include vessels, aircraft, machinery operations such as drilling or dredging, vibratory pile driving, and active sonar systems (Southall et al. 2007). The duration of such sounds, as received at a distance, can be greatly extended in highly reverberant environments (Southall et al. 2007).
6.3.2 Sound Exposure Criteria and Thresholds Under the MMPA, NOAA Fisheries Service has defined levels of harassment for marine mammals. Level A harassment is defined as “Any act of pursuit, torment, or annoyance which has the potential to injure a marine mammal or marine mammal stock in the wild.” Level A harassment is assumed to result in a “stress response” and permanent threshold shift (PTS). The stress response per se is not considered injury but refers to an increase in energetic expenditure that is a result of exposure to the stressor and that is predominantly characterized by either the stimulation of the sympathetic nervous system or the hypothalamic-pituitary-adrenal axis (Reeder and Kramer 2005). The presence and magnitude of a stress response in an animal depends on the animal’s life history stage,

Waterfront Improvement Projects at Portsmouth Naval Shipyard Request for an Incidental Harassment Authorization
6-4 October 2017
environmental conditions, reproductive state, and experience with the stressor (Department of the Navy 2010a). The Navy considers permanent hearing loss suffered by a marine mammal from pile driving activity to be a PTS or Level A harassment situation. Level B harassment is defined as “Any act of pursuit, torment, or annoyance which has the potential to disturb a marine mammal or marine mammal stock in the wild by causing disruption of behavioral patterns, including but not limited to migration, breathing, nursing, breeding, feeding or sheltering.” Level A Exposure: In August of 2016 a revised guidance on the methods utilized to determine Level A harassment was issued. When issuing the final 2017 IHA for the project, NMFS utilized the new guidance criteria for the updated PTS onset thresholds associated with impulsive peak sound pressure and cumulative sound exposure level (SELcum) metric using the Optional User Spreadsheet. The new Guidance metric indicated that there is a greater likelihood of auditory injury for phocid pinnipeds (seals) and for high-frequency cetaceans (harbor porpoise). The new guidance methods were utilized to calculate an estimated Level A take for the species of concern for the project area. The acoustic thresholds in the 2016 Technical Guidance (i.e., expressed as SELcum) now take into account the duration, as well as level of exposure, and hearing thresholds for the species of interest. The guidance is based on a technical report completed by J.J. Finneran (Auditory weighting functions and TTS/PTS exposure functions for marine mammals exposed to underwater noise May 2016) which covers a study completed on marine mammals exposed to both impulsive and non-impulsive sources, inclusive of the duration of time those marine mammals are exposed. As noted above the year 1 IHA included calculations for Level A harassment based on this guidance utilizing the user spreadsheet noted in appendix D of the guidance. The Year 1 estimates were based on engineering data as sufficient data had not yet been gathered for this project. This application will also utilize the 2016 guidance Appendix D User Spreadsheet to estimate potential behavioral and injurious takes, however construction experience, equipment specifications and the known to date project schedule will be utilized to better estimate takes. The input data for the spreadsheet utilizes contractor “real time” information and manufacturer specifications for equipment planned to be utilized. The following table (Table 6-3) lists the PTS Onset Acoustic Thresholds determined in the 2016 Guidance which were used to calculate PTS onset for the mammal for a given activity in this application.

Waterfront Improvement Projects at Portsmouth Naval Shipyard Request for an Incidental Harassment Authorization
6-5 October 2017
Table 6-3: Level A or PTS Onset Acoustic Thresholds from 2016 Guidance
Hearing Group Impulsive (Impact) Non- Impulsive (Vibratory) HF – High Frequency Cetaceans (harbor porpoises)
Lpk, flat: 202 dB LE, HF, 24hr: 155dB
LE, HF, 24h: 173dB
PW – Phocid Pinnipeds LPK: 218dB LE, HF, 24 hr: 185dB
LE, HF, 24h: 201dB
* Dual metric acoustic thresholds for impulsive sounds: Use whichever results in the largest isopleth for calculating PTS onset. If a non-impulsive sound has the potential of exceeding the peak sound pressure level thresholds associated with impulsive sounds, these thresholds should also be considered. Note: Peak sound pressure (Lpk) has a reference value of 1 μPa, and cumulative sound exposure level (LE) (SELcum as noted elsewhere in document) has a reference value of 1μPa2s. In this table, thresholds are abbreviated to reflect American National Standards Institute standards (ANSI 2013). However, peak sound pressure is defined by ANSI as incorporating frequency weighting, which is not the intent for this Technical Guidance. Hence, the subscript “flat” is being included to indicate peak sound pressure should be flat weighted or unweighted within the generalized hearing range. The subscript associated with cumulative sound exposure level thresholds indicates the designated marine mammal auditory weighting function (HF cetaceans, and PW pinnipeds) and that the recommended accumulation period is 24 hours. The cumulative sound exposure level thresholds could be exceeded in a multitude of ways (i.e., varying exposure levels and durations, duty cycle). When possible, it is valuable for action proponents to indicate the conditions under which these acoustic thresholds will be exceeded. **2016 Acoustical Guidance Level B Exposure: Behavioral harassment (Level B) is considered to have occurred when marine mammals are exposed to sounds at or above 160 dB rms for impulsive sounds (e.g., impact pile driving) and 120 dB rms for non-impulsive sounds (e.g., vibratory pile driving or drilling) but below injurious thresholds (see Table 6-4). Behavioral harassment may or may not result in a stress response. The criteria for vibratory pile driving would also be applicable to vibratory pile extraction. The application of the 120 dB rms threshold can sometimes be problematic because this threshold level can be either at or below the ambient noise level of certain locations. As a result, these levels are considered precautionary (NOAA Fisheries Service 2009, 74 FR 41684). Table 6-4: Level B: Disturbance Thresholds for Underwater Sounds (* Year 1 estimated data) Marine Mammal Functional Hearing Group
Vibratory Pile Driving and Drilling Criteria
(Non-Pulsed/Non-impulsive sound)
Underwater Impact Pile Driving Criteria
(pulsed sounds re 1mPa)
High Frequency Cetaceans (harbor porpoises)
120dB rms 160 dB rms
Phocid Pinnipeds (seals)
120 dB rms 160 dB rms
Attenuation Distance to Threshold
7.35km(4.57mi) 0.293 km

Waterfront Improvement Projects at Portsmouth Naval Shipyard Request for an Incidental Harassment Authorization
6-6 October 2017
Description of Calculation: The activity proposed for 2018 as addressed in this application is considered a stationary, continuous source. Use of the impact hammer is considered impulsive; vibratory hammer is non-impulsive based on the definitions from the 2016 guidance, see also Tables 6-5 and 6-6 below. To be conservative the following method from the guidance is used in this application and is the same as information and methods provided in the Year 1 application Addendum as no new data has yet to be tabulated from Year 1 operations. The 2016 guidance states: “An alternative approach is to calculate the accumulated isopleth associated with a stationary sound source within a 24-h period. For example, if vibratory pile driving was expected to occur over ten hours within a 24-h period, then the isopleth would be calculated by adding area with each second the source is producing sound. This is a highly conservative means of calculating an isopleth because it assumes that animals on the edge of the isopleth (in order to exceed a threshold) will remain there for the entire time of the activity.” Table 6-5: Radii to PTS Isopleths from Vibratory Pile Installation and Drilling Operations
A: Stationary Source: Non-Impulsive, Continuous
Value Input Source
Source Level (RMS SPL)
163 ICF Jones & Stokes and Illingworth & Rodkin, Inc. 2009;
2012
Activity Duration (hours) within 24-h
period
4 Use/run time estimate in hours
Activity Duration (seconds)
99900
1665VPM*60 sec/min
10 Log 56.02 Calculation Propagation (xLogR) 15 standard
Distance of source level measurement
(meters)
10 Standard
Resultant Isopleth Hearing Group
Low-Frequency Cetaceans
Mid-Frequency Cetaceans
High-Frequency Cetaceans
Phocid Pinnipeds
Otariid Pinnipeds
SELcum Threshold (dB)
199 198 173 201 219
PTS Isopleth to threshold (meters)
23.4 2.1 34.6 14.2 1.0

Waterfront Improvement Projects at Portsmouth Naval Shipyard Request for an Incidental Harassment Authorization
6-7 October 2017
NOTE: The Contractor utilized the expected number of pile to be driven per day utilizing the vibratory hammer and the pulses per hour based on VPM of the equipment to be utilized. This is estimated for use of the vibratory hammer only. 2.5 kHz was utilized as a weighting factor per the guidance in the User Spreadsheet.
Table 6-6 Radii to PTS Isopleths from Impact Hammer Pile Driving
E.1-2: ALTERNATIVE METHOD (SINGLE STRIKE EQUIVALENT)
Value Input source
Unweighted SELcum (at measured
distance) = SELss + 10 Log (# strikes)
199.1 Calculation
Source Level (Single Strike/shot SEL)
171 Caltrans 2015
a) Number of strikes in 1 h OR b) Number of strikes per pile•
160 per pile
40BPM with 4 minutes per pile
a) Activity Duration (h) within 24-h period OR b) Number of
piles per day•
4 4 pile/day
Propagation (xLogR) 15 Standard
Distance of single strike SEL measurement (meters)⁺
10 Standard
RESULTANT ISOPLETH
Hearing Group
Low-Frequency Cetaceans
Mid-Frequency Cetaceans
High-Frequency Cetaceans
Phocid Pinnipeds
Otariid Pinnipeds
SELcum Threshold
(dB)
183 185 155 185 203
PTS Isopleth to threshold (meters)
117.5 4.2 140 62.9 4.6
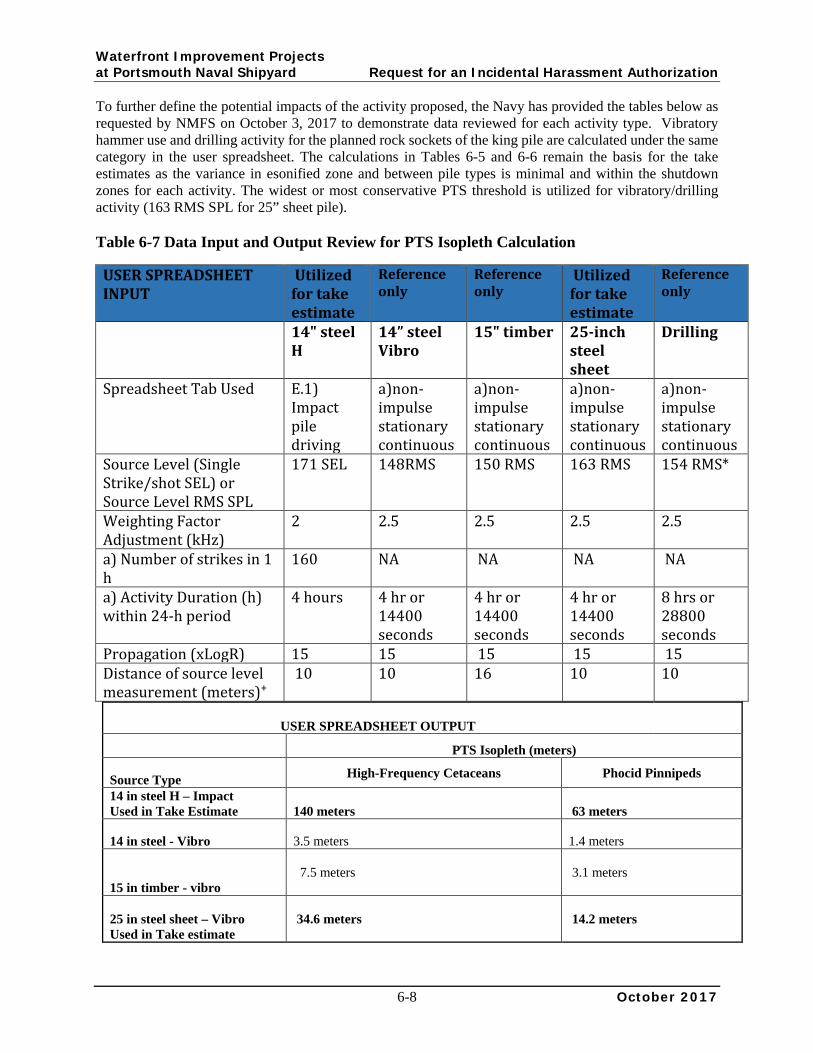
Waterfront Improvement Projects at Portsmouth Naval Shipyard Request for an Incidental Harassment Authorization
6-8 October 2017
To further define the potential impacts of the activity proposed, the Navy has provided the tables below as requested by NMFS on October 3, 2017 to demonstrate data reviewed for each activity type. Vibratory hammer use and drilling activity for the planned rock sockets of the king pile are calculated under the same category in the user spreadsheet. The calculations in Tables 6-5 and 6-6 remain the basis for the take estimates as the variance in esonified zone and between pile types is minimal and within the shutdown zones for each activity. The widest or most conservative PTS threshold is utilized for vibratory/drilling activity (163 RMS SPL for 25” sheet pile). Table 6-7 Data Input and Output Review for PTS Isopleth Calculation
USER SPREADSHEET INPUT
Utilized for take estimate
Reference only
Reference only
Utilized for take estimate
Reference only
14" steel H
14” steel Vibro
15" timber 25-inch steel sheet
Drilling
Spreadsheet Tab Used E.1) Impact pile driving
a)non-impulse stationary continuous
a)non-impulse stationary continuous
a)non-impulse stationary continuous
a)non-impulse stationary continuous
Source Level (Single Strike/shot SEL) or Source Level RMS SPL
171 SEL 148RMS 150 RMS 163 RMS 154 RMS*
Weighting Factor Adjustment (kHz)
2 2.5 2.5 2.5 2.5
a) Number of strikes in 1 h
160 NA NA NA NA
a) Activity Duration (h) within 24-h period
4 hours 4 hr or 14400 seconds
4 hr or 14400 seconds
4 hr or 14400 seconds
8 hrs or 28800 seconds
Propagation (xLogR) 15 15 15 15 15 Distance of source level measurement (meters)⁺
10 10 16
10 10
USER SPREADSHEET OUTPUT
PTS Isopleth (meters)
Source Type High-Frequency Cetaceans Phocid Pinnipeds
14 in steel H – Impact Used in Take Estimate
140 meters
63 meters
14 in steel - Vibro 3.5 meters 1.4 meters
15 in timber - vibro
7.5 meters
3.1 meters
25 in steel sheet – Vibro Used in Take estimate
34.6 meters
14.2 meters

Waterfront Improvement Projects at Portsmouth Naval Shipyard Request for an Incidental Harassment Authorization
6-9 October 2017
Drilling (8 hours/day) within Shutdown Zone * utilizing 163dB RMS value 54.9 meters 22.6 meters
Daily ensonified area (km2) Level A zone
14 in steel H - impact
140m = 0.14km; 0.0615km2
63m = 0.063km; 0.0125km2
14 in steel H - vibro 3.5m = 0.0035km; 11.483 ft; 414.038 sq ft 1.4m = 0.0014km; 4.594 ft or 66.269 sq ft
15 in timber - vibro
7.5m = 0.0075km; 0.00018 km2 or 1937.5 sq ft
1.9m = 0.0019km or 6.233 ft; 121.990 sq ft
Drilling * utilizing 163 dB RMS
54.9m=0.0549km; 0.0095 km2
22.6m = 0.0226km; 0.0016 km2
25 in steel sheet - vibro
34.6m=0.0346km; 0.0038 km2
14.2m = 0.014km; 0.00062km2
* While 154 dB RMS is shown for drilling activity, take estimates and calculation of the ensonified area have been based on 163 dB RMS (vibratory drilling) as these activities may run concurrently. Acoustic data gathered to date for Year 1 activity has been compiled in a summary report included in Appendix A. The results indicate background acoustics did serve to mask the use of the vibratory hammer indicating through those initial readings that the Level A threshold for harassment is well within the shutdown zone currently being implemented. Impact hammer use is minimal through the course of the project and has only been monitored during one pile installation event. This data has been reviewed in estimating take calculations for 2018 (Year 2) as well as observational data gathered throughout Year 1 construction activity. As observations for Year 1 have noted a higher number of harbor seal level B takes than predicted by the calculation model used in both Year 1 estimates and in this application, the Navy has opted to maintain the Shutdown zones at 75m (impact hammer) and 55m (vibratory /drilling) and request a slightly higher take for harbor and gray seals than modeling predicts as a result of field observation of their behavior. For the purpose of the estimates and utilization of the NMFS user spreadsheet, the higher source levels for impact hammer and vibratory hammer were utilized in the take estimates described below. The table 6-7 above notes those values utilized. Acoustic monitoring reports included in Appendix A discuss the field conditions which may contribute to the variations in Isopleths and esonified zones from the user spreadsheet calculation.
6.3.3 Limitations of Existing Noise Criteria The 2016 guidance was reviewed in developing the take estimates for this application which is the most recent noise criteria recommended by NMFS to determine Level A or injurious impacts. To date, there is no research or data supporting a response by pinnipeds or high frequency cetaceans to sounds from vibratory pile driving as low as the 120 dB rms threshold considered for behavioral impacts. It should be noted in this application that the guidance does not recommend use of the SELcum metric for measurement of noise from concurrent sources. Pile driving activity associated with this project may be concurrent due to planned construction schedule, however zones will be determined from individual activity

Waterfront Improvement Projects at Portsmouth Naval Shipyard Request for an Incidental Harassment Authorization
6-10 October 2017
(vibratory, impact, drilling for rock sockets) acoustic data during Year 1 operations. Until that time, and for the purposes of this application, potential take estimates will be determined utilizing the SELcum metric as noted in the 2016 guidance and the user spreadsheet provided in that guidance. (Technical Guidance for Assessing the Effects of Anthropogenic sound on Marine Mammal Hearing; NOAA Technical Memorandum NMFS-OPR-55 July 2016). During Year 2 activity, proposed under this IHA application, concurrent work utilizing a vibratory hammer during drilling operations is possible. This potential concurrent activity could occur during installation of the rock sockets for approximately 16 days. The vibratory hammer may be working to install SOE sheets or H-Pile as the drilling work is being conducted. Based on guidance from studies and data from WSDOT, if the source levels of the two respective activities differ by more than 10db, the higher of the two is to be used in calculating the respective ZOIs (WSDOT 2012). It has been determined through initial field data that the use of the vibratory hammer is generally greater than 10dB above the drilling activity. As is consistent with the Year 1 application and take estimates, the Vibratory hammer source levels have been utilized to determine the ZOI. However, should it be determined the dB differs by less than 10dB, the following method will be utilized to calculate the ZOI. To account for any overlapping noise fields, the Contractor will incorporate a multiplier to account for addition of the noise source. The multiplier will be calculated based on existing acoustic data for each individual source. The Level A and Level B zones will then be calculated for the concurrent activity based on the inclusion of the additional dB level as follows: MULTIPLE SOUND LEVEL ADDITION (Kinsler et al., 2000)
When two sound levels differ by the dB in the left column, add the dB in the right column to the higher level (dB) and proceed with calculation of the respective zones.
0–1 dB .................................. 3
2–3 dB .................................. 2
4–9 dB .................................. 1
>10 dB .................................. 0
The Year 1 IHA categorized drilling and vibratory hammer use as similar activities under stationary, non-impulsive, intermittent source. The Contractor will utilize field acoustic data obtained on both the vibratory hammer use and drilling activity to apply the above weighting factors for calculation of a slightly larger ZOI for concurrent activity. Concurrent vibratory and impact hammer use is not expected to occur. The vibratory hammer source level has been utilized to account for concurrent use during drilling activity as the difference between the two is greater than 10dB.
6.3.4 Ambient Noise Ambient noise by definition is background noise, and it has no single source or point. Ambient noise varies with location, season, time of day, and frequency. Ambient noise is continuous but with much variability on time scales ranging from less than 1 second to 1 year (Richardson et al. 1995). Ambient underwater noise at the Project area is widely variable over time due to a number of natural and anthropogenic sources. Sources of naturally occurring underwater noise include wind, waves, precipitation, and biological noise (such as shrimp, fish, and cetaceans). There is also human-generated noise from ship or boat traffic and other mechanical means (Urick 1983). Anthropogenic sources of underwater noise at industrial waterfronts could come from cranes, generators, and other types of mechanized equipment on wharves or the adjacent shoreline. As noted previously in this application an ambient air noise study was completed in preparation for Year 1 activity (ESS Group, Inc. 2015). The readings completed during that one day of monitoring were low in comparison to what was completed for this, Year 2, application. During the initial stages of actual construction activity in Year 1, background noise was recorded and found to be closer to 130 Lpeak

Waterfront Improvement Projects at Portsmouth Naval Shipyard Request for an Incidental Harassment Authorization
6-11 October 2017
dB re 1µPa during most activities. Results from the initial acoustic surveys for Year 1 construction activity are included in Appendix A.
6.4 Distance to Sound Thresholds
6.4.1 Underwater Sound Propagation Formula Pile driving would generate underwater noise that potentially could result in disturbance to marine mammals in and near the Project area. Transmission loss (TL) underwater is the decrease in acoustic intensity as an acoustic pressure wave propagates out from a source. TL parameters vary with frequency, temperature, sea conditions, current, source and receiver depth, water depth, water chemistry, and bottom composition and topography. The formula for transmission loss is:
TL = B * log10(R) + C * R, where B = logarithmic (predominantly spreading) loss
C = linear (scattering and absorption) loss R = range from source in meters
For underwater calculations in this assessment, linear loss (C) was not used (i.e. C=0), and transmission loss was calculated using only logarithmic spreading. Therefore, the revised formulas for transmission loss were as follows:
1. Cylindrical Spreading: TL = 10 log10 (R1/R0)
where: TL = transmission loss1 R1 = range at which NOAA Fisheries acoustic criteria is reached R0 = reference range (i.e., at 10 meters)
This transmission loss model is typically used for piles being driven in a water depth less than approximately 10 feet. The 14-inch steel H-type (sister) piles that would be driven using an impact hammer at Rail Beam R1 at Berths 11, 12, and 13 (shown on Figure 2-2) are to be driven in tidal conditions no greater than 11 ft of water depth. In response to NMFS guidance on October 3, 2017, the Navy has opted to utilize only the Practical Spreading loss model for all pile types and driving activity to provide a conservative approach. The majority of the work at Berth 11 is being completed in water less than 11 feet in depth during high tide, little to no water during mid and low tide. This calculation is shown for reference only.
2. Practical Spreading: TL = 15 log10 (R1/R0)
where:
TL = transmission loss R1 = range at which NOAA Fisheries acoustic criteria is reached R0 = reference range (i.e., at 10 meters)
This transmission loss model was used for the piles being driven (or drilled) in water depths of between approximately 10 and 50 feet. These pile types and sizes included:
1 Transmission Loss = source level – acoustic criteria threshold level

Waterfront Improvement Projects at Portsmouth Naval Shipyard Request for an Incidental Harassment Authorization
6-12 October 2017
• 25-inch steel sheet piles, which would be driven using a vibratory hammer at Berth 11 and for SOE.
• 14-inch steel H-type piles, which would be driven using vibratory hammer at Berth 11 and during SOE frame installation. H pile will be used to support or steel road plate in place to control sediment displacement.
• 15-inch timber piles, which would be installed using a vibratory hammer to reconstruct timber dolphins at the corner of Berths 11 and 12.
• 36-inch steel H-type (king) piles at Berth 11 which would be drilled and rock-socketed into the bedrock.
• 14-inch steel H-type pile (sister pile) being driven utilizing the impact hammer. There are 22 sister piles located along Berth 11 which will be installed utilizing both the vibratory and impact hammer as described in this application. It is noted that the sister pile are located in tidal areas and will be installed at low water as practical. High tide conditions result in no more than 11 feet of water.
This model was also used for piles extracted in water depths of 10 to 50 feet and included:
• 14-inch steel H-type piles, SOE system that would be extracted using a vibratory hammer at Berth 11.
• 15-inch timber fender piles, which would be extracted using a vibratory hammer at Berth 11 and the timber dolphin at the corners of Berths 11 and 12.
6.4.2 Underwater Noise from Pile Driving and Drilling The intensity of pile-driving sounds is greatly influenced by factors such as the type of piles, hammers, and the physical environment in which the activity takes place. A large quantity of literature regarding SPLs recorded from pile-driving projects is available for consideration. In order to determine reasonable SPLs and the associated effects on marine mammals that are likely to result from pile driving at the Shipyard, studies with similar properties to the Proposed Action were evaluated.
Pile Driving The Year 1 application included a review of source levels for the two pile-driving methods that are proposed for use during the project. This information was obtained from the “Compendium of Pile Driving Sound Data,” which is included as Appendix I to “Technical Guidance for Assessment and Mitigation of the Hydroacoustic Effects of Pile Driving on Fish” (ICF Jones & Stokes and Illingworth & Rodkin, Inc. 2012). The information presented in the compendium is a compilation of sound pressure levels recorded during various in-water pile-driving projects in California, Oregon, Washington, and Nebraska. The compendium is a commonly used reference document for pile-driving source levels when analyzing impacts on protected species, including marine mammals, from pile-driving activities. In addition, for this application, the contractor has reviewed the Final Report: Pile-Driving Noise Measurements at Atlantic Fleet Naval Installations: 28 May 2013 - 28 April 2016 for similarities in activity and verification that the estimated take calculations in this application are consistent with observations contained in that report. Source levels were collected for the four types of piles that would be installed and two pile-driving methods proposed for the Project:

Waterfront Improvement Projects at Portsmouth Naval Shipyard Request for an Incidental Harassment Authorization
6-13 October 2017
1. 14-inch steel H-type piles Used as sister piles and for SOE system installation; installed via vibratory hammer and seated as needed with impact hammer.
2. 15-inch timber piles Used for re-installation of dolphins at Berths 11, 12, and 13 and installed via vibratory hammer.
3. 25-inch steel sheet piles Used for the bulkhead at Berth 11 and for SOE installed via vibratory hammer.
Reference source levels for the Project were determined using data for piles of similar sizes, the same pile-driving method as that proposed for the Project, and at similar water depths. While the pile sizes and water depths chosen as proxies do not exactly match those for the Project, they are the closest matches available, and it is assumed that the source levels shown in Table 6-8 and Table 6-9 are the most representative for each pile type and associated pile-driving method. To reduce the dependence on a single data point for steel H piles taken from the summary tables in the front of the CALTRANS 2015 compendium, the Navy reviewed the compendium and used data from each specific project rather than from the summary tables to obtain average SEL and RMS values for H pile installation. To be sure all values were relevant to the site, the Navy eliminated all piles in waters greater than five meters, as well as all readings measured at ranges greater than 10 meters. The Navy used all H piles for which the diameter was not specified as well as the 14 to15-inch H piles, converted the dB measurements to a linear scale before averaging, and re-converted the average measurements to the appropriate dB units. Piles driven at this project site will be driven in 0-11 feet of water (0-3.4 meters). During low tide, piles will essentially be driven in the dry. This varies drastically from other Navy projects on the east coast, such as at Subase New London, where 14-inch H piles will be driven in water depths of 25 feet (7.62 meters).

Waterfront Improvement Projects at Portsmouth Naval Shipyard Request for an Incidental Harassment Authorization
6-14 October 2017
Table 6-8: Source Levels for In-Water Impact Hammer 14-inch Steel H-type (Sister) Piles
Pile Size and Type
Water Depth
Distance Measured
Peak RMS (dB) SEL (dB)
15- inch steel H pile
2-3 meters
10 187 164 154
15-inch steel H pile
2-3 meters
10 180 165 155
15-inch steel H pile
2-3 meters
10 194 177 170
Unspecified steel H pile
0.5-2 meters
10 172 160 147
14-inch steel H pile
1-5 meters
10 205 184 174
14-inch steel H pile
1-5 meters
10 206 182 172
14-inch steel H pile
1-5 meters
10 206 184 174
14-inch steel H pile
1-5 meters
10 210 190 180
14-inch steel H pile
1-5 meters
10 212 192 182
14-inch steel H pile
1-5 meters
10 210 189 179
14-inch steel H pile
1-5 meters
10 212 190 180
14-inch steel H pile
1-5 meters
10 205 190 180
14-inch steel H pile
1-5 meters
10 207 187 177
Unspecified steel H pile
0-0.9 meters
10 -- 151 142
Unspecified steel H pile
0-0.9 meters
10 -- 154 144
Unspecified steel H pile
0-0.9 meters
10 -- 170 159
Unspecified steel H pile
0-0.9 meters
10 -- 147 136
Unspecified steel H pile
0-0.9 meters
10 -- 147 136
Unspecified steel H pile
0-0.9 meters
10 -- 150 143
Unspecified steel H pile
0-0.9 meters
10 -- 153 142
Unspecified steel H pile
0-0.9 meters
10 -- 151 142
Unspecified steel H pile
0-0.9 meters
10 -- 156 146
Unspecified steel H pile
0-0.9 meters
10 -- 172 162
Unspecified steel H pile
0-0.9 meters
10 -- 161 150

Waterfront Improvement Projects at Portsmouth Naval Shipyard Request for an Incidental Harassment Authorization
6-15 October 2017
Unspecified steel H pile
0-0.9 meters
10 -- 155 145
Unspecified steel H pile
0-0.9 meters
10 -- 163 152
Unspecified steel H pile
0-0.9 meters
10 -- 178 145
Unspecified steel H pile
0-0.9 meters
10 -- 165 154
AVERAGES: 168.8 181.4 171.3
Source: Caltrans 2015 While the average RMS value is 181.4, the Navy rounded up to 182 dB RMS to be conservative since not all source levels above in Table 6-8 recorded RMS values.

Waterfront Improvement Projects at Portsmouth Naval Shipyard Request for an Incidental Harassment Authorization
6-16 October 2017
Table 6-9: Source Levels for In-Water Vibratory Hammer 25-inch Steel Sheet Piles, 20-inch Steel Sheet Piles and 15-inch Timber Piles
Pile Size and Pile Type
Water Depth
(m)
Distance Measured
(m) Peak (dB)
RMS (dB)
SEL (dB) Location
24-inch AZ* Steel Sheet1 15 10 177 163 162 Berth 23, Port of Oakland, CA
24-inch AZ Steel Sheet1 15 10 175 162 162 Berth 30, Port of Oakland, CA
24-inch AZ Steel Sheet1 15 10 177 163 163 Berth 35/37 Port of Oakland, CA
24-inch AZ Steel Sheet – Typical1
15 10 175 160 160 CA (Specific location unknown)
24-inch AZ Steel Sheet – Loudest1
15 10 182 165 165 CA (Specific location unknown)
24-inch AZ Steel Sheet (Average)1
15 10 178 163 163 CA (Specific Location unknown)
15-inch Timber Pile2 10 16 164 150 NP WSF Port Townsend Ferry Terminal, WA
14-inch H-type Pile3 6 10 155 145 145 CA (Specific Location unknown)
Source: 1 ICF Jones & Stokes and Illingworth & Rodkin, Inc. 2012. 2 WSDOT 2010. 3 WSDOT 2012 Note: All source levels are referenced to 1 microPascal (re 1 µPa) AZ refers to a specific sheet pile shape and interlock style Key: dB = decibel m = meter RMS = root mean square SEL = sound exposure level
Review of an east coast naval study for work completed at the Naval Station at Mayport included installation of 48-inch King Pile and 24-inch sheet pile to construct a retaining wall. The acoustic data within the report showed consistency with the above tables referencing west coast projects and information gathered for the Year 1 application. An APE 300 Vibratory Hammer was utilized for the Mayport project, which is similar to equipment being utilized at the PNSY Berth 11 rehabilitation project. In summary the report concluded the following for each pile type.
1. 48- Inch King Pile: The average levels for king pile installation ranged from 141 to 164 dB, with the overall average being 148 dB. The time to install a king pile ranged from 6 to 152 minutes (2.5 hours), with the average being 24 minutes. The average 10-second RMS SPL normalized to 10 meters was 149 dB.
2. 24-Inch Sheet Pile: The average levels for sheet pile installation ranged from 135 to 158 dB, with the overall average being 151 dB. The time to install sheet pile ranged from

Waterfront Improvement Projects at Portsmouth Naval Shipyard Request for an Incidental Harassment Authorization
6-17 October 2017
12 to 61 seconds, with an overall average of 21 seconds. The average 10-second RMS SPL normalized to 10 meters was 156 dB.
Also, the JEB Little Creek and Craney Island project was reviewed. This project included the installation and removal of various H-piles utilizing a vibratory hammer with similar results to those documented on the west coast. H-pile installation averaged 147dB and removal averaged 150dB both at 10 meters. For Year 1 work at PNSY Berth 11 the contractor has obtained initial acoustic readings for H-pile installation as noted in Appendix A, at 148dB 10 meters from vibratory driving associated with a 14” H-Pile. The exact source level for a given pile and pile-driving method largely depends not only on the pile size and water depth but also on site-specific conditions such as environmental and physical factors, including water temperature and sediment composition. Therefore, in this analysis, several source levels for each pile type and associated pile-driving method were averaged when multiple levels were available. These averaged source levels were used as inputs to determine transmission loss, which, in turn, was used in the propagation models described above. It should be noted that the source levels presented in the tables below do not take into account any mechanisms to attenuate the sound, such as a bubble curtain. The following analysis has been carried over from Year 1 with confirmative reviews of recent east coast studies. Appendix A includes a summary report of initial pile driving activity for the project completed during Year 1, however additional data is needed to statistically confirm zones of influence and acoustic impacts from each activity source.
Drilling Drilling is considered a continuous, non-impulsive noise source, similar to vibratory pile driving. Very little information is available regarding source levels of in-water drilling activities associated with nearshore pile installation such as that proposed for the Berths 11, 12, and 13 structural repairs project. Dazey et al. (2012) attempted to characterize the source levels of several marine pile-drilling activities. One such activity was auger drilling (including installation and removal of the associated steel casing). The average sound pressure levels re 1 µPa RMS were displayed for casing installation, auger drilling (inside the casing), and casing removal. For the purposes of this application, it is assumed that the casing installation and removal activities would be conducted in a manner similar to that described in Dazey et al. (2012), primarily via oscillation. These average source levels are reported in Table 6-10. IHA applications for other construction projects have reported that, due to a lack of information regarding pile-drilling source levels, it is generally assumed that pile drilling would produce less in-water noise than both impact and vibratory pile driving. Based on the general lack of information about these activities and the assumption that in-water noise from pile drilling would be less than either impact or vibratory pile driving, it is assumed that the source levels presented in Table 6-7 are the most applicable for acoustic impact analysis at Berths 11, 12, and 13. A source level of 163dB RMS SEL has been utilized in this application for take estimates associated with both vibratory hammer use and drilling activity.

Waterfront Improvement Projects at Portsmouth Naval Shipyard Request for an Incidental Harassment Authorization
6-18 October 2017
Table 6-10: Average Source Levels for Auger Drilling Activities During Pile Installation
Drilling Activity
Water Depth
(m)
Distance Measured
(m) RMS (dB) Location
Casing Installation 1-5 1 157 Bechers Bay Santa Rosa Island, CA
Auger Drilling 1-5 1 151 Bechers Bay Santa Rosa Island, CA
Casing Removal 1-5 1 152 Bechers Bay Santa Rosa Island, CA
Average Drilling Activity 1-5 1 154 Average Source: Dazey et al. 2012. Note: All source levels are referenced to 1 microPascal (re 1 µPa) Key: dB = decibel m = meter RMS = root mean square
Pile Extraction Vibratory pile extraction is considered an intermittent, non-impulsive noise source. Little information is available specific to vibratory extraction for most types of piles. The source level for timber-pile extraction was obtained from “Port Townsend Test Pile Project: Underwater Noise Monitoring Draft Final Report,” prepared by Jim Loughlin for the Washington State Department of Transportation Office of Air Quality and Noise (WSDOT 2010). Source levels for vibratory extraction of H-type piles were obtained from “Underwater Acoustic Measurements of Vibratory Pile Driving at the Pipeline 5 Crossing in the Snohomish River, Everett, Washington,” prepared by Greeneridge Science, Inc., for the City of Everett (Burgess et al. 2005). For vibratory pile extraction of the 24-inch steel sheet piles, the average value for the vibratory installation source levels from Table 6-9 was used. Sources including ICF Jones & Stokes and Illingworth & Rodkin, Inc. (2012) report the same values for vibratory installation and extraction, assuming that the two activities would produce similar source levels if water depth, pile size, and equipment remain constant. In addition, specific removal information was researched as noted in Table 6-11 for vibratory removal of the timber fender pile: 1. 15-inch timber fender piles Extracted via vibratory extractor at Berth 11 and the corner
of Berths 11 and 12.

Waterfront Improvement Projects at Portsmouth Naval Shipyard Request for an Incidental Harassment Authorization
6-19 October 2017
Table 6-11: Average Source Level for Vibratory Pile Extraction 15-inch Timber Fender Piles
Pile Size and Pile type Water depth
(m)
Distance Measured
(m) Peak (dB)
RMS (dB) Location
15-inch Timber Fender Pile1 10m 16m 164 150 WSF Port Townsend Ferry Terminal, WA
Notes 1 WSDOT 2010. 2 All source levels are referenced to 1 microPascal (re 1 µPa) Key: dB = decibel m = meter RMS = root mean square
Reference source levels for the Project were determined using data for piles of similar size, the same extraction method as that proposed for the Project, and at similar water depths. While the pile sizes and water depths chosen as proxies do not exactly match those for the Project, they are the closest matches available, and it is assumed that the source levels shown in Table 6-9 and 6-11 are representative of the vibratory pile installation and extraction method used for the Project.
Zones of Influence NOAA Fisheries has established disturbance and injury acoustic thresholds for marine mammals. A zone of influence (ZOI) is the in-water area in which sound from an in-water activity would exceed a particular threshold level. Determining a ZOI for each sound source is necessary to establish monitoring areas and to estimate the number of Level B takes (harassment). Attenuation distances to the NOAA Fisheries thresholds for Level B takes for pile driving are described in Table 6-12. These attenuation distances have been developed using the propagation models described in Section 6.4.1. Modeling was performed for each driving, drilling, installing, and removing activity described above using the depth-appropriate model. Activities that would result in the longest attenuation distances were selected as the worst-case sound exposure distances that would determine the ZOI for each project location. These worst-case sound exposure distances are shown in Table 6-12. Based on the 2016 guidance and data gathered, the widest ZOI would be the behavioral threshold. The 2016 guidance spreadsheet has been utilized to determine the Level A ZOI.
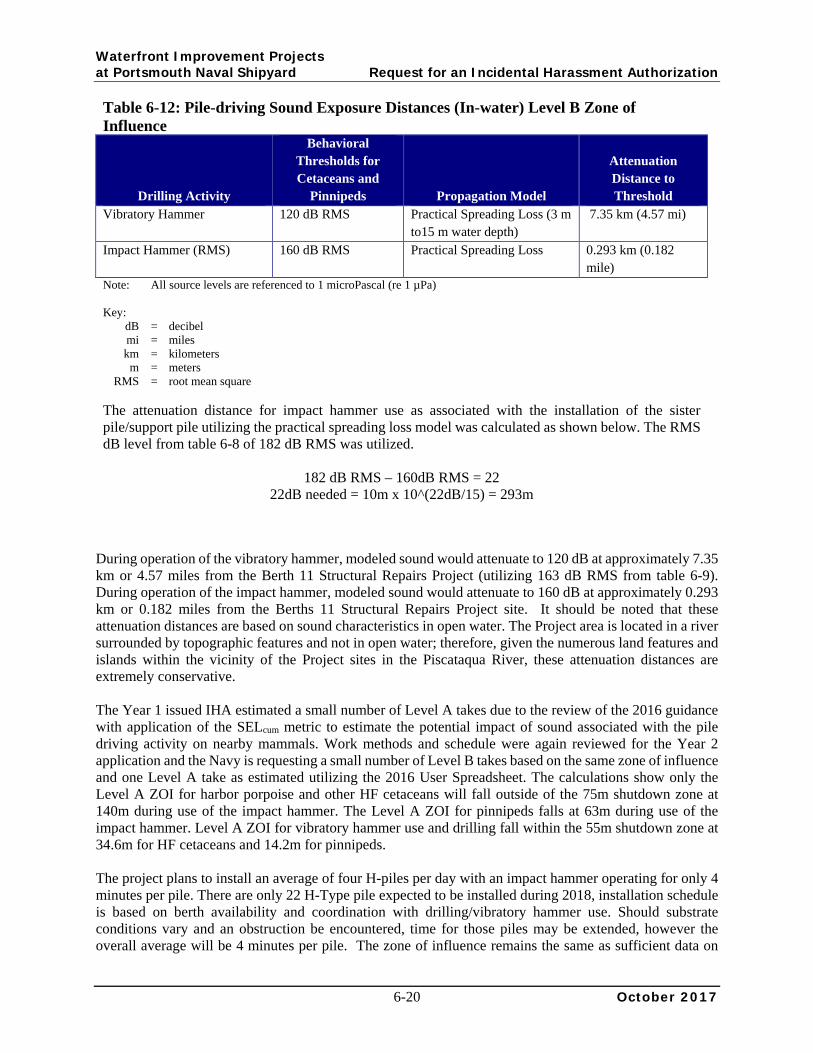
Waterfront Improvement Projects at Portsmouth Naval Shipyard Request for an Incidental Harassment Authorization
6-20 October 2017
Table 6-12: Pile-driving Sound Exposure Distances (In-water) Level B Zone of Influence
Drilling Activity
Behavioral Thresholds for Cetaceans and
Pinnipeds Propagation Model
Attenuation Distance to Threshold
Vibratory Hammer 120 dB RMS Practical Spreading Loss (3 m to15 m water depth)
7.35 km (4.57 mi)
Impact Hammer (RMS) 160 dB RMS Practical Spreading Loss 0.293 km (0.182 mile)
Note: All source levels are referenced to 1 microPascal (re 1 µPa) Key: dB = decibel mi = miles km = kilometers m = meters RMS = root mean square The attenuation distance for impact hammer use as associated with the installation of the sister pile/support pile utilizing the practical spreading loss model was calculated as shown below. The RMS dB level from table 6-8 of 182 dB RMS was utilized.
182 dB RMS – 160dB RMS = 22 22dB needed = 10m x 10^(22dB/15) = 293m
During operation of the vibratory hammer, modeled sound would attenuate to 120 dB at approximately 7.35 km or 4.57 miles from the Berth 11 Structural Repairs Project (utilizing 163 dB RMS from table 6-9). During operation of the impact hammer, modeled sound would attenuate to 160 dB at approximately 0.293 km or 0.182 miles from the Berths 11 Structural Repairs Project site. It should be noted that these attenuation distances are based on sound characteristics in open water. The Project area is located in a river surrounded by topographic features and not in open water; therefore, given the numerous land features and islands within the vicinity of the Project sites in the Piscataqua River, these attenuation distances are extremely conservative. The Year 1 issued IHA estimated a small number of Level A takes due to the review of the 2016 guidance with application of the SELcum metric to estimate the potential impact of sound associated with the pile driving activity on nearby mammals. Work methods and schedule were again reviewed for the Year 2 application and the Navy is requesting a small number of Level B takes based on the same zone of influence and one Level A take as estimated utilizing the 2016 User Spreadsheet. The calculations show only the Level A ZOI for harbor porpoise and other HF cetaceans will fall outside of the 75m shutdown zone at 140m during use of the impact hammer. The Level A ZOI for pinnipeds falls at 63m during use of the impact hammer. Level A ZOI for vibratory hammer use and drilling fall within the 55m shutdown zone at 34.6m for HF cetaceans and 14.2m for pinnipeds. The project plans to install an average of four H-piles per day with an impact hammer operating for only 4 minutes per pile. There are only 22 H-Type pile expected to be installed during 2018, installation schedule is based on berth availability and coordination with drilling/vibratory hammer use. Should substrate conditions vary and an obstruction be encountered, time for those piles may be extended, however the overall average will be 4 minutes per pile. The zone of influence remains the same as sufficient data on

Waterfront Improvement Projects at Portsmouth Naval Shipyard Request for an Incidental Harassment Authorization
6-21 October 2017
acoustic monitoring and visual observations of mammals in the area are still being gathered. This information will be presented in the reports to be submitted under Year 1 activity. The Navy also plans to continue to implement the shutdown zones as noted in the Year 1 approved IHA at 55m for Vibratory Hammer use and 75m for Impact hammer use for observation of High Frequency Cetaceans. The Navy will continue to implement and observe the established 75m and 55m shutdown zones to assure a conservative approach to minimizing injurious harm. These very small areas can easily be monitored for marine mammals, and mitigation measures will continue to be implemented to ensure that Level A takes are minimized. The behavioral observation ZOIs for each of the two separate sound sources (vibratory/drilling and impact hammers) at Berth 11 are shown on Figure 6-1. The Navy is not proposing to change these zones from 2017 IHA (Year 1) unless field data can support a reduction. The Navy recalculated the ZOI for impact hammer use utilizing the practical spreading loss model, per NMFS recommendation and as noted in Table 6-12. This reduced the zone from 1.58km to 0.293km. Figure 6-1 is revised showing both models. Work would occur in phases over several years. All of the construction-related in-water sound occurring within the waters of these ZOIs would exceed the designated NOAA Fisheries thresholds for behavioral take. Take associated with exceeding the PTS thresholds for each species are expected to be minimal based on implementation of mitigation measures including the shutdown zones and primary use of vibratory hammer pile installation methods. The ZOIs were used to calculate potential takes from each sound source and would be monitored during in-water work at Berth 11 to estimate actual harassment takes of marine mammals. The total area ensonified by these two sources is 0.36 square miles (mi2) (233.4 acres). Acoustical data from operations during Year 1 may allow for a smaller radius for the ZOI. The numerous topographic features present in and along the Piscataqua River would greatly limit the area that would be impacted from in-water sound. Sound from either source would be truncated with minimal attenuation. The ZOIs for Berth 11 have been determined using the entire length of the berth and the returns that would be constructed between the existing bulkhead and the new bulkhead. Due to the numerous islands and other land features at and around the site, the ZOIs for both the vibratory hammer and impact hammer are identical.

Waterfront Improvement Projects at Portsmouth Naval Shipyard Request for an Incidental Harassment Authorization
6-22 October 2017
6-1 Zone of Influence for Underwater Vibratory Hammer and Underwater Impact Hammer at Berth 11 (A, B, and C), Portsmouth Naval Shipyard

PortsmouthNaval
Shipyard
Goat Island
FreemansPoint
Path: \\prtbhp1\GIS\Buffalo\Portsmouth_Railway\Maps\MXD\Reports\IHA_Application\Figure_6-1_ZOI_120db_160db_Berth_11.mxd 10/27/2015
Figure 6-1Zone of Influence
for Underwater Vibratory Hammerand Underwater Impact Hammer
at Berth 11 (A, B, and C)Portsmouth Naval Shipyard
York County, Maine
Source: ESRI 2013; Department of Defense 2014.
Legend
Berth 11
Zone of Influence forUnderwater Vibratory Hammer
Zone of Influence forUnderwater Impact Hammer
4.57 mi (7.35 Km) Radius
0.98 mi (1.58 Km) Radius
Installation Area
W0 1,000 2,000 3,000 Feet
LLOHN
Rectangle
LLOHN
Text Box
Zone of Influence Impact Hammer 2018
LLOHN
Text Box
0.293 km; 0.182 miles
LLOHN
Oval
LLOHN
Line
LLOHN
Text Box
Note: Revised October 2017 to show impact hammer ZOI utilizing practical spreading loss model.

Waterfront Improvement Projects at Portsmouth Naval Shipyard Request for an Incidental Harassment Authorization
6-23 October 2017
No sound is expected to attenuate to the 120 dB rms threshold for vibratory pile driving because topographic features along the river would prevent attenuation to the full distance of 4.57 miles. The longest attenuation distance from the Project area would occur almost directly to the southeast where, during vibratory pile driving, sound would attenuate through the waters east of Pierce Island to meet land at Goat Island at a distance of 0.88 miles from the Project area (Figure 6-1).
Very little sound would reach the 160 dB RMS threshold at the fill distance of 0.984 miles (utilizing cylindrical spreading loss) for the impact hammer due to these topographical features. The longest attenuation distance from the Berth 11 Project site would again occur to the southeast where, during impact pile driving, sound would attenuate through the waters east of Pierce Island to the 160 dB threshold (a distance of 0.88 miles) at Goat Island (Figure 6-1). The practical spreading loss model would indicate attenuation to 160dB RMS at 0.183 miles or 961feet from the activity.
6.4.3 Airborne Sound from Pile Driving and Drilling Airborne sound impacts were considered in the Year 1 application with modeling indicating that airborne sound would not reach haul out locations with enough exposure to cause a Level B behavioral harassment. For the purposes of this Year 2 application, airborne sound is not considered further. Information provided in the Year 1 application is considered incorporated by reference. (Navy 2016 A - IHA Application).
6.4.4 Auditory Masking Natural and artificial sounds can disrupt behavior by masking, or interfering with a marine mammal’s ability to hear other sounds. Masking occurs when the receipt of a sound is interfered with by another coincident sound at similar frequencies and at similar or higher levels. If the second sound is manmade and disrupts hearing-related behavior such as communications or echolocation (Wartzok et al. 2003/04), it could be considered harassment under the MMPA. Noise can only mask a signal if it is within a certain “critical band” around the signal’s frequency and its energy level is similar or higher (Holt 2008). Noise within the critical band of a marine mammal signal will show increased interference with detection of the signal as the level of the noise increases (Wartzok et al. 2003, 2004). In delphinid subjects, for example, relevant signals needed to be 17 to 20 dB rms louder than masking noise at frequencies below 1 kHz in order to be detected and 40 dB greater at approximately 100 kHz (Richardson et al. 1995). It is important to distinguish temporary threshold shift (TTS) and permanent threshold shift (PTS), which persist after the sound exposure, from masking, which occurs during the sound exposure. Because masking (without a resulting threshold shift) is not associated with abnormal physiological function, it is not considered a physiological effect in this IHA application, but rather a potential behavioral effect.
Year 1 issued IHA includes behavioral observations for Level B areas which are determined by acoustic readings. Year 2 proposed operations will continue the mammal visual behavioral observation program.
The most intense underwater sounds expected to result from the Project are those produced by impact pile driving. Given that the energy distribution of pile driving covers a broad frequency spectrum, sound from these sources would likely be within the audible range of gray seals, harbor seals, hooded seals, and harp seals. Impact pile-driving activity is relatively short term, with rapid pulses occurring for approximately 4 minutes per pile. Vibratory pile driving is also relatively short term, with rapid oscillations occurring for approximately 15 minutes per pile. It is possible that impact and vibratory pile driving resulting from the Project may mask some acoustic signals that are relevant to the daily behavior of marine mammal species, but the short-term duration and limited areas affected make it very unlikely that fitness of individuals or stocks would be affected. Masking effects are, therefore, treated as negligible. Any masking event that could possibly rise to Level B harassment under the MMPA would occur concurrently within the zones of behavioral harassment already estimated for vibratory and impact pile driving, and which have already been taken into account in the exposure analysis.

Waterfront Improvement Projects at Portsmouth Naval Shipyard Request for an Incidental Harassment Authorization
6-24 October 2017
6-2 Seal Haul-out Site at Hicks Rocks

Path: \\prtbhp1\GIS\Buffalo\Portsmouth_Railway\Maps\MXD\Reports\IHA_Application\Figure_6-2_SealHaul_OutSite_HicksRocks.mxd 1/20/2016
Figure 6-2Seal Haul-Out Site at
Hicks RocksPortsmouth Naval Shipyard
York County, Maine
Source: ESRI 2013; Department of Defense 2014.
LegendInstallation Area
Seal Haul Out Site
Project Area
W0 250 500 750 1,000 Feet
ProjectLocation
Seal HaulOut Area

Waterfront Improvement Projects at Portsmouth Naval Shipyard Request for an Incidental Harassment Authorization
6-25 October 2017
6.5 Basis for Estimating Take by Harassment For Year 2 of the project, the Navy is seeking authorization for the potential taking of small numbers of harbor porpoises, gray seals, harbor seals, hooded seals, and harp seals near the Shipyard as a result of pile removal and pile driving during demolition and construction activities associated with the Project. The takes requested are expected to have no more than a minor effect on individual animals and no effect on the populations of these species. Level B takes have been estimated, and any effects experienced by individual marine mammals are expected to be limited to short-term disturbance of normal behavior or temporary displacement of animals near the source of the noise. Shut down zones and mitigation measures have been implemented to reduce risk of Level A takes. Year 2 work is identical to Year 1 work, in pile type and equipment use. Data gathered during implementation of Year 1 activity under the issued IHA will further define the Level B behavioral harassment zone. For purposes of this application, the initial full project ZOI (Level B) was determined by modeling issued in the Year 1 application. It was used to calculate the estimated Level B takes for Year 2 work. It is believed this is the most conservative approach.
6.5.1 Harbor Porpoise – High Frequency Cetacean Harbor porpoises may be present in the Project area year round, from April to December. Based on density data from the Navy Marine Species Density Database, their presence is highest in spring, decreases in summer, and slightly increases in fall. However, in general, the porpoises are known to occasionally occur in the river. Average density for the predicted seasons of occurrence was used to determine abundance of animals that could be present in the area for exposure, using the equation abundance = n * ZOI. Estimated abundance for harbor porpoises was 0.96/day. (Average density for spring, summer, and fall = 1.02.) Potential takes could occur if harbor porpoises move through the area on foraging trips during pile driving or extraction. Harbor porpoises that are taken could exhibit behavioral changes such as increased swimming speeds, increased surfacing time, or decreased foraging. Most likely, harbor porpoises may move away from the sound source and be temporarily displaced from waters near the construction areas. With the absence of any regular occurrence adjacent to the project site, potential takes by disturbance would have a negligible short-term effect on individual harbor porpoises and would not result in population-level impacts. As a precaution and through review of calculations completed utilizing methods discussed in the 2016 Acoustic Guidance, one Level A take has been estimated.
6.5.2 Gray Seal – Phocid Pinniped Gray seals may be present year-round in the project vicinity, with constant densities throughout the year. Gray seals are less common in the Piscataqua River than the harbor seal. Average density for the predicted seasons of occurrence was used to determine abundance of animals that could be present in the area for exposure, using the equation abundance = n * ZOI. Estimated abundance for gray seals was 0.21/day (average year-round density = 0.2202). Potential takes could likely involve gray seals that are moving through the area on foraging trips or to the downstream haul-out site as a result of underwater or airborne noise during pile-driving or extraction. Gray seals that are taken could exhibit behavioral changes such as increased swimming speeds, increased surfacing time, or decreased foraging. Most likely, gray seals may move away from the sound source and be temporarily displaced from waters near the construction areas. With the absence of any major rookeries and only one isolated haul-out site 1.5 miles from the Project area, potential takes by disturbance would have a negligible short-term effect on individual gray seals and would not result in population-level impacts.
6.5.3 Harbor Seal - Phocid Pinniped Harbor seals may be present year-round in the project vicinity, with constant densities throughout the year. Harbor seals are the most common pinniped in the Piscataqua River near the Shipyard. Average density for the predicted seasons of occurrence was used to determine abundance of animals that could be present

Waterfront Improvement Projects at Portsmouth Naval Shipyard Request for an Incidental Harassment Authorization
6-26 October 2017
in the area for exposure, using the equation abundance = n * ZOI. Abundance for harbor seals was 0.19/day. (Average year-round density = 0.1998.) Potential takes could likely involve harbor seals that are moving through the area on foraging trips or to the downstream haul-out site as a result of underwater or airborne noise during pile driving or extraction. Harbor seals that are taken could exhibit behavioral changes such as increased swimming speeds, increased surfacing time, or decreased foraging. Most likely, harbor seals may move away from the sound source and be temporarily displaced from waters near the construction areas. With the absence of any major rookeries and only one isolated haul-out site 1.5 miles from the Project area, potential takes by disturbance would have a negligible short-term effect on individual harbor seals and would not result in population-level impacts.
6.5.4 Hooded Seal - Phocid Pinniped Hooded seals may be present in the project vicinity during the winter and spring, from January through May, though their exact seasonal densities are unknown. In general, hooded seals are much rarer than the harbor seal and gray seal in the Piscataqua River. Anecdotal sighting information indicates that two hooded seals were observed from the Shipyard in August 2009, but no other observations have been recorded (Trefry November 20, 2015). These animals are conservatively assumed to be present within the underwater Level B ZOI during each day of in-water pile driving. Average density for the predicted seasons of occurrence was used to determine abundance of animals that could be present in the area for exposure, using the equation abundance = n * ZOI. Abundance for hooded seals was 0/day (average density for winter and spring = unknown, known to be rare). Potential takes would likely involve hooded seals that are moving through the area on foraging trips or to the downstream haul-out site as a result of underwater or airborne noise during pile-driving or extraction. Hooded seals that are taken could exhibit behavioral changes such as increased swimming speeds, increased surfacing time, or decreased foraging. Most likely, hooded seals may move away from the sound source and be temporarily displaced from waters near the construction areas. With the absence of any major rookeries and only one isolated haul-out site 1.5 miles downstream of the Project area, potential takes by disturbance would have a negligible short-term effect on individual hooded seals and would not result in population-level impacts.
6.5.5 Harp Seal - Phocid Pinniped Harp seals may be present in the Project vicinity during the winter and spring, from January through February. In general, harp seals are much rarer than the harbor seal and gray seal in the Piscataqua River. These animals are conservatively assumed to be present within the underwater Level B ZOI during each day of in-water pile driving. Average density for the predicted seasons of occurrence was used to determine abundance of animals that could be present in the area for exposure, using the equation abundance = n * ZOI. Abundance for harp seals was 0.014/day (average year-round density = 0.0125). Potential takes would likely involve harp seals that are moving through the area on foraging trips or to the downstream haul-out site as a result of underwater or airborne noise during pile-driving or extraction. Harp seals that are taken could exhibit behavioral changes such as increased swimming speeds, increased surfacing time, or decreased foraging. Most likely, harp seals may move away from the sound source and be temporarily displaced from waters near the construction areas. With the absence of any major rookeries and only one isolated haul-out site 1.5 miles from the Project area, potential takes by disturbance would have a negligible short-term effect on individual harp seals and would not result in population-level impacts.

Waterfront Improvement Projects at Portsmouth Naval Shipyard Request for an Incidental Harassment Authorization
6-27 October 2017
6.6 Description of Take Calculation The take calculations presented here relied on the best data currently available for marine mammal populations within close proximity to the Piscataqua River. There are no population data for any marine mammal species specifically within the Piscataqua River; however, the population data used are from the most recent NOAA Fisheries Service Stock Assessment Reports (SAR) for the Atlantic Ocean. The most recent NMSDD population density number was used for each species. The specific SAR used is discussed within each species take calculation in Sections 6.6.1 through 6.6.5. The formula was developed for calculating take due to pile driving, extraction, and drilling and applied to the species-specific noise-impact threshold. The formula is founded on the following assumptions:
• All piles to be installed would have a noise disturbance distance equal to the pile that causes the greatest noise disturbance.
• Pile driving could potentially occur every day of the in-water work window; however, it is estimated no more than a few hours of pile driving would occur per day.
• An individual can only be taken once per day due to sound from pile driving, whether from impact or vibratory pile driving, or vibratory extraction
The conservative assumption is made that all pinnipeds within the ZOI would be underwater during at least a portion of the noise generating activity and, hence, exposed to sound at the predicted levels. This was taken into account when utilizing the user spreadsheet for take estimates. The calculation for marine mammal takes is estimated by:
Take estimate = (n * ZOI) * X days of total activity where: n = density estimate used for each species/season X = number of days of pile driving, estimated based on the total number of piles and the average
number of piles that the contractor can install per day. ZOI = noise threshold zone of influence (ZOI) impact area The calculation n * ZOI produces an estimate of the abundance of animals that could be present in the area for exposure. The abundance is then multiplied by the total number of days of pile-driving to determine the take estimate. Because the estimate must be a whole number, this value was rounded up. The ZOI impact area is the estimated range of impact on marine mammals during in-water construction. The ZOI is the area in which in-water sound would exceed designated NOAA Fisheries Service thresholds. The formula for determining the area of a circle (π* radius2) was used to calculate the ZOI around each pile, for each threshold. The distances specified were used for the radius in the equation. All impact pile driving take calculations were based on the estimated threshold ranges the ZOI impact area took into consideration the possible affected area of the Piscataqua River from the furthest pile driving/extraction site with attenuation due to land shadowing from bends in the river. As described in Section 6.4 with regard to the distances, because of the proximity of some of the piles to the shore, the narrowness of the river at the Project area, and the maximum fetch (i.e. area impacted by wind and wind-generated waves), the ZOIs for each threshold aren’t necessarily circular and may be truncated.

Waterfront Improvement Projects at Portsmouth Naval Shipyard Request for an Incidental Harassment Authorization
6-28 October 2017
6.6.1 Harbor Porpoise Level B Harbor porpoises may be present in the Project area year-round. Based on density data from the Navy Marine Species Density Database, their presence is highest in winter and spring, decreases in summer, and slightly increases in fall. However, in general, porpoises are known to occasionally occur in the river. Average density for the predicted seasons of occurrence was used to determine abundance of animals that could be present in the area for exposure, using the equation abundance = n * ZOI. Estimated abundance estimate for harbor porpoises was 0.96 animals generated from the equation (0.9445 km2 * 1.02 animals/km2). Therefore, the number of Level B harbor porpoise exposures within the ZOIs, and requested number of Level B takes is 96, (100 days * 0.96 animals/day). Level A: The injury zone for harbor porpoise was calculated to extend to a radius of 140m from impact driven piles and 35m from vibratory or king pile drilling activity. This calculation is based on estimated run time of the equipment and number of piles to be driven in a 24-hour period. The contractor is working 8-10 hour shifts with an estimate of 4 piles per day to be driven via impact hammer and a total of 4 hours per day of vibratory hammer use and 8 hours per day possible for drilling activity. Drilling and vibratory hammer use is within the shutdown zone of 55m for vibratory hammer/drilling equipment use currently in place for Year 1. The 140m Level A zone is outside of the shutdown zone, so a take estimate calculation is listed below. The estimate of potential take was based on the method utilized in the Year 1 IHA and the 2016 Acoustical guidance. The area from past the 75 m visual monitoring zone to 140m has been determined the area where a take may occur during impact hammer use. Mammal observers will be in place during activity to maintain the 75m shutdown zone, resulting in 65 m of unmonitored area within the injury zone. The area of the 75-meter shutdown zone was subtracted from the full Level A injury zone to obtain the unmonitored portion of the Level A zone, 0.0133 km2. The density of harbor porpoises in the unmonitored area of the Level A zone (0.0132 km2 based on 140m radius) was estimated at 1.02 harbor porpoises/km2 (original density estimate approved in 2016). Using the density of harbor porpoises potentially present (1.02 animal/km2) and the area of the unmonitored portion of the injury zone, less than one (0.1218 mammals) harbor porpoise a day was estimated to be exposed to injury over the 9 days of impact pile driving. Therefore, the modeling indicates (1) one harbor porpoise that could be exposed to injurious noise levels during impact pile driving.
6.6.2 Gray Seal Level B: Gray seals may be present year-round in the project vicinity, with constant densities throughout the year. Gray seals are less common in the Piscataqua River than the harbor seal. Average density for the predicted seasons of occurrence was used to determine abundance of animals that could be present in the area for exposure, using the equation abundance = n * ZOI. The estimated abundance for gray seals is 0.21/day (average year-round density = 0.2202). Therefore, the number of Level B gray seal exposures within the ZOI is (100 days * 0.21 animals/day) resulting in up to 21 level B exposures of gray seals within the ZOI. The total modeled Level B takes for gray seals are 21. However, as with the first year IHA, the modeling of estimated takes underestimated the number of takes that could occur for the pinnipeds. This was addressed in the Year 1 IHA by comments received from the Marine Mammal Commission and subsequent revisions to the take estimates. For Year 1, 156 noise generating activity days were authorized under the IHA; however, only 58 days of noise generating activity actually occurred. Majority of this noise generating activity (98.8%) has been drilling, with 1% of the noise generating activity caused by vibratory hammers and <1% caused by impact hammers. Because there was

Waterfront Improvement Projects at Portsmouth Naval Shipyard Request for an Incidental Harassment Authorization
6-29 October 2017
little activity from the impact hammer in Year 1, that activity will occur during the second year of construction. While the modeling shows that there could be 21 Level B and 0 Level A takes for gray seal, during construction activity monitoring of the zones, observations of gray seals have shown approximately one seal per week, on average, over the activity period up to October 17, 2017. In Year 2, there will be 100 days of pile driving; therefore, we are requesting 25 Level B takes of gray seal. Level A: The injury zone for gray seals was calculated to extend a radius of 63m from impact driven piles and 14m for vibratory hammer use. Drilling activity is estimated at 23m from the activity. This calculation is based on estimated run time of the equipment and number of piles to be driven or duration of drilling activity in a 24-hour period for the vibratory hammer and pile drilling activity. The impact hammer injury zone was calculated conservatively based on the full hour set up and installation time for an H-Pile (14” sister pile). The contractor is working 8-10 hour shifts with an estimate of four piles per day to be driven via Impact hammer and only a total of four hours of actual vibratory hammer use (not likely concurrent). Impact hammer use equates to only four minutes per sheet to seat the pile to depth, however as mentioned in the harbor porpoise section above a more conservative calculation is being applied. The injury zone for impact, vibratory and drilling activity remains within the shutdown zone of 75m for impact hammer use, currently in place for Year 1. Based on these calculations and continued implementation of the 75m shutdown zone, no injurious takes of gray seals are estimated to occur. However, as stated above for the Level B take request, the modeling of estimated takes underestimated the number of takes that could occur for pinnipeds. Since there was little activity from the impact hammer in Year 1, that activity will occur during the second year of construction. We request two Level A takes of gray seal to coincide with the same number of Level A takes requested in Year 1, which is based again on actual data collected rather than the modeling. For example, one gray seal was detected within 50 meters of drilling activity. Had that activity been impact hammer it would have constituted Level A take for the species. Because the impact hammer activities will need to occur in Year 2 and there have been animals observed within the shutdown zone during Year 1, we request two Level A takes of gray seals as were authorized in Year 1 To minimize potential gray seal injury, marine mammal observers will monitor to 75 m during vibratory pile driving, consistent with the larger shutdown zone to be monitored for harbor porpoises. The same shutdown zone will be applied during drilling activities. Gray seals are highly unlikely to be in this 75 m zone during vibratory pile driving. However, if gray seals were observed approaching this zone, vibratory pile driving or drilling would be halted, resulting in no injurious take.
6.6.3 Harbor Seal Level B: Harbor seals may be present year-round in the project vicinity, with constant densities throughout the year. Harbor seals are the most common pinniped in the Piscataqua River near the Shipyard. Average density for the predicted seasons of occurrence was used to determine abundance of animals that could be present in the area for exposure, using the equation abundance = n * ZOI. Abundance for harbor seals were 0.19/day. (Average year-round density = 0.1998). Therefore, the modeling for Level B harbor seal exposures within the ZOI is (100 days * (0.19 animals/day) resulting in up to 19 Level B exposures of harbor seals within the ZOI. As described above in the gray seal section, the modeling of estimated takes underestimated the number of takes that could occur for pinnipeds. While the modeling shows that there could be 19 Level B and 0 Level A takes for harbor seal, during construction activity monitoring of the zones, observations of harbor seals have averaged approximately 1 per day over the activity period up to October 17th. In Year 2, there will be 100 days of pile driving; therefore, we are requesting 100 Level B takes of harbor seal.

Waterfront Improvement Projects at Portsmouth Naval Shipyard Request for an Incidental Harassment Authorization
6-30 October 2017
Level A: The injury zone for harbor seals was calculated to extend a radius of 63m from impact driven piles and 14m for vibratory hammer use. Drilling activity is estimated at 23m from the activity. This calculation is based on estimated run time of the equipment and number of piles to be driven or duration of drilling activity in a 24-hour period for the vibratory hammer and pile drilling activity. The impact hammer injury zone was calculated conservatively based on the full hour set up and installation time for an H-Pile (14” sister pile). The contractor is working 8-10 hour shifts with an estimate of four piles per day to be driven via Impact hammer and only a total of four hours of actual vibratory hammer use (not likely concurrent). Impact hammer use equates to only four minutes per sheet to seat the pile to depth, however as mentioned in the harbor porpoise section above a more conservative calculation is being applied. The injury zone for impact, vibratory and drilling activity remains within the shutdown zone of 75m for impact hammer use and 55m for drilling/vibratory hammer activity, currently in place for Year 1. Based on these calculations and continued implementation of the 75m shutdown zone, no injurious takes of harbor seals are estimated to occur. However, as stated above for the gray seal take request, the modeling of estimated takes underestimated the number of takes that could occur for pinnipeds. We request four Level A takes of harbor seal to coincide with the same number of Level A takes requested in Year 1, which is based again on actual data collected rather than the modeling. For example, one harbor seal was detected within 50 meters of drilling activity. Had that activity been impact hammer it would have constituted Level A take for the species. Because the impact hammer activities will need to occur in Year 2 and there have been animals observed within the shutdown zone during Year 1, we request four Level A takes of harbor seal as were authorized in Year 1.
6.6.4 Hooded Seal Level B: Hooded seals may be present in the project vicinity during the winter and spring, from January through May, though their exact seasonal densities are unknown. In general, hooded seals are much rarer than the harbor seal and gray seal in the Piscataqua River. Anecdotal sighting information indicates that two hooded seals were observed from the Shipyard in August 2009, but no other observations have been recorded. Average density for the predicted seasons of occurrence was used to determine abundance of animals that could be present in the area for exposure, using the equation abundance = n * ZOI. Abundance for hooded seals was 0/day (average density for winter and spring = unknown, known to be rare). Therefore, no behavioral takes of hooded seals are expected to occur. Level A: The injury zone for hooded seals was calculated to extend a radius of 63m from impact driven piles and 14m for vibratory hammer use. Drilling activity is estimated at 23m from the activity. This calculation is based on estimated run time of the equipment and number of piles to be driven or duration of drilling activity in a 24-hour period for the vibratory hammer and pile drilling activity. The impact hammer injury zone was calculated conservatively based on the full hour set up and installation time for an H-Pile (14” sister pile). The contractor is working 8-10 hour shifts with an estimate of four piles per day to be driven via Impact hammer and only a total of four hours of actual vibratory hammer use (not likely concurrent). Impact hammer use equates to only four minutes per sheet to seat the pile to depth, however as mentioned in the harbor porpoise section above a more conservative calculation is being applied. The injury zone for impact, vibratory and drilling activity remains within the shutdown zone of 75m for impact hammer use, currently in place for Year 1. Based on these calculations and continued implementation of the 75m shutdown zone, no injurious takes of hooded seals are estimated to occur.

Waterfront Improvement Projects at Portsmouth Naval Shipyard Request for an Incidental Harassment Authorization
6-31 October 2017
6.6.5 Harp Seal Level B: Harp seals may be present in the Project vicinity during the winter and spring, from January through February. In general, harp seals are much rarer than the harbor seal and gray seal in the Piscataqua River. These animals are conservatively assumed to be present within the underwater Level B ZOI during each day of in-water pile driving. Average density for the predicted seasons of occurrence was used to determine abundance of animals that could be present in the area for exposure, using the equation abundance = n * ZOI. Abundance for harp seals was 0.014/day (average year-round density = 0.0125). Therefore, the number of Level B harp seal exposures within the ZOI is (100 days * (0.0125 animals/day) results in approximately 1 level B exposure of harp seals. As a precaution, the Navy is requesting one (1) Level B take for harp seal. Level A: The injury zone for harp seals was calculated to extend a radius of 63m from impact driven piles and 14m for vibratory hammer use. Drilling activity is estimated at 23m from the activity. This calculation is based on estimated run time of the equipment and number of piles to be driven or duration of drilling activity in a 24-hour period for the vibratory hammer and pile drilling activity. The impact hammer injury zone was calculated conservatively based on the full hour set up and installation time for an H-Pile (14” sister pile). The contractor is working 8-10 hour shifts with an estimate of four piles per day to be driven via Impact hammer and only a total of four hours of actual vibratory hammer use (not likely concurrent). Impact hammer use equates to only four minutes per sheet to seat the pile to depth, however as mentioned in the harbor porpoise section above a more conservative calculation is being applied. The injury zone for impact, vibratory and drilling activity remains within the shutdown zone of 75m for impact hammer use, currently in place for Year 1. Based on these calculations and continued implementation of the 75m shutdown zone, no injurious takes of harp seals are estimated to occur.
6.7 Summary The Year 1 application addendum applied general information on equipment operation times. For Year 2 the contractor has provided information related directly to the equipment to be used on the project with manufacturers specifications included when completing the calculations in Appendix D of the NMFS 2016 acoustic guidance. Based on the modeling results presented above, the total numbers of takes that could occur within the Project area during the duration of proposed in-water construction activities are presented below in Table 6-13. However, as stated previously, the Navy believes the modeled takes to be underestimated based on field observations. Table 6-13B is a revised take request based on observational data gathered during Year 1. Takes are currently expected to occur year-round. There is the potential for 96 Level B disturbance takes and one Level A take of harbor porpoises, 25 Level B disturbance takes and one Level A take of gray seals, 100 Level B disturbance takes and four Level A takes of harbor seals, zero (0) Level B disturbance takes of hooded seals, and one (1) Level B takes of harp seals. Takes may occur from either impact or vibratory pile-driving operations. The Navy is requesting a total of 222 Level B behavioral disturbances and 7 Level A takes.

Waterfront Improvement Projects at Portsmouth Naval Shipyard Request for an Incidental Harassment Authorization
6-32 October 2017
Table 6-13: Total Underwater Exposure Estimates by Species for Take Request Year 2 (calculated)
Species Level B Behavioral
Disturbance Level A Injury
Harbor porpoise 96 1 Gray Seal 21 0 Harbor Seal 19 0 Hooded Seal 0 0 Harp Seal 1 0
Total 137 1
Table 16-13B: Revised Underwater Exposure Estimates by Species for Take Request (Based on Observed Behavior)
Species Level B Behavioral
Disturbance Level A Injury
Harbor porpoise 96 1 Gray Seal 25 2 Harbor Seal 100 4 Hooded Seal 0 0 Harp Seal 1 0
Total 222 7

Waterfront Improvement Projects at Portsmouth Naval Shipyard Request for an Incidental Harassment Authorization
7-33 October 2017
7 Impacts on Marine Mammal Species or Stocks
The anticipated impact of the activity upon the species or stock of marine mammals.
7.1 Potential Effects of Pile Driving and Drilling on Marine Mammals
7.1.1 Underwater Noise Effects The effects of pile driving on marine mammals are dependent on several factors, including the size, type, and depth of the animal; the depth, intensity, and duration of the pile-driving sound; the depth of the water column; the substrate of the habitat; the standoff distance between the pile and the animal; and the sound-propagation properties of the environment. Impacts to marine mammals from pile-driving activities are expected to result primarily from acoustic pathways. As such, the degree of effect is intrinsically related to the received level and duration of the sound exposure, which are in turn influenced by the distance between the animal and the source. The farther away from the source, the less intense the exposure should be. The substrate and depth of the habitat affect the sound-propagation properties of the environment. Shallow environments are typically more structurally complex, which leads to rapid sound attenuation. In addition, substrates that are soft (i.e., mud) would absorb or attenuate the sound more readily than hard substrates (rock), which may reflect the acoustic wave. Soft, porous substrates would also likely result in shorter durations of pile driving, and possibly less driving force, which would ultimately decrease the intensity of the acoustic source. Impacts to marine species are expected to be the result of physiological responses to both the type and strength of the acoustic signature (Viada et al. 2008). Behavioral impacts are also expected, though the type and severity of these effects are more difficult to define due to limited studies addressing the behavioral effects of impulsive sounds on marine mammals. Potential effects from impulsive sound sources can range from brief acoustic effects such as behavioral disturbance, tactile perception, physical discomfort, slight injury of the internal organs and the auditory system, to death of the animal (Yelverton et al. 1973; O’Keeffe and Young 1984; Navy 2001).
Physiological Responses Direct tissue responses to impact/impulsive sound stimulation may range from mechanical vibration or compression with no resulting injury, to tissue trauma (injury). Because the ears are the most sensitive organ to pressure, they are the organs most sensitive to injury (Ketten 2000). Sound related trauma can be lethal or sub-lethal. Lethal impacts are those that result in immediate death or serious debilitation in or near an intense source (Ketten 1995). Sub-lethal impacts include hearing loss, which is caused by exposure to perceptible sounds. Severe damage from a pressure wave to the ear can include rupture of the tympanum, fracture of the ossicles, damage to the cochlea, hemorrhage, and cerebrospinal fluid leakage into the middle ear (NOAA Fisheries Service 2008). Moderate injury implies partial hearing loss. Permanent hearing loss, or permanent threshold shifts (PTS), can occur when the hair cells are damaged by one very loud event or by prolonged exposure to noise. Instances of temporary threshold shifts (TTS) and/or auditory fatigue are well documented in marine mammal literature as being one of the primary avenues of acoustic impact. Temporary loss of hearing sensitivity (TTS) has been documented in controlled settings using captive marine mammals exposed to strong sound exposure levels at various frequencies (Ridgway et al. 1997; Kastak et al. 1999; Finneran et al. 2005), but it has not been documented in wild marine mammals exposed to pile driving. While injuries to other sensitive organs are possible, they are less likely because pile-driving impacts are almost entirely acoustically mediated, unlike explosive sounds, which also include a shock wave that can result in damage. No physiological responses are expected from pile-driving operations occurring during the Project, for several reasons. First, vibratory pile driving, which is being utilized as the primary installation method,

Waterfront Improvement Projects at Portsmouth Naval Shipyard Request for an Incidental Harassment Authorization
7-34 October 2017
does not generate high enough peak SPLs that are commonly associated with physiological damage. Any use of impact pile driving would only occur from a short period of time (~4-16 minutes per steel pile). Additionally, the mitigation measures that the Navy would be employing (see Section 11) would greatly reduce the chance that a marine mammal may be exposed to cumulative SPL readings that could cause physical harm. The Navy will continue to have trained biologists overseeing the monitoring at the shutdown zone to ensure no marine mammals enter the shutdown zone while work is occurring.
Behavioral Responses Behavioral responses to sound are highly variable and context-specific. For each potential behavioral change, the magnitude of the change ultimately determines the severity of the response. A number of factors may influence an animal’s response to noise, including its previous experience, its auditory sensitivity, its biological and social status (including age and sex), and its behavioral state and activity at the time of exposure (National Research Council of the National Academies 2005). Habituation can occur when an animal’s response to a stimulus wanes with repeated exposure, usually in the absence of unpleasant associated events (Wartzok et al. 2003/04). Animals are most likely to habituate to sounds that are predictable and unvarying. The opposite process is sensitization, when an unpleasant experience leads to subsequent responses, often in the form of avoidance, at a lower level of exposure. Behavioral state may affect the type of response as well. For example, animals that are resting may show greater behavioral change in response to disturbing noise levels than animals that are highly motivated to remain in an area for feeding (Richardson et al. 1995; National Research Council (NRC) 2003; Wartzok et al. 2003/04). Controlled experiments with captive marine mammals showed pronounced behavioral reactions, including avoidance of loud sound sources (Ridgway et al. 1997; Finneran et al. 2003). Observed responses of wild marine mammals to loud pulsed sound sources (typically seismic guns or acoustic harassment devices, but also including pile driving) have been varied but often consist of avoidance behavior or other behavioral changes suggesting discomfort (Morton and Symonds 2002; CALTRANS 2001, 2006; also see reviews in Gordon et al. 2004; Wartzok et al. 2003/04; and Nowacek et al. 2007). Responses to continuous noise, such as vibratory pile installation, have not been documented as well as responses to pulsed sounds. With both types of pile driving, it is likely that the onset of pile driving could result in temporary, short-term changes in the animal’s typical behavior and/or avoidance of the affected area. A marine mammal may show signs that it is startled by the noise and/or may swim away from the sound source and avoid the area. Other potential behavioral changes could include increased swimming speed, increased surfacing time, and decreased foraging in the affected area. Pinnipeds may increase their haul-out time, possibly to avoid in-water disturbance (CALTRANS 2001, 2006). Since pile driving would likely only occur for a few hours per day and over a short period of time, it is unlikely to result in permanent displacement. Any potential impacts from pile-driving activities could be experienced by individual marine mammals but would not cause population level impacts or affect the long-term fitness of a species.
7.1.2 Airborne Noise Effects Marine mammals that occur in or near the Project area could be exposed to airborne sounds associated with pile-driving that have the potential to cause harassment, depending on their distance from pile- driving activities. Airborne pile-driving noise would have less impact on cetaceans than pinnipeds because noise from atmospheric sources does not transmit well underwater (Richardson et al. 1995); thus airborne noise would be an issue only for hauled-out pinnipeds in or near the Project area. Most likely, airborne sound would cause behavioral responses similar to those discussed above in relation to underwater noise. For instance, anthropogenic sound could cause hauled-out pinnipeds to exhibit changes in their normal behavior, such as reduction in vocalizations, or cause them to temporarily abandon their habitat and move

Waterfront Improvement Projects at Portsmouth Naval Shipyard Request for an Incidental Harassment Authorization
7-35 October 2017
farther from the source. Studies by Blackwell et al. (2004) and Moulton et al. (2005) indicate a tolerance or lack of response to unweighted airborne sounds as high as 112 dB peak and 96 dB rms. Based on these observations, pinnipeds could exhibit temporary behavioral reactions to airborne noise; however, exposure is not likely to result in population-level impacts. There are no known haul-out sites for any seal species within the vicinity of the Project area. The closest known seal haul-out site to the Project area is on the Piscataqua River 1.5 miles downstream of the Project area. Therefore, acoustic disturbance to hauled-out pinnipeds is unlikely. No additional haul out points have been observed during the initial phases of Year 1 work.
7.1.3 Conclusions Regarding Impacts to Species or Stocks Individual marine mammals may be exposed to SPLs during pile driving which exceed the specified thresholds in this document, and extraction operations at the Shipyard may result in Level B Behavioral harassment. Any marine mammals that are taken (harassed) may change their normal behavior patterns (i.e., swimming speed, foraging habits, etc.) or be temporarily displaced from the area of construction. Any takes would likely have only a minor effect on individuals and no effect on populations. The sound generated from vibratory pile driving is non-pulsed (e.g., continuous), which is not known to cause injury to marine mammals. Mitigation is likely to avoid most potential adverse underwater impacts to marine mammals from impact pile driving. Nevertheless, some level of impact is unavoidable. The expected level of unavoidable impact (defined as an acoustic or harassment “take”) is described in Sections 5 and 6. This level of effect is not anticipated to have any detectable adverse impact on population recruitment, survival, or recovery (i.e., no more than a negligible adverse effect).

Waterfront Improvement Projects at Portsmouth Naval Shipyard Request for an Incidental Harassment Authorization
8-1 October 2017
8 Impact on Subsistence Use
The anticipated impact of the activity on the availability of the species or stocks of marine mammals for subsistence uses.
This section is not applicable. The Project would take place in the coastal Atlantic Ocean of Maine--specifically, the Piscataqua River. No traditional subsistence hunting areas are within the region.

Waterfront Improvement Projects at Portsmouth Naval Shipyard Request for an Incidental Harassment Authorization
9-1 October 2017
9 Impacts on the Marine Mammal Habitat and the Likelihood of Restoration
9.1 Pile-driving and Drilling Effects on Potential Prey (Fish) Fish are a primary dietary component of the cetaceans and pinnipeds discussed in this application. Similar to marine mammals, fish can also be affected by noise both physiologically and behaviorally. However, the amount of information regarding impacts on fish from human-generated acoustic sources is limited. They Year 1 application referenced a study on the acoustic threshold criteria for physiological impacts on fish developed by the Fisheries Hydroacoustic Working Group (FHWG) in 2008. The criteria determined by the FHWG is based on impacts from pile driving; however, it is assumed that because this is the most current information for any physiological acoustic impacts on fish, the criteria can be used for other human-generated sound sources. The FHWG determined that potential injury for all fish species is based on dual criteria: (1) Peak SPL of 206 dB re 1µPa, and (2) 187 dB accumulated SEL (dBcSEL; re 1µPa2-sec) for fish weighing 2 grams or more or 183 dB accumulated SEL (dBcSEL; re 1µPa2-sec) for fish weighing 2 grams or less (Palmer 2012). To assess behavioral disturbance, NOAA Fisheries Service has adopted a threshold criterion of 150 dB re 1µPaRMS for fish of all sizes (Palmer 2012). A more recent study has been completed (Popper 2014) which sets the threshold of potential mortality or mortal injury at 207 – 219 dB SELcum for fish species dependent on use of a swim bladder.
Construction activities will produce both pulsed (i.e., impact pile driving) and continuous (i.e., vibratory pile driving) sounds. Fish react to sounds that are especially strong and/or intermittent low-frequency sounds. Short-duration, sharp sounds can cause overt or subtle changes in fish behavior and local distribution. Hastings and Popper (2005; Popper and Hastings 2009) identified several studies that suggest fish may relocate to avoid certain areas of noise energy. Sound pulses at received levels of 160 dB re 1 μPa may cause subtle changes in fish behavior. SPLs of 180 dB may cause noticeable changes in behavior (Chapman and Hawkins 1969; Pearson et al. 1992; Skalski et al. 1992). SPLs of sufficient strength have been known to cause injury to fish and fish mortality (CALTRANS 2001; Longmuir and Lively 2001). The most likely impact to fish from pile-driving activities at the Project area would be temporary behavioral avoidance of the immediate area. The duration of fish avoidance of this area after pile driving stops is unknown, but a rapid return to normal recruitment, distribution, and behavior is anticipated. In addition, it should be noted that the area in question is low-quality habitat since it is already highly developed and experiences a high level of anthropogenic noise from normal Shipyard operations and other vessel traffic. In general, impacts on marine mammal prey species are expected to be minor and temporary.
9.2 Pile-driving and Drilling Effects on Potential Foraging Habitat During the course of the Project, various activities are expected to disturb the sediment. These activities include pile-driving, dredging, and filling. In order to minimize the amount of debris, sediment, and silt escaping when backfilling the Berth 11 bulkhead, the Navy will install geotextile fabric against the interior of the bulkhead to catch debris, sediment, and silt forced through seams in the bulkhead when the backfill is compacted. In addition, a temporary silt curtain and boom would be installed outside of Berth 11, approximately 18 feet off the berth, during backfilling to catch additional debris, sediment, and silt that escapes the bulkhead. Pile-driving and dredging activities may re-suspend disturbed sediment and result in turbid conditions within the immediate Project area. Suspended sediments may be transported and re-deposited downstream of the prevailing currents, which could increase siltation in the vicinity of the Shipyard. Resulting sedimentation is also expected to be localized and temporary. Since the currents are so strong in the area, suspended sediments in the water column should dissipate and quickly return to background levels. Following the completion of sediment-disturbing activities, the turbidity levels within the temporary

Waterfront Improvement Projects at Portsmouth Naval Shipyard Request for an Incidental Harassment Authorization
9-2 October 2017
offshore workspace are expected to return to normal ambient levels following the end of construction in all construction scenarios. Turbidity within the water column has the potential to reduce the level of oxygen in the water and irritate the gills of cetacean or pinniped prey fish species in the Project area. However, turbidity plumes associated with the Project would be temporary and localized, and fish in the Project area would be able to move away from and avoid the areas where plumes may occur. Therefore, it is expected that the impacts on prey fish species from turbidity, and therefore on marine mammals, would be minimal and temporary. In general, the area likely impacted by the Project is relatively small compared to the available habitat in Great Bay Estuary. As a result, activity at the Project site would be inconsequential in terms of its effects on marine mammal foraging.
9.3 Summary of Impacts on Marine Mammal Habitat All marine mammal species using habitat near the Project area are primarily transiting the area; no known foraging or haul-out areas are located within 1.5 miles of the Project area. The most likely impacts on marine mammal habitat for the Project are from underwater noise, turbidity, and potential effects on the food supply. However, it is not expected that any of these impacts would be significant. Construction may have temporary impacts on benthic invertebrate species, another marine mammal prey source. Benthic invertebrates that are commonly prey for marine mammals, such as squid species, were not detected during a 2014 benthic survey of the Project area (CR Environmental, Inc. 2014). Direct benthic habitat loss would be avoided to the extent practicable by minimizing the construction footprint, and this loss would be temporary across most of the Project area as disturbed areas are expected to recolonize with a similar benthic community composed of organisms or offspring of organisms from adjacent benthic areas. Construction of the bulkhead at Berth 11 would result in permanent loss of benthic habitat. This permanent loss would be insignificant on a landscape-scale, given the abundant habitat in the surrounding estuary system that is of similar or better quality. Indirect impacts on benthic habitat and organisms are likely to result from turbidity and resulting sedimentation caused by dredging activities. There would be temporary and minor direct and indirect adverse impacts on benthic habitat and benthic invertebrate species during construction as a result of sediment disturbance, turbidity, and sedimentation. However, the impacts that would result from the proposed activities would be similar to those resulting from maintenance dredging at the Shipyard. Within a short time after construction is complete, the benthic habitat would be expected to return to pre-construction conditions, allowing the recolonization of benthic invertebrates. Given the short daily duration of noise associated with individual pile driving and removal and the relatively small areas being affected, pile-driving and extraction activities associated with the Proposed Action are not likely to have a permanent, adverse effect on any Essential Fish Habitat (EFH) or population of fish species. Therefore, pile driving and removal are not likely to have a permanent, adverse effect on marine mammal foraging habitat at the Project area.

Waterfront Improvement Projects at Portsmouth Naval Shipyard Request for an Incidental Harassment Authorization
10-1 October 2017
10 Anticipated Impacts of Loss or Modification of Habitat During the course of the Project, various activities would cause benthic disturbance. These include dredging, pile driving, pile extraction, and filling. These activities would not result in the significant permanent loss or modification of habitat for marine mammals or their prey. The greatest impact on marine mammals associated with the Project would be the potential minimal and temporary loss of habitat due to elevated noise levels and the potential temporary impact on prey species due to turbidity. These temporary impacts are discussed in detail in Section 9.0, Anticipated Impact on Habitat.

Waterfront Improvement Projects at Portsmouth Naval Shipyard Request for an Incidental Harassment Authorization
11-1 October 2017
11 Means of Effecting the Least Practicable Adverse Impacts – Mitigation Measures
The exposures outlined in Section 6 represent the maximum expected number of marine mammals that could be exposed to acoustic sources reaching Level B harassment levels. The Navy proposes to employ a number of mitigation measures, discussed below, in an effort to minimize the number of marine mammals potentially affected.
11.1 Mitigation for Pile-driving Activities
11.1.1 Proposed Measures The modeling results for ZOIs discussed in Section 6 were used to review mitigation measures for pile driving, drilling, and extraction at Berth 11 which were developed for the Year 1 application. The ZOIs effectively represent the mitigation zone that would be established to prevent Level A harassment to marine mammals. The potential takes estimated from pile driving activity noted in Table 6-9 indicate Level A harassment is unlikely as the mammal would need to be within the shutdown zones.
1. Shutdown and Buffer Zone during Pile Driving and Removal
• During pile driving and removal, the shutdown zone shall include all areas where the underwater SPLs are anticipated to equal or exceed the Level A (injury) harassment criteria for marine mammals
Shutdown Zone will be set at 55 meters for Vibratory, 75m for Drilling and Impact Hammer use, however estimated Level A thresholds are as follows:
• Vibratory and Drilling Activity: 173 SELcum for HF Cetaceans which is 35 meters; 201 SELcum for Phocid Pinnipeds which is 14 meters.
• Impact Hammer Pile Driving: 155 SELcum for HF Cetaceans which is 140 meters from the work; 185 SELcum for Phocid Pinnepeds which is 63 meters.
• Pile-driving or removal operations will cease if a marine mammal approaches the Level A Zone or 75m work shutdown zone. Pile-driving/removal operations will restart once the marine mammal is visibly seen leaving the Level A zone, or after 15 minutes have passed with no sightings.
• During pile-driving and removal, the buffer zone shall include areas where the underwater SPLs are anticipated to equal or exceed the Level B (disturbance) harassment criteria for marine mammals (160 dB rms isopleths for impact pile driving, 120 dB rms isopleth for vibratory pile-driving). Sound levels will be re assessed/verified at the beginning of Year 2 activity.
• The entire Level B zone, or buffer zone, the zone will be visually monitored during two-thirds of all pile-driving days. If a marine mammal is observed entering the buffer zone, an exposure would be recorded and behaviors documented. The Navy will extrapolate data collected during monitoring days and extrapolate and calculate total takes for all pile-driving days.

Waterfront Improvement Projects at Portsmouth Naval Shipyard Request for an Incidental Harassment Authorization
11-2 October 2017
• All buffer and shutdown zones for Year 2 will be based on the distances from the source that were documented during Year 1 acoustic monitoring for each threshold level.
2. Shutdown Zone during Other In-water Construction or Demolition Activities
• During all in-water construction or demolition activities having the potential to affect
marine mammals, in order to prevent injury from physical interaction with construction equipment, a shutdown zone of 33 feet or 10 meters will be implemented to ensure marine mammals are not present within this zone. These activities could include, but are not limited to: 1) the movement of a barge to the construction site, or 2) the removal of a pile from the water column/substrate via a crane (i.e., a “dead pull”).
3. Visual Monitoring
In Year 1, the contractor completed development of a Marine Species Observation plan to comply with the requirements of the issued 2017 IHA. The measures noted in the observation plan will carry forward into observation protocol in 2018 and include all items noted below. All observers and supervisory level team members working on the project with the ability to conduct drilling operations received training on compliance with the issued IHA and viewed the Navy video on Marine Mammal identification. Field guides were also developed and issued to crew supervisors and the observers to aid in identification of marine mammals.
A Marine Mammal Observer Coordinator with training and experience in marine mammal identification and observations has been retained by the contractor for coordination of the observations and reporting of marine mammal behavior.
• Use of Impact hammer for pile Installation: Monitoring will be conducted within
the Level A harassment shutdown zone during all pile-driving operations and the Level B harassment buffer zone during two-thirds of pile-driving days. Monitoring will take place from 15 minutes prior to initiation through 30-minutes post-completion of pile-driving/removal activities.
• A minimum of two marine species observers will be in place during all pile- driving/removal operations. Marine species observers ("observer(s)") designated by the contractor will be placed at the best vantage point(s) practicable to monitor for marine mammals and implement shutdown/delay procedures when applicable by calling for the shutdown to equipment operators. The observer(s) shall have no other construction-related tasks while conducting monitoring and will be trained on the observation zones, potential species, how to observe, and how to fill out the data sheets by the Navy Natural Resources Manager prior to any pile-driving activities. The supervisory observer will be a trained biologist; additional observers will be trained by that supervisor as needed.
• Prior to the start of pile-driving/removal activity, the shutdown and safety zones will be monitored for 15 minutes to ensure that they are clear of marine mammals. Pile- driving will only commence once observers have declared the shutdown zone clear of marine mammals; animals will be allowed to remain in the buffer zone and their behavior will be monitored and documented.
• If a marine mammal approaches/enters the shutdown zone during the course of pile-driving/removal operations, pile-driving will be halted and delayed until either

Waterfront Improvement Projects at Portsmouth Naval Shipyard Request for an Incidental Harassment Authorization
11-3 October 2017
the animal has voluntarily left and been visually confirmed beyond the shutdown zone or 15 minutes have passed without re-detection of the animal.
• In the unlikely event of conditions that prevent the visual detection of marine mammals, such as heavy fog, activities with the potential to result in Level A or Level B harassment will not be initiated. Impact pile-driving would be curtailed, but vibratory pile driving or extraction would be allowed to continue if such conditions arise after the activity has begun.
4. Acoustic Measurements. Acoustic measurements will continue during subsequent years
of in-water construction for the Project and will be used to empirically adjust the shutdown and buffer zones. For further detail regarding our acoustic monitoring plan, see Section 13.
5. Soft Start. The use of a soft-start procedure is believed to provide additional protection to
marine mammals by providing a warning and/or giving marine mammals a chance to leave the area prior to the hammer operating at full capacity. The Project will use soft-start techniques (ramp-up/dry fire) recommended by NOAA Fisheries Service for impact pile driving. These measures are as follows: “Soft start must be conducted at beginning of day's activity and at any time pile driving has ceased for more than 30 minutes. If an impact hammer is used, contractors are required to provide an initial set of three strikes from the impact hammer at 40 percent energy, followed by a 30-second waiting period, then two subsequent 3-strike sets.” The 30-second waiting period is proposed based on the Navy’s recent experience and consultation with NOAA Fisheries Service on a similar project at Naval Base Kitsap at Bangor (Department of the Navy 2010b).
6. Daylight Construction. Pile driving/removal (vibratory as well as impact), drilling, and vibratory extraction will only be conducted during daylight hours.
7. For Year 2 work it may be possible to complete extraction of the temporary SOE and
installation of sister pile from behind the new shutter panel wall. If this is possible the new shutter panel wall will buffer sound levels associated with the removal activity of the SOE and installation of the sister pile. The contractor will utilize this method as much as practicable to reduce impacts.
11.2 Mitigation Effectiveness It should be recognized that although marine mammals will be protected from Level A harassment by marine mammal observers (MMOs) monitoring the near-field injury zones, mitigation may not be 100-percent effective at all times in locating marine mammals in the buffer zone. The efficacy of visual detection depends on several factors, including the observer’s ability to detect the animal, the environmental conditions (visibility and sea state), and monitoring platforms. All observers utilized for mitigation activities will have training in marine mammal detection and behavior. Due to their specialized training, the Navy expects that visual mitigation will be highly effective. Trained observers have specific knowledge of marine mammal physiology, behavior, and life-history that may improve their ability to detect individuals or help determine whether observed animals are exhibiting behavioral reactions to construction activities.

Waterfront Improvement Projects at Portsmouth Naval Shipyard Request for an Incidental Harassment Authorization
11-4 October 2017
Visual detection conditions in the Project area are generally excellent. Located in Portsmouth Harbor, the area is sheltered from large swells and infrequently experiences strong winds. Observers will be positioned in locations that provide the best vantage point(s) for monitoring, such as on nearby piers or on a small boat, and the shutdown and buffer zones cover relatively small and accessible areas of the lower Piscataqua River. As such, proposed mitigation measures are likely to be very effective.

Waterfront Improvement Projects at Portsmouth Naval Shipyard Request for an Incidental Harassment Authorization
12-1 October 2017
12 Minimization of Adverse Effects on Subsistence Use This section is not applicable. There is not subsistence use of marine mammal species or stocks in the Project area.

Waterfront Improvement Projects at Portsmouth Naval Shipyard Request for an Incidental Harassment Authorization
13-1 October 2017
13 Monitoring and Reporting Measures The suggested means of accomplishing the necessary monitoring and reporting that will result in increased knowledge of the species, the level of taking or impacts on populations of marine mammals that are expected to be present while conducting activities and suggested means of minimizing burdens by coordinating such reporting requirements with other schemes already applicable to persons conducting such activity. Monitoring plans should include a description of the survey techniques that would be used to determine the movement and activity of marine mammals near the activity site(s) including migration and other habitat uses, such as feeding.
13.1 Monitoring Plan The marine mammal monitoring plan submitted for the Year 1 application will continue to be utilized to monitor the project potential impacts on marine mammals in the vicinity. It is anticipated the first report from this monitoring effort will be submitted in June of 2017. The following monitoring measures will continue to be implemented along with the mitigation measures (Section 11) in order to reduce impacts to marine mammals to the lowest extent practicable during the period of this IHA. The Navy would conduct post-project surveys as well on a quarterly basis to document any changes in populations of marine mammals.
13.2 Acoustic Monitoring Continuing in 2018, the Navy will implement in situ acoustic monitoring efforts to verify zones established during 2017 in-water construction activities. A comprehensive acoustic monitoring plan was submitted with the Year 1 IHA application and is in the process of implementation as of the time of this application submittal. Preliminary results are included in Appendix A. Monitoring according to the Year 1 approved plan may continue into Year 2 should activities or schedule change. During Year 2, the Navy will verify acoustic monitoring at the source (33 feet) and, where the potential for Level A harassment exists, at a second representative monitoring location at an intermediate distance between the cetacean and pinniped shutdown zones. A report will be submitted to NMFS within 30 days of completing the verification monitoring.
13.2.1 Visual Marine Mammal Observations The Navy will collect sighting data and behavioral responses to construction for marine mammal species observed in the region of activity during the period of construction. All observers will be trained in marine mammal identification and behaviors. NOAA Fisheries Service requires that the observers have no other construction-related tasks while conducting monitoring.
13.2.2 Methods of Monitoring The Navy will monitor the shutdown zone and safety zone before, during, and after pile-driving activities. Based on NOAA Fisheries Service requirements, the Marine Mammal Monitoring Plan would include the following procedures:
• MMOs will be primarily located on boats, docks, and piers at the best vantage point(s) in order to properly see the entire shut down zone(s).
• MMOs will be located at the best vantage point(s) to observe the zone associated with behavioral impact thresholds;

Waterfront Improvement Projects at Portsmouth Naval Shipyard Request for an Incidental Harassment Authorization
13-2 October 2017
• During all observation periods, observers will use binoculars and the naked eye to search continuously for marine mammals;
• Monitoring distances will be measured with range finders;
• Distances to animals will be based on the best estimate of the MMO, relative to known distances to objects in the vicinity of the MMO;
• Bearing to animals will be determined using a compass;
• At the beginning of each survey phase (pre-construction, during construction, and post construction), a census of pinniped species hauled out in the vicinity of pile driving encompassing the level B harassment ZOIs will be performed;
• In-water activities will be curtailed under conditions of fog or poor visibility that might obscure the presence of a marine mammal within the shutdown zone;
• Pre-Activity Monitoring:
The shutdown and buffer zones will be monitored for 15 minutes prior to in-water construction/demolition activities. If a marine mammal is present within the shutdown zone, the activity will be delayed until the animal(s) leave the shutdown zone. Activity will resume only after the MMO has determined that, through sighting or by waiting approximately 15 minutes, the animal has moved outside the shutdown zone. If a marine mammal is observed approaching the shutdown zone, the MMO who sighted that animal will notify the shutdown MMO of its presence.
• During Activity Monitoring:
If a marine mammal is observed entering the buffer zone, that pile segment will be completed without cessation, unless the animal enters or approaches the shutdown zone, at which point all pile-driving activities will be halted. If an animal is observed within the shutdown zone during pile driving, then pile driving will be stopped as soon as it is safe to do so. Pile driving can only resume once the animal has left the shutdown zone of its own volition or has not been re-sighted for a period of 15 minutes.
• Post-Activity Monitoring:
Monitoring of the shutdown and buffer zones will continue for 30 minutes following the completion of the activity.
13.2.3 Data Collection NOAA Fisheries Service requires that the MMOs use NOAA Fisheries Service-approved sighting forms. NOAA Fisheries Service requires that, at a minimum, the following information be collected on the sighting forms:
• Date and time that pile driving or removal begins or ends;
• Construction activities occurring during each observation period;
• Weather parameters identified in the acoustic monitoring (e.g., wind, humidity, temperature);
• Tide state and water currents;
• Visibility;
• Species, numbers, and, if possible, sex and age class of marine mammals;

Waterfront Improvement Projects at Portsmouth Naval Shipyard Request for an Incidental Harassment Authorization
13-3 October 2017
• Marine mammal behavior patterns observed, including bearing and direction of travel, and, if possible, the correlation to SPLs;
• Distance from pile-driving activities to marine mammals and distance from the marine mammal to the observation point;
• Locations of all marine mammal observations;
• Other human activity in the area.
To the extent practicable, the Navy will record behavioral observations that may make it possible to determine whether the same or different individuals are being “taken” as a result of project activities over the course of a day.
13.3 Reporting A draft report would be submitted to NOAA Fisheries Service within 45 calendar days of the completion of acoustic measurements and marine mammal monitoring. The results would be summarized in graphical form and include summary statistics and time histories of sound values based upon the data from the piles monitored for this IHA period. A final report would be prepared and submitted to the NOAA Fisheries Service within 30 days following receipt of comments on the draft report from the NOAA Fisheries Service. At a minimum, the report shall include:
• General data:
Date and time of activities.
Water conditions (e.g., sea state, tidal state).
Weather conditions (e.g., percent cover, visibility).
• Specific pile data for acoustically monitored piles:
Description of the activities being conducted.
Size and type of piles.
The machinery used for installation or removal.
The power settings of the machinery used for installation or removal
• Specific acoustic monitoring information:
A description of the monitoring equipment.
The distance between hydrophone(s) and pile.
The depth of the hydrophone(s).
The physical characteristics of the bottom substrate where the piles were driven or extracted (if possible).
Acoustic data (per Section 13.1.1 above) for each
Pre-activity observational survey-specific data:
Dates and time survey is initiated and terminated.
Description of any observable marine mammal behavior in the immediate area during monitoring

Waterfront Improvement Projects at Portsmouth Naval Shipyard Request for an Incidental Harassment Authorization
13-4 October 2017
If possible, the correlation to underwater sound levels occurring at the time of the observable behavior.
Actions performed to minimize impacts to marine mammals.
• During-activity observational survey-specific data:
Description of any observable marine mammal behavior within monitoring zones or in the immediate area surrounding monitoring zones.
If possible, the correlation to underwater sound levels occurring at the time of this observable behavior.
Actions performed to minimize impacts to marine mammals.
Times when pile extraction is stopped due to presence of marine mammals within the shutdown zones and time when pile driving resumes.
• Post-activity observational survey-specific data:
Results, which include the detections of marine mammals, species and numbers observed, sighting rates and distances, and behavioral reactions within and outside of safety zones.
A refined take estimate based on the number of marine mammals observed during the course of construction

Waterfront Improvement Projects at Portsmouth Naval Shipyard Request for an Incidental Harassment Authorization
13-1 October 2017
14 Research
Suggested means of learning of, encouraging, and coordinating research opportunities, plans, and activities relating to reducing such incidental taking and evaluating its effects.
To minimize the likelihood that impacts will occur to the species, stocks, and subsistence use of marine mammals, all construction activities will be conducted in accordance with all federal, state, and local regulations, and minimization measures proposed by the Navy will be implemented to protect marine mammals. The Navy will coordinate all activities with the relevant federal and state agencies. These include, but are not limited to: the NOAA Fisheries Service, U.S. Fish and Wildlife Service, U.S. Coast Guard, and the U.S. Army Corps of Engineers (USACE). The Navy will share field data and behavioral observations on all marine mammals that occur in the Project area. Results of each monitoring effort will be provided to NOAA Fisheries Service in one summary report within 45 days of the conclusion of monitoring. This information could be made available to regional, state, and federal resource agencies, scientists, professors, and other interested private parties upon written request to NOAA Fisheries Service. Additionally, the Navy provides a significant amount of funding and support for marine research. The Navy provided $26 million in Fiscal Year 2008 and $22 million in Fiscal Year 2009 to universities, research institutions, federal laboratories, private companies, and independent researchers around the world to study marine mammals. The Navy sponsors 70 percent of all U.S. research concerning the effects of human-generated sound on marine mammals and 50 percent of such research conducted worldwide. Major topics of Navy-supported research include the following:
• Gaining a better understanding of marine species distribution and important habitat areas,
• Developing methods to detect and monitor marine species before and during training,
• Understanding the effects of sound on marine mammals, and developing tools to model and estimate potential effects of sound.
The Navy has sponsored several workshops to evaluate the current state of knowledge and potential for future acoustic monitoring of marine mammals. The workshops brought together acoustic experts and marine biologists from the Navy and other research organizations to present data and information on current acoustic monitoring research efforts and to evaluate the potential for incorporating similar technology and methods in Navy activities. The Navy supports research efforts on acoustic monitoring and will continue to investigate the feasibility of passive acoustics as a potential monitoring tool. Overall, the Navy will continue to research and contribute to university/external research to improve the state of the science regarding marine species biology and acoustic effects. These efforts include monitoring programs, data sharing with NOAA Fisheries Service from research and development efforts, and future research as described previously. The Navy Natural Resource Management Program has invested in several marine resource surveys in and around the Piscataqua River Estuary. In 2016, the Navy conducted biological and environmental near shore surveys covering multiple resources including marine mammals. The Navy recently initiated a 24-month survey of the occurrence, distribution and density of marine mammals in the Piscataqua River. The first survey was conducted in January 2017 and will continue monthly through December 2018. This data along with monitoring data collected as mitigation for the IHAs will help provide a better understanding of marine mammals in the estuary, help support management of the resource and support future mission readiness activities.

Waterfront Improvement Projects at Portsmouth Naval Shipyard Request for an Incidental Harassment Authorization
13-1 October 2017
15 List of Preparers Project Oversight and Document Preparation Lauren Lohn (Cianbro Corporation, Pittsfield ME) B.S. Biology, Moravian College, 1997 Years of Experience: 18 Cianbro Corporation Environmental Manager *The Year 1 Application and associated information was utilized to prepare the Year 2 Application. Cianbro Corporation provided construction sequencing, schedule and equipment information to revise take calculation estimates. Provided Oversight and Review of Year 2 Application in Coordination with Cianbro Kari S. Moore (Naval Facilities Engineering Command, PWD Maine, EV) M.S. Environmental Science, SUNY College of Environmental Science and Forestry at Syracuse, 1992 Years of Experience: 20 Portsmouth Naval Shipyard NEPA Manager Ian Trefry (Naval Facilities Engineering Command, PWD Maine, EV) B.S. Wildlife Management, SUNY Cobleskill, 2001 Years of Experience: 15 Responsible for: Biological Resources Jessica Bassi (Naval Facilities Engineering Command, Mid-Atlantic, EV) B.S. Marine Biology, University of North Carolina Wilmington, 2005 Years of Experience: 12 Responsible for: Natural and Marine Resources Cara Hotchkin (Naval Facilities Engineering Command, Atlantic, EV) Ph.D. Ecology, The Pennsylvania State University, 2012 B.S. Marine Biology, University of Rhode Island, 2007 B.S. Coastal and Marine Policy and Management, University of Rhode Island, 2007 Years of Experience: 5 Acoustics SME

Waterfront Improvement Projects at Portsmouth Naval Shipyard Request for an Incidental Harassment Authorization
13-1 October 2017
16 Literature Cited American National Standards Institute. 1986. Methods for measurement of impulse noise (ANSI S12.7-
1986). New York: Acoustical Society of America.
Baird, R.W. 2001. Status of harbour seals, Phoca vitulina, in Canada. The Canadian Field-Naturalist. 115: 663 – 675.
Blackwell, S.B., J.W. Lawson, and M.T. Williams. 2004. Tolerance by ringed seals (Phoca hispida) to impact pipe-driving and construction sounds at an oil production island. Journal of the Acoustical Society of America. 115(5): 2346-2357.
Blackwell, S.B. and C.R. Greene Jr. 2002. Acoustic measurements in Cook Inlet, Alaska during August 2001. Greeneridge Report 271-2. Report from Greeneridge Sciences, Inc., Santa Barbara for National Marine Fisheries Service, Anchorage, AK. 43 p.
Blue Ridge Research and Consulting (BBRC). 2015. Portsmouth Naval Shipyard Community Noise Study. Draft. September.
Burgess, W., S. Blackwell (Greeneridge Sciences, Inc.), and R. Abbott (URS Corporation). 2005. Underwater Acoustic Measurements of Vibratory Pile Driving at the Pipeline 5 Crossing in the Snohomish River, Everett, Washington. Greeneridge Sciences, Inc. Report 322-2. http://www.greeneridge.com/doc/Burgess_et_al_2005.pdf.
Burns, J.J. 2009. Harbor seal and spotted seal (Phoca vitulina and P. largha)., In: Perrin W.F., B. Wursig, and J.G.M. Thewissen (eds.) Encyclopedia of Marine Mammals, second edition, pp. 533 – 542, Academic Press Inc. San Diego, CA.
California Department of Transportation (CALTRANS). 2001. Marine Mammal Impact Assessment for the San Francisco- Oakland Bay Bridge Pile Installation Demonstration Project. PIDP EA 012081
(CALTRANS). 2006. Marine mammals and acoustic monitoring for the marine foundations at piers E2 and T1. January - September 2006. San Francisco - Oakland Bay Bridge East Span Seismic Safety Project. Contract No. 04-SF-80 KP 12.2/KP 14.3, 04-ALA-80 KP 0.0/KP 2.1. Prepared by SRS Technologies and Illingworth and Rodkin, Inc. Prepared for California Department of Transportation.
(CALTRANS). 2007. Compendium of Pile Driving Sound Data. Report. Published Sept. 27, 2007.
(CALTRANS).2015 Technical Guidance for Assessment and Mitigation of the Hydroacoustic Effects of Pile Driving on Fish. November 2015. California Department of Transportation Division of Environmental Analysis Environmental Engineering Hazardous Waste, Air, Noise, Paleontology Office © 2015
Cetacean and Turtle Assessment Program (CeTAP). 1982. A Characterization of Marine Mammals and Turtles in the Mid- and North Atlantic Areas of the U.S. Outer Continental Shelf. Final Report, December 1982. Prepared for the U.S. Department of the Interior, Bureau of Land Management under Contract #AA51-CT8-48. University of Rhode Island, Graduate School of Oceanography, Kingston, Rhode Island.

Waterfront Improvement Projects at Portsmouth Naval Shipyard Request for an Incidental Harassment Authorization
13-2 October 2017
Chapman, C.J. and A.D. Hawkins. 1969. The importance of fish behaviour in relation to capture by trawls. FAO Fisheries Report 62(3): 717-729.
Crain, Jonathan L. CIV NACFAC NW, EV41. 2015. Personal Communication to DiMatteo, Andrew CIV NAVFAC LANT, EV; Hotchkin, Cara F CIV NAVFAC Atlantic,Cc: Bort, Jacqueline E CIV NAVFAC LANT, EV; Bassi, Jessica CIV NAVFAC MIDLANT, EV. Subject: RE: Draft Acoustic Analysis Plan for Berths 11, 12, and 13.
CR Environmental, Inc. 2014. Benthic Survey, Portsmouth Naval Shipyard, Kittery, Maine. August 2014. 8 pp. (+ appendices).
Dazey, E., M. McIntosh, S. Brown, and K.M. Dudzinski. 2012. Assessment of Underwater Anthropogenic Noise Associated with Construction Activities in Bechers Bay, Santa Rosa Island, California. Journal of Environmental Protection; 3: 1286–1294.
Department of Fisheries and Oceans. 2003. Atlantic Seal Hunt: 2003 – 2005 Management Plan. Department of Fisheries and Oceans. Fisheries Resource Management – Atlantic, Ottawa, Ontario, Canada. 34 pp.
Department of the Navy. August 2013. Atlantic Fleet Training and Testing Final Environmental Impact Statement / Overseas Environmental Impact Statement. Volume II. Section 3.4 Marine Mammals.
__________. 2010a. Incidental Harassment Authorization Application for Navy Training Conducted within the Silver Strand Training Complex. Updates #1, #2, and #3, Submitted to NMFS Office of Protected Resources. Online: http://www.nmfs.noaa.gov/pr/pdfs/permits/sstc_iha_v3.pdf. Accessed November 24, 2014.
__________. 2010b. Incidental Harassment Authorization Application for the Navy’s EHW-1 Pile Replacement Project Conducted at Naval Base Kitsap Bangor, Submitted to NMFS Office of Protected Resources. Online: http://www.nmfs.noaa.gov/pr/pdfs/permits/ehw_iha121510.pdf. Accessed November 24, 2014.
ESS Group, Inc. 2015. PNSY Dry Dock No. 1 Lifting and Handling Improvements Ambient Sound Assessment Results, Kittery, Maine, ESS Project No. N492-000.02. Massachusetts, Rhode Island, and Virginia Field Offices.
Finneran, J.J., R. Dear, D.A. Carder, and S.H. Ridgway. 2003. Auditory and behavioral responses of California sea lions (Zalophus californianus) to single underwater impulses from an arc-gap transducer. Journal of the Acoustical Society of America. 114(3): 1667-1677.
Finneran, J. J., D. A. Carder, C. E. Schlundt, and S. H. Ridgway, 2005. Temporary threshold shift in bottlenose dolphins (Tursiops truncatus) exposed to mid- frequency tones. Journal of the Acoustical Society of America 118:2696–2705.
Finneran, J.J. and A.K. Jenkins. 2012. Criteria and Thresholds for U.S. Navy Acoustic and Explosive Effects Analysis. SPAWAR Systems Center Pacific. April.
Garman, G and L. Harris (eds). 1995. Coastal Hazardous Waste Site Reviews. September 1995. Seattle: Hazardous Materials Response and Assessment Division, National Oceanic and Atmospheric Administration. 124 pp. Online: http://archive.orr.noaa.gov/book_shelf/946_ 1995_sept_NPL.pdf. Accessed October 24, 2014.

Waterfront Improvement Projects at Portsmouth Naval Shipyard Request for an Incidental Harassment Authorization
13-3 October 2017
Hanggi, E.B. and R.J. Schusterman. 1994. Underwater acoustic displays and individual variation in make harbor seals, Phoca vitulina. Animal Behavior. 48: 1275-1283.
Harris, C.M. 1998. Handbook of acoustical measurements and noise control (3rd Edition). Huntington, NY: Acoustical Society of America.
Hastings, M.C., and A.N. Popper. 2005. Effects of Sound on Fish. Report prepared by Jones and Stokes for California Department of Transportation, Contract No. 43A0139, Task Order 1.
ICF Jones & Stokes, and Illingworth and Rodkin, Inc. 2012. Compendium of Pile Driving Sound Data. October 2012. Updated from Technical Guidance for Assessment and Mitigation of Hydroacoustic Effect of Pile Driving on Fish. Prepared for California Department of Transportation. February 2009. 215pp.
Jones, S.H. 2000. A Technical Characterization of Estuarine and Coastal New Hampshire. Published by the New Hampshire Estuaries Project. Edited by Dr. Stephen H. Jones, Jackson Estuarine Laboratory, University of New Hampshire, Durham, NH. Online: http://www.prep.unh.edu/resources/pdf/atechnicalcharacterization-nhep-00.pdf. Accessed November 19, 2014.
Kastak, D. and R. Schusterman. 1998. Low-frequency amphibious hearing in pinnipeds: Methods, measurements, noise, and ecology. Journal of the Acoustical Society of America, 103: 2216-2228.
Kastak, D., R.J. Schusterman, B.L. Southall and C.J. Reichmuth. 1999. Underwater temporary threshold shift induced by octave-band noise in three species of pinniped. Journal of the Acoustic Society of America. Journal of the Acoustic Society of America. 106(2):1142-1148.
Kastelein, R.A., P. Bunskoek, M Hagedoorn, W.W.L. Au, and D. de Haan. 2002. Audiogram of a harbor porpoise (Phoenea phocoena) measures with narrow-band frequency-modulated signals. Journal of the Acoustical Society of America. 112(1): 334-344.
Katona, S.K., V. Rough, and D.T. Richardson. 1993. A field guide to whales, porpoises, and seals from Cape Cod to Newfoundland. Smithsonian Institution Press, Washington, DC. 316 pp.
Ketten, D.R. 2000. Cetacean ears. Pp. 43-108. In: W.W.L. Au, A.N. Popper, and R.R. Fay (eds.). Hearing by Whales and Dolphins. New York: Springer-Verlag. Krahn, M.M., M.J. Ford, W.F. Perrin, P.R. Wade, R.P. Angliss, M.B. Hanson, B.L.
Kinsler, L.E. Fundamentals of Acoustics. 2000. Wiley, New York/Chichester 2000-01-26
Krause, David J. CIV NAVFAC MIDLANT, EV. 2015. Personal Communication to Jessica Forbes Project Manager ENE, Cc: Moore, Kari S CIV NAVFAC MIDLANT, PWD Maine; Bassi, Jessica CIV NAVFAC MIDLANT, EV. Subject: RE: Draft Acoustic Analysis Plan for Berths 11, 12, & 13.
Lesage, V. and M.O. Hammill. 2001. The status of the gray seal, Halichoerus grypus, in the Northwest Atlantic. The Canadian Field-Naturalist. 115(4): 653 – 662.
Longmuir, C. and T. Lively. 2001. Bubble curtain systems for use during marine pile driving. Report by Fraser River Pile and Dredge Ltd., New Westminster, BC.

Waterfront Improvement Projects at Portsmouth Naval Shipyard Request for an Incidental Harassment Authorization
13-4 October 2017
Magnusson, M., C. Colgan, and R. Gittell. June 2012. The Economic Impact of the Piscataqua River and the Ports of Portsmouth and Newington. Online: http://www.maine.gov/mdot/tigergrants/tiger2014/smlbrg/Appendices/BOtherDocuments/TechnicalReports/B8_Port_of_Portsmouth_Economic_Impact_Analysis.pdf. Accessed November 19, 2014.
Malme, C.I., P.R. Miles, C.W. Clark, P.L. Tyack, and J.E. Bird. 1984. Investigations of the potential effects of underwater noise from petroleum industry activities on migrating gray whale behavior. Phase II, January 1984 migration. Prepared by Bolt, Beranek, and Newman, Cambridge, MA. Prepared for United States Minerals Management Service, Alaska, OCS Office, Anchorage, AK.
Malme, C.I., B. Wursig, J.E. Bird, and P.L. Tyack. 1986. Behavioral responses of gray whales to industrial noise: feeding observations and predictive modeling. Final Report, Outer Continental Shelf Environmental Assessment Program, Research Unit 675. Report No. 6265, BBN Laboratories Inc. August.
Marine Species Modeling Team. 2012. Determination of Acoustic Effects on Marine Mammals and Sea Turtles for the Hawaii-Southern California Training and Testing Environmental Impact Statement/Overseas Environmental Impact Statement. Naval Undersea Warfare Center Division Newport, Rhode Island. NUWC-NPT Technical Report 12,084. 12 March.
Mansfield, A.W. 1967. Distribution of the harbor seal, Phoca vitulina Linnaeus, in Canadian Arctic waters. Journal of Mammalogy. 48(2): 249 – 257.
McGinn, Dennis. March 31, 2015. Department of the Navy, the Assistant Secretary of the Navy, (Energy, Installations and Environment). Memorandum for Commander, Navy Installations Command, Marine Corps Installations Command, Deputy Chief of Naval Operations for Fleet Readiness and Logistics, Re: Shore Energy Policy Requirement Guidance for Renewable Energy Program Office Model 2 Projects
Miller, G.W., R.E. Elliott, W.R. Koski, V.D. Moulton, and W.J. Richardson. 1999. Whales. In: Marine Mammal and Acoustical Monitoring of Western Geophysical’s Open-Water Seismic Program in the Alaskan Beaufort Sea, 1998, LGL and Greeneridge, eds. LGL Report TA 2230-3. King City, Ont., Canada: LGL Ecological Research Associates, Inc., 109 pp.
Mohn, R. and W.D. Bowen. 1996. Grey seal predation on the eastern Scotian Shelf: Modeling the impact on Atlantic cod. Canadian Journal of Fisheries and Aquatic Sciences. 53: 2722 – 2738.
Moulton, V. D., Richardson, W. J., Elliott, R. E., McDonald, T. L., Nations, C., and Williams, M. T. 2005. Effects of an offshore oil development on local abundance and distribution of ringed seals (Phoca hispida) of the Alaskan Beaufort Sea. Marine Mammal Science, 21, 217-242.
National Oceanic and Atmospheric Administration (NOAA). n.d. Tides and Currents: Tide Predictions-Portsmouth, NH Station 8423745. High/Low Tide Predictions in Feet from 2014/08/05 – 2014/08/06. Online: http://tidesandcurrents.noaa.gov/noaatidepredictions/NOAATidesFacade.jsp?Stationid=8423745. Accessed August 5, 2014
National Marine Fisheries Service. 2016. Technical Guidance for Assessing the Effects of Anthropogenic Sound on Marine Mammal Hearing: Underwater Acoustic Thresholds for Onset of Permanent and Temporary Threshold Shifts. U.S. Dept. of Commer., NOAA. NOAA Technical Memorandum NMFS-OPR-55, 178p. http://www.nmfs.noaa.gov/pr/publications/techmemos.htm

Waterfront Improvement Projects at Portsmouth Naval Shipyard Request for an Incidental Harassment Authorization
13-5 October 2017
National Ocean and Atmospheric Administration (NOAA) Fisheries Service. January 2010. Harbor Porpoise Take Reduction Team: New England. Online: http://www.greateratlantic.fisheries.noaa.gov/prot_res/porptrp/doc/HPTRPNewEnglandGuide.pdf. Accessed October 28, 2014.
__________. 2012b. Hooded Seal (Cystophora cristata). Updated November 26, 2012. Online: http://www.nmfs.noaa.gov/pr/species/mammals/pinnipeds/hoodedseal.htm. Accessed November 24,2014.
__________. 2013. Gray Seal (Halichoerus grypus). Updated August 13, 2013. Online: http://www.nmfs.noaa.gov/pr/species/mammals/pinnipeds/grayseal.htm. Accessed November 24, 2014.
__________. 2014a. Harbor Porpoise (Phocoena phocoena). Updated March 17, 2104. Online: http://www.nmfs.noaa.gov/pr/species/mammals/cetaceans/harborporpoise.htm. Accessed October 28, 2014.
__________. 2014c. Harbor Seal (Phoca vitulina). Updated October 8, 2014. Online: http://www.nmfs.noaa.gov/pr/species/mammals/pinnipeds/harborseal.htm. Accessed November 24, 2014.
__________. 2015. Harp Seal (Pagophilus groenlandicus). Updated January 15, 2015. Online: http://www.fisheries.noaa.gov/pr/species/mammals/seals/harpseal.html. Accessed December 4, 2014.
National Marine Fisheries Service (NMFS). 2005. Endangered Fish and Wildlife; Notice of Intent to Prepare and Environmental Impact Statement. Federal Register Vol. 70, No. 7. 1871-1875.
___________. 2008. Taking of marine mammals incidental to specified activities; construction of the east span of the San Francisco-Oakland Bay Bridge. 73 FR 38180, July 3, 2008.
__________. 2009. Taking of marine mammals incidental to specified activities; construction of the East Span of the San Francisco-Oakland Bay Bridge. 74 FR 41684.
___________. 2013. Draft Guidance for Assessing the Effects of Anthropogenic Sound on Marine Mammals: Acoustic Levels for Onset of Permanent and Temporary Threshold Shifts.
National Research Council of the National Academies. 2005. Marine Mammal Populations and Ocean Noise: Determining When Noise Causes Biologically Significant Effects. National Research Council of the National Academies: Committee on Characterizing Biologically Significant Marine Mammal Behavior, Ocean Studies Board, and Division on earth and Life Studies. The National academies Press Washington, D.C. p. 26.
Navy 2016
Navy (U.S. Department of the Navy). 2005. 2005 Navy Occupational Safety and Health Program Manual (OPNAVINST 5100-23G, 2005). http://www.public.navy.mil/comnavsafecen/Documents/ OSH/SafetyOfficer/5100.23G_CH-1_with_updated_links.pdf. Accessed November 11, 2014.

Waterfront Improvement Projects at Portsmouth Naval Shipyard Request for an Incidental Harassment Authorization
13-6 October 2017
__________. 2013. Naval Base Kitsap at Bangor Trident Support Facilities Explosive Handling Wharf (EHW-2) Project Acoustic Monitoring Report. Bangor, Washington. 23 April 2013. http://www.nmfs.noaa.gov/pr/pdfs/permits/navy_kitsap_ehw2_acoustics2013.pdf. Accessed 18 January 2016.
___________. January 10, 2014. Office of the Chief of Naval Operations M-5090.1 Environmental Readiness Program Manual.
NREL (National Renewable Energy Laboratory). 2014a. Navy Renewable Energy Screening Results (FY 2012). Updated January 9, 2014. Excel Workbook “Navy Report DATABASE 01 9-14 Net Zero and LLCC only.xlsx”.
Nowacek, D.P., L.H. Thorne, D.W. Johnston, and P.L. Tyack. 2007. Responses of cetaceans to anthropogenic noise. Mammal Review. 37(2): 81-115.
O’Keeffe, D.J. and G.A. Young. 1984. Handbook on the environmental effects of underwater explosions. Naval Surface Weapons Center, Dahlgren and Silver Spring, NSWC TR 83-240.
Palka, D., A. Read, and C. Potter. 1997. Summary of knowledge of white-sided dolphins (Lagenorhynchus acutus) from U.S. and Canadian Atlantic waters. Report for the International Whaling Commission. 47: 729 – 734.
Pearson, W.H., J.R. Skalski, and C.I. Malme. 1992. Effects of sounds from a geophysical survey device on behavior of captive rockfish (Sebastes spp.). Canadian Journal of Fisheries and Aquatic Sciences 49: 1343-1356.
Popper, A.N. and M. Hastings. 2009. The effects of human-generated sound on fish. Integrative Zoology 4: 43-52.
Popper, A.N., Hawkins, A.D., Fay,R., Mann, D.A., Bartol, S., Carlson, T.J., Coombs, S., Ellison, W.T., Gentry, R.L., Halvorsen, M.B., Lokkeborg, S., Rogers, P., Southall, B.L., Zeddies, D.G., and Tavolga, W.N. 2014. Sound Exposure Guidelines for Fishes and Sea Turtles: Technical Report by ANSI-Accredited Standards Committee. ASA Press, Springer, New York.
Reeder, D. M. and K.M. Kramer. 2005. Stress in free-ranging mammals: Integrating physiology, ecology, and natural history. Journal of Mammalogy. 86(2): 225-235.
Reeves, Randall, Brent Stewart, Phillip Clapham, and James Powell. 2002. Guide to Marine Mammals of the World. Chanticleer Press, Inc. New York.
Richardson, W.J., C.R. Greene, Jr., C.I. Malme, and D.H. Thomson. 1995. Marine Mammals and Noise. Academic Press, San Diego, CA.
Ridgway, S.H., D.A. Carder, R.R. Smith, T. Kamolnick, C. E. Schlundt, and W. R. Elsberry, 1997. Behavioral responses and temporary shift in masked hearing threshold of bottlenose dolphins, Tursiops truncatus, to 1-second tones of 141 to 201 dB re 1 μPa. Technical Report 1751, Revision 1. San Diego, California: Naval Sea Systems Command.
Skalski, J.R., W.H. Pearson, and C.I. Malme. 1992. Effects of sounds from a geophysical survey device on catch-per-unit-effort in a hook-and-line fishery for rockfish (Sebastes spp.). Canadian Journal of Fisheries and Aquatic Sciences 49: 1357-1365.

Waterfront Improvement Projects at Portsmouth Naval Shipyard Request for an Incidental Harassment Authorization
13-7 October 2017
Southall, B.L., A.E. Boelws, W.T. Ellison, J.J. Finneran, R.L. Gentry, C.R. Green, Jr., D. Kastak, D.R. Ketten, J.H. Miller, P.E. Nachtigall, W.J. Richardson, J.A. Thomas, and P.L. Tyack. 2007. Marine Mammal Noise Exposure Criteria: Initial Scientific Recommendations. Aquatic Mammals. 33(4).
Smith, B.W. n.d. The Marine Living Resources of the Piscataqua River. New Hampshire Fish and Game Department. Online: http://des.nh.gov/organization/divisions/water/wmb/coastal/ocean_policy/documents/te_workshop_piscataqua_marine.pdf. Accessed August 21, 2014.
Trefry, Ian. November 20, 2015. Personal communication. Natural Resource Manager. Naval Facilities Engineering Command, Public Works Department Maine. Personal correspondence with Ecology & Environment, Inc. Virginia Beach, Virginia.
Temte, J.L., M.A. Bigg, and O. Wiig. 1991. Clines revisited: the timing of pupping in the harbor seal (Phoca vitulina). Journal of the Zoological Society of London. 224: 617 – 632.
Terhune, J. and S. Turnbull. 1995. Variation in the psychometric functions and hearing thresholds of a harbour seal. Pages 81-93. IN: R.A. Kastelein, J.A. Thomas, and P.E. Nachtigall, eds. Sensory Systems of Aquatic Mammals. De Spil Publishers, Woerden, Netherlands.
Trzcinski, M.K., R. Mohn, and W.D. Bowen. 2005. Estimation of grey seal population size and trends at Sable Island. DFO Research Document 2005/067. Canadian Department of Fisheries and Oceans. Ottawa, Ontario. 10 pp. Online: http://www.dfompo.gc.ca/CSAS/Csas/DocREC/2005/RES2005_067_e.pdf. Accessed December November 24, 2014.
Urick, Robert J. 1983. Principles of underwater sound. 3rd ed. New York: McGraw-Hill.
USACE (U.S. Army Corps of Engineers). 1988. Visual Impact Assessment Procedures for U.S. Army Corps of Engineers. Prepared by the State University of New York, College of Environmental Science and Forestry, Syracuse, New York.
USDA (U.S. Department of Agriculture). 1995. Landscape Aesthetics: A Handbook for Scenery Management. Agricultural Handbook Number 701. Accessed September 5, 2013: www.fs.fed.us/cdt/carrying_capacity/landscape_aesthetics_handbook_701_no_append.pdf
USFS (U.S. Forest Service). 1974. National Forest Landscape Management, Volume 2, Chapter 1: The Visual Management System: Agriculture Handbook 462. U.S. Department of Agriculture. Accessed September 5, 2013 http://pbadupws.nrc.gov/docs/ML1224/ML12241A372.pdf
__________. 1995. Landscape Aesthetics: A Handbook for Scenery Management. Agricultural Handbook Number 701. www.fs.fed.us/cdt/carrying_capacity/landscape_aesthetics_handbook_701_no_append.pdf. Accessed September 5, 2013.
Viada, S.T., R.M. Hammer, R. Racca, D. Hannay, M.J. Thompson, B.B. Balcom, and N.W. Phillips. 2008. Review of potential impacts to sea turtles from underwater explosive removal of offshore structures. Environmental Impact Assessment. 28: 267-285.

Waterfront Improvement Projects at Portsmouth Naval Shipyard Request for an Incidental Harassment Authorization
13-8 October 2017
Van Parijs, S.M., P.J. Corkeron, J. Harvey, S.A. Hayes, D.K. Mellinger, P.A. Rouget, P.M. Thompson, M. Wahlberg, and K.M. Kovacs. 2003. Patterns in the vocalizations of male harbor seals. Journal of the Acoustical Society of America. 113(6):3403-3410.
Waring, G.T., E. Josephson, C.P. Fairfield-Walsh, K. Maze-Foley, and editors. 2007. U.S. Atlantic and Gulf of Mexico Marine Mammal Stock Assessment Report – 2007. NOAA Tech Memo NMFS NE 205. 415 p.
Waring, G.T., Josephson, K. Maze-Foley, P.E. Rosel, and editors. 2009. U.S. Atlantic and Gulf of Mexico Marine Mammal Stock Assessments -- 2009. NOAA Tech Memo NMFS NE 213; 528p.
__________. 2012. U.S. Atlantic and Gulf of Mexico Marine Mammal Stock Assessments – 2011. NOAA Tech Memo NMFS NE 221; 319p
__________. 2014. U.S. Atlantic and Gulf of Mexico Marine Mammal Stock Assessments -- 2013. NOAA Tech Memo NMFS NE 228; 464p.
Wartzok, D., A.N. Popper, J. Gordon and J. Merrill. 2003/04. Factors affecting the responses of marine mammals to acoustic disturbance. Marine Technology Society Journal 37(4):6-15.
Washington State Department of Transportation (WSDOT). 2010. Port Townsend Test Pile Project. Underwater Noise Monitoring Draft Final Report. Jim Laughlin. Washington State Department of Transportation Office of Air Quality and Noise. November 10, 2010. Seattle, WA.
Wolski, L.F., R.C. Anderson, A.E. Bowles, and P.K. Yochem. 2003. Measuring hearing in the harbor seal (Phoca vitulina): Comparison of behavioral and auditory brainstem response techniques. Journal of the Acoustical Society of America. 113(a): 629-637.
Yelverton, J.T., D.R. Richmond, E.R. Fletcher, and R.K. Jones. 1973. Safe distances from underwater explosions for mammals and birds. Lovelace Foundation, Albuquerque, DNA 3114T. http://stinet.dtic.mil/cgibin/GetTRDoc?AD=AD766952andLocation=U2anddoc=Get TRDoc.pdf

Waterfront Improvement Projects at Portsmouth Naval Shipyard Request for an Incidental Harassment Authorization