fatigue analysis of arteries using finite element method - North ...

In vivo imaging of rat coronary arteries using bi-plane digitalsubtraction angiography
Cristian T. Badeaa, Laurence W. Hedlunda, Yi Qia, Brian Berridgeb, and G. Allan Johnsona
aCenter for In Vivo Microscopy, Duke University Medical Center, Durham, NC 27710, USAbGlaxoSmithKline Safety Assessment, 5 Moore Drive, Research Triangle Park, NC 27709, USA
AbstractINTRODUCTION—X-ray based digital subtraction angiography (DSA) is a common clinicalimaging method for vascular morphology and function. Coronary artery characterization is one ofits most important applications. We show that bi-plane DSA of rat coronary arteries can provide apowerful imaging tool for translational safety assessment in drug discovery.
METHODS—A novel, dual tube/detector system, constructed explicitly for preclinical imaging,supports image acquisition at 10 frames/second with 88-micron spatial resolution. Ventilation, x-ray exposure, and contrast injection are all precisely synchronized using a biological sequencecontroller implemented as a LabVIEW application. A set of experiments were performed to testand optimize the sampling and image quality. We applied the DSA imaging protocol to recordchanges in the visualization of coronaries and myocardial perfusion induced by a vasodilator drug,nitroprusside. The drug was infused into a tail vein catheter using a peristaltic infusion pump at arate of 0.07 ml/h for 3 mins (dose: 0.0875 mg). Multiple DSA sequences were acquired before,during, and up to 25 minutes after drug infusion. Perfusion maps of the heart were generated inMATLAB to compare the drug effects over time.
RESULTS—The best trade-off between the injection time, pressure, and image quality wasachieved at 60 PSI, with the injection of 150 ms occurring early in diastole (60 ms delay) andresulting in the delivery of 113 microL of contrast agent. DSA images clearly show the mainbranches of the coronary arteries in an intact, beating heart. The drug test demonstrated that DSAcan detect relative changes in coronary circulation via perfusion maps.
DISSCUSION—The methodology for DSA imaging of rat coronary arteries can serve as atemplate for future translational studies to assist in safety evaluation of new pharmaceuticals.Although x-ray imaging involves radiation, the associated dose (0.4 Gy) is not a major limitation.
Keywordsdigital subtraction angiography; rat; coronary arteries
© 2011 Elsevier Inc. All rights reserved.Corresponding author: Cristian Badea, Center For In Vivo Microscopy, Box 3302 Duke University Medical Center, Durham, NC27710, 919-684-7858, [email protected] .Publisher's Disclaimer: This is a PDF file of an unedited manuscript that has been accepted for publication. As a service to ourcustomers we are providing this early version of the manuscript. The manuscript will undergo copyediting, typesetting, and review ofthe resulting proof before it is published in its final citable form. Please note that during the production process errors may bediscovered which could affect the content, and all legal disclaimers that apply to the journal pertain.
NIH Public AccessAuthor ManuscriptJ Pharmacol Toxicol Methods. Author manuscript; available in PMC 2012 September 1.
Published in final edited form as:J Pharmacol Toxicol Methods. 2011 September ; 64(2): 151–157. doi:10.1016/j.vascn.2011.05.008.
NIH
-PA Author Manuscript
NIH
-PA Author Manuscript
NIH
-PA Author Manuscript

IntroductionPreclinical imaging of small animal models has become an important component ofbiomedical, pharmaceutical, and genomic research programs. Imaging can be particularlyuseful for integrated (e.g. structure and function) approaches to the preclinical assessment ofsafety for novel therapeutics with the added benefit of functioning as a translationalbiomarker. To meet this need, the technology for in vivo, small animal imaging hasadvanced rapidly in recent years to include magnetic resonance microscopy(Johnson,Hedlund et al. 1992), micro-CT(Holdsworth and Thornton 2002), micro-ultrasound(Hoit2001), micro-PET/SPECT(Herschman 2003), and optical methods based on fluorescenceand bioluminescence(Ntziachristos, Ripoll et al. 2005). We and others have recently addedx-ray-based digital subtraction angiography (DSA) (Buhalog, Yasuda et al. ; Lin, Samei etal. 2006; Badea, Hedlund et al. 2007; Badea, Drangova et al. 2008) to this imagingarmamentarium.
Drug-induced vascular injury is a particularly challenging drug safety concern for a numberof reasons. Prominent among these are an incomplete understanding of the predictivity ofpreclinical models for clinical risk and lack of a sensitive and relevant translationalbiomarker strategy. Many of the best characterized preclinical models of vascular injuryinvolve drugs that are vasoactive—i.e., induce vasoconstriction or vascular relaxation/vasodilation(Kerns, Arena et al. 1989; Dogterom, Zbinden et al. 1992; Hanton, Le Net et al.1995; Louden, Brott et al. 2006). In traditional preclinical safety paradigms, these effects arecharacterized by correlating changes in systemic blood pressure as a surrogate forvasoactivity with histologic evidence of lesions in blood vessels of various organ systems,including the heart. Paradoxically, these assessments are generally collected in separatestudy settings. Sensitive measures of systemic blood pressure are most often collected insingle-dose telemetered animal safety pharmacology studies. Morphologic characterizationof vascular injury, on the other hand, is done in repeat-dose studies from whichrepresentative tissues are collected for histologic examination. This paradigm lacks theability to visualize tissue-specific vasoactivity where blood vessel lesions occur. Coronaryarteries are a recognized site of drug-induced vascular injury in both rodents and non-rodents(Kerns, Arena et al. 1989; Dogterom, Zbinden et al. 1992; Louden, Brott et al. 2006).
In many vascular studies, useful information can be obtained from two-dimensional (2D)digital subtraction angiography (DSA) projection images. First suggested by Mistretta et al.(Mistretta, Ort et al. 1973), DSA is now a routine clinical imaging modality and coronaryartery DSA is one of its main applications(Struyven, Delcour et al. 1986). However, to date,there have been only limited studies using DSA for preclinical imaging(de Lin, Ning et al.2008; Lin, Marshall et al. 2009). Yet, much potential exists for this modality given its easeof use, throughput, potential high speed, and relatively low cost. DSA can be based on eithertemporal subtraction or k-edge subtraction. The latter technique is based on the nonlineardifferences in the attenuation of iodine with the x-ray beam energy. A k-edge describes asudden increase in the attenuation coefficient of x-ray photons. K-edge DSA ideally requiresimaging on both sides of the k-edge of iodine with monochromatic x-rays obtained using asynchrotron source as in(Schültke, Fiedler et al.). However, the need of a synchrotron limitsthe availability of such a method, since the majority of x-ray imaging systems are usingpolychromatic x-ray sources and are therefore, better suited for temporal subtraction. Wereport here methods for in vivo DSA based on temporal subtraction based on the injection ofcontrast agent and image acquisition before and after the contrast injection.
Coronary arteries in the rat have been previously visualized using synchrotron x-rayradiation(Matsushita, Hyodo et al. 2005; Matsushita, Hyodo et al. 2008). Although thisapproach provides very high resolution (13 microns), the studies were limited to ex vivo
Badea et al. Page 2
J Pharmacol Toxicol Methods. Author manuscript; available in PMC 2012 September 1.
NIH
-PA Author Manuscript
NIH
-PA Author Manuscript
NIH
-PA Author Manuscript

Langerdorff heart preparations (Skrzypiec-Spring, Grotthus et al. 2007). Recently, Ishikuraet al. (Ishikura, Hirayama et al. 2008) have shown three-dimensional (3D) real-time contrastechocardiography of rat coronary arteries. The image quality, however, is inferior comparedto the x-ray-based imaging. In this work, we describe a bi-plane DSA system based onconventional x-ray tubes and CCD-based solid state detectors to image rat coronary arteriesin vivo.
Our goal was to develop methods for imaging in rats that might provide translationalinformation to assist safety assessment in drug discovery. We demonstrate that DSA can beused, not only for morphological evaluation of the coronary arteries, but also for assessingmyocardial perfusion in a case study using the drug nitroprusside.
Materials and MethodsI. Dual source/detector x-ray system
We have developed a unique, dual tube/detector radiographic system that allows high-resolution imaging with high photon fluence rate, and integrated motion control, i.e. imagingis synchronized to respiratory and cardiac activity to reduce the motion artifacts. The systemis also used for micro-CT, which was described previously (Badea, Johnston et al. 2008).The CT system uses two Varian A197 x-ray tubes (Varian Medical Systems, Palo Alto, CA)with dual focal spots of 0.3/0.8 mm. The tubes are commonly used in clinical angiography,which requires high instantaneous flux and large heat capacity. Two Epsilon HighFrequency x-ray generators (EMD technologies Quebec, Canada) are used to control both x-ray tubes. The system has two detectors with a Gd2O2S phosphor (XDI-VHR 2 115 mm,Photonic Science, East Sussex, UK) with pixel size of 22 microns, 115-mm input taper size,and 4008 × 2672 image matrix. Both detectors allow on-chip binning of up to 8 × 8 pixels,and sub-area readout to allow higher-speed readout of 10 frames/second, i.e. a temporalresolution of 100 ms. The high-performance x-ray tubes/generators provide short (10 ms)exposures that minimize motion blur with sufficient flux to fill the 14 bits of the detectordigitizer. The x-ray tubes and detectors are stationary in the horizontal plane with the subjectpositioned vertically on a rotatable stage betweenthe tubes/detector. The source-to-subjectdistance (702 mm), subject-to-detector distance (100 mm), and a source-to-detector distance(802 mm), results in a geometric blur of the focal spot that matches the Nyquist sample atthe detector(Badea, Hedlund et al. 2004). X-ray settings for DSA imaging were 80 kVp, 160mA, and 10 ms per exposures. The x-ray generators, tubes, detectors, and injector arecontrolled by a sequencer application written in LabVIEW (National Instruments, Austin,TX) to provide precise cardio-respiratory gating of each image.
II. Micro-injectorFor contrast injection, we used a custom-built, power micro-injector consisting of acomputer-controlled solenoid valve attached to the contrast injection catheter and a heatedcontrast agent reservoir, which is powered by N2 at up to 90 PSI (de Lin, Ning et al. 2008).The high power pressure driving the injection is necessary to compensate for the smallcaliber lumen and high resistance of the injection catheters (3 Fr). The high power is alsoneeded to achieve the high flow velocity for bolus injections. This device reproduciblyinjects volumes as little as 6 microL at 1 to 2 microL/ms. The contrast agent we have used isIsovue containing 370 mg/ml iodine (Isovue-370, Bracco Diagnostics Inc, Princeton, NJ).The contrast agent was heated to the body temperature of the rat, eliminating thermal shockand reducing contrast viscosity.
Badea et al. Page 3
J Pharmacol Toxicol Methods. Author manuscript; available in PMC 2012 September 1.
NIH
-PA Author Manuscript
NIH
-PA Author Manuscript
NIH
-PA Author Manuscript
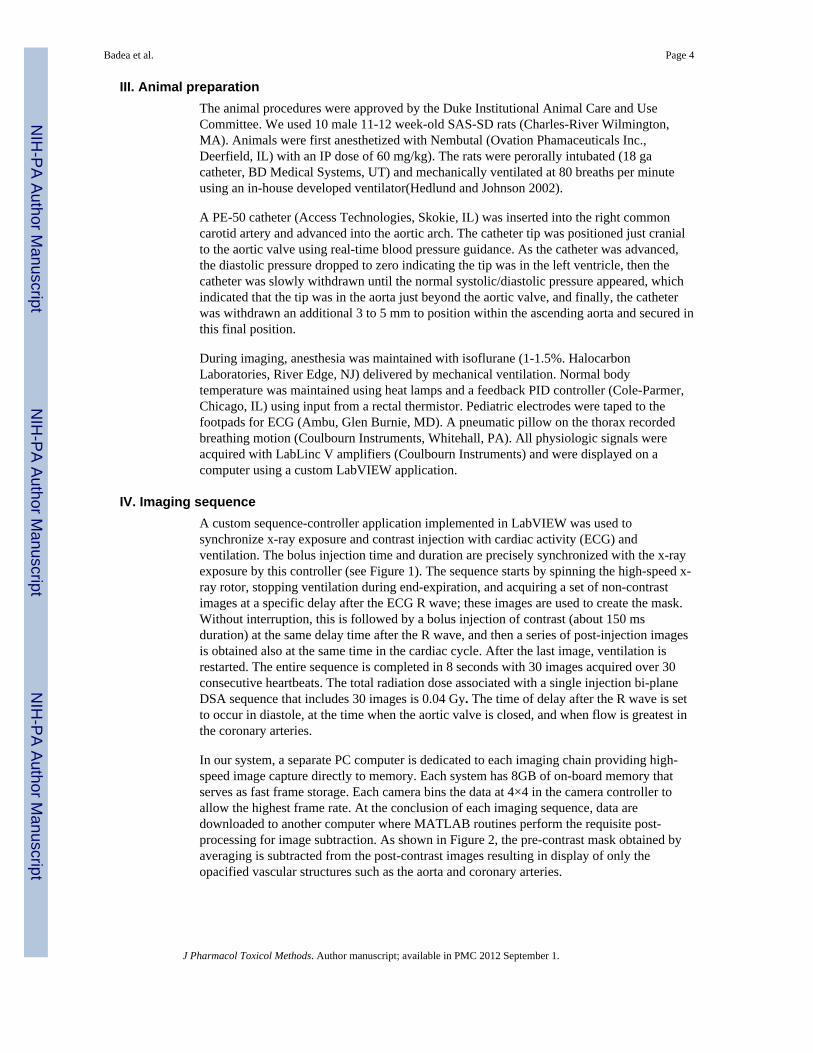
III. Animal preparationThe animal procedures were approved by the Duke Institutional Animal Care and UseCommittee. We used 10 male 11-12 week-old SAS-SD rats (Charles-River Wilmington,MA). Animals were first anesthetized with Nembutal (Ovation Phamaceuticals Inc.,Deerfield, IL) with an IP dose of 60 mg/kg). The rats were perorally intubated (18 gacatheter, BD Medical Systems, UT) and mechanically ventilated at 80 breaths per minuteusing an in-house developed ventilator(Hedlund and Johnson 2002).
A PE-50 catheter (Access Technologies, Skokie, IL) was inserted into the right commoncarotid artery and advanced into the aortic arch. The catheter tip was positioned just cranialto the aortic valve using real-time blood pressure guidance. As the catheter was advanced,the diastolic pressure dropped to zero indicating the tip was in the left ventricle, then thecatheter was slowly withdrawn until the normal systolic/diastolic pressure appeared, whichindicated that the tip was in the aorta just beyond the aortic valve, and finally, the catheterwas withdrawn an additional 3 to 5 mm to position within the ascending aorta and secured inthis final position.
During imaging, anesthesia was maintained with isoflurane (1-1.5%. HalocarbonLaboratories, River Edge, NJ) delivered by mechanical ventilation. Normal bodytemperature was maintained using heat lamps and a feedback PID controller (Cole-Parmer,Chicago, IL) using input from a rectal thermistor. Pediatric electrodes were taped to thefootpads for ECG (Ambu, Glen Burnie, MD). A pneumatic pillow on the thorax recordedbreathing motion (Coulbourn Instruments, Whitehall, PA). All physiologic signals wereacquired with LabLinc V amplifiers (Coulbourn Instruments) and were displayed on acomputer using a custom LabVIEW application.
IV. Imaging sequenceA custom sequence-controller application implemented in LabVIEW was used tosynchronize x-ray exposure and contrast injection with cardiac activity (ECG) andventilation. The bolus injection time and duration are precisely synchronized with the x-rayexposure by this controller (see Figure 1). The sequence starts by spinning the high-speed x-ray rotor, stopping ventilation during end-expiration, and acquiring a set of non-contrastimages at a specific delay after the ECG R wave; these images are used to create the mask.Without interruption, this is followed by a bolus injection of contrast (about 150 msduration) at the same delay time after the R wave, and then a series of post-injection imagesis obtained also at the same time in the cardiac cycle. After the last image, ventilation isrestarted. The entire sequence is completed in 8 seconds with 30 images acquired over 30consecutive heartbeats. The total radiation dose associated with a single injection bi-planeDSA sequence that includes 30 images is 0.04 Gy. The time of delay after the R wave is setto occur in diastole, at the time when the aortic valve is closed, and when flow is greatest inthe coronary arteries.
In our system, a separate PC computer is dedicated to each imaging chain providing high-speed image capture directly to memory. Each system has 8GB of on-board memory thatserves as fast frame storage. Each camera bins the data at 4×4 in the camera controller toallow the highest frame rate. At the conclusion of each imaging sequence, data aredownloaded to another computer where MATLAB routines perform the requisite post-processing for image subtraction. As shown in Figure 2, the pre-contrast mask obtained byaveraging is subtracted from the post-contrast images resulting in display of only theopacified vascular structures such as the aorta and coronary arteries.
Badea et al. Page 4
J Pharmacol Toxicol Methods. Author manuscript; available in PMC 2012 September 1.
NIH
-PA Author Manuscript
NIH
-PA Author Manuscript
NIH
-PA Author Manuscript

V. Protocol optimizationA set of experiments was performed to test and optimize the sampling and image quality forcoronary artery DSA.
Critical elements of a coronary arteries DSA experiment included:
a. Position of the tip of the contrast agent injection catheter
b. Contrast agent volume and injection pressure
c. Time of injection during the cardiac cycle
The volume of contrast agent injected depends on the injection duration and N2 pressure.We have tested injection times from 75 to 300 ms and pressures from 20 to 80 PSI. Wemeasured a series of volumes of delivered contrast agent by collecting and then weighingsamples. The density of Isovue 370 was used to convert mass to volume. Finally, we testedhow the time of injection during the cardiac cycle affected quality of visualization of thecoronary arteries based on maximum enhancement. The start of injection was delayed fromthe R wave by 0%, 30%, and 60% of the RR interval.
VI. DSA-based assessment of nitroprusside (NP) effects on coronary arteriesOur goal was to use coronary artery DSA to measure changes in flow in relation to drugexposure. To test our capability to measure such changes, we used sodium nitroprusside(NP, Nitropress, Hosira, Inc, Lake Forest, IL) as a model compound. NP is a smooth musclerelaxant causing vasodilation of peripheral arteries and veins. NP is also known as acoronary artery vasodilator in humans(Yeh, Gosselin et al. 1977). NP at a concentration of25 mg/ml was infused into a tail vein catheter using a peristaltic infusion pump (PegasusVario, Instech Solomon, Plymouth Meeting, PA) at a rate of 0.07 ml/h for 3 minutes (dose:0.0875 mg). Multiple DSA sequences were acquired before, during, and up to 25 minutesafter NP infusion using 113 microL of contrast per sequence. With such a small volume ofcontrast per sequence, imaging could be repeated several times without significantlychanging blood volume. For these NP studies, a pulse oximeter (Starr-Life Science,Oakmont, PA) was used to record physiologic parameters, such as pulse distension (relativeperipheral artery pressure), heart rate, oxygen saturation, breathing rate, and breathdistention (measure of breathing difficulty).
Perfusion maps of the heart were generated in MATLAB to compare the drug effects overtime. We computed perfusion using the Mullani-Gould formulation(Mullani and Gould1983). Typically, perfusion (i.e., blood flow in a voxel) is calculated as the peakenhancement divided by the area under the time density curve for the arterial input. Thearterial input was obtained by selecting a region of interest in the aorta. Similar to(Tilkemeier and Wackers, 2006), the planar DSA images can be used for segmentalperfusion assessment. In essence, the myocardium images can be divided into regions ofinterest for which average perfusion values can be computed and compared betweenmultiple runs in the same animal or between multiple animals, and Student t-test can be usedfor a statistical comparison.
ResultsExamples of cine display of DSA images are available as animations in the moviesupplement to this manuscript. Each animation shows the first pass of the bolus of thecontrast agent. For each injection, we generated two movies corresponding to the orthogonalbi-plane views. Static frames from such a cine-sequence are shown in Figure 3. Thesesequences demonstrate the importance of catheter tip position. In the Figure 3A,B series, the
Badea et al. Page 5
J Pharmacol Toxicol Methods. Author manuscript; available in PMC 2012 September 1.
NIH
-PA Author Manuscript
NIH
-PA Author Manuscript
NIH
-PA Author Manuscript

tip is very close to the aortic valve and apparently blocking the orifice of the left coronaryartery. In Figure 3C,D series, the catheter tip is farther from the aortic valve allowingcomplete filling of both coronary arteries, as seen in the first frame (first heartbeat)following contrast injection. The left (LCA) and right coronary arteries (RCA) are clearlyseen.
The effect of micro-injection pressure and duration on contrast volume is illustrated inFigure 4, and the actual volume delivered is shown in Figure 5. Coronary arteryvisualization generally improves by increasing both injection duration and/or drivingpressure (Figure 4). At a given injection duration, volume increases linearly with pressure.We selected to use 60 PSI for 150 ms as the best trade-off for providing adequate imagequality, while minimizing volume of contrast injected (113 microL, see Figure 5). While 80PSI for 150 ms provided a slight improvement in image quality, the higher pressure resultedin retrograde flow of contrast into the left ventricle.
Figure 6 shows images acquired at different delay times from the QRS complex, when thecontrast agent was injected using 60 PSI for 150 ms. The RR-interval was about 200 ms.The maximum contrast DSA images show some improvement with the added delays.
Figures 7 and 8 illustrate the use of DSA to detect changes in coronary artery circulation.Figure 7A compares the same maximum-enhanced DSA image at different sequences duringthe NP experiment. The start of NP infusion is considered as time point 0 seconds. The −5minute image is before NP infusion. The images at 2 and 3 minutes were acquired during theNP infusion. The rest of the images were acquired after infusion was stopped. The first 7frames of the pre-drug (−5 minutes) and +8 minutes post-drug DSA sequences are comparedin Figure 7B and 7C. Note how NP caused an increase in myocardial perfusion. Thesupplement movie for this manuscript compares DSA sequences in the same animal −5minutes before and +8 minutes after NP infusion.
During the NP infusion, we witnessed a drop in pulse distension (relative peripheral arterypressure) which later returns to pre-drug levels. Unexpectedly, the heart rate also dropped byapproximately 9%, but returned to the pre-drug levels in about 15 minutes. The arterialoxygen saturation remained above 98% during the whole experiment, suggesting that thesuspended respiration during the injection of contrast did not affect the animal.
Finally, myocardial perfusion maps for the NP experiment are shown by Figure 8. SinceDSA is not able to provide 3D information, the display values are given in arbitrary values,but can be used to compare qualitatively the changes that occurring over different DSAsequences. Maximum myocardial perfusion values are shown at the +8 minutes time point.
Discussion and ConclusionsImaging coronary arteries in a rat is very challenging due to their small size and fastphysiologic motion of the heart and respiration. These challenges are hard to overcome withcommercial small animal x-ray or micro-CT systems that are using micro-focus x-ray tubesfor which the exposures should be sufficiently long in time for an adequate signal to noiseratio. We have been able to achieve this goal by building an x-ray-based imaging systemthat uses x-ray tubes with large focal spot (clinical angiography tubes) able to deliver veryshort exposures (10 ms) with adequate flux (Badea, Hedlund et al. 2004). The shortexposures are needed to freeze the cardiac and respiratory motion using the gating strategies.Of equal importance to our approach is the micro-injector that is able to deliver controlledamounts of contrast with high accuracy and precision (de Lin, Ning et al. 2008). But themost important, is the integration of all these components in a single system.
Badea et al. Page 6
J Pharmacol Toxicol Methods. Author manuscript; available in PMC 2012 September 1.
NIH
-PA Author Manuscript
NIH
-PA Author Manuscript
NIH
-PA Author Manuscript

In the armamentarium of preclinical methods accepted for the evaluation of morphology ofcoronary arteries, conventional histology is still the most used method due to its low cost.TTC staining can be used detect myocardial infract size (Lie, Pairolero et al. 1975) andfluorescent microspheres for myocardial perfusion estimations (Ytrehus, Liu et al. 1994).However, these methods are post-sacrifice techniques. Imaging can sometimes provide analternative approach but in general, at higher cost. 3D micro-CT is the x-ray-based methodable to provide the morphology of the coronary arteries as shown by(Beighley, Thomas etal. 1997). However, this approach involves ex-vivo imaging of the casted heart limiting theuse of such methods to the possibility of extracting real time flow information on transitoryeffects associated with drug exposure. Cine-MRI with 3D coronary angiography has alsobeen proven to be the appropriate diagnostic tool to characterize the rat model of coronaryartery stenosis. However, in those studies, 3D MR angiography has been performed inisolated hearts(Nahrendorf, Hiller et al. 2003) .
Alternatively, (Ishikura, Hirayama et al. 2008) have shown three-dimensional (3D) real-timecontrast echocardiography of rat coronary arteries. But, the image quality is inferior due tolow resolution. The nuclear imaging techniques could provide myocardial blood flow andmetabolism information, but no 3D morphological information on coronary arteries, due tothe lack of resolution(Thomas, Bal et al. 2008).
As shown here, DSA can be used to image the coronary arteries and follow changes incardiac perfusion through the course of a drug (nitropruside) infusion. Our DSA imagesclearly show the main branches of the coronary arteries in an intact beating heart. Becausethe images are obtained in-vivo using bi-pane geometry, the correct spatial positions, andorientation of the arteries in reference to the rest of the body are clear. The approach has itsown challenges such as catheter placement, injection volume, injection timing in relation tothe cardiac cycle, and the physiologic support and monitoring of the animal. Positioning thecatheter tip and timing of contrast injection for imaging the coronary arteries proved to bechallenging (see Figure 3). The optimal placement for the catheter tip should be severalmillimeters cranial to the aortic valve. If the catheter tip is too close to the aortic valve, itcould possibly block a coronary artery orifice and obstruct flow to that artery. On the other-hand, if the tip is too far above the aortic valve, the injected contrast will be diluted by theblood volume between the tip and the roots of the coronary arteries. Timing of the sequenceof image acquisitions also poses challenges. For optimal imaging quality, the contrastinjection must occur during diastole when the aortic valve is closed so contrast enters thecoronary arteries.
Finally, the use of an invasive catheter could be a limitation of coronary artery DSA, but wenote that indwelling catheters are possible(Bechtold, Vernon et al. 2008) that will allow suchstudies to become longitudinal.
As shown in Figure 8, the temporal sequence associated with DSA can be used to assessperfusion of the myocardium. Time attenuation curves can be constructed for each pixelfrom each DSA sequence to qualitatively follow, the effects of drugs or treatments oncoronary artery flow. Thus, DSA can provide both anatomical and functional information onthe coronary arteries and myocardial perfusion. DSA is, however, not a tomographicimaging method so the data is relative, not absolute blood flow. The perfusion maps showsapproximately double values for the myocardium at +8 minutes after drug compared withthe −5 minutes pre-drug set (Figure 8). As seen in the NP experiment, coronary artery DSAstudies may involve multiple DSA consecutive imaging runs to assess a drug transitoryeffect. But, even with 10 DSA imaging runs, the radiation dose is only about 0.4 Gy, afraction of the LD 50/30 which in rats has been reported to be in approximately7.1Gy(Kouzmanova, Ivanov et al. 1997). The method is elegant in its simplicity. By
Badea et al. Page 7
J Pharmacol Toxicol Methods. Author manuscript; available in PMC 2012 September 1.
NIH
-PA Author Manuscript
NIH
-PA Author Manuscript
NIH
-PA Author Manuscript

carefully controlling the sequence, e.g. injection volume, timing, respiration, one canproduce a functional imaging biomarker that can be very sensitive to drug-induced changesin flow.
DSA is a method with high potential for imaging in drug-induced vascular injury studies.Drug-induced vascular injury seen in nonclinical toxicity studies is a significant drugdevelopment concern because of a lack of understanding of animal model-human patientconcordance and lack of sensitive translational biomarkers. This toxicity is seen in bothrodent and non-rodent animal species, and is most commonly associated with molecules thatcause vasodilation or vasoconstriction (i.e. vasoactive molecules) (Greaves 2000; Louden,Brott et al. 2006). Also, drug-induced myocardial injuries occasionally occur with a regionaldistribution in the heart that suggests an ischemic origin (e.g. subendocardial, leftventricular, apical predilections). Unlike clinical situations, these injuries frequently occur inthe absence of coronary artery occlusion. Current nonclinical methods do not allow directvisualization of drug-induced changes in vascular tone or structural integrity with non-invasive methods that might be translational to the clinical setting. DSA enables a moredirect evaluation of vascular tone and integrity of coronary arteries where vascular injurycan occur in rodents (Yuhas, Morgan et al. 1985).
Another DSA application could be ischemic heart disease. The paper by (Csonka, Kupai etal. 2010) presents different techniques to measure infarct size in clinical and preclinicalstudies. We have previously published on delayed enhancement micro-CT imaging toestimate both the size of the infarct as well as cardiac function(Nahrendorf, Badea et al.2007). Dobutamine induced cardiac stress can be also assessed with micro-CT imaging(Badea, Hedlund et al. 2011). Our imaging system can, in fact, be used for combined micro-CT and DSA imaging(Badea, Hedlund et al. 2006). Therefore, we could conceivably designexperiments that would use DSA to visualize rapid changes in coronary circulation andmyocardial perfusion; and use micro-CT for 3D morphological information and to estimatecardiac function measures such as cardiac output, ejection fraction, stroke volume.
Finally, the proposed DSA imaging method has the advantage that can be readily translatedto the clinical setting providing yet one more valuable imaging tool for assessing drug safetyand toxicity from rodent to man.
Supplementary MaterialRefer to Web version on PubMed Central for supplementary material.
AcknowledgmentsAll work was performed at the Duke Center for In Vivo Microscopy, an NIH/NCRR national BiomedicalTechnology Research Center (P41 RR005959), with additional support from NCI (U24 CA092656).
ReferencesBadea, C.; Johnston, S., et al. SPIE, Medical Imaging. San Diego, CA, SPIE: 2008. A Dual Micro-CT
System for Small Animal Imaging; p. 691342-10.Badea CT, Drangova M, et al. In vivo small-animal imaging using micro-CT and digital subtraction
angiography. Phys Med Biol. 2008; 53(19):R319–350. [PubMed: 18758005]Badea CT, Hedlund LW, et al. Micro-CT imaging assessment of dobutamine-induced cardiac stress in
rats. J Pharmacol Toxicol Methods. 2011; 63(1):24–29. [PubMed: 20399875]Badea CT, Hedlund LW, et al. Tumor imaging in small animals with a combined micro-CT/micro-
DSA system using iodinated conventional and blood pool contrast agents. Contrast Media MolImaging. 2006; 1(4):153–164. [PubMed: 17193692]
Badea et al. Page 8
J Pharmacol Toxicol Methods. Author manuscript; available in PMC 2012 September 1.
NIH
-PA Author Manuscript
NIH
-PA Author Manuscript
NIH
-PA Author Manuscript

Badea CT, Hedlund LW, et al. Tomographic digital subtraction angiography for lung perfusionestimation in rodents. Med Phys. 2007; 34(5):1546–1555. [PubMed: 17555236]
Badea CT, Hedlund LW, et al. Micro-CT with respiratory and cardiac gating. Medical Physics. 2004;31(12):3324–3329. [PubMed: 15651615]
Bechtold AG, Vernon K, et al. Genetic predisposition to hypertension sensitizes borderlinehypertensive rats to the hypertensive effects of prenatal glucocorticoid exposure. J Physiol. 2008;586(2):673–684. [PubMed: 18006585]
Beighley PE, Thomas PJ, et al. 3D architecture of myocardial microcirculation in intact rat heart: astudy with micro-CT. Adv Exp Med Biol. 1997; 430:165–175. [PubMed: 9330727]
Buhalog A, Yasuda R, et al. A method for serial selective arterial catheterization and digitalsubtraction angiography in rodents. AJNR Am J Neuroradiol. 31(8):1508–1511. [PubMed:20488903]
Csonka C, Kupai K, et al. Measurement of myocardial infarct size in preclinical studies. J PharmacolToxicol Methods. 2010; 61(2):163–170. [PubMed: 20188845]
de Lin M, Ning L, et al. A high-precision contrast injector for small animal x-ray digital subtractionangiography. IEEE Trans Biomed Eng. 2008; 55(3):1082–1091. [PubMed: 18334400]
Dogterom P, Zbinden G, et al. Cardiotoxicity of vasodilators and positive inotropic/vasodilating drugsin dogs: an overview. Crit Rev Toxicol. 1992; 22(3-4):203–241. [PubMed: 1388706]
Greaves, P. Histopathology of preclinical toxicity studies: interpretation and relevance in drug safetyevaluation. Elsevier Science B.V.; Amsterdam; New York: 2000.
Hanton G, Le Net JL, et al. Characterization of the arteritis induced by infusion of rats withUK-61,260, an inodilator, for 24 h. A comparison with the arteritis induced by fenoldopammesylate. Arch Toxicol. 1995; 69(10):698–704. [PubMed: 8572928]
Hedlund LW, Johnson GA. Mechanical ventilation for imaging the small animal lung. ILAR J. 2002;43(3):159–174. [PubMed: 12105383]
Herschman HR. Micro-PET imaging and small animal models of disease. Curr Opin Immunol. 2003;15(4):378–384. [PubMed: 12900267]
Hoit BD. New approaches to phenotypic analysis in adult mice. 2001Holdsworth DW, Thornton M. Micro-CT in small animal and specimen imaging. Trends in
Biotechnology. 2002; 20(8):S34–39.Ishikura F, Hirayama H, et al. Brief communications: visualization of coronary arteries in rats by 3-
dimensional real-time contrast echocardiography. J Am Soc Echocardiogr. 2008; 21(5):500.[PubMed: 17904818]
Johnson GA, Hedlund LW, et al. Magnetic resonance microscopy in the life sciences. Reviews ofMagnetic Resonance in Medicine. 1992; 4:187–219.
Kerns WD, Arena E, et al. Pathogenesis of arterial lesions induced by dopaminergic compounds in therat. Toxicol Pathol. 1989; 17(1 Pt 2):203–213. [PubMed: 2568682]
Kouzmanova M, Ivanov S, et al. Effects of Ionizing and Nonionizing Radiation on rat Hemopoiesis.1997; 16:161–168.
Lie JT, Pairolero PC, et al. Time course and zonal variations of ischemia-induced myocardial cationicelectrolyte derangements. Circulation. 1975; 51(5):860–866. [PubMed: 1122591]
Lin DM, Samei E, et al. Optimized radiographic spectra for small animal digital subtractionangiography. Medical Physics. 2006; 33(11):4249–4257. [PubMed: 17153403]
Lin M, Marshall CT, et al. Quantitative blood flow measurements in the small animal cardiopulmonarysystem using digital subtraction angiography. Med Phys. 2009; 36(11):5347–5358. [PubMed:19994543]
Louden C, Brott D, et al. Biomarkers and mechanisms of drug-induced vascular injury in non-rodents.Toxicol Pathol. 2006; 34(1):19–26. [PubMed: 16507540]
Matsushita S, Hyodo K, et al. Coronary angiography in rats using synchrotron radiation. NuclearInstruments and Methods in Physics Research Section A: Accelerators, Spectrometers, Detectorsand Associated Equipment. 2005; 548(1-2):94–98.
Badea et al. Page 9
J Pharmacol Toxicol Methods. Author manuscript; available in PMC 2012 September 1.
NIH
-PA Author Manuscript
NIH
-PA Author Manuscript
NIH
-PA Author Manuscript

Matsushita S, Hyodo K, et al. The minimum coronary artery diameter in which coronary spasm can beidentified by synchrotron radiation coronary angiography. Eur J Radiol. 2008; 68(3 Suppl):S84–88. [PubMed: 18586426]
Mistretta C, Ort M, et al. Multiple Image Subtraction Technique for Enhancing Low Contrast PeriodicObjects. Investigative Radiology. 1973; 8:43–49. [PubMed: 4568176]
Mullani NA, Gould KL. First-pass measurements of regional blood flow with external detectors. JNucl Med. 1983; 24(7):577–581. [PubMed: 6602868]
Nahrendorf M, Badea C, et al. High-resolution imaging of murine myocardial infarction with delayed-enhancement cine micro-CT. Am J Physiol Heart Circ Physiol. 2007; 292(6):H3172–3178.[PubMed: 17322414]
Nahrendorf M, Hiller KH, et al. Cardiac magnetic resonance imaging in small animal models ofhuman heart failure. Med Image Anal. 2003; 7(3):369–375. [PubMed: 12946475]
Ntziachristos V, Ripoll J, et al. Looking and listening to light: the evolution of whole-body photonicimaging. Nat Biotechnol. 2005; 23(3):313–320. [PubMed: 15765087]
Schültke E, Fiedler S, et al. Synchrotron-based intra-venous K-edge digital subtraction angiography ina pig model: A feasibility study. European Journal of Radiology. 73(3):677–681. [PubMed:19233584]
Skrzypiec-Spring M, Grotthus B, et al. Isolated heart perfusion according to Langendorff---still viablein the new millennium. J Pharmacol Toxicol Methods. 2007; 55(2):113–126. [PubMed: 16844390]
Struyven JJ, Delcour C, et al. Digital subtraction angiography (DSA) of the heart and coronaryarteries. Ann Radiol (Paris). 1986; 29(2):107–111. [PubMed: 3527022]
Thomas D, Bal H, et al. Noninvasive assessment of myocardial viability in a small animal model:comparison of MRI, SPECT, and PET. Magn Reson Med. 2008; 59(2):252–259. [PubMed:18228591]
Yeh BK, Gosselin AJ, et al. Sodium nitroprusside as a coronary vasodilator in man: I. Effect ofintracoronary sodium nitroprusside on coronary arteries, angina pectoris, and coronary blood flow.American Heart Journal. 1977; 93(5):610–616. [PubMed: 300557]
Ytrehus K, Liu Y, et al. Rat and rabbit heart infarction: effects of anesthesia, perfusate, risk zone, andmethod of infarct sizing. Am J Physiol. 1994; 267(6 Pt 2):H2383–2390. [PubMed: 7528994]
Yuhas EM, Morgan DG, et al. Arterial medial necrosis and hemorrhage induced in rats by intravenousinfusion of fenoldopam mesylate, a dopaminergic vasodilator. Am J Pathol. 1985; 119(1):83–91.[PubMed: 2858975]
Badea et al. Page 10
J Pharmacol Toxicol Methods. Author manuscript; available in PMC 2012 September 1.
NIH
-PA Author Manuscript
NIH
-PA Author Manuscript
NIH
-PA Author Manuscript

Figure 1.For coronary artery DSA in the rat, an imaging sequence starts by bringing the x-ray anoderotor up to speed and suspending ventilation at end-expiration. The interval between each Rwave is ~ 300 ms. Each 10-ms exposure and subsequent camera readout is initiated at thesame delay after the peak R wave. A series of non-contrast images are acquired to create themask. A 150-ms injection of Isovue is triggered followed by the acquisition of post-contrastinjection images, again at the same point in the cardiac cycle. The whole sequence lastsabout 8-10 seconds yielding a stack of 30 different frames.
Badea et al. Page 11
J Pharmacol Toxicol Methods. Author manuscript; available in PMC 2012 September 1.
NIH
-PA Author Manuscript
NIH
-PA Author Manuscript
NIH
-PA Author Manuscript

Figure 2.A dedicated image pipeline has been developed in MATLAB to automatically process theserial DSA images. We generate the average mask from pre-injection frames and subtract itfrom the post-contrast images to produce the vascular only DSA images.
Badea et al. Page 12
J Pharmacol Toxicol Methods. Author manuscript; available in PMC 2012 September 1.
NIH
-PA Author Manuscript
NIH
-PA Author Manuscript
NIH
-PA Author Manuscript

Figure 3.The effect of catheter tip position on visualizing coronary arteries is illustrated for twodifferent animals. (A) and (C) are ventral/dorsal projections, and (B) and (D) are lateralprojections. In first animal (A, B), the catheter tip appears to be touching the cranial surfaceof the aortic valve (red arrow) and apparently obstructing the orifice of the left coronaryartery, whereas in second animal (C, D), the tip of the catheter (blue arrow) is well above thevalve, and both arteries and branches are clearly seen.
Badea et al. Page 13
J Pharmacol Toxicol Methods. Author manuscript; available in PMC 2012 September 1.
NIH
-PA Author Manuscript
NIH
-PA Author Manuscript
NIH
-PA Author Manuscript

Figure 4.DSA images corresponding to the heartbeat with the maximum enhancement of the coronaryarteries selected for tests where either the injector pressure or the time for injection werevaried. Note that the best trade-off between the injection time, pressure, and image quality isachieved at 60 PSI, 150 ms injection (see green square).
Badea et al. Page 14
J Pharmacol Toxicol Methods. Author manuscript; available in PMC 2012 September 1.
NIH
-PA Author Manuscript
NIH
-PA Author Manuscript
NIH
-PA Author Manuscript

Figure 5.The injected volume is linearly related to the pressure driving the injector and the injectionduration. A visual inspection of Figure 4 favors the image corresponding to 60 PSI, 150 mscorresponding to a volume of injected contrast agent of 113 microL. This volume issufficient.
Badea et al. Page 15
J Pharmacol Toxicol Methods. Author manuscript; available in PMC 2012 September 1.
NIH
-PA Author Manuscript
NIH
-PA Author Manuscript
NIH
-PA Author Manuscript

Figure 6.The tests involved multiple injections (60 PSI, 150 ms) at different delay times from the Rpeak. The RR-interval was approximately 200 ms. Note that the visualization is slightlyimproved when the injection occurs early in diastole, 60 ms delay.
Badea et al. Page 16
J Pharmacol Toxicol Methods. Author manuscript; available in PMC 2012 September 1.
NIH
-PA Author Manuscript
NIH
-PA Author Manuscript
NIH
-PA Author Manuscript

Figure 7.These DSA images illustrate the effects of nitroprusside (NP) infusion on coronary arteries.Row A shows selected images before NP infusion (−5 minutes), during NP infusion (2 to?and 3 minutes), and after infusion has stopped (5 to 20 minutes). Note that dilation of thecoronary arteries occurs within minutes of infusion and persists for at least 7 minutes aftercessation of NP infusion, and after 17 minutes, the coronary arteries have returned to pre-infusion caliber. Row B shows the first 7 frames of the pre-infusion sequence (−5 minutes)and row C shows the first 7 images of the 8-minute sequence. In row C, after the first frame,note the evidence for myocardial perfusion as the ventricular walls are darkened.
Badea et al. Page 17
J Pharmacol Toxicol Methods. Author manuscript; available in PMC 2012 September 1.
NIH
-PA Author Manuscript
NIH
-PA Author Manuscript
NIH
-PA Author Manuscript

Figure 8.Perfusion maps from the study shown in Figure 7. Note the maximum perfusion occurs inthe 8-minute sequence, 5 minutes after cessation of NP infusion. 25 minutes later, theperfusion levels have returned to pre-infusion levels.
Badea et al. Page 18
J Pharmacol Toxicol Methods. Author manuscript; available in PMC 2012 September 1.
NIH
-PA Author Manuscript
NIH
-PA Author Manuscript
NIH
-PA Author Manuscript
Copyright © 2022 FDOKUMEN