DNA demethylation increases sensitivity of neuroblastoma cells to chemotherapeutic drugs
Upload
khangminh22Category
view
0download
0
University of Wollongong University of Wollongong
Research Online Research Online
University of Wollongong Thesis Collection 2017+ University of Wollongong Thesis Collections
2018
In vitro investigations of the potential chemotherapeutic and In vitro investigations of the potential chemotherapeutic and
chemopreventive properties of bismuth(III) complexes of non-steroidal anti-chemopreventive properties of bismuth(III) complexes of non-steroidal anti-
inflammatory drugs inflammatory drugs
Emma Louise Hawksworth University of Wollongong Follow this and additional works at: https://ro.uow.edu.au/theses1
University of Wollongong University of Wollongong
Copyright Warning Copyright Warning
You may print or download ONE copy of this document for the purpose of your own research or study. The University
does not authorise you to copy, communicate or otherwise make available electronically to any other person any
copyright material contained on this site.
You are reminded of the following: This work is copyright. Apart from any use permitted under the Copyright Act
1968, no part of this work may be reproduced by any process, nor may any other exclusive right be exercised,
without the permission of the author. Copyright owners are entitled to take legal action against persons who infringe
their copyright. A reproduction of material that is protected by copyright may be a copyright infringement. A court
may impose penalties and award damages in relation to offences and infringements relating to copyright material.
Higher penalties may apply, and higher damages may be awarded, for offences and infringements involving the
conversion of material into digital or electronic form.
Unless otherwise indicated, the views expressed in this thesis are those of the author and do not necessarily Unless otherwise indicated, the views expressed in this thesis are those of the author and do not necessarily
represent the views of the University of Wollongong. represent the views of the University of Wollongong.
Recommended Citation Recommended Citation Hawksworth, Emma Louise, In vitro investigations of the potential chemotherapeutic and chemopreventive properties of bismuth(III) complexes of non-steroidal anti-inflammatory drugs, Doctor of Philosophy thesis, School of Chemistry, University of Wollongong, 2018. https://ro.uow.edu.au/theses1/429
Research Online is the open access institutional repository for the University of Wollongong. For further information contact the UOW Library: [email protected]
In vitro investigations of the potential chemotherapeutic and chemopreventive properties
of bismuth(III) complexes of non-steroidal anti-inflammatory drugs
Emma Louise Hawksworth Bachelor of Medicinal Chemistry (Honours Class I)
This thesis is presented as part of the requirement for the conferral of the degree: Doctor of Philosophy
The University of Wollongong School of Chemistry
March 2018
ii
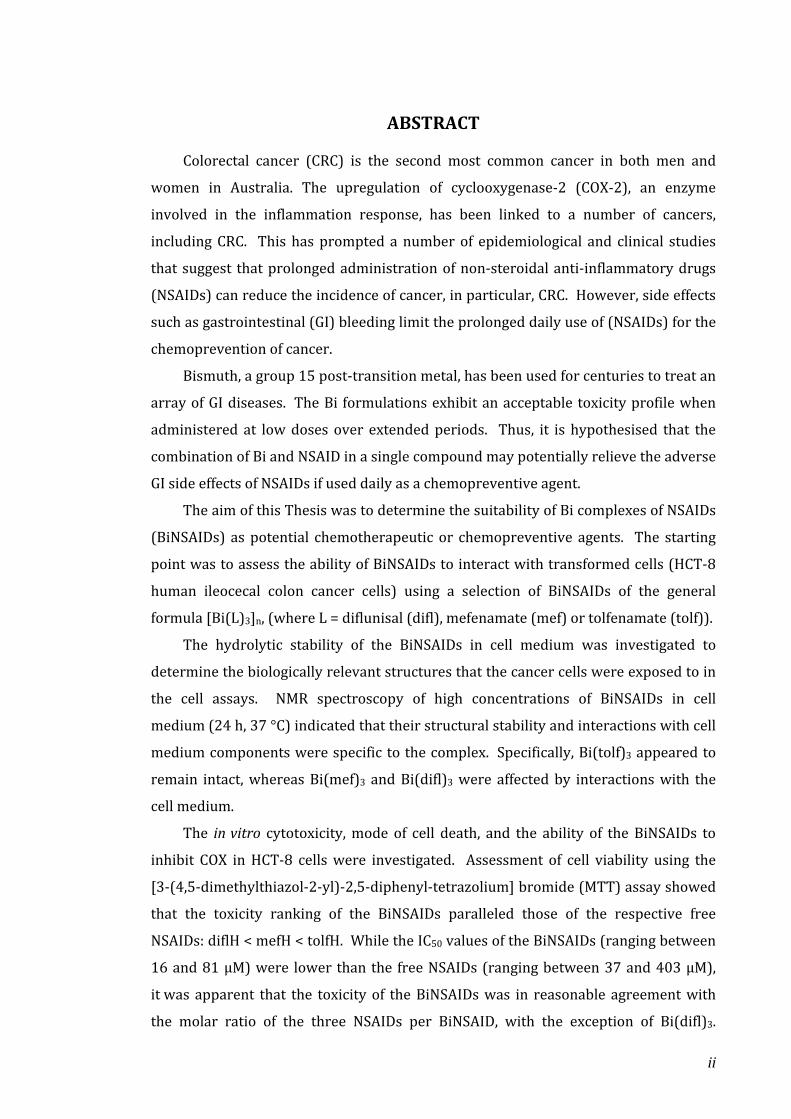
ABSTRACT
Colorectal cancer (CRC) is the second most common cancer in both men and
women in Australia. The upregulation of cyclooxygenase-2 (COX-2), an enzyme
involved in the inflammation response, has been linked to a number of cancers,
including CRC. This has prompted a number of epidemiological and clinical studies
that suggest that prolonged administration of non-steroidal anti-inflammatory drugs
(NSAIDs) can reduce the incidence of cancer, in particular, CRC. However, side effects
such as gastrointestinal (GI) bleeding limit the prolonged daily use of (NSAIDs) for the
chemoprevention of cancer.
Bismuth, a group 15 post-transition metal, has been used for centuries to treat an
array of GI diseases. The Bi formulations exhibit an acceptable toxicity profile when
administered at low doses over extended periods. Thus, it is hypothesised that the
combination of Bi and NSAID in a single compound may potentially relieve the adverse
GI side effects of NSAIDs if used daily as a chemopreventive agent.
The aim of this Thesis was to determine the suitability of Bi complexes of NSAIDs
(BiNSAIDs) as potential chemotherapeutic or chemopreventive agents. The starting
point was to assess the ability of BiNSAIDs to interact with transformed cells (HCT-8
human ileocecal colon cancer cells) using a selection of BiNSAIDs of the general
formula [Bi(L)3]n, (where L = diflunisal (difl), mefenamate (mef) or tolfenamate (tolf)).
The hydrolytic stability of the BiNSAIDs in cell medium was investigated to
determine the biologically relevant structures that the cancer cells were exposed to in
the cell assays. NMR spectroscopy of high concentrations of BiNSAIDs in cell
medium (24 h, 37 °C) indicated that their structural stability and interactions with cell
medium components were specific to the complex. Specifically, Bi(tolf)3 appeared to
remain intact, whereas Bi(mef)3 and Bi(difl)3 were affected by interactions with the
cell medium.
The in vitro cytotoxicity, mode of cell death, and the ability of the BiNSAIDs to
inhibit COX in HCT-8 cells were investigated. Assessment of cell viability using the
[3-(4,5-dimethylthiazol-2-yl)-2,5-diphenyl-tetrazolium] bromide (MTT) assay showed
that the toxicity ranking of the BiNSAIDs paralleled those of the respective free
NSAIDs: diflH < mefH < tolfH. While the IC50 values of the BiNSAIDs (ranging between
16 and 81 μM) were lower than the free NSAIDs (ranging between 37 and 403 μM),
it was apparent that the toxicity of the BiNSAIDs was in reasonable agreement with
the molar ratio of the three NSAIDs per BiNSAID, with the exception of Bi(difl)3.
iii
Phase contrast microscopy and Annexin-V/7AAD staining showed that treatment with
all BiNSAIDs and NSAIDs induced morphological changes indicative of cell death via
apoptosis. Recognising that over-expression of COX-2 is associated with CRC, the
ability of the BiNSAIDs to inhibit the production of PGE2 (and COX) in HCT-8 cells was
assessed. It was observed that the inhibition of PGE2 production by the BiNSAIDs
paralleled that of the respective free NSAIDs: diflH < mefH < tolfH. These results
indicated that the COX inhibition of the examined NSAIDs was not substantially
diminished by their coordination to Bi (in the BiNSAIDs).
Bismuth uptake was quantified using graphite furnace atomic absorption
spectroscopy (GFAAS) to establish whether BiNSAID stability and toxicity correlated
with cellular uptake. The highest cellular Bi content was observed following
treatment with Bi(tolf)3. Since NMR studies indicated that Bi(tolf)3 was the most
stable BiNSAID it appears that Bi uptake is assisted by the NSAID. Furthermore,
microprobe synchrotron radiation X-ray fluorescence (SRXRF) imaging was utilised to
determine the subcellular fate of the Bi contained in the BiNSAID complexes.
Microprobe SRXRF imaging showed that Bi generally accumulated in the cytoplasm
within 24-h exposure regardless of the BiNSAID treatment. The size and location of
the hot spots (0.3–5.8 μm2) were consistent with two intracellular fates. The first is
accumulation into lysosomes, which would be indicative of a cellular detoxification
mechanism. The second relates to the hot spots that are in close proximity to the
nuclear membrane (and potentially COX-2), which indicates the intracellular
movement of Bi. However, the specific targeting of COX-2 by the BiNSAID would
require further investigation.
Synchrotron radiation infrared microspectroscopy (SR-IRMS) was utilised in
order to assess the global biomolecular changes induced by BiNSAID treatment
compared to NSAIDs alone. Live HCT-8 cells were examined using a demountable cell
holder in order to maintain hydration. The results from 4-h experiments differed to
24-h experiments suggesting that the cells undergo time-dependent changes. In most
cases, it was observed that BiNSAID or NSAID treatment substantially affected the IR
bands associated with lipids.
Based on the results from the SR-IRMS study and literature precedence, the
effects of BiNSAID- and NSAID-induced cell death on the distribution and quantity of
three glycerophospholipids, phosphatidylcholine (PC), phosphatidylethanolamine
(PE) and phosphatidylserine (PS), in the HCT-8 cells was examined using electrospray
iv
ionisation tandem mass spectrometry (ESI-MS/MS). The results showed that
treatment with Bi(tolf)3 or Bi(difl)3 caused alterations to the profile and concentration
of individual PC, PE and PS molecules. Additionally, specific trends were identified,
whereby changes to the saturation levels of the fatty acids comprising the PC, PE and
PS were observed. Treatment with both BiNSAIDs or NSAIDs caused an increase in
the proportion of the ether-linked PC and PE molecules relative to the overall profile
of PC and PE in the HCT-8 cells, which was accompanied by a significant increase in
the relative concentration of ether-linked PE molecules (but not PC) in the
BiNSAID-treated cells.
Encouraged by the promising in vitro anti-cancer activity of the BiNSAIDs against
the HCT-8 cells, several Bi(III) derivatives of aminoarenesulfonates,
indole-carboxylates, hydroxamates were screened for anti-cancer activity using the
MTT assay. A small selection of complexes from each class showed promising in vitro
toxicity, that warrants further investigation into the chemotherapeutic potential of
non-NSAID Bi(III) complexes.
The results presented in this Thesis reveal that BiNSAIDs, Bi(tolf)3, Bi(mef)3 and
Bi(difl)3, exhibit promising anti-cancer action against CRC cells in vitro. These findings
set the precedence to establish if the chemotherapeutic and chemopreventive
potential of the BiNSAIDs translates to an in vivo model of CRC.
v
DEDICATION
To my dear Pop,
My entire desire to work in medical research has been inspired by you in the
hope that your premature death was not in vain and that other sufferers of this cruel
ailment may have access to, and benefit from, more effective cancer preventions and
treatments in the future. As my sincerest thank you, this Thesis is dedicated to you.
In loving memory:
Robert John McAvoy
22nd September 1938 – 6th February 2003
vi
ACKNOWLEDGEMENTS
This research has been conducted with the support of the Australian Government
Research Training Program Scholarship.
The use of the Advanced Photon Source was supported by the U.S. Department of
Energy (DOE) Office of Science under Contract No. DEAC02-06CH11357. Travel
funding was provided by the International Synchrotron Access Program (ISAP)
managed by the Australian Synchrotron and funded by the Australian Government.
The synchrotron radiation infrared microspectroscopy studies were undertaken
on the Infrared Microspectroscopy beamline at the Australian Synchrotron, part
of ANSTO.
First and foremost I would like to give the sincerest thank you to my PhD and
Honours Supervisor, Dr Carolyn Dillon. I really appreciate the many opportunities you
have provided me throughout my PhD project, including the chance to perform
experiments at the synchrotrons in Melbourne and Chicago, as I have learnt so much
from these experiences. Thank you for allowing me the opportunity to be independent
when exploring different scientific approaches to this project and supporting me
through the highs and lows. Your dedication to your research students and to your
academic work is truly admirable. Thank you for your feedback and support while I
completed writing my Thesis and for your encouragement and belief in me, as I would
not have reached this stage without it!
I offer a generous thank you to Professor Philip Andrews (School of Chemistry,
Monash University), for his collaboration, support and scientific input throughout the
course of this project. I also offer my sincerest thanks to the past PhD students and
post-docs of the Andrews group, particularly Dr Ish Kumar, Dr Amita Pathak and
Dr Madleen Busse, for synthesising the Bi compounds required for this project.
I offer my sincerest thank you to Associate Professor Ronald Sluyter (School of
Biological Sciences, UOW) for his collaboration on many aspects of this project. From
providing me with colon cell lines to screen the compounds, to teaching me the
techniques necessary for the progression of the project, you have always been
vii
generous with your time, resources and knowledge and you have been a fantastic (and
also very patient) mentor.
My thanks go to Dr Mark Tobin, Dr Lilijana Puskar, Dr Danielle Martin and
Dr Keith Bambery at the Australian Synchrotron IR beamline (Clayton, Australia) for
their technical support and the data analysis advice they have provided me. I would
like to especially thank Dr Bambery for helpful scientific discussions and feedback in
regards to SR-IRMS data analysis. I must also thank Associate Professor Bayden Wood
(School of Chemistry, Monash University) and Dr Elizabeth Carter (Vibrational
Spectroscopy Facility, The University of Sydney) for helpful scientific discussions.
My thanks go to Dr Barry Lai at the 2-ID-D beamline at the Advanced Photon Source
(APS, Lemont, USA) for assisting me during the beamtime and for converting the files
generated into the required format for analysis, and Dr Stefan Vogt for providing the
required software so that I could analyse the data. My fellow group members, Judith
Carrall, Dr Lloyd James, Renee Di Pietro, Sandra Spremo, Gerard Sansom, and my
Supervisor, must be recognised for their efforts as each synchrotron trip is very much
a team effort – thank you for taking over so I could get some much needed sleep
throughout the beamtimes.
For technical support, I wish to thank Tony Romeo at the UOW Electron
Microscopy Centre (EMC) for teaching Judith Carrall and myself the art of the
microtome and locating the necessary equipment for us in the fledgling days of the
EMC as we prepared our samples for analysis at APS. I offer my warmest thanks to
Dr Wilford Lie (School of Chemistry, UOW) for his generosity with his time and advice
about NMR spectroscopy and for his wonderful management of the NMR facility.
I offer a sincere thank you to Dr Jennifer Saville (School of Chemistry, UOW), my lipid
queen, for assisting me with learning techniques necessary for my project’s success
and for her willingness to answer all my queries as I analysed the data; thank you also
for your continued friendship and support following your move interstate. I would
like to thank Associate Professor Todd Mitchell (School of Medicine, UOW) for
providing a number of resources required for the lipid mass spectrometry
experiments and the subsequent data analysis. I would like to thank the Technical
Services team (School of Chemistry, UOW) for maintaining the instruments necessary
for my project and coming to my aid when things went awry with them. I must thank
Dr Phil Barker (School of Chemistry, UOW) for helpful scientific discussions.
viii
I would like to offer my warmest thanks to my fellow group member, Judith
Carrall, who has been a constant source of friendship, support and encouragement
throughout our time together in the Dillon group. I cannot express enough the
gratitude I have for the patience and understanding you have shown me throughout
our PhD years. I truly treasure the friendship I have formed with you and I wish you
all the best wherever life takes you next. I would also like to sincerely thank Dr Lloyd
James as you were a significant presence in the Dillon lab during the course of our
PhDs, and you too have become a wonderful friend. Thank you to my other amazing
friends, especially Dr Monica Birrento, Dr Kimberly Davies, and Dr Diane Ly (among
others), for many inspirational PhD pep talks over the years. There are many
wonderful students I have had the pleasure to work with, and garnered support from,
while I have been a member of the Dillon group including; Tara Brown, Jacob Lambert,
Sandra Spremo, Melanie Pearsall, Renee Di Pietro and Erica Minato.
There are many wonderful staff and academics in the UOW School of Chemistry
(honorable mentions to Louisa Wildin, Associate Professor Steven Ralph, Associate
Professor Dianne Jolley and Associate Professor Glennys O’Brien) who have provided
me with support in some of the more challenging times during my studies. The
Operations team at the Illawarra Health and Medical Research Institute (IHMRI) has
been a source of support throughout the final stages of my degree, and I have been
incredibly fortunate to work with such a fantastic team of people. Finally, everyone
can stop asking me how my Thesis is going...what a relief!
I would like to thank Mr Peter Horsley, my fantastic Year 12 Chemistry teacher,
who not only inspired me to pursue a Chemistry degree, but also taught me not to
settle for average and pushed me to achieve my best academically. I would like to
thank my family, especially my parents, siblings and Nanna, for their constant support
and encouragement throughout my PhD, and the entirety of my undergraduate degree,
even if they are still not quite sure what it was I was doing in the lab all these years!
To my partner, Dr Jacob Lewis, thank you for inspiring me to see this project through
to the end and supporting me in more ways than you know during my degree.
ix
CERTIFICATION
I, Emma Louise Hawksworth, declare that this thesis submitted in fulfilment of the
requirements for the conferral of the degree Doctor of Philosophy, from the University of
Wollongong, is wholly my own work unless otherwise referenced or acknowledged. This
document has not been submitted for qualifications at any other academic institution.
________________________________ Emma Louise Hawksworth 29th March 2018
x
ABBREVIATIONS Δψm mitochondrial transmembrane potential
2AN-SO3H 2-amino-1-naphthalensulfonic acid
4A3HN-SO3H 4-amino-3-hydroxy-1-naphthalenesulfonic acid
5AN-SO3H 5-amino-1-naphthalensulfonic acid
7AAD 7-aminoactinomycin D
AAS atomic absorption spectroscopy
AnnV fluorescein isothiocyanate-labelled Annexin-V
aspH aspirin, acetylsalicylic acid
Bcl-2 B-cell lymphoma 2
BHA-H benzohydroxamic acid
BiNSAID bismuth complex of non-steroidal anti-inflammatory drug
biyp 2,2’-bipyridine
BSA bovine serum albumin
BSS bismuth subsalicylate
CBS colloidal bismuth subcitrate
cell medium RPMI-1640 that does not contain foetal bovine serum,
penicillin/streptomycin or GlutaMAX™ solutions
CID collision induced dissociation
cisplatin cis-diamminedichloroplatinum(II)
COX cyclooxygenase
CRC colorectal cancer
CV cardiovascular
DMSO-d6 deuterated dimethyl sulphoxide
dicloH diclofenac
difl diflunisate ligand
diflH diflunisal
DMA N,N-dimethylacetamide
DMF N,N-dimethylformamide
DMSO dimethyl sulphoxide
ECACC European Collection of Cell Cultures
ESI-MS electrospray ionisation mass spectrometry
ESI-MS/MS electrospray ionisation tandem mass spectrometry
FAAS flame atomic absorption spectroscopy
xi
FAP familial adenomatous polyposis
FDA U.S. Food and Drug Administration
fluH flufenamic acid
FITC fluorescein isothiocyanate
FTIR Fourier transform infrared
GMB gemcitabine
GFAAS graphite furnace atomic absorption spectroscopy
GI gastrointestinal
growth medium RPMI-1640 medium supplemented with 10% fetal bovine
serum, GlutaMAX™ (2 mM), penicillin and streptomycin (final
concentration 200 IU/mL and 200 µg/mL, respectively)
HA hypocrellin A
HCT-8 human ileocecal colorectal cancer cell line
HEPES 4-(2-hydroxyethyl)piperazine-1-ethanesulfonic acid
Hp haptoglobin
hPBMC human peripheral blood mononuclear cell
H. pylori Helicobacter pylori
ibuH ibuprofen
IC50 concentration required to cause 50% inhibition
ICP-MS inductively coupled plasma-atomic mass spectrometry
IGA-H indole-3-glyoxylic acid
IL interleukin
ILA-H indole-3-lactic acid
indoH indomethacin
IR infrared
IRMS infrared microspectroscopy
isox isoxicam
ketoH ketoprofen
LOD limit of detection
LOQ limit of quantification
mecloH meclofenamic acid
mef mefenamate ligand
mefH mefenamic acid
melox meloxicam
xii
MMP matrix metalloproteinase
MS/MS tandem mass spectrometry
MT metallothionein
MTT 3-(4,5-dimethylthiazol-2-yl)-2,5-diphenyltetrazolium bromide
MTX methotrexate
napH naproxen
n.d. not determined
NMR nuclear magnetic resonance
ns not significant
NSAID non-steroidal anti-inflammatory drug
oAB-SO3H ortho-aminobenzenesulfonic acid
O-AcSHA-H O-acetylsalicylhydroxamic acid
pAB-SO3H para-aminobenzenesulfonic acid
PBS phosphate buffered saline
PC phosphatidylcholine
PCA principal component analysis
PE phosphatidylethanolamine
PGD2 prostaglandin D2
PGE2 prostaglandin E2
PGF2α prostaglandin F2α
PGG2 prostaglandin G2
PGH2 prostaglandin H2
PGI2 prostaglandin I2
phen 1,10-phenanthroline
pirox piroxicam
PL phospholipid
POX peroxidase
POPC 1-palmitoyl-2-oleoyl-sn-glycero-3-phosphocholine
PS phosphatidylserine
py pyridine
QqQ triple quadrupole
RBC ranitidine bismuth citrate
RMieS resonant Mie scatter
RPMI-1640 Roswell Park Memorial Institute 1640 cell medium
xiii
ROI region of interest
ROS reactive oxygen species
SHA-H salicylhydroxamic acid
SR synchrotron radiation
sh shoulder
SRB sulforhodamine B
SR-IRMS synchrotron radiation infrared microspectroscopy
SRXRF synchrotron radiation X-ray fluorescence
tenox tenoxicam
tolf tolfenamate ligand
tolfH tolfenamic acid
TXA2 thromboxane A2
UV-Vis ultraviolet-visible
VEGF vascular endothelial growth factor
vehicle RPMI-1640 containing 2% v/v DMSO
xiv
LIST OF PUBLICATIONS
Hawksworth, E.L., Andrews, P.C., Lie, W., Lai, B., Dillon, C.T. Biological evaluation of
bismuth non-steroidal anti-inflammatory drugs (BiNSAIDs): Stability, toxicity and
uptake in HCT-8 colon cancer cells. J Inorg Biochem, 135 (2014) 28–39.
LIST OF CONFERENCE PRESENTATIONS
Hawksworth, E.L., Andrews, P.C., Sluyter, R., Saville, J.T., Spremo, S., Tobin, M.J.,
Martin, D., Dillon, C.T. (2014) Biomolecular studies of bismuth non-steroidal
anti-inflammatory drugs in human colon cancer cells. 7th Asian Biological Inorganic
Chemistry Conference, Gold Coast, Australia. Poster presentation.
Hawksworth, E.L., Andrews, P.C., Sluyter, R., Saville, J.T., Spremo, S., Tobin, M.J.,
Martin, D., Dillon, C.T. (2014) Biomolecular studies of bismuth non-steroidal
anti-inflammatory drugs in human colon cancer cells. RACI National Congress,
Adelaide, Australia. Poster presentation.
xv
TABLE OF CONTENTS
Abstract .................................................................................................................................................................... ii
Dedication ............................................................................................................................................................... v
Acknowledgements ............................................................................................................................................ vi
Certification ........................................................................................................................................................... ix
Abbreviations ......................................................................................................................................................... x
List of Publications ........................................................................................................................................... xiv
List of Conference Presentations ................................................................................................................ xiv
Table of Contents ............................................................................................................................................... xv
List of Figures ................................................................................................................................................... xxii
List of Tables ...................................................................................................................................................... xxx
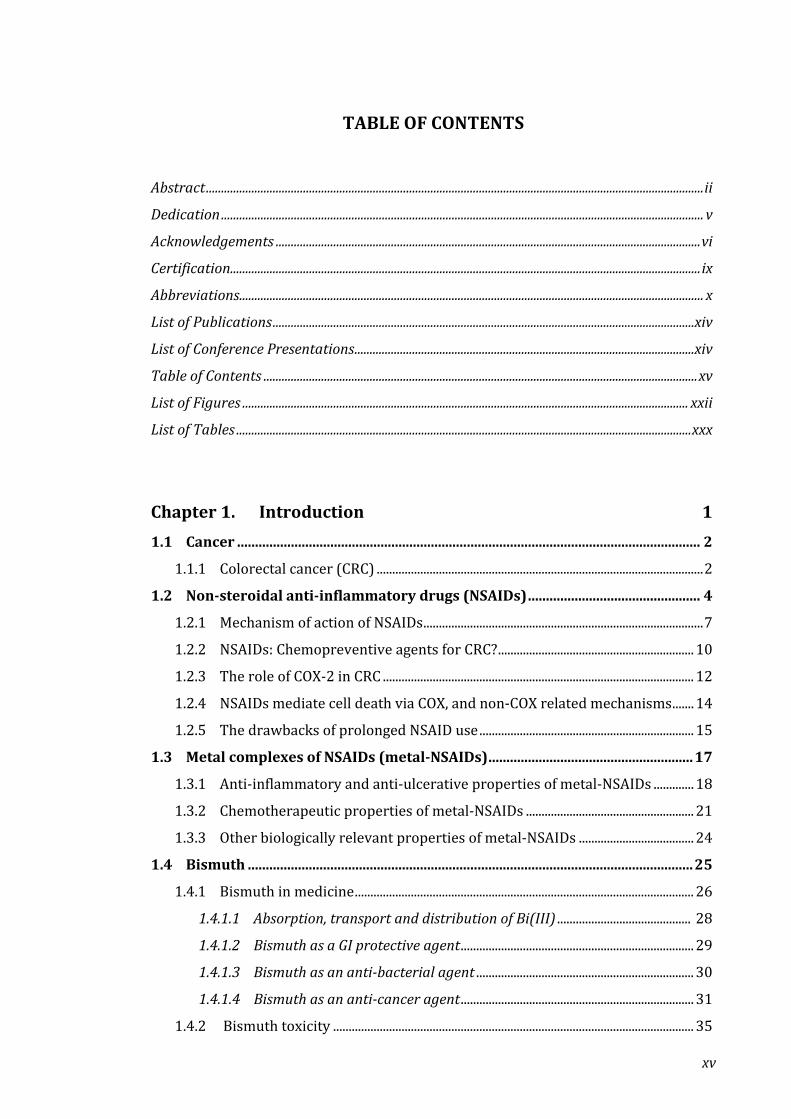
Chapter 1. Introduction 1 1.1 Cancer ................................................................................................................................. 2
1.1.1 Colorectal cancer (CRC) ......................................................................................................... 2
1.2 Non-steroidal anti-inflammatory drugs (NSAIDs) ................................................ 4
1.2.1 Mechanism of action of NSAIDs .......................................................................................... 7
1.2.2 NSAIDs: Chemopreventive agents for CRC? ............................................................... 10
1.2.3 The role of COX-2 in CRC .................................................................................................... 12
1.2.4 NSAIDs mediate cell death via COX, and non-COX related mechanisms ....... 14
1.2.5 The drawbacks of prolonged NSAID use ..................................................................... 15
1.3 Metal complexes of NSAIDs (metal-NSAIDs) ......................................................... 17
1.3.1 Anti-inflammatory and anti-ulcerative properties of metal-NSAIDs ............. 18
1.3.2 Chemotherapeutic properties of metal-NSAIDs ...................................................... 21
1.3.3 Other biologically relevant properties of metal-NSAIDs ..................................... 24
1.4 Bismuth ............................................................................................................................ 25
1.4.1 Bismuth in medicine ............................................................................................................. 26
1.4.1.1 Absorption, transport and distribution of Bi(III) ........................................... 28
1.4.1.2 Bismuth as a GI protective agent ........................................................................... 29
1.4.1.3 Bismuth as an anti-bacterial agent ...................................................................... 30
1.4.1.4 Bismuth as an anti-cancer agent ........................................................................... 31
1.4.2 Bismuth toxicity .................................................................................................................... 35
xvi
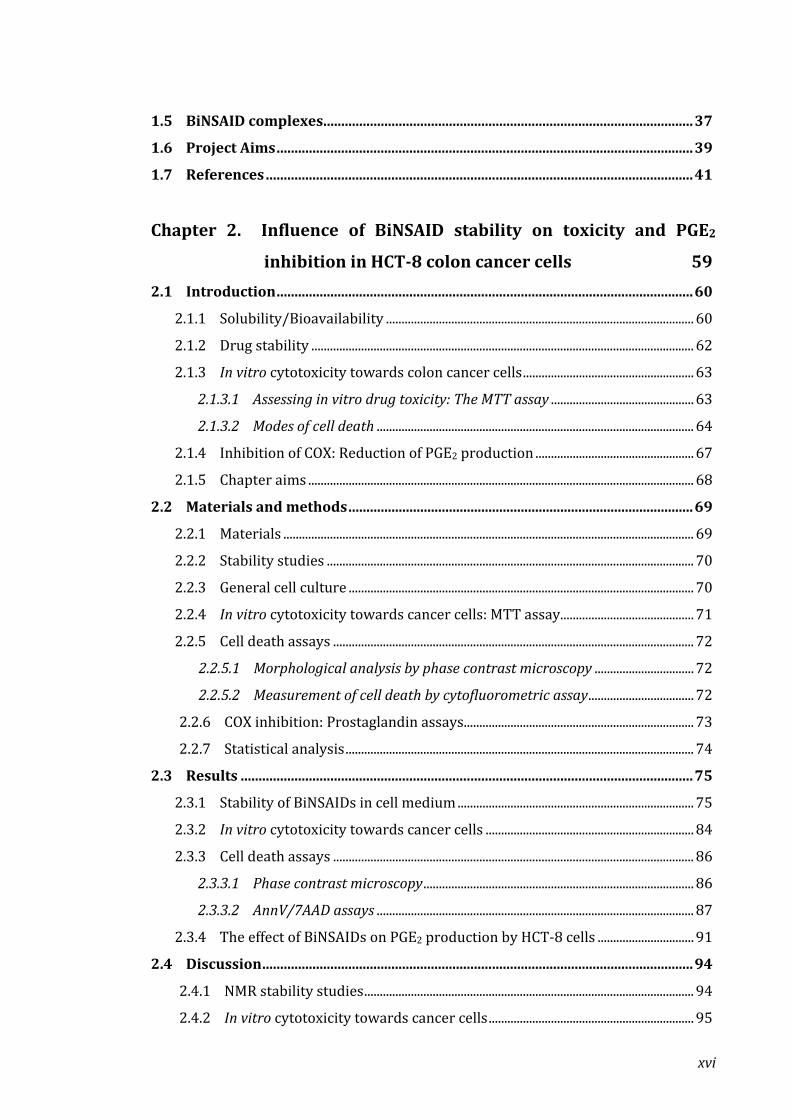
1.5 BiNSAID complexes ....................................................................................................... 37
1.6 Project Aims .................................................................................................................... 39
1.7 References ....................................................................................................................... 41
Chapter 2. Influence of BiNSAID stability on toxicity and PGE2
inhibition in HCT-8 colon cancer cells 59 2.1 Introduction .................................................................................................................... 60
2.1.1 Solubility/Bioavailability ................................................................................................... 60
2.1.2 Drug stability ........................................................................................................................... 62
2.1.3 In vitro cytotoxicity towards colon cancer cells ....................................................... 63
2.1.3.1 Assessing in vitro drug toxicity: The MTT assay .............................................. 63
2.1.3.2 Modes of cell death ...................................................................................................... 64
2.1.4 Inhibition of COX: Reduction of PGE2 production ................................................... 67
2.1.5 Chapter aims ............................................................................................................................ 68
2.2 Materials and methods ................................................................................................ 69
2.2.1 Materials .................................................................................................................................... 69
2.2.2 Stability studies ...................................................................................................................... 70
2.2.3 General cell culture ............................................................................................................... 70
2.2.4 In vitro cytotoxicity towards cancer cells: MTT assay ........................................... 71
2.2.5 Cell death assays .................................................................................................................... 72
2.2.5.1 Morphological analysis by phase contrast microscopy ................................ 72
2.2.5.2 Measurement of cell death by cytofluorometric assay .................................. 72
2.2.6 COX inhibition: Prostaglandin assays .......................................................................... 73
2.2.7 Statistical analysis ................................................................................................................ 74
2.3 Results .............................................................................................................................. 75
2.3.1 Stability of BiNSAIDs in cell medium ............................................................................ 75
2.3.2 In vitro cytotoxicity towards cancer cells ................................................................... 84
2.3.3 Cell death assays .................................................................................................................... 86
2.3.3.1 Phase contrast microscopy ....................................................................................... 86
2.3.3.2 AnnV/7AAD assays ...................................................................................................... 87
2.3.4 The effect of BiNSAIDs on PGE2 production by HCT-8 cells ............................... 91
2.4 Discussion ........................................................................................................................ 94
2.4.1 NMR stability studies .......................................................................................................... 94
2.4.2 In vitro cytotoxicity towards cancer cells .................................................................. 95

xvii
2.4.3 Cell death assays ................................................................................................................... 98
2.4.4 PGE2 production ................................................................................................................. 100
2.5 Chapter summary ....................................................................................................... 103
2.6 References .................................................................................................................... 105
Chapter 3. Uptake and localisation of Bi by BiNSAID-treated HCT-8
colon cancer cells 111 3.1 Introduction ................................................................................................................. 112
3.1.1 Atomic absorption spectroscopy for studying cellular uptake of inorganic
complexes/drugs ................................................................................................................ 113
3.1.2 Microprobe synchrotron radiation X-ray fluorescence imaging for studying
intracellular metal localisation ..................................................................................... 114
3.1.3 Chapter aims ......................................................................................................................... 117
3.2 Materials and methods ............................................................................................. 118
3.2.1 Materials ................................................................................................................................. 118
3.2.2 Cell culture procedures .................................................................................................... 118
3.2.3 GFAAS uptake studies ....................................................................................................... 118
3.2.3.1 Preparation of cell digests ................................................................................... 118
3.2.3.2 Preparation of fixed/dehydrated cell digests ............................................. 119
3.2.3.3 Graphite furnace atomic absorption spectroscopy .................................. 120
3.2.4 Microprobe SRXRF analysis of Bi-treated cells ..................................................... 120
3.2.4.1 Preparation of thin-sectioned cell samples ................................................. 120
3.2.4.2 Microprobe SRXRF analysis of thin-sectioned cells ................................. 121
3.2.5 Statistical analysis .............................................................................................................. 122
3.3 Results ........................................................................................................................... 123
3.3.1 GFAAS analysis of cellular Bi ......................................................................................... 123
3.3.1.1 The dependence of cell preparation on the cellular uptake of Bi. ......... 125
3.3.2 Microprobe SRXRF spectroscopy ................................................................................ 126
3.4 Discussion ..................................................................................................................... 131
2.4.1 GFAAS uptake studies...................................................................................................... 131
2.4.2 Microprobe SRXRF spectroscopy of thin-sectioned cells ................................ 134
3.5 Chapter summary ....................................................................................................... 140
3.6 References .................................................................................................................... 141
xviii
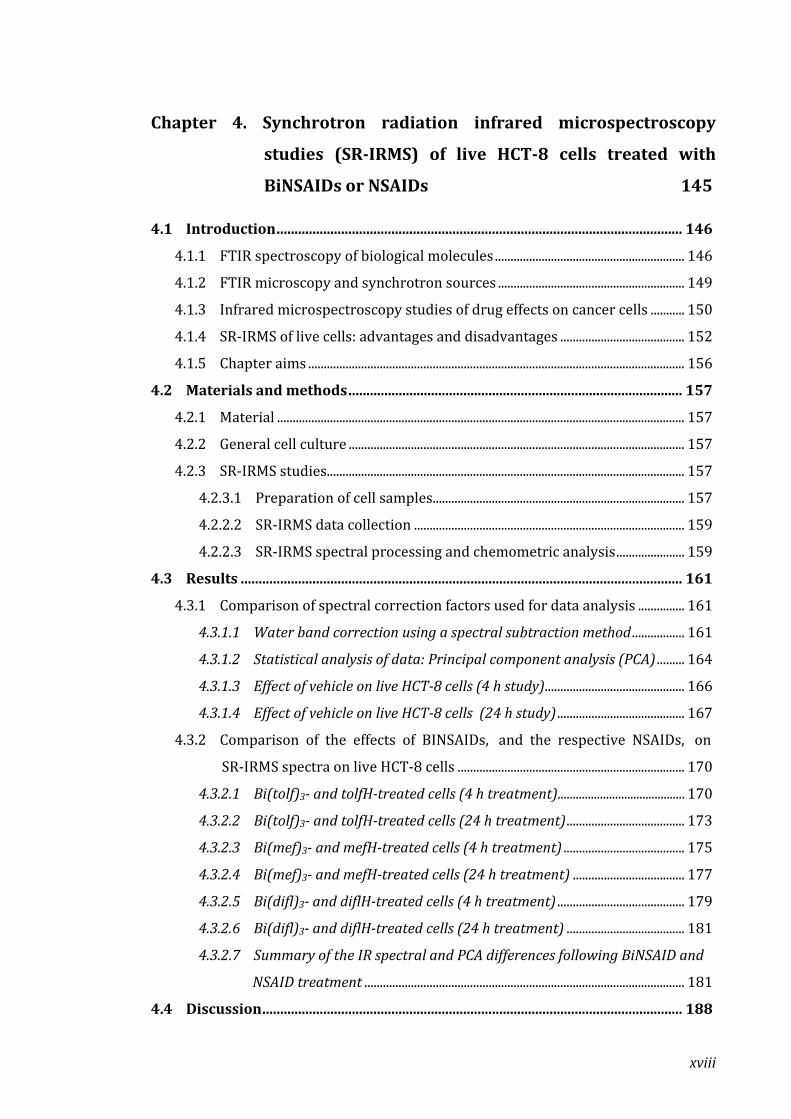
Chapter 4. Synchrotron radiation infrared microspectroscopy
studies (SR-IRMS) of live HCT-8 cells treated with
BiNSAIDs or NSAIDs 145
4.1 Introduction ................................................................................................................. 146
4.1.1 FTIR spectroscopy of biological molecules ............................................................. 146
4.1.2 FTIR microscopy and synchrotron sources ............................................................ 149
4.1.3 Infrared microspectroscopy studies of drug effects on cancer cells ........... 150
4.1.4 SR-IRMS of live cells: advantages and disadvantages ........................................ 152
4.1.5 Chapter aims ......................................................................................................................... 156
4.2 Materials and methods ............................................................................................. 157
4.2.1 Material ................................................................................................................................... 157
4.2.2 General cell culture ............................................................................................................ 157
4.2.3 SR-IRMS studies................................................................................................................... 157
4.2.3.1 Preparation of cell samples................................................................................. 157
4.2.2.2 SR-IRMS data collection ....................................................................................... 159
4.2.2.3 SR-IRMS spectral processing and chemometric analysis ...................... 159
4.3 Results ........................................................................................................................... 161
4.3.1 Comparison of spectral correction factors used for data analysis ............... 161
4.3.1.1 Water band correction using a spectral subtraction method ................. 161
4.3.1.2 Statistical analysis of data: Principal component analysis (PCA) ......... 164
4.3.1.3 Effect of vehicle on live HCT-8 cells (4 h study)............................................. 166
4.3.1.4 Effect of vehicle on live HCT-8 cells (24 h study) ......................................... 167
4.3.2 Comparison of the effects of BINSAIDs, and the respective NSAIDs, on
SR-IRMS spectra on live HCT-8 cells ......................................................................... 170
4.3.2.1 Bi(tolf)3- and tolfH-treated cells (4 h treatment) .......................................... 170
4.3.2.2 Bi(tolf)3- and tolfH-treated cells (24 h treatment) ...................................... 173
4.3.2.3 Bi(mef)3- and mefH-treated cells (4 h treatment) ....................................... 175
4.3.2.4 Bi(mef)3- and mefH-treated cells (24 h treatment) .................................... 177
4.3.2.5 Bi(difl)3- and diflH-treated cells (4 h treatment) ......................................... 179
4.3.2.6 Bi(difl)3- and diflH-treated cells (24 h treatment) ...................................... 181
4.3.2.7 Summary of the IR spectral and PCA differences following BiNSAID and
NSAID treatment ....................................................................................................... 181
4.4 Discussion ..................................................................................................................... 188
xix
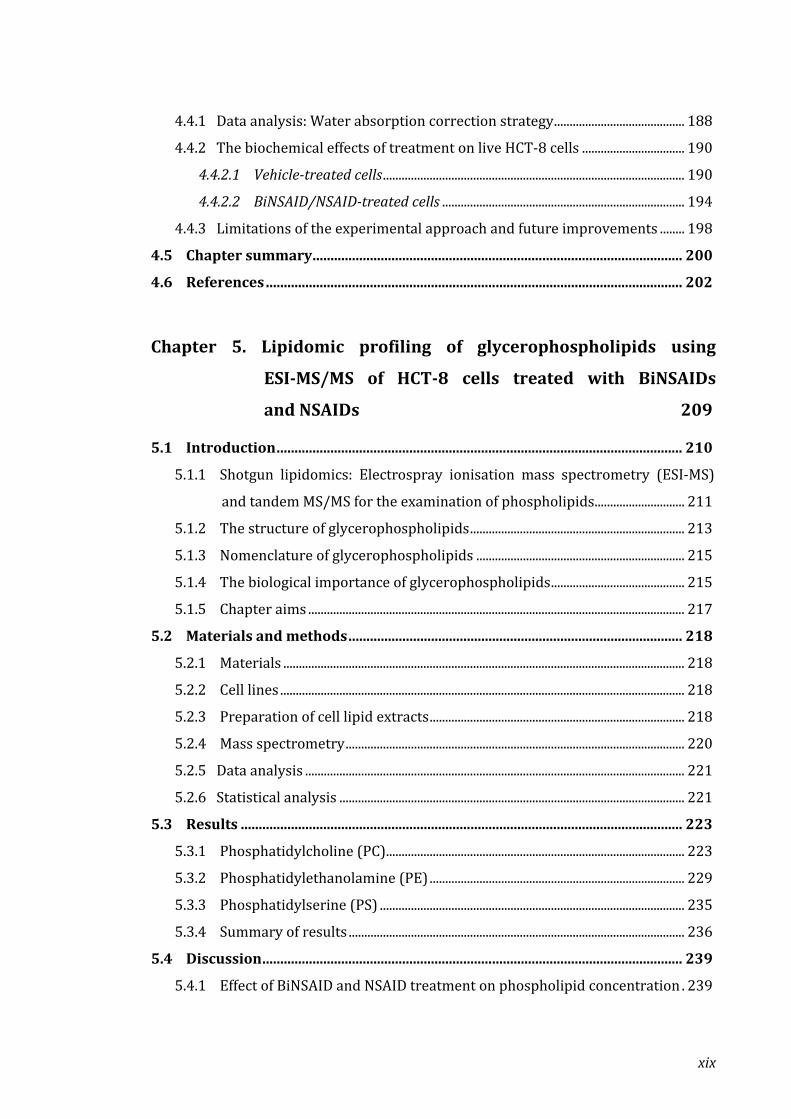
4.4.1 Data analysis: Water absorption correction strategy .......................................... 188
4.4.2 The biochemical effects of treatment on live HCT-8 cells ................................. 190
4.4.2.1 Vehicle-treated cells ................................................................................................. 190
4.4.2.2 BiNSAID/NSAID-treated cells .............................................................................. 194
4.4.3 Limitations of the experimental approach and future improvements ........ 198
4.5 Chapter summary ....................................................................................................... 200
4.6 References .................................................................................................................... 202
Chapter 5. Lipidomic profiling of glycerophospholipids using
ESI-MS/MS of HCT-8 cells treated with BiNSAIDs
and NSAIDs 209
5.1 Introduction ................................................................................................................. 210
5.1.1 Shotgun lipidomics: Electrospray ionisation mass spectrometry (ESI-MS)
and tandem MS/MS for the examination of phospholipids ............................. 211
5.1.2 The structure of glycerophospholipids ..................................................................... 213
5.1.3 Nomenclature of glycerophospholipids ................................................................... 215
5.1.4 The biological importance of glycerophospholipids ........................................... 215
5.1.5 Chapter aims ......................................................................................................................... 217
5.2 Materials and methods ............................................................................................. 218
5.2.1 Materials ................................................................................................................................. 218
5.2.2 Cell lines .................................................................................................................................. 218
5.2.3 Preparation of cell lipid extracts .................................................................................. 218
5.2.4 Mass spectrometry ............................................................................................................. 220
5.2.5 Data analysis .......................................................................................................................... 221
5.2.6 Statistical analysis ............................................................................................................... 221
5.3 Results ........................................................................................................................... 223
5.3.1 Phosphatidylcholine (PC) ................................................................................................ 223
5.3.2 Phosphatidylethanolamine (PE) .................................................................................. 229
5.3.3 Phosphatidylserine (PS) .................................................................................................. 235
5.3.4 Summary of results ............................................................................................................ 236
5.4 Discussion ..................................................................................................................... 239
5.4.1 Effect of BiNSAID and NSAID treatment on phospholipid concentration . 239
xx
5.4.2 The effect of BiNSAID and NSAID treatment on fatty acyl chain saturation ....
................................................................................................................................................................... 241
5.4.3 The effect of BiNSAID and NSAID treatment on ether-linked molecules .. 243
5.4.4 Overall summary of results and future directions ............................................... 243
5.5 Chapter summary ....................................................................................................... 247
5.6 References .................................................................................................................... 249
Chapter 6. Exploration of the in vitro toxicity of Bi(III)
aminoarenesulfonate, indole-carboxylate, and
hydroxamate complexes 253
6.1 Introduction ................................................................................................................. 254
6.1.1 Sulfonic acids and Bi(III) aminoarenesulfonates ................................................. 254
6.1.2 Indoles and Bi(III) indole-carboxylates .................................................................... 257
6.1.3 Hydroxamic acids and Bi(III) hydroxamates ......................................................... 258
6.1.5 Chapter aims ......................................................................................................................... 261
6.2 Materials and methods ............................................................................................. 262
6.2.1 Materials ................................................................................................................................. 262
6.2.2 Cell lines .................................................................................................................................. 262
6.2.3 MTT assay .............................................................................................................................. 262
6.3 Results ........................................................................................................................... 263
6.4 Discussion ..................................................................................................................... 266
6.4.1 Bi(III) aminoarenesulfonates ........................................................................................ 266
6.4.2 Bi(III) indole-carboxylates ............................................................................................. 267
6.4.3 Bi(III) hydroxamates ......................................................................................................... 268
6.5 Chapter summary ....................................................................................................... 270
6.6 References .................................................................................................................... 271
Chapter 7. Conclusions and future directions 275 7.1 Conclusions .................................................................................................................. 276
7.2 Future directions ........................................................................................................ 282
Appendices 284
Appendix 1 Additional MTT and PGE2 assays .......................................................... 284
xxi
Appendix 2 Additional whole cell and thin-sectioned cell maps ....................... 288
Appendix 3 Additional SR-IRMS spectra .................................................................... 292
Appendix 4 Additional ESI-MS/MS results ................................................................ 304
Appendix 5 Additional MTT assay results ................................................................. 305
xxii
LIST OF FIGURES Figure 1.1: Age-standardised incidence (1982-2014) and mortality rates (1968-2014)
of colorectal cancers in Australia ............................................................................................................. 3
Figure 1.2: Chemical classes of NSAIDs ............................................................................................... 6
Figure 1.3: The conversion of arachidonic acid to prostaglandins via COX ........................ 8
Figure 1.4: The key structural residues of the COX-1 and COX-2 active sites .................... 9
Figure 1.5: Selected molecular pathways affected by the over-expression of COX-2 in
neoplasia .......................................................................................................................................................... 13
Figure 1.6: Chemical structures of bismuth compounds that have shown potential
anti-cancer activity in vitro ...................................................................................................................... 33
Figure 1.7: Representation of the chemical structures of (a) Bi(tolf)3 and Bi(mef)3, and
(b) Bi(difl)3 as inferred by elemental analysis, IR and NMR data .......................................... 39
Figure 2.1: The use of flow cytometry to distinguish modes of cell death using
AnnV and 7AAD ............................................................................................................................................ 67
Figure 2.2: 1H NMR spectra of the aromatic region (6.6-8.0 ppm) of: (a) tolfH; (b) tolfH
collected after incubation in cell medium (24 h, 37 °C); (c) Bi(tolf)3 and, (d) Bi(tolf)3
collected after incubation in cell medium (24 h, 37 °C) ............................................................. 76
Figure 2.3: 1H NMR spectra of the aromatic region (6.6-8.0 ppm) of: (a) mefH;
(b) mefH collected after incubation in cell medium (24 h, 37 °C); (c) Bi(mef)3 and,
(d) Bi(mef)3 collected after incubation in cell medium (24 h, 37 °C) ................................... 79
Figure 2.4: 1H NMR spectra of the aromatic region (6.6-8.0 ppm) of: (a) diflH; (c) diflH
collected after incubation in cell medium (24 h, 37 °C); (d) Bi(difl)3, and (f) Bi(difl)3
collected after incubation in cell medium (24 h, 37 °C) ................................................................... 82
Figure 2.5: 1H NMR spectra of: (a) unknown molecule present in the sample
containing Bi(difl)3 collected after incubation in cell medium (24 h, 37 °C); and
(b) D-glucose .................................................................................................................................................. 84
Figure 2.6: Concentration-response curves obtained from the MTT assays of HCT-8
cells treated with tolfH, Bi(tolf)3, mefH, Bi(mef)3, diflH, or Bi(difl)3 (24 h) ....................... 86
Figure 2.7: Morphological effects following 24-h treatment with: (a) vehicle (DMSO
2% v/v); (b) Bi(tolf)3 (15 μM); (c) tolfH (45 μM); (d) Bi(mef)3 (40 μM);
(e) mefH (120 μM); (f) Bi(difl)3 (75 μM); and (g) diflH (225 μM) ......................................... 88
xxiii
Figure 2.8: Flow cytometric analysis of cell death in HCT-8 cells treated for 24 h with
vehicle (RPMI-1640, 2% v/v DMSO; Control), BiNSAIDs (Bi(tolf)3 (15 µM),
Bi(mef)3 (40 µM) or Bi(difl)3 (75 µM)); or the respective equimolar free NSAIDs ........ 90
Figure 2.9: Concentration-response curve obtained from the PGE2 assays of HCT-8
cells treated (4 h) with: (a) tolfH, Bi(tolf)3, mefH, Bi(mef)3; and (b) diflH, Bi(difl)3, and
aspH, followed by arachidonic acid (20 µM, 30 min) .................................................................. 92
Figure 3.1: Bohr atom model illustrating the basic principle of X-ray fluorescence..115
Figure 3.2: Trypan blue exclusion assay and GFAAS analysis of HCT-8 cells treated
with Bi compounds .................................................................................................................................. 124
Figure 3.3: GFAAS detection of Bi in HCT-8 cells following exposure to the specified Bi
compounds (40 μM, 24 h) prepared by normal washing method or prepared following
fixation with glutaraldehyde (2% in PBS, 2 h) and dehydration with ethanol ............. 125
Figure 3.4: Microprobe SRXRF elemental maps for thin-sectioned HCT-8 cells
following 24-h treatment with: (a) vehicle only (DMSO 2% v/v); (b) Bi(difl)3 (40 μM);
(c) Bi(mef)3 (40 μM); (d) Bi(tolf)3 (40 μM); and (e) BSS (40 μM) ....................................... 127
Figure 3.5: Quantifications of: (a) P; (b) Zn; (c) Ca; and (d) Bi, in the cytoplasmic and
nuclear regions of the HCT-8 thin-sectioned cells following 24-h treatment with
vehicle (2% DMSO v/v), or the specified Bi compounds (40 μM) ...................................... 130
Figure 4.1: Fundamental modes of vibration of IR active molecules ............................... 147
Figure 4.2: Typical IR signatures of biological materials ...................................................... 148
Figure 4.3: A single fixed HCT-8 cell spectrum superimposed with a spectrum
collected from cell medium .................................................................................................................. 155
Figure 4.4: Construction of the compression cell holder components employed for
SR-IRMS measurements ......................................................................................................................... 158
Figure 4.5: Individual cell spectrum before and following water subtraction to a
correction value of −0.04 using OPUS 7.0 ...................................................................................... 160
Figure 4.6: (a) Averaged (n = 59), baseline corrected (rubberband baseline corrected,
64 baseline points), vector normalised HCT-8 cell spectra following 4-h incubation in
cell medium before, and after, water band subtraction. (b) Unit vector normalised,
second derivative of the spectra shown in (a) ............................................................................. 162
Figure 4.7: PCA scores plot (left) and corresponding PC-1 and PC-2 X-loadings plots
(right) of second derivative (Savitzky Golay, 13 smoothing points), unit vector
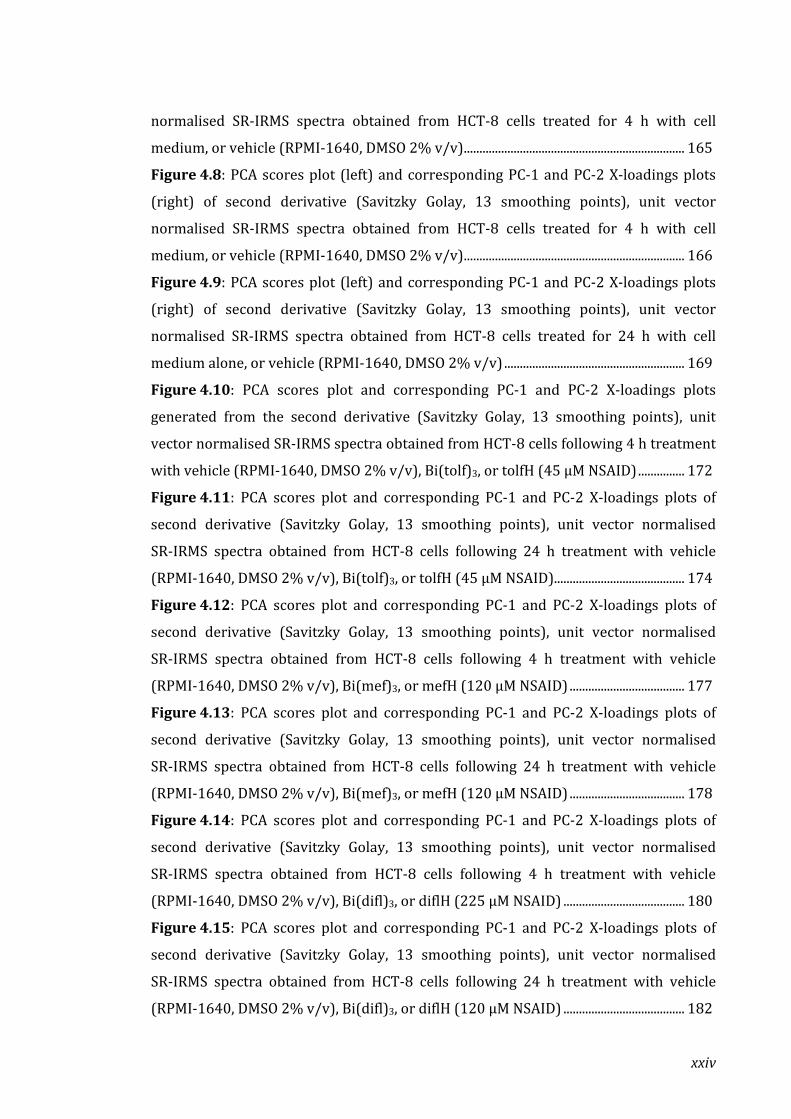
xxiv
normalised SR-IRMS spectra obtained from HCT-8 cells treated for 4 h with cell
medium, or vehicle (RPMI-1640, DMSO 2% v/v) ....................................................................... 165
Figure 4.8: PCA scores plot (left) and corresponding PC-1 and PC-2 X-loadings plots
(right) of second derivative (Savitzky Golay, 13 smoothing points), unit vector
normalised SR-IRMS spectra obtained from HCT-8 cells treated for 4 h with cell
medium, or vehicle (RPMI-1640, DMSO 2% v/v) ....................................................................... 166
Figure 4.9: PCA scores plot (left) and corresponding PC-1 and PC-2 X-loadings plots
(right) of second derivative (Savitzky Golay, 13 smoothing points), unit vector
normalised SR-IRMS spectra obtained from HCT-8 cells treated for 24 h with cell
medium alone, or vehicle (RPMI-1640, DMSO 2% v/v) .......................................................... 169
Figure 4.10: PCA scores plot and corresponding PC-1 and PC-2 X-loadings plots
generated from the second derivative (Savitzky Golay, 13 smoothing points), unit
vector normalised SR-IRMS spectra obtained from HCT-8 cells following 4 h treatment
with vehicle (RPMI-1640, DMSO 2% v/v), Bi(tolf)3, or tolfH (45 μM NSAID) ............... 172
Figure 4.11: PCA scores plot and corresponding PC-1 and PC-2 X-loadings plots of
second derivative (Savitzky Golay, 13 smoothing points), unit vector normalised
SR-IRMS spectra obtained from HCT-8 cells following 24 h treatment with vehicle
(RPMI-1640, DMSO 2% v/v), Bi(tolf)3, or tolfH (45 μM NSAID).......................................... 174
Figure 4.12: PCA scores plot and corresponding PC-1 and PC-2 X-loadings plots of
second derivative (Savitzky Golay, 13 smoothing points), unit vector normalised
SR-IRMS spectra obtained from HCT-8 cells following 4 h treatment with vehicle
(RPMI-1640, DMSO 2% v/v), Bi(mef)3, or mefH (120 μM NSAID) ..................................... 177
Figure 4.13: PCA scores plot and corresponding PC-1 and PC-2 X-loadings plots of
second derivative (Savitzky Golay, 13 smoothing points), unit vector normalised
SR-IRMS spectra obtained from HCT-8 cells following 24 h treatment with vehicle
(RPMI-1640, DMSO 2% v/v), Bi(mef)3, or mefH (120 μM NSAID) ..................................... 178
Figure 4.14: PCA scores plot and corresponding PC-1 and PC-2 X-loadings plots of
second derivative (Savitzky Golay, 13 smoothing points), unit vector normalised
SR-IRMS spectra obtained from HCT-8 cells following 4 h treatment with vehicle
(RPMI-1640, DMSO 2% v/v), Bi(difl)3, or diflH (225 μM NSAID) ....................................... 180
Figure 4.15: PCA scores plot and corresponding PC-1 and PC-2 X-loadings plots of
second derivative (Savitzky Golay, 13 smoothing points), unit vector normalised
SR-IRMS spectra obtained from HCT-8 cells following 24 h treatment with vehicle
(RPMI-1640, DMSO 2% v/v), Bi(difl)3, or diflH (120 μM NSAID) ....................................... 182

xxv
Figure 5.1: Schematic representation of the shotgun lipidomic profiling method by
tandem mass spectrometry using a triple quadrupole (QqQ) MS instrument .............. 212
Figure 5.2: Chemical structure of: (a) Glycerophospholipids; (b) Common
glycerophospholipid head groups; (c) A fatty acid (18 carbons in length) containing no
double bonds (saturated), a single double bond (monounsaturated), and two double
bonds (polyunsaturated) ....................................................................................................................... 214
Figure 5.3: Profile of phosphatidylcholine (PC) molecules in HCT-8 cells following
24-h treatment with vehicle (DMSO 2% v/v), Bi(tolf)3 (15 µM), or tolfH (45 µM),
calculated as a percentage of total PC .............................................................................................. 224
Figure 5.4: Profile of phosphatidylcholine (PC) molecules in HCT-8 cells following
24-h treatment with vehicle (DMSO 2% v/v), Bi(difl)3 (75 µM), or diflH (225 µM),
calculated as a percentage of total PC .............................................................................................. 225
Figure 5.5: The proportion of phosphatidylcholine (PC) molecules with fatty acid
chains containing saturated, monounsaturated, polyunsaturated or ether-linked fatty
acids calculated as a percentage of the total PC molecules identified in HCT-8 cell lipid
extracts .......................................................................................................................................................... 227
Figure 5.6: The normalised concentration of phosphatidylcholine (PC) molecules
containing saturated, monounsaturated, polyunsaturated or ether-linked fatty acids in
HCT-8 cell lipid extracts treated for 24 h with: (a) vehicle (RPMI-1640, DMSO 2% v/v),
Bi(tolf)3 (15 µM) or tolfH (45 µM); and (b) vehicle (RPMI-1640, DMSO 2% v/v),
Bi(difl)3 (75 µM) or diflH (225 µM) .................................................................................................. 228
Figure 5.7: Profile of phosphatidylethanolamine (PE) molecules in HCT-8 cells
following 24 h treatment with: (a) vehicle (DMSO 2% v/v), Bi(tolf)3 (15 µM), or tolfH
(45 µM); and (b) vehicle (DMSO 2% v/v), Bi(difl)3 (75 µM), or diflH (225 µM),
calculated as a percentage of total PE .............................................................................................. 230
Figure 5.8: The proportion of phosphatidylethanolamine (PE) molecules containing
monounsaturated, polyunsaturated or ether-linked fatty acids calculated as a
percentage of the total PE molecules identified in HCT-8 cell lipid extracts ................. 232
Figure 5.9: The normalised concentration of phosphatidylethanolamine (PE)
molecules containing monounsaturated, polyunsaturated or ether-linked fatty acids in
HCT-8 cell lipid extracts treated for 24 h with: (a) vehicle (RPMI-1640, DMSO 2% v/v),
Bi(tolf)3 (15 µM) or tolfH (45 µM); and (b) vehicle (RPMI-1640, DMSO 2% v/v),
Bi(difl)3 (75 µM) or diflH (225 µM). ................................................................................................. 234

xxvi
Figure 5.10: Profile of phosphatidylserine (PS) molecules in HCT-8 cells following
24 h treatment with: (a) vehicle (RPMI-1640, DMSO 2% v/v), Bi(tolf) 3 (15 µM), or
tolfH (45 µM); and (b) vehicle (RPMI-1640, DMSO 2% v/v), Bi(difl)3 (75 µM), or
diflH (225 µM), calculated as a percentage of total PS ............................................................. 235
Figure 5.11: The normalised concentration of phosphatidylserine (PS) molecules in
HCT-8 cell lipid extracts treated for 24 h with: (a) vehicle (RPMI-1640, DMSO 2% v/v),
Bi(tolf)3 (15 µM) or tolfH (45 µM); and (b) vehicle (RPMI-1640, DMSO 2% v/v),
Bi(difl) 3 (75 µM) or diflH (225 µM) .................................................................................................. 236
Figure 6.1: The chemical structures of biologically active sulfonic acids ...................... 255
Figure 6.2: The chemical structures of the aminoarenesulfonic acids used to synthesis
the five Bi(III) aminoarenesulfonate complexes investigated in the present study ... 256
Figure 6.3: The chemical structures of biologically active indoles, and the
indole-carboxylic acids used to synthesise the two Bi(III) indole-carboxylate
complexes investigated in this study ............................................................................................... 258
Figure 6.4: The chemical structures of a selection of biologically active hydroxamic
acids, and the hydroxamic acids used to synthesise the three Bi(III) hydroxamate
complexes investigated in this study ............................................................................................... 260
Figure 6.5: Concentration-response curves obtained from the MTT assays of HCT-8
cells treated with: (a) Bi(4A3HN-SO3)3 and 4A3HN-SO3H; (b) Bi(IGA)3, Bi(ILA)3, IGA-H
and ILA-H; (c) Bi(SHA)3, SHA-H, Bi(O-AcSHA)3 and O-AcSHA-H; and (d) Bi(BHA)3 and
BHA-H (24 h) ............................................................................................................................................... 264
Appendix 1.1: Concentration-response curve obtained from the MTT assay of DMSO
concentration (% v/v in RPMI-1640) in HCT-8 cells after 24-h treatment .................... 284
Appendix 1.2: Concentration-response curves obtained from the MTT assays of:
(a) tolfH and Bi(tolf)3; (b) mefH and Bi(mef)3; and (c) diflH and Bi(difl)3; in HCT-8 cells
after 4-h treatment ................................................................................................................................... 285
Appendix 1.3: Concentration-response curves obtained from the MTT assays of
cisplatin, BiCl3 and BSS after 24-h treatment ............................................................................... 286
Appendix 1.4: PGE2 production in HCT-8 cells after 4-h treatment with BSS ............. 286
Appendix 1.5: Concentration-response curve obtained from the MTT assays of aspH
in HCT-8 cells after 24-h treatment .................................................................................................. 287
xxvii
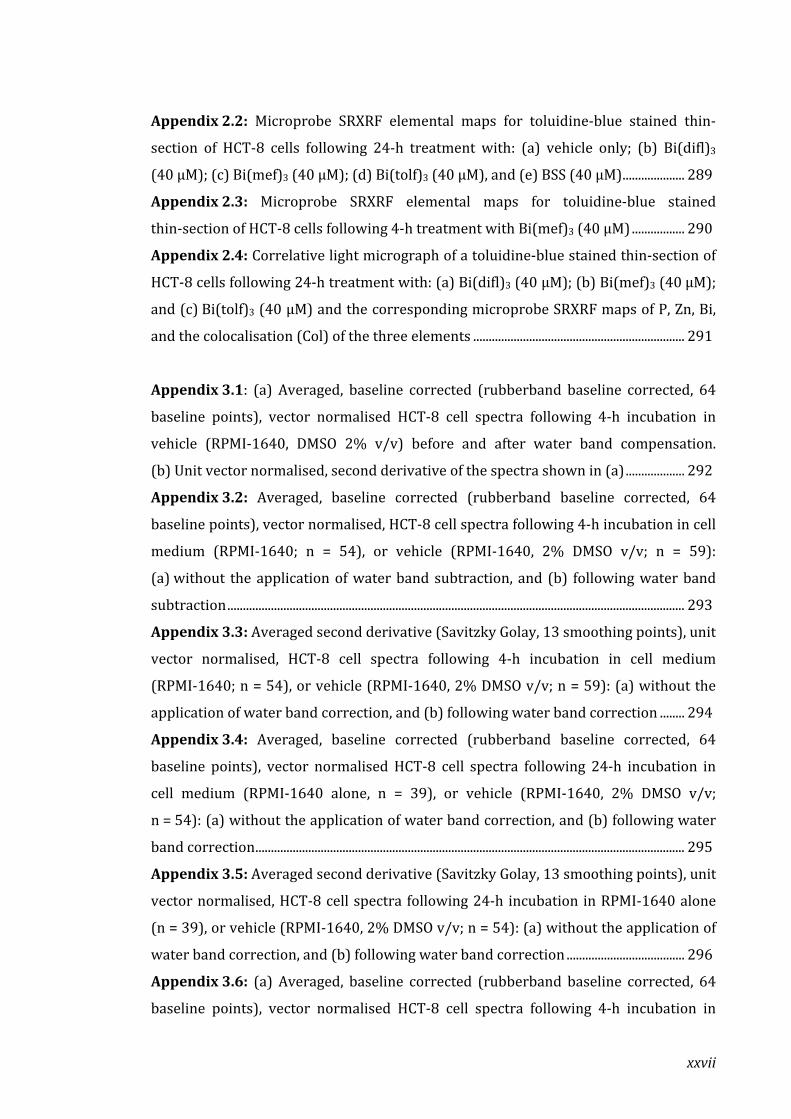
Appendix 2.2: Microprobe SRXRF elemental maps for toluidine-blue stained thin-
section of HCT-8 cells following 24-h treatment with: (a) vehicle only; (b) Bi(difl)3
(40 μM); (c) Bi(mef)3 (40 μM); (d) Bi(tolf)3 (40 μM), and (e) BSS (40 μM) .................... 289
Appendix 2.3: Microprobe SRXRF elemental maps for toluidine-blue stained
thin-section of HCT-8 cells following 4-h treatment with Bi(mef)3 (40 μM) ................. 290
Appendix 2.4: Correlative light micrograph of a toluidine-blue stained thin-section of
HCT-8 cells following 24-h treatment with: (a) Bi(difl)3 (40 μM); (b) Bi(mef)3 (40 μM);
and (c) Bi(tolf)3 (40 μM) and the corresponding microprobe SRXRF maps of P, Zn, Bi,
and the colocalisation (Col) of the three elements .................................................................... 291
Appendix 3.1: (a) Averaged, baseline corrected (rubberband baseline corrected, 64
baseline points), vector normalised HCT-8 cell spectra following 4-h incubation in
vehicle (RPMI-1640, DMSO 2% v/v) before and after water band compensation.
(b) Unit vector normalised, second derivative of the spectra shown in (a) ................... 292
Appendix 3.2: Averaged, baseline corrected (rubberband baseline corrected, 64
baseline points), vector normalised, HCT-8 cell spectra following 4-h incubation in cell
medium (RPMI-1640; n = 54), or vehicle (RPMI-1640, 2% DMSO v/v; n = 59):
(a) without the application of water band subtraction, and (b) following water band
subtraction ................................................................................................................................................... 293
Appendix 3.3: Averaged second derivative (Savitzky Golay, 13 smoothing points), unit
vector normalised, HCT-8 cell spectra following 4-h incubation in cell medium
(RPMI-1640; n = 54), or vehicle (RPMI-1640, 2% DMSO v/v; n = 59): (a) without the
application of water band correction, and (b) following water band correction ........ 294
Appendix 3.4: Averaged, baseline corrected (rubberband baseline corrected, 64
baseline points), vector normalised HCT-8 cell spectra following 24-h incubation in
cell medium (RPMI-1640 alone, n = 39), or vehicle (RPMI-1640, 2% DMSO v/v;
n = 54): (a) without the application of water band correction, and (b) following water
band correction .......................................................................................................................................... 295
Appendix 3.5: Averaged second derivative (Savitzky Golay, 13 smoothing points), unit
vector normalised, HCT-8 cell spectra following 24-h incubation in RPMI-1640 alone
(n = 39), or vehicle (RPMI-1640, 2% DMSO v/v; n = 54): (a) without the application of
water band correction, and (b) following water band correction ...................................... 296
Appendix 3.6: (a) Averaged, baseline corrected (rubberband baseline corrected, 64
baseline points), vector normalised HCT-8 cell spectra following 4-h incubation in
xxviii
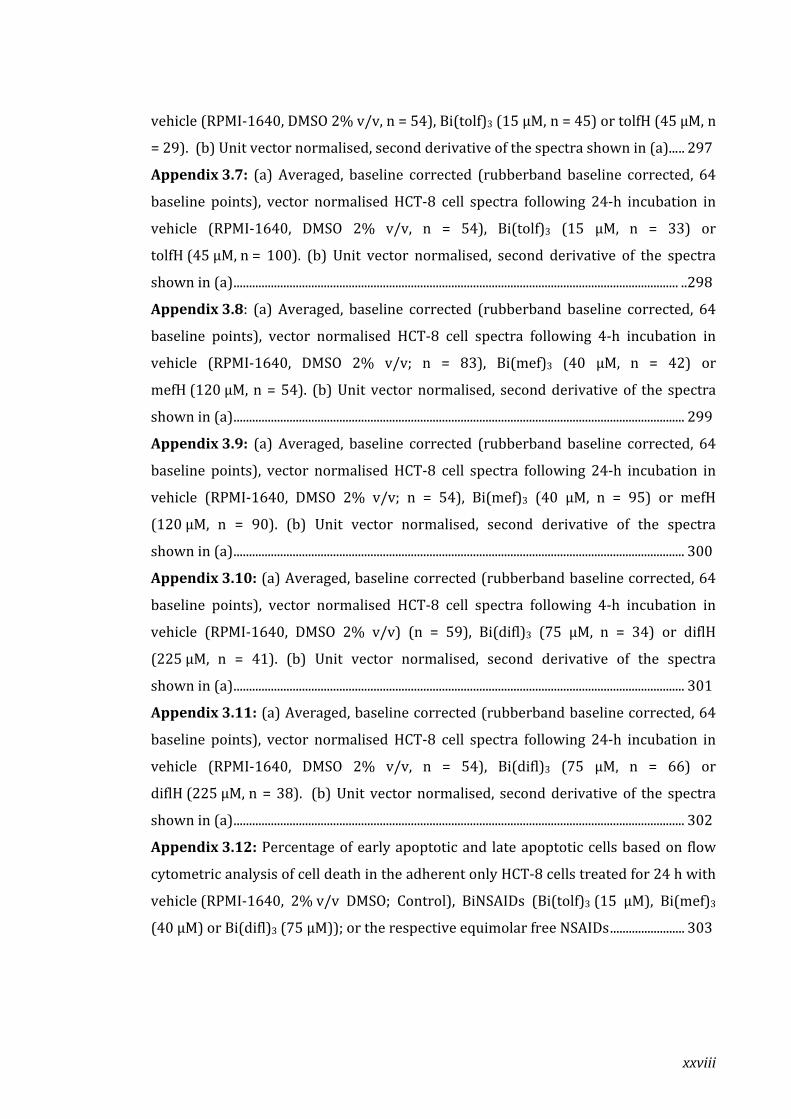
vehicle (RPMI-1640, DMSO 2% v/v, n = 54), Bi(tolf)3 (15 µM, n = 45) or tolfH (45 µM, n
= 29). (b) Unit vector normalised, second derivative of the spectra shown in (a)... .. 297
Appendix 3.7: (a) Averaged, baseline corrected (rubberband baseline corrected, 64
baseline points), vector normalised HCT-8 cell spectra following 24-h incubation in
vehicle (RPMI-1640, DMSO 2% v/v, n = 54), Bi(tolf)3 (15 µM, n = 33) or
tolfH (45 µM, n = 100). (b) Unit vector normalised, second derivative of the spectra
shown in (a) ............................................................................................................................................... ..298
Appendix 3.8: (a) Averaged, baseline corrected (rubberband baseline corrected, 64
baseline points), vector normalised HCT-8 cell spectra following 4-h incubation in
vehicle (RPMI-1640, DMSO 2% v/v; n = 83), Bi(mef)3 (40 µM, n = 42) or
mefH (120 µM, n = 54). (b) Unit vector normalised, second derivative of the spectra
shown in (a) ................................................................................................................................................. 299
Appendix 3.9: (a) Averaged, baseline corrected (rubberband baseline corrected, 64
baseline points), vector normalised HCT-8 cell spectra following 24-h incubation in
vehicle (RPMI-1640, DMSO 2% v/v; n = 54), Bi(mef)3 (40 µM, n = 95) or mefH
(120 µM, n = 90). (b) Unit vector normalised, second derivative of the spectra
shown in (a) ................................................................................................................................................. 300
Appendix 3.10: (a) Averaged, baseline corrected (rubberband baseline corrected, 64
baseline points), vector normalised HCT-8 cell spectra following 4-h incubation in
vehicle (RPMI-1640, DMSO 2% v/v) (n = 59), Bi(difl)3 (75 µM, n = 34) or diflH
(225 µM, n = 41). (b) Unit vector normalised, second derivative of the spectra
shown in (a) ................................................................................................................................................. 301
Appendix 3.11: (a) Averaged, baseline corrected (rubberband baseline corrected, 64
baseline points), vector normalised HCT-8 cell spectra following 24-h incubation in
vehicle (RPMI-1640, DMSO 2% v/v, n = 54), Bi(difl)3 (75 µM, n = 66) or
diflH (225 µM, n = 38). (b) Unit vector normalised, second derivative of the spectra
shown in (a) ................................................................................................................................................. 302
Appendix 3.12: Percentage of early apoptotic and late apoptotic cells based on flow
cytometric analysis of cell death in the adherent only HCT-8 cells treated for 24 h with
vehicle (RPMI-1640, 2% v/v DMSO; Control), BiNSAIDs (Bi(tolf)3 (15 µM), Bi(mef)3
(40 µM) or Bi(difl)3 (75 µM)); or the respective equimolar free NSAIDs ........................ 303

xxix
Appendix 5.1: Concentration-response curves obtained from MTT assays of HCT-8
cells treated (24 h) with the specified aminoarenesulfonic acids and corresponding
Bi(III) complexes ....................................................................................................................................... 305

xxx
LIST OF TABLES Table 1.1: The major COX-2 dependent or independent pro-apoptotic pathways
induced by NSAIDs ...................................................................................................................................... 16
Table 1.2: Results from selected in vivo studies comparing the anti-inflammatory,
analgesic, or anti-ulcerative activity of metal-NSAID complexes and uncomplexed
NSAIDs .............................................................................................................................................................. 19
Table 1.3: Results from in vitro studies comparing the anti-cancer activity of
metal-NSAID complexes and uncomplexed NSAIDs, or currently used anti-cancer
drugs .................................................................................................................................................................. 22
Table 1.4: A selection of historical and currently used medicinal Bi compounds ........ 26
Table 2.1: 1H and 13C NMR data of tolfH and Bi(tolf)3 in d6-DMSO, before and after
suspension in RPMI-1640 (24 h) .......................................................................................................... 77
Table 2.2: 1H and 13C NMR data of mefH and Bi(mef)3 in d6-DMSO, before and after
suspension in RPMI-1640 (24 h) .......................................................................................................... 80
Table 2.3: 1H and 13C NMR data of diflH and Bi(difl)3 in d6-DMSO, before and after
suspension in RPMI-1640 (24 h) .......................................................................................................... 83
Table 2.4: IC50 values determined by MTT toxicity assays following 24-h treatment of
HCT-8 colon cancer cells with the specified compounds ........................................................... 86
Table 2.5: Cell populations determined by flow cytometric analysis of HCT-8 cells
treated for 24h with: vehicle, BiNSAIDs, or the respective equimolar free NSAIDs ...... 91
Table 2.6: IC50 values determined by PGE2 assays following 4-h treatment of HCT-8
colon cancer cells with the specified compounds ......................................................................... 93
Table 4.1: Generalised assignments of characteristic IR bands of biological and
eukaryotic cell spectra ............................................................................................................................ 149
Table 4.2: Summary of some IRMS or SR-IRMS studies that examined the effects of
chemotherapeutic agents (either potentially or clinically-used) on cancer cells ........ 151
Table 4.3: Summary of average spectral trends and key PCA differences between
vehicle-treated cell samples versus NSAID/BiNSAID-treated cell samples. .................. 185
Table 5.1: Instrument parameters used for ESI-MS and targeted ion scan (MS/MS)
analysis on the Waters QuattroMicroTM triple quadrupole mass spectrometer .......... 220
Table 5.2: Targeted ion (MS/MS) scans ........................................................................................ 220

xxxi
Table 5.3: Summary of the overall trend in glycerophospholipid (PC and PE)
profile (% of total) following treatment of HCT-8 cells with BiNSAIDs of NSAIDs (24 h)
compared to vehicle-treated cells ..................................................................................................... 237
Table 5.4: Summary of the overall changes in glycerophospholipid (PC, PE or PS)
concentration following treatment of HCT-8 cells with BiNSAIDs of NSAIDs (24 h)
compared to vehicle-treated cells ..................................................................................................... 237
Table 6.1: IC50 values determined by MTT toxicity assays following 24 h treatment of
HCT-8 colon cancer cells with the specified compounds ........................................................ 265
Appendix 2.1: Graphite furnace operating conditions used for the analysis of Bi .... 288
Appendix 4.1: Analytes identified above the LOD in HCT-8 cell lipid extracts treated
with vehicle using ESI-MS/MS ............................................................................................................ 304
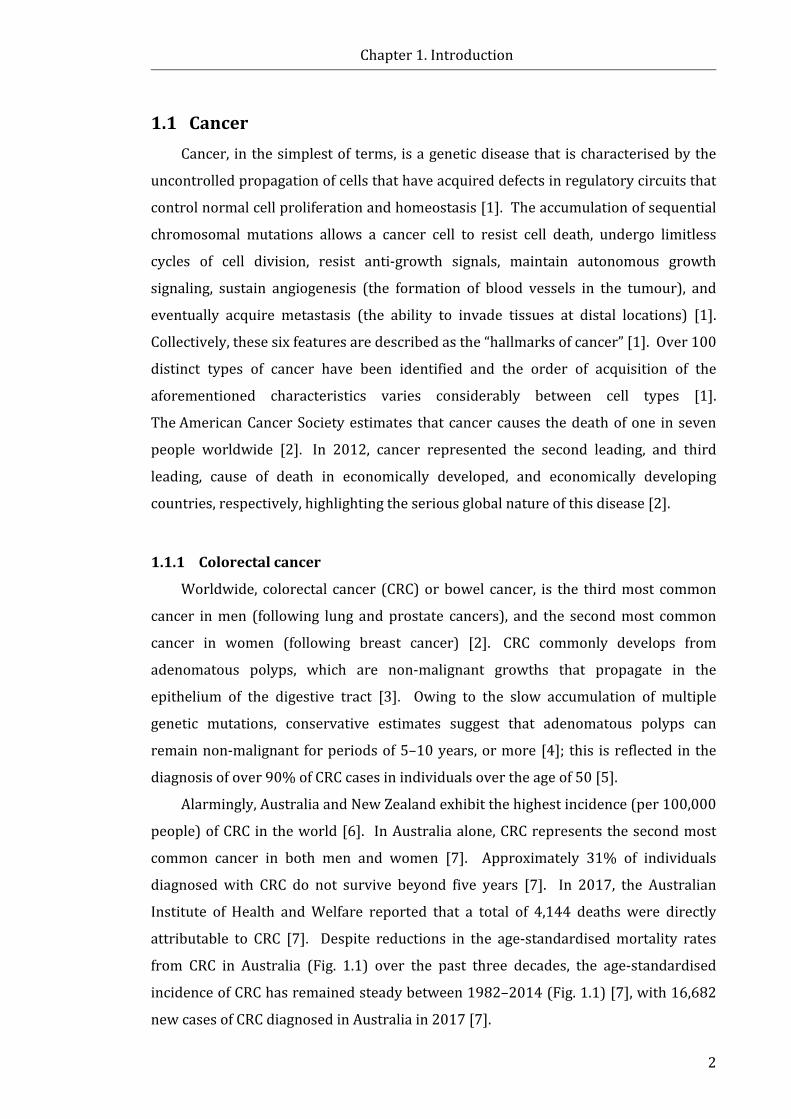
Chapter 1. Introduction
Colorectal cancer (CRC) is the second most common cancer in both men and women in
Australia. Since the incidence of CRC has not improved since the 1980s, prevention
strategies are needed to reduce the burden of this disease. The upregulation of
cyclooxygenase-2 (COX-2), an enzyme involved in the inflammation response, has
been linked to a number of cancers, including CRC. This has led to a large number of
studies that subsequently showed that several over-the-counter non-steroidal
anti-inflammatory drugs (NSAIDs) reduced the risk of CRC when taken regularly over
periods of months to years. This Chapter provides a review of the relevant literature
with a focus on the potential use of NSAIDs as chemopreventive and chemotherapeutic
agents for CRC, the advantages of coordinating NSAIDs to metals, and finally, the
medicinal use and anti-cancer activity of bismuth(III) complexes, including Bi(III)
complexes of NSAIDs (BiNSAIDs).
Chapter 1. Introduction
2
1.1 Cancer Cancer, in the simplest of terms, is a genetic disease that is characterised by the
uncontrolled propagation of cells that have acquired defects in regulatory circuits that
control normal cell proliferation and homeostasis [1]. The accumulation of sequential
chromosomal mutations allows a cancer cell to resist cell death, undergo limitless
cycles of cell division, resist anti-growth signals, maintain autonomous growth
signaling, sustain angiogenesis (the formation of blood vessels in the tumour), and
eventually acquire metastasis (the ability to invade tissues at distal locations) [1].
Collectively, these six features are described as the “hallmarks of cancer” [1]. Over 100
distinct types of cancer have been identified and the order of acquisition of the
aforementioned characteristics varies considerably between cell types [1].
The American Cancer Society estimates that cancer causes the death of one in seven
people worldwide [2]. In 2012, cancer represented the second leading, and third
leading, cause of death in economically developed, and economically developing
countries, respectively, highlighting the serious global nature of this disease [2].
1.1.1 Colorectal cancer
Worldwide, colorectal cancer (CRC) or bowel cancer, is the third most common
cancer in men (following lung and prostate cancers), and the second most common
cancer in women (following breast cancer) [2]. CRC commonly develops from
adenomatous polyps, which are non-malignant growths that propagate in the
epithelium of the digestive tract [3]. Owing to the slow accumulation of multiple
genetic mutations, conservative estimates suggest that adenomatous polyps can
remain non-malignant for periods of 5–10 years, or more [4]; this is reflected in the
diagnosis of over 90% of CRC cases in individuals over the age of 50 [5].
Alarmingly, Australia and New Zealand exhibit the highest incidence (per 100,000
people) of CRC in the world [6]. In Australia alone, CRC represents the second most
common cancer in both men and women [7]. Approximately 31% of individuals
diagnosed with CRC do not survive beyond five years [7]. In 2017, the Australian
Institute of Health and Welfare reported that a total of 4,144 deaths were directly
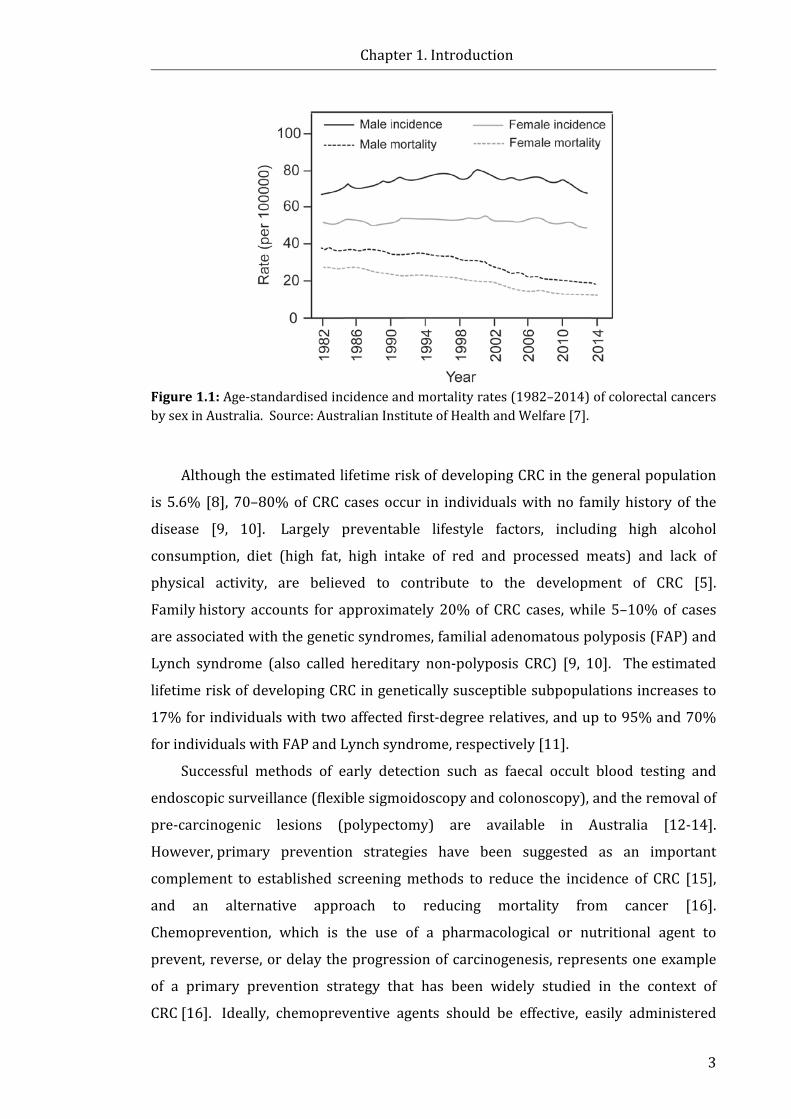
attributable to CRC [7]. Despite reductions in the age-standardised mortality rates
from CRC in Australia (Fig. 1.1) over the past three decades, the age-standardised
incidence of CRC has remained steady between 1982–2014 (Fig. 1.1) [7], with 16,682
new cases of CRC diagnosed in Australia in 2017 [7].
Chapter 1. Introduction
3
Figure 1.1: Age-standardised incidence and mortality rates (1982–2014) of colorectal cancers by sex in Australia. Source: Australian Institute of Health and Welfare [7].
Although the estimated lifetime risk of developing CRC in the general population
is 5.6% [8], 70–80% of CRC cases occur in individuals with no family history of the
disease [9, 10]. Largely preventable lifestyle factors, including high alcohol
consumption, diet (high fat, high intake of red and processed meats) and lack of
physical activity, are believed to contribute to the development of CRC [5].
Family history accounts for approximately 20% of CRC cases, while 5–10% of cases
are associated with the genetic syndromes, familial adenomatous polyposis (FAP) and
Lynch syndrome (also called hereditary non-polyposis CRC) [9, 10]. The estimated
lifetime risk of developing CRC in genetically susceptible subpopulations increases to
17% for individuals with two affected first-degree relatives, and up to 95% and 70%
for individuals with FAP and Lynch syndrome, respectively [11].
Successful methods of early detection such as faecal occult blood testing and
endoscopic surveillance (flexible sigmoidoscopy and colonoscopy), and the removal of
pre-carcinogenic lesions (polypectomy) are available in Australia [12-14].
However, primary prevention strategies have been suggested as an important
complement to established screening methods to reduce the incidence of CRC [15],
and an alternative approach to reducing mortality from cancer [16].
Chemoprevention, which is the use of a pharmacological or nutritional agent to
prevent, reverse, or delay the progression of carcinogenesis, represents one example
of a primary prevention strategy that has been widely studied in the context of
CRC [16]. Ideally, chemopreventive agents should be effective, easily administered
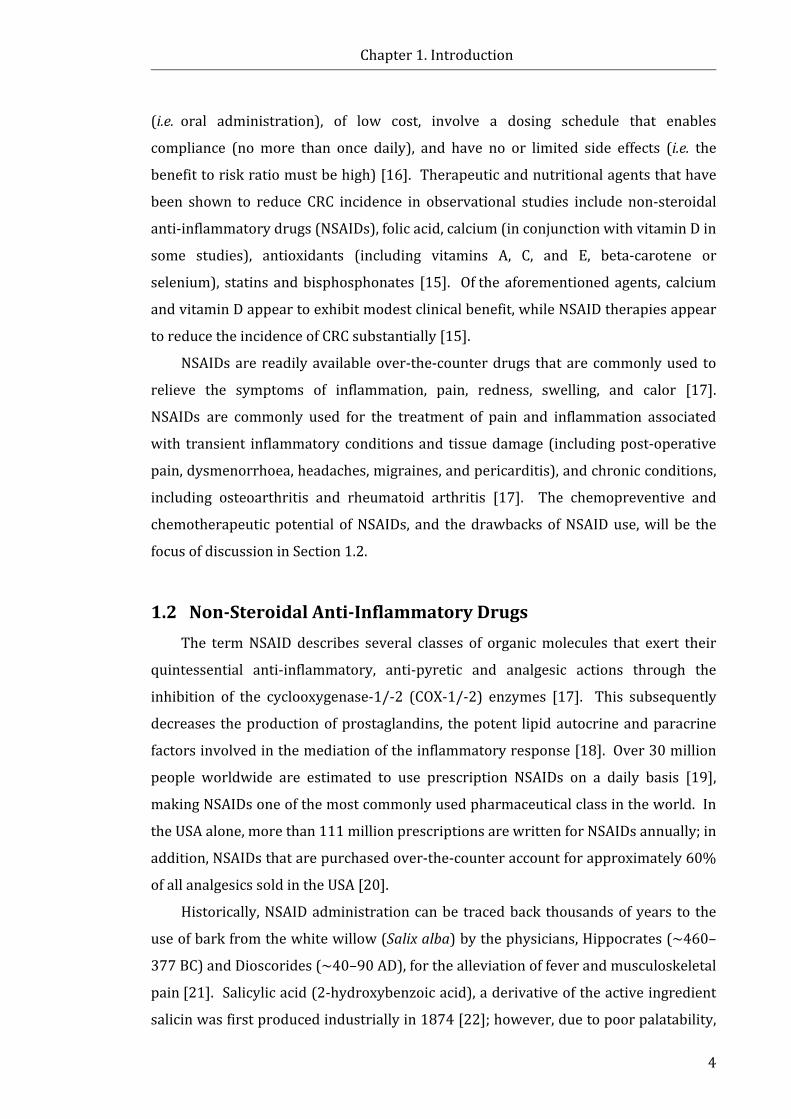
Chapter 1. Introduction
4
(i.e. oral administration), of low cost, involve a dosing schedule that enables
compliance (no more than once daily), and have no or limited side effects (i.e. the
benefit to risk ratio must be high) [16]. Therapeutic and nutritional agents that have
been shown to reduce CRC incidence in observational studies include non-steroidal
anti-inflammatory drugs (NSAIDs), folic acid, calcium (in conjunction with vitamin D in
some studies), antioxidants (including vitamins A, C, and E, beta-carotene or
selenium), statins and bisphosphonates [15]. Of the aforementioned agents, calcium
and vitamin D appear to exhibit modest clinical benefit, while NSAID therapies appear
to reduce the incidence of CRC substantially [15].
NSAIDs are readily available over-the-counter drugs that are commonly used to
relieve the symptoms of inflammation, pain, redness, swelling, and calor [17].
NSAIDs are commonly used for the treatment of pain and inflammation associated
with transient inflammatory conditions and tissue damage (including post-operative
pain, dysmenorrhoea, headaches, migraines, and pericarditis), and chronic conditions,
including osteoarthritis and rheumatoid arthritis [17]. The chemopreventive and
chemotherapeutic potential of NSAIDs, and the drawbacks of NSAID use, will be the
focus of discussion in Section 1.2.
1.2 Non-Steroidal Anti-Inflammatory Drugs The term NSAID describes several classes of organic molecules that exert their
quintessential anti-inflammatory, anti-pyretic and analgesic actions through the
inhibition of the cyclooxygenase-1/-2 (COX-1/-2) enzymes [17]. This subsequently
decreases the production of prostaglandins, the potent lipid autocrine and paracrine
factors involved in the mediation of the inflammatory response [18]. Over 30 million
people worldwide are estimated to use prescription NSAIDs on a daily basis [19],
making NSAIDs one of the most commonly used pharmaceutical class in the world. In
the USA alone, more than 111 million prescriptions are written for NSAIDs annually; in
addition, NSAIDs that are purchased over-the-counter account for approximately 60%
of all analgesics sold in the USA [20].
Historically, NSAID administration can be traced back thousands of years to the
use of bark from the white willow (Salix alba) by the physicians, Hippocrates (~460–
377 BC) and Dioscorides (~40–90 AD), for the alleviation of fever and musculoskeletal
pain [21]. Salicylic acid (2-hydroxybenzoic acid), a derivative of the active ingredient
salicin was first produced industrially in 1874 [22]; however, due to poor palatability,

Chapter 1. Introduction
5
acetylsalicylic acid (Fig. 1.2) was developed by Felix Hoffman in 1897, and marketed
by Frederick Bayer & Company as aspirin (aspH) in 1899 [23]. Non-salicylate NSAIDs,
indomethacin (indoH, Fig. 1.2) and ibuprofen (ibuH, Fig. 1.2), were first introduced to
the market in 1964 and 1969, respectively [24]. This was followed by the introduction
of diclofenac (dicloH, Fig 1.2) and ketoprofen (ketoH, Fig 1.2) in the mid-1970s [24].
As shown in Figure 1.2, arylalkanoic acids (of the general formula ArCRHCOOH,
where Ar = aryl or heteroaryl; R = H, CH3, alkyl), including salicylic acids (e.g. aspH,
diflunisal (diflH), and salsalate), indolic acids (e.g. indoH), acetic acids (e.g. sulindac),
propionic acids (e.g. ibuH, naproxen (napH), flurbiprofen, and ketoH), and fenamates
(e.g. mefenamic acid (mefH), tolfenamic acid (tolfH), flufenamic acid (fluH),
meclofenamic acid (mecloH), and dicloH), comprise the largest chemical group of
NSAIDs [25]. Notably, the arylalkanoic acid-based NSAIDs contain a carboxylate
moiety (Fig. 1.2). The selectivity preference of NSAIDs from these structural classes
for COX-1 and COX-2 varies depending on the individual NSAID [26, 27].
In the 1980s, Pfizer developed enolic acid NSAIDs, termed ‘oxicams’, which are
derivatives of 4-hydroxy-1,2-benzothiazine 3-carboxamides [28]. Piroxicam (pirox,
Fig. 1.2), marketed as Feldene® (Pfizer, New York, USA), was successfully introduced
into the market in 1982 [28]. Shortly following this other oxicams including
meloxicam (melox, Fig. 1.2), isoxicam (isox), lornoxicam, and tenoxicam (tenox) were
introduced to the market [28]. Oxicams are able to interact with both COX
isoforms [27, 29]; for instance, pirox has been shown to bind preferentially to
COX-1 [27], while melox has been shown to be moderately selective for COX-2 [29].
NSAIDs that are highly selective for COX-2 (termed ‘coxibs’, Fig. 1.2), celecoxib
(Celebrex®, Pfizer, New York, USA), rofecoxib (Vioxx®, Merck & Co. Inc., New Jersey,
USA), and parecoxib (Dynastat®, Pfizer, New York, USA), were introduced to the
market in the late 1990s [30]. The coxibs incorporate a sulfonyl moiety in their
chemical structures (Fig. 1.2), an important chemical feature that allows the molecules
to interact preferentially with the COX-2 active site [30]. The concept of COX-1 and
COX-2 selectivity, and the subsequent physiological consequences, will be discussed
further in Section 1.2.1.
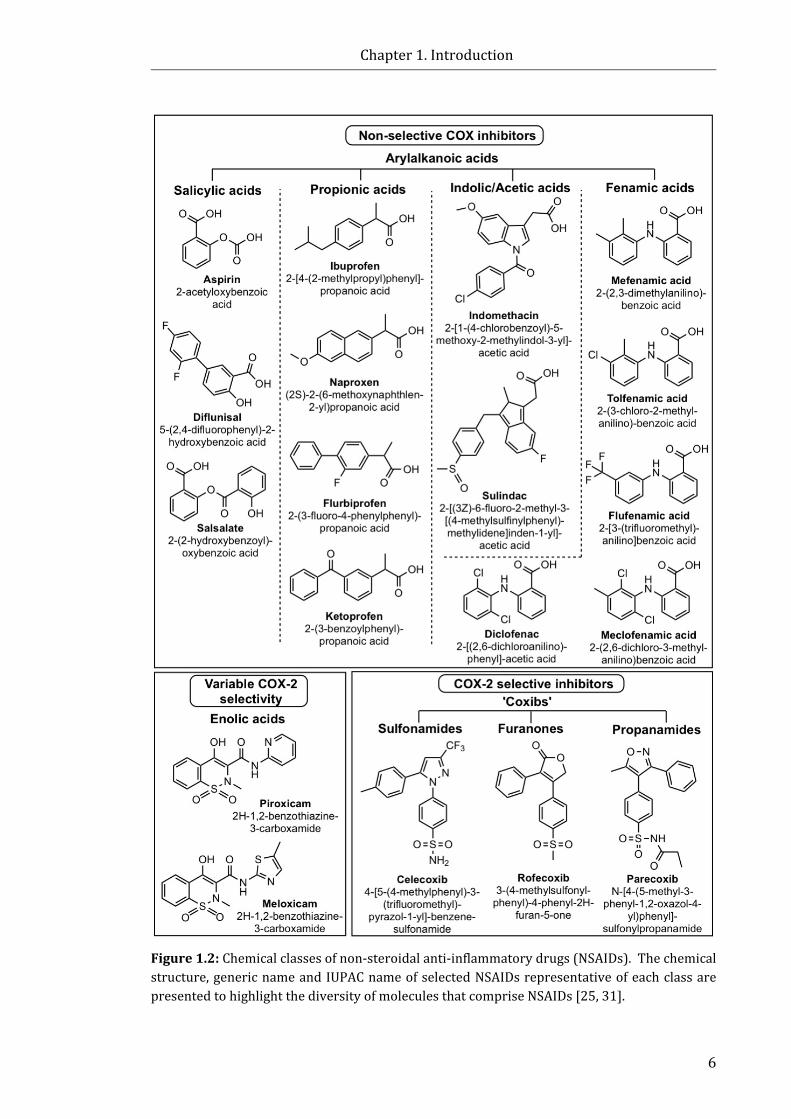
Chapter 1. Introduction
6
Figure 1.2: Chemical classes of non-steroidal anti-inflammatory drugs (NSAIDs). The chemical structure, generic name and IUPAC name of selected NSAIDs representative of each class are presented to highlight the diversity of molecules that comprise NSAIDs [25, 31].

Chapter 1. Introduction
7
1.2.1 Mechanism of action of NSAIDs
Studies performed by Vane and colleagues in the 1970s established that the
primary mechanism through which NSAIDs exert their therapeutic action was through
the inhibition of prostaglandin endoperoxide G/H synthase, the enzyme commonly
referred to as COX [18, 32]. In the early 1990s, several studies established that there
were two distinct forms of the COX enzyme, COX-1 and COX-2 [33-35]. Importantly,
COX-1 and COX-2 differ in their subcellular location, constitutive levels of expression
in tissues throughout the body, and the structure of their active sites.
Immunocytofluorescence studies have established that both isoforms are present in
the endoplasmic reticulum [36]. COX-1 is also located close to the plasma membrane,
whereas COX-2 is specifically associated with the nuclear envelope [37]. COX-1 is
constitutively expressed in most human tissues and is responsible for regulating
essential physiological functions, including platelet aggregation, gastric protection,
and renal function [38]. Conversely, under normal physiological conditions, COX-2
expression is low to negligible in most tissues [39]. Growth factors, as well as
cytokines (including tumour necrosis factor-α, interferon-γ, and interleukins (ILs),
IL-1α and IL-1β) stimulate COX-2 expression [39]. As such, COX-2 is commonly
referred to as the ‘inducible’ form of the enzyme. It is notable that COX-2 is
constitutively expressed in specific regions of the brain [40] and renal tubular cells
[41]. The upregulation of COX-2 occurs primarily in response to inflammatory stimuli
and thus plays a crucial role in mediating pain and inflammation [39]. It is notable
that COX-3, a splice-variant of COX-1 has been identified [42]. Interestingly, some
NSAIDs including dicloH, and the non-NSAID acetaminophen, have been shown to
interact preferentially with COX-3 in vitro [42]; however, the physiological significance
of COX-3 in humans remains poorly understood [43].
COX-1 and COX-2 consist of two catalytic sites, one with COX activity, and the
other with peroxidase (POX) activity, which are located in two narrow channels on
opposite sides of the catalytic domain [44]. The COX catalytic site is responsible for
the oxidation of arachidonic acid to prostaglandin G2 (PGG2). Subsequently, this short-
lived intermediate is reduced to PGH2 by the POX catalytic site (Fig. 1.3) [38]. The
second intermediate, prostaglandin H2 (PGH2), is used as the substrate to form a
number of prostaglandins, namely prostaglandin D2 (PGD2), prostaglandin E2 (PGE2),
prostaglandin F2α (PGF2α), and prostaglandin I2 (PGI2) via prostaglandin-specific
synthases, and thromboxane A2 (TXA2) via thromboxane synthase (Fig. 1.3) [38].
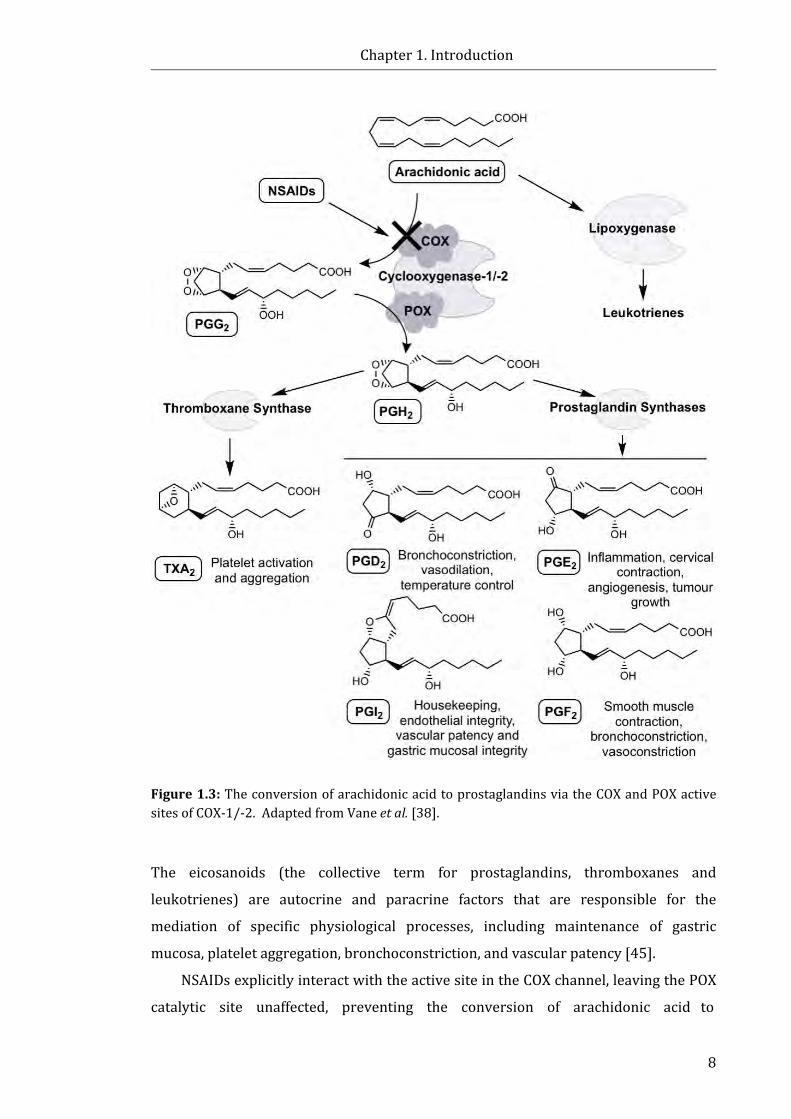
Chapter 1. Introduction
8
Figure 1.3: The conversion of arachidonic acid to prostaglandins via the COX and POX active sites of COX-1/-2. Adapted from Vane et al. [38].
The eicosanoids (the collective term for prostaglandins, thromboxanes and
leukotrienes) are autocrine and paracrine factors that are responsible for the
mediation of specific physiological processes, including maintenance of gastric
mucosa, platelet aggregation, bronchoconstriction, and vascular patency [45].
NSAIDs explicitly interact with the active site in the COX channel, leaving the POX
catalytic site unaffected, preventing the conversion of arachidonic acid to
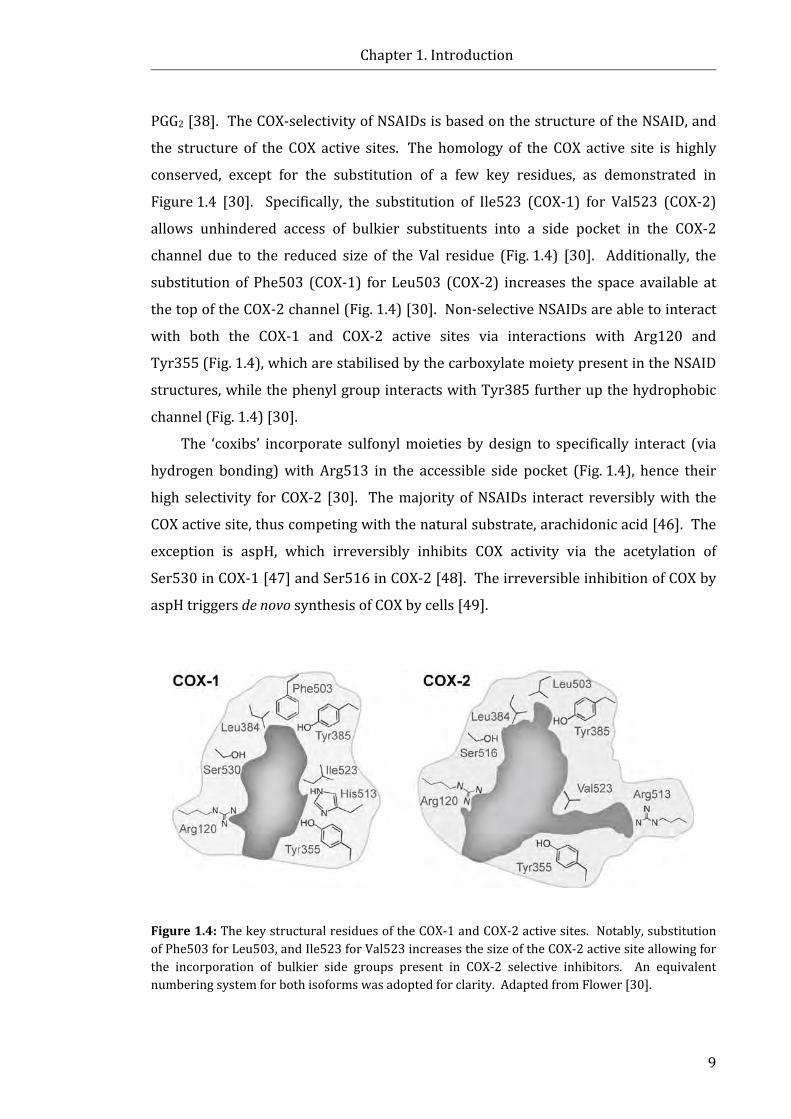
Chapter 1. Introduction
9
PGG2 [38]. The COX-selectivity of NSAIDs is based on the structure of the NSAID, and
the structure of the COX active sites. The homology of the COX active site is highly
conserved, except for the substitution of a few key residues, as demonstrated in
Figure 1.4 [30]. Specifically, the substitution of Ile523 (COX-1) for Val523 (COX-2)
allows unhindered access of bulkier substituents into a side pocket in the COX-2
channel due to the reduced size of the Val residue (Fig. 1.4) [30]. Additionally, the
substitution of Phe503 (COX-1) for Leu503 (COX-2) increases the space available at
the top of the COX-2 channel (Fig. 1.4) [30]. Non-selective NSAIDs are able to interact
with both the COX-1 and COX-2 active sites via interactions with Arg120 and
Tyr355 (Fig. 1.4), which are stabilised by the carboxylate moiety present in the NSAID
structures, while the phenyl group interacts with Tyr385 further up the hydrophobic
channel (Fig. 1.4) [30].
The ‘coxibs’ incorporate sulfonyl moieties by design to specifically interact (via
hydrogen bonding) with Arg513 in the accessible side pocket (Fig. 1.4), hence their
high selectivity for COX-2 [30]. The majority of NSAIDs interact reversibly with the
COX active site, thus competing with the natural substrate, arachidonic acid [46]. The
exception is aspH, which irreversibly inhibits COX activity via the acetylation of
Ser530 in COX-1 [47] and Ser516 in COX-2 [48]. The irreversible inhibition of COX by
aspH triggers de novo synthesis of COX by cells [49].
Figure 1.4: The key structural residues of the COX-1 and COX-2 active sites. Notably, substitution of Phe503 for Leu503, and Ile523 for Val523 increases the size of the COX-2 active site allowing for the incorporation of bulkier side groups present in COX-2 selective inhibitors. An equivalent numbering system for both isoforms was adopted for clarity. Adapted from Flower [30].

Chapter 1. Introduction
10
1.2.2 NSAIDs: Chemopreventive agents for CRC?
Numerous observational, epidemiological, and clinical studies collectively suggest
that daily use of NSAIDs reduces the occurrence of adenomatous polyps, and
decreases the overall incidence and mortality of CRC in both high- and average-risk
populations ([50], references within). Since Narisawa et al. [51] first described the
suppression of chemical-induced carcinoma in rats by indoH in 1981, over 40 other
rodent studies have shown that NSAIDs (including aspH, indoH, sulindac, ibuH, ketoH,
pirox and celecoxib) inhibit CRC or aberrant crypt formation induced by injection of
azoxymethane or other chemicals known to induce carcinogenesis ([50], references
within).
The chemopreventive effect of sulindac in humans was first recognised by
Waddell et al. [52, 53], whereby sulindac was effective in reducing the number of
polyps in patients with FAP in clinical studies. Given the inherent risk of developing
CRC by the third or fourth decade of life for FAP sufferers [54], a number of studies
focusing on the use of NSAIDs in this population have been performed. Several studies
in ApcMin mice and other murine models of human FAP have shown significant
inhibition of tumour development by NSAIDs including aspH [55], sulindac [56, 57],
and celecoxib [58]. One of the largest randomised, placebo-controlled trials conducted
in the setting of FAP (n = 133), the Colorectal Adenoma/Carcinoma Prevention
Programme [59], found no significant reduction in polyp number in the rectum and
sigmoid colon with daily aspH (600 mg) treatment over a period of one to seven years,
although a trend of reduced polyp size was observed. The suppression of the
formation of adenomatous polyps, and regression of existing polyps by sulindac has
been demonstrated in a number of randomised clinical trials in patients with
FAP [60-62], although one study [63] reported no significant reduction in the
formation of adenomas between the sulindac-treated and placebo groups. In the late
1990s, 77 patients participated in a pivotal trial that demonstrated that compared to
the placebo, a twice-daily dose of celecoxib (100 mg or 400 mg) over six months
significantly reduced the mean number of colorectal polyps and polyp burden [64].
The U.S. Food and Drug Administration (FDA) approved the use of celecoxib as an
adjunctive treatment for FAP (in conjunction with usual care procedures) under
subpart H (accelerated approval) in 2000; however, permanent FDA approval was not
pursued by the manufacturer and the preliminary approval was removed in 2011 [65].
Chapter 1. Introduction
11
The NSAID, aspH, has been shown to reduce the incidence and recurrence of CRC
in individuals with Lynch syndrome [66], and previous adenomatous polyps [67]. The
second Colorectal Adenoma/Carcinoma Prevention Programme trial [66] investigated
the effects of aspH on 1,000 individuals with Lynch syndrome, which was the first
large-scale genetically targeted chemoprevention trial of aspH with cancer as the
primary endpoint. The results suggested that following an average observation period
of 55.7 months cancer incidence was substantially reduced in hereditary CRC carriers
dosed with 600 mg of aspH once daily for a minimum of two years [66]. In a
randomised, double-blind study involving 635 patients that had previously suffered
from CRC [67], those dosed with aspH 325 mg once daily exhibited a significantly
lower risk of recurring colon adenomas (17% incidence of adenomas compared to
27% with the placebo). Furthermore, a randomised, placebo-controlled study, the
Adenoma Prevention with Celecoxib trial [68], evaluated the ability of celecoxib to
reduce the occurrence of endoscopically detected colorectal adenomas. Celecoxib
administration in patients who had previously had adenomatous polyps removed,
showed that following three years the incidence of recurrence of adenomas was
reduced in celecoxib-treated groups to 43.2% (200 mg twice daily) and 37.5%
(400 mg) compared to the placebo group (60.7%) [68]; however, the authors
concluded that due to cardiovascular (CV) risks celecoxib could not be recommended
for routine use for CRC prevention [68].
The results from 35 non-randomised epidemiological studies collectively suggest
that regular use of NSAIDs lowers the incidence of adenomatous polyps, and reduces
the incidence and mortality from CRC in individuals in the general population ([50],
references within). These observations are promising since the highest incidence of
CRC occurs in non-genetically predisposed populations. A recent meta-analysis [69]
compared data from observational studies to data from randomised controlled
trials. Encouragingly, the results from methodically rigorous observational studies
were consistent with the data obtained from randomised trials that regular use of
aspH reduces the long-term risk of CRC (and several other cancers) and the risk of
distant metastasis [69]. However, two large scale randomised placebo-controlled
studies, the Physicians’ Health Study (325 mg aspH, every other day) [70] and the
Women’s Health Study (100 mg of aspH, every other day) [71], showed no reduced
risk of CRC in individuals dosed with aspH compared to the placebo group. The lack of
effect has been debated in the literature; for instance, it is plausible that alternate day

Chapter 1. Introduction
12
dosing and relatively short follow-up periods may not produce a significant
result [72]. Importantly, a significant reduction in mortality from CRC was not
observed until 10 to 20 years post-intervention in a pooled analysis of three trials
examining the effect of daily aspH use [73].
Interestingly, the analysis of data from randomised trials that examined daily
aspH use for other endpoints, such as vascular events, have provided a large
population of aspH-dosed subjects in order to assess anti-cancer effects as a secondary
end point. For instance, pooled analysis of 34 randomised trials of daily aspH for
prevention of vascular events showed that risk of mortality from all cancers decreased
following a follow up period of more than five years [74]. Additionally, pooled analysis
of five large randomised trials (n = 17,285) of daily aspH (≥ 75 mg) versus placebo for
the prevention of vascular events suggested that daily aspH use could reduce the risk
of cancer with distant metastasis [75]. It should be noted that these analyses excluded
results from the Women’s Health Study [72].
In conclusion, the results from numerous epidemiological studies suggest there is
an inverse relationship between the regular use of NSAIDs and the incidence of CRC
and adenomas in a variety of populations. However, given the lack of strong clinical
evidence (from randomised placebo-controlled studies) to show an unequivocal
reduction in the CRC incidence of NSAID-treated subjects, combined with the risk of
adverse side effects, such as gastrointestinal (GI) bleeding, there are currently no
recommendations for the use of NSAIDs in CRC prevention [76, 77].
1.2.3 The role of COX-2 in CRC
In 1994, Eberhart et al. [78] determined that COX-2, but not COX-1, gene
expression was upregulated in approximately 86% of human colorectal carcinomas
and approximately 50% of adenomas compared to levels in adjacent healthy mucosal
cells. Other investigators [79-81] have confirmed the upregulation of COX-2
expression in CRC in human colon cancer tissues and animal models. Additionally,
elevated COX-2 expression has been identified in other types of cancer tissue including
non-small cell lung [81, 82], bladder [83], breast [81, 84], and head and neck [85]
cancers. A number of studies [86-88] have suggested that elevated COX-2 expression
in tumour tissue is associated with increased tumour invasiveness and poor prognosis
for the patient. As demonstrated in Figure 1.5, several molecular pathways are
impacted by the over-expression of COX-2 that ultimately promotes cancer cell growth
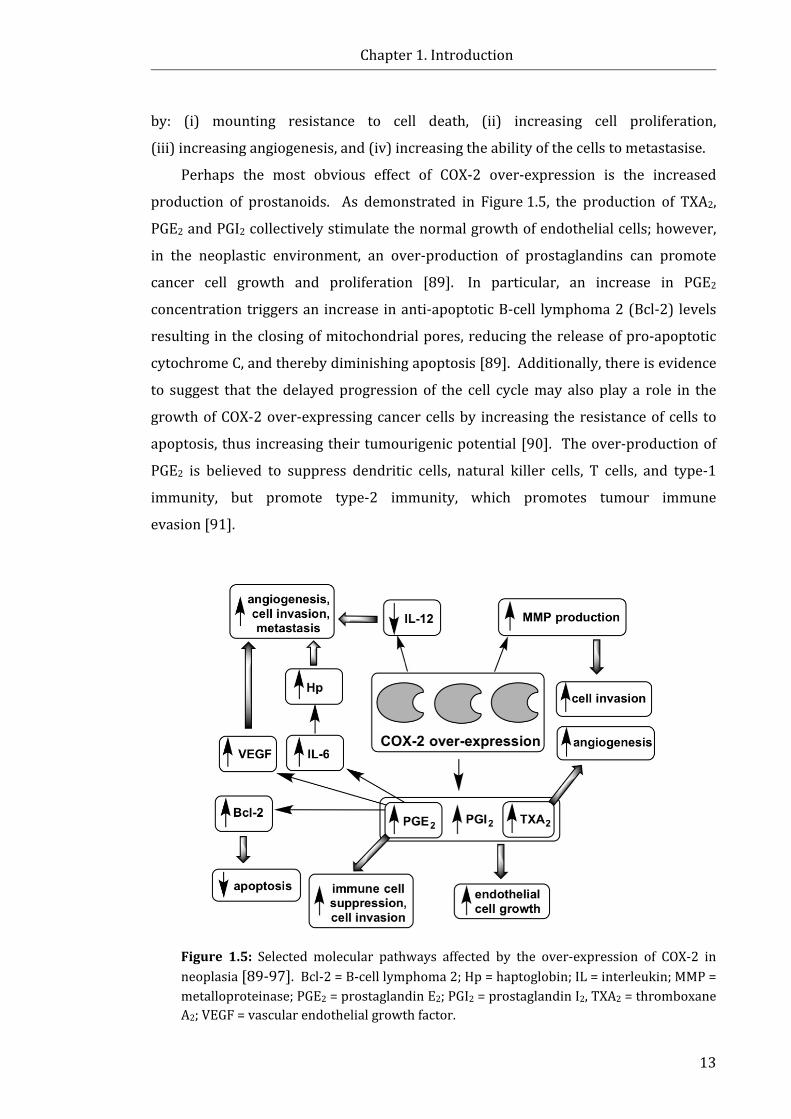
Chapter 1. Introduction
13
by: (i) mounting resistance to cell death, (ii) increasing cell proliferation,
(iii) increasing angiogenesis, and (iv) increasing the ability of the cells to metastasise.
Perhaps the most obvious effect of COX-2 over-expression is the increased
production of prostanoids. As demonstrated in Figure 1.5, the production of TXA2,
PGE2 and PGI2 collectively stimulate the normal growth of endothelial cells; however,
in the neoplastic environment, an over-production of prostaglandins can promote
cancer cell growth and proliferation [89]. In particular, an increase in PGE2
concentration triggers an increase in anti-apoptotic B-cell lymphoma 2 (Bcl-2) levels
resulting in the closing of mitochondrial pores, reducing the release of pro-apoptotic
cytochrome C, and thereby diminishing apoptosis [89]. Additionally, there is evidence
to suggest that the delayed progression of the cell cycle may also play a role in the
growth of COX-2 over-expressing cancer cells by increasing the resistance of cells to
apoptosis, thus increasing their tumourigenic potential [90]. The over-production of
PGE2 is believed to suppress dendritic cells, natural killer cells, T cells, and type-1
immunity, but promote type-2 immunity, which promotes tumour immune
evasion [91].
Figure 1.5: Selected molecular pathways affected by the over-expression of COX-2 in neoplasia [89-97]. Bcl-2 = B-cell lymphoma 2; Hp = haptoglobin; IL = interleukin; MMP = metalloproteinase; PGE2 = prostaglandin E2; PGI2 = prostaglandin I2, TXA2 = thromboxane A2; VEGF = vascular endothelial growth factor.
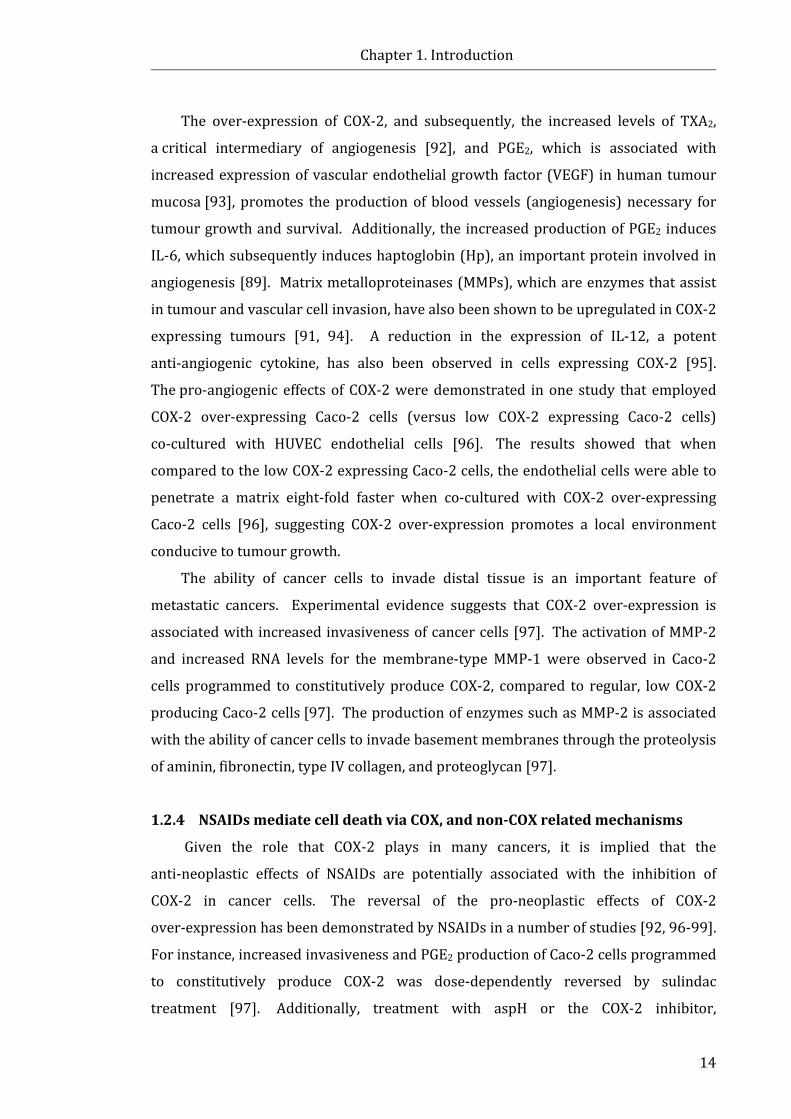
Chapter 1. Introduction
14
The over-expression of COX-2, and subsequently, the increased levels of TXA2, a critical intermediary of angiogenesis [92], and PGE2, which is associated with
increased expression of vascular endothelial growth factor (VEGF) in human tumour
mucosa [93], promotes the production of blood vessels (angiogenesis) necessary for
tumour growth and survival. Additionally, the increased production of PGE2 induces
IL-6, which subsequently induces haptoglobin (Hp), an important protein involved in
angiogenesis [89]. Matrix metalloproteinases (MMPs), which are enzymes that assist
in tumour and vascular cell invasion, have also been shown to be upregulated in COX-2
expressing tumours [91, 94]. A reduction in the expression of IL-12, a potent
anti-angiogenic cytokine, has also been observed in cells expressing COX-2 [95].
The pro-angiogenic effects of COX-2 were demonstrated in one study that employed
COX-2 over-expressing Caco-2 cells (versus low COX-2 expressing Caco-2 cells)
co-cultured with HUVEC endothelial cells [96]. The results showed that when
compared to the low COX-2 expressing Caco-2 cells, the endothelial cells were able to
penetrate a matrix eight-fold faster when co-cultured with COX-2 over-expressing
Caco-2 cells [96], suggesting COX-2 over-expression promotes a local environment
conducive to tumour growth.
The ability of cancer cells to invade distal tissue is an important feature of
metastatic cancers. Experimental evidence suggests that COX-2 over-expression is
associated with increased invasiveness of cancer cells [97]. The activation of MMP-2
and increased RNA levels for the membrane-type MMP-1 were observed in Caco-2
cells programmed to constitutively produce COX-2, compared to regular, low COX-2
producing Caco-2 cells [97]. The production of enzymes such as MMP-2 is associated
with the ability of cancer cells to invade basement membranes through the proteolysis
of aminin, fibronectin, type IV collagen, and proteoglycan [97].
1.2.4 NSAIDs mediate cell death via COX, and non-COX related mechanisms
Given the role that COX-2 plays in many cancers, it is implied that the
anti-neoplastic effects of NSAIDs are potentially associated with the inhibition of
COX-2 in cancer cells. The reversal of the pro-neoplastic effects of COX-2
over-expression has been demonstrated by NSAIDs in a number of studies [92, 96-99].
For instance, increased invasiveness and PGE2 production of Caco-2 cells programmed
to constitutively produce COX-2 was dose-dependently reversed by sulindac
treatment [97]. Additionally, treatment with aspH or the COX-2 inhibitor,
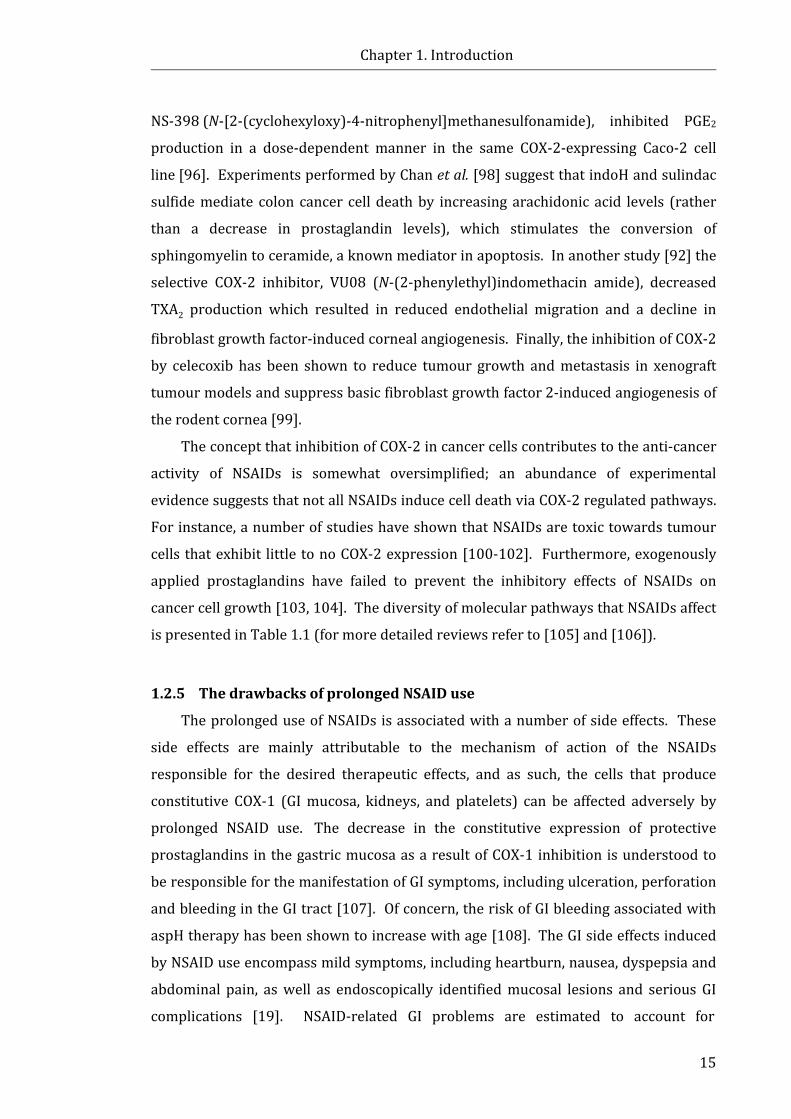
Chapter 1. Introduction
15
NS-398 (N-[2-(cyclohexyloxy)-4-nitrophenyl]methanesulfonamide), inhibited PGE2
production in a dose-dependent manner in the same COX-2-expressing Caco-2 cell
line [96]. Experiments performed by Chan et al. [98] suggest that indoH and sulindac
sulfide mediate colon cancer cell death by increasing arachidonic acid levels (rather
than a decrease in prostaglandin levels), which stimulates the conversion of
sphingomyelin to ceramide, a known mediator in apoptosis. In another study [92] the
selective COX-2 inhibitor, VU08 (N-(2-phenylethyl)indomethacin amide), decreased
TXA2 production which resulted in reduced endothelial migration and a decline in
fibroblast growth factor-induced corneal angiogenesis. Finally, the inhibition of COX-2
by celecoxib has been shown to reduce tumour growth and metastasis in xenograft
tumour models and suppress basic fibroblast growth factor 2-induced angiogenesis of
the rodent cornea [99].
The concept that inhibition of COX-2 in cancer cells contributes to the anti-cancer
activity of NSAIDs is somewhat oversimplified; an abundance of experimental
evidence suggests that not all NSAIDs induce cell death via COX-2 regulated pathways.
For instance, a number of studies have shown that NSAIDs are toxic towards tumour
cells that exhibit little to no COX-2 expression [100-102]. Furthermore, exogenously
applied prostaglandins have failed to prevent the inhibitory effects of NSAIDs on
cancer cell growth [103, 104]. The diversity of molecular pathways that NSAIDs affect
is presented in Table 1.1 (for more detailed reviews refer to [105] and [106]).
1.2.5 The drawbacks of prolonged NSAID use
The prolonged use of NSAIDs is associated with a number of side effects. These
side effects are mainly attributable to the mechanism of action of the NSAIDs
responsible for the desired therapeutic effects, and as such, the cells that produce
constitutive COX-1 (GI mucosa, kidneys, and platelets) can be affected adversely by
prolonged NSAID use. The decrease in the constitutive expression of protective
prostaglandins in the gastric mucosa as a result of COX-1 inhibition is understood to
be responsible for the manifestation of GI symptoms, including ulceration, perforation
and bleeding in the GI tract [107]. Of concern, the risk of GI bleeding associated with
aspH therapy has been shown to increase with age [108]. The GI side effects induced
by NSAID use encompass mild symptoms, including heartburn, nausea, dyspepsia and
abdominal pain, as well as endoscopically identified mucosal lesions and serious GI
complications [19]. NSAID-related GI problems are estimated to account for
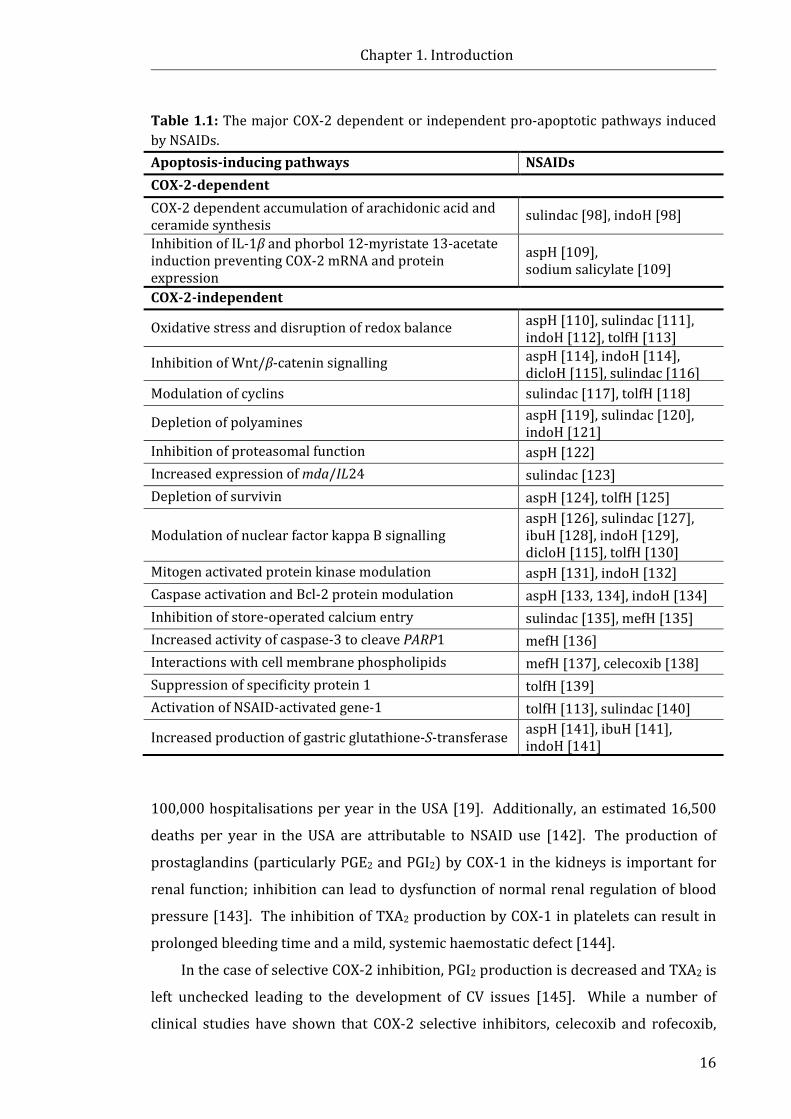
Chapter 1. Introduction
16
Table 1.1: The major COX-2 dependent or independent pro-apoptotic pathways induced by NSAIDs. Apoptosis-inducing pathways NSAIDs COX-2-dependent COX-2 dependent accumulation of arachidonic acid and ceramide synthesis
sulindac [98], indoH [98]
Inhibition of IL-1β and phorbol 12-myristate 13-acetate induction preventing COX-2 mRNA and protein expression
aspH [109], sodium salicylate [109]
COX-2-independent
Oxidative stress and disruption of redox balance aspH [110], sulindac [111], indoH [112], tolfH [113]
Inhibition of Wnt/β-catenin signalling aspH [114], indoH [114], dicloH [115], sulindac [116]
Modulation of cyclins sulindac [117], tolfH [118]
Depletion of polyamines aspH [119], sulindac [120], indoH [121]
Inhibition of proteasomal function aspH [122] Increased expression of mda/IL24 sulindac [123] Depletion of survivin aspH [124], tolfH [125]
Modulation of nuclear factor kappa B signalling aspH [126], sulindac [127], ibuH [128], indoH [129], dicloH [115], tolfH [130]
Mitogen activated protein kinase modulation aspH [131], indoH [132] Caspase activation and Bcl-2 protein modulation aspH [133, 134], indoH [134] Inhibition of store-operated calcium entry sulindac [135], mefH [135] Increased activity of caspase-3 to cleave PARP1 mefH [136] Interactions with cell membrane phospholipids mefH [137], celecoxib [138] Suppression of specificity protein 1 tolfH [139] Activation of NSAID-activated gene-1 tolfH [113], sulindac [140]
Increased production of gastric glutathione-S-transferase aspH [141], ibuH [141], indoH [141]
100,000 hospitalisations per year in the USA [19]. Additionally, an estimated 16,500
deaths per year in the USA are attributable to NSAID use [142]. The production of
prostaglandins (particularly PGE2 and PGI2) by COX-1 in the kidneys is important for
renal function; inhibition can lead to dysfunction of normal renal regulation of blood
pressure [143]. The inhibition of TXA2 production by COX-1 in platelets can result in
prolonged bleeding time and a mild, systemic haemostatic defect [144].
In the case of selective COX-2 inhibition, PGI2 production is decreased and TXA2 is
left unchecked leading to the development of CV issues [145]. While a number of
clinical studies have shown that COX-2 selective inhibitors, celecoxib and rofecoxib,
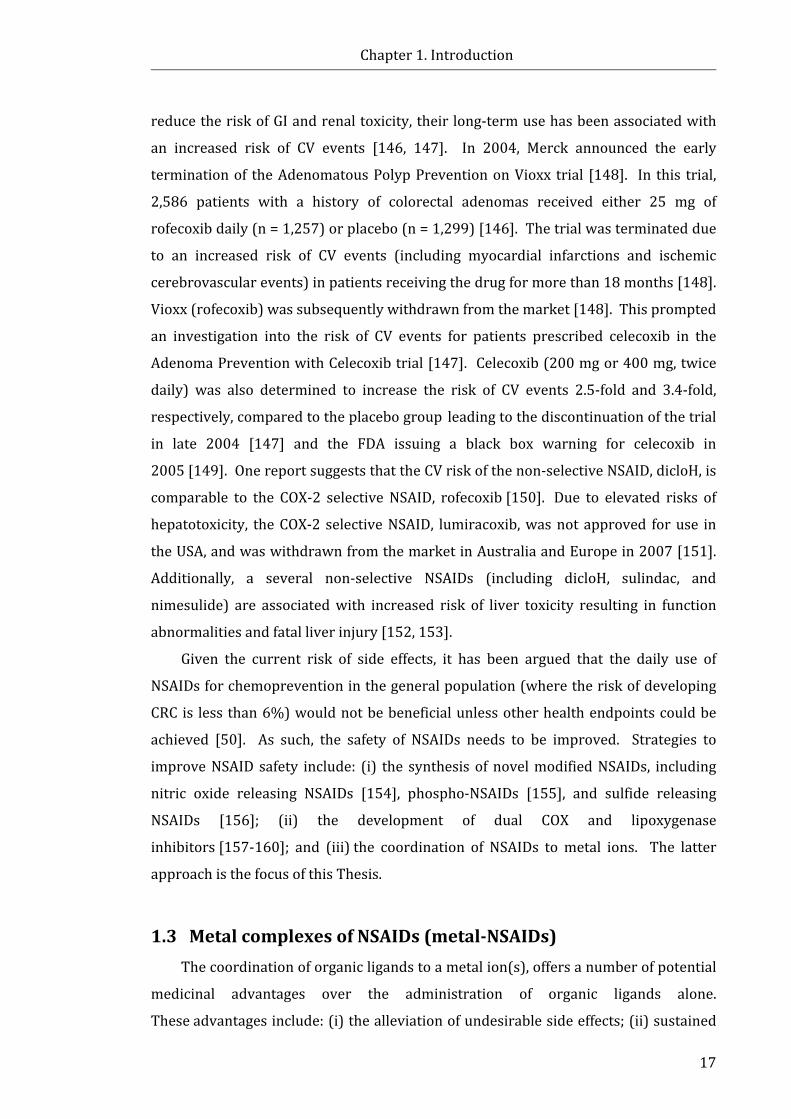
Chapter 1. Introduction
17
reduce the risk of GI and renal toxicity, their long-term use has been associated with
an increased risk of CV events [146, 147]. In 2004, Merck announced the early
termination of the Adenomatous Polyp Prevention on Vioxx trial [148]. In this trial,
2,586 patients with a history of colorectal adenomas received either 25 mg of
rofecoxib daily (n = 1,257) or placebo (n = 1,299) [146]. The trial was terminated due
to an increased risk of CV events (including myocardial infarctions and ischemic
cerebrovascular events) in patients receiving the drug for more than 18 months [148].
Vioxx (rofecoxib) was subsequently withdrawn from the market [148]. This prompted
an investigation into the risk of CV events for patients prescribed celecoxib in the
Adenoma Prevention with Celecoxib trial [147]. Celecoxib (200 mg or 400 mg, twice
daily) was also determined to increase the risk of CV events 2.5-fold and 3.4-fold,
respectively, compared to the placebo group leading to the discontinuation of the trial
in late 2004 [147] and the FDA issuing a black box warning for celecoxib in
2005 [149]. One report suggests that the CV risk of the non-selective NSAID, dicloH, is
comparable to the COX-2 selective NSAID, rofecoxib [150]. Due to elevated risks of
hepatotoxicity, the COX-2 selective NSAID, lumiracoxib, was not approved for use in
the USA, and was withdrawn from the market in Australia and Europe in 2007 [151].
Additionally, a several non-selective NSAIDs (including dicloH, sulindac, and
nimesulide) are associated with increased risk of liver toxicity resulting in function
abnormalities and fatal liver injury [152, 153].
Given the current risk of side effects, it has been argued that the daily use of
NSAIDs for chemoprevention in the general population (where the risk of developing
CRC is less than 6%) would not be beneficial unless other health endpoints could be
achieved [50]. As such, the safety of NSAIDs needs to be improved. Strategies to
improve NSAID safety include: (i) the synthesis of novel modified NSAIDs, including
nitric oxide releasing NSAIDs [154], phospho-NSAIDs [155], and sulfide releasing
NSAIDs [156]; (ii) the development of dual COX and lipoxygenase
inhibitors [157-160]; and (iii) the coordination of NSAIDs to metal ions. The latter
approach is the focus of this Thesis.
1.3 Metal complexes of NSAIDs (metal-NSAIDs) The coordination of organic ligands to a metal ion(s), offers a number of potential
medicinal advantages over the administration of organic ligands alone.
These advantages include: (i) the alleviation of undesirable side effects; (ii) sustained

Chapter 1. Introduction
18
in vivo delivery of the organic ligand, i.e. increased/prolonged bioavailability (thus the
metal complex essentially acts as a ‘pro-drug’); and (iii) synergism between the metal
and the organic ligand resulting in the improvement of the original intended biological
effect. A wide variety of metal-NSAID combinations have displayed biological actions
including anti-inflammatory activity [161-169], analgesia [164], anti-ulcer
activity [161-165], anti-cancer activity [162], and anti-microbial activity [170-175]
(for concision, the latter will not be discussed). Of particular interest to the research
presented in this Thesis is the complexation of metals with phenylalkanonic acids, and
more specifically, fenamic acid NSAIDs (i.e. fluH, mecloH, mefH and tolfH) and
salicylates (i.e. aspH and diflH). For brevity, the following Sections will focus on the
discussion of data from studies pertaining to metal complexes with phenylalkanonic
acid NSAIDs, with brief mention of some studies examining metal-NSAIDs containing
oxicam ligands.
1.3.1 Anti-inflammatory and anti-ulcerative properties of metal-NSAIDs
A number of metal-NSAID complexes have shown improved (or similar) in vivo
anti-inflammatory and analgesic activities compared to their parent NSAID [161-169],
as summarised in Table 1.2. One of the perceived advantages of the employment of
metal-NSAIDs over uncomplexed NSAIDs is the alleviation of common dose-limiting
side effects, in particular, GI ulcerations. Encouragingly, in vivo studies performed
using rodent models [161, 162, 164, 165] have shown that gastric ulceration induced
by commonly used NSAIDs (including ibuH, indoH and napH) was reduced by
complexation with Cu(II), Ru(II), and Zn(II), as demonstrated by a decrease in lesion
index scores (Table 1.2). Additionally, [Cu2(indo)4(DMF)2] (where DMF = N,N-
dimethylformamide) and [Zn2(indo)4(DMA)2] (where DMA = N,N-dimethylacetamide)
have been shown to reduce intestinal ulceration in rats when compared to indoH
alone [163]. However, unlike [Cu2(indo)4(DMF)2], the [Zn2(indo)4(DMA)2] complex
induced the same degree of ulceration in the stomach as indoH alone [163]. As
demonstrated in Table 1.2, this result was in concordance with previous studies [169].
These results validate the importance of the choice of the metal centre on the
biological activity of the complexes. The Ru(III)-oxicam complexes,
[RuCl2(piroxH2)(piroxH)] and [RuCl2(tenoxH2)(tenoxH)], demonstrated significant
anti-inflammatory activity in the carrageenan-induced rat paw oedema assay, albeit a
smaller effect was achieved than equimolar pirox [176]. The authors
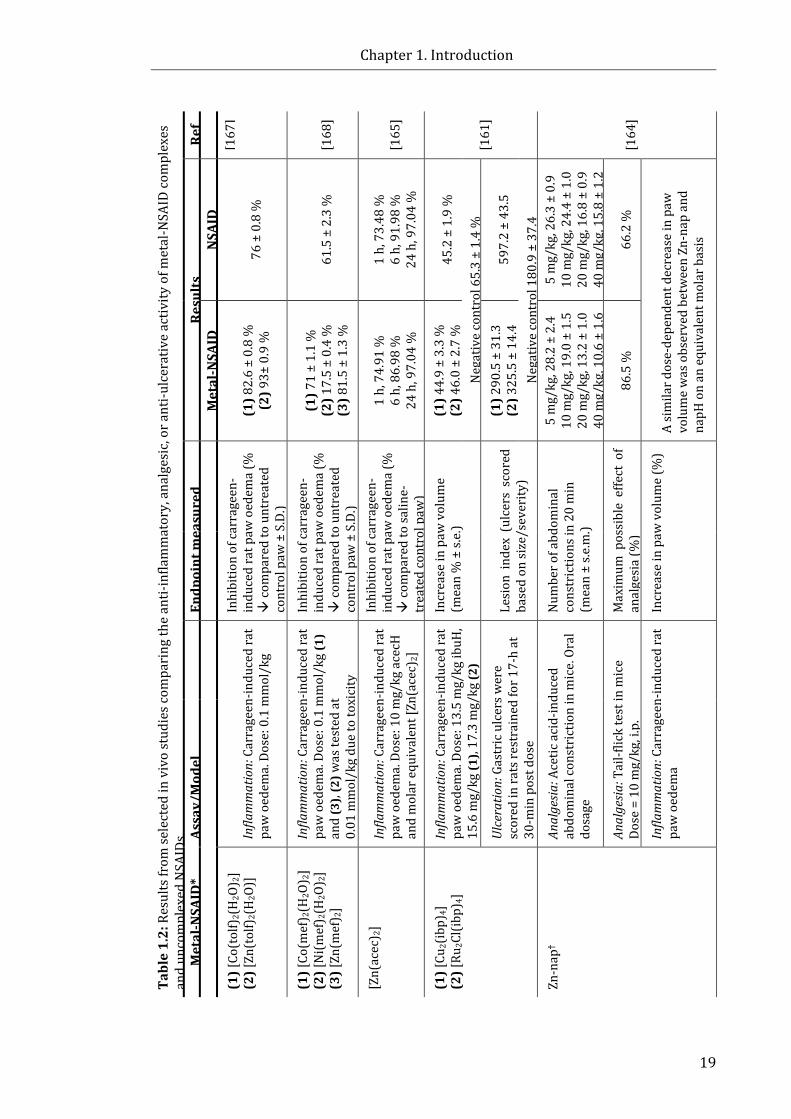
Chapter 1. Introduction
19
Tabl
e 1.
2: R
esul
ts fr
om se
lect
ed in
viv
o st
udie
s com
pari
ng th
e an
ti-in
flam
mat
ory,
ana
lges
ic, o
r ant
i-ulc
erat
ive
activ
ity o
f met
al-N
SAID
com
plex
es
and
unco
mpl
exed
NSA
IDs.
Ref
[167
]
[168
]
[165
]
[161
]
[164
]
Resu
lts
NSA
ID
76 ±
0.8
%
61.5
± 2
.3 %
1 h,
73.
48 %
6
h, 9
1.98
%
24 h
, 97.
04 %
45.2
± 1
.9 %
Neg
ativ
e co
ntro
l 65.
3 ±
1.4
%
597.
2 ±
43.5
Neg
ativ
e co
ntro
l 180
.9 ±
37.
4 5
mg/
kg, 2
6.3
± 0.
9 10
mg/
kg, 2
4.4
± 1.
0 20
mg/
kg, 1
6.8
± 0.
9 40
mg/
kg, 1
5.8
± 1.
2
66.2
%
A si
mila
r dos
e-de
pend
ent d
ecre
ase
in p
aw
volu
me
was
obs
erve
d be
twee
n Zn
-nap
and
na
pH o
n an
equ
ival
ent m
olar
bas
is
Met
al-N
SAID
(1) 8
2.6
± 0.
8 %
(2
) 93±
0.9
%
(1) 7
1 ±
1.1
%
(2) 1
7.5
± 0.
4 %
(3
) 81.
5 ±
1.3
%
1 h,
74.
91 %
6
h, 8
6.98
%
24 h
, 97.
04 %
(1) 4
4.9
± 3.
3 %
(2
) 46.
0 ±
2.7
%
(1) 2
90.5
± 3
1.3
(2) 3
25.5
± 1
4.4
5 m
g/kg
, 28.
2 ±
2.4
10 m
g/kg
, 19.
0 ±
1.5
20 m
g/kg
, 13.
2 ±
1.0
40 m
g/kg
, 10.
6 ±
1.6
86.5
%
Endp
oint
mea
sure
d
Inhi
bitio
n of
carr
agee
n-in
duce
d ra
t paw
oed
ema
(%
co
mpa
red
to u
ntre
ated
co
ntro
l paw
± S
.D.)
Inhi
bitio
n of
carr
agee
n-in
duce
d ra
t paw
oed
ema
(%
co
mpa
red
to u
ntre
ated
co
ntro
l paw
± S
.D.)
Inhi
bitio
n of
carr
agee
n-in
duce
d ra
t paw
oed
ema
(%
co
mpa
red
to sa
line-
trea
ted
cont
rol p
aw)
Incr
ease
in p
aw v
olum
e (m
ean
% ±
s.e.
)
Lesi
on i
ndex
(ul
cers
sco
red
base
d on
size
/sev
erity
)
Num
ber o
f abd
omin
al
cons
tric
tions
in 2
0 m
in
(mea
n ±
s.e.m
.)
Max
imum
pos
sibl
e ef
fect
of
anal
gesi
a (%
)
Incr
ease
in p
aw v
olum
e (%
)
Infla
mm
atio
n: C
arra
geen
-indu
ced
rat
paw
oed
ema.
Dos
e: 0
.1 m
mol
/kg
Infla
mm
atio
n: C
arra
geen
-indu
ced
rat
paw
oed
ema.
Dos
e: 0
.1 m
mol
/kg
(1)
and
(3),
(2) w
as te
sted
at
0.01
mm
ol/k
g du
e to
toxi
city
Infla
mm
atio
n: C
arra
geen
-indu
ced
rat
paw
oed
ema.
Dos
e: 1
0 m
g/kg
ace
cH
and
mol
ar e
quiv
alen
t [Zn
(ace
c)2]
Infla
mm
atio
n: C
arra
geen
-indu
ced
rat
paw
oed
ema.
Dos
e: 1
3.5
mg/
kg ib
uH,
15.6
mg/
kg (1
), 17
.3 m
g/kg
(2)
Ulce
ratio
n: G
astr
ic u
lcer
s wer
e sc
ored
in ra
ts re
stra
ined
for 1
7-h
at
30-m
in p
ost d
ose
Anal
gesia
: Ace
tic a
cid-
indu
ced
abdo
min
al co
nstr
ictio
n in
mic
e. O
ral
dosa
ge
Anal
gesia
: Tai
l-flic
k te
st in
mic
e
Dose
= 1
0 m
g/kg
, i.p
.
Infla
mm
atio
n: C
arra
geen
-indu
ced
rat
paw
oed
ema
Assa
y/M
odel
Met
al-N
SAID
*
(1) [
Co(t
olf)
2(H
2O) 2
] (2
) [Zn
(tol
f)2(
H2O
)]
(1) [
Co(m
ef) 2
(H2O
) 2]
(2) [
Ni(m
ef) 2
(H2O
) 2]
(3) [
Zn(m
ef) 2
]
[Zn(
acec
) 2]
(1) [
Cu2(
ibp)
4]
(2) [
Ru2C
l(ibp
) 4]
Zn-n
ap†

Chapter 1. Introduction
20
Tabl
e 1.
2 (c
ont.)
: Res
ults
from
sele
cted
in v
ivo
stud
ies c
ompa
ring
the
anti-
infla
mm
ator
y, a
nalg
esic
, or a
nti-u
lcer
ativ
e ac
tivity
of m
etal
-NSA
ID
com
plex
es a
nd u
ncom
plex
ed N
SAID
s. Re
f [1
64]
[163
]
[162
]
[163
]
[169
]
*Dep
roto
nate
d N
SAID
s: a
cec
= ac
eclo
fena
c; d
iclo
= d
iclo
fena
c; ib
p =
ibup
rofe
n; in
do =
indo
met
haci
n; m
ef =
mef
enam
ic a
cid;
nap
= n
apro
xen;
tolf
= to
lfena
mic
aci
d.
DMF
= N
,N-d
imet
hylfo
rmam
ide;
DM
A =
N,N
-dim
ethy
lace
tam
ide.
† Che
mic
al co
mpo
sitio
n not
def
ined
.
Resu
lts
NSA
ID
8 m
g/kg
, 4.5
± 0.
7 16
mg/
kg, 7
.0 ±
0.8
25 %
(d)/
11 %
(v)
Neg
ativ
e co
ntro
l: 48
% (d
)/60
% (v
)
36 m
m2
Neg
ativ
e co
ntro
l: 0
mm
2
140
mm
2
Neg
ativ
e co
ntro
l: 0
mm
2
25 %
(d)/
11 %
(v)
Neg
ativ
e co
ntro
l 48
% (d
)/60
% (v
)
39 m
m2
Neg
ativ
e co
ntro
l 3 m
m2
135
mm
2
Neg
ativ
e co
ntro
l 1 m
m2
9.83
mg/
kg, 6
9.26
Neg
ativ
e co
ntro
l, 2.
20
Met
al-N
SAID
8 m
g/kg
, 1.5
± 0
.0
16 m
g/kg
, 2.7
± 1.
5
30 %
(d)/
15 %
(v)
5 m
m2
5 m
m2
18 %
(d)/
10 %
(v)
37 m
m2
3 m
m2
9.83
mg/
kg, 7
0.80
3.
29 m
g/kg
, 0.7
5
Endp
oint
mea
sure
d
Lesi
on in
dex
(ulc
ers s
core
d ba
sed
on si
ze a
nd se
veri
ty)
(mea
n ±
s.e.m
.) In
crea
se in
paw
dia
met
er
(d) a
nd v
olum
e (v
) (%
com
pare
d to
bas
elin
e)
Mea
n ga
stri
c ulc
erat
ion
(sum
mat
ion
of th
e ar
ea o
f m
acro
scop
ic u
lcer
atio
n)
Mea
n in
test
inal
ulc
erat
ion
(sum
mat
ion
of th
e ar
ea o
f m
acro
scop
ic u
lcer
atio
n)
Incr
ease
in p
aw v
olum
e (d
) an
d vo
lum
e (v
) (%
com
pare
d to
bas
elin
e)
Mea
n ga
stri
c ulc
erat
ion
(sum
mat
ion
of th
e ar
ea o
f m
acro
scop
ic u
lcer
atio
n)
Mea
n in
test
inal
ulc
erat
ion
(sum
mat
ion
of th
e ar
ea o
f m
acro
scop
ic u
lcer
atio
n)
Lesi
on in
dex
(ulc
ers
scor
ed
base
d on
num
ber a
nd si
ze)
Ulce
ratio
n: G
astr
ic u
lcer
s in
rats
wer
e sc
ored
follo
win
g do
sing
ove
r 7 d
ays
Infla
mm
atio
n: C
arra
geen
-indu
ced
rat
paw
oed
ema.
Dos
e =
indo
H 1
0 m
g/kg
, [C
u 2(in
do) 4
(DM
F)2]
= 1
1.7
mg/
kg
Ulce
ratio
n: G
astr
ic u
lcer
s wer
e sc
ored
in
rats
sacr
ifice
d 3-
h po
st-d
ose;
inte
stin
al
ulce
rs w
ere
scor
ed in
rats
sacr
ifice
d 24
-h p
ost-
dose
Infla
mm
atio
n: C
arra
geen
-indu
ced
rat
paw
oed
ema.
Dos
e =
indo
H 1
0 m
g/kg
, [Z
n 2(in
do) 4
(DM
A)2]
= 1
3.3
mg/
kg
Ulce
ratio
n: G
astr
ic u
lcer
s wer
e sc
ored
in
rats
sacr
ifice
d 3-
h po
st-d
ose;
inte
stin
al
ulce
rs w
ere
scor
ed in
rats
sacr
ifice
d 24
-h
post
-dos
e. D
ose
= in
doH
10
mg/
kg
Ulce
ratio
n: G
astr
ic u
lcer
s wer
e sc
ored
in
rats
dos
ed 4
tim
es o
ver 2
day
s. D
ose
= in
doH
9.8
3 m
g/kg
, Zn-
Indo
3.7
5 m
g/kg
Assa
y/M
odel
Met
al-N
SAID
*
Zn-n
ap†
[Cu 2
(indo
) 4(D
MF)
2]
[Zn 2
(indo
) 4(D
MA)
2]
Chapter 1. Introduction
21
concluded that the two complexes were superior anti-inflammatory agents compared
to pirox due to the reduction in gastric damage in rats treated with the two complexes
compared to the damage induced by pirox alone.
The in vivo success of [Cu2(indo)4(DMF)2] has led to the development of
commercially available therapeutic products. For instance, these Cu-based NSAIDs
have been used in oral dosage forms for veterinary use, and for topical human
use [31]. An ethanolic gel-base of Cu-salicylate (marketed as Alcusal® by Australian
company Mentholatum) was formerly available for topical temporal relief of pain and
inflammation in humans [31]. Cu-Algesic® (containing [Cu2(indo)4(DMF)2]) is
available for veterinary use (dogs and horses) in Australasia, South East Asia and
South Africa due to its low toxicity profile compared to uncomplexed indoH [31].
1.3.2 Chemotherapeutic properties of metal-NSAIDs
Given the considerable evidence that NSAIDs possess chemopreventive and
chemotherapeutic properties (discussed in Section 1.2.2-1.2.4), it is reasonable to
hypothesise that metal-NSAID complexes may also possess this property. To this end,
a number of studies [167, 168, 175, 177-180] have assessed the toxicity of
metal-NSAIDs towards transformed (cancer) cells in vitro. As shown in Table 1.3, the
IC50 values (i.e. the concentration of drug required to produce 50% inhibition)
obtained from in vitro cancer cell studies allow a direct comparison of the toxicity of
the metal-NSAIDs to the analogous free NSAID, and the commonly used anti-cancer
drug, cisplatin (cis-diamminedichloroplatinum(II)). Encouragingly, a number of metal-
NSAID complexes possess improved (or similar) potency compared to the analogous
free NSAID (when considering the molar ratio of NSAID in the metal-complex) and
cisplatin against a number of cancer cell lines in vitro (Table 1.3). Many of these
studies varied the metal centre while employing the same NSAID ligands, revealing the
importance of the identity of the metal centre and the anti-cancer potential of the
complexes (Table 1.3). These studies also reveal that each of the metal-NSAID
complexes showed increased potency (i.e. selectivity) towards specific cancer cell lines
(Table 1.3).
Recently, a series of organometallic Ru(II)- and Os(II)-p-cymene complexes were
studied where the NSAIDs, indoH or dicloH, were attached to the organometallic
moieties via monodentate (pyridine/phosphine) or bidentate (bipyridine) ligands,
producing piano-stool Ru(II) and Os(II) arene complexes [181]. The modified NSAIDs
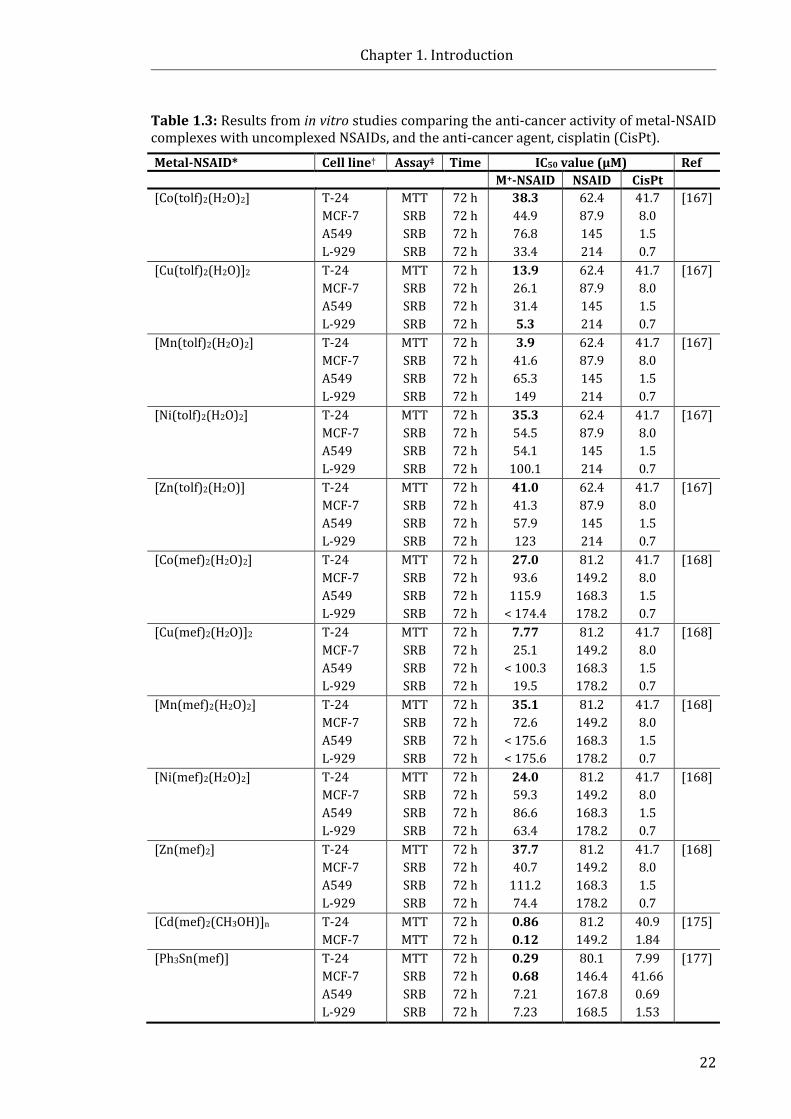
Chapter 1. Introduction
22
Table 1.3: Results from in vitro studies comparing the anti-cancer activity of metal-NSAID complexes with uncomplexed NSAIDs, and the anti-cancer agent, cisplatin (CisPt).
Metal-NSAID* Cell line† Assay‡ Time IC50 value (μM) Ref M+-NSAID NSAID CisPt [Co(tolf)2(H2O)2] T-24
MCF-7 A549 L-929
MTT SRB SRB SRB
72 h 72 h 72 h 72 h
38.3 44.9 76.8 33.4
62.4 87.9 145 214
41.7 8.0 1.5 0.7
[167]
[Cu(tolf)2(H2O)]2 T-24 MCF-7 A549 L-929
MTT SRB SRB SRB
72 h 72 h 72 h 72 h
13.9 26.1 31.4 5.3
62.4 87.9 145 214
41.7 8.0 1.5 0.7
[167]
[Mn(tolf)2(H2O)2] T-24 MCF-7 A549 L-929
MTT SRB SRB SRB
72 h 72 h 72 h 72 h
3.9 41.6 65.3 149
62.4 87.9 145 214
41.7 8.0 1.5 0.7
[167]
[Ni(tolf)2(H2O)2] T-24 MCF-7 A549 L-929
MTT SRB SRB SRB
72 h 72 h 72 h 72 h
35.3 54.5 54.1
100.1
62.4 87.9 145 214
41.7 8.0 1.5 0.7
[167]
[Zn(tolf)2(H2O)] T-24 MCF-7 A549 L-929
MTT SRB SRB SRB
72 h 72 h 72 h 72 h
41.0 41.3 57.9 123
62.4 87.9 145 214
41.7 8.0 1.5 0.7
[167]
[Co(mef)2(H2O)2]
T-24 MCF-7 A549 L-929
MTT SRB SRB SRB
72 h 72 h 72 h 72 h
27.0 93.6
115.9 < 174.4
81.2 149.2 168.3 178.2
41.7 8.0 1.5 0.7
[168]
[Cu(mef)2(H2O)]2 T-24 MCF-7 A549 L-929
MTT SRB SRB SRB
72 h 72 h 72 h 72 h
7.77 25.1
< 100.3 19.5
81.2 149.2 168.3 178.2
41.7 8.0 1.5 0.7
[168]
[Mn(mef)2(H2O)2] T-24 MCF-7 A549 L-929
MTT SRB SRB SRB
72 h 72 h 72 h 72 h
35.1 72.6
< 175.6 < 175.6
81.2 149.2 168.3 178.2
41.7 8.0 1.5 0.7
[168]
[Ni(mef)2(H2O)2] T-24 MCF-7 A549 L-929
MTT SRB SRB SRB
72 h 72 h 72 h 72 h
24.0 59.3 86.6 63.4
81.2 149.2 168.3 178.2
41.7 8.0 1.5 0.7
[168]
[Zn(mef)2]
T-24 MCF-7 A549 L-929
MTT SRB SRB SRB
72 h 72 h 72 h 72 h
37.7 40.7
111.2 74.4
81.2 149.2 168.3 178.2
41.7 8.0 1.5 0.7
[168]
[Cd(mef)2(CH3OH)]n T-24 MCF-7
MTT MTT
72 h 72 h
0.86 0.12
81.2 149.2
40.9 1.84
[175]
[Ph3Sn(mef)] T-24 MCF-7 A549 L-929
MTT SRB SRB SRB
72 h 72 h 72 h 72 h
0.29 0.68 7.21 7.23
80.1 146.4 167.8 168.5
7.99 41.66 0.69 1.53
[177]
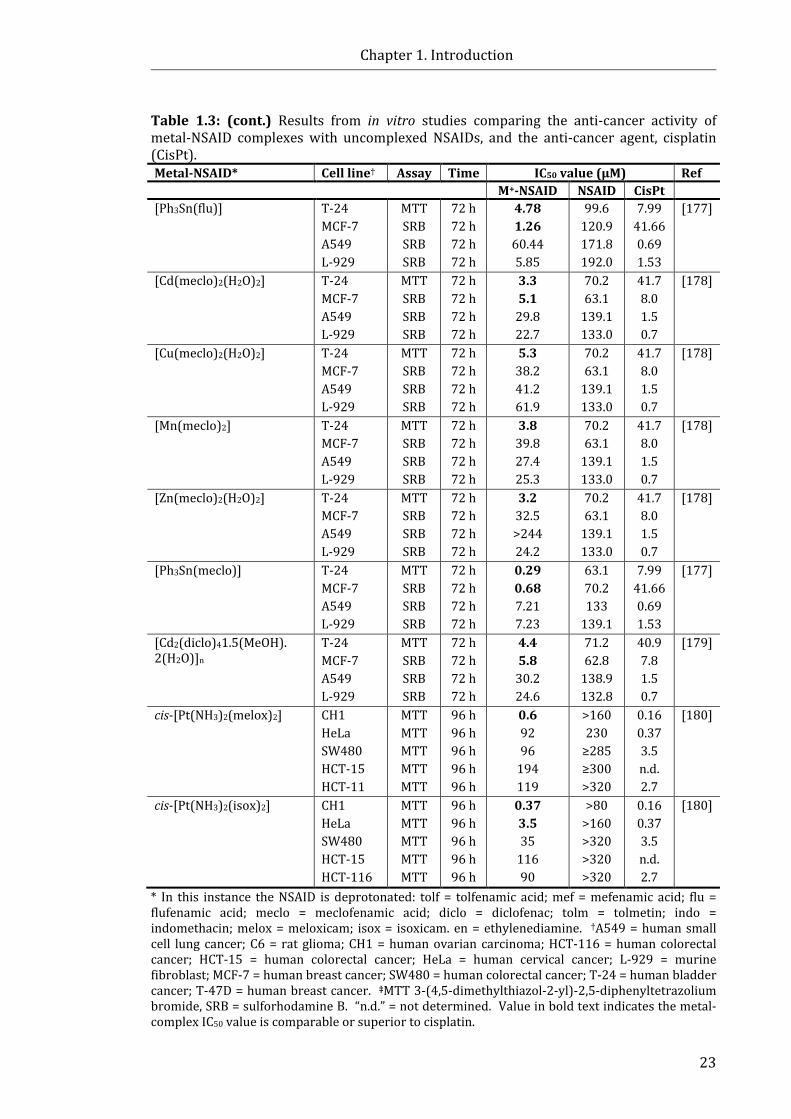
Chapter 1. Introduction
23
Table 1.3: (cont.) Results from in vitro studies comparing the anti-cancer activity of metal-NSAID complexes with uncomplexed NSAIDs, and the anti-cancer agent, cisplatin (CisPt). Metal-NSAID* Cell line† Assay Time IC50 value (μM) Ref M+-NSAID NSAID CisPt [Ph3Sn(flu)] T-24
MCF-7 A549 L-929
MTT SRB SRB SRB
72 h 72 h 72 h 72 h
4.78 1.26 60.44 5.85
99.6 120.9 171.8 192.0
7.99 41.66 0.69 1.53
[177]
[Cd(meclo)2(H2O)2] T-24 MCF-7 A549 L-929
MTT SRB SRB SRB
72 h 72 h 72 h 72 h
3.3 5.1
29.8 22.7
70.2 63.1
139.1 133.0
41.7 8.0 1.5 0.7
[178]
[Cu(meclo)2(H2O)2] T-24 MCF-7 A549 L-929
MTT SRB SRB SRB
72 h 72 h 72 h 72 h
5.3 38.2 41.2 61.9
70.2 63.1
139.1 133.0
41.7 8.0 1.5 0.7
[178]
[Mn(meclo)2] T-24 MCF-7 A549 L-929
MTT SRB SRB SRB
72 h 72 h 72 h 72 h
3.8 39.8 27.4 25.3
70.2 63.1
139.1 133.0
41.7 8.0 1.5 0.7
[178]
[Zn(meclo)2(H2O)2] T-24 MCF-7 A549 L-929
MTT SRB SRB SRB
72 h 72 h 72 h 72 h
3.2 32.5 >244 24.2
70.2 63.1
139.1 133.0
41.7 8.0 1.5 0.7
[178]
[Ph3Sn(meclo)] T-24 MCF-7 A549 L-929
MTT SRB SRB SRB
72 h 72 h 72 h 72 h
0.29 0.68 7.21 7.23
63.1 70.2 133
139.1
7.99 41.66 0.69 1.53
[177]
[Cd2(diclo)41.5(MeOH). 2(H2O)]n
T-24 MCF-7 A549 L-929
MTT SRB SRB SRB
72 h 72 h 72 h 72 h
4.4 5.8
30.2 24.6
71.2 62.8
138.9 132.8
40.9 7.8 1.5 0.7
[179]
cis-[Pt(NH3)2(melox)2]
CH1 HeLa SW480 HCT-15 HCT-11
MTT MTT MTT MTT MTT
96 h 96 h 96 h 96 h 96 h
0.6 92 96
194 119
>160 230
≥285 ≥300 >320
0.16 0.37 3.5 n.d. 2.7
[180]
cis-[Pt(NH3)2(isox)2] CH1 HeLa SW480 HCT-15 HCT-116
MTT MTT MTT MTT MTT
96 h 96 h 96 h 96 h 96 h
0.37 3.5 35
116 90
>80 >160 >320 >320 >320
0.16 0.37 3.5 n.d. 2.7
[180]
* In this instance the NSAID is deprotonated: tolf = tolfenamic acid; mef = mefenamic acid; flu = flufenamic acid; meclo = meclofenamic acid; diclo = diclofenac; tolm = tolmetin; indo = indomethacin; melox = meloxicam; isox = isoxicam. en = ethylenediamine. †A549 = human small cell lung cancer; C6 = rat glioma; CH1 = human ovarian carcinoma; HCT-116 = human colorectal cancer; HCT-15 = human colorectal cancer; HeLa = human cervical cancer; L-929 = murine fibroblast; MCF-7 = human breast cancer; SW480 = human colorectal cancer; T-24 = human bladder cancer; T-47D = human breast cancer. ‡MTT 3-(4,5-dimethylthiazol-2-yl)-2,5-diphenyltetrazolium bromide, SRB = sulforhodamine B. “n.d.” = not determined. Value in bold text indicates the metal-complex IC50 value is comparable or superior to cisplatin.

Chapter 1. Introduction
24
in complexation with Ru(II)- and Os(II) showed promising in vitro anti-proliferative
activity against human ovarian cancer cells (A2780, and cisplatin-resistant
A2780cisR) [181].
The Pt-oxicam complexes, cis-[Pt(NH3)2(melox)2] and cis-[Pt(NH3)2(isox)2],
demonstrated greater cytotoxicity compared to melox and isox alone against a panel
of cancer cell lines ([180], Table 1.3). The complexes were particularly effective
against CH1 human ovarian carcinoma cells, with IC50 values almost equal to that of
cisplatin [180]. The Cu(II), Zn(II), Co(II), and Ni(II) complexes of melox were found to
have a more pronounced cytotoxic/cytostatic effect than melox alone against HeLa
human cervical cancer cells and 8MGBA glioblastoma multiforme cells [182].
Pirox complexes with transition metal ions, V(IV), Mo(VI), Mn(II), U(VI) and Fe(III),
induce apoptosis within 24 h in HL-60 leukaemia cells, where little activity was
possessed by pirox until treatment for 57 h [183].
While there have been a substantial number of studies that have evaluated the
toxicity of metal-NSAIDs towards cancer cell lines in vitro (Table 1.3), the in vivo
anti-cancer effects of these complexes have been marginally explored. The effects of
[Cu2(indo)4(DMF)2] or indoH on the prevention of aberrant crypt foci (ACF) formation
in the colon of rats has been evaluated [162]. In the study, male Sprague-Dawley rats
were dosed with [Cu2(indo)4(DMF)2] for a 4-week period in conjunction with
azoxymethane (an inducer of ACF formation). The results from the study showed that
[Cu2(indo)4(DMF)2] treatment (3.8 mg/kg) reduced the formation of ACF by 43%,
while indoH treatment (3 mg/kg) resulted in 73% reduction. Although indoH was
more effective at preventing ACF formation, the [Cu2(indo)4(DMF)2]-treated rats
suffered significantly less gastric and intestinal ulceration ([162], Table 1.2).
1.3.3 Other biologically relevant properties of metal-NSAIDs
It is notable that a variety of metal-NSAIDs have shown strong protein binding
in vitro, and exhibited the ability to intercalate with DNA and exacerbate free radical
scavenging properties. These properties have been particularly well-studied in
metal-NSAID complexes of Co(II) or Cu(II) containing dicloH [184], diflH [185],
fluH [186], indoH [187], mefH [188], napH [184, 189], or tolfH [190, 191] ligands, or
the complexes, [M(II)(NSAID)n(L)n], where L represents incorporated nitrogen donor
heterocyclic ligands such as 2,2’-bipyridine (bipy), 1,10-phenanthroline (phen), and
pyridine (py). Additionally, the DNA binding activity of Mn(II) or Ni(II) derivatives
Chapter 1. Introduction
25
containing dicloH [192, 193], mefH [194] or nifH have been reported [195].
For instance, the Co(II) derivative of mef, [Co(mef)2(MeOH)4] (MeOH = methanol), and
Co(II)-mef complexes incorporating nitrogen donor heterocyclic ligands,
[Co(mef)2(bipy)(MeOH)2], [Co(mef)2(phen)(MeOH)2] and [Co(mef)2(py)2(MeOH)2],
possess relatively strong binding affinities for calf thymus DNA [188]. The four Co(II)-
mef complexes exhibited relatively high DNA binding constants (Kb);
however, [Co(mef)2(py)(MeOH)2] was the only complex with increased DNA binding
affinity compared to mefH alone (Kb values of 3.32 × 10⁵ M−1 and 1.05 × 10⁵ M−1,
respectively) [188]. Furthermore, competitive studies with ethidium bromide
indicated mefH and the Co(II)-mef complexes most likely interact with calf thymus
DNA by the intercalative mode [188]. Additionally, all four Co(II)-mef complexes
exhibited superior superoxide and free radical scavenging ability, and similar or
superior hydroxyl free scavenging ability in comparison to mefH [188]. Given that
NSAIDs exhibit anionic charge in vivo (deprotonated at pH 7) their interaction with the
polyanionic backbone of DNA is unlikely [196]. Uncharged metal-NSAIDs, however,
might overcome these repulsion forces [196], depending on their intracellular
stability. The ability of the aforementioned metal-NSAIDs to intercalate with DNA
with high binding affinity may be an important chemotherapeutic property given that
many clinically established anti-cancer agents exert their anti-neoplastic effects
through DNA interactions.
1.4 Bismuth One vital consideration in the rational drug development of metal-NSAIDs is the
choice of metal centre, since many metals are inherently toxic at low doses. Bi has no
essential physiological role [197]. However, Bi induces therapeutic effects in humans
and has been used in healthcare for centuries, predominantly to treat GI disorders, and
as an anti-microbial agent ([198] and references within). Bi remains employed in
contemporary medicine primarily for its anti-ulcerative and anti-bacterial actions
(discussed in Sections 1.4.1.2 and 1.4.1.3, respectively). Importantly, the use of Bi in
medicinal formulations is associated with low systemic toxicity and transient side
effects [199]. Several novel Bi compounds show promising in vitro and in vivo
anti-cancer activity (discussed in Section 1.4.1.4). As such, complexation of Bi with
NSAIDs may prove to be a successful strategy to reduce NSAID-induced GI injury and
improve the desired chemopreventive and chemotherapeutic activity of the NSAID.
Chapter 1. Introduction
26
Located in group 15 of the periodic table, Bi (atomic number 83) is considered
metallic (or semi-metallic) in character, as opposed to other group 15 elements,
arsenic and antimony, which are classified as metalloids [200]. Bi is found in the
trivalent or pentavalent oxidation state (Bi(III) and Bi(V)), where the former is the
more stable and the most biologically relevant oxidation state [201]. Given Bi(V)
possesses powerful antioxidant properties in aqueous solution (Bi(V)/Bi(III) potential
E° = 2.03 V), Bi(V) is not believed to be stable in biological systems [201]. Bi(III) is
readily hydrolysed (pKa = 1.51) in aqueous solution, and has a high affinity for oxygen,
nitrogen and thiolate containing ligands [201]. It is thought that the Bi(III) ion has
high mobility within cells due to the kinetic lability of thiolate ligands and resultant
millisecond time scale required for exchange with free thiols [202].
Furthermore, there is a wealth of experimental evidence that shows that the
therapeutic and anti-bacterial actions of Bi arise primarily through interactions with
proteins (discussed further in Sections 1.4.1.1–1.4.1.3).
1.4.1 Bismuth in medicine
Louis Odier first described the use of bismuth subnitrate for medicinal purposes
in 1786 as a treatment for dyspepsia [203]. For over two centuries, Bi preparations
have been used medicinally to treat an assortment of diseases, primarily
gastroenterological and microbiological in nature, as demonstrated in Table 1.4.
Currently, three Bi drugs are marketed for the treatment of GI conditions and
Helicobacter pylori infection in combination therapies with antibiotics. These include:
bismuth subsalicylate (BSS; Pepto-Bismol®, the Procter & Gamble Company,
Cincinnati, Ohio, USA), colloidal bismuth subcitrate (CBS; De-Nol®, Gist Brocades, Delft,
The Netherlands), and ranitidine bismuth citrate (RBC; Tritec® and Pylorid®,
GlaxoWellcome, Hertfordshire, UK) [204]. RBC combines the mucosal protection of Bi
with the anti-secretory properties of ranitidine (N,N-dimethyl-5-(3-nitromethylene-7-
thia-2,4-diaaoctyl)-furan-2-meth-amine) [204]. The chemical structures of bismuth
salicylate (bismuth 2-hydroxybenzoate), bismuth citrate (bismuth 2-hydroxypropane-
1,2,3-tricarboxylate) and RBC are shown in Table 1.4. The ‘sub’ prefixes of BSS and
CBS refers to the poorly understood chemical structure of the formulations, although
recent studies have shed light on the possible conformation and polymerisation of BSS
[205] and CBS [206] in acidic environments.
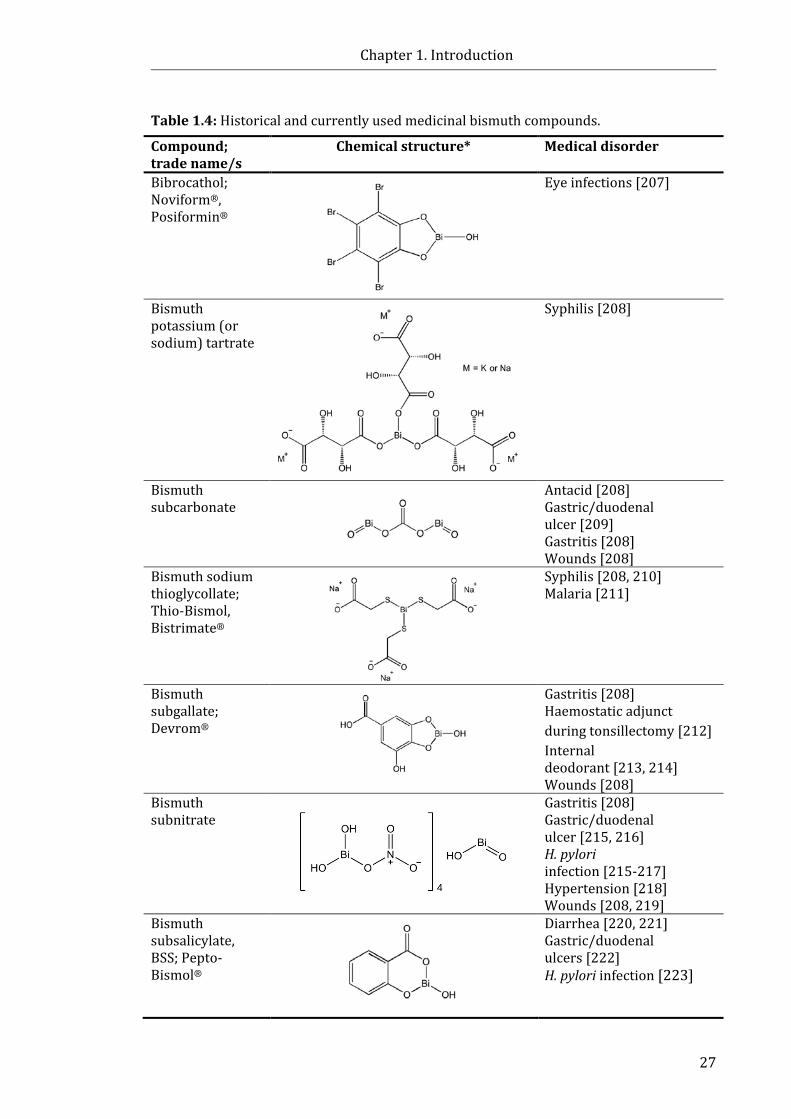
Chapter 1. Introduction
27
Table 1.4: Historical and currently used medicinal bismuth compounds.
Compound; trade name/s
Chemical structure* Medical disorder
Bibrocathol; Noviform®, Posiformin®
Eye infections [207]
Bismuth potassium (or sodium) tartrate
Syphilis [208]
Bismuth subcarbonate
Antacid [208] Gastric/duodenal ulcer [209] Gastritis [208] Wounds [208]
Bismuth sodium thioglycollate; Thio-Bismol, Bistrimate®
Syphilis [208, 210] Malaria [211]
Bismuth subgallate; Devrom®
Gastritis [208] Haemostatic adjunct during tonsillectomy [212] Internal deodorant [213, 214] Wounds [208]
Bismuth subnitrate
Gastritis [208] Gastric/duodenal ulcer [215, 216] H. pylori infection [215-217] Hypertension [218] Wounds [208, 219]
Bismuth subsalicylate, BSS; Pepto-Bismol®
Diarrhea [220, 221] Gastric/duodenal ulcers [222] H. pylori infection [223]
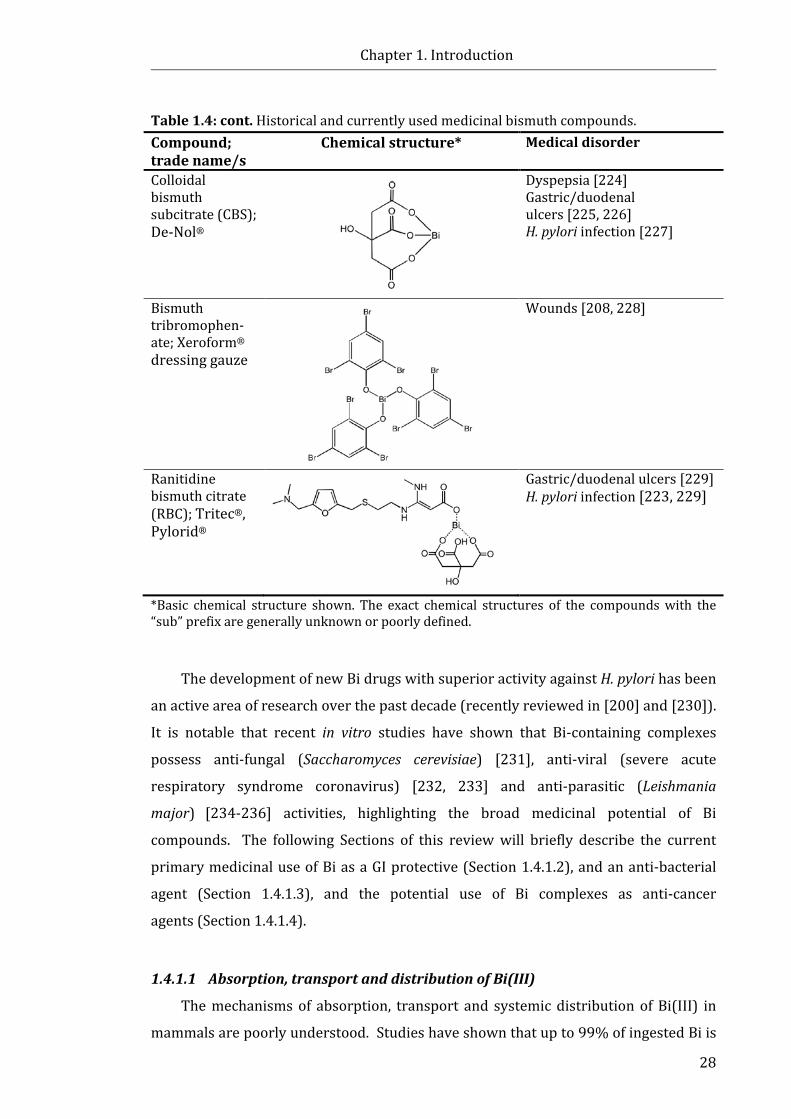
Chapter 1. Introduction
28
Table 1.4: cont. Historical and currently used medicinal bismuth compounds. Compound; trade name/s
Chemical structure* Medical disorder
Colloidal bismuth subcitrate (CBS); De-Nol®
Dyspepsia [224] Gastric/duodenal ulcers [225, 226] H. pylori infection [227]
Bismuth tribromophen-ate; Xeroform® dressing gauze
Wounds [208, 228]
Ranitidine bismuth citrate (RBC); Tritec®, Pylorid®
Gastric/duodenal ulcers [229] H. pylori infection [223, 229]
*Basic chemical structure shown. The exact chemical structures of the compounds with the “sub” prefix are generally unknown or poorly defined.
The development of new Bi drugs with superior activity against H. pylori has been
an active area of research over the past decade (recently reviewed in [200] and [230]).
It is notable that recent in vitro studies have shown that Bi-containing complexes
possess anti-fungal (Saccharomyces cerevisiae) [231], anti-viral (severe acute
respiratory syndrome coronavirus) [232, 233] and anti-parasitic (Leishmania
major) [234-236] activities, highlighting the broad medicinal potential of Bi
compounds. The following Sections of this review will briefly describe the current
primary medicinal use of Bi as a GI protective (Section 1.4.1.2), and an anti-bacterial
agent (Section 1.4.1.3), and the potential use of Bi complexes as anti-cancer
agents (Section 1.4.1.4).
1.4.1.1 Absorption, transport and distribution of Bi(III)
The mechanisms of absorption, transport and systemic distribution of Bi(III) in
mammals are poorly understood. Studies have shown that up to 99% of ingested Bi is
Chapter 1. Introduction
29
passed through the feces without alteration [237]. However, it has also been reported
that Bi levels in the gastric mucosa significantly increase to a peak level of 30–60 μg/L
(0.14–0.28 μM) following a single oral dose of BSS, CBS or RBC [238]. Bi levels in the
blood have been reported to increase 51- to 1483-fold following ingestion [238], with
a relatively rapid rate of systemic uptake (15–60 min) [239]. Once absorbed, binding
to plasma proteins conceivably facilitates the systemic transport of Bi. Experimental
evidence suggests that Bi binds strongly to the iron transport enzyme, transferrin
[240, 241]. It has also been reported that Bi bound to lactoferrin (a member of the
transferrin family) was recognised by IEC-6 rat intestinal cells and blocked the uptake
of the native Fe–lactoferrin complex, leading to the suggestion that Bi is transported
into cells by transferrin receptor pathways [242]. Bi has also been shown to bind to
human serum albumin [243], one of the most abundant proteins in the bloodstream.
However, in the presence of a large excess of albumin (albumin/transferrin 13:1, at pH
7.4, 10 mM bicarbonate), 70% of Bi was bound to transferrin [243], suggesting
transferrin is the most likely target of Bi in the bloodstream.
In addition to iron transport proteins, Bi(III) has been shown to bind to other
cellular peptides and proteins that are believed to confer intracellular uptake
pathways. For instance, it has been reported [244] that Bi has a high affinity for
glutathione, a tripeptide that is present in cells in relatively high concentrations
(0.5–7 mM) and is believed to play a role in Bi transport in cells and biofluids.
Found in most tissues, metallothioneins (MTs), are low molecular mass proteins
(~ 60 amino acids) comprised of a cysteine-rich amino acid sequence [245].
The cysteine-rich character provides a high capacity for the metals ion (such as Zn(II),
Cu(I), Cd(II) and Bi(III)) to bind. As such, the primary functions of MTs are believed to
be metal sequestration, metal homeostasis and metabolism, and the detoxification of
metals [245]. Studies by Sun et al. [246] have shown that Bi binds strongly to the
cysteine residues of MT in a stoichiometry of Bi:MT = 7:1 and can readily replace
Zn(II) and Cd(II) ions. Additionally, Bi administration has been shown to increase MT
production in humans [247, 248]. A number of studies [249-253] suggest that
intracellular Bi accumulates in lysosomes, which are acidic organelles that are used to
remove debris from within the cell, most likely as part of cellular detoxification events.
1.4.1.2 Bismuth as a GI protective agent
The success of Bi as a GI protective agent is due in part to its anti-bacterial action
against H. pylori (discussed in more detail in Section 1.4.1.3). However, common Bi
Chapter 1. Introduction
30
compounds such as BSS and CBS have been shown to exert non-bactericidal effects in
the GI system, and have been employed as clinically effective agents for the treatment
of a variety of GI ailments (Table 1.4). It has been suggested that the protective GI
properties of Bi compounds, such as those produced by BSS and CBS, are due to the
interaction of colloidal particles of Bi(III) with the acidic conditions of the stomach
resulting in the formation of precipitated polymeric Bi(III) structures [254].
For instance, BSS can undergo ligand exchange and form insoluble bismuth
oxychloride (BiOCl) ions in the stomach [255]. Studies performed with CBS led to the
suggestion that [Bi(cit)2Bi]2– molecules form colloidal particles such as [Bi6O4(cit)4]6–
and [Bi12O8(cit)8]12– at neutral pH [256], but rearrange to form sheets and 3D polymers
under acidic conditions due to ligand exchange reactions [206]. It is likely that the
precipitation of BSS or CBS products and the formation of a polymeric coating on ulcer
craters prevents further erosion of the mucosa [254]. Additionally, it has been
suggested that the stabilisation of the mucous layer by CBS increases the resistance to
back-diffusion of hydrogen ions without significantly modifying the ion-exchange
properties of the mucous [257]. Other means by which Bi has been suggested to
attenuate GI protection include scavenging reactive oxygen species (ROS) [258, 259],
inactivating the digestive enzyme pepsin [260, 261], stimulating luminal release of
PGE2 [226], stimulating epidermal growth factor [262], restoration of
phosphoinositide specific phospholipase C activity in response to injury, thus
increasing mucosal cell proliferation [263], and the activation of the calcium-sensing
receptor and the intracellular increase in Ca2+ concentration, increasing mitogen-
activated protein kinase activity, which leads to the proliferation of normal human
gastric mucous epithelial cells [264].
1.4.1.3 Bismuth as an anti-bacterial agent
In 1984, Marshall and Warren discovered that H. pylori, a bacterium that localises
in human gastric mucosa, was present in the stomach lining of patients suffering from
gastritis and stomach ulcerations [265]. A decade later, the World Health Organisation
classified H. pylori as a class I carcinogen, since chronic infection can lead to the
formation of dysplasia and eventually gastric cancer if left untreated [266]. While only
a small proportion (< 3%) of individuals infected with H. pylori are expected to
develop gastric malignancies as a result of H. pylori colonisation, it is estimated that up
to 50% of the world’s population carry H. pylori [267]. Two Bi-based H. pylori
Chapter 1. Introduction
31
treatment regimens were approved by the FDA in the mid-1990s [223].
These consisted of: (i) a two week course of RBC (400 mg twice daily), and
clarithromycin (500 mg three times daily), followed by a further two week course of
RBC (400 mg twice daily), or (ii) a two week quadruple regime combining
BSS (525 mg four times daily), metronidazole (250 mg four times daily), and
tetracycline (500 mg four times daily), in combination with a histamine-2 receptor
antagonist (ulcer healing agent) as directed over 4 weeks [223]. However, Bi-based
therapies were often employed in relapsed forms of H. pylori treatment after primary
treatment with a triple-therapy of antibiotics had failed [268].
More recently, concerns have been raised over increasing antibiotic resistance,
particularly clarithromycin resistance in H. pylori [268]. Given there is no evidence
that H. pylori are able to develop resistance to Bi, it has been suggested that Bi-based
regimes (including the Bi-based quadruple therapy, comprising of a three-in-one
capsule of potassium bismuth subcitrate, metronidazole, and tetracycline (marketed
as Pylera®), and a proton pump inhibitor) may be considered a more suitable
first-line treatment for H. pylori infection over the coming decades [268].
While many Bi compounds are active against H. pylori, the exact mechanism of
action remains unclear. Experimental evidence from in vitro studies suggests that the
anti-bacterial activity of Bi may be multimodal; for instance, proposed mechanisms
include the disruption of the glycocalyx cell wall through the formation of Bi
aggregates [269], disruption of the adherence of the bacterium to gastric cells [255],
cessation of ATP synthesis [270], the inhibition of urease, an enzyme which protects
the bacterium from the acidic environment of the stomach [271], and inhibition of
other enzymes which are responsible for toxicity to gastric mucosal cells, such as
bacterial alcohol dehydrogenase [272]. Additionally, evidence shows that H. pylori
sequesters iron through the utilisation of host-specific lactoferrin, thus Bi(III) binding
to lactoferrin may disrupt bacterial iron acquisition [273]. In many cases the
interaction of Bi with the cells is physicochemical in nature, thus potentially explaining
the lack of bacterial resistance to Bi compounds [269].
1.4.1.4 Bismuth as an anti-cancer agent: Diagnostic and therapeutic roles
In addition to the GI protective and anti-bacterial properties of Bi, there is
growing substantiation that Bi compounds have the potential to play a significant and
diverse role in cancer diagnostics and anti-cancer therapies. For instance, isotopes of
Chapter 1. Introduction
32
Bi (212Bi or 213Bi) conjugated to various monoclonal antibodies have been investigated
as a method of targeted radiotherapy [274, 275]. Nanoparticles of Bi have shown
promise as contrast agents for computed tomography, providing equal or superior
quality imaging to currently used contrast agents, owing to the large atomic number of
Bi [276]. Bi has also displayed synergism when administered with chemotherapeutic
agents in vivo. For example, co-administration of Bi and cisplatin reduced the
nephrotoxic side effects induced by cisplatin [277-279]; Bi-induced MT synthesis was
determined as the primary mechanism of this effect [247, 248]. The induction of MT
synthesis by Bi has been shown to reduce the cardiotoxic side effects of adriamycin in
mice [280, 281].
A variety of novel Bi(III) complexes have shown promising in vitro
chemotherapeutic activity. Heterocyclic organobismuth(III) complexes, N-tert-butyl-
bi-chlorodibenzo[c,f][1,5]azabismocine (Fig. 1.6, 1), bi-chlorodibenzo[c,f][1,5]-
thiabismocine (Fig. 1.6, 2) and bi-chlorophenothiabismin-S,S-dioxide (Fig. 1.6, 3) have
shown potent cytotoxicity against leukaemia cell lines; Molt-4, U937, HL-60, NB4 and
K562 [282]. Apoptosis induced by 2 (Fig. 1.6) in HL-60 cells and was associated with
enhanced generation of intracellular ROS, loss of mitochondrial transmembrane
potential (Δψm), cytochrome C release from the mitochondria to the cytosol, and
activation of caspases -3, -8, and -9, suggesting the main mechanism of action of the
compound involves mitochondrial damage. In further work, 2 (Fig. 1.6) was shown to
cause G2/M cell cycle arrest in HeLa cells at low concentrations (~1.0 µM) leading to
apoptosis [283]. This was accompanied by the disruption of the microtubule network
in the cells, suggesting the compound may be a novel tubulin polymerisation
inhibitor [283].
The organobismuth complex, 1-[(2-di-p-tolylbismuthanophenyl)diazenyl]-
pyrrolidine (Fig. 1.6, 4), showed anti-proliferative activity against several human
cancer cell lines (IC50 values 0.880−8.478 µM), with particularly high potency towards
the human acute promyelocytic leukaemia cell line, NB4 [284]. Treatment of the NB4
cells with 4 (Fig. 1.6) induced apoptosis, decreased Δψm and increased the production
of ROS, similar to the cellular effects induced by 2 (Fig. 1.6); however, 4 (Fig. 1.6) did
not show any disruption of tubulin polymerisation in vitro. It is notable that
substitution of the metal centre of 4 (Fig. 1.6) with Sb(III) resulted in no cytotoxicity in
NB4 cells (up to 10 μM) suggesting the combination of the Bi(III) centre and the
conjugated structure of the diazenylpyrrolidine moiety were essential for bioactivity.

Chapter 1. Introduction
33
Figure 1.6: Chemical structures of Bi compounds that have shown potential anti-cancer activity in vitro.
Chapter 1. Introduction
34
The [Bi(AcPhH)Cl2], [Bi(AcpClPhH)Cl2] and [Bi(AcpNO2PhH)Cl2] complexes
(Fig. 1.6, 5, where AcPhH2 = 2,6-diacetylpyridine bis(benzoylhydrazone), AcpClPhH2 =
2,6-diacetylpyridine bis(para-chlorobenzoylhydrazone), and AcpNO2PhH2 = 2,6-
diacetylpyridine bis(para-nitrobenzoylhydrazone)) showed enhanced toxicity
compared to the free ligands and analogous Sb(III) complexes, against a panel of
human cancer cell lines (IC50 values ranging from 0.09−10.56 µM). Importantly,
[Bi(AcpClPhH)Cl2] and [Bi(AcpNO2PhH)Cl2] showed relatively low potency towards
human peripheral blood mononuclear cells (IC50 values 117.0 µM and 22.94 µM,
respectively), demonstrating selectivity towards cancer cell lines [285]. More
recently, the same research group synthesised Bi(III) complexes with
2-acetylpyridine- and 2-benzoylpyridine-derived hydrazones [286], which also
showed promising cytotoxic activities against HL-60, Jurkat and THP-1 leukaemia
cells, and on MCF-7 and HCT-116 solid tumour cells. The IC50 values of the
AcpNO2PhH2 ligand and [Bi(2AcpNO2Ph)Cl2] complex (where AcpNO2PhH2 =
2-acetylpyridine-para-nitro-phenylhydrazone) were three-fold smaller when HCT-116
cells were cultured in soft-agar (3D) than when cells were cultured in monolayer (2D),
suggesting these compounds may show potential against solid tumours in vivo [286].
In other studies, the seven-coordinated Bi(III) complex [Bi(L)(NO3)2(CH3CH2OH)]
(HL = 2-acetylpyridine N(4)phenylthiosemicarbazone) (Fig. 1.6, 6) exhibited
comparable cytotoxicity to cisplatin (5.22 µM and 1.2 µM), and higher toxicity than the
free ligand (IC50 = 94.7 µM) [287]. The complex was also active against HCT-116, HeLa
and HepG2 cells [287]. Similar to other Bi(III) complexes discussed in this Section,
6 (Fig. 1.6) induced apoptotic cell death via an increase in ROS production and
reduced Δψm in HepG2 cells [287].
The Bi(III) complex, BiTPC (where TPC = 1,4,7,10-tetrakis(2-pyridylmethyl)-
1,4,7,10-tetraazacyclododecane) (Fig. 1.6, 7), a water soluble Bi compound, was found
to exhibit potent cytotoxicity towards melanoma B16-BL6 cells (IC50 = 41 nM) which
was 100 times more potent than cisplatin [288]. Although it is generally accepted that
the most likely targets of Bi compounds are proteins, DNA binding studies showed that
BiTPC could bind non-covalently to DNA under physiologically relevant
conditions [288].
While the aforementioned Bi complexes have demonstrated encouraging in vitro
activity, evaluation of a number of other Bi compounds have shown varied success in
animal models. For instance, the arylbismuth(III) oxinates, Bi(Ox)3, Bi(Ox)2I,
Chapter 1. Introduction
35
PhBi(Ox)2.EtOH, PhBi(MeOx)2, [NaPhBi(Ox)3] and [KPhBi(Ox)3] (where Ox =
quinolin-8-olate and MeOx = 2-methylquinolin-8-olate) showed promising anti-cancer
activity against murine leukaemia cells, L1210 (≤ 0.56 µM), the corresponding
cisplatin resistant cell line, L1210/DDP (≤ 0.37 µM), and human ovarian cancer cells,
SKOV-3 (≤ 2.9 µM) in vitro [289]. However, the compounds, PhBi(Ox)2.EtOH and
[KPhBi(Ox)3], showed no significant anti-tumour activity against murine
plasmacytoma, and [KPhBi(Ox)3] showed no significant anti-tumour activity against
P388 leukaemia in murine models [289]. The lack of in vivo activity was attributed to
problems with delivery of the compounds due to their poor solubility in biological
fluids [289].
Similarly, dithiocarbamate Bi complexes including, Bi(N,N-dimethyldithio-
carbamato)3, Bi(N,N-diethyldithiocarbamato)3, Bi(pyrrolidyldithio-carbamato)3 and
Bi(morpholidyldithiocarbamato)3 were found to be cytotoxic against several cancer
cell lines and, in many cases, more potent than established organic drugs [290].
Treatment with the Bi(N,N-diethyldithiocarbamato)3 complex slowed tumour growth
in mice inoculated with HT-29 cells relative to tumour growth in untreated mice [290].
The complex showed greater anti-tumour activity in OVCAR-3 inoculated mice
whereby tumour size began to reduce after 15 days of Bi(N,N-diethyldithio-
carbamato)3 treatment [290].
Finally, a nine-coordinate Bi(III) complex, [Bi(H2L)(NO3)2]NO3 (where H2L = 2,6-
diacetylpyridine bis(4N-methylthiosemicarbazone)) (Fig. 1.6, 8) has been synthesised
and its in vitro and in vivo anti-cancer activity evaluated [291]. The IC50 value of
8 (Fig. 1.6) was approximately three times lower than the ligand alone against the
K562 cell line [291]. In mice xenografted with H22 (mice hepatoma) cells, tumour
growth was inhibited by 61.6% and 43.5% following 7-day treatment with 8 (Fig. 1.6,
10 mg/kg), and the anti-cancer drug mitoxantrone (0.4 mg/kg), respectively,
compared to the control group [291]. Despite promising in vitro activity and some
preliminary success with in vivo studies, currently there are no Bi-containing
complexes in clinical trials or used in therapies for the treatment of cancer [292].
1.4.2 Bismuth toxicity
It is generally reported in the literature that Bi possesses uncharacteristically low
toxicity, particularly when compared to the group 15 counterparts, arsenic and
antimony. Compared to many medications, the side effect profile for Bi (taken at the
Chapter 1. Introduction
36
appropriate dose) is quite limited [237]; transient, harmless side effects such as
darkened stools [199] and blackening of the tongue [293] are the most commonly
reported. However, in the 1970s, concerns over the safety of Bi compounds (namely
bismuth subcarbonate, bismuth subgallate, and CBS) were raised due to cases of Bi
intoxication resulting in cases of encephalopathy in Australia [294, 295] and
France [296], which led to the withdrawal of some Bi medications from the market in
these countries. This severe side effect was reported in patients who consumed high
doses (3–20 g of Bi per day over a 6–36 month period) [296]. It is notable, however,
that Bi-induced encephalopathy can be reversed upon the cessation of Bi treatment,
with full restoration of neurological function over a few weeks [237].
A limited number of studies addressing the bioaccumulation of Bi in mammals
have been reported. Following a single dose of RBC in mice, Bi deposits have been
observed in the stomach, duodenum, ileum and kidney (2.5–10 h after dosing) [297].
Interestingly, Bi was evident in the lymph nodes, liver, spleen, kidney and
macrophages in the GI lamina propria 1–9 weeks following administration of RBC,
although Bi was absent from the GI epithelium (consistent with cellular
turnover) [297]. However, no signs of morphological changes in the Bi-treated tissues
or adverse effects in the behaviour of the mice were observed [297]. Although the link
between bioaccumulation and toxicity remains poorly understood, this study
highlights the potential for systemic accumulation of Bi, even with short-term
treatments. Another concern is the recent number of studies highlighting the
biotransformation of Bi into methylated species such as trimethylbismuth (Me3Bi) by
bacterial species present in intestinal flora in humans (recently reviewed in [255]).
Given evidence that Me3Bi species are more toxic to bacteria than inorganic
species [298], there may be implications for the regulation of gut flora in humans;
however, the health implications of the Me3Bi formation by human microflora requires
further investigation.
While the aforementioned toxicity of Bi raises some concern over the safety of
Bi-based medications, there is also evidence to suggest that when used periodically, Bi
drugs are generally safe and well tolerated. A systemic review and meta-analysis of
35 clinical studies concluded that Bi drugs (namely bismuth subnitrate, BSS, CBS, and
RBC, Bi dosage ranging from 400–1200 mg/day and duration from 7–56 days) used
for the treatment of H. pylori infection are safe and well-tolerated when administered
either alone, or in combination with antibiotics [199]. The only side effect that was
Chapter 1. Introduction
37
significantly more common in patients assigned Bi-based therapies was darkened
stools (not to be confused with GI bleeding) [199]. Accordingly, Pepto-Bismol is
currently available over-the-counter without a prescription in the USA, Canada and
UK. Given that the majority of regimes employing Bi for treatment of H. pylori
infection require less than two weeks of administration, the use of Bi in prolonged
chemopreventive therapies (months to years) would require careful monitoring to
determine if any adverse side effects or signs of toxicity negate the potential positive
therapeutic effects.
1.5 BiNSAID Complexes Despite experimental, epidemiological, and clinical evidence that indicates that
long-term use of NSAIDs is associated with reduced incidence of CRC (Section 1.2.2),
the prolonged use of NSAIDs for chemoprevention is not recommended for the general
population [77]. This is due, in part, to the risks that NSAIDs impose on the GI system.
It is, therefore, plausible to consider the combination of NSAIDs with GI protective Bi
(as a single therapeutic agent) in order to alleviate the GI side effects of NSAIDs [299].
Despite the specific GI protective advantage of Bi compared to other metals, and the
conceivable synergistic chemotherapeutic action of Bi coordinated to an organic
ligand, there are a limited number of reports [299, 300] detailing the synthesis and
biological activity of BiNSAID complexes, highlighting the potential for development in
this area.
The use of Bi(III) compounds for protection against NSAID-induced GI injury is
not without precedence. A number of studies have shown that pre-treatment or
co-administration with Bi compounds such as BSS [301, 302], CBS [303, 304], and
RBC [305] with NSAIDs reduces GI ulceration in vivo. In a double-blind randomised
three-way crossover study, healthy male volunteers (n = 24) received nine doses of
placebo, aspH (900 mg), or aspH and RBC (900 mg and 800 mg, respectively) at 12-h
intervals, with a two-week washout period between each treatment [305]. The
authors reported that co-administration with RBC significantly reduced the number of
aspH-induced erosions and micro-bleeding, suggesting RBC confers substantial
protection against aspH-related GI injury. In a more recent study, the GI-protective
effect of CBS, and other potential agents (misoprostol and omeprazole), against gastric
injury induced by indoH was evaluated in Wistar albino rats [306].
CBS (70 mg/kg/day and 15 mg/kg/day) was administered 30 min prior to indoH
Chapter 1. Introduction
38
(5 mg/kg/day) once daily for five consecutive days. The authors report that the mean
ulcer scores achieved by CBS treatment were not significantly reduced compared to
indoH alone, although the mean ulcer scores and histopathological examination
suggests that the higher dose CBS had a greater effect than the lower dose CBS.
Pre-treatment with misoprostol (100 g/kg and 10 g/kg) or omeprazole (5 mg/kg)
were both found to significantly reduce mean ulcer scores [306].
The in situ synthesis of a 1:1 Bi-diclo complex via the addition of diclofenac
sodium to CBS aqueous solution (3:1 molar ratio, dicloH to Bi) has been
reported [300]. The study concluded that diclo coordinated through the carboxylate
moiety to Bi, although the exact composition of the complex was not established.
Unexpectedly, oral administration of the Bi-diclo complex resulted in a higher stomach
lesion index than rats treated with diclofenac sodium alone, while a physical mixture
of diclofenac sodium and CBS induced the lowest lesion index; however, no statistical
analysis was performed to validate the significance of these results. The authors
hypothesised that the ulcerogenic activity of the Bi-diclo complex arose from the
decomposition of the complex into diclo particles, which were over three times
smaller than the diclofenac sodium particles, hence allowing diclo from the
decomposed Bi(III) complex to cover a greater surface area of the stomach mucosa. If
such an observation holds merit, the stability and resultant decomposition products of
other BiNSAID complexes in gastric fluid could be understatedly important and should
be established prior to in vivo studies.
Several homoleptic Bi(III) tris-carboxylate complexes derived from the
deprotonated acids of NSAIDs have been synthesised, with the general formula
[Bi(L)3]n, where L = deprotonated 5-chlorosalicylic acid, diflH, fenbufen, fluH, ibuH,
ketoH, mefH, napH, sulindac, or tolfH [299]. Elemental analysis determined that three
NSAID moieties are present for each Bi(III) ion, while complementary infrared (IR)
and nuclear magnetic resonance (NMR) spectroscopic data suggested that Bi(III)
adopts a bidentate coordination with the NSAID ligands through the deprotonation of
the carboxylic acid moiety. Crystal structures of the complexes could not be obtained,
hence the exact structural and polymeric propensities of each of the BiNSAID
complexes has not been definitively ascertained. As such, a representation of the
prospective structures of Bi(tolf)3, Bi(mef)3 and Bi(difl)3 is shown in Figure 1.7.
The anti-bacterial activity of all ten BiNSAIDs against three laboratory strains of
H. pylori, B128, 251 and 26695, compared favourably to the anti-bacterial activity of
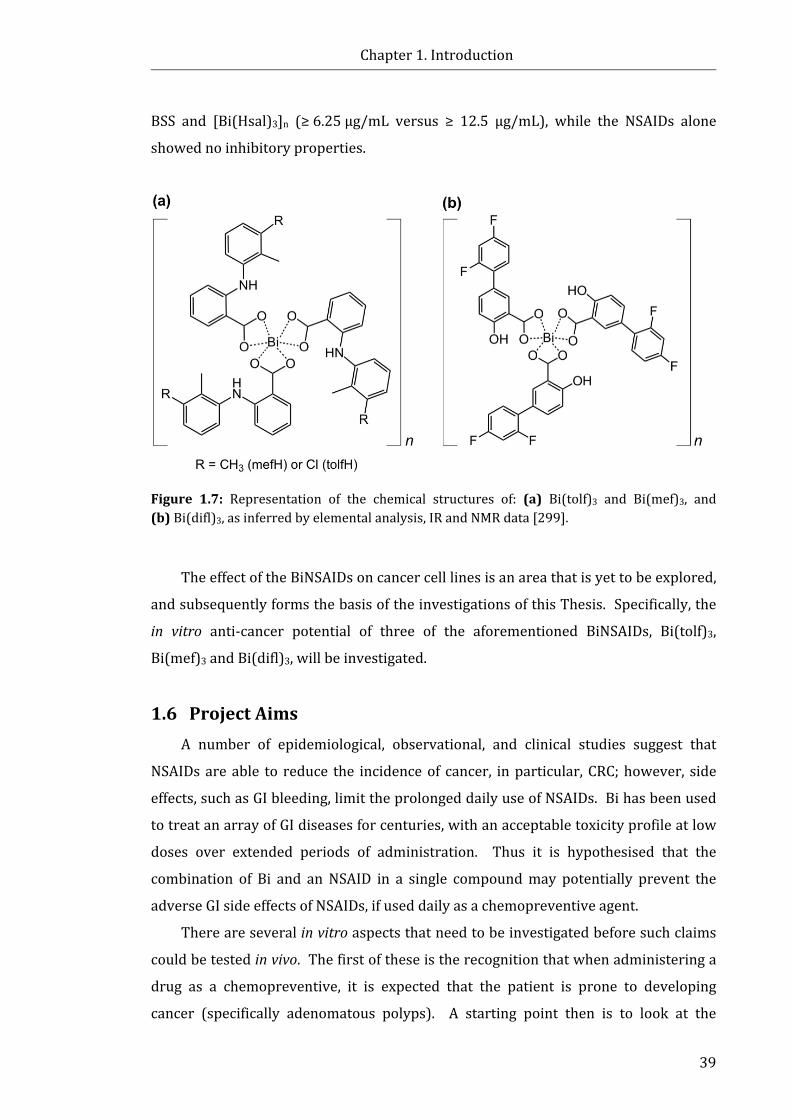
Chapter 1. Introduction
39
BSS and [Bi(Hsal)3]n (≥ 6.25 µg/mL versus ≥ 12.5 µg/mL), while the NSAIDs alone
showed no inhibitory properties.
Figure 1.7: Representation of the chemical structures of: (a) Bi(tolf)3 and Bi(mef)3, and (b) Bi(difl)3, as inferred by elemental analysis, IR and NMR data [299].
The effect of the BiNSAIDs on cancer cell lines is an area that is yet to be explored,
and subsequently forms the basis of the investigations of this Thesis. Specifically, the
in vitro anti-cancer potential of three of the aforementioned BiNSAIDs, Bi(tolf)3,
Bi(mef)3 and Bi(difl)3, will be investigated.
1.6 Project Aims A number of epidemiological, observational, and clinical studies suggest that
NSAIDs are able to reduce the incidence of cancer, in particular, CRC; however, side
effects, such as GI bleeding, limit the prolonged daily use of NSAIDs. Bi has been used
to treat an array of GI diseases for centuries, with an acceptable toxicity profile at low
doses over extended periods of administration. Thus it is hypothesised that the
combination of Bi and an NSAID in a single compound may potentially prevent the
adverse GI side effects of NSAIDs, if used daily as a chemopreventive agent.
There are several in vitro aspects that need to be investigated before such claims
could be tested in vivo. The first of these is the recognition that when administering a
drug as a chemopreventive, it is expected that the patient is prone to developing
cancer (specifically adenomatous polyps). A starting point then is to look at the

Chapter 1. Introduction
40
interaction of BiNSAIDs with transformed (cancer) cells. As the primary proposed
mechanism for chemoprevention by NSAIDs is COX-2 inhibition.
Subsequently, the overarching aim of this Thesis was to investigate the in vitro
potency and biological effects of the BiNSAID complexes, Bi(tolf)3, Bi(mef)3 and
Bi(difl)3, against a human colon cancer cell line, HCT-8, and hence the suitability of the
complexes for in vivo studies.
The specific aims of the project were to:
1. Evaluate the hydrolytic stability of the complexes in cell medium using NMR
spectroscopy to ascertain the biologically available structures of the BiNSAIDs
(Chapter 2).
2. Evaluate the in vitro drug toxicity and mode of cell death of the BiNSAIDs
compared to uncomplexed NSAIDs in HCT-8 cells (Chapter 2).
3. Assess the ability of the BiNSAIDs to inhibit the production of PGE2 by HCT-8
cells in order to determine if the complexes exhibit COX inhibition (Chapter 2).
4. Determine the cellular uptake and subcellular localisation of the BiNSAIDs in
HCT-8 cells to establish whether stability and toxicity correlated with cellular
uptake and to determine the subcellular fate of the Bi contained in the BiNSAID
complexes (Chapter 3).
5. Assess the biomolecular changes induced by BiNSAID treatment compared to
NSAIDs alone in live HCT-8 cells using synchrotron radiation infrared
microspectroscopy (SR-IRMS) (Chapter 4).
6. Examine the effects of BiNSAID- and NSAID-induced cell death on the
distribution and concentration of abundant cellular glycerophospholipids (PC,
PE, and PS) using electrospray ionisation tandem mass spectrometry (ESI-
MS/MS) (Chapter 5).
7. Evaluate the in vitro toxicity of other previously untested Bi(III) complexes of
aminoarenesulfonic acids, indole-carboxylic acids, and hydroxamic acids
against HCT-8 colon cancer cells, and determine whether complexation with Bi
improves the potency of the ligands (Chapter 6).
Chapter 1. Introduction
41
1.7 References [1] D. Hanahan and R. A. Weinberg. (2000) The hallmarks of cancer, Cell, 100, 57-70. [2] American Cancer Society. (2015) Global cancer facts & figures, 3rd Edition, Atlanta:
American Cancer Society, 1-64. [3] D. L. Worthley and B. A. Leggett. (2010) Colorectal cancer: Molecular features and
clinical opportunities, Clin. Biochem. Rev., 31, 31-38. [4] S. Kozuka, M. Nogaki, T. Ozeki and S. Masumori. (1975) Premalignancy of the
mucosal polyp in the large intestine: II. Estimation of the periods required for malignant transformation of mucosal polyps, Dis. Colon Rectum, 18, 494-500.
[5] American Cancer Society. (2011) Global cancer facts & figures, 2nd Edition, Atlanta: American Cancer Society, 1-60.
[6] J. Ferlay, I. Soerjomataram, M. Ervik, R. Dikshit, S. Eser, C. Mathers, M. Rebelo, D. Parkin, D. Forman and F. Bray, GLOBOCAN 2012 v1.0, Cancer incidence and mortality worldwide: IARC CancerBase No. 11. Available from: http://globocan.iarc.fr, [accessed: Feb. 11, 2015]
[7] Australian Institute of Health and Welfare. (2017) Cancer in Australia 2017. Cancer series no.101. Cat. no. CAN 100. Canberra: AIHW.
[8] A. Jemal, R. Siegel, E. Ward, Y. Hao, J. Xu and M. J. Thun. (2009) Cancer statistics, 2009, CA Cancer J. Clin., 59, 225-249.
[9] H. T. Lynch and A. de la Chapelle. (2003) Hereditary colorectal cancer, N. Engl. J. Med., 348, 919-932.
[10] K. Cooper, H. Squires, C. Carroll, D. Papaioannou, A. Booth, R. F. Logan, C. Maguire, D. Hind and P. Tappenden. (2010) Chemoprevention of colorectal cancer: systematic review and economic evaluation, Health Technol. Assess., 14, doi:10.3310/hta14320.
[11] American Society of Clinical Oncology. (1998) Hereditary colorectal cancer syndromes, In Cancer genetics & cancer predisposition testing, Vol. 1 (American Society of Clinical Oncology, Ed.), Alexandria (VA).
[12] O. Holme, M. Bretthauer, A. Fretheim, J. Odgaard-Jensen and G. Hoff. (2013) Flexible sigmoidoscopy versus faecal occult blood testing for colorectal cancer screening in asymptomatic individuals, Cochrane Database Syst. Rev., 9, Cd009259.
[13] D. C. Rockey, E. Paulson, D. Niedzwiecki, W. Davis, H. B. Bosworth, L. Sanders, J. Yee, J. Henderson, P. Hatten, S. Burdick, A. Sanyal, D. T. Rubin, M. Sterling, G. Akerkar, M. S. Bhutani, K. Binmoeller, J. Garvie, E. J. Bini, K. McQuaid, W. L. Foster, W. M. Thompson, A. Dachman and R. Halvorsen. (2005) Analysis of air contrast barium enema, computed tomographic colonography, and colonoscopy: prospective comparison, Lancet, 365, 305-311.
[14] C. J. Fyock and P. V. Draganov. (2010) Colonoscopic polypectomy and associated techniques, World J. Gastroenterol., 16, 3630-3637.
[15] M. Crosara Teixeira, M. I. Braghiroli, J. Sabbaga and P. M. Hoff. (2014) Primary prevention of colorectal cancer: myth or reality?, World J. Gastroenterol., 20, 15060-15069.
[16] D. Yona and N. Arber. (2006) Coxibs and cancer prevention, J. Cardiovasc. Pharmacol., 47, 76-81.
[17] Australian Medicines Handbook 2017 (online) (2017) NSAIDs. Adelaide: Australian Medicines Handbook Pty Ltd, Available from: https://amhonline.amh.net.au/ [accessed: Nov. 4, 2017]
[18] J. R. Vane. (1971) Inhibition of prostaglandin synthesis as a mechanism of action for aspirin-like drugs, Nat. New Biol., 231, 232-235.
[19] G. Singh. (2000) Gastrointestinal complications of prescription and over-the-counter nonsteroidal anti-inflammatory drugs: a view from the ARAMIS database. Arthritis, Rheumatism, and Aging Medical Information System, Am. J. Ther., 7, 115-121.
Chapter 1. Introduction
42
[20] Retail & Provider Perspective, National Prescription Audit, 1999 – 2000. Plymouth, PA: IMS Health, 2000.
[21] J. G. Mahdi. (2010) Medicinal potential of willow: A chemical perspective of aspirin discovery, J. Saudi Chem. Soc., 14, 317-322.
[22] J. Kolbe. (1874) Synthesis of salicylic acid, Prakt. Chem., 118, 107. [23] T. J. Rinsema. (1999) One hundred years of aspirin, Med. Hist., 43, 502-507. [24] K. Brune and B. Hinz. (2004) The discovery and development of antiinflammatory
drugs, Arthritis Rheum., 50, 2391-2399. [25] C. S. Boynton, C. F. Dick and G. H. Mayor. (1988) NSAIDs: an overview, J. Clin.
Pharmacol., 28, 512-517. [26] T. D. Warner, F. Giuliano, I. Vojnovic, A. Bukasa, J. A. Mitchell and J. R. Vane. (1999)
Nonsteroid drug selectivities for cyclo-oxygenase-1 rather than cyclo-oxygenase-2 are associated with human gastrointestinal toxicity: a full in vitro analysis, Proc. Natl. Acad. Sci. U.S.A., 96, 7563-7568.
[27] J. A. Mitchell, P. Akarasereenont, C. Thiemermann, R. J. Flower and J. R. Vane. (1993) Selectivity of nonsteroidal antiinflammatory drugs as inhibitors of constitutive and inducible cyclooxygenase, Proc. Natl. Acad. Sci. U.S.A., 90, 11693-11697.
[28] S. Xu, C. A. Rouzer and L. J. Marnett. (2014) Oxicams, a class of nonsteroidal anti-inflammatory drugs and beyond, IUBMB Life, 66, 803-811.
[29] L. Churchill, A. G. Graham, C.-K. Shih, D. Pauletti, P. R. Farina and P. M. Grob. (1996) Selective inhibition of human cyclo-oxygenase-2 by meloxicam, Inflammopharmacology, 4, 125-135.
[30] R. J. Flower. (2003) The development of COX2 inhibitors, Nat. Rev. Drug Discov., 2, 179-191.
[31] J. E. Weder, C. T. Dillon, T. W. Hambley, B. J. Kennedy, P. A. Lay, J. R. Biffin, H. L. Regtop and N. M. Davies. (2002) Copper complexes of non-steroidal anti-inflammatory drugs: an opportunity yet to be realized, Coord. Chem. Rev., 232, 95-126.
[32] S. H. Ferreira, S. Moncada and J. R. Vane. (1971) Indomethacin and aspirin abolish prostaglandin release from the spleen, Nat. New Biol., 231, 237-239.
[33] W. L. Xie, J. G. Chipman, D. L. Robertson, R. L. Erikson and D. L. Simmons. (1991) Expression of a mitogen-responsive gene encoding prostaglandin synthase is regulated by mRNA splicing, Proc. Natl. Acad. Sci. U.S.A., 88, 2692-2696.
[34] D. A. Kujubu, B. S. Fletcher, B. C. Varnum, R. W. Lim and H. R. Herschman. (1991) TIS10, a phorbol ester tumor promoter-inducible mRNA from Swiss 3T3 cells, encodes a novel prostaglandin synthase/cyclooxygenase homologue, J. Biol. Chem., 266, 12866-12872.
[35] B. S. Fletcher, D. A. Kujubu, D. M. Perrin and H. R. Herschman. (1992) Structure of the mitogen-inducible TIS10 gene and demonstration that the TIS10-encoded protein is a functional prostaglandin G/H synthase, J. Biol. Chem., 267, 4338-4344.
[36] J. C. Otto and W. L. Smith. (1994) The orientation of prostaglandin endoperoxide synthases-1 and -2 in the endoplasmic reticulum, J. Biol. Chem., 269, 19868-19875.
[37] I. Morita, M. Schindler, M. K. Regier, J. C. Otto, T. Hori, D. L. DeWitt and W. L. Smith. (1995) Different intracellular locations for prostaglandin endoperoxide H synthase-1 and -2, J. Biol. Chem., 270, 10902-10908.
[38] J. R. Vane, Y. S. Bakhle and R. M. Botting. (1998) Cycloxygenases 1 and 2, Ann. Rev. Pharmacol. Toxicol., 38, 97-120.
[39] W. L. Smith, R. M. Garavito and D. L. DeWitt. (1996) Prostaglandin endoperoxide H synthases (cyclooxygenases)-1 and -2, J. Biol. Chem., 271, 33157-33160.
[40] K. Yamagata, K. I. Andreasson, W. E. Kaufmann, C. A. Barnes and P. F. Worley. (1993) Expression of a mitogen-inducible cyclooxygenase in brain neurons: regulation by synaptic activity and glucocorticoids, Neuron, 11, 371-386.

Chapter 1. Introduction
43
[41] R. C. Harris, J. A. McKanna, Y. Akai, H. R. Jacobson, R. N. Dubois and M. D. Breyer. (1994) Cyclooxygenase-2 is associated with the macula densa of rat kidney and increases with salt restriction, J. Clin. Invest., 94, 2504-2510.
[42] N. V. Chandrasekharan, H. Dai, K. L. T. Roos, N. K. Evanson, J. Tomsik, T. S. Elton and D. L. Simmons. (2002) COX-3, a cyclooxygenase-1 variant inhibited by acetaminophen and other analgesic/antipyretic drugs: Cloning, structure, and expression, Proc. Natl. Acad. Sci. U.S.A., 99, 13926-13931.
[43] B. Kis, J. A. Snipes and D. W. Busija. (2005) Acetaminophen and the cyclooxygenase-3 puzzle: sorting out facts, fictions, and uncertainties, J. Pharmacol. Exp. Ther., 315, 1-7.
[44] A. L. Blobaum and L. J. Marnett. (2007) Structural and functional basis of cyclooxygenase inhibition, J. Med. Chem., 50, 1425-1441.
[45] E. Ricciotti and G. A. FitzGerald. (2011) Prostaglandins and inflammation, Arterioscler. Thromb. Vasc. Biol., 31, 986-1000.
[46] A. S. Kalgutkar and J. S. Daniels. (2010) Carboxylic acids and their bioisosteres, In Metabolism, pharmacokinetics, and toxicity of functional groups: impact of the building blocks of medicinal chemistry in ADMET (D. A. Smith, Ed.), pp 99-167, Royal Society of Chemistry.
[47] G. J. Roth and C. J. Siok. (1978) Acetylation of the NH2-terminal serine of prostaglandin synthetase by aspirin, J. Biol. Chem., 253, 3782-3784.
[48] L. P. Wennogle, H. Liang, J. C. Quintavalla, B. R. Bowen, J. Wasvary, D. B. Miller, A. Allentoff, W. Boyer, M. Kelly and P. Marshall. (1995) Comparison of recombinant cyclooxygenase-2 to native isoforms: aspirin labeling of the active site, FEBS Lett., 371, 315-320.
[49] V. Evangelista, S. Manarini, A. Di Santo, M. L. Capone, E. Ricciotti, L. Di Francesco, S. Tacconelli, A. Sacchetti, S. D’Angelo, A. Scilimati, M. G. Sciulli and P. Patrignani. (2006) De novo synthesis of cyclooxygenase-1 counteracts the suppression of platelet thromboxane biosynthesis by aspirin, Circ. Res., 98, 593-595.
[50] M. J. Thun, S. J. Henley and C. Patrono. (2002) Nonsteroidal anti-inflammatory drugs as anticancer agents: mechanistic, pharmacologic, and clinical issues, J. Natl. Cancer Inst., 94, 252-266.
[51] T. Narisawa, M. Sato, M. Tani, T. Kudo, T. Takahashi and A. Goto. (1981) Inhibition of development of methylnitrosourea-induced rat colon tumors by indomethacin treatment, Cancer Res., 41, 1954-1957.
[52] W. R. Waddell and R. W. Loughry. (1983) Sulindac for polyposis of the colon, J. Surg. Oncol., 24, 83-87.
[53] W. R. Waddell, G. F. Ganser, E. J. Cerise and R. W. Loughry. (1989) Sulindac for polyposis of the colon, Am. J. Surg., 157, 175-179.
[54] H. J. R. Bussey. (1975) Familial polyposis coli: family studies, histopathology, differential diagnosis, and results of treatment, 1-104, Johns Hopkins University Press.
[55] N. N. Mahmoud, A. J. Dannenberg, J. Mestre, R. T. Bilinski, M. R. Churchill, C. Martucci, H. Newmark and M. M. Bertagnolli. (1998) Aspirin prevents tumors in a murine model of familial adenomatous polyposis, Surgery, 124, 225-231.
[56] S. K. Boolbol, A. J. Dannenberg, A. Chadburn, C. Martucci, X. J. Guo, J. T. Ramonetti, M. Abreu-Goris, H. L. Newmark, M. L. Lipkin, J. J. DeCosse and M. M. Bertagnolli. (1996) Cyclooxygenase-2 overexpression and tumor formation are blocked by sulindac in a murine model of familial adenomatous polyposis, Cancer Res., 56, 2556-2560.
[57] C. H. Chiu, M. F. McEntee and J. Whelan. (1997) Sulindac causes rapid regression of preexisting tumors in Min/+ mice independent of prostaglandin biosynthesis, Cancer Res., 57, 4267-4273.
Chapter 1. Introduction
44
[58] R. F. Jacoby, K. Seibert, C. E. Cole, G. Kelloff and R. A. Lubet. (2000) The cyclooxygenase-2 inhibitor celecoxib is a potent preventive and therapeutic agent in the min mouse model of adenomatous polyposis, Cancer Res., 60, 5040-5044.
[59] J. Burn, D. T. Bishop, P. D. Chapman, F. Elliott, L. Bertario, M. G. Dunlop, D. Eccles, A. Ellis, D. G. Evans, R. Fodde, E. R. Maher, G. Möslein, H. F. A. Vasen, J. Coaker, R. K. S. Phillips, S. Bülow and J. C. Mathers. (2011) A randomized placebo-controlled prevention trial of aspirin and/or resistant starch in young people with familial adenomatous polyposis, Cancer Prev. Res., 4, 655-665.
[60] D. Labayle, D. Fischer, P. Vielh, F. Drouhin, A. Pariente, C. Bories, O. Duhamel, M. Trousset and P. Attali. (1991) Sulindac causes regression of rectal polyps in familial adenomatous polyposis, Gastroenterology, 101, 635-639.
[61] F. M. Giardiello, S. R. Hamilton, A. J. Krush, S. Piantadosi, L. M. Hylind, P. Celano, S. V. Booker, C. R. Robinson and G. J. Offerhaus. (1993) Treatment of colonic and rectal adenomas with sulindac in familial adenomatous polyposis, N. Engl. J. Med., 328, 1313-1316.
[62] K. P. Nugent, K. C. R. Farmer, A. D. Spigelman, C. B. Williams and R. K. S. Phillips. (1993) Randomized controlled trial of the effect of sulindac on duodenal and rectal polyposis and cell proliferation in patients with familial adenomatous polyposis, Br. J. Surg., 80, 1618-1619.
[63] F. M. Giardiello, V. W. Yang, L. M. Hylind, A. J. Krush, G. M. Petersen, J. D. Trimbath, S. Piantadosi, E. Garrett, D. E. Geiman, W. Hubbard, G. J. A. Offerhaus and S. R. Hamilton. (2002) Primary chemoprevention of familial adenomatous polyposis with sulindac, N. Engl. J. Med., 346, 1054-1059.
[64] G. Steinbach, P. M. Lynch, R. K. Phillips, M. H. Wallace, E. Hawk, G. B. Gordon, N. Wakabayashi, B. Saunders, Y. Shen, T. Fujimura, L. K. Su, B. Levin, L. Godio, S. Patterson, M. A. Rodriguez-Bigas, S. L. Jester, K. L. King, M. Schumacher, J. Abbruzzese, R. N. DuBois, W. N. Hittelman, S. Zimmerman, J. W. Sherman and G. Kelloff. (2000) The effect of celecoxib, a cyclooxygenase-2 inhibitor, in familial adenomatous polyposis, N. Engl. J. Med., 342, 1946-1952.
[65] S. L. Patterson, K. Colbert Maresso and E. Hawk. (2013) Cancer chemoprevention: successes and failures, Clin. Chem., 59, 94-101.
[66] J. Burn, A.-M. Gerdes, F. Macrae, J.-P. Mecklin, G. Moeslein, S. Olschwang, D. Eccles, D. G. Evans, E. R. Maher, L. Bertario, M.-L. Bisgaard, M. G. Dunlop, J. W. C. Ho, S. V. Hodgson, A. Lindblom, J. Lubinski, P. J. Morrison, V. Murday, R. Ramesar, L. Side, R. J. Scott, H. J. W. Thomas, H. F. Vasen, G. Barker, G. Crawford, F. Elliott, M. Movahedi, K. Pylvanainen, J. T. Wijnen, R. Fodde, H. T. Lynch, J. C. Mathers and D. T. Bishop. (2011) Long-term effect of aspirin on cancer risk in carriers of hereditary colorectal cancer: an analysis from the CAPP2 randomised controlled trial, Lancet, 378, 2081-2087.
[67] R. S. Sandler, S. Halabi, J. A. Baron, S. Budinger, E. Paskett, R. Keresztes, N. Petrelli, J. M. Pipas, D. D. Karp, C. L. Loprinzi, G. Steinbach and R. Schilsky. (2003) A randomized trial of aspirin to prevent colorectal adenomas in patients with previous colorectal cancer, N. Engl. J. Med., 348, 883-890.
[68] M. M. Bertagnolli, C. J. Eagle, A. G. Zauber, M. Redston, S. D. Solomon, K. Kim, J. Tang, R. B. Rosenstein, J. Wittes, D. Corle, T. M. Hess, G. M. Woloj, F. Boisserie, W. F. Anderson, J. L. Viner, D. Bagheri, J. Burn, D. C. Chung, T. Dewar, T. R. Foley, N. Hoffman, F. Macrae, R. E. Pruitt, J. R. Saltzman, B. Salzberg, T. Sylwestrowicz, G. B. Gordon, E. T. Hawk and A. P. C. S. Investigators. (2006) Celecoxib for the prevention of sporadic colorectal adenomas, N. Engl. J. Med., 355, 873-884.
[69] A. M. Algra and P. M. Rothwell. (2012) Effects of regular aspirin on long-term cancer incidence and metastasis: a systematic comparison of evidence from observational studies versus randomised trials, Lancet Oncol., 13, 518-527.
Chapter 1. Introduction
45
[70] P. H. Gann, J. E. Manson, R. J. Glynn, J. E. Buring and C. H. Hennekens. (1993) Low-dose aspirin and incidence of colorectal tumors in a randomized trial, J. Natl. Cancer Inst., 85, 1220-1224.
[71] N. R. Cook, I. M. Lee, J. M. Gaziano, D. Gordon, P. M. Ridker, J. E. Manson, C. H. Hennekens and J. E. Buring. (2005) Low-dose aspirin in the primary prevention of cancer: the Women's Health Study: a randomized controlled trial, JAMA, 294, 47-55.
[72] M. J. Thun, E. J. Jacobs and C. Patrono. (2012) The role of aspirin in cancer prevention, Nat. Rev. Clin. Oncol., 9, 259-267.
[73] P. M. Rothwell, F. G. Fowkes, J. F. Belch, H. Ogawa, C. P. Warlow and T. W. Meade. (2011) Effect of daily aspirin on long-term risk of death due to cancer: analysis of individual patient data from randomised trials, Lancet, 377, 31-41.
[74] P. M. Rothwell, J. F. Price, F. G. Fowkes, A. Zanchetti, M. C. Roncaglioni, G. Tognoni, R. Lee, J. F. Belch, M. Wilson, Z. Mehta and T. W. Meade. (2012) Short-term effects of daily aspirin on cancer incidence, mortality, and non-vascular death: analysis of the time course of risks and benefits in 51 randomised controlled trials, Lancet, 379, 1602-1612.
[75] P. M. Rothwell, M. Wilson, J. F. Price, J. F. Belch, T. W. Meade and Z. Mehta. (2012) Effect of daily aspirin on risk of cancer metastasis: a study of incident cancers during randomised controlled trials, Lancet, 379, 1591-1601.
[76] U.S. Preventive Services Task Force. (2007) Routine aspirin or nonsteroidal anti-inflammatory drugs for the primary prevention of colorectal cancer: Preventive Services Task Force Recommendation Statement, Ann. Intern. Med., 146, 361-364.
[77] U.S. Preventive Services Task Force (2014) Final recommendation statement: Aspirin/NSAIDs for prevention of colorectal cancer: Preventive medication, Available from: http://www.uspreventiveservicestaskforce.org/Page/Document/ RecommendationStatementFinal/aspirin-nsaids-for-prevention-of-colorectal-cancer-preventive-medication, [accessed: Aug. 15, 2016]
[78] C. E. Eberhart, R. J. Coffey, A. Radhika, F. M. Giardiello, S. Ferrenbach and R. N. DuBois. (1994) Up-regulation of cyclooxygenase 2 gene expression in human colorectal adenomas and adenocarcinomas, Gastroenterology, 107, 1183-1188.
[79] S. L. Kargman, G. P. O'Neill, P. J. Vickers, J. F. Evans, J. A. Mancini and S. Jothy. (1995) Expression of prostaglandin G/H synthase-1 and -2 protein in human colon cancer, Cancer Res., 55, 2556-2559.
[80] H. Sano, Y. Kawahito, R. L. Wilder, A. Hashiramoto, S. Mukai, K. Asai, S. Kimura, H. Kato, M. Kondo and T. Hla. (1995) Expression of cyclooxygenase-1 and -2 in human colorectal cancer, Cancer Res., 55, 3785-3789.
[81] R. A. Soslow, A. J. Dannenberg, D. Rush, B. M. Woerner, K. N. Khan, J. Masferrer and A. T. Koki. (2000) COX-2 is expressed in human pulmonary, colonic, and mammary tumors, Cancer, 89, 2637-2645.
[82] D. K. Petkova, C. Clelland, J. Ronan, L. Pang, J. M. Coulson, S. Lewis and A. J. Knox. (2004) Overexpression of cyclooxygenase-2 in non-small cell lung cancer, Respir. Med., 98, 164-172.
[83] R. Yoshimura, H. Sano, M. Mitsuhashi, M. Kohno, J. Chargui and S. Wada. (2001) Expression of cyclooxygenase-2 in patients with bladder carcinoma, J. Urol., 165, 1468-1472.
[84] C. Costa, R. Soares, J. S. Reis-Filho, D. Leitão, I. Amendoeira and F. C. Schmitt. (2002) Cyclo-oxygenase 2 expression is associated with angiogenesis and lymph node metastasis in human breast cancer, J. Clin. Pathol., 55, 429-434.
[85] B. S. Zweifel, T. W. Davis, R. L. Ornberg and J. L. Masferrer. (2002) Direct evidence for a role of cyclooxygenase 2-derived prostaglandin E2 in human head and neck xenograft tumors, Cancer Res., 62, 6706-6711.
[86] G. Ferrandina, L. Lauriola, G. F. Zannoni, A. Fagotti, F. Fanfani, F. Legge, N. Maggiano, M. Gessi, S. Mancuso, F. O. Ranelletti and G. Scambia. (2002) Increased
Chapter 1. Introduction
46
cyclooxygenase-2 (COX-2) expression is associated with chemotherapy resistance and outcome in ovarian cancer patients, Ann. Oncol., 13, 1205-1211.
[87] C. Bocca, M. Ievolella, R. Autelli, M. Motta, L. Mosso, B. Torchio, F. Bozzo, S. Cannito, C. Paternostro, S. Colombatto, M. Parola and A. Miglietta. (2014) Expression of Cox-2 in human breast cancer cells as a critical determinant of epithelial-to-mesenchymal transition and invasiveness, Expert Opin. Ther. Targets, 18, 121-135.
[88] A. Ristimaki, A. Sivula, J. Lundin, M. Lundin, T. Salminen, C. Haglund, H. Joensuu and J. Isola. (2002) Prognostic significance of elevated cyclooxygenase-2 expression in breast cancer, Cancer Res., 62, 632-635.
[89] E. Fosslien. (2000) Biochemistry of cyclooxygenase (COX)-2 inhibitors and molecular pathology of COX-2 in neoplasia, Crit. Rev. Clin. Lab. Sci., 37, 431-502.
[90] R. N. DuBois, J. Shao, M. Tsujii, H. Sheng and R. Daniel Beauchamp. (1996) G1 delay in cells overexpressing prostaglandin endoperoxide synthase-2, Cancer Res., 56, 733-737.
[91] B. Liu, L. Qu and S. Yan. (2015) Cyclooxygenase-2 promotes tumor growth and suppresses tumor immunity, Cancer Cell Int., 15, 106-111.
[92] T. O. Daniel, H. Liu, J. D. Morrow, B. C. Crews and L. J. Marnett. (1999) Thromboxane A2 is a mediator of cyclooxygenase-2-dependent endothelial migration and angiogenesis, Cancer Res., 59, 4574-4577.
[93] F. Cianchi, C. Cortesini, O. Fantappie, L. Messerini, I. Sardi, N. Lasagna, F. Perna, V. Fabbroni, A. Di Felice, G. Perigli, R. Mazzanti and E. Masini. (2004) Cyclooxygenase-2 activation mediates the proangiogenic effect of nitric oxide in colorectal cancer, Clin. Cancer Res., 10, 2694-2704.
[94] J.-H. Lee, M. S. Piao, J.-Y. Choi, S. J. Yun, J.-B. Lee and S.-C. Lee. (2013) Up-regulation of cyclooxygenase 2 and matrix metalloproteinases-2 and -9 in cutaneous squamous cell carcinoma: active role of inflammation and tissue remodeling in carcinogenesis, Ann. Dermatol., 25, 145-151.
[95] M. Stolina, S. Sharma, Y. Lin, M. Dohadwala, B. Gardner, J. Luo, L. Zhu, M. Kronenberg, P. W. Miller, J. Portanova, J. C. Lee and S. M. Dubinett. (2000) Specific inhibition of cyclooxygenase 2 restores antitumor reactivity by altering the balance of IL-10 and IL-12 synthesis, J. Immunol. Methods, 164, 361-370.
[96] M. Tsujii, S. Kawano, S. Tsuji, H. Sawaoka, M. Hori and R. N. DuBois. (1998) Cyclooxygenase regulates angiogenesis induced by colon cancer cells, Cell, 93, 705-716.
[97] M. Tsujii, S. Kawano and R. N. DuBois. (1997) Cyclooxygenase-2 expression in human colon cancer cells increases metastatic potential, Proc. Natl. Acad. Sci. U.S.A., 94, 3336-3340.
[98] T. A. Chan, P. J. Morin, B. Vogelstein and K. W. Kinzler. (1998) Mechanisms underlying nonsteroidal antiinflammatory drug-mediated apoptosis, Proc. Natl. Acad. Sci. U.S.A., 95, 681-686.
[99] K. M. Leahy, R. L. Ornberg, Y. Wang, B. S. Zweifel, A. T. Koki and J. L. Masferrer. (2002) Cyclooxygenase-2 inhibition by celecoxib reduces proliferation and induces apoptosis in angiogenic endothelial cells in vivo, Cancer Res., 62, 625-631.
[100] R. Hanif, A. Pittas, Y. Feng, M. I. Koutsos, L. Qiao, L. Staiano-Coico, S. I. Shiff and B. Rigas. (1996) Effects of nonsteroidal anti-inflammatory drugs on proliferation and on induction of apoptosis in colon cancer cells by a prostaglandin-independent pathway, Biochem. Pharmacol., 52, 237-245.
[101] D. J. Elder, D. E. Halton, A. Hague and C. Paraskeva. (1997) Induction of apoptotic cell death in human colorectal carcinoma cell lines by a cyclooxygenase-2 (COX-2)-selective nonsteroidal anti-inflammatory drug: independence from COX-2 protein expression, Clin. Cancer Res., 3, 1679-1683.
[102] S. Grösch, I. Tegeder, E. Niederberger, L. Bräutigam and G. Geisslinger. (2001) COX-2 independent induction of cell cycle arrest and apoptosis in colon cancer cells by the selective COX-2 inhibitor celecoxib, FASEB J, 15, 2742-2744.
Chapter 1. Introduction
47
[103] G. A. Piazza, A. L. K. Rahm, M. Krutzsch, G. Sperl, N. S. Paranka, P. H. Gross, K. Brendel, R. W. Burt, D. S. Alberts, R. Pamukcu and D. J. Ahnen. (1995) Antineoplastic drugs sulindac sulfide and sulfone inhibit cell growth by inducing apoptosis, Cancer Res., 55, 3110-3116.
[104] H. Kusuhara, H. Matsuyuki, M. Matsuura, T. Imayoshi, T. Okumoto and H. Matsui. (1998) Induction of apoptotic DNA fragmentation by nonsteroidal anti-inflammatory drugs in cultured rat gastric mucosal cells, Eur. J. Pharmacol., 360, 273-280.
[105] G. Farrugia and R. Balzan. (2013) The proapoptotic effect of traditional and novel nonsteroidal anti-inflammatory drugs in mammalian and yeast cells, Oxid. Med. Cell Longev., 2013, doi:10.1155/2013/504230.
[106] J. L. Liggett, X. Zhang, T. E. Eling and S. J. Baek. (2014) Anti-tumor activity of non-steroidal anti-inflammatory drugs: cyclooxygenase-independent targets, Cancer Lett., 346, 217-224.
[107] U. S. Akarca. (2005) Gastrointestinal effects of selective and non-selective non-steroidal anti-inflammatory drugs, Curr. Pharm. Des., 11, 1779-1793.
[108] C. Patrono , L. A. García Rodríguez , R. Landolfi and C. Baigent (2005) Low-dose aspirin for the prevention of atherothrombosis, N. Engl. J. Med., 353, 2373-2383.
[109] X.-M. Xu, L. Sansores-Garcia, X.-M. Chen, N. Matijevic-Aleksic, M. Du and K. K. Wu. (1999) Suppression of inducible cyclooxygenase 2 gene transcription by aspirin and sodium salicylate, Proc. Natl. Acad. Sci. U.S.A., 96, 5292-5297.
[110] H. Raza and A. John. (2012) Implications of altered glutathione metabolism in aspirin-induced oxidative stress and mitochondrial dysfunction in HepG2 cells, PLoS One, 7, e36325.
[111] M. Marchetti, L. Resnick, E. Gamliel, S. Kesaraju, H. Weissbach and D. Binninger. (2009) Sulindac enhances the killing of cancer cells exposed to oxidative stress, PLoS One, 4, e5804.
[112] H. Kusuhara, H. Komatsu, H. Sumichika and K. Sugahara. (1999) Reactive oxygen species are involved in the apoptosis induced by nonsteroidal anti-inflammatory drugs in cultured gastric cells, Eur. J. Pharmacol., 383, 331-337.
[113] J. W. Chang, S. U. Kang, J. W. Choi, Y. S. Shin, S. J. Baek, S. H. Lee and C. H. Kim. (2014) Tolfenamic acid induces apoptosis and growth inhibition in anaplastic thyroid cancer: Involvement of nonsteroidal anti-inflammatory drug-activated gene-1 expression and intracellular reactive oxygen species generation, Free Radic. Biol. Med., 67, 115-130.
[114] S. Dihlmann, A. Siermann and M. von Knebel Doeberitz. (2001) The nonsteroidal anti-inflammatory drugs aspirin and indomethacin attenuate beta-catenin/TCF-4 signaling, Oncogene, 20, 645-653.
[115] M. Cho, J. Gwak, S. Park, J. Won, D.-E. Kim, S. S. Yea, I.-J. Cha, T. K. Kim, J.-G. Shin and S. Oh. (2005) Diclofenac attenuates Wnt/β-catenin signaling in colon cancer cells by activation of NF-κB, FEBS Lett., 579, 4213-4218.
[116] M. F. McEntee, C. H. Chiu and J. Whelan. (1999) Relationship of beta-catenin and Bcl-2 expression to sulindac-induced regression of intestinal tumors in Min mice, Carcinogenesis, 20, 635-640.
[117] L. Qiao, S. J. Shiff and B. Rigas. (1998) Sulindac sulfide alters the expression of cyclin proteins in HT-29 colon adenocarcinoma cells, Int. J. Cancer, 76, 99-104.
[118] X. Zhang, S. H. Lee, K. W. Min, M. F. McEntee, J. B. Jeong, Q. Li and S. J. Baek. (2013) The involvement of endoplasmic reticulum stress in the suppression of colorectal tumorigenesis by tolfenamic acid, Cancer Prev. Res., 6, 1337-1347.
[119] N. Babbar, Eugene W. Gerner and Robert A. Casero. (2006) Induction of spermidine/spermine N(1)-acetyltransferase (SSAT) by aspirin in Caco-2 colon cancer cells, Biochem. J., 394, 317-324.

Chapter 1. Introduction
48
[120] N. Babbar, N. A. Ignatenko, R. A. Casero, Jr. and E. W. Gerner. (2003) Cyclooxygenase-independent induction of apoptosis by sulindac sulfone is mediated by polyamines in colon cancer, J. Biol. Chem., 278, 47762-47775.
[121] L. Turchanowa, N. Dauletbaev, V. Milovic and J. Stein. (2001) Nonsteroidal anti-inflammatory drugs stimulate spermidine/spermine acetyltransferase and deplete polyamine content in colon cancer cells, Eur. J. Clin. Invest., 31, 887-893.
[122] P. Dikshit, M. Chatterjee, A. Goswami, A. Mishra and N. R. Jana. (2006) Aspirin induces apoptosis through the inhibition of proteasome function, J. Biol. Chem., 281, 29228-29235.
[123] Y. Oida, B. Gopalan, R. Miyahara, S. Inoue, C. D. Branch, A. M. Mhashilkar, E. Lin, B. N. Bekele, J. A. Roth, S. Chada and R. Ramesh. (2005) Sulindac enhances adenoviral vector expressing mda-7/IL-24-mediated apoptosis in human lung cancer, Mol. Cancer Ther., 4, 291-304.
[124] M. Lu, A. Strohecker, F. Chen, T. Kwan, J. Bosman, V. C. Jordan and V. L. Cryns. (2008) Aspirin sensitizes cancer cells to TRAIL-induced apoptosis by reducing survivin levels, Clin. Cancer Res., 14, 3168-3176.
[125] U. T. Sankpal, M. Abdelrahim, S. F. Connelly, C. M. Lee, R. Madero-Visbal, J. Colon, J. Smith, S. Safe, P. Maliakal and R. Basha. (2012) Small molecule tolfenamic acid inhibits PC-3 cell proliferation and invasion in vitro, and tumor growth in orthotopic mouse model for prostate cancer, Prostate, 72, 1648-1658.
[126] E. Kopp and S. Ghosh. (1994) Inhibition of NF-kappa B by sodium salicylate and aspirin, Science, 265, 956-959.
[127] Y. Yamamoto, M. J. Yin, K. M. Lin and R. B. Gaynor. (1999) Sulindac inhibits activation of the NF-kappaB pathway, J. Biol. Chem., 274, 27307-27314.
[128] E. J. Greenspan, J. P. Madigan, L. A. Boardman and D. W. Rosenberg. (2011) Ibuprofen inhibits activation of nuclear β-catenin in human colon adenomas and induces the phosphorylation of GSK-3β, Cancer Prev. Res., 4, 161-171.
[129] S. Setia and S. N. Sanyal. (2012) Downregulation of NF-kappaB and PCNA in the regulatory pathways of apoptosis by cyclooxygenase-2 inhibitors in experimental lung cancer, Mol. Cell Biochem., 369, 75-86.
[130] J. B. Jeong, X. Yang, R. Clark, J. Choi, S. J. Baek and S. H. Lee. (2013) A mechanistic study of the proapoptotic effect of tolfenamic acid: involvement of NF-kappaB activation, Carcinogenesis, 34, 2350-2360.
[131] S. R. Im and Y. J. Jang. (2012) Aspirin enhances TRAIL-induced apoptosis via regulation of ERK1/2 activation in human cervical cancer cells, Biochem. Biophys. Res. Commun., 424, 65-70.
[132] Y.-C. Ou, C.-R. Yang, C.-L. Cheng, S.-L. Raung, Y.-Y. Hung and C.-J. Chen. (2007) Indomethacin induces apoptosis in 786-O renal cell carcinoma cells by activating mitogen-activated protein kinases and AKT, Eur. J. Pharmacol., 563, 49-60.
[133] B. Bellosillo, M. Pique, M. Barragan, E. Castano, N. Villamor, D. Colomer, E. Montserrat, G. Pons and J. Gil. (1998) Aspirin and salicylate induce apoptosis and activation of caspases in B-cell chronic lymphocytic leukemia cells, Blood, 92, 1406-1414.
[134] X. M. Zhou, B. C. Y. Wong, X. M. Fan, H. B. Zhang, M. C. M. Lin, H. F. Kung, D. M. Fan and S. K. Lam. (2001) Non-steroidal anti-inflammatory drugs induce apoptosis in gastric cancer cells through up-regulation of bax and bak, Carcinogenesis, 22, 1393-1397.
[135] H. Weiss, A. Amberger, M. Widschwendter, R. Margreiter, D. Ofner and P. Dietl. (2001) Inhibition of store-operated calcium entry contributes to the anti-proliferative effect of non-steroidal anti-inflammatory drugs in human colon cancer cells, Int. J. Cancer, 92, 877-882.
[136] D. H. Woo, I. S. Han and G. Jung. (2004) Mefenamic acid-induced apoptosis in human liver cancer cell-lines through caspase-3 pathway, Life Sci., 75, 2439-2449.
Chapter 1. Introduction
49
[137] M. Suwalsky, M. Manrique-Moreno, J. Howe, K. Brandenburg and F. Villena. (2011) Molecular interactions of mefenamic acid with lipid bilayers and red blood cells, J. Braz. Chem. Soc., 22, 2243-2249.
[138] A. Sade, S. Tunçay, İ. Çimen, F. Severcan and S. Banerjee. (2012) Celecoxib reduces fluidity and decreases metastatic potential of colon cancer cell lines irrespective of COX-2 expression, Biosci. Rep., 32, 35-44.
[139] E. S. Choi, J. H. Shim, J. Y. Jung, H. J. Kim, K. H. Choi, J. A. Shin, J. S. Nam, N. P. Cho and S. D. Cho. (2011) Apoptotic effect of tolfenamic acid in androgen receptor-independent prostate cancer cell and xenograft tumor through specificity protein 1, Cancer Sci., 102, 742-748.
[140] T. J. Jang, N. I. Kim and C. H. Lee. (2006) Proapoptotic activity of NAG-1 is cell type specific and not related to COX-2 expression, Apoptosis, 11, 1131-1138.
[141] E. M. Van Lieshout, D. M. Tiemessen, H. M. Roelofs and W. H. Peters. (1998) Nonsteroidal anti-inflammatory drugs enhance glutathione S-transferase theta levels in rat colon, Biochim. Biophys. Acta, 1381, 305-311.
[142] M. M. Wolfe, D. R. Lichtenstein and G. Singh. (1999) Gastrointestinal toxicity of nonsteroidal antiinflammatory drugs, N. Engl. J. Med., 340, 1888-1899.
[143] G.-H. Kim. (2008) Renal effects of prostaglandins and cyclooxygenase-2 inhibitors, Electrolytes Blood Press., 6, 35-41.
[144] T. D. Warner, S. Nylander and C. Whatling. (2011) Anti-platelet therapy: cyclo-oxygenase inhibition and the use of aspirin with particular regard to dual anti-platelet therapy, Br. J. Clin. Pharmacol., 72, 619-633.
[145] G. A. FitzGerald (2004) Coxibs and Cardiovascular Disease, N. Engl. J. Med., 351, 1709-1711.
[146] R. S. Bresalier, R. S. Sandler, H. Quan, J. A. Bolognese, B. Oxenius, K. Horgan, C. Lines, R. Riddell, D. Morton, A. Lanas, M. A. Konstam and J. A. Baron. (2005) Cardiovascular events associated with rofecoxib in a colorectal adenoma chemoprevention trial, N. Engl. J. Med., 352, 1092-1102.
[147] S. D. Solomon, J. J. McMurray, M. A. Pfeffer, J. Wittes, R. Fowler, P. Finn, W. F. Anderson, A. Zauber, E. Hawk and M. Bertagnolli. (2005) Cardiovascular risk associated with celecoxib in a clinical trial for colorectal adenoma prevention, N. Engl. J. Med., 352, 1071-1080.
[148] B. Sibbald. (2004) Rofecoxib (Vioxx) voluntarily withdrawn from market, CMAJ, 171, 1027-1028.
[149] U.S. Food and Drug Administration Information for Healthcare Professionals: Celecoxib (marketed as Celebrex). FDA Alert: 4/7/2005, Available from: http://www.fda.gov/Drugs/DrugSafety/PostmarketDrugSafetyInformationforPatientsandProviders/ucm124655.htm, [accessed: Sept. 5, 2016]
[150] P. McGettigan and D. Henry. (2013) Use of non-steroidal anti-inflammatory drugs that elevate cardiovascular risk: an examination of sales and essential medicines lists in low-, middle-, and high-income countries, PLoS Med., 10, e1001388.
[151] P. Geusens and W. Lems. (2008) Efficacy and tolerability of lumiracoxib, a highly selective cyclo-oxygenase-2 (COX2) inhibitor, in the management of pain and osteoarthritis, Ther. Clin. Risk Manag., 4, 337-344.
[152] G. P. Aithal and C. P. Day. (2007) Nonsteroidal anti-inflammatory drug-induced hepatotoxicity, Clin. Liver Dis., 11, 563-575.
[153] F. Bessone. (2010) Non-steroidal anti-inflammatory drugs: what is the actual risk of liver damage?, World J. Gastroenterol., 16, 5651-5661.
[154] J. L. Williams, S. Borgo, I. Hasan, E. Castillo, F. Traganos and B. Rigas. (2001) Nitric oxide-releasing nonsteroidal anti-inflammatory drugs (NSAIDs) alter the kinetics of human colon cancer cell lines more effectively than traditional NSAIDs: implications for colon cancer chemoprevention, Cancer Res., 61, 3285-3289.
[155] L. Huang, G. G. Mackenzie, Y. Sun, N. Ouyang, G. Xie, K. Vrankova, D. Komninou and B. Rigas. (2011) Chemotherapeutic properties of phospho-nonsteroidal anti-

Chapter 1. Introduction
50
inflammatory drugs, a new class of anticancer compounds, Cancer Res., 71, 7617-7627.
[156] M. Chattopadhyay, R. Kodela, N. Nath, Y. M. Dastagirzada, C. A. Velázquez-Martínez, D. Boring and K. Kashfi. (2012) Hydrogen sulfide-releasing NSAIDs inhibit the growth of human cancer cells: a general property and evidence of a tissue type-independent effect, Biochem. Pharmacol., 83, 715-722.
[157] S. A. Laufer, J. Augustin, G. Dannhardt and W. Kiefer. (1994) (6,7-diaryldihydropyrrolizin-5-yl)acetic acids, a novel class of potent dual inhibitors of both cyclooxygenase and 5-lipoxygenase, J. Med. Chem., 37, 1894-1897.
[158] S. Barbey, L. Goossens, T. Taverne, J. Cornet, V. Choesmel, C. Rouaud, G. Gimeno, S. Yannic-Arnoult, C. Michaux, C. Charlier, R. Houssin and J. P. Henichart. (2002) Synthesis and activity of a new methoxytetrahydropyran derivative as dual cyclooxygenase-2/5-lipoxygenase inhibitor, Bioorg. Med. Chem. Lett., 12, 779-782.
[159] Q.-H. Chen, P. N. Praveen Rao and E. E. Knaus. (2006) Synthesis and biological evaluation of a novel class of rofecoxib analogues as dual inhibitors of cyclooxygenases (COXs) and lipoxygenases (LOXs), Bioorg. Med. Chem., 14, 7898-7909.
[160] M. V. Reddy, V. K. Billa, V. R. Pallela, M. R. Mallireddigari, R. Boominathan, J. L. Gabriel and E. P. Reddy. (2008) Design, synthesis, and biological evaluation of 1-(4-sulfamylphenyl)-3-trifluoromethyl-5-indolyl pyrazolines as cyclooxygenase-2 (COX-2) and lipoxygenase (LOX) inhibitors, Bioorg. Med. Chem., 16, 3907-3916.
[161] A. Andrade, S. F. Namora, R. G. Woisky, G. Wiezel, R. Najjar, J. A. A. Sertié and D. de Oliveira Silva. (2000) Synthesis and characterization of a diruthenium–ibuprofenato complex: Comparing its anti-inflammatory activity with that of a copper(II)–ibuprofenato complex, J. Inorg. Biochem., 81, 23-27.
[162] A. M. Bonin, J. A. Yanez, C. Fukuda, X. W. Teng, C. T. Dillon, T. W. Hambley, P. A. Lay and N. M. Davies. (2010) Inhibition of experimental colorectal cancer and reduction in renal and gastrointestinal toxicities by copper-indomethacin in rats, Cancer Chemother. Pharmacol., 66, 755-764.
[163] C. T. Dillon, T. W. Hambley, B. J. Kennedy, P. A. Lay, Q. Zhou, N. M. Davies, J. R. Biffin and H. L. Regtop. (2003) Gastrointestinal toxicity, antiinflammatory activity, and superoxide dismutase activity of copper and zinc complexes of the antiinflammatory drug indomethacin, Chem. Res. Toxicol., 16, 28-37.
[164] N. K. Jain, A. Singh and S. K. Kulkarni. (1999) Analgesic, anti-inflammatory and ulcerogenic activity of a zinc-naproxen complex in mice and rats, Pharm. Pharmacol. Commun., 5, 599-602.
[165] M. A. Kale, R. Shelke and R. B. Nawale. (2014) Zinc-aceclofenac complex: Synthesis, hydrolysis study and anti-inflammatory studies, Curr. Med. Chem. Anti Inflamm. Anti Allergy Agents, 13, 36-44.
[166] M. Konstandinidou, A. Kourounakis, M. Yiangou, L. Hadjipetrou, D. Kovala-Demertzi, S. Hadjikakou and M. Demertzis. (1998) Anti-inflammatory properties of diclofenac transition metalloelement complexes, J. Inorg. Biochem., 70, 63-69.
[167] D. Kovala-Demertzi, D. Hadjipavlou-Litina, A. Primikiri, M. Staninska, C. Kotoglou and M. A. Demertzis. (2009) Anti-inflammatory, antiproliferative, and radical-scavenging activities of tolfenamic acid and its metal complexes, Chem. Biodivers., 6, 948-960.
[168] D. Kovala-Demertzi, D. Hadjipavlou-Litina, M. Staninska, A. Primikiri, C. Kotoglou and M. A. Demertzis. (2009) Anti-oxidant, in vitro, in vivo anti-inflammatory activity and antiproliferative activity of mefenamic acid and its metal complexes with manganese(II), cobalt(II), nickel(II), copper(II) and zinc(II), J. Enzym. Inhib. Med. Ch., 24, 742-752.
[169] A. K. Singla and H. Wadhwa. (1995) Zinc-indomethacin complex: Synthesis, physicochemical and biological evaluation in the rat, Int. J. Pharm., 120, 145-155.
Chapter 1. Introduction
51
[170] C. Dendrinou-Samara, G. Tsotsou, L. V. Ekateriniadou, A. H. Kortsaris, C. P. Raptopoulou, A. Terzis, D. A. Kyriakidis and D. P. Kessissoglou. (1998) Anti-inflammatory drugs interacting with Zn(II), Cd(II) and Pt(II) metal ions, J. Inorg. Biochem., 71, 171-179.
[171] A. A. H. S. Al-Janabi. (2010) Elevation of antidermatophytic action of mefenamic acid by cobalt ions, Indian J. Pharmacol., 42, 351-353.
[172] H. Chiniforoshan, L. Tabrizi, M. Hadizade, M. R. Sabzalian, A. N. Chermahini and M. Rezapour. (2014) Anti-inflammatory drugs interacting with Zn (II) metal ion based on thiocyanate and azide ligands: synthesis, spectroscopic studies, DFT calculations and antibacterial assays, Spectrochim. Acta Mol. Biomol. Spectrosc., 128, 183-190.
[173] A. Jalal, S. Shahzadi, K. Shahid, S. Ali, A. Badshah, M. Mazhar and K. M. Khan. (2004) Preparation, spectroscopic studies and biological activity of mono-organotin (IV) derivatives of non-steroidal anti-inflammatory drugs, Turk. J. Chem., 28, 629-644.
[174] S. Shahzadi, K. Shahid, S. Ali, M. Mazhar, A. Badshah, E. Ahmed and A. Malik. (2005) Non-steroidal anti-inflammatory drugs (NSAIDs) as donor ligands in organotin(IV) derivatives: Synthesis, spectroscopic characterization and biological applications, Turk. J. Chem., 29, 273-287.
[175] L. Tabrizi, H. Chiniforoshan, P. McArdle, M. Ebrahimi and T. Khayamian. (2015) A novel bioactive Cd(II) polymeric complex with mefenamic acid: Synthesis, crystal structure and biological evaluations, Inorg. Chim. Acta, 432, 176-184.
[176] G. Tamasi, C. Bernini, G. Corbini, N. F. Owens, L. Messori, F. Scaletti, L. Massai, P. L. Giudice and R. Cini. (2014) Synthesis, spectroscopic and DFT structural characterization of two novel ruthenium(III) oxicam complexes. In vivo evaluation of anti-inflammatory and gastric damaging activities, J. Inorg. Biochem., 134, 25-35.
[177] V. Dokorou, A. Primikiri and D. Kovala-Demertzi. (2011) The triphenyltin(VI) complexes of NSAIDs and derivatives. Synthesis, crystal structure and antiproliferative activity. Potent anticancer agents, J. Inorg. Biochem., 105, 195-201.
[178] D. Kovala-Demertzi, M. Staninska, I. Garcia-Santos, A. Castineiras and M. A. Demertzis. (2011) Synthesis, crystal structures and spectroscopy of meclofenamic acid and its metal complexes with manganese(II), copper(II), zinc(II) and cadmium(II). Antiproliferative and superoxide dismutase activity, J. Inorg. Biochem., 105, 1187-1195.
[179] L. Tabrizi, H. Chiniforoshan and P. McArdle. (2015) Synthesis, crystal structure and spectroscopy of bioactive Cd(II) polymeric complex of the non-steroidal anti-inflammatory drug diclofenac sodium: Antiproliferative and biological activity, Spectrochim. Acta Mol. Biomol. Spectrosc., 136, 429-436.
[180] G. Tamasi, M. Casolaro, A. Magnani, A. Sega, L. Chiasserini, L. Messori, C. Gabbiani, S. M. Valiahdi, M. A. Jakupec, B. K. Keppler, M. B. Hursthouse and R. Cini. (2010) New platinum–oxicam complexes as anti-cancer drugs. Synthesis, characterization, release studies from smart hydrogels, evaluation of reactivity with selected proteins and cytotoxic activity in vitro, J. Inorg. Biochem., 104, 799-814.
[181] E. Păunescu, S. McArthur, M. Soudani, R. Scopelliti and P. J. Dyson. (2016) Nonsteroidal anti-inflammatory—organometallic anticancer compounds, Inorg. Chem., 55, 1788-1808.
[182] L. Dyakova, D.-C. Culita, T. Zhivkova, M. Georgieva, R. Kalfin, G. Miloshev, M. Alexandrov, G. Marinescu, L. Patron and R. Alexandrova. (2015) 3d metal complexes with meloxicam as therapeutic agents in the fight against human glioblastoma multiforme and cervical carcinoma, Biotechnol. Biotechnol. Equip., 29, 1190-1200.
[183] P. Christofis, M. Katsarou, A. Papakyriakou, Y. Sanakis, N. Katsaros and G. Psomas. (2005) Mononuclear metal complexes with piroxicam: synthesis, structure and biological activity, J. Inorg. Biochem., 99, 2197-2210.
Chapter 1. Introduction
52
[184] F. Dimiza, F. Perdih, V. Tangoulis, I. Turel, D. P. Kessissoglou and G. Psomas. (2011) Interaction of copper(II) with the non-steroidal anti-inflammatory drugs naproxen and diclofenac: Synthesis, structure, DNA- and albumin-binding, J. Inorg. Biochem., 105, 476-489.
[185] S. Fountoulaki, F. Perdih, I. Turel, D. P. Kessissoglou and G. Psomas. (2011) Non-steroidal anti-inflammatory drug diflunisal interacting with Cu(II). Structure and biological features, J. Inorg. Biochem., 105, 1645-1655.
[186] C. Tolia, A. N. Papadopoulos, C. P. Raptopoulou, V. Psycharis, C. Garino, L. Salassa and G. Psomas. (2013) Copper(II) interacting with the non-steroidal antiinflammatory drug flufenamic acid: Structure, antioxidant activity and binding to DNA and albumins, J. Inorg. Biochem., 123, 53-65.
[187] A. Tarushi, C. P. Raptopoulou, V. Psycharis, D. P. Kessissoglou, A. N. Papadopoulos and G. Psomas. (2014) Structure and biological perspectives of Cu(II)–indomethacin complexes, J. Inorg. Biochem., 140, 185-198.
[188] F. Dimiza, A. N. Papadopoulos, V. Tangoulis, V. Psycharis, C. P. Raptopoulou, D. P. Kessissoglou and G. Psomas. (2010) Biological evaluation of non-steroidal anti-inflammatory drugs-cobalt(II) complexes, Dalton Trans., 39, 4517-4528.
[189] F. Dimiza, A. N. Papadopoulos, V. Tangoulis, V. Psycharis, C. P. Raptopoulou, D. P. Kessissoglou and G. Psomas. (2012) Biological evaluation of cobalt(II) complexes with non-steroidal anti-inflammatory drug naproxen, J. Inorg. Biochem., 107, 54-64.
[190] S. Tsiliou, L.-A. Kefala, F. Perdih, I. Turel, D. P. Kessissoglou and G. Psomas. (2012) Cobalt(II) complexes with non-steroidal anti-inflammatory drug tolfenamic acid: Structure and biological evaluation, Eur. J. Med. Chem., 48, 132-142.
[191] A. Tarushi, S. Perontsis, A. G. Hatzidimitriou, A. N. Papadopoulos, D. P. Kessissoglou and G. Psomas. (2015) Copper(II) complexes with the non-steroidal anti-inflammatory drug tolfenamic acid: Structure and biological features, J. Inorg. Biochem., 149, 68-79.
[192] M. Kyropoulou, C. P. Raptopoulou, V. Psycharis and G. Psomas. (2013) Ni(II) complexes with non-steroidal anti-inflammatory drug diclofenac: Structure and interaction with DNA and albumins, Polyhedron, 61, 126-136.
[193] M. Zampakou, V. Tangoulis, C. P. Raptopoulou, V. Psycharis, A. N. Papadopoulos and G. Psomas. (2015) Structurally diverse manganese(II)–diclofenac complexes showing enhanced antioxidant activity and affinity to serum albumins in comparison to sodium diclofenac, Eur. J. Inorg. Chem., 2285-2294.
[194] X. Totta, A. A. Papadopoulou, A. G. Hatzidimitriou, A. Papadopoulos and G. Psomas. (2015) Synthesis, structure and biological activity of nickel(II) complexes with mefenamato and nitrogen-donor ligands, J. Inorg. Biochem., 145, 79-93.
[195] P. Tsiliki, F. Perdih, I. Turel and G. Psomas. (2013) Structure, DNA- and albumin-binding of the manganese(II) complex with the non-steroidal antiinflammatory drug niflumic acid, Polyhedron, 53, 215-222.
[196] S. Chakraborty, E. Sehanobish and M. Sarkar. (2012) Binding of Cu(II) complexes of oxicam NSAIDs to alternating AT and homopolymeric AT sequences: differential response to variation in backbone structure, J. Biol. Inorg. Chem., 17, 475-487.
[197] I. Pais and J. Benton Jones Jr. (1997) The handbook of trace elements, CRC Press, Boca Raton.
[198] G. G. Briand and N. Burford. (1999) Bismuth compounds and preparations with biological or medicinal relevance, Chem. Rev., 99, 2601-2658.
[199] A. C. Ford, P. Malfertheiner, M. Giguere, J. Santana, M. Khan and P. Moayyedi. (2008) Adverse events with bismuth salts for Helicobacter pylori eradication: Systematic review and meta-analysis, World J. Gastroenterol., 14, 7361-7370.
[200] D. M. Keogan and D. M. Griffith. (2014) Current and potential applications of bismuth-based drugs, Molecules, 19, 15258-15297.
Chapter 1. Introduction
53
[201] N. Yang and H. Sun. (2011) Biological chemistry of antimony and bismuth, In Biological chemistry of arsenic, antimony and bismuth (H. Sun, Ed.), pp 53-81, John Wiley & Sons, Ltd.
[202] P. J. Sadler, C. Munice and M. A. Shipman. (2007) Chapter Vll metals in medicine, In Biological Inorganic Chemistry Structure & Reactivity (I. Bertini, H. B. Gray, E. I. Stiefel and J. S. Valentine, Eds.), pp 95-135, University Science Books, California.
[203] L. Odier. (1786) J. Med. Chir. Pharm., 68, 49-56. [204] P. J. Sadler, H. Li and H. Sun. (1999) Coordination chemistry of metals in medicine:
target sites for bismuth, Coord. Chem. Rev., 185-186, 689-709. [205] P. C. Andrews, G. B. Deacon, C. M. Forsyth, P. C. Junk, I. Kumar and M. Maguire.
(2006) Towards a structural understanding of the anti-ulcer and anti-gastritis drug bismuth subsalicylate, Angew. Chem. Int. Ed., 45, 5638-5642.
[206] W. Li, L. Jin, N. Zhu, X. Hou, F. Deng and H. Sun. (2003) Structure of colloidal bismuth subcitrate (CBS) in dilute HCl: unique assembly of bismuth citrate dinuclear units ([Bi(cit)2Bi]2-), J. Am. Chem. Soc., 125, 12408-12409.
[207] P. A. Bezdetko, N. Sergienko, Y. Dyomin, A. Korol, N. Nikitin, M. Merzbacher, D. Groß and R. Kohnen. (2012) Successful treatment of blepharitis with bibrocathol (Posiformin(®) 2 %), Graefes Arch. Clin. Exp. Ophthalmol., 250, 1869-1875.
[208] W. Modell. (2013) Drugs in current use 1958, 22-23, Springer, Berlin Heidelberg. [209] B. W. Sippy. (1915) Gastric and duodenal ulcer: Medical cure by an efficient
removal of gastric juice corrosion, JAMA, 64, 1625–1630. [210] O. M. Gruhzit, E. Lyons and R. Perkins. (1927) Bismuth thioglycollate in
experimental and clinical treatment of syphilis, Arch. Derm. Syphilol., 15, 550-567. [211] W. F. Schwartz. (1939) The effect of Thio-Bismol on therapeutic malaria,
J. Pharmacol. Exp. Ther., 65, 175-184. [212] J. E. Fenton, A. W. Blayney and T. P. O'Dwyer. (1995) Bismuth subgallate – its role
in tonsillectomy, J. Laryngol. Otol., 109, 203-205. [213] The Parthenon Co. Inc. (2016) Devrom®, Available from: http://devrom.com,
[accessed: May 25, 2016] [214] J. R. Lambert and P. Midolo. (1997) The actions of bismuth in the treatment of
Helicobacter pylori infection, Aliment. Pharmacol. Ther., 11, 27-33. [215] I. Wilhelmsen, R. Weberg, K. Berstad, T. Hausken, O. Hundal and A. Berstad. (1994)
Helicobacter pylori eradication with bismuth subnitrate, oxytetracycline and metronidazole in patients with peptic ulcer disease, Hepatogastroenterology, 41, 43-47.
[216] A. F. Carvalho, L. A. Fiorelli, V. N. C. Jorge, C. M. F. Da Silva, G. De Nucci, J. G. P. Ferraz and J. Pedrazzoli. (1998) Addition of bismuth subnitrate to omeprazole plus amoxycillin improves eradication of Helicobacter pylori, Aliment. Pharmacol. Ther., 12, 557-561.
[217] S. Tefera, A. Berstad, C. Bang, G. Nesæter, J. Hatlebakk, S. Olafsson, L. Nesje, T. Hausken, K. Berstad and Ø. Hundal. (1996) Bismuth-based combination therapy for Helicobacter pylori-associated peptic ulcer disease (metronidazole for eradication, ranitidine for pain), Am. J. Gastroenterol., 91, 935-941.
[218] E. G. Stieglitz. (1930) Bismuth subnitrate in the treatment of arterial hypertension, JAMA, 95, 842-846.
[219] R. Morison. (1916) The treatment of infected suppurating war wounds, Lancet, 2, 268-272.
[220] D. Figueroa-Quintanilla, E. Salazar-Lindo, R. B. Sack, R. Leon-Barua, S. Sarabia-Arce, M. Campos-Sanchez and E. Eyzaguirre-Maccan. (1993) A controlled trial of bismuth subsalicylate in infants with acute watery diarrheal disease, N. Engl. J. Med., 328, 1653-1658.
[221] R. Steffen, H. L. DuPont, R. Heusser, A. Helminger, F. Witassek, M. D. Manhart and M. Schär. (1986) Prevention of traveler's diarrhea by the tablet form of bismuth subsalicylate, Antimicrob. Agents Chemother., 29, 625-627.
Chapter 1. Introduction
54
[222] D. Y. Graham, G. M. Lew, D. G. Evans, D. J. Evans, Jr. and P. D. Klein. (1991) Effect of triple therapy (antibiotics plus bismuth) on duodenal ulcer healing. A randomized controlled trial, Ann. Intern. Med., 115, 266-269.
[223] R. J. Hopkins. (1997) Current FDA-approved treatments for Helicobacter pylori and the FDA approval process, Gastroenterology, 113, 126-130.
[224] J. Y. Kang, H. H. Tay, A. Wee, R. Guan, M. V. Math and I. Yap. (1990) Effect of colloidal bismuth subcitrate on symptoms and gastric histology in non-ulcer dyspepsia. A double blind placebo controlled study, Gut, 31, 476-480.
[225] G. N. Tytgat. (1987) Colloidal bismuth subcitrate in peptic ulcer - a review, Digestion, 37, 31-41.
[226] S. J. Konturek, T. Radecki, I. Piastucki and D. Drozdowicz. (1987) Studies on the gastroprotective and ulcer-healing effects of colloidal bismuth subcitrate, Digestion, 37, 8-15.
[227] C. D. Giacomo, R. Fiocca, L. Villani, L. Lisato, G. Licardi, N. Diegoli, A. Donadini and G. Maggiore. (1990) Helicobacter pylori infection and chronic gastritis: Clinical, serological, and histologic correlations in children treated with amoxicillin and colloidal bismuth subcitrate, J. Pediatr. Gastroenterol. Nutr., 11, 310-316.
[228] DeRoyal Industries Inc. Xeroform petrolatum wound dressing, Available from: http://www.deroyal.com/medicalproducts/woundcare/product.aspx?id=wc-genwound-xeroform, [accessed: May 25, 2016]
[229] W. L. Peterson, A. A. Ciociola, D. L. Sykes, D. J. McSorley, D. D. Webb and The RBC H. Pylori Study Group. (1996) Ranitidine bismuth citrate plus clarithromycin is effective for healing duodenal ulcers, eradicating H. pylori and reducing ulcer recurrence, Aliment. Pharmacol. Ther., 10, 251-261.
[230] Y. Yang, R. Ouyang, L. Xu, N. Guo, W. Li, K. Feng, L. Ouyang, Z. Yang, S. Zhou and Y. Miao. (2015) Review: Bismuth complexes: synthesis and applications in biomedicine, J. Coord. Chem., 68, 379-397.
[231] T. Murafuji, Y. Miyoshi, M. Ishibashi, A. F. Mustafizur Rahman, Y. Sugihara, I. Miyakawa and H. Uno. (2004) Antifungal activity of organobismuth compounds against the yeast Saccharomyces cerevisiae: structure-activity relationship, J. Inorg. Biochem., 98, 547-552.
[232] N. Yang, J. A. Tanner, B. J. Zheng, R. M. Watt, M. L. He, L. Y. Lu, J. Q. Jiang, K. T. Shum, Y. P. Lin, K. L. Wong, M. C. Lin, H. F. Kung, H. Sun and J. D. Huang. (2007) Bismuth complexes inhibit the SARS coronavirus, Angew. Chem. Int. Ed., 46, 6464-6468.
[233] N. Yang, J. A. Tanner, Z. Wang, J. D. Huang, B. J. Zheng, N. Zhu and H. Sun. (2007) Inhibition of SARS coronavirus helicase by bismuth complexes, Chem. Commun., 4413-4415.
[234] P. C. Andrews, V. L. Blair, R. L. Ferrero, P. C. Junk, L. Kedzierski and R. M. Peiris. (2014) Bismuth(III) beta-thioxoketonates as antibiotics against Helicobacter pylori and as anti-leishmanial agents, Dalton Trans., 43, 1279-1291.
[235] P. C. Andrews, R. Frank, P. C. Junk, L. Kedzierski, I. Kumar and J. G. MacLellan. (2011) Anti-Leishmanial activity of homo- and heteroleptic bismuth(III) carboxylates, J. Inorg. Biochem., 105, 454-461.
[236] M. L. Gomes, G. DeFreitas-Silva, P. G. dos Reis, M. N. Melo, F. Frezard, C. Demicheli and Y. M. Idemori. (2015) Synthesis and characterization of bismuth(III) and antimony(V) porphyrins: high antileishmanial activity against antimony-resistant parasite, J. Biol. Inorg. Chem., 20, 771-779.
[237] P. T. Reynolds. (2012) Bismuth toxicity: A rare cause of neurologic dysfunction, Int. J. Clin. Med., 3, 46-48.
[238] H. Sun, H. Li and P. J. Sadler. (1997) The biological and medicinal chemistry of bismuth, Chem. Ber./Recueil, 130, 669-668.
[239] W. Hespe, H. J. M. Staal and D. W. R. Hall. (1988) Bismuth absorption from the colloidal subcitrate, Lancet, 332, 1258.

Chapter 1. Introduction
55
[240] H. Sun, H. Li, A. B. Mason, R. C. Woodworth and P. J. Sadler. (2001) Competitive binding of bismuth to transferrin and albumin in aqueous solution and in blood plasma, J. Biol. Chem., 276, 8829-8835.
[241] H. Li, P. J. Sadler and H. Sun. (1996) Unexpectedly strong binding of a large metal ion (Bi3+) to human serum transferrin, J. Biol. Chem., 271, 9483-9489.
[242] L. Zhang, K. Y. Szeto, W. B. Wong, T. T. Loh, P. J. Sadler and H. Sun. (2001) Interactions of bismuth with human lactoferrin and recognition of the BiIII-lactoferrin complex by intestinal cells, Biochemistry, 40, 13281-13287.
[243] H. Sun and K. Y. Szeto. (2003) Binding of bismuth to serum proteins: implication for targets of Bi(III) in blood plasma, J. Inorg. Biochem., 94, 114-120.
[244] N. Yang and H. Sun. (2007) Biocoordination chemistry of bismuth: recent advances, Coord. Chem. Rev., 251, 2354-2366.
[245] A. T. Miles, G. M. Hawksworth, J. H. Beattie and V. Rodilla. (2000) Induction, regulation, degradation, and biological significance of mammalian metallothioneins, Crit. Rev. Biochem. Mol. Biol., 35, 35-70.
[246] H. Sun, H. Li, I. Harvey and P. J. Sadler. (1999) Interactions of bismuth complexes with metallothionein(II), J. Biol. Chem., 274, 29094-29101.
[247] P. J. Boogaard, A. Slikkerveer, J. F. Nagelkerke and G. J. Mulder. (1991) The role of metallothionein in the reduction of cisplatin-induced nephrotoxicity by Bi3+-pretreatment in the rat in vivo and in vitro. Are antioxidant properties of metallothionein more relevant than platinum binding?, Biochem. Pharmacol., 41, 369-375.
[248] M. Satoh, Y. Aoki and C. Tohyama. (1997) Protective role of metallothionein in renal toxicity of cisplatinum, Cancer Chemother. Pharmacol., 40, 358-362.
[249] M. Stoltenberg, G. Danscher, R. Pamphlett, M. M. Christensen and J. Rungby. (2000) Histochemical tracing of bismuth in testis from rats exposed intraperitoneally to bismuth subnitrate, Reprod. Toxicol., 14, 65-71.
[250] M. Stoltenberg and G. Danscher. (2000) Histochemical differentiation of autometallographically traceable metals (Au, Ag, Hg, Bi, Zn): protocols for chemical removal of separate autometallographic metal clusters in epon sections, Histochem. J., 32, 645-652.
[251] M. Stoltenberg, J. A. Hogenhuis, J. J. Hauw and G. Danscher. (2001) Autometallographic tracing of bismuth in human brain autopsies, J. Neuropathol. Exp. Neurol., 60, 705-710.
[252] M. Stoltenberg, J. D. Schionning and G. Danscher. (2001) Retrograde axonal transport of bismuth: an autometallographic study, Acta Neuropathol., 101, 123-128.
[253] N. E. Magnusson, A. Larsen, J. Rungby, M. Kruhoffer, T. F. Orntoft and M. Stoltenberg. (2005) Gene expression changes induced by bismuth in a macrophage cell line, Cell Tissue Res., 321, 195-210.
[254] H. Sun, L. Zhang and K. Y. Szeto. (2004) Bismuth in medicine, Met. Ions Biol. Syst., 41, 333-378.
[255] F. Thomas, B. Bialek and R. Hensel. (2011) Medical use of bismuth: the two sides of the coin, J. Clin. Toxicol., S:3, doi:10.4172/2161-0495.s4173-4004.
[256] E. Asato, K. Katsura, M. Mikuriya, U. Turpeinen, I. Mutikainen and J. Reedijk. (1995) Synthesis, structure, and spectroscopic properties of bismuth citrate compounds and the bismuth-containing ulcer-healing agent colloidal bismuth subcitrate (CBS). 4. crystal structure and solution behavior of a unique dodecanuclear cluster (NH4)12[Bi12O8(cit)8](H2O)10, Inorg. Chem., 34, 2447-2454.
[257] C. Tasman-Jones, C. Maher, L. Thomsen, S. P. Lee and M. Vanderwee. (1987) Mucosal defences and gastroduodenal disease, Digestion, 37 Suppl 2, 1-7.
[258] D. Bagchi, O. R. Carryl, M. X. Tran, R. L. Krohn, D. J. Bagchi, A. Garg, M. Bagchi, S. Mitra and S. J. Stohs. (1998) Stress, diet and alcohol-induced oxidative
Chapter 1. Introduction
56
gastrointestinal mucosal injury in rats and protection by bismuth subsalicylate, J. Appl. Toxicol., 18, 3-13.
[259] D. Bagchi, T. R. McGinn, X. Ye, J. Balmoori, M. Bagchi, S. J. Stohs, C. A. Kuszynski, O. R. Carryl and S. Mitra. (1999) Mechanism of gastroprotection by bismuth subsalicylate against chemically induced oxidative stress in cultured human gastric mucosal cells, Dig. Dis. Sci., 44, 2419-2428.
[260] W. Beil, S. Bierbaum and K.-F. Sewing. (1993) Studies of the mechanism of action of collodial bismuth subcitrate, Pharmacology, 47, 141-144.
[261] J. H. Baron, J. Barr, J. Batten, R. Sidebotham and J. Spencer. (1986) Acid, pepsin, and mucus secretion in patients with gastric and duodenal ulcer before and after colloidal bismuth subcitrate (De-Nol), Gut, 27, 486-490.
[262] S. J. Konturek, A. Dembinski, Z. Warzecha, W. Bielanski, T. Brzozowski and D. Drozdowicz. (1988) Epidermal growth factor (EGF) in the gastroprotective and ulcer healing actions of colloidal bismuth subcitrate (De-Nol) in rats, Gut, 29, 894-902.
[263] B. L. Slomiany, X. Y. Wang, D. Palecz, K. Okazaki and A. Slomiany. (1990) Participation of phosphoinositides in gastric mucosal protection by colloidal bismuth subcitrate against ethanol-induced injury, Alcohol. Clin. Exp. Res., 14, 580-583.
[264] J. Gilster, K. Bacon, K. Marlink, B. Sheppard, C. Deveney and M. Rutten. (2004) Bismuth subsalicylate increases intracellular Ca2+, MAP-kinase activity, and cell proliferation in normal human gastric mucous epithelial cells, Dig. Dis. Sci., 49, 370-378.
[265] B. J. Marshall and J. R. Warren. (1984) Unidentified curved bacilli in the stomach of patients with gastritis and peptic ulceration, Lancet, 1, 1311-1315.
[266] IARC Working Group on the Evaluation of Carcinogenic Risks to Humans. (1994) Schistosomes, liver flukes and Helicobacter pylori, Volume 61. Lyon, France: IARC.
[267] R. M. Peek, Jr. and M. J. Blaser. (2002) Helicobacter pylori and gastrointestinal tract adenocarcinomas, Nat. Rev. Cancer, 2, 28-37.
[268] F. Mégraud. (2012) The challenge of Helicobacter pylori resistance to antibiotics: the comeback of bismuth-based quadruple therapy, Therap. Adv. Gastroenterol., 5, 103-109.
[269] C. W. Stratton, R. R. Warner, P. E. Coudron and N. A. Lilly. (1999) Bismuth-mediated disruption of the glycocalyx-cell wall of Helicobacter pylori: ultrastructural evidence for a mechanism of action for bismuth salts, J. Antimicrob. Chemother., 43, 659-666.
[270] T. E. Sox and C. A. Olson. (1989) Binding and killing of bacteria by bismuth subsalicylate, Antimicrob. Agents Chemother., 33, 2075-2082.
[271] L. Zhang, S. B. Mulrooney, A. F. Leung, Y. Zeng, B. B. Ko, R. P. Hausinger and H. Sun. (2006) Inhibition of urease by bismuth(III): implications for the mechanism of action of bismuth drugs, Biometals, 19, 503-511.
[272] L. Jin, K. Y. Szeto, L. Zhang, W. Du and H. Sun. (2004) Inhibition of alcohol dehydrogenase by bismuth, J. Inorg. Biochem., 98, 1331-1337.
[273] O. Senkovich, S. Ceaser, D. J. McGee and T. L. Testerman. (2010) Unique host iron utilization mechanisms of Helicobacter pylori revealed with iron-deficient chemically defined media, Infect. Immun., 78, 1841-1849.
[274] H. A. Song, C. S. Kang, K. E. Baidoo, D. E. Milenic, Y. Chen, A. Dai, M. W. Brechbiel and H.-S. Chong. (2011) An efficient bifunctional decadentate ligand 3p-C-DEPA for targeted alpha radioimmunotherapy applications, Bioconjugate Chem., 22, 1128-1135.
[275] M. Cherel, S. Gouard, J. Gaschet, C. Sai-Maurel, F. Bruchertseifer, A. Morgenstern, M. Bourgeois, J. F. Gestin, F. K. Bodere, J. Barbet, P. Moreau and F. Davodeau. (2013) 213Bi radioimmunotherapy with an anti-mCD138 monoclonal antibody in a murine model of multiple myeloma, J. Nucl. Med., 54, 1597-1604.
Chapter 1. Introduction
57
[276] J. M. Kinsella, R. E. Jimenez, P. P. Karmali, A. M. Rush, V. R. Kotamraju, N. C. Gianneschi, E. Ruoslahti, D. Stupack and M. J. Sailor. (2011) X-ray computed tomography imaging of breast cancer by using targeted peptide-labeled bismuth sulfide nanoparticles, Angew. Chem. Int. Ed., 50, 12308-12311.
[277] J. T. Chen, Y. Kurokawa, K. Nakayama, K. Saito, K. Sakamoto, K. Fukuda, Y. Hirai, T. Hamada, I. Fujimoto and K. Yamauchi. (1987) The effect of bismuth subnitrate on cisplatin toxicity, J. Jpn. Obstet. Gynecol. Soc., 39, 815-822.
[278] T. Morikawa and E. Kawamura. (1989) A method of cisplatin administration with the aid of high-dose bismuth subnitrate, and their pharmacokinetics, Jpn. J. Cancer Chemother., 16, 1094-1098.
[279] Y. Kondo, M. Satoh, N. Imura and M. Akimoto. (1992) Tissue-specific induction of metallothionein by bismuth as a promising protocol for chemotherapy with repeated administration of cis-diamminedichloroplatinum (II) against bladder tumor, Anticancer Res., 12, 2303-2307.
[280] A. Naganuma, M. Satoh and N. Imura. (1988) Specific reduction of toxic side effects of adriamycin by induction of metallothionein in mice, Jpn. J. Cancer Res., 79, 406-411.
[281] M. Satoh, A. Naganuma and N. Imura. (1988) Metallothionein induction prevents toxic side effects of cisplatin and adriamycin used in combination, Cancer Chemother. Pharmacol., 21, 176-178.
[282] K. Iuchi, Y. Hatano and T. Yagura. (2008) Heterocyclic organobismuth(III) induces apoptosis of human promyelocytic leukemic cells through activation of caspases and mitochondrial perturbation, Biochem. Pharmacol., 76, 974-986.
[283] K. Iuchi, K. Akagi and T. Yagura. (2009) Heterocyclic organobismuth(III) compound targets tubulin to induce G2/M arrest in HeLa cells, J. Pharmacol. Sci., 109, 573-582.
[284] K. Onishi, M. Douke, T. Nakamura, Y. Ochiai, N. Kakusawa, S. Yasuike, J. Kurita, C. Yamamoto, M. Kawahata, K. Yamaguchi and T. Yagura. (2012) A novel organobismuth compound, 1-[(2-di-p-tolylbismuthanophenyl)diazenyl]-pyrrolidine, induces apoptosis in the human acute promyelocytic leukemia cell line NB4 via reactive oxygen species, J. Inorg. Biochem., 117, 77-84.
[285] K. S. O. Ferraz, N. F. Silva, J. G. da Silva, L. F. de Miranda, C. F. D. Romeiro, E. M. Souza-Fagundes, I. C. Mendes and H. Beraldo. (2012) Investigation on the pharmacological profile of 2,6-diacetylpyridine bis(benzoylhydrazone) derivatives and their antimony(III) and bismuth(III) complexes, Eur. J. Med. Chem., 53, 98-106.
[286] I. P. Ferreira, E. D. L. Piló, A. A. Recio-Despaigne, J. G. Da Silva, J. P. Ramos, L. B. Marques, P. H. D. M. Prazeres, J. A. Takahashi, E. M. Souza-Fagundes, W. Rocha and H. Beraldo. (2016) Bismuth(III) complexes with 2-acetylpyridine- and 2-benzoylpyridine-derived hydrazones: Antimicrobial and cytotoxic activities and effects on the clonogenic survival of human solid tumor cells, Bioorg. Med. Chem., 24, 2988-2998.
[287] Y.-K. Li, M. Yang, M.-X. Li, H. Yu, H.-C. Wu and S.-Q. Xie. (2013) Synthesis, crystal structure and biological evaluation of a main group seven-coordinated bismuth(III) complex with 2-acetylpyridine N4-phenylthiosemicarbazone, Bioorg. Med. Chem. Lett., 23, 2288-2292.
[288] X. Wang, X. Zhang, J. Lin, J. Chen, Q. Xu and Z. Guo. (2003) DNA-binding property and antitumor activity of bismuth(III) complex with 1,4,7,10-tetrakis(2-pyridylmethyl)-1,4,7,10-tetraazacyclododecane, Dalton Trans., 2379-2380.
[289] K. A. Smith, G. B. Deacon, W. R. Jackson, E. R. Tiekink, S. Rainone and L. K. Webster. (1998) Preparation and anti-tumour activity of some arylbismuth(III) oxine complexes, Met. Based Drugs, 5, 295-304.
[290] H. Li, C. S. Lai, J. Wu, P. C. Ho, D. de Vos and E. R. Tiekink. (2007) Cytotoxicity, qualitative structure-activity relationship (QSAR), and anti-tumor activity of bismuth dithiocarbamate complexes, J. Inorg. Biochem., 101, 809-816.
Chapter 1. Introduction
58
[291] M.-X. Li, M. Yang, J.-Y. Niu, L.-Z. Zhang and S.-Q. Xie. (2012) A nine-coordinated bismuth(III) complex derived from pentadentate 2,6-diacetylpyridine bis(4N-methylthiosemicarbazone): crystal structure and both in vitro and in vivo biological evaluation, Inorg. Chem., 51, 12521-12526.
[292] H. Li and H. Sun. (2012) Recent advances in bioinorganic chemistry of bismuth, Curr. Opin. Chem. Biol., 16, 74-83.
[293] M. D. Ioffreda, C. A. Gordon, D. R. Adams, S. J. Naides and J. J. Miller. (2001) Black tongue, Arch. Dermatol., 137, 968-969.
[294] R. Burns, D. W. Thomas and V. J. Barron. (1974) Reversible encephalopathy possibly associated with bismuth subgallate ingestion, BMJ, 1, 220-223.
[295] D. J. Lowe. (1974) Adverse effects of bismuth subgallate. A further report from the Australian Drug Evaluation Committee, Med. J. Aust., 2, 664-666.
[296] V. Supino-Viterbo, C. Sicard, M. Risvegliato, G. Rancurel and A. Buge. (1977) Toxic encephalopathy due to ingestion of bismuth salts: clinical and EEG studies of 45 patients, J. Neurol. Neurosur. Ps., 40, 748-752.
[297] A. Larsen, N. Martiny, M. Stoltenberg, G. Danscher and J. Rungby. (2003) Gastrointestinal and systemic uptake of bismuth in mice after oral exposure, Pharmacol. Toxicol., 93, 82-90.
[298] B. Bialek, R. A. Diaz-Bone, D. Pieper, M. Hollmann and R. Hensel. (2011) Toxicity of methylated bismuth compounds produced by intestinal microorganisms to bacteroides thetaiotaomicron, a member of the physiological intestinal microbiota, J. Toxicol., 608349, doi:10.1155/2011/608349.
[299] P. C. Andrews, R. L. Ferrero, P. C. Junk, I. Kumar, Q. Luu, K. Nguyen and J. W. Taylor. (2010) Bismuth(III) complexes derived from non-steroidal anti-inflammatory drugs and their activity against Helicobacter pylori, Dalton Trans., 39, 2861-2868.
[300] M. Abuznaid, A.-S. Sallam, I. Hamdan, M. Al-Hussaini and A. Bani-Jaber. (2008) Diclofenac-bismuth complex: synthesis, physicochemical, and biological evaluation, Drug Dev. Ind. Pharm., 34, 434-444.
[301] M. M. Goldenberg, L. J. Honkomp, S. E. Burrous and A. W. Castellion. (1975) Protective effect of Pepto-Bismol liquid on the gastric mucosa of rats, Gastroenterology, 69, 636-640.
[302] S. Tanaka, P. H. Guth, O. R. Carryl and J. D. Kaunitz. (1997) Cytoprotective effect of bismuth subsalicylate in indomethacin-treated rats is associated with enhanced mucus bismuth concentration, Aliment. Pharmacol. Ther., 11, 605-612.
[303] S. J. Konturek, N. Kwiecien, W. Obtulowicz, Z. Hebzda and J. Oleksy. (1988) Effects of colloidal bismuth subcitrate on aspirin-induced gastric microbleeding, DNA loss, and prostaglandin formation in humans, Scand. J. Gastroenterol., 23, 861-866.
[304] D. Bagchi, O. R. Carryl, M. X. Tran, M. Bagchi, P. J. Vuchetich, R. L. Krohn, S. D. Ray, S. Mitra and S. J. Stohs. (1997) Protection against chemically-induced oxidative gastrointestinal tissue injury in rats by bismuth salts, Dig. Dis. Sci., 42, 1890-1900.
[305] N. Hudson, F. E. Murray, A. T. Cole, G. M. Turnbull, S. Lettis and C. J. Hawkey. (1993) Ranitidine bismuth citrate and aspirin-induced gastric mucosal injury, Aliment. Pharmacol. Ther., 7, 515-521.
[306] F. V. Izzettin, M. Sancar, B. Okuyan, S. Apikoglu-Rabus and U. Cevikbas. (2012) Comparison of the protective effects of various antiulcer agents alone or in combination on indomethacin-induced gastric ulcers in rats, Exp. Toxicol. Pathol., 64, 339-343.
59
Chapter2. InfluenceofBiNSAIDstabilityonthetoxicityand
PGE2inhibitioninHCT-8coloncancercells
In order to determine whether BiNSAIDs are potential chemotherapeutics or
chemopreventives in vivo, the behaviour of the BiNSAIDs first needed to be studied
invitro.InthisChapter,thestabilityoftheBiNSAIDsincellmediumwasexaminedto
determine the biologically available species. The HCT-8 colon cancer cell line was
employed to assess the toxicity of the BiNSAIDs compared to uncomplexedNSAIDs,
and cisplatin, a clinicallyusedanti-cancerdrug. Upon confirming the toxicityof the
BiNSAIDs, cell death assays were employed to determine the mode of cell death
induced by the BiNSAIDs in the HCT-8 cells. Finally, the ability of the BiNSAIDs to
inhibit the production of PGE2 is presented with the respect to the proposed
mechanismofNSAIDchemoprevention,COXinhibition.
SectionsofthisChapterhavebeenpublishedin:
Hawksworth, E. L., Andrews, P. C., Lie, W., Lai, B. & Dillon, C. T. (2014) Biological
evaluation of bismuth non-steroidal anti-inflammatory drugs (BiNSAIDs): stability,
toxicity and uptake in HCT-8 colon cancer cells, J. Inorg. Biochem., 135, 28-39.
Chapter2.Stability,toxicityandPGE2inhibitionofBiNSAIDs
60
2.1 IntroductionAs discussed in Section 1.2.2, the results from a number of epidemiological,
observational and clinical studies indicate that long-term administration of NSAIDs,
suchasaspH,reducestheincidenceandreoccurrenceofCRC. Therearetwocriteria
that are important for this: (i)eradication of already transformed cells, and
(ii)preventingtheformationoftransformedcells.
Previously,NSAIDshavebeenextensivelystudiedinanumberofcancercelllines
(asdescribedinSection1.2.4)toexploreboththeirabilitytokillcancercellsandtheir
ability to prevent the transformation of normal cells to cancer cells. In addition, a
variety of Bi(III) complexes have also shown promising anti-cancer activity in vitro
and in vivo (discussed in Section 1.4.1.4) indicating their ability to kill transformed
cells.However,noworkhasbeenperformedtoestablishtheabilityofBiNSAIDstokill
cancerouscellsorpreventtheirformation.
Thereareanumberoffactorsthatneedtobeaddressedinordertodeterminethe
suitability of BiNSAIDs as potential chemotherapeutic or chemopreventive drug
candidates including general factors such as: (i) solubility/bioavailability, and
(ii)stability;andspecificfactorsrelatingtothechemopreventioncriteria:(iii)toxicity
towardscoloncancercells, (iv) inhibitionofCOX(andsubsequentreduction inPGE2
release), and (v) cellular uptake and intracellular distribution (discussed in
Chapter3). Factors (i) and (ii) are also important for in vitro testing whereby
compromisesneedtobeconsideredforthesepurposes.Assuch,Sections2.1.1–2.1.5
will present the current literature relevant to the optimal factors for BiNSAID
chemotherapeutic/chemopreventionsuitabilityandtherationaleforthemethodology
behindtheexperimentsdescribedinthisChapter.
2.1.1 Solubility/Bioavailability
Oral administration is themostdesirable routeof administrationof therapeutics
andpreventivesduetotheeaseofuseforthepatient[1]. Thedevelopmentoforally
administered drugs is often hampered by poor aqueous solubility and high
lipophilicity (logP > 3.5) which then leads to poor and variable absorption/
bioavailability [2]. Drugs with poor solubility can present in vivo issues including
reducedoralbioavailability, lackofefficacy,theneedtodevelopexpensiveandoften
problematic formulations, and the burden to patients through frequent dosing to
achieve therapeutic effectiveness [1]. Nonetheless, the requirement of the drug to
Chapter2.Stability,toxicityandPGE2inhibitionofBiNSAIDs
61
traverse the cellmembrane imposes a requirement for some degree of lipophilicity
suchthatabalancebetweenaqueoussolubilityandlipophilicityisessential[3].
NSAIDs,whichrepresentoneof themosthighlyprescribedclassesofdrug in the
world[4],aregenerallyadministeredorally[5];however,theydisplaypooraqueous
solubility and incomplete dissolution in the stomach [6]. In general, NSAIDs are
hydrophobicmolecules,aproperty that iscrucial for theirmechanismofactionas it
allowsthemoleculestoapproachthemembrane-boundtargetenzyme,COX,andenter
itshydrophobicarachidonate-bindingchannel [6]. Despite theseproperties,NSAIDs
generally display 80–95%oral absorption and 99%plasmaprotein binding (mainly
toalbumin)[6].
Similarly, commonly used bismuth drugs, BSS (Pepto-Bismol, Procter & Gamble
Company) and CBS (De-Nol®; Gist Brocades and Yamanouchi) exhibit poor aqueous
solubility and stability (discussed in more detail in Section 2.1.2). However, these
propertiescontributetothegastroprotectivenatureofthesedrugsasthedrugformsa
solidphysical coatingon theepithelial liningof the stomachsubsequentlyproviding
protectionviaaphysicalbarrier[7].
While the poor aqueous solubility of the BiNSAIDs may not necessarily hamper
invivo studiesandpotentialpatientadministration, itdoesposean issue for invitro
testing. For instance, lead compounds displaying poor aqueous solubility are often
considered less than ideal candidates for drug development as a number issues can
arise during in vitro testing, including; erratic assay results, artificially low potency,
anderroneousstructure−activityrelationships[1]. Assuch,theaqueoussolubilityof
theBiNSAIDswasafactorthatrequiredconsiderationfortheassaysreportedinthis
Chapter. Previous studies have shown that the BiNSAIDs, Bi(tolf)3, Bi(mef)3 and
Bi(difl)3,displaypoorsolubilityindeionizedwater[8]andthuswouldnotdissolvein
the cell culture medium required for cell testing. Furthermore, BiNSAIDs display
limited solubility in organic solvents such as toluene, acetone and ethanol [8];
however, all three BiNSAIDs showed appreciable solubility in dimethyl
sulphoxide(DMSO) [8]. DMSO is often employed as a solvent for biological in vitro
testing of compounds with low aqueous solubility; the high solvating efficiency of
DMSOstemsfromitsamphiphilicproperty,widetemperaturerangeoftheliquidstate,
and high polarity [9]. DMSO is generally not favoured for oral administration to
humans as the metabolism of DMSO to dimethyl sulfide produces a sulphuric-like
odour on the skin and a garlic-like after-taste and breath odour that can persist for

Chapter2.Stability,toxicityandPGE2inhibitionofBiNSAIDs
62
several days following DMSO administration[10]. In addition, DMSO is associated
withanumberofsideeffectsincludingsedation,nausea,headache,diarrhea,dizziness
and topical irritation [10]. However, DMSO is a commonly acceptable vehicle for
cell-basedscreeningassayswherebytheuseofsmallvolumesofDMSOiscommonly
reported for the purpose of testing metal complexes [11-16] and poorly soluble
organiccompounds[17-20].
2.1.2 Drugstability
Thereareanumberofproperties thatcanbeexploitedby themedicinalchemist
whendesigning/developingmetalcontainingdrugs. Forexample, theverynatureof
metal-ligandcomplexesprovidesascaffoldwherebyametalcentrecanbeconjugated
to an array of ligands with various geometries and dissociation rates. Inorder to
ensurethemetal-complexreachesitsbiologicaltarget,themetalcomplexshouldhave
asufficientlyhighthermodynamicstabilitytodeliverthemetaltothebiologicaltarget,
the metal-ligand binding should be hydrolytically stable, and understanding the
kineticswithwhichthemetalionundergoesligationordissociationreactionsshould
beconsidered[21]. Whilepresentingasignificantchallenge, it isnecessarytostudy
thestabilityofthemetal-complexesinthebiologicalenvironmenttoensurethemetal
complexeswill survive longenough in vivo to reach theirbiological target andexert
theintendedmedicinaleffects[22].
Generally, medicinal Bi compounds exhibit low aqueous solubility and lack
solutionstability;however,asdiscussedinSection1.4.1.2,lowaqueoussolubilitymay
beessentialforthegastroprotectiveeffectsofBi[7].Forinstance,anumberofstudies
have explored the formation of BSS, CBS and RBC polymeric products in acidic
environmentsthatmimicthestomach[23,24]. Thecellmediumusedtomaintain in
vitrocellculturesisformulatedtosimulatetheinvivogrowthenvironmentofthecells.
Buffersarepresent in themediumtomaintainphysiologicalpH7.4, the idealpHfor
cells to grow. Due to the nature of Bi(III) carboxylates (that are common to the
BiNSAIDs)itisessentialtodeterminethestabilityoftheBiNSAIDsinthecellmedium
inordertoassessthestructuresofthebiologicallyavailablespecies.Techniquesoften
used to study drug stability include ultraviolet-visible (UV-Vis) spectroscopy,
electrospray ionisationmass spectrometry (ESI-MS) andNMR spectroscopy. UV-Vis
spectroscopy is useful for determining if there is a change; however, the specific
chemicalinformationislimited.ESI-MSisoftenutilisedasatechniquetocharacterise
Chapter2.Stability,toxicityandPGE2inhibitionofBiNSAIDs
63
complexesbasedonthefragmentationpattern.However,ESI-MSisapoortechnique
fortheanalysisofhydrophobiccompoundsinDMSOduetothenon-volatilenatureof
this solvent. NMR spectroscopy is also a technique that is commonly used to
characterise compounds, providing structural information based on the chemical
environmentofthenuclei(commonly1Hand13C).Importantly,DMSO(intheformof
deuteratedDMSO,DMSO-d6) is a commonlyemployedsolvent inNMRspectroscopy,
particularly for compounds that have difficulty dissolving in other organic solvents
such as methanol and chloroform. The use of DMSO-d6 as a NMR solvent is
particularlyusefulforcompoundscontaining–OHand–NH2groupsduetothestrong
hydrogenbondingbetweentheseprotondonatinggroupsandaproticDMSO[9].
2.1.3 Invitrocytotoxicitytowardscoloncancercells
AsmentionedinSection2.1,oneofthecriteriaassociatedwiththeadministration
of aCRC chemopreventive agent is its ability to eradicate already transformed cells.
This is important given that the cohortwould generally include patients that are at
highriskofdevelopingbowelcancer.
2.1.3.1 Assessinginvitrodrugtoxicity:TheMTTassay
Inordertoassessthepotentialchemotherapeuticactivityofnovelcompounds,itis
necessarytoscreenthemusinginvitrooncology-relatedassays[25].Ideally,theassay
should be sensitive, reliable, inexpensive, have the capacity to test multiple
drugs/concentrationsat thesametime,andberelativelyeasytoperform[25]. First
describedbyMosmann in1983 [26], theMTTassay fits theaforementionedcriteria
and is commonly performed using cancer cell lines to screen and compare the
chemotherapeutic potential of new compounds [25]. While there are several
variations of the assay protocol [26-30], they generally employ a water-soluble
substrate, 3-(4,5-dimethylthiazol-2-yl)-2,5-diphenyltetrazolium bromide (MTT), as a
colorimetric measure of cell viability, proliferation or activation [25]. The assay is
basedonthepremisethatonlyviable(ormetabolically-active)cellsareabletoreduce
yellow MTT to water-insoluble purple (E,Z)-5-(4,5-dimethylthiazol-2-yl)-1,3-
diphenylformazan (formazan) by cleavage of the tetrazolium ring via the enzyme,
mitochondrialreductase(Scheme2.1)[25].
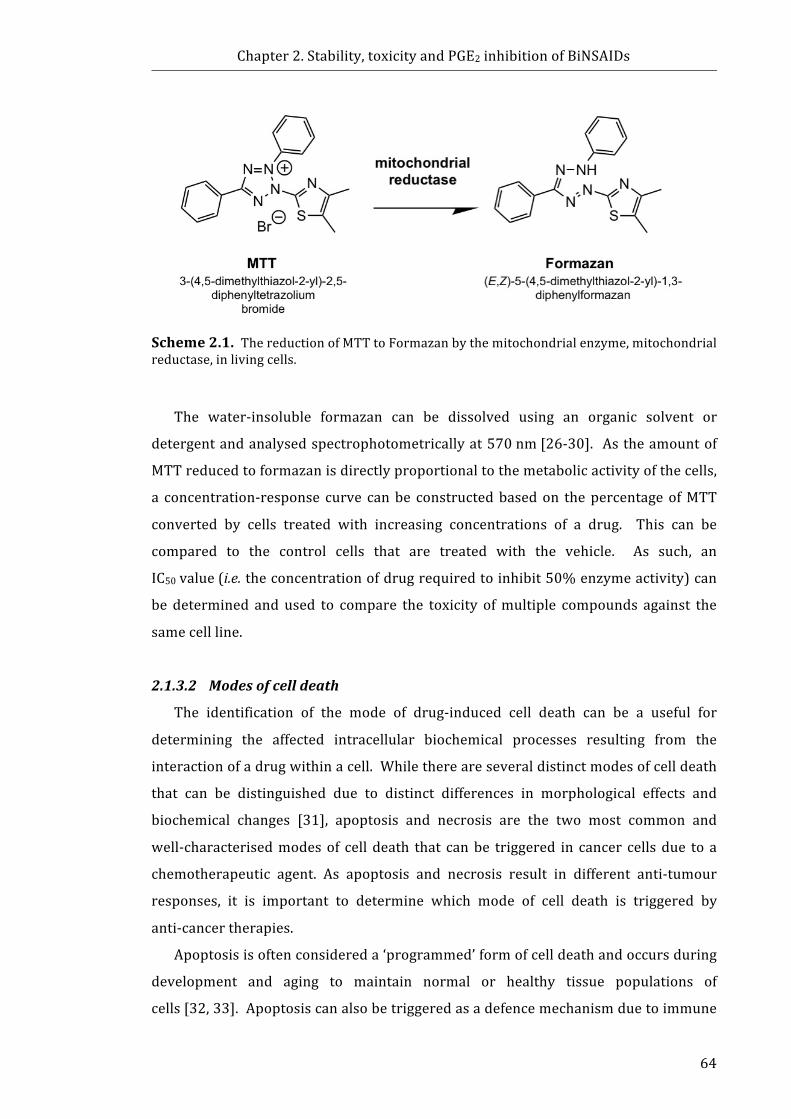
Chapter2.Stability,toxicityandPGE2inhibitionofBiNSAIDs
64
Scheme2.1.ThereductionofMTTtoFormazanbythemitochondrialenzyme,mitochondrialreductase,inlivingcells.
The water-insoluble formazan can be dissolved using an organic solvent or
detergentandanalysedspectrophotometricallyat570nm[26-30]. Astheamountof
MTTreducedtoformazanisdirectlyproportionaltothemetabolicactivityofthecells,
a concentration-response curve canbe constructedbasedon thepercentageofMTT
converted by cells treated with increasing concentrations of a drug. This can be
compared to the control cells that are treated with the vehicle. As such, an
IC50value(i.e.theconcentrationofdrugrequiredtoinhibit50%enzymeactivity)can
be determined and used to compare the toxicity ofmultiple compounds against the
samecellline.
2.1.3.2 Modesofcelldeath
The identification of the mode of drug-induced cell death can be a useful for
determining the affected intracellular biochemical processes resulting from the
interactionofadrugwithinacell.Whilethereareseveraldistinctmodesofcelldeath
that can be distinguished due to distinct differences in morphological effects and
biochemical changes [31], apoptosis and necrosis are the two most common and
well-characterisedmodesof cell death that canbe triggered in cancer cellsdue to a
chemotherapeutic agent. As apoptosis and necrosis result in different anti-tumour
responses, it is important to determine which mode of cell death is triggered by
anti-cancertherapies.
Apoptosisisoftenconsidereda‘programmed’formofcelldeathandoccursduring
development and aging to maintain normal or healthy tissue populations of
cells[32,33].Apoptosiscanalsobetriggeredasadefencemechanismduetoimmune
Chapter2.Stability,toxicityandPGE2inhibitionofBiNSAIDs
65
responses, cell damage via disease, or noxious stimuli [32]. Notably, not all cells
respond to apoptotic stimuli in the same manner; for instance, some
chemotherapeutic drugs can initiate apoptosis in cancer cells, without affecting
normal cells [32]. Distinguishing features of early apoptosis include reduction of
cellularvolume (pyknosis)andcell rounding, retractionofpseudopods, reduction in
nuclearvolume,externalisationofphosphatidylserine(PS),andminormodificationof
cytoplasmicorganelles[31]. Laterstagesofapoptoticcelldeathcanbeidentifiedby
nuclearfragmentation(karyorrhexis),membraneblebbing,lossofplasmamembrane
integrity,andengulfmentbyresidentphagocytesinvivo[31].Apoptosisisoneofthe
mostcommonmechanismsofchemotherapy-inducedcelldeath[33]. Incancercells,
normalapoptoticpathwaysareoftencompromised[33],whichisadvantageoustothe
fortificationof cancer cells against cell death. As such, chemotherapeutics areoften
designedtotargetaspecificpartoftheapoptoticpathwayinordertocircumventthe
defunctsignalingpathwaysandrestoreapoptosis[33].
In contrast, necrosis is a form of cell death that is morphologically and
biochemically distinct from apoptosis. While it is often considered an ‘accidental’,
uncontrolled form of cell death, accumulating evidence suggests that transduction
pathwaysandcatabolicmechanismsareinvolvedinregulatingnecrosis[31]. Clearly
distinct key features of necrotic cell death (as opposed to apoptosis) include
cytoplasmic swelling (oncosis), rupture of plasma membrane (occurs early, as
opposed to a late stage step in apoptosis), swelling of cytoplasmic organelles, and
moderate chromatin condensation[31]. Unlike apoptosis, necrosis releases the
intracellularcontentand tumourantigens,whichattracts immunecells to thesiteof
the tumour to help drive anti-tumour immune responses [33]. While several
anti-cancer compounds have been shown to induce cell death via necrosis [34-36],
triggering apoptosis is generally described a safer mechanism for the death of the
cancercells[37].
Themostcommonmethodofassessingthemodeofcelldeathisviaflowcytometry
coupledwithstainingformarkersspecifictotheeventsassociatedwithapoptosisor
necrosis[31]. Two fluorescent probes, fluorescein isothiocyanate (FITC)-labeled
Annexin V (referred to herein as AnnV) and 7-aminoactinomycinD (7AAD), are
commonly used to distinguish between apoptotic cells and necrotic cells. AnnV is
utilised as it is a Ca2+ dependent phospholipid-bindingproteinwith high affinity for
PS[38].Duringtheearlystagesofapoptosis,PStranslocatesfromtheinnerleafletof
Chapter2.Stability,toxicityandPGE2inhibitionofBiNSAIDs
66
theplasmamembranetotheouterleaflet[39].AnnVbindingtoPSisnotexclusiveto
apoptosis. During the later stages of necrosis the cells increase in permeability
allowingentryofAnnVwhichcanbindtoPSontheinnerleaflet[38]. Incontrastto
this, during the early stages of necrosis, cells lose their membrane integrity and
become permeable, while this event does not occur until the later stages of
apoptosis[31]. Hence, the assessment of cell death is performed with AnnV in
combination with another fluorescent dye that is excluded by an intact plasma
membrane,butisabletodiffusethroughporesofacompromisedcellmembrane[38].
Traditionally, propidium iodide or 7AAD are employed to this end; thesemolecules
increase in fluorescence intensity when they intercalate with DNA following entry
throughthecompromisedcellmembrane,andprovideameasureoflossofmembrane
integrity[40,41].
AnexampleoftheflowcytometrydataobtainedfromAnnVand7AADco-stained
cellsisshowninFigure2.1.ViablecellsmaintainanintactplasmamembraneandPS
remains on the inner leaflet, thus viable cells do not bind AnnV and exclude 7AAD,
such that these cells exhibit low fluorescent intensity (AnnV−/7AAD−); and can be
identifiedasthepopulationinthebottom-leftquadrantofthebivariateplot(Fig.2.1).
In the early stagesof apoptosis, PS translocates from the inner leaflet of theplasma
membranetothecellsurfaceallowingAnnVtobind;however,theplasmamembrane
remainsintactexcluding7AADfromthecell(AnnV+/7AAD−).AsshowninFigure2.1,
thesecellsarelocatedinthebottom-rightquadrantofthebivariateplot. Inthelater
stagesofapoptosisporesappear in thecellmembraneallowing7AADtoenter. The
population in the top-right corner is indicative of late apoptosis or late necrosis
(AnnV+/7AAD+, as shown in Fig. 2.1). In necrosis the loss of plasma membrane
integrity occurs before the translocation of AnnV (AnnV−/7AAD+). As such, early
necroticcellsappearinthetop-leftquadrantinFigure2.1.
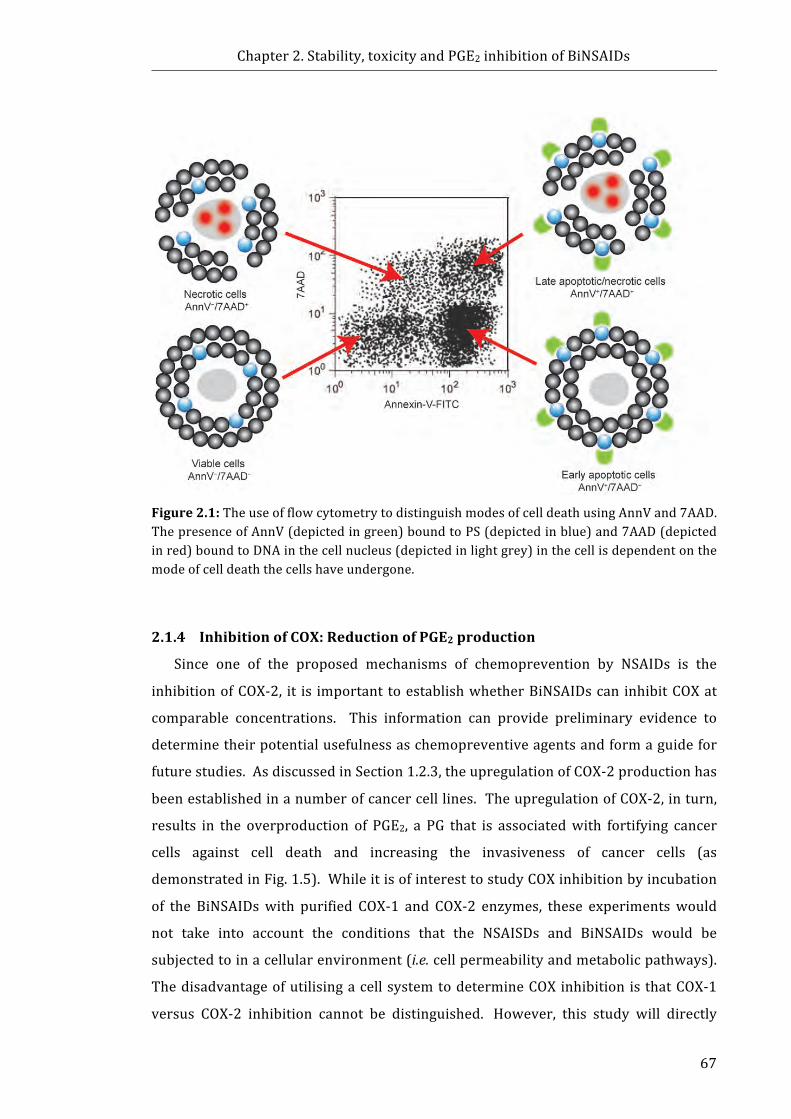
Chapter2.Stability,toxicityandPGE2inhibitionofBiNSAIDs
67
Figure2.1:TheuseofflowcytometrytodistinguishmodesofcelldeathusingAnnVand7AAD.ThepresenceofAnnV(depictedingreen)boundtoPS(depictedinblue)and7AAD(depictedinred)boundtoDNAinthecellnucleus(depictedinlightgrey)inthecellisdependentonthemodeofcelldeaththecellshaveundergone.
2.1.4 InhibitionofCOX:ReductionofPGE2production
Since one of the proposed mechanisms of chemoprevention by NSAIDs is the
inhibitionofCOX-2, it is important toestablishwhetherBiNSAIDscan inhibitCOXat
comparable concentrations. This information can provide preliminary evidence to
determinetheirpotentialusefulnessaschemopreventiveagentsandformaguidefor
futurestudies.AsdiscussedinSection1.2.3,theupregulationofCOX-2productionhas
beenestablishedinanumberofcancercelllines.TheupregulationofCOX-2,inturn,
results in the overproduction of PGE2, a PG that is associatedwith fortifying cancer
cells against cell death and increasing the invasiveness of cancer cells (as
demonstratedinFig.1.5).WhileitisofinteresttostudyCOXinhibitionbyincubation
of the BiNSAIDswith purified COX-1 and COX-2 enzymes, these experimentswould
not take into account the conditions that the NSAISDs and BiNSAIDs would be
subjectedtoinacellularenvironment(i.e.cellpermeabilityandmetabolicpathways).
ThedisadvantageofutilisingacellsystemtodetermineCOXinhibitionisthatCOX-1
versus COX-2 inhibition cannot be distinguished. However, this study will directly

Chapter2.Stability,toxicityandPGE2inhibitionofBiNSAIDs
68
compare BiNSAID versus NSAID, as it is important to establish if the BiNSAIDs can
provideequalorsuperiorCOXinhibitioninthecellularenvironment.Thustheability
ofBiNSAIDstoinhibitPGE2production(andsubsequentlytheabilitytoinhibitCOX)in
atransformedcelllinewillbeassessedinthisChapter.
2.1.5 Chapteraims
The establishment of the in vitro activity is the first step to determine whether
BiNSAIDs will be suitable candidates for in vivo studies as chemotherapeutic or
chemopreventive agents for CRC, and ultimately, whether BiNSAIDs should be
investigatedasapotentialmedication for thereductionof theaccompanyingGIside
effects of long-term NSAID use. The experiments described in this Chapter can be
dividedintotwopurposes:(i)toestablishthechemotherapeuticpotentialofBiNSAIDs
bydeterminingwhetherBiNSAIDsareabletokilltransformedcells(toxicityandcell
deathassays), and (ii) toestablishwhetherBiNSAIDsdemonstratechemopreventive
potentialbydeterminingwhetherBiNSAIDsareabletoinhibittheproductionofPGE2
(andthusinhibitCOX)intransformedcells.Ahumanepithelialileocecalcoloncancer
cell line, HCT-8, was employed as a model CRC cell line for the evaluation of the
BiNSAIDs, Bi(tolf)3, Bi(mef)3 and Bi(difl)3 and the respective uncomplexed NSAIDs,
tolfH,mefHanddiflH.
Thespecificaimsofthischapterwereto:
1. Investigate the stability of Bi(tolf)3, Bi(mef)3 and Bi(difl)3 in cell medium
usingNMRspectroscopyinordertoelucidatethebiologicallyactiveformof
thecomplexesintheinvitroassays.
2. Assess the in vitro toxicity of theBiNSAIDs,Bi(tolf)3, Bi(mef)3 andBi(difl)3,
and compare to the uncomplexed NSAIDs against human colon cancer cell
line,HCT-8.
3. DeterminewhethertheBiNSAIDs,Bi(tolf)3,Bi(mef)3andBi(difl)3,inducethe
same typeof celldeath (apoptosisornecrosis) as the respectiveNSAIDs in
HCT-8cells.
4. Ascertain whether complexation with Bi affects the ability of the NSAIDs,
tolfH, mefH and diflH, to interact with COX in vitro, by quantifying PGE2
productionbyHCT-8cells.
Chapter2.Stability,toxicityandPGE2inhibitionofBiNSAIDs
69
2.2 Materialsandmethods2.2.1 Materials
The Bi complexes of tolfH, mefH and diflH (Bi(tolf)3, Bi(mef)3 and Bi(difl)3,
respectively)werechosenforthisstudy. TolfHhasbeenextensivelystudied invitro
against a number of different types of human cancer cell lines [42-50]. MefH is
structurally similar to tolfH (both belonging to the structural class called fenamic
acids, Fig. 1.2) and was tested as a direct comparison to tolfH; additionally, mefH
exhibitstoxicity incancercell lines invitro [51,52]. DiflHwas investigatedas it isa
salicylate which is the same chemical class that aspH belongs
to(Fig.1.2). Additionally, reports suggest that diflH exhibits gastroprotective
properties[53,54]. TheBiNSAIDs,Bi(tolf)3,Bi(mef)3andBi(difl)3,weresynthesised,
purifiedandcharacterisedbyDrIshKumar(SchoolofChemistry,MonashUniversity)
and Dr Amita Pathak (School of Chemistry, Monash University) as previously
published by Andrews et al [8]. The NSAIDs, diflH (≥98%), mefH (≥98%), and
tolfH(≥98%), were purchased from Sigma-Aldrich(StLouis, USA). In addition,
bismuth salicylate was chosen to represent the marketed Bi drug, BSS. Bismuth
chloride(BiCl3)waschosentorepresentasimpleBicompoundwithnoexpectedanti-
canceractivityor toxicitystemming fromtheanion(Cl−). Cisplatinwasemployedto
provide a comparison of the BiNSAIDs to a standard chemotherapeutic drug. The
chemicals,BSS (99.9%),BiCl3(≥98%)andcisplatin (99.999%)werepurchased from
Sigma-Aldrich(StLouis,USA).
MilliQ™(18.2MΩ/cmresistivity,Millipore)waterwasusedtoprepareallaqueous
solutions.DMSO(99.8%)wasobtainedfromThermofisherScientific(Waltham,USA).
The chemicals, acetylsalicylic acid (aspH, ≥99.0%), deuterated DMSO (DMSO-d6,
99.9%),D-(+)-glucose(≥99.5%),4-(2-hydroxyethyl)-piperazine-1-ethanesulfonicacid
(HEPES, ≥99.5%), MTT (98%), and trypan blue (0.5% in phosphate buffered saline
(PBS)solution)werepurchasedfromSigma-Aldrich(StLouis,USA).Absoluteethanol
was sourced from Ajax Finechem (Seven Hills, Australia). PBS tablets (1tablet per
100mL of MilliQ water contains 0.8 g sodium chloride; 0.02 g potassium chloride;
0.115gdi-sodiumhydrogenphosphate;0.02gpotassiumdihydrogenphosphate)were
obtained from Oxoid (Basingstoke Hampshire, England). Annexin V binding buffer
andAnnVwereacquiredfromBioLegend(SanDiego,USA),and7AADwaspurchased
fromEnzoLifeSciences(PlymouthMeeting,USA).Arachidonicacid(0.1Minethanol,
Item No. 460103), potassium hydroxide (0.1M, Item No. 460105), and the
Chapter2.Stability,toxicityandPGE2inhibitionofBiNSAIDs
70
Prostaglandin E2 EIA kit – Monoclonal kits (Item No. 514010) were obtained from
CaymanChemical(AnnArbor,USA).
The materials used in the cell culture assays including, Roswell Park
Memorial Institute (RPMI)-1640 medium, penicillin/streptomycin (10,000IU/mL,
10,000μg/mL), trypsin (2.5%w/v in PBS) and GlutaMAX™ (200 mM L-alanyl-L-
glutaminedipeptidein0.85%NaCl)wereacquiredfromLifeTechnologies(NewYork,
USA). Australian certified fetal bovine serum was purchased from Thermofisher
Scientific (Waltham, USA) and was heat-inactivated before use (60 °C, 1 h).
CELLSTAR® 96-well cell culture plates, CELLSTAR® 60-mm culture dishes, and
CELLSTAR® filter cap cell culture flasks (75cm2) were sourced from Greiner
Bio-One(Kremsmünster,Austria).
2.2.2 Stabilitystudies
The stability ofBiNSAIDs inRPMI-1640 (referred toherein as cellmedium)was
assessedbycomparisonoftheNMRspectrawiththosefortheuncomplexedNSAIDsto
determine whether the NSAID dissociated from Bi. These studies were initially
performed by dissolving theNSAIDs or BiNSAIDs in accordancewith the procedure
and concentrations used for the cell assays (i.e.<100µM, 2% d6-DMSO/98% D2O);
however,onlyveryweak1HNMRsignalsoftheNSAIDsweredetected.Subsequently,
theconcentrationsoftheNSAIDsorBiNSAIDswereincreasedsuchthat10–40mgwas
dissolved in d6-DMSO (200 µL) and the resultant solution was added to
RPMI-1640(1.8mL). Theresultantsuspensionswerevortexedand incubated(37°C,
24 h). Following incubation, the suspended compounds were collected by
centrifugation(300g,5min)anddriedunderanitrogenatmosphere.The1Hand13C
NMR spectra of the BiNSAIDs, NSAIDs and the redissolved products resulting from
incubation in medium were recorded using a 500 MHz Varian spectrometer in
d6-DMSO at 25°C, referenced to DMSO (δH2.49, δC39.5). NMRassignments were
confirmedwith 2D-NMR, specifically homonuclear correlation spectroscopy (COSY),
heteronuclear single quantum coherence spectroscopy (HSQC), and heteronuclear
multiple-bondcorrelationspectroscopy(HMBC).
2.2.3 Cellculture
The human ileocecal colon cancer cell line, HCT-8, was chosen to represent a
humanbowelcancercelllineandsinceanumberofpublicationsreportthatCOX-2is

Chapter2.Stability,toxicityandPGE2inhibitionofBiNSAIDs
71
expressed in the HCT-8 cell line [55-57]. The cell line was kindly provided by
Associate Professor Ronald Sluyter (School of Biological Sciences, University of
Wollongong), and was originally sourced from the European Collection of
AuthenticatedCellCultures(ECACC).Allexperimentalworkinvolvingthecultureand
treatmentofHCT-8cells,andthesubsequenthandlingandpreparationofHCT-8cell
sampleswasperformedundersterileconditionsinabiologicalsafetycabinet(ClassII,
Email Westinghouse Pty Ltd). HCT-8 cells were cultured in growth medium that
consisted of RPMI-1640 medium supplemented with 10% fetal bovine serum,
GlutaMAX™(2mM),penicillinandstreptomycin (finalconcentration200 IU/mLand
200µg/mL,respectively).Cellswereincubatedina5%CO2atmosphereat37°Cand
passagedevery3–4days(whenconfluent)afterharvestingwithtrypsin(0.25%inPBS
solution).
2.2.4 Invitrocytotoxicitytowardscancercells:MTTassay
The toxicities of Bi(tolf)3, Bi(mef)3, Bi(difl)3, tolfH,mefH, diflH, BSS and cisplatin
were assessedusing adaptationsof theMTTassaydescribedbyMosmann [26], and
Carmichael et al [29]. Briefly, cells were seeded in 96-well plates at a density of
4×10⁴cellsperwellingrowthmedium(100μL)andwereincubatedfor24htoallow
cell adhesion to occur. Stock solutions (typically 50µM to 100mM)of theNSAIDs,
BiNSAIDs, BiCl3 and BSS, were prepared in DMSO. These solutions (20 μL) were
pipetted into RPMI-1640 (980 μL), vortexed, and the resultant solutions (100 μL
treatment solution, final concentration of drug typically 1 to 2000 µM)were added
into the wells of the 96-well plate. Control cells were incubated with the vehicle
(DMSO(2μL) and RPMI-1640 (98 μL)) containing no test compounds. In order to
avoidanypotentialligandexchangereactionsbetweenDMSOandthelabileCl−groups
resulting in the deactivation of the drug in the cell medium [58], cisplatin was
prepared inRPMI-1640(typicalstockconcentration2−4mM)andseriallydiluted in
RPMI-1640. The 96-well plate was incubated (37°C) for 24h, after which the
treatment mediumwas removed and the cells were washed twice with sterile PBS
solution.FreshRPMI-1640(100μL)wasaddedtoeachwell,followedbytheaddition
ofMTTsolution(50μL,2mg/mLinPBS).The96-wellplatewasincubated(37°C)for
4h,afterwhichthemediumwasremovedandDMSO(200μL)wasaddedtoeachwell.
The96-wellplatewasagitatedfor25sandtheabsorbanceofeachwellwasrecorded
at 570 nm and 630nm using a POLARstar Omega microplate reader with Omega
Chapter2.Stability,toxicityandPGE2inhibitionofBiNSAIDs
72
software (Version1.1.2,BMGLabtekGmbH,Ortenberg,Germany). Theresultswere
expressedaspercentMTTconversion,whichisproportionaltothenumberofhealthy
cells(Equation1):
MTT conversion % = !!"#!!!"# !"#$!#% !"##$!!"#!!!"# !"#$%&#%' !"##$
× 100(1)
Thecalculatedcellviabilitywasplottedagainstthetreatmentconcentrationsusing
Microsoft EXCEL™ (Version 12 for Windows 2007, Microsoft, Redmond, USA) to
determine the IC50 value of each compound. The MTT assays were performed in
triplicateforeachcompound.
2.2.5 Celldeathassays
2.2.5.1 Morphologicalanalysisbyphasecontrastmicroscopy
HCT-8 cells were plated in 60-mm cell culture dishes (2 × 10⁶ cells, 5mL) in
growthmediumandmaintainedat37°C,5%CO2overnight. Thecellswerewashed
twicewith PBS solution and the treatment solutions (3mL)were then added. The
treatmentconcentrationsweretheapproximateIC50dosesofeachBiNSAIDdissolved
intreatmentmedium(2%DMSOv/v)asdeterminedbyMTTassays(Section2.3.2),or
the equimolar concentration of the corresponding free NSAID, as denoted in the
figuresand text. Aminimumof three fieldsofviewwereexamined foreachsample
usingaMoticBinocularAE20Invertedlightmicroscopeequippedwitha20×objective
lens. Imageswere recorded using aMoticam 2000 2.0MP Live Resolution camera
withMoticImagesPlusVersion2.0forWindows(MoticChinaGroupCo.,Ltd.,Xiamen,
China).
2.2.5.2 Measurementofcelldeathbycytofluorometricassay
HCT-8 cells were plated in 60-mm cell culture dishes (1 × 10⁶ cells, 5mL) in
growthmediumandmaintainedat37°C,5%CO2overnight. Thecellswerewashed
twice with PBS solution and treatment solutions were added (3 mL RPMI-1640,
2%DMSO v/v). Cellswere treatedwith the approximate IC50 doses of theBiNSAID
(Bi(tolf)3, Bi(mef)3 or Bi(difl)3) as determined by MTT assays (Section 2.3.2), or
equimolar concentrations of the corresponding free NSAID (tolfH, mefH or diflH).
Following incubation(37°C,24h), the treatmentsolutionsandPBSsolutionwashes
were collected and the remaining cells were detached using trypsin (0.25% in PBS
solution). Thedetachedcellswerecombinedwiththecellsinthetreatmentsolution
washings and the resultant suspension was centrifuged (300g, 5min) to ensure
Chapter2.Stability,toxicityandPGE2inhibitionofBiNSAIDs
73
collection of all cells (live and dead). Cell death was determined by quantitative
measurement using flow cytometry. The collected HCT-8 cells were washed twice
withHEPES-bufferedsalinesolution(145mMNaCl,5mMKCl,10mMHEPES,pH7.4,
1mL),followedbyAnnexinVbindingmedium(1mL).Thecellswereincubatedwith
AnnV (5µL) and 7AAD (1mg/mL in PBS solution, 1µL) at room temperature
protected from light for15min. Following staining,AnnVbindingmedium (400µL)
wasaddedtoeachtubeandevents(20,000persample)werecollectedusingaLSRII
flow cytometer (BD Biosciences, San Diego, CA) using an excitation wavelength of
488nm and emission collectedwith 515/20 and 695/40 bandpass filters forAnnV
and7AAD,respectively.Themeanfluorescentintensity(MFI)ofAnnVand7AADwas
determined using FloJo software (Tree Star, Ashland, OR). Quadrantmarkers were
used to determine the percentage of AnnV‒/7AAD‒ (viable), AnnV+/7AAD‒ (early
apoptotic), AnnV+/7AAD+ (late apoptotic/late necrotic), and AnnV‒/7AAD+ (early
necrotic)cells.
2.2.6 COXinhibition:Prostaglandinassays
HCT-8cells(1×10⁶cells,5mL)wereseededinto60-mmcellculturedishesand
were incubated for24h,afterwhichthegrowthmediumwasremovedandthecells
werewashedtwicewithPBSsolution. TheBiNSAID(Bi(difl)3,Bi(mef)3,orBi(tolf)3),
NSAID(diflH,mefHor tolfH),aspHorBSS treatments inDMSO(5µMto50,000µM)
were added to each dish as a solution in RPMI-1640 (2mL, 2% DMSO v/v; final
concentration of drug 0.1−1000 µM),while the control cellswere incubated (37°C)
with the vehicle (2mL RPMI-1640, 2% DMSO v/v) for 4h. AspH was chosen as a
positivecontrolasitisawell-establishedCOXinhibitor,andclinicalevidencesuggests
that aspHmay possess chemopreventive properties (as discussed in Section 1.2.2).
BSS was chosen to represent a marketed anti-ulcer Bi medication. Following the
incubation period, the treatment medium was removed and the cells were washed
twicewithPBS solution. Fresharachidonic acid solutionwaspreparedaccording to
the manufacturer’s instructions. Arachidonic acid (0.1 M in ethanol, 20 µL) was
diluted by the addition of potassium hydroxide (0.1M, 20 µL) and the resultant
solutionwasaddedtoRPMI-1640(960µL).FreshRPMI-1640medium(1980µL)and
arachidonic acid solution (20 µL; final concentration 20 µM)was added to the cells
and the 60-mm dishes were incubated (37°C) for 30min. The cell medium was
collectedandcentrifuged(11000g,30sec) toremoveanycellularmaterial,andthe
Chapter2.Stability,toxicityandPGE2inhibitionofBiNSAIDs
74
supernatantwasstoredat−80°Cuntiltheassaywasperformed.PGE2productionwas
assayed using a Prostaglandin E2 EIA Kit in accordance with the manufacturer’s
instructions. Briefly, the absorbance of each well was recorded at 420 nm using a
POLARstar Omega microplate reader with Omega software (Version 1.1.2,
BMGLabtek). The PGE2 concentration(pg/mL) of each samplewas calculated using
GraphPad Prism Version 5.04 forWindows (GraphPad Software, La Jolla, USA), and
PGE2 release was expressed as a percentage of control PGE2 production. The
sensitivityoftheassay,asreportedbythemanufacturer,was15.6pgPGE2/mL.
2.2.7 Statisticalanalysis
Statistical analysis of the results of the AnnV/7AAD assays was performed by
one-way ANOVA, followed by the Tukey-Kramer Multiple Comparison Test, using
GraphPad Prism, Version 5.04 for Windows (GraphPad Software, La Jolla, USA).
TheresultswereanalysedasvehicleversusBiNSAIDversusthecorrespondingNSAID,
inordertodrawastatisticalcomparisonatthesameNSAIDconcentration.Avalueof
P≤0.05wasconsideredstatisticallysignificant.
Chapter2.Stability,toxicityandPGE2inhibitionofBiNSAIDs
75
2.3 Results2.3.1 StabilityofBiNSAIDsincellmedium
Featuresofthe1HNMRspectra(aromaticregiononly,presentedforclarity;Figure
2.2a–d)oftolfHandBi(tolf)3asobtainedinDMSO-d6priortoandafterincubationin
cellmediumaresummarisedinTable2.1.Itisapparentthatthereisnoprotonsignal
corresponding to the –COOH in the Bi(tolf)3 spectrum, which is consistent with
previous studies [8], and corresponds to the expected absence of the proton
subsequent to coordination to Bi. As shown in Table 2.1, the 13C NMR spectra of
Bi(tolf)3 also confirm the complexation to Bi, with downfield shifts observed from
170.1ppmto174.0ppmfortheresonancecorrespondingtothecarboxylatecarbon,
C14(C–OOBi),incomparisonwithuncomplexedtolfH;additionally,asubstantialshift
in the resonance of the quaternary carbon C1 (C–COOBi) was observed from
112.3ppmto118.6ppm.Themajorityofthesignalshiftsrelatingtotheintroduction
of thed6-DMSOsolutionof tolfHandBi(tolf)3 to cellmediumwereobserved for the
aromaticprotons,asshowninFigure2.2bandd.Smalldownfieldshiftsinthe1HNMR
signalsof tolfH incubated incellmediumoccurred forH5,andH8whichoverlapped
with the signal of H4 (Fig. 2.2b), indicating that there were some changes in the
chemicalenvironmentsurroundingtheseatomsfollowingincubationoftheNSAIDin
cellmediumcomparedtotheoriginalNSAID(Fig.2.2a).Inaddition,theprotonsignal
at 13.11 ppm related to –COOH disappeared and there was broadening and a
downfieldshiftofthesignalassociatedwith–NHinthe1HNMRspectraobtainedfrom
the precipitated tolfH (and Bi(tolf)3). These observations are attributed to the
presenceofasmallamountofwaterinthesampleandsubsequentexchangewithH2O
protons.Following incubation in cell medium, the 1H NMR spectrum of
Bi(tolf)3(Fig.2.2d) showed some differences from the initial spectrum of
Bi(tolf)3(Fig.2.2c), most substantially for the 1H signals of H4, H8, H9 and H10.
However,the13CNMRspectrum(Table2.1)obtainedforBi(tolf)3after incubationin
cellmediumshowedminimalshift in theC14(C–OOBi)signal (174.0 to173.8ppm).
Additionally, there was minimal shift in the C1 signal (Table 2.1) suggesting that
following incubation of the complex in cell medium, the interaction between the
carboxylategroupandBiremainsintact.
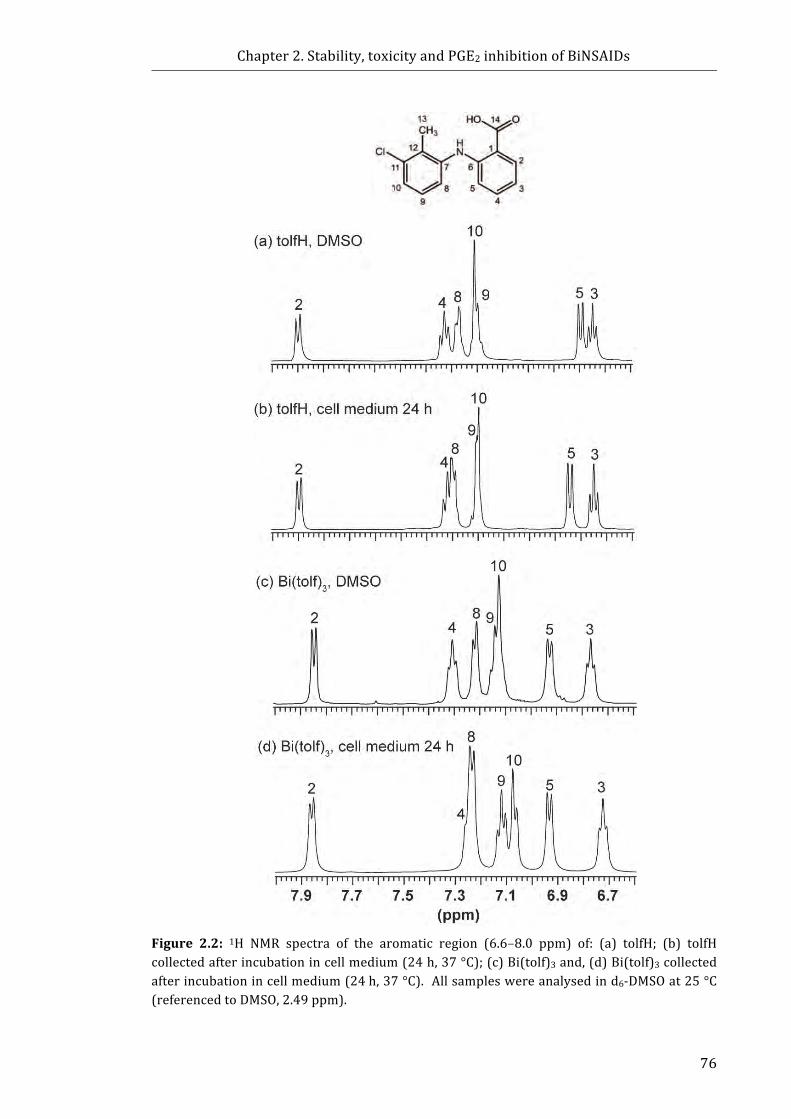
Chapter2.Stability,toxicityandPGE2inhibitionofBiNSAIDs
76
Figure 2.2: 1H NMR spectra of the aromatic region (6.6–8.0 ppm) of: (a) tolfH; (b) tolfHcollectedafterincubationincellmedium(24h,37°C);(c)Bi(tolf)3and,(d)Bi(tolf)3collectedafterincubationincellmedium(24h,37°C).Allsampleswereanalysedind6-DMSOat25°C(referencedtoDMSO,2.49ppm).
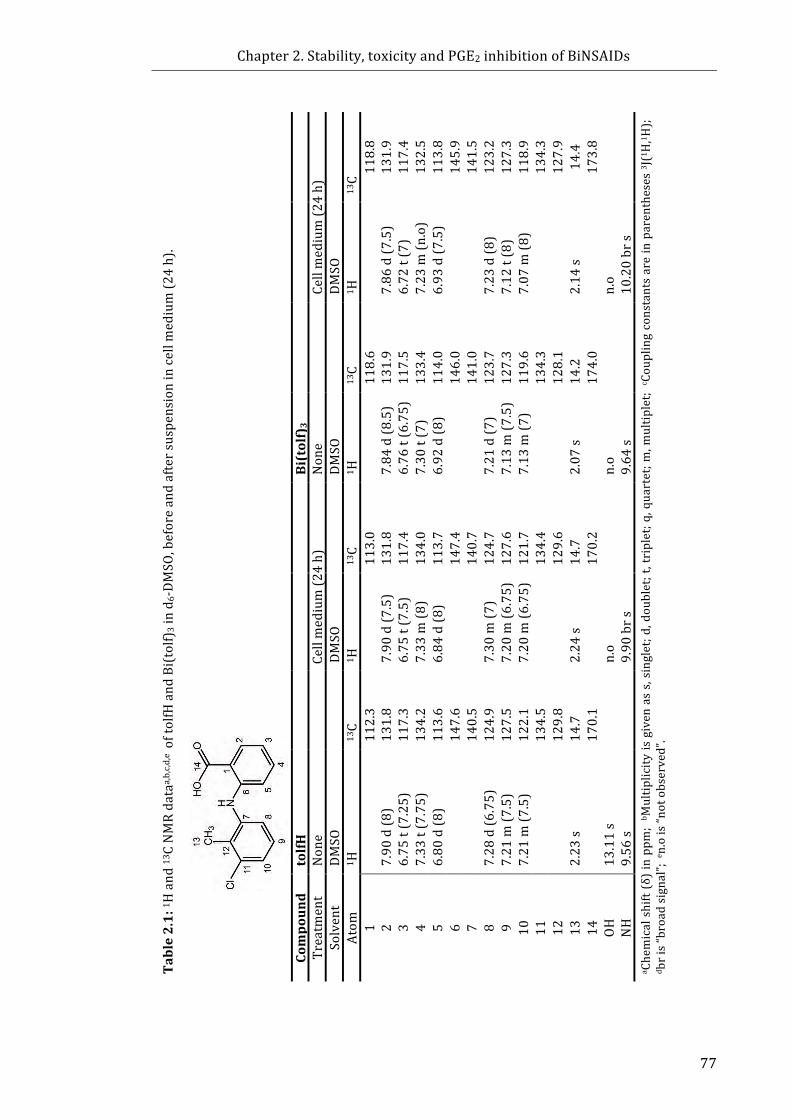
Chapter2.Stability,toxicityandPGE2inhibitionofBiNSAIDs
77
Table2.1:1 H
and
13CNMRdata
a,b,c,d
,e oftolfHand
Bi(tolf)
3ind 6-DMSO
,beforeandaftersuspensionincellm
edium(2
4h).
Cellmedium(2
4h)
13C11
8.8
131.9
117.4
132.5
113.8
145.9
141.5
123.2
127.3
118.9
134.3
127.9
14.4
173.8
a Chemicalshift(δ)inppm
;b M
ultip
licity
isgivenass,singlet;d,doublet;t,triplet;q
,quartet;m
,multip
let;c C
ouplingconstantsareinparentheses3 J(1H,1 H
);
d bris“broadsignal”;e n.ois“n
otobserved”.
DMSO
1 H
7.86
d(7
.5)
6.72
t(7)
7.23
m(n
.o)
6.93
d(7
.5)
7.23
d(8
)7.12
t(8)
7.07
m(8
)
2.14
s
n.o
10.20brs
13C
118.6
131.9
117.5
133.4
114.0
146.0
141.0
123.7
127.3
119.6
134.3
128.1
14.2
174.0
Bi(tolf)3
None
DMSO
1 H
7.84
d(8
.5)
6.76
t(6.75)
7.30
t(7)
6.92
d(8
)
7.21
d(7
)7.13
m(7
.5)
7.13
m(7
)
2.07
s
n.o
9.64
s
Cellm
edium(2
4h)
13C
113.0
131.8
117.4
134.0
113.7
147.4
140.7
124.7
127.6
121.7
134.4
129.6
14.7
170.2
DMSO
1 H
7.90
d(7
.5)
6.75
t(7.5)
7.33
m(8
)6.84
d(8
)
7.30
m(7
)7.20
m(6
.75)
7.20
m(6
.75)
2.24
s
n.o
9.90
brs
13C
112.3
131.8
117.3
134.2
113.6
147.6
140.5
124.9
127.5
122.1
134.5
129.8
14.7
170.1
tolfH
None
DMSO
1 H
7.90
d(8
)6.75
t(7.25)
7.33
t(7.75)
6.80
d(8
) 7.28
d(6
.75)
7.21
m(7
.5)
7.21
m(7
.5)
2.23
s
13.11s
9.56
s
Compoun
dTreatm
ent
Solvent
Atom
1 2 3 4 5 6 7 8 9 10
11
12
13
14
OH
NH
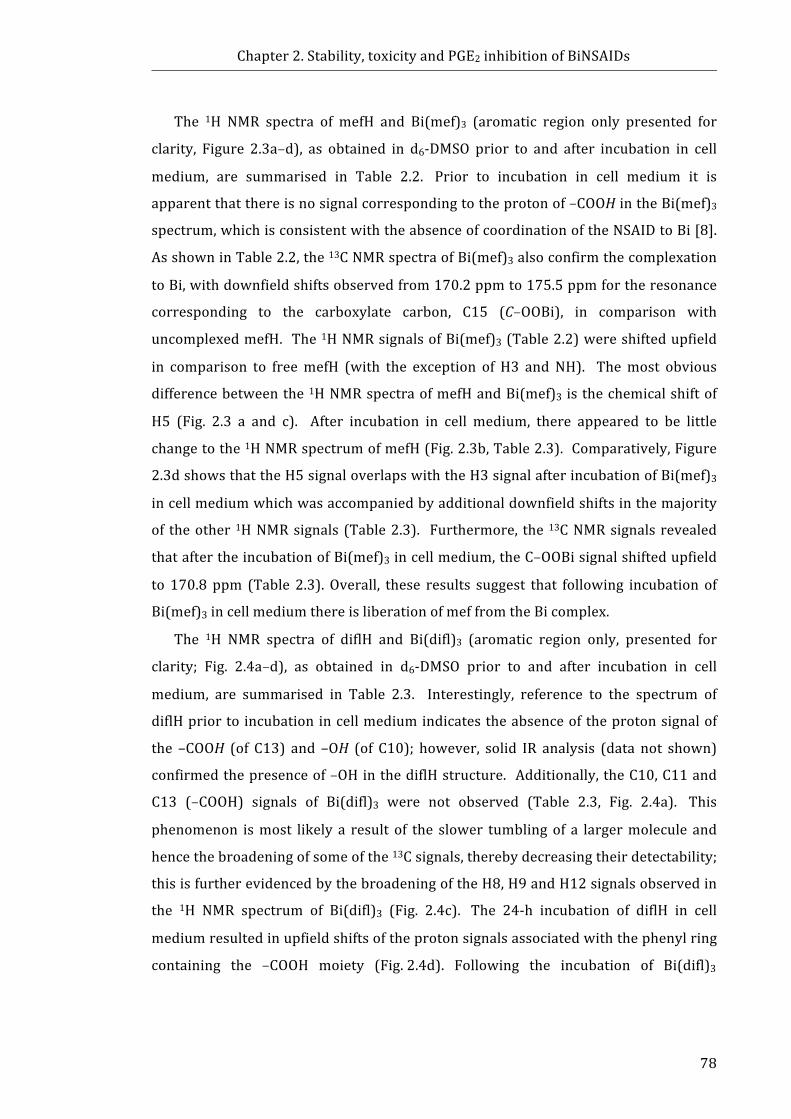
Chapter2.Stability,toxicityandPGE2inhibitionofBiNSAIDs
78
The 1H NMR spectra of mefH and Bi(mef)3 (aromatic region only presented for
clarity, Figure 2.3a–d), as obtained in d6-DMSO prior to and after incubation in cell
medium, are summarised in Table 2.2. Prior to incubation in cell medium it is
apparentthatthereisnosignalcorrespondingtotheprotonof–COOHintheBi(mef)3
spectrum,whichisconsistentwiththeabsenceofcoordinationoftheNSAIDtoBi[8].
AsshowninTable2.2,the13CNMRspectraofBi(mef)3alsoconfirmthecomplexation
toBi,withdownfieldshiftsobservedfrom170.2ppmto175.5ppmfortheresonance
corresponding to the carboxylate carbon, C15 (C–OOBi), in comparison with
uncomplexedmefH. The1HNMRsignalsofBi(mef)3(Table2.2)wereshiftedupfield
in comparison to freemefH (with the exception of H3 and NH). Themost obvious
differencebetweenthe1HNMRspectraofmefHandBi(mef)3 isthechemicalshiftof
H5 (Fig. 2.3 a and c). After incubation in cell medium, there appeared to be little
changetothe1HNMRspectrumofmefH(Fig.2.3b,Table2.3).Comparatively,Figure
2.3dshowsthattheH5signaloverlapswiththeH3signalafterincubationofBi(mef)3
incellmediumwhichwasaccompaniedbyadditionaldownfieldshiftsinthemajority
of theother 1HNMRsignals (Table2.3). Furthermore, the 13CNMRsignalsrevealed
thataftertheincubationofBi(mef)3incellmedium,theC–OOBisignalshiftedupfield
to 170.8 ppm (Table 2.3).Overall, these results suggest that following incubation of
Bi(mef)3incellmediumthereisliberationofmeffromtheBicomplex.
The 1H NMR spectra of diflH and Bi(difl)3 (aromatic region only, presented for
clarity; Fig. 2.4a–d), as obtained in d6-DMSO prior to and after incubation in cell
medium, are summarised in Table 2.3. Interestingly, reference to the spectrum of
diflHpriortoincubationincellmediumindicatestheabsenceoftheprotonsignalof
the –COOH (of C13) and –OH (of C10); however, solid IR analysis (data not shown)
confirmedthepresenceof–OHinthediflHstructure. Additionally,theC10,C11and
C13 (–COOH) signals of Bi(difl)3 were not observed (Table 2.3, Fig. 2.4a). This
phenomenon ismost likely a result of the slower tumblingof a largermolecule and
hencethebroadeningofsomeofthe13Csignals,therebydecreasingtheirdetectability;
thisisfurtherevidencedbythebroadeningoftheH8,H9andH12signalsobservedin
the 1H NMR spectrum of Bi(difl)3 (Fig. 2.4c). The 24-h incubation of diflH in cell
mediumresultedinupfieldshiftsoftheprotonsignalsassociatedwiththephenylring
containingthe–COOHmoiety(Fig.2.4d).FollowingtheincubationofBi(difl)3

Chapter2.Stability,toxicityandPGE2inhibitionofBiNSAIDs
79
Figure 2.3: 1H NMR spectra of the aromatic region (6.6–8.0 ppm) of: (a) mefH; (b) mefHcollectedafterincubationincellmedium(24h,37°C);(c)Bi(mef)3,and(d)Bi(mef)3collectedafterincubationincellmedium(24h,37°C).Allsampleswereanalysedind6-DMSOat25°C(referencedtoDMSO,2.49ppm).
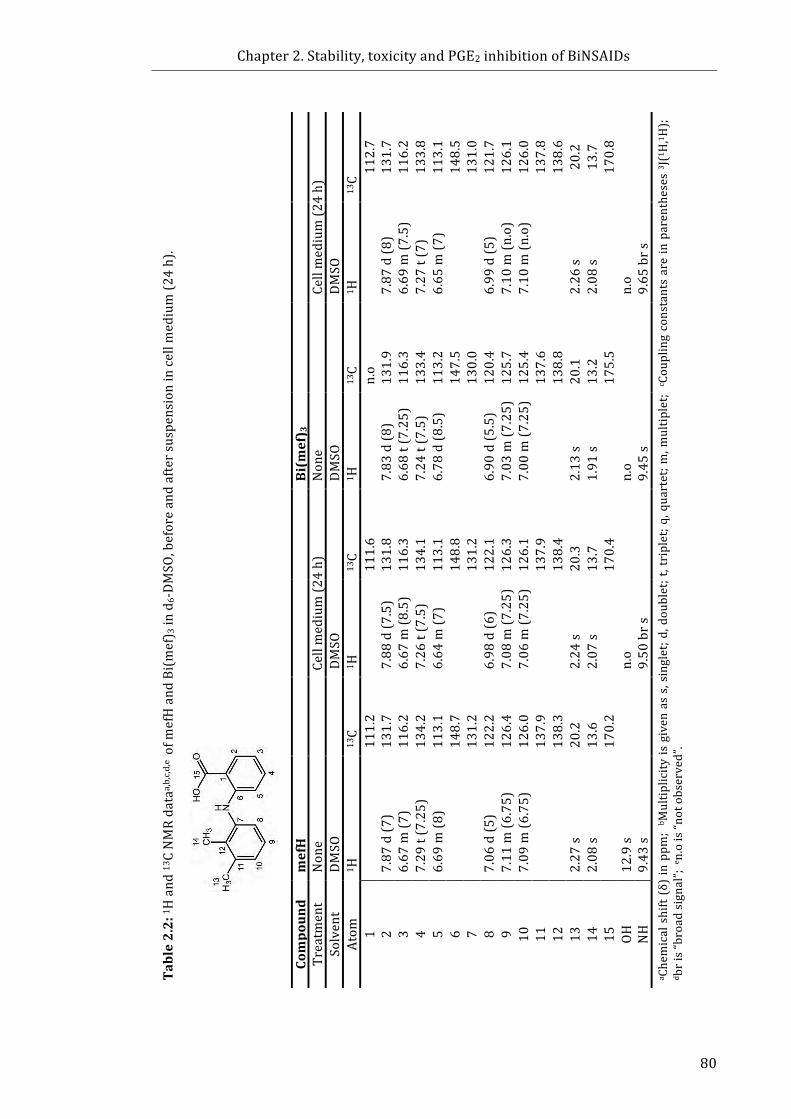
Chapter2.Stability,toxicityandPGE2inhibitionofBiNSAIDs
80
Table2.2:1 H
and
13CNMRdata
a,b,c,d
,e ofm
efHand
Bi(mef) 3ind
6-DMSO
,beforeandaftersuspensionincellm
edium(2
4h).
Cellmedium(2
4h)
13C11
2.7
131.7
116.2
133.8
113.1
148.5
131.0
121.7
126.1
126.0
137.8
138.6
20.2
13.7
170.8
a Chemicalshift(δ)inppm
;b M
ultip
licity
isgivenass,singlet;d,doublet;t,triplet;q
,quartet;m
,multip
let;c C
ouplingconstantsareinparentheses3 J(1H,1 H
);
d bris“broadsignal”;e n.ois“n
otobserved”.
DMSO
1 H
7.87
d(8
)6.69
m(7
.5)
7.27
t(7)
6.65
m(7
)
6.99
d(5
)7.10
m(n
.o)
7.10
m(n
.o)
2.26
s2.08
s
n.o
9.65
brs
13C
n.o
131.9
116.3
133.4
113.2
147.5
130.0
120.4
125.7
125.4
137.6
138.8
20.1
13.2
175.5
Bi(m
ef) 3
None
DMSO
1 H
7.83
d(8
)6.68
t(7.25)
7.24
t(7.5)
6.78
d(8
.5)
6.90
d(5
.5)
7.03
m(7
.25)
7.00
m(7
.25)
2.13
s1.91
s
n.o
9.45
s
Cellm
edium(2
4h)
13C
111.6
131.8
116.3
134.1
113.1
148.8
131.2
122.1
126.3
126.1
137.9
138.4
20.3
13.7
170.4
DMSO
1 H
7.88
d(7
.5)
6.67
m(8
.5)
7.26
t(7.5)
6.64
m(7
)
6.98
d(6
)7.08
m(7
.25)
7.06
m(7
.25)
2.24
s2.07
s
n.o
9.50
brs
13C
111.2
131.7
116.2
134.2
113.1
148.7
131.2
122.2
126.4
126.0
137.9
138.3
20.2
13.6
170.2
mefH
None
DMSO
1 H
7.87
d(7
)6.67
m(7
)7.29
t(7.25)
6.69
m(8
) 7.06
d(5
)7.11
m(6
.75)
7.09
m(6
.75)
2.27
s2.08
s
12.9s
9.43
s
Compoun
dTreatm
ent
Solvent
Atom
1 2 3 4 5 6 7 8 9 10
11
12
13
14
15
OH
NH

Chapter2.Stability,toxicityandPGE2inhibitionofBiNSAIDs
81
incellmedium,apronouncedupfieldshiftintheH8,H9andH121HNMRsignals
was observed (Fig.2.4d), in comparison to freediflH (Fig.2.4b). Additionally, the
carbonsignals forC10,C11andthe–COOHwereobserved(Table2.4)suggestingan
alterationinstructure.However,theC11signaloftheBi(difl)3differssubstantiallyto
thatofdiflHafterincubation(120.4ppmand115.9ppm)whichsuggeststhatdiflmay
remaincoordinatedtoBi.
Interestingly, weak yet observable signals were detected in the 1H NMR from
anothermolecule(s) present in the Bi(difl)3 sample after incubation in cellmedium
which were not detected in any other sample studied. Complete characterisation
couldnotbeachievedduetothe lowconcentrationof themolecule(s). Nonetheless,
the appearanceofweak 1HNMRsignals of theunknownmolecule(s) suggested that
onlymoleculeswithconcentrationcomparabletotheconcentrationofBi(difl)3inthe
cellmediumwouldbedetected,inparticularD-glucoseorHEPES.Referencetothe1H
NMRspectraofD-glucoseorHEPES(alone)ind6-DMSO,suggestedthatthepotential
identity of the molecule(s) in the incubated Bi(difl)3 sample consisted of
D-glucose(Fig.2.5). Overall, the changesobserved in the 1Hand 13CNMRsignalsof
theincubatedBi(difl)3complexcomparedtotheoriginalcompoundmaysuggestthat
thecoordinationofBitothediflligandsisalteredfollowingincubationincellmedium
due,possibly,tosubsequentinteractionswithD-glucose.
AswellastheDMSO-solublespeciesdescribedabove(Fig.2.2–2.5,Table2.1–2.3),
it was noted that a DMSO-insoluble species was present upon preparation of the
samples for NMR analysis (after collection and drying following incubation in cell
medium).Theformationofthewhiteprecipitatewasnotobserveduponincubationof
the free NSAID in cell medium and consequently implied that at least some of the
BiNSAID must be interacting with other species present in the solution. High
concentrations of anions such as phosphate, chloride, sulphate and carbonate are
presentintheinorganicsaltsfoundinRPMI-1640.GiventhatBi(III)hasaparticularly
high affinity for phosphate ions, it is envisaged that the precipitation could be
insoluble Bi(III) phosphate. Identification of the species was attempted using IR
spectroscopy;however,thedominatingsignalsinthespectrumoriginatedfromDMSO
thatproveddifficulttoremoveduetoitsnon-volatilenature.Attemptstorepeatedly
wash the precipitate with MilliQ water were performed; however, due to the
lowquantityofthesolidproduced,isolationofasufficientquantityofdried
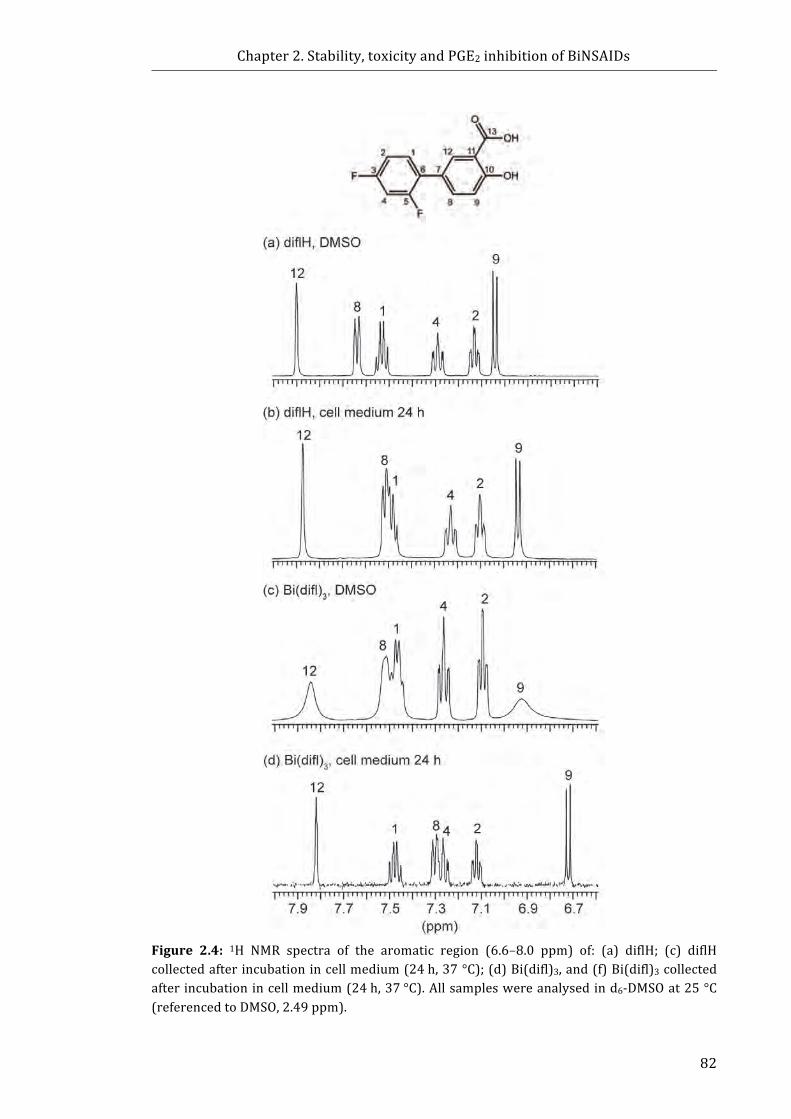
Chapter2.Stability,toxicityandPGE2inhibitionofBiNSAIDs
82
Figure 2.4: 1H NMR spectra of the aromatic region (6.6–8.0 ppm) of: (a) diflH; (c) diflHcollectedafterincubationincellmedium(24h,37°C);(d)Bi(difl)3,and(f)Bi(difl)3collectedafterincubationincellmedium(24h,37°C).Allsampleswereanalysedind6-DMSOat25°C(referencedtoDMSO,2.49ppm).
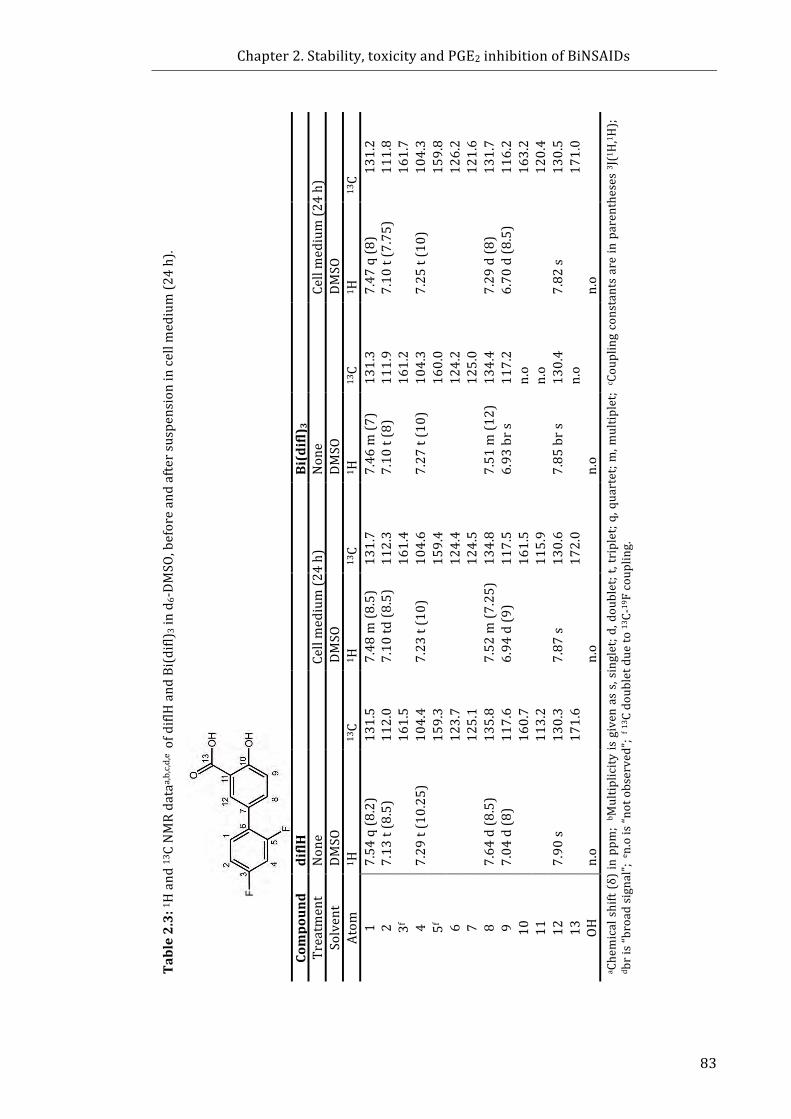
Chapter2.Stability,toxicityandPGE2inhibitionofBiNSAIDs
83
Table2.3:1 H
and
13CNMRdata
a,b,c,d
,e ofdiflHand
Bi(difl)
3ind 6-DMSO
,beforeandaftersuspensionincellm
edium(2
4h).
Cellmedium(2
4h)
13C13
1.2
111.8
161.7
104.3
159.8
126.2
121.6
131.7
116.2
163.2
120.4
130.5
171.0
a Chemicalshift(δ)inppm
;b M
ultip
licity
isgivenass,singlet;d,doublet;t,triplet;q
,quartet;m
,multip
let;c C
ouplingconstantsareinparentheses3 J(1H,1 H
);
d bris“broadsignal”;e n.ois“n
otobserved”;
f 13 Cdoubletdueto13C-
19Fcoup
ling.
DMSO
1 H
7.47
q(8
)7.10
t(7.75)
7.25
t(10)
7.29
d(8
)6.70
d(8
.5)
7.82
s n.o
13C
131.3
111.9
161.2
104.3
160.0
124.2
125.0
134.4
117.2
n.o
n.o
130.4
n.o
Bi(difl) 3
None
DMSO
1 H
7.46
m(7
)7.10
t(8)
7.27
t(10)
7.51
m(1
2)
6.93
brs
7.85
brs
n.o
Cellm
edium(2
4h)
13C
131.7
112.3
161.4
104.6
159.4
124.4
124.5
134.8
117.5
161.5
115.9
130.6
172.0
DMSO
1 H
7.48
m(8
.5)
7.10
td(8
.5)
7.23
t(10)
7.52
m(7
.25)
6.94
d(9
)
7.87
s n.o
13C
131.5
112.0
161.5
104.4
159.3
123.7
125.1
135.8
117.6
160.7
113.2
130.3
171.6
diflH
None
DMSO
1 H
7.54
q(8
.2)
7.13
t(8.5)
7.29
t(10.25
)
7.64
d(8
.5)
7.04
d(8
)
7.90
s n.o
Compoun
dTreatm
ent
Solvent
Atom
1 2 3f 4 5f 6 7 8 9 10
11
12
13
OH
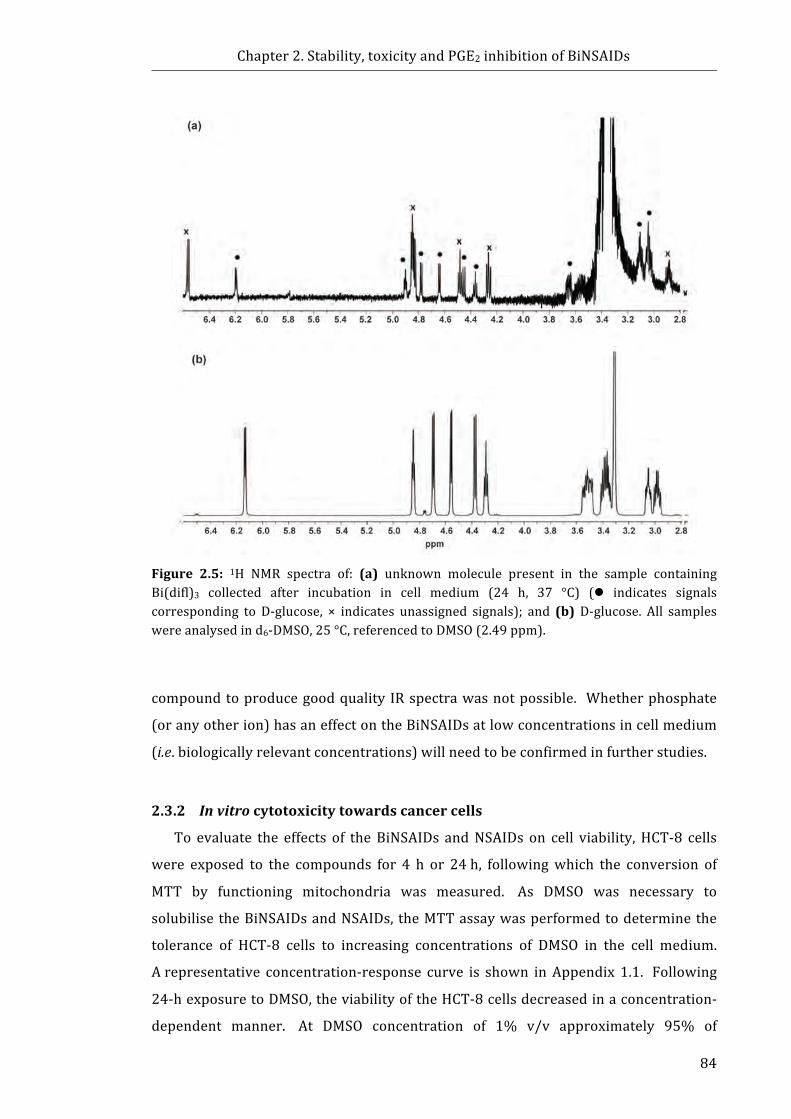
Chapter2.Stability,toxicityandPGE2inhibitionofBiNSAIDs
84
Figure 2.5: 1H NMR spectra of: (a) unknown molecule present in the sample containingBi(difl)3 collected after incubation in cell medium (24 h, 37 °C) (l indicates signalscorresponding to D-glucose, × indicates unassigned signals); and (b) D-glucose. All sampleswereanalysedind6-DMSO,25°C,referencedtoDMSO(2.49ppm).
compoundtoproducegoodquality IRspectrawasnotpossible. Whetherphosphate
(oranyotherion)hasaneffectontheBiNSAIDsatlowconcentrationsincellmedium
(i.e.biologicallyrelevantconcentrations)willneedtobeconfirmedinfurtherstudies.
2.3.2 Invitrocytotoxicitytowardscancercells
To evaluate the effects of theBiNSAIDs andNSAIDs on cell viability,HCT-8 cells
were exposed to the compounds for 4 h or 24h, followingwhich the conversion of
MTT by functioning mitochondria was measured. As DMSO was necessary to
solubilisetheBiNSAIDsandNSAIDs, theMTTassaywasperformedtodeterminethe
tolerance of HCT-8 cells to increasing concentrations of DMSO in the cell medium.
Arepresentative concentration-response curve is shown inAppendix 1.1. Following
24-hexposuretoDMSO,theviabilityoftheHCT-8cellsdecreasedinaconcentration-
dependent manner. At DMSO concentration of 1% v/v approximately 95% of

Chapter2.Stability,toxicityandPGE2inhibitionofBiNSAIDs
85
mitochondrialactivitywasmaintainedcomparedtothecontrolcells(treatedwithcell
medium in the absenceofDMSO). Increasing the concentrationofDMSO to2%v/v
resulted in a decrease in viability to approximately 78% of mitochondrial activity
comparedtothecontrolcells; furtherincreasingtheconcentrationofDMSOresulted
in a further reduction in mitochondrial activity. Despite a minor impact on
mitochondrial activity, a concentration of 2%v/v DMSO was chosen for compound
deliveryinordertomaximizethedissolutionofthehighlywater-insolubleBiNSAIDs
andNSAIDsinthecellmedium.
The concentration-response curves shown in Appendix 1.2 and Figure 2.6 are
graphedfortheNSAIDconcentration(acknowledgingthatthereare3moleofNSAID
present in each BiNSAID complex) following 4-h or 24-h treatment, respectively.
AsshowninAppendix1.2,noappreciablelossofmitochondrialactivitywasobserved
inHCT-8cellsfollowing4-htreatmentwithanyoftheBiNSAIDsorNSAIDsuptothe
highest tested concentrations (300 µM or 1000µM). However, following 24-h
exposure to BiNSAIDs the viability of HCT-8 cells decreased in a concentration-
dependentmanner (Figure 2.6). The IC50 values determined after 24-h exposure to
the BiNSAID complexes and reference compounds (cisplatin, BiCl3, and BSS) are
summarised in Table 2.4. Notably, the compounds, Bi(tolf)3, Bi(mef)3, and tolfH
(Table2.4,Fig.2.6),weremoretoxictoHCT-8cellsthantheanti-cancerdrug,cisplatin
(Table2.4,Appendix1.3).Bismuthsalicylate,whichwasusedtomimictheanti-ulcer
drug,BSS,showedlittleeffectontheviabilityoftheHCT-8cellsupto2000µM(Table
2.4, Appendix 1.3). However, the Bi compound, BiCl3, showed moderate toxicity
(IC50=383μM)towardstheHCT-8cells (Table2.4,Appendix1.3). Followingclose
inspection of the results obtained from the BiNSAIDs it is apparent that their
IC50values are lower than the respective free NSAIDs (Table 2.4), ranging from
16–81μM(BiNSAIDs) to 37–403μM (NSAIDs). Importantly, the toxicity of the
BiNSAIDs increased in the order: Bi(difl)3 < Bi(mef)3 < Bi(tolf)3 paralleling the
responseexhibitedbythefreeNSAIDs(diflH<mefH<tolfH).Figure2.6demonstrates
that the toxicity profiles of theBiNSAIDs, Bi(tolf)3 andBi(mef)3,were similar to the
respective freeNSAIDs(tolfHandmefH)whereby theBiNSAIDswereapproximately
three timesmore toxic than the respective freeNSAIDs (representativeof themolar
ratio of NSAID contained in the BiNSAID complexes). The results of the assay for
Bi(difl)3differ,however,wherebythebindingofdifltobismuthenhancedthetoxicity
oftheNSAID(Fig.2.6).
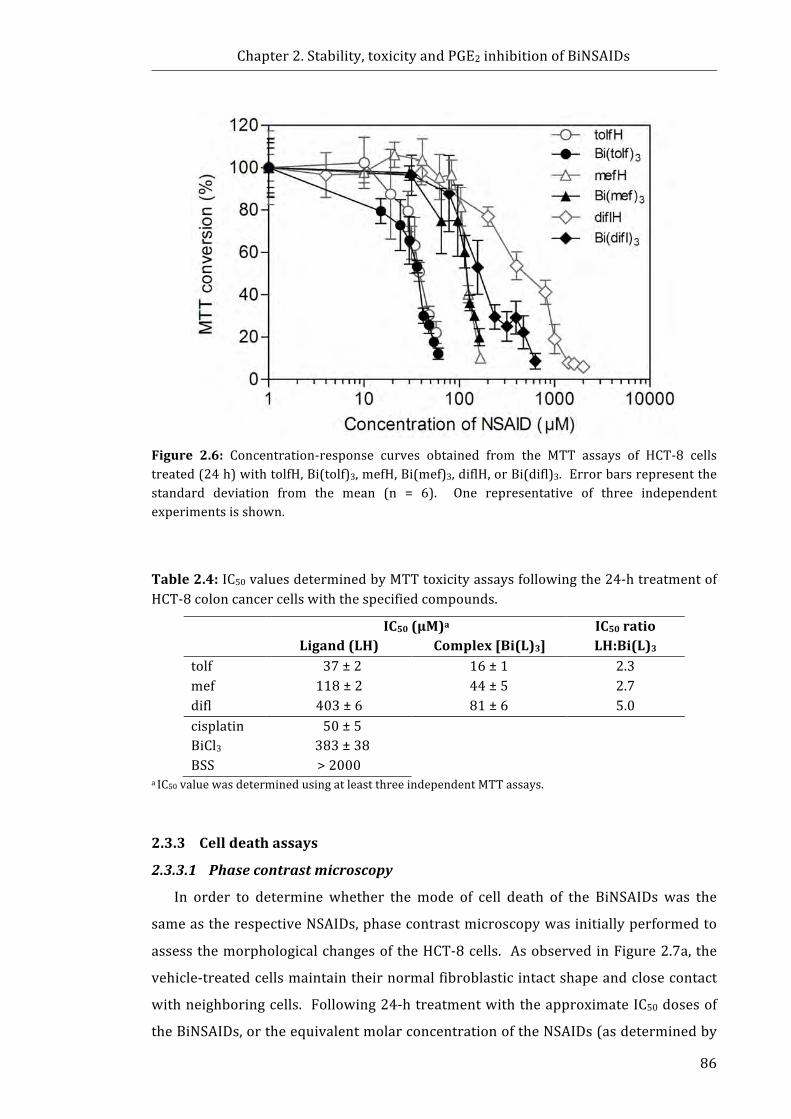
Chapter2.Stability,toxicityandPGE2inhibitionofBiNSAIDs
86
Figure 2.6: Concentration-response curves obtained from the MTT assays of HCT-8 cellstreated(24h)withtolfH,Bi(tolf)3,mefH,Bi(mef)3,diflH,orBi(difl)3.Errorbarsrepresentthestandard deviation from the mean (n = 6). One representative of three independentexperimentsisshown.
Table2.4:IC50valuesdeterminedbyMTTtoxicityassaysfollowingthe24-htreatmentofHCT-8coloncancercellswiththespecifiedcompounds.
IC50(µM)aLigand(LH)Complex[Bi(L)3]
IC50ratioLH:Bi(L)3
tolf 37±2 16±1 2.3mef 118±2 44±5 2.7difl 403±6 81±6 5.0cisplatin 50±5 BiCl3 383±38 BSS >2000
aIC50valuewasdeterminedusingatleastthreeindependentMTTassays.
2.3.3 Celldeathassays
2.3.3.1 Phasecontrastmicroscopy
In order to determine whether themode of cell death of the BiNSAIDs was the
sameastherespectiveNSAIDs,phasecontrastmicroscopywasinitiallyperformedto
assessthemorphologicalchangesoftheHCT-8cells. AsobservedinFigure2.7a,the
vehicle-treatedcellsmaintaintheirnormalfibroblasticintactshapeandclosecontact
withneighboringcells. Following24-htreatmentwiththeapproximateIC50dosesof
theBiNSAIDs,ortheequivalentmolarconcentrationoftheNSAIDs(asdeterminedby
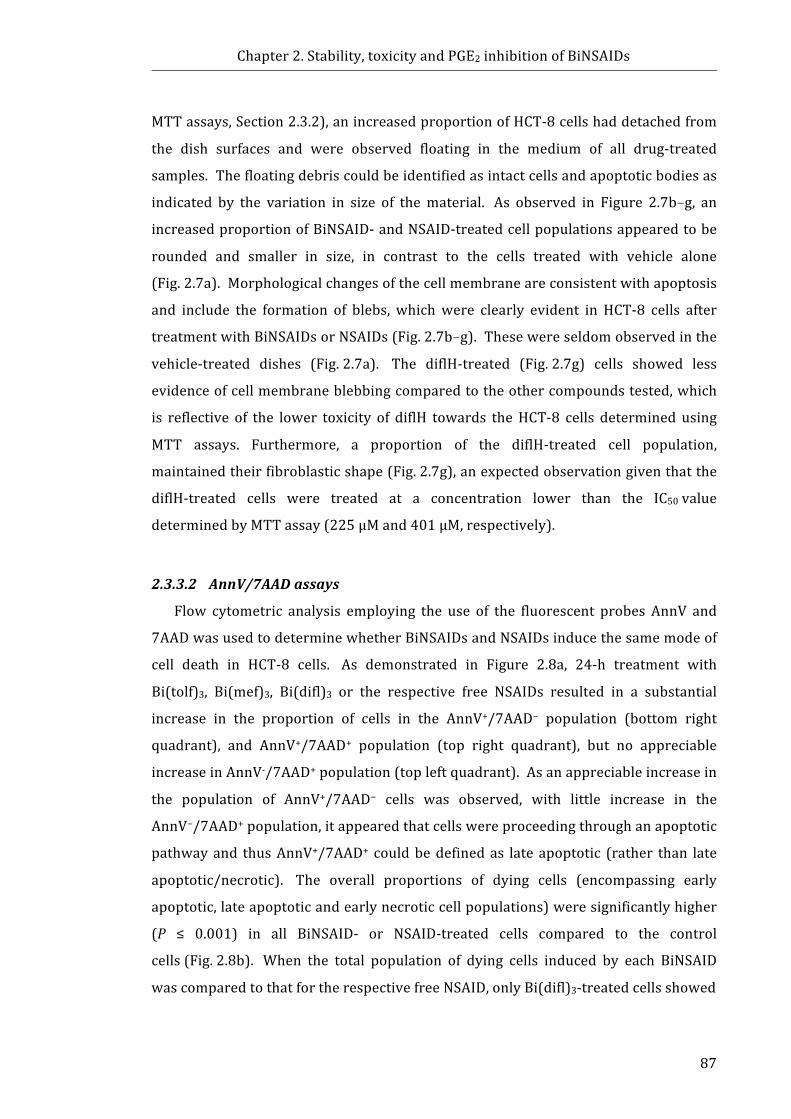
Chapter2.Stability,toxicityandPGE2inhibitionofBiNSAIDs
87
MTTassays,Section2.3.2),anincreasedproportionofHCT-8cellshaddetachedfrom
the dish surfaces and were observed floating in the medium of all drug-treated
samples.Thefloatingdebriscouldbeidentifiedasintactcellsandapoptoticbodiesas
indicated by the variation in size of thematerial. As observed in Figure 2.7b–g, an
increasedproportionofBiNSAID-andNSAID-treatedcellpopulationsappearedtobe
rounded and smaller in size, in contrast to the cells treated with vehicle alone
(Fig.2.7a).Morphologicalchangesofthecellmembraneareconsistentwithapoptosis
and include the formation of blebs, whichwere clearly evident in HCT-8 cells after
treatmentwithBiNSAIDsorNSAIDs(Fig.2.7b–g).Thesewereseldomobservedinthe
vehicle-treated dishes (Fig.2.7a). The diflH-treated (Fig.2.7g) cells showed less
evidenceofcellmembraneblebbingcomparedtotheothercompoundstested,which
is reflective of the lower toxicity of diflH towards theHCT-8 cells determined using
MTT assays. Furthermore, a proportion of the diflH-treated cell population,
maintainedtheirfibroblasticshape(Fig.2.7g),anexpectedobservationgiventhatthe
diflH-treated cells were treated at a concentration lower than the IC50value
determinedbyMTTassay(225μMand401μM,respectively).
2.3.3.2 AnnV/7AADassays
Flow cytometric analysis employing the use of the fluorescent probes AnnV and
7AADwasusedtodeterminewhetherBiNSAIDsandNSAIDsinducethesamemodeof
cell death in HCT-8 cells. As demonstrated in Figure 2.8a, 24-h treatment with
Bi(tolf)3, Bi(mef)3, Bi(difl)3 or the respective free NSAIDs resulted in a substantial
increase in the proportion of cells in the AnnV+/7AAD− population (bottom right
quadrant), and AnnV+/7AAD+ population (top right quadrant), but no appreciable
increaseinAnnV-/7AAD+population(topleftquadrant).Asanappreciableincreasein
the population of AnnV+/7AAD− cells was observed, with little increase in the
AnnV−/7AAD+population,itappearedthatcellswereproceedingthroughanapoptotic
pathwayand thusAnnV+/7AAD+ couldbedefinedas lateapoptotic (rather than late
apoptotic/necrotic). The overall proportions of dying cells (encompassing early
apoptotic,lateapoptoticandearlynecroticcellpopulations)weresignificantlyhigher
(P ≤ 0.001) in all BiNSAID- or NSAID-treated cells compared to the control
cells(Fig.2.8b). When the total population of dying cells induced by each BiNSAID
wascomparedtothatfortherespectivefreeNSAID,onlyBi(difl)3-treatedcellsshowed
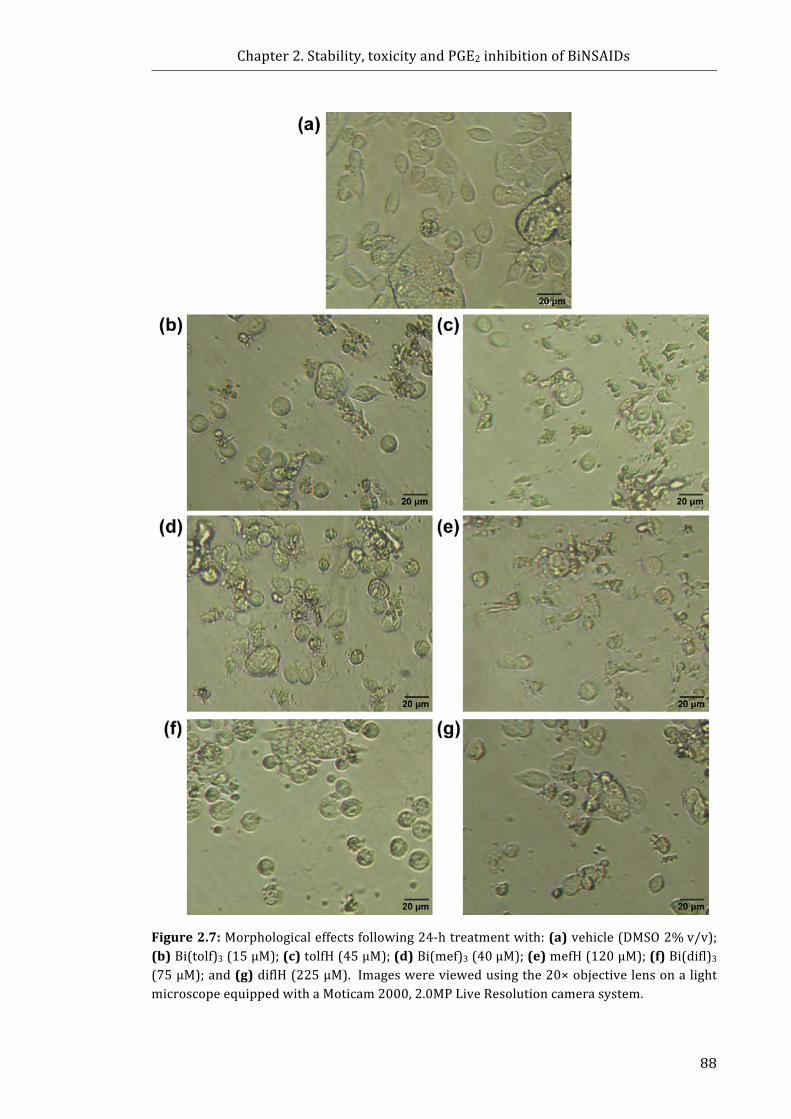
Chapter2.Stability,toxicityandPGE2inhibitionofBiNSAIDs
88
Figure2.7:Morphologicaleffectsfollowing24-htreatmentwith:(a)vehicle(DMSO2%v/v);(b)Bi(tolf)3(15μM);(c)tolfH(45μM);(d)Bi(mef)3(40μM);(e)mefH(120μM);(f)Bi(difl)3(75μM);and(g)diflH(225μM).Imageswereviewedusingthe20×objectivelensonalightmicroscopeequippedwithaMoticam2000,2.0MPLiveResolutioncamerasystem.
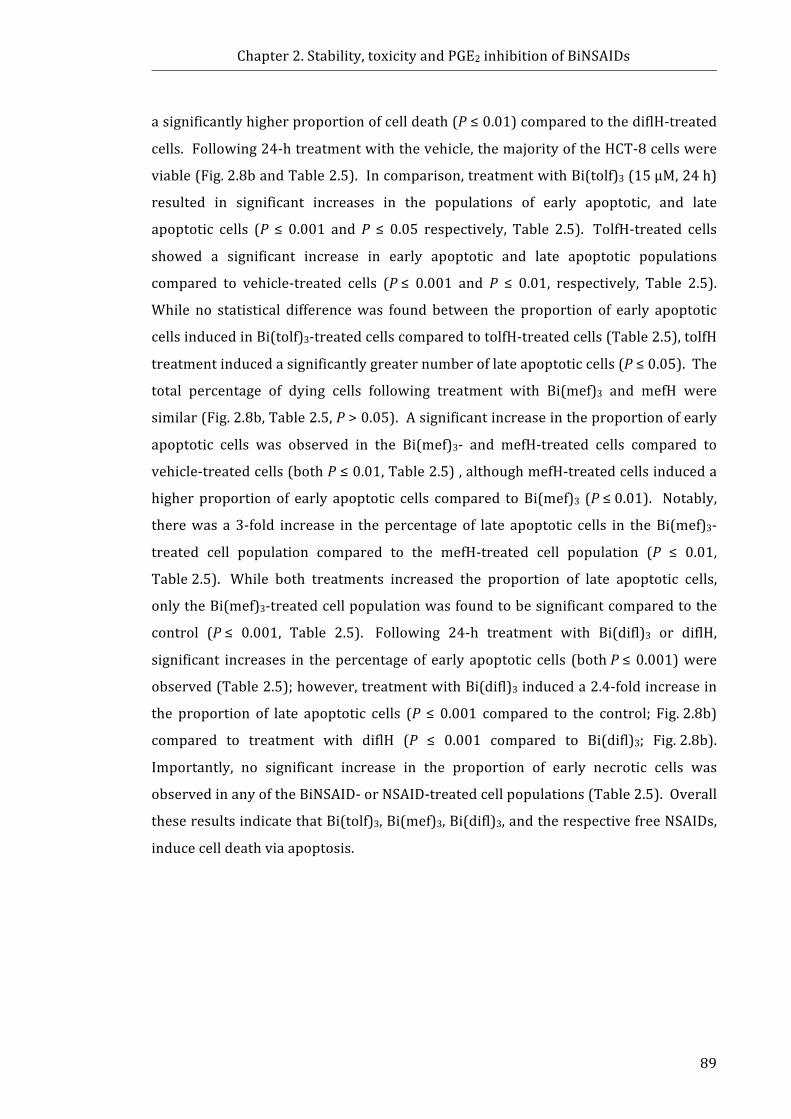
Chapter2.Stability,toxicityandPGE2inhibitionofBiNSAIDs
89
asignificantlyhigherproportionofcelldeath(P≤0.01)comparedtothediflH-treated
cells.Following24-htreatmentwiththevehicle,themajorityoftheHCT-8cellswere
viable(Fig.2.8bandTable2.5).Incomparison,treatmentwithBi(tolf)3(15μM,24h)
resulted in significant increases in the populations of early apoptotic, and late
apoptotic cells (P ≤ 0.001 andP ≤ 0.05 respectively, Table 2.5). TolfH-treated cells
showed a significant increase in early apoptotic and late apoptotic populations
compared to vehicle-treated cells (P≤ 0.001 and P ≤ 0.01, respectively, Table 2.5).
While no statistical differencewas found between the proportion of early apoptotic
cellsinducedinBi(tolf)3-treatedcellscomparedtotolfH-treatedcells(Table2.5),tolfH
treatmentinducedasignificantlygreaternumberoflateapoptoticcells(P≤0.05).The
total percentage of dying cells following treatment with Bi(mef)3 and mefH were
similar(Fig.2.8b,Table2.5,P>0.05).Asignificantincreaseintheproportionofearly
apoptotic cells was observed in the Bi(mef)3- and mefH-treated cells compared to
vehicle-treatedcells(bothP≤0.01,Table2.5),althoughmefH-treatedcellsinduceda
higherproportionof early apoptotic cells compared toBi(mef)3 (P≤0.01). Notably,
therewas a 3-fold increase in thepercentage of late apoptotic cells in theBi(mef)3-
treated cell population compared to the mefH-treated cell population (P ≤ 0.01,
Table2.5). While both treatments increased the proportion of late apoptotic cells,
onlytheBi(mef)3-treatedcellpopulationwasfoundtobesignificantcomparedtothe
control (P≤ 0.001, Table 2.5). Following 24-h treatment with Bi(difl)3 or diflH,
significant increases in thepercentageof early apoptotic cells (bothP≤0.001)were
observed(Table2.5);however,treatmentwithBi(difl)3induceda2.4-foldincreasein
the proportion of late apoptotic cells (P ≤ 0.001 compared to the control; Fig.2.8b)
compared to treatment with diflH (P ≤ 0.001 compared to Bi(difl)3; Fig.2.8b).
Importantly, no significant increase in the proportion of early necrotic cells was
observedinanyoftheBiNSAID-orNSAID-treatedcellpopulations(Table2.5).Overall
theseresultsindicatethatBi(tolf)3,Bi(mef)3,Bi(difl)3,andtherespectivefreeNSAIDs,
inducecelldeathviaapoptosis.
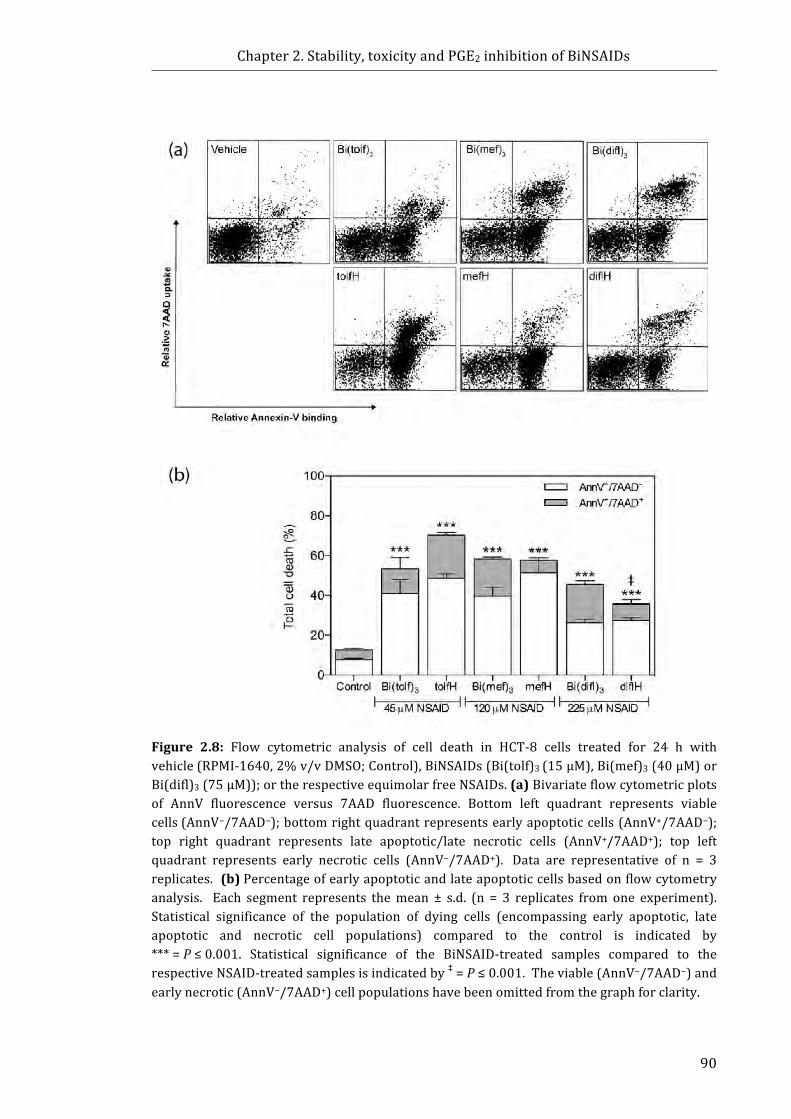
Chapter2.Stability,toxicityandPGE2inhibitionofBiNSAIDs
90
Figure 2.8: Flow cytometric analysis of cell death in HCT-8 cells treated for 24 h withvehicle(RPMI-1640,2%v/vDMSO;Control),BiNSAIDs(Bi(tolf)3(15µM),Bi(mef)3(40µM)orBi(difl)3(75µM));ortherespectiveequimolarfreeNSAIDs.(a)Bivariateflowcytometricplotsof AnnV fluorescence versus 7AAD fluorescence. Bottom left quadrant represents viablecells(AnnV−/7AAD−);bottomrightquadrantrepresentsearlyapoptoticcells(AnnV+/7AAD−);top right quadrant represents late apoptotic/late necrotic cells (AnnV+/7AAD+); top leftquadrant represents early necrotic cells (AnnV−/7AAD+). Data are representative of n = 3replicates.(b)Percentageofearlyapoptoticandlateapoptoticcellsbasedonflowcytometryanalysis. Each segment represents themean ± s.d. (n = 3 replicates from one experiment).Statistical significance of the population of dying cells (encompassing early apoptotic, lateapoptotic and necrotic cell populations) compared to the control is indicated by***=P≤0.001. Statistical significance of the BiNSAID-treated samples compared to therespectiveNSAID-treatedsamplesisindicatedby‡=P≤0.001.Theviable(AnnV−/7AAD−)andearlynecrotic(AnnV−/7AAD+)cellpopulationshavebeenomittedfromthegraphforclarity.
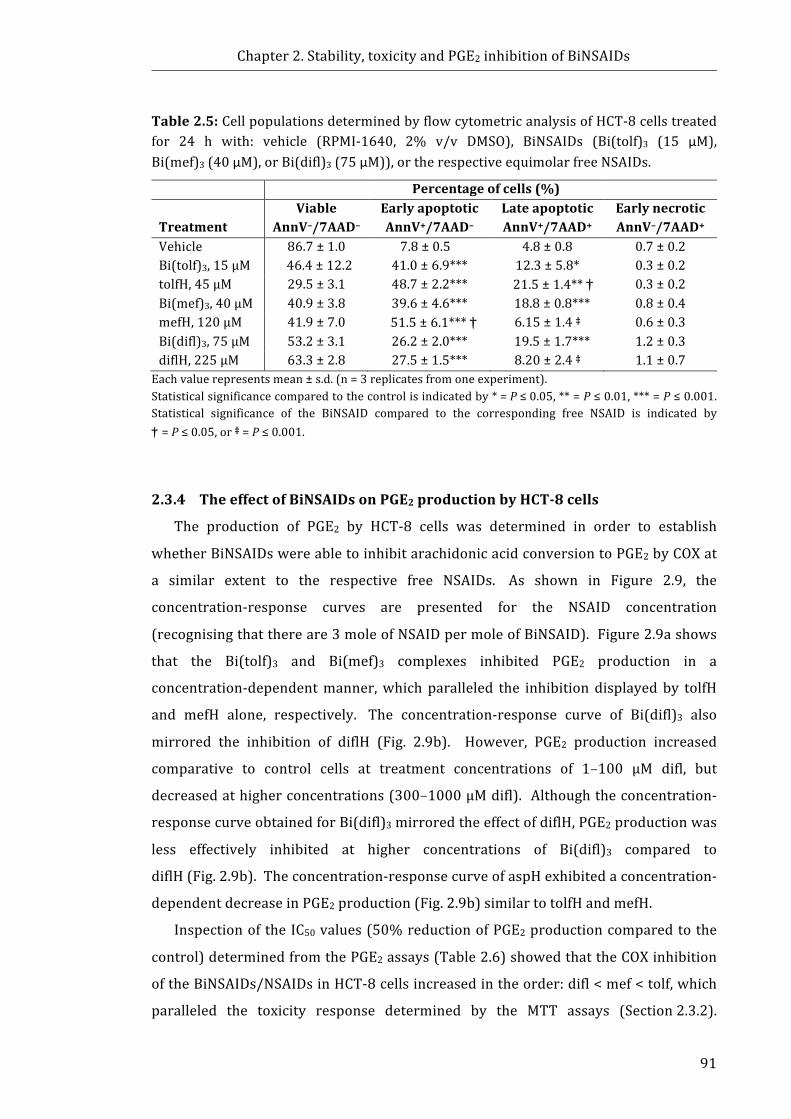
Chapter2.Stability,toxicityandPGE2inhibitionofBiNSAIDs
91
Table2.5:CellpopulationsdeterminedbyflowcytometricanalysisofHCT-8cellstreatedfor 24 h with: vehicle (RPMI-1640, 2% v/v DMSO), BiNSAIDs (Bi(tolf)3 (15 µM),Bi(mef)3(40µM),orBi(difl)3(75µM)),ortherespectiveequimolarfreeNSAIDs.
Percentageofcells(%) Treatment
ViableAnnV–/7AAD–
EarlyapoptoticAnnV+/7AAD–
LateapoptoticAnnV+/7AAD+
EarlynecroticAnnV–/7AAD+
Vehicle 86.7±1.0 7.8±0.5 4.8±0.8 0.7±0.2Bi(tolf)3,15µM 46.4±12.2 41.0±6.9*** 12.3±5.8* 0.3±0.2tolfH,45µM 29.5±3.1 48.7±2.2*** 21.5±1.4**†† 0.3±0.2Bi(mef)3,40µM 40.9±3.8 39.6±4.6*** 18.8±0.8*** 0.8±0.4mefH,120µM 41.9±7.0 51.5±6.1***†† 6.15±1.4‡ 0.6±0.3Bi(difl)3,75µM 53.2±3.1 26.2±2.0*** 19.5±1.7*** 1.2±0.3diflH,225µM 63.3±2.8 27.5±1.5*** 8.20±2.4‡ 1.1±0.7
Eachvaluerepresentsmean±s.d.(n=3replicatesfromoneexperiment).Statisticalsignificancecomparedtothecontrolisindicatedby*=P≤0.05,**=P≤0.01,***=P≤0.001.Statistical significance of the BiNSAID compared to the corresponding free NSAID is indicated by†† =P≤0.05,or‡=P≤0.001.
2.3.4 TheeffectofBiNSAIDsonPGE2productionbyHCT-8cells
The production of PGE2 by HCT-8 cells was determined in order to establish
whetherBiNSAIDswereabletoinhibitarachidonicacidconversiontoPGE2byCOXat
a similar extent to the respective free NSAIDs. As shown in Figure 2.9, the
concentration-response curves are presented for the NSAID concentration
(recognisingthatthereare3moleofNSAIDpermoleofBiNSAID).Figure2.9ashows
that the Bi(tolf)3 and Bi(mef)3 complexes inhibited PGE2 production in a
concentration-dependentmanner,whichparalleled the inhibitiondisplayedby tolfH
and mefH alone, respectively. The concentration-response curve of Bi(difl)3 also
mirrored the inhibition of diflH (Fig. 2.9b). However, PGE2 production increased
comparative to control cells at treatment concentrations of 1–100 µM difl, but
decreasedathigherconcentrations(300–1000µMdifl). Althoughtheconcentration-
responsecurveobtainedforBi(difl)3mirroredtheeffectofdiflH,PGE2productionwas
less effectively inhibited at higher concentrations of Bi(difl)3 compared to
diflH(Fig.2.9b).Theconcentration-responsecurveofaspHexhibitedaconcentration-
dependentdecreaseinPGE2production(Fig.2.9b)similartotolfHandmefH.
InspectionoftheIC50values(50%reductionofPGE2productioncomparedtothe
control)determinedfromthePGE2assays(Table2.6)showedthattheCOXinhibition
oftheBiNSAIDs/NSAIDsinHCT-8cellsincreasedintheorder:difl<mef<tolf,which
paralleled the toxicity response determined by the MTT assays (Section2.3.2).
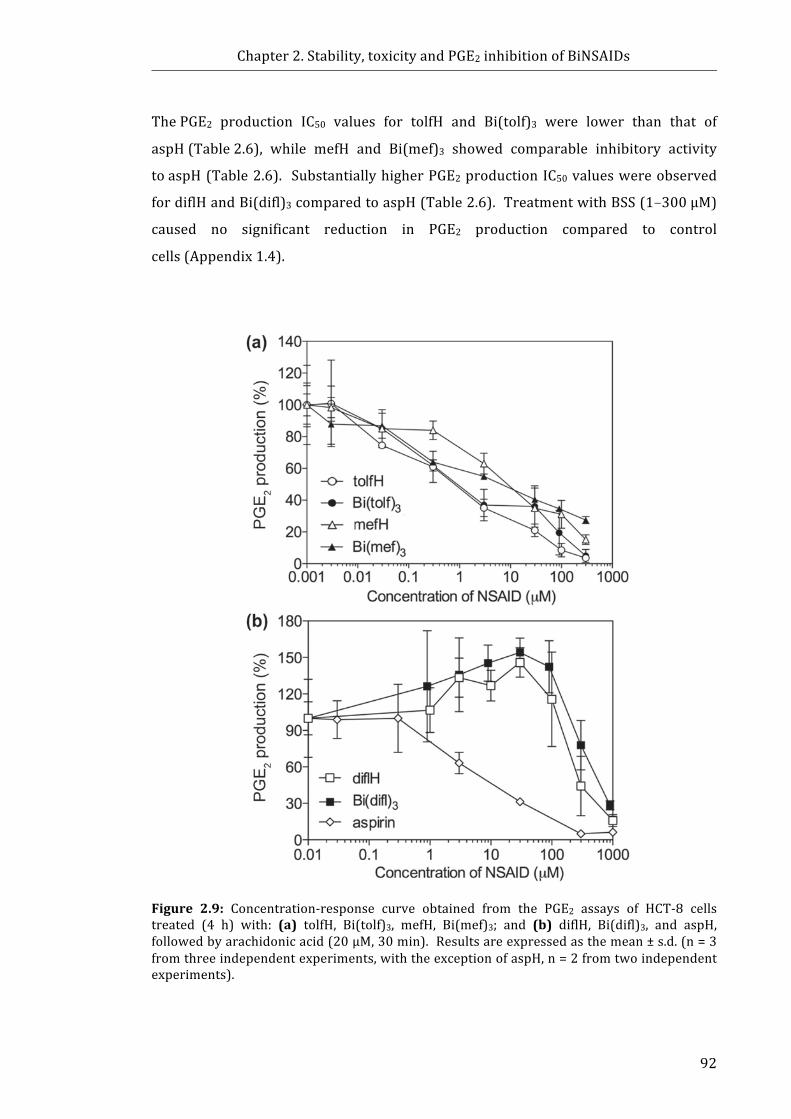
Chapter2.Stability,toxicityandPGE2inhibitionofBiNSAIDs
92
ThePGE2 production IC50 values for tolfH and Bi(tolf)3 were lower than that of
aspH(Table2.6), while mefH and Bi(mef)3 showed comparable inhibitory activity
toaspH(Table2.6). SubstantiallyhigherPGE2productionIC50valueswereobserved
fordiflHandBi(difl)3comparedtoaspH(Table2.6).TreatmentwithBSS(1–300µM)
caused no significant reduction in PGE2 production compared to control
cells(Appendix1.4).
Figure 2.9: Concentration-response curve obtained from the PGE2 assays of HCT-8 cellstreated (4 h) with: (a) tolfH, Bi(tolf)3, mefH, Bi(mef)3; and (b) diflH, Bi(difl)3, and aspH,followedbyarachidonicacid(20µM,30min).Resultsareexpressedasthemean±s.d.(n=3fromthreeindependentexperiments,withtheexceptionofaspH,n=2fromtwoindependentexperiments).

Chapter2.Stability,toxicityandPGE2inhibitionofBiNSAIDs
93
Table2.6: IC50valuesdeterminedbyPGE2assaysfollowing4-htreatmentofHCT-8cellswiththespecifiedcompounds.
Treatment
IC50(µM)aLigand(LH)Complex[Bi(L)3]
IC50ratioLH:Bi(L)3
tolf 1.3±0.7 0.5±0.3 2.6mef 23±16 10±8 2.3difl 340±180 203±32 1.7asp 13±4 BSS n.d.
aIC50valuewasdeterminedfromthreeindependentexperiments(withtheexceptionofaspH,whichwasdeterminedfromtwoindependentexperiments).n.d.=notdetermined.
Chapter2.Stability,toxicityandPGE2inhibitionofBiNSAIDs
94
2.4 Discussion2.4.1 NMRstabilitystudies
NMRspectroscopywasused to investigate thestructural stabilityofBiNSAIDs in
RPMI-1640 cellmedium to gain an understanding of the possible biologically active
species and interactions that give rise to the observed toxicity (examined in
Section2.3.2), cell uptake and localisation of the Bi (discussed in Chapter 3). The
sparingsolubilityofBiNSAIDsinaqueoussolutionsandanumberofcommonorganic
solvents (such as methanol, acetonitrile and chloroform) limited the analytical
techniqueswhichcouldbeusedforthestabilitystudies;however,thehighsolubility
of the compounds in DMSO meant that NMR spectroscopy was suitable.
Unfortunately, the low sensitivity of 1HNMR spectroscopy for the complexes at the
lowconcentrationsemployedincellassays(40μM)meantthatitwasnecessarytouse
higherconcentrationsoftheBiNSAIDs.Itshouldbenotedthatlittletonoprecipitate
wasobserved in the cellmediumat theBiNSAIDconcentrationsused for cell assays
andassuchtheNMRstudy(~600μMBi)representsthemostextremecasescenario
performedinordertoexplorewhatpotentialproductsmightform.
The NMR studies were limited to studying the chemical shifts of the 1H and13Csignals.Theoretically,the209Bisignal(chemicalshiftrangeof~5000ppm)could
beusedtostudytheenvironmentalsymmetryoftheBinuclei,andhenceanychanges
in the complexation of the NSAIDs. Bi has ideal properties for NMR studies due to
100% natural abundance of 209Bi and its high receptivity (0.144 relative to 1H, and
8.48×10²relativeto13C)[59,60].Anattemptwasmadetostudythe209Binucleiin
thepresentstudy;however, thisprovedunsuccessfulduetodifficultiestuningto209Bi nuclear resonance frequency with the broadband probe of the NMR
spectrometerused for theNMRstudies (DrWilfordLie, personal communication).
In theabsenceof instrument limitations,arecentreview[60]commentedonthe
difficultnatureofrecording209Bispectraduetothebroadsignalthatitproduces,
andasaresulttherearefewBiNMRstudiesreportedintheliterature.
TheNMRresults(Section2.3.1)indicatedthatthestabilityoftheBiNSAIDsincell
mediummight be influenced directly by the structure of the NSAID ligands, since a
marked effect in the stability of the BiNSAIDs was observed by the substitution of
–Cl(tolfH)for–CH3(mefH). ThedifferenceinthestabilityofBi(tolf)3andBi(mef)3is
unlikely to be related to physicochemical properties of the free NSAIDs because
similar values are reported for both the pKa [61-63] and logP [64] values of tolfH
Chapter2.Stability,toxicityandPGE2inhibitionofBiNSAIDs
95
andmefH.ItisnotablethatthetolfHandmefHmoleculesdifferonlybythepresence
of an electron-withdrawing group (–Cl) and an electron-donating group (–CH3).
However,thesegroupsarelocatedontheoppositephenylringofmoleculetotheBi–
carboxylatebond;assuchtheatomicdistanceislikelytobetoofarawaytohaveany
through-bond influence that affects the stability of the Bi–carboxylate bond.
Ultimately, further studies would be required to determine the exact nature of the
interactionofBi(tolf)3andBi(mef)3incellmedium.
TheNMR studies suggested that following incubationofBi(difl)3 in cellmedium,
ligandexchangereactionsmaybe facilitatedby thehighconcentrationsofD-glucose
present in RPMI-1640(~11 mM [65]). It is postulated that partial substitution by
glucosylontotheBicomplexcouldpotentiallyresultintheformationofBi(difl)2gluor
Bi(difl)glu2 (where glu = glucosyl) complexes; however, further studies would be
required to confirm this. The involvement of glucose should be further studied to
explore the likelihood of this occurring in bloodwherein the normal blood glucose
concentrationisapproximately5mM[66].
While the NMR studies performed in the current study provide some useful
insights into thestabilityof theBiNSAIDs incellmedium, ithasbeensuggested that
theuseofsolid-stateNMRcouldbeanothersuitabletechniquetostudythestabilityof
the BiNSAIDs following incubation of the complexes in various biological
media(ProfessorPhilipAndrews,personalcommunication).Oneofthedisadvantages
ofsolid-stateNMRisthatitcantakeuptothreedaystorunonesomesample,and3-h
warm-up time is required prior to replacing the cryo-probe with an ambient
temperature solid-state probe (Dr Wilford Lie, personal communication).
Additionally,giventhatinorganicsamplestypicallyrequire100–200mgofcompound
foreachmeasurement[67]andthelimitedquantitiesofBiNSAIDssynthesisedforthe
studiesdescribedinthisThesis,theuseofsolidstateNMRwasunfeasible.
2.4.2 Invitrocytotoxicitytowardscancercells
Inordertodetermine ifa leadcompoundhasanypotential fordevelopmentasa
chemotherapeutic drug, the in vitro toxicity towards tumour cell lines needs to be
determined first [68]. As discussed in Section 2.1.2, the BiNSAIDs exhibit limited
solubility in aqueous solutions (including biological medium) and some organic
solvents.FollowingrangefindingstudiestodeterminefeasibleDMSOconcentrations,
the BiNSAIDswere solubilised in DMSO (final concentration 2% v/v) prior to their
Chapter2.Stability,toxicityandPGE2inhibitionofBiNSAIDs
96
additiontocellmediumfor invitro testingagainst theHCT-8cells. While theuseof
DMSO should be revisited for in vivo testing, the solubility of the BiNSAIDs was
substantiallyimprovedinordertointroducethecomplexesintothecellmediumforin
vitro testing. In addition, the range finding ensured the optimal balance between
minimal DMSO toxicity and maximal solubilisation of the BiNSAIDs and NSAIDs,
allowingforthesuccessfuldeterminationofIC50values(Table2.4)andcomparisonof
thetoxicityoftheBiNSAIDstoeachotherandtherespectiveNSAIDs.
TheMTTassays(Section2.3.2)showedthattheorderoftoxicityoftheBiNSAIDs
paralleledtheresponseexhibitedbythefreeNSAIDs(tolfH>mefH>diflH),suggesting
thatNSAIDsareprimarilyresponsibleforthetoxicityoftheBiNSAIDs.Additionally,if
the IC50 ratio LH:BiL3 was close to 3, it may be assumed that the NSAIDs are
predominantlyresponsibleforthetoxicityoftheBiNSAIDs(acknowledgingthereare
3moleofNSAIDpermoleofBi). TheIC50ratiosoftolfH:Bi(tolf)3andmefH:Bi(mef)3
were found tobe2.3 and2.7, respectively (Table2.4). WhileBi(tolf)3 exhibited the
highestIC50valueofthethreeBiNSAIDstested,theIC50ratiotolfH:Bi(tolf)3potentially
indicated that tolf is slightly less toxic to HCT-8 cells when complexed to Bi.
Alternatively, the IC50 ratio of mefH:Bi(mef)3 was closer to 3, potentially indicating
that complexation of mef to Bi had little effect on the toxicity of mefH. Although
Bi(difl)3wastheleasttoxicofthethreeBiNSAIDswhentheratiooftheIC50valueswas
considered (diflH:Bi(difl)3 = 5.0, Table 2.4), Bi(difl)3 showed substantially higher
toxicity than that expected for diflH, indicating that difl was more toxic when
complexedtoBi.Thereareanumberoffactorsthatmayinfluencethetoxicityofthe
BiNSAIDs towards the HCT-8 colon cancer cells and the observed
differences/similarities to the NSAIDs: (i) stability in cell medium (Sections2.3.1.1
and2.4.1), (ii)intrinsic physicochemical properties, and (iii) cellular uptake (to be
discussedinChapter3).
TheNMRstabilitystudiessuggestedthatBi(tolf)3displayedgreaterstabilitythan
Bi(mef)3 following incubation in cellmedium (Section 2.3.1.1); however, the overall
coordination(orlackthereof)ofBitotheNSAIDappearedtohavelittle influenceon
the toxicity of Bi(tolf)3 and Bi(mef)3 compared to the corresponding free NSAIDs.
AsthetoxicityofBi(tolf)3wasslightlylowerthanthecorrespondingconcentrationof
tolfH, it is plausible that the increased stability of Bi(tolf)3 may be influencing the
toxicityofthetolfligands.
Chapter2.Stability,toxicityandPGE2inhibitionofBiNSAIDs
97
Incontrast,Bi(difl)3wassubstantiallymoretoxicthantheanalogousdiflH. There
aretwopossiblereasonsforthis;thefirstexplanationisthecontributingtoxicityofBi.
Reference to Table 2.4 shows that diflH exhibits an IC50 value of 403 µM. When
consideringBiCl3,whichpossessesaconceivablynon-toxicanion(Cl−),itisnotedthe
IC50value(IC50=383µM)iscomparabletodiflHthatindicatesthatanadditiveeffect
wouldbemorenoticeable.Thesecondpossibleexplanationfortheincreasedtoxicity
ofBi(difl)3(versusdiflH)towardsHCT-8cells istheNMRevidenceforglucoseinthe
sample obtained from the incubation of Bi(difl)3 in cell medium. This raises the
questionofwhether glucose ispotentially coordinatingwithBi(difl)3 and increasing
its toxicity compared to free diflH. For instance, it might be possible that the
coordination of glucosyl ligands to Bi assists the uptake of the complex via glucose
uptakemediated transporters. Thiswouldbe expected tobegreater in cancer cells
sincetheyhaveahighaffinityforglucose[69,70].InotherstudiesbyDillonandco-
workers[71],Bi(difl)3showed1.2-foldlowertoxicityagainstHepG2livercancercells
compared to HCT-8 cells, as assessed by theMTT assay. Additionally, proportional
enhancementoftoxicity(Bi:NSAIDIC50ratio3.6)wasobserved[71]. Onehypothesis
put forth to rationalise this observation was the content of glucose in the cell
medium[71].Interestingly,theculturemediumthatwasusedtomaintaintheHepG2
duringtheMTTassayscontainedalowerconcentrationofD-glucosethanRPMI-1640
used in the present study (5.5mMand11.1mM, respectively). Therefore itmaybe
possible that the increased concentration of D-glucose in RPMI-1640 increases the
propensity of Bi(difl)3 to undergo ligand exchange reactions with glucose[71].
Infuture experiments,NMR studies could be performed to validate this hypothesis.
ThiswouldinvolvestudiesofBi(difl)3inDMEMforcomparisontotheresultobtained
inthisThesis.
TheorderoftoxicityoftolfH>mefH>diflH,mayberelatedtothephysicochemical
properties of themolecules. The reported logP values of tolfH, mefH and diflH are
very similar (4.94, 4.79 and5.20, respectively) [64]. Theseminor variations in logP
andthelackofcorrelationwiththetoxicitysuggestthelogPisnotaccountableforthe
observed differences in toxicity or cellular uptake.Additionally, the NSAIDs have
reported pKa values in a similar range (3.5–4.3)[61], all of which lie well below
pH7.4(thepHofRPMI-1640). ThemaindifferencesintheNSAIDstructuresinclude
the structural incorporation of the diphenylamine (tolfH andmefH) or the diphenyl
(diflH) [72-74]. Diphenylamine NSAIDs (such as tolfH and mefH) were shown to
Chapter2.Stability,toxicityandPGE2inhibitionofBiNSAIDs
98
induce lactate dehydrogenase leakage in primary cells obtained from isolated rat
hepatocytes, more significantly than diflH, at the same concentration [72]. The
absenceof an amine in the structureof diflHmight, therefore, result in the reduced
toxicity observed in this study. The current study showed that the substitution of
–CH3(mef)for–Cl(tolf)resultedinalmosta3-foldincreaseintoxicityassociatedwith
boththefreeNSAIDandBiNSAIDs. ThisresultparallelsotherstudieswherebytolfH
reportedly exhibited higher activity than mefH against BT474 and SKBR3 breast
cancercells[52].
The toxicity of the BiNSAIDswas substantially higher than the two reference Bi
compounds, BiCl3 and BSS. Notably, the IC50 values obtained for the BiNSAIDs are
comparabletothatoftherangeoftheanti-cancerdrug,cisplatin,althoughitshouldbe
recognisedthatcisplatinhasachievedgreatestclinicaleffectivenessagainsttesticular
and ovarian cancers [75]. Althoughnanomolar toxicity is desirablewhen screening
forleadcompoundsforanti-cancerdrugdevelopment,themoderatetoxicitydisplayed
by the BiNSAIDs and the similar toxicity compared to cisplatin is an encouraging
result. Ultimately, the BiNSAIDs will need to be evaluated for chemotherapeutic,
chemopreventiveandgastroprotectiveactivityinanimalmodelsinordertodetermine
whethertheyhaveanypotentialuseaschemotherapeuticorchemopreventivedrugs
inhumans.However,theinvitrocytotoxicityoftheBiNSAIDsdeterminedinthisstudy
suggests that further study is warranted into the interactions of the BiNSAIDs in
biologicalsystems.
2.4.3 Celldeathassays
The results from the phase contrast microscopy and the AnnV/7AAD assays
indicated that apoptosis is the primary mode of cell death induced by exposure of
HCT-8 cells toBi(tolf)3,Bi(mef)3, orBi(difl)3, and the respective freeNSAIDs. These
resultsare importantas theyshowthatall threeBiNSAIDs inducethesamemodeof
cell death as the respective uncomplexed NSAIDs. These results were also in
agreementwith a number of published studies that have reported apoptosis as the
mode of cell death induced by NSAIDs, including tolfH [42, 44, 45, 48, 50, 76-79],
mefH[51, 80] and diflH[80, 81] in other cancer cell lines in vitro. Additionally, a
numberofBi compoundshavebeenreported to inducecelldeathviaapoptosis ina
numberofcancercelllinesinvitro[82-86]. TheresultsfromtheAnnV/7AADassays
were in agreement with the toxicity determined by the MTT assays, whereby the

Chapter2.Stability,toxicityandPGE2inhibitionofBiNSAIDs
99
Bi(tolf)3 or tolfH, Bi(mef)3 or mefH, and Bi(difl)3 treatments induced apoptosis in
approximately 47–70% of the HCT-8 cell populations when treated with the
approximateIC50concentration(asdeterminedfromtheMTTassay).Additionally,the
diflH treatment resulted in a smaller increase in the proportion of apoptotic cells
(approximately 37%of the cell population),which is also consistentwith the lower
toxicityastheconcentrationofdiflHappliedintheassay(225μM)waslowerthanits
IC50value(403μM),andthehealthierphysicalappearanceofthecellsobservedusing
phasecontrastmicroscopy(presentedinSection2.3.3.1).
Thepresent studyconfirmed thatapoptosis is themodeof celldeath inducedby
BiNSAID and NSAID treatment in HCT-8 cells. As discussed in Section 2.1.3.2,
apoptosisisoftendescribedasa‘programmed’formofcelldeath.Apoptosiscanoccur
viatwodistinctpathwaystermed‘extrinsic’and‘intrinsic’.Apoptosisviaanextrinsic
signaling pathway results from transmembrane receptor-mediated interactions
involvingdeathreceptorsthataremembersofthetumornecrosisfactorreceptorgene
superfamily [32]. Alternatively, apoptosis initiated via the intrinsic signaling
pathwaysaremitochondrial-initiatedeventsinvolvingnon-receptor-mediatedstimuli
thatproduce intracellular signals that actdirectlyon targetswithin the cell (further
details on these mechanisms are reviewed in [32]). The MTT assay is a useful
indicatoroftoxicity,whichreliesonfunctioningmitochondriainmetabolicallyactive
cellstoconvertMTTtoformazan(discussedinSection1.2.3.1).Whenconsideredwith
the results from the cell death studies, the reduction in mitochondria function
observed in the MTT assays may suggest that the mitochondria are involved in
BiNSAID- andNSAID-inducedapoptosis, and thus theBiNSAIDs/NSAIDsmay trigger
celldeaththroughtheintrinsicapoptoticpathway. WhileitisrecognisedthatCOX-2
contributes to the anti-apoptotic effects and proliferation of cancer cells, there are
reports that suggest that NSAID-induced cell death is also mediated via non-COX-2
regulatedpathways (discussed inSection1.2.4). In thepresent study, theBiNSAIDs
andNSAIDs inhibited the production of PGE2, suggesting the compounds inhibit the
COX enzymes (discussed further in the next Section 2.4.4). However, it cannot be
ignored that numerous studies have reported that diphenylamine NSAIDs (such as
tolfH and mefH) can also cause uncoupling of oxidative phosphorylation in
mitochondria[73,74,87-89].Furthermore,mefHanddiflHshoweduncouplingeffects
onoxidativephosphorylationinisolatedratmitochondria[90],andprimarycellsfrom
isolated rat hepatocytes [72] resulting in depletion of ATP. Overall, the exact
Chapter2.Stability,toxicityandPGE2inhibitionofBiNSAIDs
100
mechanismsbywhichtheNSAIDsandBiNSAIDsinduceapoptosisandwhythethree
NSAIDsinthisstudyshowvariationintoxicitycannotbedrawnconclusivelywithout
further investigation. Further investigation could be performed in the future to
determine the detailed molecular pathway involved in BiNSAID/NSAID induced
celldeath.
2.4.4 PGE2production
As discussed in Section 2.1.4, the increased expression of COX-2 has been
established in many cancer cell types and the subsequent production of
prostaglandins, including PGE2, is advantageous for neoplastic cell survival and
proliferation.Assuch,studyingtheabilityoftheBiNSAIDstoinhibitPGE2production
isimportantfordeterminingthechemopreventivepotentialofthecomplexes.
ThePGE2concentration-responsecurvesshowedthat theBiNSAIDsmirrored the
effectsofthefreeNSAIDsafter4hexposuretotheHCT-8cells. Thisisanimportant
resultasitdemonstratesthatadministrationoftheBiNSAID(whereintheNSAIDdoes
not initially posses a free carboxylate) does not hinder the ability of the NSAID to
target the COX enzymes. As no appreciable loss of cell viability was
observed(Appendix 1.2a–c), it could be concluded that the reduction of PGE2
production at increasing concentrations of BiNSAIDs/NSAIDs was not due to cell
toxicity. Additionally,noappreciabledecreaseintheviabilityoftheHCT-8cellswas
observedfollowing24-htreatmentwithaspH(Appendix1.5);assuchnodecreasein
viabilitywasexpected followingonly4-h treatment, confirming toxicityofaspHwas
notassociatedwithreducedPGE2production.
When the PGE2 production concentration-response curves (Fig. 2.9a) are
compared to theMTT assay concentration-response curves (Fig 2.6), it is clear that
Bi(tolf)3 and Bi(mef)3 paralleled the respective free NSAIDs whereby the BiNSAIDs
were approximately three times more toxic than the respective free NSAIDs
(representative of themolar ratio of NSAID per BiNSAID). The results of the PGE2
productionconcentration-responsecurvesofBi(difl)3differed(Figure2.9b),however,
whereby diflH appeared to have slightly enhanced PGE2 inhibition compared to
Bi(difl)3 (at higher concentrations of NSAID). Additionally, the potency of the
reduction inPGE2 occurred in the sameorder as the toxicity of theNSAIDs (tolfH<
mefH < diflH), which may suggest a correlation between PGE2 production and cell
health. It was observed that the IC50 values associated with the PGE2
Chapter2.Stability,toxicityandPGE2inhibitionofBiNSAIDs
101
inhibition(Table2.6),were lower than the IC50 values required to induce toxicity in
theHCT-8cells(Table2.5).
ThetimeframeofthePGE2assayscomparedtotheMTTassaysusedtodetermine
the IC50 values of the compounds (4 h versus 24 h) reveals some insight into the
intracellularstabilityofthecomplexes.IthasbeenestablishedthatNSAIDsmusthave
a freecarboxylate inorder to interactwith theCOX-1/-2activesite [91]. Giventhat
the BiNSAIDs decreased PGE2 production in a similar manner compared to the
analogousNSAIDs,itisreasonabletoassumethattheNSAIDligandmustbeliberated
fromtheBiNSAIDcomplex,allowingafreecarboxylatetointeractwiththeCOX.This
is particularly significant in the case of Bi(tolf)3 and Bi(difl)3 as the stability results
describedinSection2.3.1suggestthatthesecomplexesremainintactinthemedium;
however, they can undergo hydrolysis/dissociation once inside the cells following
interactionwith enzymes and competing ligands. Subsequently, it seems likely that
the Bi(tolf)3 and Bi(difl)3 complexes are metabolised by intracellular processes
relativelyquickly(i.e.<4h).
TheabilityoftheBiNSAIDsandNSAIDstoinhibitPGE2intheHCT-8cell linewas
studiedinordertoensurethatBiNSAIDsshowedcomparableactivitywithinacancer
cellline,andthusprovideinformationontheabilitytoreducePGE2inamalignantcell
for chemopreventive potential. It is important to note that HCT-8 cells have been
showntoexpresshigherlevelsofCOX-1thanCOX-2[55,56,92];hencethepreference
forBiNSAIDsorNSAIDsforCOX-2overCOX-1inHCT-8cellscannotbeevaluatedfrom
thepresentstudy. Furtherworkneedstobeperformedtodeterminetheexpression
of COX-1 and COX-2 in the HCT-8 cells used in this study, especially as the level of
expression of COX-1/-2 by HCT-8 cells varies between reports [55-57, 92, 93].
ItwouldalsobeofvaluetostudytheinhibitoryactivityoftheBiNSAIDscomparedto
theNSAIDswithpurifiedCOXenzymesinanacellularenvironmenttodetermineifthe
selectivityforCOX-1/-2isaffectedbythecomplexationoftheNSAIDtoBi.However,
thisassaywouldnottakeintoaccounttheconditionsexperiencedbytheBiNSAIDsin
thecellenvironment. Forinstance,thestabilityofthecomplexesincellmediumand
the intracellular fluids, cell uptake and any alterations in structure following cell
uptakeandsubsequentintracellularmetabolismareimportantfactorsthataffectCOX
inhibition. As such, the cell-based assay as performed in the present study, and an
enzyme-basedassayutilizingpurifiedCOX-1/-2wouldprovidecomplementaryresults
andshouldbeevaluated inconjunction. Theresults fromthepresentstudyutilising

Chapter2.Stability,toxicityandPGE2inhibitionofBiNSAIDs
102
theHCT-8cellmodelshouldbecomparedtoothercelllinesthatdisplayhighlevelsof
COX-2,andcellswithessentiallynoCOX-2expression(currentlybeingperformedby
Brown,DillonandRanson,personalcommunication).
OffinalnotewasthefindingthatdiflHincreasedtheamountofPGE2productionby
HCT-8 cells at low concentrations ranging from1−100 μM (Fig. 2.9). The increased
production may be related to the gastroprotective activity reported by other
authors[53,54].ThisresultmayindicatethattheconcentrationofBi(difl)3needsto
be considered carefully if the complex is tested in vivo for cancer prevention as
treatmentwith a dose that increases theproductionof PGE2mayhave the opposite
result to the intended therapeutic effect. This is clearly an observation that will
requirefurtherinvestigation.
Chapter2.Stability,toxicityandPGE2inhibitionofBiNSAIDs
103
2.5 ChaptersummaryThemainaimofthischapterwastouse invitroassaystodeterminewhetherthe
BiNSAIDs, Bi(tolf)3, Bi(mef)3, and Bi(difl)3, possess any chemotherapeutic or
chemopreventive potential in a colon cancer (HCT-8) cell line. To this end, the
followingstudieswereperformedwiththesubsequentoutcomes:
i. NMR spectroscopic determination of the BiNSAID stability in RPMI-1640
cellmediumshowedthatBi(tolf)3isrelativelystable,whilstmefappeared
to dissociate from Bi. The 1H NMR spectrum of Bi(difl)3 suggested that
D-glucoseinthecellmediummayinteractwiththecomplexresultinginthe
formationofanewspecies.
ii. Examinationof in vitro toxicity towards cancer cells using theMTTassay
demonstrated the ability of the complexes to eradicate transformed cells.
Specifically,theBiNSAIDsdisplayedmoderatetoxicitytowardsHCT-8cells
withtheIC50valuesrangingbetween16–81µM.Theorderoftoxicityofthe
BiNSAIDswasBi(difl)3<Bi(mef)3<Bi(tolf)3,whichparalleledtheorderof
toxicity of the free NSAIDs. When considering the molar ratio of NSAID
containedintheBiNSAIDcomplexes,Bi(tolf)3andBi(mef)3showedsimilar
activity to the free NSAIDs; the activity of diflH was improved when
complexedtoBi.
iii. Themode of cell deathwas determinedusing phase contractmicroscopy
andflowcytometricexperiments.Phasecontrastmicroscopyshowedthat
themorphologicalchangesinHCT-8cellsindicativeofapoptosis(including
cell rounding, shrinking and membrane blebbing) were induced by the
BiNSAIDs and the respective uncomplexed NSAIDs. Flow cytometric
analysisofco-stained(AnnVand7AAD)cellsconfirmedthatbothBiNSAIDs
and their respective NSAIDs induced cell death through apoptosis rather
thannecrosis.
iv. The ability of BiNSAIDs to inhibit COX and reduce PGE2 production in
HCT-8 cells was determined. The BiNSAIDs inhibited the production of
PGE2bytheHCT-8cellsattreatmentconcentrationscomparabletothefree
NSAIDs.TheorderofPGE2inhibitionwasBi(difl)3/diflH<Bi(mef)3/mefH<
Bi(tolf)3/tolfH.

Chapter2.Stability,toxicityandPGE2inhibitionofBiNSAIDs
104
AlthoughtheresultsfromtheNMRstudiessuggestthattheBiNSAIDshavelimited
stability inRPMI-1640 cell culturemedium, theBiNSAIDs (or the biologically active
forms of these complexes) elicited micromolar toxicity towards HCT-8 cells (as
demonstratedintheMTTassays)thatwerecomparableorbetterthantherespective
NSAIDs. Importantly, the presence of Bi did not adversely affect the toxicity or the
ability of the NSAIDs to induce apoptosis or inhibit PGE2 production. The superior
stability in cell medium, increased toxicity, and highest PGE2 inhibition of Bi(tolf)3
compared to the Bi(mef)3 and Bi(difl)3, suggests that Bi(tolf)3 might be the best
candidate for further testing using in vivo systems. However, the diversity in the
resultswarrants further investigation intohowthe threeBiNSAIDs interactwith the
HCT-8 cells. Further work will be required to determine whether the molecular
mechanisms involved in apoptosis are analogous between each BiNSAID and
respectivefreeNSAID.
Chapter2.Stability,toxicityandPGE2inhibitionofBiNSAIDs
105
2.6 References[1] E. Kerns and L. Di. (2008) Drug-like properties: concepts, structure design and
methods:fromADMEtotoxicityoptimization,1sted.,56-84,AcademicPress.[2] V.H.Thomas,S.Bhattachar,L.Hitchingham,P.Zocharski,M.Naath,N.Surendran,
C. L. Stoner and A. El-Kattan. (2006) The road map to oral bioavailability: anindustrialperspective,ExpertOpin.DrugMetab.Toxicol.,2,591-608.
[3] A. Dahan and J. M. Miller. (2012) The solubility–permeability interplay and itsimplications in formulation design and development for poorly soluble drugs,AAPSJ.,14,244-251.
[4] G. Singh. (2000) Gastrointestinal complications of prescription and over-the-counternonsteroidalanti-inflammatorydrugs:aviewfromtheARAMISdatabase.Arthritis, Rheumatism, and Aging Medical Information System, Am. J. Ther., 7,115-121.
[5] L. Laine. (2001) Approaches to nonsteroidal anti-inflammatory drug use in thehigh-riskpatient,Gastroenterology,120,594-606.
[6] T. Grosser. (2006) Chapter 29: Non-steroidal and anti-inflammatory drugs andcoxibs, In Applied Pharmacokinetics & Pharmacodynamics: Principles ofTherapeuticDrugMonitoring (M. E. Burton, Ed.) 4th ed., pp 752-780, LippincottWilliams&Wilkins,UnitedStatesofAmerica.
[7] H.Sun,L.ZhangandK.Y.Szeto.(2004)Bismuthinmedicine,Met. IonsBiol.Syst.,41,333-378.
[8] P.C.Andrews,R.L.Ferrero,P.C.Junk,I.Kumar,Q.Luu,K.NguyenandJ.W.Taylor.(2010) Bismuth(III) complexes derived from non-steroidal anti-inflammatorydrugsandtheiractivityagainstHelicobacterpylori,DaltonTrans.,39,2861-2868.
[9] Z.W.YuandP.J.Quinn.(1994)Dimethylsulphoxide:Areviewofitsapplicationsincellbiology,Biosci.Rep.,14,259-281.
[10] R.D.Brobyn.(1975)Thehumantoxicologyofdimethylsulfoxide,Ann.N.Y.Acad.Sci.,243,497-506.
[11] A.M.Bonin,J.A.Yanez,C.Fukuda,X.W.Teng,C.T.Dillon,T.W.Hambley,P.A.Layand N. M. Davies. (2010) Inhibition of experimental colorectal cancer andreduction in renalandgastrointestinal toxicitiesby copper-indomethacin in rats,CancerChemother.Pharmacol.,66,755-764.
[12] D.Kovala-Demertzi,D.Hadjipavlou-Litina,A. Primikiri,M. Staninska, C. Kotoglouand M. A. Demertzis. (2009) Anti-inflammatory, antiproliferative, and radical-scavengingactivitiesoftolfenamicacidanditsmetalcomplexes,Chem.Biodivers.,6,948-960.
[13] D.Kovala-Demertzi,D.Hadjipavlou-Litina,M. Staninska,A. Primikiri, C. Kotoglouand M. A. Demertzis. (2009) Anti-oxidant, in vitro, in vivo anti-inflammatoryactivity and antiproliferative activity ofmefenamic acid and itsmetal complexeswithmanganese(II), cobalt(II), nickel(II), copper(II) and zinc(II), J. Enzym. Inhib.Med.Ch.,24,742-752.
[14] G.Tamasi,C.Bernini,G.Corbini,N.F.Owens,L.Messori,F.Scaletti,L.Massai,P.L.Giudice and R. Cini. (2014) Synthesis, spectroscopic and DFT structuralcharacterizationoftwonovelruthenium(III)oxicamcomplexes.Invivoevaluationofanti-inflammatoryandgastricdamagingactivities,J.Inorg.Biochem.,134,25-35.
[15] M. Çeşme, A. Gölcü and I. Demirtaş. (2015) New metal based drugs: spectral,electrochemical, DNA-binding, surface morphology and anticancer activityproperties,Spectrochim.ActaA,135,887-906.
[16] P.Christofis,M.Katsarou,A.Papakyriakou,Y.Sanakis,N.KatsarosandG.Psomas.(2005) Mononuclear metal complexes with piroxicam: synthesis, structure andbiologicalactivity,J.Inorg.Biochem.,99,2197-2210.
[17] Cell Signaling Technology Inc. (2015) Paclitaxel #9807, Available from:https://media.cellsignal.com/pdf/9807.pdf,[accessed:Mar.112018]
Chapter2.Stability,toxicityandPGE2inhibitionofBiNSAIDs
106
[18] Cell Signaling Technology Inc. (2018) Vinblastine #14255, Available from:https://www.cellsignal.com/products/activators-inhibitors/vinblastine/14255,[accessed:Mar.112018]
[19] C. Griffin, A. Karnik, J. McNulty and S. Pandey. (2011) Pancratistatin selectivelytargets cancer cell mitochondria and reduces growth of human colon tumorxenografts,Mol.CancerTher.,10,57-68.
[20] K. L. Vine, J. M. Locke, M. Ranson, S. G. Pyne and J. B. Bremner. (2007) In vitrocytotoxicityevaluationofsomesubstituted isatinderivatives,Bioorg.Med.Chem.,15,931-938.
[21] S.Ahmad,A.A. Isab,S.AliandA.R.Al-Arfaj. (2006)Perspectives inbioinorganicchemistryofsomemetalbasedtherapeuticagents,Polyhedron,25,1633-1645.
[22] T.W.Hambley. (2007)Developingnewmetal-basedtherapeutics:challengesandopportunities,DaltonTrans.,4929-4937.
[23] W. Li, L. Jin, N. Zhu, X. Hou, F. Deng and H. Sun. (2003) Structure of colloidalbismuth subcitrate (CBS) in dilute HCl: unique assembly of bismuth citratedinuclearunits([Bi(cit)2Bi]2-),J.Am.Chem.Soc.,125,12408-12409.
[24] F.Thomas,B.BialekandR.Hensel.(2011)Medicaluseofbismuth:thetwosidesofthecoin,J.Clin.Toxicol.,S:3,doi:10.4172/2161-0495.s4173-4004.
[25] E.Vega-AvilaandM.K.Pugsley.(2011)Anoverviewofcolorimetricassaymethodsusedtoassesssurvivalorproliferationofmammaliancells,Proc.West.Pharmacol.Soc.,54,10-14.
[26] T. Mosmann. (1983) Rapid colorimetric assay for cellular growth and survival:Applicationtoproliferationandcytotoxicityassays,J.Immunol.Methods,65,55-63.
[27] F. Denizot and R. Lang. (1986) Rapid colorimetric assay for cell growth andsurvival. Modifications to the tetrazolium dye procedure giving improvedsensitivityandreliability,J.Immunol.Methods,89,271-277.
[28] H. Tada, O. Shiho, K. Kuroshima, M. Koyama and K. Tsukamoto. (1986) Animprovedcolorimetricassayforinterleukin2,J.Immunol.Methods,93,157-165.
[29] J. Carmichael, W. G. DeGraff, A. F. Gazdar, J. D. Minna and J. B. Mitchell. (1987)Evaluationofa tetrazolium-basedsemiautomatedcolorimetricassay:assessmentofchemosensitivitytesting,CancerRes.,47,936-942.
[30] M. B. Hansen, S. E. Nielsen and K. Berg. (1989) Re-examination and furtherdevelopmentofapreciseandrapiddyemethodformeasuringcellgrowth/cellkill,J.Immunol.Methods,119,203-210.
[31] G.Kroemer,L.Galluzzi,P.Vandenabeele,J.Abrams,E.S.Alnemri,E.H.Baehrecke,M. V. Blagosklonny,W. S. El-Deiry, P. Golstein, D. R. Green,M. Hengartner, R. A.Knight,S.Kumar,S.A.Lipton,W.Malorni,G.Nunez,M.E.Peter,J.Tschopp,J.Yuan,M. Piacentini, B. Zhivotovsky, G. Melino and Nomenclature Committee on CellDeath. (2009)Classificationof celldeath: recommendationsof theNomenclatureCommitteeonCellDeath2009,CellDeathDiffer.,16,3-11.
[32] S.Elmore. (2007)Apoptosis:a reviewofprogrammedcelldeath,Toxicol.Pathol.,35,495-516.
[33] M.S.RicciandW.-X.Zong.(2006)Chemotherapeuticapproachesfortargetingcelldeathpathways,Oncologist,11,342-357.
[34] Y. Z. Li, C. J. Li, A. V. Pinto and A. B. Pardee. (1999) Release of mitochondrialcytochromeCinbothapoptosisandnecrosisinducedbybeta-lapachoneinhumancarcinomacells,Mol.Med.,5,232-239.
[35] A. R. Salomon, D. W. Voehringer, L. A. Herzenberg and C. Khosla. (2000)Understanding and exploiting themechanistic basis for selectivity of polyketideinhibitorsofF(0)F(1)-ATPase,Proc.Natl.Acad.Sci.U.S.A.,97,14766-14771.
[36] X.Bai,F.Cerimele,M.Ushio-Fukai,M.Waqas,P.M.Campbell,B.Govindarajan,C.J.Der, T. Battle, D. A. Frank, K. Ye, E. Murad, W. Dubiel, G. Soff and J. L. Arbiser.(2003)Honokiol,asmallmolecularweightnaturalproduct, inhibitsangiogenesisinvitroandtumorgrowthinvivo,J.Biol.Chem.,278,35501-35507.
Chapter2.Stability,toxicityandPGE2inhibitionofBiNSAIDs
107
[37] G. Pistritto,D. Trisciuoglio, C. Ceci, A.Garufi andG.D'Orazi. (2016)Apoptosis asanticancermechanism: Function and dysfunction of itsmodulators and targetedtherapeuticstrategies,Aging,8,603-619.
[38] I.Vermes,C.Haanen,H.Steffens-NakkenandC.Reutelingsperger.(1995)Anovelassay for apoptosis. Flow cytometric detection of phosphatidylserine expressiononearlyapoptoticcellsusingfluoresceinlabelledAnnexinV,J.Immunol.Methods,184,39-51.
[39] E. M. Bevers, P. Comfurius and R. F. Zwaal. (1996) Regulatory mechanisms inmaintenance and modulation of transmembrane lipid asymmetry:pathophysiologicalimplications,Lupus,5,480-487.
[40] N. J. Philpott, A. J. Turner, J. Scopes, M.Westby, J. C. Marsh, E. C. Gordon-Smith,A.G.Dalgleish and F. M. Gibson. (1996) The use of 7-amino actinomycin D inidentifying apoptosis: simplicity of use and broad spectrum of applicationcomparedwithothertechniques,Blood,87,2244-2251.
[41] I.Nicoletti,G.Migliorati,M.C.Pagliacci,F.GrignaniandC.Riccardi.(1991)Arapidand simple method for measuring thymocyte apoptosis by propidium iodidestainingandflowcytometry,J.Immunol.Methods,139,271-279.
[42] E.S.Choi,J.H.Shim,J.Y.Jung,H.J.Kim,K.H.Choi,J.A.Shin,J.S.Nam,N.P.ChoandS. D. Cho. (2011) Apoptotic effect of tolfenamic acid in androgen receptor-independentprostatecancercellandxenograft tumorthroughspecificityprotein1,CancerSci.,102,742-748.
[43] U.T.Sankpal,M.Abdelrahim,S.F.Connelly,C.M.Lee,R.Madero-Visbal,J.Colon,J.Smith, S. Safe, P. Maliakal and R. Basha. (2012) Small molecule tolfenamic acidinhibits PC-3 cell proliferation and invasion in vitro, and tumor growth inorthotopicmousemodelforprostatecancer,Prostate,72,1648-1658.
[44] J.B.Jeong,J.Choi,S.J.BaekandS.-H.Lee.(2013)Reactiveoxygenspeciesmediatetolfenamicacid-inducedapoptosisinhumancolorectalcancercells,Arch.Biochem.Biophys.,537,168-175.
[45] J.B. Jeong,X.Yang,R.Clark, J.Choi,S. J.BaekandS.H.Lee.(2013)Amechanisticstudy of the proapoptotic effect of tolfenamic acid: involvement of NF-kappaBactivation,Carcinogenesis,34,2350-2360.
[46] D.Eslin,C.Lee,U.T.Sankpal,P.Maliakal,R.M.Sutphin,L.AbrahamandR.Basha.(2013) Anticancer activity of tolfenamic acid in medulloblastoma: a preclinicalstudy,TumorBiol.,34,2781-2789.
[47] D.Eslin,U.T. Sankpal,C.Lee,R.M.Sutphin,P.Maliakal,E.Currier,G. Sholler,M.Khan and R. Basha. (2013) Tolfenamic acid inhibits neuroblastoma cellproliferationandinducesapoptosis:anoveltherapeuticagentforneuroblastoma,Mol.Carcinog.,52,377-386.
[48] X.Zhang,S.H.Lee,K.W.Min,M.F.McEntee,J.B.Jeong,Q.LiandS.J.Baek.(2013)Theinvolvementofendoplasmicreticulumstressinthesuppressionofcolorectaltumorigenesisbytolfenamicacid,CancerPrev.Res.,6,1337-1347.
[49] U.T.Sankpal,C.M.Lee,S.F.Connelly,O.Kayaleh,D.Eslin,R.Sutphin,S.Goodison,L. Adwan, N. H. Zawia, L. M. Lichtenberger and R. Basha. (2013) Cellular andorganismal toxicity of the anti-cancer small molecule, tolfenamic acid: a pre-clinicalevaluation,CellPhysiol.Biochem.,32,675-686.
[50] J.W. Chang, S. U. Kang, J.W. Choi, Y. S. Shin, S. J. Baek, S. H. Lee and C. H. Kim.(2014) Tolfenamic acid induces apoptosis and growth inhibition in anaplasticthyroid cancer: Involvement of nonsteroidal anti-inflammatory drug-activatedgene-1expressionandintracellularreactiveoxygenspeciesgeneration,FreeRadic.Biol.Med.,67,115-130.
[51] D. H. Woo, I. S. Han and G. Jung. (2004) Mefenamic acid-induced apoptosis inhumanlivercancercell-linesthroughcaspase-3pathway,LifeSci.,75,2439-2449.

Chapter2.Stability,toxicityandPGE2inhibitionofBiNSAIDs
108
[52] X. Liu, M. Abdelrahim, S. Abudayyeh, P. Lei and S. Safe. (2009) The NSAIDtolfenamicacidinhibitsBT474andSKBR3breastcancercellandtumorgrowthbyrepressingerbB2expression,Mol.CancerTher.,8,1207-1217.
[53] M.M.Cohen.(1983)Diflunisalprotectshumangastricmucosaagainstdamagebyindomethacin,Dig.Dis.Sci.,28,1070-1077.
[54] M.Trautmann,B.M.PeskarandB.A.Peskar. (1991)Aspirin-likedrugs, ethanol-inducedratgastricinjuryandmucosaleicosanoidrelease,Eur.J.Pharmacol.,201,53-58.
[55] T.-B. Lee,K.-J.M.Kim,Y-D., S.-I.Kang,K.-R. Jung, J.-U. Lee andC.-H. Choi. (2005)Adjuvant effect of NSAIDs on the cytotoxicity of colon cancer cells to 5-FU,J.KoreanSoc.Coloproctol.,21,121-128.
[56] H. Sui, S. Zhou, Y. Wang, X. Liu, L. Zhou, P. Yin, Z. Fan and Q. Li. (2011) COX-2contributes toP-glycoprotein-mediatedmultidrugresistanceviaphosphorylationofc-JunatSer63/73incolorectalcancer,Carcinogenesis,32,667-675.
[57] S. Dinicola, A. Pasqualato, S. Proietti, M. G. Masiello, A. Palombo, P. Coluccia, R.Canipari,A.Catizone,G.Ricci,A.H.Harrath,S.H.Alwasel,A.CucinaandM.Bizzarri.(2016)ParadoxicalE-cadherinincreasein5FU-resistantcoloncancerisunaffectedduringmesenchymal-epithelialreversioninducedbygamma-secretase inhibition,LifeSci.,145,174-183.
[58] M.D.Hall,K.A.Telma,K.-E.Chang,T.D.Lee,J.P.Madigan,J.R.Lloyd,I.S.Goldlust,J.D.HoescheleandM.M.Gottesman. (2014)Sayno toDMSO:Dimethylsulfoxideinactivates cisplatin, carboplatin, and other platinum complexes,Cancer Res., 74,3913-3922.
[59] R.K.Harris,E.D.Becker,S.M.Cabral,S.M.CabraldeMenezes,R.GoodfellowandP.Granger.(2001)NMRnomenclature.Nuclearspinpropertiesandconventionsforchemicalshifts(IUPACRecommendations2001),PureAppl.Chem.,73,1795–1818.
[60] L. Ronconi and P. J. Sadler. (2008) Applications of heteronuclear NMRspectroscopy in biological andmedicinal inorganic chemistry,Coord. Chem. Rev.,252,2239-2277.
[61] J. O. Boison, F. J. Ramos and A. Chicoine. (2016) Nonsteroidal antiinflammatorydrugs, InChemicalanalysisofnon-antimicrobialveterinarydrugresiduesinfood(J.F.Kay,J.D.MacNeilandJ.Wang,Eds.),pp427-496,Wiley,NewYork.
[62] T.Velkov, J.Horne,A.Laguerre,E. Jones,M. J. ScanlonandC. J.H.Porter. (2007)Examinationoftheroleofintestinalfattyacid-bindingproteinindrugabsorptionusingaparallelartificialmembranepermeabilityassay,Chem.Biol.,14,453-465.
[63] M. Polasek, M. Pospisilova and M. Urbanek. (2000) Capillary isotachophoreticdetermination of flufenamic, mefenamic, niflumic and tolfenamic acid inpharmaceuticals,J.Pharm.Biomed.Anal.,23,135-142.
[64] A. G. Siraki, T. Chevaldina and P. J. O’Brien. (2005) Application of quantitativestructure–toxicity relationships for acute NSAID cytotoxicity in rat hepatocytes,Chem.Biol.Interact.,151,177-191.
[65] ThermoFisherScientificTechnicalresources22400-RPMI1640,HEPES,Availablefrom:https://www.thermofisher.com/au/en/home/technical-resources/media-formulation.117.html,[accessed:Feb.12,2018]
[66] B. Thorens. (1992) Molecular and cellular physiology of GLUT-2, a high-Kmfacilitated glucose diffusion transporter, In Molecular Biology of Receptors andTransporters: Bacterial and Glucose Transporters (M. Friedlander and M.Mueckler,Eds.),pp209-235,AcademicPress,SanDiego.
[67] S.A.CurranandR.Brambilla.(1996)Magneticresonancespectroscopy,InAguideto materials characterization and chemical analysis (J. P. Sibilia, Ed.), pp 39-60,Wiley,NewYork.
[68] U.ReinholdandW.Tilgen. (2012)Chemosensitivity testing inoncology,SpringerBerlinHeidelberg.
Chapter2.Stability,toxicityandPGE2inhibitionofBiNSAIDs
109
[69] O.WarburgandF.Kubowitz.(1927)Themetabolismofgrowingcells(fibroblasts,heart,chorion).,Biochem.Z.,189,242-248.
[70] E. K. Pauwels, E. J. Sturm, E. Bombardieri, F. J. Cleton andM. P. Stokkel. (2000)Positron-emission tomography with [18F]fluorodeoxyglucose. Part I. Biochemicaluptakemechanismanditsimplicationforclinicalstudies,J.CancerRes.Clin.Oncol.,126,549-559.
[71] S. Spremo. (2014) Novel bismuth complexes as potential anti-cancer drugs,BachelorofMedicinalChemistry(Advanced),UniversityofWollongong,Australia.
[72] Y. Masubuchi, H. Saito and T. Horie. (1998) Structural requirements for thehepatotoxicityofnonsteroidalanti-inflammatorydrugsinisolatedrathepatocytes,J.Pharmacol.Exp.Ther.,287,208-213.
[73] Y. Masubuchi, S. Yamada and T. Horie. (1999) Diphenylamine as an importantstructure of nonsteroidal anti-inflammatory drugs to uncouple mitochondrialoxidativephosphorylation,Biochem.Pharmacol.,58,861-865.
[74] Y.Masubuchi, S.YamadaandT.Horie. (2000)Possiblemechanismofhepatocyteinjury induced by diphenylamine and its structurally related nonsteroidal anti-inflammatorydrugs,J.Pharmacol.Exp.Ther.,292,982-987.
[75] L. Kelland. (2007) The resurgence of platinum-based cancer chemotherapy,Nat.Rev.Cancer,7,573-584.
[76] M. Abdelrahim, C. H. Baker, J. L. Abbruzzese and S. Safe. (2006) Tolfenamic acidand pancreatic cancer growth, angiogenesis, and Sp protein degradation, J. Natl.CancerInst.,98,855-868.
[77] R.Basha,S.B. Ingersoll,U.T.Sankpal,S.Ahmad,C.H.Baker, J.R.Edwards,R.W.Holloway, S. Kaja and M. Abdelrahim. (2011) Tolfenamic acid inhibits ovariancancer cell growth and decreases the expression of c-Met and survivin throughsuppressingspecificityproteintranscriptionfactors,Gynecol.Oncol.,122,163-170.
[78] S. U. Kang, Y. S. Shin, H. S. Hwang, S. J. Baek, S.-H. Lee and C.-H. Kim. (2012)Tolfenamicacidinducesapoptosisandgrowthinhibitioninheadandneckcancer:involvementofNAG-1expression,PLoSOne,7,e34988.
[79] H.-J.Kim,S.-D.Cho,J.Kim,S.-J.Kim,C.Choi,J.-S.Kim,J.-S.Nam,K.HanKwon,K.-S.Kang and J.-Y. Jung. (2013) Apoptotic effect of tolfenamic acid onMDA-MB-231breastcancercellsandxenografttumors,J.Clin.Biochem.Nutr.,53,21-26.
[80] X. Lu,W. Xie, D. Reed,W. S. Bradshaw and D. L. Simmons. (1995) Nonsteroidalantiinflammatory drugs cause apoptosis and induce cyclooxygenases in chickenembryofibroblasts,Proc.Natl.Acad.Sci.U.S.A.,92,7961-7965.
[81] K.Shirakawa,L.Wang,N.Man,J.Maksimoska,A.W.Sorum,H.W.Lim,I.S.Lee,T.Shimazu,J.C.Newman,S.Schröder,M.Ott,R.Marmorstein,J.Meier,S.NimerandE.Verdin.(2016)Salicylate,diflunisalandtheirmetabolitesinhibitCBP/p300andexhibitanticanceractivity,eLife,5,e11156.
[82] K. S. O. Ferraz,N. F. Silva, J. G. da Silva, L. F. deMiranda, C. F. D. Romeiro, E.M.Souza-Fagundes, I. C. Mendes and H. Beraldo. (2012) Investigation on thepharmacologicalprofileof2,6-diacetylpyridinebis(benzoylhydrazone)derivativesandtheirantimony(III)andbismuth(III)complexes,Eur.J.Med.Chem.,53,98-106.
[83] D.H.Ishak,K.K.Ooi,K.P.Ang,A.M.Akim,Y.K.Cheah,N.Nordin,S.N.Halim,H.L.Seng and E. R. Tiekink. (2014) A bismuth diethyldithiocarbamate compoundpromotesapoptosisinHepG2carcinoma,cellcyclearrestandinhibitscellinvasionthrough modulation of the NF-κB activation pathway, J. Inorg. Biochem., 130,38-51.
[84] A. Islam, B. L. Rodrigues, I. M. Marzano, E. C. Perreira-Maia, D. Dittz, M. T. PazLopes,M. Ishfaq, F. Frézard and C. Demicheli. (2016) Cytotoxicity and apoptoticactivityofnovelorganobismuth(V)andorganoantimony(V)complexesindifferentcancercelllines,Eur.J.Med.Chem.,109,254-267.

Chapter2.Stability,toxicityandPGE2inhibitionofBiNSAIDs
110
[85] K.Iuchi,Y.HatanoandT.Yagura.(2008)Heterocyclicorganobismuth(III)inducesapoptosis of human promyelocytic leukemic cells through activation of caspasesandmitochondrialperturbation,Biochem.Pharmacol.,76,974-986.
[86] K.Onishi,M.Douke,T.Nakamura,Y.Ochiai,N.Kakusawa,S.Yasuike, J.Kurita,C.Yamamoto, M. Kawahata, K. Yamaguchi and T. Yagura. (2012) A novelorganobismuth compound, 1-[(2-di-p-tolylbismuthanophenyl)diazenyl]-pyrrolidine,inducesapoptosisinthehumanacutepromyelocyticleukemiacelllineNB4viareactiveoxygenspecies,J.Inorg.Biochem.,117,77-84.
[87] S.Somasundaram,G.Sigthorsson,R.J.Simpson,J.Watts,M.Jacob,I.A.Tavares,S.Rafi,A.Roseth,R.Foster,A.B.Price,J.M.WrigglesworthandI.Bjarnason.(2000)UncouplingofintestinalmitochondrialoxidativephosphorylationandinhibitionofcyclooxygenasearerequiredforthedevelopmentofNSAID-enteropathyintherat,Aliment.Pharmacol.Ther.,14,639-650.
[88] G.Galati,S.Tafazoli,O.Sabzevari,T.S.ChanandP.J.O'Brien.(2002)IdiosyncraticNSAIDdruginducedoxidativestress,Chem.Biol.Interact.,142,25-41.
[89] Y. Li, X.M.Qi, X. Xue, X. F.Wu, Y. F.Wu,M. Chen, G. Z. Xing, Y. Luan and J. Ren.(2009) The relationship between diphenylamine structure and NSAIDs-inducedhepatocytesinjury,Toxicol.Lett.,186,111-114.
[90] F.E.Mingatto,A.C.Santos,S.A.Uyemura,M.C.JordaniandC.Curti.(1996)Invitrointeractionofnonsteroidalanti-inflammatorydrugsonoxidativephosphorylationofratkidneymitochondria:respirationandATPsynthesis,Arch.Biochem.Biophys.,334,303-308.
[91] R.J.Flower.(2003)ThedevelopmentofCOX2inhibitors,Nat.Rev.DrugDiscov.,2,179-191.
[92] T.J.Jang,K.H.JeonandK.H.Jung.(2009)Cyclooxygenase-2expressionisrelatedtotheepithelial-to-mesenchymaltransitioninhumancoloncancers,YonseiMed.J.,50,818-824.
[93] G.J.Du,H.H.Lin,Q.T.XuandM.W.Wang.(2005)Thalidomideinhibitsgrowthoftumors through COX-2 degradation independent of antiangiogenesis, Vascul.Pharmacol.,43,112-119.

111
Chapter3. UptakeandlocalisationofBibyBiNSAID-treated
HCT-8cells
HavingestablishedthestabilityoftheBiNSAIDsincellmediumandthetoxicityofthe
BiNSAIDstowardsHCT-8cellsinChapter2,itwasofinteresttoinvestigatetheuptake
of the complexes. The focus of this work was to quantify the cellular Bi following
treatment with BiNSAIDs to determine if there were any correlations between Bi
uptake and BiNSAID stability or toxicity. Additionally, studies of the subcellular
distributionofBiwereperformedonHCT-8cellsandtheresultswerediscussedwith
respect to the stability results (Chapter 2) and potential intracellular targets of the
BiNSAIDs.
PartsofthisChapterhavebeenpublishedin:
Hawksworth, E. L., Andrews, P. C., Lie, W., Lai, B. & Dillon, C. T. (2014) Biological
evaluation of bismuth non-steroidal anti-inflammatory drugs (BiNSAIDs): Stability,
toxicityanduptakeinHCT-8coloncancercells,J.Inorg.Biochem.,135,28-39.
Chapter3.UptakeandlocalisationofBiNSAIDs
112
3.1 IntroductionAs introduced in Section 2.1, there are a number of factors that need to be
addressed in order to determine the suitability of BiNSAIDs as potential
chemotherapeutic or chemopreventive candidates. The cellular uptake and
intracellulardistributionofadrugisanimportantcriteriathatrequiresexamination,
particularly in the contextof chemopreventionas it is important toestablish: (i)the
quantity of thedrug that can enter the cell (i.e. howmuch is required to induce the
desired therapeutic effect); and (ii) where the drug distributes in the cell (i.e. if it
localisesatthedesiredbiologicaltargetorindiscriminatelythroughoutthecell).
HavinginvestigatedthestabilityoftheBiNSAIDsincellmedium,andthetoxicityof
theBiNSAIDsandPGE2inhibitiontowardsHCT-8cellsinChapter2,itwasofinterest
to quantify the uptake of the BiNSAIDs to determine if therewere any correlations
betweenuptakeandthestabilityandtoxicityoftheBiNSAIDs.Additionally,assessing
the intracellulardistributionofBi inHCT-8 cellswasof interest inorder toprovide
insightintotheintracellulartargetsofBiandpotentiallytheBiNSAIDs(intheinstance
ofthecomplexremainingintact).
Beneficially,BiNSAIDscontaintwocomponentsthatcanbeusedtodeterminedrug
uptake and intracellular distribution, the inorganic Bi atom and the organic NSAID
molecule. Thestudiesdescribedherein focusedon theuptakeanddistributionofBi
withintheHCT-8cellsfollowingtreatmentwithBiNSAIDs.Whileitwillbeimportant
infutureworktofocusontheuptakeanddistributionoftheNSAIDs,therewereafew
reasonswhyitwasinitiallyimportanttostudytheuptakeandintracellularfateofBi.
Firstly, given the potential for Bi accumulation within mammalian cells and the
potential forBi toxicity (discussed inSection1.4.2), it is important todetermine the
quantity of Bi that enters cells at the BiNSAID concentration required to cause
cytotoxicity.Secondly,organicmolecules(includingNSAIDs)aregenerallycomprised
ofendogenouselementsthatarefoundwithincells(C,H,O,N)thatmakeitdifficultto
detect drug molecules inside cells without using labeling techniques. Radioactive
labeling (e.g. 3H) overcomes this issue, but ismore advantageous forwholebodyor
tissueimagingratherthanthemicronresolutionrequiredforintracellularimaging[1].
Thirdly, chemical labeling, such as the use of fluorophores, involves altering the
chemicalstructureandoften increasing themolecularweightof themolecule,which
can potentially alter the uptake and distribution of the drug [2]. In contrast,
metal/metalloid complexes offer an advantage in this instance, as manymetals are

Chapter3.UptakeandlocalisationofBiNSAIDs
113
often found endogenously within cells in trace quantities. The presence of a
metal/metalloidinthecompound,therefore,negatestheneedtolabelthedrug. The
limitationofthisapproachisthatitisnotpossibletotellwhetherthemetal/metalloid
isstillattachedtotheorganicligands.
There are a number of analytical techniques that can be used to detect trace
quantities of metals/metalloids in cell samples including atomic absorption
spectroscopy(AAS;discussedinSection3.1.1.)andmicroprobesynchrotronradiation
X-rayfluorescence(SRXRF)spectroscopy(discussedinSection3.1.2).
3.1.1 Atomicabsorptionspectroscopyforstudyingcellularuptakeofinorganic
complexes/drugs
Establishing the uptake of drugs entering cancer cells is important to determine
theireffectiveness,wherebythefocusofbowelcancerchemopreventivesistoprovide
insightintotheirtoxicitytowardsbowelcancercells(Section2.3.2)andtheirabilityto
inhibit PG production through the inhibition of COX-2 (Section 2.3.4). The cellular
uptake of inorganic complexes/drugs containing non-endogenous elements (such as
As,Bi,Co,Cr,Ni,Pd,Pt,Rd,RuandRh)canbemonitoredbyanumberofanalytical
techniques.
Acommonchoice isAAS,whichuseseithera flame(FAAS),oranelectrothermal
source, also known as graphite furnace atomic absorption spectroscopy (GFAAS), to
analyse metals/metalloids [3]. The sample is atomised using high temperatures
(2,000−3,000K) toproduceground state freeatoms in thevapour state [3].A light
source (generally a hollow cathode lamp), which produces the characteristic
wavelengths of light specific to the analyte, is used to quantify the element in the
sample [3]. The techniques known as inductively coupled plasma-atomic emission
spectroscopy(ICP-AES)andinductivelycoupledplasma-massspectrometry(ICP-MS),
employ a plasma source as the sample atomiser. A plasma source reaches
temperatures that exceed twice the temperature of a combustion flame
(6,000−10,000K)[3].
A number of factors are important when determining the suitability of these
techniquesforanalysingmetalsincellsamples,including;sensitivity,samplevolumes
andchemicalmatrix/interference.Thetypicaldetectionlimitsoftheaforementioned
techniques vary depending on the element of interest, and the particular brand of
instrument employed for the analysis [4]. The typical detection limits of Bi are
Chapter3.UptakeandlocalisationofBiNSAIDs
114
50parts per billion (ppb), 0.3 ppb, 18 ppb, and 0.01-0.1parts per trillion (ppt) for
FAAS,GFAAS,ICP-AES,andICP-MS,respectively[4].GFAAShasadetectionlimitupto
1000 times greater than FAAS [4]. The greater density of atoms generated by the
graphitetubeandimprovedresidencytimeoftheanalyteintheopticalpath(<1sin
FAASversus several seconds inGFAAS) contribute to the superiordetection limitof
GFAAS[3, 4]. As such, GFAAS [3-9] andmulti-element GFAAS [10] have been used
successfullytodeterminetheconcentrationofBiinbiologicalsampleswithadequate
detectionlimits(≤1μg/L).
Additionally,GFAASonlyrequiressmallsamplevolumes(approximately20μLper
detection)foraccurateelementaldetection,whereas1−2mLofsampleisrequiredfor
FAAS[3].Asatomisationofthesampleoccurs indiscretesteps,selectiveremovalof
matrixcomponentscanbeperformedwiththeaidofchemicalmodifiers. Theuseof
chemical modifiers reduces the effect of chemical interferences arising from
components of the sample matrix, which would otherwise cause issues with
determiningtheconcentrationoftheelementofinterest[4].
ThemaindisadvantagesofGFAASare its lowdynamic range (102),whichmeans
that the concentrations of the analytemust be keptwithin a narrow range, and the
amount of time that it takes to analyse the samples (> 5 min per sample) [4]; the
lengthof time taken toanalyseonesample isaparticulardisadvantage ifmore than
one element is to be studied. ICP-MS has the advantage, over GFAAS, of greater
sensitivity(partspertrillionforsomeelements),agreaterdynamicrange,andrapid
multi-elementdetection;however, thereareanumberof limitationsassociatedwith
ICP-MS. These includehigh instrumentcost, spectral interferences,andhighsample
volume; the latter being a crucial determining factor for the analysis of cell
samples.Withtheseadvantagesanddisadvantagsinmind,GFAASwasselectedasthe
mostappropriatemethodbywhichtoexaminetheuptakeofBibyHCT-8cellsinthe
presentstudy.
3.1.2 Microprobe synchrotron radiation X-ray fluorescence imaging for
studyingintracellularmetallocalisation
WhileSection3.1.1describedhighlysensitivetechniquesforthequantificationof
metal/metalloidswithinbiologicalsamples,theaforementionedtechniquescannotbe
used to determine the cellular localisation and consequently potential intracellular
targets of the metal/metalloid. Microprobe SRXRF spectroscopy (also known as
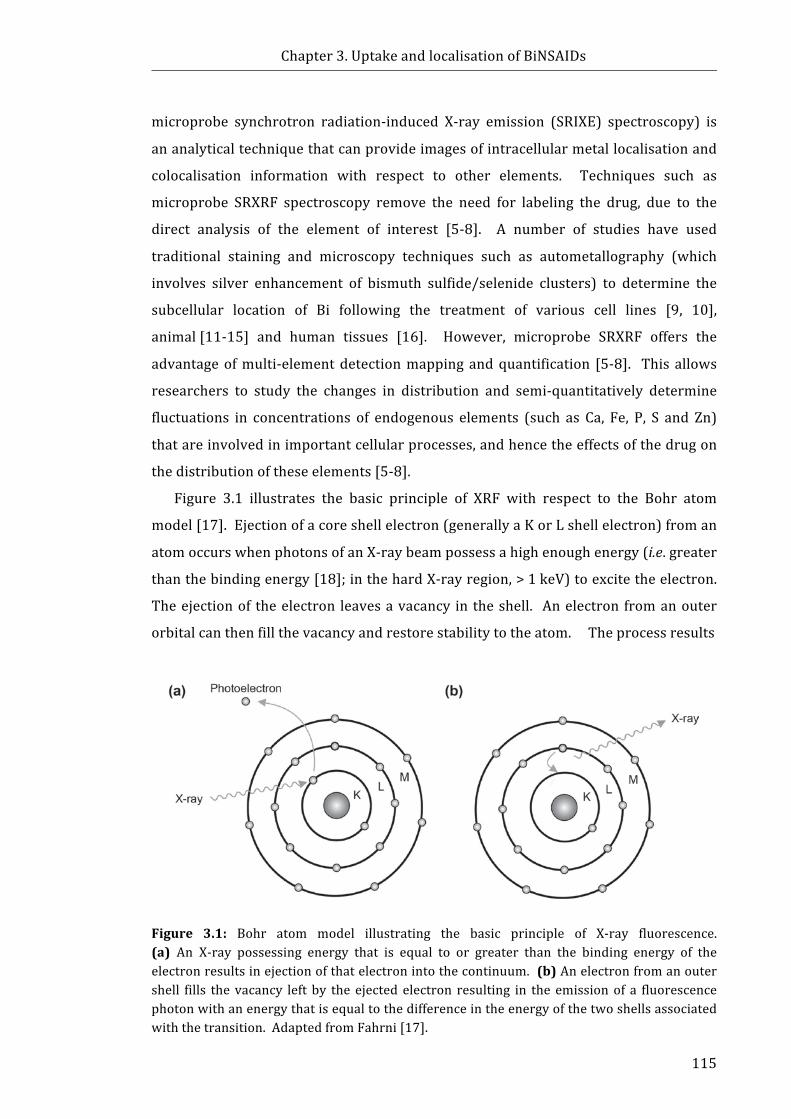
Chapter3.UptakeandlocalisationofBiNSAIDs
115
microprobe synchrotron radiation-induced X-ray emission (SRIXE) spectroscopy) is
ananalyticaltechniquethatcanprovideimagesofintracellularmetallocalisationand
colocalisation information with respect to other elements. Techniques such as
microprobe SRXRF spectroscopy remove the need for labeling the drug, due to the
direct analysis of the element of interest [5-8]. A number of studies have used
traditional staining and microscopy techniques such as autometallography (which
involves silver enhancement of bismuth sulfide/selenide clusters) to determine the
subcellular location of Bi following the treatment of various cell lines [9, 10],
animal[11-15] and human tissues [16]. However, microprobe SRXRF offers the
advantageofmulti-elementdetectionmappingandquantification [5-8]. This allows
researchers to study the changes in distribution and semi-quantitatively determine
fluctuations in concentrations of endogenous elements (such as Ca, Fe, P, S and Zn)
thatareinvolvedinimportantcellularprocesses,andhencetheeffectsofthedrugon
thedistributionoftheseelements[5-8].
Figure 3.1 illustrates the basic principle of XRF with respect to the Bohr atom
model[17].Ejectionofacoreshellelectron(generallyaKorLshellelectron)froman
atomoccurswhenphotonsofanX-raybeampossessahighenoughenergy(i.e.greater
thanthebindingenergy[18];inthehardX-rayregion,>1keV)toexcitetheelectron.
Theejectionof theelectron leavesavacancy in theshell. Anelectron fromanouter
orbitalcanthenfillthevacancyandrestorestabilitytotheatom.Theprocessresults
Figure 3.1: Bohr atom model illustrating the basic principle of X-ray fluorescence.(a)AnX-ray possessing energy that is equal to or greater than the binding energy of theelectronresultsinejectionofthatelectronintothecontinuum.(b)Anelectronfromanoutershell fills the vacancy left by the ejected electron resulting in the emissionof a fluorescencephotonwithanenergythatisequaltothedifferenceintheenergyofthetwoshellsassociatedwiththetransition.AdaptedfromFahrni[17].
Chapter3.UptakeandlocalisationofBiNSAIDs
116
intheemissionofaphotonwithenergyequaltothedifferenceinbindingenergiesof
the two shells involved in the transition. The binding energy of each electron is
proportional to the squarednuclear charge; for example, the analysis of Bi requires
energy of 10.7keV (the binding of the Lα2 electrons). In addition, every element
possessesuniquebindingenergiesandcharacteristicphotonemissions(fluorescence)
enablingdetectionof therelevantelements inthesample. Furthermore, therelative
quantities of the elements can be determined since the fluorescence emission is
directlyproportionaltotheamountofanelementpresentinasample.
TheuseofX-raysproducedatasynchrotronoffersanumberofadvantagesover
conventional bench-top X-ray sources. These include the capability of generating
X-raysup to12ordersofmagnitudebrighter thana conventionalX-raysource [19],
andfollowingtheadvancesinmodernX-rayoptics,theabilitytofocustheX-raystoa
submicronspotonasamplewiththeuseofdevicessuchasaKirkpatrick-Baezmirror
[20]orFresnelzoneplate[21].Bothofthesefactorshavefacilitatedthedevelopment
ofmicroprobe SRXRF spectroscopy. Detection sensitivities in the ppb range can be
routinely obtained from using microprobe SRXRF, in comparison to the ppm
sensitivities of alternative microprobe (particle induced X-ray emission) and
nanoprobe(electrondispersiveX-rayanalysis)techniques. Theimprovedsensitivity
ofmicroprobe XRF stems from the absence of the continuum background radiation
that isa featureof thespectraobtained fromtheuseofchargedparticlebeams,and
the increased X-ray flux on the sample associated with the use of third generation
synchrotronfacilities([22]andreferenceswithin).
TheachievementofsubmicronresolutionwithmicroprobeSRXRFcombinedwith
thehighsensitivityandpenetrationdepthofhardX-raysmakesthetechniquehighly
amenable to the study of single mammalian cells [22]. Raster scanning produces
quantitative information froman entire scanned area of a specimen resulting in the
generation of elemental maps. Depending on the particular element, detection
sensitivities have been reported in the range of 10−17−10−14 g for mammalian cell
studies([22]andreferenceswithin).MicroprobeSRXRFhasbeenappliedtothestudy
oftheintracellularfateofbothmarketedandpotentialmetal-baseddrugscontaining
Pt [6,23,24],Cr [5],Ru [8,25], Se [26,27],Gd [28,29], andAs[30] inanumberof
cancer cell lines. However, to date there are few, if any, reports assessing the
distribution of Bi-based drugs in human cells using microprobe SRXRF
microspectroscopy.

Chapter3.UptakeandlocalisationofBiNSAIDs
117
3.1.3 Chapteraims
HavingestablishedthestabilityoftheBiNSAIDs,Bi(difl)3,Bi(mef)3andBi(tolf)3,in
cellmedium,andthetoxicityoftheBiNSAIDstowardsHCT-8cells,itwasofinterestto
quantify the cellular Bi content following treatment with BiNSAIDs to determine if
therewereanycorrelationsbetweencellularuptakeversusstabilityand/or toxicity.
AssessingthesubcellulardistributionofBiwasofinterestinordertoprovideinsight
intotheintracellulartargetsoftheBiNSAIDs,Bi(difl)3,Bi(mef)3andBi(tolf)3,inHCT-8
cells.ThespecificaimsofthisChapterwereto:
1. Quantify Bi uptake by the HCT-8 cells using GFAAS in order to determine
whetherBiuptakecorrelateswithBiNSAIDstabilityandtoxicity.
2. Ascertain the subcellular location of Bi in HCT-8 cells following treatment
with BiNSAIDs using microprobe SRXRF imaging to assess how this might
influencetoxicitytowardsthecancercellsandhowthismight influencethe
targetingofCOX.

Chapter3.UptakeandlocalisationofBiNSAIDs
118
3.2 Materialsandmethods3.2.1 Materials
ThematerialsusedforthecellcultureexperimentsdescribedinthisChapterhave
been previously described in Section 2.2.1. The chemicals, ammonium acetate
(≥98%),sodiumchloride(99.999%tracemetalbasis),andtrypanblue(0.5%inPBS)
werepurchasedfromSigma-Aldrich(StLouis,USA). Pyronegdetergentwassourced
fromDiverseyLeverAustraliaPtyLtd(Smithfield,Australia).Analyticalgradeethanol
(absolute, ≥99.5%) and nitric acid (68−70%) were sourced from Ajax
Finechem(Seven Hills, Australia). Acertified Bi standard solution (1004±3mg/mL,
2% HNO3 v/v) was acquired from PerkinElmer Instruments (Massachusetts, USA),
whilethemagnesium(Mg(NO3)2,10mg/mL)andpalladiummatrixmodifiersolutions
(Pd(NO3)2, 5mg/mL)were procured from Astral Scientific (Taren Point, Australia).
Analytical volumetric flasks (Class A) were purchased from GlassCo (Dandenong
South, Australia). Tracepur nitric acid (69%)was sourced fromMerck (Darmstadt,
Germany). A Bi hollow cathode lamp and standard transversely heated graphite
atomizer tubes(insertedpyrolyticL’vovplatform)wereobtained fromPerkinElmer
Instruments (Victoria, Australia). Glutaraldehyde (25% solution), Spurr's low
viscosityembeddingresinandtoluidineblueweresourcedfromProscitech(Kirwan,
Australia). Siliconnitride (Si3N4)membranes (frame size, 5×5mm2; sample surface
area,1.5×1.5mm2;membranethickness,500nm;andframethickness,200nm)were
manufacturedbySilsonLtd(Northampton,England).
3.2.2 Cellcultureprocedures
HCT-8cellsweresourcedandemployedasdescribedinSection2.2.3.
3.2.3 GFAASuptakestudies
3.2.3.1 Preparationofcelldigests
Cell digestswere prepared for GFAAS analysis using a similar procedure to that
documentedpreviously [23]. Briefly,HCT-8 cells (2 × 10⁶ cells, 5mL)were seeded
into60-mmcellculturedishesandincubatedfor24h,afterwhichthegrowthmedium
was removed and the cells were washed twice with PBS. The control cells were
incubatedwith vehicle (5mLRPMI-1640, 2%DMSO v/v) for 24 h,while treatment
solutionsofBi(difl)3,Bi(mef)3,Bi(tolf)3orBSSwereaddedtotheotherdishes(15µM
or 40 µM Bi in 5mL RPMI-1640, 2% DMSO v/v) for 24 h. The two treatment
Chapter3.UptakeandlocalisationofBiNSAIDs
119
concentrationswereapproximatelyequaltothetwolowestIC50valuesobtainedfrom
the toxicity studies (Section 2.2.4). Triplicate disheswere prepared for the control
andeachtreatment.Followingthetreatmentperiod,thesolutionswereremovedand
thecellswerewashed twicewithPBS(2mL),harvestedwith trypsin(0.25%,2mL)
andcentrifuged(300g,5min).ThecellswereresuspendedinRPMI-1640(1mL)and
trypan blue exclusion assays were performed by removing the resultant cell
solution(50µL) fromeachsampleandmixingwith trypanblue(50µL,0.5%w/v in
PBS). The populations of intact cells and disrupted cells were scored using a
haemocytometer(100×magnification),wherebycellsthatappearedbluerepresented
uptake of trypan blue and loss ofmembrane integrity (dead cells) while those that
werecolourlessrepresentedcellswithanintactmembrane(healthycells). Thecells
inthemainsuspensionswerewashedtwicewithsterilePBSsolution(2mL),followed
by twowashes with sterile saline solution (0.9%, 2mL). The final saline solutions
were drained from the pellets and the cells were freeze-dried for 2h. Nitric acid
(Tracepur,69%v/v)wasaddedtoeachEppendorftube(43µL)andthepelletswere
digested overnight. The digested pellets were transferred to volumetric flasks
(prewashedwithasolutionofPyronegdetergent(72h),followedbynitricacid(72h),
andMilliQ water(72 h) and rinsed 5times withMilliQ water) and the volumewas
adjusted to5.00mL (usingMilliQwater)or25.00mL (usingMilliQwaterandnitric
acid(177µL,Tracepur,69%v/v)),toobtainafinalHNO3concentrationof0.6%v/v.
3.2.3.2 Preparationoffixed/dehydratedcelldigests
It has been previously reported that formalin fixation can causemetal and trace
element leaching from tissues [31]. In this study, the integrity/effect of the
glutaraldehyde fixation and ethanol dehydration process used for preparation of
thin-sectioned cell samples for microprobe SRXRF analysis was investigated to
determine if there was any change in Bi uptake. As such, the cell samples were
preparedasoutlinedintheprevioussectionbutwiththefollowingchanges.Afterthe
final PBS wash of the treated cells, the cells were resuspended in glutaraldehyde
(1mL,2%v/vinPBS)andfixedfor2hatroomtemperature.Dehydrationofthecells
was performed incrementally using increasing ethanol concentrations (in MilliQ
water; 30% ×2, 50% ×2, 70% ×2, 80% ×2, 90% ×2, 95%×2, 100% ×4) with
centrifugation,andremovalofthesupernatantandcellresuspensionaftereachstep.
The pellets were then freeze-dried after the final ethanol wash and digested as

Chapter3.UptakeandlocalisationofBiNSAIDs
120
describedinSection3.2.3.1.
3.2.3.3 Graphitefurnaceatomicabsorptionspectroscopy
Digested cell solutions were analysed for Bi using a PerkinElmer AAnalyst 600
atomic absorption spectrometer equippedwith theWinlab 32 AA Furnace program
incorporating Zeeman-effect background correction, an AS-800 autosampler and an
AAAccessory cooling system. ABihollowcathode lamp (PerkinElmer)wasusedat
223nm, using a slit width of 0.7nm, to give an instrument energy reading of
approximately 35W. A certified Bi standard solutionwas employed to prepare the
stock Bi standard (100µg/L, 0.6% HNO3v/v) for the calibration curve (correlation
coefficients: 0.993−0.997). The autosampler volumes consisted of the chemical
modifier(5µL,0.005mg/mLPd(NO3)2and0.003mg/mLMg(NO3)2), followedbythe
standard or sample (20µL). Bi was atomised from the surface of the pyrolytic
graphite-coated tubes using the furnace operating conditions described in
Appendix2.1. Theanalytereadingwasperformedduringatomisation(1700°C)and
Argaswassuppliedtotheinstrumentduringanalysis.Afteranalysisofeachdigested
cell sample, a blank (containing 0.6% HNO3v/v) was analysed to minimise
interference from previous samples and ensure that Bi detection returned to
backgroundlevels.
3.2.4 MicroprobeSRXRFanalysisofBi-treatedcells
3.2.4.1 Preparationofthin-sectionedcellsamples
Thin-sectioned cells were prepared for microprobe SRXRF analysis using
procedures documented previously [5, 6, 32, 33]. Briefly, cells were seeded in cell
cultureflasks(75cm2)andgrownto80%confluence.TreatmentsolutionsofBi(difl)3,
Bi(mef)3,Bi(tolf)3orBSS(40µMBi,10mLRPMI-1640,2%DMSOv/v)wereappliedto
the cell culture flasks, while control cells were incubated with vehicle (10mL
RPMI-1640, 2%DMSO v/v) for 4 h or 24 h. The treatment concentration of the
complexes was chosen based on the uptake results obtained from the toxicity and
GFAASexperiments(Sections2.3.2and3.3.1)toensurethatdetectableconcentrations
of Bi (suitable for microprobe SRXRF imaging) were present in the cells following
treatment.ThecellswerewashedtwicewithPBSandharvestedusingtrypsin(0.25%
inPBS).TheharvestedcellswerewashedtwicewithsterilePBSusingcentrifugation
andthe finalcellpelletwas fixed inglutaraldehyde(1mL,2%v/v inPBS) for2hat
Chapter3.UptakeandlocalisationofBiNSAIDs
121
room temperature; and dehydrated in ethanol (30% ×2, 50% ×2, 70%×2, 80% ×2,
90% ×2, 95% ×2, 100% ×4). Infiltration was achieved by rocking the cells in
50%ethanol/50% Spurr’s resin overnight and then replacing with 100% Spurr’s
resin(×2over2days)toensuretheremovalofall tracesofwater. Onthe finalday,
thecellswereembeddedin100%Spurr’sresin,centrifuged(8000g,1h)andcuredat
60 °Covernight in aBeemcapsule. Thin sections (1µm)of the cell pelletwere cut
using an ultramicrotome (Leica EM UC7). The thin-sections were stained with
toluidinebluebeforemountingonsiliconnitridemembranes.
3.2.4.2 MicroprobeSRXRFanalysisofthin-sectionedcells
Siliconnitridemembraneswereattachedtokinematicmountsdesignedtofitboth
thelightmicroscope(LeicaDMXREEpi-fluorescence/visualmicroscope)andtheX-ray
microprobe(2-ID-D).OpticalmicrographsandXYcoordinateswereobtainedinorder
tolocatesuitablecellsforanalysis.Thosecellsthatexhibitedanintactappearance,a
clearly defined nucleus and were located away from other cells and cellular debris
werechosenforanalysis.
Microprobe SRXRF was performed at beamline 2-ID-D at the Advanced Photon
Source,ArgonneNational Laboratory (Lemont, IL,USA). The13.45keVX-raybeam
wasfocusedtoaspotsizeof0.3×0.3µm2usingtwozoneplates. Thesampleswere
housedinaheliumatmosphereandthedistributionsoftheelementsfromP(2.1keV)
toBi(13.45keV)weremappedbyrasterscanningthesamplein0.3µmsteps,withthe
aidofaXYZmotorisedstage.FluorescentX-raysweredetectedusingadwelltimeof
2.5s/pt and an energy dispersive Vortex EM (Hitachi High-Technologies Science
America, Northridge, CA) silicon drift detector. Elemental distribution maps were
processedusingMAPSVersion1.7.3.02softwarepackageprovidedbyDrStefanVogt
(AdvancedPhotonSource) [34]. Conversionof elemental fluorescence intensities to
absolute densities in microgram per square centimetre(µg/cm2) was performed by
comparing X-ray fluorescence intensities with those from thin film standards,
NBS-1832andNBS-1833(NIST,Gaithersburg,MD,USA).Theelementalquantification
ofspecificregionsoftheelementaldistributionmaps(i.e.thenucleusandcytoplasm)
was performed by selecting the region of interest (ROI) and extracting the
quantificationinformationfortheROIusingMAPSVersion1.7.3.11softwarepackage
providedbyDrStefanVogt(AdvancedPhotonSource)[34].
Chapter3.UptakeandlocalisationofBiNSAIDs
122
3.2.5 Statisticalanalysis
Statistical analysis of the results of the trypan blue exclusion assays, the GFAAS
assays and the microprobe SRXRF elemental quantification were performed using
one-way ANOVA, followed by the Tukey-Kramer Multiple Comparison Test, using
GraphPadPrism,Version5.04 forWindows(GraphPadSoftware,La Jolla,USA). The
trypan blue exclusion assay and GFAAS results were analysed as two treatment
sets(i.e.controland15µM,orcontroland40µMtreatmentsamples)inordertodraw
astatisticalcomparisonatthesameBitreatmentconcentration.Resultsarepresented
asmean± standarddeviation (s.d.). A valueofP≤0.05was considered statistically
significant.
Chapter3.UptakeandlocalisationofBiNSAIDs
123
3.3 Results3.3.1 GFAASanalysisofcellularBi
Figure 3.2 shows the results of the trypan blue assay and the corresponding Bi
detected in cells treated with the vehicle, BiNSAIDs or BSS (15 µM and 40 µM Bi).
Thetrypanbluepositivecells(Fig.3.2a)formedarelativelylowproportion(<1%)of
the totalnumberofcontrolandBiNSAID-treatedcells, indicating that themembrane
integrityofthemajorityofthecellswasuncompromised.Thisisanimportantresult
becauseitestablishesthatanycellularBidetected(Fig.3.2b)isnottheresultofrapid
uptakeduetolossofcellmembraneintegrity.Notably,significantdecreasesinthecell
populationswereobservedfollowingtreatmentwithBi(mef)3(40µMBi,P≤0.01)and
Bi(tolf)3 (15 µM Bi, P ≤ 0.01; 40 µM Bi, P ≤ 0.001, Fig. 3.2a). The number of
Bi(tolf)3-treated cells (15 µM Bi) was approximately 45% of the number of control
cells and further decreased to approximately 20% with increased Bi treatment
concentration(40µMBi,Fig.3.2a).Thecellpopulationobservedfollowingtreatment
with Bi(mef)3 (40 µM Bi, 24 h) was approximately 43% of the population of
vehicle-treatedcells(Fig.3.2a).ThelowercellpopulationsobservedforBi(mef)3-and
Bi(tolf)3-treatedcells(40µM,Figure3.2a)wereconsistentwiththeresultsoftheMTT
assay(Fig.2.6,Table2.4)thatshowedthatBi(mef)3andBi(tolf)3werethemoretoxic
complexes.
In the treatmentgroupexposed to15-µMBi, thecellularBi (Fig.3.2b)wasmore
than three times higher in Bi(tolf)3-treated cells than in the Bi(difl)3- and
Bi(mef)3-treatedcells.Interestingly,BSS-treatedcellsexhibitedthehighestamountof
cellular Bi (three times higher than Bi(tolf)3), and displayed the only statistically
significant (P≤ 0.001) increase above the control for the 15-µM treatment group.
Increasingthetreatmentconcentrationfrom15µMto40µMresultedinanincreasein
cellular Bi content in all Bi-treated cells (Fig. 3.2b). Treatmentwith themost toxic
BiNSAID, Bi(tolf)3 (40 µM, 24 h), showed the highest Bi concentration per cell
(P≤0.001 compared to the control, and the other Bi treatments), which was
approximately 70 times higher than the cellular Bi associated with Bi(difl)3- and
Bi(mef)3-treated cells (40 µM, 24 h) and approximately 340 times higher than the
cellular uptake of Bi(tolf)3-treated cells at 15µM. The cellular uptake of Bi(difl)3-,
Bi(mef)3-, and BSS-treated cells increased only approximately 9, 18 and 5 times,
respectively, incomparisontocellstreatedwith15-µMofthecompounds(P>0.05).
Interestingly, despite the differences in the toxicities of the 40-µM treatments with
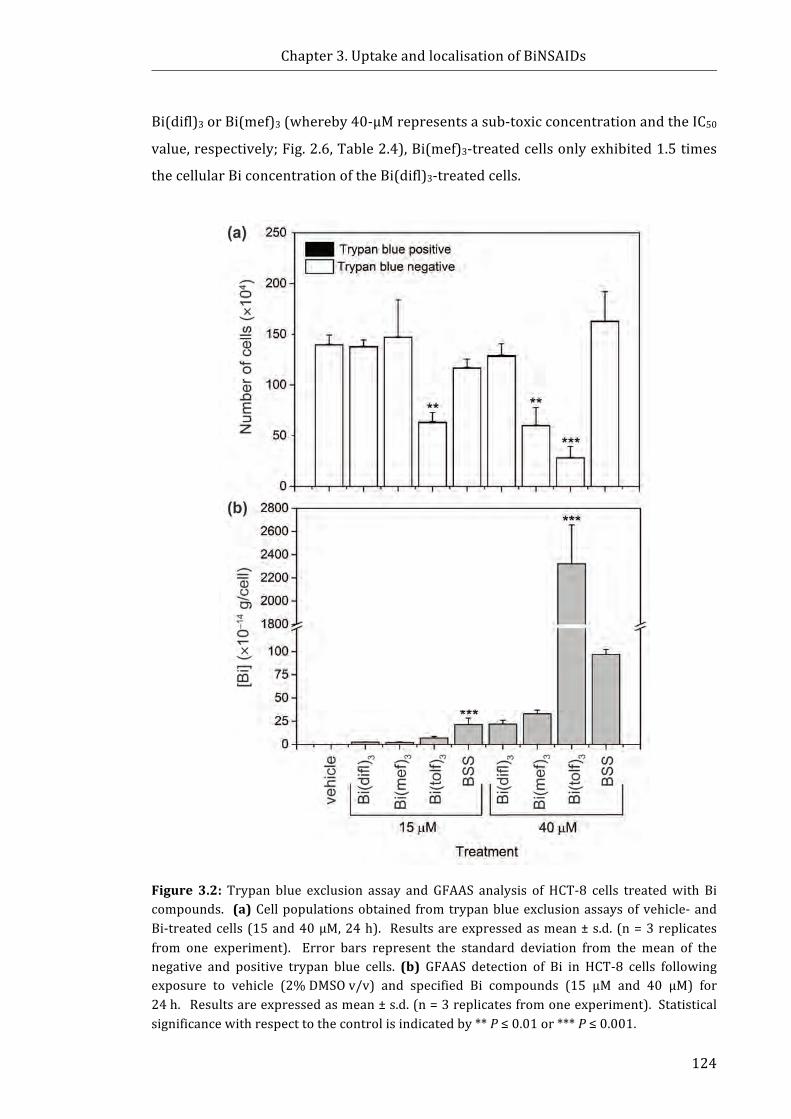
Chapter3.UptakeandlocalisationofBiNSAIDs
124
Bi(difl)3orBi(mef)3(whereby40-µMrepresentsasub-toxicconcentrationandtheIC50
value,respectively;Fig.2.6,Table2.4),Bi(mef)3-treatedcellsonlyexhibited1.5times
thecellularBiconcentrationoftheBi(difl)3-treatedcells.
Figure 3.2: Trypan blue exclusion assay and GFAAS analysis of HCT-8 cells treatedwith Bicompounds. (a)Cellpopulationsobtained fromtrypanblueexclusionassaysofvehicle-andBi-treatedcells(15and40µM,24h). Resultsareexpressedasmean± s.d. (n=3replicatesfrom one experiment). Error bars represent the standard deviation from the mean of thenegative and positive trypan blue cells. (b) GFAAS detection of Bi in HCT-8 cells followingexposure to vehicle (2%DMSOv/v) and specified Bi compounds (15 μM and 40 µM) for24h.Resultsareexpressedasmean±s.d.(n=3replicatesfromoneexperiment).Statisticalsignificancewithrespecttothecontrolisindicatedby**P≤0.01or***P≤0.001.
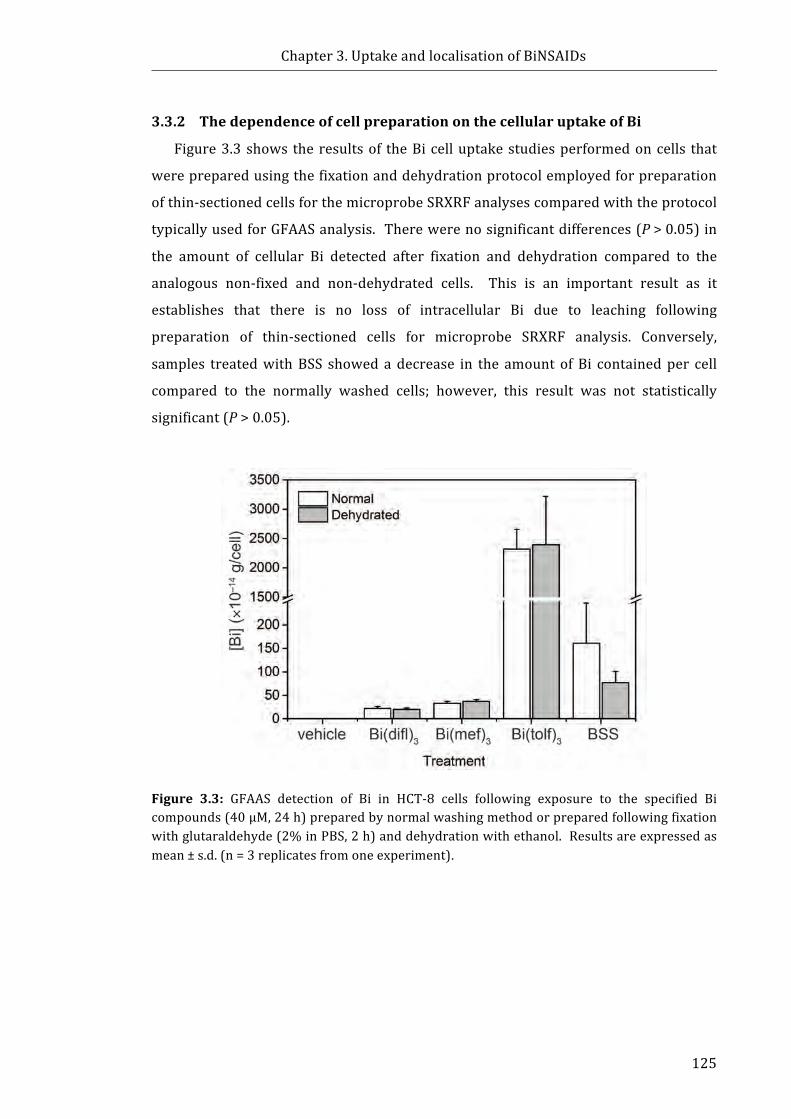
Chapter3.UptakeandlocalisationofBiNSAIDs
125
3.3.2 ThedependenceofcellpreparationonthecellularuptakeofBi
Figure3.3shows theresultsof theBicelluptakestudiesperformedoncells that
werepreparedusingthefixationanddehydrationprotocolemployedforpreparation
ofthin-sectionedcellsforthemicroprobeSRXRFanalysescomparedwiththeprotocol
typicallyusedforGFAASanalysis. Therewerenosignificantdifferences(P>0.05)in
the amount of cellular Bi detected after fixation and dehydration compared to the
analogous non-fixed and non-dehydrated cells. This is an important result as it
establishes that there is no loss of intracellular Bi due to leaching following
preparation of thin-sectioned cells for microprobe SRXRF analysis. Conversely,
samples treatedwithBSS showedadecrease in the amount ofBi containedper cell
compared to the normally washed cells; however, this result was not statistically
significant(P>0.05).
Figure 3.3: GFAAS detection of Bi in HCT-8 cells following exposure to the specified Bicompounds(40μM,24h)preparedbynormalwashingmethodorpreparedfollowingfixationwithglutaraldehyde(2%inPBS,2h)anddehydrationwithethanol.Resultsareexpressedasmean±s.d.(n=3replicatesfromoneexperiment).
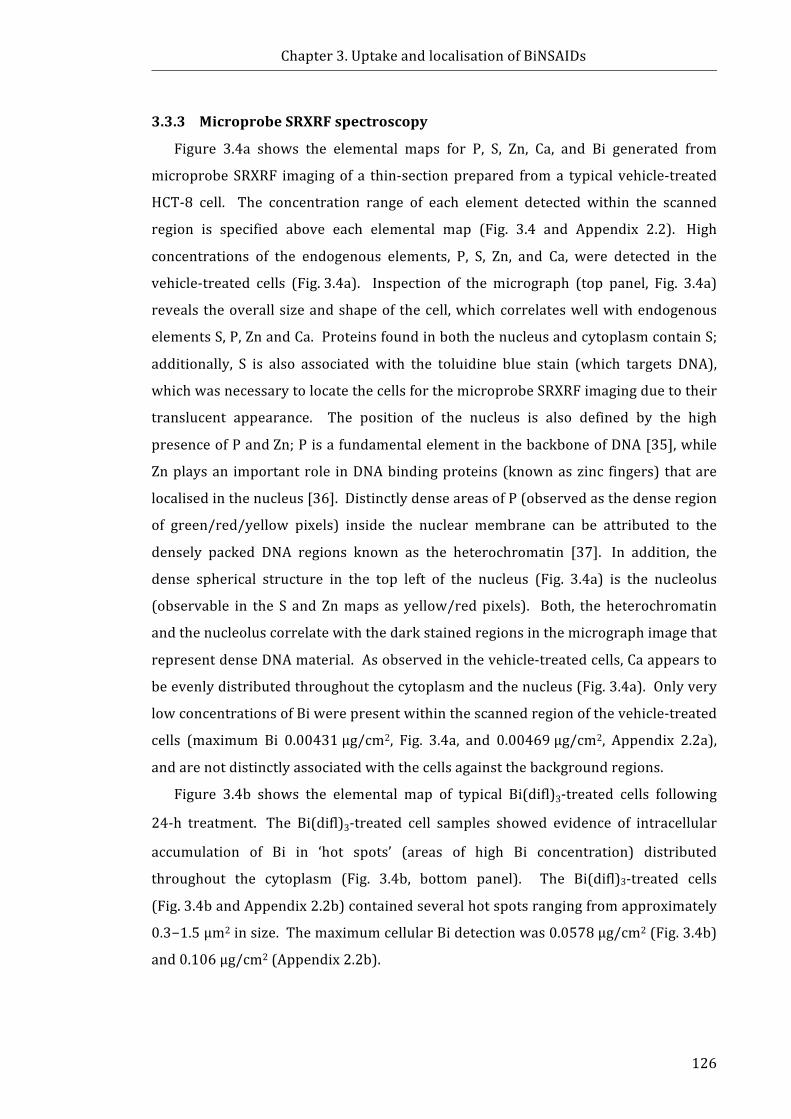
Chapter3.UptakeandlocalisationofBiNSAIDs
126
3.3.3 MicroprobeSRXRFspectroscopy
Figure 3.4a shows the elemental maps for P, S, Zn, Ca, and Bi generated from
microprobeSRXRF imagingof a thin-sectionprepared froma typical vehicle-treated
HCT-8 cell. The concentration range of each element detected within the scanned
region is specified above each elemental map (Fig. 3.4 and Appendix 2.2). High
concentrations of the endogenous elements, P, S, Zn, and Ca, were detected in the
vehicle-treated cells (Fig.3.4a). Inspection of the micrograph (top panel, Fig. 3.4a)
reveals theoverallsizeandshapeof thecell,whichcorrelateswellwithendogenous
elementsS,P,ZnandCa.ProteinsfoundinboththenucleusandcytoplasmcontainS;
additionally, S is also associated with the toluidine blue stain (which targets DNA),
whichwasnecessarytolocatethecellsforthemicroprobeSRXRFimagingduetotheir
translucent appearance. The position of the nucleus is also defined by the high
presenceofPandZn;PisafundamentalelementinthebackboneofDNA[35],while
Znplaysan importantrole inDNAbindingproteins(knownaszinc fingers) thatare
localisedinthenucleus[36].DistinctlydenseareasofP(observedasthedenseregion
of green/red/yellow pixels) inside the nuclear membrane can be attributed to the
densely packed DNA regions known as the heterochromatin [37]. In addition, the
dense spherical structure in the top left of the nucleus (Fig. 3.4a) is the nucleolus
(observable in the S andZnmaps as yellow/redpixels). Both, the heterochromatin
andthenucleoluscorrelatewiththedarkstainedregionsinthemicrographimagethat
representdenseDNAmaterial.Asobservedinthevehicle-treatedcells,Caappearsto
beevenlydistributedthroughoutthecytoplasmandthenucleus(Fig.3.4a).Onlyvery
lowconcentrationsofBiwerepresentwithinthescannedregionofthevehicle-treated
cells (maximum Bi 0.00431μg/cm2, Fig. 3.4a, and 0.00469μg/cm2, Appendix 2.2a),
andarenotdistinctlyassociatedwiththecellsagainstthebackgroundregions.
Figure 3.4b shows the elemental map of typical Bi(difl)3-treated cells following
24-h treatment. The Bi(difl)3-treated cell samples showed evidence of intracellular
accumulation of Bi in ‘hot spots’ (areas of high Bi concentration) distributed
throughout the cytoplasm (Fig. 3.4b, bottom panel). The Bi(difl)3-treated cells
(Fig.3.4bandAppendix2.2b)containedseveralhotspotsrangingfromapproximately
0.3−1.5μm2insize.ThemaximumcellularBidetectionwas0.0578μg/cm2(Fig.3.4b)
and0.106μg/cm2(Appendix2.2b).
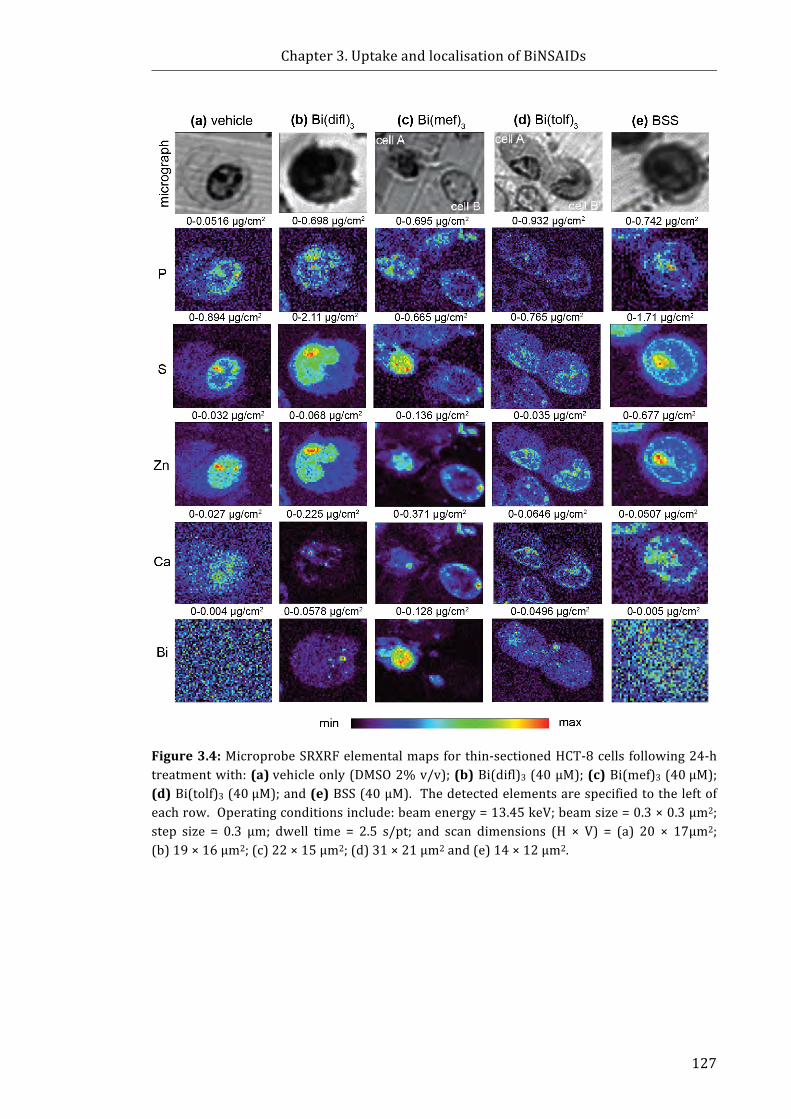
Chapter3.UptakeandlocalisationofBiNSAIDs
127
Figure3.4:MicroprobeSRXRFelementalmapsforthin-sectionedHCT-8cells following24-htreatmentwith:(a)vehicleonly(DMSO2%v/v);(b)Bi(difl)3(40μM);(c)Bi(mef)3(40μM);(d)Bi(tolf)3(40μM);and(e)BSS(40μM). Thedetectedelementsarespecifiedtotheleftofeachrow.Operatingconditionsinclude:beamenergy=13.45keV;beamsize=0.3×0.3μm2;step size = 0.3 μm; dwell time = 2.5 s/pt; and scan dimensions (H × V) = (a) 20 × 17μm2;(b)19×16μm2;(c)22×15μm2;(d)31×21μm2and(e)14×12μm2.
Chapter3.UptakeandlocalisationofBiNSAIDs
128
Figure 3.4c shows the elemental map of typical Bi(mef)3-treated cells following
24-htreatment. Thereweresubstantialdifferencesobservedinthedistributionand
maximumBidetectedbetweenCellAandCellB(Fig.3.4c).ThemaximumBidetected
in CellA was 0.128μg/cm2, twice the amount detected in CellB (maximum
0.06136μg/cm2).Additionally,BiwasdistributedthroughoutCellA,withthehighest
concentration of Bi localised in the nucleus and considerable Bi also present in the
cytoplasm(Fig.3.4c). It shouldbenotedthat thiswas theonlyBiNSAID-treatedcell
where theBi localisationwasobserved inboth thenuclearandcytoplasmic regions.
ThemajorityoftheBipresentinthecytoplasmofCellBappearstobeconcentratedin
one large hot spot, approximately 5.8μm2 in size (Fig. 3.4c). A similar result was
observed in a third Bi(mef)3-treated cell (24h), whereby one large hot spot was
observed in thecytoplasm(Appendix2.2c). Notably, therewas littleevidenceofBi
accumulationwithintheBi(mef)3-treatedcells following4-htreatment(maximumBi
0.0065μg/cm2and0.0134μg/cm2,Appendix2.3).
The 24-h Bi(tolf)3-treated cell samples also showed evidence of intracellular
accumulationofBiinhotspotsdistributedthroughoutthecytoplasm.Themaximum
Bi detected in Bi(tolf)3-treated cells (Fig. 3.4d) was 0.0496μg/cm2 (Cell A) and
0.0408μg/cm2 (Cell B), 10times greater than the amount of Bi detected in vehicle-
treated cells (Fig. 3.4a). A third Bi(tolf)3-treated cell (Appendix 2.2d) contained the
largest amount of Bi of all the BiNSAID-treated cells analysed (1.01 μg/cm2),which
appearedtobelocalisedinonecytoplasmichotspot.TheBihotspotsrangedinsize
fromapproximately0.7μm2to2.8μm2intheBi(tolf)3-treatedcells.
Figure3.4eshowsthattherewasnoevidenceofaccumulationofBiincellstreated
withBSS(24h).ThemaximumBicountsdetectedwere0.005μg/cm2(Fig.3.4e)and
0.006μg/cm2 (Appendix 2.2e), similar to the Bi content of the vehicle-treated cells
(Fig.3.4aandAppendix2.2a).
AcrossallBiNSAID-treatedcells,manyoftheBihotspotsshowedcloseproximity
to the nucleus; the colocalisation maps with P and Zn, confirmed the spots were
located close to thenuclearmembrane in a numberof cells (Appendix2.4 a(i), b(i),
b(ii)andc(i)). Analysisof themicroprobeSRXRFelementalmapsalsorevealedthat
theCadistributionofalltheBi-treatedHCT-8cells(Fig.3.4b-eandAppendix2.2b-e)
differed compared to the vehicle-treated cells (Fig.3.4a and Appendix 2.2a).
Forinstance, in the case of all Bi-treated cells (Fig. 3.4b-e and Appendix 2.2b-e),
cellularCaconcentrationappearedhigherthanthevehicle-treatedcells(Fig.3.4aand
Chapter3.UptakeandlocalisationofBiNSAIDs
129
Appendix 2.2a) as evident in the Ca range (maximum quantity detected in vehicle-
treated cells ranged from 0.027−0.0344 μg/cm2, Bi-treated cells 0.0507−0.371
μg/cm2)andthehigherdefinitionintheCamaps.
Theelementalquantificationsof thecytoplasmicandnuclear regionsof the thin-
sectionsobtainedfromvehicle-,BiNSAID-andBSS-treatedHCT-8cellsarepresented
inFigure3.5.Sincequantificationoftheentirecellularcontentsisnotpossiblefroma
thin-section, the quantifications are represented per unit area (μm2). Statistical
analysisshowsthattherewerenosignificantdifferencesinthecytoplasmicornuclear
P concentrations in the vehicle-treated cells compared to the Bi-treated cells
(Fig.3.5a).TheconcentrationofZnwassignificantlyelevatedinthecytoplasmofthe
Bi(difl)3-treated cells, and the nucleus of the Bi(mef)3-treated cells compared to the
vehicle-treated cells (P ≤ 0.05 and P≤0.01, respectively); however, no significant
changeswereobservedintheZncontentoftheBi(tolf)3-treatedcellscomparedtothe
vehicle-treatedcells(Fig.3.5b).
TheconcentrationofCawassignificantly increased in thecytoplasmandnucleus
of the Bi(mef)3-treated cells (both P ≤ 0.001) compared to the vehicle-treated cells
(Fig.3.5c).TherewerenosignificantfluctuationsinCainthecytoplasmofanyofthe
otherBi-treatedcells(Fig.3.5c).AnincreaseinCa(1.4–1.8fold)wasobservedinthe
nucleusoftheotherBi-treatedcellgroups(Fig.3.5c),althoughthisincreasewasonly
significantintheBi(difl)3-treatedcells(P≤0.05). NegligiblelevelsofintracellularBi
weredetectedinthecytoplasmandnucleusofthevehicle-andBSS-treatedcells(Fig.
3.5d); however, the BiNSAID-treated cells showed large fluctuations in the
intracellularlevelsofBiinboththecytoplasmandthenucleus.
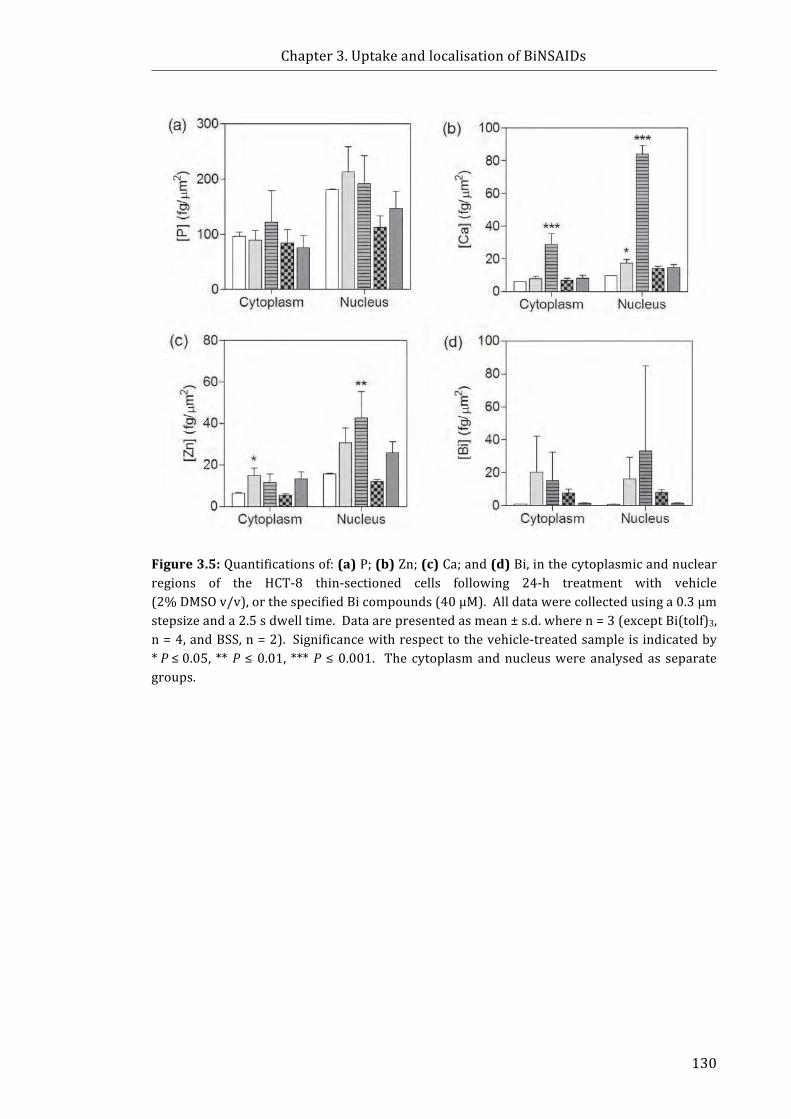
Chapter3.UptakeandlocalisationofBiNSAIDs
130
Figure3.5:Quantificationsof:(a)P;(b)Zn;(c)Ca;and(d)Bi,inthecytoplasmicandnuclearregions of the HCT-8 thin-sectioned cells following 24-h treatment with vehicle(2%DMSOv/v),orthespecifiedBicompounds(40μM).Alldatawerecollectedusinga0.3μmstepsizeanda2.5sdwelltime.Dataarepresentedasmean±s.d.wheren=3(exceptBi(tolf)3,n=4,andBSS,n=2). Significancewithrespecttothevehicle-treatedsampleisindicatedby*P≤0.05, **P ≤0.01, ***P ≤0.001. The cytoplasmandnucleuswereanalysedas separategroups.
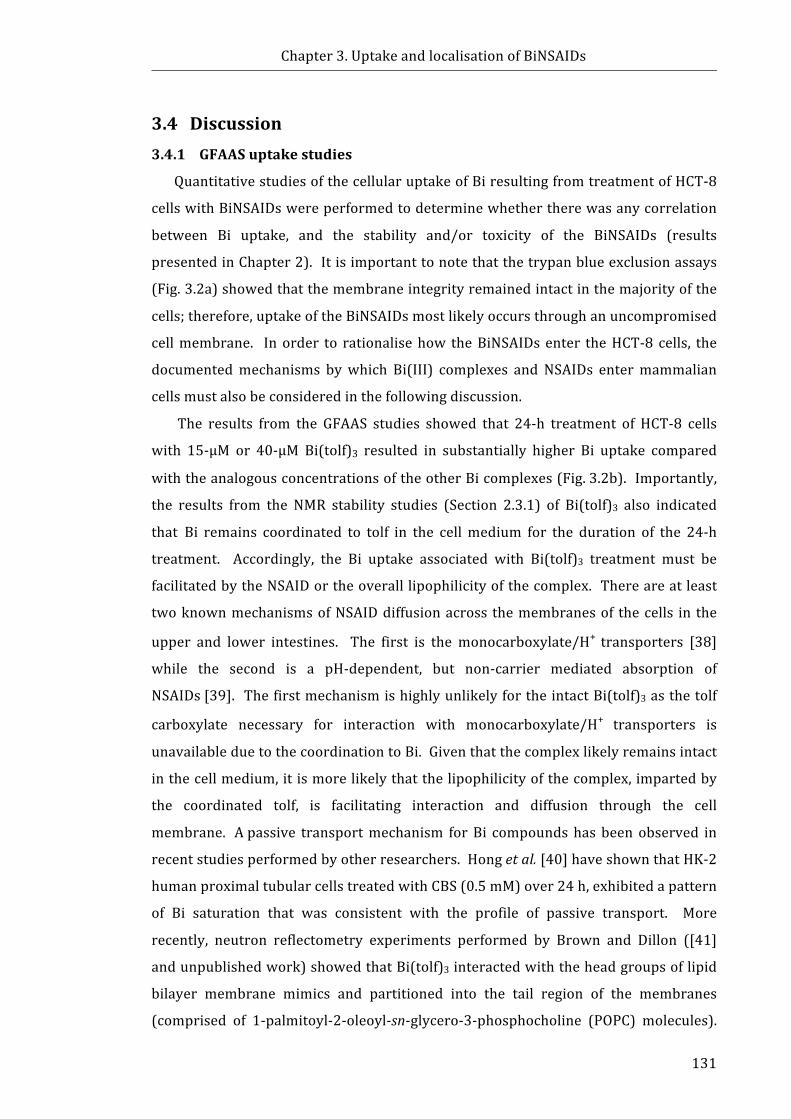
Chapter3.UptakeandlocalisationofBiNSAIDs
131
3.4 Discussion3.4.1 GFAASuptakestudies
QuantitativestudiesofthecellularuptakeofBiresultingfromtreatmentofHCT-8
cellswithBiNSAIDswereperformedtodeterminewhethertherewasanycorrelation
between Bi uptake, and the stability and/or toxicity of the BiNSAIDs (results
presentedinChapter2).Itisimportanttonotethatthetrypanblueexclusionassays
(Fig.3.2a)showedthatthemembraneintegrityremainedintactinthemajorityofthe
cells;therefore,uptakeoftheBiNSAIDsmostlikelyoccursthroughanuncompromised
cellmembrane. Inorder to rationalisehow theBiNSAIDsenter theHCT-8 cells, the
documentedmechanisms bywhich Bi(III) complexes and NSAIDs entermammalian
cellsmustalsobeconsideredinthefollowingdiscussion.
The results from the GFAAS studies showed that 24-h treatment of HCT-8 cells
with 15-μM or 40-μM Bi(tolf)3 resulted in substantially higher Bi uptake compared
withtheanalogousconcentrationsoftheotherBicomplexes(Fig.3.2b).Importantly,
the results from the NMR stability studies (Section 2.3.1) of Bi(tolf)3 also indicated
thatBi remains coordinated to tolf in the cellmedium for the duration of the 24-h
treatment. Accordingly, the Bi uptake associated with Bi(tolf)3 treatment must be
facilitatedbytheNSAIDortheoveralllipophilicityofthecomplex.Thereareatleast
twoknownmechanismsofNSAIDdiffusionacross themembranesof thecells in the
upper and lower intestines. The first is the monocarboxylate/H+ transporters [38]
while the second is a pH-dependent, but non-carrier mediated absorption of
NSAIDs[39]. ThefirstmechanismishighlyunlikelyfortheintactBi(tolf)3asthetolf
carboxylate necessary for interaction with monocarboxylate/H+ transporters is
unavailableduetothecoordinationtoBi.Giventhatthecomplexlikelyremainsintact
inthecellmedium,itismorelikelythatthelipophilicityofthecomplex,impartedby
the coordinated tolf, is facilitating interaction and diffusion through the cell
membrane. Apassive transportmechanism forBi compoundshasbeenobserved in
recentstudiesperformedbyotherresearchers.Hongetal.[40]haveshownthatHK-2
humanproximaltubularcellstreatedwithCBS(0.5mM)over24h,exhibitedapattern
of Bi saturation that was consistent with the profile of passive transport. More
recently, neutron reflectometry experiments performed by Brown and Dillon ([41]
andunpublishedwork)showedthatBi(tolf)3interactedwiththeheadgroupsoflipid
bilayer membrane mimics and partitioned into the tail region of the membranes
(comprised of 1-palmitoyl-2-oleoyl-sn-glycero-3-phosphocholine (POPC) molecules).

Chapter3.UptakeandlocalisationofBiNSAIDs
132
While these experiments were performed in a non-cell system, they showed that
Bi(tolf)3 was able to displace lipid molecules, which provides credence to the
hypothesis that passive diffusion is a potential uptake mechanism employed by
Bi(tolf)3topassthroughthecellmembraneandaccumulateinHCT-8cells.
The much lower Bi uptake associated with the Bi(mef)3- and Bi(difl)3-treated
cells(Fig.3.2)canprobablybeattributedtothedifferingstabilityandreactionsofthe
complexes in the cell medium as observed by NMR spectroscopic
investigations(Section2.3.1).Giventhestructuralsimilaritiesinthetolfandmef,one
would expect that Bi uptake would be similar for both Bi(tolf)3 and Bi(mef)3
treatment.However,thelowerBiuptakeisconsistentwiththeBi(mef)3NMRstability
studies (Section 2.3.1) that indicated that mef dissociates from Bi. As such, the Bi
uptakewouldnotbefacilitatedbythelipophilicitythatwouldbeimpartedbymefand
itssubsequentinteractionswiththemembrane.
Interestingly, Bi(mef)3-treated cells only exhibited 1.5 times greater Bi uptake
compared with the Bi(difl)3-treated cells despite the more substantial difference in
toxicityof 40-μMBi(mef)3-andBi(difl)3-(approximately50%versus20%reduction
of MTT conversion, respectively (Section 2.3.2). The NMR results indicated that
glucosemayinteractwiththeBi(difl)3complex.Itmightbepossiblethatglucosemay
facilitate uptake of any Bi(difl)2(glu) or Bi(difl)(glu)2 species that are formed.
Unfortunately,giventhattheglucosyl1HNMRsignalsonlyrepresentedapproximately
1/6 that of the difl signals, one would not expect a significant increase in the
detectableBifoundinthecells.
AnotherobservationfromthisstudywasthehighBidetectedfortheBSS-treated
cells. For instance, the cellular Bi was approximately 4−10 times higher than all
BiNSAID-treatedcellsforthe15μMtreatment,andapproximately4timeshigherthan
Bi(mef)3 and Bi(difl)3 for the 40 μM treatment. It is proposed that the increased
cellularBiassociatedwiththeBSS-treatedcells(ascomparedtotheBiNSAID-treated
cells) was due to extracellular bound Bi that could not be completely removed by
washing the cells using the protocol employed for GFAAS cell sample preparation
(Section 3.2.3.1). Inspection of the treatment dishes revealed that BSSwas far less
solublethantheBiNSAIDsasnotedbytheprecipitationinthetreatmentmedium.The
adherenceofmetalcomplexestotheexteriorofthecellmembranehasbeenobserved
in other studies [42]. Specifically, it was observed that during the preparation of
Cr(NO3)3.9H2O-treated A549 lung cancer cell samples for GFAAS analysis, the cell

Chapter3.UptakeandlocalisationofBiNSAIDs
133
pellets appeared blue in colour after several washes with PBS, followed by sterile
saline[42].WhenGFAASanalysiswasperformedononlytheintracellularcontentsof
theA549cells, theCr contentof theCr(NO3)3.9H2O-treated cellswas reduced to the
samequantityastheotherCr(III)complexestested[42], indicatingthatthemajority
oftheCrwasassociatedwiththecellmembrane.Unfortunately,BSSiswhitesuchthat
itsappearanceinthecellpelletisnotaseasilydiscerned. Itisnoteworthy,however,
that the GFAAS analysis of the BSS-treated cells differed when the more extensive
washing, fixationanddehydrationprotocolused formicroprobeSRXRFanalysiswas
employed (Fig.3.3). In contrast, no changewasobserved in the cellularBi following
treatmentwith the solubleBiNSAIDs (Fig.3.3). In addition, themaximumBi counts
detected in BSS-treated thin-sectioned cells were similar to the Bi content of the
vehicle-treatedcells(Fig.3.4)indicatingtherewasnegligibleintracellularBi.
It is importanttonotethattheGFAASanalysesdonotprovideinformationabout
the mechanisms by which “unbound” Bi enters and accumulates in cells. While
beyondthescopeofthisstudy,someassumptionscanbemadebasedontheliterature.
Importantly, the mechanisms of uptake, accumulation and metabolism of Bi by
mammaliancellsarepoorlyunderstood.ThereisevidencethatsuggeststhatBibinds
stronglytotheenzymetransferrin(discussedinSection1.4.1.1),whichcycles inand
out of cells as a method of iron transport [43]. Acknowledging that transferrin
receptors are overexpressed in cancer cells [44-46] it is feasible that in the serum-
deficient (and Fe-deficient) cell medium used during treatment that Bi may be
substitutedintotransferrinforuptakeintothecells.Additionally,ithasbeenreported
that Bi has a high affinity for glutathione, a tripeptide that is present in cells in
relativelyhighconcentrations(0.5–7mM)andisbelievedtoplayaroleinBitransport
incellsandbiofluids [47]. Recently, the importanceof the roleofglutathione in the
intracellulartransportofBiwasexaminedinHK-2cellstreatedwithCBS,wherebyit
was apparent that glutathione depletion adversely affected the ability of the cell to
detoxify itselfofBi [40]. Assuch, it isplausible thatglutathionepresent in thecells
may assist in transporting unbound Bi (in the case of Bi(mef)3) in the HCT-8 cells.
Furthermore, if Bi(tolf)3 enters the cell intact, as indicated by the NMR stability
studies,itcouldbepostulatedthatcellularprocessesresultinthereleaseoftolffrom
Bi,wherebythemechanismofBireleasemaybearesultofthestrongaffinityofBifor
other more abundant intracellular ligands such as glutathione, metallothionein, or
other metal-binding proteins that are responsible for intracellular transport of
Chapter3.UptakeandlocalisationofBiNSAIDs
134
endogenousmetalions(suchasZn(II)andFe(III)).Theexactuptakeandmetabolism
pathwaysoftheBiNSAIDswillneedtobeexaminedinfuturestudies.
OnefinalconsiderationstemmingfromtheGFAASanalysisoftheBi-treatedcellsis
the impact resulting from the Bi accumulation in the cells. At the lower treatment
concentration (15 μM Bi, which reflects the IC50 value of Bi(tolf)3), the Bi uptake
followingBi(tolf)3 treatmentwasonly three timeshigher than thatobserved for the
other BiNSAID treatments. Treatment with the higher concentration (40 μM),
however,resultedinsubstantialBiaccumulationinthecellsinhighquantities.These
resultshighlightthequestionastowheretheBiislocalisinginthecellswithrespectto
themechanismsofactionoftheBiNSAIDs,asaddressedinSection3.4.2.
3.4.2 MicroprobeSRXRFspectroscopyofthin-sectionedcells
MicroprobeSRXRFwasutilisedasa sensitive technique todeterminesubcellular
location of Bi in thin-sectioned HCT-8 cells to glean some information regarding
mechanisms of action of theBiNSAIDs. The results from theGFAAS cellular uptake
studies(Section3.3.2)demonstratedthatthetotalcellularBiconcentrationremained
essentially thesame followingacomparisonof thecellpreparationproceduresused
for thin-sectioning versus normal washing procedures (with the exception of BSS-
treated samples; Section 3.2.3.1 and 3.4.1), suggesting that therewas no significant
difference in Bi leaching from the cells using the fixation procedures employed for
samplepreparationforthemicroprobeSRXRFimaging. However,itshouldbenoted
that it can be assumed that under those conditions Bi does not leach into any of
solutions used during the washing steps in the normal GFAAS sample preparation
method(Section3.2.3.1).
The consistent trend observed from the microprobe SRXRF imaging of thin-
sectionedcellswasthattheintracellularfateofBiwasessentiallythesame,regardless
oftheBiNSAIDadministered.InthemajorityofBiNSAID-treatedcellsdiscreteBihot
spots were detected in the cytoplasm; however, there was some evidence that Bi
mightaccumulate in (oraround) thenucleus. These findingsneed tobe considered
with respect to a number of potential chemotherapeutic targets including (i) the
nucleus,(ii)COX,and(iii)mitochondria,andpotentialdetoxificationmechanismsvia
accumulationin(iv)lysosomes.
Thefirstpotentialtargetfordiscussionisthecellnucleus,whichisrelevantdueto
thefactthatitisacommontargetforanti-canceragents.Itwasnotedthattherewas

Chapter3.UptakeandlocalisationofBiNSAIDs
135
disperse distribution of Bi throughout the cell nucleus in one BiNSAID-treated cell,
(Bi(mef)3-treated Cell A, Fig. 3.4c). Of the approximately twenty cells studied,
however, thisresultwasatypicalandraises thequestionofwhether thisoccurs ina
greater number of cells (if a larger sample size was studied). In other microprobe
SRXRF studies of the clinically-used drugs, arsenite [30] and cisplatin [23],
colocalisation of As and Pt (respectively) was evident in the nucleus of a high
proportionofthedrug-treatedcells,whichisconsistentwiththemainmechanismof
anti-canceractionofthesecompounds,wherebyDNAistherelevanttarget.Giventhat
thereislittleevidenceofBiaccumulationinthenucleusoftheotherBiNSAID-treated
cells (very low proportion of Bi-treated cells compared to every cell analysed
followingtreatmentwithPtdrugs[23]andAscompounds[30]),itappearedunlikely
thatthemaintargetofBiNSAIDswasDNAinHCT-8cells.
As described in Sections 1.2.3 and1.2.4, the chemopreventive/chemotherapeutic
natureofNSAIDs isperceived fromtheirability to inhibitCOX-2. TheCOXenzymes
are membrane-bound enzymes, specifically located on the endoplasmic reticulum
(COX-1andCOX-2),plasmamembrane(COX-1andCOX-2)or thenuclearmembrane
(COX-2only) [48,49]. The colocalisationmaps (Appendix2.4) indicated thatBihot
spots were not located in close proximity to the plasma membrane. However, a
numberofBihotspotswerelocatedincloseproximitytothenucleusasshowninthe
colocalisationmaps(Appendix2.4a(i),a(ii),b(i),b(ii),andc(i)). Whilethisdoesnot
provide indisputable evidence of BiNSAID localisation at the site of COX, it does
provide evidence that places Bi in the vicinity of COX-2. In the instance that the
BiNSAIDremains intact, thissuggeststhatthemobility issuchthatthere ispotential
fortheinteractionwithCOX. It isimportanttonotethatit is likelythattheBiNSAID
alsodissociatesinsidethecellasimpliedbythePGE2productionassays(Section2.3.4)
asafreecarboxylateisrequiredtointeractwiththeCOX-2activesite.Consequently,it
wouldbebeneficialtostudythelocationoftheNSAID.Unfortunately,directprobing
oftheNSAIDusingmicroprobeSRXRFisnotfeasibleasthechemicalelementsofthe
NSAIDs are endogenous to the cell and cannot be discerned. An alternative study
worth consideringmight be the substitution of an element such as Br for Cl (in the
instanceoftolf).Additionally,theuseofCOX-2-specificantibodywithAunanoparticle
labelling and microprobe SRXRF could be used to image Au and Bi and determine
colocalisationakintoanexperimentreportedbyYuanetal.[50].

Chapter3.UptakeandlocalisationofBiNSAIDs
136
Duetobeamtimerestrictions,theamountofsamplesthatcouldbeanalysedwas
limited. Samples for microprobe SRXRF were prepared following 4-h or 24-h
treatmentwith theBi compounds,however,only4-hBi(mef)3-treatedsampleswere
analysed(Appendix2.3).NegligibleBiwasobserved in the4-hBi(mef)3-treated cell
microprobeSRXRFelementalmaps(Appendix2.3),indicatingthatanyBitakenupby
thecells is lower than thedetection limit. Thereare twonotableobservations from
these results. Firstly, given that the NMR studies (Section 2.3.1) suggested that
Bi(mef)3 isunstable inthecellmedium,theuptakeand localisationofBimaynotbe
indicativeofCOX. Secondly, itwouldappearthata longer incubationtime(>4h) is
requiredforsignificantuptakeofBi(Fig.3.5andAppendix2.2)ifitisnotboundtoan
NSAID. Furtherbeamtimewouldberequired tostudy theelementaldistributionof
the 4-h Bi(tolf)3- and Bi(difl)3-treated cells in order to determine the concentration
andlocationofBiofthestablecomplexes.
The thirdpotentialmechanismof actionofBiNSAIDs that isworth addressing is
targeting the mitochondria. The validity of this mechanism stems from results
reported inChapter 2 (toxicity and cell death assays) since the intrinsic pathwayof
apoptosis is inextricably linkedwithmitochondrial health [51]. The sizeof someof
the hot spots detected in the microprobe SRXRF studies are similar to the size
reported formitochondria (0.5−10μm) [52, 53]. Ameans for determining if Biwas
located in themitochondria is toexaminewhether it iscolocalisedwithFesince the
mitochondriaprimarilyconsumeFeforthesynthesisofhemeandFe–Sclustersandas
such serve as the centre for cellular Fe homeostasis [54]. A study by
Morrisonetal.[28] showed that Gd(III) from several Gd(III) complexes colocalised
with Fe that was contained in the mitochondria of T98G human glioblastoma
multiforme cells. Unfortunately, examination of the thin-sectioned cell maps in the
current study failed to discriminate Fe from the background (data not shown), thus
the colocalisation of Fe with other elements (such as Bi) could not be definitively
established. Alternatively, Ca has been shown to localise in the euchromatin and
mitochondria[55]. MitochondriaarevitalformaintainingCa2+homeostasisandplay
animportantroleinCa2+storageinthecell[56].However,therewaslittleevidenceto
showcolocalisationofCaandBiinthecytoplasmwheremitochondriawouldbefound.
For example, only one Bi(mef)3-treated cell showed any colocalisation with Ca
(Appendix 2.4, Fig. 3.4, CellA). Coincidentally, thiswas the onlyBi-treated cell that
Chapter3.UptakeandlocalisationofBiNSAIDs
137
displayed nuclear Bi localisation, which was an exception compared to the other
BiNSAID-treatedcells.
ThefinalsiteofpossibleBiintracellularlocalisationthatneedstobeconsideredis
the lysosomes. Lysosomes are membrane-bound, acidic organelles that play an
importantroleinremovingcellularwaste.Lysosomescontainacidhydrolases,which
areresponsibleforthedegradationofunwantedcellularbiomolecules[57].Previous
reports following autometallography studies have shown that Bi accumulates in
lysosomesofvariouscell types, includingkidneycells,macrophages,motorneurons,
ganglion,LeydigandSertolicellsinratsaspartofadetoxificationprocess[10-12,16].
Morerecently,Hongetal.[40]haveperformedfluorescencemicroscopyexperiments
that showed thatBi colocalised in lysosomesofCBS-treated (0.5mM)HK-2 (human
proximal tubular) cells. The microprobe SRXRF results are consistent with these
observationssincethesmallhotspotsoftheBiaresimilar insizeto lysosomes(50–
500nmdiameter) [58,59]. Thereare twopossibleexplanations for thediversity in
the size and number of theBi hot spots thatwere observed in theBiNSAID-treated
cells in this study; firstly, since the thin-section represents a 1-μm slice of the cell,
theremaybeheterogeneousdistributionthroughoutthecell. Secondly,thevariation
in the size of lysosomes could be the result of certain cellular events; for instance
events leadingtothe fusionofmultiple lysosomeswithautophagosomesresulting in
autolysosomeswithincreasedsizeandreducedlysosomenumber[60].Itisunknown
whether these lysosomes are excreted from the cells over time, which may also
accountforthediversityinthedistributionandthenumberofthelysosomespresent.
Unfortunately, due to the limitation in spatial resolution (beam dimensions (0.3 ×
0.3μm2)andstepsize(0.3μm)associatedwiththistechnique,anylysosomessmaller
than300nmwouldnot be easily detected. Given the evidence in the literature that
showsthatBilocalisesinlysosomesofmanyothercelltypes,andwithoutevidenceof
colocalisation with mitochondrion-related elements (Fe & Ca), it is rational to
conclude that the Bi hot spots observed in the present study are indicative of
lysosomes rather than mitochondria. Further experiments such as transmission
electronmicroscopycouldbeperformedtounequivocallyconfirmthisisthecase.
TherewereafewinterestingobservationsemanatingfromthemicroprobeSRXRF
imagingwithrespecttothedistributionandchangesinCaconcentrationthatwarrant
discussion. The first observationwas the increase in nuclear Ca localisation of the
Bi-treatedcells(Fig.3.5). ThisobservationhasbeenreportedbyLuiandHuang[61]
Chapter3.UptakeandlocalisationofBiNSAIDs
138
andMunroetal.[30]inarsenite-treatedCHO-K1andHep-G2cells,respectively.Both
studies [30, 61] concluded that themechanism of toxicity of arsenitemight involve
disturbancesinintracellularCahomeostasis,aknownindicatorofapoptosis[62].The
resultsobtainedfromthetoxicityassaysinChapter2indicatedthatthehealthofthe
cells was affected in all BiNSAID treatments at the treatment concentration and
treatmenttimechosenforthemicroprobeSRXRFcellsampletreatment(40μM,24h).
Additionally, the redistribution of Ca as indicated by themicroprobe SRXRF studies
reported herein, coupled with the cell death studies in Chapter 2, suggests that
BiNSAID-inducedapoptosisisassociatedwithadisruptionofCahomeostasis.Similar
to the conclusions drawn byMunro et al. [30], it is unclear from the present study
whether the redistribution of nuclear Ca is related to drug-induced mitochondrial
damage or another intracellular source of Ca such as disruption to the endoplasmic
reticulumleadingtothereleaseofCaintothecytosol[63].
The increase in Ca concentration in the nucleus of the BSS-treated cellswas the
second interestingobservation, since low toxic effectswereobserved inHCT-8 cells
followingtreatmentwithBSS(40μM,24h)inthetoxicityassaysreportedinChapter
2. It has been observed in normal human gastric mucous epithelial cells that
treatmentwithBSSincreasedintracellularCa2+[64]. Theincreasedconcentrationof
Ca2+promotedp44/p42andp38MAP-kinaseactivation,andsubsequentlystimulated
the growth of the gastricmucous epithelial cells [64]. Given that themetabolism of
normal cells differs to that of cancer cells [65], further studieswould be needed to
determine the significance of intracellular Ca2+ flux in BSS-treated HCT-8 cells.
Additionally, it cannot be ruled out that the Ca redistribution within BSS-treated
HCT-8cellsmayalternativelybeduetosalicylateratherthanBi.
Thirdly, elementalquantificationof the thin-sectionedcells showed thatBi(mef)3
significantly increased cytosolic and nuclear levels of Ca compared to the
vehicle-treatedcells.Assuch,thismightsuggestthatBi(mef)3inducesapoptosisviaa
pathwaywhichisattenuatedtotheeffectsofCa2+comparedtoBi(tolf)3andBi(difl)3.
GiventhatBi(mef)3causedsuchasignificantincreasein[Ca2+]icomparedtotheother
Bi compounds at the same treatment concentration, it seems unlikely that Bi alone
wouldbethecauseoftheincrease.Thisraisesthequestionastowhethertheeffecton
[Ca2+]iisduetotheligandaloneorthecombinationofBiandligand.Assuch,further
experiments could be performed to shed more light on the effects of Bi- and
NSAID-induced toxicity on intracellular Ca concentration and distribution. One
Chapter3.UptakeandlocalisationofBiNSAIDs
139
approach couldbe thepreparationofNSAID-treated samples formicroprobeSRXRF
analysis to compare to the BiNSAID-treated samples (Fig. 3.4 and Appendix 2.2).
Alternatively, bulk cell assays (with the advantage of increased statistical power)
couldbeperformedtoquantify[Ca2+]ilevelsusingatechniquesuchasflowcytometry
and a Ca fluorescent probe such as Fluo-4-AM [63]. Additionally, co-stained cells
containingacalciumfluorescentprobeandanucleardyesuchasHoechst33342could
beanalysedusingfluorescencemicroscopy[66].
Chapter3.UptakeandlocalisationofBiNSAIDs
140
3.5 ChaptersummaryTheaimof thisChapterwas toquantifyBi cellularuptakeand the localisation in
HCT-8 cells following treatment with BiNSAIDs to further examine potential
mechanismsofcelltoxicity.Specifically:
i. The most striking result from the GFAAS study was that Bi uptake was
influenced by the treatment concentration, whereby a higher treatment
concentration(40µM)resultedinincreasedBiuptakebyBiNSAID-treatedcells
(ranging from5 to340times)compared to the lowerconcentration(15µM).
ThemosttoxicBiNSAID,Bi(tolf)3,showedthehighestconcentrationofcellular
Bi at both treatment concentrations 15 µM and 40µM (24h), while the
Bi(mef)3-andBi(difl)3-treatedcellsshowedsimilarquantitiesofcellularBiat
bothtreatmentconcentrationstested. TheuptakeofBimaybeinfluencedby
stability,wherebyBi(tolf)3showedsubstantiallygreaterBiuptakeandwasthe
moststableoftheBiNSAIDsasdeterminedbyNMRspectroscopy(Chapter2).
ii. The microprobe SRXRF imaging of thin-sectioned cells showed that Bi
generallyaccumulatesindiscretehotspotsfoundinthecytoplasm.Thesizeof
thehotspotsisconsistentwithtwopossibleintracellularfates.Thefirstisthe
accumulationofBiwithinthatofthecellsdetoxificationorganelles,lysosomes.
Additionally, thecloseproximityof theBihotspotstothenuclearmembrane
(and location of COX-2), may suggest that intracellular movement of Bi can
occur.However,thissecondpropositionrequiresfurtherinvestigation.
While the GFAAS results indicated substantially greater Bi uptake for Bi(tolf)3
(versus Bi(mef)3 and Bi(difl)3), which paralleled the greater toxicity and greater
inhibition of PGE2 production of the former complex, themicroprobe SRXRF results
showed less compelling differenceswith respect to the toxicities. Of course greater
insight into the disparity between the cellular quantities of Bi associated with the
different BiNSAID treatments could be obtained following studies of NSAID uptake,
whichischallengingworkandhasbeencommencedbySpremoandDillon([67]and
unpublished results) and is continued Brown and Dillon ([41], and unpublished
results).
Chapter3.UptakeandlocalisationofBiNSAIDs
141
3.6 References[1] C.T.Dillon.(2011)Synchrotronradiationx-rayspectroscopyforinvestigationsof
intracellular metallointercalators: X-ray fluorescence imaging and X-rayabsorption spectroscopy, In Metallointercalators : synthesis and techniques toprobe their interactions with biomolecules (J. Aldrich-Wright, Ed.), pp 273-298,Springer-Verlag/Wien,NewYork.
[2] N.Zheng,H.N.Tsai,X.Zhang,K.SheddenandG.R.Rosania.(2011)Thesubcellulardistributionofsmallmolecules:ameta-analysis,Mol.Pharm.,8,1611-1618.
[3] D. C. Harris. (2011) Chapter 20: Atomic spectroscopy, In Quantitative ChemicalAnalysis8thEditioned.,Freeman,W.H.&Company.
[4] ThermoElemental.(2001)AAS,GFAAS,ICPorICP-MS?WhichtechniqueshouldIuse?Anelementaryoverviewofelementalanalysis.,1-20.
[5] C.T.Dillon,P.A.Lay,B.J.Kennedy,A.P.Stampfl,Z.Cai,P.Ilinski,W.Rodrigues,D.G. Legnini, B. Lai and J. Maser. (2002) Hard X-ray microprobe studies ofchromium(VI)-treated V79 Chinese hamster lung cells: intracellular mapping ofthebiotransformationproductsofachromiumcarcinogen,J.Biol. Inorg.Chem.,7,640-645.
[6] M.D.Hall,C.T.Dillon,M.Zhang,P.Beale,Z.Cai,B.Lai,A.P. J. StampflandT.W.Hambley.(2003)Thecellulardistributionandoxidationstateofplatinum(II)andplatinum(IV)antitumourcomplexesincancercells,J.Biol.Inorg.Chem.,8,726-732.
[7] C.M.Weekley,J.B.Aitken,L.Finney,S.Vogt,P.K.WittingandH.H.Harris.(2013)Seleniummetabolism in cancer cells: the combined application of XAS and XFMtechniquestotheproblemofseleniumspeciationinbiologicalsystems,Nutrients,5,1734-1756.
[8] S.Antony,J.B.Aitken,S.Vogt,B.Lai,T.Brown,L.SpicciaandH.H.Harris.(2013)X-ray fluorescence imaging of single human cancer cells reveals that theN-heterocyclic ligands of iodinated analogues of ruthenium anticancer drugsremaincoordinatedaftercellularuptake,J.Biol.Inorg.Chem.,18,845-853.
[9] M. Stoltenberg, A. Larsen, M. Zhao, G. Danscher and U. T. Brunk. (2002)Bismuth-inducedlysosomalruptureinJ774cells,APMIS,110,396-402.
[10] N. E. Magnusson, A. Larsen, J. Rungby, M. Kruhoffer, T. F. Orntoft and M.Stoltenberg.(2005)Geneexpressionchangesinducedbybismuthinamacrophagecellline,CellTissueRes.,321,195-210.
[11] M.Stoltenberg,G.Danscher,R.Pamphlett,M.M.ChristensenandJ.Rungby.(2000)Histochemical tracingof bismuth in testis from rats exposed intraperitoneally tobismuthsubnitrate,Reprod.Toxicol.,14,65-71.
[12] M. Stoltenberg, J. D. Schionning and G. Danscher. (2001) Retrograde axonaltransport of bismuth: an autometallographic study, Acta Neuropathol., 101,123-128.
[13] A. Larsen, N. Martiny, M. Stoltenberg, G. Danscher and J. Rungby. (2003)Gastrointestinal and systemic uptake of bismuth in mice after oral exposure,Pharmacol.Toxicol.,93,82-90.
[14] L.H.Pedersen,M.Stoltenberg,E.ErnstandM.J.West.(2003)Leydigcelldeathinratsexposedtobismuthsubnitrate,J.Appl.Toxicol.,23,235-238.
[15] A.Larsen,M.Stoltenberg,M.J.WestandG.Danscher.(2005)Influenceofbismuthon the number of neurons in cerebellum and hippocampus of normal andhypoxia-exposedmousebrain:astereologicalstudy,J.Appl.Toxicol.,25,383-392.
[16] M. Stoltenberg, J. A. Hogenhuis, J. J. Hauw and G. Danscher. (2001)Autometallographic tracing of bismuth in humanbrain autopsies, J. Neuropathol.Exp.Neurol.,60,705-710.
[17] C. J. Fahrni. (2007) Biological applications of X-ray fluorescence microscopy:exploring the subcellular topography and speciation of transition metals,Curr.Opin.Chem.Biol.,11,121-127.
Chapter3.UptakeandlocalisationofBiNSAIDs
142
[18] A.C.Thompson,D.T.Attwood,E.M.Gullikson,M.R.Howells, J.B.Kortright,A.L.Robinson,J.H.Underwood,K.-J.Kim,J.Kirz,I.Lindau,P.Pianetta,H.Winick,G.P.Williams and J. H. Scofield. (2001) Center for X-ray Optics and Advanced LightSourceX-rayDataBooklet(2ndedition),LawrenceBerkeleyNationalLaboratory.
[19] R. Meuli, Y. Hwu, J. H. Je and G. Margaritondo. (2004) Synchrotron radiation inradiology: radiology techniques based on synchrotron sources, Eur. Radiol., 14,1550-1560.
[20] S.Matsuyama,H.Mimura,H.Yumoto,Y.Sano,K.Yamamura,M.Yabashi,Y.Nishino,K.Tamasaku,T.IshikawaandK.Yamauchi.(2006)Developmentofscanningx-rayfluorescencemicroscopewithspatialresolutionof30 nmusingKirkpatrick-Baezmirroroptics,Rev.Sci.Instrum.,77,103102.
[21] E.DiFabrizio,F.Romanato,M.Gentil,S.Cabrini,B.Kaulich,J.SusiniandR.Barrett.(1999)High-efficiencymultilevelzoneplatesforkeVX-rays,Nature,401,895-898.
[22] C.T.Dillon.(2012)Synchrotronradiationspectroscopictechniquesastoolsforthemedicinal chemist: microprobe X-ray fluorescence imaging, X-ray absorptionspectroscopy,andinfraredmicrospectroscopy,Aust.J.Chem.,65,204-217
[23] K. J. Davis, J. A. Carrall, B. Lai, J. R. Aldrich-Wright, S. F. Ralph and C. T. Dillon.(2012)DoescytotoxicityofmetallointercalatorscorrelatewithcellularuptakeorDNAaffinity?,DaltonTrans.,41,9417-9426.
[24] M. Shimura, A. Saito, S. Matsuyama, T. Sakuma, Y. Terui, K. Ueno, H. Yumoto, K.Yamauchi,K.Yamamura,H.Mimura,Y.Sano,M.Yabashi,K.Tamasaku,K.Nishio,Y.Nishino,K.Endo,K.Hatake,Y.Mori,Y. IshizakaandT. Ishikawa. (2005)Elementarray by scanning X-ray fluorescence microscopy after cis-diamminedichloro-platinum(II)treatment,CancerRes.,65,4998-5002.
[25] J. B. Aitken, S. Antony, C. M.Weekley, B. Lai, L. Spiccia and H. H. Harris. (2012)Distinct cellular fates forKP1019andNAMI-AdeterminedbyX-ray fluorescenceimagingofsinglecells,Metallomics,4,1051-1056,1007.
[26] J.B.Aitken,P.A.Lay,T.T.Duong,R.Aran,P.K.Witting,H.H.Harris,B.Lai,S.VogtandG.I.Giles.(2012)SynchrotronradiationinducedX-rayemissionstudiesoftheantioxidantmechanismof theorganoseleniumdrug ebselen, J. Biol. Inorg. Chem.,17,589-598.
[27] C.M.Weekley,G.Jeong,M.E.Tierney,F.Hossain,A.M.Maw,A.Shanu,H.H.Harrisand P. K. Witting. (2014) Selenite-mediated production of superoxide radicalanions in A549 cancer cells is accompanied by a selective increase in SOD1concentration, enhanced apoptosis and Se-Cu bonding, J. Biol. Inorg. Chem., 19,813-828.
[28] D.E.Morrison, J.B.Aitken,M.D.deJonge,F. Issa,H.H.HarrisandL.M.Rendina.(2014) Synthesis andbiological evaluationof a class ofmitochondrially-targetedgadolinium(III)agents,Chem.Eur.J.,20,16602-16612.
[29] M.Busse,M.S.A.Windsor,A.J.Tefay,M.Kardashinsky,J.M.Fenton,D.E.Morrison,H. H. Harris and L. M. Rendina. (2017) Tumor cell uptake and selectivity ofgadolinium(III)-phosphonium complexes: the role of delocalisation at thephosphoniumcentre,J.Inorg.Biochem.,177,313-321.
[30] K.L.Munro,A.Mariana,A.I.Klavins,A.J.Foster,B.Lai,S.Vogt,Z.Cai,H.H.Harrisand C. T. Dillon. (2008)Microprobe XRFmapping and XAS investigations of theintracellular metabolism of arsenic for understanding arsenic-induced toxicity,Chem.Res.Toxicol.,21,1760-1769.
[31] M. J. Hackett, J. A. McQuillan, F. El-Assaad, J. B. Aitken, A. Levina, D. D. Cohen,R.Siegele, E. A. Carter, G. E. Grau, N. H. Hunt and P. A. Lay. (2011) Chemicalalterations tomurine brain tissue induced by formalin fixation: implications forbiospectroscopic imaging and mapping studies of disease pathogenesis, Analyst,136,2941-2952.
Chapter3.UptakeandlocalisationofBiNSAIDs
143
[32] J. B. Waern, H. H. Harris, B. Lai, Z. Cai, M. M. Harding and C. T. Dillon. (2005)Intracellular mapping of the distribution of metals derived from the antitumormetallocenes,J.Biol.Inorg.Chem.,10,443-452.
[33] E.L.Hawksworth,P.C.Andrews,W.Lie,B.LaiandC.T.Dillon.(2014)Biologicalevaluationofbismuthnon-steroidalanti-inflammatorydrugs(BiNSAIDs):stability,toxicityanduptakeinHCT-8coloncancercells,J.Inorg.Biochem.,135,28-39.
[34] S.Vogt.(2003)MAPS:Asetofsoftwaretoolsforanalysisandvisualizationof3DX-rayfluorescencedatasets,J.Phys.IVFrance,104,635-638.
[35] W.M.McIndoeandJ.N.Davidson.(1952)Thephosphoruscompoundsofthecellnucleus,Br.J.Cancer,6,200-214.
[36] C.Matheny,M. L.Day and J.Milbrandt. (1994)Thenuclear localization signal ofNGFI-A Is locatedwithin the zinc fingerDNAbindingdomain, J.Biol. Chem., 269,8176-8181.
[37] C. Quintana. (1991) X-raymicroanalysis of cell nuclei, J. Elec. Microsc. Tech., 18,411-423.
[38] J.S.Choi,M.J.JinandH.K.Han.(2005)RoleofmonocarboxylicacidtransportersinthecellularuptakeofNSAIDs,J.Pharm.Pharmacol.,57,1185-1189.
[39] I. Legen andA. Kristl. (2003) pH and energy dependent transport of ketoprofenacrossratjejunuminvitro,Eur.J.Pharm.Biopharm.,56,87-94.
[40] Y. Hong, Y.-T. Lai, G. C.-F. Chan and H. Sun. (2015) Glutathione and multidrugresistance protein transporter mediate a self-propelled disposal of bismuth inhumancells,Proc.Natl.Acad.Sci.U.S.A.,112,3211-3216.
[41] T.Brown.(2016)Bismuth-NSAIDsascolorectalcancerchemopreventives:Insightsinto theirmembrane interactionsanduptakemechanisms,BachelorofMedicinalChemistry(Advanced)withHonours,UniversityofWollongong,Australia.
[42] E.L.Hawksworth.(2010)Cellularstudiesofphotoactivechromiumintercalators,BachelorofMedicinalChemistry,UniversityofWollongong,Australia.
[43] B. D. Grant and J. G. Donaldson. (2009) Pathways andmechanisms of endocyticrecycling,Naturereviews.Molecularcellbiology,10,597-608.
[44] M. Prutki, M. Poljak-Blazi, M. Jakopovic, D. Tomas, I. Stipancic and N. Zarkovic.(2006) Altered iron metabolism, transferrin receptor 1 and ferritin in patientswithcoloncancer,CancerLett.,238,188-196.
[45] P. G. Cavanaugh, L. Jia, Y. Zou and G. L. Nicolson. (1999) Transferrin receptoroverexpressionenhancestransferrinresponsivenessandthemetastaticgrowthofaratmammaryadenocarcinomacellline,BreastCancerRes.Treat.,56,203-217.
[46] K.T.Chan,M.Y.Choi,K.K.Lai,W.Tan,L.N.Tung,H.Y.Lam,D.K.Tong,N.P.Leeand S. Law. (2014) Overexpression of transferrin receptor CD71 and itstumorigenic properties in esophageal squamous cell carcinoma, Oncol. Rep., 31,1296-1304.
[47] N. Yang and H. Sun. (2007) Biocoordination chemistry of bismuth: recentadvances,Coord.Chem.Rev.,251,2354-2366.
[48] I. Morita, M. Kawamoto, M. Hattori, K. Eguchi, K. Sekiba and H. Yoshida. (1990)Determinationof tryptophanand itsmetabolites inhumanplasmaandserumbyhigh-performance liquid chromatography with automated sample clean-upsystem,J.Chromatogr.B,526,367-374.
[49] J.C.OttoandW.L. Smith. (1994)Theorientationofprostaglandinendoperoxidesynthases-1and-2intheendoplasmicreticulum,J.Biol.Chem.,269,19868-19875.
[50] Y. Yuan, T. Paunesku, H. Arora, J. Ward, S. Vogt and G. Woloschak. (2011)Interrogation of EGFR targeted uptake of TiO2 nanoconjugates by X-rayfluorescencemicroscopy,AIPConf.Proc.,1365,423-426.
[51] S.Elmore. (2007)Apoptosis:a reviewofprogrammedcelldeath,Toxicol.Pathol.,35,495-516.
[52] National Institute of General Medical Sciences. (2005) Inside the cell, 1-80, U.S.DepartmentofHealthandHumanServices.
Chapter3.UptakeandlocalisationofBiNSAIDs
144
[53] P.Khanna.(2010)Cellandmolecularbiology, I.K. InternationalPublishingHousePvt.Limited,Delhi,India.
[54] C. Chen and B. H. Paw. (2012) Cellular and mitochondrial iron homeostasis invertebrates,BBAMol.CellRes.,1823,1459-1467.
[55] A. Kitamura, K. Takano and T. Inokuchi. (1994) Study on intracellular calciumlocalization by potassium antimonate technique in rabbit VX2 carcinoma, Med.ElectronMicrosc.,27,333-336.
[56] L.Contreras,I.Drago,E.ZampeseandT.Pozzan.(2010)Mitochondria:thecalciumconnection,Biochim.Biophys.Acta,1797,607-618.
[57] J.P.Luzio,P.R.PryorandN.A.Bright.(2007)Lysosomes:fusionandfunction,Nat.Rev.Mol.CellBiol.,8,622-632.
[58] M.A.Sukhai,S.Prabha,R.Hurren,A.C.Rutledge,A.Y.Lee,S.Sriskanthadevan,H.Sun, X. Wang, M. Skrtic, A. Seneviratne, M. Cusimano, B. Jhas, M. Gronda, N.MacLean,E.E.Cho,P.A.Spagnuolo,S.Sharmeen,M.Gebbia,M.Urbanus,K.Eppert,D.Dissanayake,A.Jonet,A.Dassonville-Klimpt,X.Li,A.Datti,P.S.Ohashi,J.Wrana,I.Rogers,P.Sonnet,W.Y.Ellis,S.J.Corey,C.Eaves,M.D.Minden,J.C.Y.Wang,J.E.Dick, C. Nislow, G. Giaever and A. D. Schimmer. (2013) Lysosomal disruptionpreferentiallytargetsacutemyeloidleukemiacellsandprogenitors,J.Clin.Invest.,123,315-328.
[59] D. J.PippinandK.D.Pippin. (2003)Sizeofazurophil lysosomesofhumanPMNsdeterminedbystereologicalmorphometry,Ultrastruct.Pathol.,27,261-263.
[60] L.Yu,C.K.McPhee,L.Zheng,G.A.Mardones,Y.Rong,J.Peng,N.Mi,Y.Zhao,Z.Liu,F. Wan, D. W. Hailey, V. Oorschot, J. Klumperman, E. H. Baehrecke and M. J.Lenardo. (2010) Termination of autophagy and reformation of lysosomesregulatedbymTOR,Nature,465,942-946.
[61] Y. C. Liu and H. Huang. (1996) Lowering extracellular calcium content protectscells from arsenite-induced killing and micronuclei formation, Mutagenesis, 11,75-78.
[62] S. Orrenius, B. Zhivotovsky and P. Nicotera. (2003) Regulation of cell death: thecalcium-apoptosislink,Nat.Rev.Mol.CellBiol.,4,552-565.
[63] J. E. Kim, J. S. Kang andW. J. Lee. (2012)VitaminC induces apoptosis in humancoloncancercell line,HCT-8via themodulationofcalciuminflux inendoplasmicreticulumandthedissociationofBadfrom14-3-3β,ImmuneNetw.,12,189-195.
[64] J. Gilster, K. Bacon, K. Marlink, B. Sheppard, C. Deveney and M. Rutten. (2004)Bismuth subsalicylate increases intracellular Ca2+, MAP-kinase activity, and cellproliferation in normal human gastric mucous epithelial cells, Dig. Dis. Sci., 49,370-378.
[65] R. J. DeBerardinis, J. J. Lum, G. Hatzivassiliou and C. B. Thompson. (2008) Thebiology of cancer:metabolic reprogramming fuels cell growth and proliferation,CellMetab.,7,11-20.
[66] D.-H. Kim, E. A. Rozhkova, I. V. Ulasov, S. D. Bader, T. Rajh,M. S. Lesniak and V.Novosad. (2010) Biofunctionalized magnetic-vortex microdiscs for targetedcancer-celldestruction,Nat.Mater.,9,165-171.
[67] S. Spremo. (2014) Novel bismuth complexes as potential anti-cancer drugs,BachelorofMedicinalChemistry(Advanced),UniversityofWollongong,Australia.

145
Chapter4. Synchrotronradiationinfraredmicrospectroscopy
studiesofliveHCT-8cellstreatedwithBiNSAIDs
andNSAIDs
In the last decade there has been an increase in the use of synchrotron radiation
infrared microspectroscopy (SR-IRMS) for the study of single mammalian cells to
discernbiomolecularchangesthatareassociatedwithdiseaseanddiseasetreatment.
This Chapter describes live cell SR-IRMS experiments performed at the Australian
Synchrotron(Clayton,Australia)fortheanalysisofHCT-8cellsfollowingexposureto
BiNSAIDs or NSAIDs in order to: (i) study global biomolecular variations,
(ii)determinewhetheranychangesarereflectiveofthemechanismsofcelldeath,and
(iii) identify whether the coordination of NSAIDs to Bi results in alterations in the
biomolecular effects of NSAIDs. A multivariate approach, Principal Component
Analysis (PCA),was applied to discriminate the spectral differences associatedwith
thedifferentcelltreatments.
Chapter4.Synchrotronradiationinfraredmicrospectroscopy
146
4.1 IntroductionIdentifying cellular events that occur as a result of exposure to a
chemotherapeuticagentisnecessarytounderstandhowthedrugaffectsacancercell.
Specific biological assays can be used to probemechanisms of action, a selection of
which are discussed in Chapter 2. Alternatively, Fourier transform infrared(FTIR)
spectroscopy,whichprobeschemicalchanges,isbeingincreasinglyutilisedasarapid,
non-destructive, label-free technique for studying the biochemistry of biological
materials [1]. The coupling of FTIR spectroscopywithmicroscopy and synchrotron
light has allowed researchers to simultaneously probe a large number of
macromolecules present within a single cell [1]. Importantly, detection of
simultaneous changes in themolecular composition of single cells can assist in the
identification of biological processes that can then be probed further using
complementarytechniques.
4.1.1 FTIRspectroscopyofbiologicalmolecules
FTIR spectroscopy is a technique traditionally employed by chemists and
materialsscientistsfortheidentificationandmolecularanalysisofchemicals.Selected
frequencies(energies)ofIRradiationareabsorbedbymoleculesatenergiesrequired
to cause vibrational excitation of bonds within a molecule [2]. The characteristic
vibrationsofeachchemicalgroupgiverise toaspectrumthatenableselucidationof
the identity of a molecule [2]. As demonstrated in Figure 4.1, IR active molecules
display two fundamentalmodes of vibrationwhich include: (i) stretching vibrations
(symmetric or asymmetricmotion of twoormore atomsbonded to a central atom)
resultingfromachangeinbondlengths,and(ii)bendingvibrations(includingoutof
planemotions, twisting andwagging, and in planemotions, rocking and scissoring)
resultingfromachangeinbondangles[2].
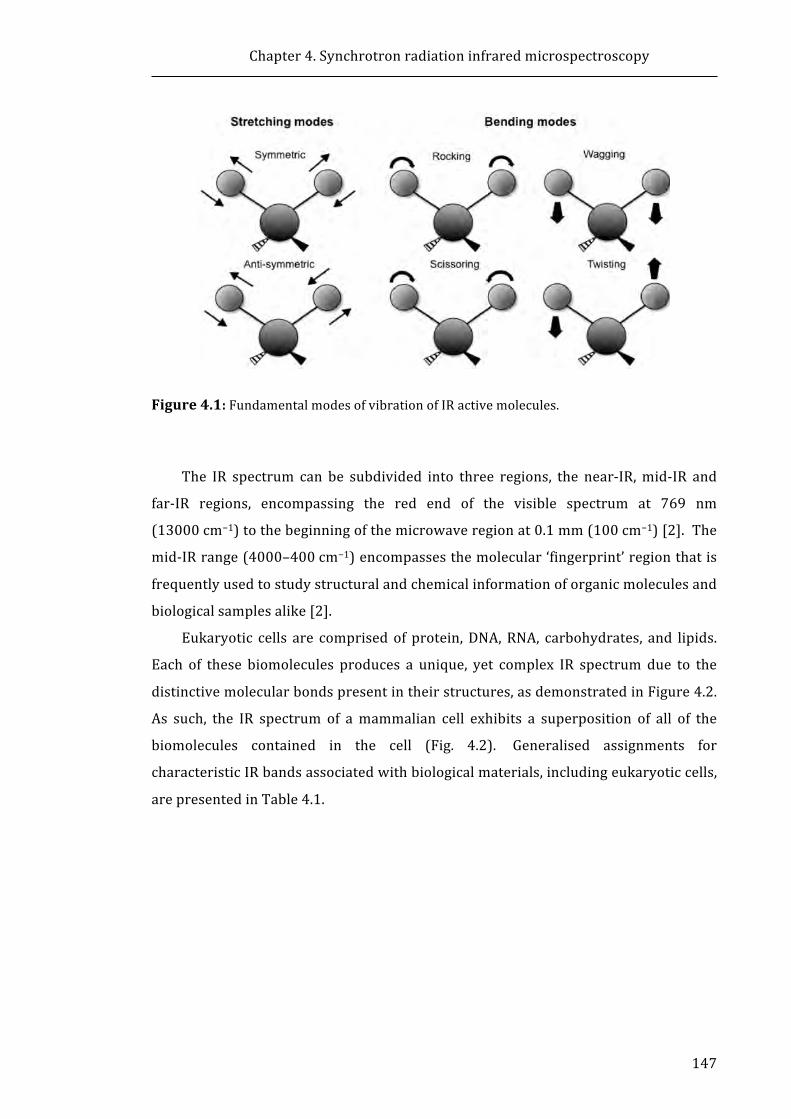
Chapter4.Synchrotronradiationinfraredmicrospectroscopy
147
Figure4.1:FundamentalmodesofvibrationofIRactivemolecules.
The IR spectrum can be subdivided into three regions, the near-IR,mid-IR and
far-IR regions, encompassing the red end of the visible spectrum at 769 nm
(13000cm−1)tothebeginningofthemicrowaveregionat0.1mm(100cm−1)[2].The
mid-IRrange(4000–400cm−1)encompassesthemolecular‘fingerprint’regionthatis
frequentlyusedtostudystructuralandchemicalinformationoforganicmoleculesand
biologicalsamplesalike[2].
Eukaryotic cells are comprisedof protein,DNA,RNA, carbohydrates, and lipids.
Each of these biomolecules produces a unique, yet complex IR spectrum due to the
distinctivemolecularbondspresentintheirstructures,asdemonstratedinFigure4.2.
As such, the IR spectrum of amammalian cell exhibits a superposition of all of the
biomolecules contained in the cell (Fig. 4.2). Generalised assignments for
characteristicIRbandsassociatedwithbiologicalmaterials,includingeukaryoticcells,
arepresentedinTable4.1.
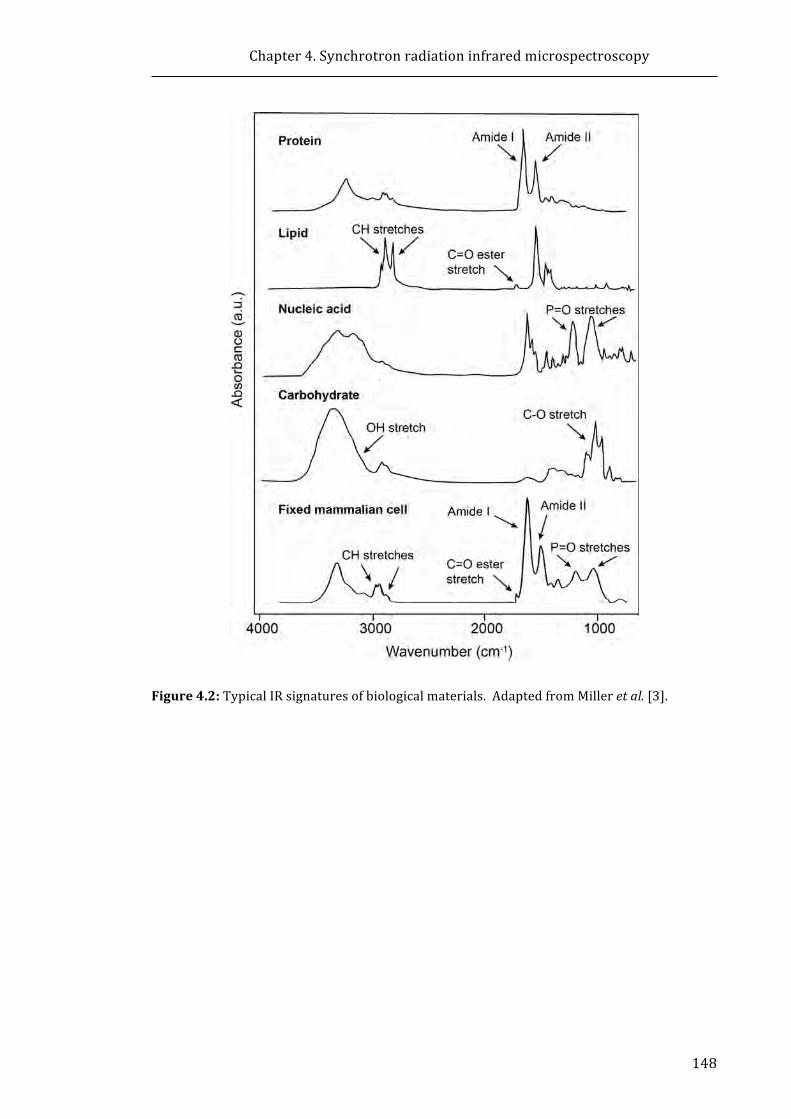
Chapter4.Synchrotronradiationinfraredmicrospectroscopy
148
Figure4.2:TypicalIRsignaturesofbiologicalmaterials.AdaptedfromMilleretal.[3].

Chapter4.Synchrotronradiationinfraredmicrospectroscopy
149
Table4.1:GeneralisedassignmentsofcharacteristicIRbandsofbiologicalandeukaryoticcellspectra[2,4].Wavenumber
(cm−1)Assignment Associated
biomolecule2955 νas(C−H)ofCH3 Lipid/phospholipid2930 νas(C−H)ofCH2 Lipid/phospholipid2898 ν(C−H)ofmethine Lipid/phospholipid2870 νs(C−H)ofCH3 Lipid/phospholipid2850 νs(C−H)ofCH2 Lipid/phospholipid1740 ν(C=O)ester Lipid/phospholipid1720 ν(C=O)ester DNA
1680–1715 ν(C=O) Nucleicacids1653 ν(C=O)/ν(C−N)/δ(N−H),amideI Protein
1567–1520 ν(C−N)/δ(N−H),amideII Protein1515 Tyrosineband Protein1470 δas(C−H)ofCH2 Lipid/phospholipid1420 νs(COO−) Protein
1310–1240 ν(C−N)/δ(N−H)/ν(C=O)/ν(O=C−N),amideIII Protein1232 νas(PO2−) Nucleicacids1170 νas(CO−O−C) Lipid1080 ν(C−O−P),νs(PO2−) Nucleicacids1050 ν(C−O) Carbohydrate
Key:ν=stretchingvibrations,δ=bendingvibrations,s=symmetric,as=asymmetric.
4.1.2 FTIRmicroscopyandsynchrotronsources
ThecouplingofmodernFTIRspectrometerswithpurposebuilt IRmicroscopes,
has allowed researchers to study samples on amicroscopic scale [1, 5]. One of the
limitations of conventional lab-based FTIR microspectroscopy is the low intrinsic
brightness which limits the smallest practical spot size (defined by the microscope
masking aperture) to approximately 20–40 μm at the expense of signal-to-
noise[1, 5]. This represents a major limitation when examining cells and cell
organelles [1, 5]. Conversely, a synchrotron light source produces lightwith higher
brilliance (increased photon flux) which when focused to narrow range emission
angles [5]withmicroscopeapertures(5–20μm)results in the inherentlybrightand
highly focused synchrotron light that facilitates the analysis ofmicrometre samples
with high signal-to-noise [1]. The main restrictions, however, stem from the
diffraction limit [1]. For instance, the diffraction limit in the mid-IR region (3500–
650cm−1)isapproximately1.4–7.7μmforaconventionalconfocalmicroscopewhich
approachesλ/2[1].
Chapter4.Synchrotronradiationinfraredmicrospectroscopy
150
4.1.3 Infraredmicrospectroscopystudiesofdrugeffectsoncancercells
Morerecentdevelopmentsofinfraredmicrospectroscopy(IRMS)inconventional
lab-based settings, and the increasing utilisation of synchrotron radiation (SR) light
sourceshasallowedanumberofresearcherstostudytheeffectsofclinically-used(or
potential) anti-cancer drugs on cancer tissue or cells, at single-cell (and even
subcellular)resolution[6-14].ThestudyofdrugeffectsoncancercellsusingtheIRMS
approachhasanumberofperceivedadvantagesinaclinicalsetting. Forinstance,in
cancer treatments where multiple drug combinations are recommended for the
treatmentofspecifictypesofcancer(suchasnon-smallcell lungcancer), ithasbeen
proposed that IRMS could potentially be employed to determine themost effective
combinationofdrugstoadministertoeachindividualpatient[6].Additionally,IRMS
could provide information on early cellular events to varied doses of
chemotherapeuticswhichcouldallowclinicians todetermine theminimumeffective
dosetoadminister,reducingtheseverityofchemotherapeuticsideeffects[9].Inthis
context,IRMSconceivablyprovidesarapid,sensitiveandeffectivemeanstoimprove
thetreatmentofcancerwithlong-termbeneficialoutcomesforpatients[6].
AsIRMScanprovideaglobalviewoftheeffectsofdrugtreatmentonallcellular
biomolecules (i.e. proteins, lipids, nucleic acids, carbohydrates), it is considered that
the technique could potentially be used to identify possible modes of action of the
drug, as changes to IRMS spectra may be correlated to alterations in biological
functionspecifictothemodeofaction[8].Arecentreviewdiscussesthepotentialuse
of IRMS as a fast and easy technique to determine the mechanisms of action of
prospective candidate compounds in drug discovery programs [15], whereby the
authors propose that IRMS this could help widen the screening process beyond
conventionaltoxicityscreeningmethods.InordertodevelopIRMSforclinicaluse,the
characterisationandinterpretationofthespectralchangesinducedbydrugtreatment
oncancercellsneedstobefullydeveloped.Tothisend,anumberofresearchgroups
haveusedIRMSorSR-IRMStostudytheeffectsofvariouschemotherapeuticagentson
cancercellsinvitro[6-14].AselectionofthesestudiesissummarisedinTable4.2.On
the cellular level, IRMS has been used to study events which are important for the
fundamentalunderstandingof cellularprocesses suchas apoptosis/necrosis [16-21]
andstagesof cell cycle [16,22], thedifferencesbetweenproliferatingandquiescent
cells[23],differentiationofstemcells[24,25]andbloodcells[17],andtheeffectsof
ultravioletBradiationoncells[26,27].
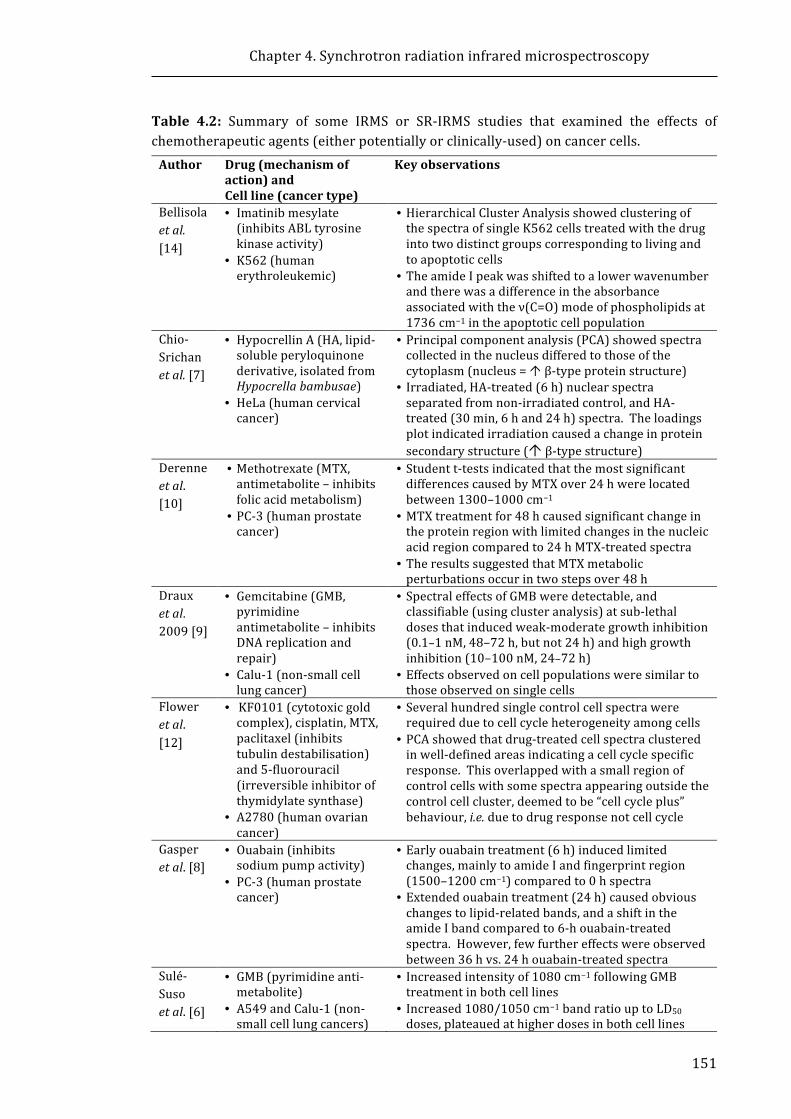
Chapter4.Synchrotronradiationinfraredmicrospectroscopy
151
Table 4.2: Summary of some IRMS or SR-IRMS studies that examined the effects ofchemotherapeuticagents(eitherpotentiallyorclinically-used)oncancercells.Author Drug(mechanismof
action)andCellline(cancertype)
Keyobservations
Bellisolaetal.[14]
• Imatinibmesylate(inhibitsABLtyrosinekinaseactivity)
• K562(humanerythroleukemic)
• HierarchicalClusterAnalysisshowedclusteringofthespectraofsingleK562cellstreatedwiththedrugintotwodistinctgroupscorrespondingtolivingandtoapoptoticcells
• TheamideIpeakwasshiftedtoalowerwavenumberandtherewasadifferenceintheabsorbanceassociatedwiththeν(C=O)modeofphospholipidsat1736 cm−1intheapoptoticcellpopulation
Chio-Srichanetal.[7]
• HypocrellinA(HA,lipid-solubleperyloquinonederivative,isolatedfromHypocrellabambusae)
• HeLa(humancervicalcancer)
• Principalcomponentanalysis(PCA)showedspectracollectedinthenucleusdifferedtothoseofthecytoplasm(nucleus=Óβ-typeproteinstructure)
• Irradiated,HA-treated(6h)nuclearspectraseparatedfromnon-irradiatedcontrol,andHA-treated(30min,6hand24h)spectra.Theloadingsplotindicatedirradiationcausedachangeinproteinsecondarystructure(Óβ-typestructure)
Derenneetal.[10]
• Methotrexate(MTX,antimetabolite–inhibitsfolicacidmetabolism)
• PC-3(humanprostatecancer)
• Studentt-testsindicatedthatthemostsignificantdifferencescausedbyMTXover24hwerelocatedbetween1300–1000cm−1
• MTXtreatmentfor48hcausedsignificantchangeintheproteinregionwithlimitedchangesinthenucleicacidregioncomparedto24hMTX-treatedspectra
• TheresultssuggestedthatMTXmetabolicperturbationsoccurintwostepsover48h
Drauxetal.2009[9]
• Gemcitabine(GMB,pyrimidineantimetabolite–inhibitsDNAreplicationandrepair)
• Calu-1(non-smallcelllungcancer)
• SpectraleffectsofGMBweredetectable,andclassifiable(usingclusteranalysis)atsub-lethaldosesthatinducedweak-moderategrowthinhibition(0.1–1nM,48–72h,butnot24h)andhighgrowthinhibition(10–100nM,24–72h)
• Effectsobservedoncellpopulationsweresimilartothoseobservedonsinglecells
Floweretal.[12]
• KF0101(cytotoxicgoldcomplex),cisplatin,MTX,paclitaxel(inhibitstubulindestabilisation)and5-fluorouracil(irreversibleinhibitorofthymidylatesynthase)
• A2780(humanovariancancer)
• Severalhundredsinglecontrolcellspectrawererequiredduetocellcycleheterogeneityamongcells
• PCAshowedthatdrug-treatedcellspectraclusteredinwell-definedareasindicatingacellcyclespecificresponse.Thisoverlappedwithasmallregionofcontrolcellswithsomespectraappearingoutsidethecontrolcellcluster,deemedtobe“cellcycleplus”behaviour,i.e.duetodrugresponsenotcellcycle
Gasperetal.[8]
• Ouabain(inhibitssodiumpumpactivity)
• PC-3(humanprostatecancer)
• Earlyouabaintreatment(6h)inducedlimitedchanges,mainlytoamideIandfingerprintregion(1500–1200cm−1)comparedto0hspectra
• Extendedouabaintreatment(24h)causedobviouschangestolipid-relatedbands,andashiftintheamideIbandcomparedto6-houabain-treatedspectra.However,fewfurthereffectswereobservedbetween36hvs.24houabain-treatedspectra
Sulé-Susoetal.[6]
• GMB(pyrimidineanti-metabolite)
• A549andCalu-1(non-smallcelllungcancers)
• Increasedintensityof1080cm−1followingGMBtreatmentinbothcelllines
• Increased1080/1050cm−1bandratiouptoLD50doses,plateauedathigherdosesinbothcelllines

Chapter4.Synchrotronradiationinfraredmicrospectroscopy
152
Notably,thestudiespresentedinTable4.2wereperformedonfixedordriedcell
samples. Traditionally, IRMS sample preparation of mammalian cells involves
chemicalfixation(withchemicalssuchasformalinorethanol)ontoanIR-transparent
substrate (such asMirrR Low-E coated slides, zinc selenide (ZnSe), barium fluoride
(BaF2), or calcium fluoride (CaF2)windows) [28]. While a general consensus in the
literaturesupportsthevalidityofresultsobtainedfromfixedsamples,interestinthe
use of FTIR microspectroscopy studies employing live cells has grown in the last
decade [29-40]. Theadvantagesand limitationsofSR-IRMSstudiesofhydrated live
cellsampleswillbediscussedinthefollowingsection.
4.1.4 SR-IRMSoflivecells:advantagesanddisadvantages
TheIRMSanalysisoflivingcellsversusfixedcellshasgainedattentioninthelast
decadeforseveralreasons.Theseinclude:(i)theeliminationofartefactsarisingfrom
chemical fixation, (ii) the minimisation of physical artefacts such as resonant Mie
scatter (RMieS) in the spectra, and (iii) theanalysisof cells in real-time,providinga
means to monitor the biomolecular effects of cell events or drug treatment in
situ[41-43].ItisgenerallyrecognisedthatabrightlightsourceofIRphotons,suchas
asynchrotron, isrequiredtoobtaingoodsignal-to-noise fromsingle livecellspectra
duetoattenuationoftheIRsignalcausedbytheIRbeamasitpassesthroughtwoIR
transparentwindows,cellmediumandthehydratedcell[28]. However,itshouldbe
notedthatthecollectionoflivecellspectrahasalsobeensuccessfullyperformedusing
conventionalbench-topIRlightsources[33,35].
In the past decade, live cell experiments have been made possible by the
development and fabrication of purpose-built chambers for themaintenance of cell
hydration during data collection. The simplest designs involve placing the cells
between two IR transparent windows (e.g. CaF2, ZnSe, or diamond) separated by a
spacer (<12 μm) in a demountable holder. These setups have been utilised in a
number of studies [16, 32, 44-49] wherein these devices have been employed
successfully for short-term analyses of live cells. The holders are not generally
suitablefor long-term(>2h)measurementsduetothe lossofcellmedium[50]. To
this end, more elaborately designed micro-machined thin-reservoirs have been
employedforlivecellstudies[23,33],whileamulti-faceted,fullysealedfluidicdevice
was designed and employed in studies reported byVaccari et al. [34]. In the latter
system, the cells are introduced into the device via a syringe pump. Additionally,
Chapter4.Synchrotronradiationinfraredmicrospectroscopy
153
lithographedbiocompatiblematerialswereusedtocreateseparatechambersforthe
cells, freshcellmediumandairbackgroundmeasurements [34]. Othergroupshave
developedmorecomplexflowchamberswithanopen-channelgeometry[51,52].
Oneofthereasonsthatsignificantefforthasfocusedonmaintaininghydrationis
tosimulatethebiochemistryofmammaliancells,andtheirbiomolecules,inparticular
nucleicacidbands.Forinstance,Whelanetal.[42]reportedthatdehydrationcausesa
B-liketoA-liketransition in theDNAofseveraleukaryoticcellsandthat thereverse
A-liketoB-liketransitionoccursuponrehydration.Thisworkalsoshowedthatupon
rehydration of the cells, sharp DNA-specific bands were observed; however, these
bands were previously broader and less intense when dehydrated. Furthermore,
Vaccari and co-workers [34] performed a study to investigate the effects of cell
fixationmethods(airdrying,ethanol,and formalin)on theSR-IRMSspectraofU937
monocytescomparedtotheSR-IRMSspectraofthelivingU937cells.Importantly,this
study showed that while formalin fixation produced spectra that were the most
similar to those from live cells (particularly in the lipidandprotein regions), effects
wereobservedintheDNAabsorptions. Forinstance,thebandcentredat1717cm−1
(reflectiveofbasepairingofnucleicacids in theB-form)waspronounced in the live
cellspectra,butabsentinthechemical-fixedanddriedcellspectra.
ThesecondadvantageofperformingSR-IRMSstudiesoflive,hydratedcellsisthe
minimisation of dispersion effects, which is an issue that affects fixed cell studies.
Dispersionartefacts suchasRMieScanarise in the spectraof single cells,whichare
typically8–30μmindiameter(andspherical)andoccurswhenthereisadifferencein
the refractive index between the cells and the surrounding environment [53]. This
occurswhentheIRwavelength(typically3–10μm,or3333–1000cm−1) issimilar in
sizetothediameterofthecellsuchthattheincidentIRbeamisscatteredasitcontacts
theouteredgesofthecellresultinginthedistortionofthecollectedIRspectrum[53].
Consequently,RMieS canbeobserved in a single cell spectrumas ahighlydistorted
baseline (particularly, between 2800–1700 cm−1) and derivative-like peak shapes
arisingfrompredominantbands[54,55].Suchdistortioncanleadtoalterationsinthe
positionandintensityofspectralfeatures,inparticulartheamideIband,whichisan
important biomarker for diagnostics and an indicator of therapeutic response [53].
TherecentdevelopmentofanalgorithmtocorrectfortheeffectsofRMieShasallowed
researcherstoremovetheeffectsofRMieSfromsinglecellspectra[53,56].However,
dispersioneffectssuchasRMieSaregenerallyminimisedinlivecellstudiessincethe
Chapter4.Synchrotronradiationinfraredmicrospectroscopy
154
refractive index of the aqueous background closely matches that of the cell [28].
Therefore,thereisnoneedtoapplyanyRMieScompensationmethods,savinganalysis
time.
TraditionalIRMSstudiesoffixedcellsonlyallowforstaticmeasurementsanddo
notallowthesamecells tobestudiedat continuous timepoints. Incontrast, in situ
measurements associated with live cell studies are ideal for tracking drug-induced
changesinthesamecelloverthecourseofatreatmentperiod.Forinstance,theeffect
of arsenite treatment (100 μM) on K562 leukaemia cells has been analysed in
real-time in a purpose-built micro-fabricated chamber [32] at the Australian
Synchrotron[31].Theauthorswereabletotrackspectralchangesconsistentwiththe
biochemistry of apoptosis induced by arsenite treatment. Specifically, following
40minofexposure,adecreaseintheν(C=O)bandat1742cm−1inthearsenite-treated
cell spectrawas consistentwith lipidmembrane changes,while the decrease in the
intensitiesoftheνs(PO2−)andνas(PO2−)wasattributedtotheIRopaquenessofDNAin
an increasingly condensed state. Following 100 min incubation with arsenite, the
intensityoftheνs(PO2−)andνas(PO2−)wasattributedtoDNAfragmentation,anevent
inlaterstagesofapoptosis.AsignificantshiftintheamideIbandfrom1642cm−1to
1650 cm−1 in the arsenite-treated cell spectra was observed suggesting arsenate
induceschanges inthecompositionofproteins inthecell (fromprimarilyβ-sheetto
α-helix/randomcoil).
The IRMSanalysisof livecells isnotwithout itsdisadvantages;oneparticularly
difficultchallengetoovercomeis thestrongIRabsorptivityof thewatermolecule in
aqueousmedia.Thenormalmodesofliquidwaterincludetheasymmetricstretching
mode, the symmetric stretching mode, and the deformation (bending) mode that
appearat~3600cm−1,~3450cm−1,and~1643cm−1,respectively[41].Abroadband
centredat~2125cm−1,which is comprisedof a combinationof abendingbandand
the librationalmodesofwater, canalsobevisualised in cell spectrabetween2500–
1800cm−1[57]. ThewaterbandofparticularconcernforIRMSspectraisthestrong
deformationbandat1640cm−1whichcompletelyoverlapswiththeamideIbandand
partiallywiththeamideIIbandofproteins(Fig.3.3a),resultinginthedistortionofthe
intensity ratio of the amide I/amide II bands (Fig. 4.3b) [33]. There is currentlyno
general consensuson theapproach to take to correct theeffectsofwater saturation
from the spectrum of a cell, although a number of groups have developedMATLAB
algorithmstocorrectfortheabsorptionofwater[33,34];othergroupshaveoptedto
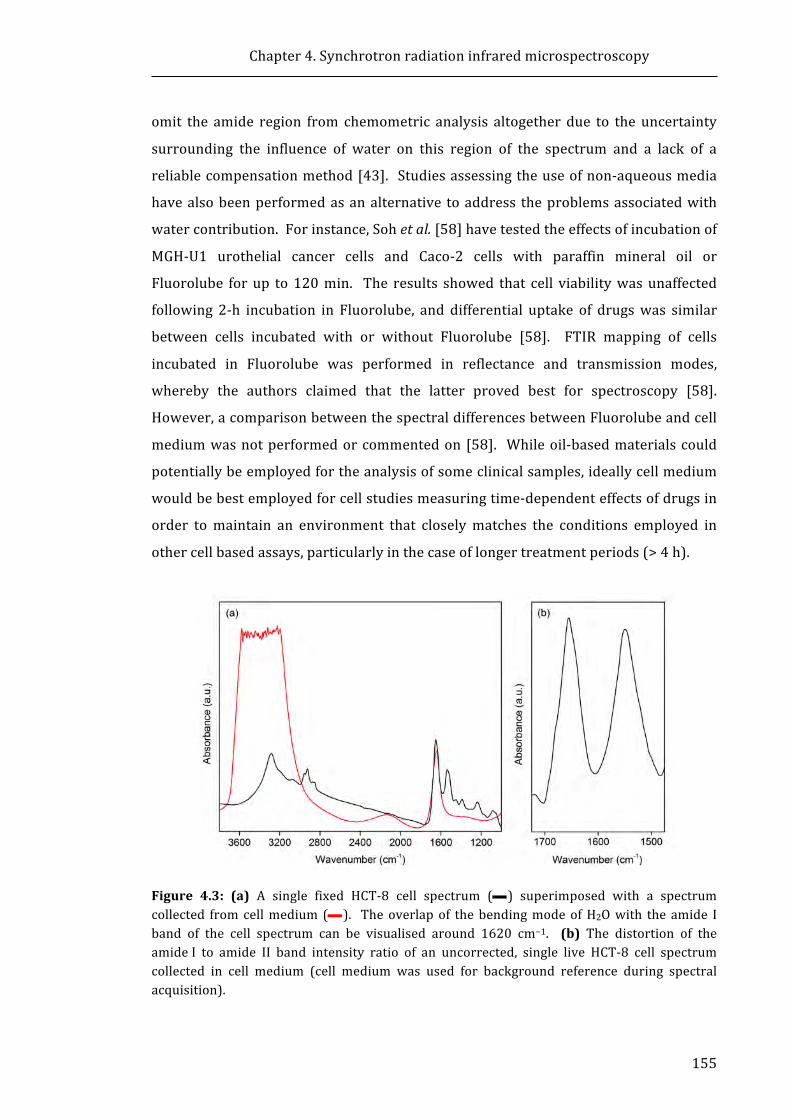
Chapter4.Synchrotronradiationinfraredmicrospectroscopy
155
omit the amide region from chemometric analysis altogether due to the uncertainty
surrounding the influence of water on this region of the spectrum and a lack of a
reliablecompensationmethod[43]. Studiesassessingtheuseofnon-aqueousmedia
havealsobeenperformedasanalternative toaddress theproblemsassociatedwith
watercontribution.Forinstance,Sohetal.[58]havetestedtheeffectsofincubationof
MGH-U1 urothelial cancer cells and Caco-2 cells with paraffin mineral oil or
Fluorolube forup to120min. The results showed that cell viabilitywasunaffected
following 2-h incubation in Fluorolube, and differential uptake of drugswas similar
between cells incubated with or without Fluorolube [58]. FTIR mapping of cells
incubated in Fluorolube was performed in reflectance and transmission modes,
whereby the authors claimed that the latter proved best for spectroscopy [58].
However,acomparisonbetweenthespectraldifferencesbetweenFluorolubeandcell
mediumwasnotperformedorcommentedon[58]. Whileoil-basedmaterialscould
potentiallybeemployedfortheanalysisofsomeclinicalsamples,ideallycellmedium
wouldbebestemployedforcellstudiesmeasuringtime-dependenteffectsofdrugsin
order tomaintain an environment that closelymatches the conditions employed in
othercellbasedassays,particularlyinthecaseoflongertreatmentperiods(>4h).
Figure 4.3: (a) A single fixed HCT-8 cell spectrum (—) superimposed with a spectrumcollected fromcellmedium(—). Theoverlapof thebendingmodeofH2Owith theamide Iband of the cell spectrum can be visualised around 1620 cm−1. (b) The distortion of theamideI to amide II band intensity ratio of an uncorrected, single live HCT-8 cell spectrumcollected in cell medium (cell medium was used for background reference during spectralacquisition).
Chapter4.Synchrotronradiationinfraredmicrospectroscopy
156
4.1.5 Chapteraims
The work in the previous Chapter suggests that the BiNSAIDs, Bi(tolf)3 and
Bi(mef)3, cause toxicity towardsHCT-8 cells that is approximately equivalent to the
respective free NSAIDs, tolfH and mefH, while Bi(difl)3 induced a greater toxic
responsecomparedtodiflH.However,theexactmechanismsbywhichtheBiNSAIDs
causetoxicitytotheHCT-8cellsarecurrentlyunknown.Itis,therefore,importantto
determine whether BiNSAIDs elicit toxicity through similar or new mechanisms of
actioncomparedtotheuncomplexedNSAIDs.
While several groups have recently reported the results from SR-IRMS studies
that employ live cells, and specifically the effects of drug compounds on cancer cell
lines, therearecurrentlynostudiesthathaveexaminedBi(III)complexesorNSAIDs
on livecancercellsusingthis technique. Additionally, there isnocurrentconsensus
on the pre-processing approach required to reduce the influence of strong
absorptivity of water bands arising from the aqueous environment. As the use of
SR-IRMS for studying the global biomolecular effects of drug-treated cells is still in
relative infancy, the current study was performed to determine the usefulness of
SR-IRMSfortheinvestigationofdominantbiomolecularchangesthatoccurfollowing
drug administration, with the focus on the BiNSAIDs and NSAIDs relevant to this
Thesis.
ThusthespecificaimsofthisChapterare:
1. To discern any differences in the results of principal component analysis
(PCA) performed on SR-IRMS spectra of HCT-8 cells using two different
approaches aimed to minimise the effects of background water: (i) pre-
processing using a water band subtractionmethod, or (ii) omission of the
amideregionfromtheanalysis.
2. Toestablish spectroscopically if thebiomolecular responsesofBiNSAIDs in
HCT-8 cells can be differentiated from those of the corresponding free
NSAIDsfollowingshort(4h)andprolonged(24h)periodsofdrugexposure.
3. TodeterminewhetheranyobservedchangesinducedbyBiNSAID/NSAIDare
consistentwithknownmechanismsofcelldeath.
Chapter4.Synchrotronradiationinfraredmicrospectroscopy
157
4.2 MaterialsandMethods4.2.1 Materials
The materials employed for these studies are described in Sections 2.2.1 and
3.2.1. Additional materials (specific to the experiments in this Chapter) include
CELLSTAR® 24-well tissue culture plates sourced from Greiner Bio-One
(Kremsmünster, Austria) and polished CaF2 windows (12mm diameter, 0.5mm
thickness)manufacturedbyCrystranLimited(Poole,England).
4.2.2 Generalcellculture
Live HCT-8 cells were transported to the Australian Synchrotron (Clayton,
Australia) and cultured onsite using the cell culture procedures described in
Section2.2.3.
4.2.3 SR-IRMSstudies
4.2.3.1 Preparationofcellsamples
HCT-8cells(2.5×10⁵cells,1mLgrowthmedium)weregrowndirectlyontoCaF2
windows (12mm diameter, 0.5mm thickness) that were located in 24-well cell
cultureplates.Sincethecellsdidnotadheretothewindowsrapidly,astainlesssteel
spacerwitha5mmdiameterholewasplacedontopofeachCaF2windowtocreatea
confinedarea for the cells to attach. Once theHCT-8 cellshadadhered, the spacers
were removed and the cells were incubated for a further period of time. No
differences in cell morphology were noted between the method employed in this
Chapter and the traditional cell culture method. Prior to treatment, the growth
mediumwasremovedandthecompounds(initiallydissolvedinDMSO,andaddedto
1mLRPMI-1640mediumtoproduceafinalDMSOconcentrationof2%v/v)orvehicle
(1mLRPMI-1640,2%v/vDMSO)wereaddedto thewell. HCT-8cellswere treated
witheachBiNSAIDataconcentrationequaltotheapproximateIC50(asdeterminedby
MTTassays, Section2.3.2), or anequimolar concentrationof the corresponding free
NSAID. At the end of the 4- or 24-h period, the cells were washed once with PBS
solution.
SR-IRMSspectraof liveHCT-8cellswerecollectedusingthedemountableliquid
cell shown in Figure 4.4, details of which (design and specification) have been
describedelsewhere[32].Firstly,the0.5-mmthickCaF2windowontowhichtheHCT-
8cellsweregrownwasplacedatthebottomofthesampleholderwiththecellsurface
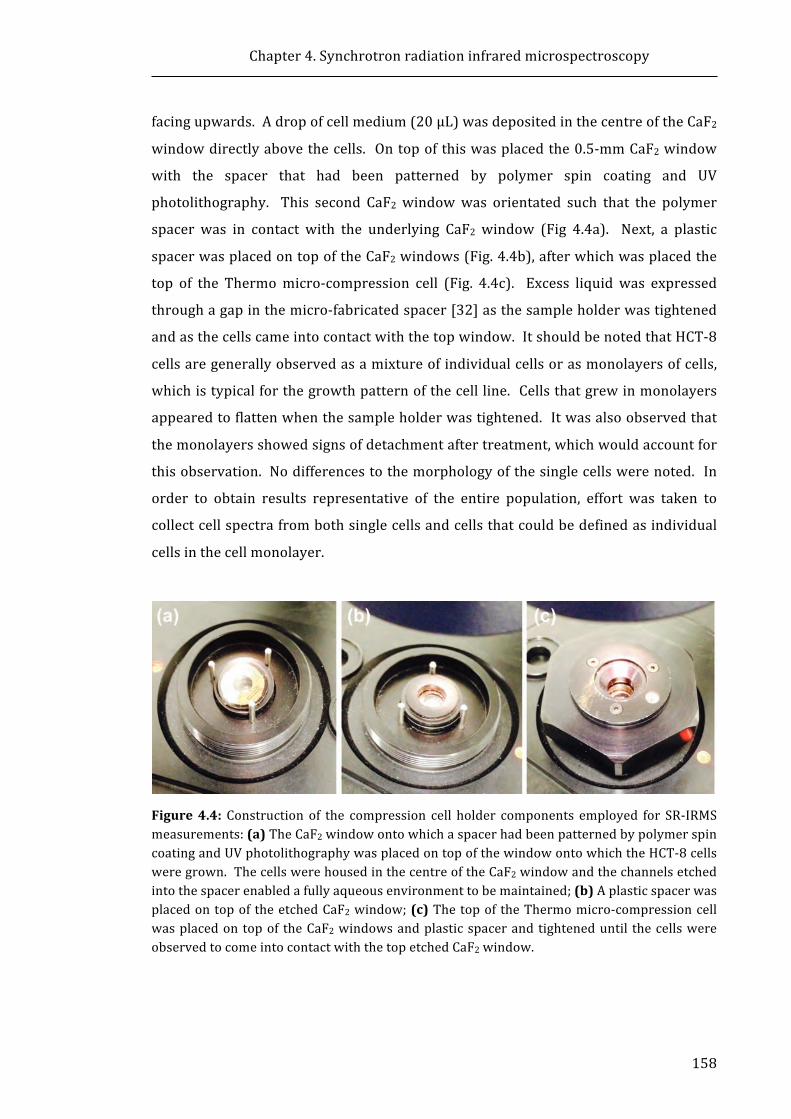
Chapter4.Synchrotronradiationinfraredmicrospectroscopy
158
facingupwards.Adropofcellmedium(20μL)wasdepositedinthecentreoftheCaF2
windowdirectlyabovethecells. Ontopofthiswasplacedthe0.5-mmCaF2window
with the spacer that had been patterned by polymer spin coating and UV
photolithography. This second CaF2 windowwas orientated such that the polymer
spacer was in contact with the underlying CaF2 window (Fig 4.4a). Next, a plastic
spacerwasplacedontopoftheCaF2windows(Fig.4.4b),afterwhichwasplacedthe
top of the Thermomicro-compression cell (Fig. 4.4c). Excess liquidwas expressed
throughagapinthemicro-fabricatedspacer[32]asthesampleholderwastightened
andasthecellscameintocontactwiththetopwindow.ItshouldbenotedthatHCT-8
cellsaregenerallyobservedasamixtureofindividualcellsorasmonolayersofcells,
whichistypicalforthegrowthpatternofthecellline.Cellsthatgrewinmonolayers
appearedtoflattenwhenthesampleholderwastightened.Itwasalsoobservedthat
themonolayersshowedsignsofdetachmentaftertreatment,whichwouldaccountfor
thisobservation. Nodifferencestothemorphologyofthesinglecellswerenoted. In
order to obtain results representative of the entire population, effort was taken to
collectcellspectrafrombothsinglecellsandcellsthatcouldbedefinedasindividual
cellsinthecellmonolayer.
Figure4.4: Construction of the compression cell holder components employed for SR-IRMSmeasurements:(a)TheCaF2windowontowhichaspacerhadbeenpatternedbypolymerspincoatingandUVphotolithographywasplacedontopofthewindowontowhichtheHCT-8cellsweregrown.ThecellswerehousedinthecentreoftheCaF2windowandthechannelsetchedintothespacerenabledafullyaqueousenvironmenttobemaintained;(b)Aplasticspacerwasplacedontopof theetchedCaF2window;(c)Thetopof theThermomicro-compressioncellwasplacedontopof theCaF2windowsandplasticspacerandtighteneduntil thecellswereobservedtocomeintocontactwiththetopetchedCaF2window.
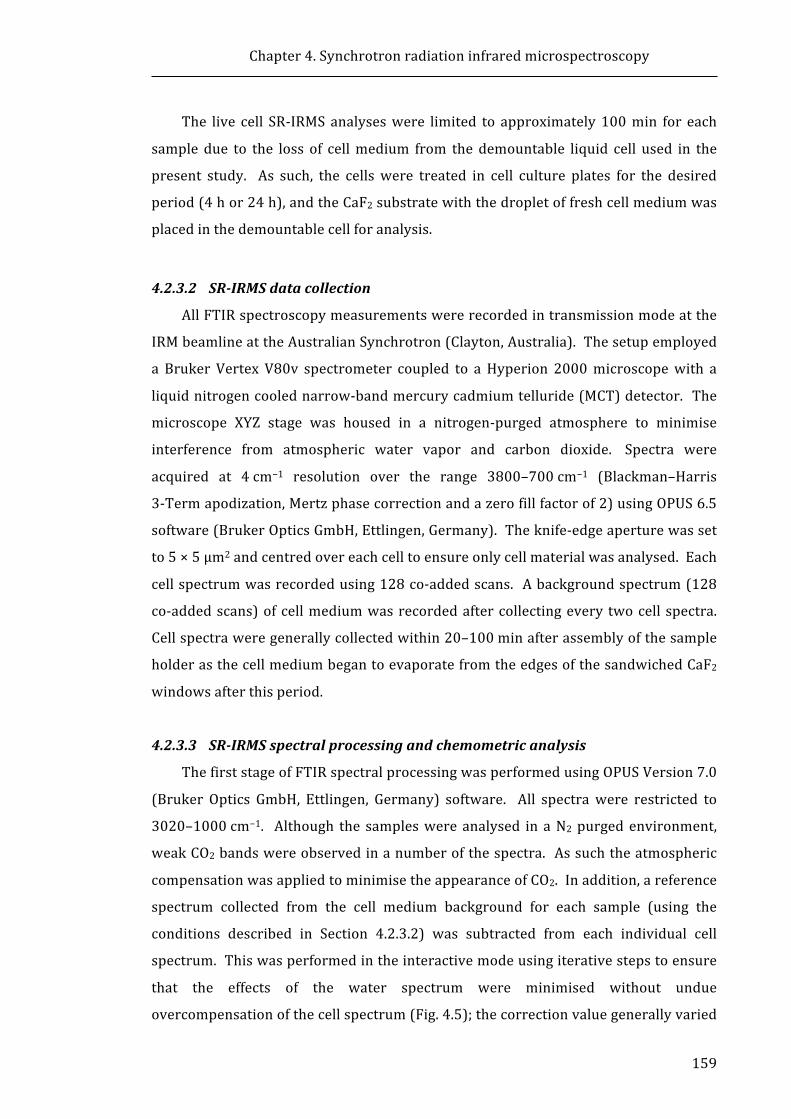
Chapter4.Synchrotronradiationinfraredmicrospectroscopy
159
The live cell SR-IRMSanalyseswere limited to approximately 100min for each
sample due to the loss of cellmedium from the demountable liquid cell used in the
present study. As such, the cellswere treated in cell culture plates for the desired
period(4hor24h),andtheCaF2substratewiththedropletoffreshcellmediumwas
placedinthedemountablecellforanalysis.
4.2.3.2 SR-IRMSdatacollection
AllFTIRspectroscopymeasurementswererecordedintransmissionmodeatthe
IRMbeamlineattheAustralianSynchrotron(Clayton,Australia).Thesetupemployed
a Bruker Vertex V80v spectrometer coupled to aHyperion 2000microscopewith a
liquidnitrogencoolednarrow-bandmercurycadmiumtelluride(MCT)detector. The
microscope XYZ stage was housed in a nitrogen-purged atmosphere to minimise
interference from atmospheric water vapor and carbon dioxide. Spectra were
acquired at 4cm−1 resolution over the range 3800–700cm−1 (Blackman–Harris
3-Termapodization,Mertzphasecorrectionandazerofillfactorof2)usingOPUS6.5
software(BrukerOpticsGmbH,Ettlingen,Germany).Theknife-edgeaperturewasset
to5×5µm2andcentredovereachcelltoensureonlycellmaterialwasanalysed.Each
cellspectrumwasrecordedusing128co-addedscans. Abackgroundspectrum(128
co-addedscans)ofcellmediumwasrecordedaftercollectingevery twocell spectra.
Cellspectraweregenerallycollectedwithin20–100minafterassemblyofthesample
holderasthecellmediumbegantoevaporatefromtheedgesofthesandwichedCaF2
windowsafterthisperiod.
4.2.3.3 SR-IRMSspectralprocessingandchemometricanalysis
ThefirststageofFTIRspectralprocessingwasperformedusingOPUSVersion7.0
(Bruker Optics GmbH, Ettlingen, Germany) software. All spectrawere restricted to
3020–1000cm−1. Although the sampleswereanalysed in aN2purgedenvironment,
weakCO2bandswereobservedinanumberofthespectra. Assuchtheatmospheric
compensationwasappliedtominimisetheappearanceofCO2.Inaddition,areference
spectrum collected from the cell medium background for each sample (using the
conditions described in Section 4.2.3.2) was subtracted from each individual cell
spectrum.Thiswasperformedintheinteractivemodeusingiterativestepstoensure
that the effects of the water spectrum were minimised without undue
overcompensationofthecellspectrum(Fig.4.5);thecorrectionvaluegenerallyvaried
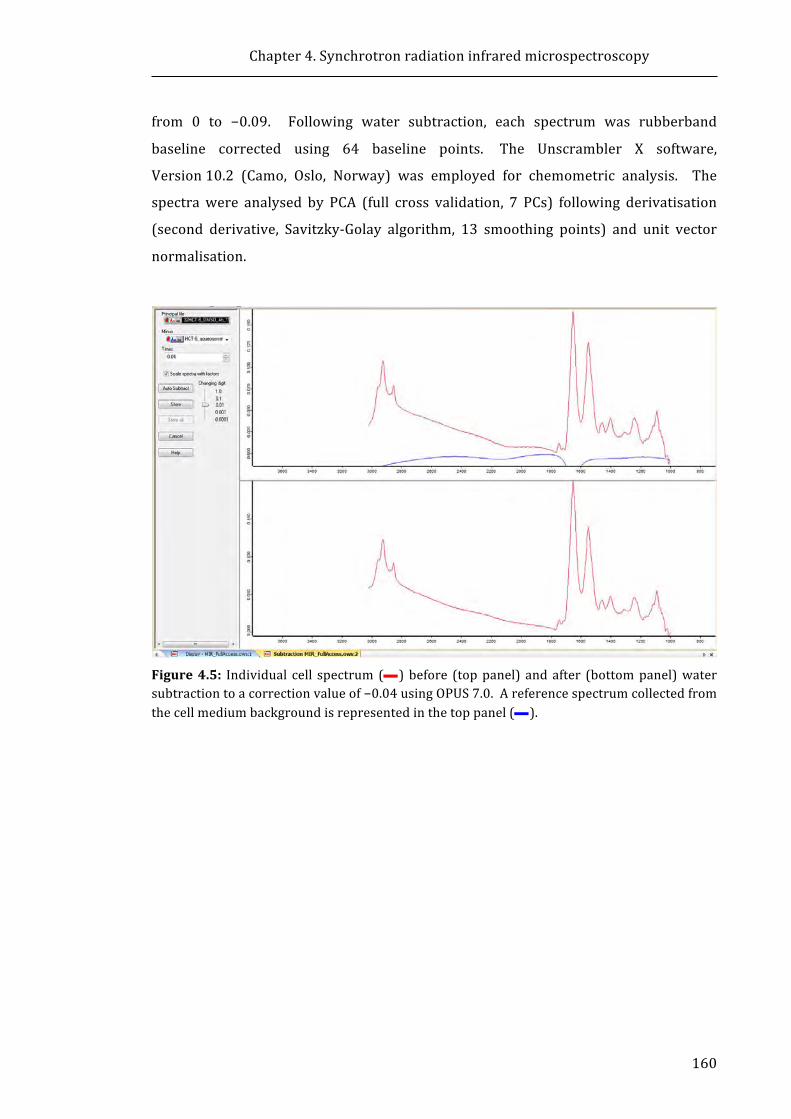
Chapter4.Synchrotronradiationinfraredmicrospectroscopy
160
from 0 to −0.09. Following water subtraction, each spectrum was rubberband
baseline corrected using 64 baseline points. The Unscrambler X software,
Version10.2 (Camo, Oslo, Norway) was employed for chemometric analysis. The
spectrawere analysed by PCA (full cross validation, 7 PCs) following derivatisation
(second derivative, Savitzky-Golay algorithm, 13 smoothing points) and unit vector
normalisation.
Figure4.5: Individual cell spectrum (—)before (toppanel) andafter (bottompanel)watersubtractiontoacorrectionvalueof−0.04usingOPUS7.0.Areferencespectrumcollectedfromthecellmediumbackgroundisrepresentedinthetoppanel(—).

Chapter4.Synchrotronradiationinfraredmicrospectroscopy
161
4.3 Results
4.3.1 Comparisonofspectralcorrectionfactorsusedfordataanalysis
In this Section the SR-IRMS spectra of HCT-8 cells treated with RPMI-1640
containingDMSO (2% v/v, referred to herein as vehicle) andHCT-8 cells incubated
withRPMI-1640(withoutfetalbovineserum,penicillin/streptomycinorGlutaMAXTM
solutions,referredtohereinascellmedium)havebeenusedto:(i)describeandjustify
thecorrectionprocessesusedforthespectraldataanalysespresentedinthisChapter
(Sections4.3.1.1and4.3.1.2), and (ii)producecontroldata toestablishwhetherany
differencescouldbedetectedinthebiomolecularsignaturesofthetreatedHCT-8cells
over the course of the drug treatment periods (4 h, Section 4.3.2, or 24 h,
Section4.3.3).
In general, theSR-IRMSspectra collected from theHCT-8 cells (typical example
showninFig.4.6a)exhibitedwatersaturation.Thiswasobservedastheνs(OH)band
typically centred around 3400 cm−1 (not shown in Fig. 4.6a), a decrease in the
intensity ratio of the amide I/amide II bands, and the presence of the water
combination band between 2500–1800 cm−1, which creates a characteristic broad
curveinthespectrum(indicatedbytheleftmostarrowinFig.4.6a). Asexplainedin
Section4.1.4,thepresenceofthewaterbandoverlappingtheamideIband(andtoa
lesser extent the amide II band) presents one of the biggest challenges when
interpretingSR-IRMSspectraoflivecells.Twoapproachesweretakeninaneffortto
extractandinterpretthebiomoleculardifferencesbetweentheSR-IRMSspectraofthe
cellsamples:(i)waterbandcorrectionusingspectralsubtraction,and(ii)omissionof
theamideIandamideIIbandregion(1709–1486cm−1)fromPCA.Inadditiontothe
presence of strong water bands in the SR-IRMS spectra, high noise was observed
below1150cm−1asaresultofthepoortransmissionofIRlight.Thiswasduetothe
combination of the two CaF2windows and the small aperturewindow (5 × 5 μm2)
used in theseexperiments.As such, spectraldataatwavenumbersbelow1150cm−1
wereomittedbeforeperformingthePCApresentedinthisChapter.
4.3.1.1 Waterbandcorrectionusingaspectralsubtractionmethod
The averaged, baseline corrected and vector normalised SR-IRMS spectra of
HCT-8cellsincubatedwithcellmedium(4h),beforeandafterwaterbandsubtraction
are shown inFigure4.6a. As indicatedby the arrows inFig. 4.6a, themost striking
differenceobservedbetweenthenon-subtractedandwaterbandsubtractedSR-IRMS

Chapter4.Synchrotronradiationinfraredmicrospectroscopy
162
spectra was the decrease in the absorbance of the amide II band (1548 cm−1) in
comparison to the amide I band (1653cm−1), and the flattening of the water
combination band between 2500–1800cm−1 (this result was expected as the water
combination band was used to determine the amount of correction to apply)
producingaSR-IRMSspectralprofileintheamideregionmorerepresentativeofthat
observedfromfixedcellspectra(seeFig.4.2).
Figure 4.6: (a) Averaged (n = 59), baseline corrected (rubberband baseline corrected,64baseline points), vector normalised HCT-8 cell spectra following 4-h incubation in cellmedium before (—), and after (—), water band subtraction. Black arrows indicate thespectral feature changes substantially affected by water band subtraction. (b) Unit vectornormalised, second derivative of the spectra shown in (a). The wavenumbers in blackrepresent thenon-correctedbandpositions,whilewavenumbers in red represent thewaterband subtracted band positions. The black arrows denote bands affected by water bandsubtraction.
Chapter4.Synchrotronradiationinfraredmicrospectroscopy
163
Figure 4.6b shows the averaged, normalised, second derivative spectra of the
same SR-IRMS spectra presented in Figure 4.6a. The second derivative
representations of the averaged SR-IRMS spectra were typically examined as they
resolve theoverlappedabsorptioncomponents,whichprovideclearerelucidationof
band positions and band shifts [59, 60]. Compared to the non-subtracted second
derivative spectrum, a very slight reduction in the intensity of the amide II band
(1551cm−1), the regionbetween the amide I and amide II bands (1601–1591cm−1),
andtheν(C=O)band(1714cm−1)wereobservedfollowingwaterbandsubtraction(as
indicated by the arrows in Fig. 4.6b). Importantly, however, no differences were
observed in the band positions between the non-subtracted and water band
subtracted spectra (Fig. 4.6b). Following the application ofwater band subtraction,
these observations were similarly noted when the averaged, normalised, second
derivative SR-IRMS spectrum of the 4-h vehicle-treated cells was examined
(Appendix3.1),suggestingthattheroutineapplicationofthewaterbandsubtraction
methodproducesaconsistentresponseacrossdifferentsamples.
WhentheaverageSR-IRMSspectrumofHCT-8cellstreatedwithcellmediumwas
comparedtothatofthevehicle,beforewaterbandsubtraction(Appendix3.2), there
wasonlyaslightdifference in the intensitiesof themajorbands. Additionally,band
shifts of only 1–2 cm−1 were observed in the bands in the CH2/CH3 stretching
region(3000–2800 cm−1), the lipid ν(C=O) band (1742 cm−1) and the amide I band
(1653cm−1),asindicatedinAppendix3.2a. GiventhenoiseobservedintheSR-IRMS
spectrabelow1150cm−1,anyshiftsintheνs(PO2−)bandat1088cm−1areunlikelyto
be reliable and these observations have not been discussed further. Following the
application ofwater band subtraction, the intensities of the SR-IRMS spectra of cell
medium- and vehicle-treated cells showed closer agreement (Appendix 3.2b),
particularly in the fingerprint region (1750–1000 cm−1); however, there was an
increaseintheabsorbanceofthelipidbands,νas(CH3)andνas(CH2)at2958cm−1and
2926cm−1,respectively,intheaveragevehicle-treatedspectrum.Itisnoteworthythat
theν(C=O)bandsof lipidsandDNAat1742cm−1and1714cm−1, respectively,were
lessdefinedfollowingwaterbandsubtraction(Appendix3.2b);although,examination
of thesecondderivativespectrashowednoshift inwavenumber inrelationto these
bands (Appendix 3.3a-b). In fact, very little difference was observed between the
averaged second derivative spectra of cell medium- and vehicle-treated cells (4 h)
beforeandfollowingwaterbandsubtraction(Appendix3.3a-b).
Chapter4.Synchrotronradiationinfraredmicrospectroscopy
164
4.3.1.2 Statisticalanalysisofdata:Principalcomponentanalysis(PCA)
Themultivariate data analysis technique, PCA,was employed in this study as a
means to distinguish any biomolecular differences between the cell populations
treatedwithBiNSAIDsorNSAIDs,orwithinthecellpopulationsthemselves.AstheIR
spectracontainthousandsofwavenumbers(orvariables)astatisticalmethodsuchas
PCAisemployedtoreducethecomplexityofthedataset,bycreatingasmallnumber
ofuncorrelatedartificialvariables,orprincipalcomponents(PCs),thatwillaccountfor
mostof thevariance in theobservedvariables [60]. Thesamplevarianceof thePCs
are representedbyeigenvaluesandare rankedaccording to theirmagnitude,where
the first eigenvalues account for a large portion of the variance of the data [60].
Assuch, the first PC (PC-1) is the linear combination with maximal variance (the
largesteigenvalue),andthesecondPC(PC-2)representsthenexthighestvariancein
anorthogonaldirectiontoPC-1[60,61]. PCAdisplaysthemainpatternsasascores
matrix(orplot),whereeachpoint(score)ontheplotrepresentsonecellspectrum;as
such, similar spectra cluster together, while dissimilar spectra appear further away
from each other [61, 62]. Additionally, PCA produces loadings plots that provide
information on the variables (spectral bands arising from differences in the
biomoleculargroupswithin thesamples in thecaseofSR-IRMSdata),whichare the
determinantsfortheclusteringvisualisedinthescoresplots[62]. Inthiswork,PCA
wasperformedonsecondderivativeSR-IRMSspectra. Assuch,positiveloadingsare
associatedwithscoresinthenegativespaceofthescoresplot,andnegativeloadings
are associated with positive scores [31]. Using PCA, the most significant spectral
differencesandtrendscanbeidentified[62].
Thestartingpointwas tousePCAasa tool toevaluate theeffectofwaterband
subtraction. PCA scores plotswere generated from spectrawithout andwithwater
bandsubtractionandcompared.Whileitwouldbeidealtocheckeachnon-subtracted
cell spectrum against the water band subtracted spectrum of each individually
correctedcell, thisprocesswouldbeextremelytime-consuminggiventhenumberof
spectra collected. The average spectra of the cell medium and vehicle-treated cell
spectra (Appendix 3.2 and Appendix 3.3) represent the average of over 50
unsynchronised living HCT-8 cells; as such, differences between the spectra of cells
within the population need to be examined in order to determine whether cells
subjectedtodifferentconditionsrepresentbiochemicallydistinctpopulations.
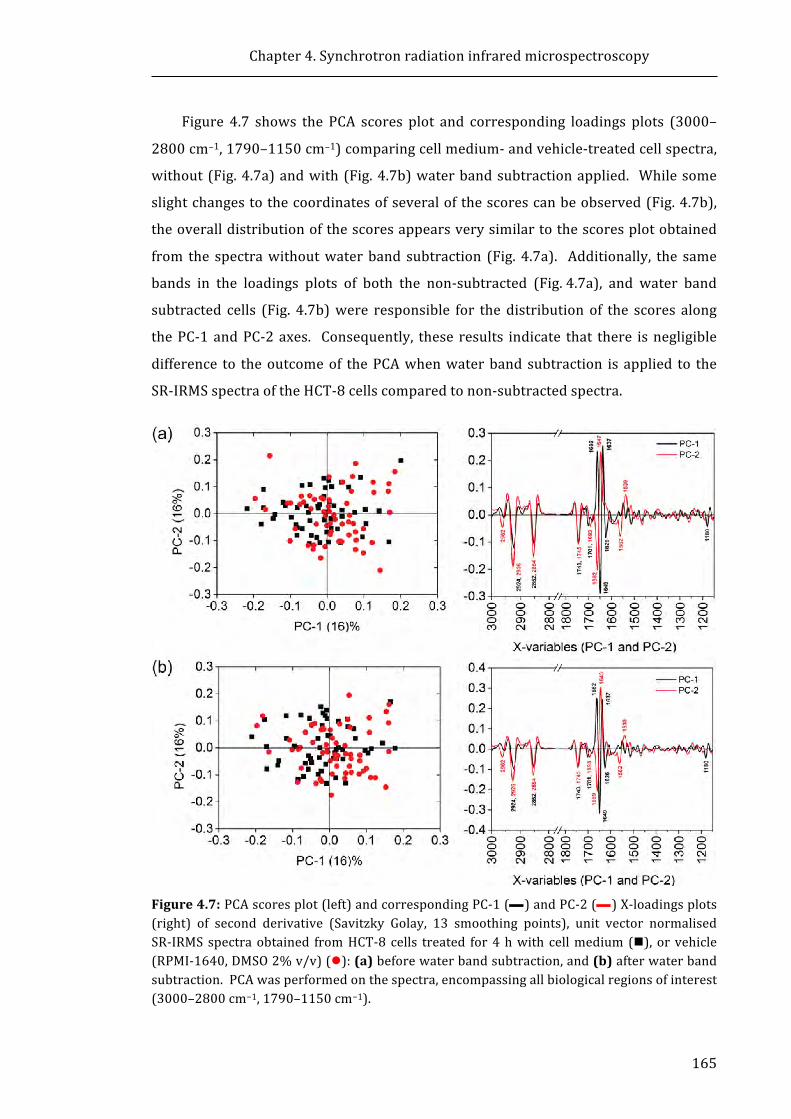
Chapter4.Synchrotronradiationinfraredmicrospectroscopy
165
Figure 4.7 shows the PCA scores plot and corresponding loadings plots (3000–
2800cm−1,1790–1150cm−1)comparingcellmedium-andvehicle-treatedcellspectra,
without(Fig.4.7a)andwith(Fig.4.7b)waterbandsubtractionapplied. Whilesome
slightchangestothecoordinatesofseveralofthescorescanbeobserved(Fig.4.7b),
theoveralldistributionofthescoresappearsverysimilartothescoresplotobtained
from the spectrawithoutwaterband subtraction (Fig. 4.7a). Additionally, the same
bands in the loadings plots of both the non-subtracted (Fig.4.7a), and water band
subtracted cells (Fig. 4.7b)were responsible for the distribution of the scores along
thePC-1andPC-2axes. Consequently, these results indicate that there isnegligible
difference to theoutcomeof thePCAwhenwaterbandsubtraction is applied to the
SR-IRMSspectraoftheHCT-8cellscomparedtonon-subtractedspectra.
Figure4.7:PCAscoresplot(left)andcorrespondingPC-1(—)andPC-2(—)X-loadingsplots(right) of second derivative (Savitzky Golay, 13 smoothing points), unit vector normalisedSR-IRMSspectraobtained fromHCT-8 cells treated for4hwith cellmedium (n), or vehicle(RPMI-1640,DMSO2%v/v)(l):(a)beforewaterbandsubtraction,and(b)afterwaterbandsubtraction.PCAwasperformedonthespectra,encompassingallbiologicalregionsofinterest(3000–2800cm−1,1790–1150cm−1).

Chapter4.Synchrotronradiationinfraredmicrospectroscopy
166
Whentheamidebandswereomitted(1709–1486cm−1)fromthePCA(Fig.4.8)of
second derivative SR-IRMS 4-h cell medium- or vehicle-treated spectra, without
(Fig.4.8a) andwith (Fig. 4.8b)water band subtraction applied, therewas negligible
difference observed between the scores plots of the non-subtracted or water band
subtracted spectra. Additionally, negligible differencewas observed in the loadings
plotofthewaterbandsubtractedspectra(Fig.4.8b)comparedtothenon-subtracted
spectra (Fig. 4.8a). Consequently, the analysis presented in the remainder of this
Chapterwasperformedonnon-subtractedspectra.
Figure4.8:PCAscoresplot(left)andcorrespondingPC-1andPC-2X-loadingsplots(right)ofsecond derivative (Savitzky Golay, 13 smoothing points), unit vector normalised SR-IRMSspectra obtained from HCT-8 cells treated for 4 h with cell medium (n), or vehicle(RPMI-1640,DMSO2%v/v)(l).PCAwasperformedonthespectra(3000–2800cm−1,1790–1710cm−1, and1485–1150 cm−1)with the omissionof the amide region (1709–1486 cm−1):(a)beforewaterbandsubtraction,and(b)afterwaterbandsubtraction.
4.3.1.3 EffectsofvehicleonliveHCT-8cells(4-hstudy)
Havingshown the rationale for thedataanalysis, thenext stepwas to interpret
theresultswithrespecttothecelltreatment.Figure4.7a(Section4.3.1.1)showsthe

Chapter4.Synchrotronradiationinfraredmicrospectroscopy
167
PCAscoresplotandcorrespondingloadingsplots(3000–2800cm−1,1790–1150cm−1)
that compare4-h cellmedium- and vehicle-treated cell spectra,withoutwater band
subtractionapplied. Thescoresplotshowscompleteoverlapofthecellmediumand
vehicle scores and no distinct clustering of either group. This result suggests that
there were no substantial biomolecular differences between the two treatment
groups, and that heterogeneity among the SR-IRMS spectra of the cells within each
sampleisresponsibleforthedistributionofthescoresalongboththePC-1andPC-2
axis. ThePC-1 loadings plot indicated that the lipid-relatedbands, νas(CH2), νs(CH2)
andν(C=O)(2924cm−1,2852cm−1and1743cm−1,respectively),andloadingsrelated
totheamideIband(1662cm−1,1649cm−1and1637cm−1)arethepredominantbands
causing the distribution of the spectra along the PC-1 axis. The PC-2 loadings plot
(Fig.4.7a) indicated that the lipid-related bands, νas(CH2), νs(CH2) and ν(C=O)
(2926cm−1,2854cm−1and1745cm−1,respectively),andloadingsrelatedtotheamide
Iband(1662cm−1and1647cm−1)andamideIIband(1562cm−1and1539cm−1)are
the predominant bands causing the distribution of the spectra along the PC-2 axis.
These results suggest that variations in cellular proteins and lipidswere present in
each population. This result is not unexpected as the cells were not cell cycle
synchronised; thus the distribution of cells throughout different phases of the cell
cyclecouldbethelikelycauseofheterogeneityamongstthetwopopulations.Thisis
also consistent with other live cell studies that have shown that cells have distinct
biomolecularsignaturesatdifferentphasesofthecellcycle[43].
Figure4.8ashowsthePCAscoresandloadingsplotsofsecondderivativeSR-IRMS
4-h cellmedium- or vehicle-treated spectra following omission of the amide region
(3000–2800 cm−1, 1790–1710 cm−1, 1485–1150cm−1), without water band
subtraction.Boththecellmediumandthevehiclescoresweredistributedacrossboth
the positive and negative PC-1 space. Once again, this suggests that heterogeneity
exists within both cell populations, and that the biomolecular differences that exist
within each sample aremore dominant than the biomolecular differences that exist
between the two samples. In contrast to Figure 4.7a (amide region included), the
loadings plot in Figure 4.8a shows that there are strong lipid-related loadings at
2924cm−1(νas(CH2)),2839cm−1(νs(CH2)),and1745cm−1(ν(C=O))andaweakloading
at 1464cm−1 (δ(CH2)) that are responsible for the distribution of the scores along
PC-1. This observation suggests that variation in cellular lipids exists between the
SR-IRMSspectrainboththecellmedium-,andvehicle-treatedcellpopulations.Along
Chapter4.Synchrotronradiationinfraredmicrospectroscopy
168
thePC-2space,therewasnocleardelineationofthetwosamples,although,thescores
obtained from the cellmedium-treated cells appearedpredominantly in thepositive
PC-2space,whilethescoresfromvehicle-treatedcellsappearedpredominantlyinthe
negative PC-2 space. Figure 4.8a shows that strong loadings in the region between
1250-1150cm−1were observed, whichwere not present in the loadings plot of the
PCAperformedwiththeamideregionincluded(Fig.4.7a);theloadingsat1252cm−1,
1238 cm−1, and 1227 cm−1 are associated with the νas(PO2−) band of nucleic acids.
Additionally, thederivative-likebands at2931 cm−1 and2847 cm−1 are indicativeof
band shifts of lipids. These observationsmay indicate that the 4-hDMSO (2% v/v)
exposuremayinducechangestolipidandnucleicacidconcentrationsinHCT-8cells.
4.3.1.4 EffectofvehicleonliveHCT-8cells(24-hstudy)
HCT-8 cells were incubated with cell medium or vehicle for 24-h in order to
correlatewiththetreatmentperiodemployedinthetoxicityanduptakeexperiments
performed with the HCT-8 cells (Chapter 2 and 3, respectively). The averaged,
baselinecorrectedandvectornormalisedSR-IRMSspectraofHCT-8cellstreatedwith
cellmediumorvehicle(24h),beforeandfollowingwaterbandsubtractionareshown
in Appendix 3.4. Similar to the 4-h samples (Appendix 3.2), only small differences
couldbeobservedwhencomparingthe24-haveragecellmediumandvehicle-treated
cellspectra,beforeorfollowingwaterbandsubtraction(Appendix3.4).Additionally,
theeffectsofwaterbandsubtractionwerealsoconsistentwiththeeffectsobservedon
the4-hsamples(Appendix3.2);specifically,theintensityratiooftheamideI/amideII
bands were affected, and the intensity of the ν(C=O) bands at 1743cm−1 and
1715cm−1wereslightlyreduced(Appendix3.4). Aslightshiftinthebandcentresof
the ν(C=O) bands was observed following water band subtraction (Appendix 3.4a
andb);however,nobandshiftwasnotedintherespectivesecondderivativespectra
(Appendix3.5aandb).Littledifferencewasobservedinthesecondderivativespectra
whencomparingthecellmedium-andvehicle-treatedcellswiththeexceptionofthe
line shape of the νas(PO2−) centred at 1240 cm−1 (and shoulder at 1227 cm−1)
(Appendix3.5aandb).Thismightindicatethatthepresenceofvehicleinducessmall
changestothenucleicacidcompositionoftheHCT-8cellsfollowing24-hincubation.
ThePCAscoresplotinFigure4.9a,whichincludestheamideregion(3000–2800cm−1,
and1790–1150cm−1),showedtherewasnodelineationofthe24-hcellmediumand
vehiclescoresalongthePC-1orPC-2axesbetweenthesamplesetssuggestingthatthe
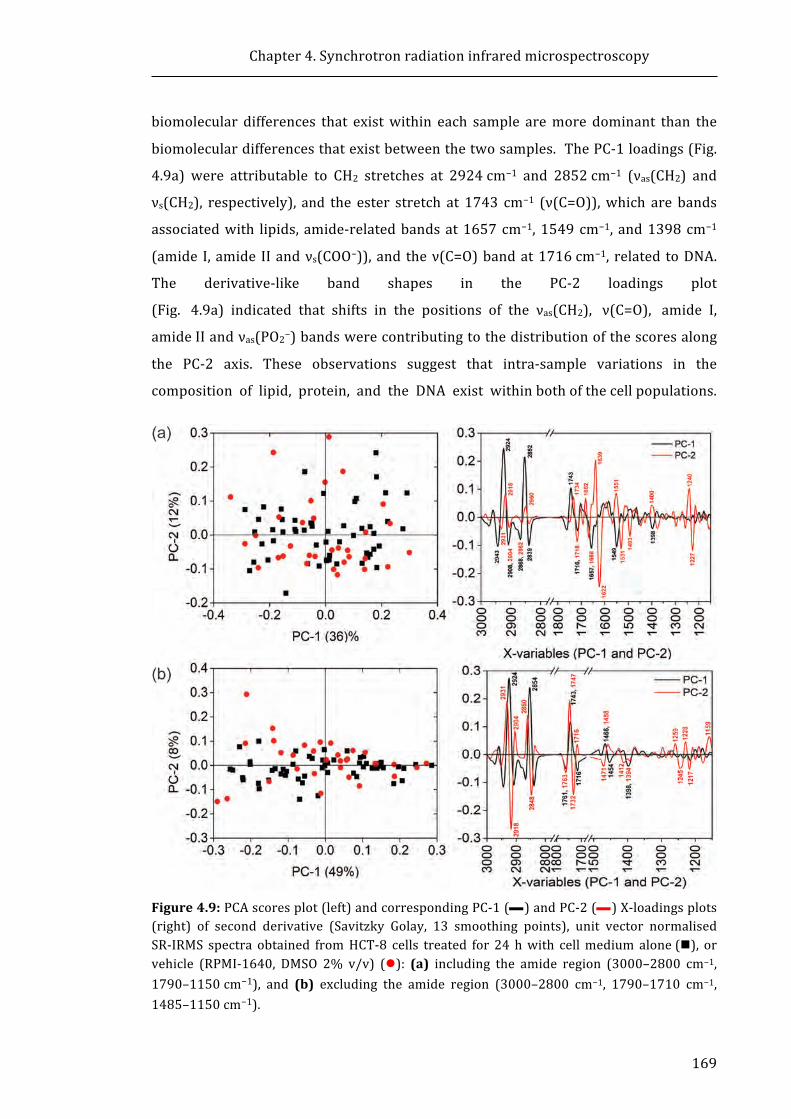
Chapter4.Synchrotronradiationinfraredmicrospectroscopy
169
biomolecular differences that existwithin each sample aremore dominant than the
biomoleculardifferencesthatexistbetweenthetwosamples.ThePC-1loadings(Fig.
4.9a) were attributable to CH2 stretches at 2924cm−1 and 2852cm−1 (νas(CH2) and
νs(CH2), respectively), and the ester stretch at 1743 cm−1 (ν(C=O)),which are bands
associatedwith lipids, amide-relatedbandsat1657cm−1,1549cm−1, and1398cm−1
(amide I,amide IIandνs(COO−)),and theν(C=O)bandat1716cm−1, related toDNA.
The derivative-like band shapes in the PC-2 loadings plot
(Fig.4.9a)indicatedthatshiftsinthepositionsoftheνas(CH2),ν(C=O),amideI,
amideIIandνas(PO2−)bandswerecontributingtothedistributionofthescoresalong
the PC-2 axis. These observations suggest that intra-sample variations in the
compositionoflipid,protein,andtheDNAexistwithinbothofthecellpopulations.
Figure4.9:PCAscoresplot(left)andcorrespondingPC-1(—)andPC-2(—)X-loadingsplots(right) of second derivative (Savitzky Golay, 13 smoothing points), unit vector normalisedSR-IRMS spectra obtained fromHCT-8 cells treated for 24 hwith cellmedium alone(n), orvehicle (RPMI-1640, DMSO 2% v/v) (l): (a) including the amide region (3000–2800 cm−1,1790–1150cm−1), and (b) excluding the amide region (3000–2800 cm−1, 1790–1710 cm−1,1485–1150cm−1).
Chapter4.Synchrotronradiationinfraredmicrospectroscopy
170
Once again, this observation could potentially be attributed to the lack of cell cycle
synchronisation.
Figure 4.9b shows the PCA scores and loadings plots obtained using the cell
medium-,orvehicle-treated(24h)SR-IRMSspectrapresentedinFigure4.9a,butwith
theomissionof theamideregion(1709–1486cm−1). AswithFigure4.9a, thescores
plot showed no sign of delineation of the cell medium or vehicle scores from one
another (Fig.4.9b); again intra-sample variation appeared to be the predominant
sourceofthebiomoleculardifferencesinthesesamples. Intheabsenceoftheamide
region,lipid-relatedbands(2924cm−1(νas(CH2)),2854cm−1(νs(CH2)),and1743cm−1
(ν(C=O))dominatedthePC-1 loadingsplot(Fig.4.9b). Interestingly,omissionof the
amide region resulted in tighter distribution of the scores along the PC-2 axis as
showninthescoresplotinFigure4.9b.Theresults(Fig.4.9aandb)indicatethatthe
strongamideIloadingsmayberesponsibleforthewiderdistributionofscoresalong
the PC-2 axis in the scores plot when the amide region is included (Fig. 4.9a).
Asshown in Figure 4.9b, themost pronounced PC-2 loadingswere the νas(CH2) and
νs(CH2) bands,which appeared as a derivative-like shape, indicative of a band shift.
Someweak PC-2 loadings contributions from the νas(PO2−) band (1259–1217 cm−1)
werealsoevident. Overall, thePCAperformedwithout theamidespresent suggests
that intra-sample lipid variations exist in the cell spectra of the cell medium- and
vehicle-treated samples.Asno separationof the cellmedium-orvehicle-treatedcell
spectra scores is evident, the PCA results suggest that the intra-sample spectral
variationwithin each of these treatment populations is dominant over any spectral
variationsoccurringasaresultofthetwotreatments.
ThePCAresultsappear to suggest thatDMSOhas littleobservableeffecton the
SR-IRMSHCT-8 cell spectra following 24-h incubation, as compared to the SR-IRMS
spectraofHCT-8cellsincubatedwithcellmediumalone.
4.3.2 ComparisonoftheeffectsofBiNSAIDs,andtherespectiveNSAIDs,onSR-
IRMSspectraofliveHCT-8cells
4.3.2.1 Bi(tolf)3-andtolfH-treatedcells(4-htreatment)
The averaged SR-IRMS spectra (29–54 spectra recorded for each treatment) of
vehicle-,Bi(tolf)3-,andtolfH-treatedcellsshowedafewnotabledistinctionsfromeach
other following4-h treatmentas shown inAppendix3.6. Notably, theBi(tolf)3- and
tolfH-treatedaveragecellspectrashowedanincreaseinintensityoftheνas(CH2)and
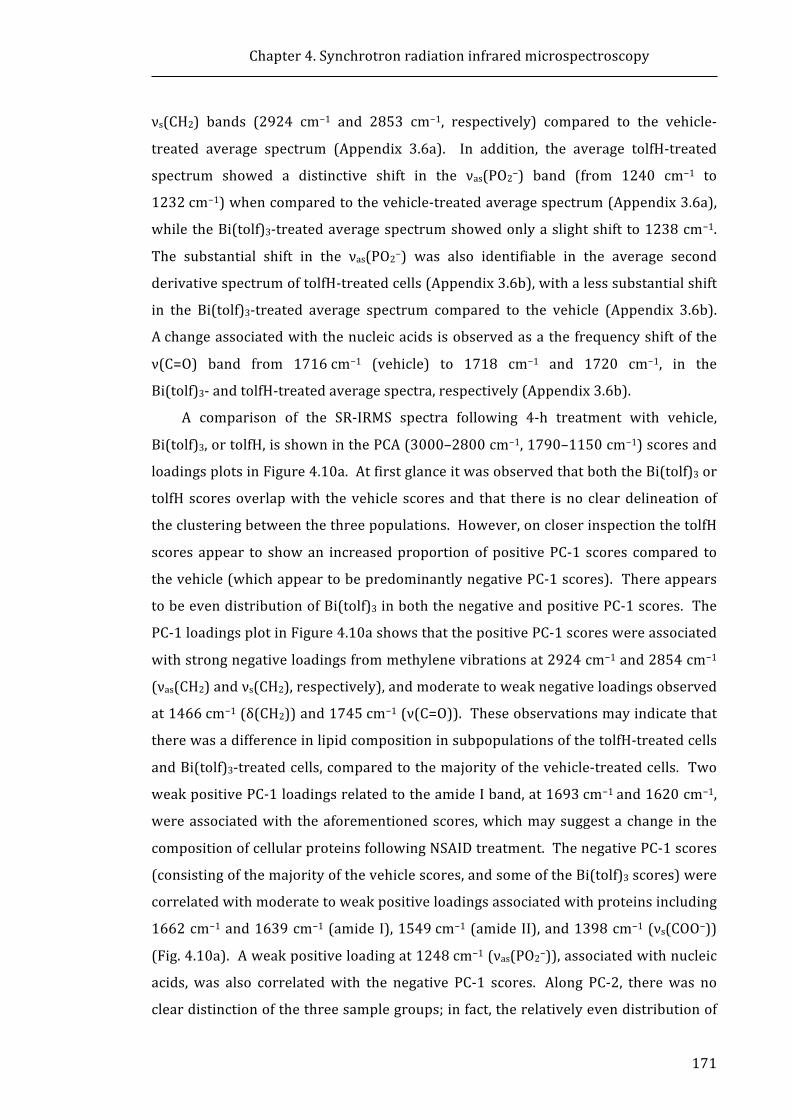
Chapter4.Synchrotronradiationinfraredmicrospectroscopy
171
νs(CH2) bands (2924 cm−1 and 2853 cm−1, respectively) compared to the vehicle-
treated average spectrum (Appendix 3.6a). In addition, the average tolfH-treated
spectrum showed a distinctive shift in the νas(PO2−) band (from 1240 cm−1 to
1232cm−1)whencomparedtothevehicle-treatedaveragespectrum(Appendix3.6a),
whiletheBi(tolf)3-treatedaveragespectrumshowedonlyaslightshift to1238cm−1.
The substantial shift in the νas(PO2−) was also identifiable in the average second
derivativespectrumoftolfH-treatedcells(Appendix3.6b),withalesssubstantialshift
in the Bi(tolf)3-treated average spectrum compared to the vehicle (Appendix 3.6b).
Achangeassociatedwiththenucleicacidsisobservedasathefrequencyshiftofthe
ν(C=O) band from 1716cm−1 (vehicle) to 1718 cm−1 and 1720 cm−1, in the
Bi(tolf)3-andtolfH-treatedaveragespectra,respectively(Appendix3.6b).
A comparison of the SR-IRMS spectra following 4-h treatment with vehicle,
Bi(tolf)3,ortolfH,isshowninthePCA(3000–2800cm−1,1790–1150cm−1)scoresand
loadingsplotsinFigure4.10a.AtfirstglanceitwasobservedthatboththeBi(tolf)3or
tolfHscoresoverlapwith thevehicle scoresand that there isnocleardelineationof
theclusteringbetweenthethreepopulations.However,oncloserinspectionthetolfH
scores appear to showan increasedproportionofpositivePC-1 scores compared to
thevehicle(whichappeartobepredominantlynegativePC-1scores).Thereappears
tobeevendistributionofBi(tolf)3inboththenegativeandpositivePC-1scores.The
PC-1loadingsplotinFigure4.10ashowsthatthepositivePC-1scoreswereassociated
withstrongnegativeloadingsfrommethylenevibrationsat2924cm−1and2854cm−1
(νas(CH2)andνs(CH2),respectively),andmoderatetoweaknegativeloadingsobserved
at1466cm−1(δ(CH2))and1745cm−1(ν(C=O)).Theseobservationsmayindicatethat
therewasadifferenceinlipidcompositioninsubpopulationsofthetolfH-treatedcells
andBi(tolf)3-treatedcells,comparedtothemajorityofthevehicle-treatedcells. Two
weakpositivePC-1loadingsrelatedtotheamideIband,at1693cm−1and1620cm−1,
wereassociatedwith theaforementionedscores,whichmaysuggestachange in the
compositionofcellularproteinsfollowingNSAIDtreatment.ThenegativePC-1scores
(consistingofthemajorityofthevehiclescores,andsomeoftheBi(tolf)3scores)were
correlatedwithmoderatetoweakpositiveloadingsassociatedwithproteinsincluding
1662cm−1and1639cm−1(amideI),1549cm−1(amideII),and1398cm−1(νs(COO−))
(Fig.4.10a).Aweakpositiveloadingat1248cm−1(νas(PO2−)),associatedwithnucleic
acids, was also correlatedwith the negative PC-1 scores. Along PC-2, therewas no
cleardistinctionofthethreesamplegroups;infact,therelativelyevendistributionof
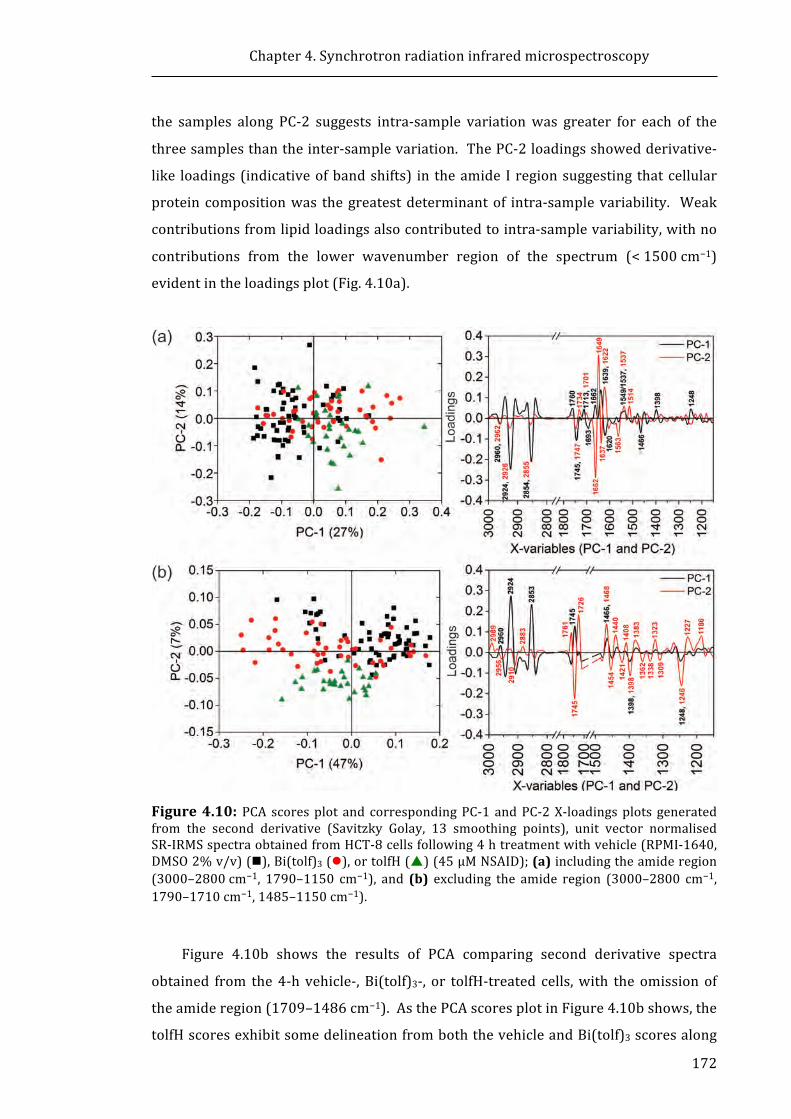
Chapter4.Synchrotronradiationinfraredmicrospectroscopy
172
the samples along PC-2 suggests intra-sample variationwas greater for each of the
threesamplesthantheinter-samplevariation.ThePC-2loadingsshowedderivative-
like loadings(indicativeofbandshifts) in theamide Iregionsuggesting thatcellular
proteincompositionwas thegreatestdeterminantof intra-samplevariability. Weak
contributionsfromlipidloadingsalsocontributedtointra-samplevariability,withno
contributions from the lower wavenumber region of the spectrum (<1500cm−1)
evidentintheloadingsplot(Fig.4.10a).
Figure4.10: PCA scoresplot and correspondingPC-1 andPC-2X-loadingsplots generatedfrom the second derivative (Savitzky Golay, 13 smoothing points), unit vector normalisedSR-IRMSspectraobtainedfromHCT-8cellsfollowing4htreatmentwithvehicle(RPMI-1640,DMSO2%v/v)(n),Bi(tolf)3(l),ortolfH(p)(45μMNSAID);(a)includingtheamideregion(3000–2800cm−1, 1790–1150 cm−1), and (b) excluding the amide region (3000–2800 cm−1,1790–1710cm−1,1485–1150cm−1).
Figure 4.10b shows the results of PCA comparing second derivative spectra
obtained from the4-h vehicle-,Bi(tolf)3-, or tolfH-treated cells,with theomissionof
theamideregion(1709–1486cm−1).AsthePCAscoresplotinFigure4.10bshows,the
tolfHscoresexhibitsomedelineationfromboththevehicleandBi(tolf)3scoresalong
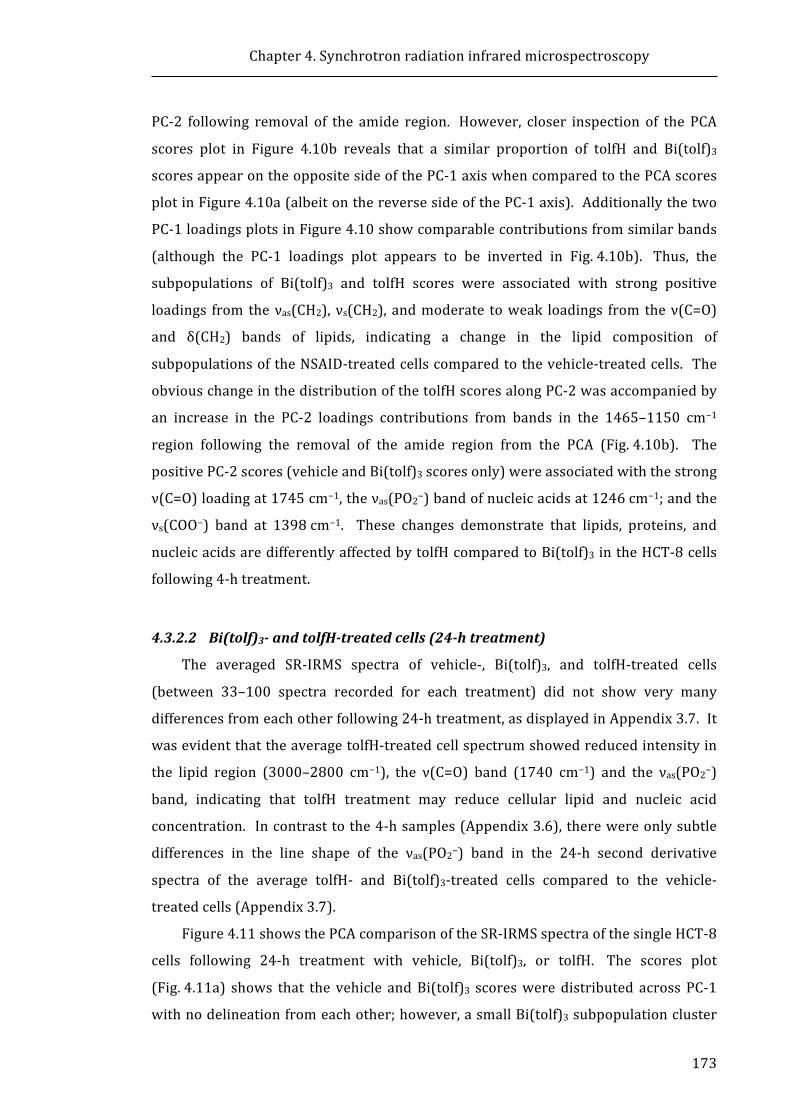
Chapter4.Synchrotronradiationinfraredmicrospectroscopy
173
PC-2 following removal of the amide region. However, closer inspection of the PCA
scores plot in Figure 4.10b reveals that a similar proportion of tolfH and Bi(tolf)3
scoresappearontheoppositesideofthePC-1axiswhencomparedtothePCAscores
plotinFigure4.10a(albeitonthereversesideofthePC-1axis).Additionallythetwo
PC-1loadingsplotsinFigure4.10showcomparablecontributionsfromsimilarbands
(although the PC-1 loadings plot appears to be inverted in Fig.4.10b). Thus, the
subpopulations of Bi(tolf)3 and tolfH scores were associated with strong positive
loadings from theνas(CH2), νs(CH2), andmoderate toweak loadings from theν(C=O)
and δ(CH2) bands of lipids, indicating a change in the lipid composition of
subpopulationsoftheNSAID-treatedcellscomparedtothevehicle-treatedcells. The
obviouschangeinthedistributionofthetolfHscoresalongPC-2wasaccompaniedby
an increase in the PC-2 loadings contributions from bands in the 1465–1150 cm−1
region following the removal of the amide region from the PCA (Fig.4.10b). The
positivePC-2scores(vehicleandBi(tolf)3scoresonly)wereassociatedwiththestrong
ν(C=O)loadingat1745cm−1,theνas(PO2−)bandofnucleicacidsat1246cm−1;andthe
νs(COO−) band at 1398cm−1. These changes demonstrate that lipids, proteins, and
nucleicacidsaredifferentlyaffectedbytolfHcomparedtoBi(tolf)3intheHCT-8cells
following4-htreatment.
4.3.2.2 Bi(tolf)3-andtolfH-treatedcells(24-htreatment)
The averaged SR-IRMS spectra of vehicle-, Bi(tolf)3, and tolfH-treated cells
(between 33–100 spectra recorded for each treatment) did not show very many
differencesfromeachotherfollowing24-htreatment,asdisplayedinAppendix3.7.It
wasevidentthattheaveragetolfH-treatedcellspectrumshowedreducedintensityin
the lipid region (3000–2800 cm−1), the ν(C=O) band (1740 cm−1) and the νas(PO2−)
band, indicating that tolfH treatment may reduce cellular lipid and nucleic acid
concentration. Incontrasttothe4-hsamples(Appendix3.6),therewereonlysubtle
differences in the line shape of the νas(PO2−) band in the 24-h second derivative
spectra of the average tolfH- and Bi(tolf)3-treated cells compared to the vehicle-
treatedcells(Appendix3.7).
Figure4.11showsthePCAcomparisonoftheSR-IRMSspectraofthesingleHCT-8
cells following 24-h treatment with vehicle, Bi(tolf)3, or tolfH. The scores plot
(Fig.4.11a) shows that the vehicle andBi(tolf)3 scoresweredistributed acrossPC-1
withnodelineationfromeachother;however,asmallBi(tolf)3subpopulationcluster
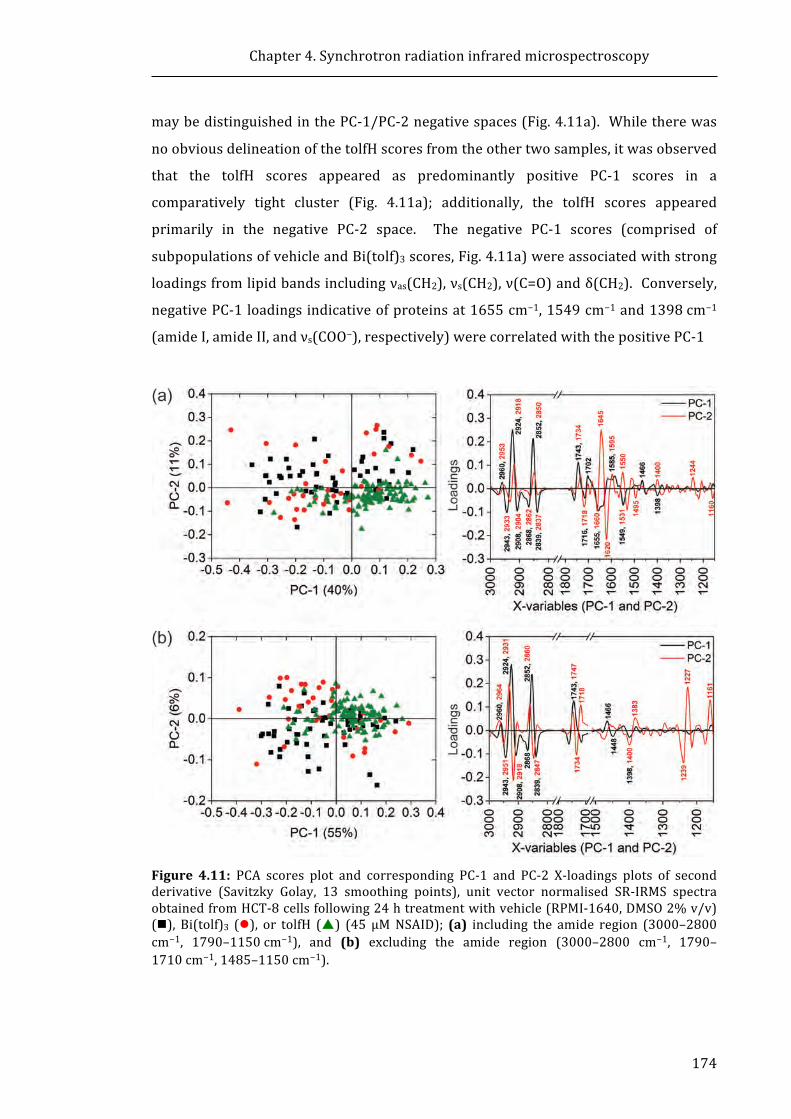
Chapter4.Synchrotronradiationinfraredmicrospectroscopy
174
maybedistinguishedinthePC-1/PC-2negativespaces(Fig.4.11a). Whiletherewas
noobviousdelineationofthetolfHscoresfromtheothertwosamples,itwasobserved
that the tolfH scores appeared as predominantly positive PC-1 scores in a
comparatively tight cluster (Fig. 4.11a); additionally, the tolfH scores appeared
primarily in the negative PC-2 space. The negative PC-1 scores (comprised of
subpopulationsofvehicleandBi(tolf)3scores,Fig.4.11a)wereassociatedwithstrong
loadingsfromlipidbandsincludingνas(CH2),νs(CH2),ν(C=O)andδ(CH2).Conversely,
negativePC-1loadingsindicativeofproteinsat1655cm−1,1549cm−1and1398cm−1
(amideI,amideII,andνs(COO−),respectively)werecorrelatedwiththepositivePC-1
Figure 4.11: PCA scores plot and corresponding PC-1 and PC-2 X-loadings plots of secondderivative (Savitzky Golay, 13 smoothing points), unit vector normalised SR-IRMS spectraobtainedfromHCT-8cellsfollowing24htreatmentwithvehicle(RPMI-1640,DMSO2%v/v)(n), Bi(tolf)3 (l), or tolfH (p) (45 μMNSAID); (a) including the amide region (3000–2800cm−1, 1790–1150cm−1), and (b) excluding the amide region (3000–2800 cm−1, 1790–1710cm−1,1485–1150cm−1).
Chapter4.Synchrotronradiationinfraredmicrospectroscopy
175
scores(comprisedofa largetolfHpopulation,Fig.4.11a). Theseresultssuggestthat
treatmentwithtolfHresultsinlipidandproteinchanges.ThePC-2loadingsplot
showedthatthemajorityofthetolfHscoresandtheBi(tolf)3subpopulationofscores
inthenegativePC-2spacewereassociatedwiththeνas(CH2),νs(CH2)andν(C=O)lipid-
relatedbands(Fig.4.11a).Thederivative-likeshiftintheamideIandamideIIbands
ofthePC-2loadingsplot(Fig.4.11a)suggeststhereisabandshiftbetweenthetreated
populationsinthePC-2negativespaceandthevehicle(andsomeBi(tolf)3scores)in
thePC-2positivespace.
Asshowninthescoresplot inFigure4.11b, therelativelytightclusteringof the
tolfH scores was still apparent following the removal of the amide region (1709–
1486cm−1)fromPCA.TheBi(tolf)3subpopulationcouldalsobeidentifiedinthePC-1
negative/PC-2 positive space (Fig. 4.11b). Again, strong lipid loadings arising from
νas(CH2), νs(CH2), ν(C=O), and δ(CH2) bands (2924 cm−1, 2852 cm−1, 1743 cm−1, and
1466cm−1,respectively)wereobservedandassociatedwiththePC-1negativescores
(comprised of subpopulations of vehicle and Bi(tolf)3 scores) in Figure 4.11b. The
removalof theamideregionfromthePCAincreasedthe intensityof thenucleicacid
(νas(PO2−)) PC-2 loadings at 1239 cm−1 and 1227 cm−1 and the lipid-related
νas(CO−O−C)loadingat1160cm−1(Fig.4.11b).Derivative-likeloadingswereobserved
inthePC-2loadingsfortheνas(CH2)andνs(CH2)lipid-relatedbandswhentheamides
were omitted (Fig. 4.11b), in contrast to the non-derivative bands in Figure 4.11a.
These observations suggest the lipid and nucleic acid SR-IRMS signatures of these
BiNSAID-andNSAID-treatedsubpopulationsdifferedfromthemajorityofthevehicle-
treatedcellspectrafollowing24-htreatment.
4.3.2.3 Bi(mef)3-andmefH-treatedcells(4-htreatment)
The averaged SR-IRMS spectra of vehicle-, Bi(mef)3, and mefH-treated cells
(between 42–83 spectra recorded for each treatment) showed some differences
following 4-h treatment as shown inAppendix 3.8. When compared to the average
vehicle-treated cell spectrum, the average Bi(mef)3-treated spectrum showed a
slightly increased intensity in the lipid region (3000–2800 cm−1) and the νas(PO2−),
whereas the average mefH-treated spectrum showed the opposite trend
(Appendix3.8a).However,theaveragesecondderivativespectraoftheBi(mef)3-and
mefH-treatedcellsshowedvery littlevariation in lineshapewhencomparedtoeach
other (Appendix3.8b); additionally, both the mefH and Bi(mef)3-treated average
Chapter4.Synchrotronradiationinfraredmicrospectroscopy
176
spectrashowedthesamevariationinthelineshapeoftheδ(CH2)andνas(PO2−)bands
whencomparedtotheaveragevehicle-treatedspectrum(Appendix3.8b).
Figure 4.12a shows the PCA scores plot comparison of the SR-IRMS spectra
(3000–2800cm−1,1790–1150cm−1)ofsingleHCT-8cellsfollowing4-htreatmentwith
vehicle, Bi(mef)3, or mefH. There was no clear delineation observed between the
vehicle,Bi(mef)3 andmefH scorepopulations;however, themajorityof theBi(mef)3
and mefH PC-1 scores were positive, whereas the vehicle PC-1 scores were
predominantlynegative(Fig.4.12a).ThePC-1loadingsplot(Fig.4.12a)indicatedthat
the majority of the Bi(mef)3 and mefH scores are associated with strong loadings
arising from the νas(CH2), νs(CH2), and νas(C=O) bands (2924 cm−1, 2852 cm−1, and
1743cm−1, respectively), which may indicate that differences between the
mefH/Bi(mef)3-treatedcellsandthevehicle-treatedcellswereattributedto the lipid
bands. Conversely, the PC-1 scores primarily associated with vehicle-treated cells
were correlatedwith loadings attributed to amide I, amide II andνs(COO−)bandsof
proteins at 1637cm−1, 1533cm−1, and 1396 cm−1, respectively (Fig. 4.12a). The
relativelyevendistributionofthescoresofallthreesamplesacrossthenegativeand
positive PC-2 space suggests that intra-sample variation was dominant over inter-
sample variation. Moderate PC-2 loadings attributable to lipids (2926 cm−1, 2854
cm−1, and 1745 cm−1) and strong derivative-like amide I loadings (1660 cm−1, 1647
cm−1,and1635cm−1)suggestvariationinthelipidcompositionandproteinstructure
inthepopulationsofeachofthethreecellgroups.
AsshowninFigure4.12b,thePCAwasperformedwiththeomissionoftheamide
region (1709–1486cm−1) on the same SR-IRMS spectra analysed in Figure 4.12a.
Notably, inFigure4.12bthevehiclescoresclusterwasalmostseparatedfromthatof
the Bi(mef)3 and mefH scores, which were completely overlapped. A higher
proportion of vehicle PC-1 scoreswere positive, while the higher proportion of the
Bi(mef)3andmefHPC-1scoreswerenegative;however,someintra-samplevariation
wasevidentinPC-1,asindicatedbythespreadofthethreeseparatepopulationsover
thenegativeandpositivesidesofthePC-1space.AsshowninthePC-1loadingsplot
in Figure 4.12b, themajority of theBi(mef)3 andmefHPC-1 scoreswere associated
withstrongloadingsarisingfromtheνas(CH2),νs(CH2),andν(C=O)lipid-relatedbands,
similar to the results of the PCA inclusive of the amides (Fig. 4.12a). In the PC-2
loadingsplot(Fig.4.12b) itwasobservedthat theremovalof theamideregion from
thePCAincreasedtheintensityofthenucleicacidνas(PO2−)loadingsat1244cm−1and
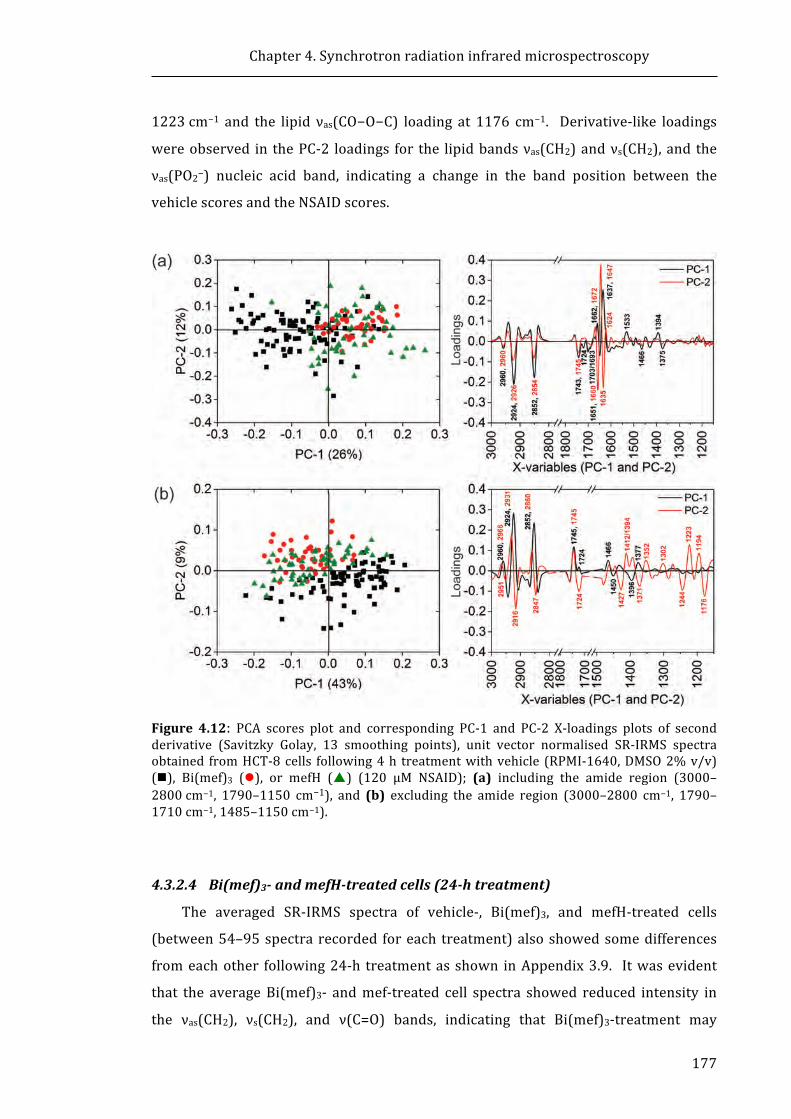
Chapter4.Synchrotronradiationinfraredmicrospectroscopy
177
1223cm−1 and the lipid νas(CO−O−C) loading at 1176 cm−1. Derivative-like loadings
wereobserved in thePC-2 loadings for the lipidbandsνas(CH2)andνs(CH2),and the
νas(PO2−) nucleic acid band, indicating a change in the band position between the
vehiclescoresandtheNSAIDscores.
Figure 4.12: PCA scores plot and corresponding PC-1 and PC-2 X-loadings plots of secondderivative (Savitzky Golay, 13 smoothing points), unit vector normalised SR-IRMS spectraobtained fromHCT-8cells following4h treatmentwithvehicle (RPMI-1640,DMSO2%v/v)(n), Bi(mef)3 (l), or mefH (p) (120 μM NSAID); (a) including the amide region (3000–2800cm−1, 1790–1150 cm−1), and (b) excluding the amide region (3000–2800 cm−1, 1790–1710cm−1,1485–1150cm−1).
4.3.2.4 Bi(mef)3-andmefH-treatedcells(24-htreatment)
The averaged SR-IRMS spectra of vehicle-, Bi(mef)3, and mefH-treated cells
(between54–95spectrarecorded foreach treatment)alsoshowedsomedifferences
fromeachother following24-h treatmentasshown inAppendix3.9. Itwasevident
that the averageBi(mef)3- andmef-treated cell spectra showed reduced intensity in
the νas(CH2), νs(CH2), and ν(C=O) bands, indicating that Bi(mef)3-treatment may

Chapter4.Synchrotronradiationinfraredmicrospectroscopy
178
reduce cellular lipid concentrations (Appendix 3.9a). Additionally, therewere some
variations in the line shape of the νas(PO2−) band in the average second derivative
spectra of the mefH- and Bi(mef)3-treated cells (Appendix 3.9b) compared to the
vehicle-treatedcells.
A comparison of the SR-IRMS spectra of the single HCT-8 cells following 24-h
treatment with vehicle, Bi(mef)3, or mefH, is shown in the PCA scores plot in
Figure4.13a (examining the 3000–2800 cm−1 and 1790–1150 cm−1 regions). The
majority of the Bi(mef)3 scores appear in the negative PC-1 space and show some
delineation from the vehicle scores; however, the mefH scores appear to be
distributed across the positive and negative PC-1 space, overlapping with both the
Bi(mef)3scores,andsomeofthevehiclescores.
Figure 4.13: PCA scores plot and corresponding PC-1 and PC-2 X-loadings plots of secondderivative (Savitzky Golay, 13 smoothing points), unit vector normalised SR-IRMS spectraobtainedfromHCT-8cellsfollowing24htreatmentwithvehicle(RPMI-1640,DMSO2%v/v)(n), Bi(mef)3 (l), or mefH (p) (120 μM NSAID); (a) including the amide region (3000–2800cm−1, 1790–1150 cm−1), and (b) excluding the amide region (3000–2800 cm−1, 1790–1710cm−1,1485–1150cm−1).
Chapter4.Synchrotronradiationinfraredmicrospectroscopy
179
The PC-1 loadings plot shows that νas(CH2), νs(CH2), and νas(C=O) lipid-related
loadingsat2924cm−1,2854cm−1and1743cm−1,respectively,areassociatedwiththe
vehicleandaproportionof themefHscoresonthepositivePC-1scores. Thestrong
loadingoriginated from the amide I band at 1637cm−1 andwas associatedwith the
Bi(mef)3, negative PC-1 scores. Intra-sample variation was observed along PC-2,
resulting from moderate lipid loadings, and strong amide I and amide II protein
loadings.
AsshowninFigure4.13b,thePCAwasperformedwiththeomissionoftheamide
region(1709–1486cm−1)onthesameSR-IRMSspectraanalysedinFigure4.13a.The
majorityoftheBi(mef)3scoresappearinthepositivePC-1spacewithasmallnumber
extending into thenegativePC-1space thatoverlapswith thevehicle scores. Again,
themefHscoresappeartobedistributedacrossthepositiveandnegativePC-1space,
overlappingwithboth thepositiveBi(mef)3scores,andsomeof thenegativevehicle
scores.SimilarlytotheamideinclusivePCA(Fig.4.13b),thePC-1loadingsplotshows
that lipid loadings at 2924 cm−1, 2854 cm−1 and 1743 cm−1 are associatedwith the
vehicleandthesmallproportionoftheBi(mef)3andmefHscoresonthepositivePC-1
scores. With the omission of the amide region, the PC-2 loadings plot has some
obviousdifferencestotheamideinclusivePC-2loadingsplot.Specifically,theνas(CH2)
andνs(CH2)bandsarenowderivative-likeinshape,indicatingabandshiftwithineach
sample. Additionally, the intensity of the νas(PO2−) loadings at 1240cm−1 and
1228cm−1,andtheνas(CO−O−C)loadingsat1184cm−1and1158cm−1wereincreased.
4.3.2.5 Bi(difl)3-anddiflH-treatedcells(4-htreatment)
AsshowninAppendix3.10,theaveragedBi(difl)3-anddiflH-treatedcellspectra
showedadecreaseintheintensityoftheνas(CH2)andνs(CH2)bands(2624cm−1and
2952cm−1)andlackofdefinitionoftheν(C=O)bandat1745cm−1(particularlyinthe
case of diflH). The averaged Bi(difl)3-treated second derivative spectrum showed
substantialdifferencesintheδ(CH2)andνas(PO2−)bandsat1466cm−1and1248cm−1,
respectively, compared to both the averaged vehicle- and diflH-treated second
derivative spectra (Appendix 3.10b). Also evident was the appearance of a slight
shoulder on the amide I band of the diflH-treated average second derivative
spectrum(Appendix3.10b).
Individual secondderivative spectraofvehicle-,Bi(difl)3- anddiflH-treatedcells
wereexaminedusingPCA,andtheresultingscoresandloadingsplots(examiningthe
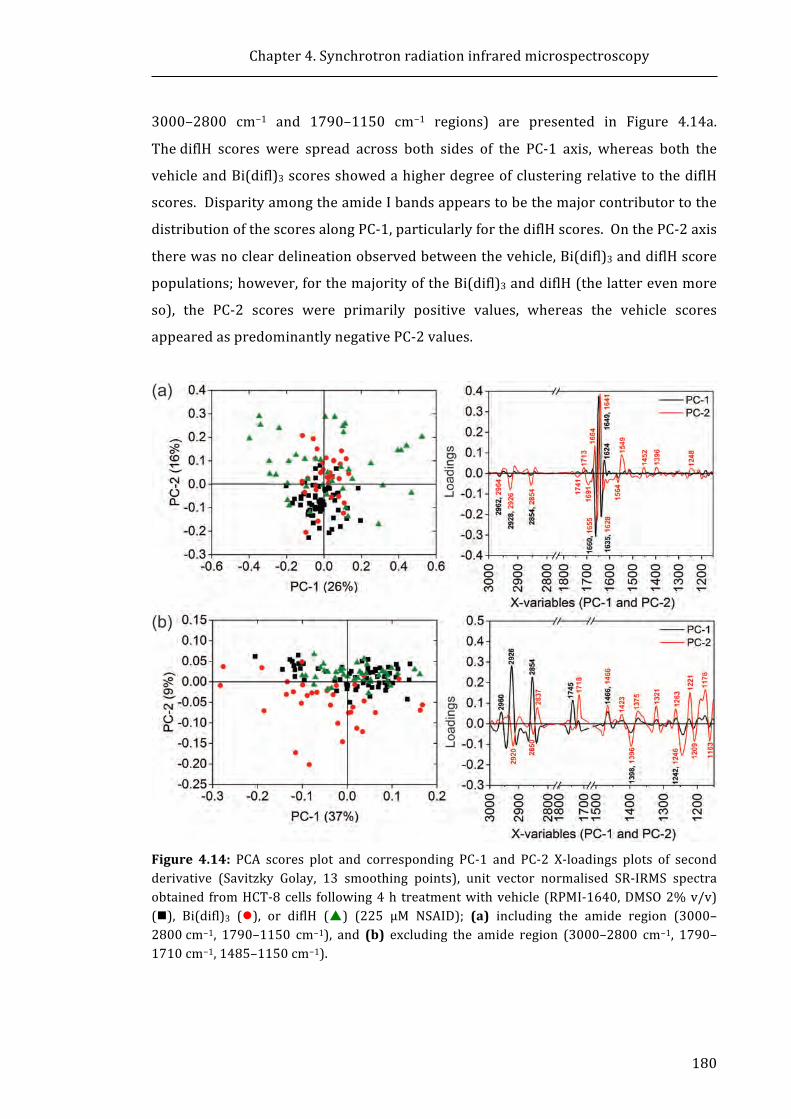
Chapter4.Synchrotronradiationinfraredmicrospectroscopy
180
3000–2800 cm−1 and 1790–1150 cm−1 regions) are presented in Figure 4.14a.
ThediflH scores were spread across both sides of the PC-1 axis, whereas both the
vehicleandBi(difl)3scoresshowedahigherdegreeofclusteringrelativetothediflH
scores.DisparityamongtheamideIbandsappearstobethemajorcontributortothe
distributionofthescoresalongPC-1,particularlyforthediflHscores.OnthePC-2axis
therewasnocleardelineationobservedbetweenthevehicle,Bi(difl)3anddiflHscore
populations;however,forthemajorityoftheBi(difl)3anddiflH(thelatterevenmore
so), the PC-2 scores were primarily positive values, whereas the vehicle scores
appearedaspredominantlynegativePC-2values.
Figure 4.14: PCA scores plot and corresponding PC-1 and PC-2 X-loadings plots of secondderivative (Savitzky Golay, 13 smoothing points), unit vector normalised SR-IRMS spectraobtained fromHCT-8cells following4h treatmentwithvehicle (RPMI-1640,DMSO2%v/v)(n), Bi(difl)3 (l), or diflH (p) (225 μM NSAID); (a) including the amide region (3000–2800cm−1, 1790–1150 cm−1), and (b) excluding the amide region (3000–2800 cm−1, 1790–1710cm−1,1485–1150cm−1).
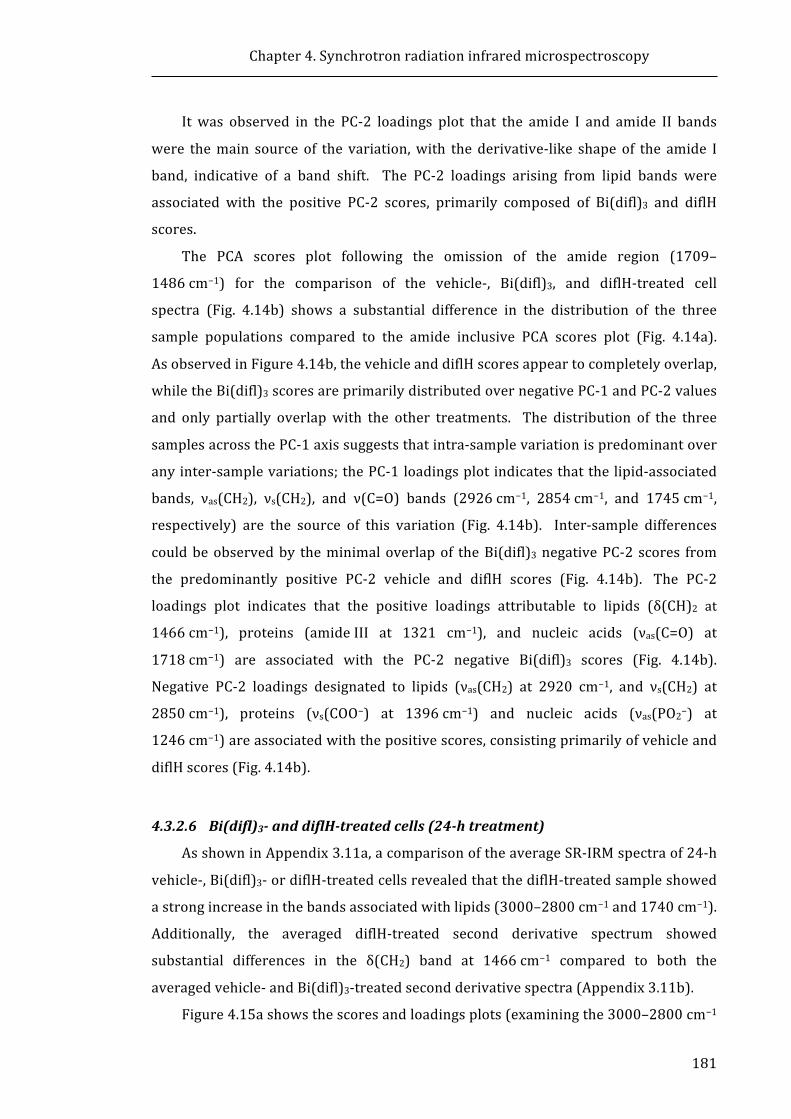
Chapter4.Synchrotronradiationinfraredmicrospectroscopy
181
It was observed in the PC-2 loadings plot that the amide I and amide II bands
were themain source of the variation,with thederivative-like shape of the amide I
band, indicative of a band shift. The PC-2 loadings arising from lipid bands were
associated with the positive PC-2 scores, primarily composed of Bi(difl)3 and diflH
scores.
The PCA scores plot following the omission of the amide region (1709–
1486cm−1) for the comparison of the vehicle-, Bi(difl)3, and diflH-treated cell
spectra(Fig. 4.14b) shows a substantial difference in the distribution of the three
sample populations compared to the amide inclusive PCA scores plot (Fig. 4.14a).
AsobservedinFigure4.14b,thevehicleanddiflHscoresappeartocompletelyoverlap,
whiletheBi(difl)3scoresareprimarilydistributedovernegativePC-1andPC-2values
and only partially overlapwith the other treatments. The distribution of the three
samplesacrossthePC-1axissuggeststhatintra-samplevariationispredominantover
anyinter-samplevariations;thePC-1loadingsplotindicatesthatthelipid-associated
bands, νas(CH2), νs(CH2), and ν(C=O) bands (2926cm−1, 2854cm−1, and 1745cm−1,
respectively) are the source of this variation (Fig. 4.14b). Inter-sample differences
couldbeobservedby theminimaloverlapof theBi(difl)3negativePC-2 scores from
the predominantly positive PC-2 vehicle and diflH scores (Fig. 4.14b). The PC-2
loadings plot indicates that the positive loadings attributable to lipids (δ(CH)2 at
1466cm−1), proteins (amideIII at 1321 cm−1), and nucleic acids (νas(C=O) at
1718cm−1) are associated with the PC-2 negative Bi(difl)3 scores (Fig. 4.14b).
Negative PC-2 loadings designated to lipids (νas(CH2) at 2920 cm−1, and νs(CH2) at
2850cm−1), proteins (νs(COO−) at 1396cm−1) and nucleic acids (νas(PO2−) at
1246cm−1)areassociatedwiththepositivescores,consistingprimarilyofvehicleand
diflHscores(Fig.4.14b).
4.3.2.6 Bi(difl)3-anddiflH-treatedcells(24-htreatment)
AsshowninAppendix3.11a,acomparisonoftheaverageSR-IRMspectraof24-h
vehicle-,Bi(difl)3-ordiflH-treatedcellsrevealedthatthediflH-treatedsampleshowed
astrongincreaseinthebandsassociatedwithlipids(3000–2800cm−1and1740cm−1).
Additionally, the averaged diflH-treated second derivative spectrum showed
substantial differences in the δ(CH2) band at 1466cm−1 compared to both the
averagedvehicle-andBi(difl)3-treatedsecondderivativespectra(Appendix3.11b).
Figure4.15ashowsthescoresandloadingsplots(examiningthe3000–2800cm−1
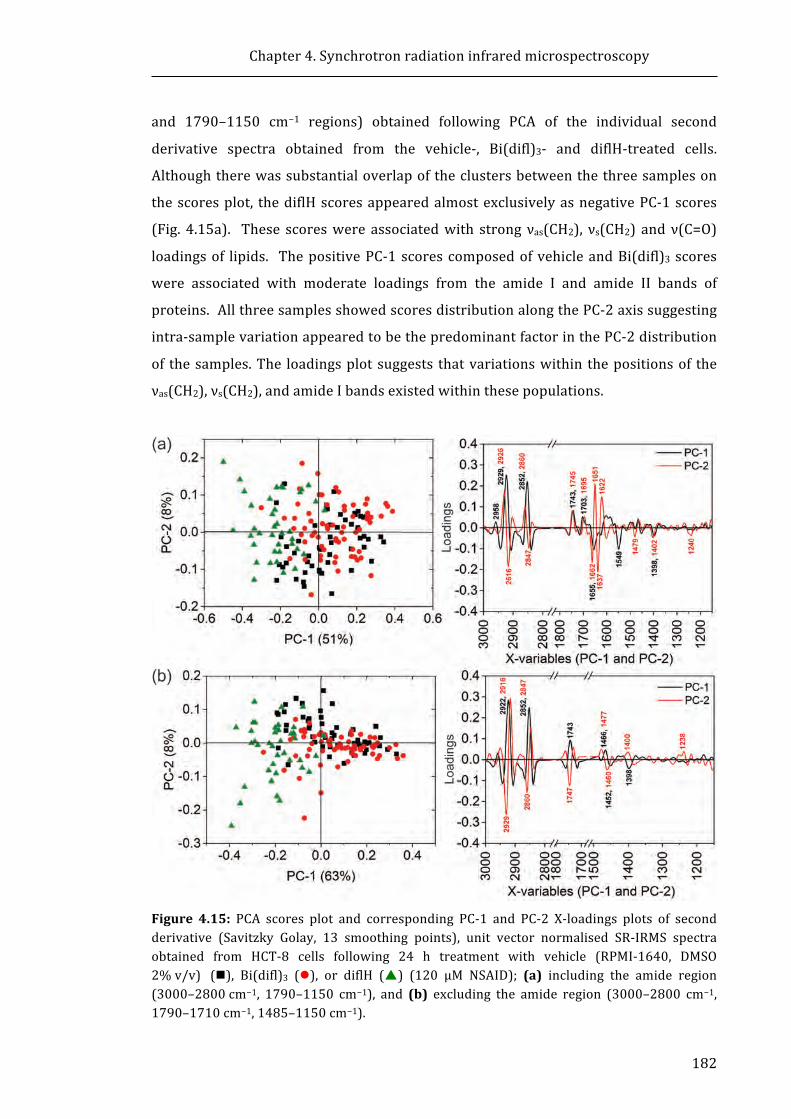
Chapter4.Synchrotronradiationinfraredmicrospectroscopy
182
and 1790–1150 cm−1 regions) obtained following PCA of the individual second
derivative spectra obtained from the vehicle-, Bi(difl)3- and diflH-treated cells.
Althoughtherewassubstantialoverlapoftheclustersbetweenthethreesampleson
thescoresplot, thediflHscoresappearedalmostexclusivelyasnegativePC-1scores
(Fig. 4.15a). These scoreswere associatedwith strong νas(CH2), νs(CH2) and ν(C=O)
loadingsof lipids. ThepositivePC-1scorescomposedofvehicleandBi(difl)3 scores
were associated with moderate loadings from the amide I and amide II bands of
proteins.AllthreesamplesshowedscoresdistributionalongthePC-2axissuggesting
intra-samplevariationappearedtobethepredominantfactorinthePC-2distribution
of thesamples.The loadingsplotsuggests thatvariationswithin thepositionsof the
νas(CH2),νs(CH2),andamideIbandsexistedwithinthesepopulations.
Figure 4.15: PCA scores plot and corresponding PC-1 and PC-2 X-loadings plots of secondderivative (Savitzky Golay, 13 smoothing points), unit vector normalised SR-IRMS spectraobtained from HCT-8 cells following 24 h treatment with vehicle (RPMI-1640, DMSO2%v/v) (n), Bi(difl)3 (l), or diflH (p) (120 μM NSAID); (a) including the amide region(3000–2800cm−1, 1790–1150 cm−1), and (b) excluding the amide region (3000–2800 cm−1,1790–1710cm−1,1485–1150cm−1).

Chapter4.Synchrotronradiationinfraredmicrospectroscopy
183
The PCA results obtained following omission of the amide region (1709–
1486cm−1) from the vehicle, Bi(difl)3 and diflH SR-IRMS spectra are presented in
Figure4.15b.SimilartoFigure4.15a,thediflHscoresappearedalmostexclusivelyas
PC-1 negative scores and remained associatedwith strong positive loadings arising
from lipids (νas(CH2), νs(CH2) and ν(C=O)). As was also observed in Figure 4.15a,
intra-samplevariationappearedtobethepredominantfactorinthedistributionofthe
samples across PC-2; the loadings plot (Fig. 4.15b) indicated that this resulted from
variations within the positions of νas(CH2), νs(CH2) and ν(C=O) bands within the
samples.Relativelylittlechangewasobservedfromtheloadingscontributionsinthe
1485–1150cm−1regionwhencomparing theamide inclusiveoramideomittedPC-1
and PC-2 loadings plots (Fig. 4.15a and Fig. 4.15b, respectively). The scores plots
indicatethat24-hincubationwithdiflHproducesbiomoleculareffects inHCT-8cells
which are relatively distinct from Bi(difl)3- and vehicle-treated cells and appear to
result from lipid-related differences. However, no significant differences were
observed for the Bi(difl)3-treated SR-IRM spectra when compared to the vehicle-
treatedSR-IRMspectra.
4.3.2.7 Summary of the IR spectral and PCA differences following BiNSAID and
NSAIDtreatment
The results described in Sections 4.3.2.1–4.3.2.6 have been summarised in
Table4.3 for ease of reference in the Discussion (Section 4.4). Briefly, the key
observationsemanatingfromtheanalysisoftheSR-IRMSstudiesinclude:
(i) TolfH treatment (4 h and 24 h) of HCT-8 cells predominantly resulted in
changestothelipidbandsandpossiblytheamidebands.
(ii)Bi(tolf)3treatment(4h)causedsomechangeinlipids;however,theeffectwas
less pronounced compared to tolfH. Additionally, the tolfH spectra were
distinguishable fromBi(tolf)3 and vehicle scores due to a change in lipids. The
24-htreatmentresultedinBi(tolf)3scoresthatwerewidelyscattered(compared
tothevehicleandtolfHscores)andpopulatedareasofvehicleandtolfHscores.
(iii) MefH and Bi(mef)3 treatment (4 h and 24 h) induced variation in the
spectrumofHCT-8 cells compared to vehicle-treated cells,whichwasprimarily
attributedtoaneffectonlipids.TheresponsebetweenmefHandBi(mef)3could
notbedistinguishedasthescoreswereoverlapped.
Chapter4.Synchrotronradiationinfraredmicrospectroscopy
184
(iv) DiflH treatment (4 h) induced a difference in the spectrum of HCT-8 cells
comparedtovehicle,whichwasprimarilyattributedtoaneffectonamidesinthe
amide inclusive PCA. When the amide bands were omitted from the PCA, no
distinctionwasobservedbetweenthediflH-andvehicle-treatedcells. Following
24-h treatment, diflH induced a difference in the spectrum of HCT-8 cells
comparedtovehiclethatwasduetoanincreaseintheintensityofthelipidbands.
(v)PCAoftheamideinclusivespectrasuggestedtherewasnodifferencebetween
vehicleandBi(difl)3scores(4h).However,whentheamideswereomittedfrom
the PCA, 4-h Bi(difl)3 treatment induced a difference in the spectrum of HCT-8
cells compared to vehicle/diflH, whichwas primarily attributed to an effect on
lipids. PCA suggests there was no difference between the 24-h vehicle and
Bi(difl)3scores,andindicatedBi(difl)3hadadifferenteffecttodiflHatthechosen
treatmentconcentrations.
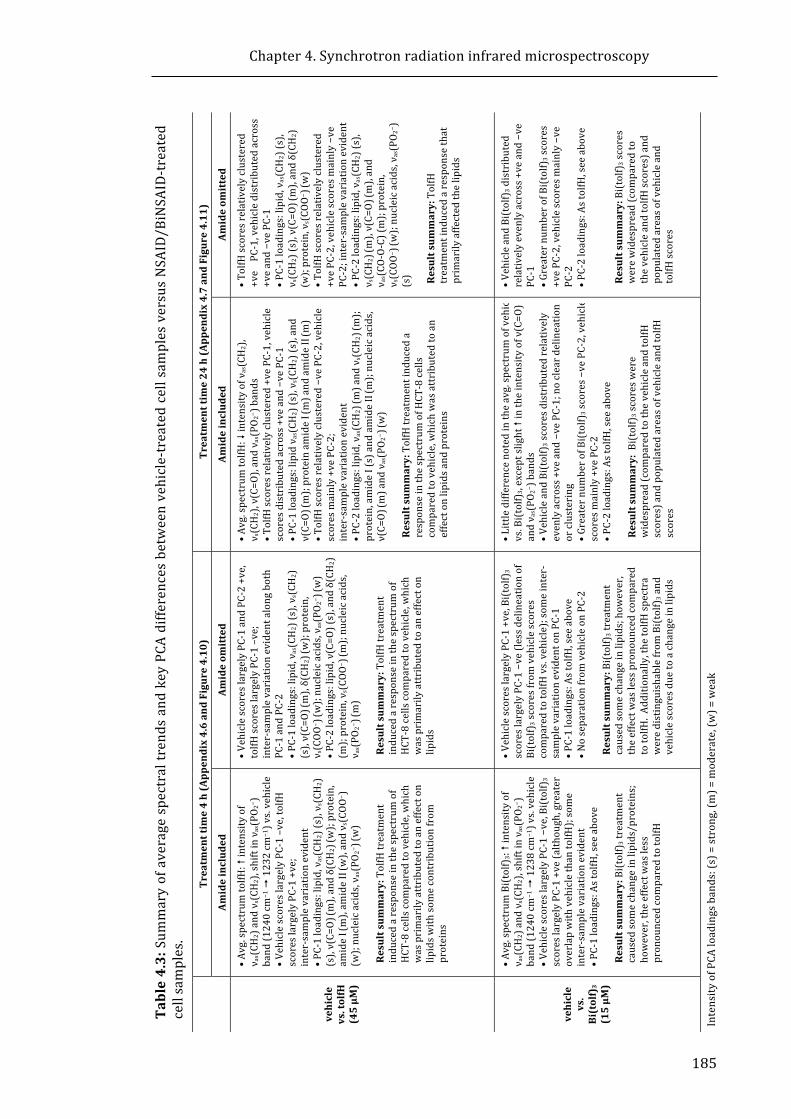
Chapter4.Synchrotronradiationinfraredmicrospectroscopy
185
Table4.3:Sum
maryofaveragespectraltrendsandkeyPCAdifferencesbetweenvehicle-treatedcellsamplesversusNSAID/BiNSAID-treated
cellsamples.
Treatmenttime24h(Appendix4.7andFigure4.11)
Amideom
itted
• •TolfHscoresrelativelyclustered
+vePC-1,vehicledistributedacross
+veand−vePC-1
• •PC-1loadings:lipid,ν
as(CH2)(s),
ν s(CH2)(s),ν(C=O)
(m),andδ(CH
2)
(w);protein,νs(COO
− ) (w)
• •TolfHscoresrelativelyclustered
+vePC-2,vehiclescoresmainly−ve
PC-2;inter-sam
plevariationevident
• •PC-2loadings:lipid,ν
as(CH2)(s),
ν s(CH2) (m
),ν(C=O)
(m),and
ν as(CO-O-C)(m
);protein,
ν s(COO
− ) (w);nucleicacids,ν as(PO 2
− )
(s) Resultsum
mary:TolfH
treatmentinducedaresponsethat
primarilyaffectedthelipids
• •VehicleandBi(tolf)3distributed
relativelyevenlyacross+veand−ve
PC-1
• •Greaternum
berofBi(tolf)3scores
+vePC-2,vehiclescoresmainly−ve
PC-2
• •PC-2loadings:AstolfH,seeabove
Resultsum
mary:Bi(tolf)3scores
werewidespread(com
paredto
thevehicleandtolfHscores)and
populatedareasofvehicleand
tolfHscores
IntensityofPCAloadingsbands:(s)=strong,(m)=moderate,(w
)=weak
Amideincluded
• •Avg.spectrum
tolfH:�intensityofν
as(CH2),
ν s(CH2),ν(C=O),andν as(PO 2
− )bands
• •TolfHscoresrelativelyclustered+vePC-1,vehicle
scoresdistributedacross+veand−vePC-1
• •PC-1loadings:lipidνas(CH2)(s),ν s(CH2)(s),and
ν(C=O)
(m);proteinam
ideI (m)andamideII(m)
• •TolfHscoresrelativelyclustered−vePC-2,vehicle
scoresmainly+vePC-2;
inter-samplevariationevident
• •PC-2loadings:lipid,ν
as(CH2) (m
)andνs(CH2) (m
);protein,amideI(s)andamideII(m);nucleicacids,
ν(C=O)
(m)andνas(PO 2
− ) (w)
Resultsum
mary:TolfHtreatmentinduceda
responseinthespectrum
ofHCT-8cells
comparedtovehicle,whichwasattributedtoan
effectonlipidsandproteins
• •Littledifferencenotedintheavg.spectrum
ofvehicle
vs.Bi(tolf)3,exceptslight�intheintensityofν(C=O)
andν as(PO 2
− )bands
• •VehicleandBi(tolf)3scoresdistributedrelatively
evenlyacross+veand−vePC-1;nocleardelineation
orclustering
• •Greaternum
berofBi(tolf)3scores−vePC-2,vehicle
scoresmainly+vePC-2
• •PC-2loadings:AstolfH,seeabove
Resultsum
mary:Bi(tolf)3scoresw
ere
widespread(com
paredtothevehicleandtolfH
scores)andpopulatedareasofvehicleandtolfH
scores
Treatmenttime4h(Appendix4.6andFigure4.10)
Amideom
itted
• •VehiclescoreslargelyPC-1andPC-2+ve,
tolfHscoreslargelyPC-1–ve;
inter-samplevariationevidentalongboth
PC-1andPC-2
• •PC-1loadings:lipid,ν
as(CH2)(s),ν s(CH2)
(s),ν(C=O)
(m),δ(CH
2) (w);protein,
ν s(COO
− ) (w);nucleicacids,ν as(PO 2
− ) (w)
• •PC-2loadings:lipid,ν(C=O)(s),andδ(CH2)
(m);protein,νs(COO
− ) (m
);nucleicacids,
ν as(PO 2
− ) (m
)Resultsum
mary:TolfHtreatment
inducedaresponseinthespectrum
of
HCT-8cellscom
paredtovehicle,which
wasprimarilyattributedtoaneffecton
lipids
• •VehiclescoreslargelyPC-1+ve,Bi(tolf)3
scoreslargelyPC-1−ve(lessdelineationof
Bi(tolf)3scoresfromvehiclescores
comparedtotolfHvs.vehicle);som
einter-
samplevariationevidentonPC-1
• •PC-1loadings:AstolfH,seeabove
• •Noseparationfrom
vehicleonPC-2
Resultsum
mary:Bi(tolf)3treatment
causedsomechangeinlipids;how
ever,
theeffectwaslesspronouncedcompared
totolfH.Additionally,thetolfHspectra
weredistinguishablefrom
Bi(tolf)3and
vehiclescoresduetoachangeinlipids
Amideincluded
• •Avg.spectrum
tolfH:�intensityof
ν as(CH2)andνs(CH2),shiftinνas(PO 2
− )
band(1240cm
−1�1232cm
−1)vs.vehicle
• •VehiclescoreslargelyPC-1–ve,tolfH
scoreslargelyPC-1+ve;
inter-samplevariationevident
• •PC-1loadings:lipid,ν
as(CH2)(s),ν s(CH2)
(s),ν(C=O)
(m),andδ(CH
2) (w);protein,
amideI (m),am
ideII(w),andν s(COO
− )
(w);nucleicacids,ν as(PO 2
− ) (w)
Resultsum
mary:TolfHtreatment
inducedaresponseinthespectrum
of
HCT-8cellscom
paredtovehicle,which
wasprimarilyattributedtoaneffecton
lipidsw
ithsomecontributionfrom
proteins
• •Avg.spectrum
Bi(tolf)3:�intensityof
ν as(CH2)andνs(CH2),shiftinνas(PO 2
− )
band(1240cm
−1�1238cm
−1)vs.vehicle
• •VehiclescoreslargelyPC-1−ve,Bi(tolf)3
scoreslargelyPC-1+ve(although,greater
overlapwithvehiclethantolfH);some
inter-samplevariationevident
• •PC-1loadings:AstolfH,seeabove
Resultsum
mary:Bi(tolf)3treatment
causedsomechangeinlipids/proteins;
however,theeffectwasless
pronouncedcom
paredtotolfH
vehicle
vs.tolfH
(45μM
)
vehicle
vs.
Bi(tolf)3
(15μM
)
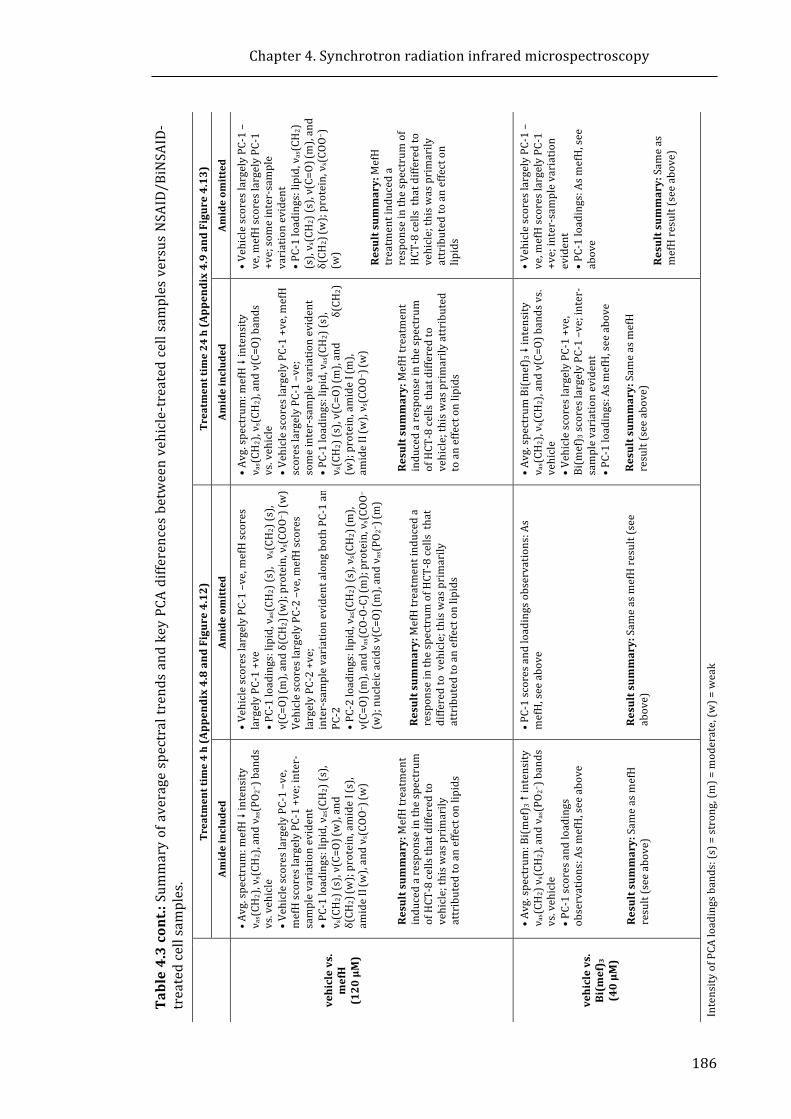
Chapter4.Synchrotronradiationinfraredmicrospectroscopy
186
Table4.3cont.:SummaryofaveragespectraltrendsandkeyPCAdifferencesbetweenvehicle-treatedcellsamplesversusNSAID/BiNSAID-
treatedcellsamples.
Treatmenttime24h(Appendix4.9andFigure4.13)
Amideom
itted
• •VehiclescoreslargelyPC-1–
ve,mefHscoreslargelyPC-1
+ve;someinter-sample
variationevident
• •PC-1loadings:lipid,ν
as(CH2)
(s),ν s(CH2)(s),ν(C=O)
(m),and
δ(CH
2) (w);protein,νs(COO−)
(w)
Resultsum
mary:MefH
treatmentinduceda
responseinthespectrum
of
HCT-8cellsthatdifferedto
vehicle;thiswasprimarily
attributedtoaneffecton
lipids
• •VehiclescoreslargelyPC-1–
ve,mefHscoreslargelyPC-1
+ve;inter-samplevariation
evident
• •PC-1loadings:Asm
efH,see
above
Resultsum
mary:Sam
eas
mefHresult(seeabove)
IntensityofPCAloadingsbands:(s)=strong,(m)=moderate,(w
)=weak
Amideincluded
• •Avg.spectrum
:mefH�intensity
ν as(CH
2),ν
s(CH
2),andν(C=O)bands
vs.vehicle
• •VehiclescoreslargelyPC-1+ve,mefH
scoreslargelyPC-1–ve;
someinter-samplevariationevident
• •PC-1loadings:lipid,ν
as(CH2)(s),
ν s(CH2)(s),ν(C=O)
(m),andδ(CH
2)
(w);protein,amideI (m),
amideII(w),ν s(COO
− ) (w)
Resultsum
mary:MefHtreatment
inducedaresponseinthespectrum
ofHCT-8cellsthatdifferedto
vehicle;thiswasprimarilyattributed
toaneffectonlipids
• •Avg.spectrum
Bi(mef) 3�intensity
ν as(CH
2),ν
s(CH
2),andν(C=O)bandsvs.
vehicle
• •VehiclescoreslargelyPC-1+ve,
Bi(mef) 3scoreslargelyPC-1–ve;inter-
samplevariationevident
• •PC-1loadings:Asm
efH,seeabove
Resultsum
mary:Sam
easmefH
result(seeabove)
Treatmenttime4h(Appendix4.8andFigure4.12)
Amideom
itted
• •VehiclescoreslargelyPC-1–ve,mefHscores
largelyPC-1+ve
• •PC-1loadings:lipid,ν
as(CH2)(s),ν
s(CH
2)(s),
ν(C=O)
(m),andδ(CH
2) (w);protein,νs(COO−)(w)
• VehiclescoreslargelyPC-2–ve,mefHscores
largelyPC-2+ve;
inter-samplevariationevidentalongbothPC-1and
PC-2
• •PC-2loadings:lipid,ν
as(CH2)(s),ν s(CH2) (m
),ν(C=O)
(m),andν as(CO-O-C) (m);protein,νs(COO−)
(w);nucleicacidsν(C=O) (m),andν as(PO
2−) (m)
Resultsum
mary:MefHtreatmentinduceda
responseinthespectrum
ofHCT-8cellsthat
differedtovehicle;thisw
asprimarily
attributedtoaneffectonlipids
• •PC-1scoresandloadingsobservations:As
mefH,seeabove
Resultsum
mary:Sam
easmefHresult(see
above)
Amideincluded
• •Avg.spectrum
:mefH�intensity
ν as(CH
2),ν
s(CH
2),andνas(PO 2
− )bands
vs.vehicle
• •VehiclescoreslargelyPC-1–ve,
mefHscoreslargelyPC-1+ve;inter-
samplevariationevident
• •PC-1loadings:lipid,ν
as(CH2)(s),
ν s(CH2)(s),ν(C=O)
(w),and
δ(CH
2) (w);protein,amideI (s),
amideII(w),andν s(COO
− ) (w)
Resultsum
mary:MefHtreatment
inducedaresponseinthespectrum
ofHCT-8cellsthatdifferedto
vehicle;thiswasprimarily
attributedtoaneffectonlipids
• •Avg.spectrum
:Bi(mef) 3�intensity
ν as(CH
2)νs(CH
2),andνas(PO 2
− )bands
vs.vehicle
• •PC-1scoresandloadings
observations:Asm
efH,seeabove
Resultsum
mary:Sam
easmefH
result(seeabove)
vehiclevs.
mefH
(120μM)
vehiclevs.
Bi(mef) 3
(40μM
)
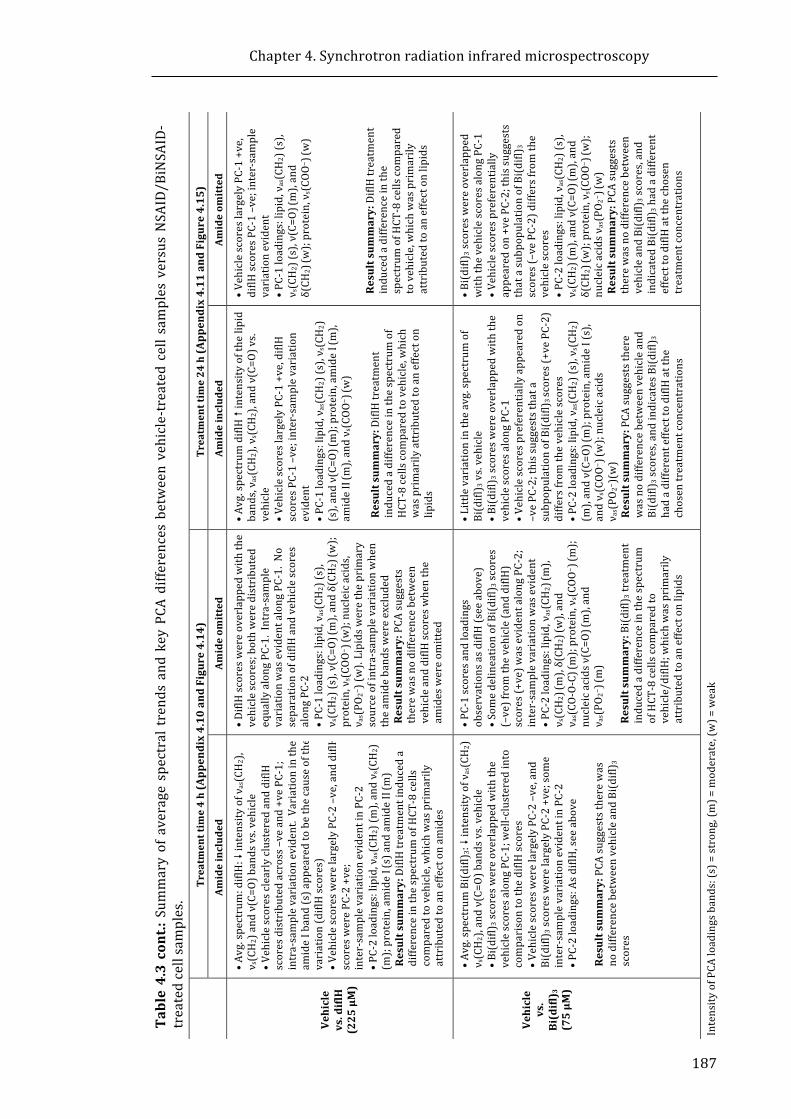
Chapter4.Synchrotronradiationinfraredmicrospectroscopy
187
Table4.3cont.:SummaryofaveragespectraltrendsandkeyPCAdifferencesbetweenvehicle-treatedcellsamplesversusNSAID/BiNSAID-
treatedcellsamples.
Treatmenttime24h(Appendix4.11andFigure4.15)
Amideom
itted
• •VehiclescoreslargelyPC-1+ve,
diflHscoresPC-1–ve;inter-sample
variationevident
• •PC-1loadings:lipid,ν
as(CH2)(s),
ν s(CH2)(s),ν(C=O)
(m),and
δ(CH
2) (w);protein,νs(COO−) (w)
Resultsum
mary:DiflHtreatment
inducedadifferenceinthe
spectrum
ofHCT-8cellscom
pared
tovehicle,whichwasprimarily
attributedtoaneffectonlipids
• •Bi(difl) 3scoreswereoverlapped
withthevehiclescoresalongPC-1
• •Vehiclescorespreferentially
appearedon+vePC-2;thissuggests
thatasubpopulationofBi(difl)
3
scores(–vePC-2)differsfromthe
vehiclescores
• •PC-2loadings:lipid,ν
as(CH2)(s),
ν s(CH2) (m
),andν(C=O)
(m),and
δ(CH
2) (w);protein,νs(COO−) (w);
nucleicacidsν
as(PO 2
− ) (w)
Resultsum
mary:PCAsuggests
therewasnodifferencebetween
vehicleandBi(difl) 3scores,and
indicatedBi(difl) 3hadadifferent
effecttodiflHatthechosen
treatmentconcentrations
IntensityofPCAloadingsbands:(s)=strong,(m)=moderate,(w
)=weak
Amideincluded
• •Avg.spectrum
diflH�intensityofthelipid
bands,ν as(CH
2),ν
s(CH
2),andν(C=O)vs.
vehicle
• •VehiclescoreslargelyPC-1+ve,diflH
scoresPC-1–ve;inter-samplevariation
evident
• •PC-1loadings:lipid,ν
as(CH2)(s),ν s(CH2)
(s),andν(C=O)
(m);protein,amideI (m),
amideII(m),andν s(COO
− ) (w)
Resultsum
mary:DiflHtreatment
inducedadifferenceinthespectrum
of
HCT-8cellscom
paredtovehicle,which
wasprimarilyattributedtoaneffecton
lipids
• •Littlevariationintheavg.spectrum
of
Bi(difl) 3vs.vehicle
• •Bi(difl) 3scoreswereoverlappedwiththe
vehiclescoresalongPC-1
• •Vehiclescorespreferentiallyappearedon
–vePC-2;thissuggeststhata
subpopulationofBi(difl)
3scores(+vePC-2)
differsfrom
thevehiclescores
• •PC-2loadings:lipid,ν
as(CH2)(s),ν s(CH2)
(m),andν(C=O)
(m);protein,amideI(s),
andν s(COO
− ) (w);nucleicacids
ν as(PO
2−)(w)
Resultsum
mary:PCAsuggeststhere
wasnodifferencebetweenvehicleand
Bi(difl) 3scores,andindicatesBi(difl)
3hadadifferenteffecttodiflHatthe
chosentreatmentconcentrations
Treatmenttime4h(Appendix4.10andFigure4.14)
Amideom
itted
• •DiflHscoreswereoverlappedwiththe
vehiclescores;bothweredistributed
equallyalongPC-1.Intra-sam
ple
variationwasevidentalongPC-1.No
separationofdiflHandvehiclescores
alongPC-2
• •PC-1loadings:lipid,ν
as(CH2)(s),
ν s(CH2)(s),ν(C=O)
(m),andδ(CH
2) (w);
protein,νs(COO−) (w);nucleicacids,
ν as(PO
2−)(w). Lipidsw
eretheprimary
sourceofintra-sam
plevariationwhen
theam
idebandsw
ereexcluded
Resultsum
mary:PCAsuggests
therewasnodifferencebetween
vehicleanddiflHscoreswhenthe
amideswereom
itted
• •PC-1scoresandloadings
observationsasdiflH(seeabove)
• •SomedelineationofBi(difl)
3scores
(–ve)fromthevehicle(anddiflH)
scores(+ve)w
asevidentalongPC-2;
inter-samplevariationwasevident
• •PC-2loadings:lipid,ν
as(CH2) (m
),ν s(CH2) (m
),δ(CH
2) (w),and
ν as(CO-O-C) (m);protein,νs(COO−) (m);
nucleicacidsν(C=O) (m),and
ν as(PO
2−) (m)
Resultsum
mary:Bi(difl)
3treatment
inducedadifferenceinthespectrum
ofHCT-8cellscom
paredto
vehicle/diflH;whichwasprimarily
attributedtoaneffectonlipids
Amideincluded
• •Avg.spectrum
:diflH:�intensityofν
as(CH2),
ν s(CH2)andν(C=O)bandsvs.vehicle
• •VehiclescoresclearlyclusteredanddiflH
scoresdistributedacross–veand+vePC-1;
intra-samplevariationevident.Variationinthe
amideIband(s)appearedtobethecauseofthe
variation(diflHscores)
• •VehiclescoreswerelargelyPC-2–ve,anddiflH
scoreswerePC-2+ve;
inter-samplevariationevidentinPC-2
• •PC-2loadings:lipid,ν
as(CH2)(m
),andν s(CH2)
(m);protein,amideI (s)andamideII(m)
Resultsum
mary:DiflHtreatmentinduceda
differenceinthespectrum
ofHCT-8cells
comparedtovehicle,whichwasprimarily
attributedtoaneffectonam
ides
• •Avg.spectrum
Bi(difl)
3:�intensityofν
as(CH2)
ν s(CH2),andν(C=O)bandsvs.vehicle
• •Bi(difl) 3scoreswereoverlappedwiththe
vehiclescoresalongPC-1;well-clusteredinto
comparisontothediflHscores
• •VehiclescoreswerelargelyPC-2–ve,and
Bi(difl) 3scoreswerelargelyPC-2+ve;som
einter-samplevariationevidentinPC-2
• •PC-2loadings:AsdiflH,seeabove
Resultsum
mary:PCAsuggeststherewas
nodifferencebetweenvehicleandBi(difl) 3
scores
Vehicle
vs.diflH
(225μM)
Vehicle
vs.
Bi(difl) 3
(75μM
)
Chapter4.Synchrotronradiationinfraredmicrospectroscopy
188
4.4 DiscussionPreviousinvitrostudieshaveshownthatNSAIDscanexertanti-neoplasticeffects
throughanumberofbiochemicalpathways(discussedinSection1.2.4).Inthiswork
SR-IRMS has been employed to determine whether gross biomolecular changes
inducedbyNSAIDs/BiNSAIDscanbedistinguished.Thisapproachhasbeenexplored
based on previous studies by other researchers who have correlated biomolecular
effectsobservedbySR-IRMSwithspecificdrugtreatments(Table4.2). SR-IRMSwas
specificallyemployedinthisstudytodeterminewhetherthetechniquecouldbeused
to:(i)observeglobalmolecularchangesintheliveHCT-8cellsthathavebeenexposed
to theNSAIDsor the correspondingBiNSAIDs, (ii) determinewhether anyobserved
changes induced by the BiNSAID/NSAID are consistent with knownmechanisms of
celldeath, and (iii)determinewhetherBiNSAIDs/NSAIDs inducesimilarordifferent
biomolecularresponses.
Livecellstudieswereperformedinordertoexaminethecellsinastatethatmost
closelymimickedthatusedfortheotherbiochemicalassaysperformedaspartofthis
Thesis,without any potential confounding IR effects from a fixation/drying process.
ItwasclearfromtheSR-IRMSstudyoflivecellsthatanumberoffactorsneededtobe
considered when determining the usefulness of SR-IRMS for the abovementioned
purposes. These include:(i) thedataanalysis,specificallythewaterbandcorrection
strategies (discussed in Section 4.4.1) and (ii) the significance of the biomolecular
changes induced by vehicle, and BiNSAID/NSAID treatments, with respect to
intra-sample variation (discussed in Section 4.4.2). Finally, the experimental
approach/designandimprovementsforfutureexperimentswithrespecttotheresults
arediscussedinSection4.4.3.
4.4.1 Dataanalysis:Waterabsorptioncorrectionstrategy
AspreviouslyhighlightedinSection4.1.4,theeffectsoftheaqueousbackground
cancreateproblemswhenanalysingtheSR-IRMSspectraoflivecellsincellmedium.
Inparticular,thewaterdeformationbandcentredat1620cm−1,whichoverlapswith
the amide I absorbancebandneeds tobe addressed. Many researchers [33, 43, 57]
have highlighted the issue of water absorption in the collection and processing of
SR-IRMS spectra obtained from living single cells. Conflicting approaches in the
literatureledtotheuseofthetwoanalyticalstrategiespresentedinthisThesis.

Chapter4.Synchrotronradiationinfraredmicrospectroscopy
189
In the present study it was observed that when comparing the average cell
spectra of a sample corrected for water band absorption to the same sample set
withoutwaterband correction, little tonodifferences in thepositionof the amide I
and amide II bands were observed in the second derivative spectra. This result is
similar tothatreportedbyMarcsisinetal.[33],wherebytheauthorsconcludedthat
the spectral integrity of the data was maintained; consequently, they employed
spectra without any water band correction in PCA. In the present study (Section
4.3.1), PCA was performed on spectra uncorrected, and corrected for the water
absorption, inorder to furtherdeterminewhether therewereanydifferences in the
PCA scores and loadings plots following correction for thewater absorption. Some
subtledifferenceswereobservedinthecoordinatesofsomeoftheindividualscoresin
the PCA scores plot following correction forwater absorption; however, the overall
trendsremainedthesameregardlessofwhetherwaterbandcorrectionwasappliedin
all of the sample sets tested. The results from the present study suggest that the
biomolecularinformationintheamideregioncontributedbycellSR-IRMSmayremain
extractable using PCA, despite the contributions from the water band centred at
1620cm−1.
Water correction strategies have been debated in a number of studies. For
instance,Whelanet al. [43] argue that anywater band ratioing is unreliable as it is
unconventional. Given that the water band influences the amide region, the
researchers excluded the amide region from PCA obtained from their live cell cycle
study[43]. Consequently, in thepresentstudyPCAwasalsoperformedonSR-IRMS
thatexcludedtheamideregion,andcomparedtothePCAperformedonspectrathat
includedtheamideregion.Inmostcases,thescoresplotwasalteredmarkedlywhen
the amide region was excluded, which can be expected as the amide I band is the
strongestbandinthespectrumandthestrongestmeasureofproteinsinthespectrum.
However, in all cases the explained variance of PC-1 (observed on the x-axis of the
scoresplotsinFig.4.7−4.15)wassubstantiallyincreasedfollowingtheomissionofthe
amideregion,whichmayindicatethattheamideIregionwascontributingmorenoise
than information. Additionally,with the omission of the amide region, the loadings
plotsshowedpredominantcontributions fromlipid-relatedbands,and inmostcases
increasedthestrengthofthecontributionsfrombandsbetween1485–1150cm−1.
Therearetwooutcomesthatrequirefurtherexamination.Firstly,theomissionof
theamidebandsappearstohaveasubstantialeffectontheoutcomeofPCA;thusthe
Chapter4.Synchrotronradiationinfraredmicrospectroscopy
190
omissionoftheamidebandsmayinfactresultintheoversightofusefuldatafromPCA
producing results less representative of the true biomolecular differences between
samples. Secondly, the effectiveness of the water band correction is difficult to
evaluateandmaystillnotprovideatruebiochemicalrepresentation.
In conclusion, the water band correction using spectral subtraction strategy
employed in thepresent studyappears tohave subtle effectson theoutcomeof the
PCA results when compared to the respective non-corrected spectra. If a suitable
water compensation strategy can be determined in the future, and employed
universally by researchers who perform SR-IRMS studies of live cells, the results
obtainedinthepresentstudyshouldbereanalysedwiththisstrategy.Forthepresent
study, however, it was opted to perform PCA on SR-IRMS spectra that were not
correctedforthewaterbandastheresultsinSection4.3.1revealedlittledifferencein
theresultantPCA.
4.4.2 ThebiomoleculareffectsoftreatmentonliveHCT-8cells
4.4.2.1 Vehicle-treatedcells
One of the notable results of the PCA of the SR-IRMS cell spectra, evident even
within control cell populations was intra-sample variation. There are a number of
reasonsthatcancontributetointrinsicvariationswithinacellpopulationsubjectedto
thesametreatment.Twowell-studiedcausesare:(i)cellcycle,and(ii)biomolecular
changesduetocelldeath.
At any given time in an unsynchronised population of mammalian cells,
subpopulationsof cellswill be found inoneof thedifferentphasesof the cell cycle:
gap1 (G1), synthesis (S), gap 2 (G2), mitosis (M) or quiescence (G0) [43].
FTIRdemonstratedthatmammaliancellsundergoingcelldivisionshowdifferencesin
eachdifferentphaseof thecell cycle [16,22]. Furthermore,Whelanetal. [43]have
shown through live cell studies that biomolecular changes could be distinguished
within each specific phase by examining the SR-IRMS spectra of the cells every two
hourspost-mitosis.Inthepresentstudynoattemptwasmadetosynchronisethecells
inanyparticularphaseof the cell cycle,but instead the cellswerepreparedusinga
similarproceduretothatemployedforallotherassaysperformedinthisThesis.Itis
reasonable to suggest that lipid, protein and nucleic acid content of theHCT-8 cells
willbeinfluencedbythecellcyclephaseandwillthereforeresultinvariationsinthe
SR-IRMSspectraofeachindividualcellwithinthepopulation.
Chapter4.Synchrotronradiationinfraredmicrospectroscopy
191
CelldeathisanotherfactorthatmayinfluencetheSR-IRMSspectraofindividual
cells. For instance, studies have shown that apoptosis and necrosis can be
distinguished in the IRMS spectra of single cells [18, 20, 21]. Importantly, in the
presentstudy,itwasestablishedfromflowcytometryassays(presentedinChapter2)
thatlateapoptotic/deadHCT-8cellsdetachedfromthecellsubstrate.IntheSR-IRMS
studyreported in thisChapteranydeadcellswouldhavebeenremovedbywashing
stepsperformedprior to insertion into the cell chamber for analysis. Thus, the cell
populationthatremainsadheredtothesubstrateprimarilycontainscellsofrelatively
good health or in the early stages of apoptotic cell death as confirmed by flow
cytometryanalysisoftheadherentcellpopulation(Appendix4.12).
Whiletherearevariationsinthebiochemistryofthecellsduetocellcycleandcell
death(whichcorrelatesinvariationsintheSRIRMSspectra),thecontrolcellsamples
thatwere incubatedwith cellmedium, in the absence of vehicle or drugs,would be
consideredtobethe‘normal’distributionofacultureofHCT-8cells.Floweretal.[12]
alsoreportedasimilarheterogeneityinthescoresplotsofspectraassociatedwiththe
controlcells.Encouragingly,theresultsfromthePCAloadingsplotsgeneratedinthis
study (Fig.4.9) indicate that the main source of variation of the cell medium and
vehicle cells is the lipid bands which causes the dominant variance across the
PC-1axis. This isconsistentwiththePCAresultsofWhelanetal. [43]whoreported
thesameobservationwhentheyperformedaPCAofG1,S,andG2cells.Itis,therefore,
likely that the distribution of the vehicle scores is indicative of cell cycle variation
withinthepopulation.
It was essential to prepare non-treated (cell medium only) cells and vehicle-
treated(DMSO2%v/vinRPMI-1640)cellsinordertodetermineifanybiomolecular
changes occurred in response to DMSO exposure. It should be noted that all cell
experimentsperformed in thisThesis includedavehicle-treated ‘control’ inorder to
directlycomparewiththeBiNSAID/NSAIDtreatments(preparedasDMSOsolutionsin
cellmedium toachievedissolutionof thedrug). A shorter4-h treatment timeframe
(aswellasthetypical24-htreatment)wasevaluatedinordertodeterminewhether
any spectral changes indicative of biomolecular changes could be detected in the
absence of cytotoxic effects (as indicated by MTT assays, Appendix 1.2). Vehicle
treatment appeared to effect the SR-IRMS spectra of the HCT-8 cells after 4-h as
evidenced by the PCA scores plots (Fig. 4.8); however, the delineation identified
between cellmedium- and vehicle-treated cellswas only observedwhen the strong
Chapter4.Synchrotronradiationinfraredmicrospectroscopy
192
loadings from the amide region (Fig. 4.7) were omitted from the PCA (Fig.4.8).
Followingomissionoftheamideregion,thePC-2loadingsplots(Fig.4.8)showedthat
the νas(CH2), νs(CH2), νas(C=O), andνas(CO−O−C)bands, and the νas(PO2−)band,were
theprimarycontributorstothevariancebetweenthecellmediumandvehiclescores.
DMSOisawater-miscible,polarsolvent,whichhasoftenbeenusedincellbiology
for the dissolution of hydrophobic compounds, cryoprotection, inducing cell
differentiation, free radical scavenging, membrane penetration, and as a cell
fusogen[63]. The effect of DMSO on lipids, and in particular, membrane
phospholipids, has been investigated in a number of studies [64-68]. Molecular
dynamicsimulationsperformedusingdioleoylphosphatidylcholinemembranesmixed
with20mol%ofcholesterolandlowDMSOfractions(≤10mol%)resultedinsporadic
and very transient hydrophobic pores which were arranged in the form of single-
molecule water columns that cross the membrane and disappear [67].
Incomplimentarymicroscopyexperiments,smallundulationsofthecellmembraneof
DC-3F cells treated with 10 vol% (2.74 mol%) DMSO were identified following
1-h[67]. Gurtovenko et al. [69] report that atomic-scale molecular dynamic
simulationsperformedonlipidbilayerscomprisingdipalmitoylphosphatidylcholinein
aqueous solution with DMSO at low concentrations showed decreased membrane
thickness and increased membrane fluidity (2.5−7.5 mol%), while moderate
concentrations (10−20mol%) induced formation of transientwater pores, and high
concentrations (25−100 mol%) destroyed the bilayer structure of membranes.
Morerecently,neutronreflectometrystudiesassessingtheeffectofDMSO(2%v/v)on
lipid membrane mimetic bilayers comprised of POPC have been performed [68].
Interestingly, scattering length density profiles indicated that DMSO (2%v/v) in
D2O/PBScausednostructuralchangestothebilayer.However,asubstantialdecrease
in the scattering length density profile of the hydrophobic tail region indicated that
DMSOenters the tail regionof thePOPCbilayerandsubsequentlydisplaces theD2O
molecules [68]. Given that the formationof transienthydrophobicpores across cell
membranesreportedlyoccursathigherconcentrationsofDMSO(>10vol%)[69]than
that utilised in the present study, it is conceivable that variation in the SR-IRMS
spectra was potentially due to the occupation of DMSO below the head groups of
membrane phospholipids and the displacement of water molecules resulting in a
difference in theSR-IRMSsignatureobserved in the lipid-relatedbandsbetween the
4-hcellmedium-andvehicle-treatedPCAscores.
Chapter4.Synchrotronradiationinfraredmicrospectroscopy
193
Interestingly,nodelineationbetweenthecellmedium-treatedorvehicle-treated
scores was observed following 24-h treatment with or without the amide bands
includedinthePCA(Fig.4.9).Plasmamembranedisruptionisoftenaccompaniedby
rapid resealing of the cell membrane in order to ensure cell survival [70]. Work
performed by Togo et al. [71, 72] suggests that cells are able to reseal wounded
membranesmore rapidly following repeated disruption to the cellmembranewhen
compared to the rate of repair following the initial wound due to an increase in
exocytosis. It isplausiblethat followinganextendedperiodoftreatment(>4h)the
HCT-8 cells could become tolerant to DMSO exposure and the cell membrane may
‘recover’toanextent. Perhapsthelackofbiomoleculardistinctionasdeterminedby
PCAbetween thespectraof cells treatedwithcellmediumorvehicle following24-h
may be due to gradual displacement of DMSO from the cell membrane. A recent
report[73]suggeststhatexperimentalquantificationofthepropertiesofDMSO–water
bondsatthelipidmembranesurfaceremainspoorlyunderstood. Thusfurtherwork
isneededtoexplicitlyconfirmthepresentfindings.
Thereareanumberofreports[65,74,75]thatdiscussthevaryingtoleranceand
biochemical effects exhibited by different cell lines when exposed to DMSO. For
instance, the effect of DMSO (2%) on the membrane dynamics and phospholipid
composition of the two different cell lines, FLC (Friend leukemia cells) and Raji
(lymphoblastoid) cells has been investigated [65]. Following 5-day incubationwith
DMSO only the phospholipid composition of FLC cells, but not the Raji cells was
affected.Thecoloncancercells,Caco-2/TC7,havebeenshowntobetoleranttoDMSO
for concentrations up to 10%v/vwithout the induction ofmembrane leakage [74].
Inanotherstudy,prolongedDMSO(2%v/v)treatmenthasbeenreportedtoinducea
number of biochemical changes in SW480 and SW620 cell lines (primary colonic
tumorandlymphnodemetastasis,respectively,isolatedfromthesamepatient)[75];
however, cell viability was not affected for up to four days following incubation in
DMSO [75]. Clearlyprevious research shows that the cell response toDMSOcanbe
variable, notonlydependentonDMSOconcentrationand timeof exposure, but also
dependent on the specific cell line. The results of the present study show that the
viabilityofDMSO-treatedHCT-8cellsisslightlyaffectedfollowing24-htreatment(as
shown by MTT assay, Chapter 2); however, no significant biomolecular differences
could be detected by PCA of the SR-IRMS spectra. For the purpose of the current
SR-IRMS study, the lack of distinction between cellmedium andDMSO scores is an

Chapter4.Synchrotronradiationinfraredmicrospectroscopy
194
importantresultasitsuggeststhatDMSOexposureof24-hdoesnotsignificantlyalter
theSR-IRMSspectraandthebiomolecularintegrityoftheHCT-8cellsusingthistool.
This indicates that any biomolecular changes observed when comparing the
DMSO-treated cells to the BiNSAID or NSAID-treated cells are not dominated by
presenceofDMSO.
4.4.2.2 BiNSAID/NSAID-treatedcells
A few key observations resulted from the PCA analysis of vehicle-treated cell
spectra compared to BiNSAID/NSAID-treated spectra. These included the findings
that: (i) inmostcases theremovalof theamideregionresulted insubtlechanges to
thedistributionofthescoresplots,(ii)inmostcases4-hdrugtreatmentcausedsubtle
biomolecularchangesdespitenoobviousphysicalchangestothecellsorviabilityloss
(described in Chapter 2), (iii) the changes observed following 24-h drug treatment
differed from the changes observed at 4-h, and (iv) differences could be observed
whencomparingtheBiNSAIDscorestotherespectiveNSAIDscores.
It should be noted that the cell medium containing the drugs was removed
followingthedefinedincubationperiods(4hor24h)andthecellswerewashedprior
toplacementinthecellholderforSR-IRMSanalysis. Thiswasperformedinorderto
prevent any SR-IRMS detection of drug in the cellmedium. Other researchers [35]
havereportedthatthedetectionlimitofFTIRinstrumentationisnotsensitiveenough
todetecttheextremelylowconcentrationsofdrugthatwouldresideintheindividual
cell.Thisisanimportantpointasitindicatesthatanysignificantchangesdetectedin
thecellspectraweretheresultoftheactionsofthedrugswithinthecellsandnotdue
tothedetectionofthedrugitself.
When the spectral analyses were performed for the full spectral range
(3000−2800 cm−1, 1790−1150 cm−1) differences were commonly observed in the
amide bands following treatment with BiNSAID/NSAID versus vehicle. These
differencesweremost obvious for cells treatedwith Bi(tolf)3 (subtle for 4 h), tolfH
(subtlefor4handmoderatefor24h),Bi(mef)3(moderatefor4h),mefH(moderate
for 4 h), and diflH (strong for 4 h), and less so for Bi(difl)3,while no changeswere
observed in Bi(tolf)3 (24h). The most significant changes were observed as band
shiftsintheamideIbandfrom1655to1653cm−1(tolfHandmefH(4h),andBi(mef)3
anddiflH(24h))orwereassociatedwiththedevelopmentofshouldersat~1635cm−1
insamplestreatedfor24-hwithtolfH,Bi(mef)3andmefH(24h).Thefrequencyofthe
Chapter4.Synchrotronradiationinfraredmicrospectroscopy
195
amideIbandhasbeenreportedtorepresentthedominantproteinstructureswithin
inacell.Forinstance,commonproteinsecondarystructuresandtheircorresponding
vibrationalfrequencyrangesinclude:α-helix(1660−1649cm−1),β-sheet(1637−1615
cm−1), random coil (1648−1638 cm−1), turn (1680−1660 cm−1), and β-antiparallel
(1692−1680 cm−1) [76]. Thus the development of a shoulder at~1635 cm−1 in the
24-h tolfH-, Bi(mef)3-, and mefH-treated cell spectra is potentially indicative of an
increase in β-secondary structures. An increase in the proportion of β-sheet
structureshasbeenidentifiedintheearlystagesofapoptosisinA549[77],HeLa[17]
and U-87 MG cells [78]. This is in agreement with the present study where a
substantialproportionofBiNSAID/NSAID-treated(atIC50dosesfor24h)HCT-8cells
were identified as early apoptotic in flow cytometry experiments (discussed in
Chapter2).Unfortunately,however,ashasbeenestablishedbyVaccarietal.[34]and
Whelanetal.[43]inSection4.1.4thewaterbandalsoeffectstheamideIandamideII
bands;assuch,whilstitappearedthatcorrectionforthewaterbandshowednoeffect
on these bands, it cannot be definitively proven that these changes are solely
attributedtomolecularchangesassociatedwithamidebands.
In most cases the other biomolecular changes associated with BiNSAID/NSAID
treatmentofcellswereconsistentregardlessofwhethertheanalysiswasperformed
forspectrawhichincludedoromittedtheamideregions.Themostsignificantchanges
observed in both of these analyses were associated with CH2/CH3 region (3000−
2800cm−1), ν(C=O) (1745 cm−1) and νas(PO2−) (1245 cm−1) that canbe attributed to
lipids.Therewasonlyoneinstancewherethelipidchangeswerenotobservedinboth
datasetanalysesandthiswastheamideinclusiveanalysesofthe4-hBi(difl)3/diflH-
treatedcellspectra(Fig.4.14a).Instanceswherelipidchangeswereobservedinclude:
tolfH(4hand24h),Bi(tolf)3(4h),mefH(4hand24h),Bi(mef)3(4hand24h),and
diflH(24h).
Interestingly,the4-hBi(tolf)3/tolfH(Fig.4.10)and4-hBi(mef)3/mefH(Fig.4.12)
PCA results showed that the loadings bands associated with the lipids were also
stronglyassociatedwiththeBiNSAID/NSAID-treatedscores(asopposedtothevehicle
scores). Furthermore, it was observed in the average Bi(tolf)3-, tolfH and Bi(mef)3-
treated (Appendix 3.6 and Appendix 3.7) spectra that there was an increase in the
intensity of the νas(CH2) and νs(CH2) bands, a possible indication that lipid
concentration is increased in the BiNSAID/NSAID-treated cell populations. The 4-h
Bi(difl)3 (Fig. 4.14), showed the opposite trend whereby the lipid bands were
Chapter4.Synchrotronradiationinfraredmicrospectroscopy
196
associated with the vehicle spectra. This is not surprising given that the diflH
structure differs significantly from the structures of mefH/tolfH (Fig. 1.2).
Importantly, asno changes to the viability of theBiNSAID/NSAID-treated cellswere
observed after 4-h treatment (as determined byMTT assays, Chapter 2), it is likely
that the biomolecular changes observed at this time-point are associated with
moleculareventsthatprecedeapoptosis.Factorsthateffectlipidsinclude:(i)changes
to the lipid membrane due to interaction/uptake of the drug molecules, or (ii) a
downstreammetaboliceffectoncethedrugisinsidethecell(e.g.lipidsynthesis).
TheSR-IRMSspectralchangesobservedinthelipidbandsdetectedinresponseto
NSAIDtreatmentareconsistentwithreports[79-81]thatNSAIDsareabletointeract
withlipids,andinparticular,phospholipids,whichconstitutealargeproportionofthe
lipids comprising the cellmembrane. Experimental evidence [79] suggests that the
deleteriouseffectsofNSAIDsontheGItissuecouldbeduetomechanismsthatinvolve
direct disruption to the surface-active properties of phospholipids of the gastric
mucosa, in addition to COX-1 inhibition. Studies by Lichtenberger et al. [80] have
shown that 30-min exposure of AGS human gastric carcinoma cells to aspirin or
ibuprofen (both 0.5 mM), or naproxen (1.5mM) altered the fluidity and packing
densityofthecellmembraneinaheterogeneousmannerresultinginportionsofthe
membrane becoming hydrophilic.While the exposure time and treatment
concentrationsvariedfromthepresentstudythereisclearevidencethatNSAIDscan
directly disrupt the mammalian cell membrane. Suwalsky et al. [81] used X-ray
diffraction to show that mefH perturbed lipid membrane mimetics consisting of
dimyristoylphosphatidylcholine or dimyristoylphosphatidylethanolamine
bilayers. Additionally, the researchers used fluorescence resonance energy transfer
measurementstoshowthatmefHwasabletoincreasefluidityofthehydrophobiccore
ofdimyristoylphosphatidylcholineliposomes.Itwasdeterminedthatthisoccurredas
a result of intercalation of mefH into the hydrophobic acyl chains of the
dimyristoylphosphatidylcholineliposome[81].
Interestingly,theoppositetrend(fromthatofthe4-htreatments)wasobserved
when examining the 24-h Bi(tolf)3/tolfH (Fig. 4.11) and 24-h Bi(mef)3/mefH
(Fig.4.13) PCA results whereby the loadings bands associated with the lipids were
also strongly associated with the vehicle-treated scores (as opposed to the
BiNSAID/NSAID-treatedscores).Assuch,thetolfH-,Bi(mef)3-andmefH-treatedcells
appeartobeassociatedwithalowerlipidconcentrationthanthevehicle-treatedcells.
Chapter4.Synchrotronradiationinfraredmicrospectroscopy
197
Thiswas supported by the reduction in the absorbance of the νas(CH2), νs(CH2) and
ν(C=O) bands in the SR-IRMS spectra (Appendix 3.7 and Appendix 3.9). Flow
cytometry assays (Appendix 3.12) showed that following 24 h treatment with the
same BiNSAID/NSAID concentrations, there was an increase in the proportion of
apoptotic cells (~16−40% within the adherent cell population). Phase contrast
microscopy also revealed morphological changes such as cell shrinkage and the
formation of membrane blebs (Fig. 2.7). Thus, in addition to changes to the lipid
membrane due to the interaction/uptake of the drug molecules, or effects on lipid
metabolismcausedbydruguptake,itisfeasiblethatthelipidbandswilladditionally
be altered as a result of apoptosis. The classic example of an alteration in lipid
distribution associated with cell apoptosis is the ‘flipping’ of phosphatidylserine
species from the interior cell membrane to the exterior leaflet of the cell
membrane[82]. Additionally,changesinmembranefluiditycommonlyoccurincells
undergoingapoptosis[83].Assuch,theobserveddecreaseinlipidabsorbancemaybe
aresultofapoptosis;however,thisobservationisincontrasttoanumberoffixedcell
studies that have demonstrated that the intensity of the lipid band increases in
apoptoticcells[17,20,84,85].LivecellstudiesperformedbyBirardaetal.[39]have
shownthatserumstarvationorcarbonyl cyanidem-chlorophenylhydrazoneexposure
induced apoptosis in U937 monocytes and caused an increase in cellular lipid
concentration.Theauthorsspeculatedthattheincreaseinthelipidcontentobserved
by spectroscopicmeasurementswas due to the accumulation of lipid droplets. The
decrease(ratherthanincrease)inlipidabsorbanceinthepresentstudymaysuggest
thatlipiddropletaccumulationisgenerallynotaneventassociatedwithcelldeathin
theHCT-8cellline.
Given the similarity in the structures of tolfH and mefH (Fig. 1.2), it is
unsurprising that tolfH and mefH would result in a similar biomolecular effect on
HCT-8 cells. Additionally, the overlap of the scores clusters in the Bi(mef)3/mefH
series is perhaps not surprising given the instability of the Bi(mef)3 complex
(concluded by the NMR data presented in Chapter 2) resulting in free mef in the
treatmentmedium. However, oneof themost surprising resultswere those for the
24-h diflH treatmentwhere itwas observed that therewas an increase in the lipid
intensity associated with diflH treatment, but no change associated with Bi(difl)3
treatment compared to the vehicle (Fig. 4.15 and Appendix 3.11). It was apparent
fromtheanalysesthatthediflH-treatedHCT-8cellsshoweddifferencesfromvehicle-
Chapter4.Synchrotronradiationinfraredmicrospectroscopy
198
treated cells but this was not the case for Bi(difl)3-treated cells. The SR-IRMS
differencesobservedfordiflH-versustolfH/mefH-treatedcellscannotbeexplainedby
theproportionofdyingcellsbasedondecreasedtoxicitysinceinallcasestheIC50was
applied. However, these differences might be explained by variations in the
mechanismofactionofdiflHcomparedtomefHandtolfH.Thisisnotsurprisinggiven
thediflHstructuredifferssignificantlyfromthestructuresofmefHandtolfH(Fig.1.2).
It isnotclearwhy the24-hdiflH-treatedcellsshowedsuchastrong increase in
theintensityoftheCH2/CH3bandregion.AlivecellcyclestudyperformedbyWhelan
et al. showed that an increase in lipid band intensity in the SR-IRMS spectra of
synchronised cells appeared 17-h post-mitosis, i.e. in the late-S phase of the cell
cycle[43]. Assuch, it isplausible that the increase in the lipidband intensityof the
24-hdiflH-treatedcellspectramightbeduetotheaccumulationofHCT-8cellsinthe
S-phaseofthecellcycle.However,NSAIDswithasimilarchemicalstructure,including
aspirin and salicylate, have been reported to arrest the cell cycle in the G0/G1
phase[86-88]. The increased intensityof theCH2/CH3bandregion, indicativeof the
lipidband,wasconsistentwithBirardaetal.[39]wherebytheauthorsspeculatethat
theincreaseinthelipidcontentobservedbyspectroscopicmeasurementswasdueto
theaccumulationoflipiddroplets. Furtherexperimentsemployingfluorescentprobes
couldbeperformedinthefuturetostudycellcyclearrestandthepossibleformation
of lipid droplets in diflH-treated HCT-8 cells, in order to better understand this
SR-IRMSobservation.
4.4.3 Limitationsoftheexperimentalapproachandfutureimprovements
The experimental design is an important factor that must be considered when
undertaking any scientific investigation. Mignolet et al. have recently commented
upon the variation in experimental design (and analysis procedures), cell handling,
and spectroscopy, in relation to the evaluation of data published in the field of
biospectroscopy[15].ThepreparationoflivecellsforSR-IRMSanalysisinthepresent
experimentwasparticularlychallengingforanumberofreasons.
Eachtreatmentsamplewaspreparedwithacontrolthatwaspreparedfromthe
same subculture, thus the passage number was kept consistent. However, the
applicationoftreatmentshadtobestaggeredby2−3hoursgiventhetimerequiredto
assemble the cell holder (typically 15−20min), set up the holder in themicroscope
andcollect theSR-IRMSspectraof thecells (typically60−90min). Thecell samples
Chapter4.Synchrotronradiationinfraredmicrospectroscopy
199
prepared following 2−3hours may, therefore, experience some changes in the cell
cycleprogressionandtheconcentrationofmetabolitesinthecellmedium.Whilethe
experiments in Chapter 4 were designed to mimic those of Chapters 2 and 3 in
hindsight, one important consideration for future experiments might also be the
preparationofsynchronisedcellsamplestotrytoreduceintra-samplevariation.This
wasnotpossibleforthecurrentstudy,however,duetobeamtimelimitations.
Vaccari and co-workers [89] have commented on the issues with demountable
liquid holders in recent publications. Essentially, the perfect closure of the
demountabledeviceisnotguaranteed,whichcanpotentiallyresultinvariationinthe
optical path length throughout the device. Importantly,water subtraction accuracy
canbe affectedby changes in path lengthbetween samples andbuffer spectra [34].
Additionally,withthedemountabledesign(suchastheoneusedinthepresentstudy)
it is difficult to standardise ‘tightening’ when the device was assembled with a cell
sample contained inside [89]. Whelan et al. [43] performed live cell studies at the
AustralianSynchrotronthatemployedthesamedeviceastheoneinthepresentstudy
attheandhavecommentedthat itsassemblycouldbeacauseforvariationbetween
replicate samples. Birarda et al. [89] have previously demonstrated that the
compressionofU937monocytecellsinadevicethatcontainedachamberheightless
thanhalfthatofthediameterofthecell(causingstrongdeformationofthecells)ledto
changesinAmI/AmII,AmII/lipidandνas(PO2−)/νs(PO2−)ratios;thusmechanicalstress
can induce cellular deformation and consequent biomolecular alterations that are
detectableusingSR-IRMS.Iffutureexperimentsweretobeperformed,theuseofaa
multi-faceted, fully sealed fluidic device, such as that reported byVaccari et al. [34]
maybemoresuitable.

Chapter4.Synchrotronradiationinfraredmicrospectroscopy
200
4.5 ChaptersummarySR-IRMSwasemployedfortheanalysisofliveHCT-8cellsfollowingexposureto
BiNSAIDs or NSAIDs in order to determine if it could be used to study global
biomolecular changes and allude to potential mechanisms of action of these
compounds. A multivariate approach, PCA, was applied to discern the spectral
differences associated with the analysis of the data and different cell treatments.
Specificobservationsregardingtheanalyticalapproachincludedthefindingsthatthe:
(i) Subtraction of a water band spectrum from the cell spectrum of each
individualcellonlysubtlyaffectedthePCAresults.
(ii) Omission of the amide region of the HCT-8 cell spectra from PCA caused
substantial changes to thedistributionof the sample scoresplot. Inmany
cases, weak loadings bands became more prominent in the loadings plot
uponomissionoftheamidebands.
The subsequent PCA showed that there was significant intra-sample variation,
althoughsomedelineationcouldbediscernedinthefollowingtreatmentgroups:
(i) The comparison of cellmedium-only or vehicle-treatedHCT-8 cell spectra
indicated there were subtle effects, attributable to the vehicle (2% v/v
DMSOincellmedium),onthespectrafollowing4-htreatment,butnot24-h
treatment.
(ii) Following4-htreatments:
a. Bi(tolf)3 and tolfH induced similar biomolecular effects on the HCT-8
cells in comparison to the vehicle,whichwereprimarily attributed to
effects on the lipidswith some contribution fromproteins. However,
followingremovaloftheamideregion,discriminationbetweenthetwo
compounds was apparent and attributable to ν(C=O) and νas(PO2−),
suggestive of difference in the effect of the two compounds on
phospholipids.
b. Bi(mef)3ormefHinducedsimilareffectsontheHCT-8cells,whichwere
primarilyattributedtolipids.
c. DiflH induced biomolecular effects on the HCT-8 cells, which were
primarily attributed to proteins. However, following amide removal
from PCA analysis, diflH no longer showed any changes from the
vehicle.TreatmentwithBi(difl)3wasdistinguishablefromdiflHandthe
Chapter4.Synchrotronradiationinfraredmicrospectroscopy
201
vehicle following amide removal, which was primarily attributed to
lipids.
(iii) Following24-htreatments:
a. TolfH induced biomolecular effects on the HCT-8 cells, which were
primarily attributed to lipids with some contribution from
proteins. Treatment of the cells with Bi(tolf)3 induced a varied
responsewithintheBi(tolf)3-treatedpopulation.
b. TreatmentwithBi(mef)3andmefHinducedsimilarbiomoleculareffects
ontheHCT-8cells,whichwereprimarilyattributedtolipids.
c. TreatmentwithBi(difl)3resultedinnodistinguishabledifferencefrom
the vehicle-treated cells. However, treatment with diflH was
distinguishable fromBi(difl)3 and vehicle scores,whichwas primarily
attributedtolipids.
The ambiguity surrounding the inclusion or omission of amide bands from
SR-IRMSspectraobtainedfromlivemammaliancellswasinvestigatedinthepresent
study using two methods reported in the literature. While this study may not
necessarilybeusedtoprovidefurtheradviceonthe inclusionofamidebands in live
cell studies, and thevalidityof thebiomolecular results theyprovide, this studyhas
providedadirectcomparisonaddingcredencetobothproceduresreportedbyother
investigators.
The SR-IRMS results obtained in the present study are preliminary in nature
showing intra- and inter-sample variations reflective of biomolecular differences in
the cell treatment groups. On the whole, the PCA results from the SR-IRMS study
suggest that treatmentwith BiNSAIDs or NSAIDs affect the lipids following 4-h and
24-h treatment. AsSR-IRMSprovidedaglobaloverviewofallbiomolecularchanges
that occurred in the HCT-8 cells following treatment with vehicle, BiNSAIDs or
NSAIDs(including cell cycle, cell death and drug-induced biomolecular changes),
additionalexperimental techniques shouldpotentiallybeemployed to confirm these
observations.Forinstance,astudytocomparetheeffectsoftheBiNSAIDs/NSAIDson
lipidsinisolatedsystems(e.g.cell-freelipidbilayers)isbeingconductedbyDillonand
Brown([68]andunpublishedresults),andanadditional invitro lipidomicstudyhas
beenperformedonisolatedlipidsfromdrug-treatedcells(seeChapter5).
Chapter4.Synchrotronradiationinfraredmicrospectroscopy
202
References
[1] D.McNaughtonandB.R.Wood.(2012)Synchrotroninfraredspectroscopyofcellsandtissue,Aust.J.Chem.,65,218-228.
[2] B. Stuart. (2004) Biological applications, In Infrared spectroscopy:Fundamentalsandapplications,pp137-165,JohnWiley&Sons,Ltd.
[3] L.M.Miller,G.D.SmithandG.L.Carr.(2003)Synchrotron-basedbiologicalmicrospectroscopy: From the mid-infrared through the far-infraredregimes,J.Biol.Phys.,29,219-230.
[4] D.Naumann.(2001)FT-infraredandFT-ramanspectroscopyinbiomedicalresearch,Appl.Spectrosc.Rev.,36,239-298.
[5] P. Dumas and L. Miller. (2003) Biological and biomedical applications ofsynchrotroninfraredmicrospectroscopy,J.Biol.Phys.,29,201-218.
[6] J. Sulé-Suso, D. Skingsley, G. D. Sockalingum, A. Kohler, G. Kegelaer,M.Manfait and A. J. El Haj. (2005) FT-IR microspectroscopy as a tool toassess lung cancer cells response to chemotherapy, Vib. Spectrosc., 38,179-184.
[7] S. Chio-Srichan, M. Réfrégiers, F. Jamme, S. Kascakova, V. Rouam andP.Dumas. (2008) Photosensitizer effects on cancerous cells: A combinedstudy using synchrotron infrared and fluorescencemicroscopies,Biochim.Biophys.ActaGen.Subj.,1780,854-860.
[8] R.Gasper, J.Dewelle,R.Kiss,T.Mijatovic andE.Goormaghtigh. (2009) IRspectroscopy as a new tool for evidencing antitumor drug signatures,Biochim.Biophys.ActaBiomembr.,1788,1263-1270.
[9] F. Draux, P. Jeannesson, C. Gobinet, J. Sule-Suso, J. Pijanka, C. Sandt,P.Dumas,M.ManfaitandG.D.Sockalingum.(2009)IRspectroscopyrevealseffect of non-cytotoxic doses of anti-tumour drug on cancer cells, Anal.Bioanal.Chem.,395,2293-2301.
[10] A. Derenne, R. Gasper and E. Goormaghtigh. (2010) Monitoring ofmetabolism perturbation in prostate PC-3 cancer cells by sub-lethalconcentrationsofmethotrexate,Spectroscopy,24.
[11] A.Derenne,R.GasperandE.Goormaghtigh. (2011)TheFTIRspectrumofprostatecancercellsallowstheclassificationofanticancerdrugsaccordingtotheirmodeofaction,Analyst,136,1134-1141.
[12] K. R. Flower, I. Khalifa, P. Bassan, D. Demoulin, E. Jackson, N. P. Lockyer,A.T.McGown,P.Miles,L.VaccariandP.Gardner.(2011)SynchrotronFTIRanalysisofdrugtreatedovarianA2780cells:anabilitytodifferentiatecellresponsetodifferentdrugs?,Analyst,136,498-507.
[13] C.Hughes,M.D.Brown,F. J.Ball,G.Monjardez,N.W.Clarke,K.R.Flowerand P. Gardner. (2012) Highlighting a need to distinguish cell cyclesignatures from cellular responses to chemotherapeutics in SR-FTIRspectroscopy,Analyst,137,5736-5742.
[14] G.Bellisola,M.DellaPeruta,M.Vezzalini,E.Moratti,L.Vaccari,G.Birarda,M.Piccinini,G.CinqueandC.Sorio.(2010)TrackinginfraredsignaturesofdrugsincancercellsbyFouriertransformmicrospectroscopy,Analyst,135,3077-3086.
[15] A. Mignolet, A. Derenne, M. Smolina, B. R. Wood and E. Goormaghtigh.(2016)FTIRspectralsignatureofanticancerdrugs.Candrugmodeofactionbeidentified?,Biochim.Biophys.ActaProteinsProteom.,1864,85-101.
Chapter4.Synchrotronradiationinfraredmicrospectroscopy
203
[16] H.-Y. N. Holman, M. C. Martin, E. A. Blakely, K. Bjornstad andW.R.McKinney.(2000)IRspectroscopiccharacteristicsofcellcycleandcelldeath probed by synchrotron radiation based Fourier transform IRspectromicroscopy,Biopolymers,57,329-335.
[17] J. Zhou, Z.Wang, S. Sun,M. Liu andH. Zhang. (2001) A rapidmethod fordetecting conformational changes during differentiation and apoptosis ofHL60 cells by Fourier-transform infrared spectroscopy, Biotechnol. Appl.Biochem.,33,127-132.
[18] N. Jamin, L.Miller, J.Moncuit,W.-H. Fridman, P. Dumas and J.-L. Teillaud.(2003)Chemicalheterogeneityincelldeath:CombinedsynchrotronIRandfluorescence microscopy studies of single apoptotic and necrotic cells,Biopolymers,72,366-373.
[19] F.GasparriandM.Muzio.(2003)MonitoringofapoptosisofHL60cellsbyFourier-transforminfraredspectroscopy,Biochem.J.,369,239-248.
[20] U. Zelig, J. Kapelushnik, R. Moreh, S. Mordechai and I. Nathan. (2009)Diagnosis of cell death bymeans of infrared spectroscopy,Biophys. J., 97,2107-2114.
[21] A. Lamberti, C. Sanges and P. Arcari. (2010) FT-IR spectromicroscopy ofmammalian cell culturesduringnecrosis andapoptosis inducedbydrugs,Spectroscopy,24.
[22] S. Boydston-White, M. Romeo, T. Chernenko, A. Regina, M. Miljković andM.Diem. (2006) Cell-cycle-dependent variations in FTIRmicro-spectra ofsingle proliferating HeLa cells: Principal component and artificial neuralnetworkanalysis,Biochim.Biophys.ActaBiomembr.,1758,908-914.
[23] J.R.Mourant,Y.R.Yamada,S.Carpenter,L.R.Dominiqueand J.P.Freyer.(2003) FTIR spectroscopy demonstrates biochemical differences inmammalian cell cultures at different growth stages, Biophys. J., 85,1938-1947.
[24] P. Heraud, E. S. Ng, S. Caine, Q. C. Yu, C. Hirst, R. Mayberry, A. Bruce,BR.Wood,D.McNaughton,E.G.StanleyandA.G.Elefanty.(2010)Fouriertransforminfraredmicrospectroscopyidentifiesearlylineagecommitmentindifferentiatinghumanembryonicstemcells,StemCellRes.,4,140-147.
[25] D.Ami,A.Natalello,P.Mereghetti,T.Neri,M.Zanoni,M.Monti,S.M.DogliaandC.A.Redi.(2010)FT-IRspectroscopysupportedbyPCA–LDAanalysisforthestudyofembryonicstemcelldifferentiation,Spectroscopy,24.
[26] D.Pozzi,P.Grimaldi,S.Gaudenzi,L.DiGiambattista,I.Silvestri,S.MorroneandA.CongiuCastellano.(2007)UVB-radiation-inducedapoptosisinJurkatcells: A coordinated fourier transform infrared spectroscopy-flowcytometrystudy,Radiat.Res.,168,698-705.
[27] L.DiGiambattista,P.Grimaldi,S.Gaudenzi,D.Pozzi,M.Grandi,S.Morrone,I. Silvestri andA.CongiuCastellano. (2010)UVBradiation inducedeffectsoncellsstudiedbyFTIRspectroscopy,Eur.Biophys.J.,39,929-934.
[28] M. J. Baker, J. Trevisan, P. Bassan, R. Bhargava,H. J. Butler, K.M. Dorling,P.R.Fielden,S.W.Fogarty,N. J.Fullwood,K.A.Heys,C.Hughes,P.Lasch,P.L.Martin-Hirsch,B.Obinaju,G.D.Sockalingum, J.Sulé-Suso,R. J.Strong,M. J.Walsh,B.R.Wood,P.GardnerandF.L.Martin. (2014)UsingFouriertransform IR spectroscopy to analyze biologicalmaterials,Nat. Protoc., 9,1771-1791.
Chapter4.Synchrotronradiationinfraredmicrospectroscopy
204
[29] M. Miljkovic, M. Romeo, C. Matthaus and M. Diem. (2004) Infraredmicrospectroscopy of individual human cervical cancer (HeLa) cellssuspendedingrowthmedium,Biopolymers,74,172-175.
[30] D.A.Moss,M.KeeseandR.Pepperkok.(2005)IRmicrospectroscopyoflivecells,Vib.Spectrosc.,38,185-191.
[31] K.L.Munro,K.R.Bambery,E.A.Carter,L.Puskar,M. J.Tobin,B.R.WoodandC.T.Dillon. (2010)Synchrotronradiation infraredmicrospectroscopyof arsenic-induced changes to intracellular biomolecules in live leukemiacells,Vib.Spectrosc.,53,39-44.
[32] M. J. Tobin, L. Puskar, R. L. Barber, E. C. Harvey, P. Heraud, B. R. Wood,K.R.Bambery, C. T. Dillon and K. L. Munro. (2010) FTIR spectroscopy ofsingle live cells in aqueous media by synchrotron IR microscopy usingmicrofabricatedsampleholders,Vib.Spectrosc.,53,34-38.
[33] E. J. Marcsisin, C. M. Uttero, M. Miljkovic and M. Diem. (2010) Infraredmicrospectroscopyoflivecellsinaqueousmedia,Analyst,135,3227-3232.
[34] L.Vaccari,G.Birarda, L.Businaro, S. Pacor andG.Grenci. (2012) Infraredmicrospectroscopyoflivecellsinmicrofluidicdevices(MD-IRMS):towardapowerfullabel-freecell-basedassay,Anal.Chem.,84,4768-4775.
[35] E. J.Marcsisin,C.M.Uttero,A. I.Mazur,M.Miljkovic,B.BirdandM.Diem.(2012) Noise adjusted principal component reconstruction to optimizeinfraredmicrospectroscopyofindividuallivecells,Analyst,137,2958-2964.
[36] D. E. Bedolla, S. Kenig, E. Mitri, P. Ferraris, A. Marcello, G. Grenci andL.Vaccari.(2013)DeterminationofcellcyclephasesinliveB16melanomacellsusingIRMS,Analyst,138,4015-4021.
[37] P. Zucchiatti, E. Mitri, S. Kenig, F. Billè, G. Kourousias, D. E. Bedolla andL.Vaccari. (2016) Contribution of ribonucleic acid (RNA) to the fouriertransform infrared (FTIR) spectrum of eukaryotic cells, Anal. Chem., 88,12090-12098.
[38] E. Mitri, S. Kenig, G. Coceano, D. E. Bedolla, M. Tormen, G. Grenci andL.Vaccari. (2015) Time-resolved FT-IR microspectroscopy of proteinaggregationinducedbyheat-shockinlivecells,Anal.Chem.,87,3670-3677.
[39] G.Birarda,D.E.Bedolla,E.Mitri,S.Pacor,G.GrenciandL.Vaccari.(2014)ApoptoticpathwaysofU937 leukemicmonocytes investigatedby infraredmicrospectroscopyandflowcytometry,Analyst,139,3097-3106.
[40] E.Mitri, G. Birarda, L. Vaccari, S. Kenig,M. Tormen andG. Grenci. (2014)SU-8bondingprotocolforthefabricationofmicrofluidicdevicesdedicatedtoFTIRmicrospectroscopyoflivecells,LabChip,14,210-218.
[41] G. Birada,G. Grenci andL. Vaccari. (2010) Synchrotron radiation infraredmicrospectroscopy (SR-IRMS) of living cells in physiological environment,In Microscopy: Science, Technology, Applications and Education (A.Méndez-Vilas and J. Díaz, Eds.), pp 422-432, Formatex Research Centre,Padajoz.
[42] D.R.Whelan,K.R.Bambery,P.Heraud,M.J.Tobin,M.Diem,D.McNaughtonandB.R.Wood. (2011)Monitoring thereversibleB toA-like transitionofDNA in eukaryotic cells using Fourier transform infrared spectroscopy,NucleicAcidsRes.,39,5439-5448.
[43] D. R. Whelan, K. R. Bambery, L. Puskar, D. McNaughton and B. R. Wood.(2013) Synchrotron Fourier transform infrared (FTIR) analysis of singlelivingcellsprogressingthroughthecellcycle,Analyst,138,3891-3899.

Chapter4.Synchrotronradiationinfraredmicrospectroscopy
205
[44] P.Heraud,B.R.Wood,M. J.Tobin, J.Beardall andD.McNaughton. (2005)Mappingofnutrient-inducedbiochemicalchangesinlivingalgalcellsusingsynchrotron infrared microspectroscopy, FEMS Microbiol. Lett., 249,219-225.
[45] D.A.Moss,M.KeeseandR.Pepperkok.(2005)IRmicrospectroscopyoflivecells,VibrationalSpectroscopy,38,185-191.
[46] N.Gierlinger,L.Goswami,M.Schmidt, I.Burgert,C.Coutand,T.RoggeandM. Schwanninger. (2008) In situ FT-IR microscopic study on enzymatictreatmentofpoplarwoodcross-sections,Biomacromolecules,9,2194-2201.
[47] M.J.Nasse,S.Ratti,M.GiordanoandC.J.Hirschmugl.(2009)Demountableliquid/flow cell for in vivo infrared microspectroscopy of biologicalspecimens,Appl.Spectrosc.,63,1181-1186.
[48] L.Quaroni,T.ZlatevaandE.Normand.(2011)Detectionofweakabsorptionchanges frommolecular events in time-resolvedFT-IR spectromicroscopymeasurementsofsinglefunctionalcells,Anal.Chem.,83,7371-7380.
[49] R. Zhao, L. Quaroni and A. G. Casson. (2010) Fourier transform infrared(FTIR)spectromicroscopiccharacterizationofstem-likecellpopulationsinhuman esophageal normal and adenocarcinoma cell lines, Analyst, 135,53-61.
[50] B.R.Wood.(2016)TheimportanceofhydrationandDNAconformationininterpreting infrared spectra of cells and tissues, Chem Soc Rev, 45,1980-1998.
[51] H.Y.Holman,R.Miles,Z.Hao,E.Wozei,L.M.AndersonandH.Yang.(2009)Real-time chemical imaging of bacterial activity in biofilms usingopen-channel microfluidics and synchrotron FTIR spectromicroscopy,Anal.Chem.,81,8564-8570.
[52] H.-Y.N.Holman,H.A.Bechtel,Z.HaoandM.C.Martin.(2010)SynchrotronIRspectromicroscopy:chemistryoflivingcells,Anal.Chem.,82,8757-8765.
[53] P. Bassan, A. Kohler, H. Martens, J. Lee, H. J. Byrne, P. Dumas, E. Gazi,M.Brown, N. Clarke and P. Gardner. (2010) Resonant Mie scattering(RMieS) correction of infrared spectra from highly scattering biologicalsamples,Analyst,135,268-277.
[54] B. Mohlenhoff, M. Romeo, M. Diem and B. R. Wood. (2005) Mie-typescattering and non-Beer-Lambert absorption behavior of human cells ininfraredmicrospectroscopy,Biophys.J.,88,3635-3640.
[55] M.Romeo,B.MohlenhoffandM.Diem.(2006)Infraredmicro-spectroscopyof human cells: Causes for the spectral variance of oral mucosa (buccal)cells,Vib.Spectrosc.,42,9-14.
[56] P. Bassan, A. Kohler, H.Martens, J. Lee, E. Jackson, N. Lockyer, P. Dumas,M.Brown, N. Clarke and P. Gardner. (2010) RMieS-EMSC correction forinfraredspectraofbiologicalcells:extensionusingfullMietheoryandGPUcomputing,J.Biophotonics,3,609-620.
[57] L.Vaccari,G.Birada,G.Grenci,S.PacorandL.Businaro.(2012)Synchrotronradiation infrared microspectroscopy of single living cells in microfluidicdevices: advantages, disadvantages and future perspectives, J. Phys. Conf.Ser.,359,012007.
[58] J.Soh,A.Chueng,A.Adio,A.J.Cooper,B.R.BirchandB.A.Lwaleed.(2013)Fourier transform infrared spectroscopy imaging of live epithelial cancercellsundernon-aqueousmedia,J.Clin.Pathol.,66,312-318.
Chapter4.Synchrotronradiationinfraredmicrospectroscopy
206
[59] K.Malek, B. R.Wood andK. R. Bambery. (2014) FTIR imaging of tissues:techniques and methods of analysis, In Optical Spectroscopy andComputational Methods in Biology and Medicine (M. Baranska, Ed.),pp419–473,Springer,Netherlands.
[60] D. Ami, P. Mereghetti and S. M. Doglia. (2012) Multivariate analysis forfourier transform infrared spectra of complex biological systems andprocesses, In Multivariate Analysis in Management, Engineering and theSciences,INTECH,OpenAccessArticle.
[61] M.Diem,A.Mazur,K.Lenau,J.Schubert,B.Bird,M.Miljkovic,C.KrafftandJ.Popp. (2013) Molecular pathology via IR and Raman spectral imaging,J.Biophotonics,6,855-886.
[62] R.BroandA.K.Smilde.(2014)Principalcomponentanalysis,Anal.Methods,6,2812-2831.
[63] Z. W. Yu and P. J. Quinn. (1994) Dimethyl sulphoxide: A review of itsapplicationsincellbiology,Biosci.Rep.,14,259-281.
[64] N. D. Weiner, M. Y. Lu and M. Rosoff. (1972) Interactions of dimethylsulfoxidewithlipidandproteinmonolayers,J.Pharm.Sci.,61,1098.
[65] H. Tapiero, G. Zwingelstein, A. Fourcade and J. Portoukalian. (1983) Theeffect of dimethyl sulfoxide on the membrane dynamics and thephospholipid composition of two different cell lines,Ann. N. Y. Acad. Sci.,411,383-388.
[66] T. J. Anchordoguy, J. F. Carpenter, J. H. Crowe and L. M. Crowe. (1992)Temperature-dependent perturbation of phospholipid bilayers bydimethylsulfoxide,Biochim.Biophys.ActaBiomembr.,1104,117-122.
[67] M.-A. l. de Ménorval, L. M. Mir, M. L. Fernández and R. Reigada. (2012)Effectsofdimethyl sulfoxide incholesterol-containing lipidmembranes:Acomparativestudyofexperimentsinsilicoandwithcells,PLoSOne,7,1-12.
[68] T.Brown. (2016)Bismuth-NSAIDsascolorectal cancerchemopreventives:Insights into their membrane interactions and uptake mechanisms,Bachelor of Medicinal Chemistry (Advanced) with Honours, University ofWollongong,Australia.
[69] A. A. Gurtovenko and J. Anwar. (2007) Modulating the structure andproperties of cell membranes: the molecular mechanism of action ofdimethylsulfoxide,J.Phys.Chem.B,111,10453-10460.
[70] T. Togo. (2006) Disruption of the plasma membrane stimulatesrearrangement of microtubules and lipid traffic toward the wound site,J.CellSci.,119,2780-2786.
[71] T.Togo,J.M.Alderton,G.Q.BiandR.A.Steinhardt.(1999)Themechanismoffacilitatedcellmembraneresealing,J.CellSci.,112,719-731.
[72] T.Togo,J.M.AldertonandR.A.Steinhardt.(2003)Long-termpotentiationof exocytosis and cell membrane repair in fibroblasts,Mol. Biol. Cell, 14,93-106.
[73] A.M.Schrader,S.H.Donaldson,Jr.,J.Song,C.Y.Cheng,D.W.Lee,S.HanandJ. N. Israelachvili. (2015) Correlating steric hydration forces with waterdynamics through surface force and diffusion NMR measurements in alipid-DMSO-H2Osystem,Proc.Natl.Acad.Sci.U.S.A.,112,10708-10713.
[74] G.DaViolante,N.Zerrouk,I.Richard,G.Provot,J.C.ChaumeilandP.Arnaud.(2002)Evaluationofthecytotoxicityeffectofdimethylsulfoxide(DMSO)onCaco2/TC7colontumorcellcultures,Biol.Pharm.Bull.,25,1600-1603.

Chapter4.Synchrotronradiationinfraredmicrospectroscopy
207
[75] Y. S. Kim,D. Tsao, B. Siddiqui, J. S.Whitehead, P. Arnstein, J. Bennett andJ.Hicks. (1980) Effects of sodium butyrate and dimethylsulfoxide onbiochemicalpropertiesofhumancoloncancercells,Cancer,45,1185-1192.
[76] J. F. Neault and H. A. Tajmir-Riahi. (1998) Interaction of cisplatin withhuman serum albumin. Drug binding mode and protein secondarystructure,Biochim.Biophys.Acta,1384,153-159.
[77] G.Abdel-RaoufAhmed,F.A.R.KhorshidandT.A.Kumosani.(2009)FT-IRspectroscopy as a tool for identification of apoptosis-induced structuralchanges in A549 cells treated with PM 701, Int. J. Nano Biomater., 2,396-408.
[78] L.Buriankova,Z.Nadova,D.Jancura,M.Refregiers,I.Yousef,J.MikesandP.Miskovsky. (2010) Synchrotron based Fourier-transform infraredmicrospectroscopy as sensitive technique for the detection of earlyapoptosisinU-87MGcells,LaserPhys.Lett.,7,613.
[79] M.N.Giraud,C.Motta,J. J.Romero,G.BommelaerandL.M.Lichtenberger.(1999) Interaction of indomethacin and naproxen with gastric surface-active phospholipids: a possible mechanism for the gastric toxicity ofnonsteroidal anti-inflammatory drugs (NSAIDs), Biochem. Pharmacol., 57,247-254.
[80] L.M.Lichtenberger,Y.Zhou,V.Jayaraman,J.R.Doyen,R.G.O'Neil,E.J.Dial,D. E. Volk, D. G. Gorenstein, M. B. Boggara and R. Krishnamoorti. (2012)Insight into NSAID-induced membrane alterations, pathogenesis andtherapeutics: characterization of interaction of NSAIDs withphosphatidylcholine,Biochim.Biophys.Acta,1821,994-1002.
[81] M.Suwalsky,M.Manrique-Moreno,J.Howe,K.BrandenburgandF.Villena.(2011)Molecularinteractionsofmefenamicacidwithlipidbilayersandredbloodcells,J.Braz.Chem.Soc.,22,2243-2249.
[82] K. Segawa and S. Nagata. (2015) An apoptotic 'eat me' signal:phosphatidylserineexposure,TrendsCellBiol.,25,639-650.
[83] S. Baritaki, S. Apostolakis, P. Kanellou, M. T. Dimanche-Boitrel, D. A.Spandidos and B. Bonavida. (2007) Reversal of tumor resistance toapoptotic stimuli by alteration of membrane fluidity: therapeuticimplications,Adv.CancerRes.,98,149-190.
[84] K. Z. Liu, L. Jia, S. M. Kelsey, A. C. Newland and H. H. Mantsch. (2001)Quantitative determination of apoptosis on leukemia cells by infraredspectroscopy,Apoptosis,6,269-278.
[85] S. Gaudenzi, D. Pozzi, P. Toroa, I. Silvestri, S. Morrone and A. Castellano.(2004)CellapoptosisspecificmarkerfoundbyFouriertransforminfraredspectroscopy,Spectroscopy,18,415–422.
[86] W. Fan, J. Li, J. Chen, L. Zhu, Y.Wang, B. Sun, B. Hua, C. Guo and Z. Yan.(2017)Aspirininhibitstheproliferationofsynovium-derivedmesenchymalstemcellsbyarrestingthecellcycleintheG0/G1phase,Am.J.Transl.Res.,9,5056-5062.
[87] M.Du,W.Pan,X.Duan,P.YangandS.Ge.(2016)Lowerdosageofaspirinpromotes cell growth and osteogenic differentiation in murine bonemarrowstromalcells,J.DentalSci.,11,315-322.
[88] R.A.Perugini,T.P.McDade,F.J.Vittimberga,Jr.,A.J.DuffyandM.P.Callery.(2000) Sodium salicylate inhibits proliferation and induces G1 cell cycle
Chapter4.Synchrotronradiationinfraredmicrospectroscopy
208
arrestinhumanpancreaticcancercell lines,J.Gastrointest.Surg.,4,24-32,discussion32-23.
[89] G. Birarda, G. Grenci, L. Businaro, B. Marmiroli, S. Pacor, F. Piccirilli andL.Vaccari. (2010) Infraredmicrospectroscopy of biochemical response oflivingcellsinmicrofabricateddevices,Vib.Spectrosc.,53,6-11.
209
Chapter5. Lipidomic profiling of glycerophospholipids using
ESI-MS/MS of HCT-8 cells treated with BiNSAIDs
andNSAIDs
This Chapter describes shotgun lipidomic profiling of the organic extracts of HCT-8
cells using electrospray ionisation tandem mass spectrometry (ESI-MS/MS). This
study was undertaken to compliment SR-IRMS studies reported in Chapter 4 that
showed that the most prominent biomolecular changes in BiNSAID/NSAID-treated
cells was that associated with lipids. The purpose of the lipidomic study was to
determine how treatmentwith BiNSAIDs or NSAIDs affects the spectral profile and
cellular concentration of the common phospholipids, phosphatidylcholine (PC),
phosphatidylethanolamine(PE)andphosphatidylserine(PS).
Chapter5.LipidomicprofilingofglycerophospholipidsusingESI-MS/MS
210
5.1 IntroductionPhospholipids are one of the major structural lipids found in eukaryotic cell
membranes and are essential for maintaining the biochemical and biophysical
propertiesofthecellmembrane[1].Theeukaryoticcellmembraneiscomprisedofa
phospholipid bilayer, embedded with other lipid molecules (namely sterols and
glycolipids) and membrane-embedded proteins [1]. The lipid bilayer provides
individual cells with a selective barrier from the extracellular environment and a
communication point between the intracellular and extracellular environments [1].
Additionally, lipid bilayers form discrete organelles within the intracellular space.
Theyareessentialforcompartmentalisationofspecificchemicalreactions,increasing
the biochemical efficiencywithin the cell [1]. Aswell as their structural role,many
phospholipidsaretheprecursorsforsecondarymessengers,whichplayanimportant
role in cellular functions including cell proliferation, apoptosis, signal transduction
pathwaysandtheregulationofmembranetrafficking[2].
Giventhe importanceofphospholipids inmaintaining thephysical integrityand
homeostasis of cells, changes to the composition of phospholipids associated with
apoptosis, in particular drug-induced apoptosis, have been increasingly investigated
[3-5]. The apoptoticprocess causes changes to thephospholipid compositionof the
outersurfaceofthecellmembraneandthephospholipiddistributionwithinthelipid
bilayer (most notably the externalisation of negatively-charged PS) [6]. Recently,
attention has focused on the importance of phospholipid composition in diseases,
includingcancerandtheirassociatedtreatment[7-9]. For instance,cancercellsthat
have a higher abundance of saturated phospholipids[10], exhibit changes in lipid
membrane dynamics and protein signal transduction, which can protect the cancer
cell fromoxidative stressby lowering the riskof lipidperoxidation. Additionally, as
lipidsmediateanumberofcellularprocessesthroughsignalingpathways,alterations
in lipid composition and signaling can result in changes to theway the cancer cells
respondtocertainchemotherapies[11].
Theresults fromtheSR-IRMSstudy(Chapter4) implied that therewasaglobal
effect on cellular lipids followingHCT-8 cell treatmentwithBiNSAIDs/NSAIDs. The
anti-inflammatoryeffectsofNSAIDsarisethroughtheinteractionwithlipidmediators
resulting in downstream consequences for arachidonic acid, which is derived from
phospholipidsintheplasmamembraneviaphospholipaseA2[12].Additionally,there
are several studies [13-16] suggesting that NSAIDs are capable of interaction with

Chapter5.LipidomicprofilingofglycerophospholipidsusingESI-MS/MS
211
phospholipids.Theseincludetheireffectonhydrophobicity,fluidityandpermeability
properties of membrane phospholipids; as such these effects could ultimately
contribute to the cell injury/toxicity observed following NSAID exposure.
Consequently, investigating changes to the cellular composition of common
phospholipids is a logical place to begin examining lipid-related effects of BiNSAIDs
andtherespectivefreeNSAIDsonthelipidomeofHCT-8cells.
Recently, lipidomics (or lipid profiling) has been increasingly utilised to study
various tissue and cellular lipidomes [17]. This has been aided by recent
advancementsinmassspectrometry(MS)techniques,whichhaveenabledresearchers
to study lipids with high sensitivity, allowing for the accurate characterisation,
identification, and quantification of thousands of lipid species in biological
samples[17].
5.1.1 Shotgun lipidomics:Electrospray ionisationmassspectrometry(ESI-MS)
andtandemMSfortheexaminationofphospholipids
While several MS approaches exist for the analysis of lipids, electrospray
ionisation tandem mass spectrometry (ESI-MS/MS) represents one of the most
commonly utilised techniques for achieving detailed structural analysis of
phospholipids in biological samples [18]. Two common approaches applied for
ESI-MS/MSanalysisoflipidsare:(i)thepartialseparationofthecrudelipidextractvia
high-performance liquid chromatography followed by infusion of the mobile phase
into theESI source [18];or (ii) thedirect infusionof the sample into theESI source
[19].Thelatterapproach,knownasshotgunlipidomics[19],wasthechosenapproach
inthestudydescribedinthisChapter.
The general protocol for the preparation of the lipid extracts from biological
materialsforshotgunlipidomicanalysisusingESI-MS/MSissummarisedinFigure5.1
where the subsequent phospholipid analysis is performedusing a triple quadrupole
(QqQ)instrumentwithanESIsource.AnESImassspectrumfromacrudelipidextract
providesaprofileofthelipidsthationiseinthechosenmode(i.e.positiveornegative).
However,sincethemassaccuracyofsomeMSinstrumentusedfortheseexperiments
may be low and the crude lipid extract (with potentially thousands of lipids) is
complicated, thecomplementary techniqueESI-MS/MS isoftenemployed to confirm
molecular identification[20]. ESI-MS/MS can be achieved through the use of aQqQ
massspectrometer,showninFigure5.1. InatraditionalESI-MS/MSexperimentina
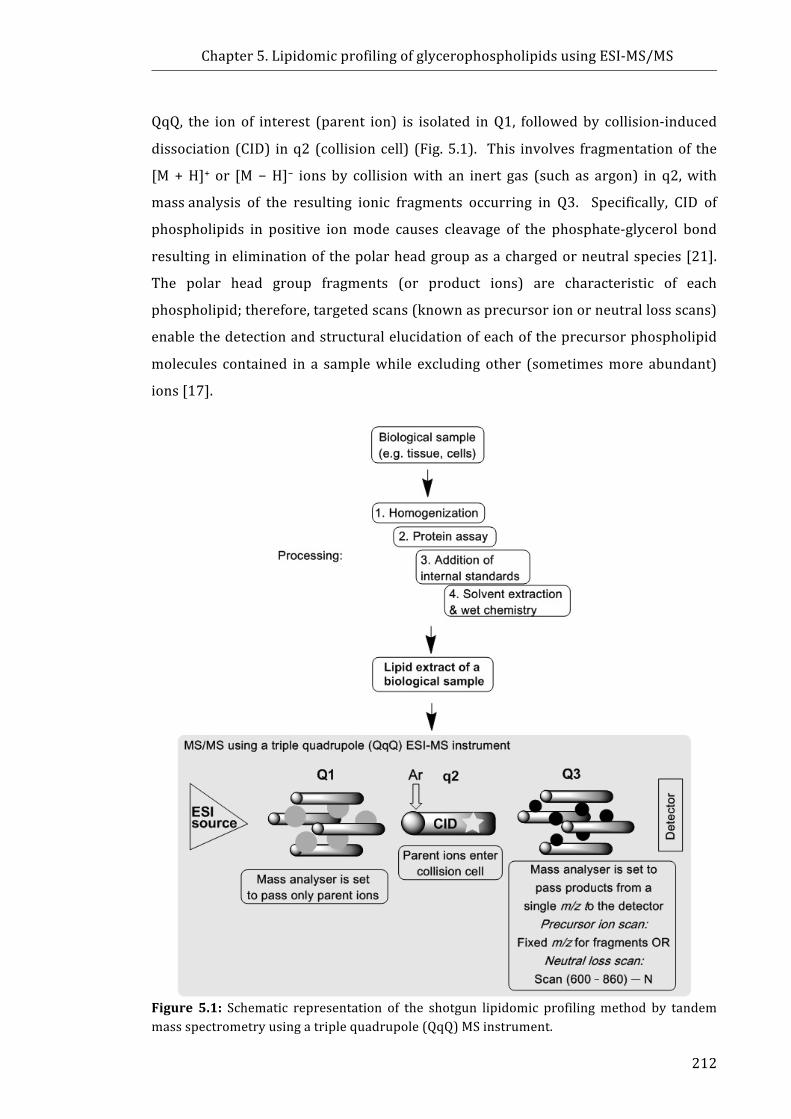
Chapter5.LipidomicprofilingofglycerophospholipidsusingESI-MS/MS
212
QqQ, the ion of interest (parent ion) is isolated inQ1, followedby collision-induced
dissociation (CID) inq2 (collisioncell) (Fig.5.1). This involves fragmentationof the
[M+H]+ or [M−H]− ions by collisionwith an inert gas (such as argon) in q2,with
massanalysis of the resulting ionic fragments occurring in Q3. Specifically, CID of
phospholipids in positive ionmode causes cleavage of the phosphate-glycerol bond
resulting ineliminationofthepolarheadgroupasachargedorneutralspecies[21].
The polar head group fragments (or product ions) are characteristic of each
phospholipid;therefore,targetedscans(knownasprecursorionorneutrallossscans)
enablethedetectionandstructuralelucidationofeachoftheprecursorphospholipid
molecules contained in a samplewhile excluding other (sometimesmore abundant)
ions[17].
Figure 5.1: Schematic representation of the shotgun lipidomic profilingmethod by tandemmassspectrometryusingatriplequadrupole(QqQ)MSinstrument.
Chapter5.LipidomicprofilingofglycerophospholipidsusingESI-MS/MS
213
5.1.2 Thestructureofglycerophospholipids
The general chemical structures of several common glycerophospholipids are
showninFigure5.2a.Glycerophospholipidsareamphipathicmoleculesthatcontaina
polarheadgrouplinkedtoa3-carbonglycerolbackboneinthesn-3position,andtwo
fattyacylmoleculesattachedtothesn-1andsn-2positionsoftheglycerolbackbone.
The fatty acyl molecules are bonded at the sn-1 position via an ester (diacyl
glycerophospholipids), alkyl ether (1-O-alkyl) or alkenyl ether (1-O-alkenyl)
linkage(Fig. 5.2a). The chemical structures of the PC, PE and PS head groups are
shown in Figure 5.2b. The head groups provide the glycerophospholipid with a
hydrophilic region. The final components of phospholipids are the fatty acyl
molecules, which comprise the hydrophobic region of the glycerophospholipid
molecule(Fig.5.2c).Fattyacylmoleculesareclassifiedbytheirchainlength(number
of carbons, typically 4−30). The number and position of double bonds, including
saturated (no double bonds), monounsaturated (one double bond) and
polyunsaturated(more thanonedoublebond),are furtherused toclassify fattyacyl
chains. The number of glycerophospholipid head groups, and the varying carbon
chain lengthsandnumber/positionofdoublebondsof fattyacids, essentiallymeans
thatover10,000uniquemolecularspeciesofglycerophospholipidscouldexist.

Chapter5.LipidomicprofilingofglycerophospholipidsusingESI-MS/MS
214
Figure5.2:Chemicalstructureof:(a)Glycerophospholipids,wheretheglycerolbackboneisinblack, thehydrophilicregion ishighlighted inblueandthehydrophobic fattyacylchainsarehighlighted in red. (b) Common glycerophospholipid head groups. (c) A fatty acid (18carbons in length) containing no double bonds (saturated), a single double bond(monounsaturated),andtwodoublebonds(polyunsaturated).
Chapter5.LipidomicprofilingofglycerophospholipidsusingESI-MS/MS
215
5.1.3 Nomenclatureofglycerophospholipids
Theglycerophospholipidnomenclatureused in this thesis is inaccordancewith
Fahyetal.[22].Glycerophospholipidsarenamedfirstlybytheirheadgroupandthen
bytheirfattyacylchains;forinstance,amoleculewithaphosphocholineheadgroup
andtwofattyacylchainscomprisedof16carbons(sn-1position)and18carbonswith
one double bond (sn-2 position) would be referred to as PC (16:0/18:1). The
experiments reported in this Chapterwereused to identify the total composition of
theglycerophospholipidmolecule,butdonotidentifytheindividualfattyacylchains.
In this instance, the sum composition (i.e. total quantity of carbons and number of
doublebonds)ispresentedinthename.Forexample,aPCmoleculecontainingatotal
of 34carbons in the fatty acyl chains and one double bond will be presented as
PC34:1.
It must be noted that one of the limitations of the commonly employed MS
techniques(asinthisstudy)istheinabilitytodistinguishisobaricspecieswitheither
odd-chainorether-linkedfattyacylgroups.Inaddition,theMSmethoduseddoesnot
allow for definitively distinguishing between glycerophospholipids containing an
1-O-alkenyletherversusglycerophospholipidswitha1-O-alkylether-linkedfattyacyl
groupcontainingadoublebond,asit isnotpossibletodeterminethepositionofthe
double bond along the fatty acyl chain. Therefore, it can only be determined that a
doublebondispresentinanether-linkedfattyacylchain. ThismeansaPCmolecule
withm/z746 canbe assigned to threedifferentmolecules; PC33:1 (odd-chain), PC
P-34:0 (1-O-alkenyl ether), or PCO-34:1 (1-O-alkyl ether). Odd-chain fatty acids
constitute veryminor components inmammals [23] andhavebeen reported at low
concentrationsinhumancancercelllines[3].Assuch,moleculeswithisobaricspecies
will bedesignatedas ether-linked, by the “O-”prefix, for the alkyl ether linked fatty
acid, and the “P-” prefix for the 1-O-alkenyl ether, or plasmalogen (e.g. PC O-34:1/
PCP-34:0).
5.1.4 Biologicalimportanceofglycerophospholipids
Ineukaryoticcellstheglycerophospholipidsaccountforapproximately60mol%
oflipidmass[19].Themostcommonphospholipidclassesfoundinmammaliancells
arePCandPE,whilePS,phosphatidylglycerol,diphosphatidylglycerol(orcardiolipin),
phosphatidylinositol and phosphatidic acid comprise less abundant phospholipid
speciesinmammaliancells[1].Inmosteukaryoticmembranes,PCandPEcollectively
Chapter5.LipidomicprofilingofglycerophospholipidsusingESI-MS/MS
216
comprise approximately 75mol%of total phospholipidmass, and are present in an
approximately3:2(PC:PE)molarratio[19].GiventheabundanceofPCandPEwithin
thecell,thesetwoglycerophospholipidswerechosenforlipidomicexaminationinthe
presentstudy.
As phospholipids are the major structural lipids found in eukaryotic cell
membranes, thevariation in themolecular structuresofphospholipidmoleculeshas
implications for cellularmembrane properties includingmembrane fluidity and the
modulationofmembrane-boundproteinactivity[1].Phospholipidsusuallydistribute
asymmetricallyinthecellmembraneswherePCcanbedominantlyfoundintheouter
monolayer, whilst PE and PS are mainly present in the inner monolayer of plasma
membranes [19]. The composition of the phospholipids contained in the lipid
membranes surrounding individual types of organelles can also differ [1]. For
instance,PEisparticularlyenrichedininnermembranesofmitochondria(∼35–40%
of totalphospholipids)comparedwithotherorganelles(∼17–25%)[24]. Duetothe
relativesizeofthePCheadgroup,PCmoleculesaretypicallycylindricalinshape[25].
Alternatively,PEmoleculescontainasmallerheadgroup,resultinginatypicallycone
shaped molecule [26]. PE molecules alone cannot form membranes, rather their
insertion into the membrane is essential for important cellular processes such as
membranefusionandfissionandtheembeddingofmembraneproteins[26].PEisthe
mostabundant lipidonthecytoplasmic layerofcellularmembranes,withsignificant
roles in cellular processes such as membrane fusion, cell cycle, autophagy, and
apoptosis [27]. PE molecules, similarly to PS, are translocated to the outer cell
membraneduringapoptosis [27-29]. Phospholipidsalsoplaya role incell signaling
pathways. For instance, the formation of the lipid mediators, prostaglandins and
leukotrienes, are derived from arachidonic acid sourced from the lipid
membrane[30].
As shown in Figure 5.2, there are two types of ether-containing
glycerophospholipids, 1-O-alkyl and 1-O-alkenyl. The ether-linked phospholipids
predominantly contain either a phosphocholine or a phosphoethanolamine head
group. Upto50%ofglycerophospholipidscontainether-linkedfattyacylchains,but
their functionsremain largelyunknown[31]. Ether-containingPCmolecules tendto
containthe1-O-alkylbondandaretypifiedbyplateletactivatingfactor[32,33]. The
1-O-alkenylglycerophospholipidscontainafattyacylgroupthathasavinyletherbond
(i.e. a double bond on the first carbon from the ether end, Fig. 5.2a) and are often
Chapter5.LipidomicprofilingofglycerophospholipidsusingESI-MS/MS
217
termed plasmalogens. Plasmalogens are particularly susceptible to oxidative attack
due to the presence of the vinyl-ether bond; as such, plasmalogens have a reported
antioxidant effect towards reactive species including ROS and iron-induced
peroxidation[33].Incertaincelltypes(e.g.,inflammatorycells,neurons,andtumour
cells), up to 70% of PE molecules contain an ether-linkage, rather than an acyl-
linkage[34].
5.1.5 ChapterAims
Themechanism(s)ofNSAID-inducedapoptosisincancercellsinvitroandinvivo
hasyet tobe fullydetermined,particularly in thecaseofCOX-2deficientcancercell
lines(discussedinSection1.2.4).IthasbeenshownthatanumberofNSAIDsinteract
directlywithglycerophospholipids,resultinginchangestothehydrophobicity,fluidity
andpermeabilitypropertiesofmembranephospholipids[13-16].GiventhatBiNSAID-
andNSAID-inducedapoptosisintheHCT-8cellswasidentifiedinChapter2,andthat
lipidvariationwasprominentintheSR-IRMSresults(Chapter4)itwasofinterestto
determine whether BiNSAID- and NSAID-induced apoptosis caused changes to the
glycerophospholipidcompositionofthemostabundantcellularglycerophospholipids,
PC,PEandPS,inHCT-8cells.
In this study, theanalysisof cellularglycerophospholipidswasperformedusing
shotgun lipidomics. The effect of two BiNSAIDs and their respective NSAIDs were
chosenforexaminationusinglipidextraction.Bi(tolf)3wasassessedduetothefactit
exhibitedhighesttoxicityagainsttheHCT-8cells,andBi(difl)3waschosenasthediflH
representedasalicylateacidstructureversusthefenamatestructuralgroupof tolfH.
Additionally,Bi(difl)3 exhibitedunusual toxicitywith respect to themolar IC50 ratio,
BiNSAID:NSAID(aspertheMTTassayresultspresentedinChapter2).
ThespecificaimsofthisChapterwereto:
1. DeterminewhetherBiNSAIDtreatmentaffectedthecompositionandrelative
quantity of abundant glycerophospholipid (PC, PE and PS)molecules in the
HCT-8 colon cancer cell line, and compare the effects to the corresponding
NSAIDtreatment.
2. ComparewhethertheeffectsonPC,PEandPScompositionandtheirrelative
quantitiesdifferedbetweenBiNSAIDtreatment(Bi(tolf)3andBi(difl)3).

Chapter5.LipidomicprofilingofglycerophospholipidsusingESI-MS/MS
218
5.2 MaterialsandMethods5.2.1 Materials
Allof thechemicalsandmaterialsused for thecell cultureand treatmentof the
cell samples in this Chapter have been previously described in Section 2.2.1.
Additionalchemicals(specifictotheexperimentsinthisChapter)includemagnesium
chloride hexahydrate (MgCl2.6H2O, ≥99%) and 2-mercaptoethanol (>98%), which
were purchased from Sigma Aldrich (St Louis, USA). QuickStartTM Bradford Dye
Reagent,1×andQuickStartTMbovineserumalbumin(BSA)standardset(2mg,1.5mg,
1mg,0.75mg,0.5mg,0.25mgand0.125mg)wereacquiredfromBio-Rad(Hercules
CA, USA). Analytical grade ammonium acetate(≥97%), chloroform (≥99.5%), and
methanol(≥99.7%)andweresourcedfromAjaxFinechem(SevenHills,Australia). A
methanolic internal standard mix (comprised of PC (19:0/19:0), 20µM; PE
(17:0/17:0), 20 µM; PS (17:0/17:0), 20 µM) was generously provided by
AssociateProfessorToddMitchell(SchoolofMedicine,UniversityofWollongong)and
prepared by Dr Jennifer Saville (School of Chemistry, University of Wollongong).
TheglycerophospholipidstandardswereoriginallyprocuredfromAvantiPolarLipids
(Alabaster,USA).
5.2.2 Celllines
HCT-8cellsweresourcedandemployedasdescribedinSection2.2.3.
5.2.3 Preparationofcelllipidextracts
HCT-8 cells (1×10⁶ cells, 5mL)were seeded in60-mmcell culturedishesand
incubated for24h,afterwhichthegrowthmediumwasremovedandthecellswere
washed twice with PBS solution. Treatment solutions of the BiNSAID (Bi(tolf)3 or
Bi(difl)3) or NSAID (tolfH or diflH) were added to each dish (3 mL RPMI-1640,
2%DMSOv/v),whilethecontrolcellswereincubatedwithvehicle(3mLRPMI-1640,
2%DMSOv/v)for24h.HCT-8cellsweretreatedwiththeapproximateIC50dosesof
each BiNSAID (as determined by MTT assays, Section 2.3.2), or an equimolar
concentration of the corresponding free NSAID. Following treatment, any detached
cellswerecollected. Theadherent cellswerewashedwithPBSsolution (1mL)and
anydisplacedcellswerecollected. Trypsin(0.25%inPBS,2mL)wasthenaddedto
eachdishand the remainderof the cellswas combinedwith thepreviouswashings.
The resultant suspension was centrifuged (300 g, 5 min) and the cell pellet was

Chapter5.LipidomicprofilingofglycerophospholipidsusingESI-MS/MS
219
washed with PBS solution to remove any trypsin. The cells were resuspended in
treatment medium(1mL) and the cell suspension was divided into two 500-µL
aliquots;onealiquotwasimmediatelyassessedforproteincontent,whilethesecond
aliquotwasstored(37°C,5%CO2)forlipidextractionandESI-MS/MSanalysis.
ThecellsinthefirstaliquotwerecentrifugedandwashedoncewithPBSsolution.
The cells were then resuspended in ice-cold osmotic lysis buffer (200 µL, 10 mM
HEPES, 5 mM MgCl2.6H20 and 20 mM 2-mercaptoethanol) and incubated on
ice(30min). Following this incubation the swollen cells were sheared 10 times
througha29-gaugesyringetocausedisruptionofthecellmembrane.Lysisefficiency
wasconfirmedbylightmicroscopy.Thedisruptedcellswerecentrifuged(20,000g,5
min) to collect lysed cellular debris and the supernatant (20 µL) was assayed for
proteinconcentrationwithBradfordreagentusingBSAasastandard.
Thesecondaliquotofcells,tobeusedforlipidextraction,wasremovedfromthe
incubatorandthecellswereresuspended.Acalculatedvolumeofthecellsuspension
(normalised to protein concentration) was removed and the cells were centrifuged
andwashedwith PBS solution. Theywere then resuspended inmethanol (500 µL)
andstoredovernightat−80°C.Thecellsamples(inmethanol)weretransferredtoa
glass test tube, chloroform(1mL)wasaddedand the solutionwasvortexedbriefly.
Thecellsampleswereplacedonanorbitalshakerat lowspeedfor1htoallowlipid
extraction to occur. Samples were spikedwith amethanolic internal standardmix
(50µL) such that he final concentration of each internal standard in all the cell
samples was 50nmol/mg protein. Following brief vortexing, ammonium acetate
solution (1mL, 0.15 M) was added and the solution was vortexed and centrifuged
(5min,2,000g). Theorganicphasewas removedand1mLof chloroform:methanol
(2:1 v/v) was added to the aqueous phase and vortexed and centrifuged (5 min,
2,000g).Theorganicphasewascombinedwiththepreviouslycollectedorganicphase
andafreshaliquotofammoniumacetate(500μL)wasadded.Theresultantsolution
wasvortexedandcentrifuged(5min,2,000g)followingwhich,theaqueousphasewas
removedusingaPasteurpipette.Carewastakentoensurethattheorganicphasewas
notdisturbed.Theorganicphasewasthendriedundernitrogenbeforereconstitution
in chloroform:methanol (1:2v/v, 500 μL). Samples were stored at −80°C until
ESI-MS/MSanalysiswasperformed.
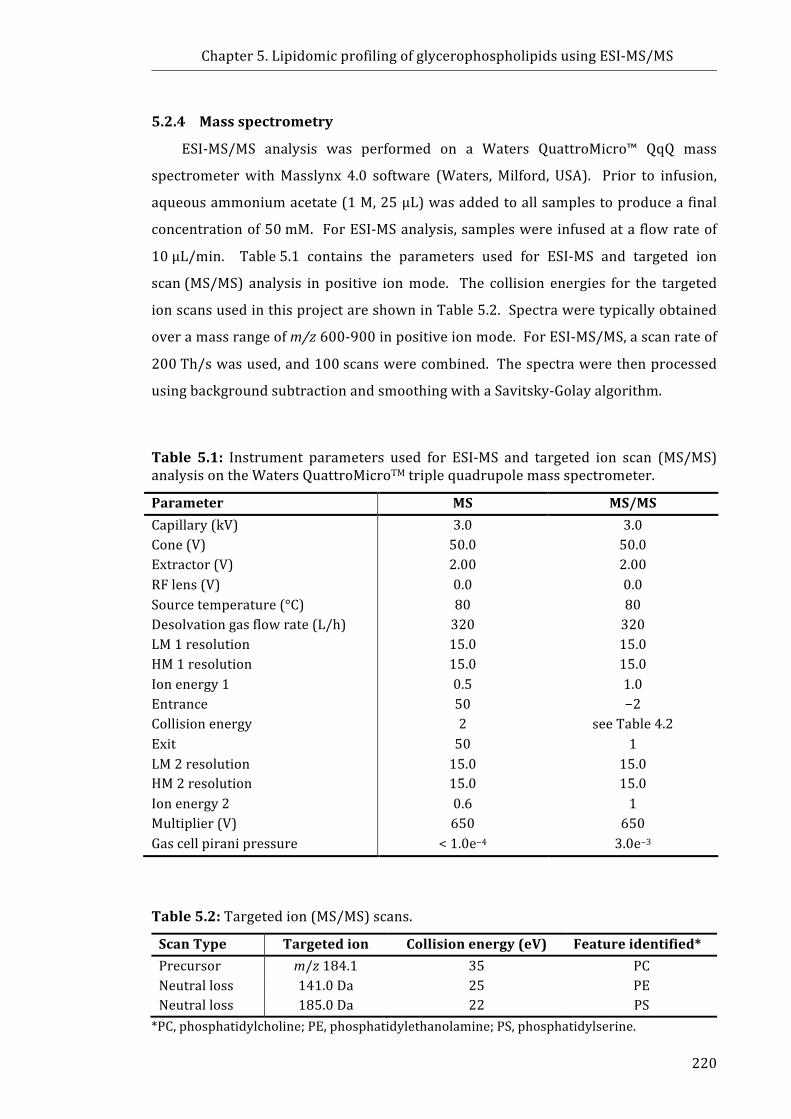
Chapter5.LipidomicprofilingofglycerophospholipidsusingESI-MS/MS
220
5.2.4 Massspectrometry
ESI-MS/MS analysis was performed on a Waters QuattroMicro™ QqQ mass
spectrometerwithMasslynx 4.0 software (Waters,Milford, USA). Prior to infusion,
aqueousammoniumacetate(1M,25μL)wasaddedtoallsamplestoproduceafinal
concentrationof50mM. ForESI-MSanalysis,sampleswereinfusedataflowrateof
10μL/min. Table5.1 contains the parameters used for ESI-MS and targeted ion
scan(MS/MS) analysis in positive ionmode. The collision energies for the targeted
ionscansusedinthisprojectareshowninTable5.2.Spectraweretypicallyobtained
overamassrangeofm/z600-900inpositiveionmode.ForESI-MS/MS,ascanrateof
200Th/swasused,and100scanswerecombined. Thespectrawerethenprocessed
usingbackgroundsubtractionandsmoothingwithaSavitsky-Golayalgorithm.
Table 5.1: Instrument parameters used for ESI-MS and targeted ion scan (MS/MS)analysisontheWatersQuattroMicroTMtriplequadrupolemassspectrometer.
Parameter MS MS/MSCapillary(kV) 3.0 3.0Cone(V) 50.0 50.0Extractor(V) 2.00 2.00RFlens(V) 0.0 0.0Sourcetemperature(°C) 80 80Desolvationgasflowrate(L/h) 320 320LM1resolution 15.0 15.0HM1resolution 15.0 15.0Ionenergy1 0.5 1.0Entrance 50 −2Collisionenergy 2 seeTable4.2Exit 50 1LM2resolution 15.0 15.0HM2resolution 15.0 15.0Ionenergy2 0.6 1Multiplier(V) 650 650Gascellpiranipressure <1.0e−4 3.0e−3
Table5.2:Targetedion(MS/MS)scans.
ScanType Targetedion Collisionenergy(eV) Featureidentified*Precursor m/z184.1 35 PCNeutralloss 141.0Da 25 PENeutralloss 185.0Da 22 PS*PC,phosphatidylcholine;PE,phosphatidylethanolamine;PS,phosphatidylserine.
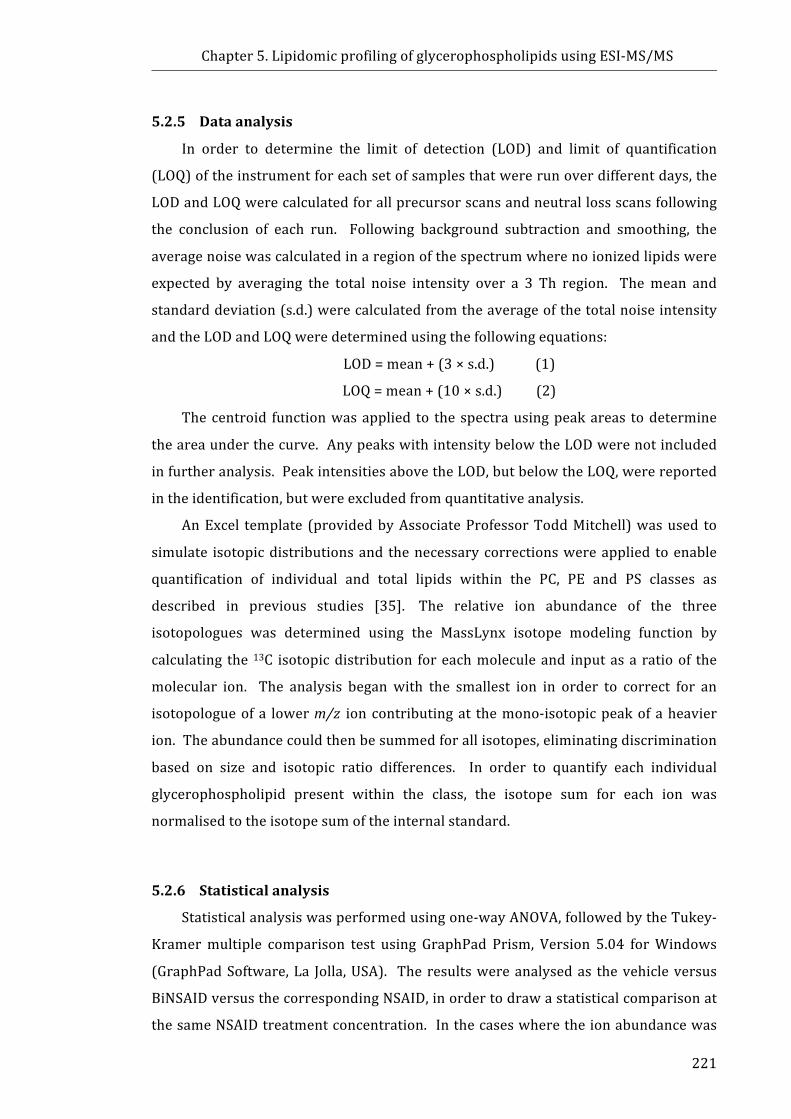
Chapter5.LipidomicprofilingofglycerophospholipidsusingESI-MS/MS
221
5.2.5 Dataanalysis
In order to determine the limit of detection (LOD) and limit of quantification
(LOQ)oftheinstrumentforeachsetofsamplesthatwererunoverdifferentdays,the
LODandLOQwerecalculatedforallprecursorscansandneutrallossscansfollowing
the conclusion of each run. Following background subtraction and smoothing, the
averagenoisewascalculatedinaregionofthespectrumwherenoionizedlipidswere
expected by averaging the total noise intensity over a 3 Th region. Themean and
standarddeviation(s.d.)werecalculatedfromtheaverageofthetotalnoiseintensity
andtheLODandLOQweredeterminedusingthefollowingequations:
LOD=mean+(3×s.d.)(1)
LOQ=mean+(10×s.d.)(2)
Thecentroid functionwasapplied to thespectrausingpeakareas todetermine
theareaunderthecurve.AnypeakswithintensitybelowtheLODwerenotincluded
infurtheranalysis.PeakintensitiesabovetheLOD,butbelowtheLOQ,werereported
intheidentification,butwereexcludedfromquantitativeanalysis.
AnExcel template (providedbyAssociateProfessorToddMitchell)wasused to
simulate isotopicdistributionsand thenecessarycorrectionswereapplied toenable
quantification of individual and total lipids within the PC, PE and PS classes as
described in previous studies [35]. The relative ion abundance of the three
isotopologues was determined using the MassLynx isotope modeling function by
calculating the 13C isotopicdistribution foreachmoleculeand inputasa ratioof the
molecular ion. The analysis beganwith the smallest ion in order to correct for an
isotopologueofa lowerm/z ioncontributingat themono-isotopicpeakofaheavier
ion.Theabundancecouldthenbesummedforallisotopes,eliminatingdiscrimination
based on size and isotopic ratio differences. In order to quantify each individual
glycerophospholipid present within the class, the isotope sum for each ion was
normalisedtotheisotopesumoftheinternalstandard.
5.2.6 Statisticalanalysis
Statisticalanalysiswasperformedusingone-wayANOVA,followedbytheTukey-
Kramermultiple comparison test using GraphPad Prism, Version 5.04 forWindows
(GraphPadSoftware,La Jolla,USA). Theresultswereanalysedas thevehicleversus
BiNSAIDversusthecorrespondingNSAID,inordertodrawastatisticalcomparisonat
thesameNSAIDtreatmentconcentration.Inthecaseswheretheionabundancewas
Chapter5.LipidomicprofilingofglycerophospholipidsusingESI-MS/MS
222
not detected above the LOD or LOQ in at least 75% of the samples, the ion was
excludedfromthestatisticalanalysis[36].Resultsarepresentedasmean±standard
deviation(s.d.).AvalueofP≤0.05wasconsideredstatisticallysignificant.
Chapter5.LipidomicprofilingofglycerophospholipidsusingESI-MS/MS
223
5.3 Results5.3.1 Phosphatidylcholine(PC)
The effect of BiNSAID and NSAID treatment on the individual and total PC
moleculesinHCT-8cellswasexaminedintwoways:(i)inspectingthechangesinthe
overallprofileof thePCmolecules(i.e. changes in therelativeabundanceofeachPC
moleculeasaproportionofthetotalofPC,Fig.5.3−5.5)and(ii)calculatingtheoverall
changestotherelativeconcentrationofPCmolecules(Fig.5.6).
TheprofilesofthePCmolecules(calculatedasapercentageoftotalPC)detected
above the LOD using ESI-MS/MS in HCT-8 cell lipid extracts treated with vehicle,
Bi(tolf)3ortolfHareshowninFigure5.3,whiletheprofilesfollowingtreatmentwith
vehicle, Bi(difl)3 or diflH are shown in Figure 5.4. For clarity, only molecules that
accounted for >0.5% relative abundance of the total PC molecules have been
presentedinFigures5.3and5.4. AsummaryofalltheidentifiedPCmoleculesabove
theLODcanbefoundinAppendix4.1.Asshownintheleft-mostgraphsofFigures5.3
and 5.4, the three most abundant PC molecules present in the vehicle- and
BiNSAID/NSAID-treated HCT-8 cell lipid extracts were PC 34:1 (m/z 760),
PC32:1(m/z 732) and PCP-32:0/O-32:1 (m/z 718). Notably, Bi(tolf)3 and tolfH
treatmentexhibitedverysimilarprofilechanges,whichdifferedsignificantlyfromthe
profile obtained from vehicle-treated cells (Fig. 5.3). Additionally, the Bi(difl)3 and
diflH treatment exhibited very similar profile changes, which differed significantly
from the profile obtained from vehicle-treated cells(Fig 5.4). However, the profile
changes induced by Bi(tolf)3/tolfH (Fig. 5.3) compared to Bi(difl)3/diflH (Fig. 5.4)
differedsomewhat.Forinstance,therelativeabundanceofthemostpredominantPC
molecule,PC34:1,decreasedintheBi(tolf)3/tolfH-treatedcells(Fig5.3),butincreased
intheBi(difl)3/diflH-treatedcells(Fig5.4)comparedtothevehicle.

Chapter5.LipidomicprofilingofglycerophospholipidsusingESI-MS/MS
224
Figure5.3:Profileofphosphatidylcholine(PC)moleculesinHCT-8cellsfollowing24-htreatmentw
ithvehicle(RPMI-1640,DMSO
2%v/v),Bi(tolf)3(15µM),ortolfH(45µM
),calculatedasapercentageoftotalPC.Dataarepresentedasmean±s.d.(n=3(vehicle)
orn=4(Bi(tolf)3andtolfH)replicatesfrom
oneexperiment.Significancewithrespecttothecontrolisindicatedbylp≤0.05
(BiNSAIDandNSAID),up≤0.05(BiNSAIDonly),ornp≤0.05(NSAIDonly).Forclarityonlymoleculesthataccountedfor>0.5%
relativeabundanceofthetotalPCmoleculeshavebeenpresented.N
ote:Oddorether-linkedfattyacylchain(e.g.PCO-34:0/PC33:1)
cannotbedifferentiatedinthisexperiment.
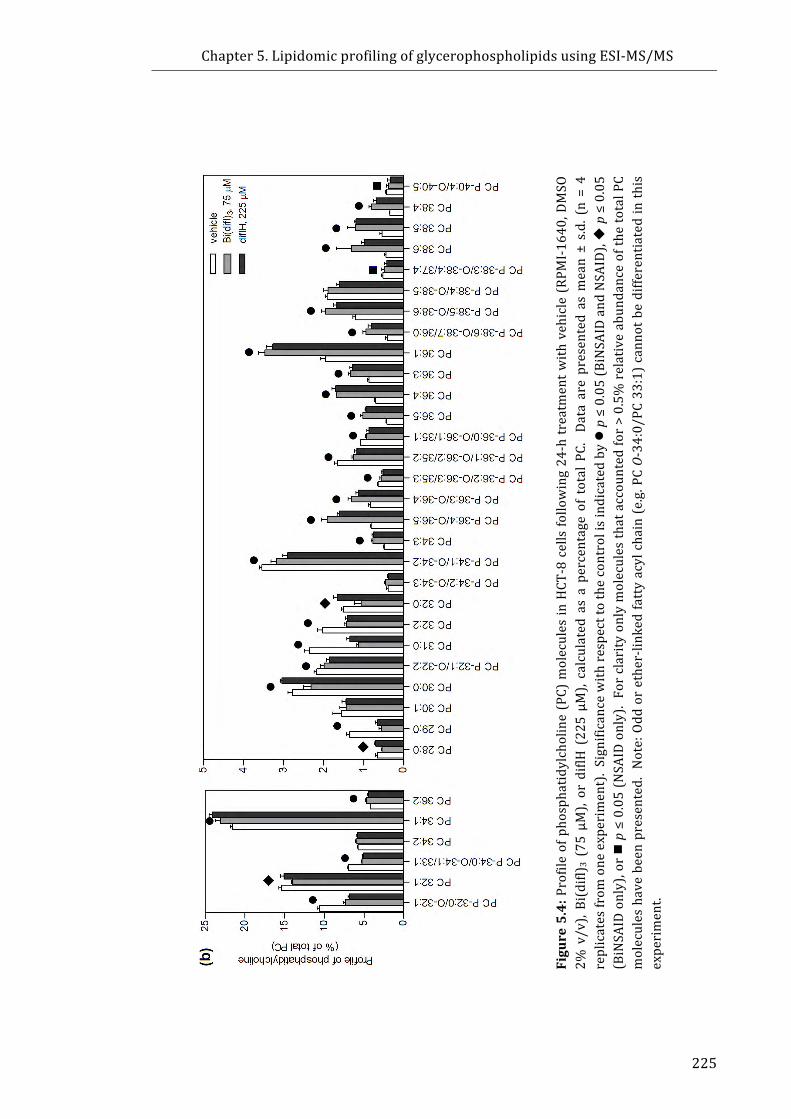
Chapter5.LipidomicprofilingofglycerophospholipidsusingESI-MS/MS
225
Figure5.4:Profileofphosphatidylcholine(PC)moleculesinHCT-8cellsfollowing24-htreatmentw
ithvehicle(RPMI-1640,DMSO
2%v/v),Bi(difl) 3(75µM),ordiflH(225µM
),calculatedasapercentageoftotalPC.Dataarepresentedasmean±s.d.(n=4
replicatesfrom
oneexperiment).Significancewithrespecttothecontrolisindicatedbylp≤0.05(BiNSAIDandNSAID),up≤0.05
(BiNSAIDonly),ornp≤0.05(NSAIDonly).Forclarityonlymoleculesthataccountedfor>0.5%
relativeabundanceofthetotalPC
moleculeshavebeenpresented.Note:Oddorether-linkedfattyacylchain(e.g.PCO-34:0/PC33:1)cannotbedifferentiatedinthis
experiment.

Chapter5.LipidomicprofilingofglycerophospholipidsusingESI-MS/MS
226
In order to identify if fatty acid composition accounts for the changes seen in
Figures 5.3 and 5.4, the PCmolecules were classified into the following categories:
those that contained fatty acidswithnodouble bonds (saturated), onedouble bond
(monounsaturated), ≥two double bonds (polyunsaturated), or an ether-linked fatty
acid. Theseweresummedwithin theaforementionedcategoriesand theresultsare
presented in Figure 5.5. It is important to note that in this context, the sum
composition of the two fatty acids have been reported and therefore saturated,
monounsaturated and polyunsaturated refers to the total number of double bonds
present. Although the identityofbothacylchainscouldnotbedeterminedwith the
methodologyusedinthepresentstudy,ithasbeenreportedthatthetypicalPCcarries
onesaturatedandoneunsaturatedchain[1].Following24-htreatmentwithBi(tolf)3
or tolfH, there was a slight, but significant decrease (Bi(tolf)3, P ≤ 0.01;
tolfH,P≤0.001) in the proportion of PC molecules containing monounsaturated or
polyunsaturated fatty acids compared to the cells treated with vehicle
alone(Fig.5.5a).Thesechangeswereconcurrentwithasignificantincrease(Bi(tolf)3,
P ≤ 0.01; tolfH, P≤ 0.001) in the proportion of PC molecules that contained
ether-linked fattyacids following24-h treatmentwithBi(tolf)3or tolfHcompared to
treatmentwith vehicle alone (Fig. 5.5a). No significant change to the proportion of
saturated PC molecules was observed (Fig. 5.5a). Additionally, no significant
differences were observed between the changes in the PC composition in
Bi(tolf)3-treatedcellswhencomparedtotolfH-treatedcells(Fig.5.5a).
Interestingly,Figure5.5bshowsthattheoppositetrendscouldbeidentifiedwhen
theBi(difl)3-anddiflH-treatedsampleswerecomparedtothevehicle-treatedsamples
wherebytherewasasmall(butsignificant)increaseinthepercentageofPCmolecules
containingmonounsaturated(Bi(difl)3,P≤0.01;diflH,P≤0.001),orpolyunsaturated
fattyacids (bothP≤0.001)compared to thecells treatedwithvehiclealone. These
observations (Fig. 5.5b) were concurrent with a significant decrease in saturated
(P≤0.001) and ether-linked PC molecules (both P≤0.001). Furthermore, while
Bi(difl)3 and diflH induced the same overall trends (i.e. concurrent increase or
decrease in relative proportion of PC in each fatty acid category, Fig. 5.5b), the
composition of PC between the Bi(difl)3 and diflH differed significantly in all cases
(unsaturated, P≤0.001; monounsaturated, P ≤ 0.01; polyunsaturated P ≤ 0.01; and
ether-linked,P≤0.001).
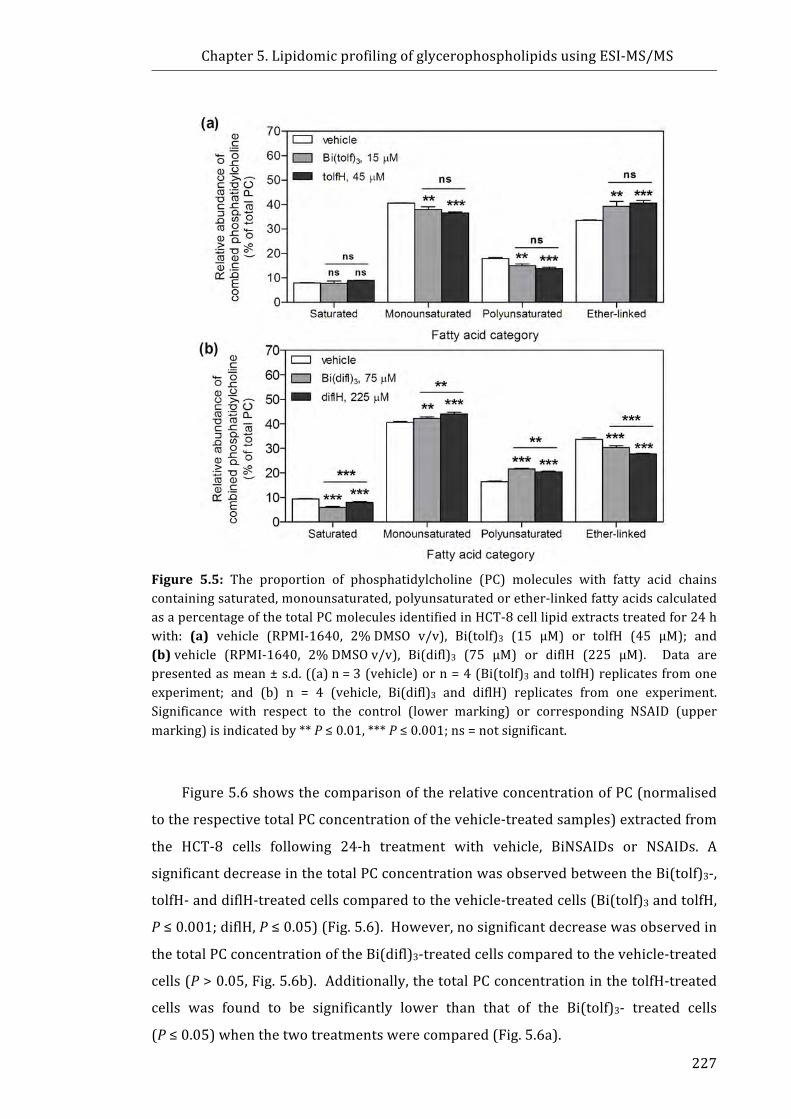
Chapter5.LipidomicprofilingofglycerophospholipidsusingESI-MS/MS
227
Figure 5.5: The proportion of phosphatidylcholine (PC) molecules with fatty acid chainscontainingsaturated,monounsaturated,polyunsaturatedorether-linkedfattyacidscalculatedasapercentageofthetotalPCmoleculesidentifiedinHCT-8celllipidextractstreatedfor24hwith: (a) vehicle (RPMI-1640, 2%DMSO v/v), Bi(tolf)3 (15 µM) or tolfH (45 µM); and(b)vehicle (RPMI-1640, 2%DMSOv/v), Bi(difl)3 (75 µM) or diflH (225 µM). Data arepresentedasmean±s.d.((a)n=3(vehicle)orn=4(Bi(tolf)3andtolfH)replicatesfromoneexperiment; and (b) n = 4 (vehicle, Bi(difl)3 and diflH) replicates from one experiment.Significance with respect to the control (lower marking) or corresponding NSAID (uppermarking)isindicatedby**P≤0.01,***P≤0.001;ns=notsignificant.
Figure5.6showsthecomparisonoftherelativeconcentrationofPC(normalised
totherespectivetotalPCconcentrationofthevehicle-treatedsamples)extractedfrom
the HCT-8 cells following 24-h treatment with vehicle, BiNSAIDs or NSAIDs. A
significantdecreaseinthetotalPCconcentrationwasobservedbetweentheBi(tolf)3-,
tolfH-anddiflH-treatedcellscomparedtothevehicle-treatedcells(Bi(tolf)3andtolfH,
P≤0.001;diflH,P≤0.05)(Fig.5.6).However,nosignificantdecreasewasobservedin
thetotalPCconcentrationoftheBi(difl)3-treatedcellscomparedtothevehicle-treated
cells(P>0.05,Fig.5.6b).Additionally,thetotalPCconcentrationinthetolfH-treated
cells was found to be significantly lower than that of the Bi(tolf)3- treated cells
(P≤0.05)whenthetwotreatmentswerecompared(Fig.5.6a).
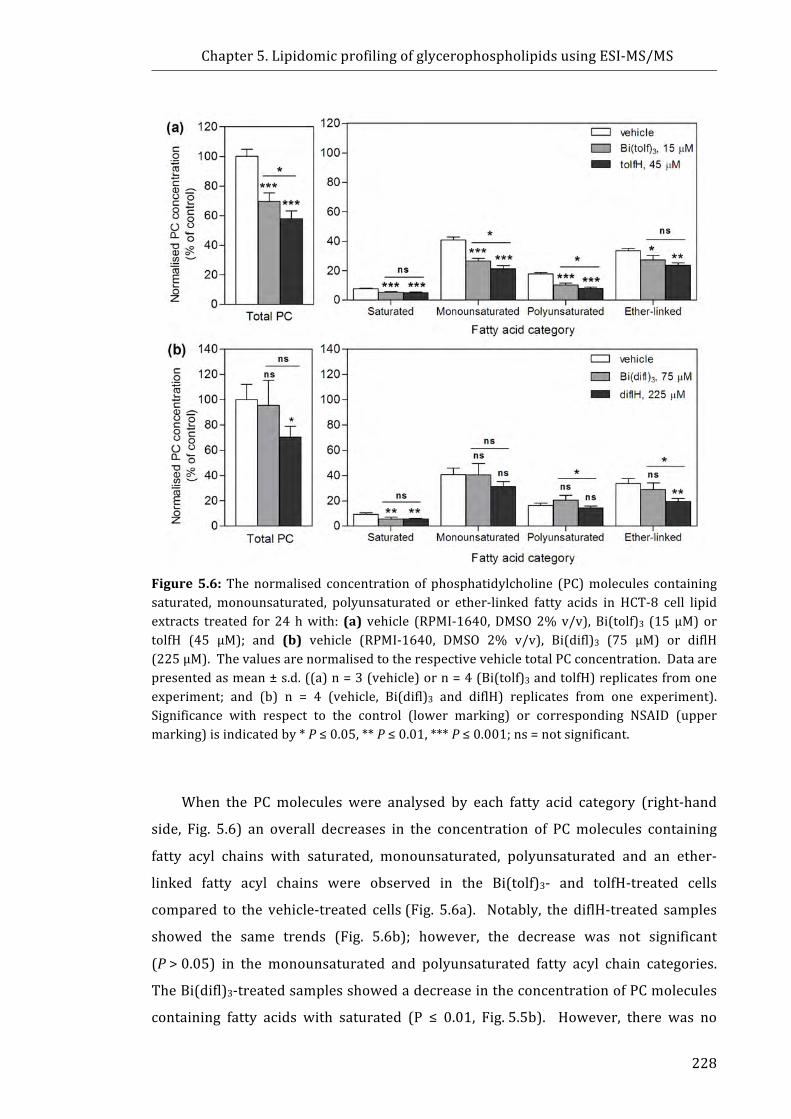
Chapter5.LipidomicprofilingofglycerophospholipidsusingESI-MS/MS
228
Figure5.6:Thenormalised concentrationof phosphatidylcholine (PC)molecules containingsaturated, monounsaturated, polyunsaturated or ether-linked fatty acids in HCT-8 cell lipidextracts treated for 24hwith: (a) vehicle (RPMI-1640,DMSO2%v/v), Bi(tolf)3 (15µM) ortolfH (45 µM); and (b) vehicle (RPMI-1640, DMSO 2% v/v), Bi(difl)3 (75 µM) or diflH(225µM).ThevaluesarenormalisedtotherespectivevehicletotalPCconcentration.Dataarepresentedasmean±s.d.((a)n=3(vehicle)orn=4(Bi(tolf)3andtolfH)replicatesfromoneexperiment; and (b) n = 4 (vehicle, Bi(difl)3 and diflH) replicates from one experiment).Significance with respect to the control (lower marking) or corresponding NSAID (uppermarking)isindicatedby*P≤0.05,**P≤0.01,***P≤0.001;ns=notsignificant.
When the PC molecules were analysed by each fatty acid category (right-hand
side, Fig. 5.6) an overall decreases in the concentration of PCmolecules containing
fatty acyl chains with saturated, monounsaturated, polyunsaturated and an ether-
linked fatty acyl chains were observed in the Bi(tolf)3- and tolfH-treated cells
compared to the vehicle-treated cells(Fig. 5.6a). Notably, the diflH-treated samples
showed the same trends (Fig. 5.6b); however, the decrease was not significant
(P>0.05) in the monounsaturated and polyunsaturated fatty acyl chain categories.
TheBi(difl)3-treatedsamplesshowedadecreaseintheconcentrationofPCmolecules
containing fatty acids with saturated (P ≤ 0.01, Fig.5.5b). However, there was no

Chapter5.LipidomicprofilingofglycerophospholipidsusingESI-MS/MS
229
significantdecrease intheconcentrationofPCmoleculeswithmonounsaturatedand
ether-linkedfattyacids(P>0.05,Fig.5.5b).TheslightincreaseinconcentrationofPC
molecules with polyunsaturated fatty acids in the Bi(difl)3-treated samples was not
foundtobesignificantcomparedtothevehicle-treatedsamples(P>0.05,Fig.5.5b).
5.3.2 Phosphatidylethanolamine(PE)
Figure5.7shows theprofilesof thePEmolecules (calculatedasapercentageof
totalPE)detectedabovetheLODusingESI-MS/MSinHCT-8celllipidextractstreated
withvehicle,BiNSAIDs,orNSAIDs.Asindicatedintheleft-mostgraphsofFigure5.7,
the most abundant PE molecules identified in HCT-8 cells treated with vehicle,
BiNSAIDsorNSAIDswerePE34:1,PE36:2,PE36:1,andPE38:4. Asummaryofall
the identified PE molecules above the LOD is shown in the Appendix 4.1. The
calculated LOD and LOQ values were slightly higher for the Bi(difl)3/diflH-treated
samples compared to theBi(tolf)3/tolfH-treatedsamples. Asa result ionabundance
didnot reach theLOD thresholdandseveralmoleculesofvery lowabundancewere
omittedfromtheresultspresentedinFigure5.7b.
AnalysisofPEprofilesrevealschangestotherelativeabundanceofPEmolecules
invehicle-treatedcellscomparedtotheBi(tolf)3-andtolfH-treatedcells(Fig.5.7).The
mostprominentdifferenceisseenintheether-linkedPEmolecules,PEP-38:5/O-38:6
(m/z750) and PE P-38:4/O-38:5 (m/z 752), which were approximately twice the
abundance in the Bi(tolf)3- and tolfH-treated cell samples compared to the vehicle-
treated cell sample (P≤ 0.05). Additionally, other lower abundance ether-linked
molecules showed an increase in relative abundance of PE molecules following
treatmentwithBi(tolf)3andtolfH, includingPEP-32:0/O-32:1,PEP-36:4/O-36:5,PE
P-36:3/O-36:4, and PEP-40:5/O-40:6 (Fig. 5.7a). This was accompanied by a
significantdecrease in theproportionofdiacylglycerolPEmolecules,specificallyPE
34:2,PE36:2,PE38:5,andPE38:4.
Analysis of PE profiles also revealed changes to the relative abundance of PE
molecules between vehicle-treated cells, and the Bi(difl)3- and diflH-treated cell
samples (Fig. 5.7b). Similarly to the Bi(tolf)3/tolfH-treated series (Fig. 5.7a), a
significantincreasewasobservedintheabundanceoftheether-linkedPEmolecules,
PEP-38:5/O-38:6 (m/z 750) and PE P-38:4/O-38:5 (m/z 752) in the Bi(difl)3- and
diflH-treatedcellsamplescomparedtothevehicle-treatedcellsample(P≤0.05).

Chapter5.LipidomicprofilingofglycerophospholipidsusingESI-MS/MS
230
Figure5.7:Profileofphosphatidylethanolamine(PE)moleculesinHCT-8cellsfollowing24htreatmentwith:(a)vehicle(DMSO2%v/v),Bi(tolf)3(15µM),ortolfH(45µM);and(b)vehicle(RPMI-1640,DMSO2%v/v),Bi(difl)3(75µM),ordiflH(225µM),calculatedasapercentageoftotalPE.Dataarepresentedasthemean±s.d.((a)n=3(vehicle)orn=4(Bi(tolf)3andtolfH)replicates from one experiment; (b) n = 4 (vehicle, Bi(difl)3 and diflH) replicates from oneexperiment).Significancewithrespecttothecontrolisindicatedbylp<0.05(bothBiNSAIDandNSAID),up<0.05(BiNSAIDonly),ornp<0.05(NSAIDonly).Note:Oddorether-linkedfattyacylchains(e.g.PEO-34:0/PE33:1)cannotbedifferentiatedinthisexperiment.
Chapter5.LipidomicprofilingofglycerophospholipidsusingESI-MS/MS
231
Theproportionof fattyacyl chainunsaturationorether-linked fattyacyl chains
calculatedasapercentageofthetotalPEmoleculesidentifiedinthevehicle-,Bi(tolf)3-
andtolfH-treatedHCT-8cell lipidextracts ispresentedinFigure5.8a. Followingthe
24-htreatmentwithBi(tolf)3ortolfH,therewasaslight(butinsignificant)decreasein
the percentage of monounsaturated PE molecules, but a significant decrease (P ≤
0.001) in the percentage of polyunsaturated PE molecules compared to the cells
treated with vehicle alone (Fig. 5.8a). These changes were concurrent with a
significant increase (P ≤ 0.001) in the percentage of PEmolecules containing ether-
linkedfattyacylchainsfollowingthe24-htreatmentwithBi(tolf)3ortolfH(Fig.5.8a).
NosignificantvariationwasobservedbetweentheBi(tolf)3-ortolfH-treatedsamples.
The changes in the PE profile of the Bi(difl)3/diflH series (Fig. 5.8b) differed
slightlyfromtheBi(tolf)3/tolfHseries(Fig.5.8a)wherebyBi(difl)3anddiflHtreatment
resultedinasignificantdecrease(P≤0.001)inthepercentageofmonounsaturatedPE
molecules,butasmallerdecrease(Bi(difl)3,P≤0.001;diflH,P>0.05,notsignificant)
inthepercentageofpolyunsaturatedPEmoleculescomparedtothecellstreatedwith
vehicle alone. However, similar to the result in Fig. 5.8a, a significant increase
(P≤0.001)inthepercentageofPEmoleculescontainingether-linkedfattyacylchains
wasobservedfollowing24-htreatmentwithBi(difl)3ordiflH(Fig.5.8b).Asobserved
in Figure 5.8b, Bi(difl)3 treatment caused more pronounced changes to the overall
proportion of PE containingmonounsaturated (P ≤ 0.01) and polyunsaturated (P ≤
0.05)fattyacylchainswhencomparedtotreatmentwithdiflH.
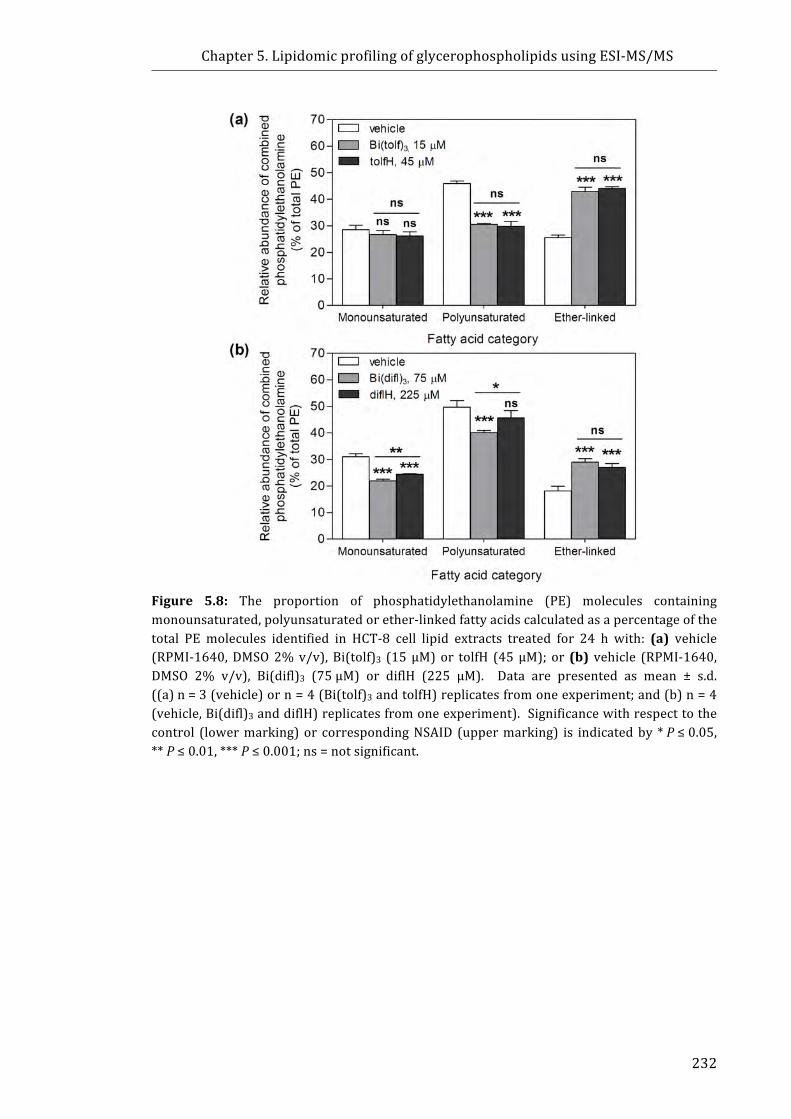
Chapter5.LipidomicprofilingofglycerophospholipidsusingESI-MS/MS
232
Figure 5.8: The proportion of phosphatidylethanolamine (PE) molecules containingmonounsaturated,polyunsaturatedorether-linkedfattyacidscalculatedasapercentageofthetotal PE molecules identified in HCT-8 cell lipid extracts treated for 24 h with: (a) vehicle(RPMI-1640,DMSO2%v/v),Bi(tolf)3 (15µM)or tolfH (45µM); or (b) vehicle (RPMI-1640,DMSO 2% v/v), Bi(difl)3 (75µM) or diflH (225 µM). Data are presented as mean ± s.d.((a)n=3(vehicle)orn=4(Bi(tolf)3andtolfH)replicatesfromoneexperiment;and(b)n=4(vehicle,Bi(difl)3anddiflH)replicatesfromoneexperiment).Significancewithrespecttothecontrol (lowermarking)or correspondingNSAID (uppermarking) is indicatedby *P≤0.05,**P≤0.01,***P≤0.001;ns=notsignificant.

Chapter5.LipidomicprofilingofglycerophospholipidsusingESI-MS/MS
233
A comparison of the relative concentration of PE (normalised to the respective
total concentration of the vehicle-treated samples) from the HCT-8 cells following
24-htreatmentwithvehicle,BiNSAIDsorNSAIDsispresentedinFigure5.9.Following
24-h treatment, an overall decrease in the total PE concentration of the Bi(tolf)3-
(P>0.05),tolfH-(P≤0.01)anddiflH-treated(P>0.05,notsignificant)cellscompared
to thevehicle-treated cells (Fig. 5.9)wasobserved. However, anoverall increase in
the concentration of PE was observed in Bi(difl)3-treated cells compared to the
vehicle-treated cells, although this was not statistically significant (Fig. 5.9b). As
showninFigure5.8a,thetotalPEwassignificantlydecreasedbytolfHtreatmentwhen
comparedtoBi(tolf)3treatment.
WhenthePEmoleculesweregroupedaccordingtofattyacidcategory(Fig.5.9),it
was apparent that there was an overall decrease in the concentration of
monounsaturatedPEmoleculesintheBi(tolf)3-(P≤0.05),tolfH-(P≤0.01)anddiflH-
treated(P≤0.05)cellscomparedtothecellstreatedwithvehiclealone.Nodecrease
was observed following Bi(difl)3 treatment (Fig. 5.9b). As shown in Figure 5.9a,
Bi(tolf)3andtolfHtreatmentalsoresultedinasignificantdecrease(bothP≤0.001)in
the relative concentration of polyunsaturated PE molecules relative to the vehicle
treatment. TreatmentwithdiflHalsoresultedinadecrease(P>0.05)intherelative
concentration of polyunsaturated PE molecules relative to the vehicle treatment;
however, no change was observed in the Bi(difl)3-treated samples (Fig. 5.9b). As
Figure 5.9 shows, all BiNSAID and NSAID treatments resulted in an increase in the
concentrationofether-linkedfattyacidPEmoleculescomparedtothevehicle-treated
cells, however, thiswas only statistically significant in the BiNSAID-treated samples
compared to the controls (P ≤ 0.01). In both treatment sets the BiNSAID-treated
samplesshowedasignificant(P≤0.05)increaseintheconcentrationofether-linked
moleculeswhencomparedtotheNSAIDtreatmentalone(Fig.5.9aand5.9b).
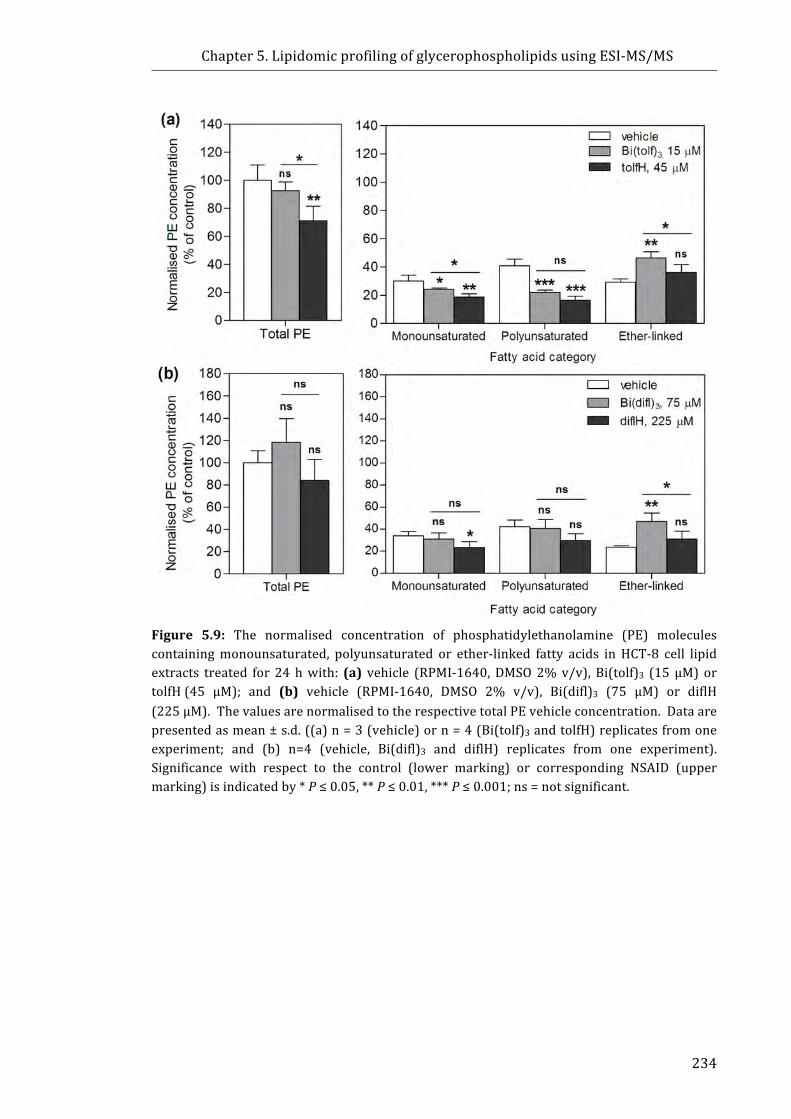
Chapter5.LipidomicprofilingofglycerophospholipidsusingESI-MS/MS
234
Figure 5.9: The normalised concentration of phosphatidylethanolamine (PE) moleculescontainingmonounsaturated, polyunsaturated or ether-linked fatty acids in HCT-8 cell lipidextracts treated for 24hwith: (a) vehicle (RPMI-1640,DMSO2%v/v), Bi(tolf)3 (15µM) ortolfH(45 µM); and (b) vehicle (RPMI-1640, DMSO 2% v/v), Bi(difl)3 (75 µM) or diflH(225µM).ThevaluesarenormalisedtotherespectivetotalPEvehicleconcentration.Dataarepresentedasmean±s.d.((a)n=3(vehicle)orn=4(Bi(tolf)3andtolfH)replicatesfromoneexperiment; and (b) n=4 (vehicle, Bi(difl)3 and diflH) replicates from one experiment).Significance with respect to the control (lower marking) or corresponding NSAID (uppermarking)isindicatedby*P≤0.05,**P≤0.01,***P≤0.001;ns=notsignificant.
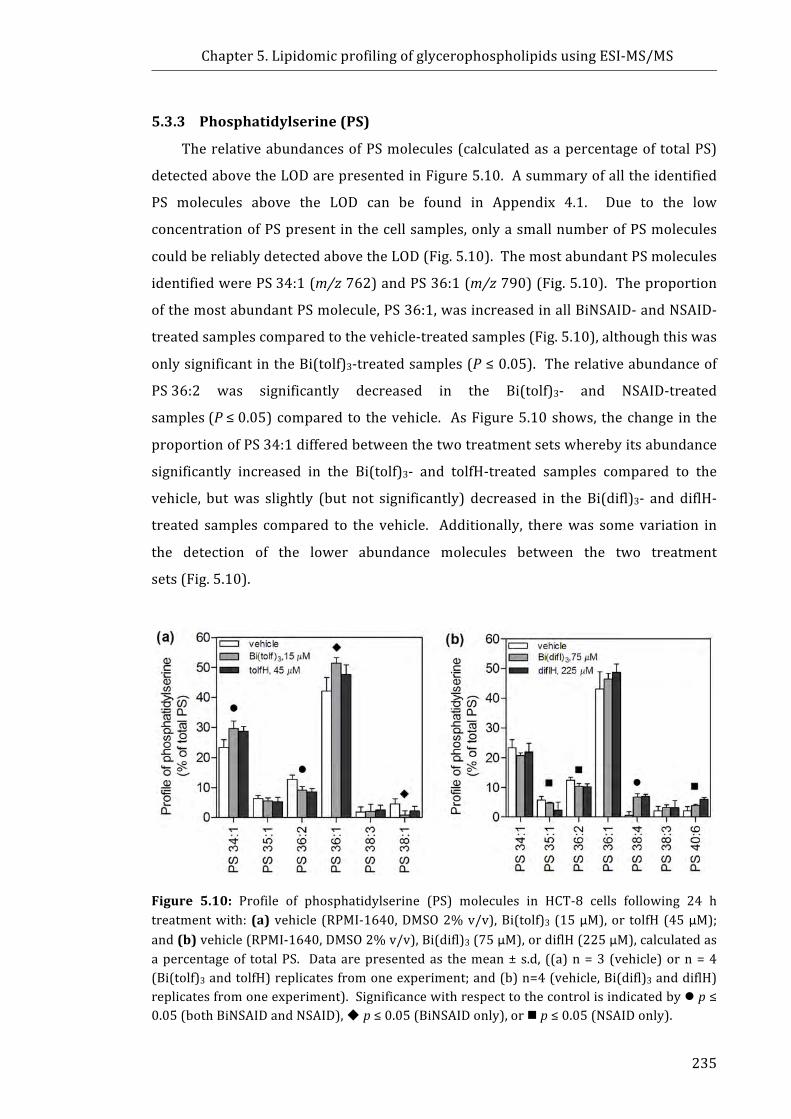
Chapter5.LipidomicprofilingofglycerophospholipidsusingESI-MS/MS
235
5.3.3 Phosphatidylserine(PS)
TherelativeabundancesofPSmolecules(calculatedasapercentageoftotalPS)
detectedabovetheLODarepresentedinFigure5.10.Asummaryofalltheidentified
PS molecules above the LOD can be found in Appendix 4.1. Due to the low
concentrationofPSpresentinthecellsamples,onlyasmallnumberofPSmolecules
couldbereliablydetectedabovetheLOD(Fig.5.10).ThemostabundantPSmolecules
identifiedwerePS34:1(m/z762)andPS36:1(m/z790)(Fig.5.10).Theproportion
ofthemostabundantPSmolecule,PS36:1,wasincreasedinallBiNSAID-andNSAID-
treatedsamplescomparedtothevehicle-treatedsamples(Fig.5.10),althoughthiswas
onlysignificantintheBi(tolf)3-treatedsamples(P≤0.05).Therelativeabundanceof
PS36:2 was significantly decreased in the Bi(tolf)3- and NSAID-treated
samples(P≤0.05)comparedto thevehicle. AsFigure5.10shows, thechange in the
proportionofPS34:1differedbetweenthetwotreatmentsetswherebyitsabundance
significantly increased in the Bi(tolf)3- and tolfH-treated samples compared to the
vehicle, butwas slightly (but not significantly) decreased in the Bi(difl)3- and diflH-
treated samples compared to the vehicle. Additionally, therewas somevariation in
the detection of the lower abundance molecules between the two treatment
sets(Fig.5.10).
Figure 5.10: Profile of phosphatidylserine (PS) molecules in HCT-8 cells following 24 htreatmentwith:(a) vehicle (RPMI-1640,DMSO2%v/v),Bi(tolf)3 (15µM),or tolfH(45µM);and(b)vehicle(RPMI-1640,DMSO2%v/v),Bi(difl)3(75µM),ordiflH(225µM),calculatedasapercentageof totalPS. Dataarepresentedas themean±s.d, ((a)n=3 (vehicle)orn=4(Bi(tolf)3andtolfH)replicatesfromoneexperiment;and(b)n=4(vehicle,Bi(difl)3anddiflH)replicatesfromoneexperiment).Significancewithrespecttothecontrolisindicatedbylp≤0.05(bothBiNSAIDandNSAID),up≤0.05(BiNSAIDonly),ornp≤0.05(NSAIDonly).

Chapter5.LipidomicprofilingofglycerophospholipidsusingESI-MS/MS
236
Fig5.11showsthecomparisonoftherelativeconcentrationofPS(normalisedto
therespectivetotalconcentrationofthevehicle-treatedsamples)fromtheHCT-8cells
following the 24-h treatment with vehicle, BiNSAIDs or NSAIDs. A decrease was
apparentinthetotalPSconcentrationoftheBi(tolf)3-(P≤0.05),tolfH-(P≤0.01)and
diflH-treated(P≤0.05)cellscomparedtothevehicle-treatedcells(Fig.5.11).Similar
tothePEresults(Fig.5.9),anincreaseinthetotalconcentrationofPSwasobservedin
Bi(difl)3-treatedcellscomparedtothevehicle-treatedcells(Fig.5.11b);however,this
resultwasnotstatisticallysignificant(P>0.05).
Figure5.11:Thenormalisedconcentrationofphosphatidylserine(PS)moleculesinHCT-8celllipidextractstreatedfor24hwith:(a)vehicle(RPMI-1640,DMSO2%v/v),Bi(tolf)3(15µM)or tolfH (45 µM); and (b) vehicle (RPMI-1640, DMSO 2% v/v), Bi(difl)3 (75 µM) or diflH(225µM).ThevaluesarenormalisedtotherespectivetotalPEvehicleconcentration.Dataarepresentedasmean±s.d.((a)n=3(vehicle)orn=4(Bi(tolf)3andtolfH)replicatesfromoneexperiment; and (b) n = 4 (vehicle, Bi(difl)3 and diflH) replicates from one experiments).Significance with respect to the control (lower marking) or corresponding NSAID (uppermarking)isindicatedby*P≤0.05,**P≤0.01,ns=notsignificant.
5.3.4 Summaryofresults
The overall trends observed in Sections 5.3.1-5.3.3 are presented in Tables 5.3
and5.4.InTable5.3and5.4,aredcolourindicatesadecreaseinprevalence,whilea
green colour represents an increase, andgrey indicatesno change. The intensity of
thecolourreflectsthesignificancelevel,wherebythedarkestshadeindicatesthemost
significance(P≤0.001). Table5.3showsthePCandPEprofilesof theBi(tolf)3-and
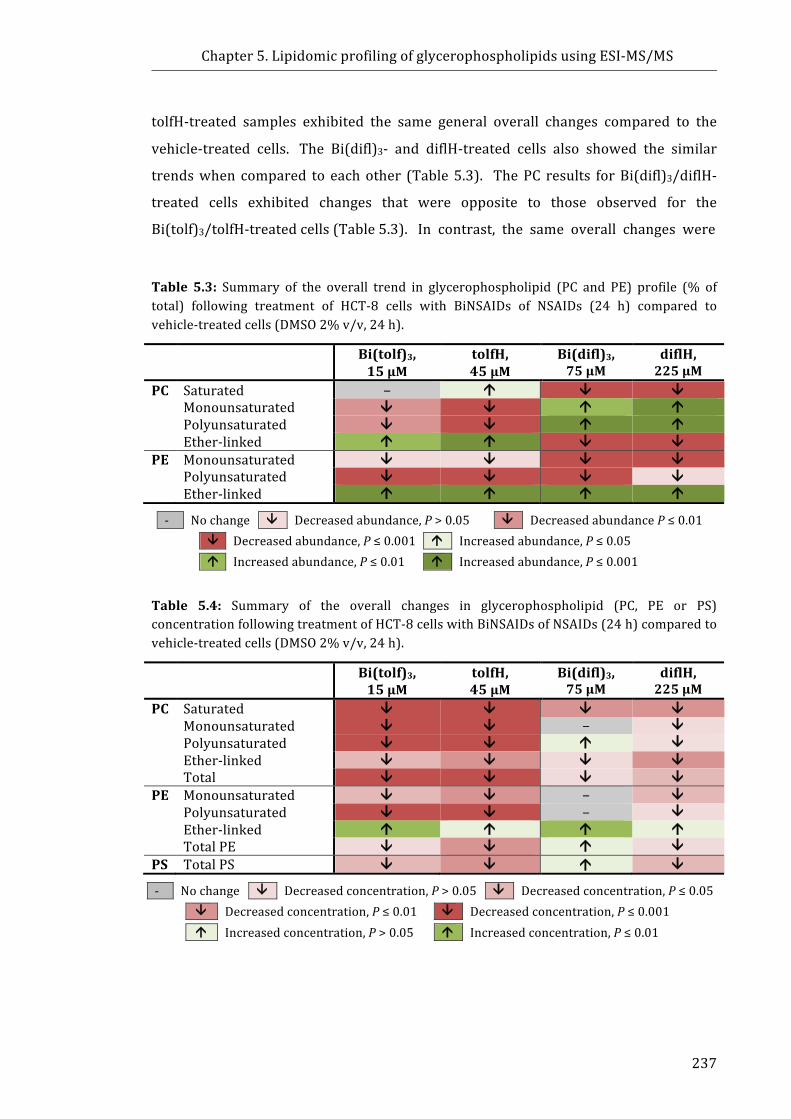
Chapter5.LipidomicprofilingofglycerophospholipidsusingESI-MS/MS
237
tolfH-treated samples exhibited the same general overall changes compared to the
vehicle-treated cells. The Bi(difl)3- and diflH-treated cells also showed the similar
trendswhen compared to eachother (Table5.3). ThePC results forBi(difl)3/diflH-
treated cells exhibited changes that were opposite to those observed for the
Bi(tolf)3/tolfH-treatedcells(Table5.3).Incontrast,thesameoverallchangeswere
Table 5.3: Summary of the overall trend in glycerophospholipid (PC and PE) profile (% oftotal) following treatment of HCT-8 cells with BiNSAIDs of NSAIDs (24 h) compared tovehicle-treatedcells(DMSO2%v/v,24h).
Bi(tolf)3,15µM
tolfH,45µM
Bi(difl)3,75µM
diflH,225µM
PC Saturated − á â â Monounsaturated â â á á Polyunsaturated â â á á Ether-linked á á â â PE Monounsaturated â â â â Polyunsaturated â â â â Ether-linked á á á á
- Nochange â Decreasedabundance,P>0.05 â DecreasedabundanceP≤0.01
â Decreasedabundance,P≤0.001 á Increasedabundance,P≤0.05
á Increasedabundance,P≤0.01 á Increasedabundance,P≤0.001
Table 5.4: Summary of the overall changes in glycerophospholipid (PC, PE or PS)concentrationfollowingtreatmentofHCT-8cellswithBiNSAIDsofNSAIDs(24h)comparedtovehicle-treatedcells(DMSO2%v/v,24h).
Bi(tolf)3,15µM
tolfH,45µM
Bi(difl)3,75µM
diflH,225µM
PC Saturated â â â â Monounsaturated â â − â Polyunsaturated â â á â Ether-linked â â â â Total â â â â PE Monounsaturated â â − â Polyunsaturated â â − â Ether-linked á á á á TotalPE â â á â PS TotalPS â â á â
- Nochange â Decreasedconcentration,P>0.05 â Decreasedconcentration,P≤0.05
â Decreasedconcentration,P≤0.01 â Decreasedconcentration,P≤0.001
á Increasedconcentration,P>0.05 á Increasedconcentration,P≤0.01

Chapter5.LipidomicprofilingofglycerophospholipidsusingESI-MS/MS
238
observed for PE composition following Bi(tolf)3/tolfH and Bi(difl)3/diflH
treatment(Table5.3).
Whenexamining theoverallchanges to therelativeconcentrationofPC,PEand
PSinducedbyBiNSAIDorNSAIDtreatmentinTable5.4,itwasobservedthatBi(tolf)3,
tolfHanddiflHexhibitedasimilaroveralltrend,wherebyanoveralldecreasein
concentration is observed in all PC and PE categories (with the exception of an
increase in PE ether-linked molecules), and total PS concentration following
treatment. As observed in Table 5.4, the Bi(difl)3-treated cell samples displayed
several differences from the three other treatments examined, whereby some
categoriesshowedanoverallincreaseornochangeinPC,PEandPSconcentration.
Chapter5.LipidomicprofilingofglycerophospholipidsusingESI-MS/MS
239
5.4 DiscussionThe overall aim of the experiments described in this Chapterwas to study the
most abundant glycerophospholipid classes in BiNSAID- and NSAID-treated HCT-8
cellsusingmethodsestablishedwithinthelaboratory[35-38].Thepurposeofthiswas
tofurtherinvestigatetheresultsobtainedinChapter4whichshowedlipidchangesin
BiNSAID/NSAID-treated cells. Specifically lipidomic analysis of the
glycerophospholipids, PC, PE and PS, using ESI-MS/MS was applied to two sets of
BiNSAID/NSAID-treatedHCT-8cell samples todetermine: (i)whetherchangescould
bedetectedintheglycerophospholipidprofilesofthedrug-treatedcellscomparedto
the vehicle-treated cells; (ii) if the relative concentrations of glycerophospholipids
were affected by BiNSAID/NSAID treatment; (iii) whether each BiNSAID and the
parent NSAID induced similar or different changes in the glycerophospholipid
composition or concentration; and (iv) whether any glycerophospholipid changes
induced by drug treatmentwere similar or differed between the twoBiNSAIDs and
correspondingNSAIDs examined. Thediscussionwill focus on these outcomeswith
respect to several key observations that stemmed from changes to the relative
concentrations of glycerophospholipids (Section5.4.1), the changes within the
glycerophospholipid saturation categories (Section 5.4.2), and the changes in the
abundance and relative concentrations of ether-linked glycerophospholipids
(Section5.4.3).
5.4.1 EffectofBiNSAIDandNSAIDtreatmentonphospholipidconcentration
The results in Section 5.3.1−5.3.3 indicated that the ESI-MS/MS technique was
sensitive enough to detect changes in the overall composition of the
glycerophospholipids selected for analysis. Additionally, the use of lipid internal
standardsallowedfortherelativequantificationofindividualPC,PEandPSmolecules.
ThetechniquewasparticularlysuccessfulforanalysingPCmolecules,whichgenerally
exhibit the highest abundance in mammalian cells [1]. The analysis of the lower
abundance molecules in the PE and PS samples approached the LOD for the
experimental conditions used. As such, a more sensitive instrument such as a
nano-ESI [39] would improve the detection of low abundance molecules if future
investigations were required. Overall, however, the ESI-MS/MS experiments
performedinthisChapterwereasuitablestartingpointtoinvestigatechangesinthe
dominantlipidsandpromisingresultshaverevealedsomeinterestingchangesinthe

Chapter5.LipidomicprofilingofglycerophospholipidsusingESI-MS/MS
240
relativeconcentrationsofthePC,PEandPSmoleculesinHCT-8cellsamplesfollowing
treatmentwithBiNSAIDsandNSAIDs.
The overall decrease in the relative concentration of glycerophospholipids
followingBi(tolf)3, tolfHanddiflH treatment (summarised inTable5.4) is consistent
with other studies wherein a decrease in the concentration of PC and PE has been
reported in a number of cell lines undergoing apoptosis [3, 40, 41]. For instance,
Anthony et al.[40] showed that drug-induced apoptosis results in inhibition of PC
synthesis in HL-60 leukaemia cells. Niebergall and Vance [41] determined that the
percentageofapoptoticcellsincreasedwhenbothmembranePCandPEdecreasedin
mutantChinesehamsterovarycellline,MT58.Finally,LiandYuan[3]reportthatthe
concentrationofPCandPEdecreased inHeLahumancervicalcancercells following
treatmentwith theanti-cancerdrugpaclitaxel.However,nochangewasobserved in
the concentration of PS in the study[3], which contrasts the results in Section
5.3.3. Theresults fromthe tolfH-treatedcells isconsistentwith theresults fromthe
SR-IRMSstudies,whichsuggestedthatfollowing24-htreatmentwithtolfHtheHCT-8
cells have lower lipid concentration than the vehicle-treated cells. The results from
the lipidomicanalysisofHCT-8cells indicate that theSR-IRMSobservationcouldbe
contributed toby loweredglycerophospholipid (PC,PEandPS) concentration in the
tolfH-treatedcells.
Interestingly,Bi(difl)3treatmentresultedinnosignificantchangestoPC,PEorPS
concentration inHCT-8cells (Table5.4). However, thediflH-treatedcellsamples(at
anequimolar treatmentconcentration),showedasignificantdecrease in therelative
concentration of PC and PS, similar to the Bi(tolf)3/tolfH-treated samples (albeit a
slightlylesssignificantdecrease,Table5.4).TheresultsobservedfromtheESI-MS/MS
analysis for the Bi(difl)3-treated cells were consistent with some of the other
experimental observations reported in this Thesis (PGE2 assays and SR-IRMS
experiments, Chapter 2 and Chapter 4, respectively), whereby Bi(difl)3 displayed a
different effect on the HCT-8 cells compared to the Bi(III) fenamate complexes,
Bi(tolf)3andBi(mef)3.ThedifferenceinthebiomolecularresponseoftheHCT-8cells
toBi(difl)3versusdiflHwasevidentintheSR-IRMSresults(Chapter4),althoughthere
issomedeviationfromtheresultsobservedfromthelipidomicanalysis(Section5.3).
Specifically,theSR-IRMSresultssuggestedthat24-htreatmentoftheHCT-8cellswith
diflHcausedanincreaseinlipids,whichwashypothesisedtooccurasaresultofthe
accumulationof lipiddroplets. Lipiddropletsarecomposedofacorecontainingthe
Chapter5.LipidomicprofilingofglycerophospholipidsusingESI-MS/MS
241
neutral lipids, triacylglycerols and cholesterol esters, surrounded by a phospholipid
monolayer (generally comprised of PC, PE, phosphatidylinositol and lysoPC, and
lysoPE)[42]. The results obtained from the lipidomic analysis (Section5.3) suggest
thatthisincreaseisnotduetoanincreaseinPC,PEorPSconcentration.Thisimplies
that instead an increase in the relative concentration of neutral lipids (such as
triacylglycerols and cholesterol esters)may be responsible for the large increase in
lipidSR-IRMSbandsobservedinthespectraof the24-hdiflH-treatedcells. Assuch,
futureworkcouldpotentiallyexpandthelipidomicanalysistoincludeneutralspecies
includingtriacylglycerols,cholesterolestersanddiacylglycerols.
5.4.2 TheeffectsofBiNSAIDandNSAIDtreatmentonfattyacylchainsaturation
WhileDNAisconsideredanimportanttargetforchemotherapeutics,researchers
have also considered the importance of the plasma membrane as a target for
anticancer therapies for anumberofdecades [43,44]. As there is little evidence to
suggest thatNSAIDs (orBiNSAIDs, Section3.3.2) interactwithDNA, othermeans of
cell death have been previously discussed, as described in Section 1.2.4. It is
importanttoconsidertheplasmamembraneasatargetforNSAIDs,sinceanumberof
NSAIDshavebeenshowntointeractwithlipids,andinparticular,phospholipids[13,
15,45]aspreviouslydiscussedinSection4.4.4.2.Oneparticularlyimportantproperty
of theplasmamembraneis fluidity.Thiscomesfromrecognisingthatmoleculesthat
modulatemembrane fluiditymay sensitise resistant tumour cells to chemotherapy-
induced cell death [46]. The level of unsaturation of fatty acids is an important
influence on the fluidity of membranes. For instance, the greater the number of
double bonds a fatty acyl molecule contains, the more physical space it occupies,
therefore influencing the fluidity of the bilayer. As such, changes in the relative
abundanceandconcentrationsofthesaturatedandunsaturatedPCandPEmolecules
werecomparedbetweenvehicle-,BiNSAID-,andNSAID-treatedcells.
Inthecurrentstudy,theBi(tolf)3-andtolfH-treatedcellsdisplayedadecreasein
the relative abundance and concentration of PC and PE molecules containing
monounsaturated and polyunsaturated fatty acids compared to the vehicle-treated
cells(Table5.3).Thisisconsistentwithotherstudies[3]thatreportedthatadecrease
inpolyunsaturatedfattyacidsprimarilycorrelatedwiththeoverallreductioninthePE
concentration in HeLa cells following paclitaxel-induced apoptosis. Li and Yuan [3]
also observed that in the PC class both polyunsaturated fatty acids and
Chapter5.LipidomicprofilingofglycerophospholipidsusingESI-MS/MS
242
monounsaturated fattyacidscontributedalmostequally to theobserveddecrease in
concentration in the HeLa cells, with a substantial decrease in saturated PCs also
observed. Themarkedreductioninthequantityofunsaturatedfattyacidssuggested
therewasapotentialdecreaseofmembranefluidityinHeLacellsfollowingpaclitaxel-
inducedapoptosis[3].
In contrast, no significant decreases were observed in the concentration of PC
moleculescontainingpolyunsaturatedfattyacidsfollowingtreatmentwithBi(difl)3or
diflH in theHCT-8 cell lipid extracts. Instead, the abundance of the unsaturatedPC
moleculeswassignificantly increased in theBi(difl)3/diflH-treatedcellscompared to
the vehicle-treated cells, which was opposite to the trend observed in the
Bi(tolf)3/tolfH-treated samples. These resultsmight suggest thatBi(difl)3 anddiflH-
treatedcells,experienceanincreaseinmembranefluidity.Ithasbeensuggestedthat
polyunsaturatedfattyacylchainsaremoresusceptibletoperoxidation,renderingcells
moresusceptibletooxidativestress-inducedcelldeath[10].Therefore,anincreasein
theabundanceofpolyunsaturatedPCandPEmoleculesstimulatedbyBi(difl)3ordiflH
treatmentmaybeanadvantageforinducingcelldeathintheHCT-8cellsastheremay
be increased potential for lipid peroxidation to occur. Future experiments could be
performed to examine whether the generation of reactive oxygen species (ROS) is
implicated in theapoptoticpathways inducedby theBiNSAIDs/NSAIDsexamined in
thisThesisandwhetherthereisanypotentialcorrelationwithlipidperoxidation.
The differences in the abundance and the saturation levels of the PC and PE
moleculesmay,inturn,resultinvariationsinfluiditybetweenthemembranesofthe
Bi(tolf)3-andBi(difl)3-treatedcells.ItisnotyetcleariftheinsertionofBi(tolf)3versus
Bi(difl)3 into thephospholipid bilayer surrounding the cellmay affect the fluidity of
thecellmembrane,orifcellulareventsrelatedtocelldeath(oracombinationofboth
factors) cause theobservedchanges. Asmentionedpreviously (Section3.4.1),work
hascommencedtoexaminetheinteractionsofBiNSAIDswithbilayermimeticsusing
neutronreflectometry(BrownandDillon[47]andunpublishedwork).Theresultsto
date show that Bi(tolf)3 interacts with the head groups of lipid bilayer membrane
mimics and partitions into the tail region of the membranes (comprised of POPC
molecules). While theseresultsweredetermined inacell-freesystem, itshowsthat
theBi(tolf)3complex isabletodisplace lipidmoleculesandpotentiallypartition into
lipid bilayers. Further studies are planned to introduce other integral membrane
components (includingcholesterolandmembrane-boundproteins) inorder tomore
Chapter5.LipidomicprofilingofglycerophospholipidsusingESI-MS/MS
243
closely mimic the cell membrane (personal communication). Additionally, it is
tempting tospeculate thatsubsequentcellmembranevariations(suchasmembrane
fluidityandtheimplicationsforactiveorpassivedruguptake)mayberesponsible(in
part)forthelargeproportionaldifferenceintheuptakeinBiobservedintheBi(tolf)3
andBi(difl)3-treatedcells(Chapter3),althoughfurtherworkisneededtodetermineif
thisisthecase.
5.4.3 TheeffectsofBiNSAIDandNSAIDtreatmentonether-linkedmolecules
One of themost interesting observations from the combined PC and PE profile
comparisonswas the effect that theBiNSAID andNSAID treatment imparted on the
relativeabundance(Fig.5.5andFig.5.8)andrelativeconcentration(Fig.5.6andFig.
5.9)ofether-linkedmolecules.Somecautionmustbetakenwheninterpretingether-
linkedmolecules due to the inability to distinguish thesemolecules from odd-chain
molecules as explained in Section 5.1.4. However, it is reported that plasmalogens
constitute ~15−20% of total phospholipids in cell membranes [32]. As such, it is
reasonable to assume that a substantial number of plasmalogens, and other ether-
linkedspecies,arepresentintheHCT-8cells.
TheresultsfromtheBiNSAID-andNSAID-treatedcellsindicateageneralincrease
intheabundanceofether-linkedPEmolecules(Table5.3),accompaniedbyanoverall
increase in the relative concentration of the ether-linked PE molecules (Table 5.4).
Additionally, it was observed that Bi(tolf)3 and tolfH caused an increase in the
abundanceofPCmoleculescontainingether-linkedfattyacidswhencomparedtothe
percent of the total PC (Fig. 5.5), although the relative concentration of all PCs
decreased (Fig. 5.6). An increase inPC andPE ether-linkedphospholipidshasbeen
observed in hematopoietic progenitor cells undergoing apoptosis following growth
factorwithdrawal, whichwas accompanied by a decrease in the relative content of
glycerophospholipids [48]. Fuchs et al. [48] speculated that an increase in ether-
linkedphospholipidsmayserveasareservoir forarachidonoyl residuesreleasedby
thebreakdownofdiacyl-glycerophospholipids,inordertoreducefurthermetabolism
ofarachidonicacidtopro-inflammatoryprostaglandins.TheBiNSAID/NSAID-treated
HCT-8cellsmaycauseaccumulationofarachidonicacidsincetheyactattheactivesite
of the COX-1/COX-2 enzymes to prevent arachidonic acid conversion to
prostaglandins. Additionally, the HCT-8 cells may upregulate arachidonic acid to
compete with the NSAIDs as tolfH and diflH are competitive/reversible COX-1/-2

Chapter5.LipidomicprofilingofglycerophospholipidsusingESI-MS/MS
244
inhibitors.Assuch,theaforementionedhypothesisproposedbyFuchsetal.[48]may
potentiallyprovideoneexplanation for the increase inether-linkedmolecules in the
BiNSAID/NSAID-treated HCT-8 cells since the cells would require a mechanism to
removeexcessarachidonicacid.
Schonfeldetal.[49]observedtheenhancedsynthesisofPEplasmalogensinPC12
cellsstimulatedwithnervegrowthfactoranddocosahexaenoicacid.Theauthors[49]
speculated that an increase in plasmalogen content was a possible reason for
enhanced resistance of nerve growth factor-differentiated cells to oxidative stress
allowing the cells to accumulate excessive intracellular Fe without undergoing cell
death. Anumberofstudies[50-54]havereportedthatNSAIDscancauseuncoupling
of oxidative phosphorylation mitochondria, an event that is synonymous with the
productionofROSproductionandoxidativestressduringapoptosis. Assuch, future
experimentsshouldbeperformedtodetermineifBiNSAID-inducedapoptosisleadsto
ROS production in HCT-8 cells in order to shed light onto the importance of ether-
linkedphospholipidproduction.
Oneofthedisadvantagesofusingconstantneutrallossof141Da(asperformed
inthepresentstudy),inordertodetermineether-linkedPEcontentinlipidmixtures,
isthatplasmalogenPEdonotundergoneutrallossofthePEheadgrouptothesame
extent as diacyl-PEmolecules [21]. This ismost likely attributed to the unique gas
phaseionchemistryimpartedbythevinylethersubstituentwhichaltersthefavorable
CID mechanism of the neutral loss of 141 Da from PE species [21]. As such, the
experimentalconditionsemployedinthepresentstudymaypotentiallyunderestimate
the presence of ether-linked PE species. Overall, the results from the ESI-MS/MS
analysisoftheHCT-8cellssuggestedthatether-linkedPCandPEmoleculesmayplay
an important role in response to BiNSAID/NSAID treatment and the implications of
thisresponseshouldbeinvestigatedfurther.
5.4.4 Overallsummaryoftheresultsandfuturedirections
The lipidomic analysis of vehicle-, BiNSAID- or NSAID-treated HCT-8 cells
suggested that, in addition to the glycerophospholipid changeswhich occurred as a
result of apoptosis, there were also additional effects resulting from each drug
treatment.Acombinationoftheseeffectshasresultedinsubstantialdifferencesofthe
PCandPEprofiles(andtoalesserextentthePSprofile)oftheBiNSAID-andNSAID-
treated cells compared to the vehicle-treated cells. The lipidomic analysis of HCT-8

Chapter5.LipidomicprofilingofglycerophospholipidsusingESI-MS/MS
245
cell lipid extracts suggests that Bi(tolf)3/tolfH treatment results in the activation of
different apoptotic responses compared to Bi(difl)3/diflH that influence the cellular
composition and relative concentrations of PC, PE andPS in theHCT-8 cells. These
results further demonstrate the difference in the biological response induced by
Bi(tolf)3 and Bi(difl)3 on the HCT-8 cells, whichwas observed in other experiments
presentedinthisThesis(reportedinChapters2-4).
Whilethereweresomeconsistenciesbetweentheobservationsobtainedfromthe
two techniques, the connection is speculative at this stage since it remains unclear
whether the glycerophospholipid changes detected using ESI-MS/MS analysis are
directlyresponsibleforthechangesdetectedintheSR-IRMSexperiments(Chapter4).
Gasper et al. were not able to correlatemass spectra and infrared bands related to
νas(CH2),νs(CH2),νas(CH3),νs(CH3)(i.e.between3025and2800cm−1)[5].Assuch,the
authors concluded that the overall global changes in lipid chains could not be
correlatedwithanyparticularlipidspeciesresolvedbymassspectrometryasalllipid
contributionsareoverlappedinthisspectralrange[5].Consequently,theresultsfrom
the ESI-MS/MS experiments performed in this study should be considered as a
complimenttothedataobtainedusingSR-IRMS(Chapter4).
While the results from the current study show that there are changes to the
profile and relative concentrations of PC, PE and PS in HCT-8 cells treated with
BiNSAIDs or NSAIDs when compared to vehicle-treated cells, it could not be
determinedwhetherthesechangesareadirectorindirecteffectofthedrugtreatment.
That is to say, it remains unknownwhetherBiNSAID orNSAID interactionwith the
identified glycerophospholipids leads to apoptosis, or whether the BiNSAID- or
NSAID-induced apoptosis results in the observed changes to the profiled
glycerophospholipids.Furtherexperiments(lipidomicandapoptosisassays)couldbe
performedatearliertimepoints(<24h)todetermineifglycerophospholipidprofile
changes are observedprior to the appearance of early apoptotic biomarkers (i.e.PS
exposure). Any futureESI-MS/MSexperimentsshouldalsoexaminetheeffectsofBi
alone and other anti-cancer agents, such as cisplatin, to draw a direct comparison
between these drugs and the BiNSAIDs/NSAIDs in HCT-8 cells. Unfortunately, the
preparation of the aforementioned samples was limited by time and resources (in
particular, the expense of phospholipid internal standards required to prepare an
increasednumberofsamples) in thepresentstudy. If thisbarriercanbeovercome,
further ESI-MS/MS experiments could also be expanded to other lipid species with

Chapter5.LipidomicprofilingofglycerophospholipidsusingESI-MS/MS
246
relativelyhighabundance inmammaliancells including: sphingomyelins, cholesterol
esters,triacylglycerols,diacylglycerols,andcardiolipins.
Chapter5.LipidomicprofilingofglycerophospholipidsusingESI-MS/MS
247
5.5 ChapterSummaryLipidomicanalysisoftreatedHCT-8cellsusingESI-MS/MSwasusedtodetermine
whetherBiNSAID/NSAIDtreatmentaffectsthecompositionofcommonphospholipids,
namelyPC,PEandPS.Specificobservationsincluded:
(i) Treatment of the HCT-8 cells with BiNSAIDs or NSAIDs significantly
altered the abundance of several individual PC, PE and PS molecules
comparedtotreatmentwithvehiclealone.
(ii) ThechangestotheabundanceoftheindividualPC,PEandPSmoleculesin
theoverallprofilesoftheBiNSAID-,andtherespectiveNSAID-treatedcells
alsodisplayedmanysimilarchangeswhencomparedtothevehicle.There
were some differences between the changes induced by Bi(tolf)3/tolfH
treatmentscomparedtotheBi(difl)3/diflHtreatments,suggestingthatthe
HCT-8 cells respondeddifferently to the fenamate compounds compared
tothesalicylatecompounds.
(iii) Changes were observed in the total concentration of PC, PE and PS
between the BiNSAID and NSAID-treated cells compared to the vehicle-
treated cells. However, when the PC and PE molecules were grouped
according to fatty acid categories, itwas observed that therewere some
differences to the overall trend (i.e. increase or decrease) between the
Bi(difl)3 and diflH-treated cells compared to the vehicle-treated cells,
whereastheBi(tolf)-andtolfH-treatedcellsinducedsimilarchanges.
(iv) The overall abundance of the ether-linked PC and PE molecules was
increasedbyallBiNSAIDandNSAIDtreatments,whichwasaccompanied
byan increase in the relative concentrationof ether-linkedPEmolecules
(butnotether-linkedPCmolecules).
Insummary,BiNSAIDandNSAIDtreatmentresultedinchangestothePC,PEand
PS composition of HCT-8 cells that was detected using ESI-MS/MS analysis. The
generalobservation fromthe lipidomicanalysiswas thatBiNSAID-andNSAIDsalter
glycerophospholipid abundance and concentration inHCT-8 cancer cells. Similar to
the results obtained from the MTT assays, flow cytometry, and PGE2 assays
(Chapter2),thepresenceofBiintheBi(tolf)3complexdidnotappeartosubstantially
alter theeffectsof tolfH,whereby theglycerophospholipid changes inducedby tolfH
wereminimally affected by the presence of Bi in theBi(tolf)3 complex. In contrast,
therewassomevariationbetweentheresultsobtainedfromBi(difl)3anddiflH-treated

Chapter5.LipidomicprofilingofglycerophospholipidsusingESI-MS/MS
248
HCT-8 cells. As such, furtherwork into the implications of phospholipid changes in
drug-inducedapoptosisshouldbeinvestigatedasthesemayhaveimplicationsforthe
mechanismofactionfortheBiNSAIDsandNSAIDs(inadditiontoCOXinhibition).

Chapter5.LipidomicprofilingofglycerophospholipidsusingESI-MS/MS
249
5.6 References[1] G. vanMeer,D. R. Voelker andG.W. Feigenson. (2008)Membrane lipids:where
theyareandhowtheybehave,Nat.Rev.Mol.CellBiol.,9,112-124.[2] K. M. Eyster. (2007) Themembrane and lipids as integral participants in signal
transduction: lipid signal transduction for the non-lipid biochemist,Adv. Physiol.Educ.,31,5-16.
[3] X.LiandY. J.Yuan.(2011)LipidomicanalysisofapoptoticHeLacells inducedbyPaclitaxel,Omics,15,655-664.
[4] M. Almada, M. R. Domingues, M. L. Dória, B. M. Fonseca, N. A. Teixeira andG.Correia-da-Silva. (2015)Lipidomicapproach towardsdecipheringanandamideeffectsinratdecidualcell,J.CellPhysiol.,230,1549-1557.
[5] R. Gasper, G. Vandenbussche and E. Goormaghtigh. (2011) Ouabain-inducedmodifications of prostate cancer cell lipidome investigated with massspectrometryandFTIRspectroscopy,Biochim.Biophys.Acta,1808,597-605.
[6] G.Kroemer,L.Galluzzi,P.Vandenabeele,J.Abrams,E.S.Alnemri,E.H.Baehrecke,M. V. Blagosklonny, W. S. El-Deiry, P. Golstein, D. R. Green, M. Hengartner,R.A.Knight, S.Kumar, S.A. Lipton,W.Malorni,G.Nunez,M.E. Peter, J. Tschopp,J.Yuan,M.Piacentini,B.Zhivotovsky,G.MelinoandNomenclatureCommitteeonCell Death. (2009) Classification of cell death: recommendations of theNomenclatureCommitteeonCellDeath2009,CellDeathDiffer.,16,3-11.
[7] M.L.Dória,C.Z.Cotrim,C.Simões,B.Macedo,P.Domingues,M.R.DominguesandL.A.Helguero.(2013)Lipidomicanalysisofphospholipidsfromhumanmammaryepithelialandbreastcancercelllines,J.CellPhysiol.,228,457-468.
[8] E.Marien,M.Meister,T.Muley,S.Fieuws,S.Bordel,R.Derua,J.Spraggins,R.VandePlas,J.Dehairs,J.Wouters,M.Bagadi,H.Dienemann,M.Thomas,P.A.Schnabel,R.M.Caprioli,E.WaelkensandJ.V.Swinnen.(2015)Non-smallcelllungcancerischaracterized by dramatic changes in phospholipid profiles, Int. J. Cancer, 137,1539-1548.
[9] K.A.Veselkov,R.Mirnezami,N.Strittmatter,R.D.Goldin,J.Kinross,A.V.M.Speller,T.Abramov,E.A. Jones,A.Darzi,E.Holmes, J.K.NicholsonandZ.Takats. (2014)Chemo-informatic strategy for imaging mass spectrometry-based hyperspectralprofiling of lipid signatures in colorectal cancer,Proc.Natl. Acad. Sci. U.S.A., 111,1216-1221.
[10] E.Rysman,K.Brusselmans,K.Scheys,L.Timmermans,R.Derua,S.Munck,P.P.VanVeldhoven,D.Waltregny,V.W.Daniels,J.Machiels,F.Vanderhoydonc,K.Smans,E.Waelkens, G. Verhoeven and J. V. Swinnen. (2010)De novo lipogenesis protectscancer cells from free radicals and chemotherapeutics by promotingmembranelipidsaturation,CancerRes.,70,8117-8126.
[11] S. Beloribi-Djefaflia, S. Vasseur and F. Guillaumond. (2016) Lipid metabolicreprogrammingincancercells,Oncogenesis,5,e189.
[12] J.Balsinde,M.V.WinsteadandE.A.Dennis.(2002)PhospholipaseA2regulationofarachidonicacidmobilization,FEBSLett.,531,2-6.
[13] L. M. Lichtenberger, Y. Zhou, V. Jayaraman, J. R. Doyen, R. G. O'Neil, E. J. Dial,D.E.Volk,D.G.Gorenstein,M.B.BoggaraandR.Krishnamoorti.(2012)InsightintoNSAID-induced membrane alterations, pathogenesis and therapeutics:characterization of interaction of NSAIDs with phosphatidylcholine, Biochim.Biophys.Acta,1821,994-1002.
[14] A.Sade,S.Tunçay,İ.Çimen,F.SevercanandS.Banerjee.(2012)CelecoxibreducesfluidityanddecreasesmetastaticpotentialofcoloncancercelllinesirrespectiveofCOX-2expression,Biosci.Rep.,32,35-44.
[15] M.Suwalsky,M.Manrique-Moreno,J.Howe,K.BrandenburgandF.Villena.(2011)Molecular interactionsofmefenamic acidwith lipidbilayers and redblood cells,J.Braz.Chem.Soc.,22,2243-2249.
Chapter5.LipidomicprofilingofglycerophospholipidsusingESI-MS/MS
250
[16] M. A. Barrett, S. Zheng, G. Roshankar, R. J. Alsop, R. K. R. Belanger, C. Huynh,N.Kučerka and M. C. Rheinstädter. (2012) Interaction of aspirin (acetylsalicylicacid)withlipidmembranes,PLoSOne,7,e34357.
[17] B. Brügger. (2014) Lipidomics: analysis of the lipid composition of cells andsubcellular organelles by electrospray ionization mass spectrometry, Ann. Rev.Biochem.,83,79-98.
[18] M. Pulfer and R. C. Murphy. (2003) Electrospray mass spectrometry ofphospholipids,MassSpectrom.Rev.,22,332-364.
[19] X.HanandR.W.Gross. (2005)Shotgun lipidomics: electrospray ionizationmassspectrometricanalysisandquantitationof cellular lipidomesdirectly fromcrudeextractsofbiologicalsamples,MassSpectrom.Rev.,24,367-412.
[20] G. Hart-Smith and S. J. Blanksby. (2011)Mass analysis, InMass Spectrometry inPolymerChemistry,pp5-32,Wiley-VCHVerlagGmbH&Co.KGaA.
[21] K.A.ZemskiBerryandR.C.Murphy.(2004)Electrosprayionizationtandemmassspectrometry of glycerophosphoethanolamine plasmalogen phospholipids, J. Am.Soc.MassSpectrom.,15,1499-1508.
[22] E. Fahy, S. Subramaniam, R. C. Murphy, M. Nishijima, C. R. Raetz, T. Shimizu,F.Spener,G.vanMeer,M.J.WakelamandE.A.Dennis.(2009)UpdateoftheLIPIDMAPScomprehensiveclassificationsystemforlipids,J.LipidRes.,50,S9-14.
[23] B. Jenkins, J. A. West and A. Koulman. (2015) A review of odd-chain fatty acidmetabolism and the role of pentadecanoic acid (C15:0) and heptadecanoic acid(C17:0)inhealthanddisease,Molecules,20,2425-2444.
[24] J. E. Vance. (2015) Phospholipid synthesis and transport in mammalian cells,Traffic,16,1-18.
[25] E. van den Brink-van der Laan, J. A. Killian and B. de Kruijff. (2004) Nonbilayerlipidsaffectperipheralandintegralmembraneproteinsviachangesinthelateralpressureprofile,Biochim.Biophys.Acta,1666,275-288.
[26] G.vanMeerandA.I.P.M.deKroon.(2011)Lipidmapofthemammaliancell,J.CellSci.,124,5-8.
[27] K. Emoto,N. Toyama-Sorimachi,H. Karasuyama,K. Inoue andM.Umeda. (1997)Exposureofphosphatidylethanolamineonthesurfaceofapoptoticcells,Exp.CellRes.,232,430-434.
[28] A. Marconescu and P. E. Thorpe. (2008) Coincident exposure ofphosphatidylethanolamineandanionicphospholipidsonthesurfaceofirradiatedcells,Biochim.Biophys.Acta1778,2217-2224.
[29] N. Maulik, V. E. Kagan, V. A. Tyurin and D. K. Das. (1998) Redistribution ofphosphatidylethanolamine andphosphatidylserine precedes reperfusion-inducedapoptosis,Am.J.Physiol.,274,H242-248.
[30] C. D. Funk. (2001) Prostaglandins and leukotrienes: advances in eicosanoidbiology,Science,294,1871-1875.
[31] J. Leßig and B. Fuchs. (2009) Plasmalogens in biological systems: their role inoxidative processes in biological membranes, their contribution to pathologicalprocessesandagingandplasmalogenanalysis,Curr.Med.Chem.,16,2021-2041.
[32] N.E.BravermanandA.B.Moser.(2012)Functionsofplasmalogenlipidsinhealthanddisease,Biochim.Biophys.ActaMol.BasisDis.,1822,1442-1452.
[33] P.Brites,H.R.WaterhamandR.J.A.Wanders.(2004)Functionsandbiosynthesisofplasmalogensinhealthanddisease,Biochim.Biophys.ActaMol.CellBiol.Lipids,1636,219-231.
[34] J. E. Vance. (2008) Phosphatidylserine and phosphatidylethanolamine inmammaliancells: twometabolically relatedaminophospholipids, J. LipidRes., 49,1377-1387.
[35] J. M. Deeley, T. W. Mitchell, X. Wei, J. Korth, J. R. Nealon, S. J. Blanksby andR.J.Truscott. (2008)Human lens lipidsdiffermarkedly from thoseof commonlyusedexperimentalanimals,Biochim.Biophys.Acta,1781,288-298.

Chapter5.LipidomicprofilingofglycerophospholipidsusingESI-MS/MS
251
[36] S.E.Norris,M.G.Friedrich,T.W.Mitchell,R. J.W.TruscottandP.L.Else.(2015)Humanprefrontalcortexphospholipidscontainingdocosahexaenoicacidincreaseduring normal adult aging, whereas those containing arachidonic acid decrease,Neurobiol.Aging,36,1659-1669.
[37] J. T. Saville, Z. Zhao, M. D. Willcox, S. J. Blanksby and T. W. Mitchell. (2010)Detectionandquantificationoftearphospholipidsandcholesterolincontactlensdeposits: the effect of contact lens material and lens care solution, Invest.Ophthalmol.Vis.Sci.,51,2843-2851.
[38] J.R.Hughes, J.M.Deeley,S. J.Blanksby,F.Leisch,S.R.Ellis,R. J.W.TruscottandT.W. Mitchell. (2012) Instability of the cellular lipidome with age, Age, 34,935-947.
[39] B. Brügger, G. Erben, R. Sandhoff, F. T. Wieland and W. D. Lehmann. (1997)Quantitative analysis of biologicalmembrane lipids at the lowpicomole level bynano-electrospray ionization tandem mass spectrometry, Proc. Natl. Acad. Sci.U.S.A.,94,2339-2344.
[40] M.L.Anthony,M.ZhaoandK.M.Brindle.(1999)Inhibitionofphosphatidylcholinebiosynthesis following induction of apoptosis in HL-60 cells, J. Biol. Chem., 274,19686-19692.
[41] L. J. Niebergall and D. E. Vance. (2012) The ratio of phosphatidylcholine tophosphatidylethanolamine does not predict integrity of growing MT58 Chinesehamsterovarycells,Biochim.Biophys.Acta,1821,324-334.
[42] T.FujimotoandR.G.Parton.(2011)Notjustfat:Thestructureandfunctionofthelipiddroplet,ColdSpringHarb.Perspect.Biol.,3,a004838.
[43] G.AranciaandG.Donelli. (1991)Cellmembranesastarget foranticanceragents,Pharmacol.Res.,24,205-217.
[44] T.R.TrittonandJ.A.Hickman.(1990)Howtokillcancercells:membranesandcellsignalingastargetsincancerchemotherapy,CancerCells,2,95-105.
[45] M.N.Giraud,C.Motta,J.J.Romero,G.BommelaerandL.M.Lichtenberger.(1999)Interaction of indomethacin and naproxen with gastric surface-activephospholipids: a possible mechanism for the gastric toxicity of nonsteroidalanti-inflammatorydrugs(NSAIDs),Biochem.Pharmacol.,57,247-254.
[46] S.Baritaki,S.Apostolakis,P.Kanellou,M.T.Dimanche-Boitrel,D.A.SpandidosandB.Bonavida.(2007)Reversaloftumorresistancetoapoptoticstimulibyalterationofmembranefluidity:therapeuticimplications,Adv.CancerRes.,98,149-190.
[47] T.Brown.(2016)Bismuth-NSAIDsascolorectalcancerchemopreventives:Insightsinto theirmembrane interactionsanduptakemechanisms,BachelorofMedicinalChemistry(Advanced)withHonours,UniversityofWollongong,Australia.
[48] B. Fuchs, J. Schiller andM. A. Cross. (2007) Apoptosis-associated changes in theglycerophospholipidcompositionofhematopoieticprogenitorcellsmonitoredby31P NMR spectroscopy and MALDI-TOF mass spectrometry, Chem. Phys. Lipids,150,229-238.
[49] E. Schonfeld, I. Yasharel, E. Yavin and A. Brand. (2007) Docosahexaenoic acidenhances ironuptakebymodulating iron transporters and accelerates apoptoticdeathinPC12cells,Neurochem.Res.,32,1673-1684.
[50] Y. Masubuchi, S. Yamada and T. Horie. (1999) Diphenylamine as an importantstructure of nonsteroidal anti-inflammatory drugs to uncouple mitochondrialoxidativephosphorylation†,Biochem.Pharmacol.,58,861-865.
[51] Y.Masubuchi, S.YamadaandT.Horie. (2000)Possiblemechanismofhepatocyteinjury induced by diphenylamine and its structurally related nonsteroidal anti-inflammatorydrugs,J.Pharmacol.Exp.Ther.,292,982-987.
[52] S.Somasundaram,G.Sigthorsson,R.J.Simpson,J.Watts,M.Jacob,I.A.Tavares,S.Rafi,A.Roseth,R.Foster,A.B.Price,J.M.WrigglesworthandI.Bjarnason.(2000)Uncouplingofintestinalmitochondrialoxidativephosphorylationandinhibitionof
Chapter5.LipidomicprofilingofglycerophospholipidsusingESI-MS/MS
252
cyclooxygenasearerequiredforthedevelopmentofNSAID-enteropathyintherat,Aliment.Pharmacol.Ther.,14,639-650.
[53] G.Galati,S.Tafazoli,O.Sabzevari,T.S.ChanandP.J.O'Brien.(2002)IdiosyncraticNSAIDdruginducedoxidativestress,Chem.Biol.Interact.,142,25-41.
[54] Y. Li, X.M.Qi, X. Xue, X. F.Wu, Y. F.Wu,M. Chen, G. Z. Xing, Y. Luan and J. Ren.(2009) The relationship between diphenylamine structure and NSAIDs-inducedhepatocytesinjury,Toxicol.Lett.,186,111-114.
253
Chapter6. ExplorationoftheinvitrotoxicityofnewBi(III)
aminoarenesulfonate,indole-carboxylate,and
hydroxamatecomplexes
Following promising results (Chapter 2) that showed that a selection of BiNSAIDs
exhibitedtoxicitytowardstheHCT-8coloncancercells,otherBicomplexeswerealso
investigated for prospective anti-cancer activity against this cell line. Several non-
NSAIDBi(III)complexes,whichincludedhomoleptictris-Bi(III)aminoarenesulfonates,
indole-carboxylates,andhydroxamates,wereselectedforthisinvitroscreeningbased
on the fact that the ligandswere derivatives of biologically active compounds. The
purpose of the work described in this Chapter was to identify new lead Bi(III)
complexes to provide direction for future studies (such as those described in
Chapters2−5).
Chapter6.Anti-canceractivityofBi(III)complexes
254
6.1 IntroductionAs previously discussed in Section 1.4.1.4, several classes of Bi(III) complexes
haveshownbothinvitroandinvivoanti-cancerpotential.ThefocusinChapters2−5
has been on the anti-cancer potential of Bi complexes of NSAIDs based on the
hypothesisthatCOX-2over-expressionisassociatedwithcancerandthatNSAIDsare
strong inhibitors of COX. It is evident from the literature (Chapter 1) that Bi(III)
complexesofother ligandsalsodisplayanti-cancerpotential invitro. Todate, there
have been no investigations of homoleptic Bi(III) complexes of aminoarenesulfonic
acids (Section 6.1.1) [1], indole-carboxylic acids (Section 6.1.2) [2], and hydroxamic
acids(Section6.1.3)[3,4].WhilemostoftheseligandsarenotknowntoinhibitCOX,
they have been shown to be biologically active, as discussed in Sections 6.1.1−6.1.3.
Assuch,theBi(III)complexesoftheseligandswarrantinvestigation.
6.1.1 SulfonicacidsandBi(III)aminoarenesulfonates
A number of simple sulfonic acid (general formula RSO3H) molecules play
important roles in biological systems. For instance, the glycine analogue,
aminomethanesulfonic acid (Fig. 6.1), has demonstrated similar hepatoprotective
effects as glycine in isolated Kuppfer (liver) cells [5]. The aspartate analogue,
L-cysteicacid (Fig. 6.1), is a potent and effective agonist towards several rat
metabotropicglutamatereceptors[6]. Taurine(Fig.6.1), isnaturallypresent inhigh
levels in the brain and is believed to play a role in neurological processes including
osmoregulation, antioxidant activity, neuromodulation, and the control of calcium
influx[7]. Inaddition,experimentalevidencesuggeststhattaurineandthesynthetic
analogue, homotaurine (Fig. 6.1), reduce protein aggregation of amyloid-β proteins
involved in the formation of plaques in Alzheimer’s disease[8, 9]. Recently, it has
been shown that a synthetic sulfonic acid, anthraquinone-2-sulfonic acid (Fig.6.1)
confers protection in primary rat cortical neurons exposed to hydrogenperoxide or staurosporine;asaresultthissulfonicacidmaypresentanoveltherapeuticagentfor
neurologicalprotection[10].
Ofrelevancetothisworkarereportsoftheanti-cancerpotentialofanumberof
sulfonicacidderivatives,whereby itwas shown that, in some instances, the sulfonic
acid derivative showed improved activity compared to the original drug [11, 12].
Forinstance,indirubin-5-sulfonicacid(Fig.6.1),aderivativeoftheanti-leukemiadrug
indirubin,wasfoundtobeamorepotentinhibitorofcyclin-dependentkinaseswhen
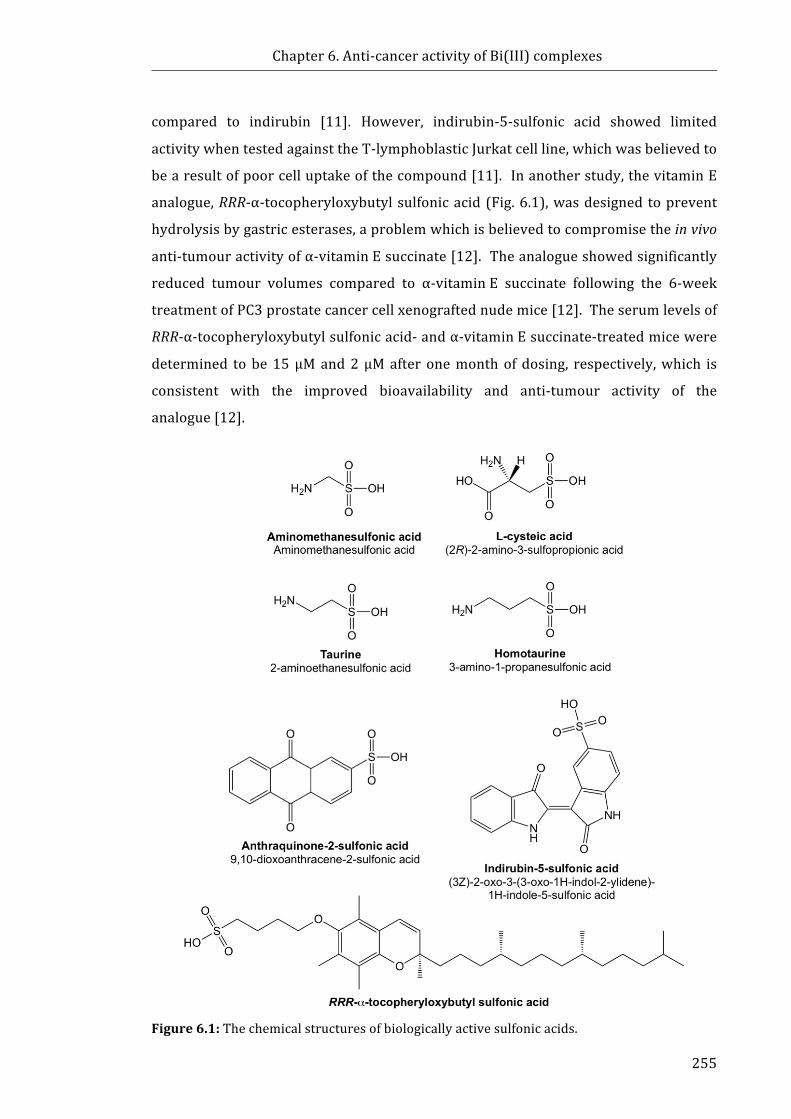
Chapter6.Anti-canceractivityofBi(III)complexes
255
compared to indirubin [11].However, indirubin-5-sulfonic acid showed limited
activitywhentestedagainsttheT-lymphoblasticJurkatcellline,whichwasbelievedto
bearesultofpoorcelluptakeofthecompound[11].Inanotherstudy,thevitaminE
analogue,RRR-α-tocopheryloxybutylsulfonicacid(Fig.6.1),wasdesignedtoprevent
hydrolysisbygastricesterases,aproblemwhichisbelievedtocompromisetheinvivo
anti-tumouractivityofα-vitaminEsuccinate[12].Theanalogueshowedsignificantly
reduced tumour volumes compared to α-vitaminE succinate following the 6-week
treatmentofPC3prostatecancercellxenograftednudemice[12].Theserumlevelsof
RRR-α-tocopheryloxybutylsulfonicacid-andα-vitaminEsuccinate-treatedmicewere
determined tobe15μMand2μMafteronemonthofdosing, respectively,which is
consistent with the improved bioavailability and anti-tumour activity of the
analogue[12].
Figure6.1:Thechemicalstructuresofbiologicallyactivesulfonicacids.
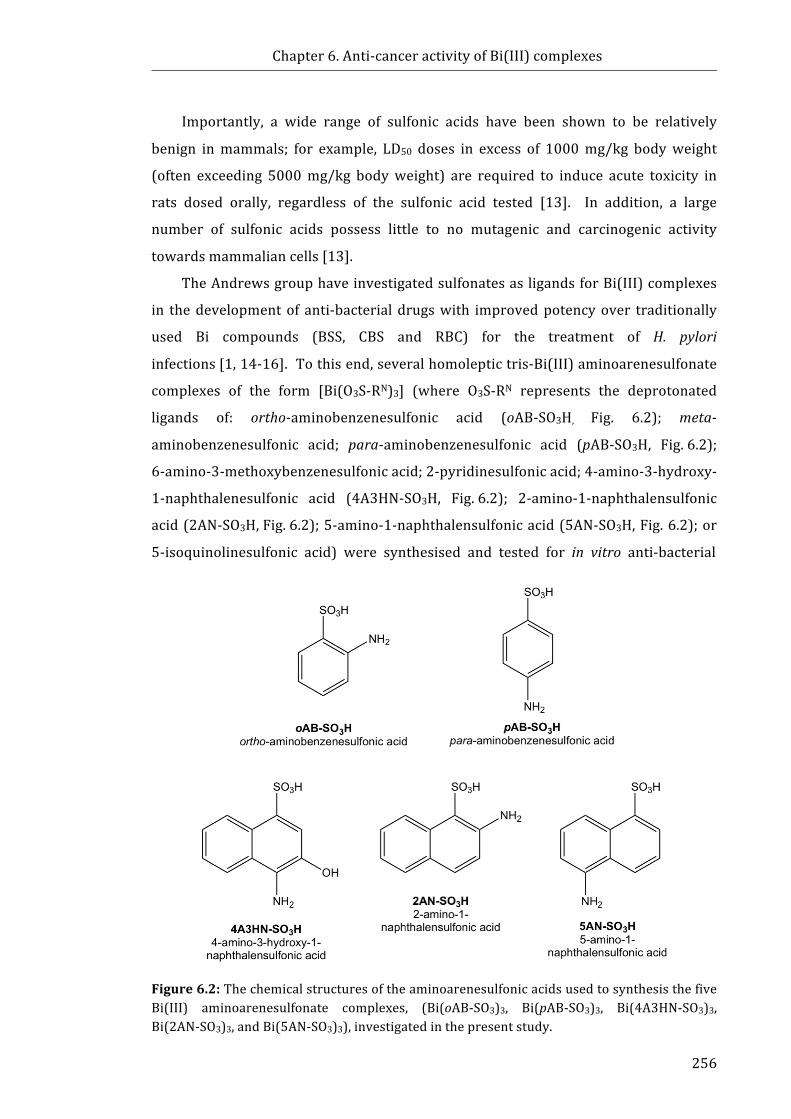
Chapter6.Anti-canceractivityofBi(III)complexes
256
Importantly, a wide range of sulfonic acids have been shown to be relatively
benign inmammals; for example, LD50 doses in excess of 1000mg/kg bodyweight
(often exceeding 5000mg/kg bodyweight) are required to induce acute toxicity in
rats dosed orally, regardless of the sulfonic acid tested [13]. In addition, a large
number of sulfonic acids possess little to no mutagenic and carcinogenic activity
towardsmammaliancells[13].
TheAndrewsgrouphaveinvestigatedsulfonatesasligandsforBi(III)complexes
in thedevelopmentof anti-bacterialdrugswith improvedpotencyover traditionally
used Bi compounds (BSS, CBS and RBC) for the treatment of H. pylori
infections[1,14-16].Tothisend,severalhomoleptictris-Bi(III)aminoarenesulfonate
complexes of the form [Bi(O3S-RN)3] (where O3S-RN represents the deprotonated
ligands of: ortho-aminobenzenesulfonic acid (oAB-SO3H, Fig. 6.2); meta-
aminobenzenesulfonic acid; para-aminobenzenesulfonic acid (pAB-SO3H, Fig.6.2);
6-amino-3-methoxybenzenesulfonicacid;2-pyridinesulfonicacid;4-amino-3-hydroxy-
1-naphthalenesulfonic acid (4A3HN-SO3H, Fig.6.2); 2-amino-1-naphthalensulfonic
acid(2AN-SO3H,Fig.6.2);5-amino-1-naphthalensulfonicacid(5AN-SO3H,Fig.6.2);or
5-isoquinolinesulfonicacid)weresynthesisedandtestedforinvitroanti-bacterial
Figure6.2:ThechemicalstructuresoftheaminoarenesulfonicacidsusedtosynthesisthefiveBi(III) aminoarenesulfonate complexes, (Bi(oAB-SO3)3, Bi(pAB-SO3)3, Bi(4A3HN-SO3)3,Bi(2AN-SO3)3,andBi(5AN-SO3)3),investigatedinthepresentstudy.
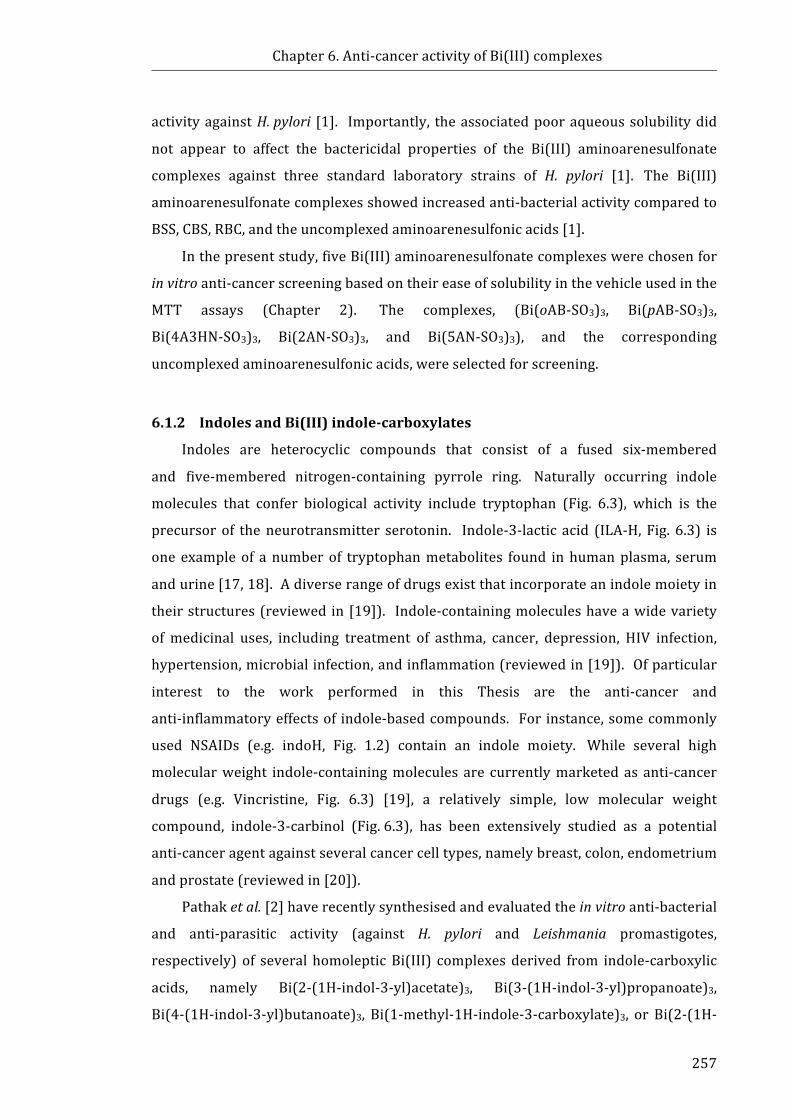
Chapter6.Anti-canceractivityofBi(III)complexes
257
activityagainstH.pylori [1]. Importantly, theassociatedpooraqueoussolubilitydid
not appear to affect the bactericidal properties of the Bi(III) aminoarenesulfonate
complexes against three standard laboratory strains of H. pylori [1].The Bi(III)
aminoarenesulfonatecomplexesshowedincreasedanti-bacterialactivitycomparedto
BSS,CBS,RBC,andtheuncomplexedaminoarenesulfonicacids[1].
Inthepresentstudy,fiveBi(III)aminoarenesulfonatecomplexeswerechosenfor
invitroanti-cancerscreeningbasedontheireaseofsolubilityinthevehicleusedinthe
MTT assays (Chapter 2). The complexes, (Bi(oAB-SO3)3, Bi(pAB-SO3)3,
Bi(4A3HN-SO3)3, Bi(2AN-SO3)3, and Bi(5AN-SO3)3), and the corresponding
uncomplexedaminoarenesulfonicacids,wereselectedforscreening.
6.1.2 IndolesandBi(III)indole-carboxylates
Indoles are heterocyclic compounds that consist of a fused six-membered
andfive-membered nitrogen-containing pyrrole ring. Naturally occurring indole
molecules that confer biological activity include tryptophan (Fig. 6.3), which is the
precursorof theneurotransmitter serotonin. Indole-3-lactic acid (ILA-H, Fig. 6.3) is
oneexampleof anumberof tryptophanmetabolites found inhumanplasma, serum
andurine[17,18].Adiverserangeofdrugsexistthatincorporateanindolemoietyin
theirstructures(reviewedin[19]). Indole-containingmoleculeshaveawidevariety
of medicinal uses, including treatment of asthma, cancer, depression, HIV infection,
hypertension,microbialinfection,andinflammation(reviewedin[19]).Ofparticular
interest to the work performed in this Thesis are the anti-cancer and
anti-inflammatoryeffectsof indole-basedcompounds. For instance,somecommonly
used NSAIDs (e.g. indoH, Fig. 1.2) contain an indole moiety. While several high
molecularweight indole-containingmoleculesare currentlymarketedasanti-cancer
drugs (e.g. Vincristine, Fig. 6.3) [19], a relatively simple, low molecular weight
compound, indole-3-carbinol (Fig.6.3), has been extensively studied as a potential
anti-canceragentagainstseveralcancercelltypes,namelybreast,colon,endometrium
andprostate(reviewedin[20]).
Pathaketal.[2]haverecentlysynthesisedandevaluatedtheinvitroanti-bacterial
and anti-parasitic activity (against H. pylori and Leishmania promastigotes,
respectively) of several homolepticBi(III) complexesderived from indole-carboxylic
acids, namely Bi(2-(1H-indol-3-yl)acetate)3, Bi(3-(1H-indol-3-yl)propanoate)3,
Bi(4-(1H-indol-3-yl)butanoate)3, Bi(1-methyl-1H-indole-3-carboxylate)3, or Bi(2-(1H-
Chapter6.Anti-canceractivityofBi(III)complexes
258
indol-3-yl)-2-oxoacetate)3 (referred to herein as Bi(IGA)3, where IGA-H = indole-3-
glyoxylicacid(Fig.6.3)).
Inthepresentstudy,twoBi(III)indole-carboxylates,Bi(IGA)3andBi(ILA)3,willbe
assessedforanti-canceractivityagainsttheHCT-8cell linesincetheirpotentialanti-
cancerpropertieshadnotbeenassessedpreviously.
Figure 6.3: The chemical structures of biologically active indoles, and the indole-carboxylicacidsused to synthesise the twoBi(III) indole-carboxylate complexes,Bi(ILA)3andBi(IGA)3,investigatedinthisstudy.
6.1.3 HydroxamicacidsandBi(III)hydroxamates
Hydroxamicacids(generalformulaRCONR´OH)areweakacidsthatrepresentan
importantfamilyoforganicbioligands[21].Hydroxamicacidsplayaroleinavariety
Chapter6.Anti-canceractivityofBi(III)complexes
259
ofbiologicalprocesses,whichislargelyduetotheabilityofhydroxamicacidstoform
stable chelates with metals such as Fe(III) [21, 22]. One of the first recognised
biologicalrolesofhydroxamicacidswastheiruseassiderophoresinmicrobialFe(III)
sequestration and transport [21]. Hydroxamic acids are used in the treatment of
bacterial infections [23], thalassemia [24], and inflammation [25]. Additionally,
hydroxamic acid molecules have been investigated as potential treatments for a
varietyofailmentsincludingcancer[26],malaria[27],andAlzheimer’sdisease[28].
The structurally simple hydroxamic acid, acetohydroxamic acid (Fig.6.4), is a
potent inhibitor of nickel-dependent ureases [29, 30]. In 1983, the FDA approved
acetohydroxamic acid for the treatment of urinary tract infections [23].
Benzohydroxamic acid (BHA-H,Fig. 6.4)has alsobeen shown to inhibit urease [31].
The similarly structured salicylhydroxamic acid (SHA-H, Fig.6.4) is employed in the
treatment of urinary tract infections and urolithiasis [32]. SHA-H has also shown
potentialinthetreatmentofCandidaalbicansinfection[32,33].
Importantly hydroxamic acids also inhibit enzymes including Zn-dependent
MMPs[34,35],histonedeacetylases,andCOX[36-38],whichhassparkedinterest in
their use as potential anti-cancer drugs. The hydroxamic acid-based drugs,
Batimastat(Fig. 6.4) and Marimastat (Fig.6.4), are MMP inhibitors that have been
investigated in Phase III clinical trials for the treatment of cancer [39, 40].
Unfortunately,neitherdrughasprogressedbeyondPhaseIIItrialsduetopoorefficacy
and adverse side effects [40]. Vorinostat (Merck & Co., Inc., Fig. 6.4) is an orally
delivered, potent inhibitor of histonedeacetylase thatwas approvedby the FDA for
the treatment of cutaneous T-cell lymphoma in 2006 [41, 42]. More recently, the
histone deacetylase inhibitor, Belinostat (Spectrum Pharmaceuticals, Fig. 6.4) was
approved by the FDA for the treatment of peripheral T-cell lymphoma [43].
Thedevelopment of diverse new ranges of hydroxamic acid-based molecules that
inhibithistonedeacetylasescanbefoundinarecentreview[44].
A number of hydroxamic acids inhibit the activity of COX [36-38], an enzyme
implicated in the formation and progression of a number of types of cancer (as
discussed in Section 1.2.3). Notably, some hydroxamic acid molecules are able to
interactwithboththePOXandCOXactivesites;forexample,tepoxalin(Fig.6.4)
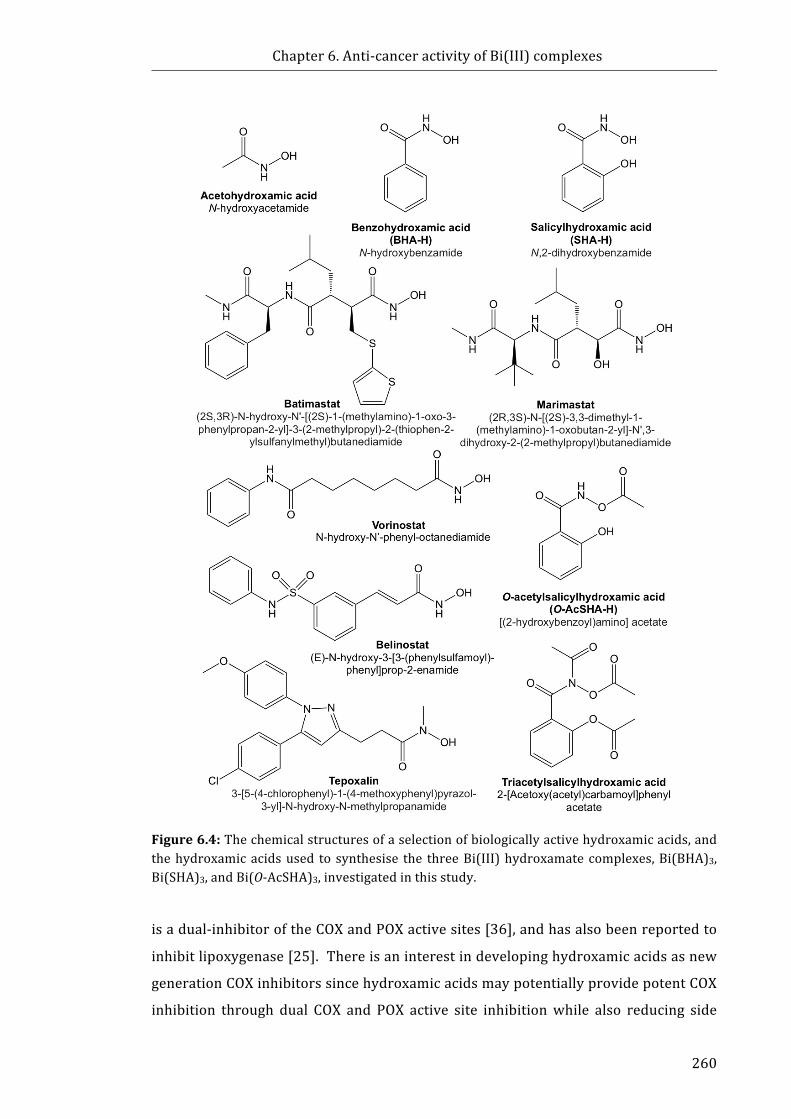
Chapter6.Anti-canceractivityofBi(III)complexes
260
Figure6.4:Thechemicalstructuresofaselectionofbiologicallyactivehydroxamicacids,andthehydroxamicacidsused to synthesise the threeBi(III)hydroxamatecomplexes,Bi(BHA)3,Bi(SHA)3,andBi(O-AcSHA)3,investigatedinthisstudy.
isadual-inhibitoroftheCOXandPOXactivesites[36],andhasalsobeenreportedto
inhibitlipoxygenase[25].Thereisaninterestindevelopinghydroxamicacidsasnew
generationCOXinhibitorssincehydroxamicacidsmaypotentiallyprovidepotentCOX
inhibition through dual COX and POX active site inhibitionwhile also reducing side
Chapter6.Anti-canceractivityofBi(III)complexes
261
effectssuchastopicalirritation,partiallyduetothefacthydroxamicacidsareweaker
acids than the analogous carboxylic acids [21]. Twohydroxamic acids developed
specifically to target COX, O-acetylsalicylhydroxamic acid (O-AcSHA-H, Fig.6.4) and
triacetylsalicylhydroxamicacid(Fig.6.4),exhibitedirreversible,non-selectivebinding
tobothCOX-1andCOX-2withcomparableor improvedpotencytoaspH[37,38]. It
has been shown that the mechanism of COX inhibition by O-AcSHA-H and
triacetylsalicylhydroxamic acid is the same as that exhibited by aspH whereby
Ser530(COX-1) is irreversibly acetylated [37, 38]. Given this evidence, it may be
possible that hydroxamic acid inhibitors of COX may confer potential anti-cancer
activity,inamannersimilartotraditionalNSAIDs,particularlyagainstcancercelllines
thatexpressupregulatedlevelsofCOX-2.
Due to the ability of several hydroxamic acids (e.g. acetohydroxamic acid,
BHA-Hand SHA-H) to inhibit bacterial urease and their use as anti-bacterial agents,
Pathaketal.[3,4]havesynthesisedseveralBi(III)hydroxamatecomplexesunderthe
premise that theymayexhibit improvedanti-bacterial activity againstH.pylori than
currentlyusedBi(III)compounds,BSS,CBSandRBC. Additionally, thetoxicityofthe
Bi(III) hydroxamates has been assessed against human fibroblasts [4]; however,
currently no studies have investigated the anti-cancer activity of these complexes
against human cancer cell lines. Three Bi(III) hydroxamate complexes, Bi(BHA)3,
Bi(SHA)3, andBi(O-AcSHA)3,werechosen forassessment in thepresent studybased
ontheireaseofsolubilityinthevehicleusedintheMTTassays(Chapter2).
6.1.4 Scopeofthischapter
FollowingresultsthatshowedthatBiNSAIDsexhibitedinvitrotoxicitytowardthe
HCT-8coloncancercellline(Chapter2)itwasofinteresttoexpandtherangeofBi(III)
compoundsand identifyotherpotential leadcompounds. Assuch,Bi(III)complexes
derivedfrombiologicallyrelevantligandswerestudiedwiththespecificaimsof:
1. Assessing the in vitro toxicity of Bi(III) aminoarenesulfonate complexes,
Bi(III) indole-carboxylatecomplexes,andBi(III)hydroxamatecomplexes,
and
2. Comparing the toxicity of the above-mentioned Bi complexes to the
uncomplexed aminoarenesulfonic acids, indole-carboxylic acids and
hydroxamicacidsusingthehumancoloncancercellline,HCT-8.

Chapter6.Anti-canceractivityofBi(III)complexes
262
6.2 MaterialsandMethods6.2.1 Materials
The Bi(III) aminoarenesulfonate complexes, Bi(oAB-SO3)3, Bi(pAB-SO3)3,
Bi(4A3HN-SO3)3,Bi(2AN-SO3)3,andBi(5AN-SO3)3,weresynthesisedandcharacterised
by Dr Madleen Busse (Monash University, Australia) as previously described[1].
TheBi(III) indole-carboxylate complexes, Bi(IGA)3, and Bi(ILA)3, and the Bi(III)
hydroxamatecomplexes,Bi(BHA)3,Bi(SHA)3,andBi(O-AcSHA)3,weresynthesisedand
characterised by Dr Amita Pathak (Monash University, Australia) as previously
described [2-4]. All aminoarenesulfonic acids (oAB-SO3H, pAB-SO3H, 4A3HN-SO3H,
2AN-SO3H, and 5AN-SO3H), indole-carboxylic acids (IGA-H and ILA-H), and
hydroxamic acids (BHA-H, SHA-H, and O-AcSHA) were supplied by ProfessorPhilip
Andrews (MonashUniversity, Australia) andwere originally purchased fromSigma-
Aldrich(StLouis, USA) or TCI America (Portland, USA) and used without further
purification as previously described [1-4]. The materials used for the cell culture
experimentsdescribedinthisChapterhavebeenpreviouslydescribedinSection2.2.1.
6.2.2 CellLines
HCT-8cellsweresourcedandemployedasdescribedinSection2.2.3.
6.2.3 MTTAssay
TheMTTassaywasperformedaspreviouslydescribedinSection2.2.4.

Chapter6.Anti-canceractivityofBi(III)complexes
263
6.3 ResultsThe MTT assay was used to evaluate the effects of the Bi(III) complexes and
ligandson cell viability inHCT-8 cells following24h exposure. Figure6.5a-d shows
the representative concentration-response curves, graphed for the concentration of
each ligand (acknowledging that three mol of ligand are present per mol of Bi(III)
complex). Forclarity,theMTTresultsforthelessactivecompoundsareprovidedin
Appendix5.1.TheIC50valuesdeterminedafter24-hexposuretotheBi(III)complexes
andligandsaresummarisedinTable6.1.
The Bi(III) aminoarenesulfonates and corresponding aminoarenesulfonic acids
demonstrated little to no activity towards HCT-8 cells (Appendix 5.1), with the
exception of Bi(4A3HN-SO3)3 and 4A3HN-SO3H (Fig. 6.5a). The complexation of
4A3HN-SO3 to Bi(III) increased the potency of the free 4A3HN-SO3H towards the
HCT-8cellsbyapproximately11times(Table6.1).
TheBi(III) indolates, Bi(IGA)3 andBi(ILA)3, exhibited low IC50 values (Fig. 6.5b,
Table6.1)of10µMand17µM,respectively. AsevidentinFigure6.5b,however,the
ligands exhibited low toxicity. For instance, IGA-H demonstrated no significant
reduction in MTT conversion up to 100µM (Fig. 6.5b), and while this decreased
between 100-1000 µMwith a small increase between 1000 µM to 2000 µM, IGA-H
failed to achieve greater than 50% inhibition of MTT conversion (Fig. 6.5b).
Comparatively, ILA-H demonstrated consistently low toxicity up to the highest
concentrationassessed,2000µM(Fig.6.5b).Inbothinstances,itisapparentthatthe
Bi(III)indole-carboxylatesexhibitedgreatertoxicitythanpredictedfortheligands.
AssummarisedinTable6.1,theIC50valuesobtainedfortheBi(III)hydroxamate
complexes, Bi(BHA)3 and Bi(SHA)3, were approximately 10 and 15 times higher,
respectively,thanBi(IGA)3.However,Bi(BHA)3demonstratedthelowestIC50valueof
the threeBi(III)hydroxamates tested,andnearly5.5 timesgreateractivity than free
BHA-H (Table 6.1). Additionally, Bi(SHA)3 demonstrated greater toxicity than free
SHA-H, whereby the latter did not inhibit MTT conversion below 50% over the
concentration range tested (up to 2000 µM, Fig. 6.5d). As observed in Figure6.5d,
Bi(O-AcSHA)3inducedsomereductionincellviabilitycomparedtothevehicle-treated
cells,but failedtoproduce50%inhibition(maximuminhibition~52%at1000µM).
UncomplexedO-AcSHA-H (IC50 = 94 ± 13 µM) showed substantially greater toxicity
towardstheHCT-8cellsincomparisontoBi(O-AcSHA)3(Fig.6.5d).
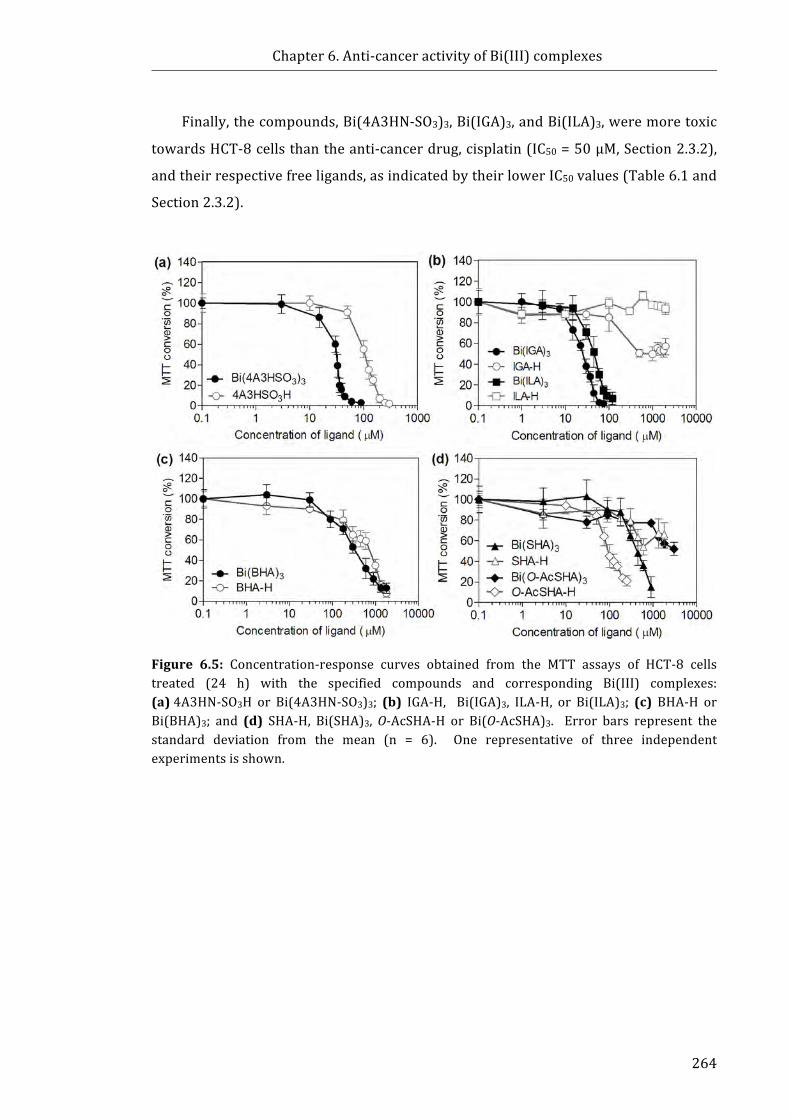
Chapter6.Anti-canceractivityofBi(III)complexes
264
Finally,thecompounds,Bi(4A3HN-SO3)3,Bi(IGA)3,andBi(ILA)3,weremoretoxic
towardsHCT-8cellsthantheanti-cancerdrug,cisplatin(IC50=50µM,Section2.3.2),
andtheirrespectivefreeligands,asindicatedbytheirlowerIC50values(Table6.1and
Section2.3.2).
Figure 6.5: Concentration-response curves obtained from the MTT assays of HCT-8 cellstreated (24 h) with the specified compounds and corresponding Bi(III) complexes:(a)4A3HN-SO3H or Bi(4A3HN-SO3)3; (b) IGA-H, Bi(IGA)3, ILA-H, or Bi(ILA)3; (c) BHA-H orBi(BHA)3; and (d) SHA-H, Bi(SHA)3,O-AcSHA-H or Bi(O-AcSHA)3. Error bars represent thestandard deviation from the mean (n = 6). One representative of three independentexperimentsisshown.
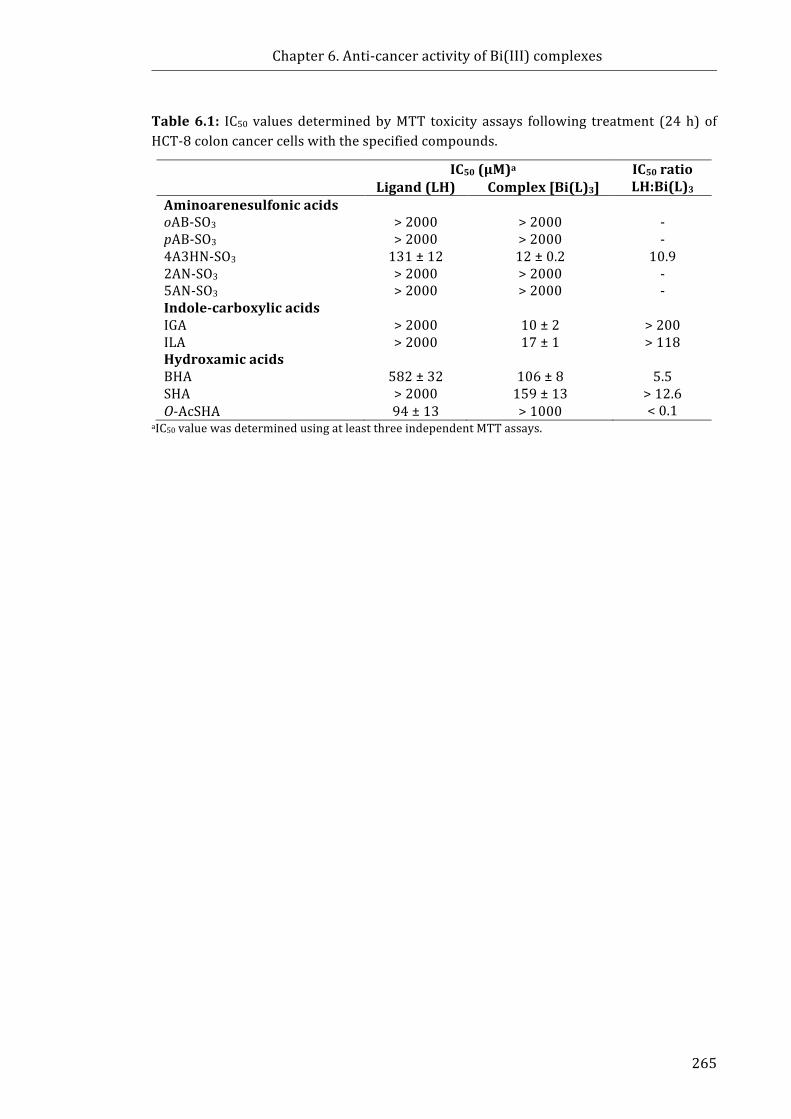
Chapter6.Anti-canceractivityofBi(III)complexes
265
Table6.1: IC50 valuesdeterminedbyMTT toxicity assays following treatment (24h) ofHCT-8coloncancercellswiththespecifiedcompounds.
IC50(µM)a IC50ratioLH:Bi(L)3Ligand(LH) Complex[Bi(L)3]
AminoarenesulfonicacidsoAB-SO3
>2000
>2000
-
pAB-SO3 >2000 >2000 -4A3HN-SO3 131±12 12±0.2 10.92AN-SO3 >2000 >2000 -5AN-SO3 >2000 >2000 -Indole-carboxylicacidsIGA
>2000
10±2
>200
ILA >2000 17±1 >118HydroxamicacidsBHA
582±32
106±8
5.5
SHA >2000 159±13 >12.6O-AcSHA 94±13 >1000 <0.1
aIC50valuewasdeterminedusingatleastthreeindependentMTTassays.
Chapter6.Anti-canceractivityofBi(III)complexes
266
6.4 Discussion6.4.1 Bi(III)aminoarenesulfonates
The MTT assay results (Section 6.3.1, Table 6.1) showed that the Bi(III)
aminoarenesulfonates and the corresponding free ligands showed little activity
towardsHCT-8cells,with theexceptionofBi(4A3HN-SO3)3and4A3HN-SO3H. Since
mostof theseBi-aminosulfonatesexhibitedno toxicityagainsthumancancercells in
the present study, and have exhibited anti-bacterial activity in other studies [1], it
would be worthwhile to determine if the complexes also show a lack of activity
towardsnon-canceroushumancellsasthiswouldbeabeneficialpropertyfortheuse
oftheBi(III)aminoarenesulfonatesforthetreatmentofH.pyloriinfection.
There are no recent publications that report the in vitro or in vivo anti-cancer
activityof theaminoarenesulfonicacidsused in thepresent study [45-49]. As such,
the reasons why Bi(4A3HN-SO3)3 and 4A3HN-SO3H showed substantial toxicity
comparedtotheotherBi(aminoarenesulfonates)3(Table6.1)canonlybespeculated.
FactorssuchaspKaandlogPmaybelesslikelytocontributetothevariationinactivity
asthefivetestedsulfonicacidsdisplaysimilarpKavalues(rangingfrom1−3,[1])and
logPvalues[45-49]. Additionally, the influenceof chemical substituentsneeds tobe
considered.Forinstance,thepresenceofaphenylring,asulfonylgroupandanamino
grouparecommonfeaturesamongthechemicalstructuresoftheaminoarenesulfonic
acids tested. While4A3HN-SO3Hsharesanaphthaleneskeletonwith2AN-SO3Hand
5AN-SO3H, the presence of the hydroxyl group is unique to the structure of
4A3HN-SO3H. It isnotclearwhetherthehydroxylgroup(andtheextraH-bondingit
provides),oritsadjacentpositiontotheaminogroupbearsinfluenceontheactivityof
4A3HN-SO3H.However,itismorelikelythatthepooraqueoussolubilitycontributes
tothe lackof invitroactivityof theoAB-SO3,pAB-SO3,2AN-SO3H,and5AN-SO3Hand
therespectiveBi(III)complexesagainsttheHCT-8cells.
Interestingly,complexationof4A3HN-SO3HwithBi(III)resultedinanincreasein
toxicityofapproximately11-fold(Table6.1). Thiswasfarhigherthanthatobserved
for Bi(difl)3 and diflH (Section 2.3.2) where it was speculated that the increase in
toxicity of Bi(difl)3might be due to an additive effect between the Bi and the diflH
basedonthecomparableIC50valuesofBiCl3(383µM)anddiflH(401µM).Insteadit
couldbespeculatedthatBi(4A3HN-SO3)3 is likelytoremain intactuponenteringthe
cell. While it is beyond the scope of the aims of this Chapter, the stability of the
complexes in cellmedium and cellular uptake of Bi and potential targets should be
Chapter6.Anti-canceractivityofBi(III)complexes
267
examined in future work. For instance, it has previously been shown that the
compound,sodium4-amino-3-hydroxy-1-naphthalene-sulfonate,whichisstructurally
similar to 4A3HN-SO3H, caused a substantial decrease inmitogenesis in Balb/c3T3
fibroblasts that were stimulatedbyacidic fibroblast growth factor (an important
angiogenesis-promoting polypeptide) [50]. These results give credence to a
mechanismoftoxicityof4A3HN-SO3Hthat involvestargetinganenzymeessential to
thecancercellgrowth.
The fact that the toxicity of Bi(4A3HN-SO3)3 was comparable to the
BiNSAIDs(Section2.3.2) provides precedence to explore the non-NSAID derived
Bi(4A3HN-SO3)3 in future experiments. Consequently, studies of the toxicity of
Bi(4A3HN-SO3)3towardsnormalhumancelllines(e.g.healthycoloncellsandhuman
peripheralbloodmononuclearcells(hPBMCs))wouldbeworthwhiletodeterminethe
potential effect on healthy colon cells if administered as a chemotherapeutic or
chemopreventive agent. Thebenefit of screeningBi(4A3HN-SO3)3 onnon-cancerous
cellswillbe two-fold,whereby the resultswillnotonlyestablish selectivity towards
cancercells,butwillalsoprovideinsight intowhetheranypotentialsideeffectsmay
resultfromtheadministrationofthecomplexasananti-bacterialagent,asoriginally
proposedbyBusseetal.[1].
6.4.2 Bi(III)indole-carboxylates
The MTT results (Section 6.3.1, Table 6.1) showed that the indole-carboxylic
acids, IGA-H and ILA-H, only displayed high toxicity towards HCT-8 cells when
coordinated to Bi as the Bi(III)complexes. Furthermore, the resultant complexes
displayed some of the lowest IC50values (highest toxicity) of all the compounds
assessed. Since ILA-H is a product of tryptophan metabolism [17], it was not
surprisingthatILA-HdidnotshowanytoxicitytowardstheHCT-8cells(upto2mM).
The comparatively lower IC50 values of theBi(IGA)3 andBi(ILA)3 (IC50 = 10 µMand
17µM, respectively) cannot be explained by Bi(III) toxicity alone since it was
previously established (Chapter 2) thatwhenBi(III)was bound to the non-toxic Cl−
anion the IC50value (383µM)wasconsiderablyhigher. If theBi(IGA)3andBi(ILA)3
complexesremainintact,alternativetoxicitypathways,mechanismsortargetswould
beresponsibleforthetoxicity.
Importantly, the homoleptic Bi(III) indole-carboxylate complexes, including
Bi(IGA)3, showed little toxicity towardshuman fibroblasts (up to 100µM, 48h) [2],
Chapter6.Anti-canceractivityofBi(III)complexes
268
making them excellent candidates for further testing as chemopreventive and
chemotherapeuticproperties. Therefore, further investigation into theirmechanism
oftoxicityincludingdeterminingmodeofcelldeathandpotentialintracellulartargets
shouldbeperformed. Thereisalsoscopetoexpandthecompoundlibraryforfuture
testing as Pathaketal. [2] have synthesised several other Bi(III) indole-carboxylate
complexes.
6.4.3 Bi(III)hydroxamates
The results of theMTT assays (Section6.3.1, Table 6.1) showed that theBi(III)
hydroxamates, Bi(BHA)3 and Bi(SHA)3, exhibited moderate toxicity towards HCT-8
cellswithincreasedactivitycomparedtothecorrespondinghydroxamicacids,BHA-H
and SHA-H, at equimolar concentrations. Interestingly, Bi(O-AcSHA)3 demonstrated
substantiallyreducedtoxicitycomparedtothefreeO-AcSHA-Hligand,whichwasthe
only Bi(III) complex observed to exhibit such a reduced effect (Sections 2.3.2
and6.3.1).
ThereareseveralpossiblereasonsthatBi(O-AcSHA)3displayedreducedtoxicity
comparedtoO-AcSHA-H.Firstly,itwasobservedthat,followingthetreatmentperiod,
Bi(O-AcSHA)3-treated wells showed signs of precipitation in cell medium at
approximately300µM.ThereforethepoorsolubilityofBi(O-AcSHA)3maycontribute
toitslimitedtoxicity.Secondly,aspreviouslydiscussedinSection6.1.3,O-AcSHA-His
anirreversibleCOXinhibitorsimilartoaspH[37]. If themechanismoftoxicityofO-
AcSHA-Hproceedsvia inhibitionofCOXthen it isconceivablethat the loweractivity
couldbe the resultof the inabilityof theacetyl group toacetylate theSer530of the
active site of COX if the Bi(O-AcSHA)3 remains intact inside the cell. In order to
explicitly prove that this is the case, further work to determine the exact chemical
nature of the complex in the cell would be required; however, this would be quite
challenging. In addition, COX inhibition assays (with and without cells) should be
performed. Additionally, ELISA assays may be utilised to assess the ability of
Bi(O-AcSHA)3 andO-AcSHA-H to inhibitPGE2production inorder todeterminehow
effectively the compounds inhibit intracellular COX in vitro (as performed in
Chapter2).
The improved toxicity of BHA-H (IC50 = 582 μM) over SHA-H (IC50 > 2000 μM)
may be attributed to the difference in the chemical structure and the resultant
physicochemical properties. The same trend was observed in another study [51],

Chapter6.Anti-canceractivityofBi(III)complexes
269
wherebyBHA-HwasfoundtobemorecytotoxicthanSHA-H,towardsneuroblastoma
IMR-32cells (IC50=218μMand249μM, respectively) following48-h treatment. In
the same study the Ru(III) complexes, [RuCl(H2O)BHA2] and [RuCl(H2O)SHA2], also
showed toxicity towards the IMR-32cells (IC50=166μMand221μM, respectively);
however,theRu(III)complexeswouldbeconsideredlesstoxicwhenaccountingthat
therearetwomolesofligandpermoleofRu(III). Itisnotablethat[RuCl(H2O)BHA2]
wasdeterminedtobemoretoxicthan[RuCl(H2O)SHA2],whichisconsistentwiththe
trendobservedfortheBi(BHA)3andBi(SHA)3complexesassessedinSection6.3.1.
The chemical structures of BHA-H and SHA-H differ only by the presence of a
phenolic –OH group in the SHA-H structure. Pathak et al. [4] determined that the
bidentatecomplexationofBi(III)totheseligandsoccursthroughthecarbonylandthe
hydroxamicacid–OHgroup. ThepKavaluesof thehydroxamicacidgroupofBHA-H
and SHA-H have been reported as 8.71 and 7.40, respectively [52]. The SHA-H
hydroxamicacidprotonismoreacidicduetointramolecularbondingoftheconjugate
basewiththephenolicOH(pKa9.81)[52].DuetothehigherpKa,theBHAligandmay
elicit a stronger affinity for Bi at physiological pH (which is maintained in the cell
medium) compared to SHA; hence the increased propensity for coordination may
improvethestabilityandtoxicityoftheBi(BHA)3complex.
Alternatively, it cannotbe ruledout that theBHA-Hstructureprovidesahigher
affinitytowardsanenzymeimportanttocancercellfunction.Forinstance,BHA-Hand
SHA-H both inhibit the enzyme ribonucleotide reductase [53], which catalyses the
formationofdeoxyribonucleotidesfromribonucleotides.Inonestudy,SHA-Hactivity
was higher than BHA-H (IC50= 150μM and 400 μM, respectively) when assessed
againstpurifiedenzymes [53];however, theseexperimentsdonot take intoaccount
thecellmediumorintracellularenvironmentofthecompounds.BHA-Hhasalsobeen
shown tobe apotent inhibitorof histonedeacetylase6 [54].Whiledetermining the
aqueousstability,uptakeandmechanismsofactionwasbeyondthescopeoftheaims
ofthisChapter,thesecriteriacouldbepotentiallyexaminedinfuturestudies.
Chapter6.Anti-canceractivityofBi(III)complexes
270
6.5 ChaptersummaryThe overall aim of this Chapter was to determine the cytotoxicity of Bi(III)
derivativesofaminoarenesulfonicacids,indole-carboxylicacids,andhydroxamicacids
against the human colorectal cancer cell line, HCT-8, in order to identify new lead
compounds for future studies. The results obtained from theMTT assays indicated
thatthetoxicityofthecomplexesishighlyvariablewithrespecttotheligandsinthe
Bi(III)complex.Specificobservationsincludedthefollowing:
i. Bi(III) aminoarenesulfonates displayed no toxicity towards HCT-8 cells
with the exception of Bi(4A3HN-SO3)3, which demonstrated reasonably
high toxicity, which was superior to the anti-cancer drug, cisplatin.
Additionally, the IC50 value obtained for Bi(4A3HN-SO3)3 was
approximately11timeslowerthan4A3HN-SO3H.
ii. Bi(III) indole-carboxylates, Bi(IGA)3 and Bi(ILA)3, displayed the highest
toxicities towardstheHCT-8cells,whichweresuperior to theanti-cancer
drug, cisplatin. Bi(III) coordination enhanced the toxicity of the free
ligands,whichshowedlittletoxicityagainsttheHCT-8cells(upto2mM).
iii. Bi(III) hydroxamates, Bi(BHA)3 and Bi(SHA)3, showed higher toxicity
against the HCT-8 cells compared to the free ligands, BHA-H and SHA-H.
Conversely, the toxicity of Bi(O-AcSHA)3was lower thanO-AcSHA-H. The
IC50valuesofBi(BHA)3andBi(SHA)3were2-3timeslowerthancisplatin.
This Chapter confirms for the first time that Bi(III) derivatives of selected
aminoarenesulfonic acids, indole-carboxylic acids, and hydroxamic acids display
cytotoxicity towards a human colon cancer cell line in vitro. TheBi(IGA)3, Bi(ILA)3,
andBi(4A3HN-SO3)3complexesshowedpromisingtoxicity,whichwascomparableto
Bi(tolf)3, assessed inSection2.3.2. This is an important result andwarrants further
investigation into the solution stability, drug uptake,mechanisms of action, and the
toxicity of theseBi(III) complexes against normal cells (e.g. fibroblast, hPBMCs) and
othercancercell lines. Althoughmanyofthecomplexestestedinthisstudyshowed
positiveactivityagainst theHCT-8coloncancercells, theactivityofBi(4A3HN-SO3)3
againstanon-cancerouscelllineremainstobetestedinordertoassessthedegreeof
selectivityandsubsequentadversesideeffects.Furtherstudiesinvestigatingwhether
theseBi(III)complexespossessanyanti-tumouractivityinvivocouldalsopotentially
bepursued.
Chapter6.Anti-canceractivityofBi(III)complexes
271
6.6 References[1] M.Busse,I.Trinh,P.C.Junk,R.L.FerreroandP.C.Andrews.(2013)Synthesisand
characterisation of bismuth(III) aminoarenesulfonate complexes and theirpowerful bactericidal activity against Helicobacter pylori, Chemistry, 19,5264-5275.
[2] A. Pathak, V. L. Blair, R. L. Ferrero, L. Kedzierski and P. C. Andrews. (2017)Structural influencesontheactivityofbismuth(III) indole-carboxylatocomplexestowardsHelicobacterpyloriandLeishmania,J.Inorg.Biochem.,177,266-275.
[3] A. Pathak, V. L. Blair, R. L. Ferrero, M. Mehring and P. C. Andrews. (2014)Bismuth(III) benzohydroxamates: powerful anti-bacterial activity againstHelicobacter pylori and hydrolysis to a unique Bi34 oxido-cluster[Bi34O22(BHA)22(H-BHA)14(DMSO)6],Chem.Commun.,50,15232-15234.
[4] A.Pathak,V.L.Blair,R.L.Ferrero,P.C.Junk,R.F.TaborandP.C.Andrews.(2015)Synthesisandstructural characterisationofbismuth(III)hydroxamatesand theiractivityagainstHelicobacterpylori,DaltonTrans.,44,16903-16913.
[5] S.Ishizaki-Koizumi,I.Sonaka,Y.Takei,K.IkejimaandN.Sato.(2004)Theglycineanalogue,aminomethanesulfonicacid,inhibitsLPS-inducedproductionofTNF-αinisolated rat Kupffer cells and exerts hepatoprotective effects in mice, Biochem.Biophys.Res.Commun.,322,514-519.
[6] Q. Shi, J. E. Savage, S. J. Hufeisen, L. Rauser, E. Grajkowska, P. Ernsberger, J. T.Wroblewski, J.H.NadeauandB.L.Roth.(2003)L-homocysteinesulfinicacidandother acidic homocysteine derivatives are potent and selective metabotropicglutamatereceptoragonists,J.Pharmacol.Exp.Ther.,305,131-142.
[7] R. J.Huxtable. (1989)Taurine in thecentralnervoussystemand themammalianactionsoftaurine,Prog.Neurobiol.,32,471-533.
[8] I.Santa-María,F.Hernández,F.J.MorenoandJ.Avila.(2007)Taurine,aninducerfor tau polymerization and a weak inhibitor for amyloid-β-peptide aggregation,Neurosci.Lett.,429,91-94.
[9] F.Gervais,R.Chalifour,D.Garceau,X.Kong,J.Laurin,R.McLaughlin,C.Morissetteand J. Paquette. (2001) Glycosaminoglycan mimetics: a therapeutic approach tocerebralamyloidangiopathy,Amyloid,8Suppl1,28-35.
[10] T. C. Jackson, J. D. Verrier and P.M. Kochanek. (2013) Anthraquinone-2-sulfonicacid(AQ2S)isanovelneurotherapeuticagent,CellDeathDis.,4,e451.
[11] R.Hoessel,S.Leclerc,J.A.Endicott,M.E.Nobel,A.Lawrie,P.Tunnah,M.Leost,E.Damiens, D. Marie, D. Marko, E. Niederberger, W. Tang, G. Eisenbrand and L.Meijer. (1999) Indirubin, the active constituent of a Chinese antileukaemiamedicine,inhibitscyclin-dependentkinases,Nat.CellBiol.,1,60-67.
[12] J.Ni,T.Mai, S.-T. Pang, I.Haque,K.Huang,M.A.DiMaggio, S. Xie,N. S. James,D.Kasi,S.R.ChemlerandS.Yeh.(2009)InvitroandinvivoanticancereffectsofthenovelvitaminEetheranalogueRRR-α-tocopheryloxybutylsulfonicacidinprostatecancer,Clin.CancerRes.,15,898-906.
[13] H.Griem,J.Ahlers,R.Bias,B.Broecker,H.Hollander,H.-P.Gelbke,H.-J.Klimisch,I.Mangelsdorf, A. Paetz, N. Schong, G. Stropp, R. Vogel, C. Weber, K. Ziegler-Skylakakis and E. Bayer. (1994) Toxicity and ecotoxicity of sulfonic acids:structure-activityrelationship,Chemosphere,28,2203-2236.
[14] P.C.Andrews,M.Busse,G.B.Deacon,R.L.Ferrero,P.C.Junk,K.K.Huynh,I.Kumarand J. G.Maclellan. (2010) Structural and solution studies of phenylbismuth(III)sulfonate complexes and their activity againstHelicobacter pylori,Dalton Trans.,39,9633-9641.
[15] P.C.Andrews,M.Busse,G.B.Deacon,R.L.Ferrero,P.C.Junk,J.G.MacLellanandA.Vom. (2012) Remarkable in vitro bactericidal activity of bismuth(III) sulfonatesagainstHelicobacterpylori,DaltonTrans.,41,11798-11806.
Chapter6.Anti-canceractivityofBi(III)complexes
272
[16] P.C.Andrews,M.Busse,P.C. Junk,C.M.ForsythandR.Peiris. (2012)Sulfonato-encapsulated bismuth(III) oxido-clusters from Bi2O3 in water under mildconditions,Chem.Commun.,48,7583-7585.
[17] I. Morita, M. Kawamoto, M. Hattori, K. Eguchi, K. Sekiba and H. Yoshida. (1990)Determinationof tryptophanand itsmetabolites inhumanplasmaandserumbyhigh-performance liquid chromatography with automated sample clean-upsystem,J.Chromatogr.B,526,367-374.
[18] National Center for Biotechnology Information. PubChem Compound Database;CID=92904,Available from: https://pubchem.ncbi.nlm.nih.gov/compound/92904[accessedJan.4,2018].
[19] S.Biswal,U. Sahoo, S. Sethy,H.K. S.Kumar andM.Banerjee. (2012) Indole:Themoleculeofdiversebiologicalactivities,AsianJ.Pharm.Clin.Res.,5,1-6.
[20] J.-R. Weng, C.-H. Tsai, S. K. Kulp and C.-S. Chen. (2008) Indole-3-carbinol as achemopreventiveandanti-canceragent,CancerLett.,262,153.
[21] CelineJ. Marmion, D. Griffith and KevinB. Nolan. (2004) Hydroxamic acids − anintriguingfamilyofenzymeinhibitorsandbiomedicalligands,Eur.J.Inorg.Chem.,2004,3003-3016.
[22] E. C. O'Brien. (1997) Metal complexes of salicylhydroxamic acid andO-acetylsalicylhydroxamicacid,Inorg.Chim.Acta,266,117-120.
[23] E.M.F.MuriandT.G.Barros.(2013)Hydroxamicacidsasinhibitorsofureaseinthe treatment of Helicobacter pylori infections, In Hydroxamic Acids: A UniqueFamily of Chemicals with Multiple Biological Activities (S. P. Gupta, Ed.),pp-241-254,SpringerBerlinHeidelberg.
[24] P.S.DobbinandR.C.Hider.(1990)Ironchelationtherapy,Chem.Br.,26,565-568.[25] D. C. Argentieri, D. M. Ritchie, M. P. Ferro, T. Kirchner, M. P. Wachter, D. W.
Anderson, M. E. Rosenthale and R. J. Capetola. (1994) Tepoxalin: a dualcyclooxygenase/5-lipoxygenase inhibitor of arachidonic acid metabolism withpotent anti-inflammatory activity and a favorable gastrointestinal profile,J.Pharmacol.Exp.Ther.,271,1399-1408.
[26] W. P. Steward. (1999) Marimastat (BB2516): current status of development,CancerChemother.Pharmacol.,43Suppl,S56-60.
[27] Z. I. Cabantchik. (1995) Iron chelators as antimalarials: the biochemical basis ofselectivecytotoxicity,Parasitol.Today,11,74-78.
[28] S.H.Chen,H.M.Wu,B.Ossola,N.Schendzielorz,B.C.Wilson,C.H.Chu,S.L.Chen,Q.Wang, D. Zhang, L. Qian, X. Li, J. S. Hong andR. B. Lu. (2012) Suberoylanilidehydroxamic acid, a histonedeacetylase inhibitor, protectsdopaminergicneuronsfromneurotoxin-induceddamage,Br.J.Pharmacol.,165,494-505.
[29] W. N. Fishbein and P. P. Carbone. (1965) Urease catalysis. II. Inhibition of theenzymebyhydroxyurea,hydroxylamine,andacetohydroxamicacid,J.Biol.Chem.,240,2407-2414.
[30] H. P. Makkar, O. P. Sharma, R. K. Dawra and S. S. Negi. (1981) Effect ofacetohydroxamicacidonrumenureaseactivityinvitro,J.DairySci.,64,643-648.
[31] D.M.Keogan, B. Twamley,D. Fitzgerald-Hughes andD.M.Griffith. (2016)Novelclass of Bi(III) hydroxamato complexes: synthesis, urease inhibitory activity andactivityagainstH.pylori,DaltonTrans.,45,11008-11014.
[32] S. Pang, S. Tristram and S. Brown. (2011) Salicylhydroxamic acid inhibits thegrowthofCandidaalbicans,Int.J.Biol.LifeSci.,7,40-46.
[33] S.-Y. M. Pang, S. Tristram and S. Brown. (2011) Inhibition of the growth ofpathogenicCandidaspp.bysalicylhydroxamicacid,Int.J.Biol.LifeSci.,7,1-7.
[34] I. Botos, L. Scapozza,D. Zhang, L. A. Liotta andE. F.Meyer. (1996)Batimastat, apotentmatrixmealloproteinaseinhibitor,exhibitsanunexpectedmodeofbinding,Proc.Natl.Acad.Sci.U.S.A.,93,2749-2754.
[35] S. M. Wojtowicz-Praga, R. B. Dickson and M. J. Hawkins. (1997) Matrixmetalloproteinaseinhibitors,Invest.NewDrugs,15,61-75.
Chapter6.Anti-canceractivityofBi(III)complexes
273
[36] S. S. Tam,D.H. Lee, E. Y.Wang,D. G.Munroe andC. Y. Lau. (1995)Tepoxalin, anovel dual inhibitor of the prostaglandin-H synthase cyclooxygenase andperoxidaseactivities,J.Biol.Chem.,270,13948-13955.
[37] P. J.Loll,C.T.Sharkey,S. J.O'Connor,C.M.Dooley,E.O'Brien,M.Devocelle,K.B.Nolan,B.S.SelinskyandD. J.Fitzgerald.(2001)O-acetylsalicylhydroxamicacid,anovelacetylatinginhibitorofprostaglandinH2synthase:structuralandfunctionalcharacterizationofenzyme-inhibitorinteractions,Mol.Pharmacol.,60,1407-1413.
[38] C. M. Dooley, M. Devocelle, B. McLoughlin, K. B. Nolan, D. J. Fitzgerald and C. T.Sharkey. (2003) A novel family of hydroxamate-based acylating inhibitors ofcyclooxygenase,Mol.Pharmacol.,63,450-455.
[39] J.A.Sparano,P.Bernardo,P.Stephenson,W.J.Gradishar,J.N.Ingle,S.ZuckerandN.E.Davidson.(2004)RandomizedPhaseIIItrialofmarimastatversusplaceboinpatientswithmetastaticbreastcancerwhohaverespondingorstablediseaseafterfirst-line chemotherapy: Eastern cooperative oncology group trial E2196, J. Clin.Oncol.,22,4683-4690.
[40] M.L.Rothenberg,A.R.NelsonandK.R.Hande.(1998)Newdrugsonthehorizon:matrixmetalloproteinaseinhibitors,Oncologist,3,271-274.
[41] P.A.MarksandR.Breslow.(2007)Dimethylsulfoxidetovorinostat:developmentofthishistonedeacetylaseinhibitorasananticancerdrug,Nat.Biotech.,25,84-90.
[42] H.-J. Kim and S.-C. Bae. (2011) Histone deacetylase inhibitors: molecularmechanismsofactionandclinicaltrialsasanti-cancerdrugs,Am.J.Transl.Res.,3,166-179.
[43] O.A.O'Connor,S.Horwitz,T.Masszi,A.VanHoof,P.Brown,J.Doorduijn,G.Hess,W. Jurczak,P.Knoblauch,S.Chawla,G.Bhat,M.R.Choi, J.Walewski,K.Savage,F.Foss, L. F. Allen and A. Shustov. (2015) Belinostat in patients with relapsed orrefractory peripheral T-cell lymphoma: results of the Pivotal Phase II BELIEF(CLN-19)study,J.Clin.Oncol.,33,2492-2499.
[44] D. Pal and S. Saha. (2012) Hydroxamic acid – a novel molecule for anticancertherapy,J.Adv.Pharm.Technol.Res.,3,92-99.
[45] National Center for Biotechnology Information. PubChem Compound Database;CID=6926, Available from: https://pubchem.ncbi.nlm.nih.gov/compound/6926[accessedJan.4,2018].
[46] National Center for Biotechnology Information. PubChem Compound Database;CID=8479, Available from: https://pubchem.ncbi.nlm.nih.gov/compound/8479[accessedJan.6,2018].
[47] National Center for Biotechnology Information. PubChem Compound Database;CID=8316, Available from: https://pubchem.ncbi.nlm.nih.gov/compound/8316[accessedJan.4,2018].
[48] National Center for Biotechnology Information. PubChem Compound Database;CID=6670, Available from: https://pubchem.ncbi.nlm.nih.gov/compound/6670[accessedJan.42018].
[49] National Center for Biotechnology Information. PubChem Compound Database;CID=6793, Available from: https://pubchem.ncbi.nlm.nih.gov/compound/6793[accessedJan.4,2018].
[50] C.Fernandez-Tornero,R.M.Lozano,M.Redondo-Horcajo,A.M.Gomez,J.C.Lopez,E. Quesada, C. Uriel, S. Valverde, P. Cuevas, A. Romero and G. Gimenez-Gallego.(2003) Leads for development of new naphthalenesulfonate derivatives withenhanced antiangiogenic activity: crystal structure of acidic fibroblast growthfactor in complex with 5-amino-2-naphthalene sulfonate, J. Biol. Chem., 278,21774-21781.
[51] R. Kaushal and Sheetal. (2016) In vitro anticancer and antibacterial activities ofoctahedral ruthenium(III) complexes with hydroxamic acids. Synthesis andspectroscopiccharacterization,Russ.J.Gen.Chem.,86,360-367.
Chapter6.Anti-canceractivityofBi(III)complexes
274
[52] E. C. O'Brien, E. Farkas, M. Jose Gil, D. Fitzgerald, A. Castineras and K. B. Nolan.(2000) Metal complexes of salicylhydroxamic acid (H2SHA), anthranilichydroxamic acid and benzohydroxamic acid. Crystal and molecular structure of[Cu(phen)2(Cl)]ClPh2Sha, a model for a peroxidase-inhibitor complex, J. Inorg.Biochem.,79,47-51.
[53] B. Van't Riet, G. L.Wampler and H. L. Elford. (1979) Synthesis of hydroxy- andamino-substitutedbenzohydroxamicacids: inhibitionofribonucleotidereductaseandantitumoractivity,J.Med.Chem.,22,589-592.
[54] F. F.Wagner, D. E. Olson, J. P. Gale, T. Kaya, M.Weïwer, N. Aidoud, M. Thomas,E.L.Davoine, B. C. Lemercier, Y.-L. Zhang and E. B. Holson. (2013) Potent andselective inhibition of histone deacetylase 6 (HDAC6) does not require asurface-bindingmotif,J.Med.Chem.,56,1772-1776.

Chapter7.
ConclusionsandFutureDirections
Chapter7.ConclusionsandFutureDirections
276
7.1ConclusionsCRC is the secondmost common cancer in both men and women in Australia.
AstheincidenceofCRChasnotimprovedsincethe1980s,chemoprevention(theuse
ofapharmacologicalornutritionalagenttoprevent,reverse,ordelaytheprogression
ofcarcinogenesis)hasbeensuggestedasaprimarypreventionstrategytoreducethe
burden of this disease. The upregulation of COX-2, an enzyme expressed during
inflammation response, has been linked to a number of cancers, including CRC.
Assuch,inhibitionofCOX-2maypresentatargetforchemoprevention/chemotherapy.
To this end, over-the-counter COX inhibitors, NSAIDs, have been investigated as
potential chemopreventives. Several epidemiological and clinical studies provided
evidencethatNSAIDs(inparticular,aspirinandsulindac)reducetheriskofCRCwhen
taken regularly over periods of months to years. However, side effects, such as
GIbleeding, CV abnormalities and hepatotoxicity, limit the daily use of NSAIDs over
prolonged periods of time. As such, a method to make NSAIDs safer for long-term
administration is needed, without diminishing the chemotherapeutic potential of
theNSAIDs.
Severalstudieshaveshownthatanumberofmetal-NSAIDcomplexesreducethe
formationofGIulcerationcomparedtothenon-complexedNSAIDsinanimalmodels.
Importantly,[Cu2(indo)4(DMF)2]reducedaberrantcryptformationintherodentcolon
cancer model, while also exhibiting GI sparing properties.Bismuth, a group 15
post-transitionmetal,hasbeenusedtotreatanarrayofGIdiseasesforcenturies,with
anacceptabletoxicityprofileatlowdoseswhenadministeredoverextendedperiods.
Thus, it ishypothesised that thecombinationofBi andNSAID ina single compound
may potentially relieve the adverse GI side effects of NSAIDs if used daily as a
chemopreventive agent. To this end, the suitability of Bi complexes of
NSAIDs (BiNSAIDs) as potential chemotherapeutics or chemopreventives needs to
beexamined.
In order to determine the suitability of the BiNSAIDs, Bi(tolf)3, Bi(mef)3 and
Bi(difl)3, as a potential chemotherapeutic or chemopreventive agents against CRC, it
wasnecessarytoevaluatetheinvitropotentialoftheBiNSAIDsasapreludetofuture
work that would involve in vivo studies. The experiments described in this Thesis
were divided into two goals: (i) to establish the chemotherapeutic potential of
BiNSAIDsbydeterminingwhetherBiNSAIDsareabletokilltransformedcells(toxicity
and cell death assays), and (ii) to establish whether BiNSAIDs demonstrate
Chapter7.ConclusionsandFutureDirections
277
chemopreventivepotentialbydeterminingwhetherBiNSAIDsareable to inhibit the
production of PGE2 (and thus inhibit COX) in transformed cells. A human epithelial
ileocecalcoloncancercell line,HCT-8,wasemployedasamodelCRCcell lineforthe
evaluation of the BiNSAIDs, and the respective uncomplexed NSAIDs, tolfH, mefH
anddiflH.
OnespecificaimofthisprojectwastocomparethetoxicityofBiNSAIDstothatof
the uncomplexed NSAIDs. The toxicity of the BiNSAIDs and NSAIDs towards the
HCT-8cellswasassessedusingtheMTTassay(Chapter2). Theresultsshowedthat
the toxicity ranking of the BiNSAIDs paralleled those of the respective free
NSAIDs:diflH<mefH<tolfH.WhiletheIC50valuesoftheBiNSAIDs(rangingbetween
16−81μM) were lower than the free NSAIDs (ranging between 37−403μM), it was
apparentthatthetoxicityoftheBiNSAIDswasreflectiveofthemolarratioofthethree
NSAIDmoleculescontainedintheBiNSAIDs,withtheexceptionofBi(difl)3.Oneofthe
most importantresults fromtheMTTassayswasthemicromolar toxicityofBi(tolf)3
and Bi(mef)3 towards HCT-8 cells which was comparable to the anti-cancer drug,
cisplatin(IC50=16μM,41μM,and50μM,respectively).
Themechanismof cell deathwas investigatedusing phase contrastmicroscopy
and AnnV/7AAD staining (Chapter 2). The results from these experiments showed
that treatment with all BiNSAIDs and NSAIDs induced morphological changes
indicativeofcelldeathviaapoptosis.WhenconsideredwiththeresultsfromtheMTT
assays,itappearedmostlikelythattheNSAIDisthemaincontributorofthetoxicityof
theBiNSAIDcomplexes.TheexperimentsdescribedinChapter2showedforthefirst
time that BiNSAIDs exhibit potential anti-cancer activity towards a human colon
cancer cell line in vitro and that cell death occurred via apoptotic pathway.
Furthermore, the toxicityof theBiNSAIDswas similaror improvedcompared to the
respectiveNSAIDs,indicatingthatthecomplexationwithBididnotnegativelyimpact
thebioactivityoftheNSAIDs.
The second focus of the in vitro studieswas to determine if theBiNSAID could
inhibitCOXactivityinthecoloncancercellssincethiswastheunderlyingmechanism
that hadbeenhypothesised forNSAID chemopreventive behaviour. As such, assays
wereperformedtodeterminewhethercomplexationwithBiaffectstheabilityofthe
NSAIDs, tolfH, mefH and diflH, to interact with COX in vitro, by quantifying PGE2
productionbyHCT-8cells(Chapter2).Theinhibitionoftheprostaglandin,PGE2,was
studiedsincePGE2hasanestablishedroleinthepromotionofcancercellgrowthand

Chapter7.ConclusionsandFutureDirections
278
fortification (Fig. 1.5). The results showed that the inhibitionofPGE2productionof
HCT-8cellstreatedwiththeBiNSAIDsparalleledthoseoftherespectivefreeNSAIDs:
diflH < mefH < tolfH. There are two important conclusions from these
experiments.Firstly,theresultsindicatedthattheanti-cancereffectsoftheexamined
NSAIDswere not substantially diminished by the coordination of Bi to the NSAIDs.
Furthermore, the results confirmed that treatment of HCT-8 cells with BiNSAIDs
caused a reduction in PGE2 (via COX inhibition),which is one of themechanisms of
actionhypothesisedfortheNSAID-chemopreventionofCRC.
Once the biological potential of the BiNSAIDs had been established in vitro,
Biuptakeandlocalisationstudieswereperformedtofurtherprobetheirintracellular
behaviour. Bi uptake was quantified using GFAAS (Chapter 3) where the highest
cellular Bi was observed following treatment with Bi(tolf)3. Since the NMR studies
(Chapter 2) indicated that Bi(tolf)3 was themost stable BiNSAID in cell medium, it
appears that Bi uptake is most likely facilitated by the NSAID. Treatment with
Bi(mef)3andBi(difl)3resultedinsubstantial,butmuchloweruptakeofBicomparedto
Bi(tolf)3, which correlated with their lower toxicities and increased reactivity
(potentialdissociation)incellmediumasdeterminedbyNMRspectroscopy.
Microprobe SRXRF imaging (Chapter 3) showed that the intracellular fate of Bi
was similar for all BiNSAID treatments irrespective of the coordinated NSAID.
Forinstance, all BiNSAID-treated cells showed Bi accumulation in the cytoplasm
within24-hexposure,typicallyindiscretehotspots.Anumberofpossiblereasonsfor
thelocalisation(includingtargetingofthenucleusandmitochondria)wereconsidered
andtwomorefeasibleoptionswereconcludedbasedoncorrelationmapsandreports
fromtheliterature.ThefirstwasthathotspotscorrelatedwithlysosomessincetheBi
locationandthesizeofthehotspots(0.3–5.8μm2)wereconsistent.Itwaspostulated
that thispackagingofBimightbe thecellsmechanismofdetoxification. Asmanyof
thehotspotswerelocatednearthenucleus,andacknowledgingthatCOX-2islocated
the on nuclear membrane, the SRXRF results also indicate that Bi is capable of
intracellular movement. In the instance that the BiNSAID has remained intact this
would suggest that BiNSAIDs could locate in the vicinity of and target COX-2. It is
importanttonote,however,thattheexperimentalmethodsutilisedinthisstudyonly
provided informationabout theuptakeand localisationofBi. Consequently, it isnot
possible tomakeanyevidence-based conclusionsabout theuptakeand intracellular
fateoftheNSAIDs.WhilethiscouldbeaddressedbytaggingtheNSAID,thistoowould
Chapter7.ConclusionsandFutureDirections
279
beinconclusiveifthetaggingalteredthecellulardistributionoftheBiNSAID.
SR-IRMSwasutilisedtoprobecellularbiomolecularchangesassociatedwiththe
treatment of liveHCT-8 cellswith BiNSAIDs andNSAIDs (Chapter 4). A number of
factors were considered when analysing the spectra obtained from the live cell
populations. Firstly, while live cell analysis can reduce spectral artifacts, such as
RMieS,theIRspectraofwatercontainsavibrationalmode(visualisedasabroadband
at~1643cm−1)thatoverlapswiththeamideIband,andtoalesserextenttheamideII
band.Theconcernisthatthiscanresultinthedistortionoftheintensityratioofthe
amide I/amide IIbands, thusconfoundingbiomolecularchangesresulting fromdrug
treatment.Inordertodeterminewhetherthewaterbandsubstantiallyinfluencesthe
biological information contained in the amide region, a correction strategy was
appliedtoremovethewaterbandsfromthecellspectra.TheresultantPCAscoresand
loadings plots revealed very little difference before and after the application of the
waterbandcorrectionappliedinthisstudy.However,duetocontinueddebateinthe
literatureabouttheidealcorrectionstrategy,moreworkwillneedtobeperformedin
thisarea.
Subsequently,theSR-IRMScellspectrawereanalysedintwoways,wherebythe
spectrawereanalysedwithandwithouttheinclusionoftheamideregion.Itwasclear
fromthePCAscoresplotsthatintra-sampleandinter-samplevarianceexistedwithin
the vehicle-, BiNSAID-, and NSAID-treated populations. Examination of the PCA
loadings plots indicated that in the majority of BiNSAID- and NSAID-treated cell
populations,theloadingsassociatedwithlipidsdominatedthePCAloadingsplots.
Following4-htreatment,Bi(tolf)3andtolfHinducedsimilarbiomoleculareffects
on theHCT-8 cells in comparison to the vehicle,whichwereprimarily attributed to
effects on the lipids with some contribution from proteins. However, following
removal of the amide region, discrimination between the two compounds was
apparentandattributabletoν(C=O)andνas(PO2−),suggestiveofdifferenceintheeffect
ofthetwocompoundsonphospholipids.Bi(mef)3ormefHinducedsimilareffectson
theHCT-8cells,whichwereprimarilyattributedtolipids.DiflHinducedbiomolecular
effects on the HCT-8 cells, which were primarily attributed to proteins. However,
followingamideremovalfromPCAanalysis,diflHnolongershowedanychangesfrom
thevehicle. TreatmentwithBi(difl)3wasdistinguishable fromdiflHand thevehicle
followingamideremoval,whichwasprimarilyattributedtolipids.
Following24-htreatment,tolfHinducedbiomoleculareffectsontheHCT-8cells,
Chapter7.ConclusionsandFutureDirections
280
which were primarily attributed to a possible reduction in lipids with some
contribution from proteins. Treatment of the cells with Bi(tolf)3 induced a varied
responsewithintheBi(tolf)3-treatedpopulation. TreatmentwithBi(mef)3andmefH
induced similar biomolecular effects on the HCT-8 cells, which were primarily
attributedtolipids.ThisresultmightbeareflectionoftheBi(mef)3dissociationsuch
that theeffectofBi(mef)3 treatment isprimarilyattributable tomefH. Interestingly,
treatment with Bi(difl)3 resulted in no distinguishable difference from the vehicle-
treatedcellSR-IRMSspectra.However,treatmentwithdiflHwasdistinguishablefrom
Bi(difl)3 and vehicle scores, which was primarily attributed to a strong association
with lipids. This was due to a large increase in the lipids contributions that were
visualisedintheaveragedSR-IRMSspectraofthe24-hdiflH-treatedcells.
Recognisingthatanoverallchange in lipidswas thedominantobservation from
theSR-IRMSexperiments,ESI-MS/MSwasusedasacomplimentarytechniquetoshed
lightonwhether lipidchangesweretrulyassociatedwithBiNSAID/NSAIDtreatment
rather than intra-sample variation. The most abundant glycerophospholipids in
mammaliancells,PC,PEandPS,werechosenasa startingpoint tobeginexamining
theeffectsofBiNSAID/NSAIDtreatment.
The changes to the abundanceof the individualPC, PE andPSmolecules in the
overall profiles of the Bi(tolf)3- and Bi(difl)3-treated cells, and the respective
NSAID-treated cells, displayedmany similar changeswhen compared to the vehicle-
treated cells. There were some differences between the changes induced by
Bi(tolf)3/tolfH treatments compared to the Bi(difl)3/diflH treatments. When the PC
and PE molecules were grouped according to fatty acid categories, the observed
changesintheBi(tolf)-andtolfH-treatedcellsweresimilartoeachotherandshowed
a significantdecrease in the contributionofunsaturatedPCandPEmolecules,buta
significantincreaseinether-linkedmolecules.TheresultsobtainedfromtheBi(difl)3-
and diflH-treated cells showed similar changes in the grouped PE profile, but
conversely, the reverse trendwas observed in the groupedPCprofileswhereby the
contribution of the unsaturated PC and PE molecules significantly increased, but a
significant decrease in ether-linkedmoleculeswas observed. Thismay suggest that
while Bi(tolf)3 and Bi(difl)3 both induced cell death via apoptosis, the biomolecular
events that precede or occur during apoptosis differ between the two complexes
wherebytheHCT-8cellsresponddifferentlytothefenamatecompoundscomparedto
thesalicylatecompounds.

Chapter7.ConclusionsandFutureDirections
281
Additionally, changeswereobserved in the relativeconcentrationofPC,PEand
PS in the BiNSAID and NSAID-treated cells compared to the vehicle-treated cells.
However, when the PC and PE molecules were grouped according to fatty acid
categories, it was observed that there were some differences to the overall trend
between the Bi(tolf)3 and tolfH-treated cells compared to the vehicle-treated cells.
Specifically, an overall decrease in the relative concentrations of PC, PE and PSwas
also observed. This result was consistent with literature reports that PC and PE
concentrations are reduced in apoptotic cells, and the SR-IRMS studies, which
suggested that tolfH (and potentially Bi(tolf)3) were associated with lower lipid
content.
In contrast, some variation was observed between the response elicited by
Bi(difl)3comparedtodiflH,wherebythediflH-treatedcellsexhibitedlowerPC,PEand
PS than the Bi(difl)3-treated cells.This was inconsistent with the SR-IRMS
experimentsthatshowedthatdiflH-treatedcellswereassociatedwithincreasedlipid
content in the PCA results (24-h results). As such, this result may indicate that
glycerophospholipids (specifically PC, PE and PS) were not associated with the
increase in the lipid signalsand thatother lipids, includingneutral lipidclasses (e.g.
cholesterolesters,triacylglycerides)shouldbeexaminedinfuturestudies.
Encouraged by the promising in vitro anti-cancer activity of the BiNSAIDs
againstthe HCT-8 cells, and recognising that Bi itself possesses anti-cancer
activity (Section1.4.1.4), several Bi(III) complexes of aminoarenesulfonates,
indole-carboxylates, hydroxamates were screened for potential anti-cancer activity
invitrousingtheMTTassay. Thecomplexeswerechosenfor investigationsincethe
aforementionedchemicalclassescompriseexamplesofbiologicallyactivemolecules,
includinganti-cancerdrugs.TheresultsfromtheMTTassaysshowedthatofthefive
Bi(III)-aminoarenesulfonate complexes tested, only Bi(4A3HN-SO3)3 and its ligand,
4A3HN-SO3H, displayed toxicity (IC50 = 12μM and 131 μM, respectively) in the
concentrationrangetested(upto2mM).TheBi(III)indole-carboxylates,Bi(IGA)3and
Bi(ILA)3,displayedtwoofthehighestIC50values(10μMand17μM,respectively)of
all the tested Bi(III) complexes assayed in this Thesis, and were superior to the
anti-cancerdrug,cisplatin(IC50=50μM)whentestedintheHCT-8cells.Incontrast,
the free ligands, IGA-H and ILA-H showed little to no toxicity against the HCT-8
cells(upto2mM)indicatingthatthecomplexationtoBiisessentialfortoxicity.The
Bi(III)hydroxamates,Bi(BHA)3andBi(SHA)3, showedhigheractivity (IC50=106μM

Chapter7.ConclusionsandFutureDirections
282
and 159μM, respectively) against the HCT-8 cells than that expected for themolar
equivalent of the free ligands BHA-H and SHA-H (IC50 = 582 μM and > 2,000 μM,
respectively). Conversely, the toxicity of Bi(O-AcSHA)3 was lower than O-AcSHA-H
(IC50=>1,000μMand94μM,respectively).
ThestudiesreportedinthisThesissuggestthatBi(tolf)3isastrongcandidatefor
further testing in an animalmodel. Specifically, the Bi(tolf)3 complexwas themost
potentBiNSAID towards cancer cells in vitro (displaying toxicity at aphysiologically
relevant concentration), and appeared to maintain stability in the aqueous
environment used to simulate physiological conditions in vitro. Additionally, the
Bi(tolf)3 showed similar ability to inhibit the production of PGE2 (Chapter 2) and
inducedsimilarchangestothephospholipidprofilecomparedtotolfHatanequimolar
treatmentconcentration.
7.2FutureDirectionsOverall, the results reported in this Thesis indicate that BiNSAIDs display
potential chemotherapeutic and chemopreventive properties against transformed
cells invitro. InadditiontothefuturedirectionssuggestedinthepreviousChapters,
thelongertermdirectionoftheprojectsshouldincludetwogeneralaims:(i) further
invitro work, including screening against other cancer and healthy cell lines, and
(ii)ultimately,invivostudies.
ThestudiesreportedinthisThesiswerepurposelylimitedtoonecelllinetogain
a fundamental understanding of the interactions of BiNSAIDswith a representative
CRCcellline.Infuturestudies,itwouldbeofinteresttoassesswhethertheBiNSAIDs
display greater potency towards cell lines that overexpress COX-2 (e.g.HT-29 colon
cancercells)comparedtoacelllinethatexhibitsnoexpressionofCOX-2(e.g.HCT-116
colon cancer cells), and thus whether there is any correlation between COX-2
expressionandBiNSAIDtoxicity.TheseexperimentshavebeencommencedbyDillon,
BrownandRanson(personalcommunication).Itisanticipatedthatthesestudieswill
provide insight into whether the inhibition of COX-2 or other off-target effects are
essential for the in vitro toxicity of BiNSAIDs. Furthermore, BiNSAIDs could also be
assessed in vitro against other types of GI cancer cell lines, including esophageal,
gastric and other cancers of the upper intestinal tract. It will also be essential to
determine whether the BiNSAIDs display any toxicity towards non-cancerous cells
including primary fibroblasts (as a non-cancerous colon cell line) and

Chapter7.ConclusionsandFutureDirections
283
hPBMCs(isolatedfromhumanblood).
InorderfortheBiNSAIDstohaveanypotentialforuseaschemotherapeuticsor
chemopreventives,severaloutcomesmustfirstbeestablishedinvivo. Theseinclude:
(i) comparing the GI toxicity of the BiNSAIDs to the free NSAIDs following dosing
(short- and long-term) in order to establish if the BiNSAIDs protect against GI
ulceration; (ii) comparing the BiNSAIDs and NSAIDs for the prevention of tumour
formation in the GI tract as ameasure of chemoprevention, and (iii)measuring the
accumulation of Bi in the GI tract and vital organs (such as the liver, kidneys, and
brain)inordertodeterminethesafetyoftheBiNSAIDsfollowinglong-termdosing.
Based on the work presented here, studies to examine the aforementioned
outcomeshavebeencommenced(initiallyforBi(indo)3,indoH,Bi(asp)3andaspH)by
Dillon and Brown, et al. using rodent models (personal communication).
ThepreliminarydatashowsthatBiNSAIDsareabletoreducetheformationoflesions
in the small intestine of rats following a single dose (unpublished results). A long-
term study is planned whereby the ability of the BiNSAIDs to prevent tumour
formation in an azoxymethane/dextran sulfate sodium colitis mouse model.
Asdiscussed in Section 1.4.2, the accumulation of Bi in animal models has been
established andBi toxicity has occurred in humans (albeit patientswho have taken
extremelylargedosesofBi). Assuch,it isimportantthatanimalstudiesaddressthe
potentialforaccumulationandtoxicityofBifollowingtreatmentwithBiNSAIDs.The
accumulationofBi in theorgansof themicedosedwithBiNSAIDswill beexamined
using GFAAS to provide insight into the potential for Bi toxicity, and therefore, the
safetyoftheBiNSAIDs(DillonandBrownetal.,personalcommunication).
Overall, the results reported in this Thesis provide an indication that BiNSAIDs
displaychemotherapeuticandchemopreventionpropertiesagainsttransformedcells.
TheSR-IRMSandlipidESI-MS/MSexperimentsindicatethatthemechanismofaction
of the BiNSAIDs may be multi-faceted and may provide a more robust
chemotherapeuticapproachthansometraditionalchemotherapeuticdrugs,whereby
cancer cells often develop chemoresistance. Additionally, the employment of
chemopreventivemedications(particularly inpopulationsatriskofdevelopingCRC)
could be beneficial to society and reduce the costs associated with treating cancer.
Additional in vivo work will need to be performed in order to further reveal the
therapeuticpotentialoftheBiNSAIDs.
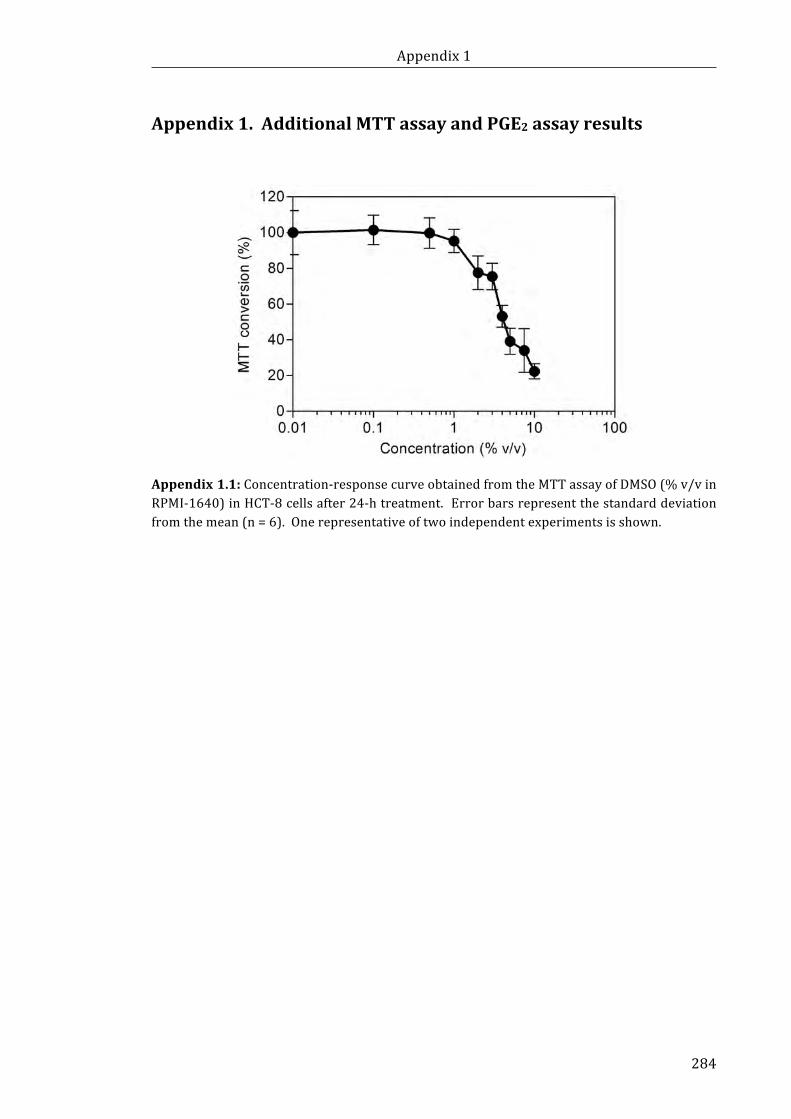
Appendix1
284
Appendix1.AdditionalMTTassayandPGE2assayresults
Appendix1.1:Concentration-responsecurveobtainedfromtheMTTassayofDMSO(%v/vinRPMI-1640)inHCT-8cellsafter24-htreatment.Errorbarsrepresentthestandarddeviationfromthemean(n=6).Onerepresentativeoftwoindependentexperimentsisshown.
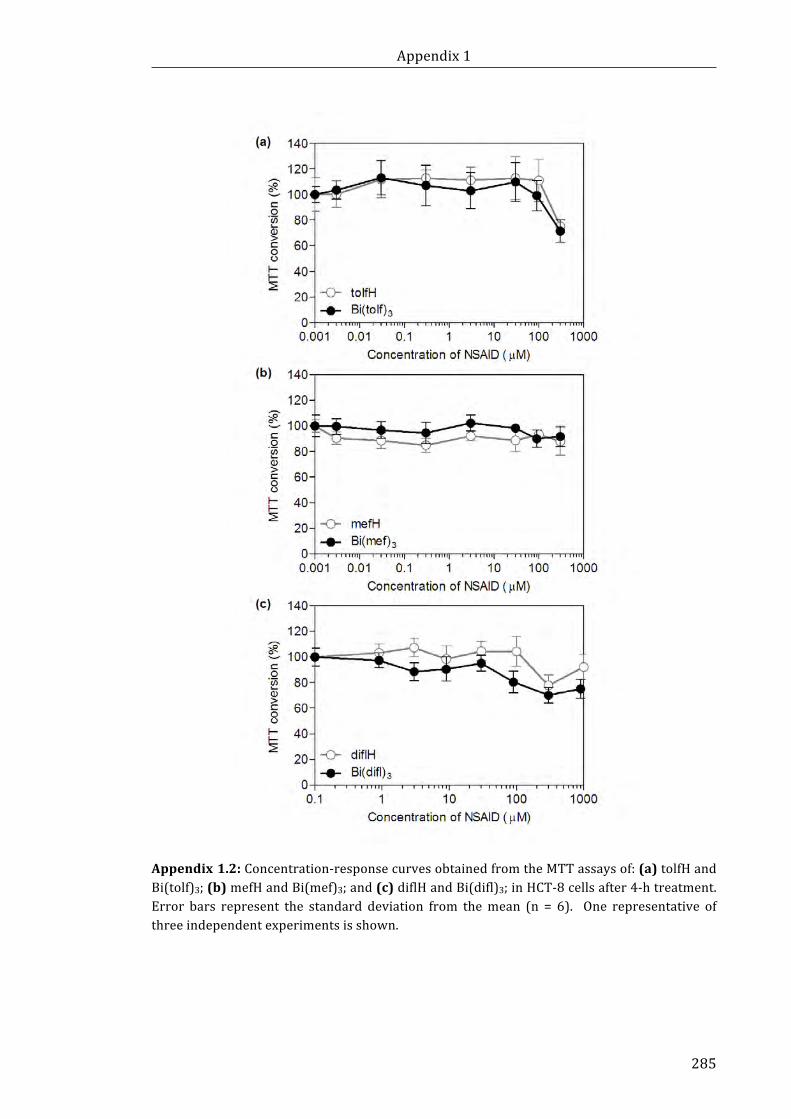
Appendix1
285
Appendix1.2:Concentration-responsecurvesobtainedfromtheMTTassaysof:(a)tolfHandBi(tolf)3;(b)mefHandBi(mef)3;and(c)diflHandBi(difl)3;inHCT-8cellsafter4-htreatment.Error bars represent the standard deviation from themean (n = 6). One representative ofthreeindependentexperimentsisshown.
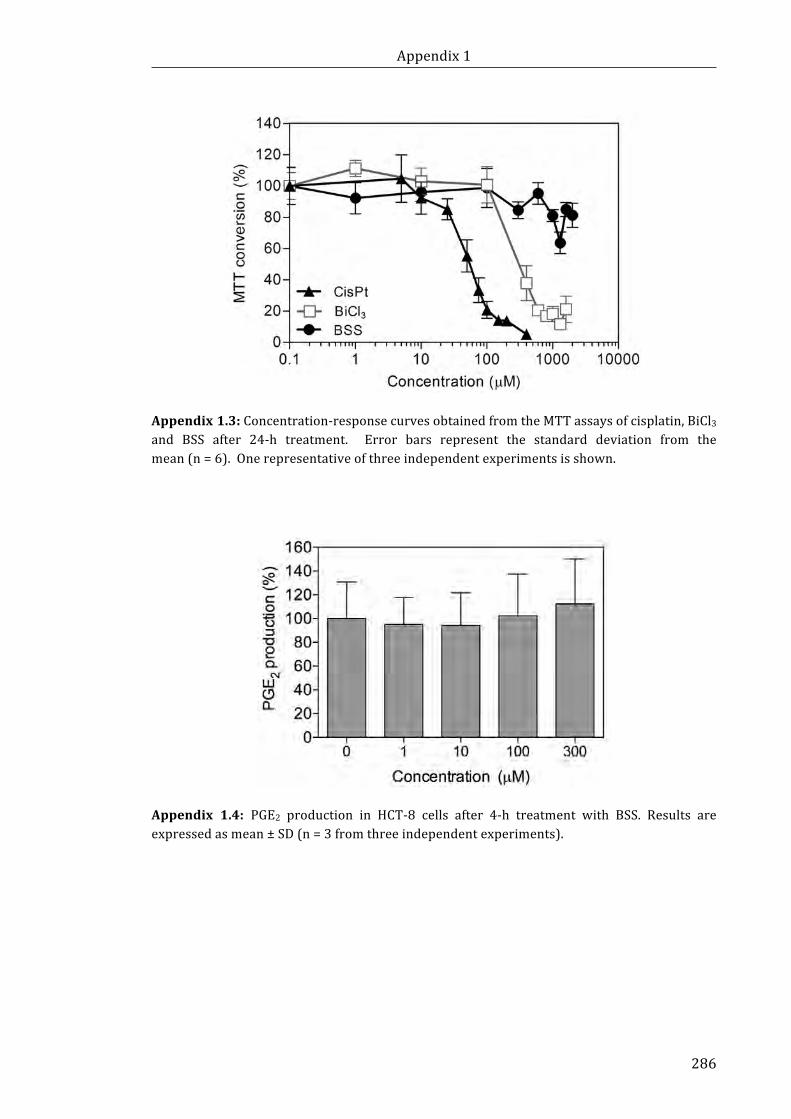
Appendix1
286
Appendix1.3:Concentration-responsecurvesobtainedfromtheMTTassaysofcisplatin,BiCl3and BSS after 24-h treatment. Error bars represent the standard deviation from themean(n=6).Onerepresentativeofthreeindependentexperimentsisshown.
Appendix 1.4: PGE2 production in HCT-8 cells after 4-h treatment with BSS. Results areexpressedasmean±SD(n=3fromthreeindependentexperiments).

Appendix1
287
Appendix1.5:Concentration-responsecurveobtainedfromtheMTTassaysofaspHinHCT-8cellsafter24-htreatment.Errorbarsrepresentthestandarddeviationfromthemean(n=6).Onerepresentativeofthreeindependentexperimentsisshown.
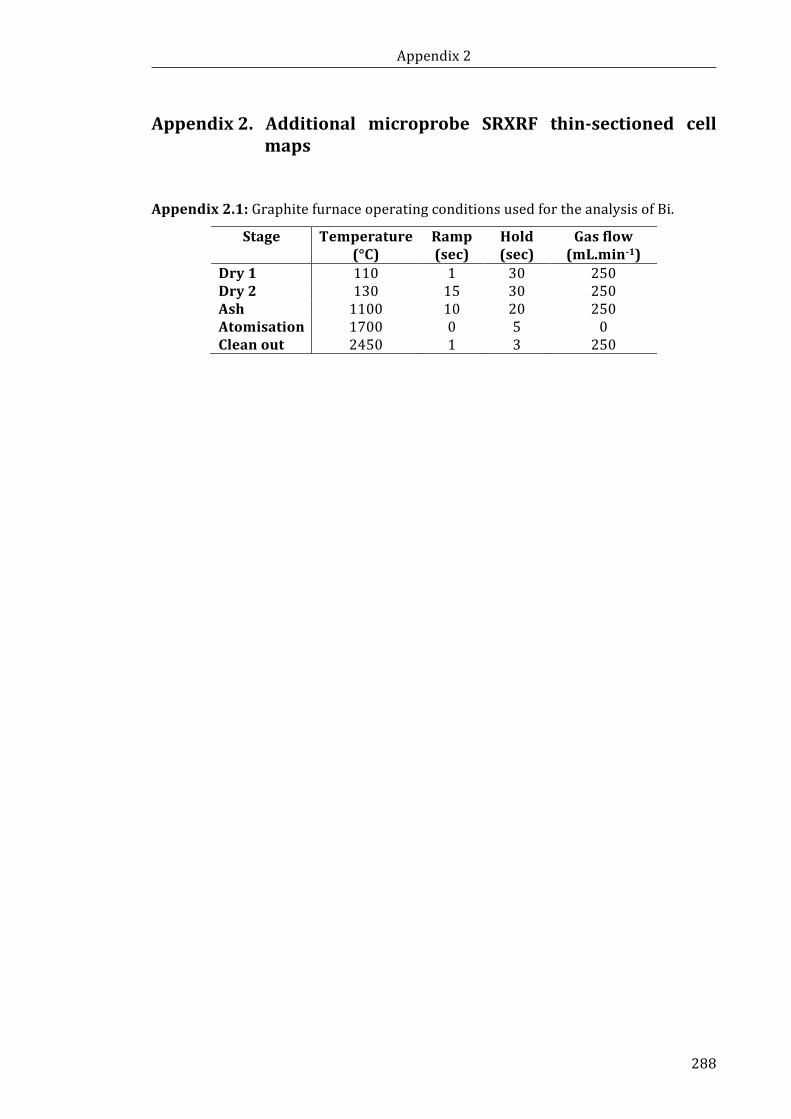
Appendix2
288
Appendix2. Additional microprobe SRXRF thin-sectioned cellmaps
Appendix2.1:GraphitefurnaceoperatingconditionsusedfortheanalysisofBi.
Stage Temperature(°C)
Ramp(sec)
Hold(sec)
Gasflow(mL.min-1)
Dry1 110 1 30 250Dry2 130 15 30 250Ash 1100 10 20 250Atomisation 1700 0 5 0Cleanout 2450 1 3 250
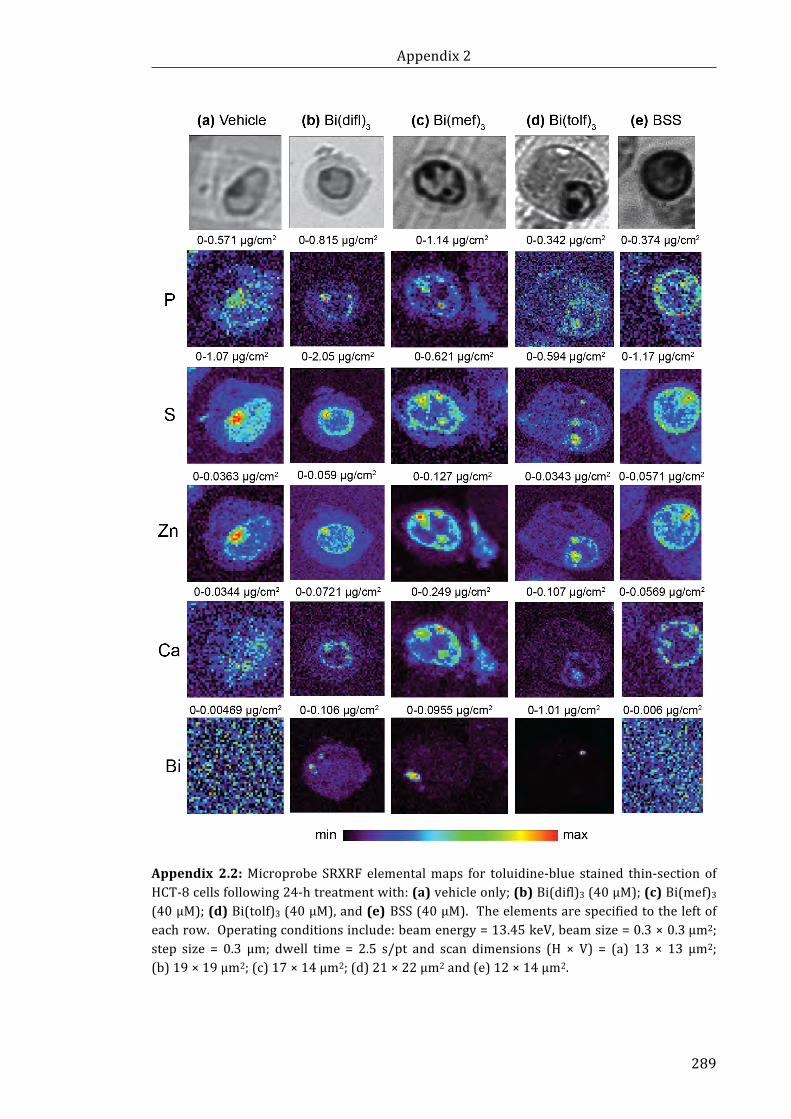
Appendix2
289
Appendix 2.2:Microprobe SRXRF elementalmaps for toluidine-blue stained thin-section ofHCT-8cellsfollowing24-htreatmentwith:(a)vehicleonly;(b)Bi(difl)3(40μM);(c)Bi(mef)3(40μM);(d)Bi(tolf)3(40μM),and(e)BSS(40μM).Theelementsarespecifiedtotheleftofeachrow.Operatingconditionsinclude:beamenergy=13.45keV,beamsize=0.3×0.3μm2;step size = 0.3 μm; dwell time = 2.5 s/pt and scan dimensions (H × V) = (a) 13 × 13 μm2;(b)19×19μm2;(c)17×14μm2;(d)21×22μm2and(e)12×14μm2.
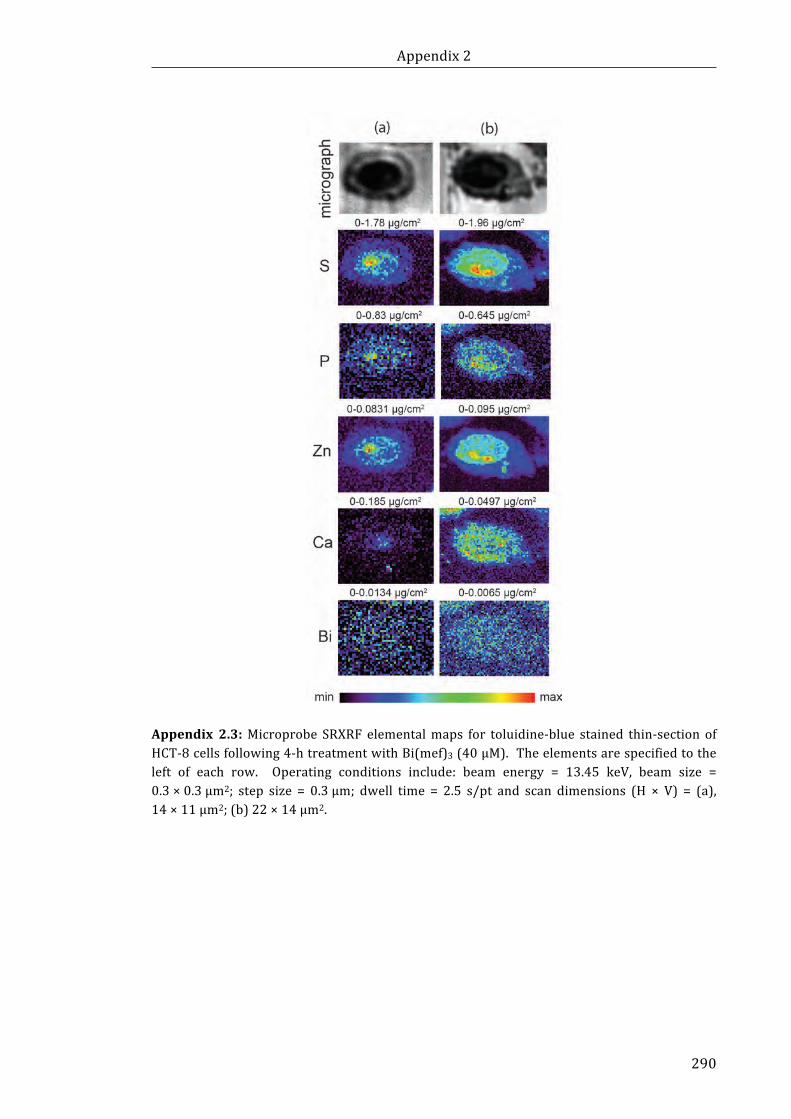
Appendix2
290
Appendix 2.3:Microprobe SRXRF elementalmaps for toluidine-blue stained thin-section ofHCT-8cellsfollowing4-htreatmentwithBi(mef)3(40μM).Theelementsarespecifiedtotheleft of each row. Operating conditions include: beam energy = 13.45 keV, beam size =0.3×0.3μm2; step size = 0.3μm; dwell time = 2.5 s/pt and scan dimensions (H × V) = (a),14×11μm2;(b)22×14μm2.
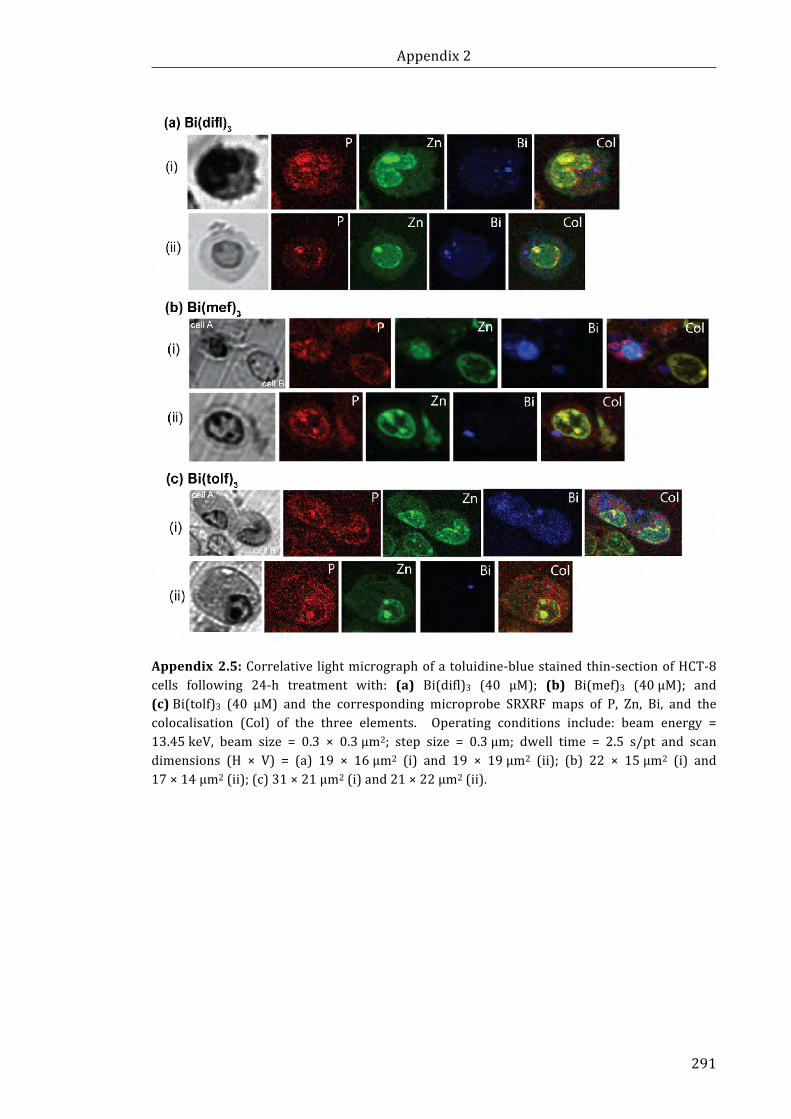
Appendix2
291
Appendix2.5:Correlative lightmicrographofatoluidine-bluestainedthin-sectionofHCT-8cells following 24-h treatment with: (a) Bi(difl)3 (40 μM); (b) Bi(mef)3 (40μM); and(c)Bi(tolf)3 (40 μM) and the corresponding microprobe SRXRF maps of P, Zn, Bi, and thecolocalisation (Col) of the three elements. Operating conditions include: beam energy =13.45keV, beam size = 0.3 × 0.3μm2; step size = 0.3μm; dwell time = 2.5 s/pt and scandimensions (H × V) = (a) 19 × 16μm2 (i) and 19 × 19μm2 (ii); (b) 22 × 15μm2 (i) and17×14μm2(ii);(c)31×21μm2(i)and21×22μm2(ii).
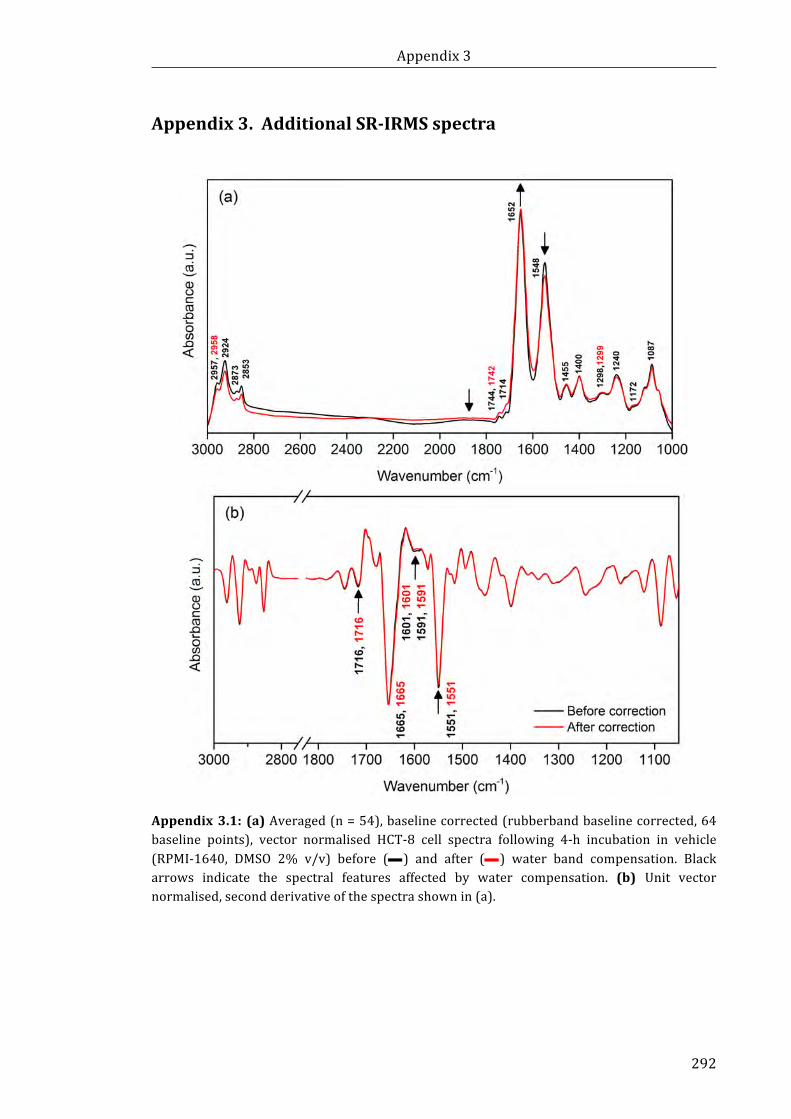
Appendix3
292
Appendix3.AdditionalSR-IRMSspectra
Appendix3.1: (a)Averaged(n=54),baselinecorrected(rubberbandbaselinecorrected,64baseline points), vector normalised HCT-8 cell spectra following 4-h incubation in vehicle(RPMI-1640, DMSO 2% v/v) before (—) and after (—) water band compensation. Blackarrows indicate the spectral features affected by water compensation. (b) Unit vectornormalised,secondderivativeofthespectrashownin(a).
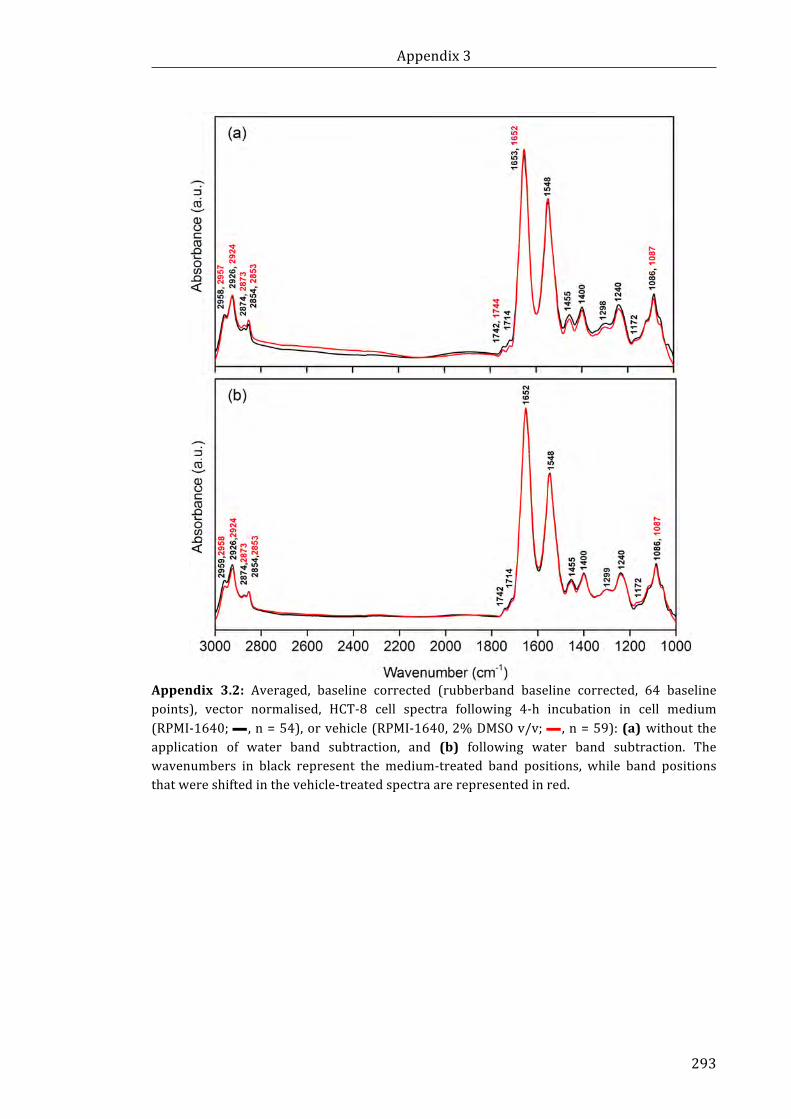
Appendix3
293
Appendix 3.2: Averaged, baseline corrected (rubberband baseline corrected, 64 baselinepoints), vector normalised, HCT-8 cell spectra following 4-h incubation in cell medium(RPMI-1640;— ,n=54),orvehicle(RPMI-1640,2%DMSOv/v;— ,n=59):(a)withouttheapplication of water band subtraction, and (b) following water band subtraction. Thewavenumbers in black represent the medium-treated band positions, while band positionsthatwereshiftedinthevehicle-treatedspectraarerepresentedinred.
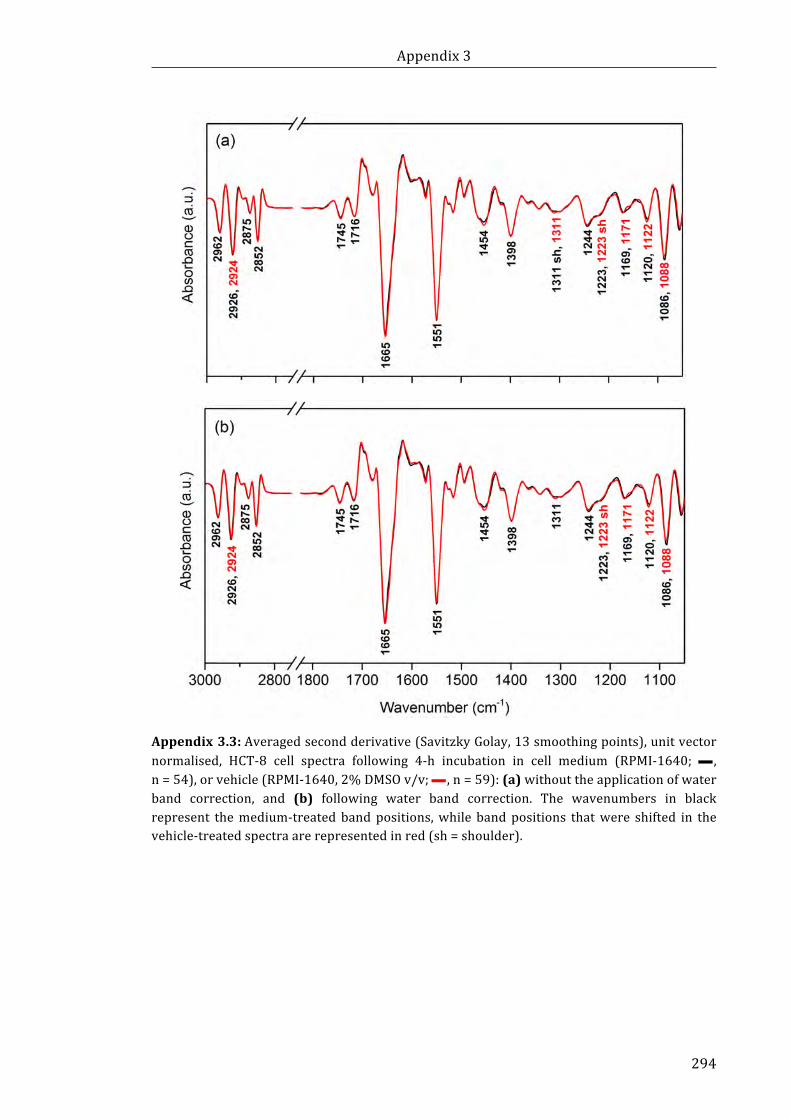
Appendix3
294
Appendix3.3:Averagedsecondderivative(SavitzkyGolay,13smoothingpoints),unitvectornormalised, HCT-8 cell spectra following 4-h incubation in cell medium (RPMI-1640; — ,n=54),orvehicle(RPMI-1640,2%DMSOv/v;— ,n=59):(a)withouttheapplicationofwaterband correction, and (b) following water band correction. The wavenumbers in blackrepresent themedium-treatedbandpositions,while bandpositions thatwere shifted in thevehicle-treatedspectraarerepresentedinred(sh=shoulder).
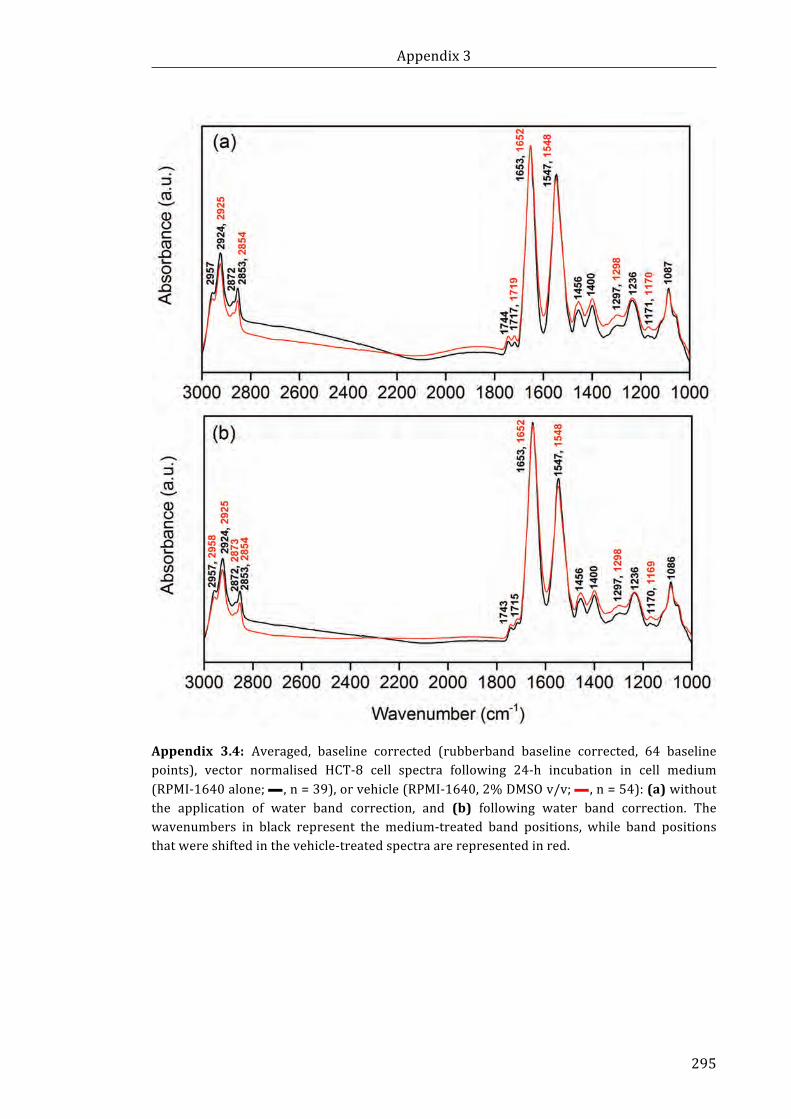
Appendix3
295
Appendix 3.4: Averaged, baseline corrected (rubberband baseline corrected, 64 baselinepoints), vector normalised HCT-8 cell spectra following 24-h incubation in cell medium(RPMI-1640alone;— ,n=39),orvehicle(RPMI-1640,2%DMSOv/v;— ,n=54):(a)withoutthe application of water band correction, and (b) following water band correction. Thewavenumbers in black represent the medium-treated band positions, while band positionsthatwereshiftedinthevehicle-treatedspectraarerepresentedinred.
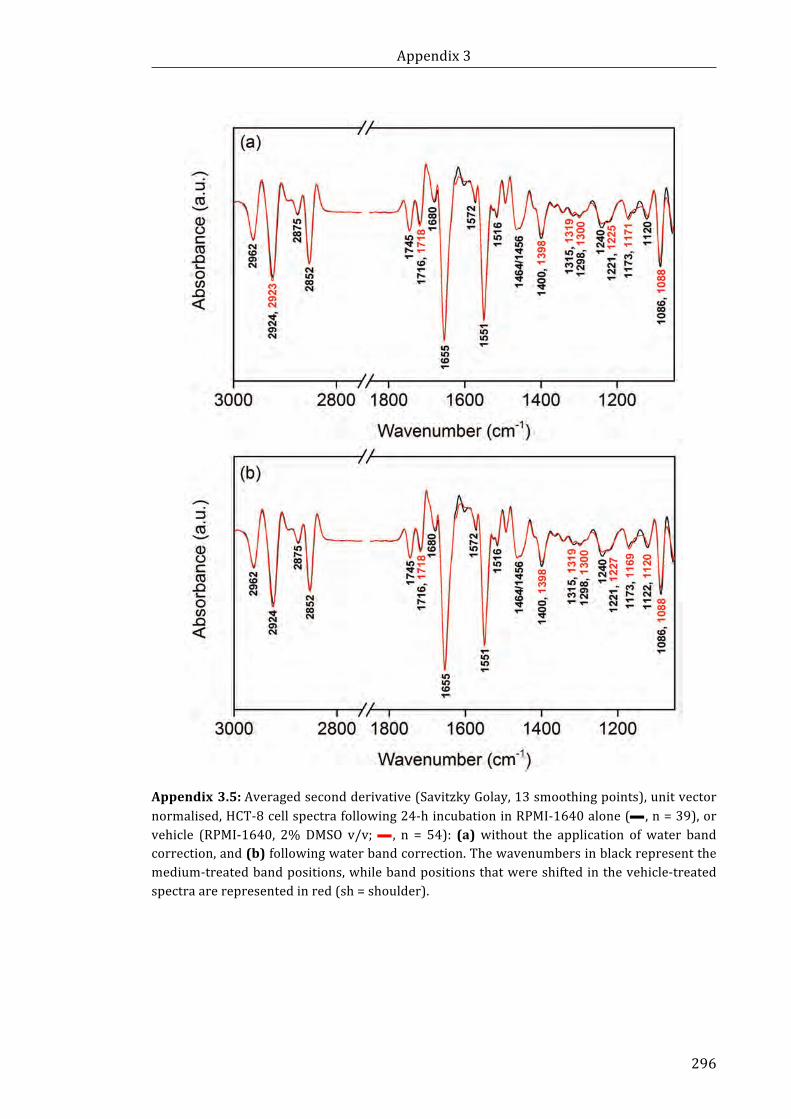
Appendix3
296
Appendix3.5:Averagedsecondderivative(SavitzkyGolay,13smoothingpoints),unitvectornormalised,HCT-8cellspectrafollowing24-hincubationinRPMI-1640alone(— ,n=39),orvehicle (RPMI-1640, 2%DMSO v/v;— , n = 54): (a) without the application of water bandcorrection,and(b)followingwaterbandcorrection.Thewavenumbersinblackrepresentthemedium-treatedbandpositions,whilebandpositionsthatwereshiftedinthevehicle-treatedspectraarerepresentedinred(sh=shoulder).

Appendix3
297
Appendix3.6:(a)Averaged,baselinecorrected(rubberbandbaselinecorrected,64baselinepoints),vectornormalisedHCT-8cellspectrafollowing4-hincubationinvehicle(RPMI-1640,DMSO2%v/v,— ,n=59),Bi(tolf)3(15µM, — ,n=45)ortolfH(45µM, — ,n=29).(b)Unitvectornormalised,secondderivativeofthespectrashownin(a).
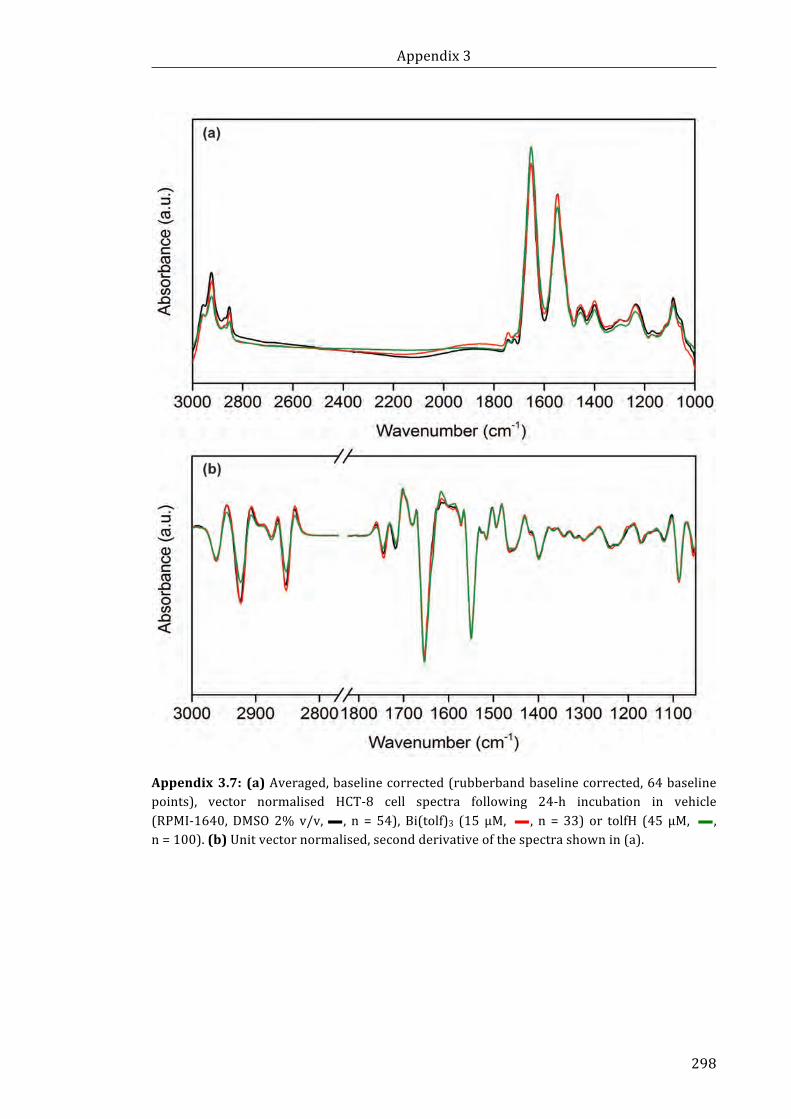
Appendix3
298
Appendix3.7:(a)Averaged,baselinecorrected(rubberbandbaselinecorrected,64baselinepoints), vector normalised HCT-8 cell spectra following 24-h incubation in vehicle(RPMI-1640,DMSO2%v/v,— , n = 54), Bi(tolf)3 (15 µM, — , n = 33) or tolfH (45 µM, — ,n=100).(b)Unitvectornormalised,secondderivativeofthespectrashownin(a).
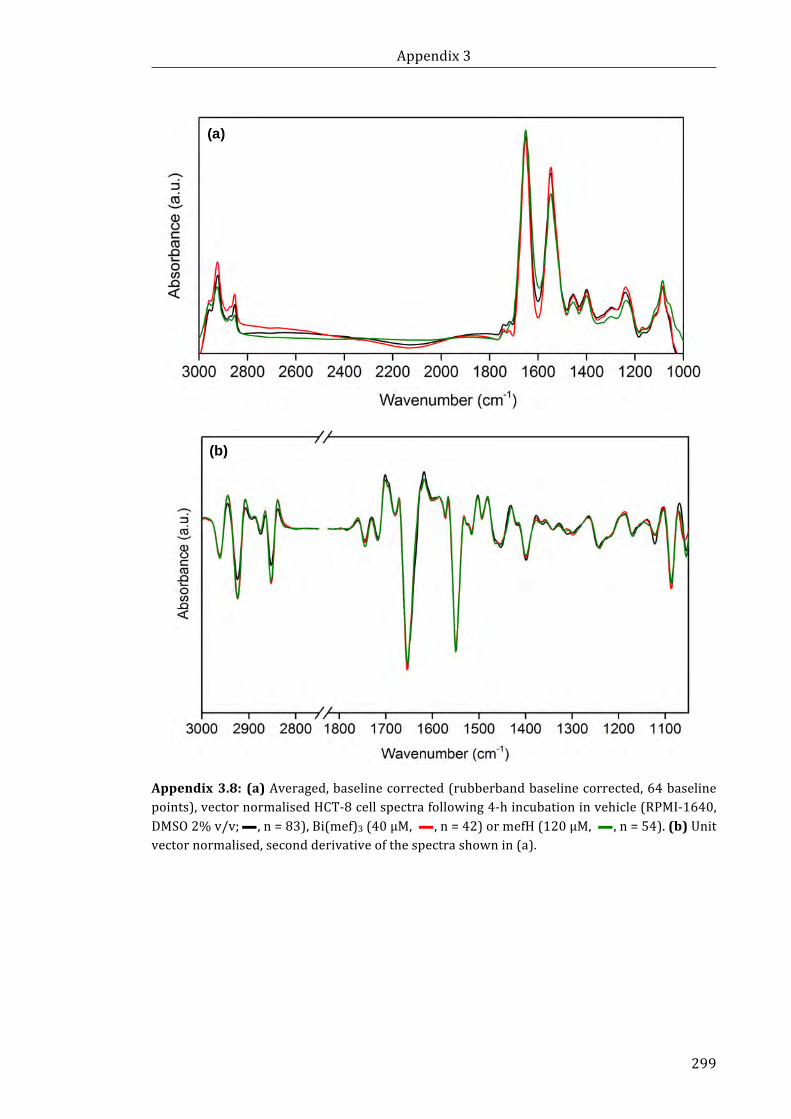
Appendix3
299
Appendix3.8:(a)Averaged,baselinecorrected(rubberbandbaselinecorrected,64baselinepoints),vectornormalisedHCT-8cellspectrafollowing4-hincubationinvehicle(RPMI-1640,DMSO2%v/v;— ,n=83),Bi(mef)3(40µM, — ,n=42)ormefH(120µM, — ,n=54).(b)Unitvectornormalised,secondderivativeofthespectrashownin(a).
(a)
(b)

Appendix3
300
Appendix3.9:(a)Averaged,baselinecorrected(rubberbandbaselinecorrected,64baselinepoints), vector normalised HCT-8 cell spectra following 24-h incubation in vehicle(RPMI-1640,DMSO2%v/v;— ,n=54),Bi(mef)3(40µM, — ,n=95)ormefH(120µM, — ,n=90).(b)Unitvectornormalised,secondderivativeofthespectrashownin(a).
(a)
(b)
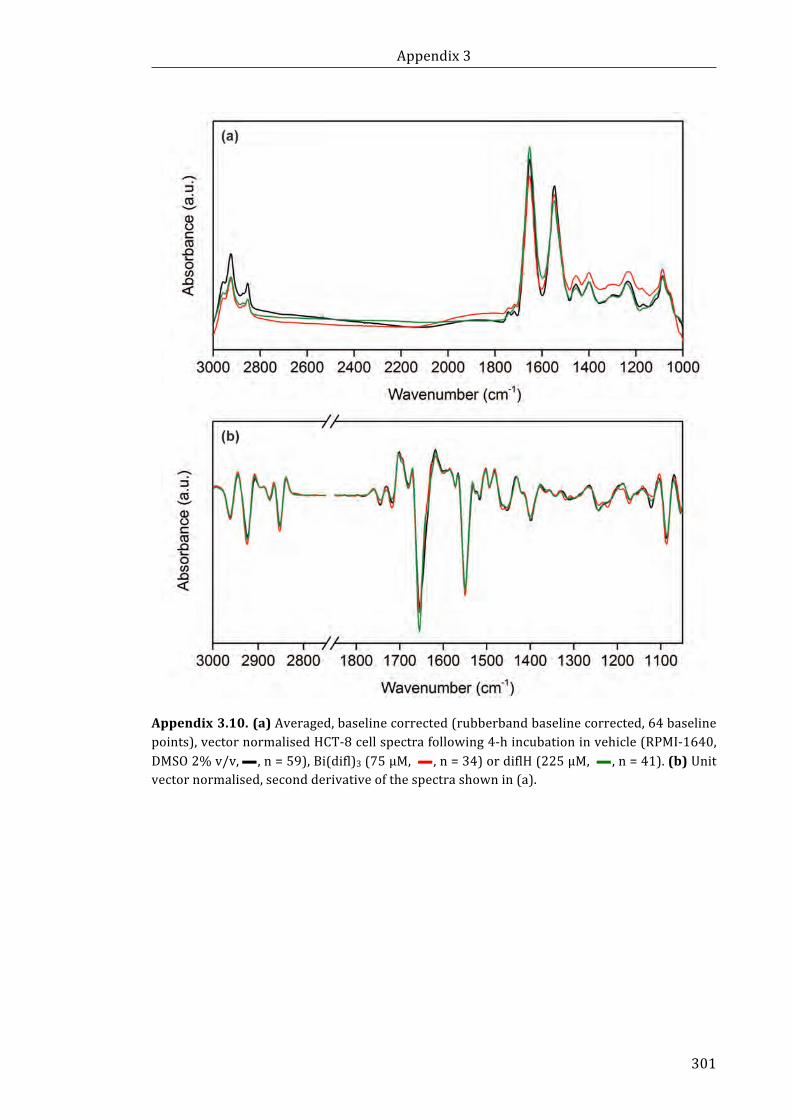
Appendix3
301
Appendix3.10.(a)Averaged,baselinecorrected(rubberbandbaselinecorrected,64baselinepoints),vectornormalisedHCT-8cellspectrafollowing4-hincubationinvehicle(RPMI-1640,DMSO2%v/v,— ,n=59),Bi(difl)3(75µM, — ,n=34)ordiflH(225µM, — ,n=41).(b)Unitvectornormalised,secondderivativeofthespectrashownin(a).
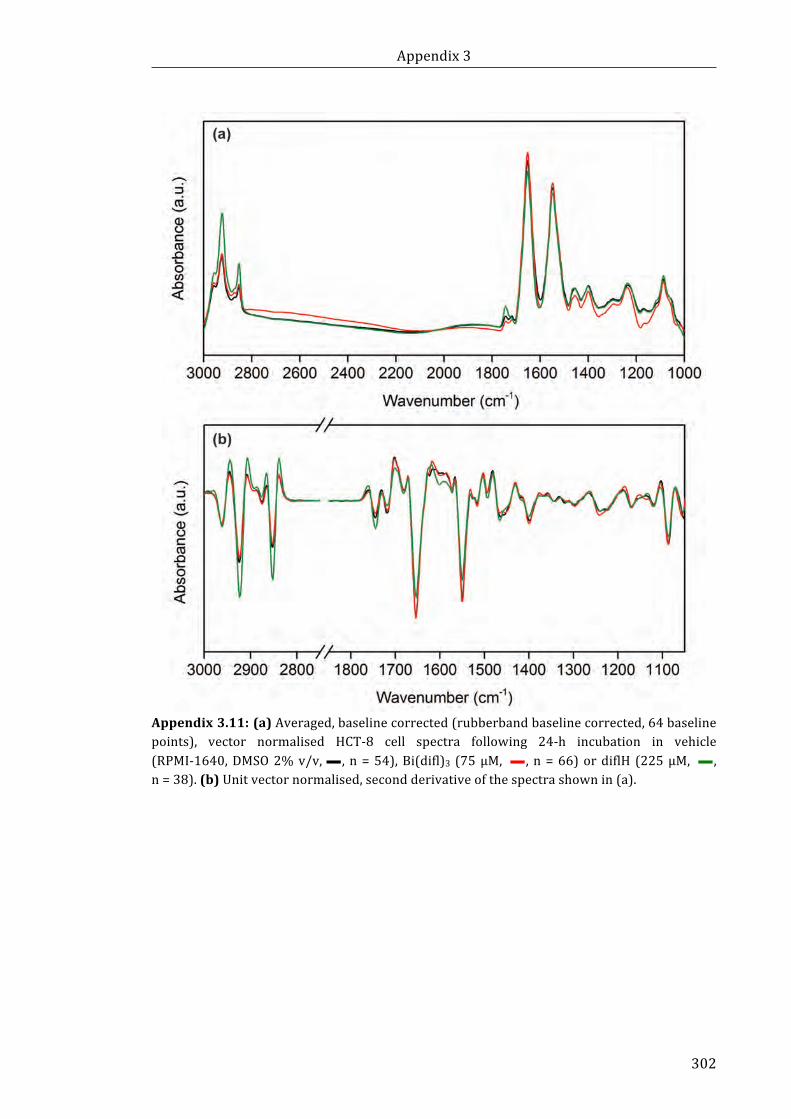
Appendix3
302
Appendix3.11:(a)Averaged,baselinecorrected(rubberbandbaselinecorrected,64baselinepoints), vector normalised HCT-8 cell spectra following 24-h incubation in vehicle(RPMI-1640,DMSO2%v/v,— , n=54),Bi(difl)3 (75µM, — , n=66)ordiflH (225µM, — ,n=38).(b)Unitvectornormalised,secondderivativeofthespectrashownin(a).
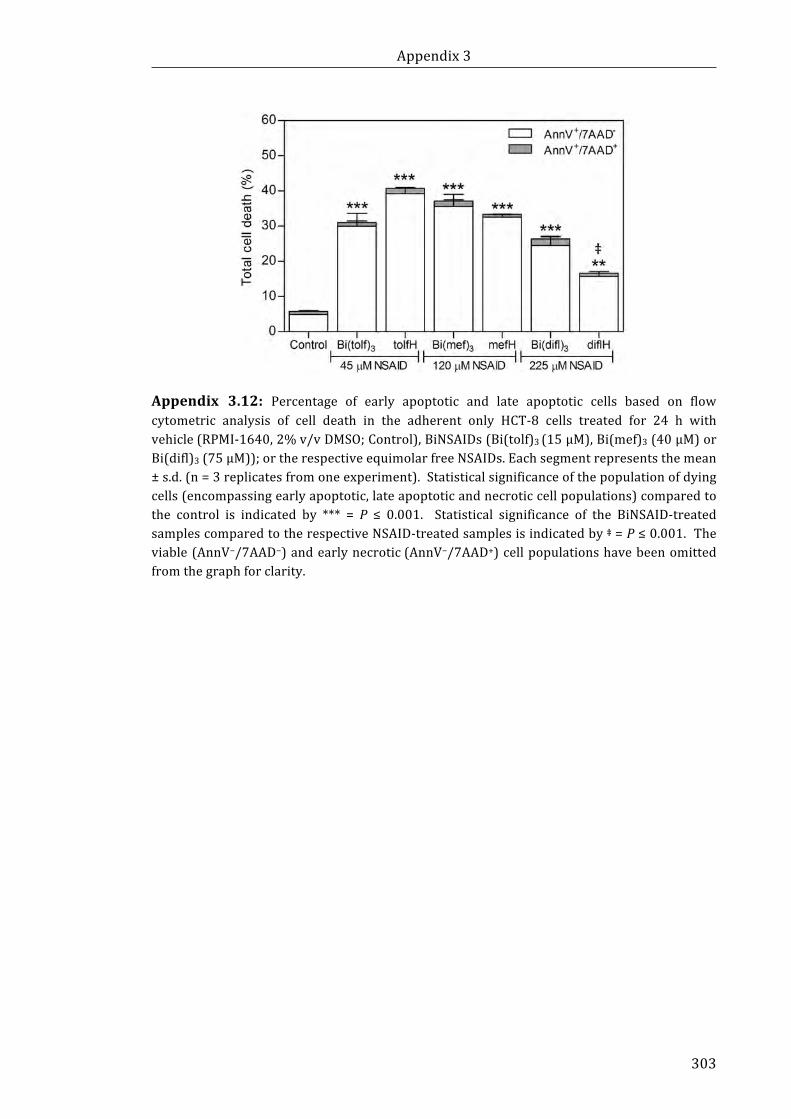
Appendix3
303
Appendix 3.12: Percentage of early apoptotic and late apoptotic cells based on flowcytometric analysis of cell death in the adherent only HCT-8 cells treated for 24 h withvehicle(RPMI-1640,2%v/vDMSO;Control),BiNSAIDs(Bi(tolf)3(15µM),Bi(mef)3(40µM)orBi(difl)3(75µM));ortherespectiveequimolarfreeNSAIDs.Eachsegmentrepresentsthemean±s.d.(n=3replicatesfromoneexperiment).Statisticalsignificanceofthepopulationofdyingcells(encompassingearlyapoptotic,lateapoptoticandnecroticcellpopulations)comparedtothe control is indicated by *** = P ≤ 0.001. Statistical significance of the BiNSAID-treatedsamplescomparedtotherespectiveNSAID-treatedsamplesisindicatedby‡=P≤0.001.Theviable(AnnV−/7AAD−)andearlynecrotic(AnnV−/7AAD+)cellpopulationshavebeenomittedfromthegraphforclarity.
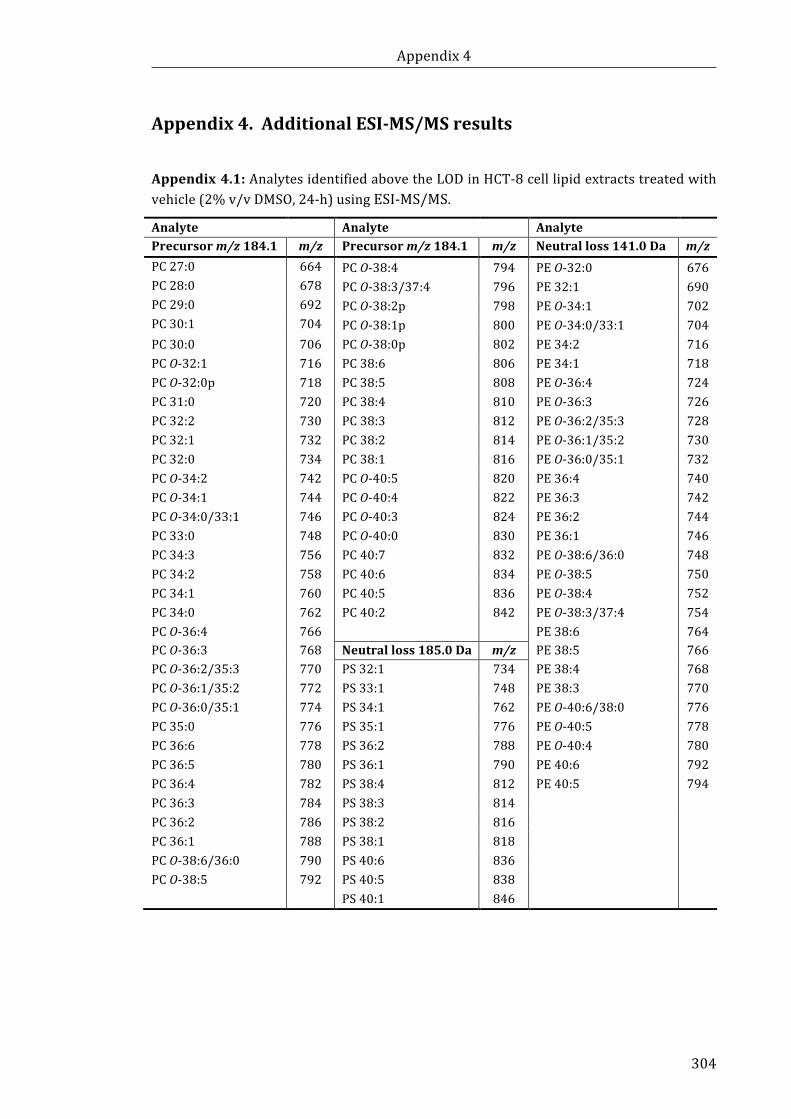
Appendix4
304
Appendix4.AdditionalESI-MS/MSresultsAppendix4.1:AnalytesidentifiedabovetheLODinHCT-8celllipidextractstreatedwithvehicle(2%v/vDMSO,24-h)usingESI-MS/MS.
Analyte Analyte Analyte Precursorm/z184.1 m/z Precursorm/z184.1 m/z Neutralloss141.0Da m/zPC27:0 664 PCO-38:4 794 PEO-32:0 676PC28:0 678 PCO-38:3/37:4 796 PE32:1 690PC29:0 692 PCO-38:2p 798 PEO-34:1 702PC30:1 704 PCO-38:1p 800 PEO-34:0/33:1 704PC30:0 706 PCO-38:0p 802 PE34:2 716PCO-32:1 716 PC38:6 806 PE34:1 718PCO-32:0p 718 PC38:5 808 PEO-36:4 724PC31:0 720 PC38:4 810 PEO-36:3 726PC32:2 730 PC38:3 812 PEO-36:2/35:3 728PC32:1 732 PC38:2 814 PEO-36:1/35:2 730PC32:0 734 PC38:1 816 PEO-36:0/35:1 732PCO-34:2 742 PCO-40:5 820 PE36:4 740PCO-34:1 744 PCO-40:4 822 PE36:3 742PCO-34:0/33:1 746 PCO-40:3 824 PE36:2 744PC33:0 748 PCO-40:0 830 PE36:1 746PC34:3 756 PC40:7 832 PEO-38:6/36:0 748PC34:2 758 PC40:6 834 PEO-38:5 750PC34:1 760 PC40:5 836 PEO-38:4 752PC34:0 762 PC40:2 842 PEO-38:3/37:4 754PCO-36:4 766 PE38:6 764PCO-36:3 768 Neutralloss185.0Da m/z PE38:5 766PCO-36:2/35:3 770 PS32:1 734 PE38:4 768PCO-36:1/35:2 772 PS33:1 748 PE38:3 770PCO-36:0/35:1 774 PS34:1 762 PEO-40:6/38:0 776PC35:0 776 PS35:1 776 PEO-40:5 778PC36:6 778 PS36:2 788 PEO-40:4 780PC36:5 780 PS36:1 790 PE40:6 792PC36:4 782 PS38:4 812 PE40:5 794PC36:3 784 PS38:3 814 PC36:2 786 PS38:2 816 PC36:1 788 PS38:1 818 PCO-38:6/36:0 790 PS40:6 836 PCO-38:5 792 PS40:5 838 PS40:1 846
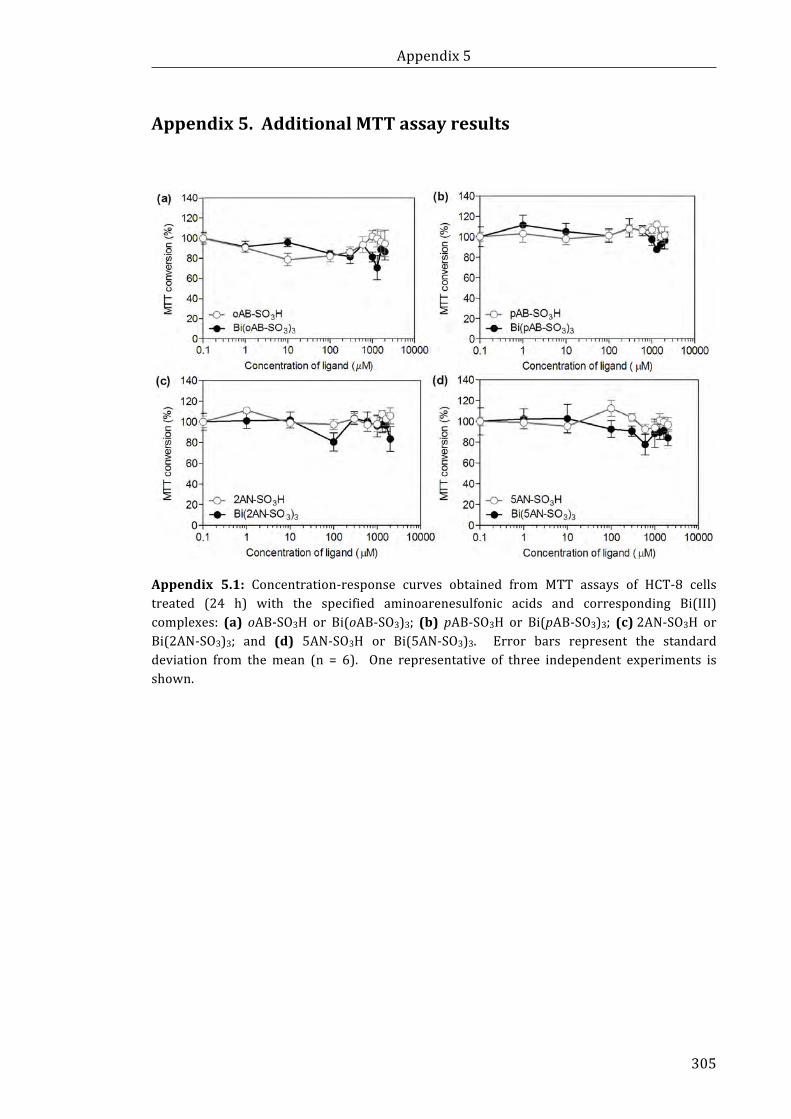
Appendix5
305
Appendix5.AdditionalMTTassayresults
Appendix 5.1: Concentration-response curves obtained from MTT assays of HCT-8 cellstreated (24 h) with the specified aminoarenesulfonic acids and corresponding Bi(III)complexes: (a) oAB-SO3H or Bi(oAB-SO3)3; (b) pAB-SO3H or Bi(pAB-SO3)3; (c)2AN-SO3H orBi(2AN-SO3)3; and (d) 5AN-SO3H or Bi(5AN-SO3)3. Error bars represent the standarddeviation from themean (n = 6). One representative of three independent experiments isshown.
Copyright © 2022 FDOKUMEN