Conservation laws and constitutive relations for density-gradient-dependent viscous fluids

Toxicology, 31 (1984)73--86 Elsevier Scientific Publishers Ireland Ltd.
IN VITRO ACTIVATION OF THE PROMUTAGENS 2-ACETAMIDOFLUO- RENE, CYCLOPHOSPHAMIDE AND 7,12-DIMETHYLBENZANTHRA- CENE BY CONSTITUTIVE FERRET AND RAT HEPATIC S-9 FRACTIONS
K.A. FREDERICK and J.G. BABISH
Department of Preventive Medicine, New York State College of Veterinary Medicine, Cornell University, Ithaca, NY 14853 (U.S.A.)
(Received July 22nd, 1983) (Accepted December 2nd, 1983)
SUMMARY
The ability of the ferret to metabolically activate promutagenic com- pounds was compared with that of the rat, using the Salmonella/microsome assay.
Three compounds which require biotransformation to mutagenic meta- bolites, 2-acetamidofluorene (2-AAF), cyclophosphamide (CPA), and 7,12- dimethylbenzanthracene (DMBA), were studied. Metabolic activation was provided by ferret or rat hepatic S-9 fractions at 5 levels for each chemical, and optimal S-9 levels as well as dose-response curves were obtained. Inter- species mutagenic activity was quanti tated on the basis of mg liver, mg S-9 protein, and nmoles P-450. The slopes of the dose-response curves and the lowest chemical dose required for a significant response were also compared.
Although constitutive levels of rat hepatic cy tochrome P-450 were shown to be higher than those of the ferret, in vitro mutagenic activation by ferret S-9, at S-9 levels which caused activation in both species, was greater than or equivalent to activation by rat S-9 for these chemicals, based on all para- meters studied. The results showed that the equilibrium between activation and detoxification reactions is dependent upon the chemical dose and S-9 level present.
Abbreviations: 2-AA, 2-aminoanthracene; 2-AAF, 2-actamidofluorene; BSA, bovine serum albumin; CPA, cyclophosphamide; DMBA, 7,1";-dimethyibenzanthracene; LSD, lowest significant dose; MFO, mixed function oxidase; NADP, nicotinamide adenine dinucleotide phosphate.
0300-483X/84/$03.00 © 1984 Elsevier Scientific Publishers Ireland Ltd. Printed and Published in Ireland 73
Key words: Ferret (Mustela furo); Biotransformation; Mutagenicity; S. typhimurium
INTRODUCTION
The majority of environmental chemical toxicants are incapable of damage to animal systems without biotransformation to reactive intermedi- ates [1]. As the mechanisms of biotransformation are capable of either increasing or decreasing the biological activity of xenobiotics, knowledge of these reaction pathways is of considerable importance in the toxicologic evaluation of chemicals. Investigations of the microsomal mixed-function oxidase (MFO) enzyme system and of non-MFO reactions such as conjuga- tion have led to documentat ion of species similarities and differences in their abilities to perform certain reactions, which have been related to variations in response to drugs and other xenobiotics [2,3].
The ferret (Mustela furo) has been proposed as a model species for toxi- cology [4]. As a carnivore, it may approximate more closely the physiologic variations of other non-rodents, such as the dog or human, than does the rat. This may result in production of similar xenobiotic metabolites, and similar therapeutic or adverse effects. As an experimental animal, its advantages include small size, ease of handling and breeding, and low cost of both acquisition and husbandry. It is metabolically capable of both oxidation [5] and conjugation reactions [6--9].
The Salmonella/microsome mutagenicity assay [10] was used to char- acterize the metabolic activation of three promutagens, 2-acetamidofluorene (2-AAF), cyclophosphamide {CPA), and 7,12<timethylbenzanthracene (DMBA). Selection of these compounds was based on reported differences in metabolic activation. The value of this test, in contrast to in vitro enzyme assays, is that this system simulates actual metabolic processes including relative rates of activation and deactivation pathways [ 11 ], and follows first- order rather than zero-order kinetics of metabolism. Both of these character- istics more closely reflect the in vitro situation than is possible with direct measurement of individual enzyme activity.
METHODS
Preparation of liver homogenates Adult male ferrets (Mustela furo) which weighed 700--1100 g were
obtained from Marshall Research Animals (North Rose, NY), where their ad libitum diet was freshly ground meat with vitamin and mineral supplements {ICN Nutritional Biochemicals, Cleveland, OH). Sprague--Dawley rats were adult males of 200---235 g, obtained from Charles River Breeding Laboratory, Wilmington, MA. They were quarantined for 5 days, during which they were housed 1 animal/cage and fed Agway RMH 2000 diet and water ad libitum.
All animals were fasted overnight prior to being killed, ferrets by CO2 inhalation and rats by cervical dislocation.
74
The basic procedure for preparation of S-9 was that of Garner et al. [12]. Immediately after each animal was killed, its liver was perfused with approxi- mately 10 ml of cold 0.15 M KC1, removed from the abdomen, and weighed. The livers were then placed in Petri plates on ice, minced with scalpels, and homogenized using a Potter-Elvehjem homogenizer with a Teflon pestle. Equipment contacting the tissue had been previously sterilized.
Ferret livers weighed 33--40 g, rat livers 6--10 g. During homogenization 3 ml of cold 0.15 M KC1 was added per gram of tissue, resulting in a 25% suspension. This homogenate was transferred to 50-ml centrifuge tubes and centrifuged (Beckman Model J2-21) at 9000 g for 20 min. The supernatant (S-9) fraction was then strained through sterile glass wool, and 5-ml aliquots were transferred to sterile plastic cryotubes, frozen quickly in a dry ice/ ethanol bath, and stored at -80°C. The same batches of ferret and rat S-9 were used throughout this series of experiments; 6 animals were used to prepare each batch. At the time an assay was performed, the S-9 was thawed and used to prepare S-9 mix according to the procedure of Ames et al. [10]. The level of S-9 in each mix was varied by increasing log amounts to deter- mine the optimum concentration. The 5 levels ranged from 10 to 200 ~l of the respective S-9 fraction/ml mix.
Protein concentration was determined by the method of Sutherland et al. [13]. In order to quantitate P-450 in the presence of hemoglobin, the method of Schoene et al. [14] was used: carbon monoxide (CO) was bubbled through duplicate 1 :10 dilutions of ferret and rat S-9 fractions in 50 mM Tris-glycerol buffer (pH 7.4}, for 5 min; sodium dithionate was then added to the sample cuvette to reduce the cytochrome P-450 and allow binding with CO. Spectra were produced using the Aminco DW-2 UV/VIS spectrophotometer, and P-450 was calculated using the molar extinction coefficient 91 mM -1 cm -~ for the reduced P-450-CO complex [14].
Mutagenicity assay Salmonella typhimurium strain TA 100 [10] was chosen for those studies
because it is sensitive to numerous mutagens. This strain was obtained from Dr. B.N. Ames (Biochemistry Dept., University of California, Berkeley), and stored as a permanent culture at - 80°C in nutrient broth with dimethyl- sulfoxide (DMSO). From this permanent culture, a master plate was pre- pared and stored at 4°C, for use as the inoculation source for cultures incubated overnight prior to each assay. The overnight cultures were grown in Oxoid nutrient broth No. 2 (Oxoid Ltd., Basingstoke, Hants., England) at 37°C for 16 h with agitation in a water bath shaker, after which they contained 1--2 X 10⁹ viable cells/ml. For each assay, crystal violet sensitivity and ampicillin resistance were confirmed, in addition to'positive mutagenic responses to sodium azide and 2-aminoanthracene. The mean spontaneous reversion rates were 157 and 175 revertants/plate, without and with S-9, respectively, for all experiments in this study.
Our assays were based on plate incorporation techniques described by Ames et al. [10] and modified by Batzinger et al. [15]. These modifications
75
included the addition of histidine (6.6 ug/ml) and biotin (1.1 ~g/ml) to the {15 ml) bottom agar rather than to the (2 ml) top soft agar layer. Addi- tionally, Vogel-Bonner medium [ 16] replaced 0.5% sodium chloride solution in the top agar. These modifications have been reported to reduce the day- to-day variability in microorganism response [15].
Each compound was tested with rat and ferret S-9 on the same day. The test mutagen, at a pre-determined concentration in 100 ~l DMSO, was pipetted into a sterile disposable culture tube followed by 2.0 ml of molten top agar, 100 ~l of the overnight culture of bacterial tester strain, and 500 pl of the appropriate species and concentration of S-9 mix. After rapid agita- tion, the mixture was poured onto a Vogel-Bonner minimal glucose plate. Duplicate determinations were made at each of 10 geometrically spaced dose levels for each compound. Mutagen dilution, dosing, and plating were per- formed in a laminar flow biological hood {Labgard; NuAire, Inc., Minne- apolis, MN) using suitable precautions including protective gloves and automatic pipettors.
All plates were incubated for 72 h at 37°C. Revertant colonies were counted using the NBS Biotran II (New Brunswick Scientific Co., Edison, NJ).
Statistical methods The dose-response calculations for activation of the promutagens included
in this paper were based on a minimum of 5 geometrically spaced doses selected from the linear portion of the dose-response curve for each chemical at its optimum level of S-9. After subtraction of spontaneous control values, regression analysis was performed on the square root of the number of revertant colonies versus log doses of the chemical. The square root trans- formation of the data was used to stabilize the variance, due to the tendency of enumeration data such as bacterial counts to fall into a Poisson distribu- tion [ 17,18]. The parameters of potency (revertants/~g chemical, revertants/ mg S-9 protein, revertants/nmole cytochrome P-450, and revertants/nmole chemical/nmole P-450), slope (A revertants/A log dose), and lowest signifi- cant dose {LSD) were computed from the results of the regression analysis. The 95% confidence intervals were calculated for potency parameters.
The LSD for each experiment was determined from the intersection point of the lower limit of its 95% confidence interval with the x-axis on the plot of the square root of excess revertants/plate vs. log ~g of promutagen. This value represents the smallest amount of the chemical able to produce a statistically significant (P < 0.05) increase in revertants in this test. The more commonly reported measure of potency (revertants/nmole) is confounded by the toxicity of test compounds to the bacterial strains. Since the LSD reflects extremely low doses of test materials, it is less affected by the inherent toxicity of the chemical to the test system, and can be used to estimate the relative potency of compounds and metabolic activation at these low levels. In our laboratory, LSD as an expression of potency is more consistent across experiments than is the slope. The validity of this para-
76
meter has been established previously in our laboratory for the mutagenicity of benzo[a]pyrene, which corresponds to the findings of McCann et al. [ 19].
All statistical procedures were performed as described by Snedecor and Cochran [20] on a Hewlett-Packard 85 desktop computer . The probabili ty of rejecting the null hypothesis when true was set at the nominal 5% level.
Chemicals All promutagens used were the highest available grade. Chemical com-
pounds were obtained from the following suppliers. Potassium phosphate dibasic, anhydrous, (K2HPO4), D-glucose, Folin-Ciocalteu phenol reagent, sodium dithionite {Na2S204), dimethylsulfoxide, labgrade, (DMSO), sodium azide (NAN3), and Tris (hydroxymethyl} aminomethane from Fisher Scientific Company, Fairlawn, NJ; magnesium sulfate {MgSO4 • 7H20), citric acid {H3C6HsO~ • H20), sodium phosphate dibasic, anhydrous, (Na2HPO4), annomium phosphate dibasic ({NH4)2HPO4), sodium phosphate monobasic (NaH~ PO4 • H20), magnesium chloride (MgC12 • 6H~O), potassium chloride (KC1), cupric sulfate {CuSO4 • 5H20), sodium tartrate, sodium carbonate, anhydrous, (Na~CO3), hydrochloric acid (HC1), sulfuric acid {H2SO4}, and glycerol (C3Hs(OH)3) from Mallinckrodt, Inc., St. Louis, MO; {+)-biotin, D-glucose-6-phosphate, monosodium salt, anhydrous, (G-6-PO4), B-nicotin- amide adenine dinucleotide phosphate, monosodium salt, anhydrous, (NADP), 2-acetamidofluorene {2-AAF), c~clophosphamide (CPA), and 7,12~limethylbenzanthracene (DMBA) from Sigma Chemical Company, St. Louis, MO; 2-aminoanthracene (2-AA), from Aldrich Chemical Company, Inc., Milwaukee, WI; L-histidine monochloride monohydrate and bovine serum albumin {BSA) from Mann Research Laboratories, Inc., Subsidiary of Becton-Dickinson, Inc., New York; and formic acid (HCOOH) from J.T. Baker Chemical Co., Phillipsburg, NJ.
RESULTS
Using constitutive rat and ferret hepatic S-9 fractions in the Salmonella/ microsome assay [10], the mutagenicity of 2-AAF, CPA, and DMBA was determined. The revertant colonies produced per nmole of test compound were quanti tated per mg wet weight of liver, per mg S-9 protein, and per nmole of cy tochrome P-450. The slope of the dose-response curve at each level of S-9 and the lowest aose of test material producing a significant elevation in revertant colonies {LSD) were also used for comparison between species.
Table I depicts the revertant colonies produced/nmole of test compound. For the ferret, the response to all 3 chemicals increased with increasing amount of S-9 level tested, 25 mg wet liver weight. Mutagenic activation of 2-AAF was not seen with less than 5.6 mg of rat liver or with less than 11.8 mg of ferret liver; however, each log increase of S-9 resulted in a 2--4-fold increase in mutagenicity of 2-AAF for both animals. Although rat
77
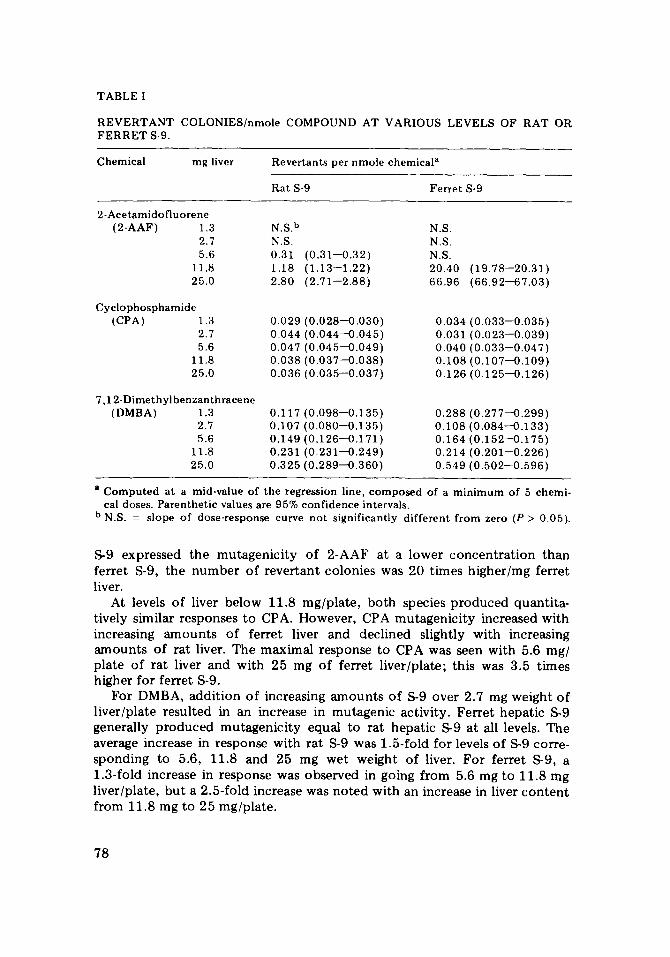
TABLE I
R E V E R T A N T COLONIES/nmole COMPOUND AT VARIOUS LEVELS OF RAT OR F E R R E T S-9.
Chemical mg liver Revertants per nmole chemical a
Rat S-9 Ferre t S-9
2-Acetamidof luorene (2-AAF) 1.3 N.S. b
2.7 N.S. 5.6 0.31
11.8 1.18 25.0 2.80
Cyclophosphamide (CPA) 1.3 0.029
2.7 0.044 5.6 0.047
11.8 0.038 25.0 0.036
(0.31--0.32) (1.13--1.22) 2 .71--2.88)
0 . 0 2 8 - 0 . 0 3 0 ) 0 .044--0 .045)
' 0 . 0 4 5 - 0 . 0 4 9 ) ' 0 . 0 3 7 - 0 . 0 3 8 ) ' 0 . 0 3 5 - 0 . 0 3 7 )
7 ,12-Dimethylbenzanthracenc (DMBA) 1.3 0.117 (0 .098--0 .135)
2.7 0.107 (0 .080--0.135) 5.6 0.149 (0 .126--0 .171)
11.8 0.231 (0 .231--0 .249) 25.0 0.325 ( 0 . 2 8 9 - 0 . 3 6 0 )
N°S. N.S. N.S. 20.40 (19.78--20.31) 66.96 (66.92--67.03)
0.034 (0 .033--0 .035) 0.031 (0 .023--0.039) 0.040 (0 .033--0.047) 0.108 (0 .107--0 .109) 0.126 (0 .125--0.126)
0.288 (0 .277--0.299) 0.108 (0 .084--0 .133) 0.164 (0 .152--0 .175) 0.214 (0 .201--0.226) 0.549 (0 .502--0 .596)
a Computed at a mid-value of the regression line, composed of a min imum of 5 chemi- cal doses. Parenthet ic values are 95% conf idence intervals.
b N.S. = slope of dose-response curve not significantly different f rom zero (P > 0.05).
S-9 expressed the mutagenicity of 2-AAF at a lower concentrat ion than ferret S-9, the number of revertant colonies was 20 times higher/mg ferret liver.
At levels of liver below 11.8 mg/plate, both species produced quantita- tively similar responses to CPA. However, CPA rautagenicity increased with increasing amounts of ferret liver and declined slightly with increasing amounts of rat liver. The maximal response to CPA was seen with 5.6 mg/ plate of rat liver and with 25 mg of ferret liver/plate; this was 3.5 times higher for ferret S-9.
For DMBA, addition of increasing amounts of S-9 over 2.7 mg weight of liver/plate resulted in an increase in mutagenic activity. Ferret hepatic S-9 generally produced mutagenicity equal to rat hepatic S-9 at all levels. The average increase in response with rat S-9 was 1.5-fold for levels of S-9 corre- sponding to 5.6, 11.8 and 25 mg wet weight of liver. For ferret S-9, a 1.3-fold increase in response was observed in going from 5.6 mg to 11.8 rag liver/plate, but a 2.5-fold increase was noted with an increase in liver content from 11.8 mg to 25 mg/plate.
78

Specific activities of hepatic S-9 fractions were calculated for both species based on production of revertants/nmole test compound/mg protein; apparent turnover numbers for cytochrome P-450 were also computed and expressed as revertants/nmole test compound/nmole P-450. These results are presented in Table II. In both the rat and ferret, the specific activity for 2-AAF activation increased with increasing amounts of S-9 protein. Signifi- cant mutagenic responses occurred at lower levels of rat S-9 protein than ferret S-9 protein with 2-AAF, but specific activities for ferret S-9 were 20--30-fold greater than rat S-9. A comparison of apparent turnover numbers for 2-AAF mutagenicity shows that ferret S~9 was 45--65 times more active than rat S-9. The apparent turnover numbers for 2-AAF muta- genicity did not change at the 2 highest levels with rat S-9, while there was a 58% increase in apparent turnover number with ferret S-9 between the same 2 levels. These trends are generally similar to those observed with activity expressed as revertants/nmole 2-AAF.
TABLE II
SPECIFIC ACTIVITIES AND A P P A R E N T CYTOCHROME NUMBERS F O R RAT AND F E R R E T HEPATIC S-9 FRACTIONS
P-450 T U R N O V E R
Chemical mg liver Specific activity a A p p a r e n t t u r n o v e r
n u m b e r b
Rat Fer re t Rat Fer re t
2 -Ace tamidof luorene ( 2 - A A F ) 1 .3 - - - -
2 . 7 - - . - -
5.6 0.055 - - 11.8 0.100 2.1 25.0 0.112 3.3
C yc lophosphamide (CPA) 1.3 0.023 0.034
2.7 0.017 0.016 5.6 0.008 0.009
11.8 0.003 0.010 25.0 0.001 0.006
7 ,12-Dimethy lbenzan th racene (DMBA) 1.3 0.094 0.288
2.7 0.040 0.054 5.6 0.027 0.037
11.8 0.020 0.023 25.0 0.013 0.027
16 29 1329 33 2101
7 21 5 9 2 6 0.9 7 0.4 4
27 181 12 32
8 23 6 14 4 17
a Reve r t an t s /nmole /mg S-9 p ro te in ; rat S-9 con ta ined ta ined 20 mg pro te in /ml .
b R e v e r t a n t s / n m o l e / n m o l e P-450; rat and ferret S-9s c y t o c h r o m e P-450/ul S-9, respectively.
25 mg pro te in /ml , ferret S-9 con-
conta ined 0.85 and 0.32 pmole
79
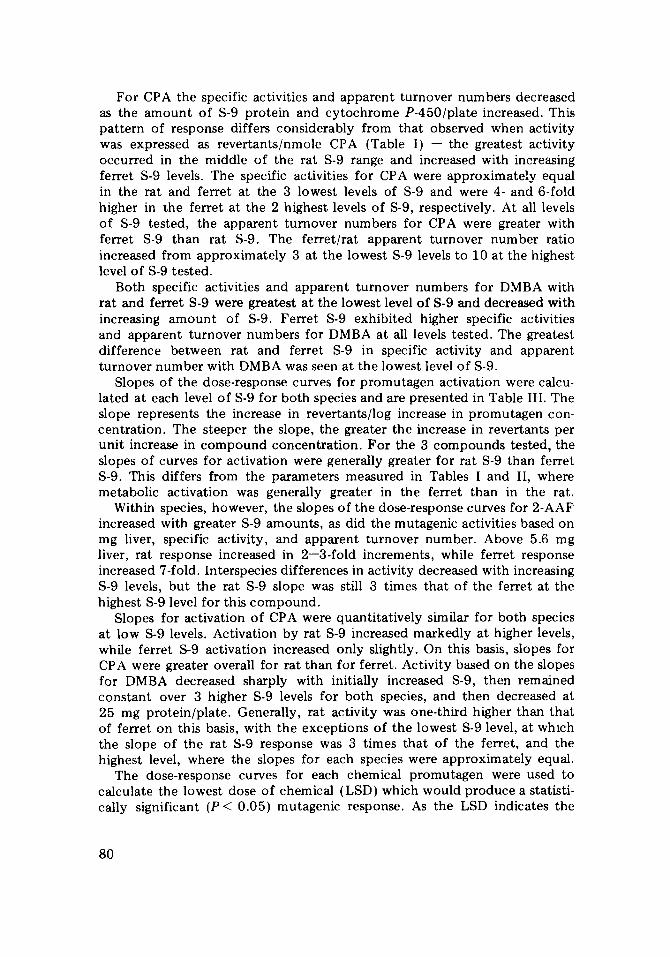
For CPA the specific activities and apparent turnover numbers decreased as the amount of S-9 protein and cytochrome P-450/plate increased. This pattern of response differs considerably from that observed when activity was expressed as revertants/nmole CPA (Table I) - - t h e greatest activity occurred in the middle of the rat S-9 range and increased with increasing ferret S-9 levels. The specific activities for CPA were approximately equal in the rat and ferret at the 3 lowest levels of S-9 and were 4- and 6-fold higher in the ferret at the 2 highest levels of S-9, respectively. At all levels of S-9 tested, the apparent turnover numbers for CPA were greater with ferret S-9 than rat S-9. The ferret/rat apparent turnover number ratio increased from approximately 3 at the lowest S-9 levels to 10 at the highest level of S-9 tested.
Both specific activities and apparent turnover numbers for DMBA with rat and ferret S-9 were greatest at the lowest level of S-9 and decreased with increasing amount of S-9. Ferret S-9 exhibited higher specific activities and apparent turnover numbers for DMBA at all levels tested. The greatest difference between rat and ferret S-9 in specific activity and apparent turnover number with DMBA was seen at the lowest level of S-9.
Slopes of the dose-response curves for promutagen activation were calcu- lated at each level of S-9 for both species and are presented in Table III. The slope represents the increase in revertants/log increase in promutagen con- centration. The steeper the slope, the greater the increase in revertants per unit increase in compound concentration. For the 3 compounds tested, the slopes of curves for activation were generally greater for rat S-9 than ferret S-9. This differs from the parameters measured in Tables I and II, where metabolic activation was generally greater in the ferret than in the rat.
Within species, however, the slopes of the dose-response curves for 2-AAF increased with greater S-9 amounts, as did the mutagenic activities based on mg liver, specific activity, and apparent turnover number. Above 5.6 mg liver, rat response increased in 2--3-fold increments, while ferret response increased 7-fold. Interspecies differences in activity decreased with increasing S-9 levels, but the rat S-9 slope was still 3 times that of the ferret at the highest S-9 level for this compound.
Slopes for activation of CPA were quantitatively similar for both species at low S-9 levels. Activation by rat S-9 increased markedly at higher levels, while ferret S-9 activation increased only slightly. On this basis, slopes for CPA were greater overall for rat than for ferret. Activity based on the slopes for DMBA decreased sharply with initially increased S-9, then remained constant over 3 higher S-9 levels for both species, and then decreased at 25 mg protein/plate. Generally, rat activity was one-third higher than that of ferret on this basis, with the exceptions of the lowest S-9 level, at which the slope of the rat S-9 response was 3 times that of the ferret, and the highest level, where the slopes for each species were approximately equal.
The dose-response curves for each chemical promutagen were used to calculate the lowest dose of chemical (LSD) which would produce a statisti- cally significant (P< 0.05) mutagenic response. As the LSD indicates the
80

TABLE III
SLOPES OF DOSE-RESPONSE CURVES FOR 2-ACETAMIDOFLUORENE, CYCLO- PHOSPHAMIDE, AND 7,12-DIMETHYLBENZANTHRACENE FOR VARIOUS LEVELS OF RAT AND FERRET HEPATIC S-9 FRACTIONS.
Chemical mg liver Slope a
Rat S-9 Ferret S-9
2-Acetamidofluorene (2-AAF) 1.3 N.S. b
2.7 N.S. 5.6 71.15 (70.24--72.06)
11.8 224.18 (218.66--229.70) 25.0 402.52 (393.64--411.40)
Cyclophosphamide (CPA) 1.3 61.73 (61.62--61.83)
2.7 50.23 (49.89--50.56) 5.6 74.18 (69.62--78.73)
11.8 87.45 (86.79--88.11) 25.0 77.34 (75.11--79.56)
7,12-Dimethylbenzanthracene (DMBA) 1.3 1144.70 (1103.14--1186.26)
2.7 302.13 (254.18--350.07) 5.6 361.46 (321.92--401.00)
11.8 386.08 (373.79--398.37) 25.0 50.18 (45.02--55.35)
S.S. N.S. N.S.
21.17 (20.48--21.86) 144.46 (144.29--144.64)
43.82 (43.18--44.45) 52.68 (43.89--61.46) 15.89 (11.59--20.19) 48.44 (47.86--49.02) 61.69 (61.38--62.00)
340.74 (331.64--349.85) 204.42 (161.77--247.07) 264.08 (244.02--284.14) 268.67 (247.11--290.22)
64.17 (57.43--70.91)
a Units are ~ revertants/A log dose; parenthetic values are 95% confidence intervals. b N.S. = slope not significantly different from zero (P > 0.05).
lowest level at which a genotoxic event would be expected, it provides an assessment o f the sensitivity of the system.
As the amount of S-9 was increased, the LSD for 2-AAF decreased for rat hepatic S-9, but was much lower and remained stable for ferret S-9. Comparatively, ferret liver S-9 appears to be approximately 100 times as po ten t as activator of 2-AAF as rat S-9. This is consistent with the data presented in Tables I--III.
Similarly, much smaller amounts of CPA were necessary to produce a significant mutagenic response using ferret S-9 than when rat S-9 was used. This greater po tency of ferret S-9 was especially obvious at higher S-9 levels. Also, at levels over 5.6 mg protein, the LSD for ferret S-9 reached a minimum of approximately 16 pg, and did not vary with increased S-9. As rat S-9 increased, so did the LSD for this compound, therefore its po tency decreased, in agreement with parameters based on mg protein, specific activity, and apparent turnover number.
For DMBA, the LSDs decreased within each species as S-9 increased. Incremental changes ranged from 2-fold at 5.6 mg protein to a 7-fold
81
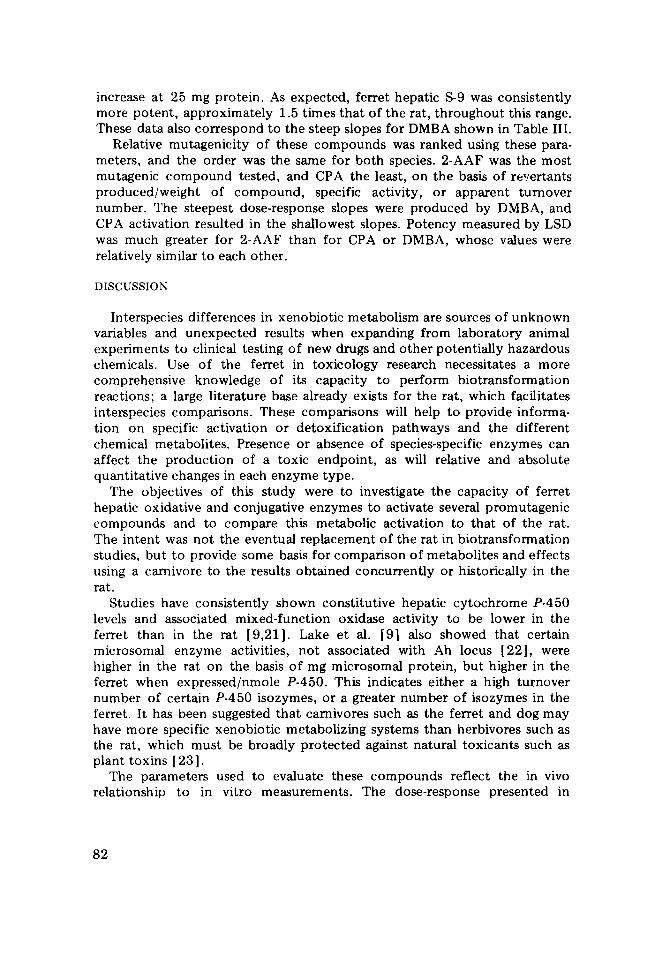
increase at 25 mg protein. As expected, ferret hepatic S-9 was consistently more potent, approximately 1.5 times that of the rat, throughout this range. These data also correspond to the steep slopes for DMBA shown in Table III.
Relative mutagenicity of these compounds was ranked using these para- meters, and the order was the same for both species. 2-AAF was the most mutagenic compound tested, and CPA the least, on the basis of re~.,ertants produced/weight of compound, specific activity, or apparent turnover number. The steepest dose-response slopes were produced by DMBA, and CPA activation resulted in the shallowest slopes. Potency measured by LSD was much greater for 2-AAF than for CPA or DMBA, whose values were relatively similar to each other.
DISCUSSION
Interspecies differences in xenobiotic metabolism are sources of unknown variables and unexpected results when expanding from laboratory animal experiments to clinical testing of new drugs and other potentially hazardous chemicals. Use of the ferret in toxicology research necessitates a more comprehensive knowledge of its capacity to perform biotransformation reactions; a large literature base already exists for the rat, which facilitates interspecies comparisons. These comparisons will help to provide informa- tion on specific activation or detoxification pathways and the different chemical metabolites. Presence or absence of species-specific enzymes can affect the production of a toxic endpoint, as will relative and absolute quantitative changes in each enzyme type.
The objectives of this study were to investigate the capacity of ferret hepatic oxidative and conjugative enzymes to activate several promutagenic compounds and to compare this metabolic activation to that of the rat. The intent was not the eventual replacement of the rat in biotransformation studies, but to provide some basis for comparison of metabolites and effects using a carnivore to the results obtained concurrently or historically in the rat.
Studies have consistently shown constitutive hepatic cytochrome P-450 levels and associated mixed-function oxidase activity to be lower in the ferret than in the rat [9,21]. Lake et al. [9] also showed that certain microsomal enzyme activities, not associated with Ah locus [22], were higher in the rat on the basis of mg microsomal protein, but higher in the ferret when expressed/nmole P-450. This indicates either a high turnover number of certain P-450 isozymes, or a greater number of isozymes in the ferret. It has been suggested that carnivores such as the ferret and dog may have more specific xenobiotic metabolizing systems than herbivores such as the rat, which must be broadly protected against natural toxicants such as plant toxins [ 23 ].
The parameters used to evaluate these compounds reflect the in vivo relationship to in vitro measurements. The dose-response presented in
82
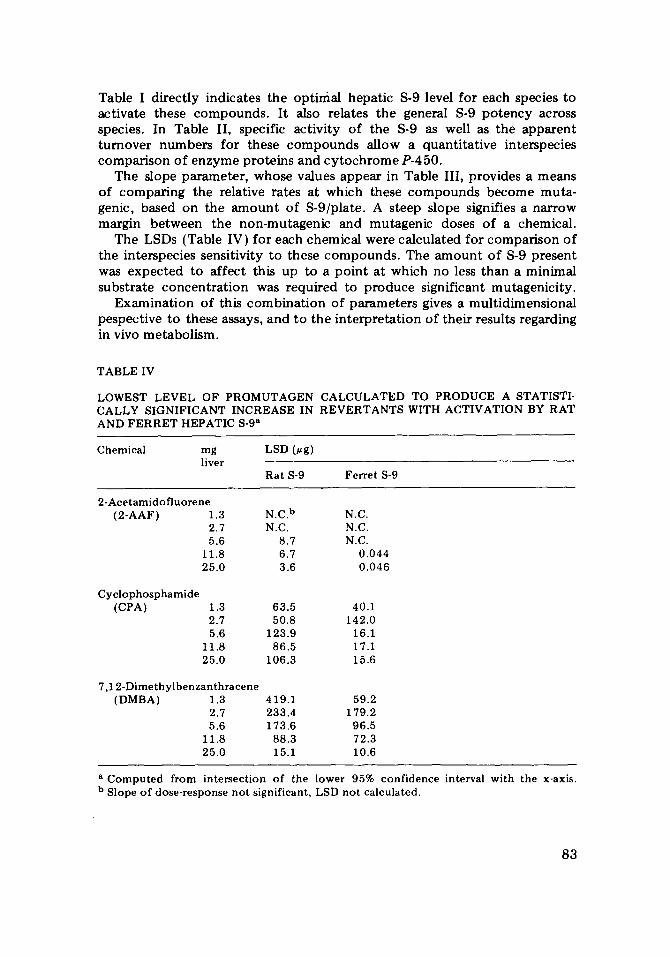
Table I d i rec t ly indicates the opt in ia l hepa t ic S-9 level fo r each species to ac t iva te these c o m p o u n d s . I t also relates the general S-9 p o t e n c y across species. In Tab le II , specific ac t iv i ty o f the S-9 as well as the a p p a r e n t t u r n o v e r n u m b e r s fo r these c o m p o u n d s a l low a quan t i t a t ive in terspecies c o m p a r i s o n o f e n z y m e p ro te ins and c y t o c h r o m e P-450.
The s lope p a r a m e t e r , whose values a p p e a r in Table III , p rovides a means of c o m p a r i n g the relat ive ra tes at which these c o m p o u n d s b e c o m e mu ta - genic, based on the a m o u n t o f S-9/pla te . A s teep s lope signifies a na r row marg in b e t w e e n the non -mutagen ic and mutagen ic doses o f a chemical .
The LSDs (Table IV) fo r each chemica l were ca lcu la ted fo r c o m p a r i s o n o f the in terspecies sensi t ivi ty to these c o m p o u n d s . The a m o u n t o f S-9 p resen t was e x p e c t e d to a f fec t this up to a p o i n t a t which no less t h a n a min ima l subs t ra te c o n c e n t r a t i o n was requi red to p r o d u c e s ignif icant mutagen ic i ty .
E x a m i n a t i o n o f this c o m b i n a t i o n o f p a r a m e t e r s gives a mu l t i d imens iona l pespec t ive to these assays, and to the i n t e r p r e t a t i o n o f the i r results regarding in vivo m e t a b o l i s m .
TABLE IV
LOWEST LEVEL OF PROMUTAGEN CALCULATED TO PRODUCE A STATISTI- CALLY SIGNIFICANT INCREASE IN REVERTANTS WITH ACTIVATION BY RAT AND FERRET HEPATIC 8-9 a
Chemical mg LSD (~g) liver
Rat S-9 Ferret S-9
2-Acetamido fluorene (2-AAF) 1.3 N.C. b N.C.
2.7 N.C. N.C. 5.6 8.7 N.C.
11.8 6.7 0.044 25.0 3.6 0.046
Cyclophosphamide (CPA) 1.3 63.5 40.1
2.7 50.8 142.0 5.6 123.9 16.1
11.8 86.5 17.1 25.0 106.3 15.6
7,12-Dimethylbenzanthracene (DMBA) 1.3 419.1 59.2
2.7 233.4 179.2 5.6 173.6 96.5
11.8 88.3 72.3 25.0 15.1 10.6
a Computed from intersection of the lower 95% confidence interval with the x-axis. b Slope of dose-response not significant, LSD not calculated.
83
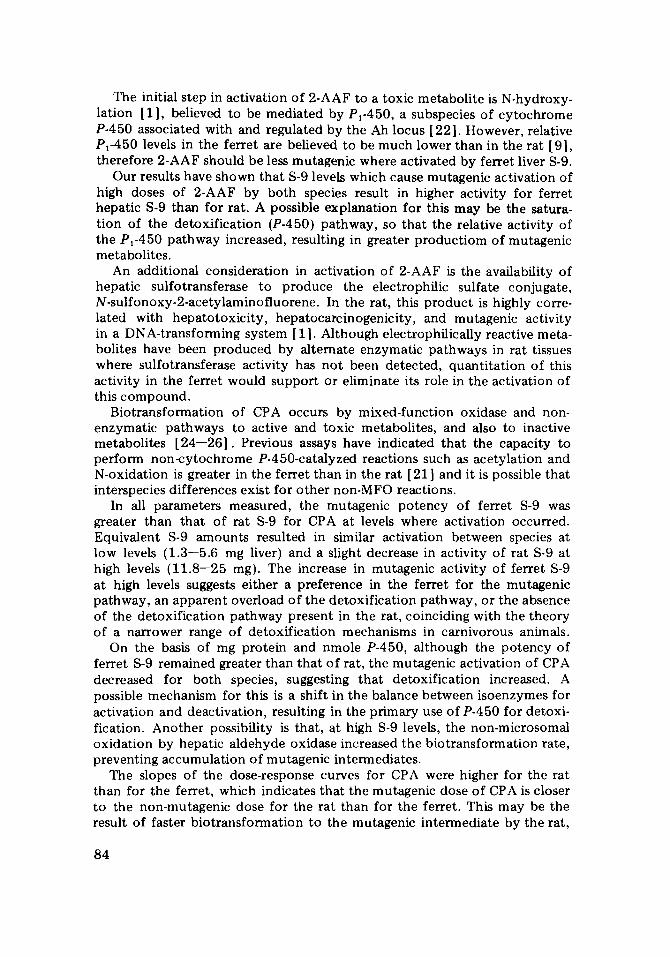
The initial step in activation of 2-AAF to a toxic metabolite is N-hydroxy- lation [1], believed to be mediated by P1-450, a subspecies of cytochrome P-450 associated with and regulated by the Ah locus [22]. However, relative PI-450 levels in the ferret are believed to be much lower than in the rat [9], therefore 2-AAF should be less mutagenic where activated by ferret liver S-9.
Our results have shown that S-9 levels which cause mutagenic activation of high doses of 2-AAF by both species result in higher activity for ferret hepatic S-9 than for rat. A possible explanation for this may be the satura- tion of the detoxification (P-450) pathway, so that the relative activity of the P,-450 pathway increased, resulting in greater productiom of mutagenic metabolites.
An additional consideration in activation of 2-AAF is the availability of hepatic sulfotransferase to produce the electrophilic sulfate conjugate, N-sulfonoxy-2-acetylaminofluorene. In the rat, this product is highly corre- lated with hepatotoxicity, hepatocarcinogenicity, and mutagenic activity in a DNA-transforming system [ 1]. Although electrophilically reactive meta- bolites have been produced by alternate enzymatic pathways in rat tissues where sulfotransferase activity has not been detected, quantitation of this activity in the ferret would support or eliminate its role in the activation of this compound.
Biotransformation of CPA occurs by mixed-function oxidase and non- enzymatic pathways to active and toxic metabolites, and also to inactive metabolites [24--26]. Previous assays have indicated that the capacity to perform non-cytochrome P-450-catalyzed reactions such as acetylation and N-oxidation is greater in the ferret than in the rat [21] and it is possible that interspecies differences exist for other non-MFO reactions.
In all parameters measured, the mutagenic potency of ferret S-9 was greater than that of rat S-9 for CPA at levels where activation occurred. Equivalent S-9 amounts resulted in similar activation between species at low levels (1.3--5.6 mg liver) and a slight decrease in activity of rat S-9 at high levels {11.8--25 mg). The increase in mutagenic activity of ferret S-9 at high levels suggests either a preference in the ferret for the mutagenic pathway, an apparent overload of the detoxification pathway, or the absence of the detoxification pathway present in the rat, coinciding with the theory of a narrower range of detoxification mechanisms in carnivorous animals.
On the basis of mg protein and nmole P-450, although the potency of ferret S-9 remained greater than that of rat, the mutagenic activation of CPA decreased for both species, suggesting that detoxification increased. A possible mechanism for this is a shift in the balance between isoenzymes for activation and deactivation, resulting in the primary use of P-450 for detoxi- fication. Another possibility is that, at high S-9 levels, the non-microsomal oxidation by hepatic aldehyde oxidase increased the biotransformation rate, preventing accumulation of mutagenic intermediates.
The slopes of the dose-response curves for CPA were higher for the rat than for the ferret, which indicates that the mutagenic dose of CPA is closer to the non-mutagenic dose for the rat than for the ferret. This may be the result of faster biotransformation to the mutagenic intermediate by the rat,
84
or more rapid detoxification by the ferret. Slopes for both species increased with S-9 levels, as expected. As shown in Table IV, the LSD demonstrates the greater sensitivity of the ferret to CPA. The minimum quanti ty of CPA required for mutagenic response was reached at the intermediate ferret S-9 level, 5.6 mg. The minimum dose required for activation by rat S-9 was 8 times higher.
In microsomal systems, DMBA is biotransformed to K-region epoxides, a temporary detoxification, then is further metabolized by epoxide hydrase to dihydrodiols. In homogenates, however, K-region epoxides react prefe- rentially with glutathione or other cellular constituents, and therefore differences are not as detectable as when microsomes are used [27]. DMBA metabolism is believed to be P1-450 mediated, as its biotransformation is enhanced by 3-methylcholanthrene. As such, it should be more highly acti- vated by rat S-9 than by ferret S-9. In our assays, ferret S-9 caused a slightly higher response at the highest S-9 level tested (25 mg liver), but interspecies responses fluctuated at lower levels, allowing no overall conclusion. Species differences in results based on specific activity and apparent turnover number were the greatest at low S-9 levels. Mutagenic responses decreased with S-9 amounts for both species. As the biotransformation of DMBA involves at least 2 steps, mediated by mixed-function oxidases and by epoxide hydrase, a change in the rate of one of these steps by saturation of the enzyme system could shift the balance between activation and detoxifi- cation. The confounding presence of glutathione in the hepatic S-9 probably falsely decreased the actual microsomal activation, and could have affected the activation/deactivation balance.
In general, the results for DMBA followed the trends of 2-AAF and CPA, where ferret S-9 was a more potent mutagenic activator than that of the rat. Differences in mutagenic potency of S-9 when measured by the various para- meters illuminates the changing predominance of alternative metabolizing systems to cytochrome P-450, such as PI-450 and other isozymes, or non- enzymatic reactions, when S-9 levels are deficient or unlimited. These observations are of value for the comparison of structurally similar chemicals which undergo the same types of reactions. They also merit consideration in interspecies extrapolation when evaluating the sensitivity of the ferret to environmental chemicals and drugs.
R E F E R E N C E S
1 E.C. Miller, Some cu r r en t perspect ives on chemical carcinogenesis in h u m a n s and expe r imen t a l an imals : Pres ident ia l Address . Cancer Res., 38 ( 1 9 7 8 ) 1479.
2 R.T. Williams, In te rspec ies var ia t ions in the m e t a b o l i s m of xenobio t ics . Biochem. Soc. Trans. , 2 ( 1 9 7 4 ) 359.
3 R. Kato , Character is t ics and d i f fe rences in the hepa t ic m ixed - func t i on oxidases of d i f f e ren t species. Pharmacol . Ther. , 6 {1979) 41.
4 C. Ioannides , B. S w e a t m a n , R. Richards and D.V. Parke, Drug me tabo l i sm in the ferre t : Effec ts of age, sex and s t rain. Gen. Pharmacol . , 8 (1977) 243.
5 R.L. S m i t h and J.A. Timbrel l , Fac tors a f fec t ing the me tabo l i sm of phenace t in -1 . In f luence o f dose, ch ron ic dosage, rou te of a d m i n i s t r a t i o n and species on the meta- bol ism of [ 1-~4C-acetyl ]phenace t in . Xenob io t i ca , 4 ( 1 9 7 4 ) 489.
85
6 J.A.R. Mead, N.J. Smith and R.T. Williams, Studies in detoxication. The metabolism of coumarin and o-coumaric acid. Biochem. J., 68 (1958) 67.
7 E. Boyland and K. Williams, An enzyme catalyzing the conjugation of epoxides with glutathione. Biochem. J., 94 (1965) 190.
8 J.R. Idle, P. Millburn and R.T. Williams, Taurine conjugation of arylacetic acids in the ferret. Biochem. Soc. Trans., 4 (1976) 139.
9 B.G. Lake, P.G. Brantom, S.D. Gangolli, K.R. Butterworth and P. Grasso, Studies on the effects of orally administered DL-2 (ethylhexyl) pthalate in the ferret. Toxi- cology, 6 (1976) 341.
10 B.N. Ames, J. McCann and E. Yamasaki, Methods for detecting carcinogens and muta- gens with the Salmonella mammalian microsome mutagenicity test. Mutat. Res., 31 (1975) 347.
11 A.M. Cheh, A.B. Hooper, J. Skochdopole, C.A. Henke and R.G. McKinnell, A com- parison of the ability of frog and rat S-9 to activate promutagens in the Ames test. Environ. Mut., 2 (1980} 487.
12 R.C. Garner, E.C. Miller and J.A. Miller, Liver microsomal metabolism of aflatoxin B~ to a reactive derivative toxic to Salmonella typhimurium TA 1530. Cancer Res., 32 (1972) 2058.
13 E.W. Sutherland, C.F. Cori, R. Haynes and N.S. Olsen, Purification of the hyper- glycemic-glycogenolytic factor from insulin and from gastric mucosa. J. Biol. Chem., 180 (1949) 825.
14 B. Schoene, R.A. Fleischmann, R. Returner and H.G. Oldershausen, Determination of drug metaholizing enzymes in needle biopsies of human liver. Eur. J. Clin. Pharmacol., 4 (1972) 65.
15 R.P. Batzinger, S.-Y.L. Ou and E. Bueding, Anti-mutagenic effects of 2(3)-tert-butyl- 4-hydroxyanisole and of antimicrobial agents. Cancer Res., 38 (1978) 4478.
16 H.J. Vogel and D.M. Bonner, Acetylorthinase of Escherichia coil: Partial purification and some properties. J. Biol. Chem., 218 (1956) 97.
17 D. Weinstein and T. Lewinson, A statistical treatment of the Ames assay. Mutat. Res., 51 {1978) 433.
18 M. Katz, S. Kazmer and D. Weinstein, An analysis of weak mutagens in the Ames assay. J. Environ. Pathol., Toxicol., 3 (1980) 171.
19 J. McCann, E. Choi, E. Yamasaki and B.N. Ames, Detection of carcinogens as muta- gens in the Salmonella/microsome test: Assay of 300 chemicals. Proc. Natl. Acad. Sci. USA, 72 (1975) 5135.
20 G.W. Snedecor and W.G. Cochran, Statistical Methods, edn. 7, Iowa State University Press, Ames, 1980.
21 K.A. Frederick, J.G. Babish and B.E. Johnson, Activation of promut~gens by ferret and rat hepatic S-9 fractions. Lab. Anita. Sci., (1984) (In press).
22 D.W. Nebert, H.J. Eisen, M. Negishi, M.A. Lang, L.M. Hjelmeland and A.B. Okey, Genetic mechanisms controlling the induction of polysubstrate monooxygenase (P-450) activities. Annu. Rev. Pharmacol. Toxicol., 21 (1981) 431.
23 C.A. Mullin, B.A. Croft, K. Strickler, F. Matsumura and J.R. Miller, Detoxification enzyme differences between a herbivorous and predatory mite. Science, 217 (1982) 1270.
24 D.L. Hill, W.R. Laster, Jr. and R.F. Struck, Enzymatic metabolism of cyclophospha- mide and nicotine and production of a toxic cyclophosphamide metabolite. Cancer Res., 32 {1972) 658.
25 C.M. Bagley, Jr., F.W. Bostick and V.T. DeVita, Jr., Clinical pharmacology of cyclo- phosphamide. Cancer Res., 33 (1973) 226.
26 Y. Seino, M. Nagao, T. Yahagi, A. Hoshi, T. Kawachi and T. Sugimura, Mutagenicity of several classes of antitumor agents to Salmonella typhimurium TA98, TA100, and TA92. Cancer Res., 38 (1978) 2148.
27 G.R. Keysell, J. Booth, P.L. Grover, A. Hewer and P. Sims, The formation of "K- region" epoxides as hepatic microsomal metabolites of 7-methylbenz[a]anthracene and 7,12-dimethylbenz[a]anthracene and their 7-hydroxylmethyl derivatives. Biochem. Pharmacol., 22 (1973) 2853.
86
Copyright © 2022 FDOKUMEN