
In This Issue:
28
ORDER Subscriptions and/or articles ON-LINE. (see inside back cover) ASPND7 31(5) 153–174 (2010) ISSN 0195-5373 A tomic S pectroscopy September/October 2010 Volume 31, No. 5 In This Issue: Welcome to the Future of ICP-MS Technology ....................................................................................................................................... 153 The Determination of Lead in Calcium-Based Antacid and Dietary Supplements Using the NexION 300 ICP-MS System to Comply With the State of California’s Proposition 65 Legislation Lorraine Foglio and Lee Davidowski ......................................................................... 154 Metal Impurities in Pharmaceuticals and Dietary Supplements – Implementing ICP-MS for USP <232> and Prop 65 Stephen J. Mangum and Kenneth R. Neubauer ........................................................ 159 The Determination of Trace Metals in Human Urine Using the NexION 300 ICP-MS David Bass and Daniel Jones ..................................................................................... 165 The Determination of Elements at Sub-ppb Concentrations in Naphtha Mixtures Using the NexION 300 ICP-MS Stan Smith, Monica Bolchi, and Riccardo Magarini ................................................. 170
-
Upload
khangminh22 -
Category
Documents
-
view
3 -
download
0
Transcript of In This Issue:

ORDERSubscriptionsand/or articles
ON-LINE.
(see inside back cover)
ASPND7 31(5) 153–174 (2010)ISSN 0195-5373
AtomicSpectroscopy
September/October 2010 Volume 31, No. 5
In This Issue:Welcome to the Future of ICP-MS Technology....................................................................................................................................... 153
The Determination of Lead in Calcium-Based Antacid and DietarySupplements Using the NexION 300 ICP-MS System to Comply Withthe State of California’s Proposition 65 LegislationLorraine Foglio and Lee Davidowski ......................................................................... 154
Metal Impurities in Pharmaceuticals and Dietary Supplements –Implementing ICP-MS for USP <232> and Prop 65Stephen J. Mangum and Kenneth R. Neubauer ........................................................ 159
The Determination of Trace Metals in Human UrineUsing the NexION 300 ICP-MSDavid Bass and Daniel Jones ..................................................................................... 165
The Determination of Elements at Sub-ppb Concentrations in NaphthaMixtures Using the NexION 300 ICP-MSStan Smith, Monica Bolchi, and Riccardo Magarini ................................................. 170

PerkinElmer and NexION are registered trademarks, and Dynamic Reaction Cell, DRC, andUniversal Cell Technology are trademarks of PerkinElmer, Inc.Meinhard is a registered trademark of J.E. Meinhard Associates, Inc.Multiwave is a registered trademark of Anton Paar, Graz, Austria.NIST is a registered trademark of National Institute of Standards and Technology.Optima is a registered trademark of Fisher Scientific.Tygon is a registered trademark of Norton Co.UTAK is a registered trademark of UTAK Laboratories, Inc.Veritas is a registered trademark of GFS Chemicals.Viton is a registered trademark of DuPont Dow Elastomers.
Registered names and trademarks used in this publication, even without specific indicationthereof, are not to be considered unprotected by law.
Printed in the United States and published six times a year by:
PerkinElmer, Inc.710 Bridgeport AvenueShelton, CT 06484-4794 USAhttp://www.perkinelmer.com
AtomicSpectroscopy
Vol. 31(5), Sept./Oct. 2010
Guidelines for AuthorsAtomic Spectroscopy serves asa medium for the disseminationof general information togetherwith new applications andanalytical data in atomicabsorption spectrometry.The pages of Atomic
Spectroscopy are open to allworkers in the field of atomicspectroscopy. There is no chargefor publication of a manuscript.The journal has around 1500
subscribers on a worldwidebasis, and its success can beattributed to the excellentcontributions of its authors aswell as the technical guidanceof its reviewers and theTechnical Editors.The original of the manuscript
can be mailed to the editor inhard copy including electronicfile on disk or CD (or simply bye-mail) in the following manner:1. If mailed, provide text (dou-ble-spaced) and tables in hardcopy plus on disk or CD withtext and tables in .doc file; fig-ures in doc or tif files.3. Number the references in theorder they are cited in the text.
5. Consult a current copy ofAtomic Spectroscopy forformat.
6. Editor’s e-mail:[email protected]: [email protected]
All manuscripts are sent to tworeviewers. If there is disagreement,a third reviewer is consulted.Minor changes in style are made
in-house and submitted to theauthor for approval.If a revision of the manuscript
is required before publication canbe considered, the paper isreturned to the author(s) withthe reviewers’ comments.In the interest of speed of
publication, a pdf file of the type-set text is e-mailed to the corre-sponding author beforepublication for final approval.Once the issue has been printed,
each author receives a final pdf fileof the article including 50 compli-mentary copies of the article andseveral copies of the completeissue.Additional reprints can be
purchased, but the requestmust be made before printing.
PerkinElmer. Inc., holds copy-right to all material published inAtomic Spectroscopy unless other-wise noted on the first page of thearticle.
Anneliese LustEditor, Atomic SpectroscopyPerkinElmer, Inc.710 Bridgeport AvenueShelton, CT 06484-4794 USA
EDITORAnneliese LustE-mail:[email protected]
TECHNICAL EDITORSLaura J. Thompson, AA, ICPKenneth R. Neubauer, ICP-MS
SUBSCRIPTION INFORMATIONAtomic SpectroscopyP.O. Box 3674Barrington, IL 60011 USAE-mail: [email protected] go on line:http://AtomicSpectroscopyJournal.com
2010 SUBSCRIPTION RATESORDER ON-LINE:• pdf only -1 yr - U.S. $60.00• 2 yr - U.S. $110.00• pdf and printed copy -
1 yr - U.S. $90.002 yr - U.S. $160.00
• printed copy only -1 yr - U.S. $70.002 yr - U.S. $130.00
ORDER BY CHECK:Check must be drawn on U.S.bank in U.S. funds made out to:“Atomic Spectroscopy”
BACK CLAIMS/ADDRESS CHANGES:• Subscriber claims for missingback issues will be honoredat no charge within 90 daysof issue mailing date.E-mail: [email protected] go on line:
http://AtomicSpectroscopyJournal.com
Copyright © 2010PerkinElmer, Inc.All rights reserved.http://www.perkinelmer.com
UMI Microfilm Editions ofAtomic Spectroscopy issuesalso available from:National Archive Publishing Co.300 N. Zeeb RoadAnn Arbor, MI 48106-0998 USA

WWeellccoommee ttoo tthhee FFuuttuurree ooff IICCPP--MMSS TTeecchhnnoollooggyyEngineered to deliver a level of stability, flexibility and performance never before seen in an ICP-MS
instrument, the NexION® 300 represents the first truly significant and revolutionary industry advance-ment in recent memory.
For the first time ever, a single ICP-MS instrument offers both the simplicity and convenience of acollision cell and the exceptional detection limits of a true reaction cell.
With this patented Universal Cell Technology™ (UCT), analysts can now choose the most appropriate technique for a specific sample or application.
• No restrictions on which gases you can use.
• No limits on your mass range.
• No compromises on how you choose to work.
• No hassles switching from one mode to another.
• Just the promise of superior accuracy and detection limits, faster analysis times, and an easier, more customizable operator experience than with any other instrument on the market.
• Signal responses are kept stable hour after hour by a unique Triple Cone Interface and Quadrupole Ion Deflector. Designed to remove an unprecedented level of un-ionized material (and preventing it from entering the Universal Cell), this innovative ion path keeps the instrumentclean, minimizing drift and completely eliminating the need for cell cleanings.
The NexION® 300. Welcome to the next generation of ICP-MS.
153

154Atomic SpectroscopyVol. 31(5), Sept./Oct. 2010
*Corresponding author E-mails:[email protected]@PerkinElmer.com
The Determination of Lead in Calcium-Based Antacid and Dietary Supplements
Using the NexION 300 ICP-MS System to Comply With the State of California’s
Proposition 65 LegislationLorraine Foglio and Lee Davidowski
PerkinElmer, Inc., Shelton, CT 06484 USA
INTRODUCTION
The California Safe DrinkingWater & Toxic Enforcement Act of1985, more commonly known as“Proposition 65”, is a voter-driveninitiative to address concernsregarding exposure to chemicalswhich might cause cancer or reproductive problems. Under thisCalifornia law, companies are pro-hibited from discharging certainchemicals into sources of drinkingwater and exposing people to car-cinogenic chemicals without priorwarning.
Lead (Pb) is one of the elementsidentified by the State of Californiaas both a cancer-causing agent anda reproductive toxin (1). Under California Proposition 65, the “nosignificant risk level” (NSRL) estab-lished by the Office of Environmen-tal Health Hazard Assessment forlead exposure is 0.5 µg/day (2).Since antacids and dietary supple-ments are commonly ingested bypeople in significant amounts on adaily basis, many manufacturers arenow testing these products for leadcontent.
Since the NSRL level for lead is given as a total exposure of 0.5 µg/day, it is necessary to deter-mine the detection levels neededfor monitoring purposes. For exam-ple, the U.S. RDA (Recommended
ABSTRACT
Compliance with California’sProposition 65 for the monitor-ing of lead (Pb) in calcium-basedantacid medications and dietarysupplements requires the analyti-cal methodology to demonstratedetection limits below 0.05 µg/gin the solid material. The analyti-cal capabilities of inductivelycoupled plasma mass spectrome-try (ICP-MS) make it the mostsuitable technique for perform-ing lead determinations at theselow levels on a routine basis.However, potential problemsmust be overcome, which makesthe analysis of these kinds ofsamples problematic unless cer-tain precautions are taken.
This Application Note willinvestigate the use of the NexION® 300 ICP-MS system to determine lead in variousantacids and dietary supple-ments. In particular, the Pbdetection limit capability will beassessed, together with the abil-ity to carry out spiked additionrecoveries. Furthermore, long-term stability data will be pre-sented to show suitability fordetermining trace levels of leadin calcium-containing matrices ina high sample throughput envi-ronment.
Daily Allowance) for calcium in theadult diet is 1000 mg. If the entireRDA were to be obtained from asingle calcium-containing supple-ment, the Pb concentration in thatsupplement must be <0.5 µg/g. Inorder to quantify <0.5 µg/g, thedetection limit for Pb should be aminimum of 10 times lower. There-fore to perform reliable quantita-tion of Pb at the 0.5 µg/g level inthe solid material, a method detec-tion limit of 0.05 µg/g or lowerwould be necessary.
Extremely low detection limitshave been the major attraction ofinductively coupled plasma massspectrometry (ICP-MS) for trace ele-ment quantitation. For example, aprevious investigation showed thatthe instrument detection limit (IDL)for lead by ICP-MS is approximately50-100x lower than by graphite fur-nace atomic absorption (AA) (3).However, one of the recognizedweaknesses of ICP-MS is signal sup-pression and long-term instabilitycaused by the sample matrix. Thisis partially overcome using internalstandardization, but can be particu-larly severe with calcium-basedsamples because of the potentialfor calcium deposits building up onthe interface cones and ion optics.This issue can have a negativeimpact on detection limit, recoveryof spiked additions and the likeli-hood of long-term drift when carry-ing out high throughput analysis.For this reason, when assessing thesuitability of an instrumental tech-nique to analyze these types of
samples on a routine basis, it is veryimportant to evaluate its long-termstability characteristics as well asassessing its detection limit andspike recovery capabilities.
The investigation was carriedout using a NexION™ 300 ICP-MS to determine Pb in a variety of cal-cium-containing materials, includ-ing calcium and calcium/magne-sium-based antacids, a dietary sup-plement, some calcium salts and a
NIST® (National Institute ofScience and Technology, Gaithers-burg, MD, USA) multivitamin tablet,using simple aqueous calibrationstandards.
EXPERIMENTAL
Six different calcium-based materials were chosen for the eval-uation, which represent a typicalcross section of antacids, over-the-counter mineral supplements, mul-tivitamins and calcium salts used inthe manufacturing process. Detailsof the samples are shown in Table I.
Sample Preparation
Approximately 0.2 g of thecrushed sample was accuratelyweighed into a 50-mL autosamplertube. Two mL of Veritas® double-distilled, high purity concentratednitric acid (GFS Chemicals™) wasadded. After the initial reaction, 2 mL of deionized water wasadded, together with 10 µg/L oflutetium (175Lu, as an internal stan-dard), and then diluted to 50 mLwith deionized water.
Calibration
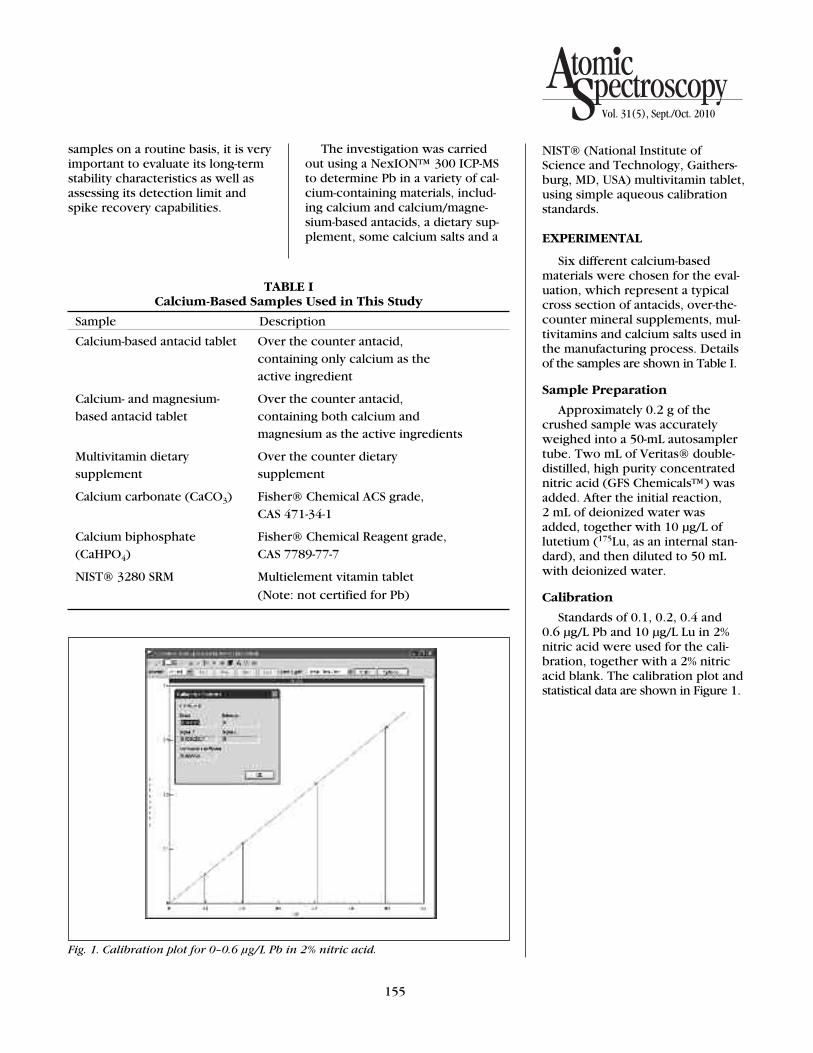
Standards of 0.1, 0.2, 0.4 and 0.6 µg/L Pb and 10 µg/L Lu in 2%nitric acid were used for the cali-bration, together with a 2% nitricacid blank. The calibration plot andstatistical data are shown in Figure 1.
155
TABLE ICalcium-Based Samples Used in This Study
Sample Description
Calcium-based antacid tablet Over the counter antacid, containing only calcium as the active ingredient
Calcium- and magnesium- Over the counter antacid,based antacid tablet containing both calcium and
magnesium as the active ingredients
Multivitamin dietary Over the counter dietarysupplement supplement
Calcium carbonate (CaCO3) Fisher® Chemical ACS grade, CAS 471-34-1
Calcium biphosphate Fisher® Chemical Reagent grade,(CaHPO4) CAS 7789-77-7
NIST® 3280 SRM Multielement vitamin tablet
(Note: not certified for Pb)
Fig. 1. Calibration plot for 0–0.6 µg/L Pb in 2% nitric acid.
Vol. 31(5), Sept./Oct. 2010

Instrumentation
All data in this study were gener-ated on a NexION® 300Q ICP massspectrometer (PerkinElmer®, Inc.,Shelton, CT, USA), fitted with alow-flow microconcentric glassnebulizer and a baffled, glasscyclonic spray chamber (both fromMeinhard® Glass Products, Golden,CO, USA). The instrumental operat-ing conditions for this applicationare shown in Table II.
Analytical Evaluation
The analytical evaluation con-sisted of three different tests:
• Detection Limits:Both the instrument detection
limit (IDL) and the method detec-tion limit (MDL) were measured.IDLs are determined by measuringthe calibration blank a number oftimes and multiplying the resultingstandard deviation by three. How-ever, it is also important to comparethese data by carrying out thedetection limit test with a low-levelstandard (MDL) and a typical sam-ple matrix.
• Spike Recoveries: The samples were first analyzed,
then a known concentration of Pbwas added to each and quantified.The spike recoveries were calcu-lated by comparing the concentra-tion of Pb in the spiked samples tothe concentration in the originalsample.
• Long-Term Stability: The true test of any analytical
technique for high throughput,routine analysis is the ability to runreal-world samples for extendedperiods of time without recalibra-tion. Therefore, to assess long-termstability, the Pb signal was moni-tored in one of the antacid tabletsover five hours without recalibra-tion.
RESULTS
Detection Limits
The detection limits were deter-mined in three different ways andare listed in Table III. First, the PbInstrument Detection Limit (IDL)was determined by measuringseven reagent blanks against thecalibration curve. The Pb MethodDetection Limit (MDL) was deter-mined by measuring seven reagent
blanks spiked with 0.010 µg/L Pb.Table III shows the MDL both insolution and in the solid, based on a0.2 g sample digested and dilutedto 50 mL. Finally, the detectionlimit in an actual calcium- and mag-nesium-based antacid tablet wasdetermined by measuring the Pbconcentration from seven differentdigestions. Again, Table III showsdetection limits in both solutionand the solid.
156
TABLE IIICP-MS Instrumental Operating Conditions for this Application
Component/Parameter Type/Value/Mode
Analyte Isotopes Measured Sum of 206Pb, 207Pb, and 208Pb
Internal Standard 10 µg/L 175Lu
Nebulizer Low Flow Glass Microconcentric
Spray Chamber Baffled Glass Cyclonic
Triple Interface Cone Material Nickel
Plasma Gas Flow 16.0 L/min
Auxiliary Gas Flow 1.0 L/min
Nebulizer Gas Flow 0.92 L/min
Sample Uptake Rate 300 µL/min
RF Power 1600 Watts
Dwell Time/No. of Sweeps 50 ms/20
Total Integration Time 1 s per mass
No. of Replicates per Sample 3
Universal Cell Technology Standard Mode
TABLE IIIPb Detection Limits
Instrumental Method Detection Limits Detection Limits Detection Limits in a Sample
Solution (µg/L) 0.0014 0.0025 0.006
Solid (µg/g) – 0.0006 0.0015

These data indicate Pb detectionlimits in a solution range from 1–6 ppt (ng/L), which is typical ofan aqueous-based instrument detec-tion limit for Pb by ICP-MS. How-ever, a Pb MDL of 0.0015 µg/g inthe solid indicates that it issufficiently low enough to reliablyquantitate Pb in a calcium matrix at0.05 µg/g as defined under Proposi-tion 65. It should also be noted thatthese detection limit studies weredone using a 1-second measure-ment time per mass. The benefit ofsuch a short integration time is thatthe methodology can be applied toa high sample-throughput environ-ment. If lower detection limits arerequired, the method could easilybe modified to use a longer integra-tion time.
Spike Recoveries
Five of the six samples werespiked with 0.2 µg/L Pb, while theCaHPO4 was spiked with 2.0 µg/Lsince Pb was present at a higherlevel than in the other samples. Thespikes were added post-digestion.The quantitative results for all thesamples, together with the spikerecovery data, are shown in TableIV. It can be seen that all the recov-eries are within the generallyaccepted guidelines in the food andenvironmental monitoring indus-tries of ±15% of the actual value(4). It should also be emphasizedthat Pb was not certified in NIST®3280 Multielement Vitamin Tablet.
Long-Term Stability
For this test, the Ca/Mg antacidtablet was spiked with 0.5 µg/L Pband the signal monitored every 30 minutes over approximately fivehours, with a rinse cycle betweenthe measurements. It should beemphasized that no recalibrationwas carried out over the timeperiod of the stability run. The 5-hour stability plot in Figure 2shows that even after almost five hours of measuring the Ca/Mg
matrix, the 0.5 µg/L Pb signal hasonly drifted by 3%.
CONCLUSION
The study has shown that theNexION® 300 ICP-MS can handlethe determination of Pb in calcium-based samples with relative ease.The Pb detection limit determinedunder routine analytical conditionsis more than 30-fold lower thanwhat is required to determine the
levels needed under the State ofCalifornia’s Proposition 65. Whenthis performance is combined withexcellent long-term stability andspike recovery data that are consis-tent with guidelines defined by fed-eral regulatory agencies, it clearlyshows that the instrument is ideallysuited for high sample throughputanalysis of calcium-based antacidmedications and dietary supplements.
157
TABLE IVQuantitative Results for Pb in All the Calcium-Based Samples,
Together With the Spike Recovery Data
Sample Pb Conc. Standard Spike % Spike Type in Solid Deviation (µg/L) Recovery
(µg/g) (µg/g)
NIST® 3280 0.029 0.002 0.2 86.4
CaCO3 0.093 0.001 0.2 97.8
CaHPO4 0.342 0.003 2.0 94.3
Antacid Tablet (Ca) 0.063 0.001 0.2 84.5
Antacid Tablet (Ca & Mg) 0.025 0.001 0.2 85.5
Multivitamin Supplement 0.039 0.001 0.2 101.1
Fig. 2. Five-hour stability plot for 0.5 µg/L Pb in the Ca and Mg antacid tablet.
Vol. 31(5), Sept./Oct. 2010

158
REFERENCES
1. Safe Drinking Water and ToxicEnforcement Act of 1986, Califor-nia Code of Regulations, Sections25249.5 and 25249.5
2. List of Chemicals Known to theState of California to Cause Canceror Reproductive Toxicity, Califor-nia Code of Regulations, Title 22,Section 12000, August, 1997.
3. Analysis of Lead (Pb) in Antacidsand Calcium Compounds forProposition 65 Compliance, R.Wolf, Atomic Spectroscopy, 18 (6),1997.
4. Determination of Trace Elementsin Waters and Wastes by ICP-MS:U.S. EPA Method 200.8 – Version5.4, 1994; J. T. Creed, C.A. Brock-hoff, T.D. Martin –http://www.epa.gov/waterscience/methods/method/files/200_8.pdf

159
*Corressponding author E-mails:[email protected] [email protected]:
Metal Impurities in Pharmaceuticals and Dietary Supplements –
Implementing ICP-MS for USP <232> and Prop 65Stephen J. Mangum and Kenneth R. NeubauerPerkinElmer, Inc., Shelton, CT 06484 USA
ABSTRACT
The United States Pharma-copeia (USP) proposed generalchapter 232 is the intendedreplacement for the old USP 231.Covering the range of activepharmaceutical ingredients forfoods and dietary supplementswill necessitate the inclusion ofmany elements. In order to meetthis need and the growing list ofproducts, technology used in themodern testing lab has beenemployed. Inductively coupledplasma mass spectrometry (ICP-MS) is an ideal choice for meet-ing these needs, with the abilityto determine most of theelements in the periodic tableand a wide dynamic range, span-ning part-per-trillion to part-per-million levels. This range meansthat trace contaminants as well asnutritionally significant elementscan be measured during the sameanalysis.
ever the source, the responsibilityfor testing all products lies with themanufacturer.
While many regulatory bodiesexist, few have put forth methodson how the testing should be done.Most recently, one of the mostprominent promulgators of meth-ods, the USP (United States Pharma-
copeia), has recognized the needfor a new metals testing methodwhich provides more accuracy andbetter specificity in product testing:
“Although still widely acceptedand used in the pharmaceuticalindustry, these methods based onthe intensity of the color of sulfideprecipitation are non-specific,insensitive, time-consuming, laborintensive, and more often thanhoped, yield low recoveries or norecoveries at all.”
(Wang, T. et al., J. Pharm. & Biomed.Anal., Vol. 23 (2000) 867-890).
The USP-proposed general chap-ter 232 is the intended replacementfor the old USP 231. The range ofactive pharmaceutical ingredientsfor foods and dietary supplementswill necessitate the inclusion ofmany elements, shown in Table I.
Inductively coupled plasma massspectrometry (ICP-MS) would be anideal choice for meeting theseneeds, with its ability to analyzemost of the elements in the peri-odic table and a wide dynamicrange, spanning part-per-trillion topart-per-million levels. This rangemeans that trace contaminants aswell as nutritionally significant ele-ments can be measured during thesame analysis.
INTRODUCTION
Heavy metal exposure of a popu-lation has been a long-standinghealth concern. When this expo-sure occurs through prescribedmedicine or dietary supplements, itis even more worrisome. Metalshave been monitored for years;while some are toxic, others arenecessary to biological functions.Even though some metals are usedas catalysts to produce the medica-tions, all non-essential metalsshould be eliminated from the finalproduct; their presence may repre-sent product quality issues. What-
Atomic SpectroscopyVol. 31(5), Sept./Oct. 2010
The only limitation of ICP-MS isthat samples have to be in a liq-uid form, which necessitatesdigesting solid samples, whichadds time and introduces the pos-sibility of contamination.Microwave digestion is the per-fect compliment to ICP-MS,ensuring rapid, clean digestionswith no analyte loss.
This work demonstrates asample preparation procedureand analysis scheme which notonly complies with the new pro-posed standards, but will take themodern analytical laboratory intothe next decade. The combina-tion of the Multiwave™ 3000microwave digestion oven andthe NexION® 300 ICP-MS, a newgeneration of ICP-MS instrumen-tation, is ideal for the analysis ofpharmaceutical and dietary sup-plements.
TABLE IElements Important for Pharmaceutical Testing
Arsenic Cadmium Chromium CopperIridium Lead Manganese MercuryMolybdenum Nickel Palladium Platinum
Rhodium Ruthenium Vanadium

160
This work shows a samplepreparation procedure which mini-mizes contamination and loss ofvolatile elements. The digested samples will be measured on a NexION® 300 ICP-MS (PerkinElmer,Inc., Shelton, CT USA), a new gen-eration of ICP-MS containingunique features which make it anideal tool for the analysis of phar-maceutical and dietary products.
EXPERIMENTAL
Sample Preparation
The samples were preparedusing microwave-assisted digestionin closed vessels. This allows a con-tamination-free environment, aswell as a single preparation methodfor all elements of interest. Themicrowave system used was theMultiwave® 3000 digestion system(Anton Paar, Graz, Austria). Thehigh-pressure 100 mL (HF100) rotorand vessels are recommended.
The sample types used in thisstudy consisted of vitamin pills(purchased in a pharmacy and sup-plied by customers), NIST® foodmaterials (National Institute ofStandards and Technology, Gaithers-burg, MD, USA), and various rawmaterials used in the formulation ofdietary supplements. A half gram ofmaterial was weighed into a HF100Multiwave vessel. Five mL of con-centrated HNO3 were added, andthe solution was swirled to ensurewetting and mixing. Finally, 2 mLof H2O2 was added slowly andallowed to react. The vessels werethen sealed. The Multiwave program
was run using the internal tempera-ture probe which allows precisecontrol of the reaction and temper-ature. The digestion program is amodified vitamin program from theMultiwave library, as shown inTable II.
Upon completion of the diges-tion, the samples were brought to50 mL final volume with deionizedwater. The samples were thendiluted 1:10 with deionized waterprior to analysis, and the followinginternal standards added: Sc (40 ppb); Ge, In, Bi (20 ppbeach). Quantitation was doneagainst aqueous, external calibra-tion curves.
Instrumental Conditions
All analyses were performed ona NexION® 300X ICP-MS, usingboth Standard and Kinetic EnergyDiscrimination (KED) modes.Extended Dynamic Range (EDR)was also utilized as part of the Uni-versal Cell Technology to enablethe simultaneous determination of
trace and major nutritionalelements (such as calcium, potas-sium and phosphorus) which arepresent at hundreds of ppm. Thereare only four metals required by theState of California Proposition 65:As, Hg, Cd and Pb. These are deter-mined at very low ppb levels in allmaterials.
The analysis of vitamins andnutritional supplements does notrequire ultra low detection limits,thus KED mode was chosen insteadof DRC™ mode as a simple univer-sal correction technique. Table IIIshows the instrumental conditionsused, and Table IV shows the cellparameters. The default elementalcorrections in the NexION® soft-ware, which account for isobaricinterferences, were used. Elementsmeasured were those which arecommonly analyzed by customerslooking to conform to the newexpanded USP requirements,although this list could furtherincrease in the future.
TABLE IIMultiwave Digestion Program
Temp Ramp Hold Fan (°C) (min) (min) Speed
170 8 15 1
0 – 15 3
p-rate: 0.5 bar/s IR: 160 °C P: 1000 W
TABLE IIINexION 300X Instrumental Conditions
Sample Uptake Rate 0.3 mL/min
Peristaltic Pump Tubing Tygon®, green/orange
Flush Delay 35 sec
Read Delay 30 sec
Wash 30 sec
Neublizer Glass Concentric
Spray Chamber Glass Cyclonic
Injector 2 mm Quartz
RF Power 1600 W
Dwell Time 50/100/200 ms
Sweeps/Reading 16
Replicates 3
Modes KED (He) and Standard
Sample Run Time 3 min/sample

161
RESULTS AND DISCUSSION
Internal standards were used tocompensate for differences inmatrix composition between thevariety of samples analyzed. Multi-ple isotopes were used for selectedelements for verification duringmethod development. Extendeddynamic range (EDR) was used forthe high level elements by adjustingthe RPa values specific to that iso-tope, as shown in Table IV. EDRallows measurements up to hun-dreds of ppm if necessary.
The accuracy of the method wasestablished by analyzing a certifiedreference material (NIST® 1548,Total Diet), as well as spike recov-eries. The results in Table V indi-cate that both the certified valuesand spike recoveries are adequatefor all elements of interest. Thehigh spike recoveries for the Hgisotopes were due to the fact thatAu was not included in the washsolutions, which meant that Hgwashout was not complete.
Once the method was validated,a batch analysis containing differentpharmaceutical and nutritional sup-plement samples was performed.The results are shown in Tables VI(raw materials for food supple-ments) and VII (vitamins, digestedin duplicate).
Instrument stability was estab-lished by comparing sensitivitybefore and after a two-hour batchanalysis, which included the SRM,different vitamins, and a variety ofraw materials used for supplementproduction. Because the sensitivitydid not change, this indicates thatthe electrical parameters within theinstrument did not change, mean-ing that there was no sample depo-sition within the instrument. TheNexION® 300 ICP-MS wasdesigned specifically to handlehigh-matrix samples.
CONCLUSION
This work has demonstrated the ability of the NexION® 300ICP-MS to effectively measure awide variety of trace elements invitamin samples, thus conformingto the proposed USP criteria. Byincorporating a Triple Cone Inter-face, Quadrupole Ion Deflector,Extended Dynamic Range, and Universal Cell Technology, the NexION® 300 ICP-MS is an idealtool to meet the needs of the newUSP guidelines and extends themetal analysis capabilities of themodern laboratory in order to meeteven more challenging analyses.
TABLE IVUniversal Cell Conditions
Cell Element Cell Gas Gas Flow RPa RPqMode (mL/min)
KED B 11 He 5 0 0.25
V 51 He 5 0 0.25
Cr 52, 53 He 5 0 0.25
Mn 55 He 5 0 0.25
Co 59 He 5 0 0.25
Ni 60, 62 He 5 0 0.25
Cu 63, 65 He 5 0 0.25
As 75 He 3.8 0 0.25
Se 78, 82 He 3.8 0 0.25
Mo 95, 97, 98 He 5 0 0.25
Ru 99 He 5 0 0.25
Pd 105 He 5 0 0.25
Cd 111, 114 He 5 0 0.25
Sn 118 He 5 0 0.25
Sb 121, 123 He 5 0 0.25
EDR Na 23 He 3.8 0.010 0.25
Mg 24 He 3.8 0.012 0.25
P 31 He 3.8 0.005 0.25
K 39 He 3.8 0.012 0.25
Ca 43, 44 He 3.8 0.010 0.25
Fe 54 He 3.8 0.006 0.25
Zn 67, 68 He 3.8 0.008 0.25
Standard W 182 – – – 0.25
Pt 195 – – – 0.25
Hg 200, 202 – – – 0.25
Pb 208 – – – 0.25
Vol. 31(5), Sept./Oct. 2010

162
TABLE VNIST® 1548a Total Diet (units = µg/g)
NIST® 1548a Certified Values % Recovery Spike Levels NIST® 1548a % Spike Spike Recovery
B11 4.34 4.16 104 10.00 15.94 116
V51 0.02 10.00 10.21 102
Cr52 0.00 10.00 9.57 96
Cr53 0.00 10.00 9.21 92
Mn55 4.40 5.75 76.5 10.00 15.29 109
Co59 0.04 (0.03) 10.00 9.60 96
Ni60 0.00 0.37 10.00 8.92 89
Ni62 0.00 0.37 10.00 9.21 92
Cu63 2.12 2.32 91.5 10.00 10.9 88
Zn67 20.1 24.6 81.7 10.00 29.7 96
As75 0.16 0.20 81.0 10.00 9.14 90
Se78 0.20 0.25 80.4 10.00 9.02 90
Se82 0.27 0.25 112 10.00 8.91 89
Mo95 0.21 0.26 79.6 10.00 11.0 108
Mo97 0.21 0.26 80.4 10.00 11.1 109
Mo98 0.20 0.26 76.9 10.00 11.0 108
Cd111 0.037 0.035 106 10.00 9.25 92
Sn118 14.01 17.20 81.5 10.00 26.8 128
Sb121 0.017 (0.009) 10.00 10.3 102
Sb123 0.015 (0.009) 10.00 10.4 104
Hg200 0.014 (0.005) 1.00 1.45 144
Hg202 0.016 (0.005) 1.00 1.47 146
W182 0.06 10.00 10.4 104
Pb208 0.038 0.044 86.4 10.00 10.5 104
Fe54 30.6 35.3 86.6 50.2
Ca44 1959.5 1967.0 99.6 2187
P31 2864.5 3486.0 82.2 2875
K39 6563.3 6970.0 94.2 7225
Na23 7673.3 8132.0 94.4 8170
Mg25 591.8 580.0 102 6445
Parentheses indicate non-certified valuesNote: Not all elements listed as part of the expanded USP 232 criteria were certified.

163
TABLE VIRaw Materials for Food Supplement Production (units = µg/g)
Mustard Granules Expected Range* Chrom Polynicotin** Phytomatrix Expected Range*
B11 2350 1550-2400 1.80 203 180-330
V51 258 155-240 1.42 27.2 18-33
Cr52 752 466-720 2290 75.2 54-99
Cr53 760 466-720 2270 75.7 54-99
Mn55 6610 4660-72000 0.27 638 540-990
Co59 0.60 0.01 0.20
Ni60 1.78 -0.03 0.21
Ni62 6.00 -0.04 0.61
Cu63 4210 3100-4800 0.11 355 360-660
Zn67 27700 27200-42000 4.6 2390 3150-5780
Zn68 30300 5.7 2030
As75 0.05 0.00 0.15
Se78 228 310-480 0.02 25.9 18-40
Mo95 292 155-240 0.02 30.1 18-33
Mo97 291 0.02 30.1
Mo98 291 0.02 29.9
Ru99 0.01 0.00 0.00
Rh103 0.00 0.00 0.01
Pd105 0.00 0.00 0.00
Cd111 0.22 0.00 0.11
Sn118 0.14 0.02 0.08
Sb121 0.01 0.00 0.06
Sb123 0.01 0.00 0.06
Hg200 0.02 0.00 0.01
Hg202 0.02 0.00 0.01
Ir193 0.01 0.00 0.00
Pt195 0.00 0.00 0.00
W182 0.24 0.02 0.08
Pb208 0.39 0.01 0.11
Fe54 12400 9300-14400 1490 1720 1080-1980
Ca44 6530 19.6 116000 112300-130500
P31 6190 6.1 41900
K39 9130 2.0 5740
Na23 868 1040 3600
Mg25 3980 15.1 3950
* Expected Ranges supplied by the customers.** Expected Range not supplied.
Vol. 31(5), Sept./Oct. 2010

164
TABLE VIIDigestion Duplicates for Vitamins (units = µg/g)
Gel Cap Vitamin Pill Digestion 1 Digestion 2 Upper Limit* Digestion 1 Digestion 2
B11 14.8 14.0 85.9 76.3
V51 0.25 0.23 0.76 0.70
Cr52 0.33 0.28 81.4 79.7
Cr53 0.34 0.30 81.0 80.1
Mn55 16.0 16.0 1440 1400
Co59 0.16 0.15 0.60 0.59
Ni60 0.38 0.36 -0.12 -0.13
Ni62 0.41 0.41 0.45 0.47
Cu63 1.17 1.04 5.00 549 537
Zn67 7.8 5.9 12.5 13300 12900
Zn68 8.0 6.0 13700 13700
As75 0.54 0.54 2.00 0.21 0.21
Se78 0.09 0.07 89.9 84.3
Mo95 0.12 0.12 57.1 54.4
Mo97 0.13 0.12 57.1 54.2
Mo98 0.12 0.12 57.3 54.2
Ru99 0.00 0.00 0.01 0.01
Rh103 0.00 0.00 2.63 2.52
Pd105 0.00 0.00 0.00 0.00
Cd111 0.03 0.03 1.00 0.15 0.13
Sn118 0.02 0.02 40.0 0.08 0.07
Sb121 0.01 0.01 1.00 0.01 0.00
Sb123 0.01 0.01 0.00 0.01
Hg200 0.01 0.01 1.00 0.01 0.01
Hg202 0.01 0.01 0.01 0.01
Ir193 0.00 0.00 3.76 3.52
Pt195 0.00 0.00 0.00 0.00
W182 0.01 0.01 0.02 0.01
Pb208 0.19 0.20 5.00 0.28 0.26
Fe54 110 105 110 104
Ca44 3200 3320 53500 50600
P31 1710 1640 1100 1040
K39 8750 8940 16800 15900
Na23 9210 9460 972 931
Mg25 4070 4130 41700 40100
* Upper Limit supplied by the customer

165
The Determination of Trace Metals in Human Urine
Using the NexION 300 ICP-MSDavid Bass and Daniel Jones
PerkinElmer, Inc., Shelton, CT 06484 USA
INTRODUCTION
The monitoring of trace metalsin human urine plays an importantrole, not only in the assessment ofnormal biological metabolic func-tions, but also as an indicator ofexposure to toxic materials and togain a better understanding ofsources of environmental contami-nation. Traditionally, urine analysishas been accomplished by graphitefurnace atomic absorption (GFAA).However, when large numbers ofsamples are analyzed for multipleelements, GFAA becomes very cum-bersome and restrictive since it canonly determine one element at atime. Additionally, the detectioncapability of inductively coupledplasma mass spectrometry (ICP-MS)for many clinically significant ele-ments is far superior to GFAA (1).The benefits of ICP-MS for biologi-cal samples are well-recognized andinclude:
• Superior detection-limit capability (2)
• Enhanced sensitivity
• Higher sample throughput
• Well-defined interferences (3)
• Reliable isotopic analysis
• Detection of elemental speciesusing HPLC (4)
However, human urine is a com-plex matrix containing high levelsof urea, uric acid, proteins, fats,sodium, potassium, bicarbonateand chloride. Figure 1 shows thechemical breakdown of the approx-
imately 1.4 liters of urine passed bya typical adult on a daily basis.These components can cause signalsuppression during ICP-MS analysis.In addition, there is the potentialfor signal drift caused by matrixdeposition on the interface conesand ion lens system. Another poten-tial problem is the formation ofpolyatomic interferences caused bythe combination of matrix compo-nents with aqueous and plasmaspecies.
EXPERIMENTAL
Instrumentation
For this study, the PerkinElmer®NexION® 300D, an innovative newICP-MS, was used to analyze agroup of UTAK® freeze-dried urineSRM samples. This instrument is
*Corresponding author [email protected] [email protected]
ABSTRACT
This application notedescribes the use of an innova-tive, next-generation inductivelycoupled plasma mass spectrome-ter (ICP-MS) for the determina-tion of trace elements in humanurine. The study will show howspectral interferences are over-come with the instrument’sbreakthrough Universal CellTechnology™, and how theunique interface and ion-filteringdesign is ideally suited for theanalysis of such difficult matrices.Data will be presented that showexcellent correlation with agroup of UTAK® freeze-driedurine standard reference materi-als.
Atomic SpectroscopyVol. 31(5), Sept./Oct. 2010
Fig. 1. Chemical breakdown of the 1.4 liters of urine passed by a typical adult on adaily basis.

166
ideally suited for the analysis ofhigh-matrix samples because of itsunique design. For the first time, asingle ICP-MS instrument offersboth the simplicity and con-venience of a traditional collisioncell with kinetic energy discrimina-tion (KED) and the superior inter-ference-reduction capabilities anddetection limits of the DynamicReaction Cell™ (DRC™). With thisdesign, analysts can now choosethe most appropriate collision/reaction cell technology for a spe-cific application without anyrestrictions to the type of gases thatcan be used.
The NexION™ 300 ICP-MS(PerkinElmer, Shelton, CT, USA)also features a unique triple-coneinterface. Unlike other systemswhich only have sampler and skim-mer cones, this instrument alsoincludes a hyper skimmer to tightlydefine and focus the ion beam.Pressure within the interface isreduced in smaller steps, providingless dispersion of ions and prevent-ing sample deposition on internalsurfaces. All three cones can bequickly and easily removed,cleaned or replaced – an importantpoint for the analysis of urine,which contains high levels of saltsand organic materials.
The ion beam emerges from thetriple-cone interface and enters aquadrupole ion deflector (QID)which is designed around a propri-etary, miniaturized quadrupole. The QID bends the ion beam 90degrees, focusing ions of a speci-fied mass into the cell. Neutrals,non-ionized species, and photonsare not affected by the voltages andpass through directly to vent, neverimpacting any of the surfaceswithin the QID. Therefore, the volt-ages within the QID remain con-stant, resulting in low backgrounds,minimal drift, and exceptional sta-bility even when running the mostchallenging matrices.
Sample Preparation
Two UTAK® (Valencia, CA,USA) freeze-dried urine standardreference materials (SRMs) werechosen for this study: normal- andhigh-range urines (UTAK®-12111,Lot # 3500; UTAK®-12110, Lot #3499). Before analysis, these con-trol samples are reconstituted with5.0 mL of 1% hydrochloric acid asper the enclosed certificate instruc-tions, then diluted 10-fold withdeionized water and preservedwith 1% nitric acid. Both acidswere Optima® grade (Fisher Scien-tific®).
To minimize matrix effects dur-ing ionization, calibration standards(0.1, 1, 5, and 10 µg/L) were pre-pared in a pooled urine sample.
Methodology
Urine, like other biological mate-rials, contains high levels ofcarbonaceous materials, chlorides,and other dissolved solids whichcan cause both spectral and matrix-induced interferences on the ana-lytes of interest. Therefore,accurate trace-metal determinationsin this matrix can be difficult. Forexample, chloride and carbon ionsform the polyatomic species ArC+,ArCl+, ArN+ and ClO+, which inter-fere with the determination of Cr+,As+, Mn+ and V+. Therefore, it isimportant to reduce the impact ofthese interferences by using celltechnology.
Although both DRC and collisioncell/KED modes are available, theanalysis was performed using DRCmode because of its superior detec-tion capability through the use ofion-molecule reaction chemistries.It was felt that the extremely lowquantitation levels, especially withthe 10-fold dilution of the normal-level UTAK® SRM, necessitated theuse of DRC technology. With thatin mind, ammonia (NH3) was usedfor the measurement of several ofthe transition elements, while
oxgen (O2) was used for the deter-mination of arsenic.
Ammonia is universally recog-nized as the best reaction gas toreduce argon-based spectral inter-ferences. The reason for this is thatthe reactivity of NH3 with argonions is extremely rapid andexothermic, whereas its reactionrate with first-row transition metalsis much slower. The reduction of40Ar12C+ on 52Cr+ with ammoniaserves as an example of this con-cept. Since both of these speciesexist at mass 52, low levels of Crcannot be measured in thepresence of carbon. However, NH3
reacts much more rapidly withArC+ (k≈10–10) than with Cr+(k≈10–12) through the followingmechanism:
ArC+ + NH3 > Ar + C + NH3+ K ≈ 10–10
Cr+ + NH3 > Cr(NH3)+ K ≈ 10–12
The net result is an increase insignal-to-background through theelimination of ArC+, thus allowingtrace levels of Cr to be measured.This process is similar for thereduction of other polyatomic inter-ferences using the DRC mode.
The optimization plot for 52Cr in the presence of high concentra-tions of carbon ions (isopropanol)is shown in Figure 2. The x-axisshows the NH3 cell gas flow rate,while the y-axis represents the sig-nal intensity. It is evident that thesignal intensity of the 40Ar12C+ inthe blank is significantly reduced,while the signal for the 1 ppb 52Cris largely unaffected. The initialapparent drop in the Cr signal fromNH3 = 0.1–0.3 mL/min is actuallythe reduction of ArC+; 1 ppb Crcannot be seen in the presence ofsuch a high concentration of car-bon at such low ammonia flows. Atan NH3 flow rate of approximately0.7 mL/min, the ArC+ interferencehas been reduced to less than 100 counts, which represents areduction of 4–5 orders of magni-

167
tude from the original level. Thedynamic bandpass tuning of theDRC technology immediately ejectsNH3
+ ions generated in the cell,thus avoiding undesirable side reac-tions taking place (Note: This opti-mized DRC bandpass tuning isrepresented by the RPq valuesshown in Table II – Page 174). As a result, only 52Cr ions exit the celland enter the analyzer quadrupole.Figure 3 shows the Cr calibrationcurve (0–5 µg/L Cr) in urine for52Cr+. The linearity of the curve atthese levels provides evidence thatthe ArC+ interference has beenremoved.
For the determination of arsenic,the analyst can leverage the DRC’sability to move arsenic to a newanalytical mass, away from theinterferences. In urine, the maininterferences on 75As+ are 40Ar35Cl+
and 40Ca35Cl+. Although ArCl+
reacts rapidly with various cellgases, CaCl+ is very unreactive dueto the extremely high Ca–Cl bondstrength. As a result, CaCl+ cannotbe eliminated through reactionchemistry. Although collision cellmode would address both of theseinterferences, the loss of As sensi-tivity is great, which would maketrace-level measurements difficult.
A better alternative would be touse oxygen as the cell gas and takeadvantage of the rapid reactionbetween As+ and O2 to form75As16O+ at m/z 91, as shown previ-ously (5). The conversion of As+ toAsO+ is illustrated in Figure 4. Inthis figure, the X axis shows the gasflow, and the Y axis shows theintensity; the bottom curve is the75As+ signal and the upper curve isthe 75As16O+ signal, both as a func-tion of oxygen flow. This dataclearly shows that as the As+ signaldecreases, the AsO+ signalincreases, demonstrating the con-version of As+ to AsO+.
Fig. 2. NH3 cell gas optimization of 52Cr in the presence of 40Ar12C+ using reactionchemistry.
Fig. 3. Calibration plot of 0.1, 1.0 and 5.0 µg/L of 52Cr+ in urine.
Vol. 31(5), Sept./Oct. 2010

168
Instrumental Operating Parameters
The instrumental operating con-ditions for the analysis of urine areshown in Table I; reaction cell con-ditions appear in Table II. A highRF power (1500 watts) is importantto break down the urine andreduce the effects of matrix sup-pression. The combination of highRF power in conjunction with alow sample-uptake rate leads to amore energetic plasma, which pro-motes more complete ionization,reducing deposition on the samplerand skimmer cones, thereby mini-mizing signal drift.
The elements determined inDRC mode (As, Cr, Co, Cu, Mn, V)are shown in Table II; all other ele-ments were determined in the stan-dard mode. Both sets of elementswere combined into a singlemethod. Changeover time betweenstandard and DRC modes wasapproximately 10 seconds.
RESULTS
the results for the UTAK® SRMsare shown in Tables III (normallevel) and IV (high level). The “Cer-tificate Value” was supplied withthe SRMs and is the average valueobtained by four different analyticaltechniques: Selective Ion Electrode(SIE), ICP-MS, ICP-OES, and a calori-metric method. The “ExpectedRange” is the lowest and the high-est value obtained by these tech-niques. The “Reported Values” aretypical results obtained in thisstudy. All the reported values fallwithin the expected range, thusvalidating the method.
TABLE IInstrumental Operating Conditions Used
for the Analysis of UTAK® Freeze-Dried Urine
Parameter Setting
Sample Introduction System Baffled Cyclonic Spray Chamber with aMeinhard Low Flow Nebulizer
Sample Uptake Rate 0.3 mL/minSampler and Skimmer Cones NickelForward Power 1500 WattsNebulizer Gas Flow 0.8 L/minSweeps 20Points per Peak 1Replicates 3Dwell Time 100 msModes Standard and DRCTime to Change Modes 10 sInternal Standards Indium (115In) for all elements except
Yttrium (89Y) for 66Zn
Fig. 4. Optimization of oxygen gas flow in the conversion of 75As+ to 75As16O+.
As+ + O2 → AsO+

169
CONCLUSION
This work has shown that theinnovative design of PerkinElmer’sNexION® 300 ICP-MS is ideallysuited for trace-metal determinationin urine. The combination of innov-ative instrumental design considera-tions along with energetic plasmaconditions and reaction cell tech-nology allows for the accuratedetermination of both trace andelevated levels of elements in urine.
REFERENCES
1. Determination of Chromium inSerum and Urine: D. Nixon, J.Butx, S. Ekdahl, M. Burritt, K.Neubauer; PerkinEmer, Inc., Appli-cation Note: D-6365A, (2002):http://las.perkinelmer.com/content/ApplicationNotes/APP_ICPMassChromiumInSerumUrine.pdf
2. Determination of Selenium inSerum and Urine: D. Nixon, J.Butx, S. Ekdahl, M. Burritt, K.Neubauer, R. Wolf; PerkinEmer,Inc., Application Note: D-6420,(2000):http://las.perkinelmer.com/content/ApplicationNotes/APP_ICPMassSeleniumInSerumUrine.pdf
3. Determination of Vanadium inSerum and Urine: D. Nixon, J.Butx, S. Ekdahl, M. Burritt, K.Neubauer; PerkinEmer, Inc., Appli-cation Note: D-6456A, (2003):http://las.perkinelmer.com/content/ApplicationNotes/APP_ELANDRCVanadiumInSerum.pdf
4. Speciation of Five Arsenic Com-pounds in Human Urine by ICP-MS: W. Reuter, L. Davidowski, K.Neubauer, J. Di Bussolo; PerkinE-mer, Inc., Application Note: D-6736, (2003):http://las.perkinelmer.com/content/ApplicationNotes/APP_SpeciationFiveArsenicCompounds.pdf
5. Analysis of High Purity Acids UsingDynamic Reaction Cell ICP-MS: D.Bollinger, A. Schleisman, At. Spec-trosc. 20(2), 60 (1999).
TABLE IIIResults for the Normal-Level
UTAK® Freeze-Dried Urine SRM
Analyte Reported Expected(Mass) Value Range
(µg/L) (µg/L)
*Arsenic as AsO (91) 9.2 8 to 11
*Chromium (52) 1.1 1.0 to 1.4
*Cobalt (59) 1.8 1.4 to 2.0
*Copper (65) 118 100 to 136
Lead (208) 0.56 0.5 to 0.7
*Manganese (55) 3.2 2.5 to 3.3
Molybdenum (98) 76 60 to 82
*Vanadium (51) 0.69 0.5 to 0.7
Zinc (66) 842 666 to 900
* Elements determined in DRC mode.All other elements determined in standard mode.
TABLE IVResults for the High-Level
UTAK® Freeze-Dried Urine SRM
Analyte Reported Expected (Mass) Value Range
(µg/L) (µg/L)
Aluminum (27) 35 32-44
*Arsenic as AsO (91) 99 88-116
Cadmium (114) 5.0 4.2-5.6
*Chromium (52) 7.6 6.3-8.5
*Copper (65) 171 143-193
Lead (208) 132 111-150
*Manganese (55) 3.9 3.0-4.0
Molybdenum (98) 98 75-101
*Vanadium (51) 10.8 9-12
Zinc (66) 1128 1112-1504
* Elements determined in DRC mode.All other elements determined in standard mode.
TABLE IIReaction Gases and Gas Flows Used With the Cell RPq Values for the
Determination of As, Cr, Co, Cu, Mn, V in UTAK® Normal and High Level Freeze-Dried Urine SRMs, Using DRC Mode
Analyte Reaction Gas Flow DRC Setting (Mass) Gas (mL/min) (RPq Value)
Arsenic Oxide (91) Oxygen 0.7 0.65Chromium (52) Ammonia 0.7 0.75Cobalt (59) Ammonia 0.7 0.75Copper (65) Ammonia 0.7 0.75Manganese (55) Ammonia 0.7 0.75Vanadium (51) Ammonia 0.7 0.75
Vol. 31(5), Sept./Oct. 2010

170
*Corresponding author. E-mail: [email protected]
The Determination of Elements at Sub-ppbConcentrations in Naphtha Mixtures
Using the NexION 300 ICP-MSStan Smitha*, Monica Bolchib, and Riccardo Magarinib
a PerkinElmer, Inc., Oak Brook, IL 60523 USAb PerkinElmer, Inc., Monza, Italy
ABSTRACT
The analysis of organic sol-vents by ICP-MS is challengingdue to their high carbon contentand volatility. Naphthas are animportant class of organic liquidsproduced in the petrochemicalindustry, byproducts of thecrude-oil refining process.Because they are organic-basedand have a variety of composi-tions, naphthas present a specialchallenge for ICP-MS analysis: thecarbon causes polyatomic inter-ferences and can clog interfacecones. The varying volatilitymeans that it is difficult to use asingle set of calibration standardsfor a variety of different naphthacompounds. Using the NexION®300 ICP-MS, several naphthacompounds (ranging from lightto heavy naphthas) were success-fully analyzed using a single setof calibration standards and oper-ating conditions, demonstratingthe accuracy and stability of themethod.
chains ranging from C5 to C13 anda boiling point range from as low as27 oC to as high as 260 oC. Thereare many types of naphthas withnumerous common and brandnames that can be quite confusing.In general, naphthas can be differ-entiated by their hydrocarbon frac-tions; the most commonlyreferred-to fractions include paraf-fins (a.k.a. normal alkanes),isoparaffins (a.k.a. branched alka-nes), olefins (a.k.a. alkenes), naph-thenes (a.k.a. cyclic alkanes), andaromatics. Lighter naphthas tend tocontain high percentages of paraf-fins, whereas heavier naphthas maycontain high percentages of naph-thenes and aromatics.
Analysis of naphthas for traceelements is important for a numberof reasons. Naphthas are used asfuel in combustion engines whereelements such as calcium, magne-sium, sodium, and potassium canform hard deposits and createexcessive wear on the engine com-ponents. Naphthas are also used asfeedstock in catalytic reformerswhich rearrange the hydrocarbonmolecules as well as break some ofthe molecules into smaller mole-cules to produce high-octane com-ponents of gasoline. In addition,naphthas are used as feedstock forsteam reformers and steam crackersfor the production of hydrogen.Elements including nickel,vanadium, and mercury have beenshown to poison the catalyst orcause corrosion in these systems.Some elements are of environmen-tal concern. Emission from combus-tion engines and the refiningprocess can release heavy metalsinto the atmosphere. As such, mon-itoring of elements such as arsenic,mercury, and lead is important.
chilling the spray chamber andhence reducing the vapor loadingon the plasma. The carbon deposi-tion can be eliminated by the addi-tion of oxygen into the nebulizerstream. The formation of interfer-ing polyatomics can be addressedwith the use of reaction gases in aDynamic Reaction Cell™ (DRC™).
Naphtha is a relatively genericterm referring to a broad range ofmiddle-distillate hydrocarbon mix-tures typically produced by petro-leum refineries from crude oil.Naphthas represent that fraction ofcrude oil that falls between thelight gases and the heavierkerosene and may have carbon
Atomic SpectroscopyVol. 31(5), Sept./Oct. 2010
INTRODUCTION
The determination of trace met-als in organic matrices, such asnaphtha, by inductively coupledplasma mass spectrometry (ICP-MS)has historically been very difficult.ICP-MS technology has the sensitiv-ity and multi-element capabilitiesdesired, but there are many hurdlesthat must be overcome. Volatileorganic liquids pose a challenge byoverloading the plasma with vaporsfrom the solvent, which can reducesensitivities, destabilize or evenextinguish the plasma. The extremelyhigh carbon content in solventsresults in deposition of carbon par-ticles or soot on the sampler cone,occluding the orifice and causingsignal drift. The excessive carbonalso creates interferences from car-bon-based polyatomic species suchas 12C14NH+ and 13C14N+ whichinterfere with 27Al+ and 40Ar12C+
which interferes with 52Cr+. Each ofthese issues must be addressed forthe successful application of ICP-MS to the analysis of naphthas.
There are a number of measuresthat can be implemented to over-come the issues mentioned above.Wet ashing organic samples decom-poses the organic matrix and ulti-mately solubilizes the elements inan aqueous matrix. However, thisprocedure is time-intensive andinvolves significant manipulation ofthe samples, which provides oppor-tunities for contamination and ele-ment loss. Direct analysis can be amuch more efficient and accuratetechnique when the matrix issuesare addressed. The vapor pressureof the solvents can be lowered by

171
This work demonstrates the abil-ity of the PerkinElmer® NexION®300 ICP-MS (PerkinElmer, Inc., Shelton, CT, USA) to successfullyanalyze several naphtha compounds(ranging from light to heavy naph-thas) under a single set of instru-mental conditions. Carbon-basedinterferences are removed, provid-ing accurate results, and stability isdemonstrated through repeatedanalysis of a single sample overtime. This initial work wasperformed with a limited numberof elements, but will be extendedin the future.
EXPERIMENTAL
Sample Preparation
For this study, three differentnaphthas were used. Two of thenaphthas were similar and repre-sented the light naphthas: petro-leum ether (Burdick & Jackson®)and ligroin (Aldrich®), with boilingpoint ranges between 35–60 oC and60–80 oC, respectively. The thirdnaphtha, Stoddard solvent (EMDChemicals®), is a heavier naphthawith a boiling-point range of154–202 oC. Such a wide array ofhydrocarbon composition and boil-ing point ranges can pose a signifi-cant challenge when trying to
analyze such an assortment ofnaphthas in the same run. Two sig-nificant issues that need to beaddressed are creating adequatesample introduction conditions toeffectively handle the range ofnaphthas and calibration.
Because of the complicationsassociated with analyzing naphthason ICP-MS, Method of StandardAdditions (MSA) is often used. WithMSA, each and every sample isspiked with varying concentrationsof target elements to create a cali-bration within the sample matrix.However, this is a tedious and time-consuming process. The use of anexternal calibration would be muchmore efficient but typically doesnot work well with such a challeng-ing matrix. Two procedures wereimplemented to address the matrixeffects: chilling of the spray cham-ber and dilution of the naphthas inanother solvent.
The diluent was semiconductor-grade xylene (mixed isomers),which was also used as the rinse.Xylene was used as a diluent as it isin the same carbon chain group asnaphthas (C8), is readily misciblewith naphthas and the calibrationsolutions, and has a similar boilingpoint range (137–144 oC), at least
to the heavier naphtha, Stoddardsolvent. The use of semiconductor-grade solvent ensured that thenaphtha samples would not be con-taminated with elements of inter-est, as well as ensuring a cleanblank. Because commercial calibra-tion standards are not currentlyavailable in a naphtha or xylenematrix, organometallic standardsfrom Conostan® were used, follow-ing dilution with the xylene. Conos-tan’s oil analysis standards, bothmixed and single-element, rangingin concentration from 100 to 1000 µg/g in 75 centistoke basemineral oil, were diluted in thexylene. Because of the high stockconcentrations, the dilution factorsneeded to produce the workingcalibration standards was such thatthe working standards matrix wasmore than 99.99% xylene which, aspreviously stated, is relatively simi-lar to naphthas. The external cali-bration curves were comprised ofstandards at 0.2, 1, and 10 µg/L.The naphtha samples themselveswere diluted 1:10 in the xylene.This dilution factor was sufficientto homogenize the matrixvariations while still allowing forsub-ppb detection limits. All sam-ples and standards were spikedwith internal standards (Li, Y, In,and Bi) at 10 µg/L.
Instrumental Parameters
A NexION™ 300D ICP-MS wasused to perform all analyses; theinstrumental conditions are listed inTable I. Carbon-based interferencesinclude 12C12C+, 12C14NH+, 40Ar12C+,and 40Ar16O+ on 24Mg+, 27Al+, 52Cr+,and 56Fe+, respectively. Ammoniawas used to remove these interfer-ences; Table II shows the cell con-ditions used.
TABLE INexION 300D ICP-MS Instrumental Conditions
Sample Uptake Rate 200 µL/minPeristaltic Pump Tubing Viton®Nebulizer Glass concentricSpray Chamber PC3 LT with
baffled glass cyclonicSpray Chamber Temperature –20 °CO2 Flow 25 mL/minInjector 0.85 mm QuartzRF Power 1600 WDwell Time 50 msSweeps/Reading 20Replicates 2Modes DRC (NH3) and Standard
Sample Run Time 1.7 min/sample
TABLE II. Reaction Cell Conditions
Element Cell Gas Gas Flow RPq(mL/min)
Al 27 NH3 0.6 0.60Cr 52 NH3 0.6 0.65Fe 56 NH3 0.6 0.45
Vol. 31(5), Sept./Oct. 2010

172
Because of the high organic con-tent and volatility of the samples,several modifications were made to the standard sample introductionsystem. The sample uptake rate was 200 µL/min, using range/ yellow Viton® pump tubing and aperistaltic pump speed of 10 rpm.The spray chamber was drainedwith black/black Viton® tubing.
The sample was aspiratedthrough a glass Meinhard® nebu-lizer into a PC3-LT Peltier-cooledglass spray chamber (Elemental Sci-entific, Inc., Omaha, NE, USA) at–20 oC to eliminate the solventvapor loading on the plasma bylowering the vapor pressure of thenaphthas. Chilling the spray cham-ber also helps to stabilize theplasma conditions while analyzingthe various naphthas. Conditions at2 oC and –5 oC were evaluated onthe ESI PC3, but it was only withthe ESI PC3LT at –20 oC that thenaphthas generated consistentresults, as determined by recoveriesof internal standards. Even at –20 oC,when the naphthas were run with-out dilution, there were significantdifferences in the plasma con-ditions (e.g., plasma flicker), inter-nal standard recoveries, and signalsuppression. However, with the1:10 dilution in xylene, there wereno noticeable differences in theplasma conditions and internal stan-dard recoveries were consistent.
Introduction of oxygen into thenebulizer stream can be used toeffectively prevent the buildup ofnon-ionized carbon on the interfacecones, primarily the sampler cone.The oxygen flow was controlledwith a mass flow controller andwas introduced via a port in theoutlet of the spray chamber. Thecorrect oxygen flow was determinedby increasing the flow until theSwann bands disappeared in theplasma, as viewed through the NexION’s plasma view window(Figure 1). Delivering the optimumflow of oxygen is important as too
little will allow the formation ofcarbon on the cones and too muchcan destabilize the plasma as wellas speed up the devitrification ofthe quartz torch and create a morecorrosive environment for thecones. An additional effect ofexcess oxygen is that the formationof oxides is increased, particularlyfor easily oxidized elements such asHg. This may result in significantlyreduced intensities as the observedm/z ratio is shifted to that of theoxides. The amount of oxygenneeded is, in part, dependent onthe carbon chain length – that is,the longer the carbon-chain length,the more oxygen is needed. Theplasma-view window allows for theaccurate determination of just theright amount of oxygen.
To further reduce carbon load-ing on the plasma, a 0.85-mm injec-tor was used. Platinum cones werechosen to withstand the corrosiveenvironment created by oxygenaddition.
RESULTS AND DISCUSSION
Since no commercial standardreference materials are available fornaphtha, the efficacy of the methodconditions was demonstrated byspiking each of the three naphthaswith target elements at low concen-trations (0.2 – 1.0 µg/L) after 10xdilution with xylene. The methoddetection limits in the naphthaswere determined by measuringeach spiked sample seven timesand multiplying the standarddeviation by 3.14 (the t-value for6 degrees of freedom). Table IIIshows the detection limits (DLs) for the three samples (Stoddard Sol-vent, Ligroin, and Petroleum Ether).Tables IV–VI show 5 µg/L spikerecovery data for all three samples.
Fig. 1. Plasma view on the NexION™ 300 ICP-MS.

173
TABLE IIIDetection Limits in Naphtha Solvents (ng/g)
Element Mass Stoddard Ligroin PetroleumSolvent Ether
V 51 0.200 0.015 0.012
Mn 55 0.038 0.031 0.017
Ni 58 0.062 0.017 0.015
Cu 63 0.080 0.015 0.017
Se 82 0.150 0.051 0.043
Cd 114 0.036 0.031 0.017
Sn 120 0.084 0.025 0.012
Ba 138 0.067 0.022 0.018
Hg 202 0.170 0.022 0.015
Pb 208 0.044 0.017 0.017
Al* 27 0.017 0.048 0.025
Cr* 52 0.030 0.040 0.012
Fe* 56 0.025 0.024 0.017
* = DRC mode.
TABLE IVSpike Recoveries in Petroleum Ether
Element Mass Solvent Spike %Recovery(µg/L) (µg/L)
V 51 0.00 6.45 129
Mn 55 0.22 5.15 98.6
Ni 58 0.11 5.24 103
Cu 63 0.05 4.76 94.2
Se 82 0.00 5.41 108
Cd 114 0.10 5.35 105
Sn 120 0.01 5.63 112
Ba 138 0.01 4.74 94.6
Hg 202 0.02 5.28 105
Pb 208 0.03 4.81 95.6
Al* 27 0.21 6.15 123
Cr* 52 0.00 6.15 123
Fe* 56 0.05 6.54 130
* = DRC mode.
TABLE VSpike Recoveries in Ligroin
Element Mass Solvent Spike %Recovery(µg/L) (µg/L)
V 51 0.01 6.18 123
Mn 55 0.28 5.16 97.6
Ni 58 0.20 5.30 102
Cu 63 0.11 5.00 97.8
Se 82 0.07 5.40 106
Cd 114 0.21 5.16 99.0
Sn 120 0.08 5.36 106
Ba 138 0.02 4.82 96.0
Hg 202 0.06 5.00 98.8
Pb 208 0.03 4.90 97.4
Al* 27 0.24 5.24 100
Cr* 52 0.01 5.56 111
Fe* 56 0.08 5.84 115
*= DRC mode.
TABLE VISpike Recoveries in Stoddard Solvent
Element Mass Solvent Spike %Recovery(µg/L) (µg/L)
V 51 0.01 5.06 101
Mn 55 0.06 4.97 98.2
Ni 58 0.02 4.83 96.2
Cu 63 0.03 4.64 92.2
Se 82 0.06 4.66 92.0
Cd 114 0.01 5.07 101
Sn 120 0.06 4.91 97.0
Ba 138 0.01 4.82 96.2
Hg 202 0.02 4.87 97.0
Pb 208 0.01 4.85 96.8
Al* 27 0.07 4.82 95.0
Cr* 52 0.00 4.86 97.2
Fe* 56 0.01 4.87 97.2
* = DRC mode.
Vol. 31(5), Sept./Oct. 2010

174
The stability of the method wasdemonstrated by monitoring recov-eries of the internal standards overtime. Each of the naphthas, diluted1:10 in xylene, was analyzedrepeatedly over time, using xyleneas the rinse between replicate mea-surements. Long-term stability isshown in Figure 2, with the resultsof normalized intensities frompetroleum ether, a light naphtha,over a 2.5-hour period. Muchlonger stability is possible.
CONCLUSION
This work has demonstrated that the PerkinElmer NexION® 300ICP-MS is an ideal instrument fortrace-level metals analysis of com-plex and highly variable naphthasolvents. Robust, high-powerplasma conditions, along with achilled spray chamber, are able toeasily handle the solvent matrix and provide excellent stability. The plasma-view window allowsfor simple determination of theoptimum oxygen-addition flow toprevent carbon deposits. The com-bined Triple Cone Interface andQuadrupole Ion Deflector create atightly focused ion beam with unri-valed reduction of neutral species,photons, and particulate deposits.Polyatomic species, particularlythose based on carbon, are all buteliminated with the use of the Uni-versal Cell Technology™ in DRCmode. With this combination offeatures, excellent detection limitsand stability can be achieved withminimal sample handling. Underone set of operating conditions,complex organic liquids such asnaphtha solvents, can be analyzed.Future work will focus on extend-ing the number of elementsanalyzed in naphthas.
Fig. 2. 2.5-hour stability of petroleum ether.

Concepts, Instrumentation and Techniques inAtomic Absorption SpectrophotometryAuthors: Richard D. Beaty and Jack D. KerberOrder No. AA-914C (free of charge)Ordering information: http://www.las.perkinelmer.com or contact your localPerkinElmer representative.
This book contains theoretical concepts and definitions of the science of atomic spectroscopy:atomic emission, atomic absorption, and atomic fluorescence. It also discusses high sensitivitysampling systems and the advantages and limitations of the cold vapor mercury, hydridegeneration, and graphite furnace atomic absorption techniques. Also discussed are spectral and non-spectral interferences, including the goals and use of thestabilized temperature platform furnace (STPF) system.
Concepts, Instrumentation and Techniques in Inductively Coupled Plasma Optical Emission SpectrometryAuthors: Charles B. Boss and Kenneth J. FredeenOrder No. 005446B (free of charge)Ordering information: http://www.las.perkinelmer.com or contact your localPerkinElmer representative.
This book presents the general characteristics of ICP-OES and ICP-OES instrumentation. Itdiscusses ICP-OES methodologies including their application for the analysis of samples in thevarious industries such as agriculture and foods, biological and clinical, geological,environmental and water, metals, and organics.
Available in pdf format only.
Books on the AAS, ICP-OES, ICP-MS Techniques
Vol. 31(5), Sept./Oct. 2010


Order Subscriptions and/or Articles On-Line
Vol. 31(5), Sept./Oct. 2010

009055_05
PerkinElmer, Inc.710 Bridgeport AvenueShelton, CT 06484-4794 USAPhone: (800) 762-4000 or (+1) 203-925-4602www.perkinelmer.com
Vol. 31(5), Sept./Oct. 2010