Improving Social Assistance in Armenia - World Bank Group
170
Report No. 19385-AM Improving Social Assistance in Armenia June8,1999 Human Development Unit Country Department III Europe and Central Asia Region Documentof the World Bank Public Disclosure Authorized Public Disclosure Authorized Public Disclosure Authorized Public Disclosure Authorized
-
Upload
khangminh22 -
Category
Documents
-
view
4 -
download
0
Transcript of Improving Social Assistance in Armenia - World Bank Group

Report No. 19385-AM
Improving SocialAssistance in Armenia
June 8,1999
Human Development UnitCountry Department IIIEurope and Central Asia Region
Document of the World Bank
Pub
lic D
iscl
osur
e A
utho
rized
Pub
lic D
iscl
osur
e A
utho
rized
Pub
lic D
iscl
osur
e A
utho
rized
Pub
lic D
iscl
osur
e A
utho
rized

ABBREVIATIONS AND ACRONYMS
ACBA Agriculture Credit Bank of ArmeniaASIF Armenia Social Investment FundBBP Basic Benefit PackageCAS Country Assistance StrategyCIS Commonwealth of Independent StatesECHO European Community Humanitarian OfficeFAR Fund for Armenian ReliefFBS Family Budget SurveyFSU Former Soviet UnionGDP Gross Domestic ProductGOA Government of ArmeniaHAC Humanitarian Assistance CommissionHACC Humanitarian Aid Coordination CommissionHBS Household Budget SurveyHES Health and Education SurveyIDA International Development AssociationIMF International Monetary FundJMP Jinishian Memorial ProgramMA Mission ArmeniaNGO Non-governmental Organization(s)OECD Organization for Economic Cooperation and DevelopmentPAYG Pay-As-You-GoSDS Armenian State Department of StatisticsSSC Social Services CenterUNHCR United Nations High Commissioner for RefugeesUNICEF United Nations Children's FundUSAID United States Agency for International DevelopmentVAT Value Added TaxWFP World Food ProgramYICRD Yerevan Institute of Computer Research and DevelopmentYSU Yerevan State University
Vice President Johannes Linn, ECAVPCountry Director Judy O'Connor, ECCO3Sector Manager Michal Rutkowski, ]ECSHDTask Team Leader Alexandre Marc, ECSHD
ACKNOWLEDGEMENTS
The preparation of the report was managed by Alexandre Marc (Sr. Human ResourcesSpecialist). Margaret Grosh (Sr. Economist) was responsible for the research work ontargeting which she carried out in collaboration with Elena Glinskaya (Consultant), and wasthe main author of the chapter on targeting of social assistance. Ruslan Yemtsov (Economist)was. responsible for the poverty profile based on the household survey and other quantitativesurvey sources. Ruslan collaborated with Ghislaine Delaine (Sr. Statistician) who organizedand supervised the analysis of the household survey results. Gillian Perkins (HumanResources Specialist) prepared the section on "other targeting options" and helped with theoverall report preparation. Elizabeth Gomart (Consultant) was responsible for all thequalitative research. Ruslan and Elizabeth were the main authors for Chapter 1 of the study.The report benefited greatly from the assessment directed by Aleksandra Posarac (Sr. SocialProtection Specialist) on the family benefit program and on the review of the social protectionsystem carried out by Babken Babajanian (Social Protection Specialist). The report alsobenefited from the advice and guidance of Ana Revenga (Sr. Economist) and JeanineBraithwaite (Economist). Hiwote Tadesse (Program Assistant) helped in producing the finalreport. The peer reviewers were Polly Jones (Program Coordinator) and Kalanidhi Subbarao(Principal Economist). The Sector Leaders are Michal Rutkowski and Maureen Lewis, andthe Sector Director Chris Lovelace. The Country Director is Judy O'Connor.
The Bank team collaborated very closely with researchers and policy makers inArmenia and would like to thank in particular Julia Magluchants and Astkhik Mirzakhanyanwho prepared the poverty analysis and the poverty profile, Hranush Kharatyan and the teamof social scientists who participated in the social assessment work, and Sasun Tsirounian, EvaGiulnazarian and Astkhik Minasian who participated in the institutional assessment. Thereport benefited greatly from the comments of Mr. Gagik Yeganian, Minister of SocialSecurity and Mr. Vahram Avanessyan, Minister of Economic Reforms.

TABLE OF CONTENTS
EXECUTIVE S UMMMAIY ................................................................ i
INTRODUCTION ................................................................ 1
1. RECENT EVOLUTION OF POVERTY ................................................................ 3
THE POVERTY PROFILE IN 1993-94 ........................................................................... 3SUMMARY OF CHANGES FROM 1993-94 TO 1996-97 ........................................................................... 5THE POVERTY PROFILE IN 1996-97 ........................................................................... 6CHARACTERISTICS OF THE POOR ............................................................................ 8SOURCES OF INCOME ........................................................................... 13
ACCESS TO BASIC SERVICES ........................................................................... 17
SOCIAL EXCLUSION ........................................................................... 2 1
2. THE ROLE OF SOCIAL ASSISTANCE IN A POVERTY REDUCTIONSTRATEGY ................................................................ 25
THE FUNDAMENTAL IMPORTANCE OF SUSTAINING ECONOMIC GROWTH ............................. ............................... 25THE ROLE OF LABOR MARKET POLICIES AND EMPLOYMENT-GENERATING PROGRAMS .............. ......................... 26THE ROLE OF EDUCATION ........................................................................... 29THE ROLE OF SOCIAL INSURANCE ....................................................................... . .. 30
THE ROLE OF SOCIAL ASSISTANCE ........................................................................... 32
3. IMPROVING SOCIAL ASSISTANCE TO PROTECT THE POOR ...................... 35
THE STATE-RUN SOCIAL ASSISTANCE SYSTEM ........................ ................................................... 35NGO PROGRAMS ........................................................................... 38THE STATUS OF THE SOCIAL ASSISTANCE REFORM ..................................... ...................................... 39
THE R O LE OF THE FAMILY BENEFIT ........................................................................... 41
MANAGING THE D ECREASE IN HUM ANITARIAN ASSISTANCE ........................................................................... 41
THE NEED TO STRENGTHEN OUTREACH ........................................................................... 42
4. TARGETING MECHANISMS FOR SOCIAL ASSISTANCE PROGRAMS ........ 45
THE ROLE OF TARGETING IN SOCIAL ASSISTANCE PROGRAMS .......................................................................... 45
PAROS, HUMANITARIAN ASSISTANCE AND THE FAMILY BENEFIT.... ................................................................ 47
REFINING AND REFORMING PAROS FOR USE FOR THE FAMILY BENEFIT ............................................................ 56THE FUTURE OF PROXY MEANS TESTING IN ARMENIA .......................................... ................................. 63OTHER TARGETING OPTIONS ........................................................................... 64
CONCLUSION ................................................................ 69
BIBLIOGRAPHY ................................................................ 73

ANNEXES
Annex 1 Main Results from the Household Budget Survey (Statistical Tables)Annex 2 Measuring Poverty in ArmeniaAnnex 3 The Armenian Labor Market: Adjustments and MisalignmentsAnnex 4 Fiscal Sustainability of Family BenefitAnnex 5 Executive Summary of the Study of the Poorest of the PoorAnnex 6 Methodology for PAROS assessmentAnnex 7 Executive Summary of the PAROS Beneficiary AssessmentAnnex 8 SSCs: Evaluation of Institutional Capacity
TABLES
Table 1 Poverty Indicators for ArmeniaTable 2 Characteristics of the Poor by Labor Market StatusTable 3 Income Sources and InequalityTable 4 UJnemployment BenefitsTable 5 Government Expenditures on Child Allowances and Social TransfersTable 6 Food Aid Assistance to ArmeniaTable 7 Emergency and Relief AssistanceTable 8 FBasic Targeting MechanismsTable 9 Basic Paros Results by DecileTable 10 Flaros and Per Capita Consumption DecilesTable 11 Incidence of Different ProgramsTable 12 Results of Modifications to ParosTable 13 Results of Different Targeting FormulasTable 14 P'overty and Inequality Indicators by MarzTable 15 Incidence, Depth and Severity of Poverty by Altitude (for rural areas only)Table 16 Poverty Incidence (among individuals) by Location of Households
FIGURES
Figure 1 Poverty by LocationFigure 2 Education Level by Poverty GroupsFigure 3 Structure of Household Incomes by Poverty GroupsFigure 4 Structure of Expenditures by Consumption DecilesFigure 5 Percentage Reduction in Relative Poverty for Various Models

EXECUTIVE SUMMARY
In recent years Armenia has made significant progress in reforming its economy,restoring a sustainable path for growth and maintaining macro-economic stability. Despitethese advances the recovery remains fragile. Although overall living standards have improvedsince 1994, poverty is still widespread and little or no impact has been made on the incidenceof extreme poverty. It is urgent, therefore, to assess how the government's poverty reductionstrategy can be made more effective and to identify the role social assistance can play in thisarea. The objectives of this study are to understand better the changes in poverty since 1994,to reassess options and priorities for the government's poverty reduction strategy, and toprovide recommendations on improving the poverty focus of social assistance programs.
After the sharp descent into poverty from 1992 to 1994, when the vast majority of thepopulation experienced conditions of absolute poverty, some improvement in livingconditions has been achieved. The average wage doubled in real terms between 1994 and1996 and substantial increases were achieved in the proportion of households with electricityand piped water. Nevertheless, poverty in Armenia remains widespread and severe. From the1996/97 Household Budget Survey, about 55% of the population were estimated to be livingin poverty and 28% percent of the population were under the food line. The average wage wasstill only one-third of its 1992 level. Vulnerability to poverty also continued to be high, withmany households moving in and out of poverty. The trend of rapidly increasing inequalityappeared to have stabilized since 1994 but remained very high. In 1996/97, per capitaconsumption was still 18 times higher in the top decile than for the poorest 10%.
The poverty correlates typical of market economies are still not evident in Armenia.The correlation between poverty and unemployment was found to be stronger than in 1994,but still very weak in comparison with non CIS countries. Although the unemployed have thehighest incidence and depth of poverty, the largest number of poor are the working poor.Because of the low level of public sector wages, the large number of workers onadministrative leave without pay, and the high prevalence of part time work, employmentdoes not guarantee sufficient earnings to support a family. Education remains a relatively poorpredictor of poverty as those with a high level of education are only slightly less likely to bepoor. Overall, the urban population continues to be poorer than the rural population; however,in contrast to 1994, the incidence of extreme poverty was found to be higher in rural than inurban areas, suggesting that agriculture has become less effective as a safety net for the ruralpopulation. There appears now to be a link between household size and poverty but theevidence is not very strong. Some groups that would intuitively be considered as poor havenot fared worse than the rest of the population; for example, refugees and pensioners livingalone were found to have slightly lower than average risk of poverty.
The primary reasons households remain poor include inactivity through lack ofremunerated employment opportunities or assets for investment in private activities, lowwages, lack of mobility, poor health and physical isolation. Unemployment is not only high,at 25 percent as measured by SDS surveys in 1996/97, it is also stagnant. Half of the

-ii-
unemployed have been without work for more than a year. Recent job creation has beenconcentrated mostly in self- employment and informal activities. At the same time, because oflow wages, employment does not necessarily protect families against poverty. Salariesconstitute a mere 13% of average current income of the population-the same share as privatetransfers and remittances from abroad (13% each). Seasonal labor migration to other CIScountries has become an extremely important income source for Armenians. Heavy relianceof the population on irregular sources of income, from private transfers, humanitarian aid andremittances, means that households undergo drastic extremes of income depending on thetiming of the receipt. State transfers, as well as the declining institutional transfers ofhumanitarian aid, have not been targeted effectively to the poor and have therefore had a verylimited impact on poverty reduction.
Evidence from the qualitative assessment indicates that social exclusion is increasingin Armenia and is closely linked to extreme poverty. The lack of a strong social network is asignificant determinant of poverty. This is most likely to affect people with weak kinship ties,such as orphans and households composed of single parents. However, social exclusion is alsorelated to lack of mobility, to poor health, and to psychological passivity due to repeatedfailure to integrate into the labor market or a support network.
The recent evolution of poverty implies the need for review by the government of itspoverty reduction strategy. As poverty is still primarily a transitional phenomenon, affectingmore than half the population, the main pillar of a poverty reduction strategy remains theacceleration of economic growth. For this purpose, further efforts are needed to increasepublic and private savings and to promote private investment. The restructuring of the, publicsector needs to move forward, as do reforms in the judicial and legal systems. In man,ysectors, reforms should be deepened to increase transparency, reduce distortion and strengthencapabilities, to restore viability of the energy, water and transport sectors, and to meet thehuman capital requirements for economic growth.
When unemployment and low wages are primary reasons for poverty, the labor marketshould play an important role in reducing poverty and inequalities. Existing labor marketregulations, however, are not creating major rigidities. An important question asked by manypolicymakers today is the potential role of proactive labor market policies to stimulate growthand employment. Under present economic conditions in Armenia, neither job subsidies nortraining and retraining programs are likely to be effective in facilitating job creation. Morecould be done, however, in the areas of microcredit, support to self employment, and publicworks. Recent experience, in particular of the Agriculture Credit Bank of Armenia (ACBA),has demonstrated that micro credit programs can be successful when designed well, withminimal subsidies, and administered by competent financial institutions. Public worksprojects have already been successfully implemented in Armenia, with IDA (ASIF) and WFPsupport, with the objectives of stimulating the local economy through the use of smallcontractors and improving social infrastructure. However, with the exception of a few pilots,the potential of public works which have the primary objective of creating employment inlabor intensive activities has not yet been thoroughly explored.
Social insurance programs, in particular old age pension and unemployment benefits,do not offer effective tools to provide protection from poverty in the short term becausesavings levels are very low, the levels of benefits are consequently very low, and the poor arenot well targeted. In the long term, however, if the ongoing reformns are maintained, the

-iii-
pension system could become a more efficient tool for preventing poverty among the elderly.Unemployment benefits cannot be efficient while the informal economy continues to prevail,which will probably be the case for a long time in Armenia. Another important area of thegovernment's poverty reduction strategy is the protection of access to quality social servicesfor the poor. In this area, deepening the social sector reforms will be very important, inparticular strengthening primary health care services and general education. Additionalmechanisms are needed to target health programs and education subsidies to the poor.
In this context, social assistance is one of the very few instruments available to protectthe poor not benefiting from economic growth in the short and medium term. Socialassistance objectives should be to protect the poorest of the poor and the most vulnerablegroups from becoming socially excluded. For such a strategy, targeting becomes crucial.Social assistance should not create or promote dependence on charitable support but providemeans by which those who have been marginalized can reenter society. This presents anenormous challenge for Armenia because (i) the approach is contrary to the Soviet principlesof social assistance on which values and expectations still tend to be based, (ii) both publicand private resources are severely limited, and (iii) the large scale of the informal economymakes it extremely difficult in practice to identify the poor. Until introduction of the FamilyBenefit in January 1999, the state-run system of social assistance-including cash transfers(child allowances and social pensions), residential institutions for a variety of vulnerablegroups, and some very limited outreach programs for the elderly and handicapped-has notbeen poverty targeted.
NGOs play an important and positive role in delivery of programs that strengthensocial safety nets in some Eastern European countries such as Poland and Hungary. The roleof NGOs and the private sector (foundations and private donations, mostly from the Diaspora)is also growing in Armenia. Most of the local and international NGO groups were created inthe aftermath of the earthquake of 1988. More than 1,200 NGOs are now registered, active inareas of elderly and nursing care, child support, employment generation activities, protectionof refugees and the disabled. Most operate on a very small scale, hampered by limited funds.State collaboration is still at the embryonic stage. NGOs are often viewed more as competitorsthan collaborators. The legal framework for NGOs is still incomplete and unfriendly.
Aware of the system's shortcomings, the government has embarked on the reform ofsocial assistance. In December 1997, a decree was passed to replace child allowances andother social benefits with a family benefit targeted to the poor. The introduction of this newbenefit in January 1999 represents a major shift from the categorical system, oriented tosocially deserving members of society, to a system focusing on protecting the poor. Otheractions have been taken to improve outreach, train social workers and improve the capacity ofthe social services centers. Reforms need to be deepened to create an adequate institutionalframework to deliver the targeted programs and to use humanitarian assistance moreeffectively. Outreach could be improved by increasing the role of elected local governmentsand NGOs in the design and delivery of social assistance programs and by strengtheningpartnerships with state structures. In addition, incentive systems needs to be improved, both toencourage social assistance centers to perform outreach activities and to encourage familiesand communities to support the poor and minimize dependence on the state.
To target the new family benefit, the government plans to use the Paros proxy meanstesting system. This system, introduced in Armenia in 1994 to improve the targeting of

-iv-
humanitarian assistance, was the first proxy means testing system adopted in Eastern Europeand Central Asia (though Russia is now experimenting with it on a pilot basis). The targetingperformance of the Paros system has been evaluated using the results of the HouseholdBudget Survey. About 71% of Annenian households report they were registered with Paros inthe fall of 1996. Registration by decile shows very little self selection in the system. E]rrors ofexclusion were found to have essentially three causes: barriers in registration for the poor;problems with measurement of proxies; and informal procedures used by social workers topre-screen beneficiaries before registering them. Errors of inclusion were related to thedifficulty of using proxies in the Armenian context and the lack of home visits for the purposeof control.
Many changes can be made in the system to improve targeting of the poor. It appearsthat changing the proxy formula would provide some improvements, and that changing theweight of the indicators used in the existing formula would also improve the targetingoutcome. On the other hand, an increased customization of benefits would not change thetargeting outcome. Several reforms can be introduced to improve the administration of theParos system: decentralize the process of assessing household scores; improve publicinformation on the formula and the registration mechanisms; integrate a more systematicoutreach by the social workers with the help of local governments and NGOs; set up iformaland informal appeal systems; and create a mechanism for program monitoring and evaluation.The family benefit program will also require the development of a streamlined, crediblepayment mechanism, and clear procedures for managers and staff of the social servicescenters, through a unified operational manual and training of social workers. After thesereforms have been introduced and the impact of the targeted family benefit has been aLssessed,more thought should be given to using the proxy means testing system to support otherprograms in health, education or social services.
Alternatives to the proxy means test for poverty targeting are limited. Because of thelocalized nature of poverty in Armenia, geographic targeting could provide anadministratively efficient mechanism for targeting of social sector spending; however, thiswould require more comprehensive and disaggregated data on poverty than are currentlyavailable, at least until the forthcoming census is carried out. The new capitation systems forfinancing of general schools and primary health care will need to take account of the largevariations in poverty rates between districts and communities and incorporate a povertyweighting in the funding formula. Until better data are available, adjustment could possibly bebased on the number of recipient;s of the family benefit in the catchment area. Moreassessment and analysis are also needed to explore the feasibility of community-based,targeting of health and education subsidies, such as the school-based targeting mecharnismrecently introduced to waive textbook rental fees for the poorest pupils.
Considering the limitations to the development of social insurance in the short andmedium term, and the relatively limited scope for interventions in terms of proactive labormarket policies, strengthening social assistance is critical to support the very poor and sociallyexcluded groups that are not in a position to benefit from the impact of growth. A number ofmeasures can be taken to improve targeting and outreach, to ensure that social assistancehelps poor groups integrate into the economy and society, and to prevent undue dependenceon the welfare system. At the same time, the system needs to be closely monitored and remainflexible in order to adapt to an ever changing situation.
INTRODUCTION
The objective of the study is to provide recommendations to the government on thereform of social assistance in Armenia and, in particular, on the introduction of a new familybenefit to be targeted to the poor. The study also presents the results of the most recentanalysis of poverty and the recent evolution of the reform of social protection, to provide thecontext for a better understanding of the reform of social assistance.
In recent years Armenia has made significant progress in reforming its economy,restoring a sustainable path for growth and maintaining macro-economic stability. After yearsof collapse, GDP grew by 5.4 percent in 1994, by nearly 7 percent in 1995, by 5.8 percent in1996 and around 6% in 1997. Despite these advances the economic recovery remains fragile,particularly on the fiscal and external fronts. Restructuring of enterprises has been slow, theeconomy is not yet sufficiently diversified and private sector investments are low. Thissituation has contributed to a lower growth rate than would have been necessary to make amajor impact on poverty reduction. The recent poverty profile shows that, although overallliving standards of the population have improved since the poverty profile of 1994, extremepoverty has not been reduced and inequities remain serious.
The government took important actions in 1996 and 1997 to try and address the povertyissue and initiate comprehensive reforms in the social sectors. Improved targeting allowed thelevel of social benefits to increase in real terms during 1996, despite a decline in total publicexpenditures. A new Pension Law was approved at the end of 1995, laying the basis forcomprehensive reform of the pension system and introducing an increase in the retirementage. In education, the government has taken steps to reallocate spending towards basiceducation, improve the availability of textbooks, and provide more managerial autonomy forschools. In health, the government has adopted a strategy separating the financing andprovision of health care, and has created a State Health Agency charged with purchasinghealth care services from both public and private providers. The 1997 budget for health careintroduced, for the first time, a program budgeting approach based on a Basic Benefit Package(BBP) of services entirely financed by the state, targeted at poor households and at the mostessential services for the improvement of the health of the community.
The pace of reforms decreased during 1997-98, delaying the impact of some of themeasures on poverty reduction. However, the main reason for the small impact that restoredgrowth had on the reduction of poverty has been the lack of employment opportunitiesgenerated. The data of the Household Budget Survey and the social assessment of the Poorestof the Poor confirmed that unemployment and inactivity in Armenia are extremely high byany standard. Growth has not yet resulted in creating jobs on a significant level.
While structural reforms need to be deepened and accelerated, protecting the very poorin the short term will be crucial to avoid the apparition of long term poverty and socialexclusion of the most vulnerable members of society. This requires strengthening reform of
-2-
social assistance and, in particular, improving targeting and outreach. The governmerLt ismaking serious efforts to target some of the programs to the poor more effectively; however,it faces a very serious challenge, considering the large size of the informal sector and the factthat poverty of this magnitude is a recent phenomenon.
In order to protect the poor, the government has decided to introduce a family benefit toreplace most other social assistance cash benefits (child allowances and social pension) and totarget this benefit to the poorest using a proxy means testing system. This is the first countryin the Eastern European and Central Asia Region to introduce at the national level a povertybenefit using proxy means testing for targeting. The amount of funding allocated for thisactivity is also far from negligible in relation to the national budget (15%). The introductionof this poverty benefit is taking place in the framework of an overall reform of the socialassistance system and has become a central element of the social sector reform. It is includedin a program supported by the Structural Adjustment Credit. The government has requestedthe World Bank to provide technical advice and support to help in the introduction of thepoverty-targeted Family Benefit.
In light of the above, the World Bank and the government decided to launch a series ofassessments of poverty and social assistance programs in 1997 and 1998. These studies havebeen based on in-depth data collection efforts that have resulted in improving the data base onpoverty, especially through the release of the results of the 1996-97 Household Budget Surveyand the qualitative assessment of the poorest of the poor. Specific analysis has been carriedout of the Paros program, a national proxy means testing system which was set up in 1994 totarget the distribution of humanitarian assistance and which the government now plans to useto target the family benefit. The objectives of these assessments are: (i) to understand betterthe changes in poverty since the last Poverty Assessment of 1995; (ii) to identify directionsfor the reform of social assistance, in light of the new findings on poverty; and (iii) to improvethe targeting of social programs and benefits. The present report summarizes the findings ofthe recent surveys and research as well as providing recommendations to the government onthe reform of the social assistance system and the introduction of the new poverty benefit.
The first section of the report reviews the recent evolution of poverty, combiningquantitative and qualitative infornation, and identifies characteristics of the poor and theircoping mechanisms. The second chapter reviews the various instruments the government hasat its disposal to reduce poverty. The third chapter discusses the role of social assistance in theshort and medium term. The fourth chapter reviews options for improving targeting of socialprograms and, in particular, of the family benefit introduced in January 1999. The conc ludingsection provides a sumrnary of general recommendations for the poverty reduction strategyand of specific recomnmendations on measures to improve poverty targeting.

1. RECENT EVOLUTION OF POVERTY
1.1 At a time of rapidly changing conditions, assessing the needs and options for measuresto alleviate poverty in Armenia, including improvement of social assistance, depends on closemonitoring of the extent and characteristics of poverty in the country. Who and where are thepoor? How can they be identified? Why are they poor? How do they cope? How do theyperceive their own conditions and problems? What strategies are poor families using to climbout of poverty? Drawing on available quantitative and qualitative information, this Chapterexamines the recent evolution of the poverty profile in Armenia over the period from 1993-94to 1996-97--i.e., from the low point just prior to the economic turnaround through three yearsof sustained economic growth.
1.2 Following some 40 years of steady improvement in living standards during the Sovietera, Armenia experienced the virtual collapse of its economy after independence in 1991. Bythe end of 1993, real wages had fallen to about 6% of their 1991 level and hyperinflationexceeded 1,000 percent, throwing the vast majority of the population into poverty. Livingstandards were further eroded by the removal of subsidies on essential goods and by drasticcuts in government spending on essential services and maintenance of infrastructure. Acomprehensive reform program was introduced early in 1994, successfully stabilizing theeconomy and restoring economic growth. Overall incomes and living standards haveimproved; however, recent growth has so far had little impact on employment and the benefitshave not reached all sections of the population. In the context of tight fiscal constraints, aswell as policies for progressive price liberalization and cost recovery, Armenia faces aformidable challenge in alleviating the worst impact of transitional poverty and preventing theemergence of long tern structural poverty.
The Poverty Profile in 1993-94
1.3 Surveys carried out between 1993 and 1995 confirmed the widespread incidence ofsevere poverty throughout the country. For the poverty analysis based on the 1993-94 pilothousehold survey, relative instead of absolute poverty lines were used, partly because oftechnical difficulties in the data set, but also because the survey indicated no less than 97percent of the population were below the unofficial (absolute) poverty line, making such aline less than useful for purposes of analysis. The drastic fall in living standards had beenaccompanied by high inequality in the distribution of income, with the top 10 percent offamilies in Yerevan, for example, earning 48 percent of the city's income, and the absence ofa significant "middle class".

-4-
DATA SOURCES
The information presented in this Chapter is drawn primarily from the following sources:
Quantiative surveys:
1. Pilot Household Survey by SDS and Yerevan State University, 1993-94. This survey, which wascarried out over a 12 month period, was the first attempt by any former Soviet Union country tomeasure accurately household income and expenditure based on a representative sample for thecountry as a whole. The stratified samples consisted of 2,100 urban families and 1,200 rural families.
2. Household Budget Survey(HBS) by SDS, carried out in November-Decernber 1996, drawiLg on thelessons from the pilot survey. Due to differences in design the findings are not directly comparablewith those of the pilot survey. The largest household survey carried out in Armenia to date, it covered100 villages and 28 towns. The sample included 5,040 households, with a response rate of 98%, andwas representative at the regionalfmarz level and of both urban and rural areas.
3. Health and Education Survey (HES) by SDS, carried out in November 1996 with funding byUNDP. This survey used the same sample as the HES but with a different questionnaire on a separatevisit.
4. Labor Market and Labor Force Survey by SDS, carried out in October 1996 with assistance of theILO.
5. Family Budget Surveys, by the SDS. On-going quarterly surveys which provide the only continuoussource of data for monitoring living standards in Armenia.
Qualiative surveys:
1. A Qualitative Assessment of the Living Standards of the Armenian Population, report by NoraDudwick, 1995, on fieldwork carried out between October 1994 and March 1995.
2. Using Land as a System of Social Protection: An Analysis of Rural Poverty in Armenia in theAftermath of Land Privatization, report by Sharon Holt, 1995.
3. Poorest of the Poor.. report by Elizabeth Gomart, 1998 on fieldwork carTied out in December 1997.
Poverty assessment:
Armenia: Confronting Poverty Issues, by the World Bank, 1996. Poverty profile, analysis andrecormnendations based on 1993-94 Household Survey and 1995 qualitative surveys.
1.4 Surveys revealed unusual characteristics of poverty at that time and pointed todifficulties in identifying good indicators of poverty for targeting social transfers. Poverty wasfound to be more severe in urban than in rural areas. Subsistence agriculture provided a safetynet against extreme poverty for many rural residents; however, wide variation was found inpoverty rates between villages, with pockets of extreme rural poverty reflecting differences inclimate, elevation, transport links, irrigation levels and soil quality.

-5-
1.5 The factors most strongly related to poverty, especially in urban areas, were lack ofextended family support, and lack of private remittances or informal sector earnings. Thesefactors are all difficult to measure objectively for targeting purposes. No strong relation wasfound between poverty and age, gender, unemployment, level of education, size of household,stock of consumer goods, or housing attributes.
Summary of C OVe froT 1993*94 to : S AO69N
Li6i Althoeugh diofe in from the apli hsondisooveynrtyneeley recent
dirvect wopaidsedon withe the sustain rpidot grtwd h oifiut shevea economy M veanwhie ihot wipecruiolto chear.nfer scare rsourcesasefcienty ast possible from mitgat the194 improvemonthe woas sernioun
atffect_ed=
some pronolmdeict iniatohsig unusual196 pitreinmwhich poverty cnisnoeueeing marbacnomicrra re
lar fbility. ahe axveragt ware ot u rk tha9 small nd ma altro V b g the
unusual1conditis ware atl funlyoneo ther tranition99 ploessl. The olan beexpcte thegowt cangearapdswithrestruceuriv;nevof rtheleos,y averi sage emig hoeverit shcingxemly difw,chltito incentfasefu
ummrty coelt Csanges f Arome, ic 19h94 to p Sa0signifnt1996.7 hng rovernmen and
ar clar sfteron rltion as desbentweint poverty andm age, gender4, unmployement, famil siee or
stod of 19onitmwr gtlloadsy The fatoirs most strogl r92eelate tnola poerty, the garkowt apextedsmore suiot,prisie;nvartheles rvertage oarninfsremaln sehockarings-arew hatreieg ifinculasto
fromas monthey maye alof cUSeamlis.epeia0 in ur9n9ras to U$08in19.Impoveminto andotf poverty
conditions over the period included substantial increases in the proportion of households with
' Data provided by SDS

-6-
electricity (from 22 percent to 99 percent) and with piped water (from 57 percent to 88percent).
1.7 Despite these improvements, still more than half the population was defined as livingin absolute poverty by the end of 1996. Poverty continued to be mainly urban, with loweraverage consumption in urban areas. By the end of 1996, however, the incidence of extremepoverty, measured in relative terms, was found to be higher in rural than in urban areas.Evidence was also found in late 1996 of long term malnutrition of children, particularlywidespread in upland villages and border areas.
1.8 It is clear that Armenia's poverty profile is moving toward a more typical pattlern ofpoverty correlates. In contrast to 1993-94, a discernible relationship has emerged betweenpoverty and unemployment, and between poverty and lack of productive assets. The inverserelationship that was found in 1993-94 between education level and poverty has shifted to avery weak relationship in the expected direction. Similarly, larger households are no 'longerfound to be better off than small ones and the relationship between poverty and number ofdependents per breadwinner has become very strong. Landholding status has become a verystrong correlate of rural poverty, although not all landholders escape extreme poverty.
1.9 Some changes are evident in the relative importance of different sources of income.For urban households, the share of income from earnings (including wages, self employmentand income from sale of agricultural products) has dropped sharply. For the better-off half ofthe population, this has been replaced largely by "sales of valuables and property" (much ofwhich is informal sector income). For the lower deciles, it has been replaced mainly byprivate transfers and humanitarian assistance, which was an insignificant source of income forthe poorest four deciles in 1993-94. Changes in the structure of rural incomes have beensmaller but also reflect increasing dependence of better-off households on informal sectorincome.
1.10 Inequality in the distribution of incomes and consumption continues to be high butthere is no evidence that it increased for the country as a whole between 1993-94 and 1996-97. Comparison of data on the distribution of incomes from the two household surveyssuggests a possible reduction in inequality in urban areas and increase in rural areas, but thecomparability of data is not sufficient to allow a firm conclusion on this.
The Poverty Profile in 1996-97
1.11 Poverty in Armenia continues to be widespread and severe. The proportion of 55percent of the population in poverty by the end of 1996, cited in Table 1, implies that about 2million people were poor.2
2 This estimate is based on the officially reported population.

-7-
Table 1: Poverty Indicators for Armenia
Poverty indicators based the national Based on the Based on
poverty line Food line: Relative Une:*
Incidence Percent very poor Percent extremelyPopulation Depth Severity
(percent poor) poor
Urban 62.4 58.8 23.1 11.6 29.6 8.1
Rural 37.6 48.0 18.9 10.3 24.4 9.2
Total 100.0 54.7 21.5 11.1 27.7 8.5
Source: SDS 1996 Household Survey. *Relative line at 40% of median per capita consumption.
1.12 The three poverty lines indicated in Table 1 were established through comprehensiveanalysis of consumption expenditures. The "food line" (representing 6,600 drains per monthper capita) was derived by calculating the cost of a "food basket" providing adequate caloricrequirements on the basis of the actual structure of food consumption. The higher "povertyline" (10,800 drains per month per capita) is derived by adding to the food line the actualexpenditure of those close to the food line on non-food items (38.7%). The relative line,marking the extremely poor, is set at 40% of the median. At 4,000 drains per month percapita, this happens to coincide with the cost of providing a daily requirement of 2,000calories from bread and oil.
1.13 Levels of consumption for a large percentage of the population fell far below thepoverty line. The average poor Annenian spent US$15 monthly for food, far below thecountry's national poverty line of almost US$25 per month.3 Poverty depth and severitytranslate into astonishingly high numbers of very poor and extremely poor.
1.14 It is also important to note that studies have shown considerable movement ofhouseholds into and out of poverty since the fall of the Soviet Union. An overwhelmingmajority of Armenian households have had at least one episode of poverty between 1992 and1996. Most households are vulnerable to seasonal fluctuations in food availability, wagearrears, incidence of serious health disorders, irregular receipt of remittances and non-formalearnings.4 In the qualitative study (Gomart, 1998), families reported fluctuations in basicnecessities, such as food availability, electricity or heating, throughout the year. Manyhouseholds anticipated a period of hunger at the end of winter or early spring, after having runout of food, food stocks and savings. Dramatic fluctuations in family welfare were closelylinked to the health and mobility of its members, which, along with other factors such as laboravailability in the household, access to remittances and trade profits, asset availability, andaccess to credit, proved crucial to income generation.
1.15 The available information on inequality suggests that a dramatic polarization tookplace during the period of economic turmoil that followed independence. Income inequalityhad increased radically by 1994, when the Gini coefficient for per capita income distribution
3At the average exchange rate during the survey: 435 dramns per I US$
4 Unfortunately, in the absence of longitudinal data it is impossible to assess with any precision the extent of consunption variability.

-8-
was estimated at 0.58, compared to the pre-transition (1989) level of 0.26.5 Since then, thetrend appears to have stabilized. From the 1996 survey data, the same index was estimated at0.596 for both urban and rural areas, implying a possible decrease in inequality in towns andincrease in rural areas.
1.16 Measures of income inequality need to be interpreted cautiously, especially whenincomes are as irregular as they are currently in Armenia. For household expenditures, whichtend to be more consistent, data from the 1996 survey suggest that inequality in expendituresis somewhat lower, with a Gini coefficient of 0.44. Nevertheless, per capita consumption inthe top decile remains 18 times higher than for the poorest 10 percent of the population. Someincrease in inequality is normal and inevitable in the transition to a market economy. Veryhigh inequality, however, has negative implications for any poverty reduction strategy in thatthe benefits of growth are likely to be shared unequally, and economic growth alone may beinsufficient to lift the poorest in the population out of poverty. It can also have negativeimplications for social stability and for political support of the reform process.
Characteristics of the Poor
1.17 Since the poor make up half the population and transient poverty predominates, it isdifficult to find household characteristics that distinguish poor from non-poor families. Thepoverty profile helps to assess the relative risks of poverty for different groups.
Characteristics of the Poor
According to the 1996 SDS Survey, Armenia's poor and very poor are more likely, but notexclusively, to be:
* Urban (58.8 percent of urban households are poor compared to 48 percent in rural areas)* Landless, in rural areas, where 70 percent of landless households are poor* Less educated, (although this relationship with poverty is still weak)* Unemployed (63A percent), though work is often insufficient to avoid poverty* Living in households with a high dependency ratio, especially when the dependents are youngchildren, invalids, or disabled elderly
Location
1.18 Poverty is mainly urban, both because the majority of Armenians live in townos, andbecause average consumption levels are lower in towns than in rural areas. These robustresults stand for different data sets and methodologies. The lower incidence of poverty inrural areas, already apparent at the time of the 1993-1994 pilot survey, was attributed tobenefits from the land privatization program.7 Conversely, as Table 1 shows, by the end of1996 rural areas had a somewhat higher incidence of extreme poverty than urban areas. As
For 1994 -- estimates based on SDS traditional family budget survey, data for 1989 are estimates taken from Atkinson and Mickelwright1992, pl 37, based on the same source.
6 This is very close to the results of CEPRA survey conducted in Yerevan in 1995-1996 that reports a Gini of 0.63.
7It is discussed in greater detail in "Armenia: Confronting the Poverty Issues" p 6.

-9-
illustrated in the graph below, although a smaller percentage of rural residents are poor, amuch larger share of those who are poor are very poor indeed. Information from thequalitative survey suggests that this extremely poor group may continue to grow as familiesare compelled to dip into seed stock in order to compensate for poor harvests and to depletecattle stocks and other assets to cross-subsidize unprofitable land cultivation efforts (seeAnnex 1, Table 6).
Figure 1: Poverty by location
7 . 0% Wid on-poor
6 60% M POOr
marzes is greaterstill.Thequalityofagriculturallandiery Poor40
3 30% M.Extrem ely
;.20% P oo r
10%
0%
1.19 Wide regional variations in poverty exist across regions and within regions. Povertyis highly localized. Although the incidence of poverty varies substantially between marzes-from 38.1 percent in Anmavir marz to 63.1 percent in Shirak marz-the variation withinmarzes is greater still. The quality of agricultural land is an important factor. Nevertheless,pockets of poverty are sometimes found even in regions with rich agro-ecological conditions.For example, in Armavir, the country's most fertile agricultural province, almost 15 percentof the rural population are food poor. Further examination of poverty within marzes confirmsthat extreme poverty tends to be most concentrated in national border areas, high altitudeareas and earthquake zones. Location can be a contributing factor in poverty in so far as someisolated regions have less access to roads, water supply and social services (see Annex 1,Tables 6, 7, and 30).
Landholding
1.20 Rural poverty is closely linked to landholding. Rural poverty is highest among 6percent of households who are without a land plot (70 percent are poor or very poor) or whoare unable to farm their land. Not only are the landless poor, their poverty is also very deep.Access to land is also an important factor for many urban families who depend on gardenplots, or gifts of produce from relatives in rural areas, as a crucial food source of last resort:19 percent of urban residents, but only 9 percent of poor rural residents, have access to gardenplots.
1.21 Land ownership does not in itself preclude rural poverty. Quality and quantity ofland, access to irrigation and other necessary resources such as labor, financial investment,markets, good weather, and supporting infrastructure are at least as important (see Annex 1,Table 16). The qualitative study (Gomart, 1998) identifies households that found their landwas more of a liability than an asset. Some had either refused to accept land during

-10-
privatization or later returned it without compensation to the municipal land reserve, citingthat land cultivation drained their resources or was a burdensome tax liability. Householdswhich lacked the labor or other inputs to cultivate their land were usually also unable to sell orlease it. According to the rural survey (Holt, 1995), only 16 percent of farmers had enteredinto land-leasing transactions, and 90 percent of leased land came from the municipal reserve,not fellow rural residents. The survey also found that the average rental cost wasapproximately the amount of tax due on the land. Land sales are also sluggish with anniualturnovers hovering at one percent.
1.22 The unemployed have the highest incidence and depth of poverty (see Table 2 andAnnex 1, Tables 13, 15 and 17). The rural unemployed are more likely to suffer greaterpoverty-38 percent are below the food line. As many as 43 percent of Arrnenian familieshave at least one unemployed member, and nearly 61 percent of such households are poor.The highest incidence of poverty (72 percent) arises after about four to five months ofunemployment, when savings have been exhausted but before individuals have had time todevelop new coping strategies, lowering the risk of poverty to a still high 60 percent.However, most of the unemployed belong to families where the head of the household iseither employed or self-employed which indicates that, despite a high correlation betweenunemployment and poverty, the core poverty problem is one of the working poor.Employment is not a guarantee of sufficient earnings to support a family. First, a sizeableshare of the labor force is only formally attached to employment and does not performn anyactual work or receive a salary. Second, the ongoing practice of labor hoarding leads to a highprevalence of part-time work with a correspondingly low salary. And finally, most of theemployed are on the payroll of state-owned enterprises that are unable to pay reasonablewages due to the need for restructuring.
Employment Status
Table 2: Characteristics of the Poor by Labor Market Status
Incidence of Percent of Incidence of Incidence ofIndividual Characteristics
poverty total poor food poverty extreme poverty
Small children (under 5) 59.1 10.1 32.9 10.9
Children (6-15 years) 56.7 22.7 28.5 8.8
Students (over 15 years) 45.3 2.9 19.0 6.0
Single pensioners (not working) 37.1 1.4 18.0 5.0
Pensioners (not working) living in families 60.6 14.1 30.8 9.6
Disabled and caring for disabled 58.6 1.8 32.3 10.6
Other inactive adults 55.8 12.8 28.1 7.9
Unemployed 63.4 12.4 35.9 12.6
Ernployed at State-owned and privatizing firms 50.5 8.8 23.0 6.1
Employed by the Government 38.0 1.8 18.2 5.0
Self-employed and private sector employees 44.7 9.0 19.5 5.5
Other economically active adults 51.0 2.3 22.0 6.6
Total 54.7 100.0 27.7 8.5
Source: SDS Household Survey 1996.

-11-
1.23 The average employee does not earn enough to support a family. (Annex 3, Table6, indicates average wages reported by sector.) Employees of state-owned enterprises are atthe highest risk for poverty among all those employed. However, since they receive supportfrom different channels by these enterprises, poverty is not severe for this group. But when aworker goes on administrative leave, his or her situation becomes worse than that of anunemployed person, partly because he or she cannot register as unemployed and receivebenefits. Seventy percent of this group were found to be poor. The employed at-work werecomparatively better off. Self-employment in rural areas was particularly lucrative,generating enough income to lower the risk of poverty by four times as compared to theaverage population8 (see Annex 1, Tables 31, 32 and 33).
Education
1.24 Those with higher education are somewhat less likely to be poor, although level ofeducation in itself is still a poor predictor of poverty in Armenia. With labor markets stillundeveloped, the wage premium paid for higher education is not yet resembling the ratetypical in market economies. No less than 46 percent of those with tertiary education remainpoor. The typical wage that college graduates earn even in new private firms is sufficient onlyto support a worker plus one, or at most two, dependents. If such an employee has to supportmore than two dependants, the household falls below the poverty line. As a result, as many as38 percent of Yerevan's private firm employees with higher education earn less than isneeded to make their families non-poor (see Annex 1, Table 10). The very low salary rate ofteachers, who constitute a major share of the highly educated population, is also an importantfactor in depressing the average income premium normally associated with higher education.For the unemployed, however, higher education appears to be particularly beneficial inproviding possibilities for different coping strategies. Among the unemployed, those withhigher education, especially men, have the lowest risk of poverty-lower in fact than theaverage population risk.
Figure 2: Education level by poverty groups l
100%
80%
60% M Prim aryDOSecondary general
4 0% *Secondary special
20%
0%
Non-poor Poor Very Poor
This typology of occupational group and poverty, based on the survey data, is in line with what is observed in other studies.

-12-
Household size and composition
1.25 It appears that larger households are more likely to be poor. However, whenpoverty is closely linked to demographic variables and the analysis is based on per caplitaindicators, survey results should be interpreted with caution. Because of possible economiesof scale in consumption, the per capita cost of reaching a certain welfare level may be lowerin large households than in small ones. For example, the cost of heating can depend on thebuilding's physical characteristics, regardless of the size of the family living in it, while theper capita cost of heating would, of course, be lower for a larger family. Considering aplausible degree of economies of scale adjustment, the household survey data reveals only aslight difference in the incidence of poverty between largest and smallest families.9
1.26 The typical Arnenian household is made up of an extended family of three or rnoreadults living under one roof. About 60 percent of the population live in extended householdsand 34 percent in nuclear families (couples with or without children). Relatively few"incomplete" families-single adults, single parents, or single elderly-exist in Armenia andtheir poverty risks are the lowest (see Annex 1, Table 8 and Figure 2). Extended families withchildren have the highest incidence of poverty among all household types. Couples with threeor more children have the second highest risk for poverty, which means large householdsconstitute the majority of the poor. Very poor households are substantially larger (average4.52) than the average Armenian household (3.94).
1.27 The dependency ratio is a much better predictor of household poverty thanhousehold size itself. Increase in the number of dependents steeply increases the risk of"poverty so that, for example, households with two dependents are on average almost twice aspoor as households where all members are actively generating income (see Annex 1, Tables12, 32, 33, and Figure 1; and Annex 2, Section 4). Among dependents, small children havethe highest risk of poverty (see Table 2), while students have the lowest. Most poorhouseholds are made up of families with children and those living in rural areas or havingdisabled children experience the most severe poverty (see Annex 1, Tables 32 and 33). Onlyone third of multi-generational households, including both children and elderly members,manage to stay non-poor.
Traditionally Vulnerable Groups
1.28 The disabled, the elderly living with relatives, and orphans are highly vulnerable topoverty, supporting the widely held belief in Armenia that erosion of the state and traditionalsocial support networks during the economic transition has left these segments of thepopulation particularly vulnerable. Fifty-nine percent of the disabled and those caring forthem are living in poor households, as are 61 percent of pensioners living in families (Table2). However, the poverty risk for small children, under five years old, is equally high.
1.29 Some groups traditionally considered vulnerable have fared better than the rest ofthe population. Refugees were found to have a lower incidence of poverty than the averagepopulation, although the number included in the 1996 household survey was too small for thisto be conclusive. Surprisingly, the 12 percent of pensioners who live alone have the least
9 It should be emphasized that there exists no consensus on whether, or how much, to adjust incomes or consumption for economies of scale.See Appendix I for detailed analysis of this issue.

-13-
poverty risk (37 percent), while pensioners residing with families, and thus directly supportedby their relatives, are among the most vulnerable to poverty. Among the single elderly, a cleargender distinction emerges: for women in this group the poverty rate is 42 percent, twice ashigh as for their male counterparts.
1.30 Analysis of the income structure of single pensioners makes clear that the combinationof traditional support networks and humanitarian assistance have effectively lifted this groupout of poverty. Income from the state pension (averaging 3,000 drains per month-less thanhalf the food poverty line-barely constitutes 15 percent of the single pensioner's averageincome. Just over 50 percent of their income is derived from private transfers, remittances andhelp from humanitarian organizations. The remainder is almost equally distributed betweenrental income from subletting apartments and income from private garden plots. This totalsabout 16,000 drains (US$ 36), enough to lift the majority in this group above the poverty line.If the private and humanitarian support were withdrawn, single pensioners on average wouldbecome food poor. Among single pensioners who receive private transfers or support fromhumanitarian organizations, the risk of poverty is only 29 percent; for those who do not itrises to 50 percent. Multivariate analysis suggests that when living in urban areas and notreceiving any transfers, the risk of poverty doubles; if a single pensioner is also female, thereis an almost 100 percent certainty that the household will be poor.
1.31 A further explanation as to why single pensioners, as a group, are less poor thanaverage is offered by the qualitative assessment: better off families are able to avoidmultigenerational living, and instead spread out into independent apartments or homes withinthe same city or village. Being a single pensioner does not necessarily mean isolation and can,in fact, imply a privileged background. In addition, being a single pensioner is a highly visiblestate and can, therefore, attract additional support from the traditional support network.
Sources of Income
Formal employment
1.32 Salaries and wages constitute on average a mere 13 percent of incomes (Table 3).Official unemployment in Armenia (i.e., job seekers who are registered as unemployed withstate employment offices) is moderate and constitutes only about 10 percent of the laborforce. However, because there are few incentives to register and some legal restrictions toobtaining unemployment status, the actual unemployment rate, as reflected in householdsurveys, is around 25 percent of the labor force.10 Half of the unemployed have been withoutwork for more than a year. Only a third of those registered received benefits, and a furtherquarter report arrears in payment. However, the level of payment is so low (2,100 drams onaverage) that the impact on incomes and poverty risk is relatively small. In addition to theunemployed, many adults of working age, often among the poorest of the poor, would like towork but have become discouraged and relinquished their job search.
1° As measured by the Labor Force survey conducted by State Department of Statistics or household survey, both of which give similarestimates.
-14-
Self-employment
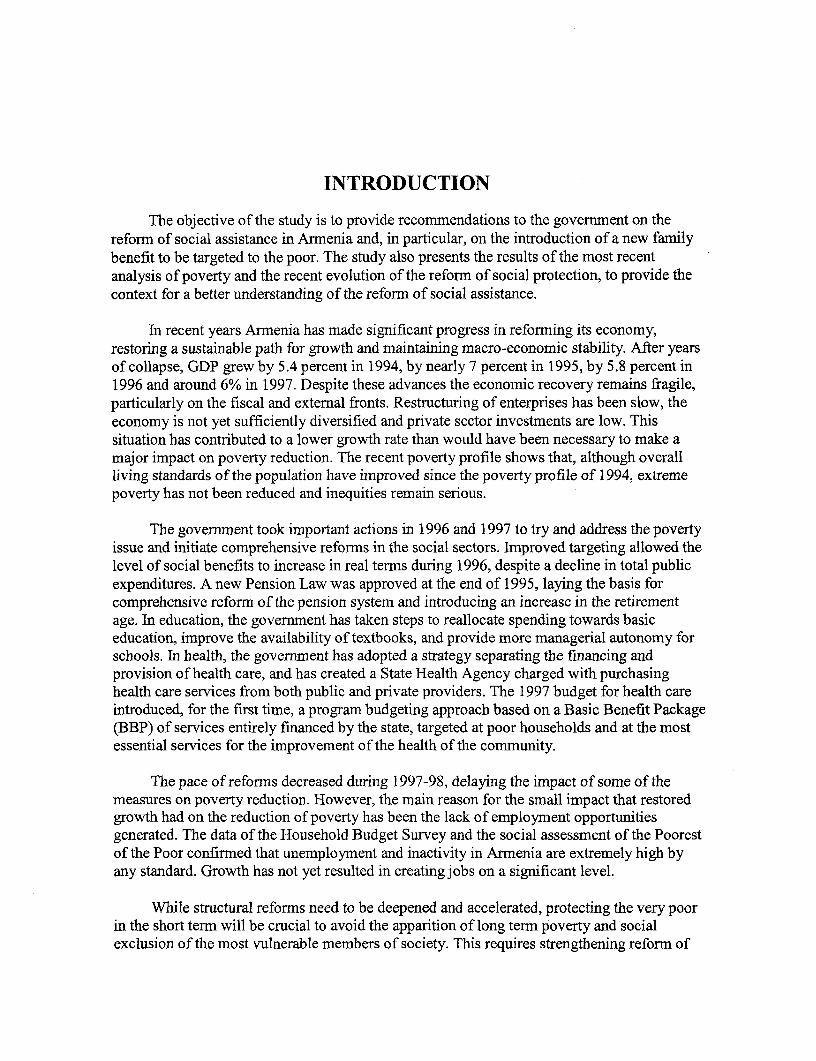
1.33 Recent job creation has been concentrated mostly in self-employment and informalactivities. The 1996 household survey shows that 80 percent of those employed in the non-state sector of the economy are self-employed. Although average earnings in this group arehigh enough to move most of the self-employed out of poverty, the variation in these earningsis extreme. Self-employment is obviously a highly heterogeneous occupational category,comprising both highly paid professional occupations and low-paying positions. The poor aretypically forced to take the latter positions, and are usually employed on a short-term dailybasis with informal-- hence insecure-- contracts.
Figure 3: Structure of household incomes by poverty groupsf00%
M Other income
80o% E Sales of Property andValuables
B .In-kind Produce
60% ..... e.- . Private Transfers and
50% Humanitarian Aid
40% -b-,',.:;_, i -i:"_b., "., .| | - -; ": ." " i ' E3State Transfers
30% ..* Self-Employment,
Rent and Interest20%
INWages and Salaries
0%
Non-poor Poor Very Poor
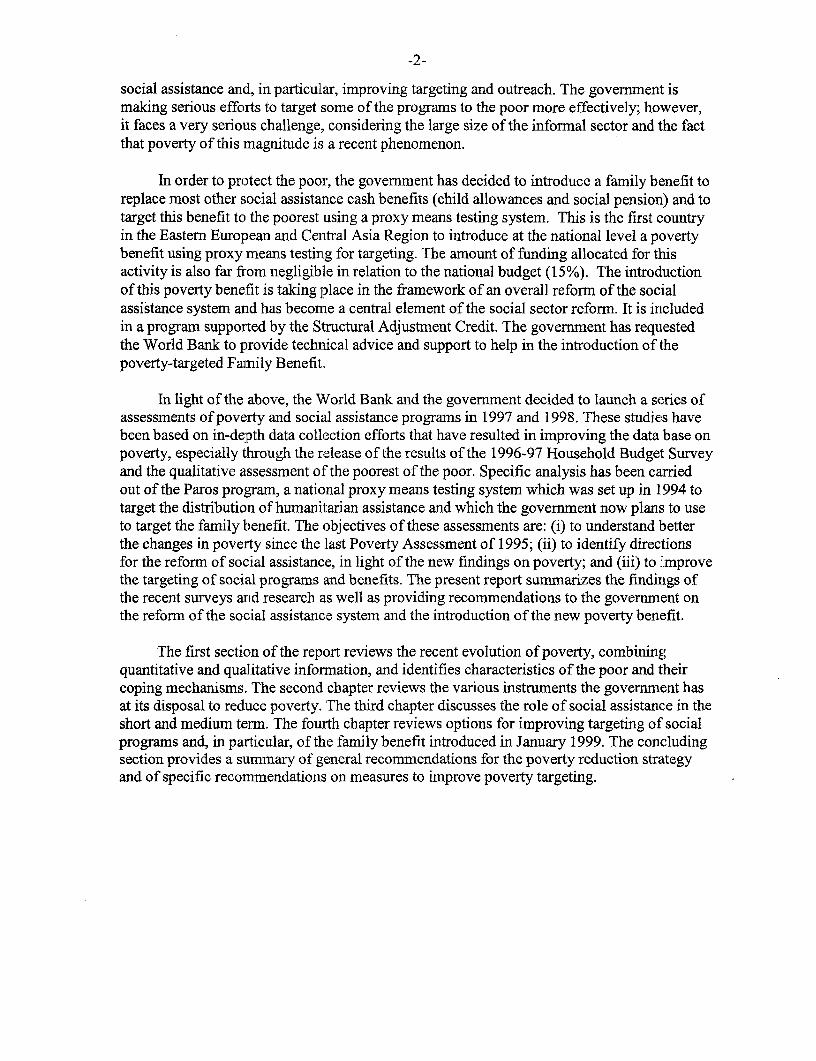
Table 3: Income Sources and Inequality
Structure of Concentration Contribution toSources of Current income! current income coefficient inequality
Salaries (including in-kind wages and benefits) 13% 0.362 8%
Self-employment income(including farm products sold) 29% 0.776 38%Rent and interest income 3% 0.935 4%
State transfers 6% 0.005 0%
Private transfers (domestic) 13% 0.549 12%
Humanitarian aid and charity 4% 0.227 2%
Remittances from abroad 13% 0.786 18%
In-kind produce from agriculture 15% 0.515 13%
Other income 4% 0.748 5%
Total 100% 0.587* 100%* Gini coefficient; for households with non-zero current income

-15-
1.34 Some of the factors behind the high levels of income inequality are revealed in Table3, where the disparity is broken down by primary income components.11 The concentrationcoefficients reported in Table 3 indicate the extent to which the distribution of eachcomponent of income is unequal. The largest contributor to overall inequality is income fromself-employment. Wage inequality is not significantly high. If all income had been solelyderived from labor income, the Gini index would have been near 0.40, much lower than theobserved level (see Annex 1, Table 14).
Remittances andprivate transfers
1.35 Private transfers and remittances from abroad are an essential coping mechanism.Seasonal labor migration to other CIS countries has become an important income source forthe Armenian population.12 Ten percent of families have at least one temporarily absentmember and, in cases where this member is an adult, the risk of poverty for the family isstrongly reduced.
1.36 The high incidence of working poor can be attributed to Armenia's low level ofjobcreation. The average private firm wage for prime age workers with higher education in anurban area was about 20,000 drams (US$ 48) per month at the time of the 1996/97 survey,which was more than double the average public sector wage but barely sufficient to supportthe average size family without falling into poverty. Consequently, most highly qualifiedArmenians prefer to seek even temporary employment abroad. This drain on the labor marketled to the collapse of the statistically reported wage as a component of income. The 1996household survey reveals that the share of other, "unofficial" sources of income was as highas 70 percent of total current income (Table 3), comprising self-employment, privatetransfers, remittances and produce from agriculture consumed in-kind. It is important to notethat the data in Table 3 are for current income, not including income from "sales of assets andvaluables", a large part of which is understood to represent earnings from petty trade,smuggling, and other informal or illegal activities. When this category is included in totalincome, the share of "unofficial" income reaches 84 percent.
1.37 Heavy reliance of the Armenian population on private transfers, humanitarian aid andremittances (see Table 3), all of which tend to be unreliable and irregular, leads to extremefluctuation in the level of household income depending on the timing of the receipt. At theend of 1996, private remittances (domestic and from abroad) were reported to account for 26percent of incomes. According to the 1993-94 household survey, most private transfers at thattime went to better-off families. From the 1996 survey, however, these appear to have a moreneutral distributive impact with about 30 percent received by the very poor.
Institutional transfers
1.38 Institutional transfers of humanitarian aid or state assistance have had, at best, aneutral impact on inequalities and therefore small impact on poverty. The distribution ofmedical humanitarian aid (although this constitutes an insignificant factor in consumption) is
" Gini index, as shown in Shorrock's 1982 can be broken down by income components, where the contribution of each income source tototal inequality can be obtained from the product of concentration coefficients from each component and their respective weights intotal income.
12 References to Dudwick 1995, results of November 1995 SDS survey on extemal nmigration in Armenia.

-16-
parceled out most unequally: 61 percent is received by the richest 10 percent of thepopulation. State transfers also fail to target the most needy. The household survey revealsthat, by the end of 1996, state transfers had dropped to a mere 6 percent of current incomelevels; they were equally shared by all groups of the population and were not, therefore,targeted to the poor at all.'3 The neutrality of state transfers in terms of income distributionhas clear implications for social sector strategy. Simply increasing the budget of socialtransfers without changing its distribution would have no impact on inequality and aninsignificant impact in alleviating extreme poverty.
Food security
Conditions of the Poor
The poor household in Armenia is unable to meet its most basic needs. In sum, the pooresthouseholds are likely to:* Experience spells of malnutrition, especially seasonal hunger in late winter and early spring* Have problems paying their electricity bill and, especially in urban areas, heating their homes* Live in poorly maintained and overcrowded housing* Have less access to quality secondary education and to higher education* Have less access to health services and little public health awareness
1.39 Although neither starvation nor acute malnutrition has been reported in Armenia, thenutritional status of the poor, and especially very poor, shows that serious deprivation exists.On average, the poor are 18 percent below the mean caloric intake for the population; the verypoor fall short by 25 percent. The diet of the poor consists mostly of bread and potatoes,failing to provide enough micro-nutrients even in cases when the caloric minimum is met.Food represents about 70 percernt of expenditures in poor households, but this is still less thanthe cost of the minimum food basket for 44 percent of Armnenians.'4 Whereas adults mnayadapt to poor nutrition, growing children are severely affected (Annex 1, Table 5).
1.40 In 1994, a study by UNICEF found no evidence of under-nutrition, nor of increasedmortality or morbidity, for children under the age of five.'5 Cultural factors, in particular thehigh value placed on children's welfare in Armenian tradition, have played an important rolein mitigating the impact of poverty on children. There is now evidence, however, of lowheight-for-age, or stunting in Armenia's poor children, an indicator of long-termmalnutrition.'6 Nutritional screening of children at the end of 1996 found that 16 percent fellinto the low height-for-age index, a sign of poor socioeconomic conditions and inadequate
'X When all households are ranked by consumption level, all deciles receive an equal share of State transfer -- about 10 percent. The same istrue when current income is taken as an indicator of well-being. As a result, concentration coefficient for State transfers is close tozero, indicating that the poor are not targeted at all.
4 This is a lower bound estimate based only on part of the sample with a diary of expenditures that had a detailed recording of fc,od stockconsumed.
"A Situation Analysis of Children and Women in Armenia," Govemment of Armenia in cooperation with UNICEF, June 1994
16 The screening was conducted by the Children's Aid Direct and funded by European Community Humanitarian Office (ECHO,) inSeptember-December 1996 and involved 9,500 children under 5 years old in four regions. The results are reported in ECHO 1997.

-17-
access to food over a long period.17 The same survey also reported wide variations in regionalprevalence of low weight-for-height and height-for-age. In upland villages and border areasthe prevalence of low weight-for-height reaches 45 percent and, in the same areas, more than85 percent of screened children were anemic. The SDS health survey shows that childrenunder age five who are from very poor families weigh less than non-poor children in each agegroup. 18 This constitutes an alarmning new phenomenon which has not received adequatepublic attention because a considerable number of deprived children are "hidden" in remoteand inaccessible areas.
Figure 4: Structure of expenditures by consumption deciles
100%
90/o ni iOt;"ther80/o
70eciles /f householdsCulture and
60% / " 0 Transport andtourism
1.41 Despite a series of disasters, te humandevelopmentindicatorsi Housing
40% Hou30% M:; Health
10% E3Food
10%
1 2 34 5 6 7 8 9 10l3ecile s of households (1 poorest)
Access to Basic Services
1.41 Despite a seres of disasters the human development indicators in Arnenia are stillhigh. Armenia has a virtually i00 percent literacy rate, relatively high life expectancy (72.6 atbirth), and an infant mortality rate (at 15.5) well below the FSU average.19 However, seriousunder-funding of the social sectors has led to deterioration in the quality of and access toservices. As more and more services are provided on a fee-for-service basis, monitoringaccessibility to services by the poor will become increasingly important in the future.
Housing
1.42 The poor in Armenia often live in overcrowded housing with faulty or non-existentutilities. Yet surprisingly, living in temporary housing, such as railway cars, containers, etc.,
'~"Low" in these antropometric studies is a relative concept related to the prevalence of observations that fall below the mean minus twostandard deviationis for the population. In a well-nourished individual, the expected prevalence of below -2SD should be around 2.3percent for this antropometric parameter.
8 The difference in mean weight is at least tO percent between children from very poor households and non-poor children for the same agein all age groups between 0 and 5. But given the limited number of observations in each age group in the health SDS survey (about60), no generalization could be inferred from this sample for the population as a whole.
19 "Armenia: Confronting Poverty Issues. Annexes 3, 4, 7." The latest figures provided by SDS for 1996: life expectancy at birth 72.6; lifeexpectancy at 30: males 41.8, females 47.9; infant mortality 15.5, matemal mortality 20.8.

-18-
does not necessarily constitute poverty; indeed, the incidence of poverty for this group isactually slightly lower than for an average Armenian household. While the housingconditions of the poor are somewhat worse than those of the non-poor, the type of housing orhouse-ownership profile of the poor does not differ markedly from the population at large (seeAnnex 1, Tables 19, 20 and 21).
Electricity
1.43 The difference between the poor and non-poor becomes more strongly apparent whenhousing costs are factored into household expenditures. For example, by the end of 1996 thecost of electricity exceeded 10 percent of an urban household's expenditures for the averagevery poor family as compared to less than 3 percent for a non-poor family. As a result, asmany as 25 percent of very poor urban households cannot pay their electric bills, even thoughthey risk having the power cut off.20 Inability to pay the electric bill was a close indiicator ofpoverty severity; about one-quarter of families who did not pay for electricity during themonth of survey were extremely poor and 75 percent were poor (see Annex 1, Table 22).
Heating
1.44 A similar picture emerges when we compare how the poor and non-poor meet heatingcosts. The average total winter heating cost according to the household survey is about20,000 drams,21 beyond the price range of very poor families, many of whom postponepurchasing fuel until the coldest months. Almost none of the very poor households spent anymoney on wood -- the only source of heat for half of Armenian households -- in Novemberand December 1996, whereas many non-poor families purchased wood during these months.22
The poor tend to economize on such expenditures by collecting fuel themselves. Thisbehavior has obvious negative environmental consequences. It also means that the ploor areoften without adequate heat during the cold season, which poses, in turn, direct healthconsequences (see Annex 1, Table 22).
Education
1.45 Education has traditionally been viewed by Armenian families as a priority need.According to the SDS education survey, school enrollment rates continue to be high, showingonly a slight bias against the poor. Neither the distribution of textbooks, nor attendarnce duringthe year shows clear discrimination against the poor. Access to higher education, however, isclearly related to family wealth. In secondary school, the difference between poor ard non-poor is strongly evident in the expenditure on private lessons, which are considered anessential pre-requisite in pursuit of higher education. Even so, the fact that some 20 percent ofhouseholds below the food poverty line report spending an average of more than 2,000 dramnsper month on private lessons for secondary school children underlines both the high valueplaced on education and also the perception of the necessity of private lessons to supplement
20 This risk explains why the majority of poor (80 percent of poor urban and rural families) were paying electricity bills.
21 Estimated total cost of heating for winter months is not different between poor and non-poor families. Source: SDS Survey cf Health andEducation.
22 For urban areas as well: only 2 percent of very poor households have actually spent money for wood or heating oil, whereas more than aquarter of urban non-poor families have bought some fuel (such as wood, coal or heating oil) for the cold season. In rural areas thecontrast is even sharper: 5 cent of very poor households spent something on wood as compared to 41 percent of non-poor.

-19-
the public school curriculum. These private lessons are often provided by teachers at theschools where students are currently enrolled, presenting the danger of a two-tier systemwithin public education. A pattern is emerging of excluding the poor from access to qualitysecondary and tertiary education, even where education is formally free (see Annex 1, Tables27 and 28).
Health
1.46 Self-reporting is one way to assess health status, although it is clearly a subjective one.In Armenia 30 percent of respondents reported dissatisfaction with their health. Povertyappears to be associated with adverse health conditions. Compared with the non-poor, thevery poor tended to report somewhat more frequently that their health was unsatisfactory2 3
(see Annex 1, Tables 23 and 25).
1.47 Reported morbidity was relatively high for both poor and non-poor. In a single monthof the survey almost one-fifth of respondents reported at least an episode of illness thatimpaired their daily activities.24 Once sick, the poor are less likely to take advantage ofmedical services and rely primarily on self-diagnosis and self-treatment. A significant causefor concern was that the poor were much less likely than non-poor to use pre-natal checkupsor birth services (see Annex 1, Table 24).
1.48 The average cost of medical consultation alone could eat up to two months of theaverage poor household's earnings. The cost of full treatment per patient is equivalent to one-third of the annual average per capita consumption. Average per capita private healthexpenditures were equivalent to 8.2 percent of current per capita expenditures, high by anystandard, and represent a substantial increase in dollar terms compared to 1995 costs2 (seeAnnex 1, Table 24).
1.49 The poor finance the cost of medical treatment primarily by borrowing and from thesale of assets. A single episode of illness that requires hospitalization can be cause foremergency liquidation of assets even for those who are relatively well-off. Every fourth non-poor household that faces paying for medical services would effectively be counted as poor iftheir expenditure on medical costs were excluded from total household expenditures.2 6
Consequently, the average Armenian family tends to postpone medical treatment until a veryacute condition develops2 7 (see Annex 1, Table 26).
23 As much as 38 percent of very poor reported the condition of their health as unsatisfactory; only 25 percent reported it was good (data fromSDS household survey percentage relates to cases where some answer was given).
24 Health and education survey conducted by SDS revealed that over the last 12 months 37.6 percent of the population had a serious healthcondition.
25 The estimate is based on the SDS household survey. By interpolating the mean expenditure over the whole year, one gets an estimate ofUSS35 per capita -- a doubling compared to the 1995 Ministry of Health estimate and threefold increase compared to extrapolationsbased on the 1995 Social Assessment. (Source: Health Financing and Primary Health Care Development Project SAR, Report 16475AM, p.2.).
26 In the SDS household survey, 544 non-poor families incurred some health expenses; 156 of them would plummet below the food line ifhealth expenditures were subtracted from total household expenditures. This adjustment, however, could only be done for pureillustrative purposes and should not affect the overall classification of families, since it violates the consumer sovereignty principle.
27 This also translates into a very high share of hospitalizations as an outcome of illness: 10 percent of tose who were sick over a year endedup being treated in hospitals (Source: Health and Education Survey), which might have been prevented if proper treatment wereavailable. Among all respondents who were seriously ill in the last 12 months 39 percent reported "successfully curing" themselves.
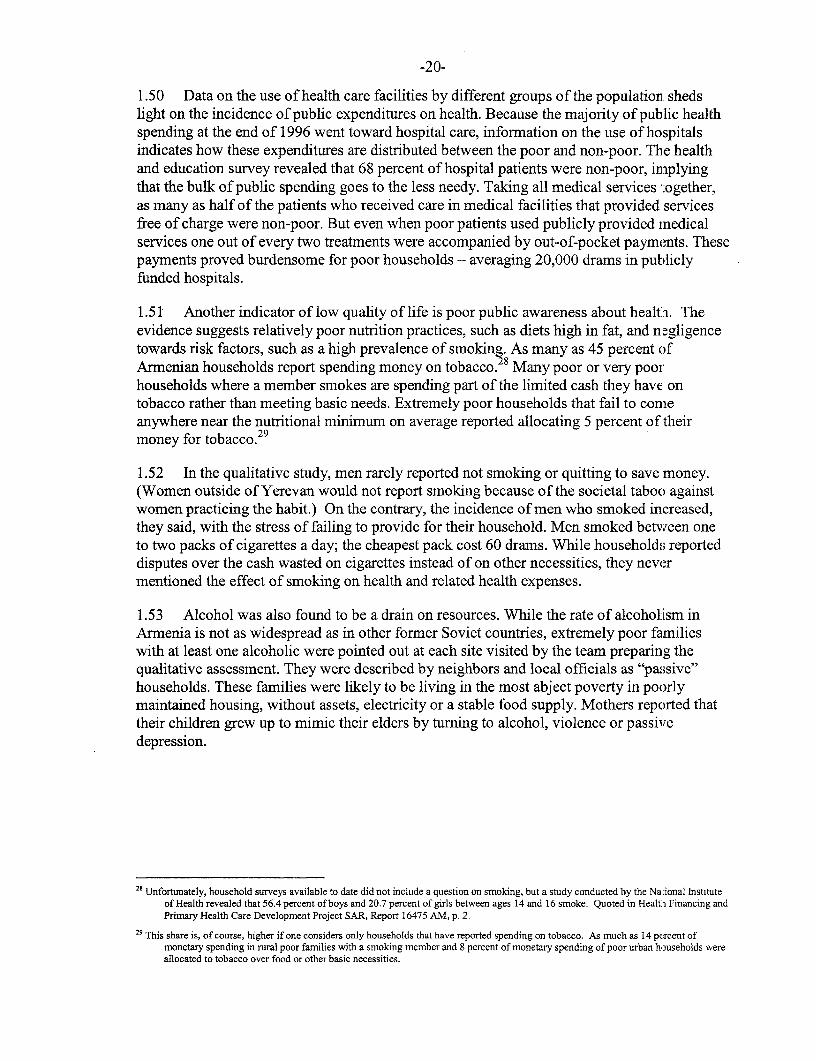
-20-
1.50 Data on the use of health care facilities by different groups of the population shedslight on the incidence of public expenditures on health. Because the majority of public healthspending at the end of 1996 went toward hospital care, informnation on the use of hospitalsindicates how these expenditures are distributed between the poor and non-poor. The healthand education survey revealed that 68 percent of hospital patients were non-poor, implyingthat the bulk of public spending goes to the less needy. Taking all medical services together,as many as half of the patients who received care in medical facilities that provided servicesfree of charge were non-poor. But even when poor patients used publicly provided medicalservices one out of every two treatments were accompanied by out-of-pocket payments. Thesepayments proved burdensome for poor households - averaging 20,000 drams in publiclyfunded hospitals.
1.51 Another indicator of low quality of life is poor public awareness about health. Theevidence suggests relatively poor nutrition practices, such as diets high in fat, and negligencetowards risk factors, such as a high prevalence of smoking. As many as 45 percent ofArmenian households report spending money on tobacco.28 Many poor or very poorhouseholds where a member smokes are spending part of the limited cash they have ontobacco rather than meeting basic needs. Extremely poor households that fail to comeanywhere near the nutritional minimum on average reported allocating 5 percent of theirmoney for tobacco.2 9
1.52 In the qualitative study, men rarely reported not smoking or quitting to save money.(Women outside of Yerevan would not report smoking because of the societal taboo againstwomen practicing the habit.) On the contrary, the incidence of men who smoked increased,they said, with the stress of failing to provide for their household. Men smoked between oneto two packs of cigarettes a day; the cheapest pack cost 60 drams. While households reporteddisputes over the cash wasted on cigarettes instead of on other necessities, they nevermentioned the effect of smoking on health and related health expenses.
1.53 Alcohol was also found to be a drain on resources. While the rate of alcoholism inArmenia is not as widespread as in other former Soviet countries, extremely poor familieswith at least one alcoholic were pointed out at each site visited by the team preparing thequalitative assessment. They were described by neighbors and local officials as "passive"households. These families were likely to be living in the most abject poverty in poorlymaintained housing, without assets, electricity or a stable food supply. Mothers reported thattheir children grew up to mimic their elders by turning to alcohol, violence or passivedepression.
28 Unfortunately, household surveys available to date did not include a question on smoking, but a study conducted by the National Instituteof Health revealed that 56.4 percent of boys and 20.7 percent of girls between ages 14 and 16 smoke. Quoted in Health Financing andPrimary Health Care Development Project SAR, Report 16475 AM, p. 2.
29 This share is, of course, higher if one considers only households that have reported spending on tobacco. As much as 14 peTcent ofmonetary spending in rural poor families with a smoking member and 8 percent of monetary spending of poor urban households wereallocated to tobacco over food or other basic necessities.

-21-
Social Exclusion
In the Armnian:cont:ext etixoshlsmy epriual trs o xrm oet fte are:t,n f
; * t0Soillyb isltd (e.g.. \famliswih nalchoic mmb ingl pesos withou a network
rf00tefu[geerinternaly displaced pros n ~iies adwthutiesF f to th vilae
0 ;t*0 Immoble due0 to -menal0 ora0 -phscl dsblit,pencyadbratfeing choi health prbes fail re sponsibilities orlak ofcash 9 or, assetsif
* Hosehods n crsis(e.g. u oji emo rysrie
1.54 Most of the coping strategies of the poor depend on at least a small capital outlayand/or on social connections. The lack of strong social networks means that poor householdsare often unable to access official jobs, have few contacts to locate temporary employment,including work abroad, do not have access to credit, and do not benefit from gifts of foodfrom relatives who are better off. Poverty itself may also reinforce isolation, when poorhouseholds are unable to take part in social ceremonies or family rituals in which they wouldbe expected to contribute materially. Isolation may be compounded by the efforts of the poorthemselves, especially households that are work-capable and educated, to hide their poverty.Households which become socially marginalized for any reason, including poverty itself, arethose most vulnerable to extreme long term poverty.
1.55 Social institutions define rules by which individual households are included orexcluded from access to resources at different strata -- extended family network, community,associations, economy and state levels. Social exclusion can lead to the household's economicvulnerability and can result in poverty, even where poverty was not a predetermining factor.The most important and recurrent determinants are: moral and traditional values which definethe deserving and undeserving poor; financial wealth which can be used to obtain services,amenities and start-up economic activities; social connectedness which guarantees privilege;and access to goods, services, assets and jobs. Social ties often provide the only recourse for ahousehold at a time when legal, health, financial and other support systems are in disarray.
1.56 Households that had recently relocated in new towns such as Sharensavan weresignificantly worse off than long-time town or village residents with ancestors or relatives inthe surrounding areas who were able to provide some food staples. Having ancestors nearbyalso carried the potential of political and economic weight in Armenia. In Yeghegnadzor,those households who could not demonstrate ancestry in 1937 were excluded from landprivatization. In other regions, a household's political standing was linked to when the familyestablished itself in the region (for example, prior to or after the genocide, in the 1 950s whenrepatriates were sent to the villages by Stalin) and the location of its origins (Van in Turkey orlocal Armenian, etc.).
1.57 Weak kinship ties, as in the case of orphans and even adult orphans, also limit thehousehold's ability to rely on relatives for a support networks. Examples were evident amongfemale pensioners living alone or in couples where male children had moved away. Ties to

-22-
daughters or sisters were not compensatory and often offered inadequate support. The loss ofconnection can come from personal differences, physical distance, moral issues, suclh asalcoholism, or a lack of direct ties to male providers such as brothers, father and mother orbrothers-in-law.
1.58 The most extreme cases of poverty occur when traditional support networks failbecause they are unreliable or insufficient. Cases were cited of young, single men in Spitakand Yerevan who had taken their own lives because, according to neighbors, they had lost allhope of being able to support themselves. Without the benefit of kinship ties, young men arealso unlikely to marry, a state that would offer them the support of a wife's relatives. Recentlyseparated or divorced women reported being belittled and rejected by their mothers-in-lawbecause they were now considered orphans and were without a dowry. Some street children inYerevan shared the common characteristic that their mothers were separated or divorced andthereby rejected from the husband's family. In villages, single pensioners who were unable tocultivate their land, without close relatives nearby, and living solely on their pensions wereoften in terrible conditions.
1.59 In the qualitative assessment, the poorest of the poor were found often to suffer fromphysical or psychological immobility. Those whose earning opportunities were limited byimmobility-due to chronic ill health, physical or mental handicap, or family care-givingcommitments-were often extremely poor. In addition, many of the very poor experiencedfeelings of depression and hopelessness and were convinced their situation was unlikely toimprove. Some had tried different income-generating activities and failed and, as a result,believed themselves incapable of supporting their families. A number of households wereunwilling to start anything new after depleting not only their savings and assets but also theircapacity to tolerate risk. Many of the unemployed were looking for work in their field, oftenin industries that no longer operate on a large scale in Armenia. They found themselvessidelined from current changes in the economy, lacking the skills, confidence and energy toadapt once more to a new set of circumstances.
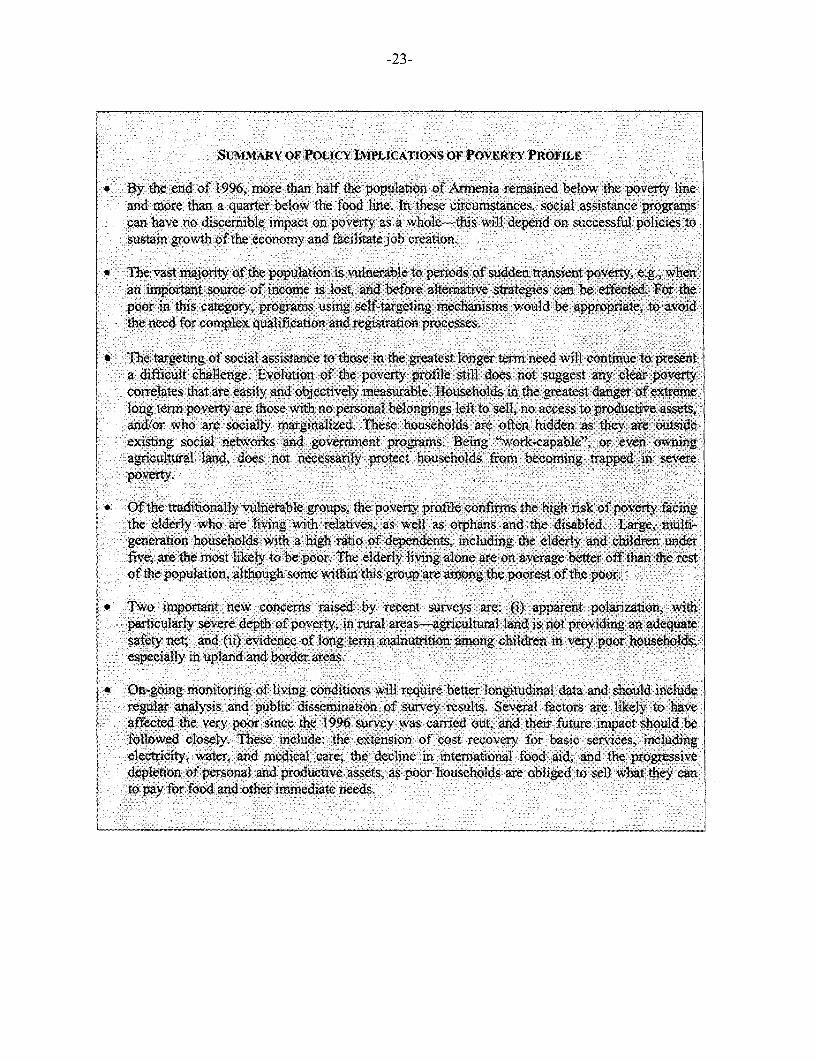
-23 -
*0 tBy the end of l1996 mretha hlfthei :populaion ofArmnaeaie below th oet lineand0 mor tana quarterblw h oo ie In teise crus>taess ocal asgsistance prga lca 0have no dscer ibe impat on port asawoet3 wl eedo su0; ccessful oi Iestsustai 0 0grwhof theecnmyand failitat joraion.t 0 0;00 00-t00:0 00:0000 00 0
an importantq sourcee of incme is 2lost, and0beforealt0erntv trtge can e ffct& Fr thpoor painths catgor progam using seftaretn mehaism would tbe aprpiat to2 avoidw
a ; diffc>ult, challenge. Evoluvtfsioofthte pov0ert proiestilldoes not 1 sugs n la oet
existingi socia netorsn government pogabms. Being wrkcpal',o ee onnagicltra land,v does no necssail proec hoshodfo beomn trpe insvr
* Ofth tEr. aditionlyvlneable goups the poveryp:rofile confirms he hgh iskoflX poet tfcni :the ldrlywh 04 0are livin wthrlives, -as 0well -asophans and th disabled.-iLarge, ulti
genraio hoshod wit a3 high ratio t;0 of depedns,icudn h elderly and ch iden nder;five,are te ot ikl t epor.Te elerldy lvngaon reo aeag ete offXthan " th rs
ofXfE oth populat(ion,.athu som withi lth s groupareamong- th pooes of th poor
particularlyseveedpho povertyl,in rualareas-grcltrlAlan s not povdigan aeqat
especialyinr upla and border areas.\
affected the veypoor 0 sineth 01996 survey 0was c£arried out,and0therftreimpc shul be*follwe clsey Thes include: th0e etnion of ^cost reoveryfor b:asic serieinclu2din:00ielectrcty waer and meia ae 1 thei decline 0in intenaionalfood -aid;ndthe proresiv
depltio ofprsnland prouctve tassets, 0as poorhousehld are: oledtsllwha heato pa for food and other immediate needs.00 $:f0000000000 0000f0000000 00000 -00000 0i~

2. THE ROLE OF SOCIAL ASSISTANCE IN A POVERTYREDUCTION STRATEGY
2.1 To understand the role social assistance can play in alleviating poverty in Armenia, itis important to view social assistance in the context of the overall strategy for povertyreduction. This strategy, which depends fundamentally on sustained economic growth,includes economic restructuring, labor market policies, the development and restructuring ofsocial insurance, and policies facilitating access to social services. The purpose of this chapteris not to provide an in-depth discussion of these components but to review the status andpossible future directions of the reforms in these areas. In some sectors, including labormarket developments and reform of the pension system, much more work is needed beforedetailed recommendations can be made.30 In the area of pensions, the government is startingto prepare a comprehensive reform of the pension system and has just recently begun carryingout some actuarial projections.3
The fundamental importance of sustaining economic growth
2.2 The central pillar of any poverty reduction strategy in Armenia must be sustainableeconomic growth. The country's poverty results directly from the recent economic crisisrelated to the breakup of the Soviet Union, the war and the blockade. Output in Armenia fellby nearly 70 percent between 1991 and 1994. As a result, poverty is severe and widespread,with more than 50 percent of the population falling under the poverty line. In thesecircumstances, no impact can be made in reducing poverty without substantial and sustainedeconomic growth.
2.3 To consolidate macroeconomic stability and accelerate growth, the Bank's CountryAssistance Strategy (CAS) stresses several important elements. Efforts are needed to raiseboth public and private saving levels to stimulate investments; in 1997, domestic savings werenegative. Fiscal consolidation and civil service reform are needed to increase the effectivenessof public expenditures. The size of the state sector must be reduced to increase privateactivities and generate savings, and the banking system's credibility must be restored. Formaland informal barriers to local and foreign investment need to be removed. Reforms of thejudicial and legal system must be accelerated to increase the system's transparency andfairness. Major bottlenecks in infrastructure need to be alleviated, restoring viability of theenergy, water and transport sectors. The lifting of the blockade imposed by some ofArmenia's neighbors should open up opportunities for Armenian entrepreneurs.
30 After the results of the on-going Household Expenditure Survey are available, a Labor Market Note will be prepared to review the issuesin detail.
3 The World Bank plans to assist the government in formulating its strategy for pension reform.

-26-
2.4 Although higher growth rates are necessary, they may be far from sufficient to reduceabsolute poverty. There is some evidence of slow abatement of poverty following the re-establishment of growth in 1995, but the incidence of extreme poverty has not been reducedand may even have increased. Growth needs to be more robust and must translate intoincomes for the general population. Even though real wages increased by over 29 percent in1996 and 19 percent in 1997, they were still (at US$20 per month on average) only one thirdof their 1992 level, Inequality of income distribution is very high, with a Gini coefficient ofabout 0.60 in 1996. The 1996 study, Armenia, Confronting Poverty Issues providesrecommendations that are still valid on a variety of policies that could increase the povertyreducing impact of growth: these include measures to improve investment in humanresources, to broaden income earning opportunities, and to strengthen the capacity oforganizations involved with poverty alleviation.
2.5 Even under the best possible policy environment for equitable economic growth,reducing transitional poverty takes time. During this time, the persistence of extreme povertyincreases the risk of social exclusion and the entrenchment of long term poverty. Somehouseholds will deplete their assets entirely, reducing their own and their children's chancesof coming out of poverty. Attention will also be needed, therefore, to target assistance tohouseholds which are marginalized and excluded from the benefits of growth.
The role of labor market policies and employment-generating programs
2.6 Armenia faces high uneimployment and high levels of inactivity. The unemployed, ofwhom half have not worked in the formal or informal sectors for a year or more, constitute 25percent of the labor force. Recent growth has created very few jobs. Moreover, having a jobdoes not guarantee escaping poverty in Armenia, because of the low level of remuneration forwork and the fact that those with jobs are often supporting many dependants (see Amnex 3).
2.7 Existing labor market regulations do not create major rigidities as legislation allowsfor reasonable flexibility in hiring and dismissing workers. Payroll taxes are high, however,and could potentially become a major constraint to job creation when the share of wages intotal costs increases, as wages rise through improvements in productivity. There is an obvioustradeoff between establishing a high level of payroll tax to finance pension andunemployment benefit and maintaining employers' incentives to hire. In the short run tomedium term, the balance should be in favor of job creation incentives.
2.8 To stimulate activities at the local level, some countries in transition have introducedjob subsidies, training and retraining programs, micro-credit and support to micro-enterprisedevelopment, and labor intensive public works. In a relatively depressed economy, such asArmenia's, with a relatively slow pace of economic restructuring, it is unlikely that jobsubsidies or training programs would be a cost-effective way to fight poverty. Introducing jobsubsidies would be liable to delay the restructuring of enterprises in Armenia. It would alsohave only a very short-term impact, if any, on employment when enterprises are alreadyinefficient and many workers are underpaid. A positive aspect of present economic policies isthat nearly all explicit subsidies to the enterprise sector have ceased (although some imnplicitsubsidies are still in place related to electricity and other utilities prices). Reducing thesesubsidies has contributed significantly to the macroeconomic adjustment essential tosupporting long-term growth; introducing job subsidies could jeopardize these achievements.

-27-
2.9 Training and retraining programs would be difficult to design because there is noevidence that lack of skills in the labor force is, at present, a serious constraint to economicgrowth in Armenia. Industries and services with new technology are still limited. Theunemployed appear quite capable of actively and effectively retraining themselves in thoseareas where demand has recently been generated by foreign investment, primarily computerskills, foreign languages, and accounting. Small private training institutions have provedsuccessfuil in filling training gaps in these areas. Lack of demand for persons with traditionaltechnical training has resulted in a large number of students dropping out of technicalcolleges. Since 1990, primary and secondary education enrollment has remained stable whilethe number in technical and vocational education has plummeted. Programs oriented to smallbusinesses and the self-employed in management, finance and marketing, often offered byforeign NGOs, have had limited success to date. Small enterprises are currently facing manyother more serious constraints. Demand for training in management will likely develop laterwhen local competition increases and managers need to become more efficient to survive.
2.10 At this stage, micro-credit and support for the self-employed and small enterprisesshould offer greater opportunities than training or re-training programs. Small businesses andself-employment constitute the largest sector by far for job creation in the economy,especially if private farmers are considered small businessmen: farmers and the self-employedaccount for about 50 percent of total employment; the non-fanning self-employed account for12 percent (see Annex 3). Access to formal credit, however, is still a major obstacle for smallbusinesses because of the banking sector's fragility and risk aversion. Many small businessesand the self-employed operate in the informal sector, making access to official credit evenmore problematic.
2.11 The primary complication regarding micro-credit and support for the self- employed isthe high cost per beneficiary of outreach and administration. Additionally, the sustainabilityof financed projects can be an issue in a country where many factors other than financing(such as the need for personal connections and market access) act as constraints to thedevelopment of small businesses. However, some successful experiences, especially inagriculture, with the Agriculture Credit Bank of Armenia (ACBA), show that micro-creditscan be an effective tool to help the poor climb out of poverty. A number of NGOs and UNagencies, including Save the Children, Oxfam, UNHCR, International Organization forMigration, and Eurasia Foundation, are also piloting micro-credit activities with somesuccess.
2.12 Micro-credit and other programs to support to small enterprises may have littleimmediate impact in combating extreme poverty and social exclusion in Armenia, becausesmall businesses do not generally recruit from among the poorest in the population. Micro-

-28-
credit cannot, therefore, substitute for social assistance. Nevertheless, the current imrportanceof self-employment in job creation in Armenia makes this an important area of intervention.Even though micro-credit programs may not immediately benefit the poorest, these programsshould not be weakened by efforts to target them only to specific categories of the population,such as the unemployed, or by administering them through agencies with no specific expertisein the area, such as employment service offices. Nor should they be considered charity.Micro-credit programs have proved effective when they are administered on real bankingterms, with very limited subsidy of the interest rate, as in the ACBA model (see box above).More effort is needed to test micro-credit approaches in urban areas on a larger scale than thevery limited experiments that "have been carried out so far.
2.13 Public works programs are potentially an important complementary activity to socialor unemployment assistance to support the poor. Three different approaches to public worksprograms can be distinguished, according to their primary objective: (i) to provide subsistenceto the poor unemployed; (ii) to provide a work test for social assistance benefits; and (iii) toimprove social and economic infrastructure. The first approach has the advantage ofmaximizing the immediate impact on poverty; this is liable to be at the expense ofproductivity, however, unless substantial resources are devoted to supervision and monitoring.The aim is to provide better targeted assistance to the poor unemployed without reducingwork incentives or promoting an entrenched "dependent mentality." Benefits in exchange forwork should, therefore, be lower than market wages and should be administered by local orregional government. This type of public works program has not yet been attempted inArmenia, but may be tested on selected groups in the future. Experience in other cotutries(including India, Chile and Argentina) has shown that it works better when the targetunemployed are unskilled workers, while in Armenia the unemployed are for the most part atleast semi-skilled.
2.14 A second approach is to use public works as a work test for social assistance benefitsprovided to the poor who are able to work. In this case too, the level of the benefits should beunder the market wage. At the same time, the level of benefit must be high enough to allowthe poor working on the scheme to survive without depending on other coping activities. Thiswould not be feasible in Armenia at present, considering the very low level of benefits andwages. Another disadvantage of such programs is that they can have very high administrativecosts for a small improvement in targeting outcome.
2.15 A third type of public works program is designed primarily to support growth andimprove social and economic infrastructure. Projects are identified according to local orcomnunity priorities. The drawback is that the costs per job created can be relatively high,when labor costs typically constitute only 20% to 30% of the total. The Armenia SocialInvestment Fund is a good example of this approach (see box below). The World FoodProgram is also running a food-for-work program with local governments and municipalitieswhere it is in high demand; it pays locally recruited workers in food for work on smallprojects identified by the regions.

-29-
ASI: PIILC WRK FOR COMMUNITfY DtVELIMN
Sic its cet ion0 in 95 ASIF hsimlem4ntedmoeha 120 small-scale; infratrutrreaiiainpoet at9 anX; avera0ge cost of UtS$50,000 eah These000 prjcs aeha ostv
2 0 peren0 ;t o ec wr agreement XIn treeyeas, ASFhas crate 1O;000 ¢< 0 wokas n a
capbiltyof loca governmentsadmncplteinmngnifrtutreehbiaioprojcts.Howeer,man of the joscete r emoay
2.16 In summary, the existing regulatory and policy framnework for the labor market isreasonably supportive of job creation. There is considerable scope, however, for piloting andextending different formns of support to the work able poor, in the areas of micro-credit andmicro-enterprise support, and by expanding public works program.s.
The role of education
2.17 In view of the high level of education of Armenia's population and the lack of rawmaterials, protecting A-rmenia's investment in human capital is particularly critical for bothgrowth and poverty reduction. Protecting access of the poor to quality education may be thesingle most important factor in ensuring increased equity in the economy and society. Anincreasingly strong correlation should be expected in the future between low education leveland poverty.
2.18 Access to basic education is not a major issue at this stage for the poor in Armenia:enrolment rates have remained very high (around 99 percent) despite the fiscal crisis,although there is some evidence from qualitative surveys that attendance may be less regularamong poor children (reliable data on attendance rates are not available). The most crucialconcerns in this sector are the quality of education received by the poor, and their access tohigher education. The education assessment system is still too weak to allow objectivemeasurement of differences in the quality of education offered in public schools, eitherbetween districts or between poor and non-poor children. Nevertheless, there are severalreasons for concern. First, the shortage of public funding makes schools dependent on privatecontributions from parents and community sponsors to meet essential costs. As a result,substantial inequities are likely to exist between schools in the quality of education provided,depending on the relative wealth or poverty of the community. Second, the private costs ofattending public school, as revealed in the SDS education survey, are substantial. When poorhouseholds are unable to pay the charges levied by schools and teachers, including informalpay-ments as well as formal charges for services outside the minimum core curriculum, thereis a danger that a two-tier system emerges within public schools discriminating against poorerpupils. Third, the public secondary school curriculum is not sufficient in itself to preparepupils for competitive entrance to higher education. Access to higher education dependstherefore on private tutoring, the costs of which are beyond the means of very poorhouseholds.
2.19 The government is embarking on important reforms of general education, introducingincentives to use teachers and buildings more efficiently, increasing the role of school and

-30-
community-level in school management, and providing funding to schools on a lump sum, percapita basis. A new system of textbook provision has already been introduced, improving thequality and reducing the costs of books to parents, and ensuring that even the poorest childrenhave access to the books they need. Additional measures are needed to monitor and promoteequity in the general education system, including the possibility of adjustment in the new percapita funding formula to account for poverty, as discussed in Chapter 4. Attention is alsoneeded to the linkage between public secondary and tertiary education, and to the allocationof post-secondary scholarships on the basis of need as well as merit.
The role of social insurance
2.20 Social insurance can have an important role in reducing risk and vulnerability, andtherefore can potentially be an important component of a poverty reduction strategy. Socialinsurance typically includes old age pensions, unemployment benefits and health insurance.According to different systems, social insurance schemes can be voluntary or mandatory, stateor privately managed. Health care in Armenia is completely covered under the state budgetand by direct payments from patients; no contributory health insurance system exists. Thissection will look at old age pension and unemployment insurance in Armenia.
2.21 There are several constraints to social insurance in the short term in Armenia: thesizeable population of poor; the low levels of public and private savings, due to low incomesand fragility of the formal sector; and the large population of self employed in the infc,rmalsector. As a result, social insurance cannot be expected to cover social risks for householdson a universal basis in Armenia in the short to medium term. It will require majorstrengthening if it is to have an impact in the longer term. This should not be achievedthrough increases in the payroll tax to finance the contributory insurance system. Despite thereduction of the payroll tax in December 1998, to 28 percent for employers and three percentfor workers, this tax is still high and is a disincentive to formal employment. An importantobjective of labor market policy should be to reduce the level of this tax in the medium term.
2.22 The old age pension system. The old age pension system in Armenia is a pay-as-you-go system (PAYG), financed by the payroll tax. The current system provides an extrernelylow flat benefit (averaging US$7 per month, or one third of the 1997 poverty line estirmate).Since independence, the pension system has nearly collapsed, trapped between dramatic dropsin contributions and the extensive coverage of the population. In 1997, the system madepension payments to 600,000 people when only 480,000 are estimated to be over age 60. Only570,000 people contribute to the pension plan. However, in contrast to many other countries,the problems of the PAYG system are due less to demographic changes than to the erosion ofthe tax-base. Because of fluctuation in revenues of the pension fund due to tax collectionproblems, the system does not operate as insurance, and the size of benefits changes ainuallyin anticipation of increases or decreases in revenue collection.
2.23 The government has taken very important steps in instituting reforms to increasesustainability of the PAYG system. In December 1995, it passed the Pensions Reform lawwhich, in addition to streamlining many benefits, introduced a gradual increase in theretirement age to 65 years for men and 63 for women. This increase will be fully implementedby 2011. Despite these reforms, the number of beneficiaries remains high (49 percent of theworking age population) and as a consequence the system remains financially fragile.Revenue can be improved, especially by strengthening the system to collect contributions
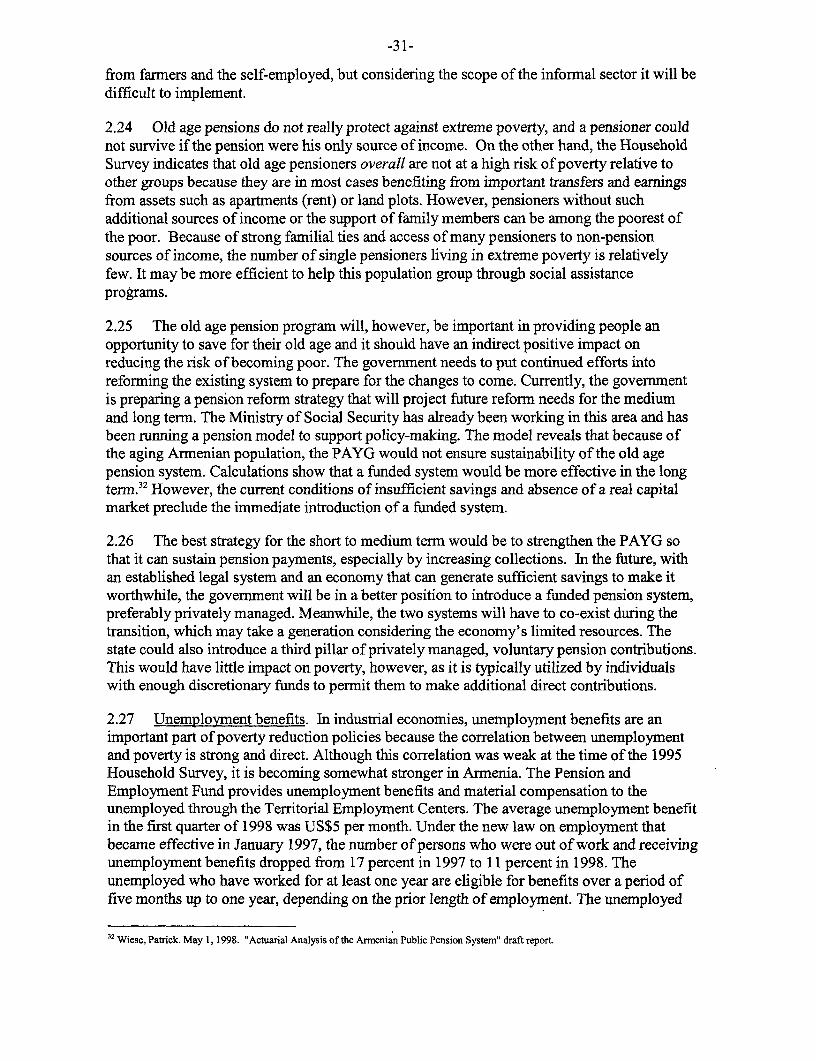
-31-
from farmers and the self-employed, but considering the scope of the informal sector it will bedifficult to implement.
2.24 Old age pensions do not really protect against extreme poverty, and a pensioner couldnot survive if the pension were his only source of income. On the other hand, the HouseholdSurvey indicates that old age pensioners overall are not at a high risk of poverty relative toother groups because they are in most cases benefiting from important transfers and earningsfrom assets such as apartments (rent) or land plots. However, pensioners without suchadditional sources of income or the support of family members can be among the poorest ofthe poor. Because of strong familial ties and access of many pensioners to non-pensionsources of income, the number of single pensioners living in extreme poverty is relativelyfew. It may be more efficient to help this population group through social assistanceprograms.
2.25 The old age pension program will, however, be important in providing people anopportunity to save for their old age and it should have an indirect positive impact onreducing the risk of becoming poor. The government needs to put continued efforts intoreforming the existing system to prepare for the changes to come. Currently, the governmentis preparing a pension reform strategy that will project future reform needs for the mediumand long term. The Ministry of Social Security has already been working in this area and hasbeen running a pension model to support policy-making. The model reveals that because ofthe aging Armenian population, the PAYG would not ensure sustainability of the old agepension system. Calculations show that a ffnded system would be more effective in the longterm.32 However, the current conditions of insufficient savings and absence of a real capitalmarket preclude the immediate introduction of a funded system.
2.26 The best strategy for the short to medium term would be to strengthen the PAYG sothat it can sustain pension payments, especially by increasing collections. In the future, withan established legal system and an economy that can generate sufficient savings to make itworthwhile, the government will be in a better position to introduce a funded pension system,preferably privately managed. Meanwhile, the two systems will have to co-exist during thetransition, which may take a generation considering the economy's limited resources. Thestate could also introduce a third pillar of privately managed, voluntary pension contributions.This would have little impact on poverty, however, as it is typically utilized by individualswith enough discretionary funds to permit them to make additional direct contributions.
2.27 Unemployment benefits. In industrial economies, unemployment benefits are animportant part of poverty reduction policies because the correlation between unemploymentand poverty is strong and direct. Although this correlation was weak at the time of the 1995Household Survey, it is becoming somewhat stronger in Armenia. The Pension andEmployment Fund provides unemployment benefits and material compensation to theunemployed through the Territorial Employment Centers. The average unemployment benefitin the first quarter of 1998 was US$5 per month. Under the new law on employment thatbecame effective in January 1997, the number of persons who were out of work and receivingunemployment benefits dropped from 17 percent in 1997 to 11 percent in 1998. Theunemployed who have worked for at least one year are eligible for benefits over a period offive months up to one year, depending on the prior length of employment. The unemployed
32 Wiese, Patrick. May 1, 1998. "Actuarial Analysis of the Armenian Public Pension System" draft report.
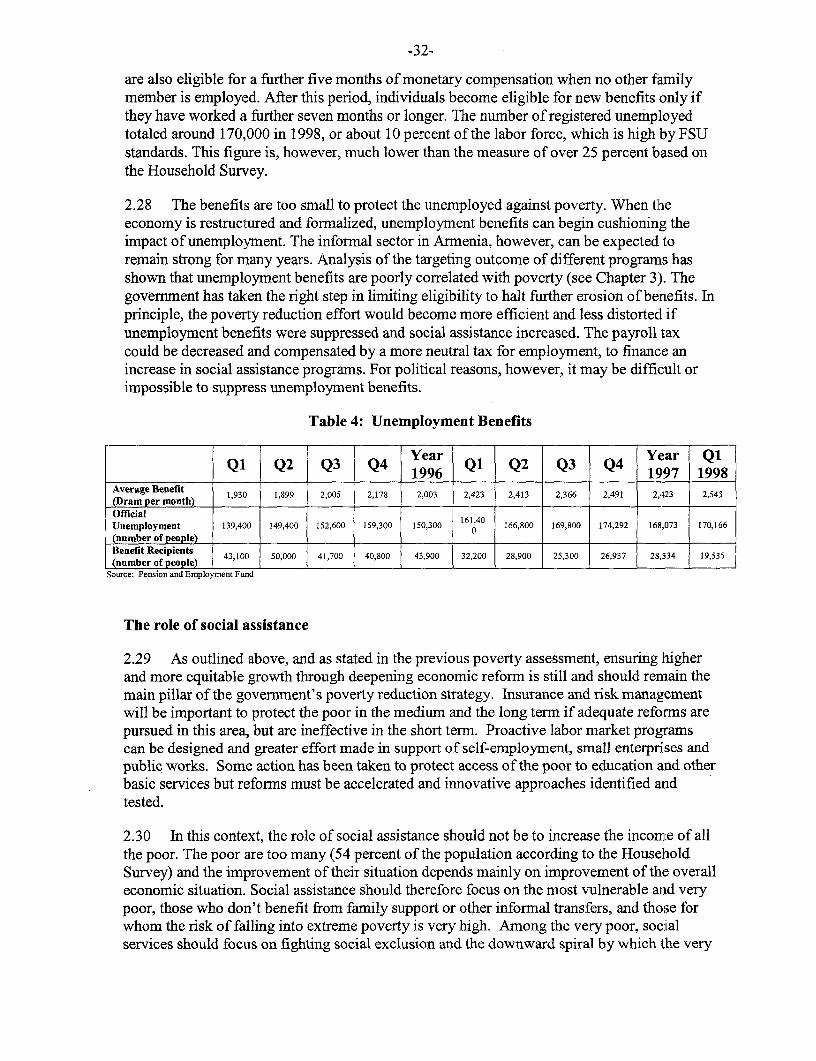
-32-
are also eligible for a further five months of monetary compensation when no other familymember is employed. After this period, individuals become eligible for new benefits only ifthey have worked a further seven months or longer. The number of registered unemployedtotaled around 170,000 in 1998, or about 10 percent of the labor force, which is high by FSUstandards. This figure is, however, much lower than the measure of over 25 percent based onthe Household Survey.
2.28 The benefits are too small to protect the unemployed against poverty. When theeconomy is restructured and formnalized, unemployment benefits can begin cushioning theimpact of unemployfment. The informal sector in Armenia, however, can be expected toremain strong for many years. Analysis of the targeting outcome of different programs hasshown that unemployment benefits are poorly correlated with poverty (see Chapter 3). Thegovernment has taken the right step in limiting eligibility to halt further erosion of benefits. Inprinciple, the poverty reduction effort would become more efficient and less distorted ifunemployment benefits were suppressed and social assistance increased. The payroll taxcould be decreased and compensated by a more neutral tax for employment, to finance anincrease in social assistance programs. For political reasons, however, it may be difficult orimpossible to suppress unemployment benefits.
Table 4: Unemployment Benefits
Ql Q2 Q3 Q4 Year Ql Q2 Q3 Q4 1997 19981996 1______ 97__ 1998_
Average Benefit 1930 1,899 2,005 2,178 2,003 2,423 2,413 2,366 2,491 2,423 2,543(Dram per month)OfficialUnemployment 139,400 149,400 152,600 159,300 150,300 161,40 166,800 169,800 174,292 168,073 170,166
0(number of people) I I I_I_I
Benefit Recipients | so,ooo 41,700 40,800 43,900 32,200 28,900 25,300 26,937 28,334 19,535(number of people) I I__ __ _I_ _ __ _ _ __ _ _ I__ _ _ _ _
Source: Pension and Employment Fund
The role of social assistance
2.29 As outlined above, and as stated in the previous poverty assessment, ensuring higherand more equitable growth through deepening economic reform is still and should remain themain pillar of the government's poverty reduction strategy. Insurance and risk managementwill be important to protect the poor in the medium and the long term if adequate reforms arepursued in this area, but are ineffective in the short term. Proactive labor market programscan be designed and greater effort made in support of self-employment, small enterprises andpublic works. Some action has been taken to protect access of the poor to education and otherbasic services but reforms must be accelerated and innovative approaches identified andtested.
2.30 In this context, the role of social assistance should not be to increase the incomLe of allthe poor. The poor are too many (54 percent of the population according to the HouseholdSurvey) and the improvement of their situation depends mainly on improvement of the overalleconomic situation. Social assistance should therefore focus on the most vulnerable anrd verypoor, those who don't benefit from family support or other informal transfers, and those forwhom the risk of falling into extreme poverty is very high. Among the very poor, sociialservices should focus on fighting social exclusion and the downward spiral by which the very

-33-
poor lose community ties and enter a survival mode with a passivity that is often transferredto the next generation. (Industrialized market economies are typically characterized by thistype of poverty). Social assistance should not create or promote dependence on charitablesupport but provide a means by which the disenfranchised can reenter society. This challengeis enormous for three reasons:
(a) This approach is completely contrary to the Soviet principles of socialassistance. Poverty and unemployment were marginal issues in the Sovietsystem and any social assistance was based on supporting specific groups thatwere viewed as socially deserving of special support and state recognition. Thismindset remains entrenched in Armenia where social assistance is closelyassociated with privilege. Because the poor tend not to be particularly vocal,turning this perception around has proved difficult.
(b) As a result of the depressed economy, both the government and non-governmentsector have very limited resources at their disposal to implement socialprograms. These economic limitations also constrain the possibilities for thepoor to help themselves out of poverty, through employment and other copingmechanisms.
(c) The large scale of the informal economy, which is likely to remain substantial inArmenia for many years, makes it particularly difficult to identify the poor.
In the following chapters, this study examines the scope for improving social assistanceprograms and targeting mechanisms to meet this challenge.


3. IMPROVING SOCIAL ASSISTANCE TO PROTECT THEPOOR
3.1 Social assistance can be defined as support provided to poor and vulnerable populationgroups by the state and non-government structures in order to assist these groups in achievinga minimal acceptable standard of living. Social assistance is different from social protection inthat it does not include social insurance mechanisms by which some groups can insurethemselves against risks, such as lack of revenue associated with old age or unemployment.In Armenia, the Ministry of Social Security is the state structure responsible for socialassistance. It manages cash benefits, several social pensions provided through the PensionFund, family allowances (now replaced by a proxy means-tested Family Benefit), variousspecialized institutions dealing with vulnerable groups, and in-kind support to differentcategories of households and individuals at risk of poverty.
3.2 The Ministry also plays an important role in controlling and monitoring thedistribution of humanitarian assistance from bilateral and multilateral organizations.Humanitarian assistance was crucial to reducing the hardship on the population during theworst years of the economic crisis, from 1993 to 1996. A number of local Armenian non-government organizations operate a limited level of social assistance programs, often withfinancial support from external donors. In addition, multilateral organizations and foreignNGOs (including UNICEF, Save the Children, Oxfam, Medecins Sans Frontieres, Care, andDiasporan organizations such as the Armenian General Benevolent Union and the Fund forArmenian Relief) support social assistance programs targeted to the poor. Regions (marzes)manage a few institutions to help vulnerable groups but their role in providing socialassistance is limited.
3.3 Social assistance funding is far from negligible in relation to the government's budget.The 1997 state budget contributed an estimated US$32 million, or about 8 percent ofgovernment expenditures, to social assistance. This level was increased to 10% of totalgovernment expenditure in 1998. Including humanitarian assistance in cash and kind ($24million of in-kind assistance and some US$2 million from local NGOs and the Diaspora), thisamounted to about 3.8 percent of GDP in 1997. Other costs included free health care to themost vulnerable groups through the BBP (Basic Benefit Package) and, more recently, freetextbooks for the poorest children, through a program begun in 1998.
The State-run Social Assistance System
3.4 The Armenia government has recently undertaken major reform of social assistanceprograms. From January 1999, the primary social assistance program is the Family Benefit,replacing all existing cash benefit programs including child allowances and other socialtransfers. In December 1998, just over 500,000 families applied for the new benefit. Thenumber of recipient families amounted to 221,000 by March 1999 and is expected to reach

-36-
230,000 by the end of April. Selection has been based on the vulnerability score calculatedthrough the Paros formula (see Chapter 4). The total budget for the benefit is 22 billion dramsfor 1999 (approximately $41 million, up from $30 million in the 1998 budget).
Table 5: Government ExpendituresOn Child Allowances and Social Transfers
(in thousand drams)
1995 1996 1997 By Oct. 1998
Child Allowances 9,087,000.0 7,101,757.0 7,504,802.2 5,853,200.0
Social Transfers** N/A N/A 2,980,527.0 5,275,000.0Source: Law on State Budget; Ministry of Finance and Economy.*llocated to cover expenditures for both child allowances and social transfers.* *Social transfers were introduced in July 1997 to replace state subsidized "privileges " to specific groups.
3.5 The Ministry of Social Security, in conjunction with the Humanitarian AssistanceCommission (or HAC, which has been under the Ministry since 1997), oversees thedistribution of humanitarian assistance, which has been dramatically reduced from its peak in1996. The government developed a system of proxy means testing (the Paros Program) totarget humanitarian assistance to the neediest. Development of the system was financed byUSAID and designed by the Yerevan Institute for Computerization Research andDevelopment, (YICRD). First introduced in December 1995, the system has since beenl usedfor 18 programs of distribution of humanitarian assistance provided by various donors andtotaling US$34.5 million. It is this system that is used now to target the new Family Benefits.
Table 6: Food Aid Assistance to Armenia (thousand USD)33
1994 1995 1996 1997 1998 (planned)
10,538 6,519 57,219 38,632 25,808
Table 7: Emergency and Relief Assistance (thousand USD)34
1994 1995 1996 1997 1998 (planned)
4,118 50,550 93,413 71,999 47,699
33 The estimates are based on the UTNDP Development Cooperation Report database. Note that all the figuresreflect both bilateral and multilateral assistance to Armenia.
34 Assistance in medical, non-food commodity and targeted relief supplies. The figure includes financing ofmedical equipment and medicines to policlinics and hospitals.

-37-
3.6 The humanitarian assistance programs were distributed with the support ofinternational NGOs, UN agencies (WFP, UNHCR) and FAR (Fund for Armenian Relief), anArmenian Diaspora Organization that helped with overall monitoring of the system. Inaddition, the social services center of social security played an important role in Parosregistration and in overseeing some distribution.
3.7 Although housed under the marz, the social services centers of social security havesome autonomy in the implementation of the policies and programs defined by the Ministry ofSocial Security. They are also supposed to provide social services which theoretically requiressocial workers to visit homes of those unable to come to the centers; and offer familycounseling, emergency help in finding temporary shelters, and various fonns of assistance tothe disabled and elderly. In practice, however, lack of incentives have relegated these tosecondary activities.
3.8 The state system is presently lacking in three ways: (i) clear objectives andapproaches to social assistance; (ii) funding and proper staff incentives; and (iii) institutionalcapabilities for outreach. Confusion exists among the population between social assistanceand social insurance based on the capacity of individuals or households to insure themselvesagainst risk. The Pension Fund continues to pay out some social pensions that have nothing todo with social insurance. Few people perceive old age pensions as insurance since no linkexists today between contributions and benefits. As in other areas of the government, verylittle financing is available for social assistance, wages are extremely low, and the budget aswell as outreach is limited by operating costs and proper incentives (per diem, etc.). Socialworkers often have inadequate training and few hold a degree in their field. Some retraininghas been carried out by USAID and TACIS but is still extremely limited in relation to needs.
3.9 The state's capacity to provide non-cash benefits is limited. The Ministry of SocialSecurity operates six orphanages, three homes for the elderly, and two rehabilitation centersthat provide free medical care and psychological counseling to the disabled. Operating onlimited funds, they must often rely on humanitarian assistance to complement state funding.The Ministry of Education also runs nine children's institutions for socially vulnerablestudents and those with minor disabilities; two more institutions for disabled children areoperated by the'Ministry of Health. The majority of institutions for children, housed under themarz (regions), also depend on humanitarian assistance and have been expanding in recentyears. Many of the children in these institutions do not need to be institutionalized and couldbe living at home, with some minimal support provided to families, or with fostet parents.
3.10 Where caring for the disabled and orphans is concerned, the government continues torely on the approach it inherited from the Soviet system of institutionalizing sociallyunprotected children in special boarding schools. Not only is this system financiallyinefficient, but it poses severe humanitarian problems. Such children would be better offresiding in regular communities and attending normal schools instead of being separated fromtheir community and family and thereby marginalized by society. Conscious of this problem,the government is preparing a strategy to reduce the number of residential institutions forchildren and replace them with community based services.
3.11 Another major limitation to the state system has been a general lack of localgovernment involvement in the lives of the citizens it serves and in particular in helping thepoorest and vulnerable. Organizations such as municipalities and village councils that areelected by the people are more accountable to the population than the central state structure

-38-
and should have an important role to play, given their strong potential in delivering basicsocial services. In many countries, local governments provide social assistance programs.Studies of other Eastern European countries show that targeting by municipality and villagecouncils has a good outcome. The system also urgently needs a clearer definition of roles andresponsibilities between the Ministry of Social Security, the marzes, and local governmentbodies.
NGO Programs
3.12 NGOs play a crucial role in the delivery of social safety net projects in OECDcountries and their role regarding social assistance in Eastern European countries is growingas well. In Poland and Hungary, the government has contracted NGOs to manage severaloutreach programs because it recognizes that these organizations are often in a much betterposition to work closely with the population than are central government offices. In the yearssince independence, NGO programs have grown in Armenia, many of them created in theaftermath of the 1988 earthquake. More than 1,900 non-govermnental organizations andassociations are registered locally and more than 700 local NGOs have received training at theNGO Training and Resource Center (which is supported by the Armenian Assembly ofAmerica and funded by USAID). Also, donors such as USAID have funded capacity-buildingprograms. Many local NGOs have also benefited from small grant programs managed byvarious donors, international NGOs and UN organizations. They are active in areas of elderlyand nursing care, child support, employment generation activities, and support to refuLgees andthe disabled. Some local NGOs, such as Mission Armenia (see Box), fill an important vacuumwhere the state is not at all active, such as outreach for the elderly living alone or support forthe home-bound disabled.
3.13 However, the institutional capacities of local NGOs are still hampered by limitedfunds and operate on a very small scale. They often lack program design skills and capacitiesin areas such as budgeting, financial management, and reporting or monitoring systems. Statecollaboration is still at an embryonic stage and NGOs are often viewed more as competitorsthan collaborators. In some cases, as with Mission Armenia, they are officially recognized andprovided with a specific government mandate which has helped them carry out their tasks, buthas not increased collaboration between social services centers and NGO programs.Diasporan organizations have also played a limited role in supporting local NGOs but stillprefer their own implementation mechanisms or the All Armenia Fund, an autonomous stateorganization, rather than supporting local organizations.

-39-
Mi14 ThwArmeniaiesinc1 wen a nrupofen plyestNGof thaw doervno CifmeretSotwe nitut tss onfa voluntaryfbasistonhelp ta Nssocnationsars.kharefes humandthe 1n989rgiarth e victims by distrbtngfo and proile
foo gommoitesnt ados n idtngf the fithscial nservies orAxereaisofl ret a trit n ln199t3 iMAetededsori thece ofny its arctiest fothr vulanroablevgrousngder p0ensioners,c hildsen, orp ha, lonelym motrfrm ITn 19f934u995c Mr rmanita6i programs.icld kerenmiastibuation Ai Cynrdi schoo persosa and mHdCal crf the edeOy, distribi d of fho
Mnschyofls Sinnce 1995 Ecooms min madaes hasiblefome deteivering wihpersonralhme are tcosidereldel peopme.ithranks towee,thee suprt nof guAidelandes MAlln povidesa coseticuestuma900asiangl bedoriddn want haondisapped eHderl inaYesen its hageens;as establishe mrediaroomsa rgding4 ctmuna centersa tA peovid corrnslytinge servicews anxprimaytad to addes tes
rfuges. MA has cetednits own dathe gofe3000tvulneabe usiung diferetiont den
cotnandependncse MA malso works Nonstrengethening ofitheinformal netwrksbyte inolvingpratnegohbors ah fndreaivns in" supproatingatheedrly Mhan haocs ben reciigwoganizd byattheyArmeniand
whrie Miewniterts adeacre as aneothfw organization.hs thatnorkfcu ins parsotnrsipue wth the
governmnt 5 0 0 to serve isabled nd singl elderly
3.14 The legal framework for NGOs in Armenia is incomplete and unfriendly. CurrentNGO law does not differentiate between different types of NGOs (i.e. professionalassociations vs. charitable, humanitarian organizations) in terms of benefits and privileges.The government does not offer any financial incentives or tax breaks for charitablecontributions nor is there any legal precedent for philanthropic activity under Armenian law.Only goods are exempted from VAT if purchased for "humanitarian programs." TheHsumanitarian Aid Coordination Commission (HACC) of the GOA, which is chaired by theMinistry of Finance and Economy, is responsible for determining which programs areconsidered "humanitarian." However, there are no guidelines spelling out what constituteshumanitarian aid or on what grounds the HACC makes its judgements; even NGOs areunclear regarding the criteria. A new law currently under review is expected to address theseissues, but it is not known when the government will take it under consideration. Thecontinual dependence of many local NGOs on external funding has contributed to a desperate"go where the funding is" approach rather than a focus on defining who and what they are andwhere they want to advance as an organization. This donor focus has also contributed to theerroneous perception that NGOs have formed primarily to make a living for their individualmembers out of the proceeds of international funding35.
The Status of the Social Assistance Reform
3.15 The government, conscious of the system's shortcomings, has begun reforming socialassistance by preparing a law that will delineate a clear separation between social insuranceand social assistance and implement the concept of the poverty line. The law also clarifies therespective roles of the Ministry and marz in delivering social assistance programs, which willprove vital to improving the effectiveness of social assistance and supporting old age pension
35 Save the Children (USA). 1998. "Overview of the Operating Environment for NGOs in Armenia". Mimeo.
-40-
reform. The government has also introduced a method of targeting social assistance cashbenefits using a proxy means test. On December 9, 1997, a decree was passed to replace childallowances and other social benefits with a Family Benefit targeted to poor families. Asoutlined above, the Family Benefit was actually introduced in January, 1999. This step was amajor shift from the categorical system oriented to socially deserving members of society to asystem focusing on protecting the poor. At the same time, the Ministry of Education andScience is preparing a strategy for de-institutionalization of children, including piloting ofcommunity-based support systems.
3.16 With TACIS support, the Ministry is working to improve the capacity of the socialservices centers. With USAID and IDA financing, the Ministry has computerized theTerritorial Centers for social assistance to manage the proxy means testing database forcalculating and paying local cash benefits. It has also published, under the TACIS project, amanual for social workers. Yerevan State University, with help from American universities,has created a training program for social workers (see Box below). In November 1997, thegovernment approved a programn to improve social assistance services to single pensionersand the homebound disabled, including support in such areas as household management, legalcounseling, medical care and psychological counseling. About 2,000 pensioners are currentlyserved in Yerevan, many by the 350 Medical University students who voluntarily deliverhome care, an interesting attempt to improve outreach.
A PROGRAM OF TRAINING FOR SOCIAL WORKERS
Yerevan State University's (YSU) Sociology Department, with the support of the EUTempus program, has initiated undergraduate (BA) and graduate (MA) programs in social workand social policy. Program curricula have been developed with help from foreign specialists fromGermany and the UJK. Experts from the University of Connecticut, working together with the YSUSociology department, have developed and conducted brief training programs for professionals.Since 1993, 150 specialists have been trained, including 43 heads of social services centers. In1997, the Sociology Department published the Handbook on Social Work.
3.17 A number of fundamental issues regarding social assistance reform must be addressedin order to develop a, long-term vision that will support reforms, some of which have beenpartially addressed by ongoing reforms. Any social assistance program must remain flexiblein order to adapt to future developments; as the poverty situation in Armenia evolves,government revenues may increase and a more sustainable social insurance system can comeinto being. Recently, the most fundamental change in the system was the focus of socialassistance on the vulnerable and very poor, a step that involves targeting the main socialprograms (see Chapter 3). A second priority is to avoid a deepening dependence on statetransfers, which could not only drain the state of its limited resources, but have a negativeimpact both psychologically for the person receiving assistance as well as for society as awhole. A third effort should involve outreach to identify groups or individuals who, alreadyexcluded, are not reached by various ongoing programs.

-41-
The Role of the Family Benefit
3.18 The initial step is to assess what the role of the Family Benefit should be for both theimmediate future and the long term. Cash benefits are designed to help households who havefallen below the line of absolute poverty, enabling them to subsist without fully depletingtheir and their children's essential assets - which would result in them losing their ability tore-enter society when conditions improve.
3.19 The Family Benefit should target the poorest, be at a high enough level to cover basichousehold needs, and not be available on a pennanent basis. Cash benefits can easily createthe perverse effect of dependency, discourage recipients from looking for jobs (workdisincentive effect) or seeking other sources of revenue, and discourage more solventhouseholds from transferring money or providing support to poorer households (crowding outeffect). Currently, the risk is minute because in most cases the benefit is so low that familiesreceiving assistance must continue searching for additional support to survive. On the otherhand, benefit levels should not be so low as to bring about complete depletion of the assetsthat can enable households to improve their situation
3.20 Another important question for policymakers is whether people who are capable ofworking should be eligible for a Family Benefit. Making any family with a work capablemember ineligible for the benefit would be feasible only ifjoblessness were very low and ifunemployment benefits covered most cases of unemployment. This is not the case in present-day Armenia. However, in cases where some family members can work, benefits could becontingent on their being employed through a publicly managed work fare scheme. Althoughthere is no capacity at the moment to manage such a program on a national basis, this could bean alternative for the future. Work fare should be piloted as a separate program independentof the Family Benefit (see Chapter 2).
3.21 Another issue is how various elements can be factored into the benefits equation tomake it an effective tool against poverty while taking into account the state's fiscalconstraints. Some projections have been carried out using different scenarios: economicgrowth, number of poor, and size of benefits. These scenarios assume that the impact ofgrowth on poverty reduction has remained unchanged in recent years and that the level offunding available for poverty benefit will stay the same in proportion to the budget.
3.22 In the first scenario, growth is high at 9 percent per year and social assistancespending represents 44.5 percent of the budget of the poverty gap by the year 2007 ascompared to 13 percent in 1998. In a less optimistic growth scenario, 4 percent growthannually, social assistance spending represents 23.9 percent; 7 percent growth annually,brings the latter number up to 35.7 percent. These figures make clear that if growth issustained and the fiscal situation of the state improves accordingly, in ten years socialassistance might become an important tool to protect poor and vulnerable groups (see Annex4).
Managing the Decrease in Humanitarian Assistance
3.23 Even if not well targeted, as shown in the 1995 Poverty Assessment, humanitarianassistance nevertheless played a significant role in cushioning the effects of the economiccrisis on the population because of the sizeable amount of funds available. The rapid decreasein humanitarian support in 1996 and 1997 left many households in very vulnerable

-42-
circumstances, which offers another argument for improving the targeting of poverty benefitsand introducing other programs to help the poorest access food. Targeting humanitarianassistance to institutions such as orphanages, boarding schools, and rehabilitation centlers hashelped protect vulnerable groups with few other means of survival. But it has also had theperverse effect of increasing staiFf and attendants attracted by the generous distribution of foodto already ineffective institutions.
3.24 The decrease of humanitarian assistance must be done in parallel with an improvementof targeting through self targeting schemes and special outreach programs. Communityprograms and the creation of employment through food for work programs should beencouraged on the model piloted by WFP. NGOs could be encouraged to develop somlespecific outreach programs such as soup kitchens and targeted support such as food deliveryto the disabled or homebound pensioners.
The Need to Strengthen Outreach
3.25 Outreach should be an essential dimension of social assistance for a variety ofimportant reasons. One of the gravest risks Armenia could face would be the emergence oflong-term structural poverty because people who have been deprived of education, goodhealth and community connections would be unable to reintegrate into society and attainnormal living conditions when the economy improves. They are likely to experiencepermanent social rejection and albandon their sense of belonging to a community. As thequalitative assessment of the poorest of the poor demonstrates, these individuals have alreadybeen marginalized; anecdotal evidence shows that they make up the majority of the very poor,are rarely registered under Paros, often do not receive support from the state, and very seldomget some NGO support. Such cases clarify why outreach is crucial to social assistance, notonly so the extremely poor can access some sort of financial and in-kind support, but also tofeel that society cares about them.
3.26 Improving outreach should be a critical component of social assistance in order tofight the social exclusion that results from extreme poverty. To bolster outreach efforts, thegovernment should take three important steps:
(a) Increase the role of elected local governments and NGOs in the design anddelivery of social assistance programs as well as strengthen partnerships withstate structures. The role of local governments and NGOs in supporting outreachfor state programs has been limited until recently. They could participate moreactively in registering the very poor with Paros, and at the same time socialservice centers could direct people in need to nearby NGOs for assistance. Thisis already done but in a limited scale. If local municipalities, urban districts andvillage councils had stronger fiscal bases they might be encouraged to gettraining to design their own outreach programs to support the poorest, in such away as to complement the state run programs. The Ministry of Social Securityhas recently carried out an information campaign to try and encourage localgovernments and NGOs to support the process of registration for the familybenefit.
(b) Strengthen the capabilities of social services centers, review the structures'incentives to promote outreach in particular by increasing allocation for
-43-
transportation (see Chapter 4 for proposal). Major improvements would resultfrom: providing a clear objective for the role of the social assistance worker;defining national operating procedures; redesigning the financial assistanceprogram's system for outreach; creating a central inspection at the Ministry levelto ensure that outreach is actually taking place; and strengthening staff training.
(c) Create a framework encouraging families and communities to support the poorand avoid depending on the state. This is probably the most difficult aspect ofreform because it depends on public information to explain that it is theresponsibility of the community as a whole to support the poorest. Stress theindependence communities gain when they avoid turning to institutions andother formal structures for help but rely instead on community-basedorganizations to support people with minor disabilities, children of poorfamilies, and other vulnerable groups.


4. TARGETING MECHANISMS FOR SOCIAL ASSISTANCEPROGRAMS
4.1 The previous chapter has attempted to demonstrate that Social Assistance needs to befocused on the poorest. Inproving targeting should therefore become an essential objective ofthe government's social policy. This chapter reviews different approaches to targeting socialprograms of the government. It opens with a brief summary of the general concept oftargeting in social assistance programs. It goes on to sketch the Armenian Paros targetingsystem as it has been used for humanitarian aid and how it can be improved to target the newFamily Benefit program. The end of the chapter examines how other mechanisms, especiallygeographic and community-based targeting, might be used in health and education programs.
The Role of Targeting in Social Assistance Programs
4.2 Targeting directs program benefits to the people who need them most. It serves as atool to make programs more efficient, not as an end in its own right. Its benefits and costsmust be carefully weighed in deciding whether and how precisely to target a specific programbecause what is appropriate for one program may not be so for another. For a summary ofdifferent mechanisms and some of their advantages and disadvantages, see Table 8 below.
4.3 The benefit of targeting is that it ensures resources go to the neediest. In some cases,targeting means that some people (the needy) receive benefits and others the (non-needy) donot. In other cases, the benefit size varies according to need, so the neediest benefit most, andthose who are better off receive smaller benefits. With perfect targeting, only the needy areserved, and the non-needy do not benefit; no funds are wasted on the non-needy and all theneedy are served. There are, however, tradeoffs to be made in targeting.
4.4 The first tradeoff is that, in practice, no program is ever perfectly targeted. Because itis difficult to always accurately establish who is needy and who is not, some of the needy willslip through the cracks and not be included in a given program; these are considered errors ofexclusion (or undercoverage). And some non-needy will be included in the program; theseare considered errors of inclusion (or leakage). In general, actions that help to reduce one kindof error will increase the other.
4.5 The second tradeoff is that targeting has costs as well as benefits. These are usuallygrouped under three headings -- administrative costs, political costs and incentive effects.Establishing who is needy is costly, and usually the more precise the examination of who is inneed, the more costly it is. Thus, there are always administrative costs. These may be high orlow, depending on how the program is targeted and what information and institutions arealready in place in the country to build upon.
-46-
4.6 Targeting may involve political costs. In general, the more finely targeted anassistance program is, the smaller the population that would benefit from it, which meansfewer people would have a direct reason to support a budget for it. Moreover, in mosl.countries, the poorest have relatively little political clout; they are often less likely to beregistered voters, or to vote if registered, and less likely to be represented by interest groupsthat define electoral themes. Where decision-making is not democratic, the poor may be evenless powerful. Yet it would be too simplistic to conclude that only those who couldinmmediately benefit from such a program would support it, i.e. the powerless poor. Otherparts of the population may back it if they fear that their relatives or they themselves mayneed a safety net in the future; they may vote for it because they prefer to live in a more equalsociety than would be possible without the program, or because their jobs in some way relateto the program. Nonetheless, the politics of who would support a program and what influencethey will have on its long-run budget should be weighed. In at least some cases, and possiblygenerally, a program that serves a wide swath of society may get so much more funding that itcan protect the poor as well as a more narrowly targeted one.
4.7 Incentive costs occur when some targeting mechanisms alter the incentives peopleface in ways that produce economic costs. The classic example of this in many OECD socialassistance programs is that if a program reduces a welfare payment for every dollar therecipient earns, then the recipient will have less incentive to work. The magnitude of this canvary, and the precise disincentives that the targeting mechanism produces can be manipulatedto some degree, but such costs must always be considered.
4.8 The "target" or "need population" can have various interpretations. Sometimes itrefers to all those under the poverty line, but because few assistance programs have enoughresources to give useful amounts to so many people, the target population may be the poorestfew percent (5 to 10 percent) of the population, even if others fall below the poverty line aswell. In cash transfer programs, "need" is usually based on poverty defined in money terms,or some proxy for poverty. But in health interventions, the target population may be tlhosewho are ill or at high risk of illness, rather than the poor. In many cases of publicly financedhealth care, the target population will be the poor, or those poor who are at high risk forillness since the government assumes the non-poor can get their health care needs met in theprivate market. An analogous situation applies in education.
4.9 In the following sections, these concepts are applied to several specific aspects ofsocial programs in Armenia.

-47-
Table 8: Basic Targeting Mechanisms
Mechanism Examples Administrative Costs Targeting ErrorsTargeting to individuals - a means tests, proxy means Costs involved in selecting Highly variable. Have theprogram official must tests, evaluations by social beneficiaries are the highest of potential to be the best,detennine whether each workers, targeting by any of the targeting depending on caution usedapplicant (individual or nutritional status, mechanisms and can range uphousehold) is eligible biomedical risk to about 2% of program costs,
usually no more than $2 perbeneficiary per year
Categorical targeting - all The elderly, children under Can be very low if information Precision depends on themembers of some easy to five, pregnant and lactating bases already exist strength of the correlation ofobserve category are eligible, women, registered the category with poverty,where the category selected unemployed are common usually rather low, sois correlated with poverty groups. Many programs targeting is not exact. In
that provide services and a geographic targeting usingfew cash transfers or small administrative unitssubsidies in kind may be (e.g. a hamaink or rayongeographically targeted, by rather than oblast or republic)only allowing schools, will be more exact butclinics, stores, etc. in poor requires more informationareas to participate
Self-targeting -- the service Hard physical labor for low Administrative costs to the If wages are set low, it can beis available to all, but wages on labor intensive selection of beneficiaries are, very good for labor intensivesomething about it public works; subsidies to by definition, zero, but there public works, but thediscourages the non-needy foods consumed may be considerable costs to opportunity costs to thefrom applying disproportionately by the administer the whole program participants can account for a
poor; subsidies to medical large share of wages paid if bydevices needed only by the taking the job they cannot dodisabled any other work, even part-
time or on subsistenceagriculture. Food subsidiesare usually not targeted wellas the non-needy consumemore than the needy in total,
________________________________________ _______even staple goods
Paros, Humanitarian Assistance and the Family Benefilt
How the Paros system works
4.10 In 1994 and 1995, the Armenian government introduced a proxy means testing methodcalled the Paros program to serve as the targeting mechanism for the large quantities ofhumanitarian aid flowing into the economy.36 Paros was the first proxy means testing systemadopted in Eastern Europe or Central Asia, though Russia is now experimenting with it on apilot basis. The program was introduced very quickly to deal with the emergency. Severalgovernment agencies were involved in the program, depending on their comparativeadvantage. The Ministry of Social Security offices were used to register beneficiaries; SocialService Centers (SSC) were created with the sole purposes of registering families in Paros andhelping to distribute humanitarian aid. The Yerevan Institute of Computer Research andDevelopment (YICRD) maintained and managed the database, and did most of the early dataentry. The Fund for Armenian Relief provided some technical assistance and monitored theParos system. These three agencies together comprised "the Paros system." USAID providedsome assistance for administrative costs. Many NGOs and several UN aid agencies usedinformation on beneficiaries provided by the Paros system to distribute humanitarian relief.
36 Humanitarian aid is estimated to have been about 12% of GDP in 1994, declining to about 2% in 1996.

-48-
From 1994 through 1996, individual donors and distributors of humanitarian aid had theoption to take advantage of the P'aros program, use it in different ways or not use it at all. In1996, it became the official system through which all humanitarian aid was distributed inArmenia.
4.11 Humanitarian assistance has declined markedly in recent years and it is now intendedthat the Paros system be used to target the new Family Benefit, a cash transfer financed by theGOA budget that is scheduled to go into effect in January 1999. Paros might also be useful totarget other transfers or fee waivers. In Chile, for example, a single Paros-like system is usedto determine eligibility for three different social programs. Putting it to this use, of course,spreads the burden of the administrative structure over a larger program base. The chaLnge inthe Paros program's purpose makes reviewing its performance, constraints and structLres verytimely.
4.12 Scoring. In order to register in the Paros system, a representative of a given householdmust go to his or her local Social Services Center (SSC) with the required paperwork tosubstantiate the family's position. Birth and marriage certificates, copies of disabilitycertifications, pay stubs and the like are required. A social worker interviews the applicantand fills out two copies of a "social passport," filing one in the registration and one in theprogram office. Based on this data, a "Paros score" is calculated for each registered household(see Box 1).
4.13 When the system was used for humanitarian aid, no threshold existed above whichpeople necessarily received benefits. Instead, for example, for each shipment of huma:nitarianaid distributed, those with the highest scores received a ration until the shipment wasexhausted. Thus, the threshold has fallen by different point scores at different times. Also,some distributing agencies, either because of the geographic range of their coverage orbecause of the type of aid they distribute, limit their distributions to households that mLeetcertain geographic or demographic characteristics and, within that category, use Paros pointsas a guideline. For example, if an aid organization set up to work only in an earthquake zonereceived a shipment of powdered milk, the Paros program would provide a list of householdswith pregnant women, new mothers or young children living in that zone, with the householdsranked according to the Paros score.
4.14 A household's Paros income level was recalculated after each aid distribution basedon the Paros system's information about the value of rations received, and all householdswere re-ranked based on the new scores. This re-ranking following each distribution drovemany aspects of the program. It meant, for example, that the scores had to be calculated in asingle central office, because the task required that the entire up-to-date database be emnployedto determine the list of those eligible for each aid distribution. It also meant that whethLer afamily was eligible or not, changed from distribution to distribution, which carried with it thechallenge of explaining the eligibility criteria, and informing families of their status for eachdistribution.
4.15 For the Family Benefit program, the government has appropriately proposed thiat asingle eligibility threshold be set for a defined period, probably one year. This will allowscores to be calculated in local social services centers, and may simplify the burden ofexplaining the program to applicants and informing them of their status, as will be discussedmore fully below.

-49-
Box I' Tkhe ars Prox formula
Thle cuatent Pares formla iis ompose of five actors. Tebasic fbrmua is:
Score = F, *F * F F ,*
Each ftor has its sb4-formla:
*0i Eahsocialceory'iJha a specific numerof pit attachedtoit. Table B. i provids a lkisto tecaeoies and poHints ass igned to 0ea, calclaingtheX social 0categrfatr firtst a poin scoreA is} givenA to eah eronin 0the0 household.0A ero may0 fX0W it omr than one soca aeoy,frea a perWson ihtb simultanosyscn-ere dit isabled,
step, theprsnl crei totaed 7 toete foralte househod !memesanddvdd by th nube of memer o the 0household.Voud e
* he housin gqualty fco ransaight from TaLbe B.1.
* The locatIioncrisdrawnstaght frm abl :B :.
* Th houseold size factor is calulated as g1 1.0- 0.02n,-0 w here n is theVnumber of famlyTn m bes.0i 0 0 0 * The formula for the i ctor in iros formula was designed toequalonewhenincome was equ to the co of
a l0 i:ow costfodbakts c;alculwatedinerl ovrywork. Thncm faco bis > i calulte as:'. 0 0$0it
0 S 0:;: ~~~~~~~~~~12 y:g:0;u ;X:-0- :t:0 : Cincomne 1.2- 04
nm
* a0E is the totl. value of humanitarianaid receivd inf US dollars
*s is the total, declaredd monthly inme o f the householi in dollars.
* ii t he0 n .enumberofmmbersintehousehold, 400000000000 f0ttift!0000000000i000000iVi00000
*-0 in is thie minimaum monthlyalryof the Reublic of Arenia exprssdn US dolars (about $2). tit0 t 0: d
High scoresindicate ahigher need thai low sces.ie Note that th fo do not hae ebsout ds.Ngativevalues are possible for thoswith highincomes. At the upper end o the range, t laisinly iosethere is notfa theoretical maximum numbera ofindividuals or social ies asso with t a household cc ontain.Iprcie t hhp e rfe is anupper plausible budof abouWf7t0 S 70 toS0;f; 75. 00Xff0000i0
The formula as an;0 adhc eision mad by prora designrs. Te points Aassignedtoeahsoital categoywere .originally eived frm a survey of to ons of s ers. ou h senormula
?f have be aesnetepormbgn mogtems motn hne a een a new rulp:Et Vt e ithatsets tozeohscore ofayhosehldthspua iany carsince I 93Rthe fl J lof 17, rsobi infrtionfothe
ttax authority tosre as thec infrain bas fo this, and changedthXe scoesof bot4,00 ghousehods }to zero.S8imilarly, scors of houisehol tha dasall busin license are set to zero baedonin ionfr te salbus inmess lcesng bureau.40 i;; f0 : i;iLLL ;;;;ifLsLa;Lff

-50-
Table &I: Points Assigned for Variotts Attributes in Current Parms Score
ConditionSocial Category Points Assigned Housing Points Assignedcategory-less person 20 none (homeless) 1.05child of a divorced parent 26 ernergency 1.04child of a single mother 26 tenporary 1.03unenmployed person 27 dormitory 1.023rd degree disabled 28 permanent 1.0student age l6 or older 29pregnant woman 30 Locationchild aged two to eighteen 31 earthquake zone 1.10pensioner 34 border region 1. 05child under 2 35 other 1.0pensioners living alone 36twitis (and more) under 5 362nd degree disabled 39person age 80+ 39orphan, one-sided 43disabled child under 16 48tst degree disabled 48orphan, two-sided 50
4.16 People were eligible to register in the program at any time after the Paros systembecame active in 1994. After registering, households were obliged to report any charLges intheir status when they occurred. Nonetheless, prior to implementing its new Family Benefitsystem, the government required any interested households to re-register, starting in August1997. Based on the sample of SSCs visited by Posarac, the number of households that re-registered is about 70 percent of the number originally registered three years ago, thissuggests that about half of the households in Armenia may currently be registered. Programofficials attribute the drop in registration to the drop in humanitarian aid and reduced prospectof getting a benefit from registering, to self-targeting, and to emigration.
Targeting perform.ance
4.17 It is now possible to use data from the Household Expenditure Survey to study howthe Paros system functioned in the fall of 1996 when used for humanitarian assistance. This,together with information from two qualitative studies (Gomart 1998a and b) will also allowus to make some inferences about how it might work in the future.
4.18 About 71 percent of Armenian households report they were registered with the Parossystem in the fall of 1996 (see Table 9). Registration by decile of per capita consumptionshows an inverted slightly U-shaped curve. The percentage registered increases from about 71percent of households in the poorest decile to 79 percent for those in the fourth decile, thenfalls to 64 percent for the richest decile. This shape indicates very little self-selection, whichwould have implied that those in higher deciles register markedly less often than those inlower deciles. In many other countries (especially in Europe and Latin America) there is muchmore self-selection out of social assistance programs by those in the upper half of the welfaredistribution spectrum.
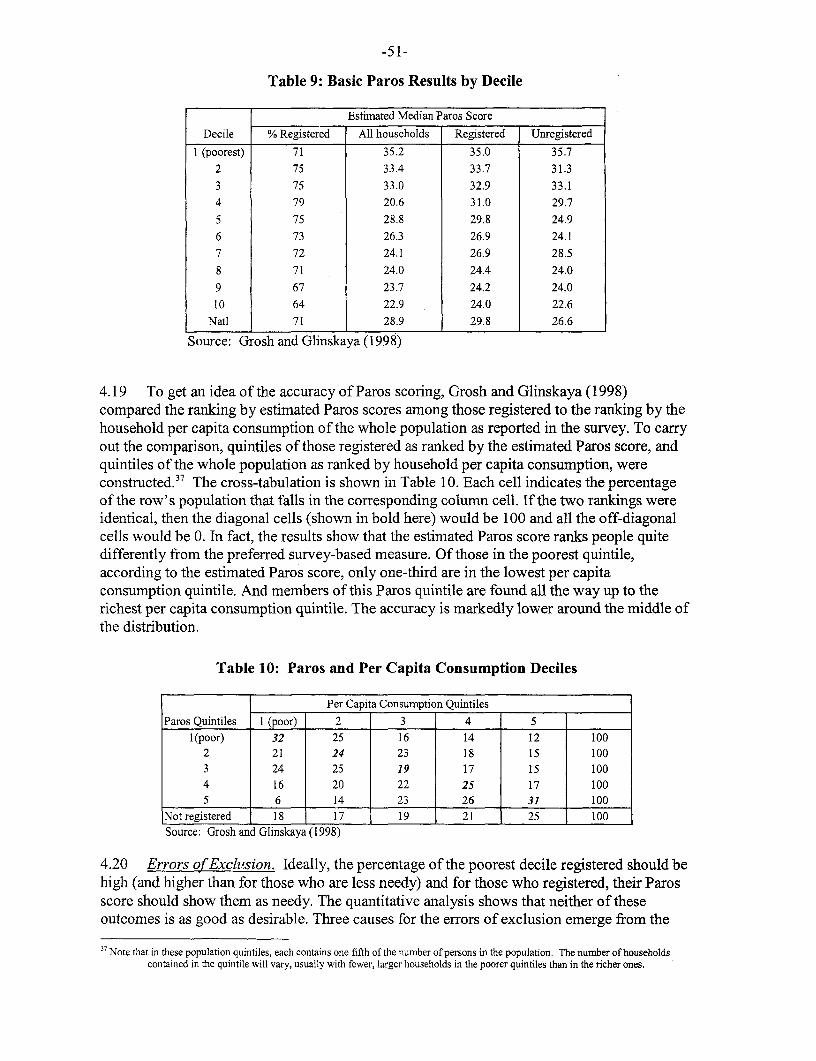
-51-
Table 9: Basic Paros Results by Decile
Estimated Median Paros Score
Decile % Registered All households Registered Unregistered
I (poorest) 71 35.2 35.0 35.7
2 75 33.4 33.7 31.3
3 75 33.0 32.9 33.1
4 79 20.6 31.0 29.7
5 75 28.8 29.8 24.9
6 73 26.3 26.9 24.17 72 24.1 26.9 28.5
8 71 24.0 24.4 24.0
9 67 23.7 24.2 24.0
10 64 22.9 24.0 22.6
Natl 71 28.9 29.8 26.6
Source: Grosh and Glinskaya (1998)
4.19 To get an idea of the accuracy of Paros scoring, Grosh and Glinskaya (1998)compared the ranking by estimated Paros scores among those registered to the ranking by thehousehold per capita consumption of the whole population as reported in the survey. To carryout the comparison, quintiles of those registered as ranked by the estimated Paros score, andquintiles of the whole population as ranked by household per capita consumption, wereconstructed.37 The cross-tabulation is shown in Table 10. Each cell indicates the percentageof the row's population that falls in the corresponding column cell. If the two rankings wereidentical, then the diagonal cells (shown in bold here) would be 100 and all the off-diagonalcells would be 0. In fact, the results show that the estimated Paros score ranks people quitedifferently from the preferred survey-based measure. Of those in the poorest quintile,according to the estimated Paros score, only one-third are in the lowest per capitaconsumption quintile. And members of this Paros quintile are found all the way up to therichest per capita consumption quintile. The accuracy is markedly lower around the middle ofthe distribution.
Table 10: Paros and Per Capita Consumption Deciles
Per Capita Consumption Quintiles
Paros Quintiles I (poor) 2 3 4 5 L1(poor) 32 25 16 14 12 100
2 21 24 23 18 15 1003 24 25 19 17 15 1004 16 20 22 25 17 1005 6 14 23 26 31 100
Not registered 18 17 19 21 25 100Source: Grosh and Glinskaya (1998)
4.20 Errors of Exclhsion. Ideally, the percentage of the poorest decile registered should behigh (and higher than for those who are less needy) and for those who registered, their Parosscore should show them as needy. The quantitative analysis shows that neither of theseoutcomes is as good as desirable. Three causes for the errors of exclusion emerge from the
37Note that in these population quintiles, each contains one fifth of the number of persons in the population. The number of householdscontained in the quintile will vary, usually with fewer, larger households in the poorer quinbiles than in the richer ones.

-52-
qualitative study. First, Gomart (1 998a and b) documents that am,ong the poorest the causesfor not registering included: possessing insufficient information or understanding of'the Parossystem; inability to pay the bus fares, fees and often, under-the-table payments required to getall documentation in order and to register with the Paros system; and difficulty standing inlines for long periods due to disability, pregnancy or child care duties. Of course the degree towhich these barriers are felt is highly variable.
4.21 Such barriers are comrmon, indeed almost inherent, in such assistance programs,though of course they do not affect all potential applicants equally. Some of these barrners canbe reduced, at least to a degree, by altering how the program is administered to improve thepublic's awareness of it, shorten registration time, and improve outreach to make it easier forthe disabled to get to the offices to register. The Ministry of Social Security has taken someactions already to lower some of these barriers. It carried out a new publicity campaign in1998 to increase public understanding of the system, using primarily mass media. Manyoffices organized at least one visit to villages during the period of peak re-registration to makeit cheaper and easier for those in outlying areas to register. And households may be registeredby proxies -- friends or neighbors, if physical access is a problem. All of these efforts arevaluable, and there is potential to carry them further.
4.22 Nonetheless, some of these barriers are likely to remain, at least in the medium term,in part because they are somewhat inherent in programs requiring documentation anrd centralregistration, and in part because the most expensive transaction costs for applicants stem notfrom the Paros program or Ministry of Social Security itself, but from the costs of lining updocumentation -- fees exist, though are low, for much of the official documentation;photocopies are required, and sometimes busfares. These modest costs can be prohibitive forsome of the poorest. More significant costs can apply for some individuals who have to lineup documentation of disability, which requires medical exams and sometimes unofficialcharges. Some of the population also believes that they cannot get documentation ofhousehold size or Armenian passports, which are required, without being up to date on taxand utility payments handled by the same agencies that issue the documents (the JEKs).Apparently officials often agree to waive or defer at least part of such arrears, but the practiceis not universal or official so some needy may be deterred from arranging their documents andregistering with Paros.
4.23 A second problem with errors of exclusion lies in the use of imputations and proxiesthat are only approximate. As we shall see later, no set of easily measured, objective variablesdoes as well at predicting poverty in Armenia as is feasible in other countries. But even withvariables that are, on average, inextricably linked to poverty, Paros faces measurementproblems. For households that own land, Paros imputes an income stream, based on thequality and size of holdings. Gomart (1998a), however, reports that some of the poorest of thepoor cannot afford to farm the land that they own because they lack labor, seeds, or cash topay for irrigation, tillage, etc. Consequently, they don't in fact get the funds that Parosassumes they do, and their Paros score understates their poverty. A similar problem occurswith automobiles. Households with cars are assigned zero scores that preclude them fromreceiving benefits. But the qualitative study suggests that a few genuinely poor householdsindeed own cars (especially among the disabled who were given priority access to cars priorto 1991), although they often lack the money for gasoline or repairs to run them; but they arestruck from the eligibility rolls anyway.

-53-
4.24 A third problem appears to lie with how social workers treat potential clients.Apparently, the information provided by the social workers occasionally differs explicitly orimplicitly from the Paros formula. The system allows all households to register and includesthe working poor and the poor who are able-bodied in qualifying for benefits. However, somesocial workers discourage or prevent households that do not fit certain social categories,particularly the able-bodied and working poor, from registering or receiving benefits, eventhough they may be needy.
4.25 Errors of Inclusion. The extent of the benefits distributed through the Paros systemand other programs in Armenia are compared in Table 11. The incidence of the simulatedParos program is better than for any of the other Armenian programs included in the HES.Fifty-four percent of a transfer targeted through Paros would accrue to the poorest 40 percentof the population; for state transfers, about 40 percent of the total would get to the poorest 40percent. The incidence is a little better for child allowances and unemployment benefits.Comparing the incidence from the simulated Paros transfer to international standards, it issomewhat less successful than many targeted programs have been able to achieve, but muchmore progressive than for general food price subsidies. Among Latin American programsexamined by Grosh, the median distribution meant that about 70 percent of benefits accruedto the poorest 40 percent of households (1994). The Chilean proxy means test is the mostsimilar to the Paros program, where about 70 to 80 percent of benefits accrued to the poorest40 percent of the population. The comparators for transfers in various Eastern Europeancountries show that some produce better incidence than Paros, others worse.
Table I1: Incidence of Different ProgramsShare of Benefits Accruing to Population Decile (in %)
Programn I (poorest) 2 3 4 5 6 7 8 9 10
tT TyT0y,;0000 $ffff,$054,, f,, fAriSa-SSESi ;SEiNdg$E g 777 A777"77e,um1Pensions 10 9 11 11 10 II 10 11 9 9Disability benefits I1 9 10 12 13 9 9 13 7 8Child allowances 14 11 10 10 10 11 10 9 9 8Unemployment benefits 11 15 9 15 14 7 12 5 8 4Student stipends 5 11 8 4 10 12 9 19 15 8State transfers - total 10 9 11 1 1 10 1 1 10 I 1 9 9Humanitarian aid4 3 5 6 9 10 I I 1 0 13 13 20
Paros (no cars) 14 15 I I 14 10 9 9 7 8 5International ExtperinenceChile-family subsidy ' 57 26 12 4 2
Chile-pension asst' 50 23 17 7 3
Median of 30 programs in 72 28Latin America I
Algeria - 17 subsidized foods ' 14 17 20 22 27Sri Lanka-wheat, bread, sugar' 14 17 21 23 25Estonia -pensions2 3 14 33 28 17 13
Estonia - unemp ben 2 35 25 13 11 7 9Estonia -social asst 2 13 31 14 8 27 7
Estonia -child ben.2 12 28 17 19 18 7Hungary-fam. allow.
310 10 10 10 10 1o 10 10 10 10
Bulgaria - fam. allow. 3 6 9 10 10 10 11 11 12 13 10
Poland - fam. allow. 9 10 9 10 10 11 11 l 11 12I From Grosh, 1994. Deciles are household deciles, so the lowest contain slightly more than 10% of the population.2 From World Bank (1996) Estonia Living Standard During the Transition, Report no. 15647-EE Table 3.23 From Fajth, 1994. The numbers reported here are interpolated off graphs, and thus somewhat inaccurate ft. Note that the numbers referto the household's consumption after they have received the transfer.4 It is not possible to tell from the calculations presented here whether humanitarian assistance flows disproportionately to those at the topend of the distribution, or whether these transfers are so large that they move households that would otherwise be poor out of poverty.

-54-
4.26 Changes in the Paros System. It is necessary to examine how variations in the Parossystem affect targeting outcomes and specifically how setting to zero the scores for those withcars affect outcomes, and the importance of the threshold used.
4.27 Poverty measures and errors of inclusion and exclusion for a simulated transfer areshown in Table 12. With the lower poverty line, for example, the headcount is reduced from17.2 to 14.2 when the cutoff is 32 points and no account is taken of car ownership. In thissame case, 17 percent of the whole population count as errors of exclusion because they arepoor (log per capita consumption per person per month of less than 8.83) and either chose notto register or are ruled ineligible for benefits based on a Paros formula score of less than 32.Errors of inclusion, 20 percent of the whole population, are comprised of the non-poor (logper capita consumption per person per month of more than 8.83), elected to register and havea Paros score of more than 32.
Table 12: Results of Modifications to Paros
Poverty Line = .5 median pc cons Absolute Poverty Line
% hh drains of (5,400 dramns per person per month) Errors of Errors of (10,784 drains per person permonth)
receiving transfer FGT(0) FGT( 1) FGT(2) Exclusion Inclusion FGT(0) FGT( 1) FGT(2)
Baseline 17.2 4.6 1.8 54.7 21.0 10.5
Uniform 100 337 14.7 3.6 1.3 52.8 19.0 9.2Paros 32 29 1056 14.2 3.4 1.2 17 20 52.7 19.0 9.0Paros 35, no cars 20 1522 14.3 3.5 1.3 20 13 52.7 19.0 9.0
Note: this table was calculated including only those farnilies that reported actually being registered in Paros in November 1996.
4.28 Modifications to the Paros program with regard to cutoff score and handling cf carownership has lowered errors of inclusion from 20 to 13 percent, that is, fewer people withrelatively high welfare levels receive transfers under the new scheme. But the new scheme hasalso raised errors of exclusion, which have risen from 17 to 20 percent. As a result, thlenumber of truly needy who are excluded from the system has increased. Note that the errorscalculated here probably somewhat underestimate errors of exclusion. Because the survey didnot contain information on car ownership directly, Grosh and Glinskaya based theirassumptions on which households spent money on gasoline or auto repairs (1998). But somepoor people may own cars they couldn't afford to use during the month of the survey and sodidn't outlay funds for gasoline or repairs. The qualitative study suggests that thisphenomenon does occur. These people would not be noted in the Household ExpenditureSurvey as car owners, but the Paros system, upon leaming from the automobile registryagency that these households owned cars, would set their scores to zero.
4.29 It is interesting to note that the poverty indices resulting from the simulations of thetwo versions of the Paros program are very similar; changes in errors of inclusion andexclusion offset each other. Therefore, while the political economy of the program haschanged somewhat, and administrative requirements are heightened by the need to crosscheckrecords with the automobile registry, the overall impact on poverty of the program was notchanged significantly. The FGI' measures of poverty are fairly constant as the cutoff scorevacillates, but the errors of inclusion and exclusion change.

-55-
4.30 Incentive Effects. The Paros proxy means test likely produces a minimal disincentiveto work. It was not possible to model this formally, because the Household ExpenditureSurvey does not contain data on hours worked. But understanding the formula and how it isapplied would suggest minimal, if any, effect. First, the formula does not rely very heavily onincome to begin with; it is only one of the five factors. However, it does include somecomponents of income, but in ways that would likely minimize disincentives to work.Applicants are expected to produce official paperwork to gain formal sector employment, butmuch of this is very poorly paid and constitutes a small fraction of income (see Chapter 1).Moreover, most formal sector jobs are full-time, though the common wisdom prevails thatfew workers devote much effort to these jobs and that they are, in fact, often performed on apart-time basis. Thus, a change in the number of hours worked is only tangentially tied, if atall, to income from this source. For agriculture, Paros does not rely on reports of earnings, butinstead imputes an expected income based on the size, quality and location of landholdings.Paros asks for, but is in no position to verify, income from most other sources, especially frominformal enterprises and transfers. It is commonly known that these earnings go largelyunreported by applicants. Since households don't report the earnings, they have no incentiveto lower them.
4.31 Paros continues to use various categorical factors that have been pervasive in theArmenian social assistance system for many years and possibly inherited from the Soviets.Disability status, household structure, location and quality of dwellings are capable of beingmanipulated, whereas age and gender are not. Thus any incentive costs these have are merelycontinuations of old distortions, and no attempt has been made to measure them for thisreport.
4.32 Political Economy of Targeting. It is difficult to speak authoritatively on this subject.On the most general level, Gomart's (1998b) study reveals a certain ambivalence in Armeniatoward targeting in general. On the one hand, the instances of well-fed, well-dressed people infancy cars picking up humanitarian assistance transfers negatively affected the citizens'perception of how well targeted the aid was. This suggests a certain desire to avoid, at thevery least, the most blatant errors of inclusion in a social assistance program. On the otherhand, the concept of giving transfers only to the poorest is not obviously supported. Most ofthe population has suffered a significant drop in living standards in recent years, andconsequently view poverty as the defining difference between "before" and now. Accordingto this criterion, most people are poor and feel themselves deserving of aid. By contrast,targeting focuses on those at the bottom of the current income distribution. Moreover, Gomart(1998a) reports that the poorest are sometimes seen by society as being responsible for theirsituation; that being economically poor is linked to being intellectually or socially poor.Targeting them is viewed by some to merely reward those who are not perceived as pullingtheir own weight.
4.33 The qualitative study also suggests that the Paros system doesn't have a goodreputation. Many focus group participants were concerned with cases of either inclusion orexclusion errors during the distribution of humanitarian assistance that they had witnessed intheir districts or heard about. And they generally considered that Paros lacked clear and wellunderstood rules of eligibility, required procedures, informnation dissemination to applicantsregarding their status, making appeals, etc. Specific steps to improve services have alreadybeen taken and further steps are discussed below under administration. There will, however,inevitably be a lag between the system's current perfornance and its reputation, which isbased on its cumulative performance since its inception.

-56-
4.34 Administration. The GOA and agencies involved in Paros very quickly and in themidst of an emergency situation erected an innovative system that reached a very largesegment of society, produced a somewhat progressive incidence and had relatively lowadministrative costs relative to the aid that flowed through it. A July 1996 mission estimateroughly put costs at about US$I per beneficiary. For this they deserve significantcongratulations.
4.35 Nonetheless, the program switch from emergency ad hoc distributions of humanitarianaid to medium and long-term distributions of cash allows the program to look atadministrative options previously unavailable to it. It also affords Paros the opportunity tobuild procedures and systems better suited to its new tasks that can be more uniformlyimplemented and monitored than was possible during the emergency. The next sectionreviews beneficial changes.
Refining and Reforming Paros for Use for the Family Benefit
4.36 Changes to the proxy formula. The original Paros formula was invented, out ofnecessity, without recourse to accurate data regarding poverty. However, such data are nowavailable and if Armenia is to continue using a proxy means testing system, it is important toconsider whether the targeting formula can be made more accurate. Grosh and Glinskayaperform a number of simulations to deduce how well alternate indicators and weights forthem could work (I998). Briefly, the simulations use per capita household consumption as ameasure of "true" wvelfare. Using regression analysis, they predict this "true" welfare using avariety of sets of easily observed variables. The regression helps diagnose which indicatorsare good proxies fcr poverty and then gives the weights to be used for each. The accuracy isthen judged by simulating a transfer to those below a poverty line and examining the impacton poverty and errors of inclusion and errors of exclusion.
4.37 Grosh and Glinskaya test several alternative models. The general logic is that eachmodel demands more information and is therefore more difficult to implementadministratively than the one preceding it. Within each model, they tested various alternativespecifications of the precise variables available from the HBS data set, their definitions andthe functional forms. The results of the simulations are presented below in Table 13 andFigure 5. The main conclusions are:
(a) The better models reduce poverty by more than the current Paros system for agiven transfer budget and, of course, more than a uniform transfer would do.For example, evaluating the results for the relative poverty line (see Column 9of T'able 13), a uniform transfer would reduce the poverty as measured by thehead count index from 17.2 to 14.7, the current Paros formula would reduce itto 14.3 and proxy formula 6 would reduce it to 13.6
(b) Even using the same indicators, a change in the weights used in the Parosformnula could imcnprove targeting. Model 9, which uses only informationalready available in Paros records but different weights, could be adoptedrelatively easily because no new information collection or registration wouldbe required, just training for social workers, public outreach and computerprogramming to recalculate scores. Note that the simulation probablyexaggerates how well Paros could target after re-weighing, because theinformation on income in the survey is quite likely more accurate than what is
-57-
actually available to Paros administrators. This formula reduces povertynoticeably more for the same size transfer budget than does the current Parosformula.
(c) Several administratively complex options do not perform much better thansimpler ones, and can therefore be discarded. Adding the employment andincome variables, for example, hardly improves the effect of the transfer, but isquite hard to verify. Paros already asks households to report such information,but has little way of verifying it. In the case of agricultural income Parosimputes an income based on landholdings, and in the case of registered smallbusiness owners sets the score to zero, thereby disqualifying the family for aid.The results here suggest that the administrative burden implied by theseprocedures is not worthwhile. Similarly, using separate formulas for urban andrural areas would be administratively difficult and hardly improves results.
(d) Models 6 and 7, which include information about location, social categories,household demographic characteristics, housing quality and some householdassets are the best options among the models that do not use incomeinformation. Model 6, the most accurate of these models, uses the mostinformation. Model 7 dispenses with some of the indicators with a weakercorrelation to consumption, and so requires less information and would costless to administer. However, the impact on poverty of a transfer targeted withModel 7 would be slightly less than that of one based on Model 6. Eitherwould be acceptable options.
(e) Geographic targeting, at least at the gross level of detail used here, is notterribly accurate, though considering how low the information requirementsare, the results are not too bad.38
(f) The simulated transfer budget, which approximately reflects the actual budgetavailable for the Family Benefit, doesn't contain enough money to lift manyhouseholds out of poverty, even with a very low poverty line, like the relativeline used in the simulations. Thus the main impact of the transfers is not on thehead count index, but on the depth and severity of poverty.
(g) Overall, the prediction equations are inaccurate, especially when comparedwith the degree of accuracy obtained in other countries. While somewhatdisappointing, this result is not surprising. In a full market setting, the assetsthat are the core of a proxies equation (human capital, housing, land, livestock,etc.) are correlated with consumption both because it took past earnings toacquire the assets, and because the assets can generate a return in the present.Since markets in Armenia are newer and less developed the correlationbetween assets and current expenditure is lower. Moreover, householdsapparently move in and out of poverty over short periods of time, makingpoverty very dynamic whereas the indicators available in a survey and easilyused in a Paros-type program are more static.
38 Note that in a previous version of Grosh and Glinskaya, geographic targeting performed much worse. That picture was unrealistically poorfor three reasons. First, the border, conflict and earthquake zones were improperly coded. Second, no corrections had been made forregional price variations, and third, the results were difficult to interpret because the omitted category of the regional dummy variablewas poorly chosen.

-58-
(h) Note that the proxies for poverty and how strongly they correlate to povertychange over time regardless of the country, and might be expected to do somore quickly in a transition economy than a more stable one. Thus, it isappropriate to revisit the proxy formula periodically and change either theweights or the indicators. The 1998-1999 Household Budget Survey willprovide new data to firther fine-tune the proxy fornula. The Ministry of SocialSecurity has recently forned and equipped a small policy unit which is beingtrained to carry out such studies periodically.
Table 13: Results of Different Targeting Formulas
Pover ty Line = .5 medianAbsolute Poverty Line pc cons
(10,784 drams per Errors of Errors of (5,400 drams per personperson per month) per month)
Information Model# FGT(0) FGT(1) FGT(2) Exclusion Inclusion FGT(0) FGT(1) FGT(2)Baseline Base 54.7 21.0 10.5 17.2 4.6 1.8Uniform Uni. 52.8 19.0 9.2 0 47.2 14.7 3.6 1.3(simulated) Paros 52.7 18.9 8.9 17 17 14.2 3.3 1.2(social categories) numberofhouseholdmembers 1 53.1 19.0 9.0 20 12 14.3 3.3 1.2
in each social category,household size
(location) dummyvariablesforthemarz, 2 52.7 19.0 9.0 21 12 14.1 3.4 1.2the strata in the sample, theearthquake zone, the conflict-affected border zone andinteractions between the lattertwo and rural areas.
(social cat. And 3 53.0 18.9 8.8 18 14 13.8 3.2 1.1location)(Model 3 + hh household size and its square, 4 53.2 18.8 8.8 16 15 13.9 3.1 1.1demographic the dependency ratio, the age,characteristics age squared and gender of the
head, and the educational levelof the most educated member
(Model4+assets) land,livestockandaproxyfor 5 53.2 18.7 8.7 14 17 13.9 3.0 1.0car ownership
(Model 5 + size of the dwelling, presence of 6 53.2 18.8 8.7 13 18 13.6 3.0 1.0housing water, electricity, heat,characteristics) telephones, the type of dwelling
and type of ownership.(all categories, uses variables in Model6 from 7 52.7 18.8 8.7 14 18 13.6 3.0 1.0fewer variables) each category that are the best
predictors and most readilyverified; number of pieces ofinformation required is reducedfrom 39 to 20
(Model6plus manyemploymentvariables, 8 52.8 18.7 8.6 12 18 13.4 2.9 1.0employment and whether or not the householdincome) has received remittances, and
the amount of agriculturalproduction sold and the amountof food from home consumption
(allcategories, models6and7onthesample 6U/R 52.7 18.8 8.7 13 19 13.7 3.0 1.0separate urban and split into rural and urban areasrural) separatelyParosInformation letsregressionprovideweights 9 52.9 18.7 8.7 14 16 13.2. 3.1 1.1

-59-
Figure 3: Percentage Reduction in Relative Poverty forVarious Models
0.50.45-
0.4-
0.35-
.~0.25-
O FGT(1)~0.2 U FGT(2)0.15-
010.05
N CO ro A '
Model
4.38 Benefit Levels. Each beneficiary household (220,000 households in March, 1999)receives a base amount of 3,500 drams, plus a small increment of 1,500 drams per person inthe household, making an average amount in the order of 6,000 drams per household permonth (about US$12). Based on simulations of such a formulation's impact on poverty, theeffect is about as good as those achieved with many other variations on the transfer formula,including options that more closely customize benefits to the Paros score (Grosh andGlinskaya, 1998). In the case of the Paros program, the key to improved targeting is notgreater customization of transfers among recipients, but better selection of who the recipientsshould be.
4.39 Administration. The government has put the SSCs at the heart of the implementationof the Family Benefit and proposes, in the medium term, to broaden their role to perform awider variety of social work tasks in the delivery of cash and in-kind benefits. To this end, theMinistry of Social Security has moved ahead with creating the framework and buildingcapacity to carry out the new Family Benefit program. The necessary decrees were passed,job descriptions written, a publicity campaign carried out, social workers received a week'straining in the procedures and rules for the Family Benefit, and new computer software hasbeen installed and operators trained in its use.
4.40 One welcome change is that households' Paros scores are now calculated in the SSC.This is made possible because, for the Family Benefit, a single eligibility threshold wouldhold for the whole year, in contrast to the case of humanitarian assistance when scores werere-calculated, the lists re-ranked and new cutoff points set for each aid distribution. Thisdecentralized score calculation should permit social workers to inform families of theireligibility or not when they apply for benefits instead of later, greatly increasing thetransparency of the program and eliminating a source of complaint on the part of its clients.

-60-
4.41 Local municipalities (hamaynks) are closely involved in outreach and identifyinghouseholds. Candidates identified by hamaynks are scored for eligibility and communmityquotas constitute five percent of the total number of benefit recipients. Updating ofinformation and re-registration of all households in Paros is to be completed over a 1]2-monthperiod. There is a mandatory requirement for all social workers to make home visits andcheck the real situation of those registered. The written conclusions of the social workers areattached to files and can play a crucial role in determining eligibility. The benefits are homedelivered through the local post offices. hispection in the hamaynks is carried out byemployees of the Ministry of Social Protection, helping with problems which arise as well aschecking on implementation of the Ministry's directives.
4.42 The evaluation of institutional capacity (Posarac, 1998) endorses the role of the SSCin the Family Benefit and notes the preparatory work that has been carried out. The mainresources required are available to SSCs. The 54 centers are well spread through the country,have adequate staff (545), and have recently acquired adequate computers, software andprinters. Better access to photocopy and fax machines would be helpful. Offices arefunctional. Space and furnishings are often far from ideal and local initiatives to upgrade themmay be helpful, but this is not the greatest need in most offices. Since decentralization reformin 1996, the SSC are financed from the republican budget through marz budgets. The SSC areresponsible to the marz social policy department for organizational, management, financialand staffing issues. The Ministry of Social Affairs guides methodological and policy issues.
4.43 Nonetheless, both the institutional assessment and the qualitative studies interviewswith clients point to a number of areas in which operation of the SSC needs to be strengthenedor realigned to optimally support the Family Benefit system:
(a) A good deal of work has been done to build the "soft" elements of the system.However, there is a pressing need to further some aspects.
(i) Operational manuals and performance standards need to be put onpaper and systematized in order to ensure that cases and clients aretreated comparably, and to facilitate adequate staff supervision.
(ii) Ongoing training for social workers is highly desirable as their jobs aretransformed from merely registering beneficiaries for humanitarian aidto taking on broader and more pro-active roles in helping the needysolve problems and get access to a variety of programs. Such trainingshould cover three areas: (a) the programs available, so that theworkers can council clients appropriately; (b) orientation to a client-focused way of operating that values outreach, referring clients, andgaining them access to programs beyond the Family Benefit that theymay need and be eligible for; and (c) teaching social workers how todeal more comfortably and competently with the difficult parts ofsocial work (e.g. handling depressed, angry, senile or mentally illclients, explaining to the ineligible why they are so, etc.).
(b) The public must have a better grasp of the Family Benefit system thatn it everhad of the Paros structure. Some publicity has been done on the FamilyBenefit, but additional steps might be helpful. Few of today's SSC haveposters or pamphlets that explain the programs. They should be made available
-61-
in bread shops, hamaink offices, village councils, hospitals, hostels for theaged, NGOs and other places the poor are likely to visit, or through agencieswishing to reach the poor. A series of public meetings through these venueswould be particularly useful since a qualitative study found that the poor arenot reached effectively through newspapers and radio announcements. Thequalitative study found that social workers were often not adept at simplifyingthe Paros eligibility formula, and relied instead on the explanation that "thecomputer decides." Proper training and supervision are needed to insure thatsocial workers give correct and helpful explanations to clients. To this end,social workers have just received an additional week of training in the FamilyBenefit system.
(c) Outreach is required to lower errors of exclusion. Some administrative refornssuch as clearer public information, decentralization of scores, and the simpler,ongoing nature of the Family Benefit compared to humanitarian assistanceshould help lower transaction costs to program participants. For most people,this will be welcome and may help discourage under-registration among thepoorest. However, to significantly raise registration among the poorest of thepoor, additional measures will be necessary. Social workers must regularlyenter communities to register those who have difficulty getting to the SSC aswell as helping applicants to gather the correct paperwork required for anapplication, including disabilities documentation. In turn, this requires that thesocial workers have money for busfare available to them. Currently most suchexpenses are not reimbursed, but come from the social workers' pockets.Since their salaries alone are not enough to keep them from poverty it isunrealistic to expect them to do most such outreach. It also appears that theexpectations for outreach vary among SSC's, with some directors ensuringgreater efforts than others. It must, however, be recognized that in some areaswith limited public transport, the need for outreach is greatest, but thepossibilities for doing it the smallest. It would also be useful to strengthen thereferral network, with other agencies that work with the poor (includingNGOs), referring clients for the Family Benefit.
(d) A formal and uniform appeals system must be set up. Few SSC currently havesuch a system and no written appeals procedures are clearly spelled out(Posarac, 1998). Most appeals are addressed and solved at the SSC director'slevel. According to Gomart (1 998b), clients believe that appeals are dealt withbased either on the strength of personal connections the client may have withsomeone in power, or the amount of noise and nuisance he or she makes in theSSC office. The public does not perceive that appeals are resolved on the basisof corrected or new information, or according to a fair and impartial set ofprocedures. The appeals system should have firm and publicly availableguidelines; it should usually conduct a home visit as part of fact finding aboutthe case; and it should have a con-mmittee representing several bodies -- theSSC, the village council, perhaps a locally active NGO, etc. This will ensuresome transparency and safeguard both the decision process and the SSC'sreputation.

-62-
(e) The appeals system must be capable of handling at least the following kinds ofcases:
(i) corrections in information. Most of these should be handled by thesocial workers in office, and the new decentralized data processing willfacility this, but in occasional cases, clients make seek recourse to theappeals mechanism.
(ii) making allowance for incomplete documentation. The qualitative studyrevealed cases where obviously mentally or physically disabled personswere unable to obtain full documentation of their cases. Similarly,women whose spouses have immigrated can have difficulty achievinglegal divorce papers. These cases should be dealt with in an appealsprocedure.
(iii) a system of appealing imputations. The Paros system imputes anincome stream frorm land, but the poorest of the poor may lack accessto the other farming necessities such as labor, seeds, and money forirrigation and so cannot realize this income. The income Paros assumesthey get from land may make them ineligible for the Family Benefit,when in fact they do not realize such an income and are quite needy.Similarly, the Paros system sets the score to zero for anyone who ownsa car on thle assumption that only the non-needy can afford a car.While perhaps broadly true, there are certainly cases where it is not so.
(iv) cases of special need. No proxy formula will ever correspond perfectlywith need, and as Grosh and Glinskaya's work shows, the proxies inArmenia are not very strong. Thus even with the best formula possible,there will be cases of real need not revealed by the scores from theproxy means test.
(f) There needs to be a permanent system of monitoring and evaluation, whichshould include the following elements:
(i) spot checks of registrants conducted by home visits, preferably a fixedpercentage of cases should be checked each month. The percentagechecked may be higher in problem cases.
(ii) a regular system of household surveys that would: (a) allowmonitoring of who benefits from the family benefit, and (b) allowperiodic revisions of the proxy formula. The Ministry of Statist.icscould easily do this by introducing appropriate questions into a series ofHousehold Budget Surveys.
(iii) periodic qualitative studies to determine whether client service issatisfactory and to address residual problems of reaching the poorest.
(iv) regular reporting on program processes: number of applicationsprocessed, number of outreach visits, number of monitoring visits,number of beneficiaries, turn-around rates for various processes,administrative costs, etc.

-63-
(v) links between performance and rewards.
(g) The program needs to develop a streamlined, credible payment mechanism.Use of a system similar for paying pensions is under consideration. Whateverthe mechanism used, it should not require the SSC to handle cash themselvesand should be easily monitorable.
The future of proxy means testing in Armenia
4.44 The Paros system is not yet a perfectly implemented proxy means test. A number ofconcrete steps to improve its implementation, and transform it from an emergency distributionsystem to a medium or long-term means of targeting the new Family Benefit have beensuggested and seem feasible given the political will and administrative acumen. This has beenthe focus of Chapter 4 up to this point.
4.45 It is perhaps, useful to go back to the big picture of how well a proxy means test canwork in a country like Annenia, and for what kinds of programs. As the many sectoralreforms in Armenia lead consumers to pay for many services previously subsidized, it willbecome increasingly important to have either a cash transfer program or a series of sector-specific fee waivering mechanisms to insure the poor have access to minimal goods and socialservices in order to prevent the development of structural poverty and the resulting inter-generational transmission. A proxy means test is, in the abstract, an attractive candidate fortargeting in either of these cases. Purely categorical targeting is rarely accurate, but correctincome assessment is very difficult in an economy with an income structure like Armenia's.
4.46 There are, however, certain inherent drawbacks to a proxy means test. First, as Groshand Glinskaya show, the correlates to poverty are not especially strong, so that there will bemore errors of inclusion and exclusion in Armenia than there would be in many othercountries. Moreover, most of the qualitative evidence we have suggests that, in Armenianfamilies, welfare can fluctuate sharply over short periods, often within a year. It would bedifficult for a proxy means test to capture such fluctuations since the proxies selected havecharacteristics that are relatively static. Moreover, even if more dynamic indicators werechosen, dealing effectively with such poverty would require re-registering people severaltimes a year, an intolerable administrative burden.
4.47 Some ideas bom out of other countries' experiences in implementing proxy meanstests have not been seriously reviewed in Armenia but deserve more in-depth consideration.First, in all Latin American countries using the tests, evaluation is done by a social workerwho goes into the applicant's home to gather information. This has several advantages: itallows the proxy formula to include many factors for which documentation cannot readily be,produced, but the social worker can observe. Important among these are ownership of durablegoods and quality of housing. Under this system, indicators to support home visits could beidentified using the growing work on poverty in Armenia, especially the qualitative sources.Also, the necessity of a visit to the household would most likely discourage unqualifiedapplicants from applying fraudulent applications. It is, after all, easier to manipulate a piece ofpaper than to drastically alter a dwelling. Employing home visits would also make inclusionof the poorest easier. Social workers would already be in their neighborhoods anyway, andwould, therefore, be more likely to leam of families who could potentially slip through thecracks and to include them at a lower marginal cost. Of course, since a higher percentage of

-64-
households are registered in Armenia than in other countries, the frequency of home visitsmay have to be adjusted somewhat.
4.48 Second, it is important to note that the proxy means test could be used for more thanthe Family Benefit program. In theory, it could be used to grant fee waivers or discounts forother programs, for example, waivers for the textbook rental fee or electricity vouchers.Multiple uses have the advantage of reducing the total administration dedicated to targetingdecisions across programs. Where other targeting mechanisms are already in place, carefulevaluations should be carried out to evaluate whether they are preferable to the proxy meanstest and should continue to be utilized. If they produce similar or better targeting outcomes,have low administrative costs, and are more politically or culturally acceptable than the proxymeans test, they should remain. If the alternative mechanisms do not have these features, thenreplacing them with the proxy means test should become an option.
Other Targeting Options
4.49 This section examines the potential of using alternate mechanisms to proxy meanstesting in targeting benefits to the poor, particularly with respect to allocating public fundingand subsidies in the education and health sectors.
Geographic targeting
4.50 Targeting based on geographic location can sometimes be a useful means of targetingbenefits to the poor. When regional differences in poverty rates are significant, geographictargeting mechanisms are relatively simple to implement and the administrative costs aremuch lower than for programs based on means testing. Geographic targeting can be used in anumber of ways: subsidized services can be exclusively located, or concentrated, in poorregions: in many countries, free health clinics or stores selling subsidized food are onlypositioned in urban slums or underprivileged rural areas; or the pool of funds allocated tosubsidy programs can be divided up so that poor areas get more than the share that would bedue them based on population alone, a technique often used in targeting social investmentfunds.
4.51 In Armenia, the household survey data point to only limited potential for usinggeographic targeting. Poverty rates do vary substantially between marzes, are higher in urbanthan rural areas, and higher in remote mountainous regions than rural flatlands. However, thevariations within these areas are more significant than between them. Substantial pockets ofsevere poverty exist throughout Armenia and poverty rates are liable to vary greatly evenbetween neighboring villages. This means that, to be effective, geographic targeting wvouldhave to be carried out at the level of small localities, and would require a more disaggregatedsource of data than the HBS.

-65-
Table 14: Poverty and inequality indicators by marz
Marz Incidence Average Depth of Severity of Inequality ofOf poverty Shortfall by % Poverty poverty income*
Aragacotn 51.1% 35.43 18.12 8.51 0.49Ararat 54.2% 37.94 20.55 10.47 0.64Armavir 38.1% 32.79 12.48 5.76 0.74Gegargunick 48.1% 36.02 17.31 8.53 0.41Lori 51.5% 35.68 18.38 8.91 0.47Kotaik 62.4% 40.59 25.31 13.45 0.57Shirak 63.1% 43.02 27.17 15.17 0.66Sunik 47.1% 34.87 16.42 8.11 0.56Vajoc Dzor 61.5% 46.62 28.67 17.50 0.59. _Tavush 56.1% 46.41 26.05 14.90 0.55Yerevan 58.2% 39.81 23.17 11.56 0.59AdRMENIA 54.7% 39.32 21.52 11.08 0.60* Inequality of distribution of current income within region, measured by Theil mean log deviation index.
4.52 Between marzes, the proportion of poor or very poor in the population varies from 38percent in Armavir to 58 percent in Yerevan and above 62 percent in Shirak and Kotaik (seeTable 16). The regions with the highest proportion of poor also have the most severe poverty.However, because of the great inequality within marzes, these differences are not sufficient tojustify targeting benefits or subsidies to marzes with the highest poverty rates. Althoughincome per capita is highest in Armavir, the degree of income inequality is also highest in thearea and the incidence of extreme poverty is still important.
4.53 Geographic targeting to high altitude areas, border zones and the earthquake zone hasbeen used by the government for certain specific purposes, such as determining salarybonuses and allocating funding for special programs such as the ASIF, based on assumptionsof special needs or hardship conditions in these areas. Survey data confirm the relationshipbetween altitude and poverty (see Table 17), but the differences between zones are smallcompared to variations within each zone. The Ministry of Social Security and the Ministry ofAgriculture are discussing the possibility of establishing indicators of rural poverty accordingto land type and quality. These criteria could help provide a basis for geographic targeting inrural areas.
Table 15: Incidence, depth and severity of poverty by altitude (for rural areas only)
Poverty indicators Population
Poverty Depth of Severity of Percent of ruralincidence poverty poverty population by(percent) altitude
Low altitude (under 1300m) 45.7% 0.17 0.09 40.9%
Medium elevation (1300-1700m) 48.4% 0.19 0.10 23.4%
High elevation (above 1700 m) 50.4% 0.21 0.12 35.7%
All rural population 48.0% 0.19 0.10 100.0%

-66-
4.54 Survey data also indicate higher poverty rates in the earthquake and border zones (seeTable 18), and especially in urban centers within these zones. However, the differencesrevealed are not any greater than those between marzes.
Table 16: Poverty incidence (among individuals) by location of households
Earthquake zone Border zone High Altitude All ArmeniaAreas
URBAN RURAL URBAN RURAL RURAL URBAN RURAL
Non-poor 37.4% 50.9% 46.1% 48.7% 49.6% 41.2% 52.0%
Poor 29.1% 23.8% 26.1% 20.8% 23.6% 29.2% 23.6%
Very Poor 33.6% 25.3% 27.8% 30.5% 26.8% 29.6% 24.4%
Total 100.0% 100.0% 100.0% 100.0% 100.0% 100.0% 100.0%
4.55 In many countries, geographic targeting and poverty maps are not based on surveydata because, as in the case of the HBS, the small samples in household surveys mean theirdata are representative only for large and heterogeneous areas. To identify pockets of povertyrequires using a smaller geographic area than a marz, which necessitates using a datalbase thathas information for such small units. Perhaps the most common source of such data in othercountries is the census. Armenia's census, however, is not only old -- completed in 1'988 --but is more than usually outdated. The earthquake and the population migration that resultedfrom it, the economic transition, and the strife in Karabakh, have combined to make the 1988census increasingly irrelevant. In some countries, there are other sources of data that are bothcomplete at the small, disaggregate level and closely correlated to poverty. In several LatinAmerican countries with high levels of malnutrition, all children entering first grade aremeasured, and their nutritional status calculated. This database not only monitors malnutritionover time but forms a basis for poverty maps. Unfortunately, Armenia has few data sourcesthat have both complete coverage at high levels of disaggregation, and a known, strongrelationship to poverty. After a new census is taken, the potential for geographic targeting willbe greater and the issue should be revisited at that time.
Capitation-based funding mechanisms
4.56 Armenia is moving to a capitation principle for public funding of health and educationinstitutions. This raises the question of whether funding formulas should incorporateweighting to reflect differences in poverty level between different client groups. In the case ofschools, the shortage of public fumding means they must depend on parental contributions andlocal sponsorship for heating and building repair, teaching materials and other essentials. As aresult, the threat of increasing divergence in the quality of education in different districts is amatter of serious concern. Schools in the poorest communities are often unable to raisesufficient resources to meet even the most basic needs. In some schools in better offcommunities, on the other hand, parental and community contributions are able to supportbonuses to teachers, additional course subjects, new equipment, etc. Until budgetary fundingcan be raised to a level that fully covers essential costs of providing basic education for allschool-age children, an argument can be made for allocating a higher level of public fandingper pupil to schools in communities with an especially high incidence and severity of poverty.Analogous issues arise for health clinics.

-67-
4.57 Unfortunately, because of highly localized pockets of poverty throughout the country,weighting the level of per capita funding on geographic criteria using such large areas asdiscussed above would not be a very effective solution in itself. Using all four characteristics(marz, rural/urban, altitude, and special zones) simultaneously might yield slightly betterresults. The other alternative is to use a different source of data with some correlation topoverty that is also available at more finely disaggregated levels of geographic area than theHousehold Survey. One candidate would be to use an index of the number of beneficiaries ofthe new Family Benefit per Hamaink. Such a mechanism is proposed to be used for thetextbook fee waiver system, where a school's portion of the subsidy pool is proposed to bebased on the number of pupils, with an adjustment for the number of "socially unprotectedfamilies," defined by the Ministry of Social Security.
4.58 Detailed design of a capitation scheme for education is now in progress, to be pilotedin about 10 percent of Armenian schools from September 1999. At this stage, it is proposed tokeep the formula for calculating each school's funding as simple as possible, while makingessential allowance for the high unit costs of small schools in remote, inaccessible areas.Additional allowances for pupils with special needs may also be considered. However, noallowance is made at this stage for geographically-based differences in poverty incidence.Neither does the capitation system developed for allocating funds for health care considerpoverty. Given the complexities involved in moving to a capitation system, and the absence ofreliable data sources citing strong geographic differences, this is acceptable for now. Theissue should not be considered closed, however. Refinements in the capitation system will beneeded in its early years of implementation, including the addition of a poverty-related factorto the formula. Further work is needed to determine the most effective approach forcalculating this factor, based possibly on the percentage of the Hamaink population receivingthe Family Benefit.
Community-based targeting of social sector spending subsidies
4.59 The introduction of fees and charges for some health and education services risksdenying essential services to those without the means to pay. Not only is this a danger, butsocial assessments performed to inform the design of the World Bank-financed health andeducation projects reveal that fees are a barrier to access for a substantial portion of thepopulation. Within the general public education system, parents are required to pay for food,courses and services outside the core curriculum, and fees for textbook rental. In health care,government funds cover only part of the salary and infrastructure costs and virtually nothingremains for expendable supplies and drugs. Thus a defacto system of under-the-tablepayments has evolved and patients must pay out-of-pocket fees close to the cost of providingthe services.
4.60 The question of how subsidies for school-related expenses can be most effectivelytargeted has been addressed in the design of the new textbook rental scheme. Consultationwith parents, teachers, school principals and regional administrators revealed a broadconsensus that decisions about who should be exempt from paying should be made at theschool level, where the most complete information on individual students' circumstances isthought to be readily available. This approach has been tested during the first two years of thetextbook rental scheme and the school-based revolving fund operation. Evidence so farsuggests that the approach has been well received and generally effective. The vast majorityof schools have succeeded both in raising the required amount for their revolving fund and inensuring that every child, including those who cannot afford the rental fee, has a copy of each
-68-
book. Because the precise selection criteria and decision-making processes used were notspecified in detail but were left up to individual schools, these appear to have differedconsiderably between schools and between marzes. A qualitative evaluation of the scheme isto be carried out in 1999 and will yield more information on which variants of local selectionof beneficiaries have been more effective and why, and on the potential for extending school-based selection to other education-related subsidies.
4.61 In the second year of operating the rental scheme, the government has allocatedbudgetary resources for a subsidy sufficient to waive fees for 10 percent of students in orderto assist schools in exempting the most needy pupils from payment. Although theresponsibility for targeting within the school will remain at the school level, criteria areneeded for allocating the budgetary subsidy between schools. For 1998/99, because of latepayment of the government's contribution, these funds are to be allocated to the revolvingfund accounts of individual schools on a simple per-pupil basis. However, in principle, thissubsidy is to be targeted in favo:r of schools in the neediest communities. The formula.proposed by the government to achieve this involves weighting first at the marz level,according to the registered number of socially unprotected families in each marz, and thenbetween schools, according to criteria that have not yet been clearly specified but will dependon knowledge at the marz level of local conditions. The procedures and subsidy amounts needto be made clear to schools well in advance of the 1999/2000 school year, so that each schoolknows from the start how many pupils it can afford to subsidize. The issues and options fortargeting of the governinent textbook subsidy to schools are very similar to those for the newcapitation funding mechanism, discussed above. What is learnt from refinement and pilotingof the targeting of textbook subsidies in 1999/2000 will, therefore, have direct relevance forany subsequent inclusion of a poverty factor in the capitation funding mechanism for generalschools.
4.62 In the area of health care, it is less clear which targeting alternatives will provesatisfactory. Currently, government officially provides for the poor and vulnerable (beyondservices provided free to the whole population) under the Basic Benefit Package, usin.gcategorical targeting. The large number of categories included for free health care is notfiscally sustainable however, and it is unclear how well the categories relate to poverty. A fewNGOs have experimented with screening at the level of the facility for patients that cannotafford to pay for health care. There is little evidence yet on which to evaluate theseexperiments, though piloting sirmilar techniques in public facilities and evaluating thern couldprove a useful way of learning what might work. The social assessment done in preparing thehealth project revealed that in fact doctors in private practice and those in public facilitiestaking informal payments actually already accept different levels of payment from those ofdifferent levels of welfare. But the screening mechanisms rely heavily on personalconnections between the health care providers and the clients and would therefore be clifficultio fornalize on a wide scale.
4.63 Community-based targeting of social sector spending is more difficult than ineducation because the notion of a community is much stronger in education than in healthcare. This is true throughout the country as most people will have been to school and havechildren attending school every day, whereas everyone hopes they won't be sick or require adoctor. The experience of the Armenia Social Investment Fund confirmed the communities'stronger commitment to education than to health. Under the ASIF, communities are requiredto prioritize small infrastructure rehabilitation projects and education and water came up astop priorities. Very few health projects have been requested by communities.

-69-
CONCLUSION
The study suggests that protecting the poor in the short term will be a major challenge for thegovernment in view of the extent of poverty, the very limited budgetary resources available, and therelatively limited institutional capability. The most urgent step in this area is to improve the povertyfocus of social assistance and move from a system that has supported many privileged groups, who arenot always poor, to a system that cares for the poorest members of society. In this regard, thegovernment has made a courageous move in replacing the categorical system of cash benefits with apoverty targeted family benefit, introduced in January 1999. The challenge now is to improve targetingof the family benefit and developing outreach, to avoid emergence of the phenomenon of socialexclusion. Other improvements in the social protection system such as the development of a publicworks program, supporting the self-employed and small businesses, better use of food aid to supportoutreach programs for the poorest, providing greater responsibilities to local government in themanagement and implementation of social assistance programs, and deepening health and educationreforms, can potentially have a positive impact on poverty reduction in the short and medium term.
Social insurance, through pension and unemployment benefit systems, cannot be expected tomake a significant impact in reducing the incidence of poverty in the short term. Nevertheless, it isimportant to maintain the pace in reforming the old age pension system because it has the potential tobecome a very important tool in the long term, once the capacity for savings has increased in Armenia.The system needs to be developed taking into account the specifics of the Armenian situation, both interms of the very large informal sector and the constraints to the development of a capital market.
The following table summarizes the recommendations made in the study: (i) generalrecommendations on the reform of the social protection system, and (ii) specific recommendations forimproving targeting.
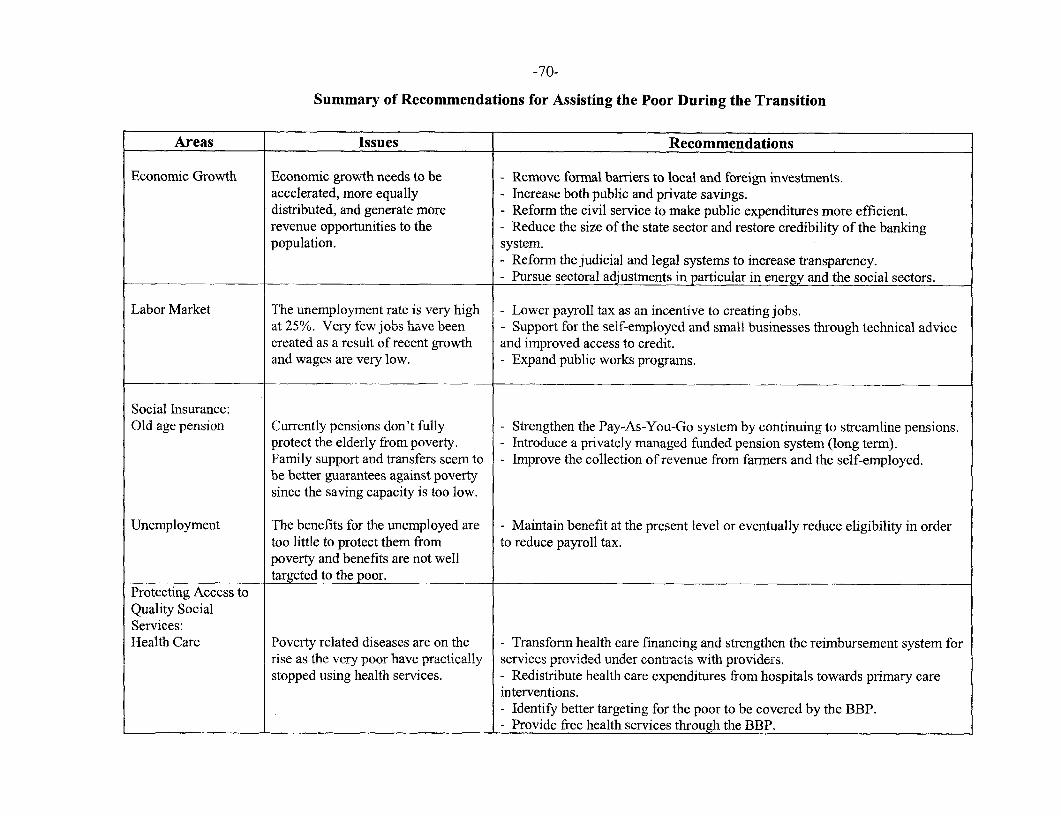
-70-
Summary of Recommendations for Assisting the Poor During the Transition
Areas Issues Recommendations
Economic Growth Economic growth needs to be - Remove formal barriers to local and foreign investments.accelerated, more equally - Increase both public and private savings.distributed, and generate more - Reform the civil service to make public expenditures more efficient.revenue opportunities to the - Reduce the size of the state sector and restore credibility of the bankingpopulation. system.
- Reform the judicial and legal systems to increase transparency.- Pursue sectoral adjustments in particular in energy and the social sectors.
Labor Market The unemployment rate is very high - Lower payroll tax as an incentive to creating jobs.at 25%. Very few jobs have beern - Support for the self-employed and small businesses through technical advicecreated as a result of recent growth and improved access to credit.and wages are very low. - Expand public works programs.
Social Insurance:Old age pension Currently pensions don't fully - Strengthen the Pay-As-You-Go system by continuing to streamline pensions.
protect the elderly from poverty. - Introduce a prtivately managed funded pension system (long term).Family support and transfers seem to - Improve the collection of revenue from farmers and the self-employed.be better guarantees against povertysince the saving capacity is too low.
Unemployment The benefits for the unemployed are - Maintain benefit at the present level or eventually reduce eligibility in ordertoo little to protect them from to reduce payroll tax.poverty and benefits are not welltargeted to the poor.
Protecting Access toQuality SocialServices:Health Care Poverty related diseases are on the - Transform health care financing and strengthen the reimbursement system for
rise as the very nonr have prac.tically serices provided under contracts wit' providers.stopped using health services. - Redistribute health care expenditures from hospitals towards primary care
interventions.- Identify better targeting for the poor to be covered by the BBP.- Provide free health services through the BBP.

-71-
Education Although enrollment rates in basic - Increase the level of per capita financing for schools in poor areas.education are very high, access to - Support school-based management.quality education is a concern for the - Rationalize schools and introduce multi-grade teaching.poor. Furthermore, access to higher - Improve the linkage between secondary and tertiary education and targeteducation is particularly problematic. subsidies for tertiary education on the basis of need as well as merit.
Utilities Tariffs for electricity and water are - Provide adequate compensation through an increase in Family Benefits, whenbeing increased to improve utility prices are increased. Inprove monitoring of the impact of utility pricesustainability of the utility increases on the poor.companies, but a large number ofpoor households are unable to affordthe new costs.
State-Run Social The state system is currently lacking -- Need to focus on the vulnerable and very poor, and fighting social exclusion
Assistance System in three areas: for those who don't benefit from informal transfers of family support.- clear objectives and approaches to - Set clear objectives and approaches to social assistance.social assistance; Define different levels of responsibilities between the marz, central and local- funding and staff incentives; government bodies.- institutional capabilities for - Accelerate the de-institutionalization of children.outreach. - Improve the local govemment's involvement in its citizens' lives, especially
in helping the poor and vulnerable.- Inprove the capacity of social services centers.- Avoid a deepening dependence on state transfers.- Increase outreach to identify individuals not reached by on-going programs.- Increase the role of elected local government and NGOs in the design anddelivery of Social Assistance programs.- Strengthen partnerships between NGOs and state structures.- Strengthen capabilities of social services centers.
NGOs NGOs are still weak and could play a - Increase their capacities in areas such as budgeting, financial management,stronger role. and reporting or monitoring systems.
- Reform the legal framework for NGOs.- Provide financial incentives or tax breaks for charitable contributions.
Humanitarian Fast decreases have a negative - Need to better manage the decrease of humanitarian assistance.Assistance impact on vulnerable groups. - Encourage cornmunity programs and create employment through food for
work programs.- Encourage NGOs to develop specific outreach programs for the very poorsuch as soup kitchens.

-72-
Summary of Recommendations to Improve Targeting
Areas Issues Recommendations
Family Benefit Targeting needs to be improved. - Reduce barriers to registering for the program by improving the public'sawareness of it, shortening registration time and improving outreach to makeit easier for the disabled to get to the offices.- Improve measurement problems, e.g. imputing income based on qualityand size of holding or ownership of car.- Improve the reputation of the system: clearly explain rules of eligibility,required procedures, disseminating information regarding status, makingappeals, etc.- Change weights in the Paros system.- Decentralize the process of assessing household scores.- Train social workers to clarify the Family Benefit system to the public.- Improve outreach in order to lower errors of exclusion.- Put in place a formal and uniform appeals system.- Set up a permanent system of monitoring and evaluation.
Other TargetingOptions:Geographic targeting The household survey data points to only - Need to carry out geographic targeting at the level of small localities and
limited potential for using geographic use a more disaggregated source of data than the Household Survey.targeting. The potential for geographictargeting will be greater after a newcensus is taken.
Capitation-based The capitation system developed for - Refine the capitation system and possibly add a poverty-related factor tofunding mechanism allocating funds for education and health the formula.
care does not consider poverty.
Despite indications from the new textbook - Carry out systematic evaluation of the different decision-makingCommunity-based rental scheme that school-based targeting procedures and selection criteria used so far by marz authorities andTargeting of subsidies can be effective, more individual schools. On the basis of this evaluation, specify in detail the
systematic evaluation of this scheme is exemption process for textbook subsidies and assess the potential for havingneeded. other targeting decisions made at the school level.Community-based targeting is difficult inhealth care because the notion of a - Introduce pilot schemes to test feasibility of screening the groups to benefitcommunity is weak. from free health care services at the community and facility level.

-73-
BIBLIOGRAPHY
Atkinson, A. and Micklewright, J. 1992. Economic Transformation in Eastern Europe and theDistribution of Income. Cambridge, England: Cambridge University Press.
Babajanian, B. 1998. "Social Protection in Armenia" Washington, D.C. The World Bank. Processed
Braithwaite, J. 1995. "Armenia: A Poverty Profile." ESP Working pare No. 80.
Braithwaite, J. 1995. "Armenia: Medium-Term Social Assistance Strategy." Mimeo.
Center for Economic Policy Research and Analysis (CEPRA). 1997. "Survey of Household Incomesand Expenditures in Yerevan 1995-1996." An Interim Report.
Children's Aid Direct. 1996. "Report on Nutritional Screening (An Approach to Targeted FoodDistribution) Martouni, Artik, Goris and Abovian." September-December 1996.
Dudwick, N. 1995. "An Ethnographic Report on the Living Standards of the Armenian Population:October 1994-March 1995."
European Community Humanitarian Office. 1996. "ECHO: Food and Medical Assessment inArmenia." April-May 1996. European Commission.
Fajth, Gaspar. 1994. "Family Support Policies in Transitional Economies: Challenges andConstraints." Innocenti Occasional Papers Economic Policy Sereis, Number 43. UNICEFInternational Child Development Centre, Florence. Figures 1 and 2.
Gomart, Elizabeth. 1998. "The Poorest of the Poor in Armenia." Washington, D.C: The World Bank.Processed.
Gomart, E. 1998. "Paros Beneficiary Assessment" Washington DC. Report
Gomart, E. 1996. "Social Assessment Report on the Education and Health Sectors in Armenia."Washington D.C, Report
Grosh, Margaret. 1994. Administering Targeted Social Programs in Latin America: From Platitudesto Practice. Washington, D.C: The World Bank.
Grosh, Margaret and Judy Baker, 1995. "Proxy Means Tests for Targeting Social Programs:Simulations and Speculation." Living Standard Measurement Study Working Paper No. 118.Washington, D.C: The World Bank (available in Russian)
Grosh, Margaret and Elena Glinskaya. 1998. "Proxy Means Testing and Social Assistance inArmenia." Washington, D.C: The World Bank. Processed.
Hentschel, J., Lanjouw, P. and Poggi, J. 1997. "Combining Survey Data with Census Data toConstruct Spatially Disaggregated Poverty Maps." Mimeo, Policy Research Department, TheWorld Bank.
Holt, S. 1995. "Using Land as a System of Social Protection: an Analysis of Rural Poverty inArmenia in the Aftermath of Land Privatization."
Keshishian. 1996. "Paros Two: Voluntary Social Registration Program Evaluation." United StatesAgency for International Development: Yerevan. Grant No. 111 -0001 -G-00-5015.
Klugman, J., ed. 1997. "Poverty in Russia: Public Policy and Private Responses: Introduction andOverview." EDI Development Studies.
Lanjow, P. and Ravallion, M. 1995. "Poverty and Household Size." Economic Journal 105: 1415-1434.
-74-
Nelson. 1993. "Household Equivalence Scales: Theory Versus Policy?" Journal of Labor Economics11:471-93
Ravallion, M. 1994. Poverty Comparisons. Chur: Harwood Press.
Ravalion and Bidani 1994. "How Robust is a Poverty Profile?" World Bank Economic Review 8(1)75-102.
Rimashevskaya 1997. "Poverty Trends in Russia: A Russian Perspective in Poverty in Russia: PublicPolicy and Private Responses."
Schmidt M and Marc A 1998. "Social Investment Funds in ECA, Opportunities and Risks"Washington, DC The World Bank. Processed.
World Bank. 1996. "Armenia: Confronting Poverty Issues." Report No. 15693-AM.
World Bank. 1997. "Republic of Armenia: Health Financing and Primary Health Care DevelopmentProject SAR." Report 16475.
ANNEX 1
Main Results from the Household Expenditure Survey

ANNEX 1Page 1 of 25
Table 1: Distribution of incomes and expenditures in Armenia by deciles: results ofhousehold survey, November-December, 1996
Percapita Current Percapita Total IncomesDeciles Net Expenditures Current Incomes Percapita
Poorest 10% 2.1% 0.3% 0.3%20% 3.4% 1.3% 1.2%30% 4.3% 2.3% 2. 0%40% 5.2% 3.3% 2.8%50% 6.2% 4.4% 3.8%60% 7.5% 5.9% 5.1%70% 9.1% 8.0% 7.0%80% 11.5% 11.3% 9.7%90% 15.7% 17.4% 14.6%
Richest 10% 35.0% 45.8% 53.4%Gini coefficient 0.4436 0.6021 0.6529Theil mean log deviation 0.3377 0.5994 0.7659Coefficient of variation 1.3445 1.9127 4.686
ean D 14-,4. 984 15,539'' mdia'; ' ' ' .r. - . . 9^ ., w}{9,90( 5 6.8175
1st decile/median 0.31 0.06 0.0710th decile/median 5.15 9.03 12.08
Notes: population deciles ranged by percapita expenditure (for expenditure Lorenz curves) andpercapita income (for income) total income includes revenue from sales of assets and valuables

ANNEX 1Page 2 of 25
Table 2: Relative Poverty Line
2752 55.93 9934 51.19
2168 44.07 9473 48.8:1
49t20 100.00 19407* 100.0(
4326 87.93 16665 85.87
594 12.07 2742 14.13
4920 100.00 19407 100.0
_ ~~~~~~~~~~~~~~~~~~~~~~~~
4550 92.48 17749 91.46
370 7.52 1658 8.54
49'20 100.00 19407 100.00
Mean Current Expenditure Per Capita 14542 drains2/3 of expenditure = 9694 drains113 of expenditure = 4847 drams
Median of Mean Current Expenditure Per Capita = 9900 dramns40% of median 3960 dramns
* Number of present members in surveyed households
Table 3: Absolute Poverty Line
Non-poor 2461 50.02% 8785 45.27%Poor 1271 25.83% 5252 27.06%
Very poor | 1188 24.15%1 53701 27.67%
Poor: percapita monthly expenditures higher than food line, but lower than national poverty line
Very poor: percapita monthly expenditures less than food line
National Poverty Line 10784.18 dramnsNational Food Line = 6612.35 dramns

ANNEX 1Page 3 of 25
Table 4 Poverty line basket structure and caloric value
Grams (per Cost (drams perProduce day, per month, per KCal KCal%
capita) capita)1 Rice 17.19 149 71 3.4%2 Beans 18.03 169 44 2.1%3 White flour 19.64 120 67 3.2%4 White bread 427.39 2244 1124 53.5%5 Macaroni products 25.62 187 89 4.2%6 Lavash (national bread) 28.62 262 76 3.6%7 Beef 17.82 513 39 1.9%8 Poultry 4.07 117 3 0.2%9 Fresh water fish 15.00 146 11 0.5%10 Milk 27.12 143 18 0.9%i Yogurt 18.27 110 14 0.7%12 Hard cheese, cow milk 12.48 317 51 2.4%13 Eggs 7.60 223 10 0.5%14 Butter 3.46 141 26 1.2%15 Oil 6.53 98 59 2.8%16 Melted butter 19.70 621 165 7.9%17 Apples 44.24 159 19 0.9%18 Grapes 4.96 28 3 0.1%19 Citrus fruts 3.30 24 1 0.0%20 Compots 14.92 45 11 0.5%21 Cabbage 45.85 69 12 0.6%22 Onions 12.19 33 4 0.2%23 Potatoes 192.45 560 115 5.5%24 Suar 16.93 134 67 3.2%
TOTAL61I ZO~~40
National Food Lhine(*.i~s 64
Share o.f ou4ood g. -san%
serics n Overty bN, t, nal , Po,e,, Lint,,k ,,,,,,,~ , ', ' . 0784 ,,,§.;' '.i":''

ANNEX 1Page 4 of 25
Table 5: Calories intake and food consumption by deciles
PRODUCE (gr. per day per capita) lDeciles KCal (per day, Bread Potatoes Apples Beef Butter (incl. Cheese Milk
per capita) l melted)
Poorest 1 | 261 137 1 6 3 9 5 16
2 1 311 136 17 6 12 6 14
3,6. 2 344 149 24 6 13 7 9
4 1,7 350 150 37 10 17 9 19
5 1 381 152 31 12 18 9 13
______ 382 200 42 2 1 22 12 27
7 ~ ~ 212370 167 43 20 24 14 35
8 227395 171 48 28 22 1 6 37
9 2 404 193 48 39 26 21 45
Richest 10 445 193 78 44 30 22 57
Aerage forwS N>all 20 36 166 39.20 $12 28;
Table 6: Poverty incidence (among individuals) by location of households
37.4% 50.9% 46.1% 48.7% 49.6% 41.2% 52.0%
29.1% 23.8% 26.1% 20.8%1 23.6% 29.2% 23.6%/
I;,et-t I33.6% 25.3% 27.8%1 30.5%l - 1 26.8% I 29.6% 1 24.4%
ol 00r0% 100.% 100 10G0-.0% h 100.0% 00% 00L0%

ANNEX 1Page 5 of 25
Table 7: Poverty Indicators by Marz
;an 0~ Z! sh--- I~ep~hof Sefey:a '~~~~~~~~~~~~~~~~~~~~~~. ,. :
Aragacotn 51.1% 35.43 18.12 8.51
Ararat 54.2% 37.94 20.55 10.47
Armavir 38.1% 32.79 12.48 5.76
Gegarqunic 48.1% 36.02 17.31 8.53
Lori 51.5% 35.68 18.38 8.91
Kotaik 62.4% 40.59 25.31 13.45
Shirak 63.1% 43.02 27.17 15.17
Sunik 47.1% 34.87 16.42 8.11
Vajoc Dzor 61.5% 46.62 28.67 17.50
Tavush 56.1% 46.41 26.05 14.90
Yerevan 58.2% 39.81 23.17 11.56
Note: number of poor in this table is the sum of poor and very poor
Table 8. Poverty and household size
--:__-::_-._- Household size (persons) Children per family Elderly per familyNe9n!poor -: 3.57 1.07 0.57
Po¢r 0 4.13 1.35 0.62Very NPor 4.52 1.55 0.64T41 3 .94 146. .-::
* Note: for present household members

ANNEX 1Page 6 of 25
Table 9: Poverty incidence by household types
Household composition Non-poor Poor Very poor. Total
1 Single person, elderly (over 60) 248 63.8% 75 19.3% 66 17.0% 3 0
2 Single person, ( less than 60 years) 165 75.7% 32 14.7% 21 9.6% X 8 1 l
3 Single parent with children 73 56.2% 30 23.1% 27 20.8% 1
4 Elderly couple without children 181 47.9% 108 28.6% 89 23.5% 3 1 l
5 Couple without children ( less than 60 years) 95 60.5% 30 19.1% 32 20.4% E 1*3. l
6 Couple with one children 124 54.6% 56 24.7% 47 20.7% 2 l
7 Couple with two children 307 50.7%1 181 29.9% 118 19.5% NO 10 l
8 Couple with three or more children 227 44.5% 144 28.2% 139 27.3% 5 10%
9 Three adults with one or more children 277 44.9% 171 27.7% 169 27.4% 6 0
10 Four or more adults with one or more children 300 40.9% 201 27.4% 233 31.7% 7 0
11 Three or more adults without children 377 52.7% 187 26.2% 151 21.1% C 4
12 All households with 8 or more person 87 36.4% 56 23.4% 96 40.2%°/
Table 10: Poverty incidence by education
-- ~.atiei, Highereducation Secondar special Secondar general Primary
ia ' Wr E1407 53.9% 16821 48.0% 2469 43.1%/ 445 41.5%r 5 X 647 24.8% 954 27.2% 15471 27.0% 312 29.1%
58 0 b2i1.4% 870 24.8%1 1716i 29.9%1 314j 29.3%
Note: excluding children

ANNEX 1Page 7 of 25
Table 11: Poverty incidencc by gender
Male FemaleNon- 4209 45.9% 4576 44.7%
Poor 2477 27.0% 2775 27.1%
Pory 2481 27.1% 2889 28.2%
Total 9167 100.0%N 10240 1Af0.f0%
Table 12: Poverty incidence by age
_________ Less han 7 7 -16 17 - 22 23 - 29 30 -39 40 - 49 50 - 59 Ovcr 60
Non-poor 908 40.9% 1732 43.6% 769 48.3% 790 45.0% 1449 44.4% 1167 49.3% 707 49.6% 1263 44.9%
Poor 589 26.5% 1124 28.3% 410 25.8% 469 26.7% 898 27.5% 642 27.1% 326 22.9% 794 28.2%
Ver Poor 724 32.6% 1113 28.0% 413 25.9% 497 28.3% 915 28.1% 557 23.5% 393 27.6% 758 26.9%-___- _-.- -. -- _--i -_ N -_
Total 2221 1 )000% 3969 100% 1502 t100 : 175 100.0% 362 IO0.0% 2366 100.0% 142 100.0% 2815 l,t%
Table 13: Poverty incidence by labor market status
Inactive Unemployed Employed
Non 5273 43.3% 739 36.1% 27731 53.5%
3386 27.8% 567 27.7% 1299 25.1%
3521 28.9% 739 36.1% 1110 21.4%
I >: 2: 10:0 51i2 I0080%
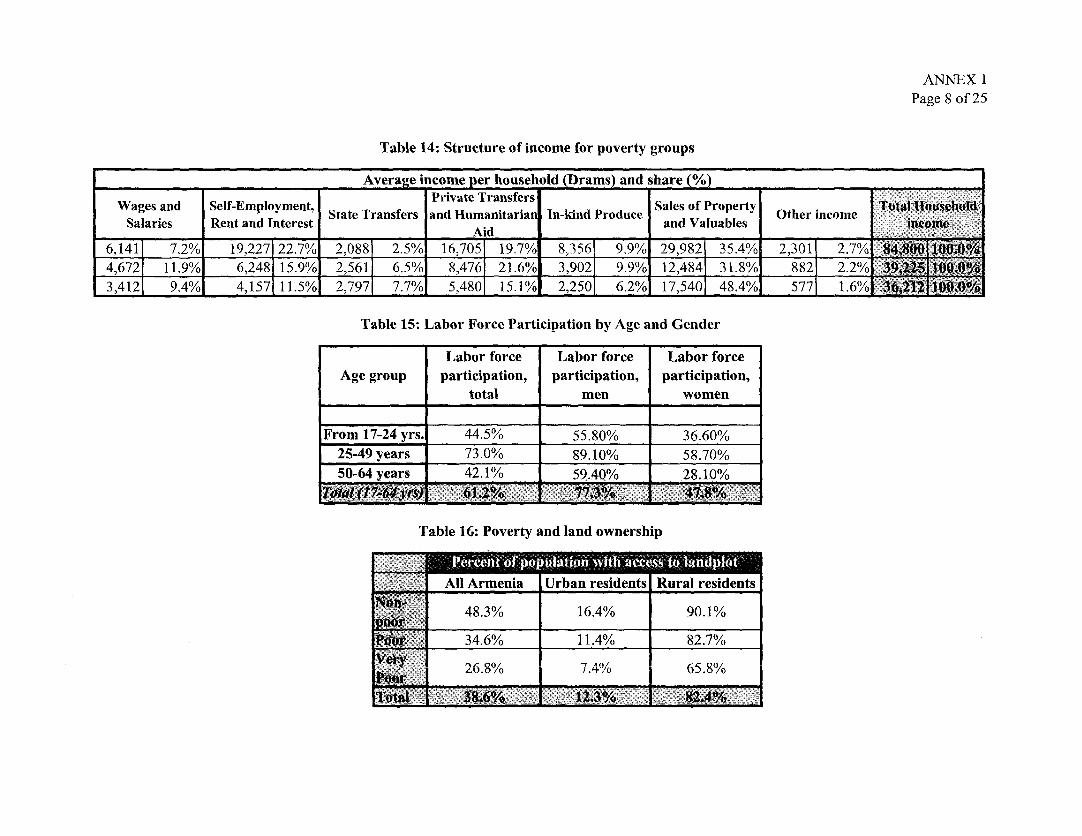
ANNEX 1Page 8 of 25
Table 14: Structure of income for poverty groups
Average income per household (Drams) and hare
Wages and Self-Employment, Private Transfers Sales of Property oal1ieid
Salaries Rent and Interest State Transfers and Humanitaria In-kind Produce and Valuables Other incomeAid _ _ _ _ _ _ _ _
6,141 7.2% 19,227 22.7% 2,088 2.5% 16,70S19.7%/ 8,3561 99% 29,982 35.4% 2,301 2.7% $
4,672 11.9% 6,248 15.9l 2,561 6.5% 8,476 21.6% 3,9026 9.9 9 12,484 31.8% 882 2.2% 92 1
3,412 9.4% 4,157 11.5% 2,797 7.7% 5,4801 15.1% 2,250 6.22% 17,540 48.4% 577 1.6%° 2
Table 15: Labor Force Participation by Age and Gender
Labor force Labor force Labor force
Age group participation, participation, participation,
total men women
From 17-24 yrs. 44.5% 55.80% 36.60%
25-49 years 73.0% 89.10% 58.70%
50-64 years 42.1% $9.4Q% 28.10%
Table 16: Poverty and land ownership
All Armenia Urban residents Rural residents
48.3% 16.4% 90.1%wo I
0 2634.6% 11.4% 82.7%
/_U.0% 1.1+74 65.8%I~~~~* I LU.070 ~ ~ 1,10046*

ANNEX 1Page 9 of 25
Table 17: Unemployment and labor force participation by regions
Labor force Unemployment
Marz participation rate for Unemployment rate among the registered with theworking age rate youth (17-25 years employment officespopulation old) employment_offices
Aragacotn 63.2% 21.7% 18.4% 3.2%Ararat 62.4% 15.1% 18.6% 16.1%Armavir 69.3% 22.7% 49.6% 16.7%Gegargunick 64.5% 17.2% 28.9% 14.1%Lori 70.1% 35.4% 53.8% 21.6%Cotaik 51.7% 27.4% 50.9% 15.7%Shirak 65.3% 37.6% 53.8% 41.7%Sunick 68.4% 40.4% 60.5% 51.8%Vajoc Dzor 69.4% 27.1% 57.7% 4.8%Tavush 72.4% 14.8% 38.7% 27.4%Yerevan 60.9% 33.8% 52.8% 22.5%A1MENTA 63 - - .9% 28.3% 45.8% 2
Note: working age population is between 17 and 60 years (inclusive)
Table 18: Unemployment by Age and Gender
Age group Unemployment rate, Share in total Unemployment rate Share of femaleAge gronp percent to labor force unemployment among women unemployment
From 17 to 24 years 46.4% 21.1% 50.9% 48.3%25 - 49 years 28.1% 68.7% 28.8% 42.7%50 - 64 years 18.8% 9.2% 11.9% 36.8%rai 7o-64yedr** :9)Z% 1)..1% 30.1% 42.9%

Table 19: Poverty and per capita living space ANNEX 1Page 10 of 25
All population Urban Rural
15.87 12.67 20.06
12.34 10.32 16.48
11.18 9.43 14.69
Table 20: Poverty and housing conditions
Urban Areas Apartments Own houses Dormitories contai or Oth er
To % sq.m. % sq.m. % sq.m. % % sq.m.46.8% 11.03 44.8% 16.78 30.0% 8.62 49.2% 11.03 45.9% 9.43
Vt i0000 -toor ̂ 28.6% 9.13 26.2% 13.66 32.5% 6.91 33.8% 9.04 27.0% 7.13246 % 3879 29.0% 11j43 37.5% 5.28 16.9% 7.64 27.0% 5.33
Apartments Own houses Dormitories Wagon or Other
&W= g iSg ^ 0 g ~~~~~~~~~sa.m. sa.,%qs.m. % sa.m.% sqm
=)~~~~M 51.0%1 17.221 57.1%1 21.201 53.8%1 17.851 50.6%1 8.781 58.8%1 i O. 410000:00 |2 4 .8%1| 1 2 .28 |2 1 .8% |1 7 .901| 1 5 .4% | 7 .7 3 |2 9 .9% | 6 .641| 1 9 .6% |10 .52|
09000124.3%1 9.751 21.1%1 16.201 30.8%1 11.551 19+5% 6a37 21.6%1 6.711

ANNEX 1Page 11 of 25
Table 21: Poverty and household utilities: running water
e, Percent of loutsehold wvith normallv fhinctionniig water suppliyL, .< S .A:§:: All population Urban Rural
88.2% 94.6% 78.7%
87.1% 93.9% 73.8%
86.2% 93.8% 71.6%
Table 22: Cost of utilities and incidence of payments
............- AN eragge per otiwschnold
All uTotilities andrentElectricity Rent Wood for heating(T otafl)_ _ _ _ _ __ _ _ _ _ _ _ _ _ _ _ _ _ _ _ _
Percent Drams Percent Drams Percent Drams Percent DramsUrban : reporting when reporting when reporting when reporting when
expenditures paid expenditures paid expenditures paid expenditures paid
96.6% 9,131 91.0% 3,443 39.1% 1,928 21.7% 26,166t6#r- '~ ' - ,, ,, - 93.6% 4,174 86.1% 2,588 29.1% 1,625 7.8% 9,115
84.8% 2,967 76.7% 2 329 30.3% 1,432 2.3% 9,2 1
. .: All utilities and rent Electricity Rent Wood for heating(Total
Percent Drams Percent Drams Percent Drams Percent Drams>;- R < * < :: reporting when reporting when reporting when reporting when
expenditures paid expenditures paid expenditures paid expenditures paid
MA*W 96.1% 11,964 91.3% 2,637 2.6% 2,615 40.3% 40,88392.5% 3,525 88.1%1 2,095 0.9% 2,333 18.2% 10,093l 88.1% 2,169 81.2% 1,871 0.3% 1 333 4.9% 20 163
N | E i tf.~~~~~~~, :,-A1i1 1.F

ANNEX 1Page 12 of 25
Table 23: Poverty, incidence of illness and use of health services
Of which:Percent seriously sick Of which: did not had to cure
to all population seek a consultation themselves39.9% 44.3% 47.7% 41.8%
Poo.r ~~~~~~32.8% 47.3% 61.4% 33.3%
e Poorr37.3% 59N5% b63.1% o 36.5%
*Note: for health survey sample (978 households, 3498 respondents)), November-December 1996
Table 24: Average private cost of completed medical treatment per patientfor non-poor, poor and very poor
Km~ ~ nna ^niec om paiddre meiedicralsan argi S se~~~~rvieatets s rain srvices pain
All ty es of treatment Of which: hospital careN Number Number of For those
Number of of For those Number of persons whopersons persons who paid: persons who paid paid:
.~~~undergoing who paid dramns per that were for dramnsmedical for ptethsiaie eia e
procedures medical painsosiai edrmeical patertIservices srie ain
Non-poor 411 332 82,995 131 131 198,296Poor ~~147 93 14,647 27 27 36,278Ve,. Poor 121 76 24,3 31 20 79,750
Note: only for health and education survey (number of respondents 3498) for completed treatment
over the last 12 months
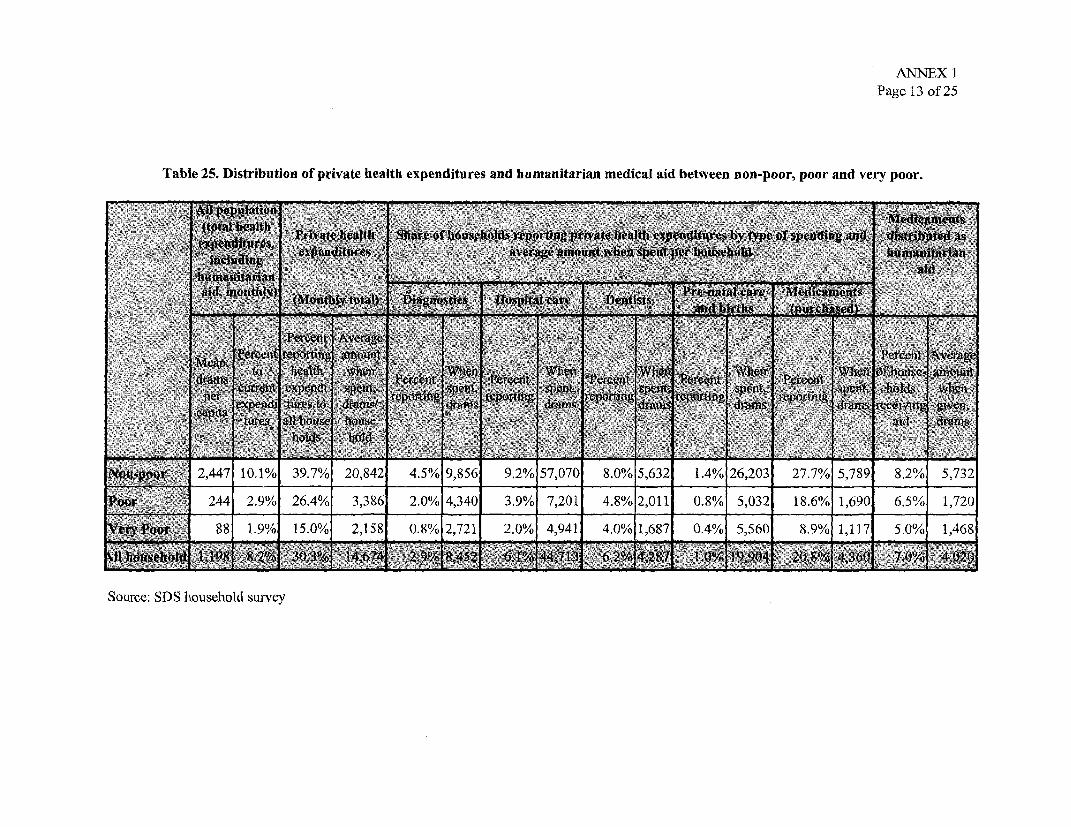
ANNEX 1Page 13 of 25
Table 25. Distribution of private health expenditures and humanitarian medical aid between non-poor, poor and very poor.
W. y4te"healM Omor v eo Wk bydy
1:-D S:SU'd.. =a
'..o'- -'''''n'.-''''' ' 8 ', ,, - ' - , '- '"
NQu. ___ 2,447 10.1% 39.7% 20,842 4.5% 9,856 9.2% 57,070 8.0% 5,632 1.4% 26,203 27.7% 5,789 8.2% 5,732
244 2.9% 26.4% 3,386 2.0% 4,340 3.9% 7,201 4.8% 2,011 0.8% 5,032 18.6% 1,690 6.5% 1,720
eryPor ' 88 1.9% 15.0% 2,158 0.8% 2,721 2.0% 4,941 4.0% 1,687 0.4% 5,560 8.9% 1,117 5.0% 1,468- SD- S- . . ... .... -h- u .. surveyli~~ ;i oiPl 1g49 X.2 3-3 -467 2 .9 8-5 ...........W. 4471 6,2 ' - 1.0 I989r 20 Sn% 4,30 70 ,2
Source. SDS household survey

ANNEX IPage 14 of 25
Table 26: Main sources for financing health expenditures forthose who paid for services over the last 12 months
46.0% 27.6% 8.7% 17.1% 0.6%47.2% 21.4% 10.1% 19.1% 2.2%
u U 5t4i.1% ,7.7% 9.t% 11.0
~~~~384 35.6, 9.6% 137 ffi _ 2.7
Table 27: Enrolment rates by age groups for non-poor, poor and very poor.
N 1nx 864 845 98% 522 517 99% 346 314 91% 1130 328 29%
552 537 97% 359 358 10% 213 198 93% 620 139 22% 1
Ve ~~~~~~577 557i 97% 356 3471 97% 180 159, 88%1 611 99, 16% 12 '~19~~ 1939 97%.fi 123 1222'~0 99 19 71 91 26 56 4% 43f

ANNEX ITable 28: Private cost of education per student by age groups for non-poor, poor and very poor. Page 15 of 25
Jneldelwe of expentitue ,mn o~eils'ihcfde in te correspohoing ags group ad vre_,~~~~~~~~~~~~~~~~s .g,. .; . ___: ___ __ ._E__: m onthly cst peir lhild. ram s .__.__.__ ___
Private lessons (for
Schools (primary) Schools (secondary schools) secondary school High school
._____________ -___________ -_______ children)Drams Percent Percent Drams
Percent reporting Drams Dramsper reotngreotnrpr
expendituresexpenditures per child reporting per childchild expenditures perdchildsexpenditures child
Nop:oor 45.6% 2758 50.0% 3492 71.6% 4130 17.0% 34932
VPor 41.4% 1227 29.5% 1465 36.4% 1287 4.1% 2387
Very oo 28.7% 759 34.1% 732 20.5% 2021 3.6% 2642
All ho'useholds: 40.3%/ 20609F 40.9% I340 30 7.0 33A10% 2S
Table 29: Decomposition of Inequality by, within and between regions.
RegIon 1~~~~~~qu~aofty ClfrIbIC
Aragacotn 9,434 0.49 3.3% 16,929 0.37 4.5%
Ararat 7,866 0.64 9.2% 14,144 0.31 7.9%
Armavir 16,269 0.74 10.9% 18,685 0.30 8.0%
Gegarqunick 11,637 0.41 5.4% 14,751 0.25 5.9%
Lori 9,800 0.47 7.3% 15,533 0.30 8.1%
Cotaik 8,874 0.57 7.2% 12,897 0.36 8.0%
Shirak 9,942 0.66 12.3% 11,509 0.28 9.4%
Sunick 12,086 0.56 3.7% 14,737 0.28 3.3%
Vajoc Dzor 8,426 0.59 2.2% 11,542 0.39 2.6%
Tavush 8,814 0.55 5.4% 12,993 0.35 6.1%
Yerevan 8,343 0.59 29.6% 14,797 0.38 33.8%
Betwveen 3.7% 2.4%
Urban 8,014 0.55 57.5% 14,032 0.34 63.2%
Rural 12,879 0.61 38.3% 15,416 0.33 36.5%
Between 4.5% 0.1%
Note: Inequality is measured by Theil mean log deviation index (L)

ANNEX IPage 16 of 25
Table 30: Incidence, depth and severity of poverty by altitude(only for rural population)
M M'm2S~Yov a r
MMP ^0 45.7% 0.17 0.09 40.9%
Me4i!~ elQi13Q~N1GQjn) 48.4% 0.19 0.10 23.4%
ili;I~ (kvi 50.4% 0.21 0.12 35.7%
Alrra. 4% 090.0-

ANNEX ITable 31: Poverty Profile by the Employment Status of Household Head Page 17 of 25
NubrPersons Pretoin these me1mbe4 Percent POulation:
4 louselhold Htead of house- Percent 7f 2 13 U honotworkiml 4 Ilds house /6.that are P toor cholds
1 1nmployed and At work 1823 8266 42.6% 51.7% 24.,7%o 42% 34.0%%
2 Employed on leave 89 419 2.20o 59.% 28.4% 2.4%/'o 2.2%
3 Employed on adminleave 107 465 2.40o XS.% 413% 3,j% 3.6%/,
4Self-employed, workin 720 3105 16.0o 47.6 2O. 2% 13.% 1.7%
5 sel.einployed,~ idle 30] 1321 6.80 53.4% ~35.0% 6.6% 8.6%
6 R~etired, not working 1165 3175 16.40 61.4%~ 3 3.4%.> 18.3 197%
7 Vnemnployed, registered 142 585 3.000 65.5% 28.7% 3.%3.1%
8 Unemployed, not registrd. 342 1323 6.8% 60.3% 36.2-% 7. 5 89%.
9 Iflscouraged Voorker." 100 364 1.900 60-% 29.9%K" 2. 1%0 2,0%
10 1osk*pr83 275 1.400 59.:6%~ 33.--8% .%17/
11 Mn~~~ctlvead~~~il# . 4 ~ 13 0.100 69.2%. 3.% 0.1% 01
12 ul~hed.;notrlg26 4 030 7% 2&%.%0%
13 _tudent 4 6} 0.000 9.3% (t0ki.6 9.0%
14 W~kln~teaiter 4 18 0.1% 100 Y0/ .%00
$ O*h~~~~~~r 1~I0 23 0.10o $2%01
TtV 4920 19487 1811.0f 54.7%o 27.7% &% 101. 0% 100.(0 10%0.%
Notes In this table poor are the sum of very poor and poor individualsPoor - all below national poverty line, very poor - below national food line, extremely poor - below 40% of national median expenditures
Household head is defined as primary earner in a household.

Palge I S of2'
Table 32: Poverty. pirorile by employment status and location of individuals
WPersons Percent
t l' B ~~~~~1811 9.33% fl,
& wzf fl v J~340 3.76%f i, 2
000 Zb_ 1 ~~~4244 21.87% k -'''., _; S E
~~~~~~~14 7.446%6i1W:!
~~~~~~~177 0.91%' l?/ ~~~~~~~394 2.03%g h
17 1]63 e 85% 3 27e0-65_ ~~~~~~2467 12.71° 9%; EXE
7@32 3.77 =%f06S
_222 ~~~~31 1.7% X;IwIeri
; j = ~~~~~~129 0.59% ^ lf6W104 0284% |C
u00rr¢ X,i;LN 72833.75%6%
§ 121§6 68~~23 3520%
387 1.99% ; . °_ l

ANNEX 1Page 19 of 25
2128 10.97% z-:->, -- <2- [ 42~~~37 2.05/o%i I;||-
297 0;15% / 0l1 0 - 18 0.09% 4. bl
- .- ; --- ; . ; s; ~~8 0.04% 00+;..... lS. .% -- :-f-:00. . .8. .3 0.02% ..... .4 .. ::-;
-- i- qft,: -. ;]457 2.35% ,,.|2m.~
17~~~~~~~~760 0.397°%o l i All 19407 l l)A. %0 5 4.7 % 2 7.7Z.4 8&5% 5 0{).W}%, I00.QsY. ,00.ONote: Poor - below national poverty line, very poor - below national food line, extremely poor - below 40%of national median expenditures; in this table poor are the sum of very poor and poor individuals; for presenthousehold members.

ANNEX IPage 20 of 25
Table 33: Poverty profile by employment status and location of individuals: FGT measures
_ 1Mg.}w w...............1811 .9.33% ratfig
£? 5~~~~~~~544 2.80% §
~~~~~~~~4244 21.87%__ y,fr_'.
.. Qg' QiS}}S} 1662 ............ 8.56/,w=%_Q ,Q' E
~~~~~~~~680 3.50% _ _ 0"W MOW A M , A,.IN6
~~~~~~~~394 2.03%_ Q' _QM ¢i_ .72A,D
gI'9R., & ,, ~~~27 0.65% Wyi lj:W 9
_ ~~~~~~~2467 12.71%
.. . ~~~~~~331 1. 71%So~|/;;K3
_ j ~~~~~~633 3.26%
; 98 L028%
~~XX1!000~22 L14%28oU k
~~~~~~~~684 8.68% 1 511 2.63%_ ;!Lq [Q!
2 ''Yi: 2~~~37° L994% <8P YX

ANNEX 1Page 21 of 25
Privatese1f-eMpliyed 2128 10.97% 44.7% 15.9% 748/ - .0M :- :7.7%.Yer.vazz 397 -.05% 49.4% - 9.0% 1. 1 ;% 1,7%Ciherur 424 2.18% 514% 18.09' 84% 2.% 1% 1. 7%--Rural 1307 6.73% 41.r/ 14.3% 7I2% :51% 4 -5% 44%4
S Jovdfo*reIgW 29 0.15 % 41.4%13.4% 5.7% --- 'X4% - --Yerevan 18 0.09% 44.4% II.% 8.9% 01%/ - 0.1% 0.Oh erur 8 0.04% 75.0% 5.2% 1.1% 00%- 0% 0.09'
ural 3 0.02% 66.7/ 13-4% 3.6% 0.0% -0 0,i0%;'.Other emloyed 457 2.35% / 51% 0.6% ;%i
Yrev 111 0.57% 57 11. 0(tAerurba 76 0.39% 50.0/ 17.6$ 78% #.4% 03% 0,3%---.. ral 270 139% 49.649 207% 11.6 13% 1.3% , 5%
L_ i54.7%9 215% 11. I J0 I 00.0% 1.00.OV 100.0%N o t e : i n t h i s t a b l e p o o r a r e th e s u m o f _ve r y .po o r . a n d. p o or. . n d.v.d ua.s ;.f or.p r e s e nt.h o u s e h o ld.m e m b e r s .
Note: in this table poor are the sulm of very poor and poor individuals; for preserit household members.
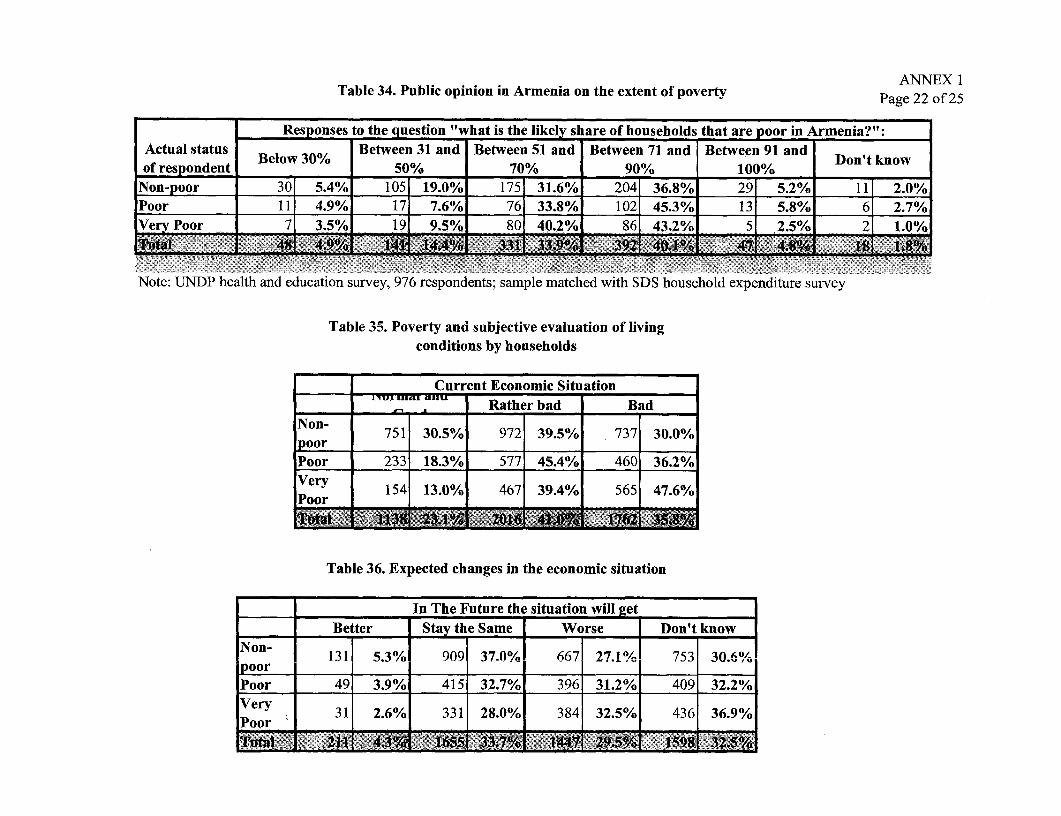
ANNEX 1Table 34. Public opinion in Armenia on the extent of poverty Page 22 of 25
Responses tothe question "what is the likely share of households that are poor in Armenia?":Actual status Between 31 and Between 51 and Between 71 and Between 91 and Dntkoof respondent 50% 70% 90% 100%
Non-poor 30 5.4% 105 19.0% 175 31.6% 204 36.8% 29 5.2% 11 2.0%Poor 11 4.9% 17 7.6% 76 33.8% 102 45.3% 13 5.8% 6 2.7%Very Poor 7 3.5% 19 9.5% 80 40.2% 86 43.2% 5 2.5% 2 1.0%
Note: UNDP health and education survey, 976 respondents; sample matched with SDS household expenditure survey
Table 35. Poverty and subjective evaluation of livingconditions by households
Current Economic SituationUI YXJ I lp Rather bad Bad
Non- 751 30.5% 972 39.5% 737 30.0%
Poor 233 18.3% 577 45.4% 460 36.2%
Very 154 13.0% 467 39.4% 565 47.6%Poor
Table 36. Expected changes in the economic situation
- l In The Future the situation will getBetter lStay the Same W Wrse Don't known
Non- 1311 5.3% 909 37.0% 667 27.1% 753/ 30.606p o o r __ _ _ _ _ _ _ _ _ _ _ _ _ _ _ _ _ _ _ _ __ _ _
Poor 49 3.9% 415 32.7% 396 31.2% 409 32.2%Very 31 2.6% 331 28.0% 384 325% 436 369%Poor _ _

Figure ) .ANTNEX I
Page 23 of 25
Rsk of pove y and nunber of dependants
70%
6 70% ___ _
50%
0%3. 0%__ __ _
20 __ _ __ _
Io %_ __ _
20%
0 1 2 3 4 5 6 7
Number of dependants in a household
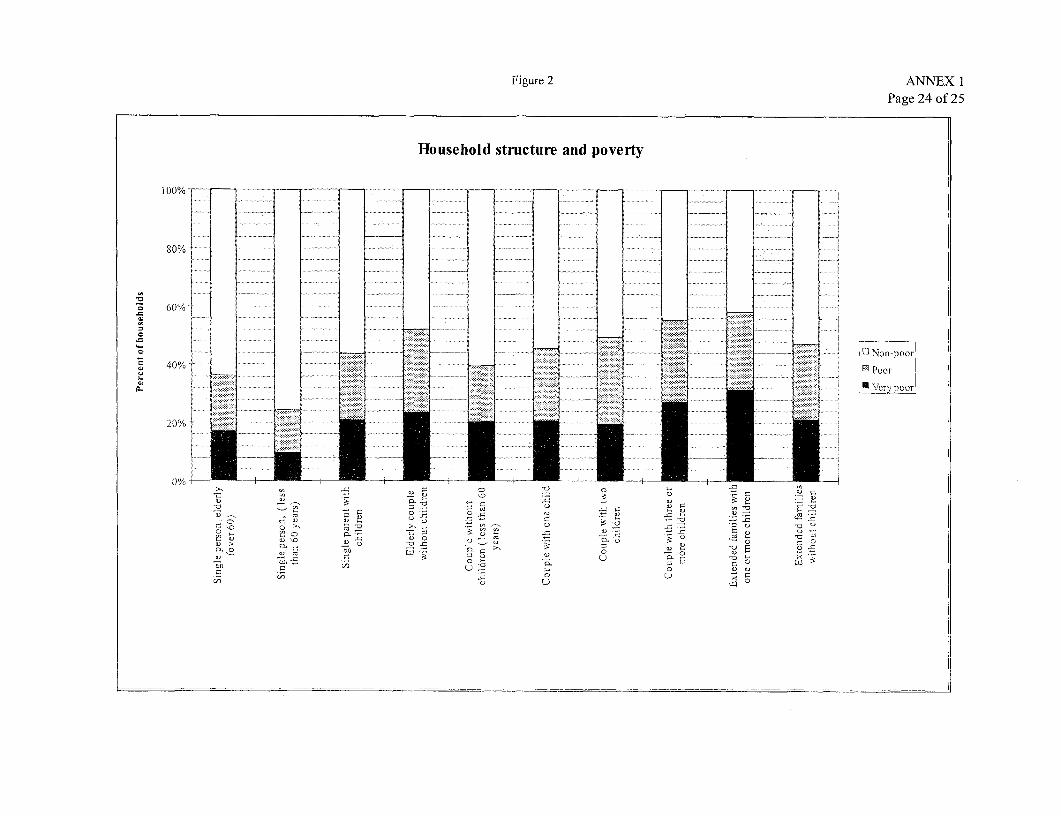
Figure 2 ANNEX 1Page 24 of 25
Household structure and poverty
100% - 9 -. - = - - ..: .. .. L- :- -- Kt ~ ~ ~~ ~ ~ ~ ~~ ~ ~ ~~~~~~~~~~~~~~ ~ ~ ~ ~ ~~~~~~ ~ .. .. ........ ....... ....
80% t - ~~~~~~~~~~~~~~~~~~~~~~~~~~~~~~~~~~~~~~~~~~~~~~. .----. 0f --l....... .
1 .. .- 0 -. -... ... ... ..... A ..... X~~~~~~~~~~~~~~~~~~~~~~~~~~~~~~~~~~~~~~~~~~~~~~~~~~~~~~~~~~~~~~~~......*~60% -
^°o 60%j0 . = _ _ _ ; _ ........ r = .s
._ ....... ... _...... _: Non-poor4071 4 ~ ~ ~ ~ ~ ~ ~ ~ ~ ~ ~ ~ ~ ~ ~ ~ ~ ~ ~ ~ ~ ~ ~~~ ~~~~~~~Poor
v,,ry P.oor
200
0% -h _ I - - -+ - - I - t- i -';Y , - S X;~~0)0 °0 - >°. C.
0 ') , c0 .° S S I
. 0)' U - rr_
L_ __ ~~~~~_ __ _ _
~~~ -~~~~~~~ 0~~~4
COn ~~~~~~~~~ -, 0)~~~~~~~~
4~~~~~~~~~~~~~~~~~0Of)~~~~~~~~~~~~~~~~c7:

Figure 3 ANNEX 1Page 25 of 25
Labor force participation: age profile (Males)
1 _
0.9
0.8-
0.5 - CM /;~~;/%~ Discouraged workers
0.4 - E Employed
0.3 - / '' Non-registered unemployed
0.2 UM Registered unemiployed0.1
0
>s~~~~~~ >E z )
o m u O 0 0 Cn 0
0~~~~~~~~~~~~~~~~~~'rs N q q m m It Ir
Labor force participation: age profile (Females)
09 -
0.8 -
0.7 _ _ _ _
0.6-
0.5 - I /01 Discouraged workers
0.4- EJm Emnployed
0.3 N~~~~~~~ Non-registered unemployedo ~ /'~/ U Registered unemployed
0.2
0.1
0 ~ ~ ~ 0~
cq 6, ° <, $) F m
Note: As a proportion of the corresponding age group; discouraged workers are individuals without work,able to work, who would like to work, but not actively searching for a job.

ANNEX 2Page 1 of 14
MEASURING POVERTY IN ARMENIA
Description of 1996 Household Survey compared to 1993-94 Pilot Survey
1. The 1993-1994 pilot survey conducted by a joint team from Yerevan State University'sSociology department and the State Department of Statistics (SDS) was unique at the timebecause it was one of the first attempts by an FSU country to accurately measure householdincome and expenditure based on a representative sample of the country as a whole. The pilotsurvey provided the database that was later used to draw the poverty profile for the PovertyAssessment.' The poverty profile must be updated for s number of reasons and, fortunately, newrepresentative household data are available.
2. The pilot survey's methodology is fully described in Braithwaite (1995). The survey wasnot without limitations that the new Household Expenditure Survey was designed to overcome, inparticular: (i) the sample was drawn to be representative for the country as whole, including ruraland urban areas, but not regions, limiting its value to inform regional policies; (ii) the recallperiod for food expenditures was a single day as compared to a week for other expenditures,making expenditure data not truly representative, and likely making all measures relying on thevariance (including poverty measures) overstated; and (iii) the questionnaire design was differentfor urban and rural parts of the sample, and datasets were not strictly comparable since the ruraldata included the imputed values of the respondents' own consumption of produce and livestockfrom their plots which the urban data did not; different relative poverty lines were applied to bothregions to overcome the distinction.
3. In addition, the year timeframe for implementing the survey was long. The country wentthrough a period of hyperinflation during 1993 and because no reliable price deflators existed,part of the dataset (related to 1993) could not be used for the analysis. Consequently, therepresentative nature of the results were somewhat reduced. Finally, the questionnaires were notpre-coded for the different types of currency in circulation in Armenia, which unquestionablyincreased the measurement error, especially given the extreme exchange rate swings during thelong time span of the survey. As a result, due to technical problems related to dispersion ofexpenditures in the dataset, only relative poverty lines based on the medians were used to producethe pilot poverty profile.
4. It is important to note that the pioneering nature of this work produced these shortcomings,indicating that results of the survey are not strictly comparable to other transition economies or tothe new Household Expenditure Survey.
5. The new household survey conducted by the SDS in November-December 1996 drewheavily on lessons from the pilot survey. Although the SDS team designed the survey, TheWorld Bank and external consultants provided substantial technical assistance.
6. The survey covered 100 villages and 28 towns and was designed to be self-weighted.2 Itwas representative of the administrative marz, or regional, level as well as of both urban (by thesize of cities within urban areas) and rural areas (by the elevation of rural ones). The sample sizeincluded 5,040 households of which 4,920 responded - a very high response rate -- making it thelargest household survey carried out to date in Armenia.
Armenia: Confronting Poverty Issues. ReportNo.15693-AM.
Detail on the sampling see in the report by the SDS: (1998).

ANNEX 2Page 2 of 14
7. A randomly selected quarter of respondents kept a diary and made daily entries of theirexpenditures and consumption; three-fourths of respondents filled out a questionnaire based onrecalls for the last month. Most of the questionnaire was similar for both parts of the sample andincluded sections on household composition, housing conditions, labor market status, income andtransfers, family business (including land use and livestock), saving and borrowing, food stocks,and their subjective evaluation and expectations of the current economic situation. Thequestionnaire also included explicit, detailed questions of in-kind consumption and transfers, andprovided pre-coding for different currencies. All of Armenia was included in the survey in thelast two months of 1996, a relatively brief period of time. The SDS team performed the dataentry and cleaning; it completed the construction of main aggregates and definition of povertybasket during a visit to Washington in September-October 1997.
Definition of Poverty; Unit of Analysis; Consumption and Income
8. What is poverty? In the broadest definition, poverty is the economic status of a personwho falls short of a reasonable minimum level, either in absolute terms or by the standards of aspecific society. Even this narrow definition poses serious measurement problems. Beforeexamining the state of poverty based on the Household Budget Survey data, several assumptionsreflecting an approach to defining poverty should be clarified. General concepts of measuringwell-being, choosing the unit of analysis (individuals or households), and determining the povertyline are discussed below. Extensive literature exists for dealing with these issues3 and it will bediscussed briefly below in the context of the Armenian data.
9. Measuring well-being. Income and consumption are considered the typical measures ofwell-being. Their time profiles may differ because as families save or borrow, their measuredpoverty status may be different the two approaches. The generally preferred indicator ofhousehold living standard is a comprehensive measure of current consumption that includes allsources, including purchases, gifts, stocks and the household's own production. Consumption ispreferred over income for three reasons:
10. (i) First, current consumption is usually taken to be a better indicator of the currentstandard of living, since the household's welfare during the observation period is likely to dependprimarily on that period's rate of consumption. Consequently, the consumption measure shouldbe as comprehensive as possible. (ii) Second, current consumption may also be the best possibleapproximation of average well-being in the long run since households typically "smooth" theirconsumption even though incomes vary sharply over time. In other words, households tend tosave during periods of high income and to consume from those savings when income is low.Also, some households can borrow from either relatives or private lenders. (iii) Third, anyobserved differences between income and consumption can result from respondents seeking tcoconceal their income to avoid taxation and for other concerns. In the socialist economy, mostinformal activities were illegal and residual fears may induce households to underreport incomne.Because taxes on many entrepreneurial activities are rarely paid, households may fear thatstatistical bodies will disclose such information to tax authorities4. The empirical work based ona number of countries has shown that relative ranking of households by reported consumption is abetter indicator of their true standards of living than reported income (see Deaton 1998).
See, for example, see Ravallion (1992) for a survey
For the new Armenian Household Budget Survey mean per capita current expenditures were higher than current average per capitaincomes almost by 50 percent. This discrepancy is, however, reduced to only 5 percentage points, once total incomes (i.e.including incomes from valuables and property sales) and total expenditures (including durable goods purchases) are compared.

ANNEX 2Page 3 of 14
11. Unit of analysis. The analysis in the profile focuses on poverty among Armenianhouseholds. If the household was deemed poor, all its members were counted as poor. This wasbased on the implicit assumption that all individual members of a household benefit equally or ina constant proportion from the household's total income and expenditure.
12. In reality, change in household consumption may effect the welfare of different membersin different ways depending on their age, gender or education. Data on the actual differences inliving standards within a given household are rarely available, and the Armenian HouseholdBudget Survey was no exception in this respect. This limitation should be kept in mind ininterpreting the profile's quantitative findings since it has implications for policy andmeasurement, such as that household-based measures may underestimate the true extent ofpoverty among individuals (see Haddad and Kanbur 1990; Nelson 1993).
13. Issues in measuring consumption. Complications arise in defining household expendituresand consumption in FSU countries today. The most significant concerns are: socially-based,publicly-awarded in-kind benefits, including those received from enterprises or as privatetransfers; and consumption of home-produced goods and common property resources.
14. The household survey included a very explicit section on goods received in-kind from theState, NGOs, employers and individuals as well as those given by the household to others.Normally, individuals were asked to specify the monetary values of benefits received in-kindfrom employers (output produced, food, transportation, health care) and aid from humanitarianorganizations (food, non-food goods, kerosene, medicine). The respondents' valuations of thesein-kind benefits are, of course, subject to criticism, but parallel market prices exist for most of thegoods and services and most of the responses are close to shadow values. However, servicesgiven for free are by their nature much more difficult to pin a fixed rate to.
15. The source of primary concem is housing. Most of the housing in Armenia has beenprivatized by now and utility prices are close to production costs levels. This was not true,however, at the time of survey. Fortunately, little difference exists in the ownership or quality ofhousing between the poor and non-poor, according to the profile. Therefore, the study introducesonly a slight measurement error by omitting the imputed rents for owner-occupied houses. Thequestion of how to treat arrears on utility payments is related to this issue because a great manyhouseholds indicated using electricity and water but did not report expenditures for them.Unfortunately, it is impossible to quantify the amount they should have paid in order to get arough estimate of their consumption, however in this case, aggregate consumption will tend tounderestimate actual well-being. Most of these omissions are similar to the survey data gaps inother FSU countries. Within this regional perspective, consumption computed for Armenianhouseholds is not likely to be severely underestimated.
16. The second issue, how to measure in-kind consumption of home-produced goods, could bemore adequately dealt with by using the survey instrument. The questionnaire addressed anumber of points about access to and use of land plots, and respondents recorded all products andamounts in great detail. Respondents were also asked to evaluate the market value of homeconsumption. Since local prices derived from the expenditure segment of the questionnaires anddiaries were available, this information was used to check the self-reported total value ofagricultural produce consumed in-kind, and the values for outliers were properly corrected.Interpreting the results from common property resources proved a bit more problematic. Thequestionnaire did not specifically ask for goods that were not obtained from their own land, forexample a fish caught from a river, or fuel collected in the forest. Wild herbs collected inwastelands and then dried constitute an important component of consumption in some rural areas,

ANNEX 2Page 4 of 14
especially for the poorest households. This is less of a concern in accurately estimating thepoverty basket, since it is based on actual consumption of households as recorded in their dairies.
17. The current total monthly expenditures used as a measure of consumption comprise: foodand current non-food purchases; in kind production and consumption of food products; the valueof net in-kind transfers. It does not, however, include consumption from food stocks. Data on1consumption from stocks were unavailable for three-fourths of the sample since only householdsin the part of the sample that filled out the daily diary were reminded to include all produceconsumed from stocks in their total consumption. A specific test was carried out to determine theextent to which this omission biased the expenditure measure. For those with daily records,purchases, production and consumnption could be separated. Using the diary sample with dailyrecords of consumption in-kind for about a dozen of the main food staples, it was possible toconstruct the distribution for purchases, own production and consumption (including the use offood stocks). As a result, during the month of observation, the amounts consumed from the fciodstock and that consumed from monthly purchase (or production used to replenish food stocks) areroughly equivalent. Thus, consumption was not dramatically underestimated since it included allpurchases regardless of whether they went to consumption or to stocks to be consumed in latermonths.
18. Expenditures recorded in diaries are by design more comprehensive than estimates basedon recall given during oral interviews. The implication is that for all lower deciles the Lorenzcurve of current expenditures for diaries dominates the one for questionnaires. For almost alldecile groups up to 9th decile, current expenditures recorded by the segments of the sample thatfilled out the diaries were somewhat higher. But this discrepancy is normally within a reasonablerange: for any percentile the difference is between 5 and 20 percent of per capita expenditures.This property of the dataset has implications for measuring poverty that are discussed in thesection on robustness checks for the poverty line.
19. Defiition of povi-Xy line. Two approaches exist for setting the poverty line; one uses anabsolute standard and the other uses a relative approach to poverty. This profile is based on anabsolute line: How to derive a cost of normative nutritional requirements and make allowancesfor non-food consumption? One popular method is to determine the consumption expenditure atwhich the average individual achieves the food energy requirement. This can be readilyestimated from a graph (relating calories intake to actual current expenditures) or regression.Price data are not required and the method automatically includes allowances for non-foodconsumption.
20. Although acceptable for a single national poverty line, this method can yield inconsistentpoverty comparisons across sub-groups because the relationship between energy intake andexpenditures will shift depending on affluence, tastes, activity levels and publicly-providedgoods, and nothing guarantees these differences will remain relevant for poverty analysis. Forinstance, poverty lines derived with this method tend to be higher in richer regions wherehouseholds tend to buy more "expensive" calories and may cause a complete rank reversal andinconsistencies in the poverty profile. When a person migrates from a poor to richer region itcould lead to an increase in the aggregate poverty measure even though he or she is better off interms of real consumption (see Ravallion and Bidani 1994).
21. An alternate method attempts to directly measure the local cost of a normative food andnon-food consumption bundle. The food bundle is anchored to nutritional requirements and isconsistent with the consumption habits of the poor, and its value is estimated at regional prices.The food line then becomes a reference point to estimate the share of non-food items in thepoverty basket. This was the method used to estimate Armenian poverty lines in this study.
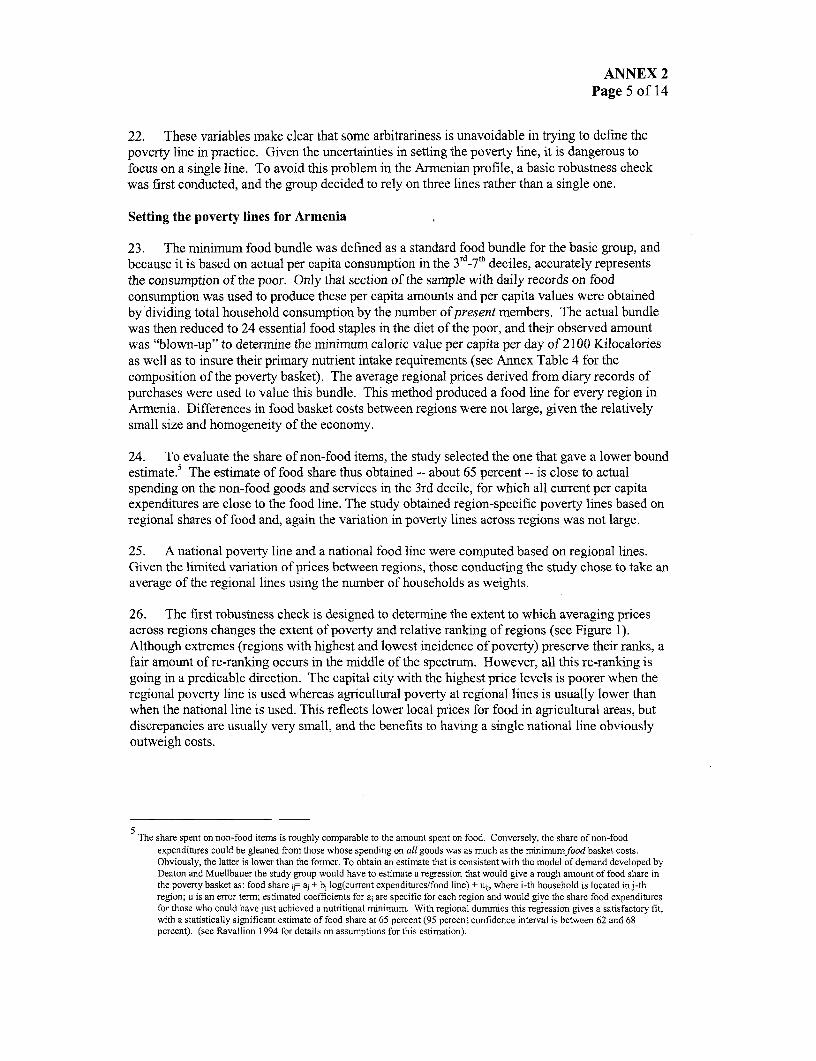
ANNEX 2Page 5 of 14
22. These variables make clear that some arbitrariness is unavoidable in trying to define thepoverty line in practice. Given the uncertainties in setting the poverty line, it is dangerous tofocus on a single line. To avoid this problem in the Armenian profile, a basic robustness checkwas first conducted, and the group decided to rely on three lines rather than a single one.
Setting the poverty lines for Armenia
23. The minimum food bundle was defined as a standard food bundle for the basic group, andbecause it is based on actual per capita consumption in the 3d-7 deciles, accurately representsthe consumption of the poor. Only that section of the sample with daily records on foodconsumption was used to produce these per capita amounts and per capita values were obtainedby'dividing total household consumption by the number of present members. The actual bundlewas then reduced to 24 essential food staples in the diet of the poor, and their observed amountwas "blown-up" to determine the minimum caloric value per capita per day of 2100 Kilocaloriesas well as to insure their primary nutrient intake requirements (see Annex Table 4 for thecomposition of the poverty basket). The average regional prices derived from diary records ofpurchases were used to value this bundle. This method produced a food line for every region inArmenia. Differences in food basket costs between regions were not large, given the relativelysmall size and homogeneity of the economy.
24. To evaluate the share of non-food items, the study selected the one that gave a lower boundestimate.' The estimate of food share thus obtained -- about 65 percent -- is close to actualspending on the non-food goods and services in the 3rd decile, for which all current per capitaexpenditures are close to the food line. The study obtained region-specific poverty lines based onregional shares of food and, again the variation in poverty lines across regions was not large.
25. A national poverty line and a national food line were computed based on regional lines.Given the limited variation of prices between regions, those conducting the study chose to take anaverage of the regional lines using the number of households as weights.
26. The first robustness check is designed to determine the extent to which averaging pricesacross regions changes the extent of poverty and relative ranking of regions (see Figure 1).Although extremes (regions with highest and lowest incidence of poverty) preserve their ranks, afair amount of re-ranking occurs in the middle of the spectrum. However, all this re-ranking isgoing in a predicable direction. The capital city with the highest price levels is poorer when theregional poverty line is used whereas agricultural poverty at regional lines is usually lower thanwhen the national line is used. This reflects lower local prices for food in agricultural areas, butdiscrepancies are usually very small, and the benefits to having a single national line obviouslyoutweigh costs.
5The share spent on non-food items is roughly comparable to the amount spent on food. Conversely, the share of non-food
expenditures could be gleaned from those whose spending on all goods was as much as the minimumfood basket costs.Obviously, the latter is lower than the former. To obtain an estimate that is consistent with the model of demand developed byDeaton and Muellbauer the study group would have to estimate a regression that would give a rough amount of food share inthe poverty basket as: food share ij= aj + bj log(current expenditures/food line) + uii, where i-th household is located in j-thregion; u is an error term; estimated coefficients for aj are specific for each region and would give the share food expendituresfor those who could have just achieved a nutritional minimum. With regional dummies this regression gives a satisfactory fit,with a statistically significant estimate of food share at 65 percent (95 percent confidence interval is between 62 and 68percent). (see Ravallion 1994 for details on assumptions for this estimation).

ANNE,X 2Page 6 of 14
Figure 1.
Poverty incidence with national and regional poverty lines (regions are rankedby poverty incidence implied by the national line)
70.00%
60.00%
50.00 I ONational poverty line (10784
40pendit00es is equal 0.5 -- very lose to 1 - which meas an extra Drams per capita)
~-30-00o8 A Regionally-specific poverty lines
20.00%
27. nt addition to the food line, used to identify the very poor, a relative line set at 40 percentof the mredian was also used. This one was intentionally set using a method similar to the line forthe pilot survey and happened to be the lowest line; it was used to identify the ultra or theextremely poor6. This definition of extremely poor also corresponds to the idea of the followingbehavioral threshold for hunger: the elasticity of expenditure on food with respect to total currentexpenditures is equal 0.95 -- very close to 1 -- which means an extra dram would almost entirelybe spent on food.
28. A second check of the acclracy of the poverty line would be to examine the sensitivity ofthe poverty measure to a change in the level of the poverty line. While inequality at both end ofthe distribution line seems to be high, households appears to be fairly evenly distributed along thepoverty line (see Figure 2) with the exception of two regions.7 Decreasing the poverty line by 20percent would reduce the headcount by nearly a quarter, from 54.7 percent to 42.3 percent for thecountry as a whole; decreasing it by 1 0 percent would reduce the headcount by 11I percent. Thieelasticity of poverty incidence with respect to increases in the poverty line is even smaller.Increasing the poverty line by 10 percent and by 20 percent would cause a headcount to increaseby 9 and 17 percent respectively. Such roughly proportional changes suggest that the distributionwas not especially concentrated around the poverty line and that it was measured within areasonable margin of error.
6See also endnote 9 in the main text that gives an absolute value and nutritional intake associated with thia relative line.
Sunick and Vajots Dzor; note that Vajots Dzor is the smallest region in termrs of population and has the fewest observations in thesample.

ANNEX 2Page 7 of 14
Figure 2.
Sensitivity Analysis of Poverty Incidence (Regions ranked bypoverty implied by national line)
5 70- - - K .-E5 70% v -A--- -20%higher poverty line
5 50%4 0% + *-_A+-__-t-X 0%/ohigher povesty line
8 4 0 % - - - ---- - -- --I- N-a--o ional poverty line (1 0784.+---t- ~~~~~~~~~~~Dra-n pee capita)
0 30 !/ ------- ------ -+-- 10%lover poverty line
20% --- ------ - - --- 20%lo,er poverty line
1 0 % - -- - - - - - - - - - - - - - - - - - - - - - - - - - - -_ %j I O < #> S go0 < 8 8 > >
t O%~~~8
29. A third check of the accuracy of the poverty line is to test the extent to which the resultswould change, if the difference between the part of the sample derived from daily records and thepart from oral monthly recalls are incorporated into the analysis. The poverty basket was derivedfrom consumption data that came only from diaries. The diary sub sample has higher currentexpenditures. If we apply the poverty line only to this part of the sample and adjust the povertyline for the rest of the sample accordingly (that is downwards), the national poverty incidencewould drop only slightly from the observed 54 percent to 50 percent. Such a small change in theoverall headcount was judged too minor to bother with applying two different lines to two partsof the sample, therefore, one national line was adopted regardless of whether the household filledout a diary or answered the questionnaire during the interview.
Equivalence scales and economies of scale in the household
30. Income and consumption data from household surveys are usually collected at thehousehold, rather than the individual, level. This means that in attributing to the individuals whocomprise the household their share of household resources, an adjustment based on someallocation rule must be imposed. The most commonly applied "rule" is that each family memberreceives an equal share of household resources, which means household consumption and incomeare divided by household size to get a per capita measure consumption or income. Althoughsimple, this allocation rule is not necessarily correct, therefore other allocation rules, known asequivalence scales, are often proposed for a more accurate reading. Despite little availableguidance in choosing among the wide range of possible scales, it is important to examine thesensitivity of poverty comparisons to the particular allocation rule selected.
31. Because equivalence scale is usually distinct from scale economies of consumption withinthe household, they will be addressed separately.' In many developing countries, commoditieswith economies of scale in consumption account for a small part of consumption budgets of thepoor because their consumption is primarily made up of goods such as food and clothing forwhich few scale economies exists. Consequently, the literature on poverty in developing
'Although Jenkins has recently demonstrated that any equivalence scale should in fact be proxied by an economies of scale parameter0, in other words by changing 0, one can obtain any number of equivalent adults using the formula: Na=N0 , where Na -number of equivalent adults, N- number of household members; 0 is also known as a parameter for economies of scale. Valueof I would imply per capita measurement (no economies of scale), value of 0- that all household expenditures are fixed costsand do not depend on the number of people (infinite economies of scale).

ANNEX 2Page 8 of 14
countries has tended to use flat equivalence scales, most conmmonly per capita measures. As afirst-order approximation it is also defensible for Arrnenia, but certainly needs to be carefullychecked.
32. To illustrate how the incidence of poverty and the poverty profile are sensitive to changesin assumptions about the economies of scale, we will apply the OECD, Georgian and Russiartequivalence scales to the Armenian dataset.9 All three have limitations and advantages. TheOECD scale is widely used for intemational comparisons and is judged suitable to mostdeveloped market economies. The Russian equivalence scale is the only one developed fortransition economies based on direct measurement of individual consumption within thehousehold. Its disadvantage is that, being based on 1992 data, it is relatively outdated. TheGeorgian equivalence scale has been developed using only expert judgments, unlike the othertwo, but still has validity when applied to Armenia since it shares many similarities in lifestylewith neighboring Georgia.
33. Note that the following experiments are carried out purely for illustrative purposes. To geta meaningful set of results the original poverty line had to be changed according the concept ofequivalent adult as opposed to per capita measurement.10
Table A2. Poverty incidence among individuals, by type of householdsand location under different equivalence scales
Percent of members who are poor and very poor
Household composition Share of Per capita OECD Russian Georgianpopulation scale scale scale scale
Single person, elderly (over 60) 2% 36.2 45.0 23.1 34.2
Single person, working age 1% 24.3 29.4 27.5 28.9Single parent with children 2% 49.6 40.2 54.8 38.6
Elderly couple without children 4% 52.5 50.9 38.8 44.8Couple without children (working age) 2% 40.6 38.6 48.0 42.3
Couple with one child 3% 45.7 36.6 52.8 35.5
Couple with two children 12% 49.6 34.4 54.7 36.8
Couple with three or more children 13% 55.5 37.7 60.1 39.3
Extended families with one or more children 48% 60.4 47.9 63.1 48.9Extended families without children 13% 49.1 42.2 53.7 46.3
TOTAL 100% 54.7 43.3 57.6 44.3
Urban 62% 58.8 47.7 61.9 48.7
Rural 38% 48.0 36.0 50.4 37.0
OECD and Russian scale are presented in detail in Klugman 1997 and are forthcoming for Georgia. In OECD scale every adulthousehold head has a weight of 1, all other adults - 0.7, children - 0.5; Russian scale gives to every adult approximately 1.2,each child 1.01, and each pensioner 0.7. Georgian scale gives different weights to different demographic groups for foodconsumption with children and pensioners getting 0.8 of the equivalent for adult, depending on age and gender. It also impliesa "mutual consumption effect" or economies of scale for non-food component of the poverty line, and large and progressiveeconomies of scale for the household size. For households with 4 members, for example, each would have to have to spend onnon-food only a half of the amount for a single person household. On aggregate, Russian scale does not imply economies ofscale, OECD implies large economies of scale (0=0.7), and Georgian implies a combination of Russian scale (relatively highweight to children) and economies of scale implied by OECD.
10 Applying OECD scale would require, for example, re-estimating the minimum consumption basket and expressing all figures inconsumption per equivalent adults. There was no attempt to re-estimate the food minimum bundle itself, so the adjustment: isvery approximate and based on the "price per calorie" of the standard Armenian basket. Applyihg the share of non-foodexpenditures produces a poverty line for an equivalent adult based on household composition, or number of equivalent adults asimplied by the equivalence scale.

ANNEX 2Page 9 of 14
34. Table A2 presents the results of a comparison by household types (for which equivalencescales are designed on purpose). The overall headcount changes between different methodologiesare quite dramatic, but the relative risks of poverty are less affected. The per capita measures thatwere used for Armenian extended families with children that had the highest incidence of povertywere the same on the Russian and the Georgian scales. The OECD scale ranks pensioner couplesliving alone as facing the highest risk of poverty, but even on this scale extended families withchildren rank second in terms of poverty incidence. Couples who have increasingly number ofchildren are also at greater risk of poverty for all scales, except OECD. Rural areas areconsistently better off regardless of the assumptions about economies of scale used.
Econometric tests to determine the existence of economies of scale in Armenian households
35. The framework adopted for this section is taken from Lanjouw and Ravallion (1995) andbased on a demand model proposed by Deaton (see source for details of the underlying model anddiscussion). Simply summarized, the main question is to determine whether larger householdsneed less per member or whether they spend less per member simply because they are poorer.
36. Introducing a welfare metric is essential and the most widely used method, the Engelapproach, jointly estimates the equivalence scales and economies of scale whereby the share ofspending devoted to food becomes an inverse indicator of wealth. Ravallion and Lanjouw (1995)follow the common Leser-Working model in which the food share is regressed on the log ofexpenditures per person and a set of demographic variables. The basic form tested on Armeniandata can be obtained by adding parameters for the effects of household size independently ofthese variables:
wi=a+bln(xi/ni0)+Zj=1llcjeji + regions' relative prices + residual.
Where wi denotes the budget share devoted to food by household i, eij is the proportion of personsin household i who belong to category j. In that specification, the compositional effect cj(equivalence scale per se) is estimated alongside the size elasticity 0 (economies of scale effect),by isolating the pure compositional effect from the effect of household size n.
Specifically, the estimated coefficient and the basic output layout are the following:Coefficients: Name
Dependent vari.: wi foodsh
Explanatory var.s: Log household expenditure X Incurex
Log household size Y lnmemb
Demographics:
Children share Cl chish
Old share C2 oldsh
Log of price level (poverty line) P lnpr
Dummy for rural areas R rural
The estimate of theta is 0 =Y/X.The size and significance of cj suggests whether some difference in needs between demographicgroups that require the introduction of equivalence scale.
37. Below are the printouts of estimates. The food share is computed as total expenditures onfood (including in-kind consumption from land plots and net transfers) to total current householdexpenditures. The printout reports basic tests for omitted variables bias and heteroscedasticity. It

ANNEX 2Page 10 of 14
also provides a test of the hypothesis consistent with theta equal to one, which has evidently notbeen accepted. Alcohol and restaurant food was likewise excluded from total food expenditures,but results were similar to the ones reported below.
Source I SS df MS Number of obs = 4915---- +------------------------------- F( 6, 4908) = 244.46
Model | 58.8848584 6 9.81414307 Prob > F = 0.0000Residual | 197.039683 4908 .040146635 R-squared = 0.2301--------- + -------------------------- Adj R-squared = 0.2291
Total | 255.924541 4914 .052080696 Root MSE = .20037
foodsh | Coef. Std. Err. t P,|t| [95% Conf. Interval]
lncurexp J -.1387909 .0036986 -37.525 0.000 -.1460419 -.1315399lnmemb | .0920774 .0066408 13.865 0.000 .0790584 .1050964oldsh | -.0015093 .0101878 -0.148 0.882 -. 021482 .0184633chish | -.011366 .0157103 -0.723 0.469 -.0421653 .0194333lnpr | .2288241 .0684572 3.343 0.001 .0946173 .3630308rural | .0472532 .0064849 7.287 0.000 .03454 .0599664cons | -.8201935 .8285695 -0.990 0.322 -2.44456 .8041734
Ramsey RESET test using powers of the fitted values of foodshMo: model has no omitted variables
F(3, 4905) = 89.34Prob > F = 0.0000
Cook-Weisberg test for heteroscedasticity using fitted values of foodshHo: Constant variance
chi2(1) = 41.54Prob > chi2 = 0.0000
test lncurexp=-lnmemb( 1) lncurexp + lnmemb = 0.0F( 1, 4908) = 54.05Prob > F = 0.0000
38. The values estimated suggest that parameter of scale economies as implied by data is near0.092/0.139=0.66 (the 95 percent confidence interval is between 0.54 and 0.80), a very substantialeffect and one consistent with the OECD scale. Demographic variables turn out to be insignificant,pointing out that what matters is household size, but not its demographic composition. Based on- theeconometric test, a per capita measurement is inappropriate for Armenia.
39. However, these results don't come without some doubts and qualifications. The first onecomes from the data itself. Dividing the sample in two parts -- bottom half and richer half (in termsof per capita consumption) -- we can see that for the poor half there is no significant effectassociated with the size of household. In fact, results for the sample as a whole are driven by thericher families, which appear to be the only ones with some economies of scale.
40. Repeating the same procedure separately for each marz produces mixed results. Only threeregions offer evidence of positive scale economies: Yerevan, Gegharkunik and Ararat. Notsurprisingly, many regions have a substantial number of wealthy families, which, as pointed outearlier, are likely to drive these results. The hypothesis of constant scale economies is not rejectedin three other regions. Others produce inconsistent estimates.
41. Thus, accepting the scale economies on empirical grounds is uncertain. On the theoreticallevel, limitations to using this test as a definitive argument are also present. Before concluding thlatthere are some economies of scale, it is wise to reflect on the assumptions that underlie it. Twoproblems stand out: (i) the method is only valid under special assumptions about the property of theconsumer's cost function, for example, unit price elasticity (see Lanjouw and Ravallion 1995). Theshare of expenditures devoted to food is not the best indicator of utility for many reasons, therefore,the importance attached to these results are dependent on subjective beliefs; (ii) intra-household

ANNEX 2Page 11 of 14
inequalities are not taken into account. Even if the food share was a valid indicator of averagewelfare levels within the household, there might be better indicators for specific sub-groups, suchas adults or children, and those indicators might respond differently to household size. Thealternative Rothbarth method of setting the scale (used for constructing the OECD and Russianequivalence scale) takes this explicitly into account, using consumption of "adult" goods as awelfare metric. Alternatively, the scale could be anchored to child welfare. All those methodsrequire, however, a lot of research time and effort, and the results are again inconclusive.
42. The strategy adopted in the case of the Armenia poverty profile was not to set the "correct"scale. Instead, it was adopted to see how robust conclusions were on correlates of poverty tomeasurement assumptions, which poses the question: What changes would arise in demographiccharacteristics of the poor if the premise of the economies of scale implied by the estimate isaccepted? First, unlike in the per capita-based measurement, both larger and smaller households areat equally high risk of poverty, whereas medium-sized ones are less likely to be poor (see Figure 3).
Figure 3
Values of economies of scale parameter and poverty incidence by size ofhousehold
6S 000%~
600Y -.- / z i=
eC39%~~~~~~~~~~~~~~~~~~~~~~~~~~~~~~~~~-n- 0=00
400D96-*-- ~
Note: with changes in the parameter for economies of scale the poverty line has been changed each time to keep the average incidence of
poverty constant.
43. Where the structure of poverty is concerned, only miinor changes relate to introducingeconomies of scale. Some increase in the share of pensioners among the poor and a decrease in thenumber of children is shown in Figure 4, but both effects are marginal.

ANNEX 2Page 12 of 14
Figure 4.
Economies of scale and composition of poverty bydemographic groups
Z r-_ Adultinactive andunemployedAdult
50% ~~~~~~~~~~~~~~~~~~~~~~~~breadwinner09 _ .., _ .. _ .... ............ ............ -.- : _ . ....... ......... ,.,. .zElderly
20%/, - _ - _ _ ' -Children
9=1 8=0.9 9=.8 0=7
44. More importantly, the number of dependents including children, the elderly and unemployedis closely and positively related to poverty risk, whatever value of theta in a plausible interval isused. Figure 5 illustrates this point. For each class, given by the total number of dependents in thehouseholds, it shows the percentage of households that are poor. A range of economies of scaleadjustment is used, as in Figure 4.
Figure 5.
Number of denendants and risk of Dovertv for a
70.00%
60.00%
50.00% / =
40.00%,
30.00% A 3=.8
20.00% :
10.00% - 0
0.00% I
0 1 2 3 4 5 6 7 andmore
Number of dependants
Note: with changes in the parameter for economies of scale the poverty line has been changed each time to keep the average incidence ofpoverty constant
45. Finally, and most importantly, the number of employed or self-employed breadwinners inthe household acts as a very strong determinant of poverty regardless of the assumptions abouteconomies of scale taken into consideration, as Figure 6 illustrates.

ANNEX 2Page 13 of 14
Figure 6.
Number of breadwinners and risk of poverty for a household
60.00%
: 50.00% - - - - - - - - - - - - - - - - - - - -
, 40.00% - - - - ------- t--Iw O 9
5 320 .0 0 % -- - - - - - - - - - - - - - - - ---- -- -- -- -- -- -- -- -- -- -- -- -- -- ---- - - - - - - -- - - - - - --- -- - -
30.00% 7
0 1 2 3
Number of breadwinners
Note: with changes in the parameter for economies of scale the poverty line has been changed each time to keep the average incidence of
poverty constant.
46. What about the socioeconomic profile of the poor? Because the economies of scaleadjustment is based primarily on household demographics, changes in this parameter should not, inprincipal, effect the poverty profile of the main socioeconomic groups, and indeed they have a verysmall impact on the relative risks of poverty, as Table 3A shows.
Table 3A. Relative risk of poverty and economies of scale adjustment
Parameter for economies of scaleHousehold head: 0=1 (per 0=0.9 0=.8 0=.7 Number of
capita) families
Employed 0.87 0.88 0.89 0.89 1823
Self-employed 0.75 0.75 0.77 0.78 720
Unemployed, registered 1.20 1.24 1.27 1.27 142
Unemployed, not registered 1.02 1.03 1.05 1.07 342
Retired 0.94 1.04 1.14 1.24 1165
Familieswithalleastoneunemployed 1.10 1.11 1.11 1.11 1824
Education of h/h members
Not relevant - no active members 0.85 0.97 1.07 1.18 1084
all have secondary or primary education 1.03 1.04 1.05 1.07 1421
at least one with special secondary 0.90 0.90 0.93 0.92 1249
at least one with higher education 0.83 0.83 0.85 0.85 1166
Location:
in Yerevan 0.99 1.01 1.04 1.08 1424
in other urban centers 1.00 0.99 0.98 0.97 1591
in rural areas 0.85 0.85 0.86 0.87 1905
47. The average poverty risk for households is taken in this table as 1. Values higher than 1indicate a higher risk of poverty among households in a particular group and-values lower than Iimply a lower risk of poverty. Unsurprisingly, the primary conclusions reported by the profileremain unchanged. The one exception is when demographics and socioeconomic conditions are

ANNEX 2Page 14 of 14
closely intermingled, as in the case of pensioners, where if they are head, the household is usuallysmall. This is why as larger households "gain" affluence when the economies of scale areintroduced, and their numbers among the poor population are reduced as a result, families headedby pensioners tend to be over-represented among the poor. Since their numbers are also sizeable inYerevan, the rising poverty risk coupled with the introduction of economies of scale explains thiseffect. Bearing this caveat in mind, all other characteristics of the poor as reported in the povertyprofile remain valid.
48. Setting economies of scale is a very approximate science. It relies heavily on normnativeassumptions generally accepted by society. Given Armenia's strong tradition, government officialsinvolved in the design of social policies and public opinion are not ready to relinquish the per capitameasurement standard. Therefore, the per capita equivalence scale was used in the report. But asexperimenting with a wide range of parameters for economies of scales has demonstrated, someconclusions concerning the poor are not qualitatively altered. However, others are very sensitive toeven minor adjustments for economies of scale in consumption. This issue is particularly importantin light of demographic characteristics of the poor.

ANNEX 3Page 1 of 16
ARMENIAN LABOR MARKET: ADJUSTMENTS AND
MISALIGNMENTS
The Labor Market Situation and Economic Trends
1. When viewed in context with the FSU, the Armenian labor market possesses someunusual characteristics and shares some common trends. The FSU is characterized, moststrikingly, by an asymmetrical employment response to output contraction, that is, a largedrop in the GDP that has not been matched by a corresponding fall in total employment.Armenia shares this asymmetry, but it is more extreme because the elasticity ofemployment with respect to output is amongst the lowest for all FSU countries.According to official statistics, total employment declined only slightly, by 14 percent, in1996 compared to 1991's highest levels of employment, resulting in a net loss of 200,000jobs. The official numbers for GDP and total employment shown in Figure 1 recordsignificant labor hoarding and suggest a steep fall in productivity. This demonstrates thatthe brunt of the adjustment was felt in terms of real wages, not employment. It alsomeans that it will take a while for economic growth to impact on measured employmentsince many workers' hours or productivity have been dramatically reduced and could berestored without rising numbers in employment as the economy takes off.
Figure 1
10090
80
70
o60O ~~~- GDP
it50-Employment
0~40
30
20
I10
0
1991 1992 1993 1994 1995 1996
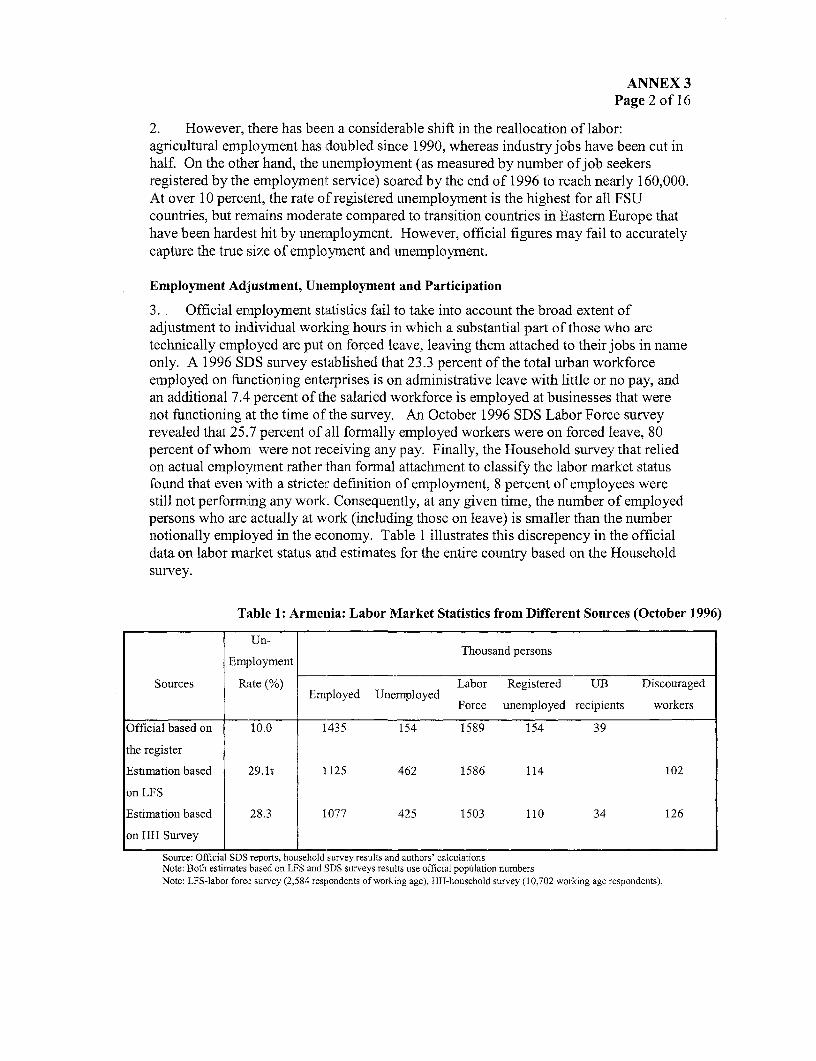
ANNEX 3Page 2 of 16
2. However, there has been a considerable shift in the reallocation of labor:agricultural employment has doubled since 1990, whereas industry jobs have been cut inhalf. On the other hand, the unemployment (as measured by number of job seekersregistered by the employment service) soared by the end of 1996 to reach nearly 160,000.At over 10 percent, the rate of registered unemployment is the highest for all FSUcountries, but remains moderate compared to transition countries in Eastern Europe thathave been hardest hit by unemployment. However, official figures may fail to accuratelycapture the true size of employrnent and unemployment.
Employment Adjustment, Unemployment and Participation
3. Official employment statistics fail to take into account the broad extent ofadjustment to individual working hours in which a substantial part of those who aretechnically employed are put on forced leave, leaving them attached to their jobs in nameonly. A 1996 SDS survey established that 23.3 percent of the total urban workforceemployed on functioning enterprises is on administrative leave with little or no pay, andan additional 7.4 percent of the salaried workforce is employed at businesses that wer enot functioning at the time of the survey. An October 1996 SDS Labor Force surveyrevealed that 25.7 percent of all formally employed workers were on forced leave, 80percent of whom were not receiving any pay. Finally, the Household survey that reliedon actual employment rather than forrnal attachment to classify the labor market stattisfound that even with a stricter definition of employment, 8 percent of employees werestill not performing any work. Consequently, at any given time, the number of employedpersons who are actually at work (including those on leave) is smaller than the numbernotionally employed in the economy. Table 1 illustrates this discrepency in the officialdata on labor market status and estimates for the entire country based on the Householdsurvey.
Table 1: Armenia: Labor Market Statistics from Different Sources (October 1996)
Un-
Employment Thousand persons
Sources Rate (%) Labor Registered UB Discouraged
Force unemployed recipients workers
Official based on 10.0 1435 154 1589 154 39
the register
Estimationbased 29.lt 1125 462 1586 114 102
on LFS
Estimation based 28.3 1077 425 1503 110 34 126
on HH Survey
Source: Official SDS reports, household survey results and authors' calculationsNote: Both estimates based on LFS and SDS surveys results use official population numbersNote: LFS-labor force survey (2,584 respondents of working age), HH-household survey (10,702 working age respondents).

ANNEX 3Page 3 of 16
4. What emerges from this data? The collapse in output has lead to significant laborchanges from temporary layoffs in the form of administrative leave rather than openredundancy. The reasons that companies might hoard labor are numerous (seeCommander, et al. 1996). In Armenia's case, severance pay that is required by law to goto laid-off workers could be the most immediate reason for cash-stripped enterprises tohoard labor.
5. Consequently, a significant number workers who are formally consideredemployed and are still on the payroll lists (often with zero wages) are, in reality, eitherunemployed or have dropped out of the labor force altogether. Aggregate employmentfigures based on enterprises differ from survey-generated numbers by about 300,000people. In other words, actual employment at the end of 1996 was lower than the officialestimate by at least 20 percent. Part of this discrepancy is explained by seasonal factors,but breaking this gap down by sectors shows the main contributor to be industry - wherethey tend to keep workers on the books after they have long since lost their occupations. 1Considering the survey-generated figure, the drop of employment appears much closer tothe compound change in GDP and would bring net labor shedding over the period oftransition to 40 percent.
6. Unemployment levels measured by labor force Household surveys stand at muchhigher levels than are suggested by the registration statistics. Registered data onunemployment fails to take into account about 3/10 of a million unemployed, exactly thenumber of "missing" employees. However, "missing" employees and the non-registeredunemployed, though numerically identical, are not necessarily the same persons. Theimportant point is that the unemployment rate measured by the Household surveysexceeds 25 percent, whose numbers may be comprised of those who are officiallyconsidered inactive as well as only the formally employed.
7. A 26 percent unemployment rate is very high by any standard and astronomicallyso for an FSU country. But the drop in actual employment by 40 percent during thetransition from a communist to a capitalist economy would have generated even higherunemployment rates if all the released workers continued active participation in theworkforce. In fact a substantial segment has been absorbed by non-participation, and aselsewhere in FSU, participation rates fell. In addition to the unemployed large groups ofdiscouraged workers want to work but have given up the job search. The sizeable fall outof active participation was not equally important for different age groups. Older maleworkers were more likely to hang on to their jobs to the disadvantage of younger, femaleworkers and new entrants. The next section explores ways in which the slow integrationof younger workers into the labor market is a particularly acute problem in Armenia.
Outcomes
8. Unemployment coupled with the lack of participation by the majority of theworking-age population means that at any given time Armenia is without productivelevels of employment. The gravity of the situation is illustrated in Table 2, which is
1 The law requires that a worker sent on forced leave due to economic reasons must receive one-third of the minimum wage, as lowas 720 drams at the time of the survey, however even such a meager half a dollar monthly rate was actually paid to only 1/4 of theworkers affected by administrative leave.

ANNE'X 3Page 4 0f16
based on labor force survey results. It breaks down the labor survey non-employment2estimates by age group for Russia in 1995, Bulgaria in 1996, the Eastern Europeancountry most affected by unemployment and drop in participation, and Turkey in 1996,the country in the region with charactenrstics most similar to Armenia.
9. Armenia's statistics lie outside this group. Almost half of prime working ageadults (25-49 years old) do not have gainful employment. Non-employment of newentrants (15 to 24) is also the highest among these four countries. The fact that separatesArmenia even from countries with low participation rates for the population as a whole islow employment rate for males.
Table 2. Non-employment rates for Armenia andselected countries in the region (percentages)
ArmeniaAge group Total Male Female
15-24 82.0 76.5 86.225-49 47.6 35.5 58.250-60 59.3 45.0 70.7Total 57.9 46.6 67.4
Russian FederationAge group Total Male Female
15-24 62.3 60.4 64.325-49 19.6 15.9 23.250-60 26.7 16.2 44.4Total 29.6 26.6 32.8
Bul2ariaAge group Total Male Female
15-24 80.1 79.8 80.525-49 25.2 22.8 27.550-60 34.6 37.0 30.1Total 40.5 39.5 41.6
TurkeyAge group Total Male Female
15-24 65.4 60.9 69.625-49 38.6 10.6 67.250-60 45.1 30.7 69.3Total 46.9 24.4 68.1
Note: non-employed are unemployed and out of the labor forceSource: Armenia - SDS HH survey, OECD, 1998
2 Non-Employment = Unemployment + Non-Participation

ANNEX 3Page 5 ofl6
10. Two phenomena appear to be responsible for low employment, and they playdifferent roles for two main age groups: new entrants and prime age adults. Among newentrants a low participation rate is to blame for low employment, whereas for most workage adults unemployment is the primary cause. Most striking in a country like Armeniais an unemployment rate as high as 28 to 29 percent in a labor force where only abouthalf the working age population is gainfully employed.
The Puzzle of EHigh Unemployment and Low Participation
11. It is possible this regime could be sustained for a long time only in a society thatdepends on extensive intra- and interfamily transfers. But before adopting this premise,other possibilities related to measurement issues must be explored.
12. The official statistical practice was not to count as employed able-bodied membersof rural households that own land, but SDS abandoned this approach when conductingthe labor force survey. This across-the-board adjustment in the aggregate employmentstatistics for formal land owners is not fully justified because Social assessment revealssome households that received land during privatization aren't able to work it, but don'tsell it because taxes are prohibitively high. However, not all farming is limited to ruralareas; some urban households, especially in small towns, are also landowners. Therefore,applying such an adjustment to rural areas only would be a mistake. Finally, and mostimportantly, the statistical practice of counting all rural landowners and their familymembers as employed does not take into account an economic criterion of labor marketclassification based on actual behavior rather than formal characteristics. Unemploymentmay be concealed in an agricultural household when the marginal product falls below thereservation wage and members could actively begin looking for jobs, thereby exertingpressure on the labor market. But since the official employment number includes thesecases such adjustments could be attempted as an experiment.
13. If households owning rural land were excluded from the ranks of the unemployed,as current legislation dictates, the unemployment rate for the country would drop to 23percent (from 14.9 percent to 1.4 percent in rural areas). If only those who work theirland (in both rural and urban areas) were considered employed - producing a moreaccurate adjustment -- the unemployment rate in rural areas would be drastically reducedto 4.8 percent, but only marginally to 33.1 percent in urban areas. The unemploymentrate for the whole country would similarly drop -- from 28 percent to 23 percent -- stillvery high. The conclusion emerging from this statistical exercise is that factors otherthan poor measurement or reporting are behind the high unemployment rate.
14. Three possible explanatory factors are presented in detail below: (i) extendedfamily as safety net, (ii) flow of transfers from outside the household, and (iii) casual,one-time occupations.
15. Extended family. A large household may, in fact, play a role in the poolingmechanism and act as a security net for unemployed members that may cushion theeffects ofjob loss. In response to high unemployment, for example, young adults mayremain at home longer. The prevailing family structure, in which several generations

ANNEX 3Page 6 of 16
share an extended household, makes clear why the huge unemployment rate does nothave a more pronounced impact on living conditions.
16. The actual distribution of the population by household types shows that over halfthe population lives in extended families. The specific employment and unemploymentrates reveal that members of extended families are more likely to be outside the laborforce or unemployed, particularly for working age males. Conversely, in less than Ipercent of extended households no one is employed as opposed to 30-40 percent amongnuclear or incomplete families. Therefore, unemployed and inactive working age adultshave someone in the family who directly supports them.
17. This effect of large households becomes particularly striking when we look at age-specific unemployment risks in relation to the type of household the individual belongsto. The distribution of individuals for different types of households and age groups plustheir specific unemployment risks is shown in Table 3. Two effects are immediatelyclear: First, most young adults live with their parents until age 26. Even for the primeworking age (between 26 and 50) only half the population belong to nuclear families andover a third still pool their resources in multigenerational households. It becomes clearthat age primarily affects unemployment risks depending on various types of families.Young adults, especially those living in extended households, are at maximumunemployment risk and this effect continues until age 35, but as they grow older andbecome primary earners, the risk falls considerably. Hence, demographics can accountfor part of the high unemployment problem.
Table 3. Unemployment rates for prime age workersby household demographic type and age group (percent)
Under 26 years old Between 26 and 35 years From 36 to 50 years old Between 50 and 60old
Demographic type Unemploy- Distribution Unemploy- Distribution Unemploy- Distribution of Unemploy- Distributionment rate of population ment rate of ment rate population ment rate ofpopulation
population
Extended with children 52 47 38 27 25 28 23 35
Extended w/o children 41 29 35 11 24 15 20 26
Work. Age couple with children 42 16 24 53 26 46 16 12
Work. Age couple w/o children 33 2 15 1 32 3 23 6
Work. Age single female 46 1 38 1 26 percent 2 27 percent I
Work. Age single male 12 1 24 1 percent 31 percent I percent 24 percent 2 percent
Retired with or w/o children 0 0 0 0 0 0 0 9
Work. Age sing. female w. depend. 33 3 29 4 26 4 18 3.
Work. Age sing. male w. depend. 83 1 53 1 43 1 9 6
Total 46 100 30 100 26 100 20 100
Note: for present family members between 17 and60 yearsSource: SDS household survey
18. Transfers. Once the household receives support through transfers or remittances,its members are more likely to remain inactive or to take longer to look for a job, therebypushing up the unemployment rate. Private transfers play a particularly important rolesince the State provides relatively little support to the unemployed or poor. As much as

ANNEX 3Page 7 ofl6
30 percent of the population lives in households that receive transfers, and even whenallowances are made for the demographic type of family, transfer recipients are much lesslikely to be employed. Transfers effect male employment figures most strongly, resultingin 6 percentage points difference in job rates between members of households that do ordo not receive transfers.
19. An even stronger effect is seen where remittances are concerned. By their nature,they are a highly unstable source of income, and since the Household survey wasconducted for only a single month, data on actual receipt of remittances may beincomplete. Therefore, another criterion should be used instead; for example, theabsence of a working age member from the country. If the family that remains inArinenia eventually gets support from this member, it could be used as a proxy for receiptof remittances. About 7 percent of Armenians live in households in which someonecould potentially provide such support. Again allowing for demographic types andgender distinctions, the employment rate is almost halved for those who receiveremittances.
20. Temporary occupations. Most unemployed Armenians are, by their own account,without work for at least one year. Given the economy's informalization and significantentrepreneurial activity it is quite plausible that some of these periods of unemploymenthave, in fact, been briefly broken by temporary, casual work or jobs (often unpaid)related to activities of an employed member of the household. Such "side" labor isdifficult to pin down due to its very nature and to the fact that it usually doesn't offer asubstantial income. Nevertheless, irregular jobs maybe the only coping mechanism forsome of the unemployed given the fact that unemployment benefits are low and privatetransfers are not received by all who need support.
21. Labor force surveys typically don't provide any insight into the labor activities ofthe unemployed since all respondents who have some kind ofjob during the period ofobservation (even for only one hour in the last week or month) are automaticallyclassified as employed.3 Fortunately, in the case of Armenia, a separate survey ondifferent issues4 was applied to the same households and included questions about timespent on different activities, such as work outside the house, work on family farm, etc.Consequently, the labor market status of individuals found in the income andemployment section of the Household survey can be checked against their reports onactual time spent in a different survey.
22. It appears that when any work (paid or unpaid, in or outside the home) is acceptedas a criterion for classifying unemployed or inactive person as employed,5 ruralemployment and unemployment figures are powerfully effected, but urban employmentlevels experience no dramatic reduction. Figures are also altered by counting asemployed those classified as out of the labor force (primarily family members of
3 The SDS was fully aware of this problem, having published a report on the LFS results. The approach used involved interpretingall the unemployed who were out of work for over a year as employed in the informal economy, thereby halving the observedunemployment rate. However, as with any across-the- board adjustments this methodology does not take into account the actual statusof the unemployed and the heterogeneity among them.
4 UNDP survey on health and education conducted around the time of main Household survey.
5 But not counting employed as unemployed if they report zero hours.

ANNEX 3Page 8 of 16
agricultural households), rather than by reducing the actual stocks of the unemployment.With these new settings, the unemployment rate for the country as a whole would be reduced to20 percent of the labor force and the employment rate would increase to 57 percent.
23. Another method for measuring concealed labor is to take onto account income fromsales of assets and valuables. There is strong support for the assumption that a substantialpart of this income in fact represents proceeds from unregistered trading activities.6Qualitative assessment methods outline an informal credit arrangement when a householdsells some products, such as cigarettes, soft drinks, etc., at retail street prices and lives onthe income (see Dudwick 1995). Another form of this activity is shuttle or suitcase trade.These occupations typically lack job security and few consider it employment, which iswhy it is not fully reported in surveys. Indeed, in the SDS Household survey half thehouseholds that do report income from such sales don't declare themselves as employedor report earnings from self-employment.
24. Operating on the assumption that such sales activities involve all family memlbersin one way or another, all unemployed or inactive adults are counted as employed in afamnily enterprise or as entrepreneurs when sales income was reported. This reduces theunemployment rate for the country as a whole to 16 percent (i.e. more than by 10percentage points), and increases the employment rate to 60 percent. This adjustmentprimarily effects urban areas wvhere 95 percent of such "employment" is found.However, it should be noted that in half of these adjusted cases the income from sales isless than the cost of a minimum food basket per adult, underscoring that such activities arelow-income, low-productivity, casual occupations.
25. What if both adjustments are made simultaneously, i.e. taking into account anylabor activity and any incomes from sales of valuables? Since the two adjustments ofteneffect different types of households, the combined effect is indeed very large. In sum, theunemployment rate as a result of both adjustments drops to 10 percent of activepopulation and the employment increases to 70 percent of working age population. Thisis on the order of the magnitude to be expected in Armenia given its income level. Notethat this result was achieved by applying a very "soft" definition of employment and arestricted definition of unemployment.
26. It is noteworthy that a large number of those considered employed have no work todo and receive no earnings, but are instead on involuntary leave. The SDS Householdsurvey reveals that 2/3 of such employees do not consider themselves "employed" andhave lost any attachment to their former work places although they formally remain onpayroll lists. The remaining 1/3 is quite heterogeneous, which makes any across-the-board adjustments inappropriate.7 In fact, some have found other employment or beenrecalled by their employer, as occurs in 25 percent of cases, as the UNDP survey data onuse of time suggests. Another 25 percent manage to survive on informal sector casualoccupations. The remaining half is probably in worse shape compared even to theunemployed, since this group can't register for unemployment benefits.
6 In the SDS Household survey, results indicate a big disrepancy between the total amount of valuables bought and sold (the formeris only a fraction of the latter) as reported by repondents and interprets such income as informal sector self-employment income.
7 This contradicts SDS report on LFS assumption that all workers on administrative leave are unemployed, arriving at a highunemployment rate.

ANNEX 3Page 9 of 16
27. Consequently, the puzzle of high unemployment and low participation can beexplained by different economic phenomena. A clear demographic effect in conjunctionwith the impact of transfers and remittances make the rate for sustainable unemploymenthigher for a given income. But it is doubtful whether the exuberantly highunemployment and low participation should be taken at face value. Informalization andmarginalization of employment are the primary causes of much joblessness due to a greatdeal of urban petty trade and rural barter economics, both of which are not considered asmuch employment as survival tactics. Because these activities are statistically invisiblethey are particularly difficult to measure with any precision. If assumptions about thisinvisible marginal employment are indeed accurate, it accounts for about 40 percent ofthe Armenian workforce, in which case not genuine unemployment, butunderemployment, is the issue in Armenia. It is also clear that the unemployed are agroup with different degrees of adjustment to the labor market situation. This specificissue will be explored in greater detail below.
Characteristics of Armenia's Unemployed
28. The above makes clear that being unemployed in Armenia means different thingsto different people. However, the unemployed share some pronounced characteristicsthat set them apart from the employed. First, this section will explore a profile of theunemployed that emerges from the labor force statistics; it will then examine thecharacteristics of specific unemployed groups according to their coping strategies ofrelying on family networks, temporary occupations such as petty trade. And finally, thesection will look at those unemployed who are without any earnings opportunities.
29. As measured by the Household and labor force surveys unemployment is mostlyurban. The unemployed live in rural areas, too, but they appear to have little support andare particularly destitute when they are either landless or incapable of working their land.
30. In urban areas, those hardest hit by unemployment are younger workers and newentrants. In analyzing unemployment by age, Armenia has difficulty integrating youngergenerations into the economy: 27 percent of unemployed are new entrants to the jobmarket. The problem of unemployed youth is particularly acute in urban areas wherebetween the ages of 17 and 25 unemployment reaches 60 percent. In Guymri andVanadzor, the largest cities after Yerevan, it's as high as 70 percent. The breakdownaccording to educational groups is marked, mostly affecting those who graduate fromsecondary school.
31. One commonly held view was that unemployment was characterized by adisproportionate high female unemployment rate. While this is true for those whoregister at employment offices, the labor force and Household surveys suggest thatfemale and male unemployment rates are roughly equal.
32. Classifying the unemployed by the sector of origin does not show any particularsector-specific risks; unemployment equally affects all sectors of the labor force, with thepossible exception of agriculture. About 40 percent of the unemployed have been laid offin redundancies, and 10 percent have quit their jobs, statistics that are in line with the

ANNEX 3Page 10 of 16
overall shift away from manufacturing and public service jobs. This suggests that mostlaid-off workers haven't dropped out of the labor force but instead moved on to othertypes of work.
33. Most of the jobless are long-term unemployed. Over half are out of work for :12months or more, and as much as 5 percent are unemployed for 5 years. Given theproblematic nature of these data on duration, this report will devote little attention tc, it,but will focus instead on specific groups among the unemployed.
34. Only 25 percent of the unemployed look for work by registering at employmentoffices. According to the LFS, the avenue more often relied upon -- 53 percent of thetime -- is through family member, relatives and acquaintances. This is in striking contrastwith many other transition economies where personal contacts are relied on much lessfrequently and suggests a great deal of insider power in Armenian firms.
35. As previously mentioned, the unemployed who constitute unpaid labor in familyenterprises and petty trade make up a substantial part of the total unemployment pool.The Household survey data indicates that, according to the formal definition, slightly lessthan half the unemployed may be involved in such activities. It is interesting to note thatno apparent differences in individual characteristics in terms of age, education, gender orfamily type exist between the "working" unemployed and the rest.
36. Over a half of Armenia's unemployed live in extended households. This share isparticularly high for unemployed young adults and pre-retirement age groups, 80 percentof who are dependents in large families. One-third of the unemployed receive privatetransfers, but only 3 percent are supported by a family member working abroad. Amongall the unemployed, 24 percent live in households with no apparent source of income, thatis, no members are employed, no land is worked, no transfers are received from state orother households, and no one is working abroad. Such groups are termed the "excluded"unemployed.
37. They possess a distinct demographic profile: 50 percent are couples with childrenor single parents, and the majority are of prime working age, between 35 and 50 yearsold; and 60 percent are males. Not surprisingly, 75 percent of this group is poor, andl 25percent are extremely poor. They are predominantly urban; only 12 percent live in mralareas, but all of the "excluded" rural unemployed are poor. Most strikingly, 24 percent ofthis group has a higher education, a share significantly greater than for all unemployed(18 percent), and 47 percent posses a general secondary education. As much as 60percent of them were unemployed for 12 months or more. And of this percentage only30 percent were registered at an employment office, making most of them "invisible" tothe official statistics.
38. But even within this group inequities exist. For example, relatively few of theunemployed, about one-third, reported income from selling valuables primarily becausetheir income from such property was below the poverty threshold. This sub-group ofcasual workers has a somewhat lower incidence of poverty and is almost exclusivelyurban.
ANNEX 3Page 11 of 16
39. Regardless of the different viewpoints on unemployment or underemployment inArmenia, it is plain that, for various reasons, a considerable percentage of theunemployed fail in their attempts to find any source of income. And those who succeedmanage to do so mainly through activities that reflect the precarious state of employmentin the country.
Structure of employment
40. The structure of Arnenian employment that emerges from this analysis ischaracterized by a clear dichotomy. Out of the total estimated employment of 1,750thousand there are about 800 thousand marginal workers, or those who work as unpaidfamily labor, in casual occupations, or in petty trade plus those temporarily laid off fromtheir enterprises who are on administrative leave. Most of these people have random,irregular and unstable occupations and part of their employment is also statisticallyinvisible, but not all marginal workers are in informal sector.
41. The remaining "core" group of about 950 thousand employed enjoy greater jobsecurity, but not necessarily in the formal sector or in full-time work. Between 25 and 50percent8 of those who have their own businesses had not registered it at the time of thesurvey. On the other hand, the LFS revealed that during the week of the survey, about 9percent of those employed. (according to ILO definition) had one-time or seasonal jobsand between 2 and 15 percent of regular employees at formal sector firms are workingpart-time.9
42. Additionally, some employees in the private sector hold multiple jobs or workovertime. The extent of multiple job activities is not as broad as in other, more dynamictransition economies. The LFS found that about 5 percent of those employed have morethan one job.
43. Since most of the data sources do not fully capture marginal employment, it isdifficult to find consistent data on labor allocation according to sector. Therefore, thissection will combine official and survey data to pin down the main trends.
44. When the ownership structure is taken into consideration, the private sector seemsto overtake what is traditionally the largest employer in the country, the State sector (seeTable 4). But in attempting to break down total employment by ownership types, theresult turns out to be not as encouraging as the aggregate picture may suggest. Armenia'sbiggest expanding employment sector is self-employment, mostly agricultural, whichaccounts for about 50 percent of total employment. The government still directlyemploys about 16 percent of the total workforce, mainly in health, education and publicadministration, while de nuovo private firms are far behind with 6 percent of totalemployment. Table 4 does not include large parts of the marginally employed, namelythose in petty trade, because including this group would definitely inflate the privatesector share.
8 Depending on whether one uses LFS (the former figure) or Household Budget survey (the latter).

ANNEX 3Page 12 of 16
Table 4. Employment by ownership type in 1994 and 1996:official and survey estimates (percentage)
Sector Official, 1994 Household Survey,1996
Total employment 100 100State and under privatization 53 43Private 47 57
of which:- private firms employees and 4 6
employers- self-employed outside agriculture 12 11- private agricultural workers 31 39
Note: According to official methodology all inactive or unernployed members of rural land-holding household of working ag, are counted asself-employed in agriculture. The same adjustment has been applied to survey-generated estimates.Source: SDS household survey, SDS official report, and 1997.
45. Labor was reallocated primarily when informal, individual, low-productivitybusinesses and family enterprises absorbed released workers and not through moreformal growth areas such as new private investment firms. In the absence of sizableformal private sector growth in the country, the government seems to play the role ofemployer of last resort for urban dwellers unwilling to become individual entrepreneursin marginal trading activities.
46. During transition a substantial reallocation of employment between governmentbranches took place. Interestingly, survey-generated numbers and official reports eachprovide similar estimates of the sectoral allocation of labor, with the exception ofindustry, which as noted earlier, effectively employs fewer workers than are kept on thelists. The appropriate corrections for industry and construction would reduce their shiareto 10-15 percent, more typical for a low-income, post-socialist country. As official datasuggests, employment in agriculture has almost doubled, followed by a much modest risein the services sector (see Table 5). It is typical and reflects strongly on the quality ofsuch job creation that 60 percent of all agricultural output in Armenia is consumed byrural households which produce it.9 Nearly all the net losses in employment wereconcentrated in industry. Most FSU countries are undergoing a similar process in whichthe growing percentage of total employment figures devoted to subsistence agriculture isoften a last resort income activity for rural and semi-urban population groups.
9 Two percent belongs to enterprise survey results; 15 percent is from the UNDP survey of health and education.

ANNEX 3Page 13 ofl6
Table 5. Structure of employrnent over tlie transitioin: official estimatesEmployment by sector (thousands)
Sector 1991 1995 1996 Netchange
Agriculture and forestry 389 552 536 +147Industry and construction 635 379 374 -261Transport, trade, communications 218 167 166 -52etcOther services (private and public) 429 379 363 -65Total employment 1,671 1,476 1,439 -232
Source: SDS reports. Note: 1996 -- estimate
47. The structure of employment that emerges from the surveys is typical for atransition economy. At 40 percent the share taken up in agriculture seems a bit highwhen Armenia is compared, for example, to neighboring Georgia where fertile landemploys 42 percent. Additionally, the services sector remains underdeveloped and the itsshare of employment, in contrast to more dynamic transition economies, has notincreased. The inclusion of marginal employment in trading activities would, of course,considerably inflate the share of this sector in total employment figures, but greatdynamism in Armenia's labor market is not readily apparent outside the informalmarginal occupations.
Labor Migration
48. The SDS Household Budget survey estimated that about 110 thousand familymembers were temporarily absent. In 85 percent of the cases, they people of primeworking-age, and 75 percent were men. Since 5 percent of the original place-of-residence addresses were replaced because the inhabitants were out of the country duringthe month of the survey, the tctal share of the registered population that was outside thecountry at the end of 1996 was about 9.5 percent. According to Dudwick, the majority ofable-bodied males are involved in labor migration (1995).49. As the qualitative assessment and results of the November 1995 SDS survey onexternal migration suggest, most of it is work-related. It is primarily directed to otherCIS countries, mainly Russia, and attracts skilled labor and professional occupations (seeDudwick 1995). A worker with comparable skills could earn a much higher salaryabroad than in Armenia.
50. Consequently, outside eaming opportunities and remittances are an importantsource of income; the survey revealed that 13.2 percent of current income comes fromremittances. In fact, remittances dominate domestic earning opportunities compared towages, which constitute only 13.1 percent of current income. This means that in terms ofwage earnings from employment the external labor market is at least as important as theinternal one.

ANDiEX 3Page 14 of 16
Wages and Self-employment Incomes
51. The two main reasons that 10 percent of Armenia's workforce is employed abroadare slack labor creation and low wages. Table 6 below, based on the Household survey,gives a very bleak picture. The average wage reported in the survey is actually slightlyhigher than the official average wage (9,500 drams) based on wage bill data, since thisfigures includes all bonuses, in-kind payments, etc. Not only are wages very low, butthey are also paid irregularly even to employees who are actually at work. The numberof workers in relatively well-paid occupations is extremely low; even private firm salariesare barely sufficient to support a family with one dependent without slipping intopoverty.
Table 6. Monthly wages reported by employees in Household survey
Sector Average Average Percent of Structure ofmonthly monthly workers wage
wage, drams wage, US subject to employmentdollars wage arrears (percent)
SOE and privatizing 9,520 22 4 64firmsPrivate firms 20,888 48 5 12Government 9,028 21 9 18Joint ventures 17,359 40 0 1Foreign firms 58,987 136 0 0Other 12,212 28 8 2,Total 11,143 26 9 1Source: SDS household survey
52. Despite such obvious wage compression, a broad range of salaries exists betweenemployees. First, the private sector normally pays a substantial premium (a factor of 1:2compared to State or privatized enterprises) when allowances are made for workers'different occupational branches and educational backgrounds. A clear, observable gendergap means that for the same sector and education level, females are paid about 40 percentless than their male counterparts. Age also effects wage levels; for the same branch andeducation, each year brings a wage increase of about 40 drams. This is especially true inthe State sector. Within the same sector, university graduates typically earn a premium of20 percent. These earnings profiles are nearly identical to Russia, and every othertransition economy in the region, except that Armenia's base wage is much lower.
53. Self-employment income is typically higher than that derived from wages (about30,000 drams), but is much less regular. In the Household survey, about half the selfemployed reported zero income in the month of the survey. When this irregular incomeflow is taken into account, it turns out that the self-employed usually earn the equivalentof the average jobholder in a month. The size of self-employment income, however,varies little between different sectors. Interestingly, when the self-employed werereporting that their businesses were not registered both their incomes and their

ANNEX 3Page 15 of 16
consumption were somewhat lower on average when compared to the formal sector. Theincome of those who are only marginally employed is usually far below the wage leveland even less regular than the income of those who are self-employed.
54. Such low wages in combination with educated and abundant labor are a potentiallyadvantageous source if other elements are in place. But the overall economicenvironment has so far not been conductive to private sector development or significantinvestment in Armenia; consequently such potential has yet to translate into the rapideconomic growth and government resources are too limited to remedy to the situation.
Government Labor Market Policies
55. The State employment service, established at the onset of transition like many FSUcountries, collects unemployment registration data. Figure 2 shows a rapid increase inthe number of registered job seekers between 1992-1997 with a dip in 1994 due primarilyto the denial of unemployment status to people who failed to re-register as unemployed.It has, however, rapidly climbed back to its initial trajectory and shows no tendency totail off despite slack job creation in the country. The graph also doesn't show the typicalseasonal pattern observed in Russia, for example, because the register recorded almost nooutflow; in 1996 only 4,000 unemployed were placed in jobs by employment offices.Therefore, unemployment has all the features of stagnant pool, slowly accumulating overtime.
56. The registered unemployment rate is higher in Armenia than in any other FSUcountries. On top of this, the country also has the lowest vacancy rate with over 300 jobseekers for each single registered vacancy. This is a reflection of the country's poorrecord ofjob creation, domination by insider power, and informal labor hiringarrangements, factors that exist even in the larger enterprises of the formal sector. Sinceincentives to register with the employment services are low and eligibility rules aresimilar to FSU guidelines, Armenia's high unemployment cannot be blamed on overlyattractive benefits that are more appealing than employment opportunities. At the time ofthe survey, the average unemployment benefit was 2,000 drains, a mere fraction abovethe poverty line, and benefits were of limited duration. No more than one-third of theregistered unemployed receive benefits, but even this sum can be essential for householdswithout any cash income. However, only half of recipients get the benefits on timewithout arrears.
57. This obvious dearth of funding for employment policies means resources for activelabor market policies, training or public works are likewise depleted. The function ofemployment offices is effectively reduced to a mere provider of unemployment-linkedsocial assistance, but chronically under-funded offices are unable even to carry out thisfunction efficiently. Whereas many of the truly unemployed aren't registered atemployment offices, a substantial number of the registered unemployed actually work.Referring back to the comparison in Table 1 of registration numbers with survey-basedestimates reflecting the actual labor market status of individuals, it appears that aboutone-third of the registered unemployed are in fact employed somewhere in the economy.And applying the definition of employment in the LFS or Household survey, they likelymake up the "core" employment group. Even among those still classified as unemployed
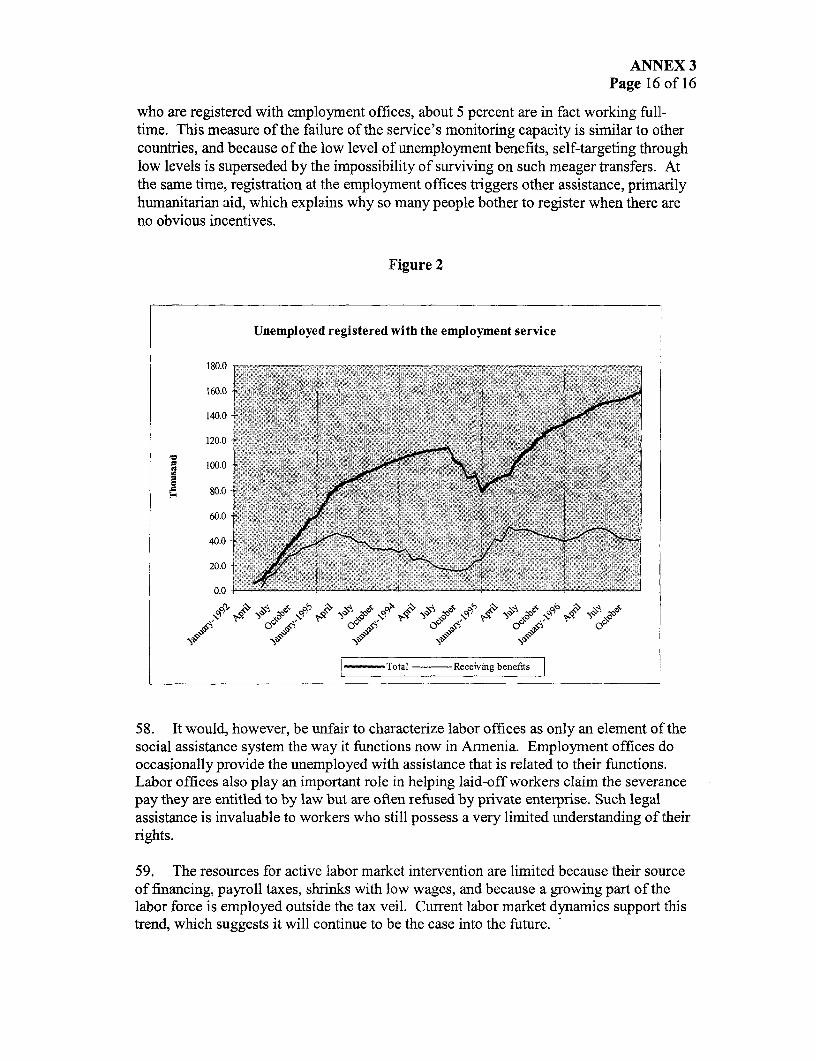
ANNiEX 3Page 16 of 16
who are registered with employment offices, about 5 percent are in fact working full-time. This measure of the failure of the service's monitoring capacity is similar to othercountries, and because of the low level of unemployment benefits, self-targeting throughlow levels is superseded by the impossibility of surviving on such meager transfers. Atthe same time, registration at the employment offices triggers other assistance, primarilyhumanitarian aid, which explains why so many people bother to register when there areno obvious incentives.
Figure 2
Unemployed registered with the employment service
180.0
1600
140.0 -
120.0
100.0
A 80.0
60.0
40.0
20.0-
0.0 ~ ~ ~ ~ ~ ~ ~ ~ 0
-- Total Receiving benefits
58. It would, however, be unfair to characterize labor offices as only an element of thesocial assistance system the way it functions now in Armenia. Employment offices clooccasionally provide the unemployed with assistance that is related to their functions.Labor offices also play an important role in helping laid-off workers claim the severancepay they are entitled to by law but are often refused by private enterprise. Such legalassistance is invaluable to workers who still possess a very limited understanding of theirrights.
59. The resources for active labor market intervention are limited because their sourceof financing, payroll taxes, shrinks with low wages, and because a growing part of thelabor force is employed outside the tax veil. Current labor market dynamics support thistrend, which suggests it will continue to be the case into the future. -

ANNEX 4
Fiscal Sustainability of Family Benefit
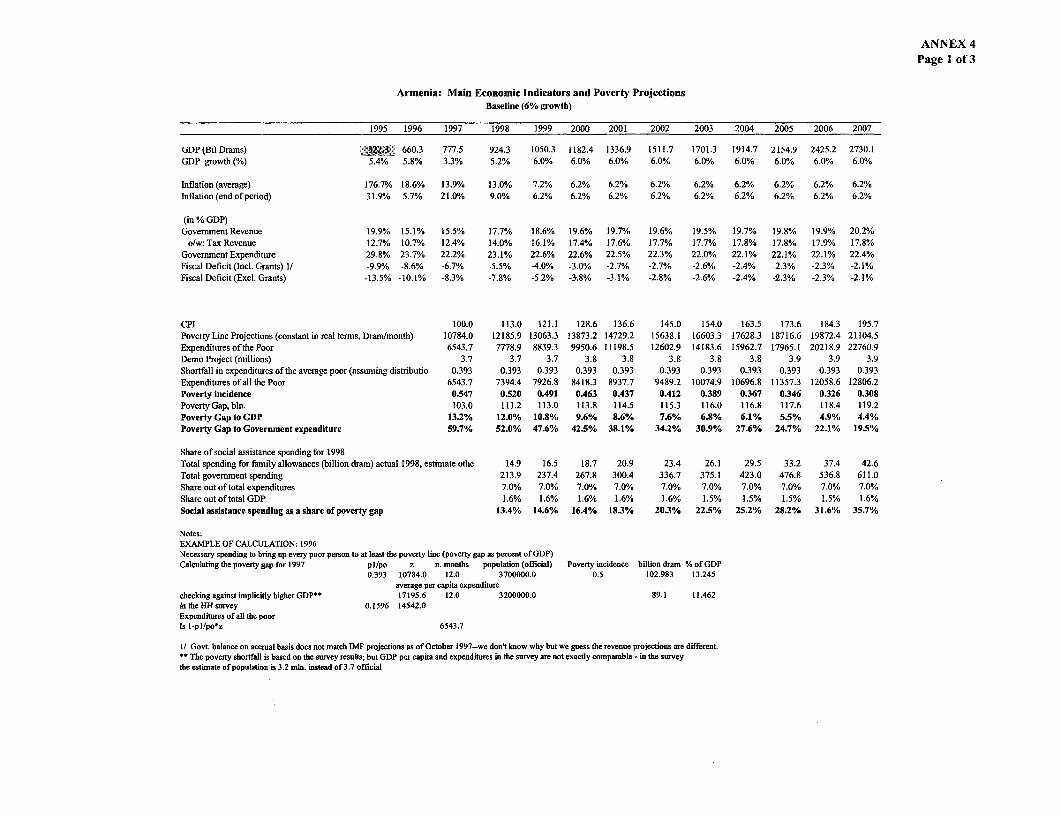
ANNEX 4Page 1 of3
Armenia: Main Economic Indicators and Poverty ProjectionsBaseline (6% growth)
1995 1996 1997 1998 1999 2000 2001 2002 2003 2004 2005 2006 2007
(IDP (Bil Drams) .522.3. 660.3 777.5 924.3 1050.3 1182.4 1336.9 1511.7 1701.3 1914.7 2154.9 2425.2 2730.1GDP growth(%) 5.4% 5.8% 3.3% 5.2% 6.0% 6.0% 6.0% 6.0% 6.0% 6.0% 6.0% 6.0% 6.0%
Inflation (average) 176.7% 18.6% 13.9% 13.0% 7.2% 6.2% 6.2% 6.2% 6.2% 6.2% 6.2% 6.2% 6.2%Inflation (end of period) 31.9% 5.7% 21.0% 9.0% 6.2% 6.2% 6.2% 6.2% 6.2% 6.2% 6.2% 6.2% 6.2%
(in % GDP)Government Revenue 19.9% 15.1% 15.5% 17.7% 18.6% 19.6% 19.7% 19.6% 19.5% 19.7% 19.8% 19.9% 20.2%
o/w: Tax Revenue 12.7% 10.7% 12.4% 14.0% 16.1% 17.4% 17.6% 17.7% 17.7% 17.8% 17.8% 17.9% 17.8%Government Expenditure 29.8% 23.7% 22.2% 23.1% 22.6% 22.6% 22.5% 22.3% 22.0% 22.1% 22.1% 22.1% 22.4%Fiscal Deficit (Incl. Grants) 1/ -9.9% -8.6% -6.7% -5.5% -4.0% -3.0% -2.7% -2.7% -2.6% -2.4% -2.3% -2.3% -2.1%Fiscal Deficit (Excl. Grants) -13.5% -10.1% -8.3% -7.8% -5.2% -38% -3.1% -2.8% -2.6% -2.4% -2.3% -2.3% -2.1%
CPI 100.0 113.0 121.1 128.6 136.6 145.0 154.0 163.5 173.6 184.3 195.7PovertyLine Projections (constantinreal terms, Dram/month) 10784.0 12185.9 13063.3 13873.2 14729.2 15638.1 16603.3 17628.3 18716.6 19872.4 21104.5Expenditures of the Poor 6543.7 7778.9 8839.3 9950.6 11198.5 12602.9 14183.6 15962.7 17965.1 20218.9 22760.9Demo Project (millions) 3.7 3.7 3.7 3.8 3.8 3.8 3.8 3.8 3.9 3.9 3.9Shortfall in expenditures of the average poor (assuming distributio 0.393 0.393 0.393 0.393 0.393 0.393 0.393 0.393 0.393 0.393 0.393Expenditures of all the Poor 6543.7 7394.4 7926.8 8418.3 8937.7 9489.2 10074.9 10696.8 11357.3 12058.6 12806.2Poverty incidence 0.547 0.520 0.491 0.463 0.437 0.412 0.389 0.367 0.346 0.326 0.308Poverty Gap, bIn. 103.0 111.2 113.0 113.8 114.5 115.3 116.0 116.8 117.6 118.4 119.2Poverty Gap to GDP 13.2% 12.0% 10.8% 9.6% 8.6% 7.6% 6.8% 6.1% 5.5% 4.9% 4.4%Poverty Gap to Government expenditure 59.7% 52.0% 47.6% 42.5% 38.1% 34.2% 30.9% 27.6% 24.7% 22.1% 19.5%
Share of social assistance spending for 1998Total spending for family allowances (billion dram) actual 1998, estimate othe 14.9 16.5 18.7 20.9 23.4 26.1 29.5 33.2 37.4 42.6Total government spending 213.9 237.4 267.8 300.4 336.7 375.1 423.0 476.8 536.8 611.0Share out of total expenditures 7.0% 7.0% 7.0% 7.0% 7.0% 7.0% 7.0% 7.0% 7.0% 7.0%Share out of total GDP 1.6% 1.6% 1.6% 1.6% 1.6% 1.5% 1.5% 1.5% 1.5% 1.6%Social assistance spending as a share of poverty gap 13.4% 14.6% 16.4% 18.3% 20.3% 22.5% 25.2% 28.2% 31.6% 35.7%
Notes:EXAMPLE OF CALCULATION: 1996Necessary spending to bring up every poor person to at least the poverty tine (poverty gap as percent of GDP)Calculating the poverty gap for 1997 pl/po z n. months population (official) Poverty incidence billion dram % of GDP
0.393 10784.0 12.0 3700000.0 0.5 102.983 13.245average per capita expenditure
checking against implicitly higher GDP** 17195.6 12.0 3200000.0 89.1 11.462in the HH survey 0.1596 14542.0Expenditures of all the poorIs t-pl/po*z 6543.7
1/ Govt. balance on accrual basis does not match IMF projections as of October 1997--we don't know why but we guess the revenue projections are different.*1 The poverty shortfall is based on the survey results; but GDP per capita and expenditures in the survey are not exactly comparable - in the surveythe estimate of population is 3.2 min, instead of 3.7 official

ANNEX 4Page 2 of 3
Armenia: Main Economic IndicatorsScenario of Lower Growth (2%)
1995 1996 1997 1998 1999 2000 2001 2002 2003 2004 2005 2006 2007
GDP(BilDrams) ~,_ 660.3 7775 924.3 1050.3 1182.4 1336.9 1511.7 1701.3 1914.7 2154.9 2425.2 2730.1GDP growth (%) 5.4% 5.8% 3.3% 2.0% 4.0% 4.0% 4.0% 4.0% 4.0% 4.0% 4.0% 4.0% 4.0%
Inflation (average) 176.7% 18.6% 13.9% 13.0% 7.2% 6.2% 6.2% 6.2% 6.2% 6.2% 6.2% 6.2% 6.2%Inflation(endofperiod) 31.9% 5.7% 21.0% 9.0% 6.2% 6.2% 6.2% 6.2% 6.2% 6.2% 6.2% 6.2% 6.2%
(in % GDP)Government Revenue 19.9% 15.1% 15.5% 17.7% 18.6% 19.6% 19.7% 19.6% 19.5% 19.7% 19.8% 19.9% 20.2%
o1w: Tax Revenue 12.7% 10.7% 12.4% 14.0% 16.1% 17.4% 17.6% 17.7% 17.7% 17.8% 17.8% 17.9% 17.8%Government Expenditure 29.8% 23.7% 22.2% 23.1% 22.6% 22.6% 22.5% 22.3% 22.0% 22.1% 22.1% 22.1% 22.4%Fiscal Deficit (Inel. Grants) 1/ -9.9% -8.6% -6.7% -5.5% -4.0% -3.0% -2.7% -2.7% -2.6% -2.4% -2.3% -2.3% -2.1%Fiscal Deficit (Excl. Grants) -13.5% -10.1% -8.3% -7.8% -5.2% -3.8% -3.1% -2.8% -2.6% -2.4% -2.3% -2.3% -2.1%
CPI 100.0 113.0 121.1 128.6 136.6 145.0 154.0 163.5 173.6 184.3 195.7Poverty Line Projections (constant in real terms, Dram/mt 10784.0 12185.9 13063.3 13873.2 14729.2 15638.1 16603.3 17628.3 18716.6 19872.4 21104.5ExpendituresofthePoor 6543.7 7542.3 8408.8 9287.3 10254.8 11323.1 12502.8 13805.6 15244.3 16833.0 18591.7Demo Project (millions) 3.7 3.7 3.7 3.8 3.8 3.8 3.8 3.8 3.9 3.9 3.9Shortfall in expenditures of the average poor (assuming d 0.393 0.393 0.393 0.393 0.393 0.393 0.393 0.393 0.393 0.393 0.393ExpendituresofallthePoor 6543.7 7394.4 7926.8 8418.3 8937.7 9489.2 10074.9 10696.8 11357.3 12058.6 12806.2Poverty incidence 0.547 0.536 0.516 0.496 0.477 0.458 0.441 0.424 0.408 0.392 0.377Poverty Gap, bln. 103.0 114.7 118.8 121.9 125.1 128.3 131.6 135.1 138.6 142.2 145.9PovertyGaptoGGDP 13.2% 12.4% 11.3% 10.3% 9.4% 8.5% 7.7% 7.1% 6.4% 5.9% 5.3%Poverty Gap to Government expenditure 59.7% 53.6% 50.0% 45.5% 41.6% 38.1% 35.1% 31.9% 29.1% 26.5% 23.9%
Share of social assistance spending for 1998Total spending for family allowances (billion dram) actual 1998, estimate 14.9 16.5 18.7 20.9 23.4 26.1 29.5 33.2 37.4 42.6Total government spending 213.9 237.4 267.8 300.4 336.7 375.1 423.0 476.8 536.8 611.0Share out of total expenditures 7.0% 7.0% 7.0% 7.0% 7.0% 7.0% 7.0% 7.0% 7.0% 7.0%Share out oftotal GDP 1.6% 1.6% 1.6% 1.6% 1.6% 1.5% 1.5% 1.5% 1.5% 1.6%Social assistance spending as a share of poverty gap 13.0% 13.9% 15.3% 16.7% 18.3% 19.8% 21.8% 24.0% 26.3% 29.2%
Notes:EXAMPLE OF CALCULATION: 1996Necessary spending to bring up every pooT person to at least the poverty line (poverty gap as percent of GDP)Calculating the poverty gap for 1997 pl/po z n. montbs population (official) Povcrty incidence billion dram % of GDP
0,393 10784.0 12.0 3700000.0 0.5 102.983 13.245average per capita expenditure
checking against implicitly higher GDP*' 17195.6 12.0 3200000.0 89.1 11.462in the HH survey 0.1596 14542.0Expenditures of all the poorIs l-pl/po*z 6543.7
1/ Govt. balance on accrual basis does not match IMF projections as of October 1997--we don't know why but we gLuess the revenue projections are different.** The poverty shortfall is based on the survey results; but GDP per capita and expenditures in the survey are not exactly comparable - in the surveythe estimate of population is 3.2 miln. instead of 3.7 official

ANNEX 4Page 3 of 3
Armenia: Main Economic IndicatorsScenario of Rapid Growth (3%)
1995 1996 1997 1998 1999 2000 2001 2002 2003 2004 2005 2006 2007
GDP (Bil Drams) S2Zl 660.3 777.5 924.3 1050.3 1182.4 1336.9 1511.7 1701.3 1914.7 2154.9 2425.2 2730.1GDP growth(%) 5.4% 5.8% 3.3% 2.0% 9.0% 9.0% 9.0% 9.0% 9.0% 9.0% 9-0% 9.0% 9.0%
Inflation (average) 176.7% 18.6% 13.9% 13.0% 7.2% 6.2% 6.2% 6.2% 6.2% 6.2% 6.2% 6.2% 6.2%Inflation (end of period) 31.9% 5.7% 21.0% 9.0% 6.2% 6.2% 6.2% 6.2% 6.2% 6.2% 6.2% 6.2% 6.2%
(in % GDP)Government Revenue 19.9% 15.1% 15.5% 17.7% 18.6% 19.6% 19.7% 19.6% 19.5% 19.7% 19.8% 19.9% 20.2%
o/w:TaxRevenue 12.7% 10.7% 12.4% 14.0% 16.1% 17.4% 17.6% 17.7% 17.7% 17.8% 17.8% 17.9% 17.8%Government Expenditure 29.8% 23.7% 22.2% 23.1% 22.6%/. 22.6% 22.5% 22.3% 22.0% 22.1% 22.1% 22.1% 22.4%Fiscal Deficit (Incl. Grants) 1/ -9.9% -8.6% -6.7% -5.5% -4.0% -3.0% -2.7% -2.7% -2.6% -2.4% -2.3% -2.3% -2.1%Fiscal Deficit (Excl. Grants) -13.5% -10.1% -8.3% -7.8% -5.2% -3.8% -3.1% -2.8% -2.6% -2.4% -2.3% -2.3% -2.1%
CPI 100.0 113.0 121.1 128.6 136.6 145.0 154.0 163.5 173.6 184.3 195.7
Poverty Line Projections (constant in real terms, Dram/mt 10784.0 12185.9 13063.3 13873.2 14729.2 15638.1 16603.3 17628.3 18716.6 19872.4 21104.5Expenditures ofthe Poor 6543.7 7542.3 8813.0 10201.8 11806.1 13662.7 15811.5 18298.4 21176.7 24508.0 28370.0
Demo Project (millions) 3.7 3.7 3.7 3.8 3.8 3.8 3.8 3.8 3.9 3.9 3.9
Shortfall in expenditures of the average poor (assuming d 0.393 0.393 0.393 0.393 0.393 0.393 0.393 0.393 0.393 0.393 0.393Expenditures of all the Poor 6543.7 7394.4 7926.8 8418.3 8937.7 9489.2 10074.9 10696.8 11357.3 12058.6 12806.2
Poverty Incidence 0.547 0.536 0.492 0.451 0.414 0.380 0.349 0.320 0.293 0.269 0.247Poverty Gap, bin. 103.0 114.7 113.3 111.0 108.6 106.3 104.1 101.9 99.8 97.7 95.6
Poverty Gap to GDP 13.2% 12.4% 10.8% 9.4% 8.1% 7.0% 6.1% 5.3% 4.6% 4.0% 3.5%Poverty Gap to Government expenditure 59.7% 53.6% 47.7% 41.4% 36.2% 31.6% 27.8% 24.1% 20.9% 18.2% 15.7%
Share of social assistance spending for 1998Total spending for family allowances (billion dram) actual 1998, estimate 14.9 16.5 18.7 20.9 23.4 26.1 29.5 33.2 37.4 42.6Total government spending 213.9 237.4 267.8 300.4 336.7 375.1 423.0 476.8 536.8 611.0
Share out of total expenditures 7.0% 7.0% 7.0% 7.0% 7.0% 7.0% 7.0% 7.0% 7.0% 7.0%
Share out of total GDP 1.6% 1.6% 1.6% 1.6% 1.6% 1.5% 1.5% 1.5% 1.5% 1.6%
Social assistance spending as a share of poverty gap 13.0% 14.6% 16.8% 19.3% 22.1% 25.1% 28.9% 33.3% 38.3% 44.5%
Notes:EXAMPLE OF CALCULATION: 1996Necessary spending to bring up every poor person to at least the poverty line (poverty gap as percent of GDP)Calculating the poverty gap for 1997 pl/po z n. months population (official) Poverty incidence billion dram % of GDP
0.393 10784.0 12.0 3700000.0 0.5 102.983 13.245average per capita expenditure
checking against implicitly higher GDP** 17195.6 12.0 3200000.0 89.1 11.462in the HH survey 0.1596 14542.0Expenditures of al the poorIs l-pl/po*z 6543.7
I/ Govt balance on accrnal basis does not natch IMF projections as of October 1997-we don't know why but we guess the revenue projections are different** The poverty shortfall is based on the survey results; but GDP per capita and expenditures in the survey are not exactly comparable - in the survey theestimate of population is 3.2 min. instead of 3.7 official

ANNEX 5Page 1 of 8
THE POOREST OF THE POOR IN ARMENIA
Executive Summary
1. In December 1997, The World Bank undertook a qualitative study of the poorest of thepoor in the Republic of Armenia (RoA) to provide data to complement the Armenian StateDepartment of Statistics' Household Budget Survey (SDS survey hereafter) describing extremepoverty in Armenia. The study's immediate objectives were to understand, improve targeting of,and protection for of the poorest. Another goal was to provide information at a crucial time inthe design of policies and programs in the RoA. Fieldwork for the qualitative Social Assessmentof the Poorest of the Poor in Armenia consisted of in-depth interviews with 1 10 households thatwere identified through qualitative indicators as the poorest households in each of 18 sitesthroughout Armenia. Additional interviews were conducted with local officials, NGOs, andother key sources. Where relevant, the findings are juxtaposed to those of the SDS survey.
2. Poverty in Armenia is both deep and widespread. The SA focus on the poorest of thepoor described characteristics, living conditions and coping mechanisms and made briefrecommendations. In the early 1990s, the country's economy suffered a multitude ofcompounding blows: the aftermath of the 1988 earthquake, the demise of the Soviet trade systemand All-Union subsidies, and an economic blockade upheld by its neighbors who sided withAzerbaijan in the war over Nagorno Karabakh. Macroeconomic stabilization, achieved in themid- 1990s, accompanied by macroeconomic growth of 3-6 percent per year has improved thesituation. However, this growth has been notably unequal and today over half of Armenia'spopulation (54.7 percent) remains below the poverty line with another quarter (27 percent) belowthe food line.
What Does Poverty Look Like in Armenia?
3. In this context, it is not surprising that the poorest of the poor are unable to meet theirmost basic human needs: food, warmth, education and health. According to the qualitative study,while there was no widespread malnutrition, the poorest of the poor are unable to meet theirbasic food needs. The main findings included:
- the most affected are urban, though hungry rural households also exist;- children were most affected by the food shortage in terms of their health and education;- poor households reduce consumption by rationing food;- seasonal hunger or fear of hunger is most common in the late winter and early spring;- households are limited to a monotonous diet with poor quality produce; and- rural households are often limited to what they or their relatives can grow themselves,
which can in turn be limited in terms of the diversity of produce and its quantity. Manyhouseholds were therefore reduced to eating under a handful of food items, namelypotatoes, bread, oil and a few collected greens. These findings were confirmed byquantitative nutrition and other studies conducted in Armenia.
4. Poor households dramatically limited their use of electricity for lighting and heatingpurposes. With severely limited regular income, electrical expenses represented an importantshare of expenses, usurping the income available to meet other needs, such as food. Indeed, inurban areas, respondents had experienced having their electricity cut off and generally haddifficulty meeting their light and heating needs because of the lack of alternative energy sources.In rural areas, households used electricity only for lighting, reported lower usage levels, and had

ANNEX 5Page 2 of 8
an easier time meeting their needs. Other households had never been able to afford an elect.iccounter nor had their electricity indefinitely cut off due to non-payment. Many householdsseemed unaware of the stepped pricing system introduced for electricity.
5. Shelter type was not considered a good indicator of poverty. Instead, the home's generalstate of repair (peeling paint and lack of upkeep) was a better indicator. Indeed, not only did thepoorest households forego maintenance and repairs on their own property, they often scavengedconstruction materials to meet daily needs, such as burning floor planks and doorframes for heat,selling roofing materials to pay off debts, and tearing down walls brick by brick to sell in order tobuy food.
6. Education is still regarded as a priority for the poor. Attendance and enrollments arehigh, however there is a problem with regards to the quality of schooling available. Privatelessons, textbooks, supplies and appropriate clothing are heavy burdens on the budgets of thepoorest. Children and parents also felt that teachers discriminate against the poor in theclassroom.
7. Access to health is limited by the high cost of medical care. The poor are unable toafford treatment, even though the government has financed a package system of free healthservices for them. And poverty itself - poor nutrition, insufficient heat, lack of adequate shoesand clothing, and lower access to health care - promotes chronic poor health, making health carefor the indigent a vicious cycle.
8. Households reported spending some of their income on cigarettes. These expensesrepresented a substantial part of the budget even among households that were far from meetingtheir basic food needs. Cigarette purchases caused much tension between spouses who disagreedover the best use for the money. However, they didn't discuss the health implications of smoking- either in the form of health care expenditures or foregone income from illness. Some incomewas received in-kind as alcohol and consumed rather than sold or bartered for food.
Why are the Poorest Unable to Cope?
9. The coping mechanisms of the poorest of the poor are, as might be expected, limited andinsufficient to lift the households out of extreme poverty. The most striking commonality amongthe poorest is that they share an inability to benefit from the most widespread income-generatingactivities available in the country, either from trade, land or remittances. In response to thisexclusion, the poorest reduce consumption (as cited above), and if possible, increase theirdependence on formal and informnal support systems, deepen their indebtedness, and sell offassets and personal belongings to survive.
10. Labor market. At the level of the household, the lack of well-remunerated localemployment opportunities is viewed as the main cause of poverty. This perception is based ontwo main points. First, unemployment is high in Arnenia. The SDS survey estimatedunemployment at 28.3 percent of the total labor force and 45.8 percent for youths between 17and 25 years old. Second, obstacles to obtaining employment include the necessity of personalties who will extend an "invitation to work," and the need for cash to use as bribes to secure aposition. Similarly, in the informal and private sectors and in work abroad, employment andincome-generating activities require start-up capital to facilitate bribes for employment and ties.In addition, cultural and psychological factors also act as self-imposed barriers to adopting the

ANNEX 5Page 3 of 8
new capitalist economic order. The pervasive post-Soviet mentality still views free trade asdistasteful and values employment in now poorly remunerated but still prestigious governmentinstitutions and agencies. Employment choices are also commonly determined by what is deemedappropriate based on gender and age. While some people have overcome these societalconstraints, these issues remain entrenched and widespread. Even when the head of householdhas work, salary size is irregular and payment is often delayed; work is often part-time or erraticeven in formal enterprises; and wages are too low to support a family.
11. Self-employment is not a viable solution for the poorest of the poor. Income from self-employment was sporadic, involved incurring health risks, and was poorly paid (4000 drams permonth on average according to the SDS survey and the qualitative work). Self-employmentrequires good health and mobility since most opportunities open to the poorest are limited totugging, lugging and pulling. And it requires free time above and beyond other activities andresponsibilities as well as the personal connections that open invitational doors.
12. Trade is one of Armenia's primary income-generating activities. Urban households (orrural ones without quality land) who do not trade are often pointed out as poorest at thecommunity level. Some of the poorest households that had attempted to trade but failed to makea profit then became indebted or lost major assets in the process. Others were reluctant to wagertheir limited assets or their health in a risky, highly competitive venture. Other reasons foravoiding trading activities were pregnancy, childcare, health problems and the low prestige oftrading. The poorest sometimes become involved, not on an ongoing basis but to a limiteddegree, in trade by marketing sporadically to cover specific needs as they arise, such aselectricity or school supplies.
13. Finding work abroad, especially in Russia, is one of the main means of subsistence forArmenian families today. An estimated 20 percent of the population has left Armenia over thelast five years because of the worsening economic and social situation. According to our study,however, the poorest, who stand to benefit the most from working abroad, were commonly thosewhose breadwinners were least able to afford the trip to Russia or, once there, were unable toearn enough money to support their families left behind in Armenia.
WOtking abroad is not an option for all because it requires an expnsive initial investment. Thusemigration is belivd tobe concentd aogtid work *0labrad, a s
- citalfravel and initial expenses;- ties; in the ity choice residents of a same Armenian village will often tra to specific
ssncitesadrelo ong-standng supprnet of Axrenians alrey work there;-someassuranest attherewillbe wkincity X 0 000000000i; 0of choice;f- goodealth eauelaborin Russii ost y physcal; and t:0 ; V :i : 0 0 t ;
14. Debts incurred to finance the trip, the cost of a return ticket and, most importantly, debtsincurred by the family during the wage earner's absence were often cited as impediments to hisreturn to Armenia because once the wage earner rejoins the household, creditors demandrepayment. With the wage earner absent, formal and informal networks are likely to provide amodest amount of support for the family (see Informal Support Networks).

ANNEX 5Page 4 of 8
15. Land. Again, the situation in rural Armenia is different from other regions where ruralhouseholds have been farming land for generations. In Armenia, large factions of rural residentsown land, work it to subsist, but do not consider themselves farmers. They don't intend to makea profit from land cultivation, but simply to supplement their income, so their land merelyprovides an additional "social net." This perspective dictates a preference for such food staplesas potatoes and wheat that are consumed solely by the household over the cultivation of highervalue crops for profit marketing. It also explains the limited attempts to rationalize cultivation.'
16. Poverty and landholding are intimately linked in the rural economy. Landlesshouseholds were likely to be very poor since home production is the main source of income forthe majority of rural households. The landless are rural residents who did not receive landduring privatization (in some cases because none was available to the village), or returned theirland to the municipality.
17. However, landowners are also among the rural poor. According to the qualitative study,landowners experience many limitations to effectively cultivating their land, including:
- possessing only a small quantity of land;- low quality and poor productivity of the land;- decreased land productivity due to prohibitive cost of materials and inaccessibility of
essential inputs (water, fertilizers, pest control, equipment, and poor seed quality ordepleted stored seed);
- need for additional sources of income to finance land cultivation costs;- lack of male labor availability in the household; and- weather disasters such as hail, drought, flooding.
18. It is striking to note that while households are free to sell or lease their land, somehouseholds refused outright or elected to return the land allocated to them during privatization.In the qualitative survey, none of the households reported selling their land. A land sales tax maybe one impediment to liquidating land assets, but households also perceive land as a liabilitybecause ownership means foregone incomes from government transfers and employment. Localresidents are disallowed from registering as unemployed, and in one case a respondent wasturned away from a factory job by a manager who explained that he gives preference to urbanresidents who don't own land.
19. Depletion of assets. Traditionally, assets such as apartments, homes, cattle or jewelry,and personal belongings such as bed sheets, furniture, rugs or crystal, are amassed during goodtimes or brought into the household by the young bride as dowry which allows the family toweather bad times by selling off these items. In the last seven years, assets become the mainholdings since cash savings were lost to currency reforms and continue to be eroded by inflation.The absence of personal belongings and assets is a result of poverty because the poorest dependto an inordinate degree on the sale of assets to cover large, one-time costs such as bribes orhealth bills as well as daily consumption needs such as electricity, food and school supplies.Poverty also results from the depletion of assets which are provide the necessary start up capitalto embark on productive activities such as trade, sending a husband or son abroad, or keeping theexisting labor force healthy.

ANNEX 5Page 5 of 8
20. Increasing dependence. As may be expected, access to traditional networks is notgoverned by universal compassion. Informal support networks are regulated by a set of societalrules that identify the responsible helper as well as determining specific households' access tothat help. The accessibility and scale of assistance varied greatly among different households.Traditional support networks are subject to the following societal values and rules. Informalnetworks are:
- intended as a social gesture to maintain ties and don't necessarily offer assistance toalleviate poverty;
- determined by kinship ties and prioritized along patriarchal kinship lines;- conditional based on reciprocity, repayment and gratitude;- moralistic in that they distinguish between "deserving," or work-incapable, and
"undeserving," or work-capable, households;- judgmental in that some households, although work-incapable, hence presumably
"deserving" are nonetheless considered "responsible" for their situation and thus lessdeserving than others; and
- most often initiated by the outsider and not the poor, leaving many of the poor"invisible."
21. Indebtedness. Other informal systems exist which support families such as chronicindebtedness. Food and bread shops provide credit that the majority of poor households rely onbecause income is so irregular. The local electric company also delays payments that allowhouseholds to carry their debt into the next pay period. However, if creditors believe householdswill no longer be able to pay off their debt at some future date, they will refuse to continueextending credit. Many of the poorest households could no longer access this coping mechanismbecause sources of income had dried up causing creditors to withdraw credit.
22. Government assistance. Government cash transfers:- are insufficient to lift households out of poverty though they are an important source of
income for the poorest;- are unreliable because they are often paid months after they are due;- are impeded by administrative hurdles prevent acquiring appropriate status -- especially
with regard to invalidity;- don't reach all unemployed due to cultural and fiscal constraints understating real
unemployment;- fail to include all the poor and exclude the non-poor because they are aimed at assisting
vulnerable groups and not the work-capable poor, thus reflecting the same hierarchicaland moralistic values as informal networks; and
- exclude landowners, regardless of income.
23. Government social targeting systems. The main issues raised concerning the Parosregistration and formula system were:
- the Paros formula remains a black box, effectively limiting recourse for households whoare unduly excluded;
- some households have opted to not register although they may qualify for assistance,such as work-capable rural households;
- lack of outreach limits access to the most needy households, such as invalids, youngchildren and families with infants;
- the registration process uses a cumbersome documentation system and time-consumingregistration burdens households;

ANNEX 5Page 6 of 8
- data in Paros "passports" is often incorrect, increasing errors of inclusion and exclusion;and
- an overlap in government agency responsibilities led to uneven implementation ofdocumentation guidelines.
24. Local government assistance. In a less formal manner, local social protection offices andother local government offices have acted to prioritize among vulnerable households through theillicit, formal inclusion of households on humanitarian distributions and assistance lists. Thispractice demonstrates a perceived hierarchy of vulnerability on the part of the government.
25. Government institutions. Some parents use overnight schools, orphanages and schoolsfor physically and mentally retarded to receive government assistance by claiming theseinstitutions offered their child was better food, clothes and health care. But this alternativeremained highly unappealing to most poor parents -- even those living in very poor conditions(see Appendix 2: Govermnent Iinstitutions).
26. Humanitarian assistance. While humanitarian assistance has played an important role insupporting households, it remains poorly targeted and mostly benefits well-off households.
Gathering and Begging
27. Many of the poorest households collect food left over and discarded by others. It iscommon for poor rural households (especially the landless and those unable to cultivate theirland) to gather leftover wheat or potatoes from harvested fields. For urban households, the mostcommon sources are large garbage containers and trash piles found in building courtyards. Thepoorest collect bottles from trashcans for 5-10 drams per bottle, and gather scrap aluminum andmetal for 15 drams per kilogram. Households report this as a difficult, degrading activity thatrequires a great deal of searching, and feel belittled in the eyes of observers. The admit tobringing home any object that they might use or sell, such as old clothes, worn shoes, jars ofanimal fat, cigarettes, unfinished bottles of alcohol, etc. A half dozen people in Spitak andYerevan were discovered living surviving on the food and alcohol discarded in cemeteries (seecase below).
28. A few households, mainly older women and children, resorted to begging in both citiesand villages. Begging for cash was mostly limited to Yerevan, which is considered the onlypropitious place to beg. In large villages and cities, a few respondents reported going door todoor requesting bread but never begged in the streets.
Who are the Poorest Households?
29. Dynamics of poverty. The vast majority of Armenian households have experiencecl atleast a temporary spell of poverty in the last five years. In addition, considerable evidencesuggests that many households move in and out of poverty as incomes and expenses fluctuate.The main difference between the transient and chronically very poor is that the former haveretained crucial links to society and continue to have successful access to opportunities. Arnongthe transient very poor, financial cycles result from income and expenditure fluctuations such astemporary:
- decrease in income due to poor or insufficient harvest, unpaid salaries, seasonalvariations in income-generating activities, recent loss of employment, or extended family

ANNEX 5Page 7 of 8
crisis;- depletion of stored goods such as food or fuel, assets, or savings while retaining an
ability to replenish savings through work abroad, indebtedness, etc.;- unexpected increases in expenditures from illness, funeral, legal problems requiring large
bribes, etc.; and- loss of labor force, which can become permanent, such as incarcerated family member,
military son, pregnant or lactating mother, and mental or physical illness.
30. Household characteristics. The poorest households are afflicted by problems that arepsychological, physical, geographic, social and economic in nature. Thus, to improve thesituation of the poorest of the poor, poverty alleviation involves not only increased incomelevels, but includes access to other essential needs as well. This has important implications forpolicymakers whose programs must take into account not only economic poverty but otherimpoverishment, too.
Thmain eaat sts fthpoeshueodsare:
ionclusion and Recommendations
31. Within Armenian society, specific, clearly delineated groups are excluded from the verystrategies targeted to meet their basic needs because of isolation (geographic or social), lack ofmobility, dearth of assets (for sale or productive purposes, such as quality land), poor health andpsychological barriers. Currently, such strategies are supported by growth policies meant tofocus on increasing consumption, however these policies haven't translated into sufficient localinvestments and economic restructuring to promote development of local employmentopportunities. A parallel movement is afoot to reduce government subsidies to households forbasic amenities such as water and electricity, and services such as education and health. Kinshipand other traditional support networks are unable to support large factions of the pooresthouseholds, and consequently a growing segment of the poorest ones have lost all hope forimprovement in their situation. Having exhausted their resources, they live day to day, hungry,cold, anxious and hopeless.
32. While poverty has already spread to a large percentage of the urban population, it hassimply been postponed for the rural population. Rural poverty can be expected to worsen, albeitat a slower pace since productive assets can be more easily depleted and replenished in a ruralsetting. But cycles of poverty in rural areas will be deeper than in urban areas, and keyinformants at some rural sites identified a trend, by which the middle classes had vacated villagesand outlying areas, leaving behind only the wealthy and the poorest. The isolation of villageswill take a long-term toll on the rural poor as they lose human capital to diminished educationand health care quality.

ANNEX 5Page 8 of 8
33. The brunt of these circumstances is borne by the children who are coming of agefollowing the transition. This generation was born into poverty and is growing up malnourished,poorly educated, and without access to quality education or medical care -- a strikingly differentsituation from their parents' generation who may also have been poor but had guaranteed accessto basic food products and health and educational services. The long-term effects of grapplingwith this new type of poverty will be felt for many years to come.
Recommendations
The top priorities for the country's poorest households are to:- Promote development of well-remunerated local labor opportunities such as micro-enterprisesthrough micro-credits for trade and services.- Support restructuring of local industry, services and other sectors to promote local employment.Privatization of existing structures has proved insufficient to generating sustainable growth.. Thelocal investment climate must be improved to attract local and foreign investments forproduction.- Review obstacles to selling and renting land -- such as high cadaster valuations, land sale taxes!lack of land ownership certificates -- which may be impeding land redistribution. Review iissuesrelated to the poorest returning their land to the municipality without compensation. Landredistribution or compensation packages may be considered at the local level.- Do not overestimate the importance of informal support networks for the poorest which cannotreplace local labor opportunities and targeted government transfers. Compared to the poor andnon-poor, the poorest are more isolated, even in crisis situations, so improved targeting ofgovenment benefits is essential.- Develop and implement a basic package of free health services for the poorest to includecurrently unavailable services: family planning, child vaccinations, and treatment of respiratoryinfections as well as infant and child under-nutrition. Consider health coverage credit schemesfor the poor and non-poor and voucher schemes for the poorest. Develop tobacco awarenesscampaign.-Defme and enforce laws regarding employer's responsibility regarding work-related injunies.-Ihitiate an informed debate within the Ministry of Social Protection regarding poverty.- Consider outreach and other methods to better reach the poor. Consider alternatives to theParos formula to reduce institutional costs and reduce risks of inclusion and exclusion.- Review the process of obtaining invalidity status. Prioritize these households for cash transfersbased on the results of the SDS survey and outreach.- Implement and enforce law that separates receiving child allowances from paying taxes.- Identify means (such as cash transfers) to offer support to families now relying on governmentinstitutions to meet child needs.
'These findings were confirmed by other sources such as the representative of CARE International whomanages a program providing technical assistance to farmers in Armenia, November 1997.
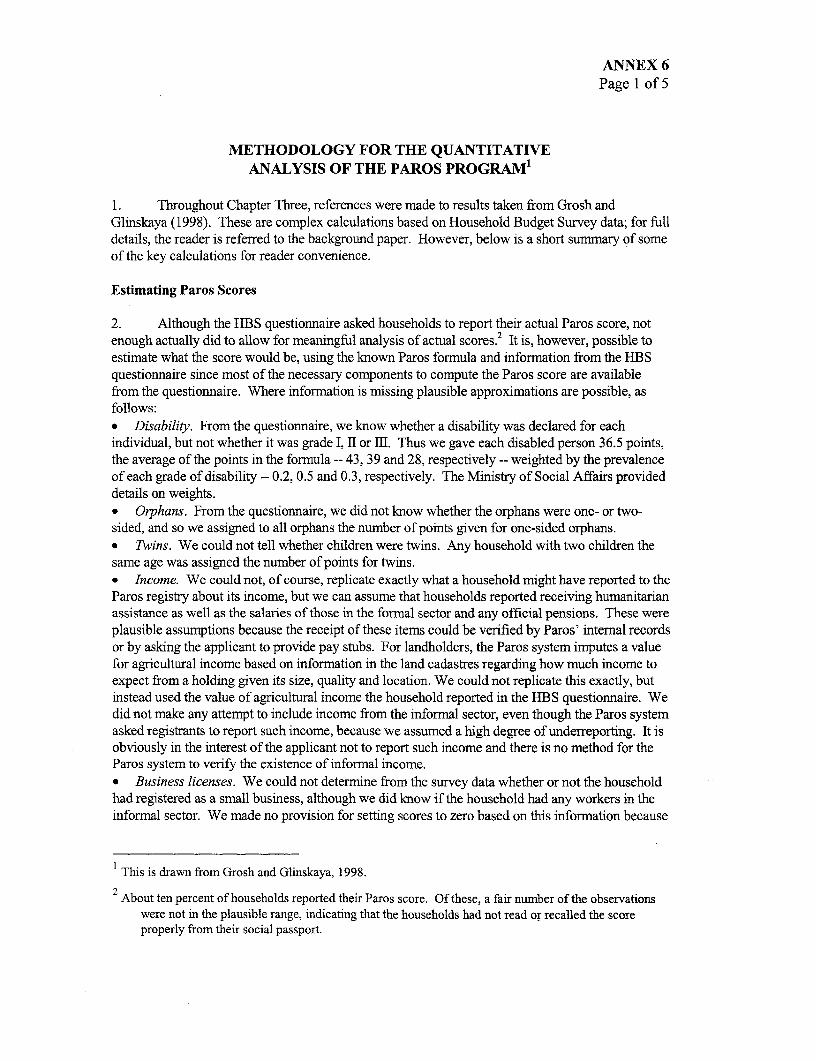
ANNEX 6Page 1 of 5
METHODOLOGY FOR THE QUANTITATIVEANALYSIS OF THE PAROS PROGRAM1
1. Throughout Chapter Three, references were made to results taken from Grosh andGlinskaya (1998). These are complex calculations based on Household Budget Survey data; for fulldetails, the reader is referred to the background paper. However, below is a short summary of someof the key calculations for reader convenience.
Estimating Paros Scores
2. Although the HBS questionnaire asked households to report their actual Paros score, notenough actually did to allow for meaningful analysis of actual scores.2 It is, however, possible toestimate what the score would be, using the known Paros formula and information from the HBSquestionnaire since most of the necessary components to compute the Paros score are availablefrom the questionnaire. Where information is missing plausible approximations are possible, asfollows:e Disability. From the questionnaire, we know whether a disability was declared for eachindividual, but not whether it was grade I, II or m. Thus we gave each disabled person 36.5 points,the average of the points in the formula -- 43, 39 and 28, respectively -- weighted by the prevalenceof each grade of disability -- 0.2, 0.5 and 0.3, respectively. The Ministry of Social Affairs provideddetails on weights.- Orphans. From the questionnaire, we did not know whether the orphans were one- or two-sided, and so we assigned to all orphans the number of points given for one-sided orphans.a Twins. We could not tell whether children were twins. Any household with two children thesame age was assigned the number of points for twins.* Income. We could not, of course, replicate exactly what a household mnight have reported to theParos registry about its income, but we can assume that households reported receiving humanitarianassistance as well as the salaries of those in the formal sector and any official pensions. These wereplausible assumptions because the receipt of these items could be verified by Paros' internal recordsor by asking the applicant to provide pay stubs. For landholders, the Paros system imputes a valuefor agricultural income based on information in the land cadastres regarding how much income toexpect from a holding given its size, quality and location. We could not replicate this exactly, butinstead used the value of agricultural income the household reported in the HIBS questionnaire. Wedid not make any attempt to include income from the informal sector, even though the Paros systemasked registrants to report such income, because we assumed a high degree of underreporting. It isobviously in the interest of the applicant not to report such income and there is no method for theParos system to verify the existence of informal income.* Business licenses. We could not determine from the survey data whether or not the householdhad registered as a small business, although we did know if the household had any workers in theinformal sector. We made no provision for setting scores to zero based on this information because
This is drawn from Grosh and Glinskaya, 1998.
2 About ten percent of households reported their Paros score. Of these, a fair number of the observationswere not in the plausible range, indicating that the households had not read or recalled the scoreproperly from their social passport.

ANNEX 6Page 2 of 5
to date the number of firms registered and licensed in the bureau has been very small. Clearly, non-compliance is the norm.* Ownership of Cars. The HBS survey did not contain a direct question on whether householdsown automobiles, so we constructed a proxy variable based on whether the household reportedexpenditures on gasoline or automobile repairs during the reference period (prior month) of thesurvey. This method likely underestimated car ownership, especially among those who essentiallygaraged an automobile to save operating expenses.
Simulating the Impact of Transfers through Paros
3. The HBS data did not allow us to directly see who received transfers through Paros andwho did not, so to draw conclusions about how the system operates, we simulated how transfersmight work using the Paros score. We hypothesized a very simple program that approximates howactual aid distributions worked, as follows:* Budget. We postulate a budget of 6.4 million drams, which represents about 2.5 percent of thetotal consumption of the sample, e.g. an approximate scaling down of the budget for socialassistance in 1997.3 Benefit. Everyone who gets a transfer receives the same amotint.
E Eligibility. We use two eligibility criteria. First, we use a cutoff point of 35 with the scores ofthose who own cars, according to our proxy, set to zero. Second, we use a cutoff of 32 withouttaking into account information on car ownership. The first variation may be more similar to howthe program works today in that it currently takes into account the data on cars, and as aid hasdiminished, the thresholds have gotten higher. The second variation represents more closely howthe program operated when the bulk of humanitarian aid was flowing through it. Car ownershipwas not factored in, and since aid was more abundant, cutoffs were lower. (Remember that a highscore represents more need, so that "lower cutoff' actually means one in which more of thepopulation benefited).* Registration. We only give a benefit to those who are both registered and meet the eligibilitycriterion.* Poverty measures. As in Chapter 2 (The Poverty Profile), we use household per capitaconsumption as our measure of welfare. We calculate the same measures of poverty, theheadcount, depth and severity (i.e. the Foster-Greer-Thorbecke measures for alpha equals 0, 1 and2) using the same poverty lines.* Calculating errors of inclusion and exclusion. We assume that the target population is thebottom 25 percent of the population and use this as the guideline for a plausible simulation since theactual cutoff points used over the years were in this range. In monetary terms, the 25ipercentile ofthe population has a log per capita consumption per person per month of 8.83 drams. Thiscorresponds approximately to a score of 35 Paros points, with the scores of car owners set to zero.* Benchmarks. To provide benclhmarks for comparison, we also show the baseline situationbefore a transfer and simulate what would happen if the same budget were distributed equally t-o allpeople, which is called the uniform transfer.
Regression Results from Models of Proxy Formula
4. Before we embarked on any of the work in the simulations, we divided the sample in halfby sorting households by region, urban/rural and per capita consumption. We then took the evennumbered observations for one sub-sample and the odd numbered observations for the other. Weused one sub-sample to run the regressions to determine which indicators-and weights to use andthen used the other half of the sample to predict welfare and conduct the transfer analysis.

ANNEX 6Page 3 of 5
5. The idea behind this technique is that it applies a harder test to our procedures. Ifinstead, the work had all been done on the same sample with the same households used in theregressions to determine what the formula should be -- and in the simulation of the transfers --the results would have been biased in favor of accurate prediction. (Sensitivity analysis notpresented here nonetheless shows the bias to be negligible).
6. Ordinary, least squares regressions are used.3 Standard errors are adjusted forstratification and in the (mostly rural) areas where two-stage sampling was used, for clustering.The particularly significant variables shift somewhat between models. This is largely a result ofhaving reduced the sample size in order to conduct the methodology more correctly out of samplepredictions.
7. Model 1: Location. We have four types of location variables available: Yerevan, otherurban, low altitude rural areas, medium altitude rural areas and high altitude rural areas. They arein the earthquake zone, conflict-effected border zone, and the marz, or region, where the householdlives. Surprisingly, the strata variable was not generally significant. The conflict-effected borderzone was not strongly associated with lower consumption, and residences in the earthquake-effectedarea were more closely tied to with lower consumption. Armavir and Lori marzes were alsoassociated with higher per capita consumption than Yerevan, whereas the others had insignificantcoefficients.
8. Model 2: Social categories. For each of the fifteen social categories we could handle(described above), we include a variable consisting of the number of household members with thosecharacteristics. Households where all members were classified as "category-less" were excluded.These households were presumed to have no disadvantages; the Paros program hypothesizes that allother categories constitute a social disadvantage that will result in poverty. When household size isadded to the regression, interpretation of the social category dummies has the same effect onwelfare that would occur if a "category-less" person were replaced by someone who was identicalbut possessed one of the disadvantages in the social categories.4
3 Strictly speaking, OLS is inappropriate for predicting consumption for two reasons. First, the techniqueminimizes the squared errors between the "true" and the predicted levels of welfare. Theminilmization of squared errors is a different theoretical problem than that of the minimization ofpoverty. Ravallion and Chao's (1989) algorithm directly minimizes poverty, thereby producing betterpoverty results which could make it a better tool for designing a transfer scheme. However, we do notuse it throughout this paper because it is: cumbersome when a large number of predictive variablesare available, doesn't use continuous variables efficiently, and policymakers and their technical teamnsare unfaniliar with it. OLS may not be the best algorithm to use for a small number of discretevariables, but it's convenient and useful when large numbers of variables and continuous ones areavailable. (see Grosh and Baker, 1995, Annex I for a fuller discussion of this issue.)
The second problem with using an OLS model is that many of the variables we use on the right-hand sideof the regression are, strictly speaking, endogenous. In other words, the household makes decisions
about them that are not independent of decisions that determine household welfare, which is the variableon the left-hand side of the regression. OLS is nevertheless sufficient in this targeting simulation becausewe are only concerned with identifying the poor and not with explaining why they are poor.
4 Note that household size and the sum of the social category variables are not so strongly collinear as tocause the regression package computational difficulties. Indeed, they are hardly more collinear thanmany regressors. To the extent that they are collinear, they may inflate standard errors somewhat, but
ANNEX 6Page 4 of 5
9. Three of the social categories were, in fact, strongly and negatively related to consumption:the registered unemployed, pensioners, and pensioners living alone. These variables presumablyeffect eaming power, and thus consumption, in ways that can be easily interpreted. The iamilystructure variables that indicated the presence of children were generally negatively correlated withconsumption, in some cases strongly enough to be significant (children aged 2-18, orphans, twins).Any interpretation of the coefficients on these variables should, however, be done with caution.Since the consumption measure being predicted is consumption per capita rather than per adultequivalent, and since food is quite a large share of consumption (50 percent overall and 73 percentfor the poorest decile), the link between children and poverty may be somewhat exaggerated in thisformulation. Most of the social categories are not significantly related to consumption.
10. Model 3: Social categones and location. Next, we used social categories and locationtogether. The pattem of which variables were important remained fairly stable and the coefficientsfor conflict-effected border areas and persons over age 80 are more strongly significant andnegative. The adjusted R-squaredL, which shows the overall fit of the model was slightly better, butstill low at xxxx. (TK)
11. Model 4: Adding household demographics. We add several variables about householddemographics to those in Model 3. As is common, the household size and its square are signif.icant,however once these are in the equation, the dependency ratio5 is not significant. The head of thehousehold's6 gender doesn't matter either. However, the maximum education level attained by themost highly educated member of the household has a strongly positive effect on consumption. Theage of the head of the household (entered as age and age squared) is not individually or jointlysignificant.
5 . Model 5: Adding assets. We included assets that were mentioned on the questionnaire andwhose existence it might be reasonably easy for a program administrator to verify. First, we use aproxy measure for car ownership7 that was strongly and positively related to consumption withhouseholds we believe own a czLr having per capita consumption 38 percent higher than thosewithout cars. Interactions show that car ownership is especially crucial in rural areas. Owning landhas strong, positive effects on consumption. Holdings of cows exhibit a threshold effect; ownershipof a single cow does not significantly raise consumption, but ownership of more than one does.Because relatively few households own pigs or sheep (5 and 8 percent, respectively) we enter thosevariables as dummnies for ownerslhip or not although neither is significant. Owning fowl shows nosignificant effect on consumption, though because they are more common and have more variablenumbers we allow for a threshold effect.
do not bias the coefficients. We prefer to leave household size in, as it is important in its own right,and aids greatly in the simplest interpretation of the social category variables.
5The dependency ration is defined as (number of members-number of earners)/number of members.
6 Head of household in this data set is defined in a somewhat unusual manner. The household was notasked to name a head during the interview. Instead, the survey institute inferred such a position. Itis assigned to the member with the greatest reported income in households with an identifiableeamer. In other households, the oldest male is labeled as head.
7The questionnaire did not ask directly if a household owned a car. However, it did request data onexpenditures for gasoline and auto repairs. If a household reported either of these, it was assumedthat the household owned a car.
ANNEX 6Page 5 of 5
6. Model 6: Adding housing quality. We add various measures of housing quality. First, weexamine the type of residence. The base case is apartment dwellers. Unexpectedly, the types ofresidence variables are not significant, which is a surprise when we take into account those living inrailcar/containers or hostels. With respect to ownership of the dwelling, the welfare of those whorented from private persons was about a quarter higher than other renters. The size of the dwellingis statistically significant, but not significantly so. An extra 10 square meters of living space isassociated with a 1- percent increase in per capita household consumption. Virtually no one hasoperational centrally supplied gas or heat, although most had functioning electricity so thesevariables turn out to be insignificant. Households without bottled gas or their own sources of heatare worse off than those with them just as people with telephones are better off than those withoutthem.
7. Model 6U/R: Separate rural/urban formulas. We included all the same variables but splitthe sample into rural and urban components. On the whole, the variables that are significant andtheir parameter estimates are fairly stable. The bigger exceptions are unsurprising: more of themarz variables are significant because they are now more closely associated with land quality or, inurban areas, with the local labor market, and some of the livestock variables lose significance inurban areas. Surprisingly, some of the dwelling quality variables matter more in rural areas thanurban ones.
8. Model 7: Shortened variable list. By now the model involves a fairly large set of variables.Since the administrative burden increases with each extra variable, keeping the model as small aspossible is desirable. In order to move closer to this goal, we excluded the variables that had nothad significant statistics in the preceding regressions and a few that were harder to measure, likelivestock. This effectively reduces the number of pieces of information we must gathered from 39to 20. The adjusted R squared drops a little -- from .251 to .263 -- but not markedly.
9. Model 8: Adding employment and income variables. The labor force status of the headof household, the sum of earnings, and the imputations for the value of agricultural goods wereall significant and the coefficients of the expected sign. However, the sum of wage arrears wasnot significant, nor was whether the household received remittances (dummy indicator, notamount) during the month of the reference period. A variable constructed from the difference inthe number of persons the household considers to constitute their family and the number ofindividuals who reside together at the time of the survey can be taken as a proxy of the potentialnumber of remitters. This variable is significantly related to consumption, as is the actual levelof remittances during the recall period.
10. Model 9: Paros indicators. Many of the indicators are significantly associated withwelfare. The social categories and locations that are not strong predictors of welfare are, ofcourse, the same as in Models 1 and 2.

ANNEX 7Page lof8
PAROS BENEFICIARY ASSESSMENT
Executive Summary
I. Introduction
This Beneficiary Assessment of the Paros targeting system was funded by the WorldBank in an effort to inform the reform of the social welfare system prior to theintroduction of a new family benefit system. (See Appendix 2: Methodology)
II. Background
The Paros system was initiated in 1994 in an effort to improve the targeting ofhumanitarian assistance from international donors to the Armenian population. In 1997, are-registration of households was conducted in order to update information, and improvethe quality of data available on households by requiring official documentation. In the fallof 1998, it is expected that the Ministry of Social Security will use the Paros system todistribute cash transfers to 200,000-250,000 households.
III. Main Characteristics of the System
The main characteristics of the Paros system are the following. It relies on a self-targeted,voluntary registration. Household information is collected from potential clients in theoffice - not in the household. The proxy means test algorithm is complex. The algorithmis not a secret formula. The data is processed both locally and centrally. The supervisionrole is ill-defined supervision and there is no effective audit function. Technical andhuman resources are available in the system, but not used to their full potential ---because of lack of training and clear definition of roles, tasks and goals.
IV. Findings of the Beneficiary Assessment
1 . Choice of a Proxy Means Test
Compared to other targeting alternatives, the choice of a proxy means test is a rationalone from the point of view of the government and the population. There are three mainreasons: the lack of accessible and reliable data regarding actual household incomes; thelack of professional training to identify the poor among social workers, and the perceivedand real) corruption of bureaucrats as gatekeepers of government resources.
However, the objectivity of these lists should not be overstated. Social workers can edit(5 percent of) the lists they receive from the Mergelian Institute and can use their owncriteria for distributing up to 15 percent of the assistance through additional lists.
ANNEX 7Page 2 of 8
2. Voluntary Registration Process
The number of registered households with Paros has decreased considerably since th[e1994 registration. This is in large part to emigration and the regrouping of certainhouseholds who had claimed previously to be living separately.
The process of re-registration of households under Paros has been in many sites quiteefficient because of de-centralization. At the peak of registration - in late summer andfall of 1997 - many of the territorial offices set up temporary offices in neighborhoodshops in towns and in the village councils in villages. In some sites, de-centralization didnot take place (Vartenis town and villages) or took place late in the Spring of 1998 (Talinvillages).
3. Access
There are two opportunities for inclusion: the first is access to the system throughregistration and the second is inclusion once data is in the system and the household isselected by the formula. (Also see Formula). Access to the Paros system is determinedby above all, by information availability (See point 4), perception of household eligibilityand other social values and social alienation of the household (passivity, mental health,gender), then cost of processing registration (informal processing fees, documentationcosts), mobility/ distance/ transportation.
Costs (See Appendix 1: Table 1) varied greatly in terms of type and size of expensethrough out the sites. The unofficial costs were common in villages where documentationwas provided at a cost 2-4 times higher than official urban prices. Unofficial costs intown were not reported (except on respondent in Vartenis) while they were common inrural areas.
Documentation requirements entailed some formal and informal costs. Documentaticin ofhandicap ($10-$50 infornal cost plus costs related to the health services), divorce(30,000 dr. in Yerevan) and change of passports from old Soviet passports to the newArmenian passports (1200 dr.) require official and unofficial payments related to legalprocedures (Also see DocumenLtation).
In urban and rural areas, costs related to pre-conditions set by organizations issuingdocumentation were the highest expense related to registration. There were cases ofhouseholds who did not go through re-registration because they heard first or second-hand of pre-conditions requiring paying off outstanding debts. Many of these paymerntswere said to be negotiable, according to the officials themselves, in order to make themaccessible to the poorest. The costs related to transportation were high especially for ruralhouseholds who did not take advantage of the decentralized re-registration process whensocial workers spent a day or two in their village.
There are social (gender, age, family status, ethnic) barriers to obtaining documentationaffecting mostly secondary cities and villages. This affected women (Armenian and
ANNEX 7Page 3 of 8
Yezidi villagers near Talin and Aparan) without a male head of household present anddaughters in law (Talin). Participants explained that "without a master, without ahusband," a woman has no right to go to the village council for business reasons.
As a result, the greatest divides in registration levels among respondents were a functionof rural versus urban residence, and work capable versus work incapable adults. Ruralresidents registering at a lower rate because of lack of information about Paros andhistorically low levels of humanitarian assistance going to rural areas (except in theconflict zone, earthquake zone and among some refugee populations). Urban householdswere more systematically targeted by de-centralized re-registration efforts. Work capableversus vulnerable groups, with work capable households having historically beenineligible for assistance.
The main reasons why eligible participants were unable to register were: lack ofinformation (re-registration process and Paros benefits); inability to document poverty;cost (low mobility because of old age, illness or distance, pre-requisite payments ofdebts; informal and formal costs of registration)
The main reasons why the poor are not actively included by social workers are that thereexist no directives as to how this identification should take place; the large number ofcases for which each caseworker is responsible (some 2000 cases per worker). But at thetime of field work, the social workers were sitting mostly idle - with no plans for homevisits; and cultural inhibitions about visiting strangers' homes.
4. Information about Paros
The primary source of information for most households was word of mouth. The secondmost important source was the mass media -- namely television and radio notnewspapers. However, it is important to remember that the poorest of the poor often donot have electricity or consumer goods in working order. In some villages, the mainsource of information was the village council head.
Knowledge of Paros is limited. The purpose of Paros is generally perceived to be to assistthe poor, and to distribute humanitarian assistance from abroad. Paros is sometimes notbelieved to be a government program or associated with the Ministry of Social Security.There was little knowledge of the use of a formula to select recipients of assistance.
5. Data Collection and Processing
Information about the situation of households is collected in the office, not in thehousehold. The main assumption of the system is therefore that the household's welfarestatus can be communicated through documentation.
There are a number of obstacles to documenting poverty. First, Paros assumes thatpoverty is linked directly to a household's status or characteristic of a member of thehousehold which has been refuted by the recent poverty studies. Second, it assumes that
ANNEX 7Page 4 of 8
the poor have the information and financial resources to access appropriatedocumentation. In many cases, the poor are likely to lack documentation and live inunofficial situations - unformalized divorce, handicap or illness, changing householdcomposition, etc. Cost (formal and informal) associated with documentation and lack ofability to navigate bureaucracy are the two main impediments to documentation.
The system therefore encourages strategizing on the part of households (and sometimessocial workers) struggling to show low welfare in order match up poor households vvitheligibility requirements. Thus there is an incentive to produce false documentation. Theissue is not always that the household is not poor but that poverty is not coherent with theParos criteria.
The quality of information within the system becomes less reliable as it progressesthrough the system (Also see Monitoring below). Human error in data entry of householddata is widespread. There are no processes for fact checking or data cleaning. Thebureaucrats issuing documentation may have little information upon which to assessveracity of the information they are documenting and even an incentive to providedocumentation that is not true. Delays in input of data into the central computer maytemporarily exclude eligible families. The information recorded in the Paros booklets ofthe beneficiaries does not necessarily correspond with the data on file at the socialservices, or that in the central computer. The information in the computer can bechanged by the social worker or the Mergelian Institute once it enters the system. Tlhelists received by social workers for distribution of assistance can also be changed by thesocial workers. According to regulations, up to 5% of recipients can be eliminatedbecause they are not deemed needy by the social workers.
6. The Paros Formula
The Paros formula remains based on the concept of vulnerable groups. As a result, theformula retains a moralistic character. It also continued to privilege the work incapableversus the work capable. Thus, a poor family with two children and a working adult isunlikely to receive aid no matter how poor it is.
The criteria used in the formula may not always be appropriate to support what it ismeant to document - i.e. relative welfare levels. This is in particular the case forcharacteristics such as household composition, employment status, household income,and agricultural incomes.
An emphasis is being made on excluding the well-off but not on including the poor.Particular efforts are being made to exclude well-off households by using a single criteriasuch as car ownership, having a registered trade or private enterprise, sale of real estate,and others are being considered. There are no equivalent efforts to identify proxies forincluding the poor. The fact that a single criteria can exclude households entirely is anunfortunate oversimplification.,

ANNEX 7Page 5 of 8
The lack of effectively enforced standards used for documentation weakens the reliabilityof the centralized selection system. Supporting information requirements varied byterritorial office for asset holdings, household composition, car ownership and receipt ofassistance.
7. Technical and Human Resources
The social workers are often perceived by beneficiaries as uneducated, rude and corrupt.The social workers are bureaucrats trained to process documentation, do not have aprofessional background and few have lengthy experience in the system. The level ofprofessionalism of directors of local territorial center offices who had gone through athree-month training program was notably higher than that of social workers.
The social workers are seen as corrupt because of their position as gatekeepers togovernment resources. While beneficiaries clearly based this perception on amisunderstanding of the international assistance system, it was also a result of excessesexperienced in the context of assistance distributions. Yet precedents are widespread withregard to officials and government workers benefiting from their position as gatekeepersof government resources. One example is the Health Commission reporting to theMinistry of Social Security that approves handicap status and is known to take bribes.Another "tradition" involves the postman who delivers pensions and takes 100 drams incities as a mandatory tip and 200-400 drams in villages "for newspapers," that is, theobligatory purchase from the postman of out-of-date newspapers. The family benefitswill not only be managed by people who are widely seen as corrupt but alsoinexperienced with cash management and monitoring of cash transfers.
The formula is not secret but it is misunderstood. Lack of understanding of the Parosscoring system feeds expectations that officials and social workers are taking advantageof the poor. Left in the dark, people assume that the social workers and the system arecorrupt.
8. Accountability, Supervision and Monitoring
There is little sense of accountability of the system to its clients/ beneficiaries. The socialworkers seem to use the fact that a computer selects beneficiaries to divert accountabilityaway from themselves. The majority of complaints about exclusion were met by a similarreply through out the country: "It's not our choice. The computer decided."
The monitoring system focuses on monitoring the beneficiaries through the control ofpapers. There is no monitoring of the quality of the information being inputted into thesystem. Other controls within the system are mostly rubber stamps. There are no meansto check data inputted based on the files compiled by the social services since the onlydocuments kept on file are photocopies of birth certificates of minors. The Marz levelauthorities have unclear authority and role in the management of the system and benefitfrom no additional information.
ANNEX 7Page 6 of 8
The appeal system is weak. It continues to rely on official documentation rather thanintroducing new types of information. The official appeal system consists of a sittiligcommission at the local level whose purpose is to review complaints. This commission ischarged with reviewing the complaints based on documentation gathered by thebeneficiary to counter information that is in the computer. There is also a conmmission atthe Marz level.
The only means of correcting erroneous information in the file (because of poor dataentry or out of date information about car ownership, etc.) is for the beneficiaries tocomplain. Beneficiaries complained only when they expected to receive assistance, thendid not and were self-assured enough to complain. Thus complaints are few compared tothe total caseload. One reason why there are few complaints may be that beneficiariesdid not know to whom to complain or were told to go to Yerevan to complain.
9. Parallel Targeting Methods
"Additional lists," which represent up to 15 percent of the total list of recipients, could, intheory, introduce flexibility in a system that is particularly rigid and excludes some typesof poor households. In practice, however, the criteria for the additional lists did notnecessarily introduce flexibility in identifying the poorest since its purpose is often seenas correcting errors in applying the system rather than introducing targeting alternatives.
Officially, the lists consisted of those persons who were erroneously excluded because oferrors in data entry; late data entry; priority households based on Paros scores near thecut-off point; and cases positively reviewed by the Ministry. In fact, the social workersclaimed that they use these lists mostly to appease scandal-prone households. Thus risk ofhysteria is the criteria not relative need.
These additional lists are not posted so there is little accountability to the community orto super-visors with regard to these lists.
There is a perceived disincentive for the social workers to disseminate informationregarding recipients of assistance because the more beneficiaries do not come to clai:mtheir assistance, the larger the additional list drafted at the initiative of the social workers.The social workers were also seen as making it difficult for certain households to claimassistance.
There is no institutionalized cooperation to identify the poor among local agencies. IThebelief at each level of the system that "I know best" who deserves assistance impedesefforts to build on local knowledge, share resources and to allow different levels toidentify different kinds of households for assistance depending on a varied assortment ofcriteria.
ANNEX 7Page 7 of 8
10. Role of Government
According to the focus groups, the role of government is to support the work incapableand provide work to the work-capable. The definition of social policy is broader inArmenia as a former Soviet state where employment creation is seen as a duty of thestate. Examples of local government efforts to target the poor were mostly ad hoc,targeted to entire population, or self-targeted.
The concept of targeting the poorest is controversial among beneficiaries and socialworkers. One reason why targeting the poorest may be politically difficult is that most ofthe population has suffered a great drop in living standards so that most are struggling incomparison to Soviet times. Second, the concept of allowances is tied to a history ofSoviet entitlements provided on the basis of good citizenship to all families in return forworking hard, for fighting a war, for having many children who will be able to producefor the state and be called to serve in the army. Allowances are thus not necessarily seenas support to the poor but as manifestation of a reciprocal, beneficial relationship betweenthe state and the citizen. Third, there may be a cultural/ societal condescension toward thepoor. Armenian sayings and stereotypes point to the poor as being responsible for theirown situation.
11. Beneficiary Satisfaction with Paros
The assessment of the Paros system was mostly negative. It was linked to a large part to'beneficiaries' experience of humanitarian assistance. The positive aspect of Paros wasthat it is meant to assist the poor. The beneficiary's assessment of the Paros formula wasclosely linked to whether they had qualified for assistance and how much assistance theyhad received.
V. Recommendations
The Paros formula and system need to be retained for the time being because there is nobetter alternative in the absence of a trained and reliable corps of social workers todistribute the assistance without creating a web of patron-client relationships; and theformula is an improvement on the Soviet-style vulnerable group targeting system.However, some important changes need to be made to the existing system in order tostrengthen its ability to meet its goals effectively.
The summary of recommendations listed below is drawn from focus group discussionsand the analysis of the findings discussed in this report.
- Increase focus on the serving beneficiaries. Provide professional training toinspectors. Clarify the goals, and activities of the social services to include activetargeting sand support of the poorest households through the system.
- Rethink the targeting system to rely less exclusively on documentation and more ontrained and dedicated social workers.

ANNEX 7Page 8 of 8
- Improve openness, information dissemination and sharing, transparency to enhancetrust in the system and to increase beneficiaries' ability to enforce accountability atthe local level. Information dissemination can take place through radio shows, TV,distribution of leaflets in plain language; open house, meetings in villages.
- Increase accountability by improving the information flow back down to thebeneficiary.
- Monitor of costs of registration and receiving assistance to the beneficiary isessential.
- Introduce more flexibility in the appeals system by allowing decisions based onadditional information sources that can be documented for the file and monitored by asupervisory body.
- Introduce a methodology for determining inclusion in and monitoring of theadditional lists.
- Introduce partnerships with organizations that have experience in targeting thepoorest to mentor social workers.'
- Introduce other services than family benefits to ensure impact on poverty. These areessential for the mentally ill, alcoholics, bed-ridden handicapped and other groups.Essential services for the general population are: assistance with registration, legaLlassistance for documentation. A contact persons who can act to as links to othersources of information or services (work, credit, training, health care, etc.) for thosehouseholds not eligible for the cash transfers would also be useful.
- Create a multi-disciplinary/ mixed commission that would assess the relative need ofhouseholds by observing living conditions in the home.
- Introduce effective supervision roles. Re-define and strengthen the supervisory roleof managers, and monitoring activities to improve both quality of work andaccountability to the beneficiaries.
- Improve data used in the processing of the Paros score. Improve standardizationof requirements for documentation used in calculating the Paros score. Identify betterinformation sources for the data used in the formula.
- Make a symbolic and real distinction between the government's cash transferprogram to families and the system of distribution of humanitarian assistance.Change the name of Paros as it applies to the government program. This will allowmonitoring of public perceptions independent from ongoing humanitarian assistanceprograms.

ANNEX 8Page 1 of 5
SOCIAL SERVICES CENTERS IN ARMENIA - A SUMMARY OFINSTITUTIONAL CAPACITY EVALUATION
1. Findings and recommendations presented in this summary regarding institutionalcapacity of Armenia's social services centers, are based on extensive field workconducted by a team of researchers in July and August 1998. The team visited 13 socialservices centers (one forth of the total number): one in each region (marz) and three in thecapital of Armenia, Yerevan.
2. The social services centers were chosen so as to reflect the most importantgeographic, social and economic characteristics of the country and its population. Eachcenter was extensively surveyed concerns: (i) its functioning, (ii) work organization, (iii)monitoring procedures, (iv) working conditions, (v) services provided to the population,(vi) registration of the population within the PAROS data base, including issues related todata entry procedures and practice, data entry errors detection and correction, data basemanagement, possibilities for clients to check directly their files, etc., (vii) outreachwork, (viii) financing, and (ix) the most pressing problems. More than 110 socialworkers, including directors of the surveyed social services centers were interviewed(about 20% of the total number of employees working for the social services centers inArmenia), in order to find out what work tasks they performed, in what manner, the waytheir work was organized, qualifications, training issues, motivation, etc.
3. The method used in the field work was basically a qualitative assessment. Anenormous arnount of information was collected. Basic findings and recommendations aresummarized in the following paragraphs.
1. Introduction
4. History: Social services centers (SSC) in Armenia were established in 1993/1994to register population eligible for humanitarian assistance and to distribute or participatein distribution of humanitarian assistance. These have been the only tasks performed bythe SSC so far.
5. Current status: SSC still perform the same function of registering the populationfor humanitarian assistance, within the PAROS data base and using the proxy means testas a targeting mechanism, and distributing humanitarian assistance from time to time.The volume of humanitarian assistance has declined sharply. SSC and their staff havebeen prepared and trained lately to administer the new Family Benefit which the Ministryof Social affairs introduced at the end of 1998. As of August 1997, the SSCs have beenreregistering population for the new family benefit. The re-registration has been mostlycompleted. The number of reregistered families (with all the required documentssubmitted) is approximately 30% lower than it was before.

ANNEX 8Page 2 of 5
6. Currently, there are 54 social services centers with 545 employees covering theentire Armenian territory. In urban areas they are within walking distance. In rural areas,in most of the cases, the distance between the SSC and the most far away villages servedby the SSC is 35-40 km. SSCs are financed from the republican budget through theregional (marz) budgets. They account both to a social policy department at the marzlevel (for organizational, management, budgeting, financial, staffing and otheroperational issues) and to the Ministry of Social Affairs (for policy and methodologicalissues).
7. Potential: SSC constitute a solid base for building a network of efficient andeffective, client oriented social policy implementation units.
2. The Situation
8. Role, functions and tasks. Not clearly and precisely defined. This opens roomn fordiscretionary decisions by the SSC directors as regards eligibility and other rules.
9. Work procedures (business plan). Nonexistent. Tasks are performed in acampaign-like manner which puts an uneven workload on social workers: waves of re-registration and hundreds of clients crowding in narrow corridors are followed by monthsof idleness for most of the SSC employees.
10. Organization of work. Under the circumstances, not bad. SSC directors andemployees are trying to accomplish assigned tasks as best and as efficiently as they can.However, organization of work varies. It mainly depends on the SSC director's capacitiesand initiative.
11. Client orientation. Poor. Clients are mainly seen as objects to be registered andprocessed, not as individuals in need served by the SSC staff. This is probablyconditioned by the major function performed: registration of the population forhumanitarian assistance. However, it seems that SSC employees are trying to facilitateregistering process as much as possible. In all of the surveyed SSCs it was firmly statedthat clients are allowed to check directly their personal computer file and requestcorrection, if information in the file is found to be inaccurate.
12. Monitoring: Weak and random at all levels. There is not clear understanding of theterm "monitoring" (nablyudenie) which is feared and rejected, because it is understood asthe old Soviet control system.
13. Appeal commissions and procedures: Appeal commissions officially do notexist, neither are there written appeal procedures. Appeals are mainly solved at the levelof the SSC director. However, some of the SSC have established an appeal commission.In some of them, representatives of the local community actively participate in solvingcomplaints and disputes.
ANNEX 8Page 3 of 5
14. Information of clients: Sporadic, mainly through electronic media (radio and TV).There are not even any posters hanging on the SSC walls with basic information asregards registering with the PAROS data base for humanitarian assistance.
15. Registration of outreach clients. Although all screened SSC employees claimedthat they had done all the necessary work to include population from far way villages inthe PAROS data base, outreach work is not organized in a systematic manner. Theimpression is that it mainly depends on the SSC initiative and the good will of the sociaiworkers, because in most of the cases they have to bear transportation costs to villagesthemselves. Having in mind the very low amount of their monthly wages $15-20, it isunderstandable that they are not particularly willing to spend money on travel to villages.Therefore, major impediments for better results in assisting the outreach clients are:
(a) lack of resources (budgeted operational expenditures, such as transportation costsfor outreach, are executed by less than 30% on average), and(b) poor transportation (in most cases transport is available only once a week; insome cases it is non-existent).
However, some of the surveyed SSC have achieved good results in registeringoutreach clients through cooperation with local councils and NGOs.
16. Cooperation with local communities and NGOs. Sporadic and limited. Localcommunities and local NGOs sometimes provide information to SSC on the needypopulation which should be registered for humanitarian assistance. It seems that localcommunity administration offices in far away villages have played an active role inregistering population for humanitarian assistance.
17. Staff. Mainly with higher education. However, only a few of them are socialsciences graduates. Few like the work they perforn and are satisfied with it, althoughthey are happy for the fact that they at least have a job. Most of the SSC employeeswould change their job if they could find a better (that is, higher paid) one. The problemof burn-out is significant. Social workers feel helpless because of their limited mandate -registration of the population within the PAROS data base. People in need come to thesocial services centers asking for assistance. The only assistance social workers can givethem is to register them for humanitarian assistance and talk to them. This creates lots ofvery unpleasant situations in which the clients' anger is directed to the social workerswho are unable to help them.
18. Training. Not sufficient, although almost all of the SSC employees have at least afew days of social work training, while some of them, particularly managers (SSCdirectors) have several months of training in social work. The Ministry of SocialProtection has obviously put significant efforts into training the SSC employees. At thetime of the SSC institutional assessment field work, quite extensive training of socialworkers and directors of the SSC was being undertaken regarding the issues related to thenew Family Benefit.
19. Financing. Not sufficient. SSC employees (very low) wages are paid more or lessregularly. However, operating expenditures are severely underfunded. SSC getapproximately 30% of the resources budgeted for material expenses, transportation costsrelated to serving clients, and the like. Disconnected telephone lines and electricity

ANNEX 8Page 4 of 5
supply due to unpaid bills are quite common. As already pointed out, lack of funds is oneof the major impediments for better registration of outreach clients.
20. Preniises: Generally poor, in some cases very poor. However, all of the visitedfacilities can serve their purpose.
21. Furniture and equipment. In many cases furniture is barely sufficient for work.Computer equipment is mostly sufficient. Faxes, Xerox machines and similar equipmentare completely lacking.
General evaluation. With its experience in registering population forhumanitarian assistance, and relatively good knowledge of the economicand social situation of most of their clients, SSC make a good basis for beingtransferred into a social policy implementation units, provided that:
v socialpolicy measures to be implemented by the SSC are clearly defined,and
V SSC capacity to implement them efficiently and effectively isstrengthened.
3. Strengthening the institutional capacity of thesocial services centers in Armenia - what should be done
22. Role, functions and tasks to be performned by the social services centers should beclearly and precisely defined. Each social assistance measure to be implemented by theSSC should be accompanied by written implementing rules, procedures and instructions,in order to provide fair and equal treatment of the clients.
23. Work procedures (business plan) should be developed, including simpleoperational manuals, so that work is organized smoothly and efficiently. Room fordiscretionary decisions made by the SSC directors should be minimized.
24. Monitoring procedures and mechanisms should be developed and implemented.Responsibilities should be clearly defined. SSC employees should know who and in whatway accounts and reports to whom. Regular evaluation of performance should beintroduced together with incentives and awards for good working results.
25. Appeal commissions and procedures: Appeal commissions should be establishedofficially and written instructions for their functioning should be developed. It is highlyrecommended that local community representatives actively participate in their work, aswell as distinguished and respected members of the community.

ANNEX 8Page 5 of 5
26. Information of clients should be systematic. While electronic media campaignsare welcome, posters with information on social assistance benefits, including lists ofnecessary documents should be placed where potentially indigenous people frequentlygather or can be found (hospitals, local administration offices, post offices, etc.) to reachmore of the potential clients.
27. Registration of outreach clients should be a regular SSC activity, organized andmonitored in a systematic manner. In assisting clients social services centers andsocial workers should go to the clients, they should not wait passively for the clientsto come to them asking for assistance. Simple instructions based on the best practiceacquired during registering population for humanitarian assistance should be developed.Appropriate funding should be secured, including incentives for social workers engagedin registration and providing services to outreach clients.
28. Cooperation with local communities and NGOs should be regular practice.Exchange of information and jointly organized actions can result in many new initiativesand better services provided to the needy. SSC cooperation with local communities andNGOs is particularly important for better outreach work.
29. Staff. Although social services centers employees have not been educated forsocial work, most of them hold university degrees and have significant experience inworking with the needy - the vast majority of the interviewed SSC employees had beenworking there since the SSCs were established. The Ministry of Social Insurance hasinvested significant efforts to provide at least basic training in social work for the socialservices centers employees. It should continue to provide workshops, seminars,knowledge updates, as well as more ambitious training in social work, particularly toyounger employees.
30. Financing should be sufficient to provide normal functioning of the SSC. Incomparison to the current situation this means regular payment of wages and more fundsfor operational costs, e.g. what is planned by all means should be executed.
31. Premises, furniture and equipment: As already seen in the field, premises andwork environment can be greatly improved through the initiative of a SSC director andemployees and joint action with the local community. Recently acquired computersshould be sufficient for the time being. Other equipment, such as faxes, Xeroxes, etc., isneeded, but is not an immediate impediment for work to be performed.