
Improving image retrieval effectiveness in query-by-example environment
8
Improving Image Retrieval Effectiveness in Query-by-Example Environment Khanh Vu Department of Computer Science Oklahoma State University Tulsa, OK 74106 [email protected] Kien A. Hua Department of Computer Science University of Central Florida Orlando, FL 32816-2362 [email protected] Ning Jiang Department of Computer Science University of Central Florida Orlando, FL 32816-2362 [email protected] ABSTRACT Query-by-example is the most popular query model for to- day’s image retrieval systems. A typical query image con- tains not only relevant objects (e.g., Eiffel Tower), but also irrelevant image areas (e.g., the background). The latter, referred to as noise in this paper, has limited the effective- ness of existing image retrieval systems. We present here a similarity model for noise-free queries (NFQs), and inves- tigate indexing techniques for this new environment. Our query model is more expressive than the standard query-by- example. The user can draw a contour around a number of objects to specify spatial (relative distance) and scaling (rel- ative size) constraints among them, or use separate contours to disassociate these objects. Our experimental results con- firm that traditional approaches, such as Local Color His- togram and Correlogram, suffer from noisy queries. In con- trast, our method can leverage NFQs to offer significantly better performance. This is achieved using only a fraction of the storage overhead required by the compared techniques. Keywords Image retrieval system, image query processing, reducing noise, indexing 1. INTRODUCTION The popularity of digital images has spurred a demand for robust content-based image retrieval systems. These sys- tems are needed in various application domains including medical imaging, digital libraries, geographic mapping, and electronic commerce, to name but a few. The growing de- mand for this technology has led to a significant body of recent research addressing image retrieval problems ([11], [9], [5], [3], [10], [12], [7], [2], etc.). Image databases can be queried in several ways. Query- by-example (QBE), however, is by far the most widely sup- Permission to make digital or hard copies of all or part of this work for personal or classroom use is granted without fee provided that copies are not made or distributed for profit or commercial advantage and that copies bear this notice and the full citation on the first page. To copy otherwise, to republish, to post on servers or to redistribute to lists, requires prior specific permission and/or a fee. ACM SAC 2003 Melbourne, Florida, USA Copyright 2003 ACM 1-58113-624-2/03/03 ...$5.00. ported model in research prototypes and commercial prod- ucts. In this environment, users formulate a query by means of giving an example image selected from a pool of general image categories. Since this sample set is generally small, the expectation of finding a perfect example (i.e. the entire content is relevant) is low. As a result, query images typi- cally contain not only the objects of users’ interest, but also irrelevant image areas. We refer to the latter as noise in this paper. Many content-based image retrieval techniques have been developed to enhance robustness with respect to trans- lation, scaling, and changes in the viewing angle. However, problems with noise have been largely neglected. We address this outstanding issue by proposing a similarity model for noise-free queries. This new model enables the user to pre- cisely include only relevant objects in formulating a query. Queries so defined are called noise-free queries (NFQs). In the following, we review some of the existing image retrieval techniques and examine their ability to support NFQs. In a typical content-based image retrieval system, salient properties of database images are extracted and stored as feature vectors. During a retrieval process, the feature vector of the query image is computed and compared against those in the database. Typically, these feature vectors capture the color distribution (e.g., color histograms). Recent tech- niques also include other features such as texture [10], struc- ture [3], etc. to increase the overall effectiveness. A scheme, based on local matching, was proposed in [9]. This method utilizes a large number of overlapping square subimages of each image. A signature is computed for each such subim- age. The signatures of each image are mapped into points in the feature space, and clustered into subimage groups. For each subimage group, the centroid of the signature points is used as the group signature. Matching between two images is done by pair-wise comparison of their matching groups (i.e., having similar group signatures). This scheme minimizes the effect of global features on local matches. However, it cannot tell the difference between several scattered red bal- loons and a red car since the balloons and the car would have similar group signatures. To address this problem, Correl- ogram [5] can be used to capture finer details of the color distribution by incorporating both color and its spatial lay- out, so called spatial color indexing. Experimental results [5] indicate that Correlogram offers excellent performance for a wide range of images. It can handle both translation and scaling in the matching objects. It can also tolerate differ- ences in the background areas, or in the object appearance
-
Upload
independent -
Category
Documents
-
view
0 -
download
0
Transcript of Improving image retrieval effectiveness in query-by-example environment
Improving Image Retrieval Effectiveness inQuery-by-Example Environment
Khanh VuDepartment of Computer
ScienceOklahoma State University
Tulsa, OK 74106
Kien A. HuaDepartment of Computer
ScienceUniversity of Central Florida
Orlando, FL 32816-2362
Ning JiangDepartment of Computer
ScienceUniversity of Central Florida
Orlando, FL 32816-2362
ABSTRACTQuery-by-example is the most popular query model for to-day’s image retrieval systems. A typical query image con-tains not only relevant objects (e.g., Eiffel Tower), but alsoirrelevant image areas (e.g., the background). The latter,referred to as noise in this paper, has limited the effective-ness of existing image retrieval systems. We present herea similarity model for noise-free queries (NFQs), and inves-tigate indexing techniques for this new environment. Ourquery model is more expressive than the standard query-by-example. The user can draw a contour around a number ofobjects to specify spatial (relative distance) and scaling (rel-ative size) constraints among them, or use separate contoursto disassociate these objects. Our experimental results con-firm that traditional approaches, such as Local Color His-togram and Correlogram, suffer from noisy queries. In con-trast, our method can leverage NFQs to offer significantlybetter performance. This is achieved using only a fraction ofthe storage overhead required by the compared techniques.
KeywordsImage retrieval system, image query processing, reducingnoise, indexing
1. INTRODUCTIONThe popularity of digital images has spurred a demand for
robust content-based image retrieval systems. These sys-tems are needed in various application domains includingmedical imaging, digital libraries, geographic mapping, andelectronic commerce, to name but a few. The growing de-mand for this technology has led to a significant body ofrecent research addressing image retrieval problems ([11],[9], [5], [3], [10], [12], [7], [2], etc.).Image databases can be queried in several ways. Query-
by-example (QBE), however, is by far the most widely sup-
Permission to make digital or hard copies of all or part of this work forpersonal or classroom use is granted without fee provided that copies arenot made or distributed for profit or commercial advantage and that copiesbear this notice and the full citation on the first page. To copy otherwise, torepublish, to post on servers or to redistribute to lists, requires prior specificpermission and/or a fee.ACM SAC 2003 Melbourne, Florida, USACopyright 2003 ACM 1-58113-624-2/03/03 ...$5.00.
ported model in research prototypes and commercial prod-ucts. In this environment, users formulate a query by meansof giving an example image selected from a pool of generalimage categories. Since this sample set is generally small,the expectation of finding a perfect example (i.e. the entirecontent is relevant) is low. As a result, query images typi-cally contain not only the objects of users’ interest, but alsoirrelevant image areas. We refer to the latter as noise in thispaper. Many content-based image retrieval techniques havebeen developed to enhance robustness with respect to trans-lation, scaling, and changes in the viewing angle. However,problems with noise have been largely neglected. We addressthis outstanding issue by proposing a similarity model fornoise-free queries. This new model enables the user to pre-cisely include only relevant objects in formulating a query.Queries so defined are called noise-free queries (NFQs). Inthe following, we review some of the existing image retrievaltechniques and examine their ability to support NFQs.In a typical content-based image retrieval system, salient
properties of database images are extracted and stored asfeature vectors. During a retrieval process, the feature vectorof the query image is computed and compared against thosein the database. Typically, these feature vectors capturethe color distribution (e.g., color histograms). Recent tech-niques also include other features such as texture [10], struc-ture [3], etc. to increase the overall effectiveness. A scheme,based on local matching, was proposed in [9]. This methodutilizes a large number of overlapping square subimages ofeach image. A signature is computed for each such subim-age. The signatures of each image are mapped into points inthe feature space, and clustered into subimage groups. Foreach subimage group, the centroid of the signature points isused as the group signature. Matching between two images isdone by pair-wise comparison of their matching groups (i.e.,having similar group signatures). This scheme minimizesthe effect of global features on local matches. However, itcannot tell the difference between several scattered red bal-loons and a red car since the balloons and the car would havesimilar group signatures. To address this problem, Correl-ogram [5] can be used to capture finer details of the colordistribution by incorporating both color and its spatial lay-out, so called spatial color indexing. Experimental results [5]indicate that Correlogram offers excellent performance for awide range of images. It can handle both translation andscaling in the matching objects. It can also tolerate differ-ences in the background areas, or in the object appearance
due to small changes in the viewing angle. We refer to theaforementioned techniques as the whole-matching approachsince they extract features based on the entire image area,and tightly integrate them into feature vectors. Matchingmust be done on the entire image area, and noise exclusionis not possible.Image comparison can also be done by matching homoge-
neous image regions. This is referred to as the region-basedapproach (e.g., QBIC [11], VisualSeek [12], Netra [7], Blob-world [2].) This scheme segments each image into severalregions, and image matching is done by comparing the vi-sual features, such as average color, dominant colors, tex-ture, shape, size, etc., of these regions. While this approachhas several advantages, its effectiveness relies on the accu-racy of image segmentation techniques which are far fromreliable today. When image regions are incorrectly detected,their visual features are wrong and retrieval precision is af-fected. Today’s region-based systems also do not supportNFQs: users still submit the entire image area as a query.We note that matching arbitrary-shaped regions is not thesame as searching for images similar to an arbitrary-shapedquery. The former may contain noise.We observe that to support NFQs, users must be allowed
the freedom to exclude any irrelevant objects. Such NFQscan be supported in a region-based framework by matchingonly image regions falling within the query contours. Whilethis solution is straightforward, its performance is limited bythe reliability of the image segmentation techniques as dis-cussed above. In this paper, we address this class of queriesusing a recently proposed approach called SamMatch. Thecontribution of this paper is the design of a similarity modeland an indexing method to support NFQs. By insulatingthe similarity computation from the interference of noise,our experimental results indicate that retrieval effectivenesscan be improved significantly for a wide range of queries.We review the SamMatch environment, and present a sim-
ilarity model for NFQs in Section 2. Section 3 discusses ourindexing method. Section 4 introduces the query process-ing technique. Experimental study is discussed in Section 5.Concluding remarks are given in Section 6.
2. A SIMILARITY MODEL FOR NFQSIn this section, we first review the SamMatch environ-
ment. We then present the similarity measure for process-ing NFQs in this framework, and discuss the technique forhandling scaling in the matching objects.
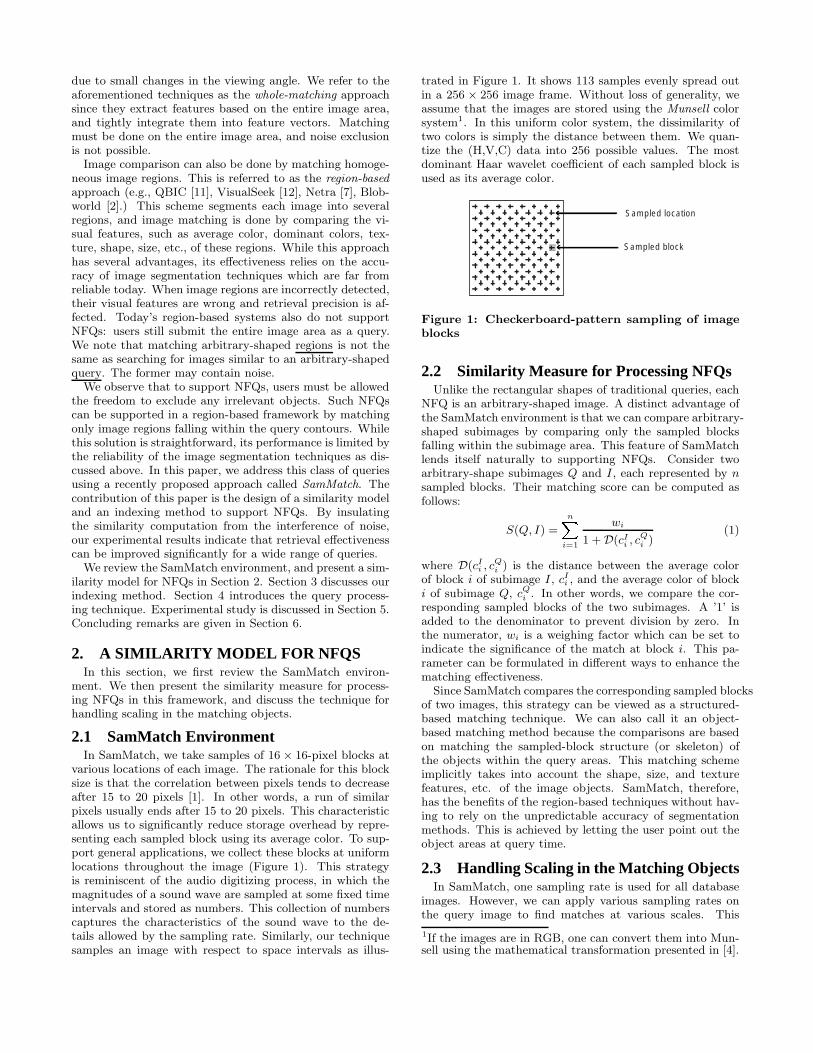
2.1 SamMatch EnvironmentIn SamMatch, we take samples of 16× 16-pixel blocks at
various locations of each image. The rationale for this blocksize is that the correlation between pixels tends to decreaseafter 15 to 20 pixels [1]. In other words, a run of similarpixels usually ends after 15 to 20 pixels. This characteristicallows us to significantly reduce storage overhead by repre-senting each sampled block using its average color. To sup-port general applications, we collect these blocks at uniformlocations throughout the image (Figure 1). This strategyis reminiscent of the audio digitizing process, in which themagnitudes of a sound wave are sampled at some fixed timeintervals and stored as numbers. This collection of numberscaptures the characteristics of the sound wave to the de-tails allowed by the sampling rate. Similarly, our techniquesamples an image with respect to space intervals as illus-
trated in Figure 1. It shows 113 samples evenly spread outin a 256 × 256 image frame. Without loss of generality, weassume that the images are stored using the Munsell colorsystem1. In this uniform color system, the dissimilarity oftwo colors is simply the distance between them. We quan-tize the (H,V,C) data into 256 possible values. The mostdominant Haar wavelet coefficient of each sampled block isused as its average color.
Sampled location
Sampled block
Figure 1: Checkerboard-pattern sampling of imageblocks
2.2 Similarity Measure for Processing NFQsUnlike the rectangular shapes of traditional queries, each
NFQ is an arbitrary-shaped image. A distinct advantage ofthe SamMatch environment is that we can compare arbitrary-shaped subimages by comparing only the sampled blocksfalling within the subimage area. This feature of SamMatchlends itself naturally to supporting NFQs. Consider twoarbitrary-shape subimages Q and I , each represented by nsampled blocks. Their matching score can be computed asfollows:
S(Q, I) =
nX
i=1
wi
1 +D(cIi , cQ
i )(1)
where D(cIi , cQ
i ) is the distance between the average colorof block i of subimage I , cI
i , and the average color of blocki of subimage Q, cQ
i . In other words, we compare the cor-responding sampled blocks of the two subimages. A ’1’ isadded to the denominator to prevent division by zero. Inthe numerator, wi is a weighing factor which can be set toindicate the significance of the match at block i. This pa-rameter can be formulated in different ways to enhance thematching effectiveness.Since SamMatch compares the corresponding sampled blocks
of two images, this strategy can be viewed as a structured-based matching technique. We can also call it an object-based matching method because the comparisons are basedon matching the sampled-block structure (or skeleton) ofthe objects within the query areas. This matching schemeimplicitly takes into account the shape, size, and texturefeatures, etc. of the image objects. SamMatch, therefore,has the benefits of the region-based techniques without hav-ing to rely on the unpredictable accuracy of segmentationmethods. This is achieved by letting the user point out theobject areas at query time.
2.3 Handling Scaling in the Matching ObjectsIn SamMatch, one sampling rate is used for all database
images. However, we can apply various sampling rates onthe query image to find matches at various scales. This
1If the images are in RGB, one can convert them into Mun-sell using the mathematical transformation presented in [4].
is illustrated in Figure 2. Figure 2(a) shows one databaseimage with its sampled blocks. In this example, the queryimage is assumed to be smaller in size, and is sampled atthree different rates as illustrated in Figures 2(b), 2(c), and2(d). We note that a lower sampling rate corresponds to alonger distance between the sampled blocks. By comparingthe blocks in Figure 2(b) with the corresponding blocks inthe database images, we can find images of similar but biggerobjects. Similarly, the blocks in Figure 2(c) are sampledat the same rate as that used for the database images tofind images of matching objects of similar size. Finally, thesampling rate shown in Figure 2(d) is used to find images ofsimilar, but smaller objects.
(a) (b) (c) (d)
Matching areas with the same number of sampled blocks
Figure 2: Handling scaling: One fixed sampling ratefor database images (a) and multiple sampling ratesfor the query (b, c, d)
To support matching at various practical scales, our sys-tem currently employs five different sampling rates for thequery images. This results in five different sampling con-figurations with 25, 41, 61, 85, and 113 sampled blocks,respectively. Although we can take advantage of additionalsampling rates, our experiments indicate that these five aresufficient to achieve excellent performance. We will addressthe translation in the matching objects in Section 3. We de-cide not to consider rotation invariance in this paper sincethis property is not always desirable, e.g., resulting in falseretrievals.
3. INDEXINGIn this section, we present implementation techniques for
the similarity model presented in Section 2. To facilitatesubimage matching at different scales, we slide five square-shape windows of various sizes over database images, andindex them on the subimages captured by these windows atsliding positions. We will refer to these subimages as in-dexing subimages. In the following two subsections, we firstdescribe signatures, and then discuss the index structure inmore detail.
3.1 Image SignaturesWe use sliding window of sizes 25, 41, 61, 85, and 113
sampled blocks, respectively. Thus, the smallest indexingsubimage covers only 25 sampled blocks at any sliding posi-tion. On the other hand, the largest indexing subimage cancontain all 113 sampled blocks of an image. In our design,a sliding step is the distance between two nearest samplingblocks in the sliding direction. The rationale for our windowsizes and the sliding step size is as follows:
1. Subimages containing fewer than 25 sampled blocksare not interesting for most image-retrieval purposes.
2. The contents of heavily overlapping subimages are es-sentially similar. It is not necessary to consider square-
shape subimages less than one sliding step from theindexing subimages.
In other words, the subimages used in our design practicallyrepresent all ”possible” subimages of the database image.There are 41, 25, 13, 5 and 1 indexing subimages of sizes
25, 41, 61, 85, and 113 sampled blocks, respectively. In total,each database image contains 85 indexing subimages. Foreach indexing subimage, we compute its signature as sevenstatistical average-variance pairs as follows:
• the first pair is computed from the average colors ofall the sampled blocks in the indexing subimage (Fig-ure 3(a));
• each of the next four pairs is computed from the aver-age colors of the sampled blocks in a distinct quadrantof the indexing subimage (Figure 3(b));
• finally, each of the last two pairs is computed from theaverage colors of the sampled blocks along one of thetwo diagonals of the indexing subimage (Figure 3(c)).
We use as many as 14 features because R∗-tree has beenshown to perform well up to 16 dimensions [6]. These average-variance pairs are designed to capture the various local char-acteristics of the indexing subimage. For each pair, the aver-age is the mean of the average colors of the relevant sampledblocks; and the variance is the statistical variance of theseaverage colors. Using average-variance pairs has the follow-ing advantage. Those computed from heavily overlappingindexing subimages are similar although their Haar waveletcoefficients may be quite different.
An indexing subimage
(a) (b) (c)
Figure 3: The seven areas used to compute the sig-nature of an indexing subimage.
3.2 Clustering and IndexingThe introduction of the signatures is to support our initial
search procedure as follows. Given an arbitrary-shape im-age as the query, we can identify its core area as the largestsquare subimage that contains a noise level (i.e., irrelevantarea) no greater than a predetermined limit (the core areaand an efficient detection algorithm are discussed in detailin [13]). Once this core area has been determined, we cancompute its signature, and use it to find similar indexingsubimages in the database. This initial search step can lever-age an index structure such as an R∗-tree to quickly filterout those database images that have no chance of matchingthe query image. Only those database images with at leastone matching indexing subimage need to participate in themore thorough test of comparing the corresponding sam-pled blocks. We will discuss the image retrieval procedurein more detail in the next section.

Although we can index the database images on their 85signatures, such an access structure would be a monolith.To substantially reduce the size of the index, we map the85 signatures of each image into signature points in the 14-dimensional feature space, and cluster them into m minimalbounding rectangles (MBRs). In other words, each databaseimage is represented by its m MBRs; and we index thedatabase on these MBRs. This strategy significantly re-duces the height of the R∗-tree. We will examine this issuein more detail when we discuss the experimental results inSection 5.We note that our sliding windows are not used in the
same way as in the Walrus technique [9]. The latter slideswindows over the image area to discover regions of similarcharacteristics, whereas we use sliding windows of differentsizes to capture the various possible subimages for the pur-pose of indexing.
4. IMAGE RETRIEVAL PROCEDUREIn this section, we first present our query model, and then
discuss the implementation technique using the index struc-ture presented in the last section.
4.1 Query FormulationWe recall that SamMatch is capable of matching arbitrary-
shaped subimages. This feature enables us to support noise-free queries as follows. To express a query, the user firstselects a suitable image from the collection of image cate-gories. A contour is then drawn as precisely as desired tospecify the relevant objects in the selected image. An ex-ample is illustrated in Figure 4(a). It shows a query for aperson about to enter a car. This query is represented inter-nally by the sampled blocks falling within the contour. Weobserve that this query is essentially noise free since irrele-vant parts of the image, such as the trees and clouds, haveno effect on the outcome of the retrieval.Other unique benefits of this query model are as follows. A
query contour imposes spatial (relative distances) and scal-ing (relative sizes) constraints on the enclosed objects. Forinstance, the NFQ in Figure 4(a) implies the following se-mantic constraints:
• Spatial Constraint: The person must be close to thedriver’s side of the car.
• Scaling Constraint: The car must be about five timesthe size of the person.
Enforcing scaling constraints is not the same as handlingscaling in existing methods. The intent of the query in ourexample is to find images of a person about to enter a car.Such a query should not match an image having at the bot-tom a person standing on the street, and a billboard of acar in the upper right corner. Existing retrieval techniquescapable of tolerating translation and scaling of objects (e.g.,[9],[5]) would incorrectly return this image as a good match.In fact, they would retrieve any images having a person anda car, disregarding the intended constraints on the two ob-jects. If disassociating the query objects is desired, Sam-Match allows the user to use a separate contour for eachobject. Thus, our query model is more expressive than con-ventional whole-image matching model.Some degree of flexibility in formulating queries can also
be achieved by treating each database image as a collection
of non-overlapping subimages, each having its own color his-togram [8]. For a given query, any combination of the localhistograms can be selected for matching the database im-ages with the query image. We refer to these techniques asthe Local Color Histogram (LCH) approach. Although theyprovide a means to exclude some degree of noise, severaldrawbacks remain:
• The storage overhead is very high compared to Sam-Match. For instance, the storage cost for only onelocal color histogram is about the same as the storageoverhead for the SamMatch approach. We will discussthis issue in more detail in Section 5.
• This approach is not noise free since each rectangularsubimage is large and can contain substantial noise.
• It is not clear how to handle matching at differentscales when the objects span multiple subimages.
We will show experimental results to compare SamMatchand LCH in Section 6.
4.2 Query ProcessingAs we have discussed previously, the query image is sam-
pled at five different rates to support matching at five differ-ent scales. The execution of a query involves the followingsteps:
• Search Preparation:
1. We apply five different sampling rates to the queryimage to create five different versions of the NFQ,each designed to compare against subimages of apredetermined size.
2. We determine the core area of the NFQ ( see [13]for an efficient core-area detection algorithm). Wecompute the signature of this core area using thesame technique used for the indexing subimages(discussed in Section 3). Any one of the queryversions can be used in this computation to giveessentially similar signatures due to the propertyof the Haar wavelet coefficients. This step is il-lustrated in Figure 4(b).
• Initial Search: We use a tiny hyperrectangle centeredat the signature point of the core area as the search keyto find all relevant MBRs using the R∗-tree. This stepis illustrated in Figure 4(c). The result is a collection ofcandidate subimages enclosed in the qualified MBRs.
• Detailed Matching: For each candidate subimage, wecompare it against the version of NFQ having the samenumber of sampled blocks. This is done by comparingthe average colors of the corresponding sampled blocksfalling within the query contour. Equation (1) is usedto compute the matching score. This step is illustratedin Figure 4(d). If the matching score is higher thana predefined threshold, the database image containingthe matching indexing subimage is returned as a queryresult. This step is illustrated in Figure 4(e).
• Ranking: We rank the returned images according totheir matching score.

(a) (b) (c) (d) (e)
Figure 4: Query Processing
We note that a tiny hyperrectangle, centered at the signa-ture point of the core area, is used as the search key in theInitial Search step since the R∗-tree supports range queries.For convenience, we refer to this hyperrectangle as the queryrectangle, and the signature point of the core area as thequery point. In practice, the query rectangle is adjusted tocontrol the size of the returned set in the initial search.A requirement of the proposed query processing technique
is that the core area must not be smaller than the smallestindexing subimage. This should not be deemed as a limita-tion of the SamMatch approach since we can always employhigher sampling rates to support core areas as small as de-sired. This can be accomplished without incurring more in-dexing overhead since we index the database on the MBRs,not individual subimages. Alternatively, we can also usenon-square sliding windows for specialized applications. Forinstance, long rectangular windows can better support ap-plications with many slim query objects.
5. EXPERIMENTAL STUDYTo assess the benefits of the extended SamMatch (SM)
approach, we did experiments to compare it with Local ColorHistogram (LCH) [8] and Correlogram [5]. The rationales forusing these two schemes in our study are as follows:
• Local color histograms were used in [8] to allow theuser to compose query images using subimages frommultiple image sources. We adapt this scheme for ourstudy as follows. Since subimages are treated indepen-dently with their own color histogram, one can easilyexclude irrelevant subimages in a query. Since there isno other practical technique for NFQs, we use LCH asa reasonable approach to assess the effectiveness andefficiency of SamMatch.
• Correlogram was also selected for this study becauseit has been shown to provide excellent results [5] whenthe entire image area is relevant. This scheme is usedto verify that SamMatch support NFQs not at the ex-pense of whole-image matching.
In addition to comparing SamMatch with the above meth-ods, we performed additional experiments to study the al-ternative implementation techniques for SamMatch.We executed more than 100 NFQs of various characteris-
tics to compare the robustness of the three image retrievaltechniques. These NFQs contain diverse objects, such asroses, birds, airplanes, balloons, buildings, skies, sand, stat-ues, food. The test queries can be classified into three groupsas follows:
• Type 1 (30 queries): The query image, from which wedefine the NFQ, has the same size as those images inthe database. Furthermore, the NFQ is small coveringonly a small region of the query image.
• Type 2 (20 queries): The query image has the samesize as those in the database. However, the NFQ isrelatively large covering almost the entire query image.
• Type 3 (more than 50 queries): The query image issmaller or larger than the size of the database images.The corresponding NFQ can be small or large.
We note that Type 3 was included in our study to capturethe fact that images are typically not uniform in size. Itis unrealistic and restrictive to assume that the sizes of thequery images and those of the database images are alwaysthe same. We present and discuss the experimental resultsin the following subsections.
5.1 Comparative StudiesWe describe our performance metric as follows. Let A1,
A2, . . ., Aq denote the q relevant images in response to aquery Q. The recall R is defined for a scope S, S > 0, as:
R/S =|{Ai|rank(Ai) ≤ S}|
q
This measure indicates the percentage of the returned im-ages ranked within the specified scope. For instance, if aquery returns 30 out of a total of 40 relevant images in somescope S, then its R/S is computed as 30/40 or 0.75. Therationale for this metric is that the retrieved images that fallfar behind in the rankings often do not make it to the user.This metric was first used in [5]. An important benefit ofthis approach is that we do not need to use a threshold inthe image retrieval procedure. Instead, for each query werequest the system to retrieve the S highest-ranked images.To compute R/S, we need to know the relevant images inthe database. This was done manually in our study as fol-lows. We used a commercial image database, called Art Ex-plosion, available from Nova Development. This databaseis organized as a hierarchy of subfolders according to theimage categories. We added a few images of our own inorder to test specific features. In total, the test databasehas 15,808 images which is significantly larger than manydatabases used in recent studies [9],[5],[2],[10],[7]. For eachquery, we determine the relevant images by inspecting the500 highest-ranked images returned by each of the three im-age retrieval techniques, and those images in the relevantcategories according to the organization of the database. Intotal, we inspect about 1,200 images for each test query.

5.1.1 Performance under Type-1 QueriesIn this study, we compare the three techniques in process-
ing NFQs that cover some small area of the query image.An example of these NFQs is shown in Figure 5. The R/Saverages observed in this experiment are presented in Fig-ure 7(a). It shows that SamMatch offers 40% improvementover Correlogram. Although LCH also shows some improve-ment, it is not as good as SamMatch which allowed us tomore precisely exclude noise from the query.
5.1.2 Performance under Type-2 QueriesIn this experiment, the objects of interest cover almost the
entire area of the query image. Two such NFQ examples andtheir similar database images are shown in Figures 6(a) and6(b). The results of this study are plotted in Figure 7(b).We see that LCH actually performs much worse than Cor-relogram under these queries. This indicates that we can-not handle NFQs by simply partitioning images into theirsubimages as in LCH. In contrast, SamMatch continues tooffer the best performance under this category. We also ob-serve in Figure 6(b) that both SamMatch and Correlogramcan detect objects viewed from different angles. This can beattributed to the fact that these schemes are much betterthan LCH in capturing the spatial layout of the colors.
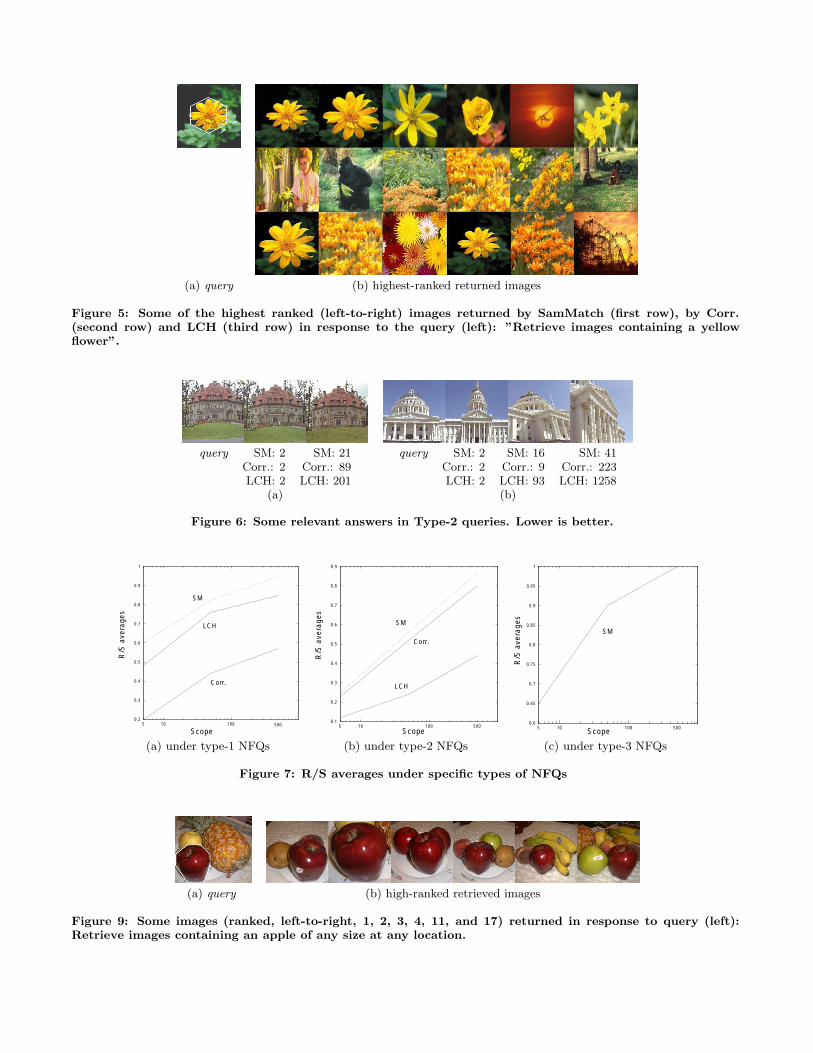
5.1.3 Performance under Type-3 QueriesAs we have discussed, this class of queries represents many
practical applications, in which database and query imagesdo not have the same size. We observe that LCH cannotsupport such queries. An example is illustrated in Figure 8showing that there is no easy way to match the two iden-tical apples using LCH. Similarly, we cannot perform suchcomparisons under Correlogram. Due to these limitations,we investigated only SamMatch in this experiment.
(a) query (b) database image
Figure 8: A difficult match using LCH
The experimental results are presented in Figure 7(c).They indicate that SamMatch is highly effective. We showtwo examples in Figures 9 and 10 to illustrate the qualityof this technique. They demonstrate that SamMatch is ro-bust to scaling and translation of the objects. The objectsin the retrieved images have different sizes and are found atdifferent locations. Furthermore, the large amount of irrel-evant content (occupying as much as 75%) of the databaseimages does not affect their ranking. Interestingly, the tworightmost images in Figure 10 are ranked very low. Thisis because the person and the car in this image do not sat-isfy the spatial and scaling constraints imposed in the query.Since we are looking for images of a person about to enter acar, these two images should not be considered as very rel-evant. On the other hand, the 11th and 17th ranking of therightmost images in Figure 9 appear to be low. This is dueto the misalignment of the apple and the sliding windows in
the region. Such problems can be easily addressed by usingmore window sizes and smaller sliding steps. We feel thatthe current configuration is sufficient for most applications.
5.1.4 Space RequirementIn this study, we compare the three image retrieval tech-
niques in terms of storage overhead. Since quick-and-dirtyfiltering and indexing were not used for Correlogram in [5]and LCH in [8], we assume that index is not used in all threetechniques in this study. Thus, the storage overhead re-ported in this subsection is due to the feature vectors alone.In our performance studies, the size of each image is 256×
256 pixels, and there are 256 possible colors. We can com-pute the space requirement for the feature vector of eachtechnique as follows:
• There are three levels of image partitioning in LCH[8]. Each database image is partitioned into 1, 4, and16 equal-size non-overlapping subimages at levels 1, 2,and 3, respectively. Therefore, the required storagespace is (1 + 4 + 16)× 256× 2 = 10,752 bytes - ”256”represents the 256 possible colors; and ”2” to counteach color since up to 256 × 256 = 65,536 pixels canhave the same color.
• We use the distance set D = {1, 3, 5, 7} for Correlo-gram, as in [5]. The space requirement for its featurevector is 4× 256× 2 or 2048 bytes.
• For SamMatch, the space requirement is 113 bytes, onefor each sampled block.
In summary, LCH requires more than five times the stor-age overhead of Correlogram in order to achieve very lim-ited support for NFQs. On the other hand, SamMatch cantake full advantage of NFQs while using only 1/16 the spacerequired by Correlogram. These results indicate that ourapproach is more suitable for very large image databases.
5.2 Performance Issues Specific to SamMatchIn this subsection, we investigate the effect of the num-
ber of clusters per image on the overall performance of thesystem (including the time to detect the core area).Building an index on individual subimages in the database
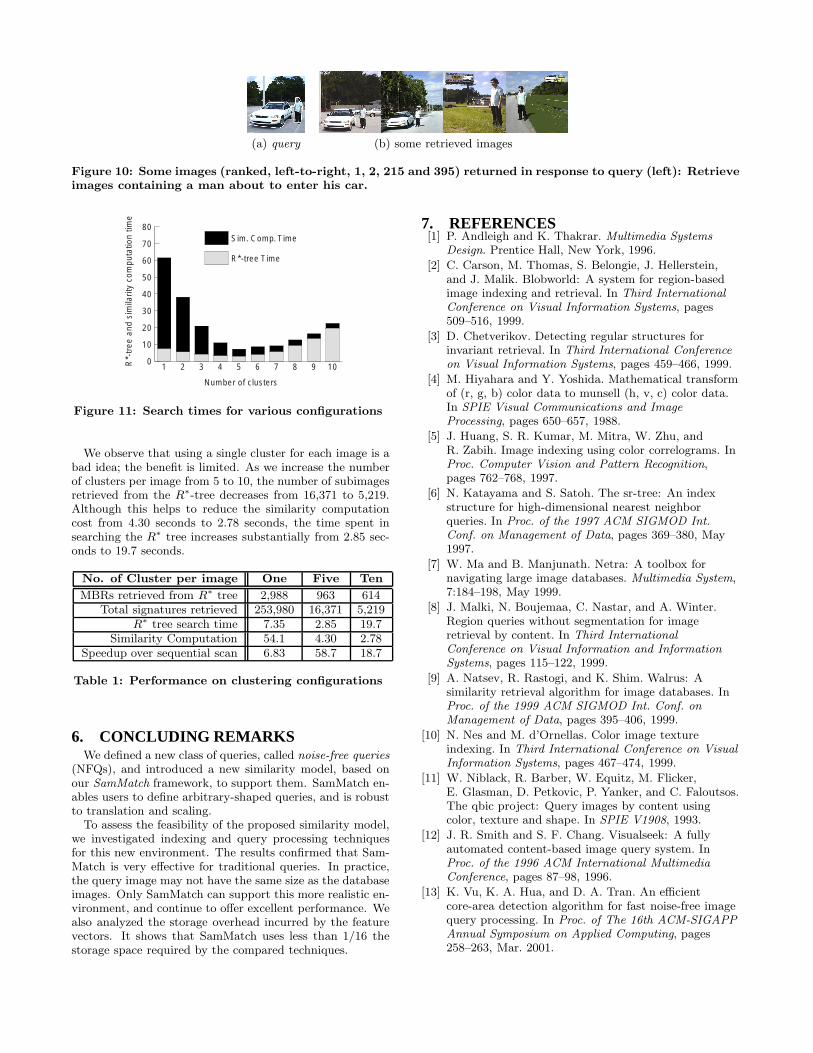
would result in a very deep R∗-tree. To reduce the timerequired to search through this access structure, we indexthe database on the MBRs, each represents a cluster ofsubimages in a given image. The tradeoff is that each qual-ified MBR must be searched sequentially to find the similarsubimages. The experimental results for different clusteringconfigurations, up to ten clusters, are shown in Figure 11.The light bar indicates the average time spent on searchingthe R∗-tree; and the dark bar represents the average timespent on searching within the qualified MBRs to find thesimilar indexing subimages. The sum of the two gives theaverage response time of the queries for the correspondingclustering configuration. The plot shows that the perfor-mance is significantly better when the number of clustersis from 4 to 7. This is a nice property since it allows usa lot of leeway to select a good number of clusters for agiven application. In practice, the database administratorcan tune this parameter, as in any database system, to en-sure the best performance. To get more insight, we providemore information on three of the clustering configurationsin Table 1.
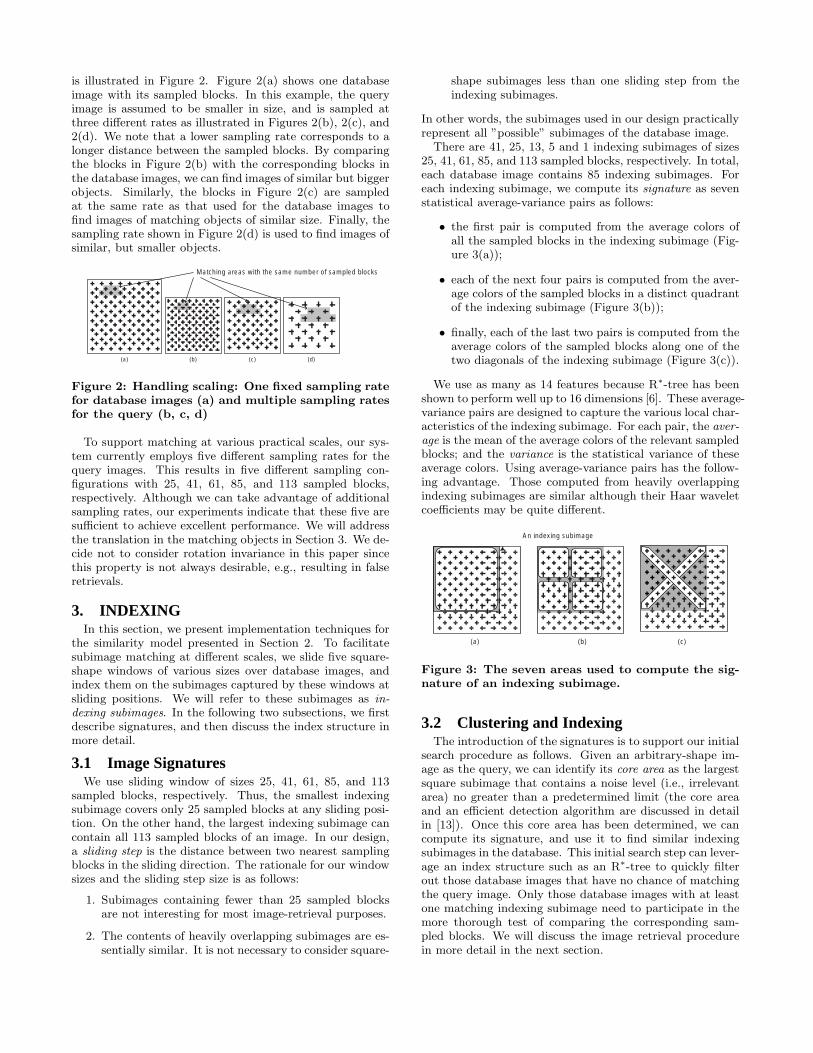
(a) query (b) highest-ranked returned images
Figure 5: Some of the highest ranked (left-to-right) images returned by SamMatch (first row), by Corr.(second row) and LCH (third row) in response to the query (left): ”Retrieve images containing a yellowflower”.
query SM: 2 SM: 21Corr.: 2 Corr.: 89LCH: 2 LCH: 201
query SM: 2 SM: 16 SM: 41Corr.: 2 Corr.: 9 Corr.: 223LCH: 2 LCH: 93 LCH: 1258
(a) (b)
Figure 6: Some relevant answers in Type-2 queries. Lower is better.
0.2
0.3
0.4
0.5
0.6
0.7
0.8
0.9
1
5 10 100
R/S
ave
rage
s
Scope
LCH
Corr.
SM
5000.1
0.2
0.3
0.4
0.5
0.6
0.7
0.8
0.9
5 10 100 500
R/S
ave
rage
s
Scope
LCH
Corr.
SM
0.6
0.65
0.7
0.75
0.8
0.85
0.9
0.95
1
5 10 100 500
R/S
ave
rage
s
Scope
SM
(a) under type-1 NFQs (b) under type-2 NFQs (c) under type-3 NFQs
Figure 7: R/S averages under specific types of NFQs
(a) query (b) high-ranked retrieved images
Figure 9: Some images (ranked, left-to-right, 1, 2, 3, 4, 11, and 17) returned in response to query (left):Retrieve images containing an apple of any size at any location.
(a) query (b) some retrieved images
Figure 10: Some images (ranked, left-to-right, 1, 2, 215 and 395) returned in response to query (left): Retrieveimages containing a man about to enter his car.
0
10
20
30
40
50
60
70
80Sim. Comp. Time
R*-tree Time
10987654321
Number of clusters
R*-
tree
and
sim
ilarit
y co
mpu
tatio
n tim
e
Figure 11: Search times for various configurations
We observe that using a single cluster for each image is abad idea; the benefit is limited. As we increase the numberof clusters per image from 5 to 10, the number of subimagesretrieved from the R∗-tree decreases from 16,371 to 5,219.Although this helps to reduce the similarity computationcost from 4.30 seconds to 2.78 seconds, the time spent insearching the R∗ tree increases substantially from 2.85 sec-onds to 19.7 seconds.
No. of Cluster per image One Five Ten
MBRs retrieved from R∗ tree 2,988 963 614Total signatures retrieved 253,980 16,371 5,219
R∗ tree search time 7.35 2.85 19.7Similarity Computation 54.1 4.30 2.78
Speedup over sequential scan 6.83 58.7 18.7
Table 1: Performance on clustering configurations
6. CONCLUDING REMARKSWe defined a new class of queries, called noise-free queries
(NFQs), and introduced a new similarity model, based onour SamMatch framework, to support them. SamMatch en-ables users to define arbitrary-shaped queries, and is robustto translation and scaling.To assess the feasibility of the proposed similarity model,
we investigated indexing and query processing techniquesfor this new environment. The results confirmed that Sam-Match is very effective for traditional queries. In practice,the query image may not have the same size as the databaseimages. Only SamMatch can support this more realistic en-vironment, and continue to offer excellent performance. Wealso analyzed the storage overhead incurred by the featurevectors. It shows that SamMatch uses less than 1/16 thestorage space required by the compared techniques.
7. REFERENCES[1] P. Andleigh and K. Thakrar. Multimedia Systems
Design. Prentice Hall, New York, 1996.
[2] C. Carson, M. Thomas, S. Belongie, J. Hellerstein,and J. Malik. Blobworld: A system for region-basedimage indexing and retrieval. In Third InternationalConference on Visual Information Systems, pages509–516, 1999.
[3] D. Chetverikov. Detecting regular structures forinvariant retrieval. In Third International Conferenceon Visual Information Systems, pages 459–466, 1999.
[4] M. Hiyahara and Y. Yoshida. Mathematical transformof (r, g, b) color data to munsell (h, v, c) color data.In SPIE Visual Communications and ImageProcessing, pages 650–657, 1988.
[5] J. Huang, S. R. Kumar, M. Mitra, W. Zhu, andR. Zabih. Image indexing using color correlograms. InProc. Computer Vision and Pattern Recognition,pages 762–768, 1997.
[6] N. Katayama and S. Satoh. The sr-tree: An indexstructure for high-dimensional nearest neighborqueries. In Proc. of the 1997 ACM SIGMOD Int.Conf. on Management of Data, pages 369–380, May1997.
[7] W. Ma and B. Manjunath. Netra: A toolbox fornavigating large image databases. Multimedia System,7:184–198, May 1999.
[8] J. Malki, N. Boujemaa, C. Nastar, and A. Winter.Region queries without segmentation for imageretrieval by content. In Third InternationalConference on Visual Information and InformationSystems, pages 115–122, 1999.
[9] A. Natsev, R. Rastogi, and K. Shim. Walrus: Asimilarity retrieval algorithm for image databases. InProc. of the 1999 ACM SIGMOD Int. Conf. onManagement of Data, pages 395–406, 1999.
[10] N. Nes and M. d’Ornellas. Color image textureindexing. In Third International Conference on VisualInformation Systems, pages 467–474, 1999.
[11] W. Niblack, R. Barber, W. Equitz, M. Flicker,E. Glasman, D. Petkovic, P. Yanker, and C. Faloutsos.The qbic project: Query images by content usingcolor, texture and shape. In SPIE V1908, 1993.
[12] J. R. Smith and S. F. Chang. Visualseek: A fullyautomated content-based image query system. InProc. of the 1996 ACM International MultimediaConference, pages 87–98, 1996.
[13] K. Vu, K. A. Hua, and D. A. Tran. An efficientcore-area detection algorithm for fast noise-free imagequery processing. In Proc. of The 16th ACM-SIGAPPAnnual Symposium on Applied Computing, pages258–263, Mar. 2001.