Improved Estimation of Finite-Population Mean Using SubSampling to Deal with Non Response in...
9
Columbia International Publishing Journal of Advanced Computing (2013) 1: 70-78 doi:10.7726/jac.2013.1006 Research Article ______________________________________________________________________________________________________________________________ *Corresponding e-mail: [email protected] 1 School of Studies in Statistics, Vikram University, Ujjain-456010, M.P., India 70 Improved Estimation of Finite Population Mean in Sample Surveys Ramkrishna S. Solanki 1* , Housila P. Singh 1 , and Surya Kant Pal 1 Received 1 May 2013; Published online 29 June 2013 © The author(s) 2013. Published with open access at www.uscip.org Abstract The present paper discusses the problem of estimating the finite population mean in simple random sampling. A class of estimators has been proposed using information on an auxiliary variable and its properties are studied. It has been shown that the proposed class of estimators is more efficient than the usual unbiased, ratio and product estimators. An empirical study has been carried out to examine the merits of the proposed class of estimators over others. Keywords: Ratio estimator; Product estimator; Bias; Mean square error; Simple random sampling. 1. Introduction It is well established in sample surveys that auxiliary information is often used to improve the precision of estimators of population parameters. It is well known that for estimating population mean Y of the study variable y using information on auxiliary variable x (say population mean X of x is known in advance) at the estimation stage, the ratio and product methods are extensively used [see Cochran (1977), Upadhyaya and Singh (1999), Singh and Ruiz-Espejo (2003), Singh (2003), Singh and Solanki (2011a, b, 2012a, b, 2013a, b), Solanki et al. (2013)]. The ratio method of estimation which has been developed by Cochran (1940) is used to estimate the population mean Y of the study variable y which is positively (high) correlated with an auxiliary variable x . For example (i) y may be the production of wheat and x is the area cultivated. (ii) y may denote the number of bullocks on a holding and x its area in acres. (iii) y may be the total production and x is the number of workers.
-
Upload
jammuuniversity -
Category
Documents
-
view
0 -
download
0
Transcript of Improved Estimation of Finite-Population Mean Using SubSampling to Deal with Non Response in...
Columbia International Publishing Journal of Advanced Computing (2013) 1: 70-78 doi:10.7726/jac.2013.1006
Research Article
______________________________________________________________________________________________________________________________ *Corresponding e-mail: [email protected] 1 School of Studies in Statistics, Vikram University, Ujjain-456010, M.P., India
70
Improved Estimation of Finite Population Mean in Sample Surveys
Ramkrishna S. Solanki1*, Housila P. Singh1, and Surya Kant Pal1
Received 1 May 2013; Published online 29 June 2013 © The author(s) 2013. Published with open access at www.uscip.org
Abstract The present paper discusses the problem of estimating the finite population mean in simple random sampling. A class of estimators has been proposed using information on an auxiliary variable and its properties are studied. It has been shown that the proposed class of estimators is more efficient than the usual unbiased, ratio and product estimators. An empirical study has been carried out to examine the merits of the proposed class of estimators over others. Keywords: Ratio estimator; Product estimator; Bias; Mean square error; Simple random sampling.
1. Introduction It is well established in sample surveys that auxiliary information is often used to improve the precision of estimators of population parameters. It is well known that for estimating population
mean Y of the study variable y using information on auxiliary variable x (say population mean X
of x is known in advance) at the estimation stage, the ratio and product methods are extensively used [see Cochran (1977), Upadhyaya and Singh (1999), Singh and Ruiz-Espejo (2003), Singh (2003), Singh and Solanki (2011a, b, 2012a, b, 2013a, b), Solanki et al. (2013)]. The ratio method of estimation which has been developed by Cochran (1940) is used to estimate
the population mean Y of the study variable y which is positively (high) correlated with an
auxiliary variable x . For example
(i) y may be the production of wheat and x is the area cultivated.
(ii) y may denote the number of bullocks on a holding and x its area in acres.
(iii) y may be the total production and x is the number of workers.
Ramkrishna S. Solanki, Housila P. Singh and Surya Kant Pal / Journal of Advanced Computing (2013) 1: 70-78
71
However, when auxiliary variable x is negatively correlated (high) with the study variable y the
product method of estimation envisaged by Robson (1957) and rediscovered by Murthy (1964) can be employed quite effectively. For example
(i) Price and demand of a commodity. (ii) The volume and pressure of a gas.
(iii) Sale of woolen cloth and temperature. Survey statisticians seem more inclined to use the ratio and product estimators due to their stronger intuitive appeal. Perhaps, this is why prevalent work has been done in the direction of improving the performance of these estimators. However, a large number of attempts have produced ratio and product-type estimators which are more efficient than the sample mean estimator and the ancestor ratio and product estimators. In this article we have proposed the class
of estimators of population meanY , which is more efficient than the usual unbiased, ratio and product estimators, by using known information on an auxiliary variable x . Numerical illustrations are also given to through light on the merits of the proposed study. Consider a finite population NUUUU ,...,, 21 of N identifiable units. Let y and x denote the
study variable and auxiliary variable taking values iy and ix respectively on the thi unit iU of the
population U and a sample of size )( Nn is drawn by simple random sampling without
replacement (SRSWOR) from the population U . Let ][1
1
n
i iyny and ][1
1
n
i ixnx denote the
sample mean of the study variable y and auxiliary variable x respectively.
The remaining part of the paper is organized as follows: Sec. 2 give a brief review of usual estimators of the population mean. In Sec. 3, the new class of estimator is described and the expressions of its asymptotic bias and the mean square error are obtained. Sec. 4 addresses the problem of efficiency comparisons, while in Sec. 5 we have optimized the proposed class. Sec. 6 has focused on empirical study of proposed study. Sec. 7 finished off the paper with final remarks.
2. The Traditional Estimators
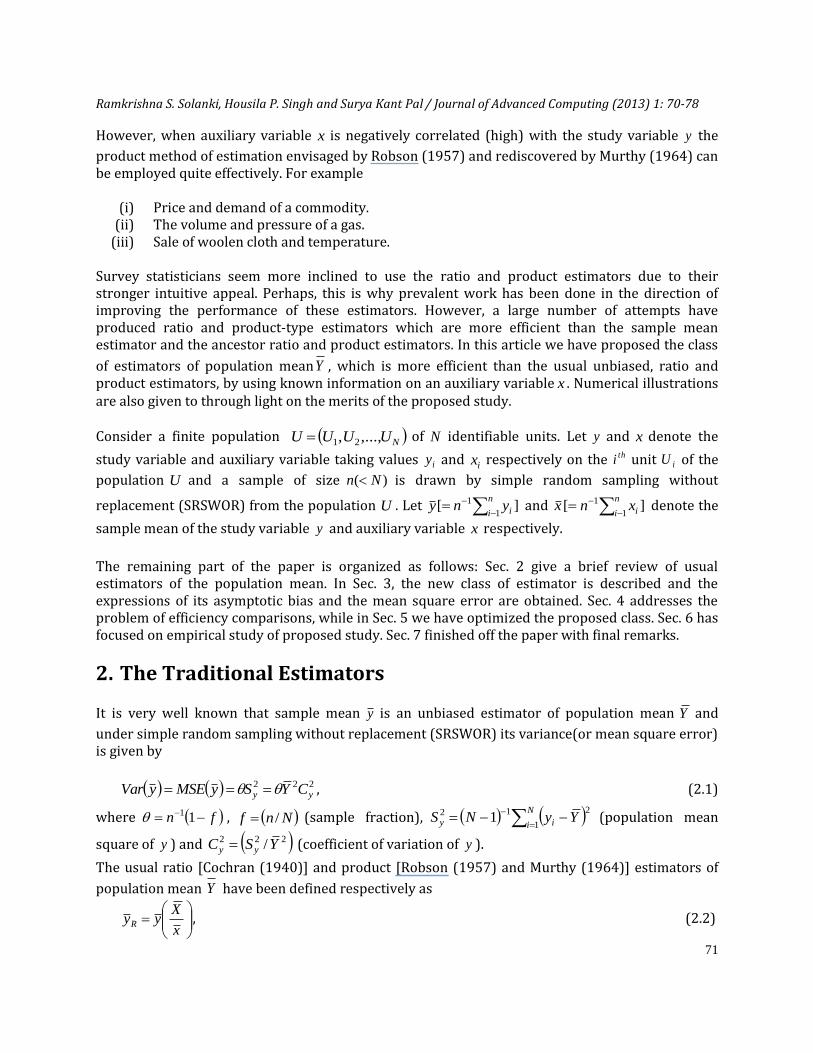
It is very well known that sample mean y is an unbiased estimator of population mean Y and
under simple random sampling without replacement (SRSWOR) its variance(or mean square error) is given by
222yy CYSyMSEyVar , (2.1)
where fn 11 , Nnf / (sample fraction),
N
i iy YyNS1
212 1 (population mean
square of y ) and 222 /YSC yy (coefficient of variation of y ).
The usual ratio [Cochran (1940)] and product [Robson (1957) and Murthy (1964)] estimators of
population mean Y have been defined respectively as
x
XyyR , (2.2)
Ramkrishna S. Solanki, Housila P. Singh and Surya Kant Pal / Journal of Advanced Computing (2013) 1: 70-78
72
X
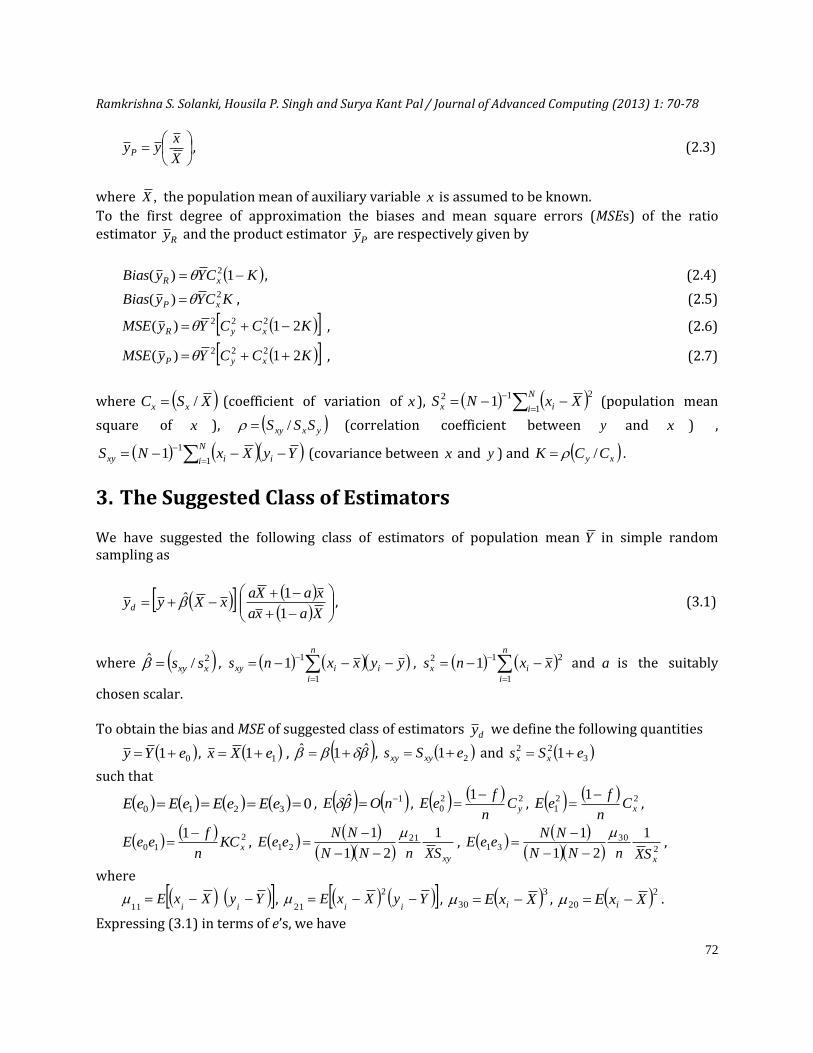
xyyP , (2.3)
where ,X the population mean of auxiliary variable x is assumed to be known.
To the first degree of approximation the biases and mean square errors (MSEs) of the ratio estimator Ry and the product estimator Py are respectively given by
KCYyBias xR 1)( 2 , (2.4)
KCYyBias xP2)( , (2.5)
KCCYyMSE xyR 21)( 222 , (2.6)
KCCYyMSE xyP 21)( 222 , (2.7)
where XSC xx / (coefficient of variation of x ),
N
i ix XxNS1
212 1 (population mean
square of x ), yxxy SSS / (correlation coefficient between y and x ) ,
N
i iixy YyXxNS1
11 (covariance between x and y ) and xy CCK / .
3. The Suggested Class of Estimators
We have suggested the following class of estimators of population mean Y in simple random sampling as
Xaxa
xaXaxXyyd
1
1̂ , (3.1)
where 2/ˆxxy ss ,
n
i
iixy yyxxns1
11 ,
n
i
ix xxns1
212 1 and a is the suitably
chosen scalar. To obtain the bias and MSE of suggested class of estimators dy we define the following quantities
01 eYy , 11 eXx , ˆ1ˆ , 21 eSs xyxy and 322 1 eSs xx
such that
03210 eEeEeEeE , 1ˆ nOE , 220
1yC
n
feE
, 22
1
1xC
n
feE
,
2
10
1xKC
n
feeE
,
xySXnNN
NNeeE
1
21
1 2121
,
2
3031
1
21
1
xSXnNN
NNeeE
,
where
YyXxEii
11 , YyXxE
ii
2
21 , 330 XxE i , 220 XxE i .
Expressing (3.1) in terms of e’s, we have
Ramkrishna S. Solanki, Housila P. Singh and Surya Kant Pal / Journal of Advanced Computing (2013) 1: 70-78
73
1
1131210 1111
aeeaeeeeKeYyd . (3.2)
We assume that 11 ae , so that 1
11
ae is expandable. Now expanding the right hand side of
(3.2) and neglecting the terms of e’s having power greater than two, we have
3121
2
110102121211 eeeeKeaaeeaeaey
d . (3.3)
or
3121
2
11010212121 eeeeKeaaeeaeaeYYy
d . (3.4)
Taking expectation on both sides of (3.4), we get the bias of proposed class of estimators dy , up to
first degree of approximation as
20
30
11
212
221
X
K
N
NCaaKYyBias xd . (3.5)
Squaring both sides of (3.4) and neglecting terms of e’s having power greater than two, we have
10
2
1
22
0
2221221 eeaeaeYYy
d . (3.6)
Taking expectation on both sides of (3.5), we get the MSE of proposed class of estimators dy , up to
first degree of approximation as
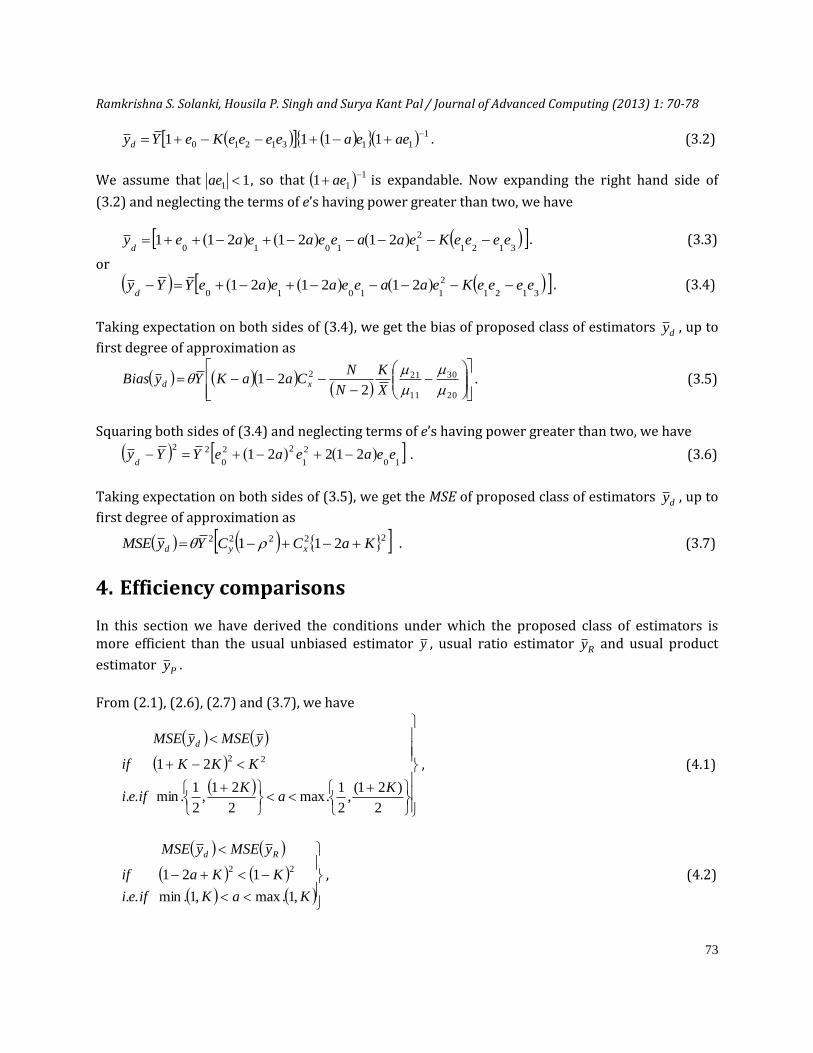
22222 211 KaCCYyMSE xyd . (3.7)
4. Efficiency comparisons In this section we have derived the conditions under which the proposed class of estimators is more efficient than the usual unbiased estimator y , usual ratio estimator Ry and usual product
estimator Py .
From (2.1), (2.6), (2.7) and (3.7), we have
2
)21(,
2
1.max
2
21,
2
1.min..
21 22
Ka
Kifei
KKKif
yMSEyMSE d
, (4.1)
KaKifei
KKaif
yMSEyMSE Rd
,1.max,1.min..
12122
, (4.2)
Ramkrishna S. Solanki, Housila P. Singh and Surya Kant Pal / Journal of Advanced Computing (2013) 1: 70-78
74
KaKifei
KKaif
yMSEyMSE Pd
1,0.max1,0.min..
12122 . (4.3)
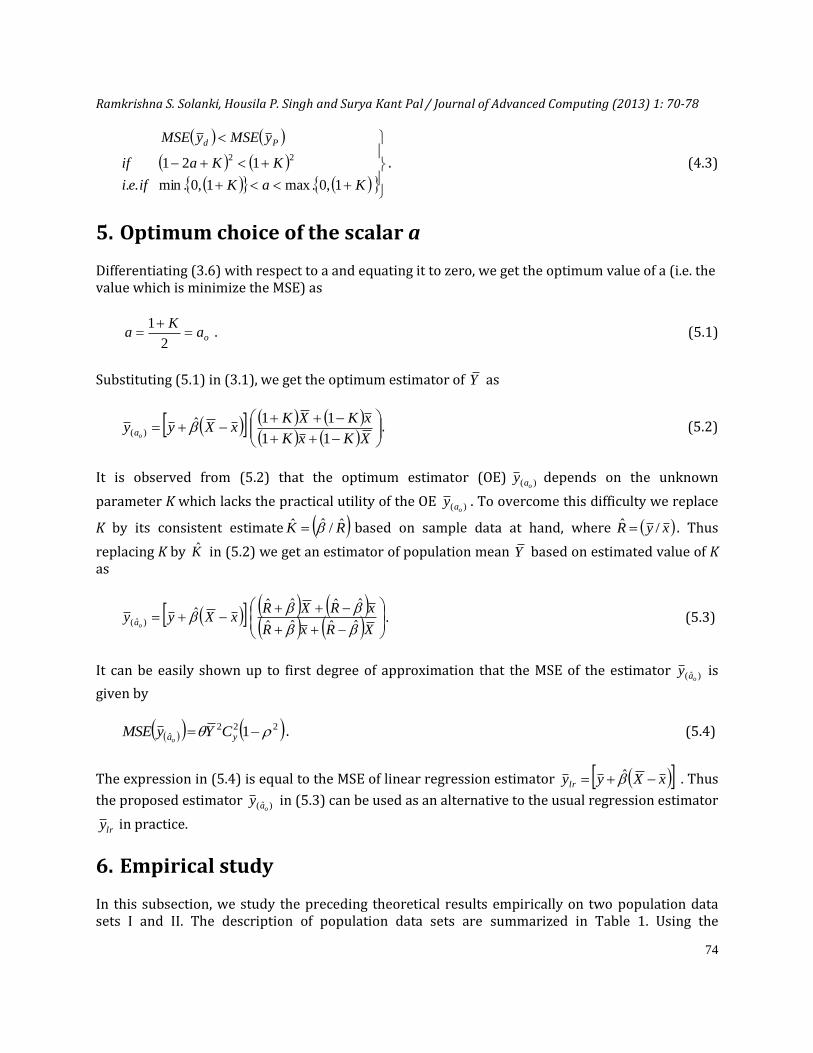
5. Optimum choice of the scalar a Differentiating (3.6) with respect to a and equating it to zero, we get the optimum value of a (i.e. the value which is minimize the MSE) as
oaK
a
2
1 . (5.1)
Substituting (5.1) in (3.1), we get the optimum estimator of Y as
XKxK
xKXKxXyy
oa11
11ˆ)( . (5.2)
It is observed from (5.2) that the optimum estimator (OE) )( oay depends on the unknown
parameter K which lacks the practical utility of the OE )( oay . To overcome this difficulty we replace
K by its consistent estimate RK ˆ/ˆˆ based on sample data at hand, where xyR /ˆ . Thus
replacing K by K̂ in (5.2) we get an estimator of population mean Y based on estimated value of K as
XRxR
xRXRxXyy
oa
ˆˆˆˆ
ˆˆˆˆˆ
)ˆ( . (5.3)
It can be easily shown up to first degree of approximation that the MSE of the estimator )ˆ( oay is
given by
222ˆ 1 ya CYyMSEo
. (5.4)
The expression in (5.4) is equal to the MSE of linear regression estimator xXyylr ̂ . Thus
the proposed estimator )ˆ( oay in (5.3) can be used as an alternative to the usual regression estimator
lry in practice.
6. Empirical study
In this subsection, we study the preceding theoretical results empirically on two population data sets I and II. The description of population data sets are summarized in Table 1. Using the
Ramkrishna S. Solanki, Housila P. Singh and Surya Kant Pal / Journal of Advanced Computing (2013) 1: 70-78
75
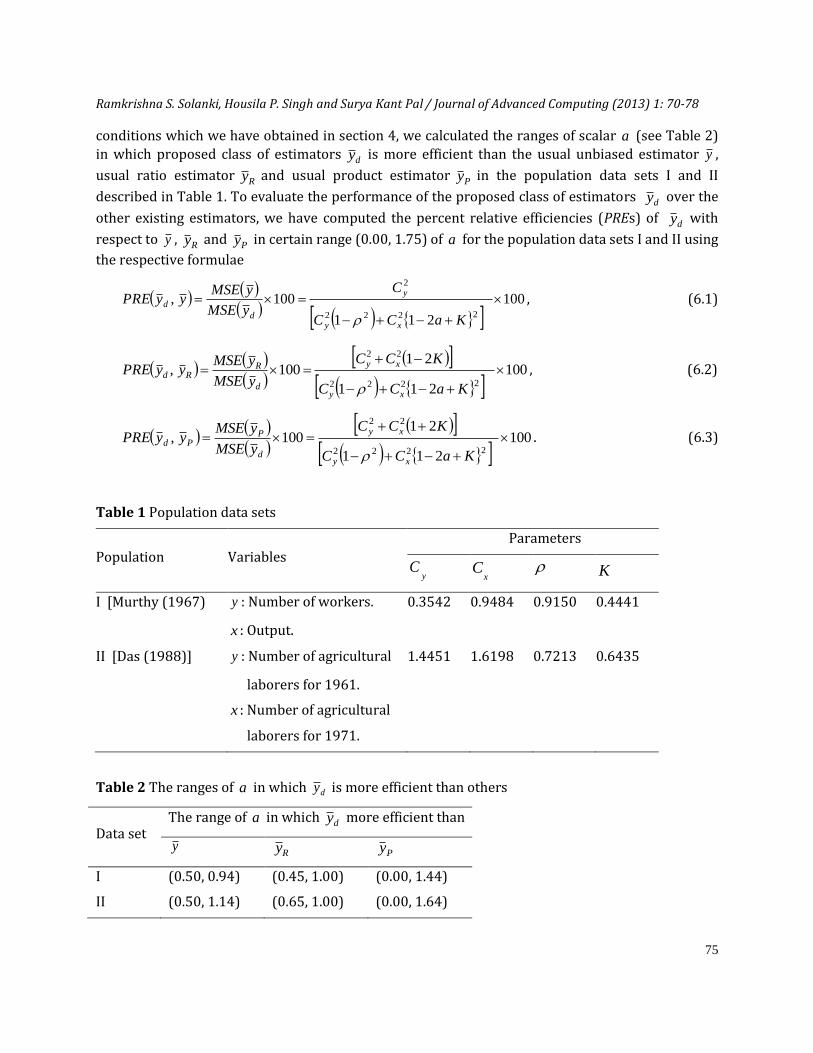
conditions which we have obtained in section 4, we calculated the ranges of scalar a (see Table 2)
in which proposed class of estimators dy is more efficient than the usual unbiased estimator y ,
usual ratio estimator Ry and usual product estimator Py in the population data sets I and II
described in Table 1. To evaluate the performance of the proposed class of estimators dy over the
other existing estimators, we have computed the percent relative efficiencies (PREs) of dy with
respect to y , Ry and Py in certain range (0.00, 1.75) of a for the population data sets I and II using
the respective formulae
100
211
100,2222
2
KaCC
C
yMSE
yMSEyyPRE
xy
y
d
d
, (6.1)
100
211
21100,
2222
22
KaCC
KCC
yMSE
yMSEyyPRE
xy
xy
d
RRd
, (6.2)
100
211
21100,
2222
22
KaCC
KCC
yMSE
yMSEyyPRE
xy
xy
d
PPd
. (6.3)
Table 1 Population data sets
Population Variables
Parameters
yC
xC
K
I [Murthy (1967) y : Number of workers.
x : Output.
0.3542 0.9484 0.9150 0.4441
II [Das (1988)] y : Number of agricultural
laborers for 1961.
x : Number of agricultural
laborers for 1971.
1.4451 1.6198 0.7213 0.6435
Table 2 The ranges of a in which dy is more efficient than others
Data set The range of a in which dy more efficient than
y Ry Py
I (0.50, 0.94) (0.45, 1.00) (0.00, 1.44)
II (0.50, 1.14) (0.65, 1.00) (0.00, 1.64)
Ramkrishna S. Solanki, Housila P. Singh and Surya Kant Pal / Journal of Advanced Computing (2013) 1: 70-78
76
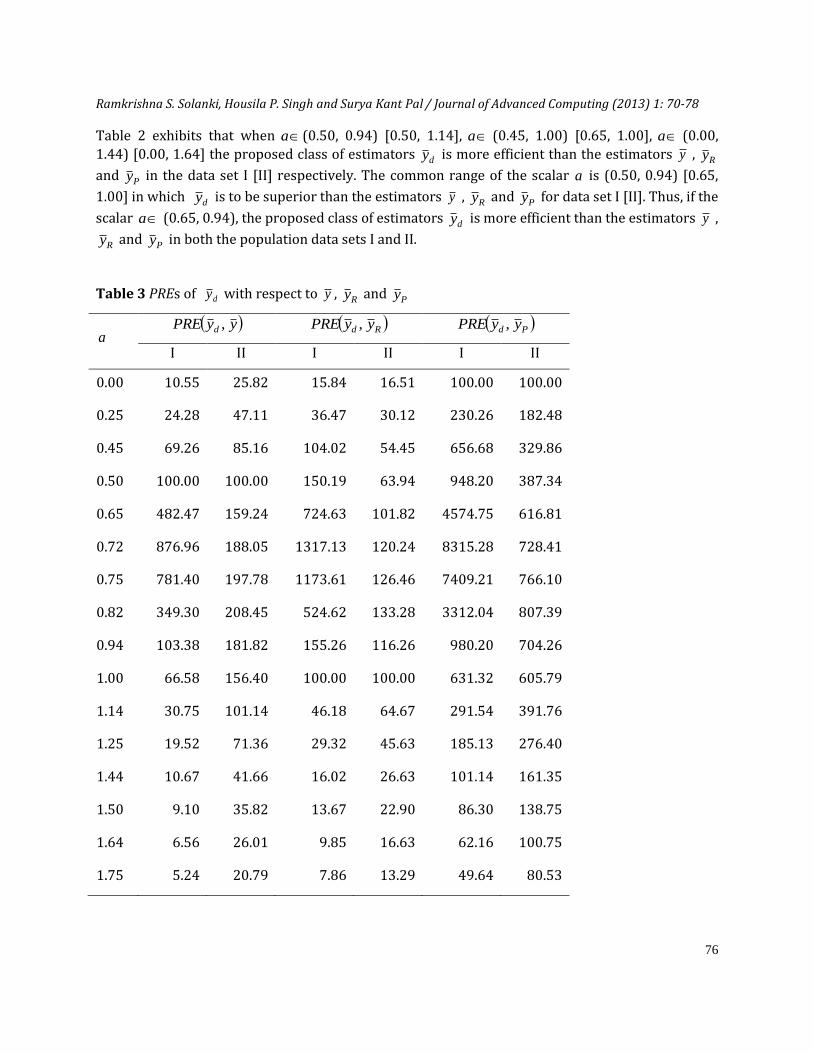
Table 2 exhibits that when a (0.50, 0.94) [0.50, 1.14], a (0.45, 1.00) [0.65, 1.00], a (0.00,
1.44) [0.00, 1.64] the proposed class of estimators dy is more efficient than the estimators y , Ry
and Py in the data set I [II] respectively. The common range of the scalar a is (0.50, 0.94) [0.65,
1.00] in which dy is to be superior than the estimators y , Ry and Py for data set I [II]. Thus, if the
scalar a (0.65, 0.94), the proposed class of estimators dy is more efficient than the estimators y ,
Ry and Py in both the population data sets I and II.
Table 3 PREs of dy with respect to y , Ry and Py
a yyPRE d , Rd yyPRE , Pd yyPRE ,
I II I II I II
0.00 10.55 25.82 15.84 16.51 100.00 100.00
0.25 24.28 47.11 36.47 30.12 230.26 182.48
0.45 69.26 85.16 104.02 54.45 656.68 329.86
0.50 100.00 100.00 150.19 63.94 948.20 387.34
0.65 482.47 159.24 724.63 101.82 4574.75 616.81
0.72 876.96 188.05 1317.13 120.24 8315.28 728.41
0.75 781.40 197.78 1173.61 126.46 7409.21 766.10
0.82 349.30 208.45 524.62 133.28 3312.04 807.39
0.94 103.38 181.82 155.26 116.26 980.20 704.26
1.00 66.58 156.40 100.00 100.00 631.32 605.79
1.14 30.75 101.14 46.18 64.67 291.54 391.76
1.25 19.52 71.36 29.32 45.63 185.13 276.40
1.44 10.67 41.66 16.02 26.63 101.14 161.35
1.50 9.10 35.82 13.67 22.90 86.30 138.75
1.64 6.56 26.01 9.85 16.63 62.16 100.75
1.75 5.24 20.79 7.86 13.29 49.64 80.53
Ramkrishna S. Solanki, Housila P. Singh and Surya Kant Pal / Journal of Advanced Computing (2013) 1: 70-78
77
It is observed from Table 3 that the performance of proposed class of estimators dy is better than
the estimators y , Ry and Py , if a lies between the corresponding range of the inferior estimators
which we have calculated in Table 2 for both the population data set I and II. Further it is observed from Table 3 that there is larger gain in efficiency by using the proposed class of estimators dy
over usual unbiased estimator y , usual ratio estimator Ry and usual product estimator Py in
certain range of a . The maximum gain in efficiency is seen at the optimum value 72.0oa (for
population data set I) and 82.0oa (for population data set II) of scalar a .
7. Conclusion In this article we have considered the problem of estimating the population mean of the study variable when the population mean of an auxiliary variable is known in simple random sampling without replacement (SRSWOR). The class of estimators has been proposed and the bias and mean square error expressions of the proposed class of estimators have been obtained up to first degree of approximation. The realistic conditions under which the proposed class of estimators is better than the usual unbiased, ordinary ratio and product estimators have been obtained. The estimator based on optimum values of the scalar has been obtained. It has been found theoretically as well as empirically that the proposed class of estimators is more efficient than the usual unbiased, ratio and product estimators. However this conclusion should not be extrapolated due to limited empirical study.
Acknowledgements The authors are thankful to the Editor-in-Chief of Journal of Advanced Computing for earlier draft of the article.
References Cochran, W.G., (1977). Sampling Techniques. 3rd ed., John Wiley and Sons, New York, USA. PMCid:1607049 Cochran, W.G., 1940. The estimation of the yields of cereal experiments by sampling for the ratio of grain to
total produce. Jour. Agri. Sci. 30, 262-275. http://dx.doi.org/10.1017/S0021859600048012 Das, A.K., (1988). Contributions to the theory of sampling strategies based on auxiliary information. Ph.D.
thesis submitted to B.C.K.V., Mohanpur, Nadia, West Bengal, India. Murthy, M.N., (1964). Product method of estimation. Sankhya A 26(1), 69-74. Murthy, M.N., (1967). Sampling: Theory and Methods. Statistical Publishing Society, Calcutta, India. Robson, D.S., (1957). Applications of multivariate polykays to the theory of unbiased ratio-type estimation.
Journal of American Statistical Association 52(280): 511-522. http://dx.doi.org/10.1080/01621459.1957.10501407 Singh, H.P., Ruiz-Espejo, M., (2003). On linear regression and ratio-product estimation of a finite population
mean. The Statistician 52(1), 59-67. http://dx.doi.org/10.1111/1467-9884.00341 Singh, H.P., Solanki, R.S., (2011a). A general procedure for estimating the population parameter in the
presence of random non-response. Pakistan Journal of Statistics 27(4), 427-465.

Ramkrishna S. Solanki, Housila P. Singh and Surya Kant Pal / Journal of Advanced Computing (2013) 1: 70-78
78
Singh, H.P., Solanki, R.S., (2011b). Generalized ratio and product methods of estimation in survey sampling. Pakistan Journal of Statistics and Operation Research 7(2), 245-264.
Singh, H.P., Solanki, R.S., (2012a). An efficient class of estimators for the population mean using auxiliary information in systematic sampling. Journal of Statistical Theory and Practice 6(2), 274–285.
http://dx.doi.org/10.1080/15598608.2012.673881 Singh, H.P., Solanki, R.S., (2012b). Improved estimation of population mean in simple random sampling using
information on auxiliary attribute. Applied Mathematics and Computation 218(15), 7798-7812. http://dx.doi.org/10.1016/j.amc.2012.01.047 Singh, H.P., Solanki, R.S., (2013a). A new procedure for variance estimation in simple random sampling using
auxiliary information. Statistical Papers 54(2), 479-457. http://dx.doi.org/10.1007/s00362-012-0445-2 Singh, H.P., Solanki, R.S., (2013b). An efficient class of estimators for the population mean using auxiliary
information. Communications in Statistics-Theory & Methods 42(1), 145-163. http://dx.doi.org/10.1080/03610926.2011.575519 Solanki, R.S., Singh, H.P., Rathour, A., (2012). An alternative estimator for estimating the finite population
mean using auxiliary information in sample surveys. ISRN Probability and Statistics, DOI 10.5402/2012/657682.
http://dx.doi.org/10.5402/2012/657682 Upadhyaya, L.N., Singh, H.P., (1999). Use of transformed auxiliary variable in estimating the finite population
mean. Biometrical Journal 41(5), 627-636. http://dx.doi.org/10.1002/(SICI)1521-4036(199909)41:5<627::AID-BIMJ627>3.0.CO;2-W