Implications of restructuring in the banking industry: the case ...
23
Implications of restructuring in the banking industry: the case of Spain Ignacio Fuentes and Teresa Sastre Since the late eighties, Spanish bank markets have been undergoing major changes that have affected both their structure and the nature of strategic interaction among Spanish banks. These changes have been a natural outcome of the heightening competitive pressure exerted on all countries' banks by processes such as deregulation, globalisation of financial and economic activities, the development of new technology and the prospects of greater integration of European financial markets. The main purpose of this paper is to assess the implications of two significant phenomena which have affected the structure of the Spanish banking industry in the nineties: the process of consolidation via mergers and acquisitions and the growing competition in prices, which has been particularly intense in certain market segments. It is widely recognised that this last event has had a strong influence on banks' decisions on interest rates and thus affected the monetary transmission mechanism. However, there are few empirical studies on the effects of competition on banks' interest rates. That might be partly due to difficulties in defining variables that could be used to measure the degree of competition. This task is undertaken in this paper by using the cross-section dispersion of bank interest rates as an indicator of competition in the sector. The paper also pays attention to the consolidation process that has taken place among Spanish banking firms since the prospect of a more integrated European market was made explicit. The paper assesses the impact of mergers on bank interest rates and on the efficiency, profitability and soundness of the institutions involved in the process. The paper is organised as follows. Section 1 outlines the most relevant events that have affected the structure and activity of the Spanish banking sector. Section 2 addresses issues related to the consolidation process and the increase in price competition. This section is itself divided in two parts. The first part analyses the effects of consolidation and competition on bank interest rates and the transmission mechanism. The second part widens the range of variables to be analysed by also considering bank efficiency, profitability and solvency. 1. Recent major developments in the Spanish banking sector The liberalisation and opening up of the Spanish financial system, begun in the previous decade and to be completed with the incorporation into EMU in the coming months, has brought about major changes in banks' operating environment. Such changes have affected both the structure of their business and their profit-generating capacity. 1.1 Dismtermediation One of the consequences of this process has been the substantial widening of the range of financial instruments available to investors. The development of secondary markets and the growing role of financial intermediaries other than banks has set in train a process of disintermediation which is shifting a significant portion of the financial intermediation business towards non-bank institutions. As can be seen in Table 1, which shows changes in the structure of the financial assets of the non- financial firms and households sector, the share accounted for by deposits in credit institutions has progressively fallen in recent years, while that of other instruments such as variable-yield securities, 98
-
Upload
khangminh22 -
Category
Documents
-
view
0 -
download
0
Transcript of Implications of restructuring in the banking industry: the case ...
Implications of restructuring in the banking industry: the case of Spain
Ignacio Fuentes and Teresa Sastre
Since the late eighties, Spanish bank markets have been undergoing major changes that have affected both their structure and the nature of strategic interaction among Spanish banks. These changes have been a natural outcome of the heightening competitive pressure exerted on all countries' banks by processes such as deregulation, globalisation of financial and economic activities, the development of new technology and the prospects of greater integration of European financial markets.
The main purpose of this paper is to assess the implications of two significant phenomena which have affected the structure of the Spanish banking industry in the nineties: the process of consolidation via mergers and acquisitions and the growing competition in prices, which has been particularly intense in certain market segments. It is widely recognised that this last event has had a strong influence on banks' decisions on interest rates and thus affected the monetary transmission mechanism. However, there are few empirical studies on the effects of competition on banks' interest rates. That might be partly due to difficulties in defining variables that could be used to measure the degree of competition. This task is undertaken in this paper by using the cross-section dispersion of bank interest rates as an indicator of competition in the sector.
The paper also pays attention to the consolidation process that has taken place among Spanish banking firms since the prospect of a more integrated European market was made explicit. The paper assesses the impact of mergers on bank interest rates and on the efficiency, profitability and soundness of the institutions involved in the process.
The paper is organised as follows. Section 1 outlines the most relevant events that have affected the structure and activity of the Spanish banking sector. Section 2 addresses issues related to the consolidation process and the increase in price competition. This section is itself divided in two parts. The first part analyses the effects of consolidation and competition on bank interest rates and the transmission mechanism. The second part widens the range of variables to be analysed by also considering bank efficiency, profitability and solvency.
1. Recent major developments in the Spanish banking sector
The liberalisation and opening up of the Spanish financial system, begun in the previous decade and to be completed with the incorporation into EMU in the coming months, has brought about major changes in banks' operating environment. Such changes have affected both the structure of their business and their profit-generating capacity.
1.1 Dismtermediation
One of the consequences of this process has been the substantial widening of the range of financial instruments available to investors. The development of secondary markets and the growing role of financial intermediaries other than banks has set in train a process of disintermediation which is shifting a significant portion of the financial intermediation business towards non-bank institutions.
As can be seen in Table 1, which shows changes in the structure of the financial assets of the non-financial firms and households sector, the share accounted for by deposits in credit institutions has progressively fallen in recent years, while that of other instruments such as variable-yield securities,
98
especially participations in mutual funds and, to a lesser extent, in products handled by insurance companies, such as pension funds and life assurance has increased.
Table 1 Financial assets of non-financial corporate and quasi-corporate enterprises and households*
1990 1991 1992 1993 1994 1995 1996 1997 Credit institutions deposits 64.4 63.7 60.5 57.7 57.1 56.1 50.1 43.4 Other deposits 2.3 2.3 3.0 3.3 3.7 4.2 4.2 4.7 Short-term securities and bonds 7.7 6.3 6.4 4.0 3.4 3.8 2.9 2.3 Shares and other equities 16.6 14.5 13.6 14.6 14.3 14.0 16.9 20.6 Mutual funds shares 1.5 4.8 7.4 10.7 11.0 10.9 14.4 17.7 Insurance technical reserves 7.5 8.4 9.2 9.6 10.5 11.1 11.4 11.4 Total 100.0 100.0 100.0 100.0 100.0 100.0 100.0 100.0 * Financial assets exclude loans and others. Source: BE.
This shift has been especially significant in recent years, and there was even a decline in the absolute amount of fixed-term bank deposits in 1997 of more than Pta 2 trillion. Nonetheless, the impact of this disintermediation on banks is actually rather small, since more than 90% of the net asset value of mutual funds is managed by subsidiaries of the banking groups themselves (see Table 2). Accordingly, the income obtained on the management commissions charged by these companies would be part of the consolidated group's income. In 1997, estimated commission income obtained by management companies belonging to banking groups was almost 0.23% of the banking system's average total assets, i.e. almost 10% of net interest income. In 1998, with data to June, the related result would be revenue equivalent to 0.28% of average total assets or almost 12% of net interest income.
Table 2 Structure of mutual funds*
Billions of pesetas % of total Total mutual funds 31,936 100.0 Total managed by deposit institutions 29,784 93.3
Managed by banks 19,925 62.4 Managed by savings banks 9,283 29.1 Managed by credit cooperatives 576 1.8
Managed by other financial institutions 2,152 6.7 * Includes securities funds (FIM) and money market funds (FIAMM). Source: CNMV.
Similarly, part of the disintermediation via insurance companies also remains within banking groups since the major banks have insurance subsidiaries with a significant presence in the market.
1.2 Heightened competition
The liberalisation and opening up of the Spanish financial system has not only affected the structure of business but has also entailed a most notable increase in the levels of competition between banks
99
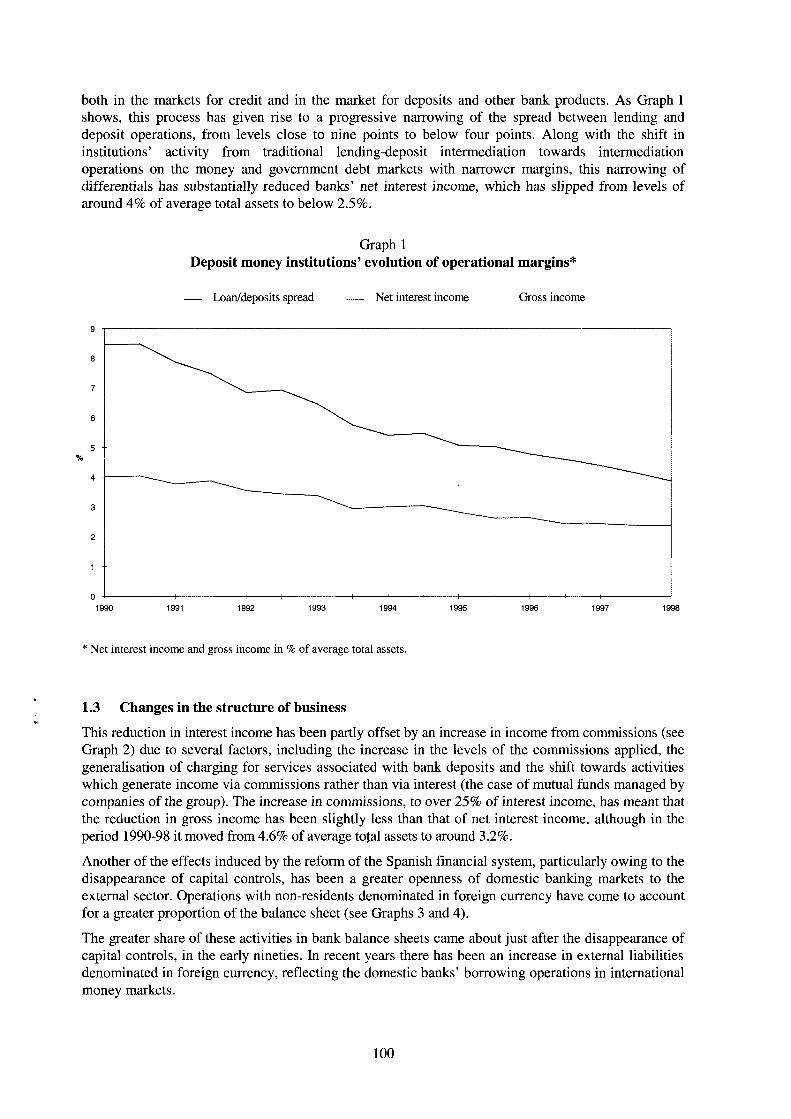
both in the markets for credit and in the market for deposits and other bank products. As Graph 1 shows, this process has given rise to a progressive narrowing of the spread between lending and deposit operations, from levels close to nine points to below four points. Along with the shift in institutions' activity from traditional lending-deposit intermediation towards intermediation operations on the money and government debt markets with narrower margins, this narrowing of differentials has substantially reduced banks' net interest income, which has slipped from levels of around 4% of average total assets to below 2.5%.
Graph 1 Deposit money institutions' evolution of operational margins*
Loan/deposits spread — Net interest income Gross income
9
8
7
6
5 /C
4
3
2
1
0 1991 1993 1994 1995 1996 1998 1990 1992 1997
* Net interest income and gross income in % of average total assets.
1.3 Changes in the structure of business
This reduction in interest income has been partly offset by an increase in income from commissions (see Graph 2) due to several factors, including the increase in the levels of the commissions applied, the generalisation of charging for services associated with bank deposits and the shift towards activities which generate income via commissions rather than via interest (the case of mutual funds managed by companies of the group). The increase in commissions, to over 25% of interest income, has meant that the reduction in gross income has been slightly less than that of net interest income, although in the period 1990-98 it moved from 4.6% of average tojal assets to around 3.2%.
Another of the effects induced by the reform of the Spanish financial system, particularly owing to the disappearance of capital controls, has been a greater openness of domestic banking markets to the external sector. Operations with non-residents denominated in foreign currency have come to account for a greater proportion of the balance sheet (see Graphs 3 and 4).
The greater share of these activities in bank balance sheets came about just after the disappearance of capital controls, in the early nineties. In recent years there has been an increase in external liabilities denominated in foreign currency, reflecting the domestic banks' borrowing operations in international money markets.
100
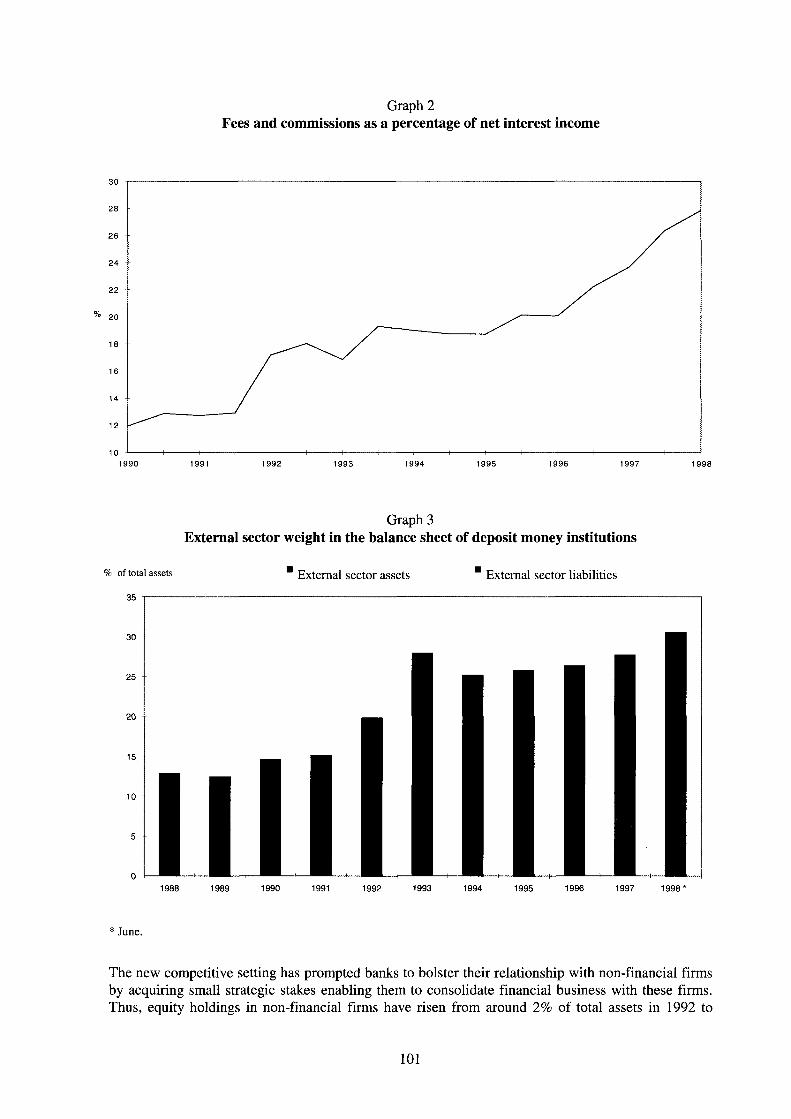
Graph 2 Fees and commissions as a percentage of net interest income
30
2 8
2 6
2 4
2 2
% 20
1 9 9 6 1 9 9 0 1 9 9 1 1 9 9 2 1 9 9 3 1 9 9 4 1 9 9 5 1 9 9 7 1 9 9 8
Graph 3 External sector weight in the balance sheet of deposit money institutions
% of total assets • External sector assets " External sector liabilities 35 1
1988 1989 1990 1991 1992 1993 1994 1995 1996 1997 1998*
* J u n e .
The new competitive setting has prompted banks to bolster their relationship with non-financial firms by acquiring small strategic stakes enabling them to consolidate financial business with these firms. Thus, equity holdings in non-financial firms have risen from around 2% of total assets in 1992 to
101
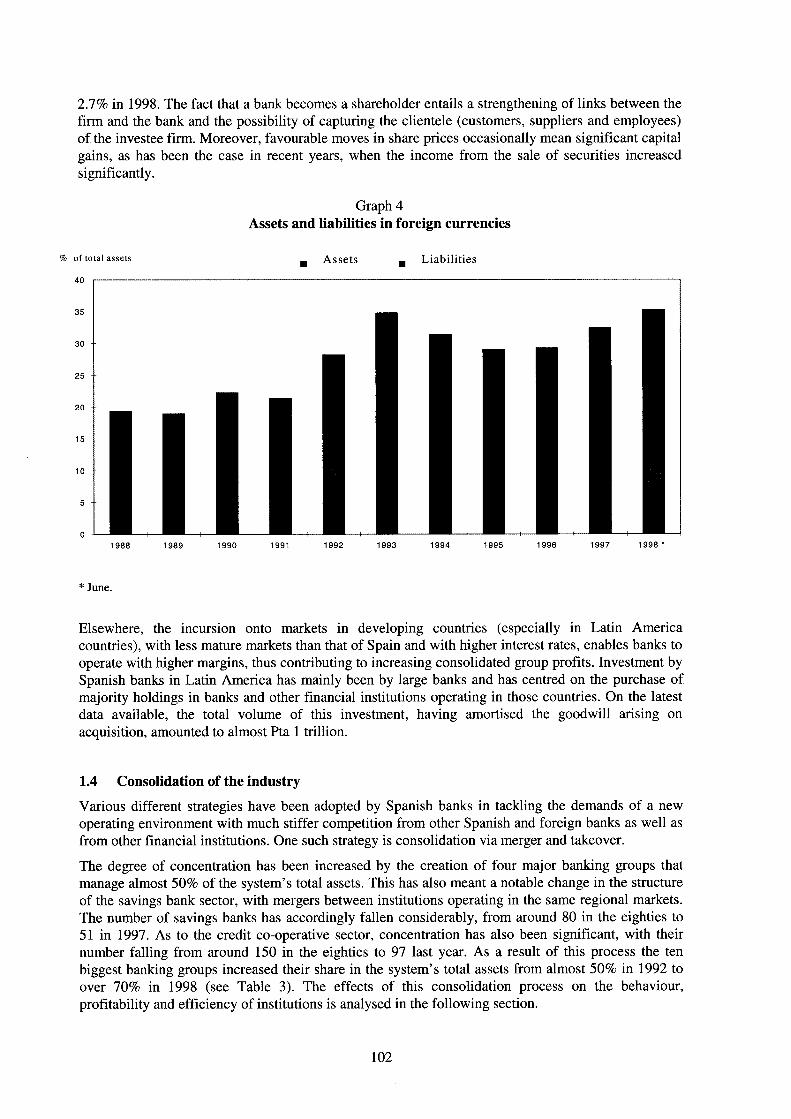
2.7% in 1998. The fact that a bank becomes a shareholder entails a strengthening of links between the firm and the bank and the possibility of capturing the clientele (customers, suppliers and employees) of the investee firm. Moreover, favourable moves in share prices occasionally mean significant capital gains, as has been the case in recent years, when the income from the sale of securities increased significantly.
Graph 4 Assets and liabilities in foreign currencies
% o f to ta l a s s e t s Liabilities Assets
1 9 8 8 1 9 8 9 1 9 9 0 1 9 9 1 1 9 9 2 1 9 9 3 1 9 9 4 1 9 9 5 1 9 9 6 1 9 9 7 1 9 9 8 *
* June.
Elsewhere, the incursion onto markets in developing countries (especially in Latin America countries), with less mature markets than that of Spain and with higher interest rates, enables banks to operate with higher margins, thus contributing to increasing consolidated group profits. Investment by Spanish banks in Latin America has mainly been by large banks and has centred on the purchase of majority holdings in banks and other financial institutions operating in those countries. On the latest data available, the total volume of this investment, having amortised the goodwill arising on acquisition, amounted to almost Pta 1 trillion.
1.4 Consolidation of the industry
Various different strategies have been adopted by Spanish banks in tackling the demands of a new operating environment with much stiffer competition from other Spanish and foreign banks as well as from other financial institutions. One such strategy is consolidation via merger and takeover.
The degree of concentration has been increased by the creation of four major banking groups that manage almost 50% of the system's total assets. This has also meant a notable change in the structure of the savings bank sector, with mergers between institutions operating in the same regional markets. The number of savings banks has accordingly fallen considerably, from around 80 in the eighties to 51 in 1997. As to the credit co-operative sector, concentration has also been significant, with their number falling from around 150 in the eighties to 97 last year. As a result of this process the ten biggest banking groups increased their share in the system's total assets from almost 50% in 1992 to over 70% in 1998 (see Table 3). The effects of this consolidation process on the behaviour, profitability and efficiency of institutions is analysed in the following section.
102
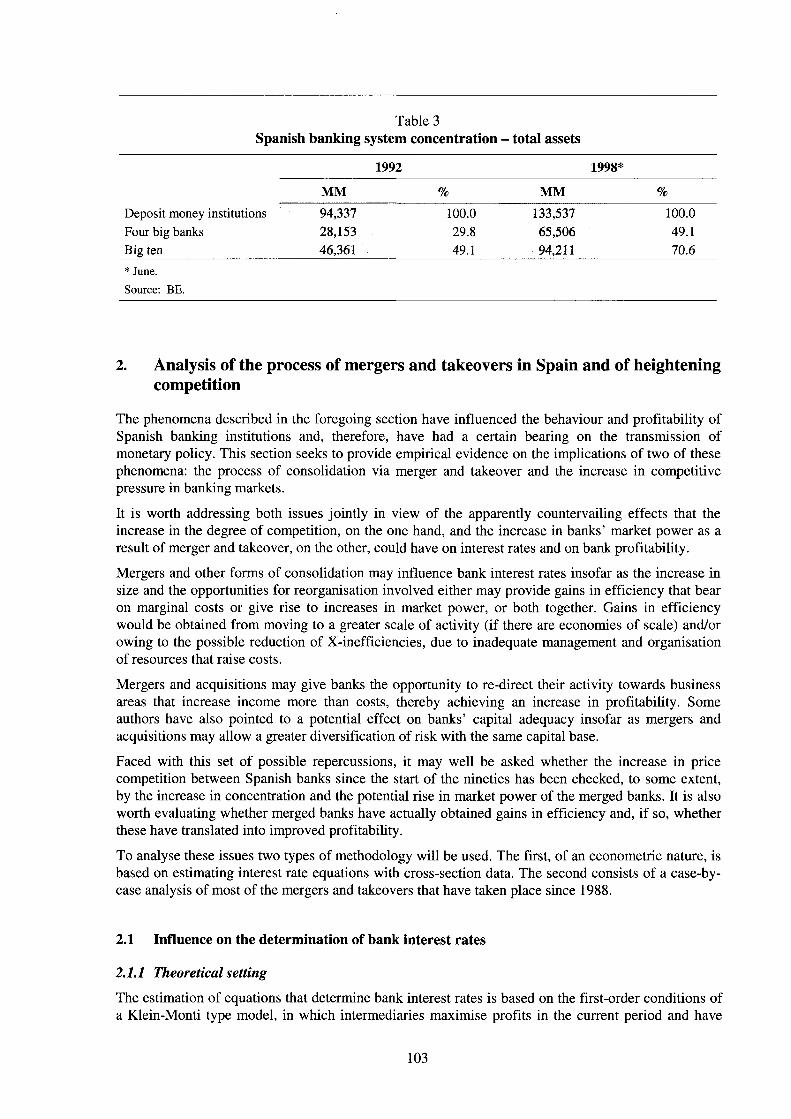
Table 3 Spanish banking system concentration - total assets
1992 1998*
MM % MM % Deposit money institutions Four big banks Big ten
94,337 28,153 46,361
100.0
49.1 29.8
133,537 65,506 94,211
100.0 49.1 70.6
* June. Source: BE.
2. Analysis of the process of mergers and takeovers in Spain and of heightening competition
The phenomena described in the foregoing section have influenced the behaviour and profitability of Spanish banking institutions and, therefore, have had a certain bearing on the transmission of monetary policy. This section seeks to provide empirical evidence on the implications of two of these phenomena: the process of consolidation via merger and takeover and the increase in competitive pressure in banking markets.
It is worth addressing both issues jointly in view of the apparently countervailing effects that the increase in the degree of competition, on the one hand, and the increase in banks' market power as a result of merger and takeover, on the other, could have on interest rates and on bank profitability.
Mergers and other forms of consolidation may influence bank interest rates insofar as the increase in size and the opportunities for reorganisation involved either may provide gains in efficiency that bear on marginal costs or give rise to increases in market power, or both together. Gains in efficiency would be obtained from moving to a greater scale of activity (if there are economies of scale) and/or owing to the possible reduction of X-inefficiencies, due to inadequate management and organisation of resources that raise costs.
Mergers and acquisitions may give banks the opportunity to re-direct their activity towards business areas that increase income more than costs, thereby achieving an increase in profitability. Some authors have also pointed to a potential effect on banks' capital adequacy insofar as mergers and acquisitions may allow a greater diversification of risk with the same capital base.
Faced with this set of possible repercussions, it may well be asked whether the increase in price competition between Spanish banks since the start of the nineties has been checked, to some extent, by the increase in concentration and the potential rise in market power of the merged banks. It is also worth evaluating whether merged banks have actually obtained gains in efficiency and, if so, whether these have translated into improved profitability.
To analyse these issues two types of methodology will be used. The first, of an econometric nature, is based on estimating interest rate equations with cross-section data. The second consists of a case-by-case analysis of most of the mergers and takeovers that have taken place since 1988.
2.1 Influence on the determination of bank interest rates
2.1.1 Theoretical setting
The estimation of equations that determine bank interest rates is based on the first-order conditions of a Klein-Monti type model, in which intermediaries maximise profits in the current period and have
103
the capacity to set the price in both the credit and the deposit markets. There is a third and competitive market in which they are not able to influence the price (the interbank or government debt market) and in which they resort to seeking a return on surplus liquidity or borrow funds. Consequently, the latter market is one of adjustment between the market for credit and that for deposits. Under these assumptions, the interest rates on credit and on deposits are determined separately and independently. If, in addition, it is assumed that there is product differentiation and strategic interaction between intermediaries, banks' decisions on prices will depend on the actions of rivals or competitors, so that the elasticity perceived by each bank will be the outcome of the price elasticity of the consumers whose demand it satisfies and the degree of rivalry among market participants.
In addition, one of the features inherent to the credit market is the risk arising from the uncertainty about collecting loan principal and interest. So as to take this aspect into account, the probability of incurring past-due loans which, along with interest rates, determines the expected return on the loan portfolio, has also been introduced into the model.
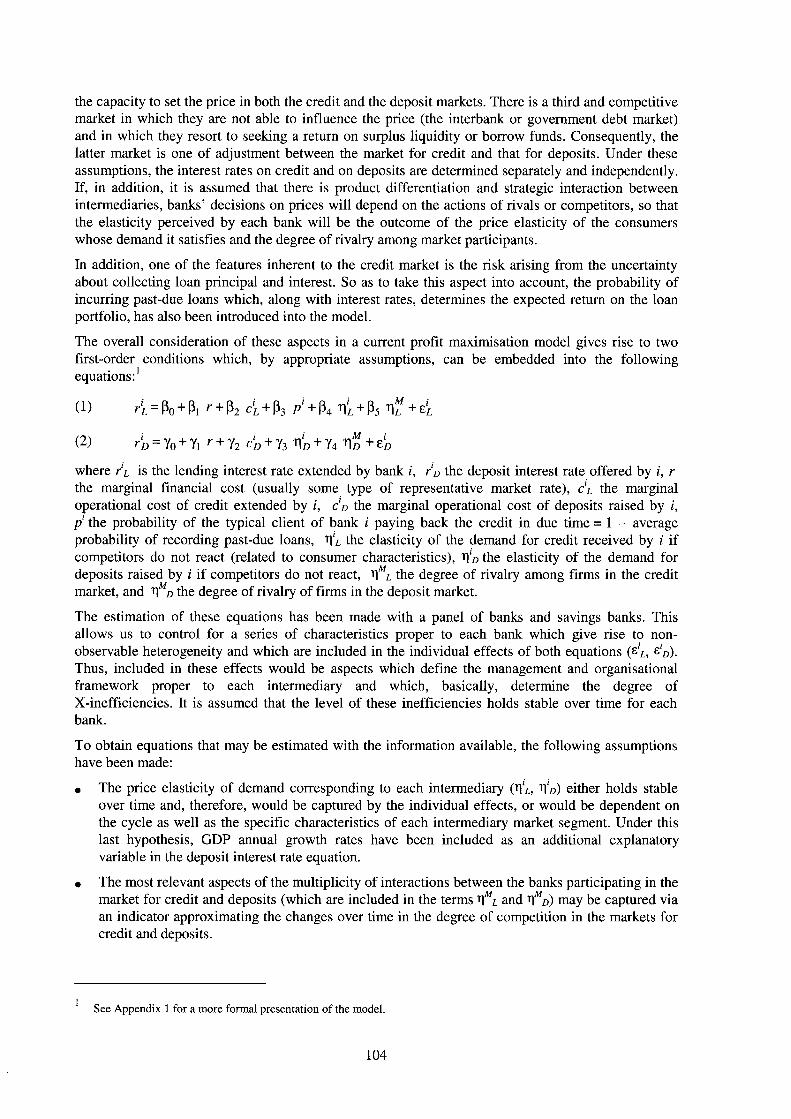
The overall consideration of these aspects in a current profit maximisation model gives rise to two first-order conditions which, by appropriate assumptions, can be embedded into the following equations:1
(1) rlL = ßo + ßi r + ßa cL + ßs p + ß4 T|'¿ + ß5 r | f +
(2) r i , = Yo+ yi r + Y2 c'a + Yj TI0 + Y4 t\d+¿D
where is the lending interest rate extended by bank i, r'n the deposit interest rate offered by i, r the marginal financial cost (usually some type of representative market rate), C'L the marginal operational cost of credit extended by i, C'D the marginal operational cost of deposits raised by i, p the probability of the typical client of bank i paying back the credit in due time = 1 - average probability of recording past-due loans, rfi the elasticity of the demand for credit received by i if competitors do not react (related to consumer characteristics), ti'd the elasticity of the demand for deposits raised by i if competitors do not react, t|Mz, the degree of rivalry among firms in the credit market, and V d the degree of rivalry of firms in the deposit market.
The estimation of these equations has been made with a panel of banks and savings banks. This allows us to control for a series of characteristics proper to each bank which give rise to non-observable heterogeneity and which are included in the individual effects of both equations (e1
L, &'D). Thus, included in these effects would be aspects which define the management and organisational framework proper to each intermediary and which, basically, determine the degree of X-inefficiencies. It is assumed that the level of these inefficiencies holds stable over time for each bank.
To obtain equations that may be estimated with the information available, the following assumptions have been made:
• The price elasticity of demand corresponding to each intermediary (n't, T|'0) either holds stable over time and, therefore, would be captured by the individual effects, or would be dependent on the cycle as well as the specific characteristics of each intermediary market segment. Under this last hypothesis, GDP annual growth rates have been included as an additional explanatory variable in the deposit interest rate equation.
• The most relevant aspects of the multiplicity of interactions between the banks participating in the market for credit and deposits (which are included in the terms V4¿ and "r\Md) may be captured via an indicator approximating the changes over time in the degree of competition in the markets for credit and deposits.
See Appendix 1 for a more formal presentation of the model.
104
• Average costs are a good approximation to marginal costs, i.e. most intermediaries operate with constant returns to scale.
• Institutions do not have sufficient information to distinguish between the operating costs arising from their respective activities in the credit and deposit markets, and consequently tend to charge the aggregate of both.
2.1.2 Data used
The variables in equations (1) and (2) have been approximated as follows:
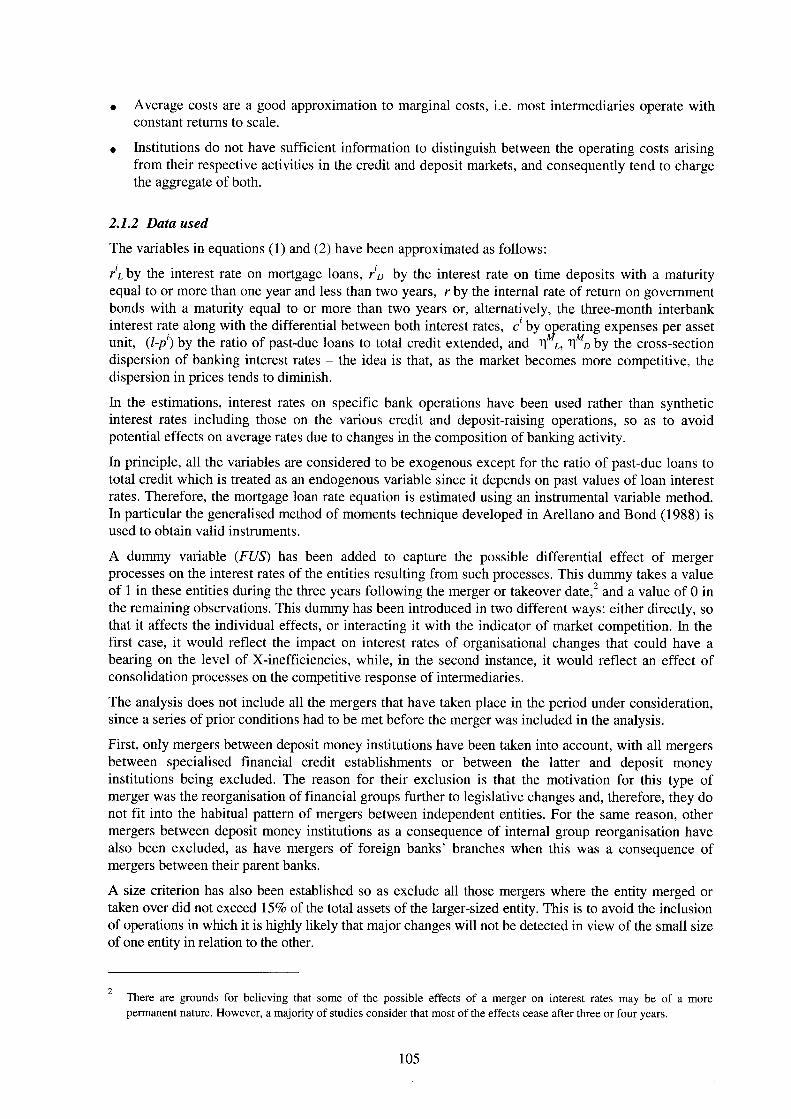
ri by the interest rate on mortgage loans, r'o by the interest rate on time deposits with a maturity equal to or more than one year and less than two years, r by the internal rate of return on government bonds with a maturity equal to or more than two years or, alternatively, the three-month interbank interest rate along with the differential between both interest rates, c by operating expenses per asset unit, (l-p ) by the ratio of past-due loans to total credit extended, and i f 1 l, d by the cross-section dispersion of banking interest rates - the idea is that, as the market becomes more competitive, the dispersion in prices tends to diminish.
In the estimations, interest rates on specific bank operations have been used rather than synthetic interest rates including those on the various credit and deposit-raising operations, so as to avoid potential effects on average rates due to changes in the composition of banking activity.
In principle, all the variables are considered to be exogenous except for the ratio of past-due loans to total credit which is treated as an endogenous variable since it depends on past values of loan interest rates. Therefore, the mortgage loan rate equation is estimated using an instrumental variable method. In particular the generalised method of moments technique developed in Arellano and Bond (1988) is used to obtain valid instruments.
A dummy variable (FUS) has been added to capture the possible differential effect of merger processes on the interest rates of the entities resulting from such processes. This dummy takes a value of 1 in these entities during the three years following the merger or takeover date,2 and a value of 0 in the remaining observations. This dummy has been introduced in two different ways: either directly, so that it affects the individual effects, or interacting it with the indicator of market competition. In the first case, it would reflect the impact on interest rates of organisational changes that could have a bearing on the level of X-inefficiencies, while, in the second instance, it would reflect an effect of consolidation processes on the competitive response of intermediaries.
The analysis does not include all the mergers that have taken place in the period under consideration, since a series of prior conditions had to be met before the merger was included in the analysis.
First, only mergers between deposit money institutions have been taken into account, with all mergers between specialised financial credit establishments or between the latter and deposit money institutions being excluded. The reason for their exclusion is that the motivation for this type of merger was the reorganisation of financial groups further to legislative changes and, therefore, they do not fit into the habitual pattern of mergers between independent entities. For the same reason, other mergers between deposit money institutions as a consequence of internal group reorganisation have also been excluded, as have mergers of foreign banks' branches when this was a consequence of mergers between their parent banks.
A size criterion has also been established so as exclude all those mergers where the entity merged or taken over did not exceed 15% of the total assets of the larger-sized entity. This is to avoid the inclusion of operations in which it is highly likely that major changes will not be detected in view of the small size of one entity in relation to the other.
There are grounds for believing that some of the possible effects of a merger on interest rates may be of a more permanent nature. However, a majority of studies consider that most of the effects cease after three or four years.
105
Also excluded are those mergers in which the resulting new entity lasted for less than one complete financial year. Including such mergers would have been impossible, owing to lack of data. If the disappearance of the new entity was the result of a new merger, only the latter operation will be considered.
Lastly, we also decided to exclude one particular operation since, although it met the established requirements, it showed anomalous values for the ratios considered (such as negative net income) and excessive volatility in the ratios relating to balance-sheet structure; accordingly, its inclusion in the sample might have distorted the data.
Applying these criteria, 18 merger operations have been included in the analysis. Of these, two involve large private banks, two medium-sized subsidiaries and the remaining 14 various savings banks. Three of the mergers involve more than two entities, the rest only two institutions.
All the data are annual average values obtained from the information on interest rates provided monthly to the Banco de España by banks and savings banks and from the accounting information included in confidential statements. The sample of intermediaries included in the panel data corresponds to those which have reported interest rates on an ongoing basis. The information covers the period from 1988 to 1997.
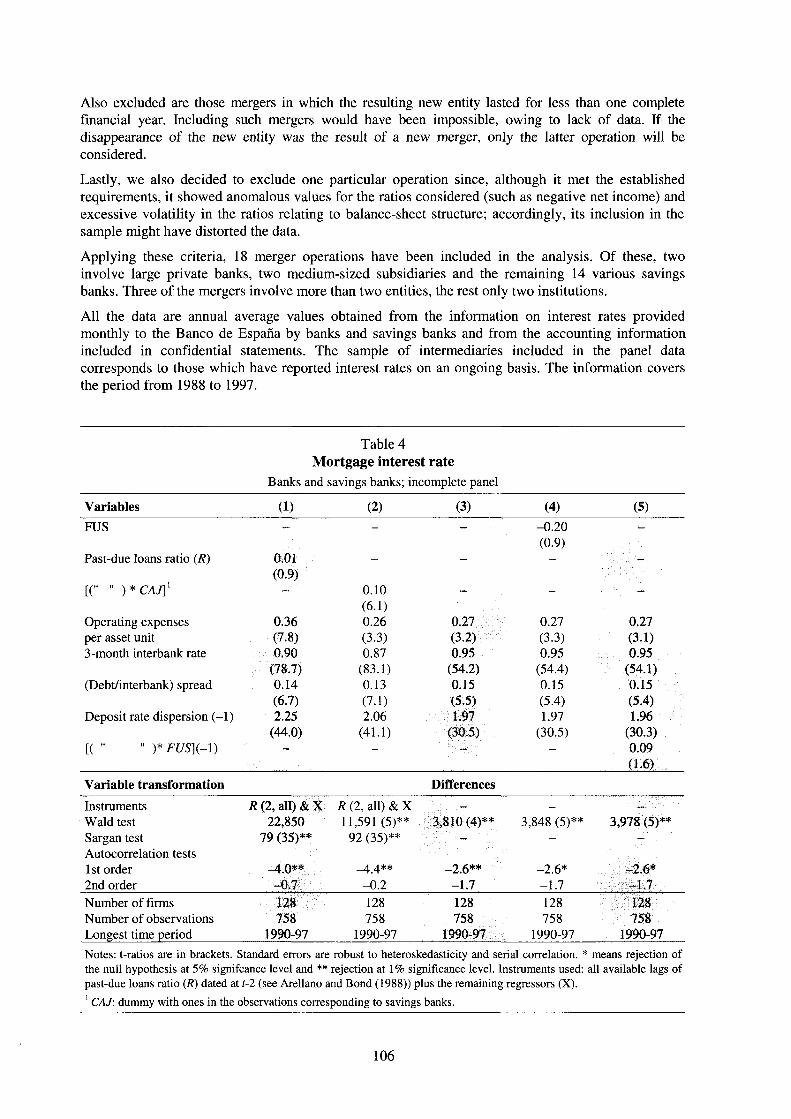
Table 4 Mortgage interest rate
Banks and savings banks; incomplete panel
Variables (1) (2) (3) (4) (5) FUS - - -0.20 -
(0.9) Past-due loans ratio (R) 0.01 - - -
(0.9) [(" " )*CAJ]1
- 0.1!) - - -
(6.1) Operating expenses 0.36 0.26 0.27 0.27 0.27 per asset unit (7.8) (3.3) (3.2) (3.3) (3.1) 3-month interbank rate 0.90 0.87 0.95 0.95 0.95
(78.7) (83.1) (54.2) (54.4) (54.1) (Debt/interbank) spread 0.14 0.13 0.15 0.15 0.15
(6.7) (7.1) (5.5) (5-4) (5.4) Deposit rate dispersion (-1) 2.25 2.06 1.97 1.97 1.96
(44.0) (41.1) (30.5) (30.5) (30.3) [( " " )*FUS](-l) - - - - 0.09
(L6) Variable transformation Differences Instruments R (2, all) & X R (2, all) & X - - -
Wald test 22,850 11,591 (5)** 3,810(4)** 3,848 (5)** 3,978 (5)** Sargan test 79 (35)** 92 (35)** - - -
Autocorrelation tests 1st order —4 0** -2.6** -2.6* -2.6* 2nd order -0.7 -0.2 -1.7 -1.7 -1.7 Number of firms 128 128 128 128 128 Number of observations 758 758 758 758 758 Longest time period 1990-97 1990-97 1990-97 1990-97 1990-97 Notes: t-ratios are in brackets. Standard errors are robust to heteroskedasticity and serial correlation. * means rejection of the null hypothesis at 5% signifcance level and ** rejection at 1% significance level. Instruments used: all available lags of past-due loans ratio (R) dated at f-2 (see Arellano and Bond (1988)) plus the remaining regressors (X). 1 CAJ: dummy with ones in the observations corresponding to savings banks.
106
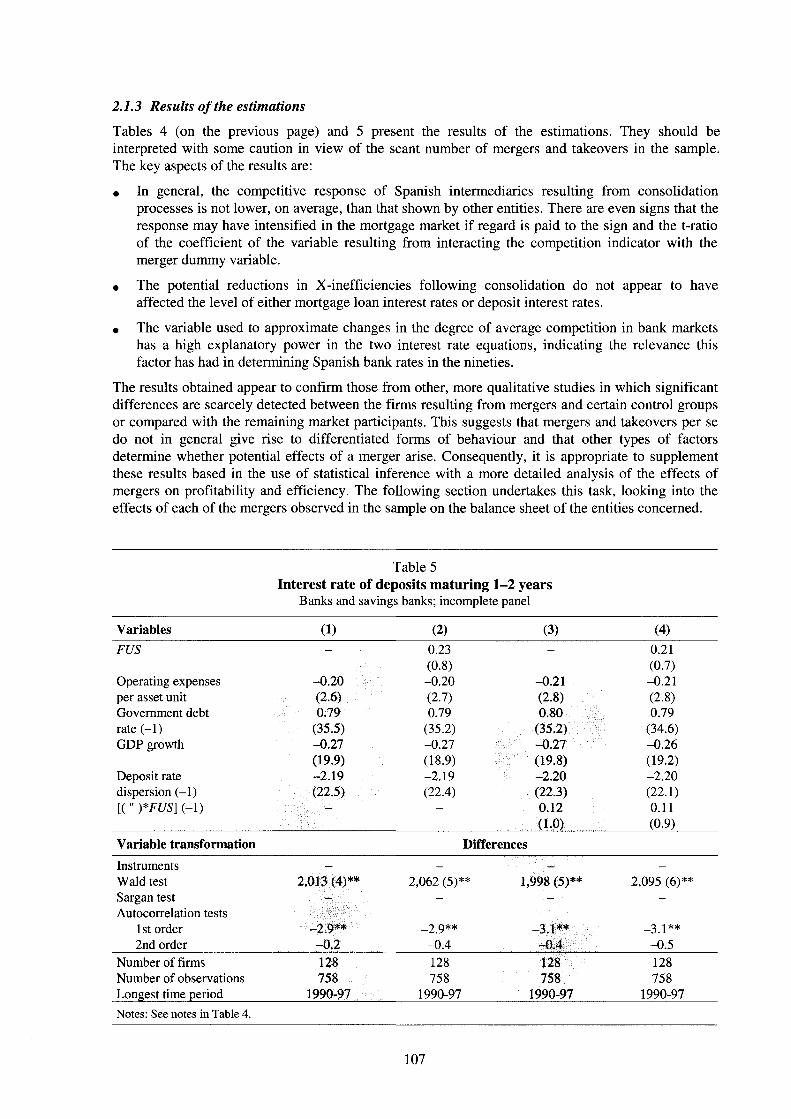
2.1.3 Results of the estimations
Tables 4 (on the previous page) and 5 present the results of the estimations. They should be interpreted with some caution in view of the scant number of mergers and takeovers in the sample. The key aspects of the results are:
• In general, the competitive response of Spanish intermediaries resulting from consolidation processes is not lower, on average, than that shown by other entities. There are even signs that the response may have intensified in the mortgage market if regard is paid to the sign and the t-ratio of the coefficient of the variable resulting from interacting the competition indicator with the merger dummy variable.
• The potential reductions in X-inefficiencies following consolidation do not appear to have affected the level of either mortgage loan interest rates or deposit interest rates.
• The variable used to approximate changes in the degree of average competition in bank markets has a high explanatory power in the two interest rate equations, indicating the relevance this factor has had in determining Spanish bank rates in the nineties.
The results obtained appear to confirm those from other, more qualitative studies in which significant differences are scarcely detected between the firms resulting from mergers and certain control groups or compared with the remaining market participants. This suggests that mergers and takeovers per se do not in general give rise to differentiated forms of behaviour and that other types of factors determine whether potential effects of a merger arise. Consequently, it is appropriate to supplement these results based in the use of statistical inference with a more detailed analysis of the effects of mergers on profitability and efficiency. The following section undertakes this task, looking into the effects of each of the mergers observed in the sample on the balance sheet of the entities concerned.
Table 5 Interest rate of deposits maturing 1 -2 years
Banks and savings banks; incomplete panel
Variables (1) (2) (3) (4) FUS - 0.23 - 0.21
(0.8) (0.7) Operating expenses -0.20 -0.20 -0.21 -0.21 per asset unit (2.6) (2.7) (2.8) (2.8) Government debt 0.79 0.79 0.80 0.79 rate (-1) (35.5) (35.2) (35.2) (34.6) GDP growth -0.27 -0.27 -0.27 -0.26
(19.9) (18.9) (19.8) (19.2) Deposit rate -2.19 -2.19 -2.20 -2.20 dispersion (-1) (22.5) (22.4) (22.3) (22.1) [( " )*FUS] (-1) - - 0.12 0.11
(1.0) (0.9) Variable transformation Differences Instruments - — -
Wald test 2.0 n (4)** 2,062 (5)** 1,998 (5)** 2,095 (6)** Sargan test - - - -
Autocorrelation tests 1st order -2.9** _2 g** -3.1** -3.1** 2nd order -0.2 -0.4 -0.4 -0.5
Number of firms 128 128 128 128 Number of observations 758 758 758 758 Longest time period 1990-97 1990-97 1990-97 1990-97 Notes: See notes in Table 4.
107

2.2 Case-by-case analysis of bank mergers in Spain in the period 1988-97
The case-by-case analysis of mergers compares changes in certain financial ratios of the institution resulting from the merger process with the same ratios calculated for a comparable group, the selection of which will depend, in each case, on the characteristics of the entities that have merged.
2.2.1 Description of the ratios used in the analysis and of the methodology applied
To analyse the impact of mergers on banks, a series of variables has been selected which seeks to measure the effects of the merger on various aspects of their entities' activity. Five groups of indicators are specified. First are those which attempt to measure profit-generating capacity; second, indicators of the level of efficiency and productivity; third, indicators of changes in market share; fourth, indicators of business structure; and lastly, indicators of the level of capital adequacy.
The basic indicators used are as follows:
• Group 1: profit-generating capacity as a percentage of average total assets and includes: total income (interest income + commissions + result on financial operations), interest expenses, gross income (total income - financial charges), operating expenses, and net income (total income -interest expenses - operating expenses).
• Group 2: efficiency and productivity, which includes: operating expenses/average total assets, operating expenses/total income, efficiency ratio (operating expenses/gross income), productivity per employee (average total assets/number of employees), productivity per office (average total assets/number of offices), and number of employees and offices following merger.
To obtain supplementary information, three additional types of indicators are used, namely:
• Indicators of market share and total assets growth, containing growth rate of total assets, and market share in relation to comparable group.
• Indicators of business structure based on lending-deposit activity in pesetas as a percentage of total assets.
• Indicators of capital adequacy, using capital/total assets.
In each merger, these indicators have been calculated annually for the four years prior to the merger and the four years after, or for those years for which data were available if the subsequent period ran past 1997.
The indicators have been obtained from the information in the financial statements of the merged institution for the period subsequent to the merger and by aggregating the financial statements of the institutions participating in the merger process for the previous period. In each case the values of these indicators are compared with those that would be obtained from a specific control group for each type of entity.
The control groups considered in this study are the group of four major banks in the case of mergers between large banks, the group of subsidiary banks of domestic banks for mergers of this type and the total sum of savings banks for mergers between such institutions.
The comparison is established between the average of the four years prior to the merger with the average of the four years after. The values obtained for each year, are also analysed. The analysis attempts to identify potential improvements for each entity vis-à-vis the control group, with the results being presented as the change in basis points between the difference in the average values of the entity analysed and the control group before and after the merger.3 A significant improvement4 in the
Except in the case of the market indicators, where a distinction is made only between a positive and a negative change, and in the case of changes in the number of employees and offices, where only an increase or a decrease in this number is indicated.
108
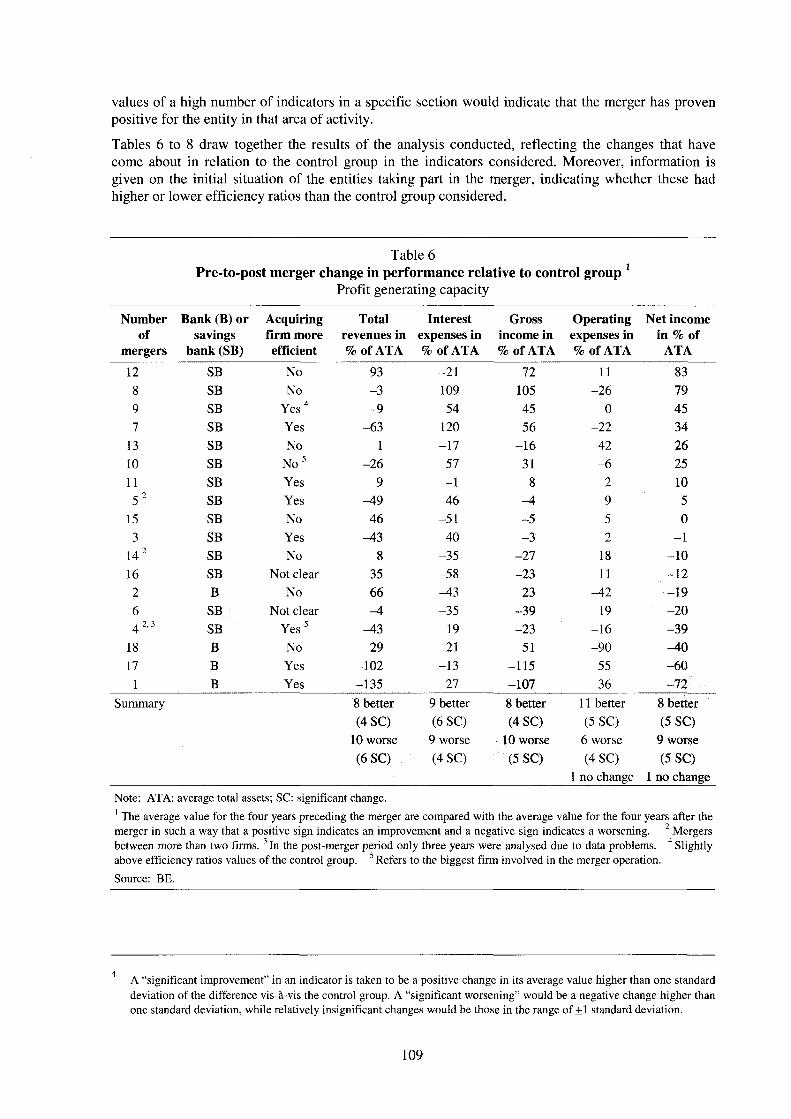
values of a high number of indicators in a specific section would indicate that the merger has proven positive for the entity in that area of activity.
Tables 6 to 8 draw together the results of the analysis conducted, reflecting the changes that have come about in relation to the control group in the indicators considered. Moreover, information is given on the initial situation of the entities taking part in the merger, indicating whether these had higher or lower efficiency ratios than the control group considered.
Table 6 Pre-to-post merger change in performance relative to control group 1
Profit generating capacity
Number Bank (B) or Acquiring Total Interest Gross Operating Net income of savings firm more revenues in expenses in income in expenses in in % of
mergers bank(SB) efficient % of ATA % of ATA % of ATA % of ATA ATA 12 SB No 93 -21 72 11 83 8 SB No - 3 109 105 -26 79 9 SB Yes4 - 9 54 45 0 45 7 SB Yes -63 120 56 -22 34
13 SB No 1 -17 -16 42 26 10 SB No5 -26 57 31 - 6 25 11 SB Yes 9 -1 8 2 10 5 2 SB Yes -49 46 -4 9 5
15 SB No 46 -51 -5 5 0 3 SB Yes -43 40 - 3 2 - 1
142 SB No 8 -35 -27 18 -10 16 SB Not clear 35 -58 -23 11 -12 2 B No 66 -43 23 -42 -19 6 SB Not clear -4 -35 -39 19 -20 4 2,3 SB Yes5 -43 19 -23 -16 -39
18 B No 29 21 51 -90 -40 17 B Yes -102 -13 -115 55 -60
1 B Yes -135 27 -107 36 -72 Summary 8 better 9 better 8 better 11 better 8 better
(4 SC) (6 SC) (4 SC) (5 SC) (5 SC) 10 worse 9 worse 10 worse 6 worse 9 worse (6 SC) (4 SC) (5 SC) (4 SC)
1 no change (5 SC)
1 no change Note: ATA: average total assets; SC: significant change.
' The average value for the four years preceding the merger are compared with the average value for the four years after the merger in such a way that a positive sign indicates an improvement and a negative sign indicates a worsening. 2 Mergers between more than two firms. 3 In the post-merger period only three years were analysed due to data problems. 4 Slightly above efficiency ratios values of the control group. 5 Refers to the biggest firm involved in the merger operation.
Source: BE.
A "significant improvement" in an indicator is taken to be a positive change in its average value higher than one standard deviation of the difference vis-à-vis the control group. A "significant worsening" would be a negative change higher than one standard deviation, while relatively insignificant changes would be those in the range of +1 standard deviation.
109
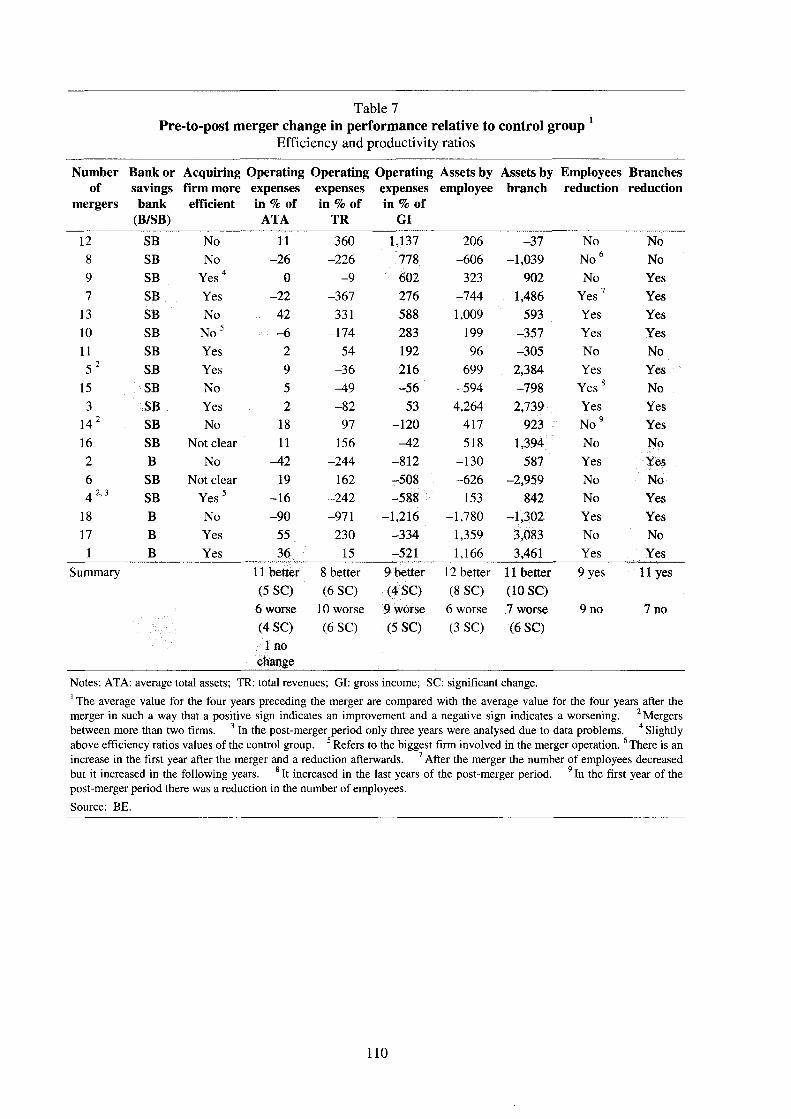
Table 7 Pre-to-post merger change in performance relative to control group 1
Efficiency and productivity ratios
Number Bank or Acquiring Operating Operating Operating Assets by Assets by Employees Branches of savings firm more expenses expenses expenses employee branch reduction reduction
mergers bank (B/SB)
efficient in % of ATA
in % of TR
in % of GI
12 SB No 11 360 1,137 206 -37 No No 8 SB No -26 -226 778 -606 -1,039 No6 No 9 SB Yes4 0 - 9 602 323 902 No Yes 7 SB Yes -22 -367 276 -744 1,486 Yes7 Yes
13 SB No 42 331 588 1,009 593 Yes Yes 10 SB No5 - 6 -174 283 199 -357 Yes Yes 11 SB Yes 2 54 192 96 -305 No No 5 2 SB Yes 9 -36 216 699 2,384 Yes Yes
15 SB No 5 -49 -56 -594 -798 Yes8 No 3 SB Yes 2 -82 53 4,264 2,739 Yes Yes
142 SB No 18 97 -120 417 923 No9 Yes 16 SB Not clear 11 156 -42 518 1,394 No No 2 B No -42 -244 -812 -130 587 Yes Yes 6 SB Not clear 19 162 -508 -626 -2,959 No No 4 2,3 SB Yes5 -16 -242 -588 153 842 No Yes
18 B No -90 -971 -1,216 -1,780 -1,302 Yes Yes 17 B Yes 55 230 -334 1,359 3,083 No No 1 B Yes 36 15 -521 1,166 3,461 Yes Yes
Summary 11 better (5 SC)
8 better (6 SC)
9 better (4 SC)
12 better (8 SC)
11 better (10 SC)
9 yes 11 yes
6 worse 10 worse 9 worse 6 worse 7 worse 9 no 7 no (4 SC) (6 SC) (5 SC) (3 SC) (6 SC)
1 no change
Notes: ATA: average total assets; TR: total revenues; GI: gross income; SC: significant change. 1 The average value for the four years preceding the merger are compared with the average value for the four years after the merger in such a way that a positive sign indicates an improvement and a negative sign indicates a worsening. 2 Mergers between more than two firms. 3 In the post-merger period only three years were analysed due to data problems. 4 Slightly above efficiency ratios values of the control group. 5 Refers to the biggest firm involved in the merger operation. 6 There is an increase in the first year after the merger and a reduction afterwards. 7 After the merger the number of employees decreased but it increased in the following years. 8 It increased in the last years of the post-merger period. 9 In the first year of the post-merger period there was a reduction in the number of employees.
Source: BE.
110
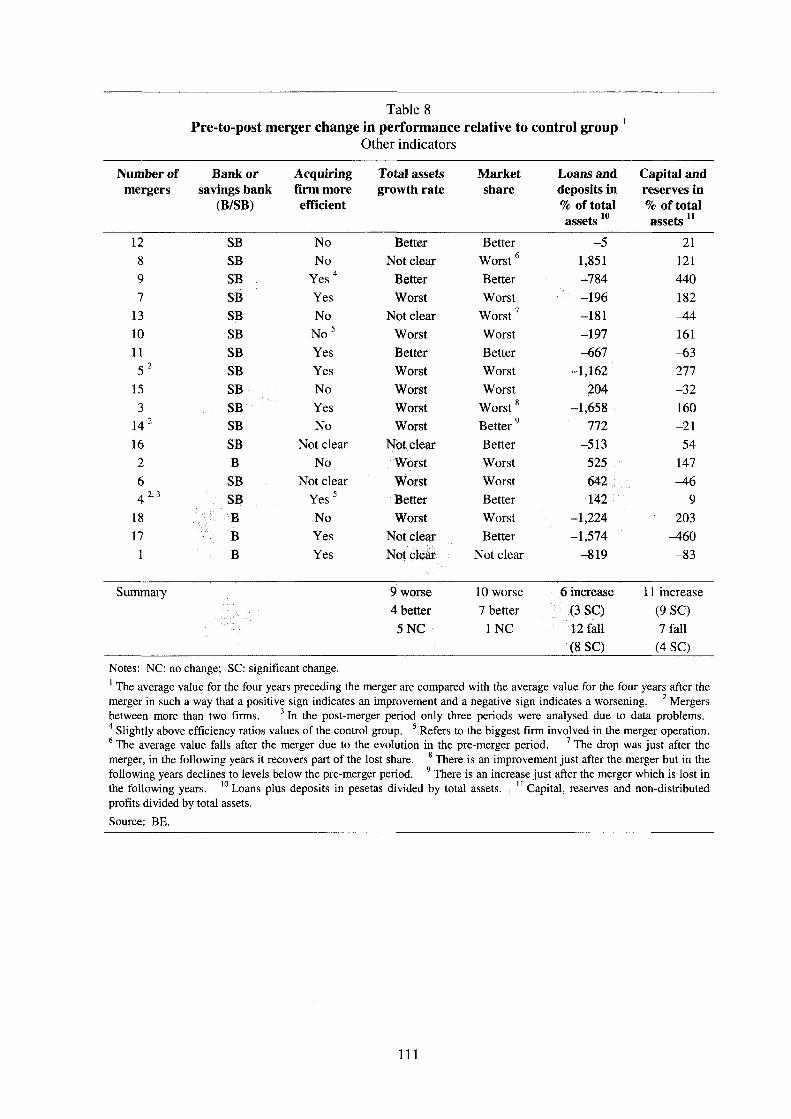
Table 8 Pre-to-post merger change in performance relative to control group 1
Other indicators
Number of mergers
Bank or savings bank
(B/SB)
Acquiring firm more efficient
Total assets growth rate
Market share
Loans and deposits in % of total assets 10
Capital and reserves in % of total assets 11
12 SB No Better Better - 5 21 8 SB No Not clear Worst 6 1,851 121 9 SB Yes4 Better Better -784 440 7 SB Yes Worst Worst -196 182
13 SB No Not clear Worst7 -181 -44 10 SB No5 Worst Worst -197 161 11 SB Yes Better Better -667 -63 5 2 SB Yes Worst Worst -1,162 277
15 SB No Worst Worst 204 -32 3 SB Yes Worst Worst8 -1,658 160
14 2 SB No Worst Better9 772 -21 16 SB Not clear Not clear Better -513 54 2 B No Worst Worst 525 147 6 SB Not clear Worst Worst 642 -46 4 2, 3 SB Yes 5 Better Better 142 9
18 B No Worst Worst -1,224 203 17 B Yes Not clear Better -1,574 -460 1 B Yes Not clear Not clear -819 -83
Summary 9 worse 4 better 5 NC
10 worse 7 better
1 NC
6 increase (3 SC) 12 fall (8 SC)
11 increase (9 SC) 7 fall (4 SC)
Notes: NC: no change; SC: significant change.
' The average value for the four years preceding the merger are compared with the average value for the four years after the merger in such a way that a positive sign indicates an improvement and a negative sign indicates a worsening. 2 Mergers between more than two firms. 3 In the post-merger period only three periods were analysed due to data problems. 4 Slightly above efficiency ratios values of the control group. 5 Refers to the biggest firm involved in the merger operation. 6 The average value falls after the merger due to the evolution in the pre-merger period. 7 The drop was just after the merger, in the following years it recovers part of the lost share. 8 There is an improvement just after the merger but in the following years declines to levels below the pre-merger period. 9 There is an increase just after the merger which is lost in the following years. 10 Loans plus deposits in pesetas divided by total assets. , 11 Capital, reserves and non-distributed profits divided by total assets.
Source: BE.
I l l
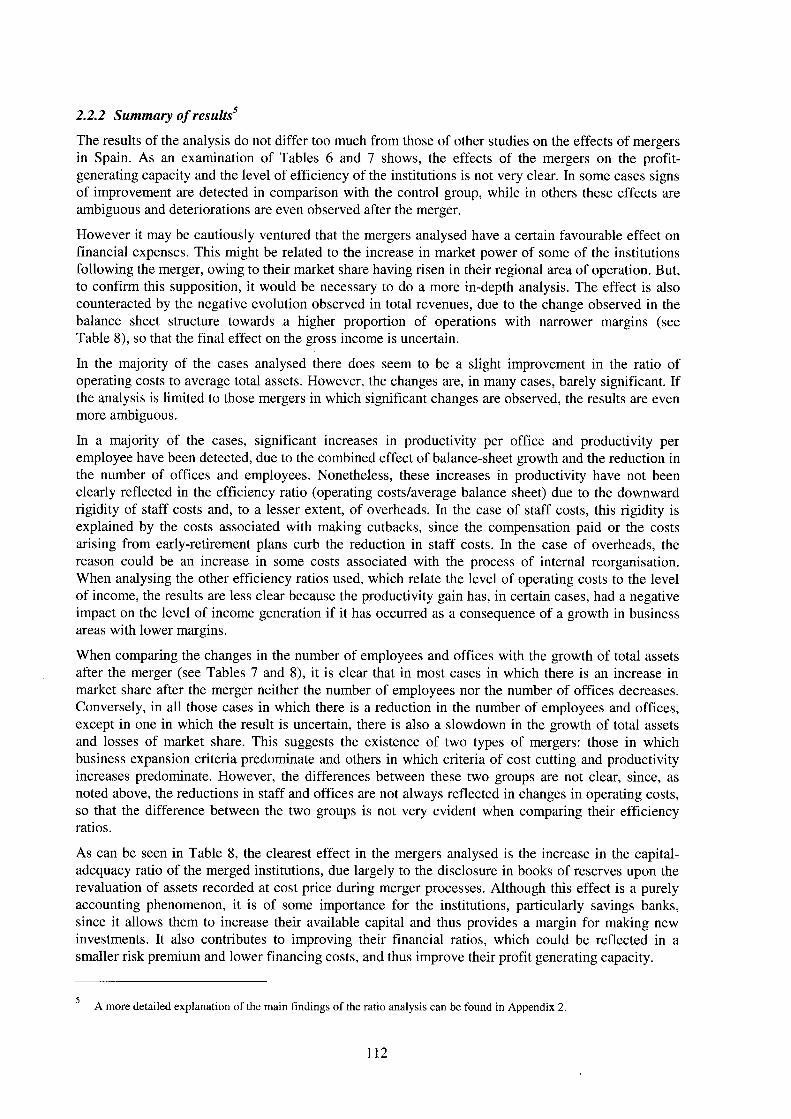
2.2.2 Summary of results5
The results of the analysis do not differ too much from those of other studies on the effects of mergers in Spain. As an examination of Tables 6 and 7 shows, the effects of the mergers on the profit-generating capacity and the level of efficiency of the institutions is not very clear. In some cases signs of improvement are detected in comparison with the control group, while in others these effects are ambiguous and deteriorations are even observed after the merger.
However it may be cautiously ventured that the mergers analysed have a certain favourable effect on financial expenses. This might be related to the increase in market power of some of the institutions following the merger, owing to their market share having risen in their regional area of operation. But, to confirm this supposition, it would be necessary to do a more in-depth analysis. The effect is also counteracted by the negative evolution observed in total revenues, due to the change observed in the balance sheet structure towards a higher proportion of operations with narrower margins (see Table 8), so that the final effect on the gross income is uncertain.
In the majority of the cases analysed there does seem to be a slight improvement in the ratio of operating costs to average total assets. However, the changes are, in many cases, barely significant. If the analysis is limited to those mergers in which significant changes are observed, the results are even more ambiguous.
In a majority of the cases, significant increases in productivity per office and productivity per employee have been detected, due to the combined effect of balance-sheet growth and the reduction in the number of offices and employees. Nonetheless, these increases in productivity have not been clearly reflected in the efficiency ratio (operating costs/average balance sheet) due to the downward rigidity of staff costs and, to a lesser extent, of overheads. In the case of staff costs, this rigidity is explained by the costs associated with making cutbacks, since the compensation paid or the costs arising from early-retirement plans curb the reduction in staff costs. In the case of overheads, the reason could be an increase in some costs associated with the process of internal reorganisation. When analysing the other efficiency ratios used, which relate the level of operating costs to the level of income, the results are less clear because the productivity gain has, in certain cases, had a negative impact on the level of income generation if it has occurred as a consequence of a growth in business areas with lower margins.
When comparing the changes in the number of employees and offices with the growth of total assets after the merger (see Tables 7 and 8), it is clear that in most cases in which there is an increase in market share after the merger neither the number of employees nor the number of offices decreases. Conversely, in all those cases in which there is a reduction in the number of employees and offices, except in one in which the result is uncertain, there is also a slowdown in the growth of total assets and losses of market share. This suggests the existence of two types of mergers: those in which business expansion criteria predominate and others in which criteria of cost cutting and productivity increases predominate. However, the differences between these two groups are not clear, since, as noted above, the reductions in staff and offices are not always reflected in changes in operating costs, so that the difference between the two groups is not very evident when comparing their efficiency ratios.
As can be seen in Table 8, the clearest effect in the mergers analysed is the increase in the capital-adequacy ratio of the merged institutions, due largely to the disclosure in books of reserves upon the revaluation of assets recorded at cost price during merger processes. Although this effect is a purely accounting phenomenon, it is of some importance for the institutions, particularly savings banks, since it allows them to increase their available capital and thus provides a margin for making new investments. It also contributes to improving their financial ratios, which could be reflected in a smaller risk premium and lower financing costs, and thus improve their profit generating capacity.
A more detailed explanation of the main findings of the ratio analysis can be found in Appendix 2.
112
3. Conclusions
An overall evaluation of the results of the various sections of this paper leads to two types of conclusion.
First, the consolidation of the banking industry does not appear to have affected the growing degree of competition which has been seen in the sector in recent years. In principle, a bigger size offers greater capacity to set prices out of line with the market. But, in an environment characterised by fierce competition, it is probably very costly, in terms of market share, to take advantage of this power. Nonetheless, the general effect does not preclude a significant reduction in interest expenses which has been observed in some takeovers. However, it is not clear if this could be interpreted as the result of an increase in market power or as a strategic decision taken by most banking institutions which have ruled out competing strongly in the deposit market. In a context of considerable shifts in savings from bank deposits to mutual funds, this decision seems to be a sensible way to redistribute competitive pressure among different markets while minimising its negative impact on profitability.
Second, the basic effect of any merger or takeover is to widen the range of strategic alternatives available to a bank, by enabling it to attain a size which, in the absence of the merger, could probably not have been achieved, and by requiring a reassessment of existing organisational arrangements. It seems that in the case of mergers and takeovers in Spain, one can speak of two types: those which have sought to expand business and those which have opted for increases in productivity and improvements in the level of efficiency. The ambiguity of the results obtained in terms of profitability per unit of asset would suggest that it is virtually impossible to achieve both at the same time; i.e. the growth in the gross income of certain merged institutions as a result of a strategy of business expansion is usually accompanied by an increase in operating costs which tend to offset higher income. On the other hand, those institutions which opt for a significant reorganisation, with elimination of duplication in the office network, seem to suffer a loss of income-generating capacity, so that the productivity and efficiency gains are not transformed into improvements in profitability, at least within a four-year period.
In short, although the mergers analysed in this study give no clear results as regards improvements in the profit-generating capacity or efficiency levels of the merged institutions, they can mostly be considered satisfactory from the viewpoint of the banking sector since they have been an instrument for achieving some positive objectives:
• certain reductions in costs, although these have been small;
• implementation of rationalisation plans which, although they have not been immediately reflected in the institutions' profit and loss account due to the difficulties and high costs of staff cutbacks in Spain, have certainly served to improve the competitiveness of the institutions; and
• improvements in capital-adequacy ratios, which have helped to facilitate investment growth. These effects observed in the mergers analysed, have most likely helped put the merged institutions in a better position to confront the growing competition in the financial sector, especially in those cases where merged institutions were of a relatively small size and competitors in the same regional market.
113
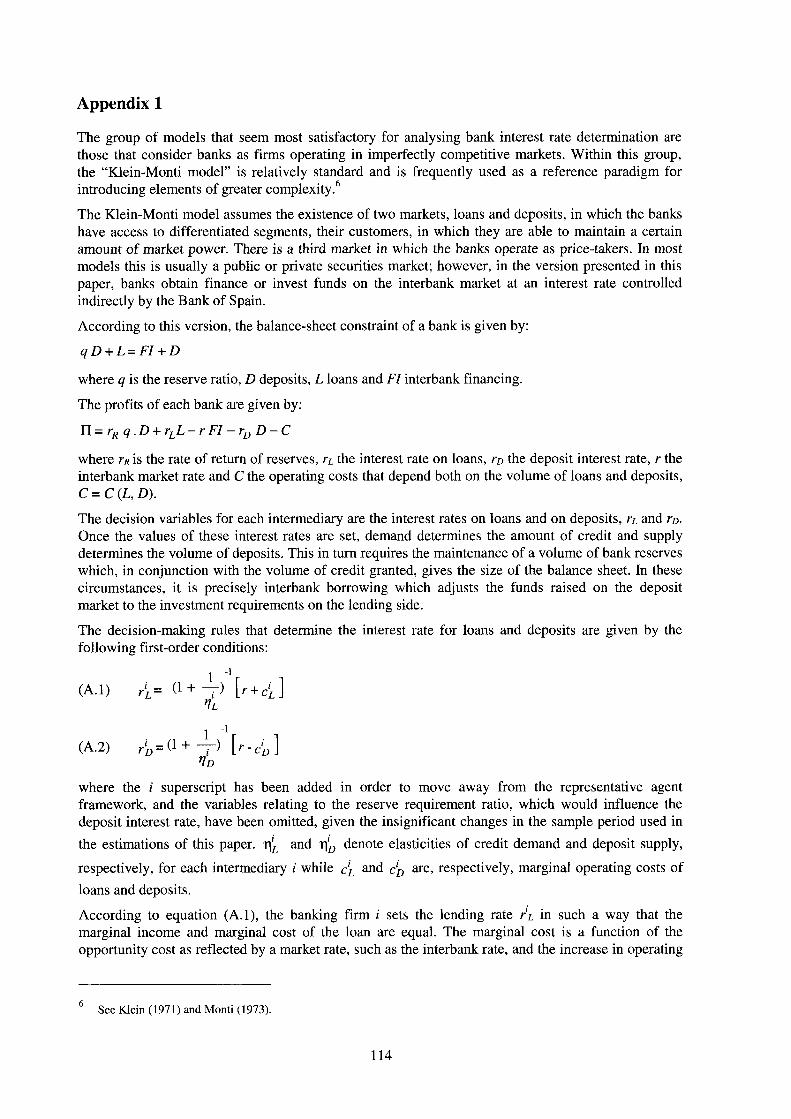
Appendix 1
The group of models that seem most satisfactory for analysing bank interest rate determination are those that consider banks as firms operating in imperfectly competitive markets. Within this group, the "Klein-Monti model" is relatively standard and is frequently used as a reference paradigm for introducing elements of greater complexity.6
The Klein-Monti model assumes the existence of two markets, loans and deposits, in which the banks have access to differentiated segments, their customers, in which they are able to maintain a certain amount of market power. There is a third market in which the banks operate as price-takers. In most models this is usually a public or private securities market; however, in the version presented in this paper, banks obtain finance or invest funds on the interbank market at an interest rate controlled indirectly by the Bank of Spain.
According to this version, the balance-sheet constraint of a bank is given by:
qD + L=FI + D
where q is the reserve ratio, D deposits, L loans and FI interbank financing.
The profits of each bank are given by:
I I = rR q. D + rLL - r FI - rD D - C
where r« is the rate of return of reserves, r/_ the interest rate on loans, rD the deposit interest rate, r the interbank market rate and C the operating costs that depend both on the volume of loans and deposits, C = C (L, D).
The decision variables for each intermediary are the interest rates on loans and on deposits, r i and rD. Once the values of these interest rates are set, demand determines the amount of credit and supply determines the volume of deposits. This in turn requires the maintenance of a volume of bank reserves which, in conjunction with the volume of credit granted, gives the size of the balance sheet. In these circumstances, it is precisely interbank borrowing which adjusts the funds raised on the deposit market to the investment requirements on the lending side.
The decision-making rules that determine the interest rate for loans and deposits are given by the following first-order conditions:
1 1
(A.1) (1+ — ) [ r + c U ni
i 4
(A.2) r iD = ( 1 + - - ) [ r - c i , ]
no
where the i superscript has been added in order to move away from the representative agent framework, and the variables relating to the reserve requirement ratio, which would influence the deposit interest rate, have been omitted, given the insignificant changes in the sample period used in the estimations of this paper. and r|'D denote elasticities of credit demand and deposit supply,
respectively, for each intermediary i while cL and c'D are, respectively, marginal operating costs of loans and deposits.
According to equation (A.1), the banking firm i sets the lending rate V'L in such a way that the marginal income and marginal cost of the loan are equal. The marginal cost is a function of the opportunity cost as reflected by a market rate, such as the interbank rate, and the increase in operating
6 See Klein (1971) and Monti (1973).
114
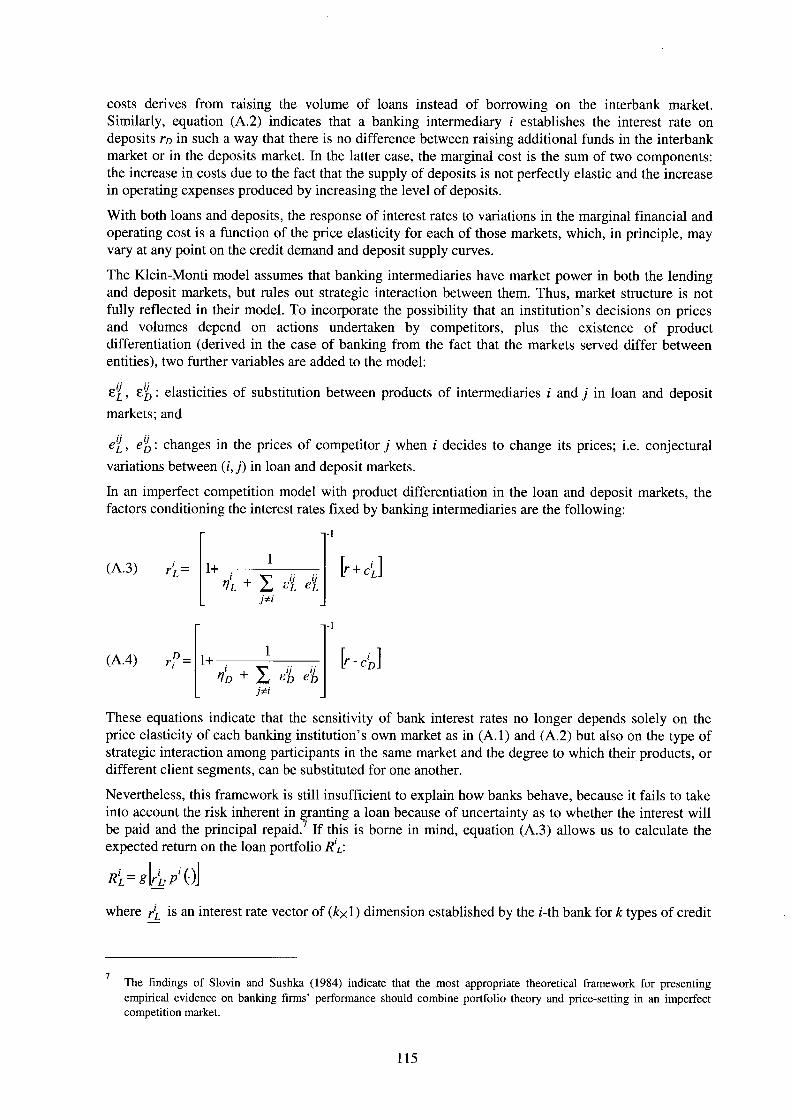
costs derives from raising the volume of loans instead of borrowing on the interbank market. Similarly, equation (A.2) indicates that a banking intermediary i establishes the interest rate on deposits ro in such a way that there is no difference between raising additional funds in the interbank market or in the deposits market. In the latter case, the marginal cost is the sum of two components: the increase in costs due to the fact that the supply of deposits is not perfectly elastic and the increase in operating expenses produced by increasing the level of deposits.
With both loans and deposits, the response of interest rates to variations in the marginal financial and operating cost is a function of the price elasticity for each of those markets, which, in principle, may vary at any point on the credit demand and deposit supply curves.
The Klein-Monti model assumes that banking intermediaries have market power in both the lending and deposit markets, but rules out strategic interaction between them. Thus, market structure is not fully reflected in their model. To incorporate the possibility that an institution's decisions on prices and volumes depend on actions undertaken by competitors, plus the existence of product differentiation (derived in the case of banking from the fact that the markets served differ between entities), two further variables are added to the model:
e'l, elJD : elasticities of substitution between products of intermediaries i and j in loan and deposit
markets; and
e'l, el]D : changes in the prices of competitor j when i decides to change its prices; i.e. conjectural
variations between (i,j) in loan and deposit markets.
In an imperfect competition model with product differentiation in the loan and deposit markets, the factors conditioning the interest rates fixed by banking intermediaries are the following:
(A.3) I _ RL ~ 1 + -
i'l + X ¿i e'i j*'
h i ]
(A.4) D_ ri - 1 + -1
ID + S e!¿ e'i)
[ - i ]
These equations indicate that the sensitivity of bank interest rates no longer depends solely on the price elasticity of each banking institution's own market as in (A.1) and (A.2) but also on the type of strategic interaction among participants in the same market and the degree to which their products, or different client segments, can be substituted for one another.
Nevertheless, this framework is still insufficient to explain how banks behave, because it fails to take into account the risk inherent in granting a loan because of uncertainty as to whether the interest will be paid and the principal repaid.7 If this is borne in mind, equation (A.3) allows us to calculate the expected return on the loan portfolio R'L-
tfWk'P'Oj
where r'L is an interest rate vector of (&xl) dimension established by the ;-th bank for k types of credit
The findings of Slovin and Sushka (1984) indicate that the most appropriate theoretical framework for presenting empirical evidence on banking firms' performance should combine portfolio theory and price-setting in an imperfect competition market.
115
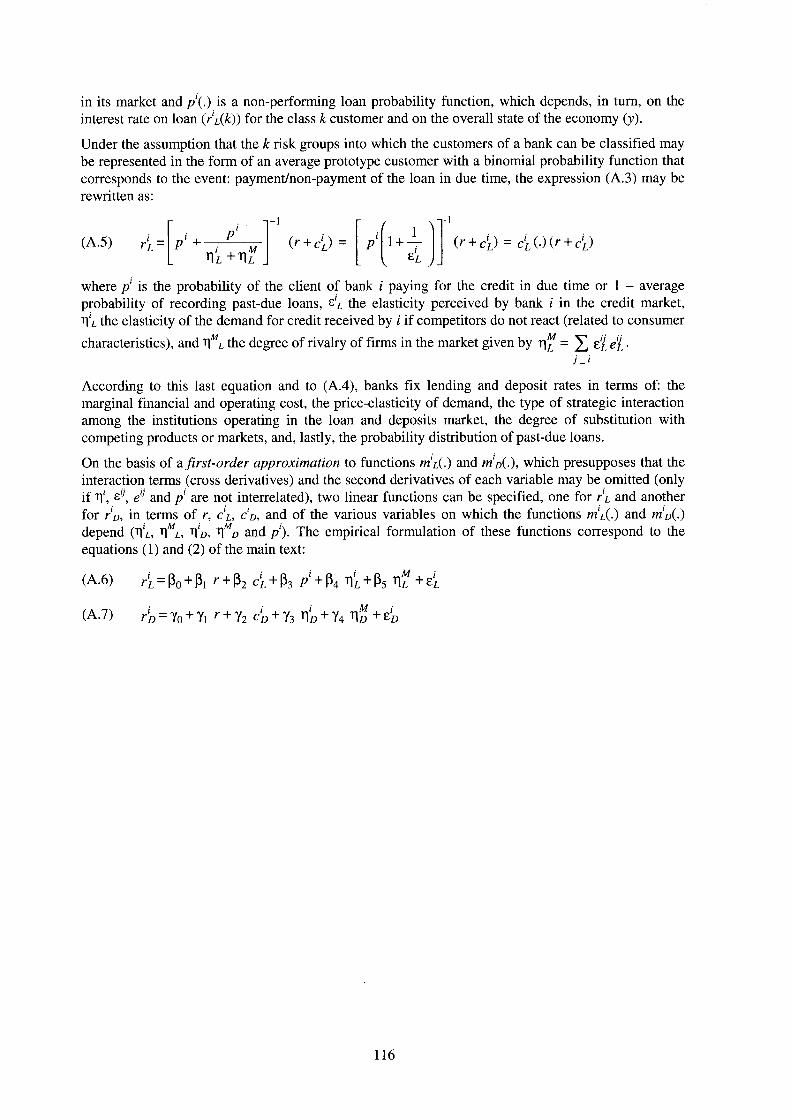
in its market and p{.) is a non-performing loan probability function, which depends, in turn, on the interest rate on loan ( ' / dk ) ) for the class k customer and on the overall state of the economy (>')•
Under the assumption that the k risk groups into which the customers of a bank can be classified may be represented in the form of an average prototype customer with a binomial probability function that corresponds to the event: payment/non-payment of the loan in due time, the expression (A.3) may be rewritten as:
(A.5) I . rf p + M
-1 {r + ci
I) = E'L V y
(r + ciI) = ci
L(.)(r + ciL)
where p is the probability of the client of bank i paying for the credit in due time or 1 - average probability of recording past-due loans, e'i. the elasticity perceived by bank i in the credit market, ti'l the elasticity of the demand for credit received by i if competitors do not react (related to consumer characteristics), and t\ml the degree of rivalry of firms in the market given by ^ e'l e'l •
j-i
According to this last equation and to (A.4), banks fix lending and deposit rates in terms of: the marginal financial and operating cost, the price-elasticity of demand, the type of strategic interaction among the institutions operating in the loan and deposits market, the degree of substitution with competing products or markets, and, lastly, the probability distribution of past-due loans.
On the basis of a first-order approximation to functions m ¡i. ) and m d(.), which presupposes that the interaction terms (cross derivatives) and the second derivatives of each variable may be omitted (only if "n1, e J and p are not interrelated), two linear functions can be specified, one for r'L and another for r'i), in terms of r, C'L, C'D, and of the various variables on which the functions and m'ai-) depend ("n'i, ViML, t Í d , ïï^d and p). The empirical formulation of these functions correspond to the equations (1) and (2) of the main text:
(A.6) R'I - ß 0 + ßi r + ß 2 C'L + ßs P + ß4 T|!l + ß5 r i f
(A.7) ¿ o = Yo + Yi r + y2 c^ + y3 rfo + Y4 + e'o
+ e't
116
Appendix 2
This section contains the main findings of the case-by-case analysis as summarised in Tables 6 to 8. It is divided in three parts each devoted to a specific area of the entities' activity.
Profit-generating capacity
The results for the first group of indicators, which attempt to measure entities' profit-generating capacity, are summarised in Table 6. As can be seen, the results are rather unclear, although there is generally a larger number of cases in which there is a worsening of profit-generating capacity, whatever the indicator used to measure it. Nonetheless, excluding the cases in which changes are no significant reveals some details of interest.
As can be seen, the effects of the mergers analysed appear to have different effects on the course of respectively financial charges and total income, with a higher number of negative changes in the case of total income, while positive changes predominate in financial charges. The improvement in financial expenses may be related to the increase in market power following the merger, owing to a larger market share in the regional area of operation.8 Negative effects on total income might be related to a shift in the balance sheet structure after the merger towards operations in areas with lower margins such as foreign exchange markets or money and securities market which substitute the traditional lending/deposit activity (see Table 8). More in-depth analyses would, however, be needed to confirm these hypotheses.
Nonetheless, if we analyse gross income margin, the final conclusions are less clear because the trend in total income offsets the improvement recorded in financial expenses. Thus, out of the 9 cases where there were significant changes in gross income, 4 were positive and 5 were negative. When analysing the net income the results are similar; 10 cases with significant changes, 5 of them positive and 5 negative.
Generally, in mergers between banks, the results are worse than in the case of savings banks since in 3 cases there was a significant worsening in profit-generating capacity measured in terms of net income and in 1 case a non-significant worsening. In the group of savings banks, out of a total of 14 cases, there was a significant improvement in profit-generating capacity in 5 cases, no substantial positive changes in 4 cases, no substantial negative changes in 3 cases and a significant worsening of the post-merger situation in only 2. In part, the worse behaviour of banks was the result of a bigger switch in activity towards operations with narrower spreads. As can be seen in Table 8, in all the mergers between banks there are significant reductions in the ratio of peseta lending and deposits to total assets, which is the business area with the highest spreads. The changes in business structure in savings banks were less evident and, although there was generally some switching in activity towards business areas other than traditional ones, the influence of these changes on profit-generating capacity is not clear owing to the low significance of these shifts.9
Efficiency and productivity
Table 7 illustrates the results obtained with the second group of indicators, which attempt to measure the efficiency of the institutions. In this case, the results are somewhat more positive, since in most of the cases there were improvements in productivity per employee, productivity per office, and, to a lesser extent, in the ratio of operating costs to average total assets. The effects of the mergers are less clear in the cases of the other two ratios as a consequence of the greater variability observed in the profit-generating capacity of institutions which have been through a merger.
Many of the mergers analysed are between savings banks, for which the reference market would b e the regional rather than the national market, where their share would b e much smaller.
The average reduction in the ratio of lending+deposits in pesetas to total assets is 773 basis points for mergers between banks and 125 basis points for savings banks.
117
Nonetheless, a more detailed analysis shows that, although mergers have a positive effect on the ratio of operating costs to average total assets, in 9 cases, the changes are barely significant. If we only consider those operations in which the effects of the merger are significant, the results are even more ambiguous. In the case of productivity per employee and productivity per office, the situation is more positive as the number of significant improvements is bigger than the number showing a worsening in both ratios.
As changes in gross income were generally larger than changes in operating costs, the efficiency ratio (operating costs/gross income) is more influenced by the changes in the latter variable. There is therefore a significant overlap between those institutions showing improvements in the generation of profits and those showing improvements in the efficiency ratio (see Tables 6 and 7).
What does seem clear is the relationship between productivity per employee and office and the ratio of operating costs to average total assets. Of the 9 cases in which there is an increase in the productivity of both factors, in 8 there is also an improvement in the latter ratio, while in the 4 cases in which there is a fall in productivity levels, in 3 of them there is a deterioration in this ratio.
When analysing the other efficiency ratios, which relate the level of operating costs to the level of income, the positive relationship is less clear. This is because, in certain cases, the productivity gain may have a negative impact on the level of income generation if it has occurred as a consequence of a growth in areas of business with lower margins.
This hypothesis is partly confirmed by the relationship which seems to exist between changes in the ratio of peseta loans and deposits to total assets and the growth of total assets after the merger. In general, mergers in which there is a larger fall in the above-mentioned ratio are those which show the highest growth in total assets. Intermediation activities in the foreign-exchange, money and securities markets are usually operations involving larger amounts than traditional lending/deposit activities and they therefore facilitate growth in total assets, albeit with lower operating margins. As a result, those institutions which have achieved higher rates of growth in their total assets, as a consequence of the shift of activity towards these areas of business, see a reduction in their operating costs in relation to total assets. However, the ratios of their operating costs to income will not necessarily fall, since their income may be affected by the change in the structure of the business.
There does not seem to be any clear relationship between a better ratio of operating costs to average total assets and the reduction in the numbers of employees and offices. In many cases in which the merger involves a reduction in staff, the gains are practically cancelled out by the increase in the costs per employee as a consequence of the impact of severance payments or because the reduction in staff is achieved through early retirement which does not reduce staff costs. A similar situation occurs, although to a lesser extent, when there is a reduction in the number of offices, since overheads per office tend to increase more than the sector average, thus reducing the impact of the saving on operating expenses. This effect could be associated with an increase in overheads due to internal reorganisation of the merged institutions. Of all the cases with a fall in the number of employees after the merger (9 cases), in only 1 was the decline in staff almost entirely reflected in the operating costs. On the other hand, of the 11 cases of reduction in the number of offices, reductions in the network were almost completely reflected in 4.
Improvements in productivity per employee seem to be more closely associated with changes in total assets after the merger than with a decline in the number of employees. In many mergers a fall (rise) in the number of employees does not, as expected, lead to a rise (fall) in their level of productivity. These discrepancies are explained by the subsequent change in total assets, with higher than average growth in those cases in which there was an increase in the number of employees and an increase in productivity and lower growth in the opposite case. However, productivity per office is much more closely related to the change in the number of offices and in 14 cases the expected relationship is observed. This difference is due to the fact that changes in the number of offices are, in general, more far-reaching than staff changes.
118
In certain cases the rationalisation of the institution has an immediate effect on the productivity ratios in the year immediately following the merger, which then gradually evaporates in subsequent years, as the number of offices or staff increases again. In these cases, the merger could be used to rapidly restructure the resulting institution, which then embarked on an expansion. This outcome only occurs in mergers between savings banks where institutions with a high degree of overlap in their office networks often merge. After such mergers, a sharp fall in the number of offices, and to a lesser extent, of employees, frequently occurs as a result of the reorganisation of the regional distribution network. However, this is followed by increases later on, due to expansion into other regions.
When comparing the changes in the number of employees and offices with the growth of total assets after the merger (see Tables 7 and 8), it is clear that in most cases in which, after the merger, there is an increase in market share, neither the number of employees nor the number of offices decreases (4 cases against 2). Conversely, in all those cases in which there is a reduction in the number of employees and offices, there is also a slowdown in the growth of total assets and losses of market share, except in one case, in which the result is uncertain.
All this may indicate the existence of two types of merger, those in which business expansion criteria predominate (increase in share and more employees and offices) and those in which criteria of cost cutting and productivity increases predominate (reduction in staff and offices even at the expense of losses of market share). However, the differences between these two groups are not clear since, as noted above, the reductions in staff and offices are not always reflected in changes in operating costs, so that the differences between the two groups in changes in their efficiency ratios are not very evident.
There does not seem to be a clear relationship between the previous level of efficiency of the institutions taking part in a merger and the values of the efficiency ratios in the subsequent period. Although, in general, mergers involving institutions which had higher efficiency levels subsequently show efficiency levels above those of the control group, some of the mergers involving institutions with efficiency levels below the average for the sector are those which then show better results in terms of efficiency (mergers 12, 8 and 13). This result may have a certain logic, since the possibility of achieving reductions in costs is greater in less efficient institutions, so that an improvement in the management stemming from the merger may give rise to rapid increases in the levels of efficiency.
Capital adequacy ratio
In relation to the possibilities for balance-sheet growth after mergers, one element which is definitely important is the increase which mergers tend to produce in the value of the capital-adequacy ratio. In fact, as can be seen in Table 8, in 11 of the 18 cases there is an increase in this ratio, of which 9 are significant. The results are even clearer if the situation of the last year prior to the merger is compared with the first after, since in 14 of the 18 cases there is then an increase in the capital-adequacy ratio. To a large extent, these increases reflect the incorporation into reserves of the capital gains arising from mergers, due to the revaluation of assets which were recorded on the books at historical cost. Although they are a purely accounting phenomenon, they widen the possibilities for growth of the institutions by increasing the balance of available eligible capital. This is most important for savings banks since, when they lack capital, they find it more difficult to increase their own funds.
In various of the mergers analysed, the value of the capital-adequacy ratio decreases after the merger. This could indicate that the institutions have taken advantage of the capacity for growth generated by the increase in capital.
There seems to be an apparent relationship between the increase in capital adequacy ratio and profit-generating capacity. Out of the 8 entities posting an increase in their net income as a percentage of average total assets, in 6 there was an increase in the capital adequacy ratio. Yet of the 9 cases where net income deteriorated, the capital adequacy ratio diminished in 5 instances. Possibly, the improvement in entities' capital adequacy may have a positive influence on the cost of resources obtained in the markets, thus contributing to increasing the operating margins of entities with greater increases in their capital adequacy ratio.
119

References
Arellano, M. and S.R.Bond (1988): "Some tests of specification for panel data: Monte Carlo evidence and an application to employment equations". Institute for Fiscal Studies, Working Paper, 88/4.
Klein (1971): "A theory of the banking firm". Journal of Money, Credit and Banking, May, pp. 205-18.
Monti (1973): "A theoretical model of bank behaviour and its implications for monetary policy". Société Universitaire Européenne de Recherches Financières, reprint of L'Industria, No. 2 (1971).
Slovin, M. B. and M. E. Sushka (1984): "A note on the evidence in alternative models of the banking firm". Journal of Banking and Finance, 8, pp. 99-108.
120