Calcareous nannoplankton from middle and upper Eocene rocks at Gebel Mokattam, East-Cairo, Egypt
Upload
independentCategory
view
3download
0
J. Appl. Geophys., Vol. 6, No. 2, September 2007, 47-63.
47
IMPACTS OF TOC AND ROCK-EVAL PYROLYSISON THE ELECTRICAL BEHAVIOUR
OF SAFA FORMATION COAL SEAMS, GEBEL EL MAGHARA, NORTH SINAI, EGYPT
By
Bassem S. Nabawy1 and Mohamed M. El Nady2 1National Research Centre, Department of Geophysical Sciences, Dokki, Cairo, Egypt.
2Department of Exploration, Egyptian Petroleum Research Institute, Cairo, Egypt.
ABSTRACT The electrical behaviour or prints of the Jurassic Safa coal sequence of Gebel El
Maghara mine in North Sinai were matched at stepwise 21 selected frequencies from 1 to 100 kHz in dry, fresh water and saline water states. The electric print; in the present study, is a term used to match the electrical behaviour of coal samples, represented as electrical resistivity (R) against the used current frequency (f). The electrical behaviour and bulk density of the coal samples have been studied to offer a rapid and cheap method for estimating the Total Organic Carbon (TOC) and the highest hydrocarbon content (S2) of the Safa coal seams in Gebel El Maghara, North Sinai. From the matched coal electric prints, it is concluded that only one electric print could be matched in the dry state. It is differentiated into 3 stages; abrupt drop stage (1-10 kHz), transition stage (10-20 kHz) and steady stage (20-100 kHz). On the other hand, four electric prints were matched in full saturation fresh water and six prints in the saline water state were also matched. The behaviour is more complex in both cases, due to the ionic exchange between the interstitial water and the solid conductors. Estimation of total organic carbon content (TOC) and Rock-Eval pyrolysis on the samples indicated that the Safa coal samples consist of mixed kerogen types II/III, with a very good source rock of high maturity level with oil and gas prone and does not generate one type of oil. The most strongly oil prone coals analyzed here would be expected to generate waxy oils. In parallel to Schmoker and Hester's equation (1983), two equations were introduced to calculate the TOC and S2 of the Safa coal samples in terms of their bulk density. Electrical resistivity, on the other hand, has a good contribution for the TOC of coal samples, so TOC is possible to be calculated in terms of R at the different frequencies in the dry state.
INTRODUCTION Coal as a fossil renewable fuel is
important source for energy production. In Egypt, it is found mainly in the Jurassic sequence with considerable reserves but of low quality. It was first discovered in 1966 by Al Far in Gebel El Maghara area in North Sinai. The Gebel El Maghara area lies in north
Sinai; about 50 km south of the Mediterranean sea coast, between longitudes 33°10′ and 33°35′E and latitudes 30°35′ and 30°50′N (Fig. 1). It is a NE–SW trending asymmetrical doubly plunging anticline, concordant with the Syrian arc structural trend through northern Sinai.

48 Bassem S. Nabawy and Mohamed El Nadi
Fig. 1 Location Map of Gebel El Maghara Mine, Sinai Peninsula.
The core of El Maghara area is dome-like and the northwestern flank dips with about 25°, while the southeastern flank is very steep, nearly vertical, or overturned, where it is bounded by a major thrust fault with Jurassic rocks riding over the Lower Cretaceous section (Moustafa and Khalil, 1990).
The Jurassic sediments are exposed at the core, whereas the Cretaceous and Eocene sediments form the flanks. It is about 54 km long and 30 km wide and has a total area of approximately 1300 km2. The area is one of the most important structural features in Egypt, since it represents one of the major Jurassic outcrops in north Sinai, where the sole coal mine of Egypt is located; in addition, it is the type section of the Jurassic exposures in north Sinai.
The Jurassic sequence in Gebel
El Maghara area has been subjected to many geologic and palaeontological studies by many authors such as Farag (1959), Kostandi (1959), Al Far (1966), Jenkins (1990), Moustafa and Khalil (1990), Said (1990) and Kassab (2004). Many studies have been carried out on the electrical properties of sedimentary rocks in the frequency ranges less than 1 kHz but few studies were done based on the frequencies from 1 kHz up to 100 kHz, so the present work was conducted within this range. In a trial to calculate TOC from the density logs from Bakken Formation, USA, Schmoker and Hester (1983) offered the following simple equation.
TOC = (154.497 / ρ) – 57.261 Where: ρ is the formation density.
They mentioned that, the constants in this equation are specifically used for a particular formation, member or area. Hence, in parallel to the Schmoker and Hester's equation, a trial has been done to offer a precious and more suitable empirical equation to determine the TOC of coal samples of Safa Formation as a cheap and fast tool.
GEOLOGIC SETTING AND OCCURRENCE OF COAL Following Al Far (1966), the
Jurassic sequence in Gabal El Maghara has been subdivided into six formations, namely, Mashaba at the base, Rajabia, Shusha, Bir Maghara, Safa and Masajid Formation at the top. They range in age from Liassic to Kimmeridgian and are approximately 1850 to 1935m thick. The studied sequence represents three cycles of intercalated sea regressions and transgressions. The Safa Formation (Bathonian) is the most well known
Gebel El Maghara

IMPACTS OF TOC AND ROCK-EVAL PYROLYSIS 49
formation in the sequence of Gebel El Maghara, due to the presence of the coal producing seams in its lower part. It is composed mainly of about 215 m of brownish, cross-bedded and ripple-marked calcareous sandstones, well represented at wadi Safa. The sandstones of the Safa Formation are intercalated with dark grey and brownish claystones and yellow calcareous marl. Mostafa and Younes (2001) studied the coal of the Safa Formation. They stated that, the lower part of this formation includes the economic coal bearing beds of Gebel El Maghara. At least 11 coal seams of a rather lenticular shape were recorded in this part of the Safa Formation (Al Far, 1966; and Issawi et al., 1999).
The thickness of the main coal seam in Gebel El Maghara area ranges from 130 to 190 cm and the geologic coal reserve is estimated to be 52 Mt, based on the drilling data from more than 50 exploration wells. These coals are interpreted as having been deposited in lakes or lagoons adjacent to the coastline (Jenkins, 1990). Hassan et al. (1989) concluded that, the Safa Formation was deposited from acid tropical soils in continental estuarine to very shallow marine environments, interrupted by fluviomarine or continental phases.
From field investigations during the sampling process, it was found that, the Safa coal seams suffer from the groundwater content throughout the Safa Formation. Many studies, carried out on the groundwater of the Safa Formation showed that, it is highly mineralized and considered as palaeowater resulted from a simple mixing of meteoric and saline connate waters.
METHODOLOGY The main two seams of the Safa
coal sequence in Gebel El Maghara mine were sampled for the present work. The hand samples were cored and sliced as discs (2.5 cm diameter and 3-5 mm thickness). Analyses of the total organic carbon content (TOC) and Rock-Eval pyrolysis of the samples were performed with a Leco WR112 and Rock-Eval II apparatus and a standard methodology described in Espitalié et al. (1985) and Peters (1986).
Two-electrodes electric measurements were obtained matching the electrical behaviour of the studied samples with a Hioki 3522-50LCR, Hitester impedance analyzer up to 100 kHz. Low-frequency electrical measurements are sensitive to pore-fluid chemistry and the electrochemistry of a metal-fluid contact (Slater, et al., 2005). Consequently, the apparent electrical resistivity of the prepared discs was matched in ambient conditions at stepwise 21 selected frequencies within a range of 1 to 100 kHz at three states; the dry, the fresh water saturation (3.5 kppm NaCl, equivalent to the mean TDS of the fluvial water) and the saline water saturation (35 kppm NaCl, equivalent to the mean TDS of the Mediterranean sea water). These two fresh and sea waters' TDS have been chosen as two extremes of the TDS in the studied area. Bulk density and connected porosity were measured using the saturation method introduced by Rzhevsky and Novik (1971), Anderson (1975), Dakhanova (1977).
50 Bassem S. Nabawy and Mohamed El Nadi
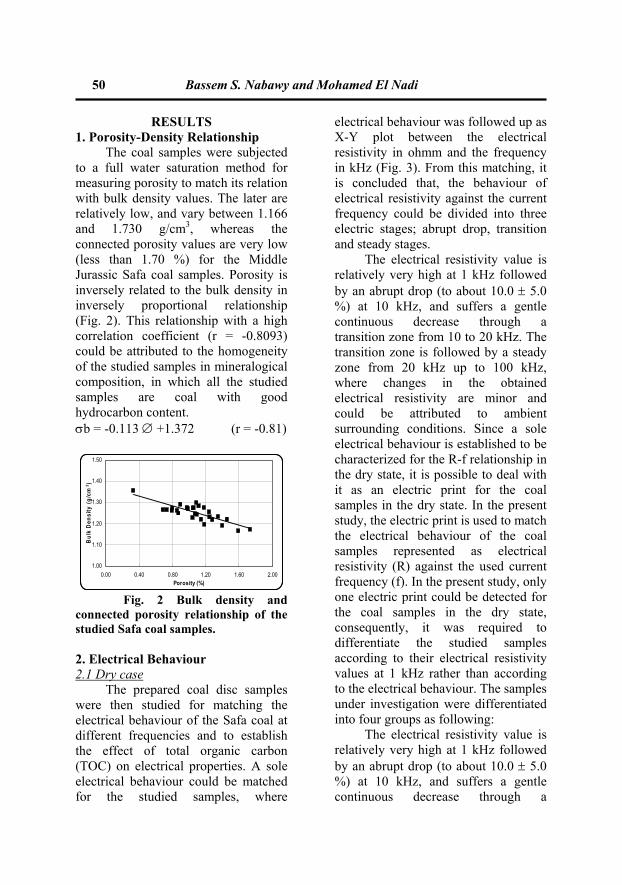
RESULTS 1. Porosity-Density Relationship
The coal samples were subjected to a full water saturation method for measuring porosity to match its relation with bulk density values. The later are relatively low, and vary between 1.166 and 1.730 g/cm3, whereas the connected porosity values are very low (less than 1.70 %) for the Middle Jurassic Safa coal samples. Porosity is inversely related to the bulk density in inversely proportional relationship (Fig. 2). This relationship with a high correlation coefficient (r = -0.8093) could be attributed to the homogeneity of the studied samples in mineralogical composition, in which all the studied samples are coal with good hydrocarbon content. σb = -0.113 ∅ +1.372 (r = -0.81)
Fig. 2 Bulk density and
connected porosity relationship of the studied Safa coal samples.
2. Electrical Behaviour 2.1 Dry case
The prepared coal disc samples were then studied for matching the electrical behaviour of the Safa coal at different frequencies and to establish the effect of total organic carbon (TOC) on electrical properties. A sole electrical behaviour could be matched for the studied samples, where
electrical behaviour was followed up as X-Y plot between the electrical resistivity in ohmm and the frequency in kHz (Fig. 3). From this matching, it is concluded that, the behaviour of electrical resistivity against the current frequency could be divided into three electric stages; abrupt drop, transition and steady stages.
The electrical resistivity value is relatively very high at 1 kHz followed by an abrupt drop (to about 10.0 ± 5.0 %) at 10 kHz, and suffers a gentle continuous decrease through a transition zone from 10 to 20 kHz. The transition zone is followed by a steady zone from 20 kHz up to 100 kHz, where changes in the obtained electrical resistivity are minor and could be attributed to ambient surrounding conditions. Since a sole electrical behaviour is established to be characterized for the R-f relationship in the dry state, it is possible to deal with it as an electric print for the coal samples in the dry state. In the present study, the electric print is used to match the electrical behaviour of the coal samples represented as electrical resistivity (R) against the used current frequency (f). In the present study, only one electric print could be detected for the coal samples in the dry state, consequently, it was required to differentiate the studied samples according to their electrical resistivity values at 1 kHz rather than according to the electrical behaviour. The samples under investigation were differentiated into four groups as following:
The electrical resistivity value is relatively very high at 1 kHz followed by an abrupt drop (to about 10.0 ± 5.0 %) at 10 kHz, and suffers a gentle continuous decrease through a
1.00
1.10
1.20
1.30
1.40
1.50
0.00 0.40 0.80 1.20 1.60 2.00Porosity (%)
Bul
k D
ensi
ty (
g/cm
3 )

IMPACTS OF TOC AND ROCK-EVAL PYROLYSIS 51
transition zone from 10 to 20 kHz. The transition zone is followed by a steady zone from 20 kHz up to 100 kHz, where changes in the obtained electrical resistivity are minor and could be attributed to ambient surrounding conditions. Since a sole electrical behaviour is established to be characterized for the R-f relationship in the dry state, it is possible to deal with it as an electric print for the coal samples in the dry state. In the present study, the electric print is used to match the electrical behaviour of the coal samples represented as electrical resistivity (R) against the used current frequency (f). In the present study, only one electric print could be detected for
the coal samples in the dry state, consequently, it was required to differentiate the studied samples according to their electrical resistivity values at 1 kHz rather than according to the electrical behaviour. The samples under investigation were differentiated into four groups as following:
Log R = A Log f + B
Where, A is more or less a stable factor equals -1.10 ± 0.2, and B equals 8.54 ± 0.32 with a correlation coefficient more than 0.98.
The B factor increases with increasing the electrical resistivity values; B ∝ R
Group (a) Group (b)
Group (c) Group (d)
Fig.3: Resistivity-frequency relationship of the studied Safa coal samples in the dry state.
0
10000
20000
30000
40000
50000
60000
70000
80000
0 20 40 60 80 100Frequency (kHz)
Res
istiv
ity (o
hmm
)
0
20000
40000
60000
80000
100000
120000
140000
160000
0 20 40 60 80 100Frequency (kHz)
Res
istiv
ity (o
hmm
)
0
50000
100000
150000
200000
250000
300000
0 20 40 60 80 100Frequency (kHz)
Res
istiv
ity (o
hmm
)
0
50000
100000
150000
200000
250000
300000
350000
400000
0 20 40 60 80 100Frequency (kHz)
Resi
stiv
ity (o
hmm
)

52 Bassem S. Nabawy and Mohamed El Nadi
In an attempt to offer an empirical equation for the different studied Safa coal samples and to calculate f or R in terms of the other parameters, the following equation could be used.
Log R = -1.11 Log f + 8.70 (r = -0.94)
This equation satisfies a total of 97 % of the studied coal samples with sufficient precision.
2.2 Fresh water case
Wet porous rocks are generally heterogeneous and multiphase systems with a complicated internal structure. Both the electric and hydraulic properties are governed by pore space geometry and the clay type, content and distribution. The apparent electrical resistivity, as a function of frequency, is used to solve the true resistivity as a function of mineralogical composition and internal pore structure (Börner et al., 1996).
So, matching the electrical behaviour of the studied coal samples is a necessity to follow up their behaviour under the saturation case with fresh water. From the present study, it is possible to match four electric prints of the Safa coal samples. In the fresh water case, there is a possibility for dissolving and transferring some salts from the solid phase into the fresh water phase to act in a way different from that in the dry case which adds some complexity to the electric print in the dry case.
The first print of the coal samples in the full saturation fresh water case of Group (a), 39 % of the samples are similar to that obtained for the dry state, but with wider zones for both the abrupt change and transition zones
(Fig. 4). The abrupt change is within the zone from 1 to 10 kHz (to about 50 % decrease at 5 kHz and to 25 % at 10 kHz), whereas the transition zone could be matched from 10 to 60 kHz, in which the decrease in the electrical resistivity with increasing the frequency is relatively low (to 15 % at 15 kHz, to 10 % at 20 kHz and to 3 % at 60 kHz). The third steady zone is extended from 60 kHz up to 100 kHz, where there is a neglected or no change from 3 % at 60 kHz to 2 % at 100 kHz. However, for some samples, the transition and steady stages were found to be replaced by a slight curvature stage extended from the 10 kHz to 100 kHz.
In a similar way to the electric print of the samples measured in the dry state, the electrical resistivity values could be calculated from the measured frequency using a simple linear equation:
Log R = -0.71 Log f + 7.28 (r = -0.86)
Another electric print could be identified for the studied samples in the fresh water state. For Group (b), 39 % of the studied samples, where the X-Y plot of the R-f relationship indicates a more or less linear relationship with a slight curvature, in which there is only one stage through it, with a consequent decrease of the R into 25-70 % with increasing of f (Fig. 4).
For Group (b), the R-f relationship is still possible to be figured in the X-Y plot. Also, the electrical resistivity could be calculated from the measured frequency using the following second order equation: Log R=-0.24 Log f 2 + 1.68 Log f + 1.47
(r = -0.92)

IMPACTS OF TOC AND ROCK-EVAL PYROLYSIS 53
A third electrical behaviour could be observed for the coal samples of Group (c) (11 % of the samples), where the electrical behaviour could be distinguished into two stages. In, the first one, from 1 to 10 kHz, there is a gentle peak, where the electrical resistivity increases slightly with increasing the frequency from 1 to 5 kHz, followed by a decrease of the R values. The second stage could be defined as a gentle decrease of the R values (Fig. 4) in a similar way to the electric print of Group (b). The R-f relationship is expressing by the following equation:
LogR= -0.39 Log f 2+ 2.74 Log f -0.20 ( r = -0.97)
A fourth electric print could be shown for 11 % of the studied samples, Group (d), where the behaviour of the samples is similar to that of Group (b) and Group (c), but with sharp peak at 5 kHz and behaves like that of Group (b) with another decrease, followed by a gentle one through a slight curvature stage from 10 to 100 kHz (Fig. 4). However, the following equation is applied for these samples. Log R=-0.367 Log f 2 + 2.58 Log f - 0.09
(r = -0.95)
Group (a) Group (b)
Group (c) Group (d)
Fig. 4 Resistivity-frequency relationship for the full fresh water saturated coal samples of the Safa Formation.
0
50000
100000
150000
200000
250000
300000
0 20 40 60 80 100Frequency (kHz)
Res
istiv
ity (o
hmm
)
4000
6000
8000
10000
12000
14000
16000
0 20 40 60 80 100Frequency (kHz)
Resi
stiv
ity (o
hmm
)
0
5000
10000
15000
20000
25000
30000
0 20 40 60 80 100Frequency (kHz)
Res
istiv
ity (o
hmm
)
0
5000
10000
15000
20000
25000
0 20 40 60 80 100Frequency (kHz)
Res
istiv
ity (o
hmm
)

54 Bassem S. Nabawy and Mohamed El Nadi
2.3 Saline Water Case For the saline water case, the
electrical behaviour of the coal samples is more complex than the dry and full saturation fresh water cases, due to the ionic exchange between the saline water and solid matrix. This ionic exchange may lead to some lime-mud effects, as minor to major circuits cause some anomaly and shifting from the behaviour in both the fresh water and dry cases. It is possible to match six electric prints for the electrical resistivity-frequency relationship.
The first behaviour was detected for Group (a) (11 % of the coal samples, Fig. 5) is similar to that obtained in both the dry and fresh water cases, where the electric print could be differentiated into three stages. In the first one (1 to 10 kHz), there is a drop in the resistivity value to 25 % at 10 kHz, followed by a transition zone from 10 to 20 kHz, where the R values change into 20 %, while the third steady stage extends from 20 to 100 kHz.
In a similar way to the first print of the fresh water state, the transition stage may extend to 100 kHz. The behaviour of this R-f relationship could be matched using the following equation: Log R = -0.57 Log f + 5.32 (r = -0.96)
From the former equation, and in correlation with the normal behaviour matched for the coal samples in the dry state and for 39 % of the samples in the fresh water saturation state (Group a), it can be deduced that constant A (-0.57 in the former equation) increases with
increasing the salinity of the interstitial pore saline, whereas B (5.32) has an inversal behaviour.
Another print could be identified for the saline water case (Group b, 14 % of the samples). It is also similar to that obtained for the fresh water case, where the X-Y plot of R-f relationship indicates a more or less linear relationship with a slight curvature. There is only one stage through it, with a consequent decrease of the R into 25-65 % with increasing the f values (Fig. 5). Log R = -0.12 Log f 2 + 0.81 Log f+2.53
(r = -0.99) The third print, which could be
identified for the coal samples under the present saline condition, is characterized by a sharp peak at 10 kHz (sharper than that of the fresh water case) through an abrupt change stage extends to 20 kHz, followed by a slight curvature stage, with a continuous decrease of the R against f (Group c, 18 % of the samples, Fig. 5). A second order equation could be used to calculate the R or f in terms of each with high correlation coefficient. Log R = -0.15 Log f 2 + 1.17 Log f+1.90
(r = -0.93) The fourth electric print is
characterized by a signal-like behaviour through the first stage (1 to 10 kHz, signal stage), followed by a slight curvature stage up to 100 kHz (Group d, 11 % of the samples) as shown in figure 5. The following equation represents the electrical behaviour of samples of Group (d).
Log R = -0.12 Log f 2 + 0.82 Log f+2.79 (r = -0.96)
Another electrical behaviour could be matched (Fig. 5) with some shift from the fourth one, where the

IMPACTS OF TOC AND ROCK-EVAL PYROLYSIS 55
signal stage is present and extends from 1 kHz up to 10 kHz, followed by a steady stage up to 100 kHz. In this print, the signal stage is characterized by an abrupt drop of the resistivity value to 35 % at 5 kHz, and then goes back with an increase to about 50 % at 10 kHz. In some cases, the steady state may be replaced by a slight curvature stage.
This behaviour is characterizes about 28 % of the studied samples (Group e). The following equation is applied for calculating one of the used electric parameters in terms of the other.
Log R= -0.01 Log f 2 - 0.03 Log f+2.95 (r = -0.95)
Group (a) Group (b)
Group (c) Group (d)
Group (e) Group (f)
Fig. 5 Resistivity-frequency relationship of full saline saturated the Safa coal samples.
0
2000
4000
6000
8000
10000
12000
0 20 40 60 80 100Frequency (kHz)
Res
istiv
ity (o
hmm
)
4000
4500
5000
5500
6000
6500
7000
7500
8000
8500
0 20 40 60 80 100Frequency (kHz)
Res
istiv
ity (o
hmm
)
0
5000
10000
15000
20000
25000
30000
35000
40000
45000
50000
0 20 40 60 80 100Frequency (kHz)
Res
istiv
ity (o
hmm
)
5000
5500
6000
6500
7000
7500
8000
8500
9000
0 20 40 60 80 100Frequency (kHz)
Resi
stiv
ity (o
hmm
)
0
200
400
600
800
1000
1200
0 20 40 60 80 100Frequency (kHz)
Resi
stiv
ity (o
hmm
)
2500
2700
2900
3100
3300
3500
3700
3900
0 20 40 60 80 100Frequency (kHz)
Res
istiv
ity (o
hmm
)

56 Bassem S. Nabawy and Mohamed El Nadi
The last electric print of the coal samples in the full saturation saline water state is characterized by behaviour different from that of the other prints, where there is an increase stage from 1 to 10 kHz, followed by a steady state from 10 to 60 kHz, then a slight curvature stage from 60 to 100 kHz. In many cases, the steady stage may extend to 100 kHz. This print is characteristic for Group f (18 % of the samples, Fig. 5).
The following equation is applied for this electric print. Log R = -0.052 Log f 2 + 0.52 Logf+1.85
(r = -0.97)
3. Maceral composition and bulk properties
In hand specimen, the coal is dark brown to black in color, hard, compact, having dull luster, and conchoidal fracture. It is massive, possessing fine-grained texture. The streak of coal is dark brown. It is characterized by a substantial amount of finely disseminated grains of iron sulphides, mainly pyrite, which is the dominant constituent of mineral matter, being about 6.5 % by weight. Coal samples from the main two seams are generally vitrinite-rich (averaging 70% vitrinite) with approximately 23% liptinite and minor amount of inertinite, 5-6% (Mostafa and Younes, 2001). It is ranked as brown coal or lignite to subbituminous coal, i.e. of high moisture content, low in heat values and of low degree of coalification (Pettijohn, 1984). 4. Rock-Eval Pyrolysis
Source rock richness was determined by a total pyrolysis technique and measurements of the total organic
carbon in terms of weight percent of organic carbon in the whole rock. A threshold value for carbon richness was taken as 0.5 wt % TOC. Thus, samples contain TOC (wt %) less than 0.5 % are considered poor. From 0.5 to 1.0 % are fair and those contain more than 1.0 % are good source rocks (Waples, 1985, and Peters, 1986).
The source rocks within the Safa Formation are characterized by TOC values between 5.46 and 10.50 wt % (Table 1) representing very good source rocks for the hydrocarbon generations. These measured results are also evidenced by the pyrolysis derived “S2” value; this varies from 12.46 to 17.24 mg/g. These values show a good agreement with the measured TOC results. The hydrogen index values of the Safa Formation range from 118 to 287 mg/g (Table 1), and OI (oxygen index) ranges from 143 to 211 mg/g indicating that, the organic matter of Safa Formation is classified as mixed type II/III (Fig. 6). This type of kerogen is deposited under anoxic condition (Peters et al., 2000).
Fig. 6 Kerogen type identification.
050
100150200250300350400450500
0 50 100 150 200 250
Oxygen Index (mg CO2/ g TOC)
Hyd
roge
n In
dex
(mg
HC
/g T
OC
) Type I
Type II
Type III

IMPACTS OF TOC AND ROCK-EVAL PYROLYSIS 57
Table 1. The measured TOC and Rock-Eval Pyrolysis data for the studied Safa coal samples, Gebel El Maghara, North Sinai.
S. No. TOC (wt %)
S1 (mg/g)
S2 (mg/g)
S3 (mg/g)
Tmax ( OC)
HI (mg/g)
OI (mg/g)
1
2
3
4
5
6
7
8
9
10
11
12
13
14
15
16
17
18
19
20
21
22
23
24
25
26
27
28
6.18
8.19
9.26
7.92
8.17
6.19
9.20
5.46
9.24
9.43
9.33
5.57
7.30
9.55
8.21
8.43
9.33
5.55
9.31
10.50
8.29
9.33
9.42
5.56
9.39
10.00
8.12
9.42
7.11
7.10
8.18
8.14
7.10
8.10
9.35
6.40
9.14
8.50
10.24
6.24
8.40
8.66
9.10
9.00
9.00
6.21
8.11
9.50
7.20
8.88
9.00
6.48
7.59
8.24
8.00
8.95
14.42
15.09
15.28
15.24
16.28
15.44
15.48
15.46
14.24
16.55
14.44
13.68
12.46
16.46
14.18
14.15
17.10
15.28
13.41
12.42
15.25
16.18
16.20
15.98
17.24
15.42
14.12
15.15
9.61
13.10
13.81
11.75
11.68
10.21
15.36
9.17
17.51
16.50
16.79
10.03
15.44
16.04
13.96
16.88
16.79
10.10
17.69
16.80
15.34
15.86
16.49
9.45
16.62
17.90
14.70
16.96
444
445
453
455
438
446
436
438
449
459
456
440
448
440
439
444
436
445
455
453
455
458
456
446
454
440
440
445
233
184
165
192
199
249
168
283
154
176
155
246
171
172
173
168
183
275
144
118
184
173
172
287
184
154
174
161
155
160
149
148
143
165
167
168
190
175
180
180
211
168
170
200
180
182
190
160
185
170
175
170
177
179
181
180
TOC: Total Organic Carbon (weight percent of the whole rock). S1: Low hydrocarbon yield and values are mg hydrocarbon/g rock. S2: High hydrocarbon yield (mg hydrocarbon/ g rock). HI: Hydrogen index and values are mg hydrocarbon (S2)/g TOC. OI: Oxygen index and values are mg CO2/g TOC. Tmax: The temperature at which the maximum pyrolytic hydrocarbon (S2) liberated.

5
togpetinteprowerlowcomtharelahigunrenvdepoccvegand
madetsturanThefromo6 sgasgenthemoheroilsgenass 5. T
to (19agato
58
The Rock–Evgether with the trographical charerpreted in termocesses. The in sitre formed in a we
wer delta plain mprised of the remat inhabited theseatively high sulphgh hydrogen indicrestricted seawvironment. These pleted in woody mcurrence of prgetation at the depod Younes, 2001).
The maturity atter for the Safa termined by the R
udied coal samplenging from 439o tese data indicatem the Jurassic
ostly mature sourchows that the coas prone and also innerate one type ofe character of oils ost strongly oil prre would be expecs. The less oil nerate gas/condsociated oils may n
TOC -Density ReIn the present
Schmoker and 983) the measureainst the reciproca
offer an empir
Bassem S. Naba
val results for the cogeochemical a
racteristics can ms of depositiotu El Maghara coet forest–swamp in
setting, and mains of plant spece environments. Thur contents and ces of coals suggward depositio
coals are relativmaterial suggesting
redominantly leositional site (Most
level of the orgaFormation could
Rock-Eval Tmax. Tes have Tmax valuto 455oC, (Table e that, coal sampSafa Formation
ce rocks. Also Figal samples are oil anfers that, it does f oil but instead twill be variable. Trone coals analyz
cted to generate waprone coals wo
densate, but anot be waxy.
elationship work, and in para
Hester's equatd TOC was plot
al of the bulk densrical equation w
awy and Mohame
oals and be
onal oals n a are
cies The the
gest onal vely the
eafy tafa
anic be
The ues 1).
ples are ure and not that The zed axy uld any
allel tion tted sity
with
accepThe satisfiTOC bulk equatTOC
used correand iSafa into lS2 =
as a fu 6. TO
were studysatursaturR relthe dfreshon thnameand trelatidifferkHz, critic
ed El Nadi
ptable precision (r obtained relation
fies 75 % of the stucontent can be density data usi
tion. = (15.892/ρ) - 3. S2 data are mo
as a function inelation coefficienit satisfies 93 %samples, with n
levels like the TO(34.333 / ρ) – 12
Fig. 7 TOC of function in the bulk
OC - Resistivity RThe electrica
obtained for thy, the dry staation state anation states. Howlationship could dry state to avoih water or salinhe matched elecely, the electrolthe ionic exchanionship was rent studied fre
from these frecal frequencies a
= 0.6513, Fig. 7)nship of TOC-ρudied samples. The
determined froming the following
844 (r = 0.65)
ore reliable to ben ρ, it has highernt (r = 0.7999)
% of the studiedno differentiationOC (Fig. 8). .401 (r = 0. 80)
Safa coal samplek density.
Relationship al resistivity datahe three states oate, fresh waterd saline waterwever, the TOConly be traced inid the interstitia
ne water impactsctrical behaviourlyte conductivitynge. The TOC-Rtraced at the
equencies 1-100equencies only 6are selected to be
). ρ e
m g
)
e r ) d n
)
s
a f r r -n al s r y R e 0 6 e

IMPACTS OF TOC AND ROCK-EVAL PYROLYSIS 59
matched, at 1, 5, 10, 20, 50 and 100 kHz.
Plotting the TOC as a function of log R (Fig. 9), enabling the calculation of TOC in terms of R at the different current frequencies using the following equations:
Log R1 = 0.11 (TOC)+4.41 (r = 0.80)
Log R5 = 0.12 (TOC)+3.54 (r = 0.81)
Log R10= 0.11 (TOC)+3.26 (r = 0.75)
Log R20= 0.12 (TOC)+2.87 (r = 0.79)
Log R50= 0.12 (TOC)+2.87 (r = 0.79)
Log R100= 0.13(TOC)+2.03(r = 0.78)
The TOC, therefore; as a function of logarithm R at the different applied frequencies, could be presented as a simple linear equation in the form:
Log Rn = A * (TOC) + B Where; Rn is the measured
electrical resistivity at n frequency, A and B are two constants, A value equals to 0.12 ± 0.1, whereas B decreases with increasing the current frequency.
Fig. 8 S2 of Safa coal samples as a function in the bulk density.
DISCUSSION In the present study, it was
possible to detect only one electric print for the 100 % coal samples in the dry state with abrupt change in the R by increasing the applied frequency from 1 to 10 kHz, followed by a transition stage with little changes (10-20 kHz) and steady stage (20-100 kHz). This is in agreement with the mixture laws, which show that, the dielectric constant gives normal values at frequencies more than 10 kHz.
The same agreement was revealed only for about 36 % of the coal samples in the full saturation fresh water state, but the electrolytic effect minimizes the abrupt drop in the first stage into only 25 % of the original value at 1 kHz, instead of 10 % in the dry state and also extended the transition zone to be from 10 to 60 kHz. On the other hand, only 11 % of the studied samples in the saline water state retained the same electric print recorded for the dry samples with a drop to 35 % at 10 kHz in the first stage and down to 25 % at 20 kHz for the transition zone. These recorded samples for both the full saturation fresh and saline water states are expected to have the lowest clay content and the lowest ability for ionic exchange. In the full saturation fresh water and saline states, electrical behaviour is more complex than the simple print in the dry case, where the electrical resistivity measured for the coal samples seems to be physically uncontrolled by the effective porosity, though it is less than 1.7 %, i.e. the coal samples are so sensitive to the minor free pore NaCl electrolyte. A good matched shift and many modifications were detected from one electric print in the dry case into four prints in the fresh
10.0
12.0
14.0
16.0
18.0
20.0
0.72 0.74 0.76 0.78 0.8 0.82 0.84 0.86 0.881/ρ
S2 (m
g/g)

60 Bassem S. Nabawy and Mohamed El Nadi
water case and into six simple to complex electric prints in the saline water case.
This could be attributed to the electric sharing of the electrolyte anions in the bulk electrical resistivity in the saline water case and to the main share of the anion - cation exchange between the free pore NaCl electrolyte and the charged solid fine content, mainly clays, in both the fresh and saline water cases and, also in what is known as electrical double layers of charges developed at the clay-electrolyte interfaces (Clavier et al., 1984; and de Lima et al., 2005).
It can be also explained by the fact that, in the dry state, the fine conductive solids die and have no electric sharing; by adding a minor amount of the NaCl-electrolyte, the fine conductive solids become alive and can share in the electrical behaviour due to the mobility of the ions through the added electrolyte. This could be ensured by the decrease in electrical resistivity values through adding the electrolyte. However, some anomalies were recorded in the electrical behaviour of minor samples, where when adding the electrolyte, the electrical resistivity results increase more than that in the dry state in non-expected behaviour.
However, this anomaly ensures the double layer effect in these samples and again reveals the complexity of this behaviour in the presence of electrolyte. In the saline water case, the electrical behaviour becomes more complex especially through the abrupt change and transition zones, due to increasing the ionic content of the electrolyte from the fresh water state into the saline water one. However, the electric prints of the
studied coal samples indicate that, the abrupt drop stage (1-10 kHz) is a critical diagnostic stage and could be used to reflect the different electric prints of the coal samples.
The classification of the coal samples in the dry state into four groups, according to their electrical resistivity values, rather than the classification according to their TOC and S2 content indicates that, the structure and distribution of the organic content which affected the electrical resistivity results. Two equations having high reliability were introduced for calculating the TOC and S2 of the coal-bearing formations in terms of density data. Due to the complexity of the electrical behaviour of the coal samples in both the fresh and saline water states, it is recommended to derive the TOC of the coal samples in terms of R in the dry state at the critical saturations using the relevant equations, which are obtained in the present study, at 5 kHz for the abrupt drop stage, at 20 kHz for the transition stage and at 50 kHz for the steady stage.
CONCLUSIONS In the present study, only one
electric print could be matched for the dry Safa coal samples, it is differentiated into three stages; abrupt drop stage (1-10 kHz), transition stage (10-20 kHz) and steady state (20-100 kHz). The electrical behaviour is more complex in the full saturation fresh or saline water cases, due to the ionic exchange between the interstitial water and the solid conductors
Four electric prints could be matched in the fresh water state and six prints in the saline water one. The stage 1-20 kHz is considered to be a diagnostic stage for differentiating the

IMPACTS OF TOC AND ROCK-EVAL PYROLYSIS 61
different matched electric prints, particularly in the full saturation fresh and saline water states.
The total organic carbon content (TOC) and Rock-Eval pyrolysis revealed that, the coal samples of the Safa Formation consist of mixed kerogen type II/III with good source rocks of high level maturity
properties. This indicates that, the Jurassic coal of the Safa Formation from Gebel El Maghara in north Sinai is oil and gas prone and also indicates that, it does not generate one type of oil, but instead the character of oils will be variable. The most strongly oil prone coals analyzed here would be expected to generate waxy oils.
Group (a) Group (b)
Group (c) Group (d)
Group (e) Group (f)
Fig. 9 TOC vs. log R for the studied coal samples in the dry state.
R = 0.11 (TOC) + 4.41r = 0.814
4.8
5
5.2
5.4
5.6
5.8
6
4.00 6.00 8.00 10.00 12.00TOC wt (%)
Res
istiv
ity a
t 1k
Hz R = 0.12 (TOC) + 3.54
r = 0.8001
4.00
4.20
4.40
4.60
4.80
5.00
4.00 6.00 8.00 10.00 12.00TOC wt (%)
Res
istiv
ity a
t 5
kHz
R = 0.11 (TOC) + 3.26r = 0.754
3.60
3.804.00
4.20
4.40
4.604.80
5.00
4.00 6.00 8.00 10.00 12.00TOC wt (%)
Res
istiv
ity a
t 10
kH
z R = 0.12 (TOC) + 2.87r = 0.794
3.40
3.60
3.80
4.00
4.20
4.40
4.60
4.80
4.00 6.00 8.00 10.00 12.00TOC wt (%)
Res
istiv
ity a
t 20
kH
z
R = 0.13 (TOC) + 2.38r = 0.789
3.00
3.20
3.40
3.60
3.80
4.00
4.00 6.00 8.00 10.00 12.00TOC wt (%)
Res
istiv
ity a
t 50
kH
z R = 0.13 (TOC) + 2.03r = 0.778
2.402.60
2.803.00
3.203.40
3.603.80
4.00 6.00 8.00 10.00 12.00TOC wt (%)
Res
istiv
ity a
t 10
0 kH
z

62 Bassem S. Nabawy and Mohamed El Nadi
In the present study, the bulk density of the Safa coal is used to determine TOC and S2 with a high precision. The TOC also is a main contributor to the electrical resistivity, and the R of Safa coals at the different frequencies in the dry state can be used for estimating the TOC as rapid and cheap method. Not only the TOC content, but also its distribution has affected the measured electrical resistivity. So the R of Safa coal at different frequencies can be used in the dry state for estimating TOC, where it is considered as a rapid and cheap method. Both the TOC and kerogen distribution have a great effect on the measured electrical resistivity.
REFERENCES Al Far, D.M., 1966. Geology and coal
deposits of Gebel Maghara, North Sinai. Geol. Surv. Egypt, Paper, vol. 37, 59 pp.
Anderson, G., 1975. Coring and core Analysis Handbook. Petroleum Pub. Co., Tulsa, 200 p.
Börner, F.D., Schopper, J.R. and Weller, A., 1996. Evaluation of transport and storage properties in the soil and groundwater zone from induced polarization measurements. Geophysical Prospecting, vol. 44, pp. 563-601.
Clavier, C., Coates, G. and Dumanoir, J., 1984. Theoretical and experimental bases for the dual water model for the interpretation of shaly sands. SPE Journal, vol. 4, pp. 153–168.
De Lima, O.A.L., Clennell, M.B., Nery, G.G. and Niwas, S., 2005. A Volumetric approach for the resistivity response of fresh water shaly sandstones. Geophysics, vol. 70, no. 1, pp. F1-F10.
Espitalié, J., Deroo, G. and Marquis, F., 1985. La Pyrolyse Rock-Eval et ses applications. Rev. Inst. Fr. Pet., vol. 40, pp. 563-579.
Farag, I.A.M. 1959. Contribution to the study of the Jurassic Formation in the Maghara massif, N. Sinai. J. Geol. Soc. Egypt, vol. 3, no. 2, pp. 175-195.
Hassan, M., Zein El-Din, M.Y., Saad, A.A. and El-Erian 1989. Geologic and Petrographic studies on the Safa Formation and associated coal seams, Wadi ElRakba, North Sinai. 2nd Conf. Geol. Sinai Develop., Suez Canal Univ.
Jenkins, D., 1990. Mesozoic Sediments of Gebel El-Maghara, Northern Sinai. In: R. Said (Ed.). The Geology of Egypt.
Issawi, B., El Hinnawi, M., Francis, M. and Mazhar, A., 1999. The Phanerozoic Geology of Egypt. A Geodynamic Approach. The Egyptian Geologic Survey and Mining authority (EGSMA). Special Publication, no. 76, 402 pp.
Kassab, M.A.M., 2004. Petrophysical studies on Jurassic rocks in the Gulf of Suez and North Sinai and its implications for hydrocarbon exploration. Ph.D. Thesis, Ain Shams Univ., 273 p.

IMPACTS OF TOC AND ROCK-EVAL PYROLYSIS 63
Koithara, J., Hashmy, K. and Mehra, Y.M. 1968. Report on the laboratory study of core samples from productive sandstones (Barails) in Rudrasafar field for establishing relationships between electrical and reservoir parameters. Unpublished report of the Institute of Petroleum Exploration, OWGC, Moscow.
Kostandi, A.B., 1959. Facies maps for the study of the Palaeozoic & Mesozoic sedimentary basins in the Egyptian Region. U.A.R. 1st Arab Petroleum Congress, vol. 2, pp. 33-51.
Mostafa, A.R. and Younes, M.A., 2001. Significance of organic matter in recording paleoenvironmental conditions of the Safa Formation coal sequence, Maghara Area, North Sinai, Egypt. Int. J. Coal Geol., vol. 47, Issue 1 , pp. 9-21.
Moustafa, A.P. and Khalil, M., 1990. Structural characteristics and tectonic evolution of Northern Sinai fold belts, Egypt. In R. Said (Ed.). The Geology of Egypt. pp. 381-389.
Peters, K.E., 1986. Guidelines for evaluating petroleum source rock using programmed pyrolysis; AAPG Bull, vol. 70, pp. 318-329.
Peters, K.E., Snedden, J.W., Sulaeman, A., Sarg, J.F. and Enrico, R.J., 2000. A new geochemical - sequence stratigraphic model for the Mahakam Delta and Makassar slope, Kalimantan, Indonesia; AAPG Bull., vol. 84, pp.12-44.
Pettijohn, E.J., 1984. Sedimentary Rocks, 3rd Ed., CBS Publication & Distribution, New Delhi, pp. 628.
Rzhevsky, Y. and Novik, G., 1971. The physics of rocks. Translation and Edited by A. A. Beknazarov, Mir Publishers, Moscow, 320 p.
Said, R., 1990. The Geology of Egypt. Brookfield, Rotterdam (Balkema), 734p.
Schmoker, J.W. and Hester, T.C., 1983. Organic Carbon in Bakken Formation, United States portion of Williston Basin, AAPG, vol. 67, no. 12, pp. 2165-2174
Slater, L.D., Choi1, J. and Wu1, Y., 2005. Electrical properties of iron-sand columns: Implications for induced polarization investigation and performance monitoring of iron-wall barriers. J. Geophysics, vol. 70, no. 4, pp. G87–G94.
Waples, D.W., 1985. Geochemistry in Petroleum Exploration. International Human Resources and Development, Boston, 232p.
Copyright © 2022 FDOKUMEN


![A survey of Christian textual finds from Gebel Adda kept in the Royal Ontario Museum in Toronto [in:] J. R. Anderson, D. A. Welsby (eds.), The Fourth Cataract and Beyond. Proceedings](https://static.fdokumen.com/doc/165x107/631c4676d5372c006e045ba0/a-survey-of-christian-textual-finds-from-gebel-adda-kept-in-the-royal-ontario-museum.jpg)


![Alcune ceramiche decorate [da Gebel Barkal]](https://static.fdokumen.com/doc/165x107/631e479a3dc6529d5d07e395/alcune-ceramiche-decorate-da-gebel-barkal.jpg)