Evolution of methane sorption capacity of coal seams as a function of burial history — a case...
25
Evolution of methane sorption capacity of coal seams as a function of burial history—a case study from the Campine Basin, NE Belgium A. Hildenbrand a, * , B.M. Krooss b , A. Busch b , R. Gaschnitz c a Flemish Institute for Technological Research (Vito), Boeretang 200, B-2400 Mol, Belgium b Lehrstuhl fu ¨ r Geologie, Geochemie und Lagersta ¨tten des Erdo ¨ls und der Kohle, Rheinisch-Westfa ¨ lische Technische Hochschule (RWTH) Aachen, Lochnerstr. 4-20, D-52056-Aachen, Germany c aix-o-therm GeoEnergien, Beginenstrasse 5, 52062 Aachen, Germany Received 8 February 2005; received in revised form 22 July 2005; accepted 27 July 2005 Available online 19 September 2005 Abstract Based on extensive data sets of high-pressure sorption isotherms and canister desorption data from two Central European coal basins (Campine and Ruhr basins) a computational scheme has been developed to calculate the maximum coal bed methane (CBM) sorption capacity of coal seams as a function of pressure, temperature and coal rank. In addition, the effects of in situ moisture content and maceral composition have been tentatively implemented. Using this algorithm it is possible to explicitly take into account variations in sorption capacity of the coal seams in sedimentary basins over geologic time as a function of burial history and thermal evolution. The procedure has been applied to model the evolution and the present-day coal bed methane content of the Campine Basin, NE Belgium. It is demonstrated how the present-day gas content of the Campine Basin is controlled by the burial history of the coal layers throughout geologic time. The maximum gas sorption capacity typically occurs at a depth range between 500 and 1000 m. During periods of uplift and erosion (~250 and 90 Ma before present) the uppermost coal layers have lost methane due to a reduction of gas storage capacity while their storage capacity has increased during periods of burial (~300 and 180 Ma ago, and present). Additionally, the present-day gas content is controlled by the gas generation history. Coal layers, which have lost storage capacity during geologic time, will stay undersaturated if not replenished by late-stage (e.g. microbial) gas. The gas content profile of test well KB206 in the NE Campine Basin, established from canister desorption tests, can be reproduced by assuming that undersaturation of the coals is due to erosion and re-burial, and that no significant gas generation (e.g. microbial gas) has taken place after the time of maximal burial. Isotopic data (d D~178x, d 13 C~59x) indicate the presence of a small portion of microbial gas. The absolute gas contents in this well are lower than the calculated maximum 0166-5162/$ - see front matter D 2005 Elsevier B.V. All rights reserved. doi:10.1016/j.coal.2005.07.006 * Corresponding author. Tel.: +32 14 335909; fax: +32 14 321185. E-mail address: [email protected] (A. Hildenbrand). International Journal of Coal Geology 66 (2006) 179 – 203 www.elsevier.com/locate/ijcoalgeo
-
Upload
independent -
Category
Documents
-
view
3 -
download
0
Transcript of Evolution of methane sorption capacity of coal seams as a function of burial history — a case...
www.elsevier.com/locate/ijcoalgeo
International Journal of Coal G
Evolution of methane sorption capacity of coal seams as a function
of burial history—a case study from the Campine
Basin, NE Belgium
A. Hildenbrand a,*, B.M. Krooss b, A. Busch b, R. Gaschnitz c
a Flemish Institute for Technological Research (Vito), Boeretang 200, B-2400 Mol, Belgiumb Lehrstuhl fur Geologie, Geochemie und Lagerstatten des Erdols und der Kohle, Rheinisch-Westfalische
Technische Hochschule (RWTH) Aachen, Lochnerstr. 4-20, D-52056-Aachen, Germanyc aix-o-therm GeoEnergien, Beginenstrasse 5, 52062 Aachen, Germany
Received 8 February 2005; received in revised form 22 July 2005; accepted 27 July 2005
Available online 19 September 2005
Abstract
Based on extensive data sets of high-pressure sorption isotherms and canister desorption data from two Central European
coal basins (Campine and Ruhr basins) a computational scheme has been developed to calculate the maximum coal bed
methane (CBM) sorption capacity of coal seams as a function of pressure, temperature and coal rank. In addition, the effects of
in situ moisture content and maceral composition have been tentatively implemented. Using this algorithm it is possible to
explicitly take into account variations in sorption capacity of the coal seams in sedimentary basins over geologic time as a
function of burial history and thermal evolution.
The procedure has been applied to model the evolution and the present-day coal bed methane content of the Campine
Basin, NE Belgium. It is demonstrated how the present-day gas content of the Campine Basin is controlled by the burial
history of the coal layers throughout geologic time. The maximum gas sorption capacity typically occurs at a depth range
between 500 and 1000 m. During periods of uplift and erosion (~250 and 90 Ma before present) the uppermost coal layers
have lost methane due to a reduction of gas storage capacity while their storage capacity has increased during periods of burial
(~300 and 180 Ma ago, and present). Additionally, the present-day gas content is controlled by the gas generation history. Coal
layers, which have lost storage capacity during geologic time, will stay undersaturated if not replenished by late-stage (e.g.
microbial) gas.
The gas content profile of test well KB206 in the NE Campine Basin, established from canister desorption tests, can be
reproduced by assuming that undersaturation of the coals is due to erosion and re-burial, and that no significant gas generation
(e.g. microbial gas) has taken place after the time of maximal burial. Isotopic data (dD~178x, d13C~59x) indicate the
presence of a small portion of microbial gas. The absolute gas contents in this well are lower than the calculated maximum
0166-5162/$ - s
doi:10.1016/j.co
* Correspondi
E-mail addre
eology 66 (2006) 179–203
ee front matter D 2005 Elsevier B.V. All rights reserved.
al.2005.07.006
ng author. Tel.: +32 14 335909; fax: +32 14 321185.
ss: [email protected] (A. Hildenbrand).
A. Hildenbrand et al. / International Journal of Coal Geology 66 (2006) 179–203180
present-day sorption capacity. This may be due to an underestimation of the effect of water content on sorption capacity or result
from degassing via nearby faults, enforced by fluid circulation.
D 2005 Elsevier B.V. All rights reserved.
Keywords: Gas adsorption; CH4; Coal; Burial history; Campine Basin
1. Introduction
Coal-bearing sequences in sedimentary basins
contain substantial amounts of natural gas generated
during the thermal decomposition (maturation) of
organic matter. Most of this gas is physically sorbed
in the microporous structure of the coal. Smaller
amounts may occur in the free gas phase present in
the macro- and mesopores and cleats and, to an
even lesser extent, as dissolved gas in the formation
water (e.g. Boyer and Qingzhao, 1998; Noak,
1998).
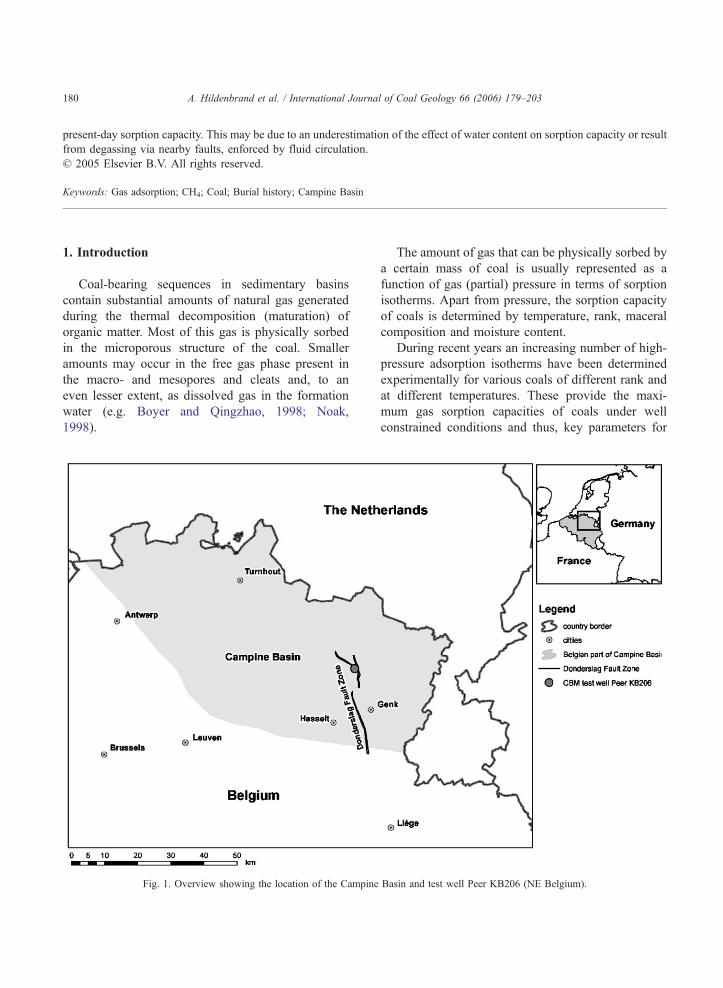
Fig. 1. Overview showing the location of the Campine
The amount of gas that can be physically sorbed by
a certain mass of coal is usually represented as a
function of gas (partial) pressure in terms of sorption
isotherms. Apart from pressure, the sorption capacity
of coals is determined by temperature, rank, maceral
composition and moisture content.
During recent years an increasing number of high-
pressure adsorption isotherms have been determined
experimentally for various coals of different rank and
at different temperatures. These provide the maxi-
mum gas sorption capacities of coals under well
constrained conditions and thus, key parameters for
Basin and test well Peer KB206 (NE Belgium).
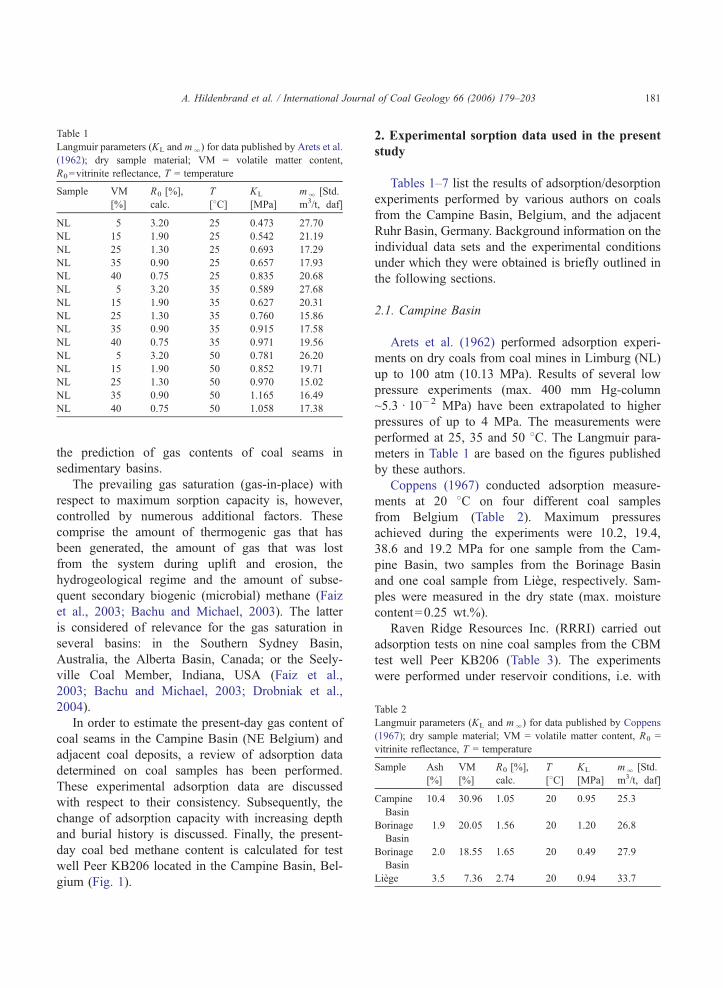
Table 1
Langmuir parameters (KL and ml) for data published by Arets et al.
(1962); dry sample material; VM = volatile matter content,
R0=vitrinite reflectance, T = temperature
Sample VM
[%]
R0 [%],
calc.
T
[8C]KL
[MPa]
ml [Std.
m3/t, daf]
NL 5 3.20 25 0.473 27.70
NL 15 1.90 25 0.542 21.19
NL 25 1.30 25 0.693 17.29
NL 35 0.90 25 0.657 17.93
NL 40 0.75 25 0.835 20.68
NL 5 3.20 35 0.589 27.68
NL 15 1.90 35 0.627 20.31
NL 25 1.30 35 0.760 15.86
NL 35 0.90 35 0.915 17.58
NL 40 0.75 35 0.971 19.56
NL 5 3.20 50 0.781 26.20
NL 15 1.90 50 0.852 19.71
NL 25 1.30 50 0.970 15.02
NL 35 0.90 50 1.165 16.49
NL 40 0.75 50 1.058 17.38
Table 2
Langmuir parameters (KL and ml) for data published by Coppens
(1967); dry sample material; VM = volatile matter content, R0 =
vitrinite reflectance, T = temperature
Sample Ash
[%]
VM
[%]
R0 [%],
calc.
T
[8C]KL
[MPa]
ml [Std.
m3/t, daf]
Campine
Basin
10.4 30.96 1.05 20 0.95 25.3
Borinage
Basin
1.9 20.05 1.56 20 1.20 26.8
Borinage
Basin
2.0 18.55 1.65 20 0.49 27.9
Liege 3.5 7.36 2.74 20 0.94 33.7
A. Hildenbrand et al. / International Journal of Coal Geology 66 (2006) 179–203 181
the prediction of gas contents of coal seams in
sedimentary basins.
The prevailing gas saturation (gas-in-place) with
respect to maximum sorption capacity is, however,
controlled by numerous additional factors. These
comprise the amount of thermogenic gas that has
been generated, the amount of gas that was lost
from the system during uplift and erosion, the
hydrogeological regime and the amount of subse-
quent secondary biogenic (microbial) methane (Faiz
et al., 2003; Bachu and Michael, 2003). The latter
is considered of relevance for the gas saturation in
several basins: in the Southern Sydney Basin,
Australia, the Alberta Basin, Canada; or the Seely-
ville Coal Member, Indiana, USA (Faiz et al.,
2003; Bachu and Michael, 2003; Drobniak et al.,
2004).
In order to estimate the present-day gas content of
coal seams in the Campine Basin (NE Belgium) and
adjacent coal deposits, a review of adsorption data
determined on coal samples has been performed.
These experimental adsorption data are discussed
with respect to their consistency. Subsequently, the
change of adsorption capacity with increasing depth
and burial history is discussed. Finally, the present-
day coal bed methane content is calculated for test
well Peer KB206 located in the Campine Basin, Bel-
gium (Fig. 1).
2. Experimental sorption data used in the present
study
Tables 1–7 list the results of adsorption/desorption
experiments performed by various authors on coals
from the Campine Basin, Belgium, and the adjacent
Ruhr Basin, Germany. Background information on the
individual data sets and the experimental conditions
under which they were obtained is briefly outlined in
the following sections.
2.1. Campine Basin
Arets et al. (1962) performed adsorption experi-
ments on dry coals from coal mines in Limburg (NL)
up to 100 atm (10.13 MPa). Results of several low
pressure experiments (max. 400 mm Hg-column
~5.3 d 10�2 MPa) have been extrapolated to higher
pressures of up to 4 MPa. The measurements were
performed at 25, 35 and 50 8C. The Langmuir para-
meters in Table 1 are based on the figures published
by these authors.
Coppens (1967) conducted adsorption measure-
ments at 20 8C on four different coal samples
from Belgium (Table 2). Maximum pressures
achieved during the experiments were 10.2, 19.4,
38.6 and 19.2 MPa for one sample from the Cam-
pine Basin, two samples from the Borinage Basin
and one coal sample from Liege, respectively. Sam-
ples were measured in the dry state (max. moisture
content=0.25 wt.%).
Raven Ridge Resources Inc. (RRRI) carried out
adsorption tests on nine coal samples from the CBM
test well Peer KB206 (Table 3). The experiments
were performed under reservoir conditions, i.e. with
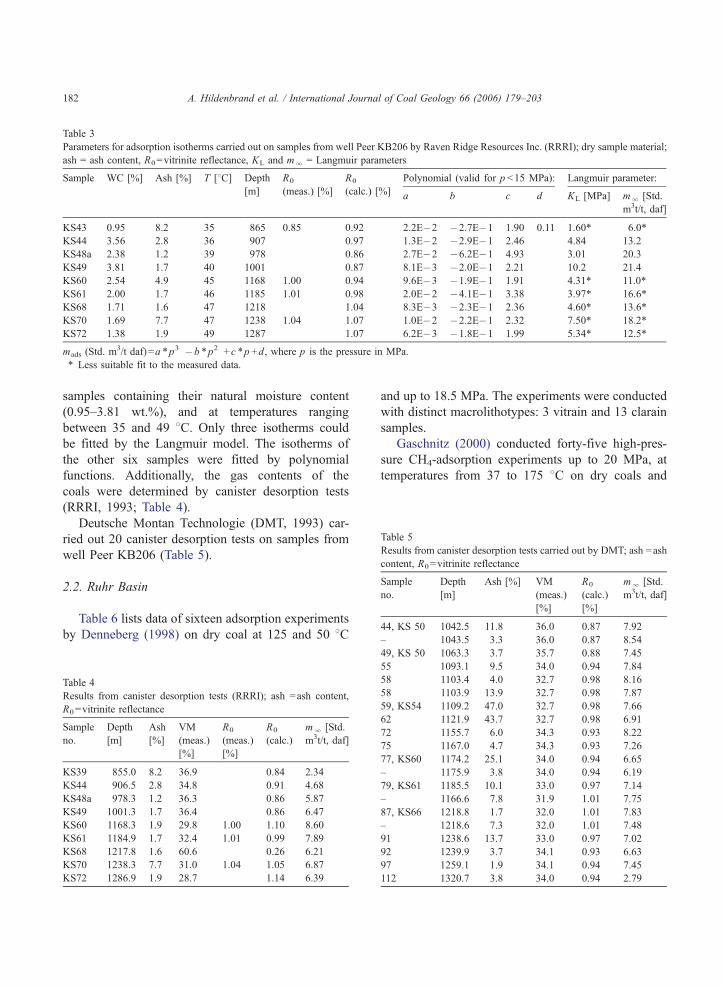
Table 3
Parameters for adsorption isotherms carried out on samples from well Peer KB206 by Raven Ridge Resources Inc. (RRRI); dry sample material;
ash = ash content, R0=vitrinite reflectance, KL and ml = Langmuir parameters
Sample WC [%] Ash [%] T [8C] Depth
[m]
R0
(meas.) [%]
R0
(calc.) [%]
Polynomial (valid for p b15 MPa): Langmuir parameter:
a b c d KL [MPa] ml [Std.
m3t/t, daf]
KS43 0.95 8.2 35 865 0.85 0.92 2.2E�2 �2.7E�1 1.90 0.11 1.60* 6.0*
KS44 3.56 2.8 36 907 0.97 1.3E�2 �2.9E�1 2.46 4.84 13.2
KS48a 2.38 1.2 39 978 0.86 2.7E�2 �6.2E�1 4.93 3.01 20.3
KS49 3.81 1.7 40 1001 0.87 8.1E�3 �2.0E�1 2.21 10.2 21.4
KS60 2.54 4.9 45 1168 1.00 0.94 9.6E�3 �1.9E�1 1.91 4.31* 11.0*
KS61 2.00 1.7 46 1185 1.01 0.98 2.0E�2 �4.1E�1 3.38 3.97* 16.6*
KS68 1.71 1.6 47 1218 1.04 8.3E�3 �2.3E�1 2.36 4.60* 13.6*
KS70 1.69 7.7 47 1238 1.04 1.07 1.0E�2 �2.2E�1 2.32 7.50* 18.2*
KS72 1.38 1.9 49 1287 1.07 6.2E�3 �1.8E�1 1.99 5.34* 12.5*
mads (Std. m3/t daf)=a *p3 �b *p2 +c *p +d, where p is the pressure in MPa.
* Less suitable fit to the measured data.
Table 5
Results from canister desorption tests carried out by DMT; ash =ash
content, R0=vitrinite reflectance
Sample
no.
Depth
[m]
Ash [%] VM
(meas.)
[%]
R0
(calc.)
[%]
ml [Std.
m3t/t, daf]
44, KS 50 1042.5 11.8 36.0 0.87 7.92
– 1043.5 3.3 36.0 0.87 8.54
A. Hildenbrand et al. / International Journal of Coal Geology 66 (2006) 179–203182
samples containing their natural moisture content
(0.95–3.81 wt.%), and at temperatures ranging
between 35 and 49 8C. Only three isotherms could
be fitted by the Langmuir model. The isotherms of
the other six samples were fitted by polynomial
functions. Additionally, the gas contents of the
coals were determined by canister desorption tests
(RRRI, 1993; Table 4).
Deutsche Montan Technologie (DMT, 1993) car-
ried out 20 canister desorption tests on samples from
well Peer KB206 (Table 5).
2.2. Ruhr Basin
Table 6 lists data of sixteen adsorption experiments
by Denneberg (1998) on dry coal at 125 and 50 8C
Table 4
Results from canister desorption tests (RRRI); ash =ash content,
R0=vitrinite reflectance
Sample
no.
Depth
[m]
Ash
[%]
VM
(meas.)
[%]
R0
(meas.)
[%]
R0
(calc.)
ml [Std.
m3t/t, daf]
KS39 855.0 8.2 36.9 0.84 2.34
KS44 906.5 2.8 34.8 0.91 4.68
KS48a 978.3 1.2 36.3 0.86 5.87
KS49 1001.3 1.7 36.4 0.86 6.47
KS60 1168.3 1.9 29.8 1.00 1.10 8.60
KS61 1184.9 1.7 32.4 1.01 0.99 7.89
KS68 1217.8 1.6 60.6 0.26 6.21
KS70 1238.3 7.7 31.0 1.04 1.05 6.87
KS72 1286.9 1.9 28.7 1.14 6.39
and up to 18.5 MPa. The experiments were conducted
with distinct macrolithotypes: 3 vitrain and 13 clarain
samples.
Gaschnitz (2000) conducted forty-five high-pres-
sure CH4-adsorption experiments up to 20 MPa, at
temperatures from 37 to 175 8C on dry coals and
49, KS 50 1063.3 3.7 35.7 0.88 7.45
55 1093.1 9.5 34.0 0.94 7.84
58 1103.4 4.0 32.7 0.98 8.16
58 1103.9 13.9 32.7 0.98 7.87
59, KS54 1109.2 47.0 32.7 0.98 7.66
62 1121.9 43.7 32.7 0.98 6.91
72 1155.7 6.0 34.3 0.93 8.22
75 1167.0 4.7 34.3 0.93 7.26
77, KS60 1174.2 25.1 34.0 0.94 6.65
– 1175.9 3.8 34.0 0.94 6.19
79, KS61 1185.5 10.1 33.0 0.97 7.14
– 1166.6 7.8 31.9 1.01 7.75
87, KS66 1218.8 1.7 32.0 1.01 7.83
– 1218.6 7.3 32.0 1.01 7.48
91 1238.6 13.7 33.0 0.97 7.02
92 1239.9 3.7 34.1 0.93 6.63
97 1259.1 1.9 34.1 0.94 7.45
112 1320.7 3.8 34.0 0.94 2.79
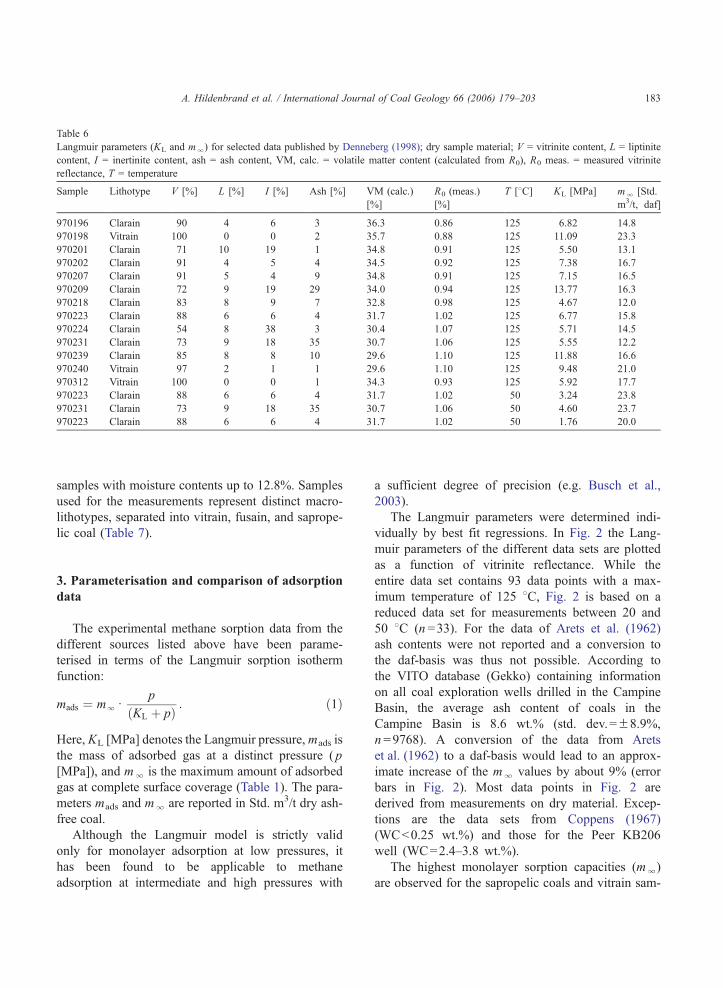
Table 6
Langmuir parameters (KL and ml) for selected data published by Denneberg (1998); dry sample material; V = vitrinite content, L = liptinite
content, I = inertinite content, ash = ash content, VM, calc. = volatile matter content (calculated from R0), R0 meas. = measured vitrinite
reflectance, T = temperature
Sample Lithotype V [%] L [%] I [%] Ash [%] VM (calc.)
[%]
R0 (meas.)
[%]
T [8C] KL [MPa] ml [Std.
m3/t, daf]
970196 Clarain 90 4 6 3 36.3 0.86 125 6.82 14.8
970198 Vitrain 100 0 0 2 35.7 0.88 125 11.09 23.3
970201 Clarain 71 10 19 1 34.8 0.91 125 5.50 13.1
970202 Clarain 91 4 5 4 34.5 0.92 125 7.38 16.7
970207 Clarain 91 5 4 9 34.8 0.91 125 7.15 16.5
970209 Clarain 72 9 19 29 34.0 0.94 125 13.77 16.3
970218 Clarain 83 8 9 7 32.8 0.98 125 4.67 12.0
970223 Clarain 88 6 6 4 31.7 1.02 125 6.77 15.8
970224 Clarain 54 8 38 3 30.4 1.07 125 5.71 14.5
970231 Clarain 73 9 18 35 30.7 1.06 125 5.55 12.2
970239 Clarain 85 8 8 10 29.6 1.10 125 11.88 16.6
970240 Vitrain 97 2 1 1 29.6 1.10 125 9.48 21.0
970312 Vitrain 100 0 0 1 34.3 0.93 125 5.92 17.7
970223 Clarain 88 6 6 4 31.7 1.02 50 3.24 23.8
970231 Clarain 73 9 18 35 30.7 1.06 50 4.60 23.7
970223 Clarain 88 6 6 4 31.7 1.02 50 1.76 20.0
A. Hildenbrand et al. / International Journal of Coal Geology 66 (2006) 179–203 183
samples with moisture contents up to 12.8%. Samples
used for the measurements represent distinct macro-
lithotypes, separated into vitrain, fusain, and saprope-
lic coal (Table 7).
3. Parameterisation and comparison of adsorption
data
The experimental methane sorption data from the
different sources listed above have been parame-
terised in terms of the Langmuir sorption isotherm
function:
mads ¼ mldp
KL þ pð Þ : ð1Þ
Here, KL [MPa] denotes the Langmuir pressure,mads is
the mass of adsorbed gas at a distinct pressure ( p
[MPa]), and ml is the maximum amount of adsorbed
gas at complete surface coverage (Table 1). The para-
meters mads and ml are reported in Std. m3/t dry ash-
free coal.
Although the Langmuir model is strictly valid
only for monolayer adsorption at low pressures, it
has been found to be applicable to methane
adsorption at intermediate and high pressures with
a sufficient degree of precision (e.g. Busch et al.,
2003).
The Langmuir parameters were determined indi-
vidually by best fit regressions. In Fig. 2 the Lang-
muir parameters of the different data sets are plotted
as a function of vitrinite reflectance. While the
entire data set contains 93 data points with a max-
imum temperature of 125 8C, Fig. 2 is based on a
reduced data set for measurements between 20 and
50 8C (n =33). For the data of Arets et al. (1962)
ash contents were not reported and a conversion to
the daf-basis was thus not possible. According to
the VITO database (Gekko) containing information
on all coal exploration wells drilled in the Campine
Basin, the average ash content of coals in the
Campine Basin is 8.6 wt.% (std. dev.=F8.9%,
n=9768). A conversion of the data from Arets
et al. (1962) to a daf-basis would lead to an approx-
imate increase of the ml values by about 9% (error
bars in Fig. 2). Most data points in Fig. 2 are
derived from measurements on dry material. Excep-
tions are the data sets from Coppens (1967)
(WCb0.25 wt.%) and those for the Peer KB206
well (WC=2.4–3.8 wt.%).
The highest monolayer sorption capacities (ml)
are observed for the sapropelic coals and vitrain sam-
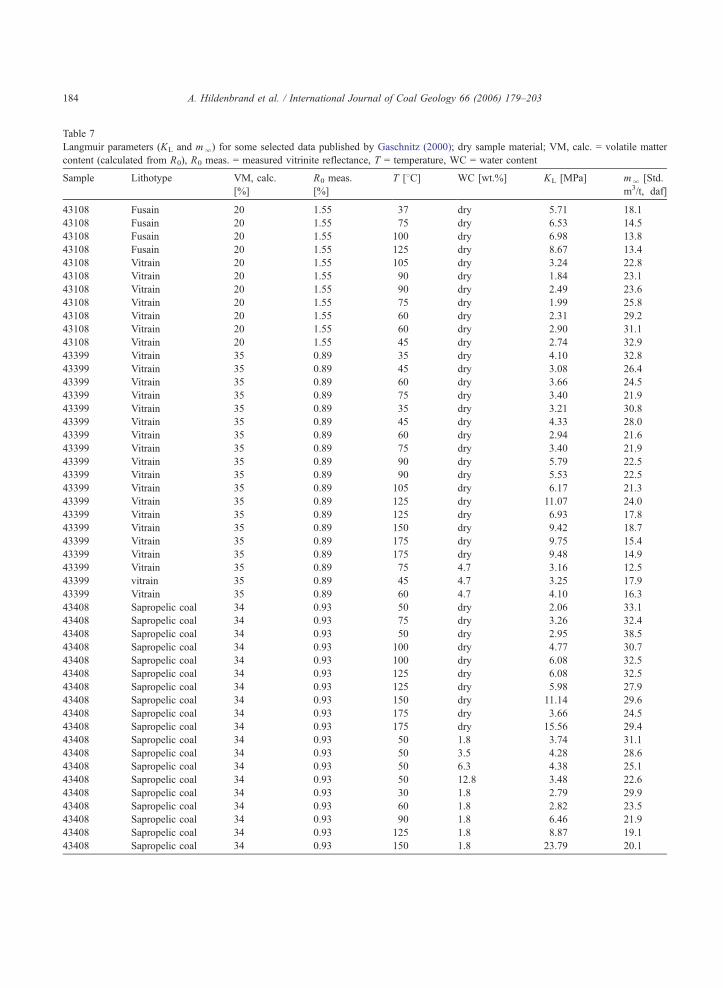
Table 7
Langmuir parameters (KL and ml) for some selected data published by Gaschnitz (2000); dry sample material; VM, calc. = volatile matter
content (calculated from R0), R0 meas. = measured vitrinite reflectance, T = temperature, WC = water content
Sample Lithotype VM, calc.
[%]
R0 meas.
[%]
T [8C] WC [wt.%] KL [MPa] ml [Std.
m3/t, daf]
43108 Fusain 20 1.55 37 dry 5.71 18.1
43108 Fusain 20 1.55 75 dry 6.53 14.5
43108 Fusain 20 1.55 100 dry 6.98 13.8
43108 Fusain 20 1.55 125 dry 8.67 13.4
43108 Vitrain 20 1.55 105 dry 3.24 22.8
43108 Vitrain 20 1.55 90 dry 1.84 23.1
43108 Vitrain 20 1.55 90 dry 2.49 23.6
43108 Vitrain 20 1.55 75 dry 1.99 25.8
43108 Vitrain 20 1.55 60 dry 2.31 29.2
43108 Vitrain 20 1.55 60 dry 2.90 31.1
43108 Vitrain 20 1.55 45 dry 2.74 32.9
43399 Vitrain 35 0.89 35 dry 4.10 32.8
43399 Vitrain 35 0.89 45 dry 3.08 26.4
43399 Vitrain 35 0.89 60 dry 3.66 24.5
43399 Vitrain 35 0.89 75 dry 3.40 21.9
43399 Vitrain 35 0.89 35 dry 3.21 30.8
43399 Vitrain 35 0.89 45 dry 4.33 28.0
43399 Vitrain 35 0.89 60 dry 2.94 21.6
43399 Vitrain 35 0.89 75 dry 3.40 21.9
43399 Vitrain 35 0.89 90 dry 5.79 22.5
43399 Vitrain 35 0.89 90 dry 5.53 22.5
43399 Vitrain 35 0.89 105 dry 6.17 21.3
43399 Vitrain 35 0.89 125 dry 11.07 24.0
43399 Vitrain 35 0.89 125 dry 6.93 17.8
43399 Vitrain 35 0.89 150 dry 9.42 18.7
43399 Vitrain 35 0.89 175 dry 9.75 15.4
43399 Vitrain 35 0.89 175 dry 9.48 14.9
43399 Vitrain 35 0.89 75 4.7 3.16 12.5
43399 vitrain 35 0.89 45 4.7 3.25 17.9
43399 Vitrain 35 0.89 60 4.7 4.10 16.3
43408 Sapropelic coal 34 0.93 50 dry 2.06 33.1
43408 Sapropelic coal 34 0.93 75 dry 3.26 32.4
43408 Sapropelic coal 34 0.93 50 dry 2.95 38.5
43408 Sapropelic coal 34 0.93 100 dry 4.77 30.7
43408 Sapropelic coal 34 0.93 100 dry 6.08 32.5
43408 Sapropelic coal 34 0.93 125 dry 6.08 32.5
43408 Sapropelic coal 34 0.93 125 dry 5.98 27.9
43408 Sapropelic coal 34 0.93 150 dry 11.14 29.6
43408 Sapropelic coal 34 0.93 175 dry 3.66 24.5
43408 Sapropelic coal 34 0.93 175 dry 15.56 29.4
43408 Sapropelic coal 34 0.93 50 1.8 3.74 31.1
43408 Sapropelic coal 34 0.93 50 3.5 4.28 28.6
43408 Sapropelic coal 34 0.93 50 6.3 4.38 25.1
43408 Sapropelic coal 34 0.93 50 12.8 3.48 22.6
43408 Sapropelic coal 34 0.93 30 1.8 2.79 29.9
43408 Sapropelic coal 34 0.93 60 1.8 2.82 23.5
43408 Sapropelic coal 34 0.93 90 1.8 6.46 21.9
43408 Sapropelic coal 34 0.93 125 1.8 8.87 19.1
43408 Sapropelic coal 34 0.93 150 1.8 23.79 20.1
A. Hildenbrand et al. / International Journal of Coal Geology 66 (2006) 179–203184
0
5
10
15
20
25
30
35
40
45
50
0 1 2 3 4
vitrinite reflectance, R0 [%]
m∞
[Std
. m3 /
t]
U-shaped trend(Arets et al., 1962)
linear trend for samples fromCoppens (1967),Denneberg (1998) andPeer KB206
0
2
4
6
8
10
12
0 2 31 4
vitrinite reflectance, R0 [%]
KL [
MP
a]
Arets (dry)CoppensGaschnitz, fusainGaschnitz, saprop.Gaschnitz, vitrainDenneberg, clarainPeer KB206
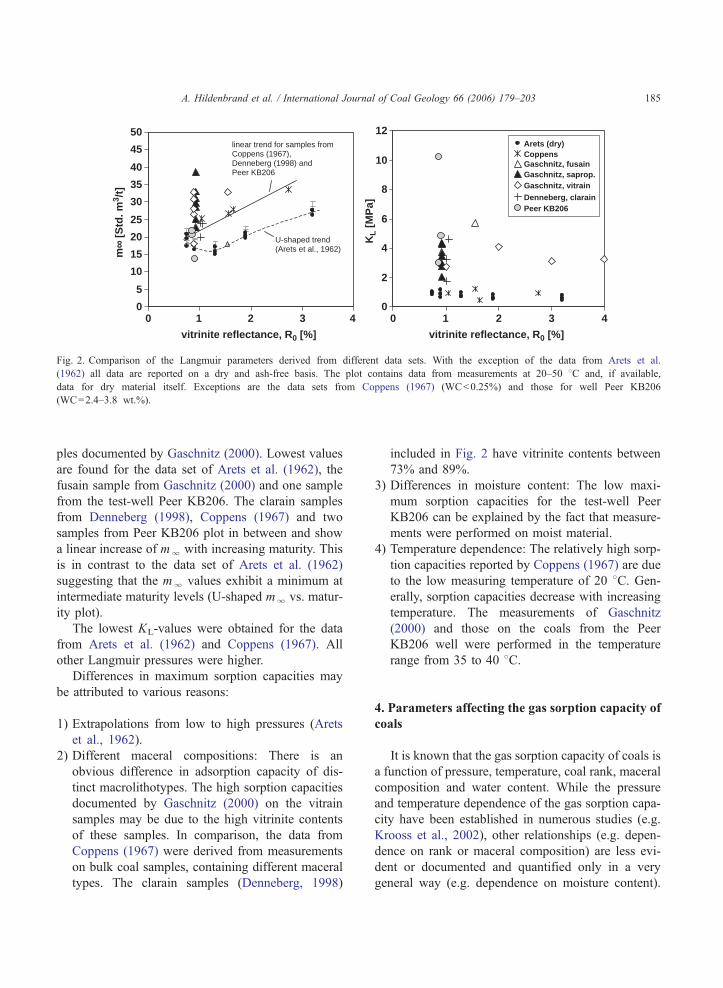
Fig. 2. Comparison of the Langmuir parameters derived from different data sets. With the exception of the data from Arets et al.
(1962) all data are reported on a dry and ash-free basis. The plot contains data from measurements at 20–50 8C and, if available,
data for dry material itself. Exceptions are the data sets from Coppens (1967) (WCb0.25%) and those for well Peer KB206
(WC=2.4–3.8 wt.%).
A. Hildenbrand et al. / International Journal of Coal Geology 66 (2006) 179–203 185
ples documented by Gaschnitz (2000). Lowest values
are found for the data set of Arets et al. (1962), the
fusain sample from Gaschnitz (2000) and one sample
from the test-well Peer KB206. The clarain samples
from Denneberg (1998), Coppens (1967) and two
samples from Peer KB206 plot in between and show
a linear increase of ml with increasing maturity. This
is in contrast to the data set of Arets et al. (1962)
suggesting that the ml values exhibit a minimum at
intermediate maturity levels (U-shaped ml vs. matur-
ity plot).
The lowest KL-values were obtained for the data
from Arets et al. (1962) and Coppens (1967). All
other Langmuir pressures were higher.
Differences in maximum sorption capacities may
be attributed to various reasons:
1) Extrapolations from low to high pressures (Arets
et al., 1962).
2) Different maceral compositions: There is an
obvious difference in adsorption capacity of dis-
tinct macrolithotypes. The high sorption capacities
documented by Gaschnitz (2000) on the vitrain
samples may be due to the high vitrinite contents
of these samples. In comparison, the data from
Coppens (1967) were derived from measurements
on bulk coal samples, containing different maceral
types. The clarain samples (Denneberg, 1998)
included in Fig. 2 have vitrinite contents between
73% and 89%.
3) Differences in moisture content: The low maxi-
mum sorption capacities for the test-well Peer
KB206 can be explained by the fact that measure-
ments were performed on moist material.
4) Temperature dependence: The relatively high sorp-
tion capacities reported by Coppens (1967) are due
to the low measuring temperature of 20 8C. Gen-erally, sorption capacities decrease with increasing
temperature. The measurements of Gaschnitz
(2000) and those on the coals from the Peer
KB206 well were performed in the temperature
range from 35 to 40 8C.
4. Parameters affecting the gas sorption capacity of
coals
It is known that the gas sorption capacity of coals is
a function of pressure, temperature, coal rank, maceral
composition and water content. While the pressure
and temperature dependence of the gas sorption capa-
city have been established in numerous studies (e.g.
Krooss et al., 2002), other relationships (e.g. depen-
dence on rank or maceral composition) are less evi-
dent or documented and quantified only in a very
general way (e.g. dependence on moisture content).
A. Hildenbrand et al. / International Journal of Coal Geology 66 (2006) 179–203186
4.1. Effect of pressure
Generally, the sorption capacity increases with
increasing pressure until a certain saturation pres-
sure is reached. In the present study the Langmuir
model was used to represent this pressure depen-
dence and it was found to adequately describe most
of the experimental data sets analysed. The adsorp-
tion measurements performed by Raven Ridge
Resources Incorporated, however, showed unex-
pected features and could not be fitted by
the Langmuir model. Instead of asymptotically
approaching an adsorption limit (ml), these iso-
therms show a steep increase in adsorption capacity
at higher pressures (above approximately 10 MPa).
This observation is in contrast with many high-
pressure methane sorption isotherms published
since. It casts some doubt on the reliability of this
data set and might be due to leakage problems
during isotherm measurements.
4.2. Effect of temperature
It is known that adsorption is an exothermic
process and therefore adsorption capacity decreases
with increasing temperature (Sircar, 1992). The tem-
perature dependence of the sorption capacity is con-
trolled by the isosteric heat of sorption which, in
turn, depends on the surface coverage. For ideal
systems, thermodynamic analysis can provide infor-
mation on the temperature dependence of sorption
capacity (e.g. Krooss et al., 2002). Due to the com-
plexity of natural coals, however, a precise predic-
tion of this temperature dependence is usually
impossible. For the present investigation a linear
relationship between sorption capacity and tempera-
ture was assumed in the regression analysis as a first
approximation.
4.3. Effect of rank
Experimental sorption data by Arets et al. (1962)
indicate that the amount of adsorbed gas is highest
for mature samples and passes through a minimum
for coals with a volatile matter content of 27%
(~1.2% R0). The data from Coppens (1967) show a
linear increase in sorption capacity with increasing
coal rank. The highest adsorption capacity was deter-
mined for the sample from Liege with a volatile
matter content of 7.36% (vitrinite reflectance
~2.74% R0), the lowest capacity was found for the
sample from the Campine Basin with a volatile
matter content of 30.96% (~1.05% R0). The data of
Gaschnitz (2000) also show increased adsorption
capacities for higher maturities. No distinct trend
with coal rank could be established from the data
of Denneberg (1998) covering the range from 0.86%
to 1.1% R0 (Table 6).
The dependence of CH4 sorption capacities on
rank and pore structure of coals has been discussed
for various other data sets e.g. by Nodzenski (1998),
Laxminarayana and Crosdale (1999, 2002), Levy et
al. (1997) and Gluskoter et al. (2002). Levy et al.
(1997) found a clear positive relation between CH4
sorption capacities of moist coals with carbon con-
tent (rank). In contrast, the results for dry samples
did not show a clear trend; the data were rather
scattered and showed a sharp increase of sorption
capacities above a carbon content of about 90%. The
behaviour for the moist coals found by Levy et al.
(1997) is confirmed by Laxminarayana and Crosdale
(2002) who reported a linear increase of CH4 sorp-
tion capacities with rank for high- to low volatile
moist Indian coals. In contrast, dry coals showed a
decrease in maximum CH4 sorption capacities with
rank. In an earlier study on Australian coals, Laxmi-
narayana and Crosdale (1999) found that CH4 sorp-
tion capacities on dry coals displayed a bUQ-shapedtrend with rank with a minimum between 1.5% and
2.0% R0 max. Prinz (2004, 2005) demonstrated for a
suite of nine Pennsylvanian coals from the Ruhr
Basin, analysed at 40 8C, that dry coals exhibit a
bUQ-shaped trend, as described by Arets et al. (1962)
and Laxminarayana and Crosdale (1999). However,
the same samples investigated in the moist state
show a linear increase in sorption capacity from
high-volatile bituminous to semi-anthracite rank
(Prinz, 2004, 2005).
The initial decrease in CH4 capacities with rank is
attributed to the blocking of micropores by higher
molecular-weight hydrocarbons. During increasing
coalification, the micropores are believed to open
up due to cracking of the hydrocarbon components
so that additional sorption capacity becomes avail-
able (e.g. Gan et al., 1972). This behaviour is
assumed to occur predominantly in vitrinites due to
A. Hildenbrand et al. / International Journal of Coal Geology 66 (2006) 179–203 187
the higher abundance of micropores as compared to
inertinites.
4.4. Effect of maceral composition
Denneberg (1998) found that methane sorption
capacity increases with increasing vitrinite content
and decreasing liptinite content. The results of
Gaschnitz (2000) reveal differences between distinct
lithotypes. In contrast to the data set of Denneberg
(1998), a sapropelic coal, which contains higher
amounts of liptinite, had a higher sorption capacity
than a vitrain sample of similar maturity. The lowest
sorption capacity was measured for a fusain sample
(1.55% R0).
Many studies on CH4 adsorption have investigated
the effects of maceral composition of coals of various
rank and locations (e.g. Lamberson and Bustin, 1993;
Crosdale et al., 1998; Levy et al., 1997; Laxminar-
ayana and Crosdale, 1999, 2002; Bustin and Clarkson,
1998; Ettinger et al., 1966; Ryan and Lane, 2002;
Mastalerz et al., 2004). Studies on Australian and
Canadian coals showed that maceral composition is
an important control on CH4 adsorption but the degree
of influence is rank-dependent (Lamberson and Bus-
tin, 1993; Crosdale et al., 1998; Bustin and Clarkson,
1998; Laxminarayana and Crosdale, 1999). Most of
these studies concluded that vitrinite is the most
important maceral favouring CH4 sorption on coal
compared to similar-rank inertinite. In contrast, inves-
tigations on Indian coals showed that the vitrinite
content does not influence CH4 sorption capacities
(Laxminarayana and Crosdale, 2002). Bustin and
Clarkson (1998) demonstrated for coals from the
USA, Canada and Australia that sorption capacities
decrease with increasing inertinite and ash contents
and increase with increasing vitrinite contents for iso-
rank coals. This might be due to higher specific sur-
face areas related to higher micropore capacities in
vitrinites (e.g. Crosdale et al., 1998; Unsworth et al.,
1989). In contrast to other authors, Ettinger et al.
(1966) documented for hand-picked macerals from
the Donetsk Basin, Ukraine, that inertinite exhibits
higher sorption capacities for CH4 than vitrinite.
Results by Busch et al. (2003) indicate that rank rather
than maceral composition influences CH4 sorption
capacity. Mastalerz et al. (2004) demonstrated that
the CO2 sorption volumes are positively correlated
with the content of maceral telocollinite; no trend
with maceral composition could be established for
the CH4 sorption capacity. Apart from the study of
Denneberg (1998) no information on the influence of
liptinite on the CH4 sorption capacity was found in the
literature.
4.5. Effect of water content
The gas sorption capacity of coals is strongly
affected by the presence of water. Depending on the
water content, the sorption capacity can apparently be
reduced by 60% to 90% as compared to the dry state.
Generally, sorption capacity decreases continuously
with increasing water content until a certain critical
level is reached. Above this critical water content it
remains nearly constant (Gaschnitz, 2000; Joubert et
al., 1973, 1974).
A common reference state is the equilibrium
water content established at 30 8C and 96–97%
relative humidity. For a sapropelic coal with a vitri-
nite reflectance of 0.93% and an equilibrium water
content of 3 to 4.5 wt.%, a moisture content of only
1.8 wt.% was found to reduce the sorption capacity
by 66–84% (Gaschnitz, 2000). Upon further increase
of the moisture content up to 6 wt.% the methane
sorption capacity was reduced by 51–63%, with
respect to the sorption capacity in the dry state.
Temperature and pressures above 7.5 MPa do not
have a significant influence on the mads(dry) /mads
(moist)-ratio.
Some authors propose a linear relationship between
moisture content and the reduction of sorption capacity
with factors of 0.23 (Joubert et al., 1973), 0.31 (Ettinger
et al., 1958) and 0.39 m3/(td% H2O) (Killingley et al.,
1995). Non-linear correlations between moisture con-
tent and adsorption capacity were established empiri-
cally by Joubert et al. (1974) for a temperature of 30
8C and for pressures up to 6 MPa.
For water-undersaturated coals (below the critical
water content; after Joubert et al., 1974):
mads dryð Þmads moistð Þ ¼ 0:7461d pd1:45ð Þ�0:2009
dWCþ 1 ð2Þ
where p is the pressure [MPa] and WC is the water
content [wt.%].
A. Hildenbrand et al. / International Journal of Coal Geology 66 (2006) 179–203188
For water-saturated samples (Joubert et al.,
1974):
mads dryð Þmads moistð Þ ¼ 1þ 5:0535d 10�5d pCH4
� 0:0576� �
d X0 � 10�7:221d 10�3d pCH4�1:0194: ð3Þ
Here X0 is the oxygen content [wt.%] of the coal.
The oxygen content of coals appears to affect the
sorption capacity in a similar way as the moisture
content (Prinz, 2004). Generally, the oxygen content
of coals decreases with increasing rank. This holds
also for the equilibrium moisture content (critical
water saturation). For the Ruhr Basin Gaschnitz
(2000) proposed the following correlation:
WCcrit ¼ 1:436þ O
6:114
� �3:001
;
R2 ¼ 0:883; n ¼ 448: ð4Þ
Here WCcrit denotes the critical water saturation and
O the oxygen content [wt.%].
In the Campine Basin coals the water content ranges
between 40% and 100% of the critical water content as
Water content of coal s
0
1
2
3
4
5
6
7
8
0.5 0.6 0.7 0.8 0.9 1.0 1.
vitrinite refec
wat
er C
on
ten
t, W
C [
%]
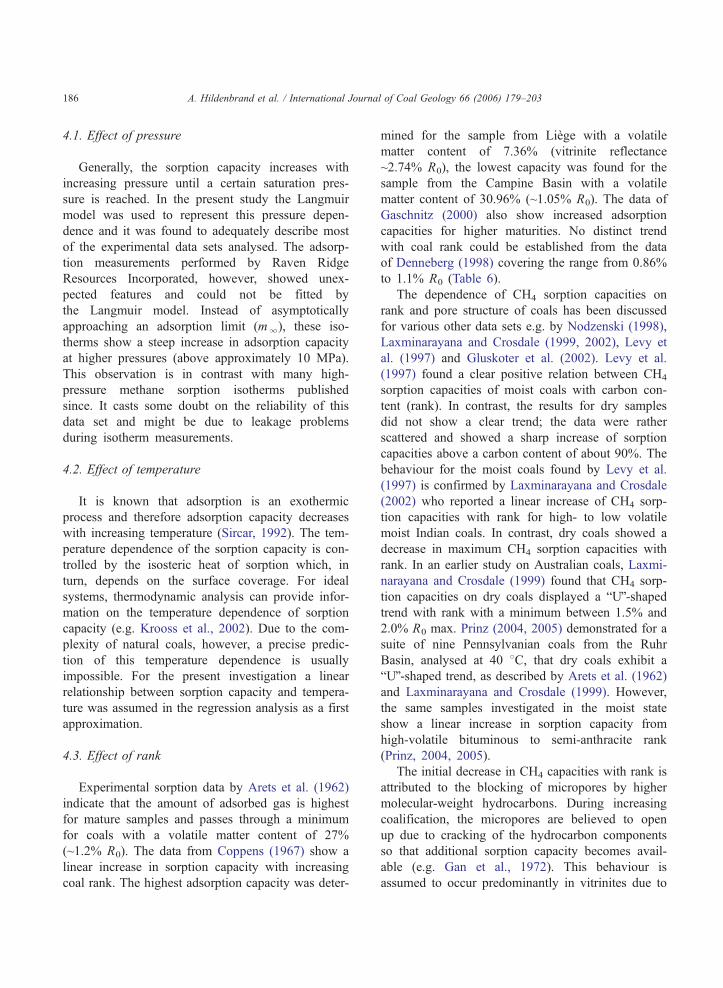
Fig. 3. Actual (WC) and critical water content (WCcrit) of coals from t
according to a formula suggested by Gaschnitz (2000) for the Ruhr Basin
determined using the formula of Gaschnitz (2000).
Both, the critical and prevailing water content (includ-
ing only the adsorbed water and the water held by
capillary forces) change as a function of coal rank
(Fig. 3):
WCcrit ¼ 2:35d R�2:370 ; R2 ¼ 0:52; n ¼ 90 ð5Þ
WC ¼ 1:61d R�2:250 ; R2 ¼ 0:52; n ¼ 203: ð6Þ
From 0.6% to 1.2% R0 the average measured water
content (WC) drops from approximately 6 to 1 wt.%.
For higher rank samples (R0N1%) the water content
does not change significantly (1–2 wt.%). Similar
findings are reported for the Ruhr Basin where the
coals are undersaturated in water by 50–65% with
respect to the critical water content (Gaschnitz, 2000).
5. Sorption capacity estimation algorithms
During burial in sedimentary basins, coal seams are
exposed to elevated pressures and temperatures which,
in combination with the moisture content, represent
primary controls on the gas storage capacity. Further-
amples Campine Basin
WCcrit = 2.35 * R0-2.35 (R2 = 0.52)
WC = 1.61 * R0-2.25 (R2 = 0.54)
1 1.2 1.3 1.4 1.5 1.6 1.7
tance R0 [%]
WC
WCcrit
he Campine Basin; the critical water content has been determined
.
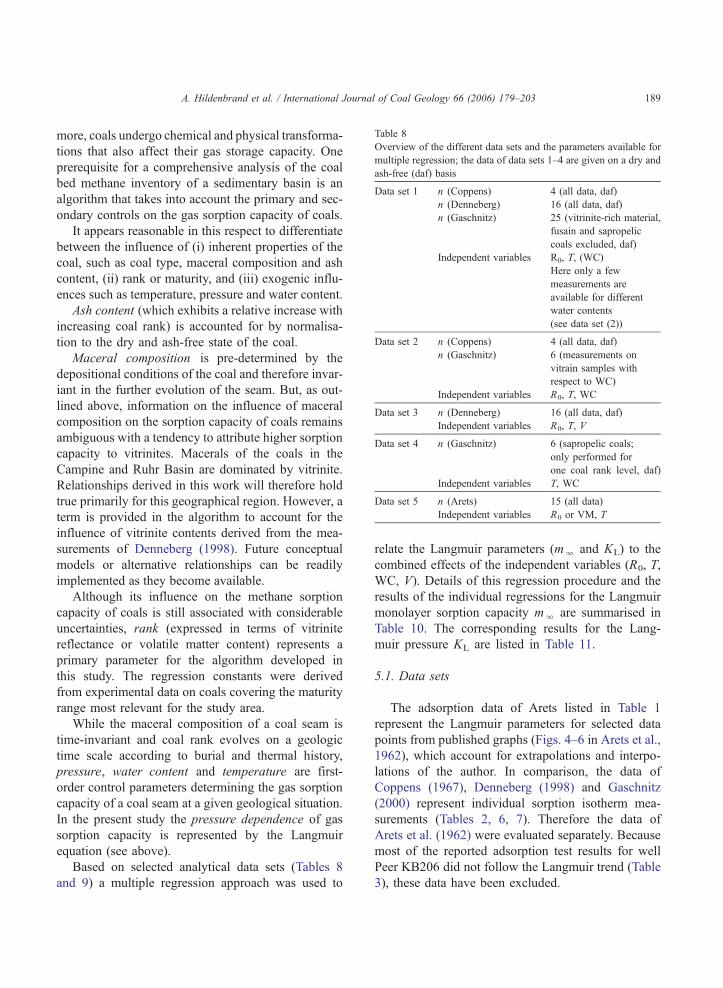
Table 8
Overview of the different data sets and the parameters available for
multiple regression; the data of data sets 1–4 are given on a dry and
ash-free (daf) basis
Data set 1 n (Coppens) 4 (all data, daf)
n (Denneberg) 16 (all data, daf)
n (Gaschnitz) 25 (vitrinite-rich material,
fusain and sapropelic
coals excluded, daf)
Independent variables R0, T, (WC)
Here only a few
measurements are
available for different
water contents
(see data set (2))
Data set 2 n (Coppens) 4 (all data, daf)
n (Gaschnitz) 6 (measurements on
vitrain samples with
respect to WC)
Independent variables R0, T, WC
Data set 3 n (Denneberg) 16 (all data, daf)
Independent variables R0, T, V
Data set 4 n (Gaschnitz) 6 (sapropelic coals;
only performed for
one coal rank level, daf)
Independent variables T, WC
Data set 5 n (Arets) 15 (all data)
Independent variables R0 or VM, T
A. Hildenbrand et al. / International Journal of Coal Geology 66 (2006) 179–203 189
more, coals undergo chemical and physical transforma-
tions that also affect their gas storage capacity. One
prerequisite for a comprehensive analysis of the coal
bed methane inventory of a sedimentary basin is an
algorithm that takes into account the primary and sec-
ondary controls on the gas sorption capacity of coals.
It appears reasonable in this respect to differentiate
between the influence of (i) inherent properties of the
coal, such as coal type, maceral composition and ash
content, (ii) rank or maturity, and (iii) exogenic influ-
ences such as temperature, pressure and water content.
Ash content (which exhibits a relative increase with
increasing coal rank) is accounted for by normalisa-
tion to the dry and ash-free state of the coal.
Maceral composition is pre-determined by the
depositional conditions of the coal and therefore invar-
iant in the further evolution of the seam. But, as out-
lined above, information on the influence of maceral
composition on the sorption capacity of coals remains
ambiguous with a tendency to attribute higher sorption
capacity to vitrinites. Macerals of the coals in the
Campine and Ruhr Basin are dominated by vitrinite.
Relationships derived in this work will therefore hold
true primarily for this geographical region. However, a
term is provided in the algorithm to account for the
influence of vitrinite contents derived from the mea-
surements of Denneberg (1998). Future conceptual
models or alternative relationships can be readily
implemented as they become available.
Although its influence on the methane sorption
capacity of coals is still associated with considerable
uncertainties, rank (expressed in terms of vitrinite
reflectance or volatile matter content) represents a
primary parameter for the algorithm developed in
this study. The regression constants were derived
from experimental data on coals covering the maturity
range most relevant for the study area.
While the maceral composition of a coal seam is
time-invariant and coal rank evolves on a geologic
time scale according to burial and thermal history,
pressure, water content and temperature are first-
order control parameters determining the gas sorption
capacity of a coal seam at a given geological situation.
In the present study the pressure dependence of gas
sorption capacity is represented by the Langmuir
equation (see above).
Based on selected analytical data sets (Tables 8
and 9) a multiple regression approach was used to
relate the Langmuir parameters (ml and KL) to the
combined effects of the independent variables (R0, T,
WC, V). Details of this regression procedure and the
results of the individual regressions for the Langmuir
monolayer sorption capacity ml are summarised in
Table 10. The corresponding results for the Lang-
muir pressure KL are listed in Table 11.
5.1. Data sets
The adsorption data of Arets listed in Table 1
represent the Langmuir parameters for selected data
points from published graphs (Figs. 4–6 in Arets et al.,
1962), which account for extrapolations and interpo-
lations of the author. In comparison, the data of
Coppens (1967), Denneberg (1998) and Gaschnitz
(2000) represent individual sorption isotherm mea-
surements (Tables 2, 6, 7). Therefore the data of
Arets et al. (1962) were evaluated separately. Because
most of the reported adsorption test results for well
Peer KB206 did not follow the Langmuir trend (Table
3), these data have been excluded.
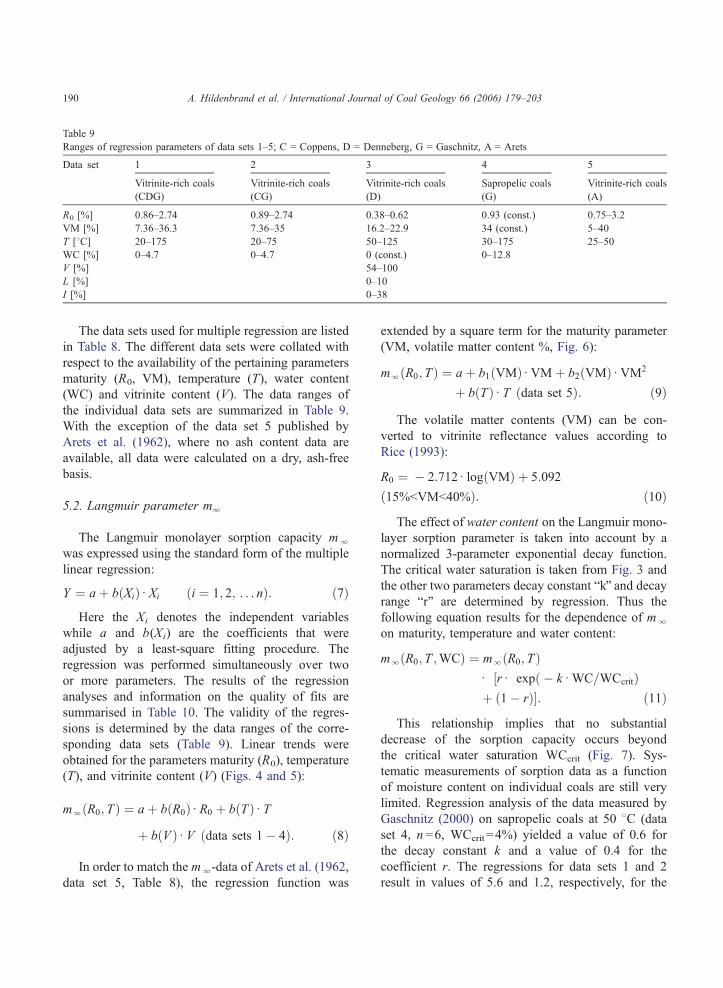
Table 9
Ranges of regression parameters of data sets 1–5; C = Coppens, D = Denneberg, G = Gaschnitz, A = Arets
Data set 1 2 3 4 5
Vitrinite-rich coals
(CDG)
Vitrinite-rich coals
(CG)
Vitrinite-rich coals
(D)
Sapropelic coals
(G)
Vitrinite-rich coals
(A)
R0 [%] 0.86–2.74 0.89–2.74 0.38–0.62 0.93 (const.) 0.75–3.2
VM [%] 7.36–36.3 7.36–35 16.2–22.9 34 (const.) 5–40
T [8C] 20–175 20–75 50–125 30–175 25–50
WC [%] 0–4.7 0–4.7 0 (const.) 0–12.8
V [%] 54–100
L [%] 0–10
I [%] 0–38
A. Hildenbrand et al. / International Journal of Coal Geology 66 (2006) 179–203190
The data sets used for multiple regression are listed
in Table 8. The different data sets were collated with
respect to the availability of the pertaining parameters
maturity (R0, VM), temperature (T), water content
(WC) and vitrinite content (V). The data ranges of
the individual data sets are summarized in Table 9.
With the exception of the data set 5 published by
Arets et al. (1962), where no ash content data are
available, all data were calculated on a dry, ash-free
basis.
5.2. Langmuir parameter ml
The Langmuir monolayer sorption capacity ml
was expressed using the standard form of the multiple
linear regression:
Y ¼ aþ b Xið Þd Xi i ¼ 1; 2; . . . nð Þ: ð7Þ
Here the Xi denotes the independent variables
while a and b(Xi) are the coefficients that were
adjusted by a least-square fitting procedure. The
regression was performed simultaneously over two
or more parameters. The results of the regression
analyses and information on the quality of fits are
summarised in Table 10. The validity of the regres-
sions is determined by the data ranges of the corre-
sponding data sets (Table 9). Linear trends were
obtained for the parameters maturity (R0), temperature
(T), and vitrinite content (V) (Figs. 4 and 5):
ml R0; Tð Þ ¼ aþ b R0ð Þd R0 þ b Tð Þd T
þ b Vð Þd V data sets 1� 4ð Þ: ð8Þ
In order to match the ml-data of Arets et al. (1962,
data set 5, Table 8), the regression function was
extended by a square term for the maturity parameter
(VM, volatile matter content %, Fig. 6):
ml R0; Tð Þ ¼ aþ b1 VMð Þd VMþ b2 VMð Þd VM2
þ b Tð Þd T data set 5ð Þ: ð9Þ
The volatile matter contents (VM) can be con-
verted to vitrinite reflectance values according to
Rice (1993):
R0 ¼ � 2:712d log VMð Þ þ 5:092
15%bVMb40%ð Þ: ð10Þ
The effect of water content on the Langmuir mono-
layer sorption parameter is taken into account by a
normalized 3-parameter exponential decay function.
The critical water saturation is taken from Fig. 3 and
the other two parameters decay constant bkQ and decayrange brQ are determined by regression. Thus the
following equation results for the dependence of ml
on maturity, temperature and water content:
ml R0; T ;WCð Þ ¼ ml R0; Tð Þd rd exp � kd WC=WCcritð Þ½þ 1� rð Þ�: ð11Þ
This relationship implies that no substantial
decrease of the sorption capacity occurs beyond
the critical water saturation WCcrit (Fig. 7). Sys-
tematic measurements of sorption data as a function
of moisture content on individual coals are still very
limited. Regression analysis of the data measured by
Gaschnitz (2000) on sapropelic coals at 50 8C (data
set 4, n =6, WCcrit =4%) yielded a value of 0.6 for
the decay constant k and a value of 0.4 for the
coefficient r. The regressions for data sets 1 and 2
result in values of 5.6 and 1.2, respectively, for the
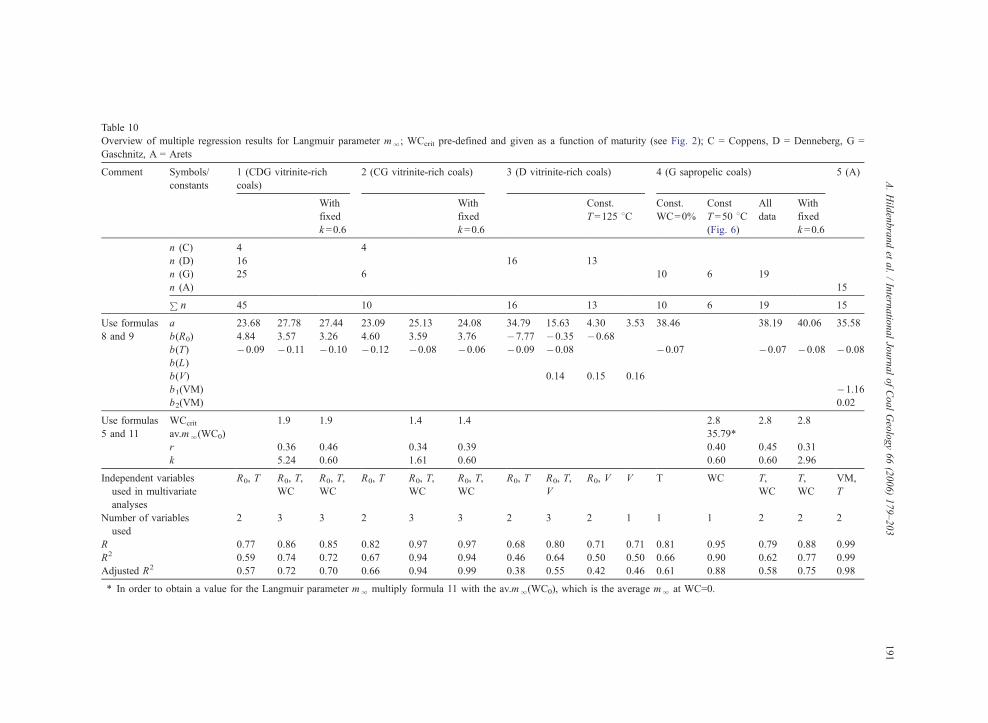
Table 10
Overview of multiple regression results for Langmuir parameter ml; WCcrit pre-defined and given as a function of maturity (see Fig. 2); C = Coppens, D = Denneberg, G =
Gaschnitz, A = Arets
Comment Symbols/
constants
1 (CDG vitrinite-rich
coals)
2 (CG vitrinite-rich coals) 3 (D vitrinite-rich coals) 4 (G sapropelic coals) 5 (A)
With
fixed
k =0.6
With
fixed
k =0.6
Const.
T=125 8CConst.
WC=0%
Const
T =50 8C(Fig. 6)
All
data
With
fixed
k =0.6
n (C) 4 4
n (D) 16 16 13
n (G) 25 6 10 6 19
n (A) 15Pn 45 10 16 13 10 6 19 15
Use formulas a 23.68 27.78 27.44 23.09 25.13 24.08 34.79 15.63 4.30 3.53 38.46 38.19 40.06 35.58
8 and 9 b(R0) 4.84 3.57 3.26 4.60 3.59 3.76 �7.77 �0.35 �0.68
b(T) �0.09 �0.11 �0.10 �0.12 �0.08 �0.06 �0.09 �0.08 �0.07 �0.07 �0.08 �0.08
b(L)
b(V) 0.14 0.15 0.16
b1(VM) �1.16
b2(VM) 0.02
Use formulas WCcrit 1.9 1.9 1.4 1.4 2.8 2.8 2.8
5 and 11 av.ml(WC0) 35.79*
r 0.36 0.46 0.34 0.39 0.40 0.45 0.31
k 5.24 0.60 1.61 0.60 0.60 0.60 2.96
Independent variables
used in multivariate
analyses
R0, T R0, T,
WC
R0, T,
WC
R0, T R0, T,
WC
R0, T,
WC
R0, T R0, T,
V
R0, V V T WC T,
WC
T,
WC
VM,
T
Number of variables
used
2 3 3 2 3 3 2 3 2 1 1 1 2 2 2
R 0.77 0.86 0.85 0.82 0.97 0.97 0.68 0.80 0.71 0.71 0.81 0.95 0.79 0.88 0.99
R2 0.59 0.74 0.72 0.67 0.94 0.94 0.46 0.64 0.50 0.50 0.66 0.90 0.62 0.77 0.99
Adjusted R2 0.57 0.72 0.70 0.66 0.94 0.99 0.38 0.55 0.42 0.46 0.61 0.88 0.58 0.75 0.98
* In order to obtain a value for the Langmuir parameter ml multiply formula 11 with the av.ml(WC0), which is the average ml at WC=0.
A.Hild
enbrandet
al./Intern
atio
nalJournalofCoalGeology66(2006)179–203
191
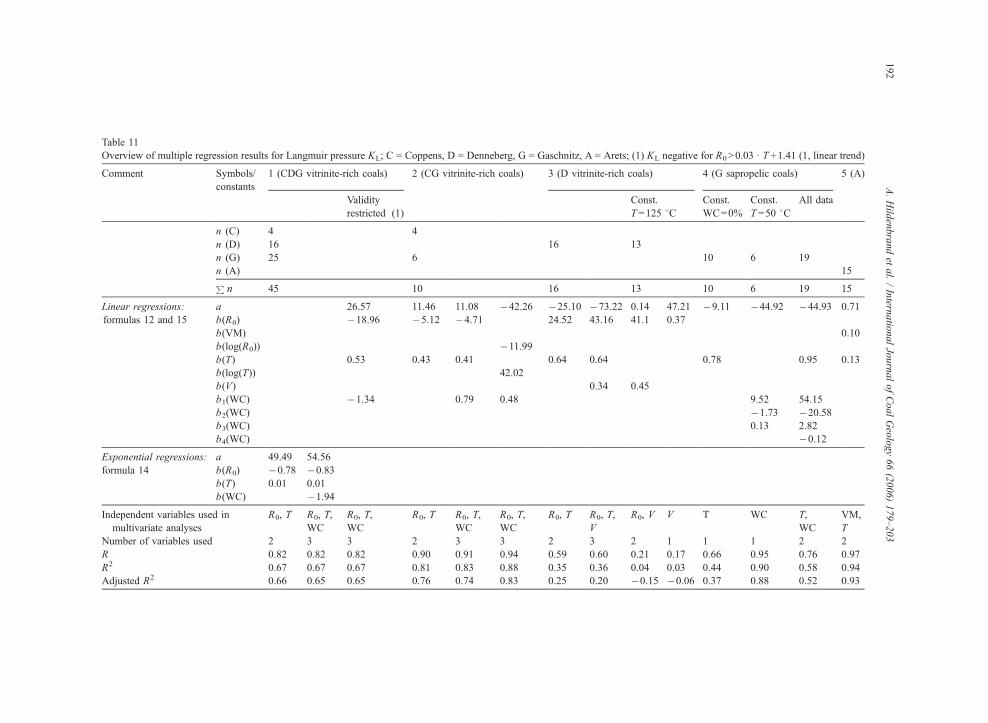
Table 11
Overview of multiple regression results for Langmuir pressure KL; C = Coppens, D = Denneberg, G = Gaschnitz, A = Arets; (1) KL negative for R0N0.03 d T +1.41 (1, linear trend)
Comment Symbols/
constants
1 (CDG vitrinite-rich coals) 2 (CG vitrinite-rich coals) 3 (D vitrinite-rich coals) 4 (G sapropelic coals) 5 (A)
Validity
restricted (1)
Const.
T=125 8CConst.
WC=0%
Const.
T =50 8CAll data
n (C) 4 4
n (D) 16 16 13
n (G) 25 6 10 6 19
n (A) 15Pn 45 10 16 13 10 6 19 15
Linear regressions: a 26.57 11.46 11.08 �42.26 �25.10 �73.22 0.14 47.21 �9.11 �44.92 �44.93 0.71
formulas 12 and 15 b(R0) �18.96 �5.12 �4.71 24.52 43.16 41.1 0.37
b(VM) 0.10
b(log(R0)) �11.99
b(T) 0.53 0.43 0.41 0.64 0.64 0.78 0.95 0.13
b(log(T)) 42.02
b(V) 0.34 0.45
b1(WC) �1.34 0.79 0.48 9.52 54.15
b2(WC) �1.73 �20.58
b3(WC) 0.13 2.82
b4(WC) �0.12
Exponential regressions: a 49.49 54.56
formula 14 b(R0) �0.78 �0.83
b(T) 0.01 0.01
b(WC) �1.94
Independent variables used in
multivariate analyses
R0, T R0, T,
WC
R0, T,
WC
R0, T R0, T,
WC
R0, T,
WC
R0, T R0, T,
V
R0, V V T WC T,
WC
VM,
T
Number of variables used 2 3 3 2 3 3 2 3 2 1 1 1 2 2
R 0.82 0.82 0.82 0.90 0.91 0.94 0.59 0.60 0.21 0.17 0.66 0.95 0.76 0.97
R2 0.67 0.67 0.67 0.81 0.83 0.88 0.35 0.36 0.04 0.03 0.44 0.90 0.58 0.94
Adjusted R2 0.66 0.65 0.65 0.76 0.74 0.83 0.25 0.20 �0.15 �0.06 0.37 0.88 0.52 0.93
A.Hild
enbrandet
al./Intern
atio
nalJournalofCoalGeology66(2006)179–203
192
vitrinite-rich coals, n = 45(Coppens, Denneberg, Gaschnitz)
0
5
10
15
20
25
30
35
40
0 1 2 3% R0
m ∞
[Std
. m3 /
t]
m ∞
[Std
. m3 /
t]
meas.calc.linear trend (50oC, 0%WC)
meas.calc.linear trend (2%R0, 0%WC)
vitrinite-rich coals, n = 45(Coppens, Denneberg, Gaschnitz)
0
5
10
15
20
25
30
35
40
0 50 100 150 200
T [oC]
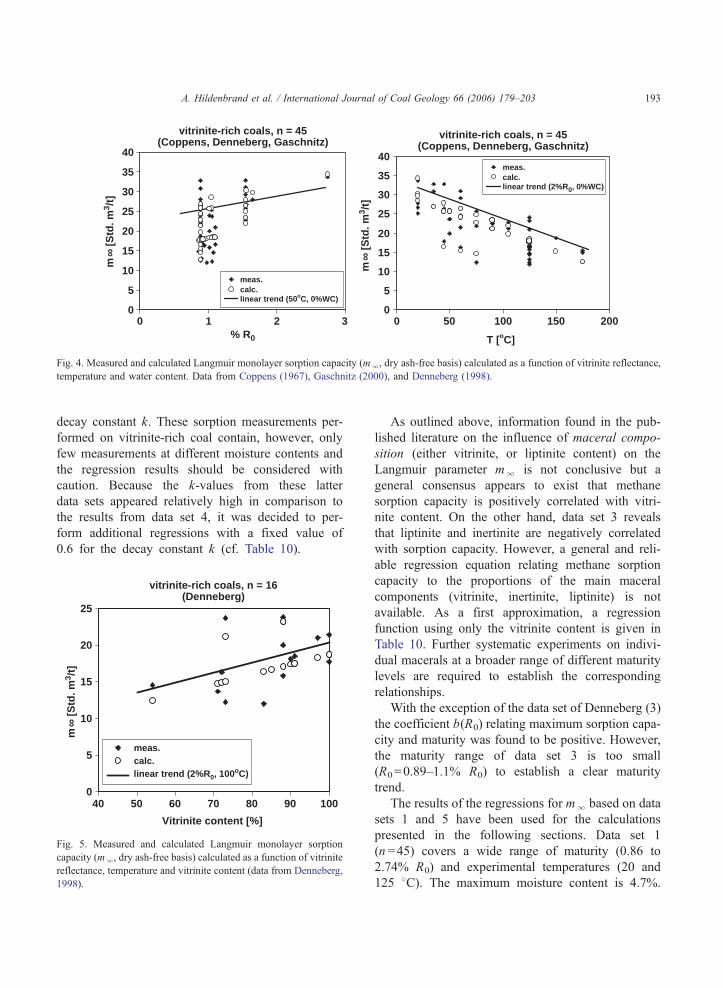
Fig. 4. Measured and calculated Langmuir monolayer sorption capacity (ml, dry ash-free basis) calculated as a function of vitrinite reflectance,
temperature and water content. Data from Coppens (1967), Gaschnitz (2000), and Denneberg (1998).
A. Hildenbrand et al. / International Journal of Coal Geology 66 (2006) 179–203 193
decay constant k. These sorption measurements per-
formed on vitrinite-rich coal contain, however, only
few measurements at different moisture contents and
the regression results should be considered with
caution. Because the k-values from these latter
data sets appeared relatively high in comparison to
the results from data set 4, it was decided to per-
form additional regressions with a fixed value of
0.6 for the decay constant k (cf. Table 10).
vitrinite-rich coals, n = 16(Denneberg)
0
5
10
15
20
25
40 50 60 70 80 90 100
Vitrinite content [%]
m ∞
[S
td. m
3 /t]
meas.calc.linear trend (2%R0, 100oC)
Fig. 5. Measured and calculated Langmuir monolayer sorption
capacity (ml, dry ash-free basis) calculated as a function of vitrinite
reflectance, temperature and vitrinite content (data from Denneberg,
1998).
As outlined above, information found in the pub-
lished literature on the influence of maceral compo-
sition (either vitrinite, or liptinite content) on the
Langmuir parameter ml is not conclusive but a
general consensus appears to exist that methane
sorption capacity is positively correlated with vitri-
nite content. On the other hand, data set 3 reveals
that liptinite and inertinite are negatively correlated
with sorption capacity. However, a general and reli-
able regression equation relating methane sorption
capacity to the proportions of the main maceral
components (vitrinite, inertinite, liptinite) is not
available. As a first approximation, a regression
function using only the vitrinite content is given in
Table 10. Further systematic experiments on indivi-
dual macerals at a broader range of different maturity
levels are required to establish the corresponding
relationships.
With the exception of the data set of Denneberg (3)
the coefficient b(R0) relating maximum sorption capa-
city and maturity was found to be positive. However,
the maturity range of data set 3 is too small
(R0=0.89–1.1% R0) to establish a clear maturity
trend.
The results of the regressions for ml based on data
sets 1 and 5 have been used for the calculations
presented in the following sections. Data set 1
(n =45) covers a wide range of maturity (0.86 to
2.74% R0) and experimental temperatures (20 and
125 8C). The maximum moisture content is 4.7%.
sapropelic coals, n = 6(Gaschnitz)
0
5
10
15
20
25
30
35
40
45
0 5 10 15WC [%]
m ∞
[S
td. m
3 /t]
calc. (50oC)meas
m∞= r * exp(-k • WC / WCcrit) + (1- r)
WCcrit = 2.8
with WCcrit = 2.35 * R0^(-2.37)
r = 0.40
k = 0.6
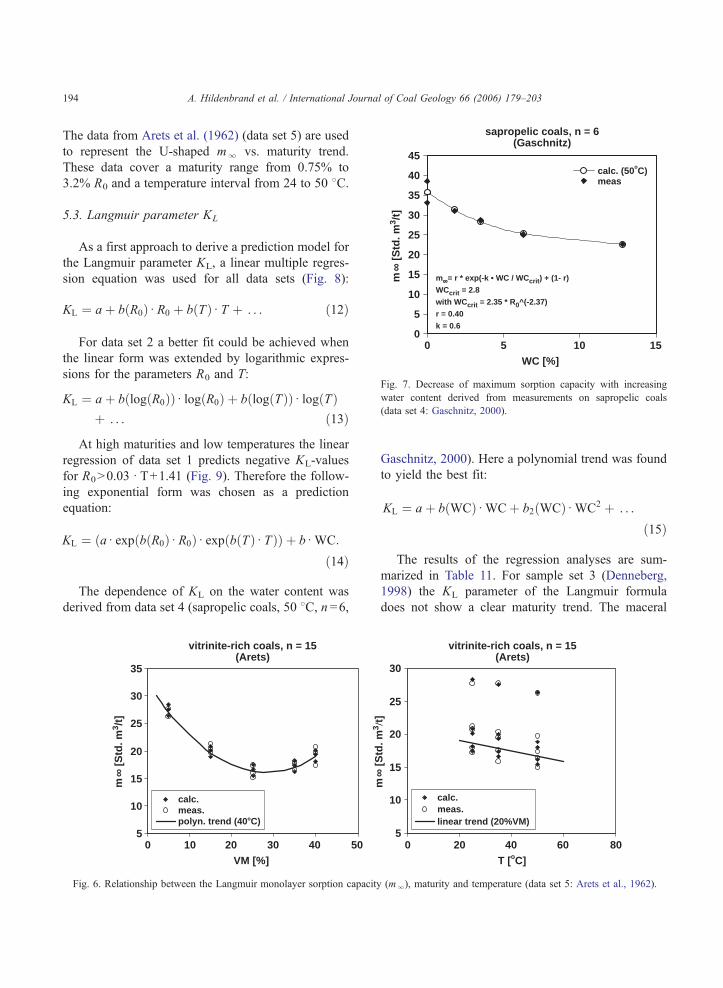
Fig. 7. Decrease of maximum sorption capacity with increasing
water content derived from measurements on sapropelic coals
(data set 4: Gaschnitz, 2000).
A. Hildenbrand et al. / International Journal of Coal Geology 66 (2006) 179–203194
The data from Arets et al. (1962) (data set 5) are used
to represent the U-shaped ml vs. maturity trend.
These data cover a maturity range from 0.75% to
3.2% R0 and a temperature interval from 24 to 50 8C.
5.3. Langmuir parameter KL
As a first approach to derive a prediction model for
the Langmuir parameter KL, a linear multiple regres-
sion equation was used for all data sets (Fig. 8):
KL ¼ aþ b R0ð Þd R0 þ b Tð Þd T þ . . . ð12Þ
For data set 2 a better fit could be achieved when
the linear form was extended by logarithmic expres-
sions for the parameters R0 and T:
KL ¼ aþ b log R0ð Þð Þd log R0ð Þ þ b log Tð Þð Þd log Tð Þþ . . . ð13Þ
At high maturities and low temperatures the linear
regression of data set 1 predicts negative KL-values
for R0N0.03 d T+1.41 (Fig. 9). Therefore the follow-
ing exponential form was chosen as a prediction
equation:
KL ¼ ad exp b R0ð Þd R0ð Þd exp b Tð Þd Tð Þð Þ þ bd WC:
ð14Þ
The dependence of KL on the water content was
derived from data set 4 (sapropelic coals, 50 8C, n =6,
vitrinite-rich coals, n = 15(Arets)
5
10
15
20
25
30
35
0 10 20 30 40 50VM [%]
m ∞
[S
td. m
3 /t]
calc.meas.polyn. trend (40oC)
Fig. 6. Relationship between the Langmuir monolayer sorption capacity
Gaschnitz, 2000). Here a polynomial trend was found
to yield the best fit:
KL ¼ aþ b WCð Þd WCþ b2 WCð Þd WC2 þ . . .
ð15Þ
The results of the regression analyses are sum-
marized in Table 11. For sample set 3 (Denneberg,
1998) the KL parameter of the Langmuir formula
does not show a clear maturity trend. The maceral
vitrinite-rich coals, n = 15(Arets)
m ∞
[S
td. m
3 /t]
5
10
15
20
25
30
0 20 40 60 80T [oC]
calc.meas.linear trend (20%VM)
(ml), maturity and temperature (data set 5: Arets et al., 1962).
vitrinite-rich coal, n = 15(Arets)
0.0
0.5
1.0
1.5
0 10 20 30 40 50
VM [%]
KL [
MP
a]
vitrinite-rich coal, n = 15(Arets)
0.0
0.5
1.0
1.5
0 20 30 40
T [oC]K
L [
MP
a]
meas.calc.linear trend (20%VM)
meas.calc.linear trend (40oC)
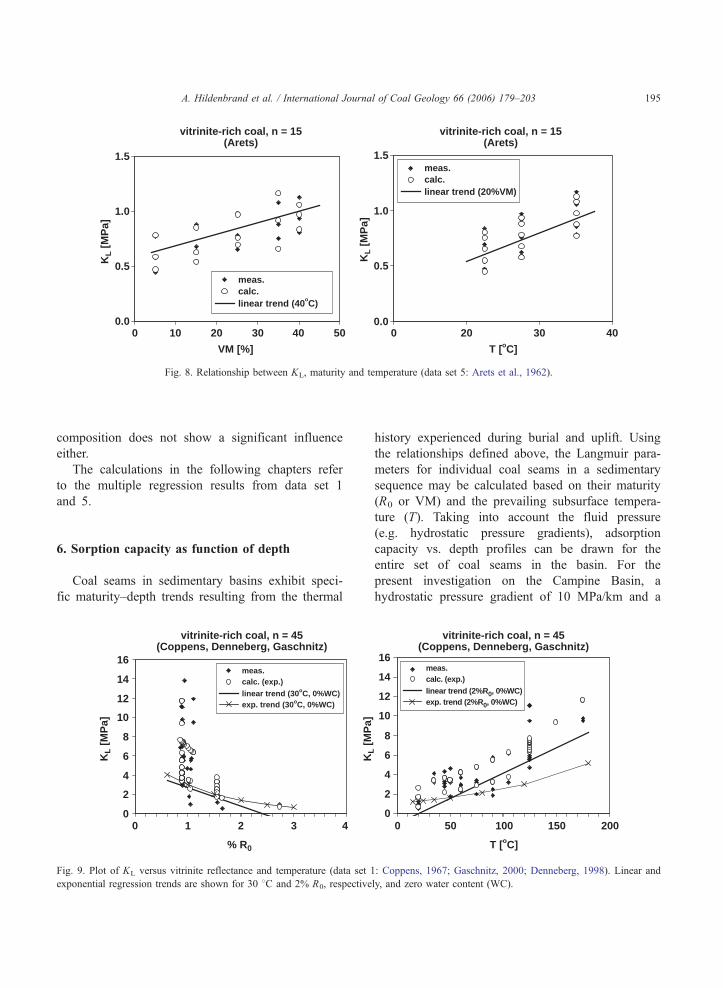
Fig. 8. Relationship between KL, maturity and temperature (data set 5: Arets et al., 1962).
A. Hildenbrand et al. / International Journal of Coal Geology 66 (2006) 179–203 195
composition does not show a significant influence
either.
The calculations in the following chapters refer
to the multiple regression results from data set 1
and 5.
6. Sorption capacity as function of depth
Coal seams in sedimentary basins exhibit speci-
fic maturity–depth trends resulting from the thermal
vitrinite-rich coal, n = 45(Coppens, Denneberg, Gaschnitz)
0
2
4
6
8
10
12
14
16
0 1 2 3 4
% R0
KL [
MP
a]
K [
MP
a]
meas.calc. (exp.)linear trend (30oC, 0%WC)exp. trend (30oC, 0%WC)
Fig. 9. Plot of KL versus vitrinite reflectance and temperature (data set 1
exponential regression trends are shown for 30 8C and 2% R0, respective
history experienced during burial and uplift. Using
the relationships defined above, the Langmuir para-
meters for individual coal seams in a sedimentary
sequence may be calculated based on their maturity
(R0 or VM) and the prevailing subsurface tempera-
ture (T). Taking into account the fluid pressure
(e.g. hydrostatic pressure gradients), adsorption
capacity vs. depth profiles can be drawn for the
entire set of coal seams in the basin. For the
present investigation on the Campine Basin, a
hydrostatic pressure gradient of 10 MPa/km and a
L
meas.calc. (exp.)linear trend (2%R0, 0%WC)exp. trend (2%R0, 0%WC)
vitrinite-rich coal, n = 45(Coppens, Denneberg, Gaschnitz)
0
2
4
6
8
10
12
14
16
0 50 100 150 200
T [oC]
: Coppens, 1967; Gaschnitz, 2000; Denneberg, 1998). Linear and
ly, and zero water content (WC).
0
1
2
3
4
5
6
0 5 10 15 20 25 30
sorption capacity [Std. m3/t]according to dataset 1
dep
th [
km]
2 % R01.5 % R01 % R00.6 % R00.6-1.6 % R0
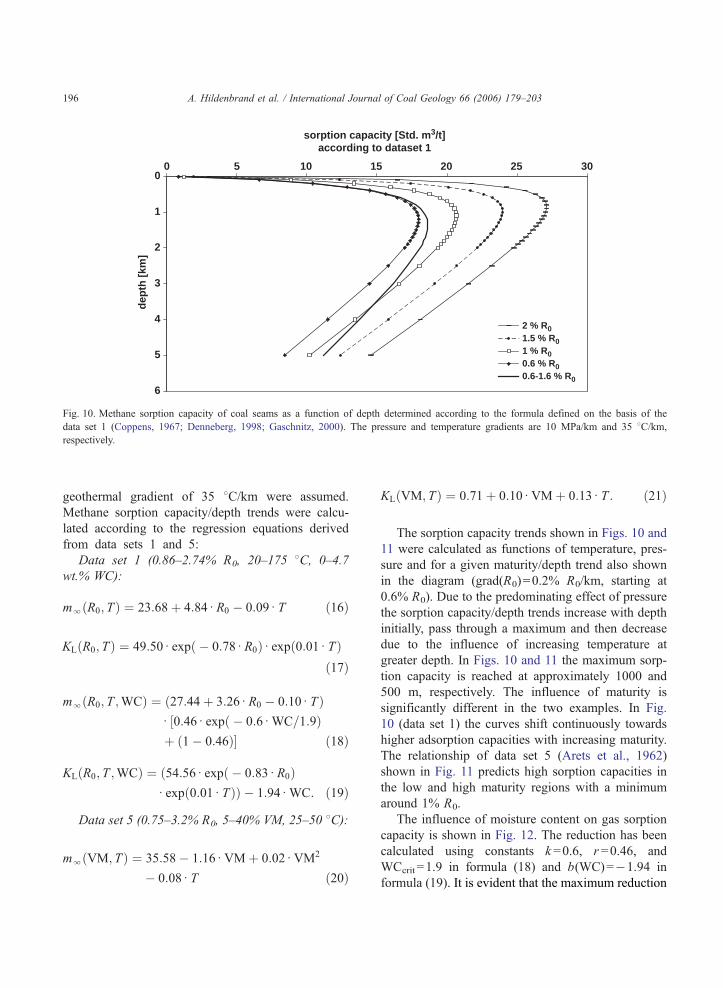
Fig. 10. Methane sorption capacity of coal seams as a function of depth determined according to the formula defined on the basis of the
data set 1 (Coppens, 1967; Denneberg, 1998; Gaschnitz, 2000). The pressure and temperature gradients are 10 MPa/km and 35 8C/km,
respectively.
A. Hildenbrand et al. / International Journal of Coal Geology 66 (2006) 179–203196
geothermal gradient of 35 8C/km were assumed.
Methane sorption capacity/depth trends were calcu-
lated according to the regression equations derived
from data sets 1 and 5:
Data set 1 (0.86–2.74% R0, 20–175 8C, 0–4.7
wt.% WC):
ml R0; Tð Þ ¼ 23:68þ 4:84d R0 � 0:09d T ð16Þ
KL R0; Tð Þ ¼ 49:50d exp � 0:78d R0ð Þd exp 0:01d Tð Þð17Þ
ml R0; T ;WCð Þ ¼ 27:44þ 3:26d R0 � 0:10d Tð Þd 0:46d exp � 0:6d WC=1:9ð Þ½þ 1� 0:46ð Þ� ð18Þ
KL R0; T ;WCð Þ ¼ 54:56d exp � 0:83d R0ð Þðd exp 0:01d Tð ÞÞ � 1:94d WC: ð19Þ
Data set 5 (0.75–3.2% R0, 5–40% VM, 25–50 8C):
ml VM; Tð Þ ¼ 35:58� 1:16d VMþ 0:02d VM2
� 0:08d T ð20Þ
KL VM; Tð Þ ¼ 0:71þ 0:10d VMþ 0:13d T : ð21Þ
The sorption capacity trends shown in Figs. 10 and
11 were calculated as functions of temperature, pres-
sure and for a given maturity/depth trend also shown
in the diagram (grad(R0)=0.2% R0/km, starting at
0.6% R0). Due to the predominating effect of pressure
the sorption capacity/depth trends increase with depth
initially, pass through a maximum and then decrease
due to the influence of increasing temperature at
greater depth. In Figs. 10 and 11 the maximum sorp-
tion capacity is reached at approximately 1000 and
500 m, respectively. The influence of maturity is
significantly different in the two examples. In Fig.
10 (data set 1) the curves shift continuously towards
higher adsorption capacities with increasing maturity.
The relationship of data set 5 (Arets et al., 1962)
shown in Fig. 11 predicts high sorption capacities in
the low and high maturity regions with a minimum
around 1% R0.
The influence of moisture content on gas sorption
capacity is shown in Fig. 12. The reduction has been
calculated using constants k =0.6, r =0.46, and
WCcrit =1.9 in formula (18) and b(WC)=�1.94 in
formula (19). It is evident that the maximum reduction
0
1
2
3
4
5
6
0 5 10 15 20 25
sorption capacity [Std. m3/t]according to dataset 5
dep
th [
km]
2 % R01.5 % R01 % R00.6 % R00.6-1.6 % R0
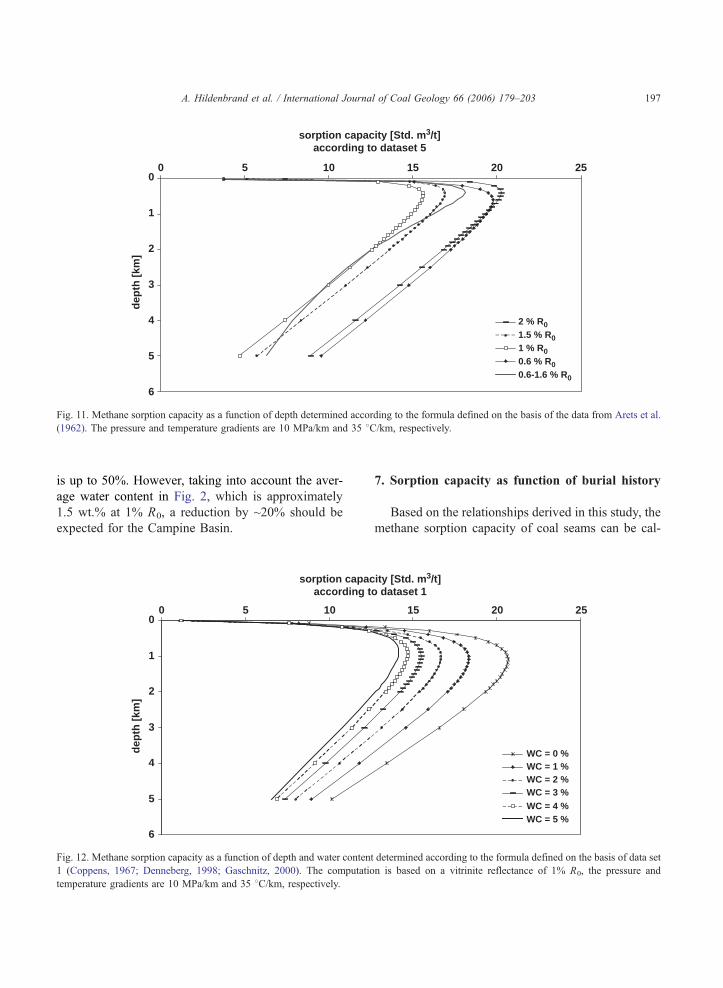
Fig. 11. Methane sorption capacity as a function of depth determined according to the formula defined on the basis of the data from Arets et al.
(1962). The pressure and temperature gradients are 10 MPa/km and 35 8C/km, respectively.
A. Hildenbrand et al. / International Journal of Coal Geology 66 (2006) 179–203 197
is up to 50%. However, taking into account the aver-
age water content in Fig. 2, which is approximately
1.5 wt.% at 1% R0, a reduction by ~20% should be
expected for the Campine Basin.
0
1
2
3
4
5
6
0 5 10
sorption capacaccording t
dep
th [
km]
Fig. 12. Methane sorption capacity as a function of depth and water content
1 (Coppens, 1967; Denneberg, 1998; Gaschnitz, 2000). The computatio
temperature gradients are 10 MPa/km and 35 8C/km, respectively.
7. Sorption capacity as function of burial history
Based on the relationships derived in this study, the
methane sorption capacity of coal seams can be cal-
15 20 25
ity [Std. m3/t]o dataset 1
WC = 0 %WC = 1 %WC = 2 %WC = 3 %WC = 4 %WC = 5 %
determined according to the formula defined on the basis of data set
n is based on a vitrinite reflectance of 1% R0, the pressure and
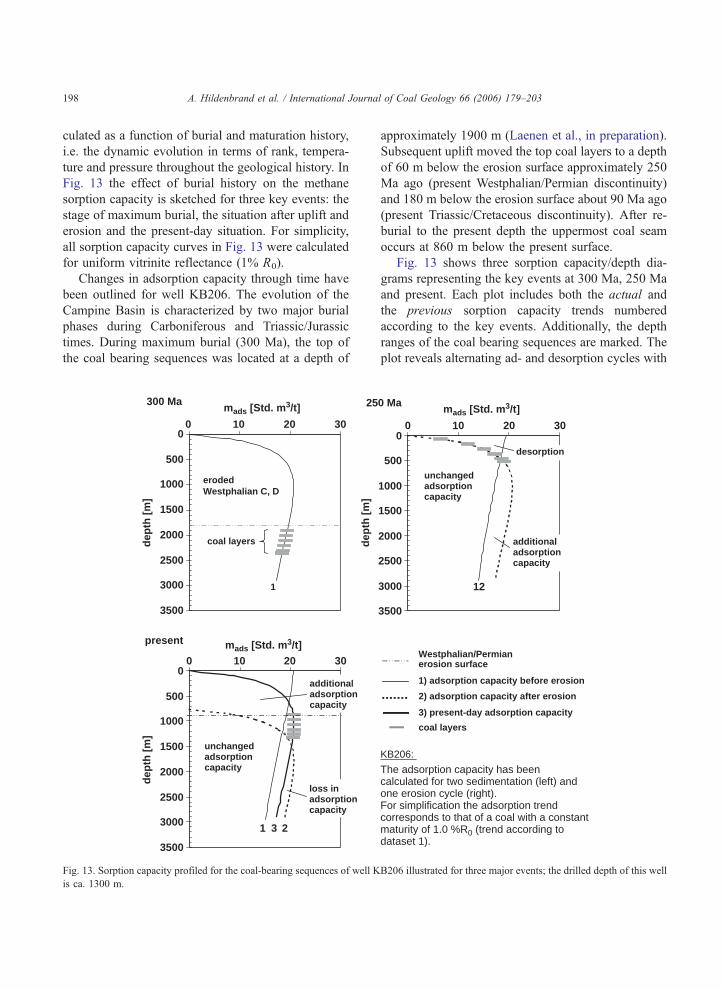
A. Hildenbrand et al. / International Journal of Coal Geology 66 (2006) 179–203198
culated as a function of burial and maturation history,
i.e. the dynamic evolution in terms of rank, tempera-
ture and pressure throughout the geological history. In
Fig. 13 the effect of burial history on the methane
sorption capacity is sketched for three key events: the
stage of maximum burial, the situation after uplift and
erosion and the present-day situation. For simplicity,
all sorption capacity curves in Fig. 13 were calculated
for uniform vitrinite reflectance (1% R0).
Changes in adsorption capacity through time have
been outlined for well KB206. The evolution of the
Campine Basin is characterized by two major burial
phases during Carboniferous and Triassic/Jurassic
times. During maximum burial (300 Ma), the top of
the coal bearing sequences was located at a depth of
depth
[m
]
25
0 10 20 30
mads [Std. m3/t]300 Ma
0
500
1000
1500
2000
2500
3000
3500
dep
th [
m]
erodedWestphalian C, D
coal layers
1
0
500
1000
1500
2000
2500
3000
3500
0 10 20 30mads [Std. m3/t]
dep
th [
m]
present
unchangedadsorptioncapacity
23
additionaladsorptioncapacity
loss inadsorptioncapacity
1
Fig. 13. Sorption capacity profiled for the coal-bearing sequences of well K
is ca. 1300 m.
approximately 1900 m (Laenen et al., in preparation).
Subsequent uplift moved the top coal layers to a depth
of 60 m below the erosion surface approximately 250
Ma ago (present Westphalian/Permian discontinuity)
and 180 m below the erosion surface about 90 Ma ago
(present Triassic/Cretaceous discontinuity). After re-
burial to the present depth the uppermost coal seam
occurs at 860 m below the present surface.
Fig. 13 shows three sorption capacity/depth dia-
grams representing the key events at 300 Ma, 250 Ma
and present. Each plot includes both the actual and
the previous sorption capacity trends numbered
according to the key events. Additionally, the depth
ranges of the coal bearing sequences are marked. The
plot reveals alternating ad- and desorption cycles with
0
500
1000
1500
2000
2500
3000
3500
0 10 20 30
mads [Std. m3/t]0 Ma
unchangedadsorptioncapacity
additionaladsorptioncapacity
12
desorption
Westphalian/Permianerosion surface
KB206:
The adsorption capacity has beencalculated for two sedimentation (left) andone erosion cycle (right).For simplification the adsorption trend corresponds to that of a coal with a constantmaturity of 1.0 %R0 (trend according todataset 1).
1) adsorption capacity before erosion
2) adsorption capacity after erosion
3) present-day adsorption capacity
coal layers
B206 illustrated for three major events; the drilled depth of this well

A. Hildenbrand et al. / International Journal of Coal Geology 66 (2006) 179–203 199
changing burial depth. Depending on the burial his-
tory and the position within the sedimentary column,
the maximum methane sorption capacity of a coal
seam may either increase or decrease. It is evident
from Fig. 13 that after the first uplift/erosion event
(250 Ma) the sorption capacity of the top layers
decreased, whereas for the deeper sequences an
increase in sorption capacity is observed. After re-
burial (present, curve 3), and in comparison to the
adsorption capacity established at 250 Ma (curve 2)
this trend is reversed and the sorption capacity of the
top layers has increased, whereas the deeper
sequences have lost part of their sorption capacity.
At depth levels below ca. 1500 m the first adsorption
capacity curve established at 300 Ma (curve 1) exhi-
bits the lowest sorption capacity.
During subsidence and increasing burial, the
excess gas stored in the lowermost coal seams is
desorbed and migrates upwards, where it either re-
adsorbs in undersaturated layers having a higher sorp-
tion capacity, is trapped underneath low-permeable
layers or will migrate to the surface. Zones where
additional sorption capacity is created will remain
undersaturated if no additional gas is supplied.
ad- and desorbed amount of gas [Std. m3/t, daf]
0 5 10 150.8
1.0
1.2
1.4
0.6 0.8 1.0 1.2
% R0
dep
th [
km]
Fig. 14. Comparison of measured gas contents from canister desorption te
capacities were either calculated according to Stuffken (1960) and the re
Gaschnitz, 2000). The regressions were used to calculate different adsorp
during maximum burial (300 Ma), (2) after erosion (250 Ma) and (3) the p
calculated based on the water contents measured on samples of well K
WCcrit=1.8–3.8%), both decreasing with depth. Error bars indicate a 50%
For the quantification of the present-day gas con-
tent of coal seams one has therefore to take into
account the gas generation history:
— Assuming that no additional gas (e.g. late-stage
biogenic gas) has been generated or supplied from
greater depth after the time of maximum burial, the
gas storage potential of the coal seam in all sub-
sequent periods will be equal to the lowest sorp-
tion capacity which has been exhibited since (zone
of dunchanged adsorption capacityT in Fig. 13).
— If the layers, where additional sorption capacity
was created during the geological history, are sup-
plied with appropriate amounts of thermogenic gas
from deeper sequences or secondary biogenic gas,
the present-day adsorption trend has to be used for
the gas content computations.
8. Coalbed methane content of well Peer KB206
Figs. 14 and 15 show comparisons of gas contents
from canister desorption tests with calculated sorption
capacities for the Peer KB206 test well (RRRI and
(well KB206)
20 25
desorbed gas (DMT)desorbed gas (RRRI)calc. after Stuffken (1960)
123min. ‘dry’ sorption capacity
min. ‘wet’ sorption capacity(k = 0.6, r = 0.46)min. 'wet' sorption capacity(k = 5.24, r = 0.36)
calc.dataset 1
sts and calculated adsorption capacities for well KB206. Adsorption
gressions based on data set 1 (Coppens, 1967; Denneberg, 1998;
tion trends (dry state), which either follow (1) the one established
resent-day burial depth. The reduction due to moisture content was
B206 and the calculated critical water content (WC=1.4–2.0%,
reduction of the minimum ddryT sorption capacity.
ad- and desorbed amount of gas (well KB206)[Std. m3/t, daf]
0 5 10 15 20 25
desorbed gas (DMT)desorbed gas (RRRI)calc. after Stuffken (1960)123min. ‘dry’ sorption capacitymin. ‘wet’ sorption capacity(k = 0.6, r = 0.46)
min. ‘wet’ sorption capacity(k = 5.24, r = 0.36)
calc.dataset 5
calc.dataset 1
0.8
1.0
1.2
1.4
0.6 0.8 1.0 1.2
% R0
dep
th [
km]
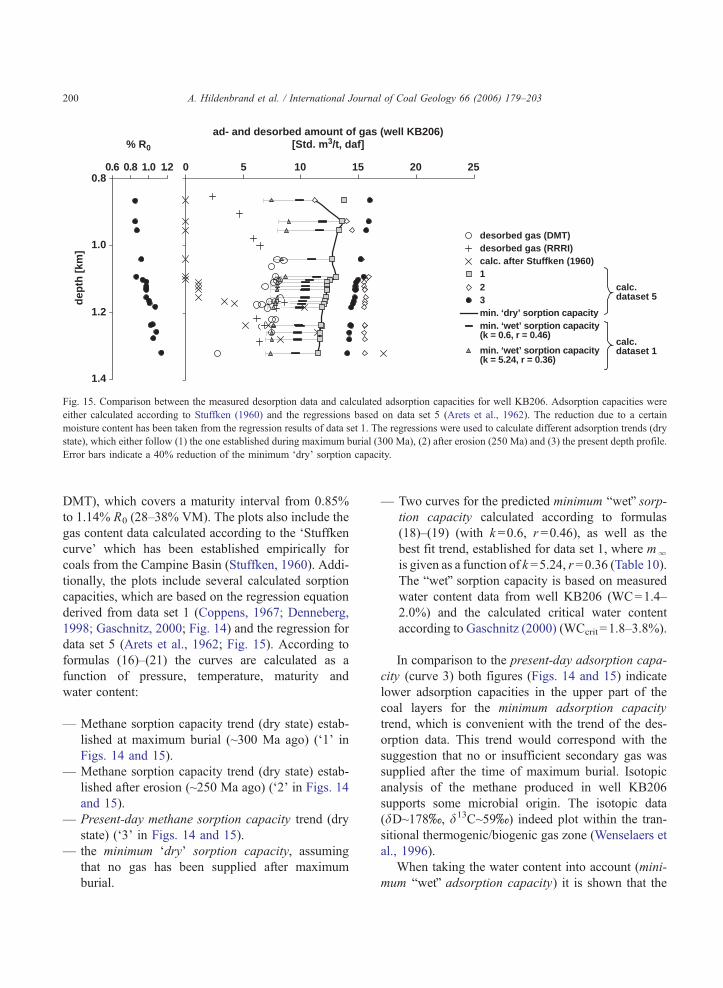
Fig. 15. Comparison between the measured desorption data and calculated adsorption capacities for well KB206. Adsorption capacities were
either calculated according to Stuffken (1960) and the regressions based on data set 5 (Arets et al., 1962). The reduction due to a certain
moisture content has been taken from the regression results of data set 1. The regressions were used to calculate different adsorption trends (dry
state), which either follow (1) the one established during maximum burial (300 Ma), (2) after erosion (250 Ma) and (3) the present depth profile.
Error bars indicate a 40% reduction of the minimum ddryT sorption capacity.
A. Hildenbrand et al. / International Journal of Coal Geology 66 (2006) 179–203200
DMT), which covers a maturity interval from 0.85%
to 1.14% R0 (28–38% VM). The plots also include the
gas content data calculated according to the dStuffkencurveT which has been established empirically for
coals from the Campine Basin (Stuffken, 1960). Addi-
tionally, the plots include several calculated sorption
capacities, which are based on the regression equation
derived from data set 1 (Coppens, 1967; Denneberg,
1998; Gaschnitz, 2000; Fig. 14) and the regression for
data set 5 (Arets et al., 1962; Fig. 15). According to
formulas (16)–(21) the curves are calculated as a
function of pressure, temperature, maturity and
water content:
— Methane sorption capacity trend (dry state) estab-
lished at maximum burial (~300 Ma ago) (d1T inFigs. 14 and 15).
— Methane sorption capacity trend (dry state) estab-
lished after erosion (~250 Ma ago) (d2T in Figs. 14
and 15).
— Present-day methane sorption capacity trend (dry
state) (d3T in Figs. 14 and 15).
— the minimum ddryT sorption capacity, assuming
that no gas has been supplied after maximum
burial.
— Two curves for the predicted minimum bwetQ sorp-tion capacity calculated according to formulas
(18)–(19) (with k =0.6, r =0.46), as well as the
best fit trend, established for data set 1, where ml
is given as a function of k =5.24, r=0.36 (Table 10).
The bwetQ sorption capacity is based on measured
water content data from well KB206 (WC=1.4–
2.0%) and the calculated critical water content
according to Gaschnitz (2000) (WCcrit =1.8–3.8%).
In comparison to the present-day adsorption capa-
city (curve 3) both figures (Figs. 14 and 15) indicate
lower adsorption capacities in the upper part of the
coal layers for the minimum adsorption capacity
trend, which is convenient with the trend of the des-
orption data. This trend would correspond with the
suggestion that no or insufficient secondary gas was
supplied after the time of maximum burial. Isotopic
analysis of the methane produced in well KB206
supports some microbial origin. The isotopic data
(dD~178x, d13C~59x) indeed plot within the tran-
sitional thermogenic/biogenic gas zone (Wenselaers et
al., 1996).
When taking the water content into account (mini-
mum bwetQ adsorption capacity) it is shown that the
A. Hildenbrand et al. / International Journal of Coal Geology 66 (2006) 179–203 201
calculated amount of gas appears to be overestimated
by up to 10 Std. m3/t in comparison to the desorption
data. The only match with the canister desorption data
is given in Fig. 15 for the data below ca. 1100 m,
computed with k =5.24 and r =0.36. In order to fit the
measured desorption data, the ddryT adsorption capa-
cities in Figs. 14 and 15 would have to be reduced by
50% to 60% and 30% to 55%, respectively. The
calculated reduction due to moisture content does
not predict such a strong decline.
In general, an undersaturation may be the result of
diffusive gas loss from coal seams into adjacent
permeable formations (aquifers). Removal of gas in
solution or in a free phase will decrease the gas partial
pressure around the coal seams and result in contin-
uous gas loss. Therefore, the calculated adsorption
trends must be considered as an estimation of the
maximum sorption capacity of moist coals in equili-
brium with a free methane phase. Fluid movement has
previously been considered a potential cause for gas
production problems at test well Peer KB206. Due to
a strong water influx during pumping, which appeared
to be related to a nearby fault zone, the fluid pressure
in the well could not be reduced below a certain
pressure (Wenselaers et al., 1996) which resulted in
a limited gas production. Thus, the active hydrody-
namic regime may have caused gas loss from the
adjacent coal seams and thus undersaturation of the
coals.
9. Conclusions
Sorption capacity denotes the maximum amount of
gas that can be physically stored in coal seams at
given subsurface conditions. It is basically influenced
by pressure and temperature, the actual moisture con-
tent, the composition of the organic material, the
mineral content, and the coal rank of the sediments:
— Sorptive gas storage capacity increases with
increasing gas pressure and decreases with increas-
ing temperature.
— Sorption capacity is positively correlated with coal
rank. The data from Coppens (1967) show a linear
increase in sorption capacity with increasing coal
rank. The data by Arets et al. (1962) indicate that
the amount of adsorbed gas is highest for mature
samples and passes through a minimum for coals
with a volatile matter content of 27% (~1.2% R0).
— Measurements performed on dry material and at
different water contents revealed that even very
low water contents (e.g. 1.8 wt.%) lead to a strong
reduction of the adsorption of methane. A decrease
of sorption capacity up to 50% has been measured.
— With respect to the maceral composition the data
sets used in this study support two different trends:
Denneberg (1998) showed that sorption capacity
increases with increasing vitrinite content and
decreases with liptinite and inertinite content.
Gaschnitz (2000) demonstrated that there is a dis-
tinct difference in adsorption capacity between
macrolithotypes. Highest storage capacities have
been measured for sapropelic coals, intermediate
capacities for vitrain samples and lowest for iner-
tinite-rich coals.
Using multiple regression procedures, expressions
have been defined for different data sets, which take
into account the key parameters influencing the
adsorption capacity of coals. Based on the Langmuir
formula the adsorption capacity can be estimated with
reasonable accuracy as a function of pressure, tem-
perature, maturity, maceral composition and water
content. Due to the limited database, the expressions
relating sorption capacity to maceral composition and
water content are not yet very reliable. Among the
regression equations derived in this study, those based
on data sets 1 and 5 were applied in the subsequent
calculations of the evolution of sorption capacity with
burial history of the coal seams:
1) Data set 1, n =45 (0.86–2.74% R0, 20–175 8C):
ml R0; Tð Þ ¼ 23:68þ 4:84d R0 � 0:09d T
KL R0; Tð Þ ¼ 49:50d exp � 0:78d R0ð Þd exp 0:01d Tð Þ
2) Data set 5, n =15 (0.75–3.2% R0, 5–40% VM, 25–
50 8C):
ml VM; Tð Þ ¼ 35:58� 1:16d VMþ 0:02d VM2
� 0:08d T
KL VM; Tð Þ ¼ 0:71þ 0:10d VMþ 0:13d T :
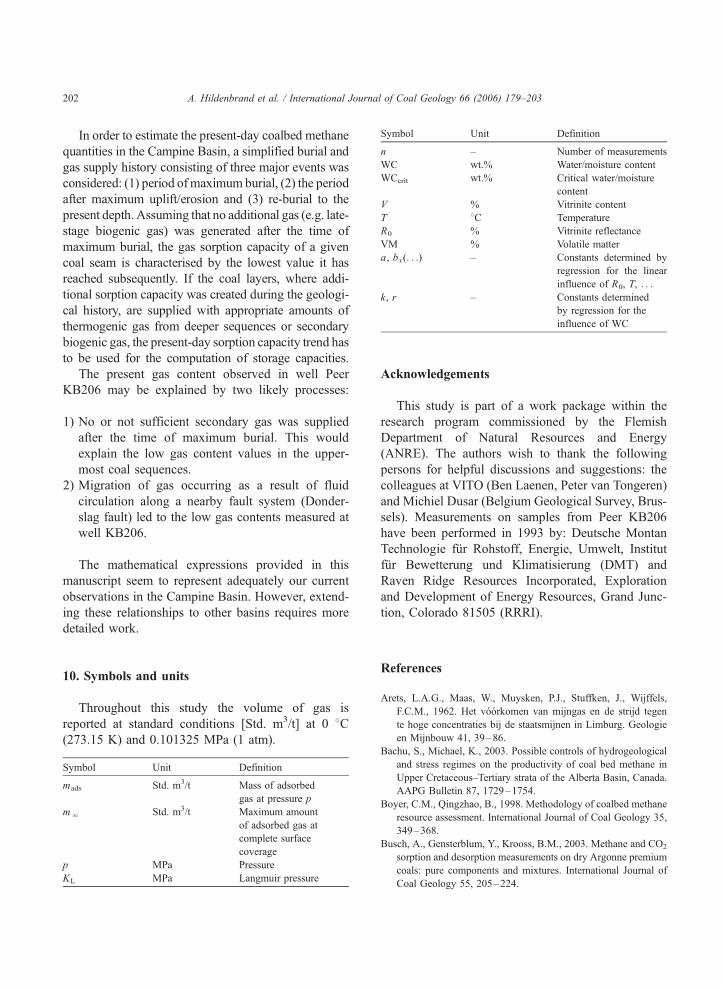
Symbol Unit Definition
n – Number of measurements
WC wt.% Water/moisture content
WCcrit wt.% Critical water/moisture
content
V % Vitrinite content
T 8C Temperature
R0 % Vitrinite reflectance
VM % Volatile matter
a, bx(. . .) – Constants determined by
regression for the linear
influence of R0, T, . . .
k, r – Constants determined
by regression for the
influence of WC
A. Hildenbrand et al. / International Journal of Coal Geology 66 (2006) 179–203202
In order to estimate the present-day coalbed methane
quantities in the Campine Basin, a simplified burial and
gas supply history consisting of three major events was
considered: (1) period ofmaximum burial, (2) the period
after maximum uplift/erosion and (3) re-burial to the
present depth. Assuming that no additional gas (e.g. late-
stage biogenic gas) was generated after the time of
maximum burial, the gas sorption capacity of a given
coal seam is characterised by the lowest value it has
reached subsequently. If the coal layers, where addi-
tional sorption capacity was created during the geologi-
cal history, are supplied with appropriate amounts of
thermogenic gas from deeper sequences or secondary
biogenic gas, the present-day sorption capacity trend has
to be used for the computation of storage capacities.
The present gas content observed in well Peer
KB206 may be explained by two likely processes:
1) No or not sufficient secondary gas was supplied
after the time of maximum burial. This would
explain the low gas content values in the upper-
most coal sequences.
2) Migration of gas occurring as a result of fluid
circulation along a nearby fault system (Donder-
slag fault) led to the low gas contents measured at
well KB206.
The mathematical expressions provided in this
manuscript seem to represent adequately our current
observations in the Campine Basin. However, extend-
ing these relationships to other basins requires more
detailed work.
10. Symbols and units
Throughout this study the volume of gas is
reported at standard conditions [Std. m3/t] at 0 8C(273.15 K) and 0.101325 MPa (1 atm).
Symbol Unit Definition
mads Std. m3/t Mass of adsorbed
gas at pressure p
ml Std. m3/t Maximum amount
of adsorbed gas at
complete surface
coverage
p MPa Pressure
KL MPa Langmuir pressure
Acknowledgements
This study is part of a work package within the
research program commissioned by the Flemish
Department of Natural Resources and Energy
(ANRE). The authors wish to thank the following
persons for helpful discussions and suggestions: the
colleagues at VITO (Ben Laenen, Peter van Tongeren)
and Michiel Dusar (Belgium Geological Survey, Brus-
sels). Measurements on samples from Peer KB206
have been performed in 1993 by: Deutsche Montan
Technologie fur Rohstoff, Energie, Umwelt, Institut
fur Bewetterung und Klimatisierung (DMT) and
Raven Ridge Resources Incorporated, Exploration
and Development of Energy Resources, Grand Junc-
tion, Colorado 81505 (RRRI).
References
Arets, L.A.G., Maas, W., Muysken, P.J., Stuffken, J., Wijffels,
F.C.M., 1962. Het voorkomen van mijngas en de strijd tegen
te hoge concentraties bij de staatsmijnen in Limburg. Geologie
en Mijnbouw 41, 39–86.
Bachu, S., Michael, K., 2003. Possible controls of hydrogeological
and stress regimes on the productivity of coal bed methane in
Upper Cretaceous–Tertiary strata of the Alberta Basin, Canada.
AAPG Bulletin 87, 1729–1754.
Boyer, C.M., Qingzhao, B., 1998. Methodology of coalbed methane
resource assessment. International Journal of Coal Geology 35,
349–368.
Busch, A., Gensterblum, Y., Krooss, B.M., 2003. Methane and CO2
sorption and desorption measurements on dry Argonne premium
coals: pure components and mixtures. International Journal of
Coal Geology 55, 205–224.

A. Hildenbrand et al. / International Journal of Coal Geology 66 (2006) 179–203 203
Bustin, R.M., Clarkson, C.R., 1998. Geological controls on coalbed
methane reservoir capacity and gas content. International Jour-
nal of Coal Geology 38, 3–26.
Coppens, P.L., 1967. Synthese des proprietes chimiques et physi-
ques des houilles — Les houilles belges. Report of the Institut
National de l’Industrie Charbonniere, publ. by Inichar.
Crosdale, P.J., Beamish, B.B., Valix, M., 1998. Coalbed methane
sorption related to coal composition. International Journal of
Coal Geology 35, 147–158.
Denneberg, T., 1998. Untersuchungen zum Methan–Adsorptions-
verogen von Steinkohlen unterschiedlicher Reife aus dem Ruhr-
gebiet. Diplomarbeit (unpublished), RWTH–Aachen.
Drobniak, A., Mastalerz, M., Rupp, J., Eaton, N., 2004. Evaluation
of coalbed gas potential of the Seelyville Coal Member, Indiana,
USA. International Journal of Goal Geology 57, 265–282.
Ettinger, I., Lidin, I.L., Dmitriev, A.M., Zhupakhina, E.S., 1958.
Systematic handbook for the determination of methane content
of coal seams from the seam pressure of the gas and the methane
capacity of the coal. Inst. Mining, Acad. Science, USSR, USBM
Translation No. 1505, Washington.
Ettinger, I., Eremin, I., Zimakov, B., Yanovskaya, M., 1966. Natural
factors influencing coal sorption properties: I — petrography
and the sorption properties of coals. Fuel 45, 267–275.
Faiz, M., Stalker, L., Sherwood, N., Saghafi, A., Wold, M., Barclay,
S., Choudhurry, J., Barker, W., Wang, I., 2003. Bio-enhance-
ment of coal bed methane resources in the southern Sydney
Basin. APPEA Journal, 595–610.
Gan, H., Nandi, S.P., Walker, P.L., 1972. Nature of the porosity in
American coals. Fuel 51, 272–277.
Gaschnitz, R., 2000. Gasgenese und Gasspeicherung im flozfuhren-
den Oberkarbon des Ruhr-Beckens. Dissertation, RWTH-
Aachen, D82.
Gluskoter, H., Mastalerz, M., Stanton, R., 2002. The potential for
carbon dioxide sequestration in coal beds: new evidence from
methane and carbon dioxide adsorption analyses of coals from
lignite to anthracite. North–central section (36th) and southeast-
ern section (51st). GSA Joint Annual Meeting, Lexington,
Kentucky, April 3–5.
Joubert, J.I., Grein, C.T., Bienstock, D., 1973. Sorption of Methane
in Moist Coal, Fuel, vol. 52. IPC Business Press, pp. 181–185.
Joubert, J.I., Grein, C.T., Bienstock, D., 1974. Effect of Moisture on
the Methane Capacity of American Coals, Fuel, vol. 53. IPC
Business Press, pp. 186–191.
Killingley, J., Levy, J., Day, S., 1995. Methane adsorption on
coals of the Bowen Basin, Queensland, Australia. Proceedings
of Intergas, 15.–19.5.1995, Tuscaloosa, AL, Paper, vol. 9503,
pp. 401–411.
Krooss, B.M., van Bergen, F., Gensterblum, Y., Siemons, N., Pag-
nier, H.J.M., David, P., 2002. High-pressure methane and car-
bon dioxide adsorption on dry and moisture-equilibrated
Pennsylvanian coals. International Journal of Coal Geology
51, 69–92.
Laenen, B., Van Tongeren, P., Hildenbrand, A., in preparation. The
burial history of the Upper Carboniferous strata of the Belgian
Campine Basin.
Lamberson, M.N., Bustin, R.M., 1993. Coalbed methane charac-
teristics of Gates Formation coals, northeastern British
Columbia: effect of maceral composition. AAPG Bulletin 77
(12), 2062–2076.
Laxminarayana, L., Crosdale, P.J., 1999. Role of coal type and rank
on methane sorption characteristics of Bowen Basin, Australia
coals. International Journal of Coal Geology 40, 309–325.
Laxminarayana, L., Crosdale, P.J., 2002. Controls on methane
sorption capacity of Indian coals. AAPG Bulletin 86 (2),
201–212.
Levy, H.J., Day, S.J., Killingley, J.S., 1997. Methane capacities
of Bowen Basin coals related to coal properties. Fuel 76 (9),
813–819.
Mastalerz, M., Gluskoter, H., Rupp, J., 2004. Carbon dioxide and
methane sorption in high volatile bituminous coals from Indi-
ana, USA. International Journal of Coal Geology 60, 43–55.
Noak, K., 1998. Control of gas emissions in underground coal
mines. International Journal of Coal Geology 35, 57–82.
Nodzenski, A., 1998. Sorption and desorption of gases (CH4, CO2)
on hard coal and active carbon at elevated pressures. Fuel 77,
1243–1246.
Prinz, D., 2004. Die Porenstruktur von Kohle (The pore structure of
coals). Disseration, RWTH Aachen University.
Prinz, D., Littke, R., 2005. Development of the micro- and ultra-
microporous structure of coals with rank as deduced from the
accessibility to water. Fuel 85, 1645–1652.
Rice, D.D., 1993. Composition and origins of coalbed gas. In: Law,
B.E., Rice, D.D. (Eds.), Hydrocarbons from Coal, AAPG Stu-
dies in Geology, vol. 38, pp. 159–184.
Ryan, B., Lane, B., 2002. Adsorption characteristics of coals with
special reference to the Gething Formation, northeast British
Columbia. Geological Fieldwork 2001, Paper 2002-1. British
Columbia Ministry of Energy and Mines, pp. 83–98.
Sircar, S., 1992. Estimation of isosteric heats of adsorption of single
gas and multicomponent gas mixtures. Industrial & Engineering
Chemistry Research 31, 1813–1819.
Stuffken, J., 1960. Ein Berechnungsverfahren zur Bestimmung der
Ausgasung von Steinkohlenflozen. Bergbau Archiv 1, 40–48.
Unsworth, J.F., Fowler, C.S., Jones, L.F., 1989. Moisture in coal: 2.
Maceral effects on pore structure. Fuel 68, 18–26.
Wenselaers, P., Dusar, M., van Tongeren, P.C.H., 1996. Steenkool-
lag methaangaswinning — Proefproject te Peer. Ministerie van
de Vlaamse Gemeenschap, department EWNBL.