Impacts of grazing on the alkalinized–salinized meadow steppe ecosystem in the Songnen Plain,...
15
Plant and Soil 249: 237–251, 2003. © 2003 Kluwer Academic Publishers. Printed in the Netherlands. 237 Impacts of grazing on the alkalinized–salinized meadow steppe ecosystem in the Songnen Plain, China – A simulation study Zongbo Shang 1,3 , Qiong Gao 2 & Ming Dong 1 1 Laboratory of Quantitative Vegetation Ecology Institute of Botany, Chinese Academy of Sciences Beijing 100093, China; 2 MOE Key Lab of Environmental Change and Natural Disaster Institute of Resources Science, Beijing Normal University Beijing 100875, China; 3 Corresponding author ∗ Key words: alkalization, grazing, growth, meadow steppe ecosystem, process-based model, soil hydrology, salinization, succession Abstract A process-based model was built to describe the ecological processes of an alkalinized–salinized meadow steppe ecosystem, including the hydrological and alkalization–salinization processes in the soil, as well as the succession and growth dynamics of the grassland communities. A numerical integration model and a water and salt balance model were integrated into a physically-based model, describing the dynamics of soil moisture, salt concentration, exchangeable sodium percentage (ESP) and pH. Meteorological variables and soil characteristics were the main environmental factors used to estimate the growth dynamics of three herbaceous communities that were dominated by Aneurolepidium chinense, Chloris virgata, and Suaeda glauca, respectively. Model validation showed good agreement between the simulated results and the observed data. Simulation studies were conducted to evaluate the potential changes in hydrological and alkalization–salinization processes, succession and growth dynamics from 1991 to 1998, under five grazing intensities, namely 0%, 25%, 50%, 75% and 90% above-ground biomass removal (AGBR). The simulations show that soil moisture decreased markedly under the 50%, 75% and 90% AGBR, but increased slightly under the 25% AGBR. The de-alkalization and de-salinization processes would be predominant under the 0% AGBR, and the processes became a little slower under the 25% AGBR. In contrast, the 50%, 75% and 90% AGBR accelerated the degradation of soil properties. The grassland was dominated by A. chinense under the 0% AGBR, and by A. chinense and C. virgata under the 25% AGBR. C. virgata could grow on slightly alkalinized– salinized soil and became a dominant species after three years of 50% AGBR. The soil degraded quickly and only S. glauca could grow on the severe alkalinized–salinized soil if the grassland received 75% or 90% AGBR. The grassland grew well under the 0% AGBR, and the biomass stayed at moderate level under 25% AGBR. The 50%, 75% and 90% AGBR decreased the grassland growth greatly. After accumulating the grazed biomass for each year, the 25% AGBR would provide the highest production, and the grassland production would decrease sharply with the increasing of grazing intensities. The simulation results indicate that 25% AGBR is significant for preserving the soil from degradation, and maintaining high grassland production. Introduction The vast alkalinized–salinized grassland (Li and Zheng, 1997) covers 23 925.79 km 2 , or about two- thirds of the meadow grasslands area of the Songnen Plain in North-eastern China. This critical area for ∗ FAX No: +86-10-82595962. E-mail: [email protected] animal husbandry has been suffering from degrada- tion resulting from soil alkalization and salinization for centuries. The Songnen Plain has a very flat relief with elevation variation of less than 100 m, surroun- ded by mountains with very poor drainage (Zheng and Li, 1993). Thousands of tons of minerals are carried annually by surface runoff from the mountains to the plain. The groundwater is 1–3 m deep, and highly min-
Transcript of Impacts of grazing on the alkalinized–salinized meadow steppe ecosystem in the Songnen Plain,...
Plant and Soil 249: 237–251, 2003.© 2003 Kluwer Academic Publishers. Printed in the Netherlands.
237
Impacts of grazing on the alkalinized–salinized meadow steppe ecosystemin the Songnen Plain, China – A simulation study
Zongbo Shang1,3, Qiong Gao2 & Ming Dong1
1Laboratory of Quantitative Vegetation Ecology Institute of Botany, Chinese Academy of Sciences Beijing 100093,China; 2MOE Key Lab of Environmental Change and Natural Disaster Institute of Resources Science, BeijingNormal University Beijing 100875, China; 3Corresponding author∗
Key words: alkalization, grazing, growth, meadow steppe ecosystem, process-based model, soil hydrology,salinization, succession
Abstract
A process-based model was built to describe the ecological processes of an alkalinized–salinized meadow steppeecosystem, including the hydrological and alkalization–salinization processes in the soil, as well as the successionand growth dynamics of the grassland communities. A numerical integration model and a water and salt balancemodel were integrated into a physically-based model, describing the dynamics of soil moisture, salt concentration,exchangeable sodium percentage (ESP) and pH. Meteorological variables and soil characteristics were the mainenvironmental factors used to estimate the growth dynamics of three herbaceous communities that were dominatedby Aneurolepidium chinense, Chloris virgata, and Suaeda glauca, respectively. Model validation showed goodagreement between the simulated results and the observed data. Simulation studies were conducted to evaluate thepotential changes in hydrological and alkalization–salinization processes, succession and growth dynamics from1991 to 1998, under five grazing intensities, namely 0%, 25%, 50%, 75% and 90% above-ground biomass removal(AGBR). The simulations show that soil moisture decreased markedly under the 50%, 75% and 90% AGBR, butincreased slightly under the 25% AGBR. The de-alkalization and de-salinization processes would be predominantunder the 0% AGBR, and the processes became a little slower under the 25% AGBR. In contrast, the 50%, 75% and90% AGBR accelerated the degradation of soil properties. The grassland was dominated by A. chinense under the0% AGBR, and by A. chinense and C. virgata under the 25% AGBR. C. virgata could grow on slightly alkalinized–salinized soil and became a dominant species after three years of 50% AGBR. The soil degraded quickly and onlyS. glauca could grow on the severe alkalinized–salinized soil if the grassland received 75% or 90% AGBR. Thegrassland grew well under the 0% AGBR, and the biomass stayed at moderate level under 25% AGBR. The 50%,75% and 90% AGBR decreased the grassland growth greatly. After accumulating the grazed biomass for each year,the 25% AGBR would provide the highest production, and the grassland production would decrease sharply withthe increasing of grazing intensities. The simulation results indicate that 25% AGBR is significant for preservingthe soil from degradation, and maintaining high grassland production.
Introduction
The vast alkalinized–salinized grassland (Li andZheng, 1997) covers 23 925.79 km2, or about two-thirds of the meadow grasslands area of the SongnenPlain in North-eastern China. This critical area for
∗ FAX No: +86-10-82595962. E-mail: [email protected]
animal husbandry has been suffering from degrada-tion resulting from soil alkalization and salinizationfor centuries. The Songnen Plain has a very flat reliefwith elevation variation of less than 100 m, surroun-ded by mountains with very poor drainage (Zheng andLi, 1993). Thousands of tons of minerals are carriedannually by surface runoff from the mountains to theplain. The groundwater is 1–3 m deep, and highly min-
238
eralized (concentration about 5 g L−1) with sodiumbicarbonate being the main component. The evapor-ative demands are extremely high with about threetimes the annual precipitation, which tends to bringsolutes dissolved in groundwater and deep soil up tothe surface. The topographical features and climaticconditions of the area result in a very slow primarysoil alkalization and salinization process.
Human over-utilization of the grasslands, mainlythrough overgrazing and over-mowing, results in sec-ondary soil alkalization and salinization processesbeing much faster than the primary ones. Aneur-olepidium chinense is the dominant species of thenatural grasslands. The overgrazing and over-mowingwill reduce the importance value of A. chinense anddeteriorate the environment for grass growth, leadingto a quick regressive succession of the meadow steppeecosystem. The regressive succession process (Li andZheng, 1997) due to overgrazing can be regarded asseveral phases in terms of the dominant species ofthe communities: (1) A. chinense, (2) A. chinense andChloris virgata, (3) C. virgata, and (4) Suaeda glauca.
Damage to the grassland canopy will change thesoil properties, leading to its degradation and waterloses (Gao et al., 1996a, 1998). The soil will undergoalkalization and salinization, which will deteriorateplant growth seriously and accelerate the regressivesuccession. In contrast, conservation of the grass-land will improve the plant growth environment andaccelerate the progressive succession.
Experimental investigations by Gao and Zhang(1993) and Zhang and Gao (1994) looked at the dy-namics of soil water and salt in the Songnen grassland.Wang and Ripley (1997) investigated the communitycomponents under different grazing intensities in theSongnen grasslands. However, the data available fromthe experimental studies can only describe the generalchanges in the soil status and species components ofdifferent herbaceous communities. It cannot explainprecisely the fundamental changes in soil factors thatdetermine the water dynamics, alkalization and salin-ization processes in soil, and the cause that changesin grasslands growth and succession. A few mechan-istic models have been constituted at plot-scale (Gaoet al. 1996a, 1998) and landscape scale (Gao et al.,1996b), to simulate the plant–environmental systemin the Songnen grassland. Although overgrazing isthe primary reason for the quick degradation of theSongnen grasslands, insufficient attention has beengiven on the impacts of human disturbance on thegrasslands using a simulation approach.
In this paper, we use a process-based model to sim-ulate the hydrological and alkalization–salinization/de-alkalization–salinization processes in a heterogeneoussoil. The growth dynamics of three types of eco-systems in the regressive succession dominated byAneurolepidium chinense, Chloris virgata, andSuaedaglauca respectively were evaluated by consideringtheir response to weather, soil moisture, soil salt con-centration, exchangeable sodium percentage (ESP)and pH. A simulation study was performed to evalu-ate the hydrological and alkalization–salinization/de-alkalization–salinization processes, succession andgrasslands growth under 0%, 25%, 50%, 75% and90% above-ground biomass removal (AGBR), re-spectively, to estimate the impacts of overgrazing ongrassland degradation, and to describe the productionof grazing under different treatments.
Materials and methods
Model description
A complete mathematical description of the model isgiven by Shang et al. (2001) and Shang et al. (2002,in press). The major assumptions and treatments aredescribed here.
Water and salt balance modelling (Kaddah andRhoades, 1976) and numerical integration modelling(Bresler, 1975; Hillel, 1977) are two approaches toevaluate the movement of water and salt in soil. Nu-merical integration models, which attempt to simulatea range of complex, small-scale movement of soilwater and salt and require an equally complex rangeof input parameters, are more suitable for laboratoryconditions, and are difficult to apply to spatially het-erogeneous soils in the field. Water and salt balancedmodels (Kaddah and Rhoades, 1976) are more ap-preciate for the simulation of the dynamics of waterand salt in the field. A physically-based model hasbeen constituted, combining these two modelling ap-proaches to evaluate the movement of water and saltin the heterogeneous soil in the Songnen Plain. Themajor treatments of the physically-based model weregiven subsequently.
The soil was divided into five 0.10 m layers. A nu-merical integration approach was used to evaluate thevertical movement of water, due to capillary rise andpercolation between adjacent layers, and the capillaryrise from groundwater into the bottom layer (0.40–

239
0.50 m). A water balance model was used to definethe change of soil moisture content of each layer.
Four cation species, Ca2+, Mg2+, K+ and Na+,and four anion species CO2−
3 , HCO−3 , SO2−
4 and Cl−,were considered in this model. They were initial-ized in the model, using measured values of the soilsolution and groundwater in the Songnen Plain (Liand Zheng, 1997). Diffusion was assumed to be themain approach for transporting solution vertically inthe salinization/de-salinization process. Movement ofthese cations and anions was defined by the verticalmovement of water in the soil, as well as the concen-tration gradient in the soil solution. The salt balancemodel was applied to determine the salt concentrationof each layer.
Soil alkalization was viewed as the process ofcalcium cations attached to soil particles being re-placed by sodium cations (Wang, 1993). Two cationspecies, Ca2+ and Na+ in the soil solution and twoexchangeable cation species, Ca2+and Na+attachedto soil particles were considered in the model. Thealkalization/de-alkalization process could be definedby two equilibrium processes: (1) the calcium cationsattached to soil particles were replaced by sodiumcations, for the high concentration of sodium cationsin the soil solution; (2) some replaced calcium cationsreacted with carbonate anions and generated insolublecalcium carbonate, which led to more exchangeablecalcium cations being replaced by sodium cations.The existence of alkaline sodium cation was the lead-ing reason for the high alkalinity of sodic soil (Wang1993). Concentrations of Ca2+, Mg2+, CO2−
3 , andHCO−
3 were used to define the pH of each layer.The standing biomass of the herbaceous com-
munities was parted into below-ground and above-ground components. These were determined from thedistribution of daily net photosynthesis, the transferbetween above- and below-ground components, andthe litter production rate. Distribution between above-and below-ground biomass was assumed to be gov-erned by plant phenology (Gao et al., 1997). For mostperennial plants, such as Aneurolepidium chinense,the below-ground part provided energy for the emer-ging of leaves and stems in spring, and large amountsof biomass was transported from above-ground com-ponents to below-ground components and stored therelater in the growing season. The litter rate increasedgradually early in the growing season, and moresharply at the end.
Climatic variables and soil factors affected thephotosynthetic production, and thus impacted the eco-system growth dynamics. The rate of net photosyn-thesis (Gao et al., 1996a, 1997, 1998; Shang et al.,2000) was assumed to be a hyperbolic function ofdaily photosynthetically active radiation (PAR), leafarea index (LAI) and atmospheric CO2 concentration,a linear function of soil moisture, and a unimodalfunction of mean air temperature. It was assumed thatthe rate of net photosynthesis (Qi et al., 1989) woulddecline nonlinearly with the increase of salt concentra-tion, exchangeable sodium percentage (ESP) and soilpH in the rooting zone (0–0.30 m).
The alkalization – salinization/de-alkalization –salinization processes and the dynamics of grassgrowth were evaluated during the period from 1991to 1998 under different intensities of grazing. Thegrassland was subject to five intensities of above-ground biomass removal (AGBR) each 15 days: (1)0% AGBR, (2) 25% AGBR, (3) 50% AGBR, (4)75% AGBR and (5) 90% AGBR. The soil hydrolo-gical properties were changed correspondingly (Li andZheng, 1997) with the grazing intensities. The soilfactors (i.e. soil moisture, salt concentration, ESP,and pH) and growth status (especially the standingbiomass of below-ground component) were selectedas leading factors, to judge the dominant species ofeach year during the succession process. The grazedbiomass was accumulated annually to show the po-tential production of the herbaceous ecosystem underdifferent grazing intensities.
Experimental observations and modelparameterization
Field observations were carried out at the grasslandecosystem station of the Northeast Normal Universityin Changling (44◦ 15′ N, 123◦ 58′ E). The soil ofthe experimental plot can be recognized as Meadowsolonetz. The groundwater table is just near the sur-face, at the depth around 3 m, and always ascendto near 2 m in summer. The measurements includedsoil moisture content of each 0.10 m layers of soil, toa depth of 0.50 m during the growing seasons from1991 to 1998. Part of the measurements were carriedout by Li (1993) and Yun (1993) in 1991, includingconcentration of soluble salts and exchangeable cationin soil, standing biomass of above- and below-groundcomponents, as well as litter biomass of three grasscommunities, dominated by Aneurolepidium chinense,Chloris virgata, and Suaeda glauca, respectively.
240
The meteorological data used in this researchcomprised: 10-day averages between 1991 and 1998of temperature, relative humidity, sunshine frac-tion, wind velocity and pan evaporation, collectedfrom nine meteorological observation stations (MOS),namely Baicheng (45◦ 38′ N, 122◦ 51′ E), Daan (45◦30′ N, 124◦ 16′ E), Fuyu (44◦ 58′ N, 126◦ 00′ E),Qianan (45◦ 00′ N, 124◦ 01′ E), Nongan (44◦ 25′N, 125◦ 10′ E), Shuangliao (43◦ 30′ N, 123◦ 32′ E),Songyuan (45◦ 11′ N, 124◦ 50′ E), Taonan (45◦ 20′ N,122◦ 49′ E) and Zhenlai (45◦ 51′ N, 123◦ 10′ E). Sim-ilar data between 1986 and 1998 were also collectedat: Changling (44◦ 15′ N, 123◦ 58′ E), Qianguo (45◦07′ N, 124◦ 50′ E) and Tongyu (44◦ 07′ N, 123◦ 04′E). Daily precipitation data from 1991 to 1998 werecollected at the Changling MOS.
An object-oriented approach was used to programall the processes, and compile them into Java classesusing the JDK1.2 software, downloaded from the Website of Sun Company (http://java.sun.com.).
Results
Model validation
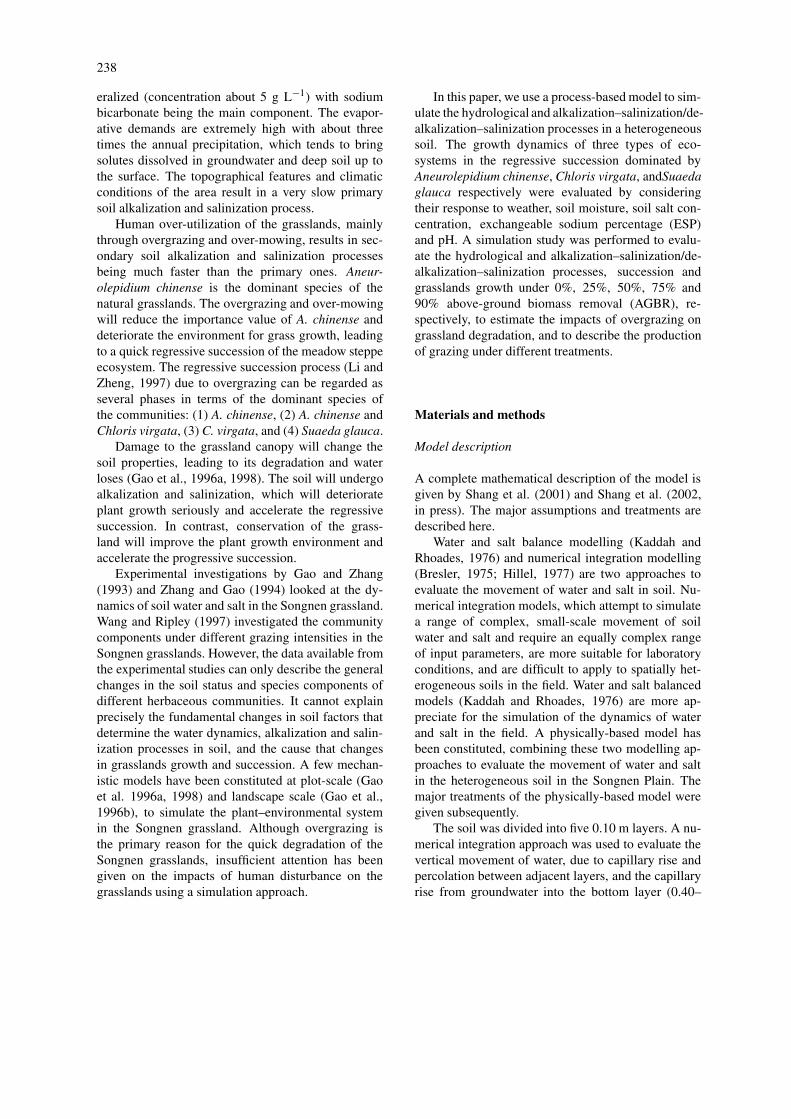
A comparison of simulated evapotranspiration and ob-served pan evaporation, for 4 284 10-day periods fromthe 12 meteorological observation stations is shownin Figure 1. The high correlation (R2 = 0.811) in-dicates that the modified Penman equation providesa good estimate of the potential evapotranspiration inthe Songnen Plain, Northeastern China.
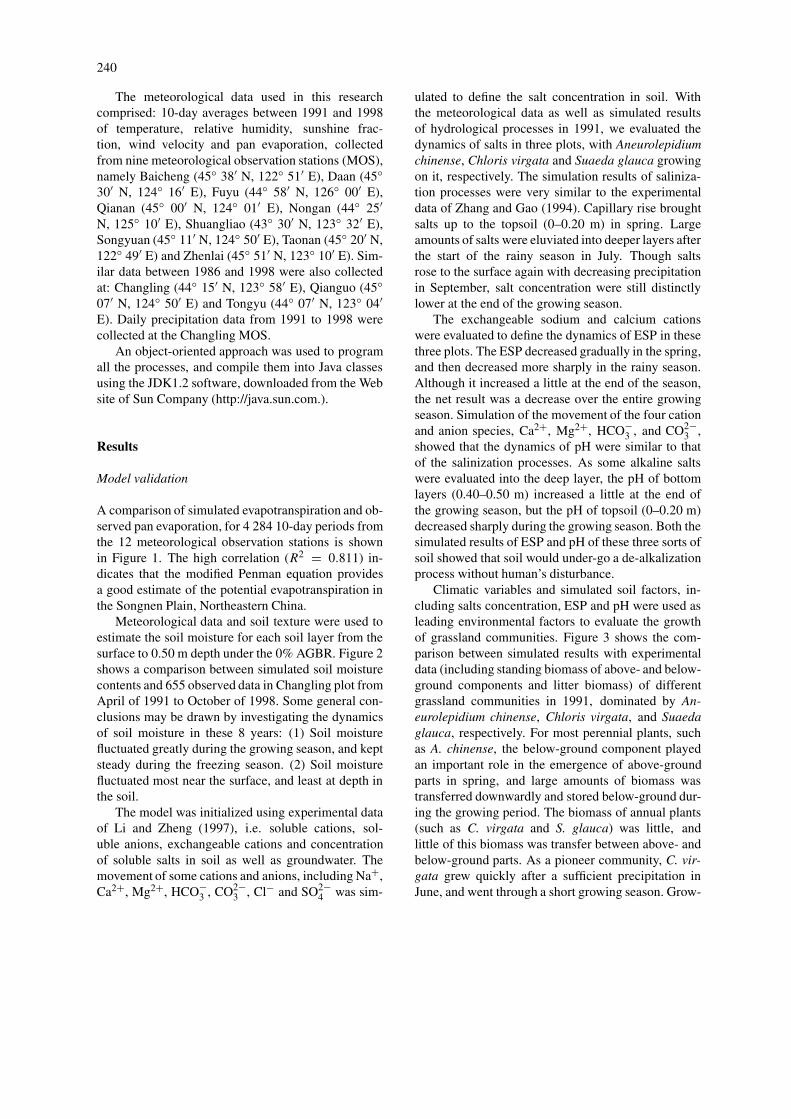
Meteorological data and soil texture were used toestimate the soil moisture for each soil layer from thesurface to 0.50 m depth under the 0% AGBR. Figure 2shows a comparison between simulated soil moisturecontents and 655 observed data in Changling plot fromApril of 1991 to October of 1998. Some general con-clusions may be drawn by investigating the dynamicsof soil moisture in these 8 years: (1) Soil moisturefluctuated greatly during the growing season, and keptsteady during the freezing season. (2) Soil moisturefluctuated most near the surface, and least at depth inthe soil.
The model was initialized using experimental dataof Li and Zheng (1997), i.e. soluble cations, sol-uble anions, exchangeable cations and concentrationof soluble salts in soil as well as groundwater. Themovement of some cations and anions, including Na+,Ca2+, Mg2+, HCO−
3 , CO2−3 , Cl− and SO2−
4 was sim-
ulated to define the salt concentration in soil. Withthe meteorological data as well as simulated resultsof hydrological processes in 1991, we evaluated thedynamics of salts in three plots, with Aneurolepidiumchinense, Chloris virgata and Suaeda glauca growingon it, respectively. The simulation results of saliniza-tion processes were very similar to the experimentaldata of Zhang and Gao (1994). Capillary rise broughtsalts up to the topsoil (0–0.20 m) in spring. Largeamounts of salts were eluviated into deeper layers afterthe start of the rainy season in July. Though saltsrose to the surface again with decreasing precipitationin September, salt concentration were still distinctlylower at the end of the growing season.
The exchangeable sodium and calcium cationswere evaluated to define the dynamics of ESP in thesethree plots. The ESP decreased gradually in the spring,and then decreased more sharply in the rainy season.Although it increased a little at the end of the season,the net result was a decrease over the entire growingseason. Simulation of the movement of the four cationand anion species, Ca2+, Mg2+, HCO−
3 , and CO2−3 ,
showed that the dynamics of pH were similar to thatof the salinization processes. As some alkaline saltswere evaluated into the deep layer, the pH of bottomlayers (0.40–0.50 m) increased a little at the end ofthe growing season, but the pH of topsoil (0–0.20 m)decreased sharply during the growing season. Both thesimulated results of ESP and pH of these three sorts ofsoil showed that soil would under-go a de-alkalizationprocess without human’s disturbance.
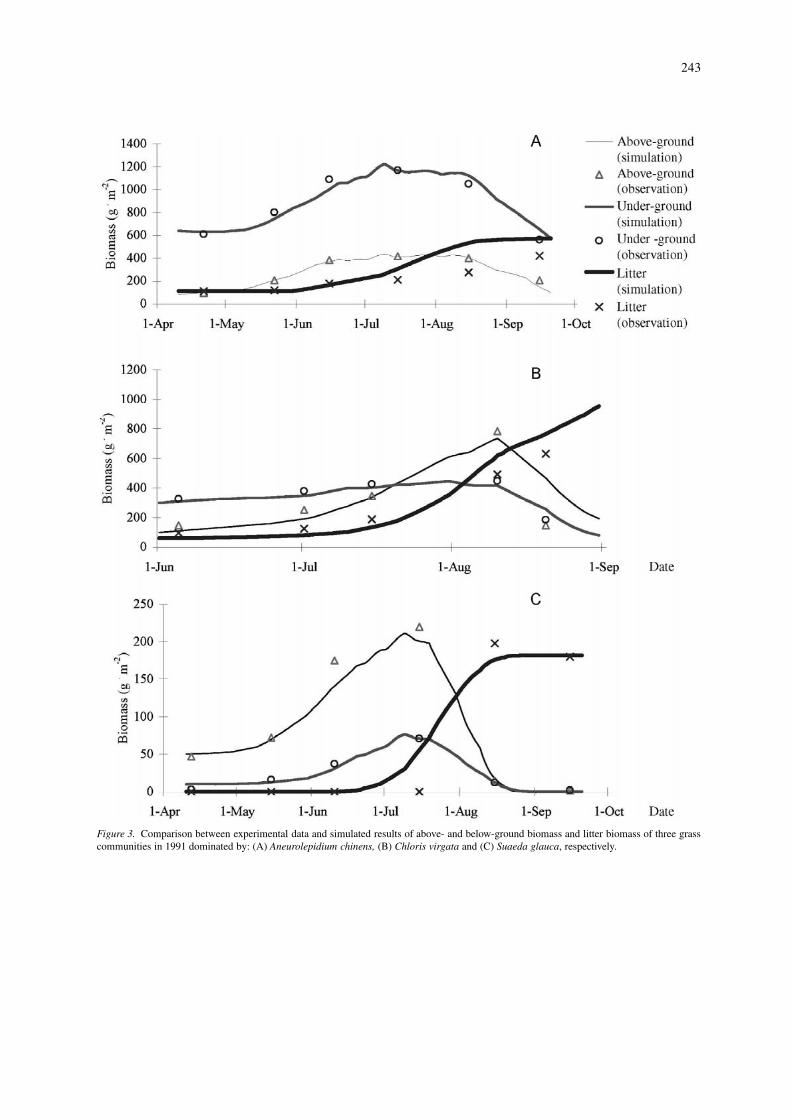
Climatic variables and simulated soil factors, in-cluding salts concentration, ESP and pH were used asleading environmental factors to evaluate the growthof grassland communities. Figure 3 shows the com-parison between simulated results with experimentaldata (including standing biomass of above- and below-ground components and litter biomass) of differentgrassland communities in 1991, dominated by An-eurolepidium chinense, Chloris virgata, and Suaedaglauca, respectively. For most perennial plants, suchas A. chinense, the below-ground component playedan important role in the emergence of above-groundparts in spring, and large amounts of biomass wastransferred downwardly and stored below-ground dur-ing the growing period. The biomass of annual plants(such as C. virgata and S. glauca) was little, andlittle of this biomass was transfer between above- andbelow-ground parts. As a pioneer community, C. vir-gata grew quickly after a sufficient precipitation inJune, and went through a short growing season. Grow-
241
Figure 1. Comparison between the 10-day period simulated evapotranspiration and observed pan evaporation collected from 12 meteorologicalobservation stations in the Songnen Plain.
ing in a severe alkalinized–salinized soil, S. glauca’sbiomass was small and could not accumulate sufficientlitter biomass to improve the soil characters distinctly.
Model application
Simulation studies were performed to illustrate theimpacts of the different grazing intensities on as-pects of the meadow steppe ecosystem includinghydrological processes, alkalization–salinization/de-alkalization–salinization processes in the soil, as wellas growth dynamics and succession in grassland com-munities. The treatments were performed by the modelto ‘remove’ the standing biomass of above-groundcomponent by 0%, 25%, 50%, 75% and 90%, respect-ively, for each 15 days. The soil hydrological prop-erties were changed correspondingly (Li and Zheng,1997) with the grazing intensities. Relevant para-meters were chosen for each year, according to soilfactors, succession process and growth status.
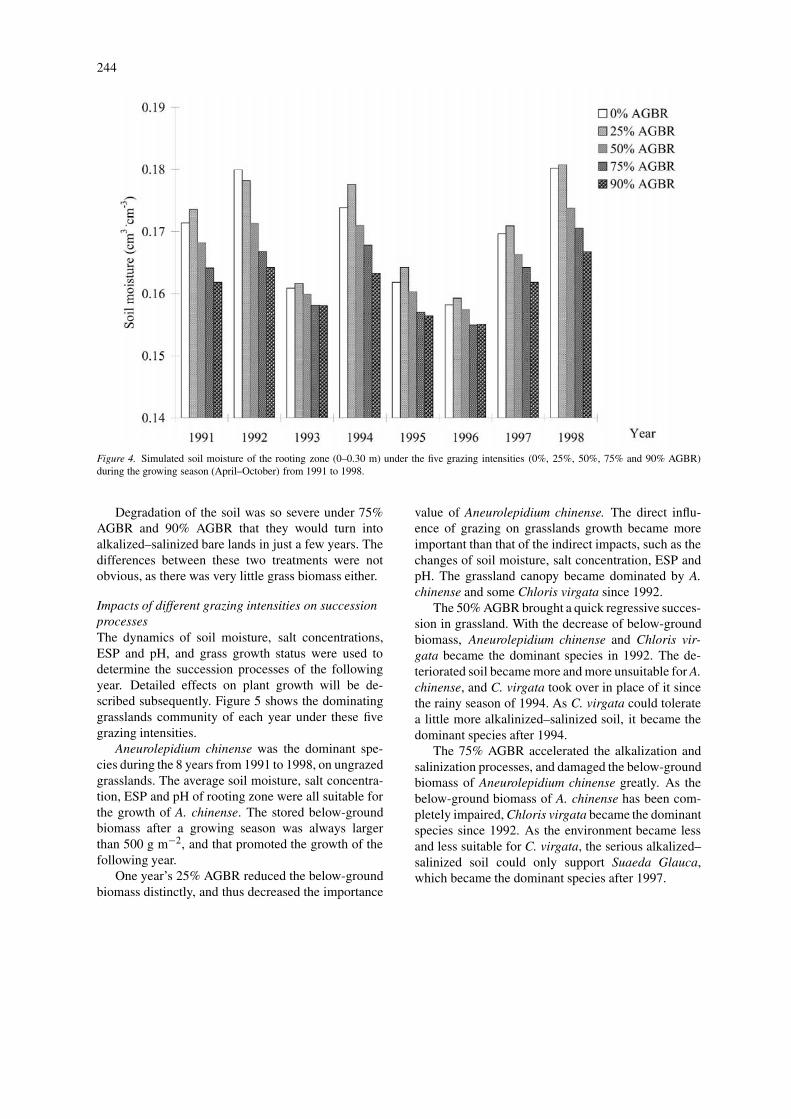
Impacts of different grazing intensities on thehydrological processesThe soil hydrology was simulated under differenttreatments to show the impacts of grassland graz-ing on the soil moisture. Figure 4 shows the av-erage soil moisture in rooting zone (0–0.30 m) inthe growing season (April–October) under these fivegrazing intensities. It’s very clear that the soil mois-
ture decreased sharply under the 50%, 75% and 90%AGBR. The removal of vegetation canopy decreasedthe below-ground biomass and organic matter in soil,which reduced the amounts of non-capillary pores insoil, and hence depressed the hydraulic conductivity.Twenty five percent AGBR would reduce the transpir-ation, and improve the soil moisture then. So the totalsoil moisture under 25% AGBR was larger than thatof without grazing.
Impacts of different grazing intensities on thealkalization–salinization /de-alkalization–salinizationprocessesThe movements of cations and anions in soil, i.e.Na+, Ca2+, Mg2+, HCO−
3 , CO2−3 , Cl− and SO2−
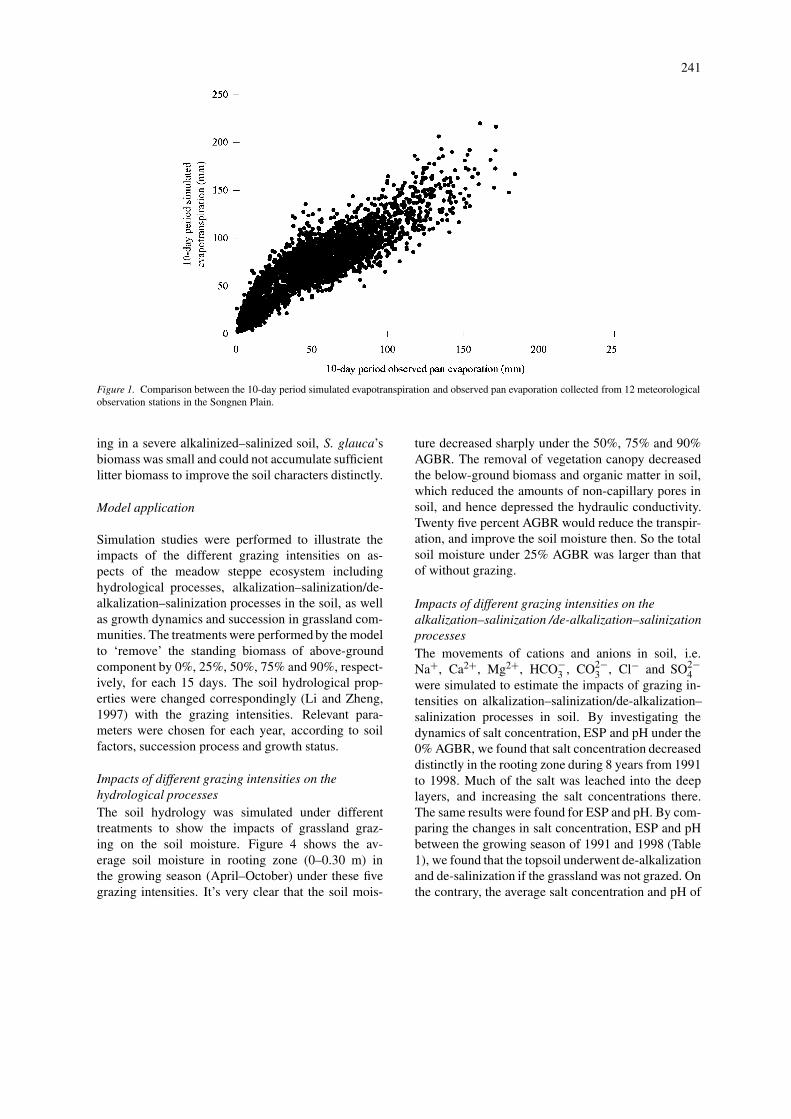
4were simulated to estimate the impacts of grazing in-tensities on alkalization–salinization/de-alkalization–salinization processes in soil. By investigating thedynamics of salt concentration, ESP and pH under the0% AGBR, we found that salt concentration decreaseddistinctly in the rooting zone during 8 years from 1991to 1998. Much of the salt was leached into the deeplayers, and increasing the salt concentrations there.The same results were found for ESP and pH. By com-paring the changes in salt concentration, ESP and pHbetween the growing season of 1991 and 1998 (Table1), we found that the topsoil underwent de-alkalizationand de-salinization if the grassland was not grazed. Onthe contrary, the average salt concentration and pH of
242
Figure 2. Comparison between simulated and observed soil moisture content from 1991 to 1998 in the soil from the surface to 0.50 m depth.(Cycle is observed data and line is simulated results).
Table 1. Average salt concentration, ESP and pH of the soil in the growing seasons of 1991 and 1998 under different grazing intensities
Grazing Year Salt concentration ESP (%) pH
intensity (g kg)
0–0.30 m 0.30–0.50 m 0–0.30 m 0.30–0.50 m 0–0.30 m 0.30–0.50 m
0% 1991 0.114 0.184 27.176 30.892 8.109 9.011
AGBR 1998 0.013 0.327 6.300 26.013 7.557 9.806
25%AG 1991 0.127 0.259 32.078 36.231 8.205 9.264
BR 1998 0.078 1.261 18.313 48.029 8.149 11.225
50% 1991 0.132 0.328 39.303 42.851 8.316 9.459
AGBR 1998 0.442 3.853 43.345 73.195 9.946 12.450
75% 1991 0.136 0.362 46.456 50.865 8.325 9.502
AGBR 1998 0.497 5.637 52.492 83.523 10.026 12.800
90% 1991 0.140 0.375 48.904 52.935 8.329 9.541
AGBR 1998 0.510 5.996 53.496 84.833 10.073 12.810
the soil between 0.30 m and 0.50 m increased a little,as some salts were leached into these layers.
By investigating the dynamics of salt concentra-tion, ESP and pH under the 25% AGBR, we found thatproper grazing had the capability to keep the soil fromdegradation. Though some salts rose from groundwa-ter to topsoil due to capillary rise in the dry season,more salts were leached into the subsoil. The topsoilunder-went slow de-alkalization and de-salinization,as there were sufficient non-capillary pores in the
soil, which kept the soil hydraulic conductivity largeenough to wash the salts down to deep layers.
From the dynamics of salt concentration, ESP andpH under 50% AGBR, we found that the deterior-ation was very fast, as the salt concentration, ESPand pH increased sharply in all layers, especially thebottom layer (0.40–0.50 m). Large amounts of saltwould rise from groundwater into the bottom layer,and eventually into the topsoil (0–0.20 m).
243
Figure 3. Comparison between experimental data and simulated results of above- and below-ground biomass and litter biomass of three grasscommunities in 1991 dominated by: (A) Aneurolepidium chinens, (B) Chloris virgata and (C) Suaeda glauca, respectively.
244
Figure 4. Simulated soil moisture of the rooting zone (0–0.30 m) under the five grazing intensities (0%, 25%, 50%, 75% and 90% AGBR)during the growing season (April–October) from 1991 to 1998.
Degradation of the soil was so severe under 75%AGBR and 90% AGBR that they would turn intoalkalized–salinized bare lands in just a few years. Thedifferences between these two treatments were notobvious, as there was very little grass biomass either.
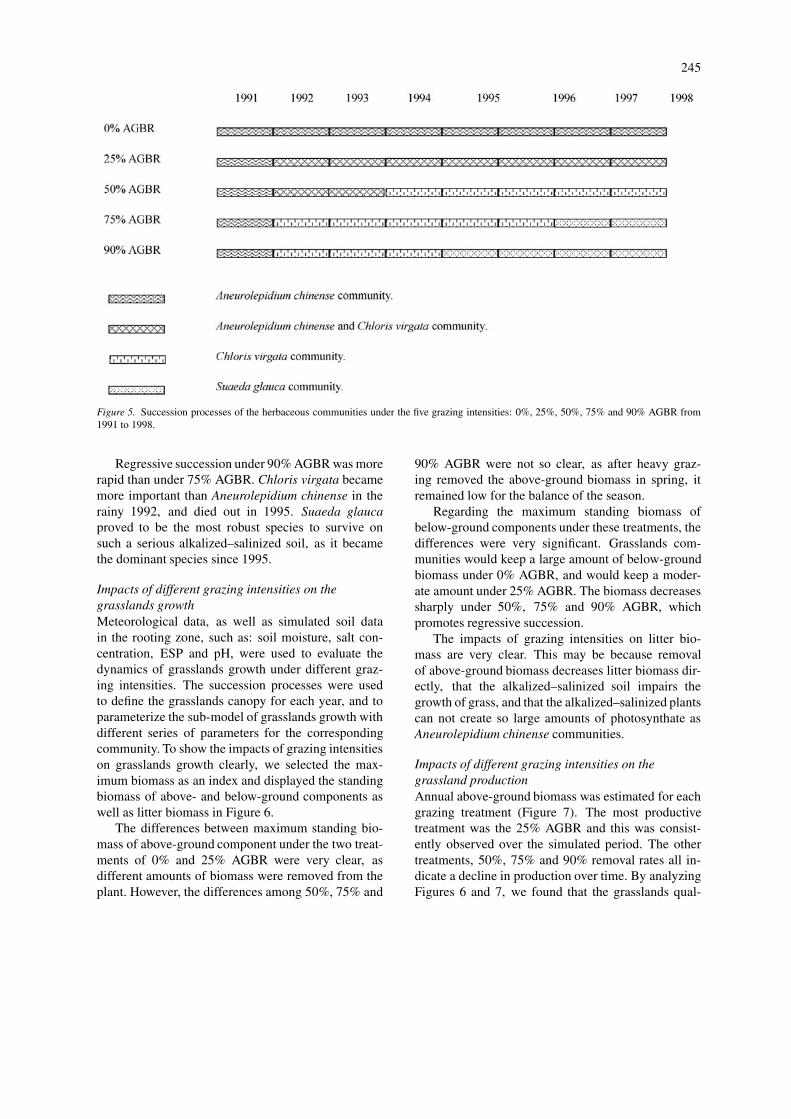
Impacts of different grazing intensities on successionprocessesThe dynamics of soil moisture, salt concentrations,ESP and pH, and grass growth status were used todetermine the succession processes of the followingyear. Detailed effects on plant growth will be de-scribed subsequently. Figure 5 shows the dominatinggrasslands community of each year under these fivegrazing intensities.
Aneurolepidium chinense was the dominant spe-cies during the 8 years from 1991 to 1998, on ungrazedgrasslands. The average soil moisture, salt concentra-tion, ESP and pH of rooting zone were all suitable forthe growth of A. chinense. The stored below-groundbiomass after a growing season was always largerthan 500 g m−2, and that promoted the growth of thefollowing year.
One year’s 25% AGBR reduced the below-groundbiomass distinctly, and thus decreased the importance
value of Aneurolepidium chinense. The direct influ-ence of grazing on grasslands growth became moreimportant than that of the indirect impacts, such as thechanges of soil moisture, salt concentration, ESP andpH. The grassland canopy became dominated by A.chinense and some Chloris virgata since 1992.
The 50% AGBR brought a quick regressive succes-sion in grassland. With the decrease of below-groundbiomass, Aneurolepidium chinense and Chloris vir-gata became the dominant species in 1992. The de-teriorated soil became more and more unsuitable for A.chinense, and C. virgata took over in place of it sincethe rainy season of 1994. As C. virgata could toleratea little more alkalinized–salinized soil, it became thedominant species after 1994.
The 75% AGBR accelerated the alkalization andsalinization processes, and damaged the below-groundbiomass of Aneurolepidium chinense greatly. As thebelow-ground biomass of A. chinense has been com-pletely impaired, Chloris virgata became the dominantspecies since 1992. As the environment became lessand less suitable for C. virgata, the serious alkalized–salinized soil could only support Suaeda Glauca,which became the dominant species after 1997.
245
Figure 5. Succession processes of the herbaceous communities under the five grazing intensities: 0%, 25%, 50%, 75% and 90% AGBR from1991 to 1998.
Regressive succession under 90% AGBR was morerapid than under 75% AGBR. Chloris virgata becamemore important than Aneurolepidium chinense in therainy 1992, and died out in 1995. Suaeda glaucaproved to be the most robust species to survive onsuch a serious alkalized–salinized soil, as it becamethe dominant species since 1995.
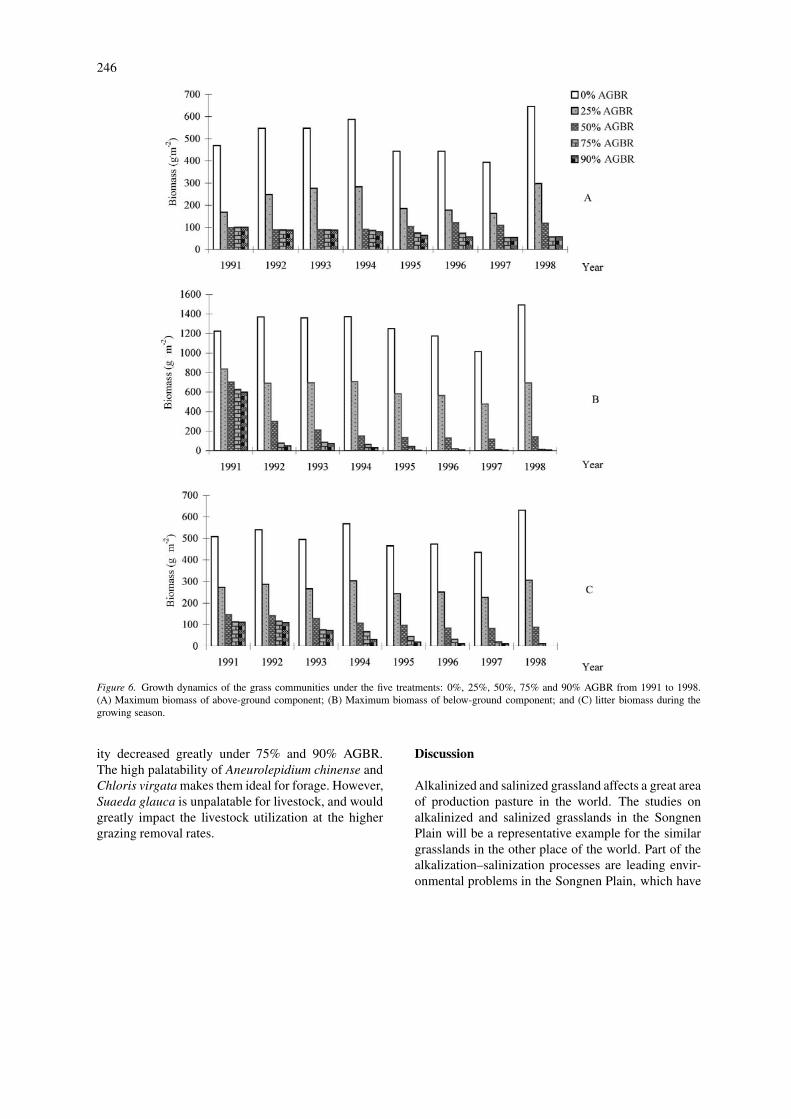
Impacts of different grazing intensities on thegrasslands growthMeteorological data, as well as simulated soil datain the rooting zone, such as: soil moisture, salt con-centration, ESP and pH, were used to evaluate thedynamics of grasslands growth under different graz-ing intensities. The succession processes were usedto define the grasslands canopy for each year, and toparameterize the sub-model of grasslands growth withdifferent series of parameters for the correspondingcommunity. To show the impacts of grazing intensitieson grasslands growth clearly, we selected the max-imum biomass as an index and displayed the standingbiomass of above- and below-ground components aswell as litter biomass in Figure 6.
The differences between maximum standing bio-mass of above-ground component under the two treat-ments of 0% and 25% AGBR were very clear, asdifferent amounts of biomass were removed from theplant. However, the differences among 50%, 75% and
90% AGBR were not so clear, as after heavy graz-ing removed the above-ground biomass in spring, itremained low for the balance of the season.
Regarding the maximum standing biomass ofbelow-ground components under these treatments, thedifferences were very significant. Grasslands com-munities would keep a large amount of below-groundbiomass under 0% AGBR, and would keep a moder-ate amount under 25% AGBR. The biomass decreasessharply under 50%, 75% and 90% AGBR, whichpromotes regressive succession.
The impacts of grazing intensities on litter bio-mass are very clear. This may be because removalof above-ground biomass decreases litter biomass dir-ectly, that the alkalized–salinized soil impairs thegrowth of grass, and that the alkalized–salinized plantscan not create so large amounts of photosynthate asAneurolepidium chinense communities.
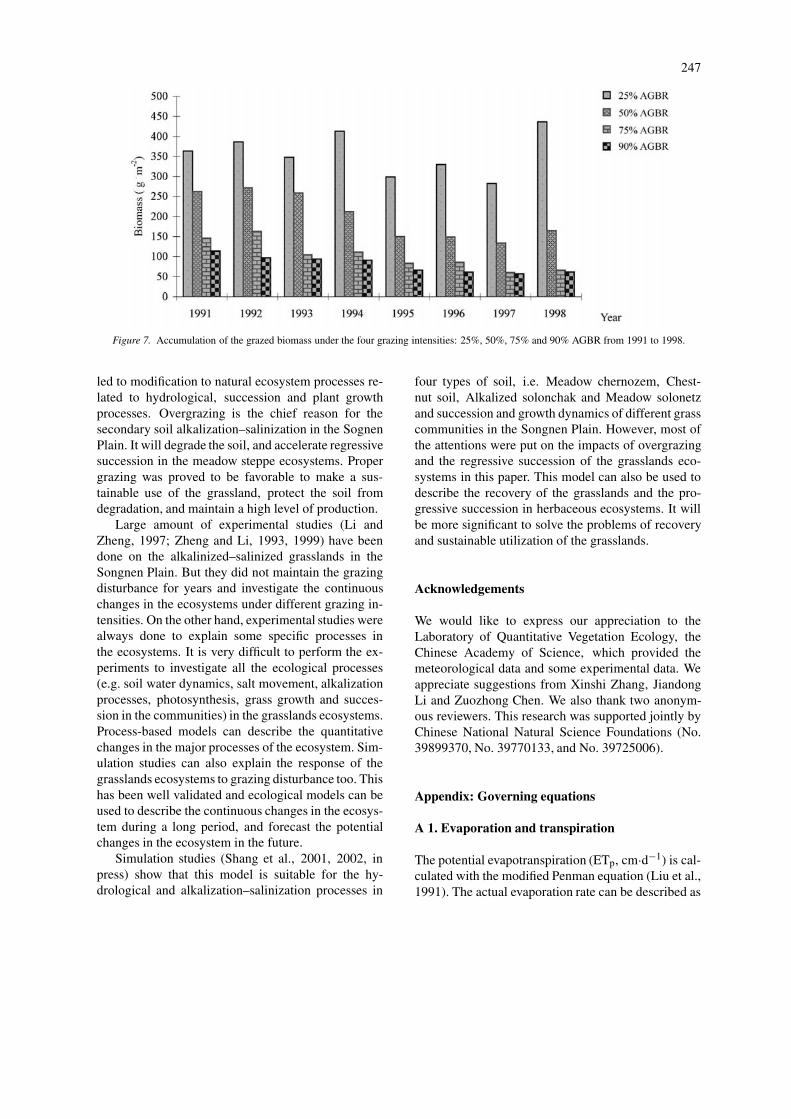
Impacts of different grazing intensities on thegrassland productionAnnual above-ground biomass was estimated for eachgrazing treatment (Figure 7). The most productivetreatment was the 25% AGBR and this was consist-ently observed over the simulated period. The othertreatments, 50%, 75% and 90% removal rates all in-dicate a decline in production over time. By analyzingFigures 6 and 7, we found that the grasslands qual-
246
Figure 6. Growth dynamics of the grass communities under the five treatments: 0%, 25%, 50%, 75% and 90% AGBR from 1991 to 1998.(A) Maximum biomass of above-ground component; (B) Maximum biomass of below-ground component; and (C) litter biomass during thegrowing season.
ity decreased greatly under 75% and 90% AGBR.The high palatability of Aneurolepidium chinense andChloris virgata makes them ideal for forage. However,Suaeda glauca is unpalatable for livestock, and wouldgreatly impact the livestock utilization at the highergrazing removal rates.
Discussion
Alkalinized and salinized grassland affects a great areaof production pasture in the world. The studies onalkalinized and salinized grasslands in the SongnenPlain will be a representative example for the similargrasslands in the other place of the world. Part of thealkalization–salinization processes are leading envir-onmental problems in the Songnen Plain, which have
247
Figure 7. Accumulation of the grazed biomass under the four grazing intensities: 25%, 50%, 75% and 90% AGBR from 1991 to 1998.
led to modification to natural ecosystem processes re-lated to hydrological, succession and plant growthprocesses. Overgrazing is the chief reason for thesecondary soil alkalization–salinization in the SognenPlain. It will degrade the soil, and accelerate regressivesuccession in the meadow steppe ecosystems. Propergrazing was proved to be favorable to make a sus-tainable use of the grassland, protect the soil fromdegradation, and maintain a high level of production.
Large amount of experimental studies (Li andZheng, 1997; Zheng and Li, 1993, 1999) have beendone on the alkalinized–salinized grasslands in theSongnen Plain. But they did not maintain the grazingdisturbance for years and investigate the continuouschanges in the ecosystems under different grazing in-tensities. On the other hand, experimental studies werealways done to explain some specific processes inthe ecosystems. It is very difficult to perform the ex-periments to investigate all the ecological processes(e.g. soil water dynamics, salt movement, alkalizationprocesses, photosynthesis, grass growth and succes-sion in the communities) in the grasslands ecosystems.Process-based models can describe the quantitativechanges in the major processes of the ecosystem. Sim-ulation studies can also explain the response of thegrasslands ecosystems to grazing disturbance too. Thishas been well validated and ecological models can beused to describe the continuous changes in the ecosys-tem during a long period, and forecast the potentialchanges in the ecosystem in the future.
Simulation studies (Shang et al., 2001, 2002, inpress) show that this model is suitable for the hy-drological and alkalization–salinization processes in
four types of soil, i.e. Meadow chernozem, Chest-nut soil, Alkalized solonchak and Meadow solonetzand succession and growth dynamics of different grasscommunities in the Songnen Plain. However, most ofthe attentions were put on the impacts of overgrazingand the regressive succession of the grasslands eco-systems in this paper. This model can also be used todescribe the recovery of the grasslands and the pro-gressive succession in herbaceous ecosystems. It willbe more significant to solve the problems of recoveryand sustainable utilization of the grasslands.
Acknowledgements
We would like to express our appreciation to theLaboratory of Quantitative Vegetation Ecology, theChinese Academy of Science, which provided themeteorological data and some experimental data. Weappreciate suggestions from Xinshi Zhang, JiandongLi and Zuozhong Chen. We also thank two anonym-ous reviewers. This research was supported jointly byChinese National Natural Science Foundations (No.39899370, No. 39770133, and No. 39725006).
Appendix: Governing equations
A 1. Evaporation and transpiration
The potential evapotranspiration (ETp, cm·d−1) is cal-culated with the modified Penman equation (Liu et al.,1991). The actual evaporation rate can be described as
248
(Ritchie, 1972):
Emax = ETp · e−Kp · LAI (A.1)
Ea =
θ − θm
θ0 − θm· Emax if St = 0 and Ea > C1
R
Emax else(A.2)
where Emax is maximum evaporation rate (cm·d−1);LAI is leaf area index (cm2·cm−2); Ea is actualevaporation rate (cm·d−1); θ is soil moisture con-tent (cm3·cm−3); θm is moisture content of air-driedsoil material (cm3·cm−3); θ0 is total soil porosity(cm3·cm−3); St is actual surface storage water (cm);C1
R is risen water to surface by capillary rise (cm·d−1);and KP is constant.
The actual transpiration can be described by(Doorenbos et al., 1978 and van Keulen andWolf, 1986)
Tmax = ETp – Emax (A.3)
Ta =
0 if θ ≤ θwθ − θw
θCR − θW· Tmax if θW < θ < θCR
Tmax if θCR ≤ θ ≤ θFCθ0 − 0.05) − θ
(θ0 − 0.05) − θFC· Tmax if θFC < θ < θ0
0 if θ � (θ0 − 0.05)
(A.4)
θCR = (1 − v · (θFC − θW) + θW, (A.5)
where Tmax is the maximum transpiration rate(cm·d−1); Ta is actual transpiration rate (cm·d−1); θwis the wilting point (cm3·cm−3); θo is the saturatedsoil moisture content (cm3·cm−3); θ is soil moisturecontent (cm3·cm−3); θCR is the corresponding criticalsoil moisture (cm3·cm−3); v is constant; and θFC isfield capacity (cm3·cm−3).
A 2. Infiltration
The surface storage capacity is determined by the sur-face roughness and the vegetation canopy. The max-imum infiltration rate is determined by matrix forcesand gravity forces (Stroosnijder, 1976):
Imax = SSo ·(
1 − θ
θ0
)· (t)
−0.5 + A, (A.6)
where Imax is maximum infiltration rate (cm·d−1); SS0is standard sorptivity values (cm·d−0.5); t is precip-itation period (d); and A is the transmission zonepermeability (cm·d−1).
The total water supply (including precipitation andirrigation) will be consumed by losses due to evapor-ation, transpiration, surface flow and infiltration. Thesurface storage will increase in case that total watersupply exceeds the maximum infiltration rate, and ex-cess water will flow off, while stored water exceeds thesurface storage capacity. In reverse, if the surface sup-ply is below the maximum infiltration rate, the surfacestorage of water will be consumed by infiltration.
A 3. Hydraulic conductivity
Rijtema (1965) gave the formula to calculate theunsaturated hydraulic conductivity:
K ={
K0 · ea·S if S ≤ Smax
β · S−1.4 if S > Smax,
(A.7)
where K is unsaturated hydraulic conductivity(cm·d−1); K0 is saturated hydraulic conductivity(cm·d−1); S is soil matric (cm3·cm−3); S max is theair entry point (cm·d−0.5; α is constant (cm·d−1); β isconstant (cm−1).
van Keulen and Wolf’s equation (1986) is used toexpress the relationship between matric suction andsoil water content:
S =e
√ln θ0−ln θ
τ if θ < θ0
1 if θ ≥ θ0,(A.8)
where θ0 is total soil porosity (cm3·cm−3); and τ isconstant (cm).
A 4. Vertical movement
The soil is divided into five 10 cm layers. For such athin layer, the differential operator in Darcy’s law maybe assumed to the little difference between these twolayers, and the capillary rise rate (CR) between thesetwo layers can be calculated by the reformed Darcy’s

249
law:
CjR = K · dH
dZ= K ·
(dS
dZ− 1
)
≈ K ·(
S
Z− 1
)(A.9)
= Kj + Kj+1
2·(
Sj − Sj+1
Zj+1 − Zj − 1
),
where CjR is capillary rise from the j layer to j −1 layer
(cm·d−1); H is hydraulic head (cm); Zj is depth of thej layer soil (cm).
If the soil moisture of the bottom layer is wet andthe matric suction is less than the ‘air entry point’(Smax), the capillary rise from groundwater to thebottom layer can be defined by (van Keulen and Wolf,1986):
CgR = K0 · [eα·S − e−α·(GW–ZB)]
e−α·(GW–ZB) − 1if S ≤ Smax, (A.10)
where CgR is capillary rise from groundwater to the bot-
tom layer (cm·d−1); GW is groundwater table (cm);ZB is depth of bottom layer (cm). But numerical in-tegration technology (Rijtema, 1965) is necessary ifthe soil moisture of the bottom layer is wetter than the‘air entry point’ (Smax).
The downward percolation rate (Pe) can be calcu-lated by (van Keulen and Wolf, 1986)
Pe = K, (A.11)
where Pe is downward percolation (cm·d−1).
A 5. Water balance
The changes in soil moisture content (θ j) can bedefined by the ‘input’ and ‘output’ water, and the depthof this layer:
θ j = Wjin–Wj
out
Zj – Zj−1, (A.12)
where Wjin is the ‘input’ water of the j layer soil
(cm·d−1), Wjout is the ‘output’ water of the j layer
(cm·d−1), and Zj is the depth of the j layer soil (cm).
A 6. Soil salinization process
Diffusion is assumed to be the main transfer manner.One-dimensional equation is used to describe the ver-tical movement of solutes (Bear, 1972; Bresler, 1975;Bresler et al., 1982):
∂
∂ t(Q + θC) ≈= ∂
∂z(qC), (A.13)
where t is time; Q is the concentration of absorbed andsolid solutions; θ is soil moisture content; C is solutionconcentration; z is distance; q is water flux. Since thedynamic of water movement has been calculated inthe submodel of water dynamics, we can define thevertical movement of solutes in soil now.
A 7. Soil alkalization process
Only four cation and anion species, Na+, Ca2+,HCO−
3 and CO2−3 , are considered in soil alkalization
process. The replacement of exchangeable calciumcations attaching to the surface of soil particles bysodium cations in soil solution is determined by theconcentration of calcium and sodium cations in thesolution (Wang, 1993):
XNa√XCa
= KS · CNa√CCa
(A.14)
The total exchangeable cations will not change duringthis process:
XCa + XNa= Xec, (A.15)
where XCa and XNa are exchangeable calcium cationand sodium cation (mEq/100 g); CCa and CNa are con-centration of calcium cation and sodium cations in thesolution (mEq /100 g); Xec is the total exchangeablecations (mEq /100g); and KS is constant.
The existence of carbonate anion in the soil solu-tion will react to calcium cation and generate insolublecalcium carbonate:
CCa· CCO3 = Ksp, (A.16)
where CCO3 is concentration of carbonate anion in soilsolution (mEq /100 g); and Ksp is solubility product.
A 8. pH
The existence of alkaline sodium cation is the domin-ant reason of high pH in sodic soil, and the pH can be

250
defined by (Wang, 1993):
SpH = Kpa + Kpb· l g (CHCO3 +CCO3 – CCa – CMg)
(A.17)
where SpH is pH; CHCO3, CCO3, CCa and CMg areconcentration of bicarbonate anion, carbonate anion,calcium cation and magnesium cation in soil solutionrespectively (mEq /100g); Kpa and Kpb are constants.
A 9. Plant growth
Plant growth equation is used to describe this process:
dmiu
dt = β iu(t) · Ai(t, mi
u) + δir(t) · mi
r
−δiu(t) · mi
u − Diu(t, mi
u)
dmir
dt = β ir(t)A
i(t, miu)
−δir(t) · mi
r + δiu(t) · mi
u − Dir(t, mi
r),
(A.18)
wheredmi
udt and
dmir
dt are accumulation rate of above-and below-ground biomass; i is the sort of grass com-munity; mi
u and mir are above- and below-ground
biomass; Ai(t,miu) is the rate of net photosynthesis; β i
u(t) and β i
r (t) are the partition of daily photosynthesisproducts into above- and below-ground components;δi
r(t) is the transfer partition from below-ground toabove-ground; δi
u(t is the transfer partition form above-ground to below-ground; Di
u(t,miu and Di
r(t,mir) are
litter rate of above- and below-ground biomass.
A 10. Influence of environmental factors on grassgrowth
The leaf area index can be defined by green biomassand the specific leaf area:
LAIi = miu· ki
l/SLAj, (A.19)
where kil is percentage of green biomass in the above-
ground biomass, SLAi is specific leaf area. The rate ofnet photosynthesis is defined by:
Ai(tmiu) = Bg·PAR
1 + Ag·PAR· LAIi
ag+bg·LAIi·
FiT · Fi
C · FiW · Fi
S · FiA · Fi
pH·, (A.20)
where PAR is photosynthetically active radiation(J·cm−2·d−1); Fi
T, FiC, Fi
W, FiS, Fi
A and FipH are in-
fluence function of air temperature, atmospheric CO2
concentration, soil moisture, soil salts concentration,ESP, and pH respectively; Ag, Bg, ag and bg areconstants.
The influence of air temperature on photosynthesisrate is defined as (Gao et al., 1997; Shang et al., 2000):
Fit = e
−(T–ti0pi
T)2
, (A.21)
where T is air temperature (◦C); Ti0 is the optimum
temperature for photosynthesis of this community(◦C); and pi
T is constant (◦C).The influence function of atmospheric CO2 con-
centration is expressed with (Gao et al., 1997):
FiC = Co
KCO + Co, (A.22)
where Co is atmospheric CO2 concentration (µL/L);KCO is constant (µL/L). The influence of soil moistureis defined as a linear function:
FiW =
θ−θ iW
θ iop−θ i
Wif θ < θ i
op
1 if θ ≥ θ iop,
(A.23)
where θ is soil moisture (cm3·cm−3) of the rootzone, θ i
W is wilting point (cm3·cm−3) of this sortof community, and θ i
op is the optimum soil moisture
(cm3·cm−3).The influence function of soil salts concentra-
tion, soil alkalization and soil pH on the rate of netphotosynthesis are defined as (Qi et al., 1989):
FiS =
e
−(
EC−EiC0
giS
)2
EC > EiC0
1 EC ≤ EiC0
(A.24)
FiA =
e
−(
Al−Ail0
giA
)2
Al > Ail0
1 Al ≤ Ail0
(A.25)
FipH =
e
−(
pH−piH0
gipH
)2
PH > PiH0
1 PH ≤ PiH0,
(A.26)
where EC, Al and pH are soil salt concentration, ESPand pH, Ei
C0, Ail0 and pi
H0 are the optimum soil saltconcentration, ESP and pH, respectively, gi
S, giA and
gipH are constants.
251
References
Bear J 1972 Dynamics of Fluids in Porous Media. AmericanElsevier Publishing Company, Inc. New York. 764 pp.
Bresler E 1975 Two-dimersional transport on solutes during non-steady infiltration from a trickle source. J. Soil Sci. Soc. Am. 39,604–612.
Bresler E, McNeal B L and Carter D L 1982 Saline and sodic soils(principles dynamics-modeling). Adv. Series in Agricul. Sci. 10.
Doorenbos J, Kassam A H and Bentvelder C 1978 Yield response towater. U. N. Economic Commission West Asia, Rome.
Frere M and Pruitt W O 1979 Guidelines for predicting crop waterrequirements. FAO Irrigation and Drainage Paper 24, Rome. 41–45.
Fu B 1983 Mountainous climate. Science Press of China. Beijing.270 pp.
Gao Q and Zhang W 1993 SOINFIL – A method to explorethe data of infiltration experiment for retentivity and hydraulicconductivity. Acta Ecol. Sin. 13, 280–282.
Gao Q and Zhang X 1997 A simulation study of responses of theNortheast China Transect to elevated CO2 and climate change.Ecol. Appl. 7, 470–483.
Gao Q, Li J and Zheng H 1996b A dynamic landscape simulationmodel for the alkaline grasslands on Songnen Plain in northeastChina. Landscape Ecol. 11, 339–349.
Gao Q, Yang X, Yun R and Li C 1996a MAGE, a dynamic model ofalkaline grassland ecosystems with variable soil characteristics.Ecol. Model 93, 19–32.
Gao Q, Yu M, Li C and Yun R 1998 Effects of ground water andharvest intensity on alkaline grassland ecosystem dynamics – asimulation study. Plant Ecol. 135, 165–176.
Hillel D 1977 Computer Simulation of Soil Physics. AcademicPress, New York.
Kaddah M T and Rhoades J D 1976 Salt and water balance in theImperial Valley, California. J. Soil Sci. Soc. Am. 41, 93–100.
Li C Model study on the interaction between biomass of Puccinel-lia tenuiflora and Suaeda glauca communities and ecologicalfactors. Master thesis of Northeast Normal University. 1993. 5
Li J and Zheng H 1997 Management on Alkaline-saline Grasslandin Songnen Plain and Its Bio-ecological Mechanism. SciencePress of China, Beijing. 271 pp.
Liu C, Hong J and Jin H 1991 Calculation of field evapotranspir-ation. In Evapotranspiration of the Field – Measurement andCalculation. Eds. Xie X, Zuo D and Tang D. pp. 134–142.Meteorological Publishing House of China. Beijing.
Monteith J L 1965 Evaporation and environment. Symposium So-ciety Experiment Biology XIX. Cambridge University Press.London.
Qi Q, Sheng X, Jiang S, Jin Q and Hong L 1989 A comparative study
of the community photosynthesis of Aneurolepidium Chinenseand Stipa grandis. Acta. Phytoecol. Geobot. Sin. 13, 332–340.
Rijtema P E 1969 Soil moisture forecasting. Nota 513, I.C.W.Wageningen. 18 pp.
Ritchie J T 1972 Model for predicting evaporation from a row cropwith incomplete cover. Wat. Resour. Res. 8, 1204–1213
Shang Z, Gao Q and Li J 2001 Simulation study on the alkalized–salinized grassland ecosystem in the Songnen Plain. Acta. Bot.Sin. 43, 624–630.
Shang Z, Gao Q and Wang R 2002 Simulation study on the dynam-ics of alkalization–salinization processes in Songnen grassland.Acta Pedologica Sin. (In press).
Shang Z, Yang J, Yin H, Luo X and Zhao S 2000 A physiological-ecological simulation model of maize growth. Acta. Bot. Sin. 42,184–194.
Stroosnijder 1976 Infiltrate en herverdeling van water in ground.Verslagen Ladbouwkundige Onderzoekingen (Agricultural Re-search Reports) 847, Pudoc, Wageningen. 213 p.
van Keulen H and Wolf J 1986 Modelling of Agricultural Pro-duction: Weather, Soil and Crops. Pudoc Wageningen. 479p.
Vertessy R A, Hatton T J, O’Slaughnessy P J and Jayasuriya M D A1993 Predicting water yield from a moutain ash forest catchmentusing a terrain analysis based catchment model. J. Hydrol. 50,665–700.
Viessman W, Lewis G L and Knapp J W 1989 Introduction toHydrology. Harper and Row, New York. 780 p.
Wang R and Ripley E A 1997 Effects of grazing on a Leymus chinen-sis grassland on the Songnen plain on north-eastern China. J.Arid. Envir. 36, 307–318.
Wang Z 1993 Alkaline–Saline Soil of China. Science Press ofChina, Beijing. 573 pp.
Yun R. An experimental study on the biomass and soil elementsof Aneurolepidium chinense and Chloris virgata communitieson Songnen Plain. Master thesis of Noreast Normal University.1993. 5.
Zhang W and Gao Q 1994 Exploration of the movements of waterand dissolved salts in soils under different plant communitiesin Aneurolepidium Chinense grasslands of Songnen Plain. ActaPhytoecol Sin 18, 132–139.
Zheng H and Li J 1993 Protection and Utilization of the GrasslandVegetation on Songnen Plain. Science Press of China, Beijing.195 p.
Zheng H and Li J 1999 Saline Plants in Songnen Plain and Res-toration of Alkaline-saline Grass. Science Press of China. 233pp.
Section editor: J.M. Cheeseman