
Assessing the status of sealed fire in underground coal mines
Upload
independentCategory
view
0download
0
Energy Vol. 7. No. 9. pp. 773-782. 1982 Printed in Great t&in.
03&5442/82Km7!-loso1.00 Pergunon Press Ltd.
IMPACT OF TECHNOLOGICAL CHANGE ON LABOR PRODUCTIVITY IN U.S. COAL
MINES-EVIDENCE FROM TIME SERIES AND CROSS SECTIONAL DATAt
HYDER ALI G. LAKHANI
Energy, Economics and Environmental Research, 3213 Amberly Lane, Fairfax, VA 22031, U.S.A
(Receiued 10 July 1981)
Abstract-111 this paper, we examine the impact of technological change (TC) on labor productivity in underground and surface mines. TC in the underground mines is the replacement of continuous machines for conventional miners between 1951 and 1970 and the recent penetration of longwall machines. In surface mines, TC consists of substitution of medium and large sized power shovels and draglines (PSBDLs) for smaller counterparts. Impact of these capital stocks ub-d-ais such other explanatory variables as seam thickness or strip ratio, utilization of capacity, captive vs non-captive mines. skilled labor, large sized mines and a dummy variable for coal mine regulations, on labor productivity is analysed by regressing the effects of these explanatory variables on labor productivity. The data used for the analysis include time series, as well as cross section data for mines in the Energy Information Administration’s tapes for 1977. The analysis shows that adoption of newer technologies increases labor productivity in both mine types. Other variables that explain increases in productivity are increased seam thickness (in underground mines), exploitation of non-captive mines, use of skilled labor. and use of large mines. The variables explaining decreases in productivity are increased use of semi-skilled labor, strip ratio (in surface mines), mine accidents. and coal mine regulations.
I. INTRODUCTION
For an orderly substitution of coal and its by-products for oil and natural gas, it is necessary that the prices of coal do not increase excessively. Increases in the prices of coal can be restrained by a decrease in the cost of production. One of the major components of cost of production of coal is the cost of labor. The increase in labor costs could be restrained if productivity of labor can be increased. If labor productivity declines, the impact of wage increases on coal prices will be compounded. One of the important variables that can be controlled by policy measures to increase labor productivity is technological change in coal mines, which involves production of increased output per unit increase in input of labor. The other factors that could increase productivity, but which cannot be easily controlled by policy, are seam thickness of mined coal beds, mine ownership by competitive entrepreneurs, and utilization of capacity. In addition to these productivity-raising variables, there are such productivity-depressing variables as increased coal m.ine health and safety regulations, mine ownership by non-competitive entrepreneurs, and increased fatal or non-fatal accidents. Reductions in mine accidents increase social welfare and also affect productivity. We examine the role of newer technologies and of non-technological variables that increase productivity.
Section 2 deals with trends in labor productivity, wages and prices in the coal mining industry; in Section 3, we summarise the trends in technological change in underground and surface mines that were discussed in detail in Ref. 1. Section 4 deals with the conceptual framework for analysis of labor productivity and sources of data. In Section 5, we analyse the relative importance of technological change and other variables in explaining changes in labor productivity; the empirical variations in productivity are analysed using time series and cross-sectional data on coal mines.
Yl’he views expressed in this paper are personal views. This study was prepared at the Mitre Corporation for a Mining Manpower Model project sponsored by the U.S. Department of Energy. An earlier draft of this paper was read at the Atlantic Economic Conference in October 1979 in Washington, DC., where if was discussed by Dr. Herman Enzer of the U.S. Department of the Interior. I am grateful to Dr. Enzer for his invaluable comments. The errors that remain are entirely my responsibility.
n3
774 H. A.G. LAKHANI
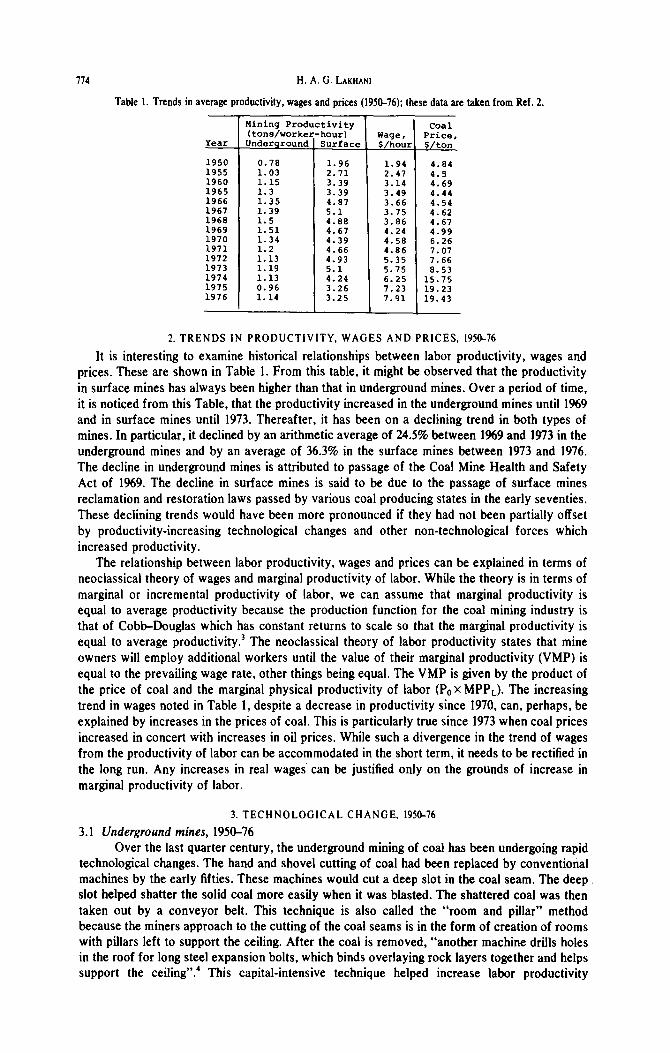
Tabie 1. Trends in average productivity, wages and prices (1950-76); these data are taken from Ref. 2.
Year r Mining Prod (tons/worke Underground
tivity hour) Surface
1950 0.78 1.96 1955 1.03 2.71 1960 1.15 3.39 1965 1.3 3.39 1966 1.35 4.87 1967 1.39 5.1 1968 1.5 4.88 1969 1.51 4.67 1970 1.34 4.39 1971 1.2 4.66 1972 1.13 4.93 1973 1.19 5.1 1974 1.13 4.24 1975 0.96 3.26 1976 1.14 3.25
Coal wage. Price, S/hour S/ton
1.94 4.04 2.47 4.5 3.14 4.69 3.49 4.44 3.66 4.54 3.75 4.62 3.86 4.67 4.24 4.99 4.58 6.26 4.86 7.07 5.35 7.66 5.75 8.53 6.25 15.75 7.23 19.23 7.91 19.43
2. TRENDS IN PRODUCTIVITY, WAGES AND PRICES, 1950-76
It is interesting to examine historical relationships between labor productivity, wages and prices. These are shown in Table 1. From this table, it might be observed that the productivity in surface mines has always been higher than that in underground mines. Over a period of time, it is noticed from this Table, that the productivity increased in the underground mines until I%9 and in surface mines until 1973. Thereafter, it has been on a declining trend in both types of mines. In particular, it declined by an arithmetic average of 24.5% between 1969 and 1973 in the underground mines and by an average of 36.3% in the surface mines between 1973 and 1976. The decline in underground mines is attributed to passage of the Coal Mine Health and Safety Act of 1%9. The decline in surface mines is said to be due to the passage of surface mines reclamation and restoration laws passed by various coal producing states in the early seventies. These declining trends would have been more pronounced if they had not been partially offset by productivity-increasing technological changes and other non-technological forces which increased productivity.
The relationship between labor productivity, wages and prices can be explained in terms of neoclassical theory of wages and marginal productivity of labor. While the theory is in terms of marginal or incremental productivity of labor, we can assume that marginal productivity is equal to average productivity because the production function for the coal mining industry is that of Cobb-Douglas which has constant returns to scale so that the marginal productivity is equal to average productivity.3 The neoclassical theory of labor productivity states that mine owners will employ additional workers until the value of their marginal productivity (VMP) is equal to the prevailing wage rate, other things being equal. The VMP is given by the product of the price of coal and the marginal physical productivity of labor (Pox MPP,J. The increasing trend in wages noted in Table 1, despite a decrease in productivity since 1970, can, perhaps, be explained by increases in the prices of coal. This is particularly true since 1973 when coal prices increased in concert with increases in oil prices. While such a divergence in the trend of wages from the productivity of labor can be accommodated in the short term, it needs to be rectified in the long run. Any increases in real wages can be justified only on the grounds of increase in marginal productivity of labor.
3. TECHNOLOGICAL CHANGE, 1950-76
3.1 Underground mines, 195&76 Over the last quarter century, the underground mining of coal has been undergoing rapid
technological changes. The hand and shovel cutting of coal had been replaced by conventional machines by the early fifties. These machines would cut a deep slot in the coal seam. The deep. slot helped shatter the solid coal more easily when it was blasted. The shattered coal was then taken out by a conveyor belt. This technique is also called the “room and pillar” method because the miners approach to the cutting of the coal seams is in the form of creation of rooms with pillars left to support the ceiling. After the coal is removed, “another machine drills holes in the roof for long steel expansion bolts, which binds overlaying rock layers together and helps support the ceiling”.4 This capital-intensive technique helped increase labor productivity
Impact of technological change on labor productivity in U.S. coal mines
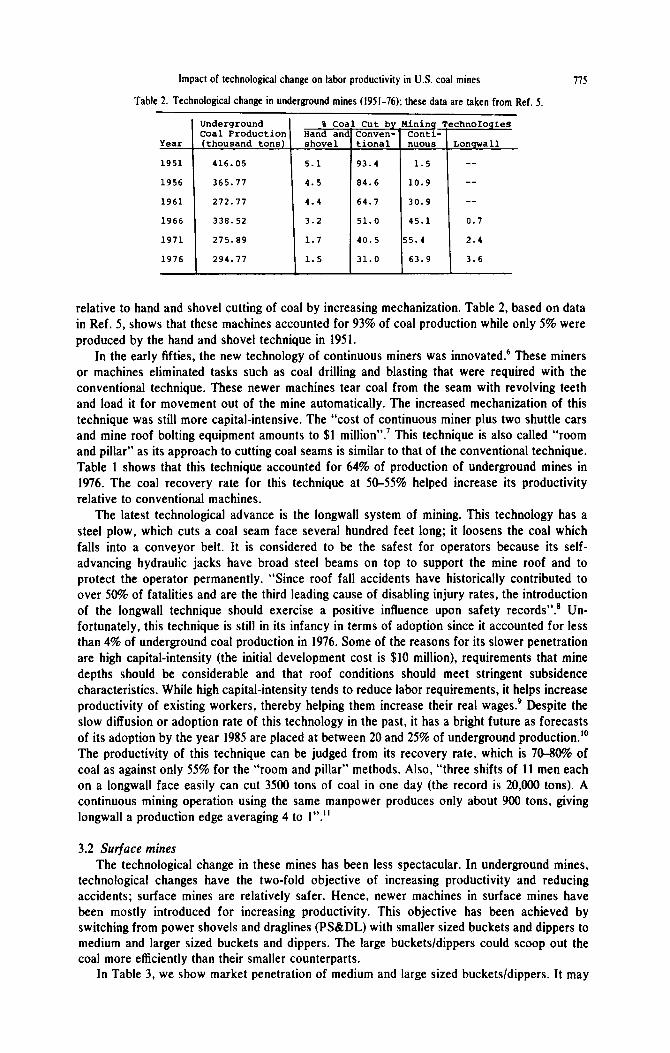
Table 2. Technological change in underground mines (1951-76); these data are taken from Ref. 5.
Underground Coal Production
8 Coal Cut by Mining2 Hand and Conven-' Conti-
Year (thousand tons) shovel tional nuous
1951 416.05 5.1 93.4 1.5
1956 365.77 4.5 84.6 10.9
1961 272.77 4.4 64.7 30.9
1966 338.52 3.2 51.0 45.1
1971 275.89 1.7 40.5 55.4
1976 294.77 1.5 31.0 63.9
Pet
I
I :hnoIogfes
,on 9wall
_-
-_
__
0.7
2.4
3.6
relative to hand and shovel cutting of coal by increasing mechanization. Table 2, based on data in Ref. 5, shows that these machines accounted for 93% of coal production while only 5% were produced by the hand and shovel technique in 1951.
In the early fifties, the new technology of continuous miners was innovated.6 These miners or machines eliminated tasks such as coal drilling and blasting that were required with the conventional technique. These newer machines tear coal from the seam with revolving teeth and load it for movement out of the mine automatically. The increased mechanization of this technique was still more capital-intensive. The “cost of continuous miner plus two shuttle cars and mine roof bolting equipment amounts to $1 million”.’ This technique is also called “room and pillar” as its approach to cutting coal seams is similar to that of the conventional technique. Table 1 shows that this technique accounted for 64% of production of underground mines in 1976. The coal recovery rate for this technique at 50-55% helped increase its productivity relative to conventional machines.
The latest technological advance is the longwan system of mining. This technology has a steel plow, which cuts a coal seam face several hundred feet long; it loosens the coal which falls into a conveyor belt. It is considered to be the safest for operators because its self- advancing hydraulic jacks have broad steel beams on top to support the mine roof and to protect the operator permanently. “Since roof fall accidents have historically contributed to over 50% of fatalities and are the third leading cause of disabling injury rates, the introduction of the longwall technique should exercise a positive influence upon safety records”.” Un- fortunately, this technique is still in its infancy in terms of adoption since it accounted for less than 4% of underground coal production in 1976. Some of the reasons for its slower penetration are high capital-intensity (the initial development cost is $10 million), requirements that mine depths should be considerable and that roof conditions should meet stringent subsidence characteristics. While high capital-intensity tends to reduce labor requirements, it helps increase productivity of existing workers, thereby helping them increase their real wages? Despite the slow diffusion or adoption rate of this technology in the past, it has a bright future as forecasts of its adoption by the year 1985 are placed at between 20 and 25% of underground production.” The productivity of this technique can be judged from its recovery rate, which is 70-80% of coal as against only 55% for the “room and pillar” methods. Also, “three shifts of 11 men each on a longwall face easily can cut 3500 tons of coal in one day (the record is 20,000 tons). A continuous mining operation using the same manpower produces only about 900 tons, giving longwall a production edge averaging 4 to I”.”
3.2 Surface mines The technological change in these mines has been less spectacular. In underground mines,
technological changes have the two-fold objective of increasing productivity and reducing accidents; surface mines are relatively safer. Hence, newer machines in surface mines have been mostly introduced for increasing productivity. This objective has been achieved by switching from power shovels and draglines (PS&DL) with smaller sized buckets and dippers to medium and larger sized buckets and dippers. The large buckets/dippers could scoop out the coal more efficiently than their smaller counterparts.
In Table 3, we show market penetration of medium and large sized buckets/dippers. It may
‘16 H. A.G. LAKHANI
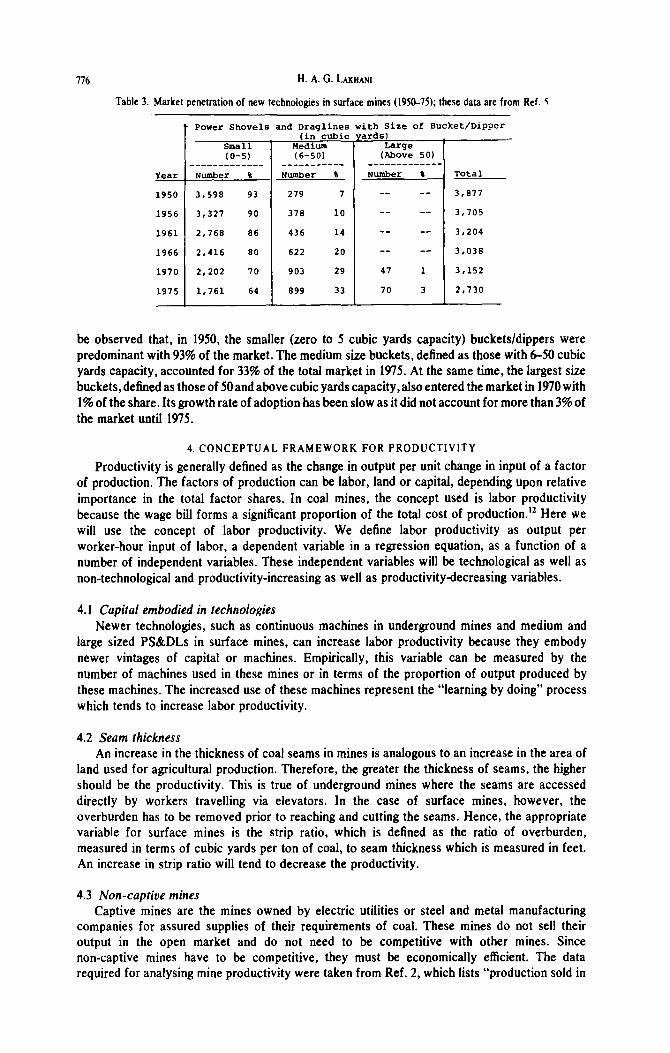
Table 3. Market penetration of new technologies in surface mines (1950-75); these data are from Ref. 5
YeaX
1950
1956
1961
1966
1970
1975
Power Shovels and Draglines with Size of Bucket/Dipper
Small (O-5)
________-_---
Number a
3,598 93
3,327 90
2,760 06
2,416 SO
2,202 70
1,761 64
in cubic Medmm T--- (6-50)
_--_-_-----
Number a
279 7
370 10
436 14
622 20
903 29
899 33
vmds) Large (Above 50)
__ __
__ __
47 1
70 3
Total
3,077
3,705
3,204
3,038
3,152
2,730
be observed that, in 1950, the smaller (zero to 5 cubic yards capacity) buckets/dippers were predominant with 93% of the market. The medium size buckets, defined as those with 6-50 cubic yards capacity, accounted for 33% of the total market in 1975. At the same time, the largest size buckets, defined as those of 50 and above cubic yards capacity, also entered the market in 1970 with 1% of the share. Its growth rate of adoption has been slow as it did not account for more than 3% of the market until 1975.
4. CONCEPTUAL FRAMEWORK FOR PRODUCTIVITY
Productivity is generally defined as the change in output per unit change in input of a factor of production. The factors of production can be labor, land or capital, depending upon relative importance in the total factor shares. In coal mines, the concept used is labor productivity because the wage bill forms a significant proportion of the total cost of production.” Here we will use the concept of labor productivity. We define labor productivity as output per worker-hour input of labor, a dependent variable in a regression equation, as a function of a number of independent variables. These independent variables will be technological as well as non-technological and productivity-increasing as well as productivity-decreasing variables.
4.1 Capital embodied in technologies Newer technologies, such as continuous machines in underground mines and medium and
large sized PS&DLs in surface mines, can increase labor productivity because they embody newer vintages of capital or machines. Empirically, this variable can be measured by the number of machines used in these mines or in terms of the proportion of output produced by these machines. The increased use of these machines represent the “learning by doing” process which tends to increase labor productivity.
4.2 Seam thickness An increase in the thickness of coal seams in mines is analogous to an increase in the area of
land used for agricultural production. Therefore, the greater the thickness of seams, the higher should be the productivity. This is true of underground mines where the seams are accessed directly by workers travelling via elevators. In the case of surface mines, however, the overburden has to be removed prior to reaching and cutting the seams. Hence, the appropriate variable for surface mines is the strip ratio, which is defined as the ratio of overburden, measured in terms of cubic yards per ton of coal, to seam thickness which is measured in feet. An increase in strip ratio will tend to decrease the productivity.
4.3 Non-captive mines Captive mines are the mines owned by electric utilities or steel and metal manufacturing
companies for assured supplies of their requirements of coal. These mines do not sell their output in the open market and do not need to be competitive with other mines. Since non-captive mines have to be competitive, they must be economically efficient. The data required for analysing mine productivity were taken from Ref. 2, which lists “production sold in
Impact of technological change on labor productivity in U.S. coal mines 111
open market by all mines”. In order to separate these total sales into those sold by the surface and the underground mines, we allocated these sales in proportion to production (in tons) of these mines in the respective years.
4.4 Large size mines The greater the number of large sized mines, the higher should be their productivity since
these mines could avail themselves of economies of scale in production by employing optimally-sized equipment and manpower mix. The data required for this variable were also taken from Ref. 2 and pertained to the number of mines in Classes I and II, that is, mines producing in excess of 200,000 tons/year.
4.5 Capacity utilization If a mine operates nearer to its theoretical or planned capacity, it will have higher
productivity because there will be minimal idle capacity or equipment or manpower mix. Ideally, the data for measuring theoretical capacity and deviations from such capacities have to pertain to the daily output capacities planned for these mines and the actual production levels per day. The only data available to approximate capacities pertain to the average number of days that the aggregation of all mines operated per year. These data were used as proxy variables and it was hypothesized that the greater the number of days that these mines operated per year, the higher would be the utilization of capacity and hence the higher will be the labor productivity. Conversely, the smaller the number of days that the mines operated (e.g., due to strikes, lockouts or stockpiling of coal because of inadequate demand), the lower will be the productivity.
4.6 Investment in human capital If coal mines employ increasing proportions of skilled labor, the human investment
embodied in the labor skills could enhance productivity. We defined skilled laborers as those workers who had passed miner certification/qualification tests set by the Mine Health and Safety Administration or some form of apprenticeship program. Skilled labor in underground mines included such workers as mining machine operators, electricians, roof bolters; in surface mines, they included power shovel and dragline operators, electricians, and bull dozer opera- tors. The required data for these classifications were developed from wage settlement reports prepared by the Bituminous Coal Operators Association for the years in which wage contracts were signed and were interpolated for other years. The percentage of skilled labor in the total labor force was used in the analysis to explain labor productivity positively.
Semi-skilled or unskilled labor was defined to be the workers who had only on-the-job training and mostly included helpers. Examples in underground mines included mining machine operators’ and electricians’ helpers; in surface mines, they were shovel and dragline operators’ helpers and oilers and greasers. Some of these workers are likely to be less productive because their performance is limited by union agreements or by mine health and safety regulations.
4.1 Fatal and non-fatal accidents There is no clear-cut theory of the nature of relationships between productivity and
accidents. Neumann and Nelson believe that the relationship should be direct and positive because “increase in output lead to greater demand for workers and to more accidents”.‘3 In other words, the enactment of mine safety legislation resulted in diversion of resources from production of coal to production of safety, thereby lowering output as well as injury rates. On the other hand, the relationship can also be negative because the occurrences of these accidents can bring about disruption and discontinuity in production and hence could reduce the productivity. We will examine these hypotheses by normalizing the number of fatal and non-fatal accidents by dividing them by millions of worker-hours for the respective years.”
4.8 Strip ratio This variable is expected to bear a negative relationship to the productivity because the
higher the strip ratio, and hence the overburden to be cleared prior to excavating the seams, the lower should be the productivity.
778 H. A. G. hW4Nl
4.9 Mine health and safety act and state surface mines regulations The enactment and enforcement of the U.S. Coal Mine Health and Safety Act of 1%9
required mine owners to spend considerable amounts for mine safety equipment, professional manpower and for contributions to miners’ health and welfare funds. Labor productivity was thereby reduced after 1969. Similarly, the passage and implementation of surface mining reclamation laws, passed by various state governments in the early seventies, resulted in reduced productivity since 1974. These impacts will be examined by using a dummy variable for a regression equation with zero to 1969 and one thereafter for the underground mines and with zero to 1973 and one thereafter for surface mines. This variable should be negative and significant.
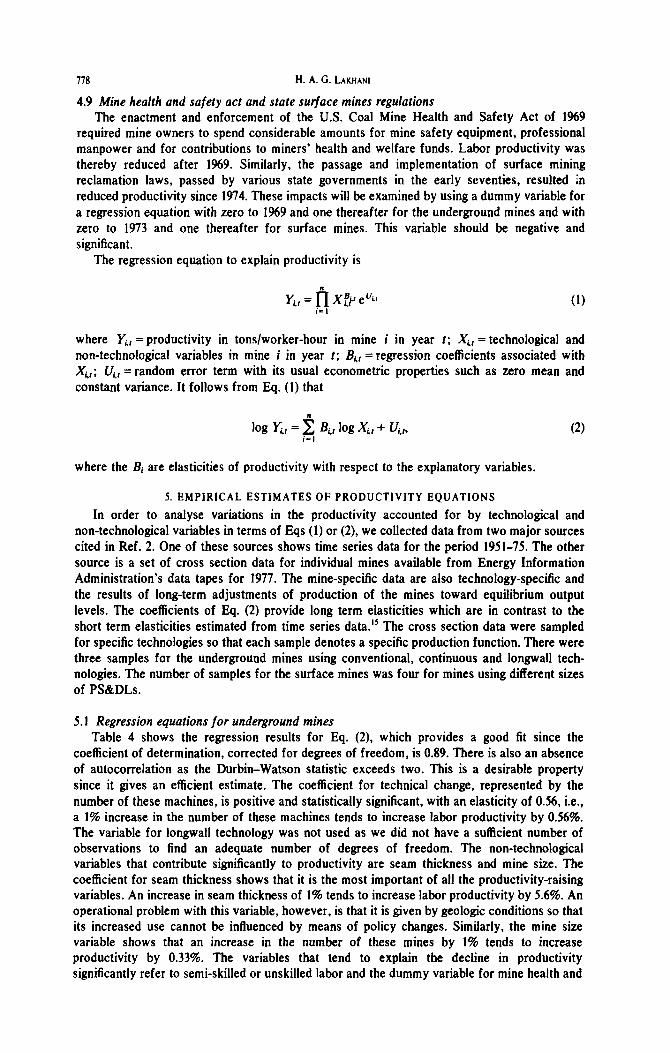
The regression equation to explain productivity is
yL, = fi X$.t e”Ll i-l
where Y,, = productivity in tons/worker-hour in mine i in year 1; Xi, = technological and
(1)
non-technological variables in mine i in year t; II,, = regression coefficients associated with Xi,; V,, = random error term with its usual econometric properties such as zero mean and constant variance. It follows from Eq. (1) that
log Yit = 2 Bit log Xi, + Ui,, i-l
where the Bi are elasticities of productivity with respect to the explanatory variables.
S.EMPIRICAL ESTIMATES OFPRODUCTIVITY EQUATIONS
In order to analyse variations in the productivity accounted for by technological and non-technological variables in terms of Eqs (1) or (2), we collected data from two major sources cited in Ref. 2. One of these sources shows time series data for the period 1951-75. The other source is a set of cross section data for individual mines available from Energy Information Administration’s data tapes for 1977. The mine-specific data are also technology-specific and the results of long-term adjustments of production of the mines toward equilibrium output levels. The coefficients of Eq. (2) provide long term elasticities which are in contrast to the short term elasticities estimated from time series data.15 The cross section data were sampled for specific technologies so that each sample denotes a specific production function. There were three samples for the underground mines using conventional, continuous and longwall tech- nologies. The number of samples for the surface mines was four for mines using different sizes of PSBiDLs.
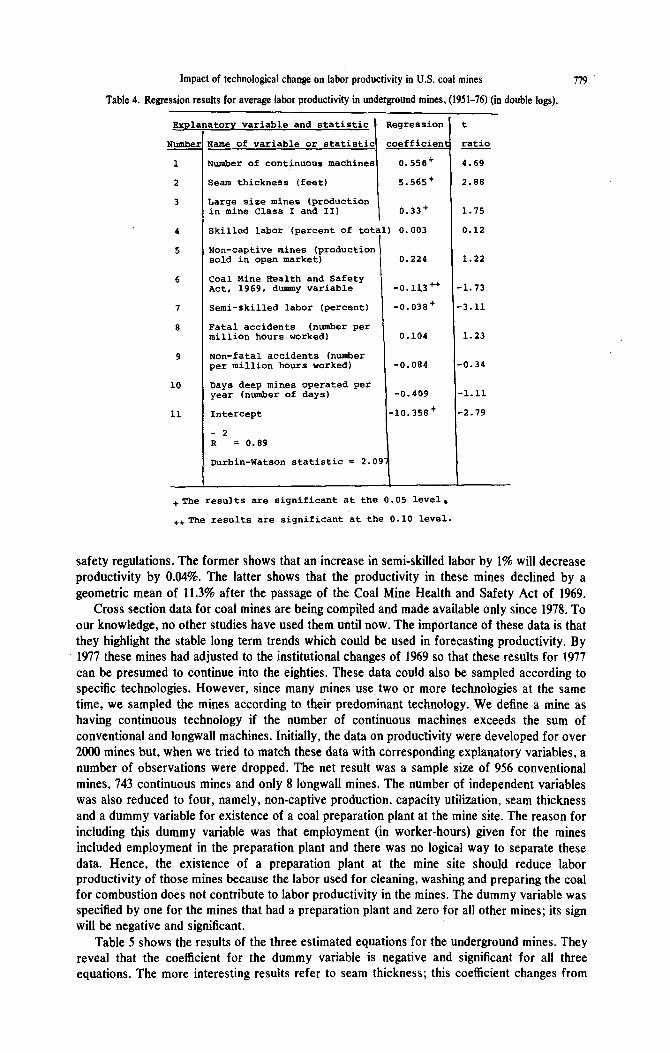
5.1 Regression equations for underground mines Table 4 shows the regression results for Eq. (2), which provides a good fit since the
coefficient of determination, corrected for degrees of freedom, is 0.89. There is also an absence of autocorrelation as the Durbin-Watson statistic exceeds two. This is a desirable property since it gives an efficient estimate. The coefficient for technical change, represented by the number of these machines, is positive and statistically significant, with an elasticity of 0.56, i.e., a 1% increase in the number of these machines tends to increase labor productivity by 0.56%. The variable for longwall technology was not used as we did not have a sufficient number of observations to find an adequate number of degrees of freedom. The non-technological variables that contribute significantly to productivity are seam thickness and mine size. The coefficient for seam thickness shows that it is the most important of all the productivity-raising variables. An increase in seam thickness of 1% tends to increase labor productivity by 5.6%. An operational problem with this variable, however, is that it is given by geologic conditions so that its increased use cannot be influenced by means of policy changes. Similarly, the mine size variable shows that an increase in the number of these mines by 1% tends to increase productivity by 0.33%. The variables that tend to explain the decline in productivity significantly refer to semi-skilled or unskilled labor and the dummy variable for mine health and
Impact of technological change on labor productivity in U.S. coal mines I?9
Table 4. Regression results for average labor productivity in underground mines, (1951-76) (in double logs).
story variable and statistic Regression t
Yame of variable or statistic coefficienl ratio
!wm!z-er of continuous machines 0.55e+ 4.69
Seam thickness (feet) 5.565+ 2.88
Large size mines (production in mine Class I and II) 0.33+ 1.75
Skilled labor (percent of tot;11 0.003 0.12
1.22
I -1.73
-3.11
Expla
Numbel
1
2
3
4
5
6
7
8
9
10
11
Non-captive mines (production sold in open market) 0.224
coal Mine Health and Safety Act, 1969, dummy variable
Semi-skilled labor (percent)
-0.113++
-0.038+
Fatal accidents (number per million hours worked) 0.104 1.23
Non-fatal accidents (number per million hours worked)
Days deep mines operated per year (number of days)
-0.084
Intercept
-2 R = 0.89
Durbin-Watson statistic = 2-O!
-0.409
-10.358+
-0.34
-1.11
-2.79
37
i
+The results are significant at the 0.05 level.
++The results are significant at the 0.10 level.
safety regulations. The former shows that an increase in semi-skilled labor by 1% will decrease productivity by 0.04%. The latter shows that the productivity in these mines declined by a geometric mean of 11.3% after the passage of the Coal Mine Health and Safety Act of 1969.
Cross section data for coal mines are being compiled and made available only since 1978. To our knowledge, no other studies have used them until now. The importance of these data is that they highlight the stable long term trends which could be used in forecasting productivity. By 1977 these mines had adjusted to the institutional changes of 1969 so that these results for 1977 can be presumed to continue into the eighties. These data could also be sampled according to specific technologies. However, since many mines use two or more technologies at the same time, we sampled the mines according to their predominant technology. We define a mine as having continuous technology if the number of continuous machines exceeds the sum of conventional and longwall machines. Initially, the data on productivity were developed for over 2CKJO mines but, when we tried to match these data with corresponding explanatory variables, a number of observations were dropped. The net result was a sample size of 956 conventional mines, 743 continuous mines and only 8 longwall mines. The number of independent variables was also reduced to four, namely, non-captive production, capacity utilization, seam thickness and a dummy variable for existence of a coal preparation plant at the mine site. The reason for including this dummy variable was that employment (in worker-hours) given for the mines included employment in the preparation plant and there was no logical way to separate these data. Hence, the existence of a preparation plant at the mine site should reduce labor productivity of those mines because the labor used for cleaning, washing and preparing the coal for combustion does not contribute to labor productivity in the mines. The dummy variable was specified by one for the mines that had a preparation plant and zero for all other mines; its sign will be negative and significant.
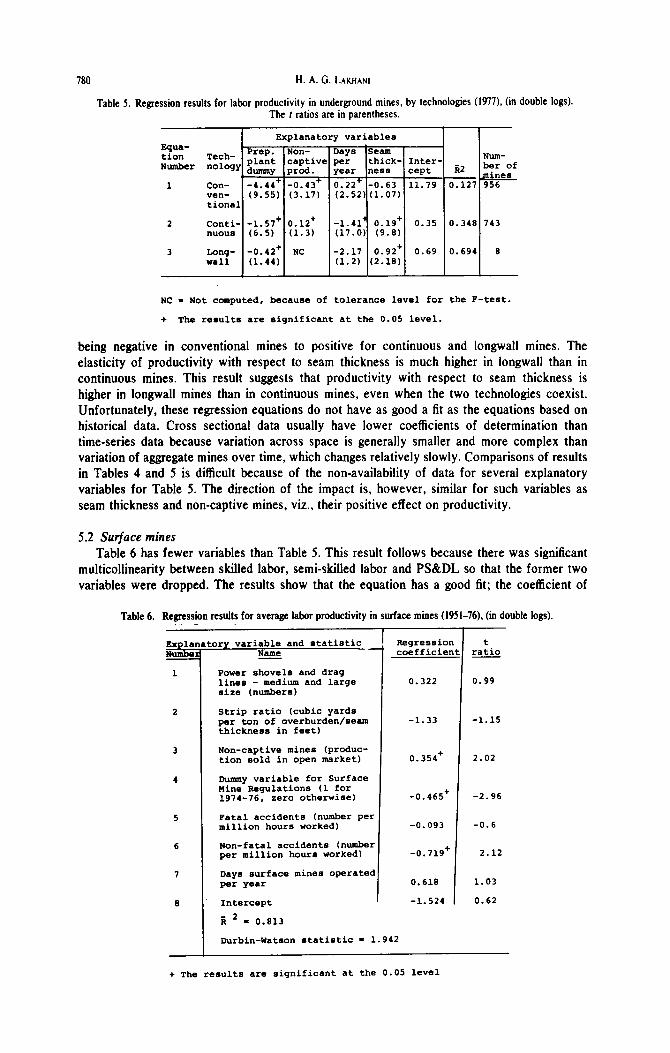
Table 5 shows the results of the three estimated equations for the underground mines. They reveal that the coefficient for the dummy variable is negative and significant for all three equations. The more interesting results refer to seam thickness; this coefficient changes from
780 H. A. G. LAKHANI
Table 5. Regression results for labor productivity in underground mines, by technologies (1977), (in double logs). The f ratios are in parentheses.
I Explanatory variables I Equa- tion Number
1
P . Non- ;',;ky ,:x:t
Days SeaIll captive per thick-
durmny prod. year ness
con- -4.44+ -0.43+ 0.22+ -0.63 ven- (9.55) (3.171 (2.52) (1.071 tional
Conti- -1.57+ 0.12+ -1.41' 0.19' nuous (6.51 ,(1.3) (17.01 (9.8)
Long- -0.42+ NC -2.17 0.92' wall (1.40 (1.21 (2.19)
0.35 0.348 743
--L-L 0.69 0.694 8
NC - Not computed, because of tolerance level for the F-test.
+ The results are significant at the 0.05 level.
being negative in conventional mines to positive for continuous and longwall mines. The elasticity of productivity with respect to seam thickness is much higher in longwall than in continuous mines. This result suggests that productivity with respect to seam thickness is higher in longwall mines than in continuous mines, even when the two technologies coexist. Unfortunately, these regression equations do not have as good a fit as the equations based on historical data. Cross sectional data usually have lower coefficients of determination than time-series data because variation across space is generally smaller and more complex than variation of aggregate mines over time, which changes relatively slowly. Comparisons of results in Tables 4 and 5 is difficult because of the non-availability of data for several explanatory variables for Table 5. The direction of the impact is, however, similar for such variables as seam thickness and non-captive mines, viz., their positive effect on productivity.
5.2 Surface mines Table 6 has fewer variables than Table 5. This result follows because there was significant
multicollinearity between skilled labor, semi-skilled labor and PSLDL so that the former two variables were dropped. The results show that the equation has a good fit; the coefficient of
Table 6. Regression results for average labor productivity in surface mines (1951-76), (in double logs).
rory variable and statistic Name
Power shovels and drag lines - medium and large sire (numbers1
Strip ratio (cubic yards per ton of overburden/seam thickness in feet)
Non-captive mines (ProdUC- tion sold in open market)
~uamny variable for Surface Mine Regulations (1 for 1974-76, zero otherwise)
Fatal accidents (number Per million hours worked)
Non-fatal accidents (number per million hours worked)
Days surface mines operated per year
Intercept
ii2 = 0.813
T I
Durbin-Watson statistic - 1.942
Regressiol coefficie:
t ratio
0.322 0.99
-1.33 -1.15
0.354+ 2.02
-0.465+ -2.96
-0.093 -0.6
-0.719+ 2.12
0.618 1.03
-1.524 0.62
-r
+ The results are significant at the 0.05 level
Impact of technological change on labor productivity in U.S. coal mines 781
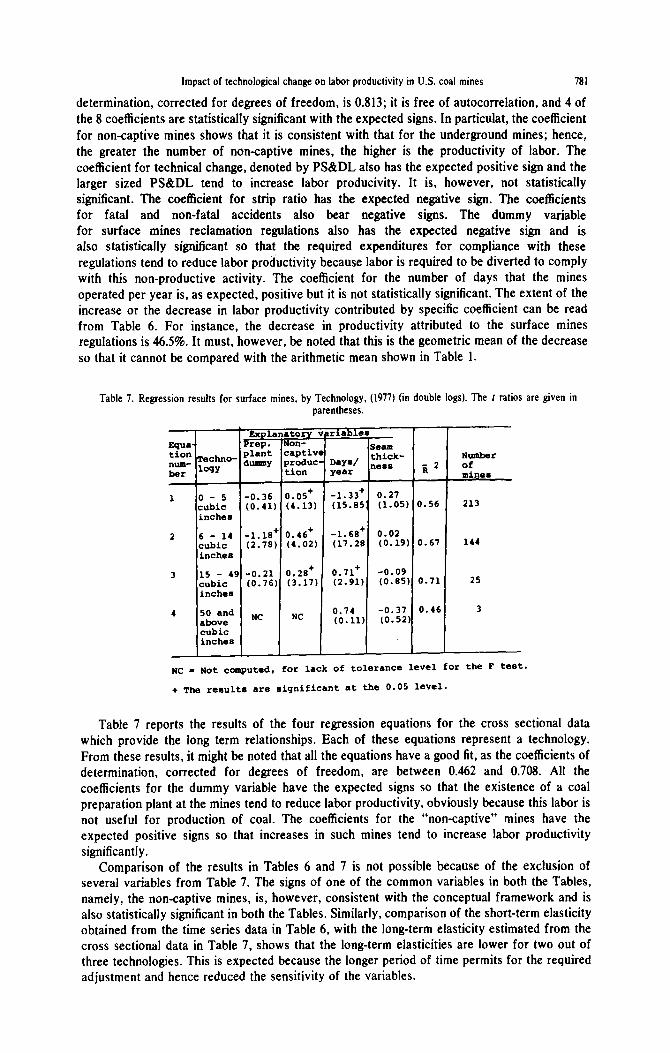
determination, corrected for degrees of freedom, is 0.813; it is free of autocorrelation, and 4 of the 8 coefficients are statistically significant with the expected signs. In particulat, the coefficient for non-captive mines shows that it is consistent with that for the underground mines; hence, the greater the number of non-captive mines, the higher is the productivity of labor. The coefficient for technical change, denoted by PS&DL also has the expected positive sign and the larger sized PSLDL tend to increase labor producivity. It is, however, not statistically significant. The coefficient for strip ratio has the expected negative sign. The coefficients for fatal and non-fatal accidents also bear negative signs. The dummy variable for surface mines reclamation regulations also has the expected negative sign and is also statistically significant so that the required expenditures for compliance with these regulations tend to reduce labor productivity because labor is required to be diverted to comply with this non-productive activity. The coefficient for the number of days that the mines operated per year is, as expected, positive but it is not statistically significant. The extent of the increase or the decrease in labor productivity contributed by specific coefficient can be read from Table 6. For instance, the decrease in productivity attributed to the surface mines regulations is 46.5%. It must, however, be noted that this is the geometric mean of the decrease so that it cannot be compared with the arithmetic mean shown in Table 1.
Table 7. Regression results for surface mines, by Technology, (1977) (in double logs). The 1 ratios are given in parentheses.
1 o-5 -0.36 cubic (0.41 inches
2 6 - 14 -1.18 cubic (2.78 inches
3 15 - 49 -0.21 cubic (0.76 inches
4 50 and above
NC
cubic inches
Ei -I
< 1 1
,
)
+ )
1
story vpriables Son- captive seam
thick- ?roduc- Dmym/ nemm tfon year ii2
0.05+ -1.33+ 0.27 (4.13) (15.85' (1.05) 0.56
0.46+ -1.68+ 0.02 (4.02) (17.28 (0.19) 0.67
0.28+ 0.71+ -0.09 (3.17) (2.91) (0.85) 0.71
Number of minem
213
144
25
3
NC - Not computed, for lack of tolerance level for the F teat.
+ The remultm are significant at the 0.05 level.
Table 7 reports the results of the four regression equations for the cross sectional data which provide the long term relationships. Each of these equations represent a technology. From these results, it might be noted that all the equations have a good fit, as the coefficients of determination, corrected for degrees of freedom, are between 0.462 and 0.708. All the coefficients for the dummy variable have the expected signs so that the existence of a coal preparation plant at the mines tend to reduce labor productivity, obviously because this labor is not useful for production of coal. The coefficients for the “non-captive” mines have the expected positive signs so that increases in such mines tend to increase labor productivity significantly.
Comparison of the results in Tables 6 and 7 is not possible because of the exclusion of several variables from Table 7. The signs of one of the common variables in both the Tables, namely, the non-captive mines, is, however, consistent with the conceptual framework and is also statistically significant in both the Tables. Similarly, comparison of the short-term elasticity obtained from the time series data in Table 6, with the long-term elasticity estimated from the cross sectional data in Table 7, shows that the long-term elasticities are lower for two out of three technologies. This is expected because the longer period of time permits for the required adjustment and hence reduced the sensitivity of the variables.
182 H. A. G. LAKHANI
REFERENCES
1. H. Lakhani, Energy 5,217 (1980). 2. Bureau of Mines, hfineruls Year Books; Bureau of Labor Statistics, Monthly Labor Review; and Energy Information
Administration, Energy D&J Repot?-Cool: BiIuminous and Lignife in 1976. Document Number 0118/1(78). 3. A. A. Walters, An Infroducfion fo Economefrics. 2nd Edn, p. 334. Macmillan, London (1973). 4. 1. W. Straton, Min. Gong. 1. 20 (1977). 5. National Coal Association. Coal Facls, 1977-78, Washington, D.C. (1978). 6. R. A. Schmidt, Coal in America: An Encyclopedia of Reserves, Production and Use, p. I68 McGraw Hill, New York
(1978): W. S. Peirce, “Factors Affecting Responsiveness to Technological Innovations in Coal Mining”, Work&paper No. 54. D. 5. June 1974, Case Western Reserve University, Universitv Circle. Cleveland. OH 44106. Research Prouram . in Industrial Economics.
7. “Industrial Production: Longwalhng Gives Productivity a Boost”: Business Week (1978). 8. P. Connerton, “Impact of Mine Health and Safety Act, l%9, on Productivity”, p. 62, unpublished Ph.D., Economics
Dissertation, Harvard University, Cambridge, Mass. 1978. 9. American Economic Association, Readings in Infernotional Trade 7keory, Stopler-Samuelson Theorem.
10. Ont. Cif. 7. I I. opt. cti. 7. 12. J. Baker, “Labor Productivity in Bituminous Coal and Lignite Mining”, Oak Ridge Associated Universities. Oak Ridge,
Tennessee, Draft (1979); C. L. Christienson and W. H. Andrews. 1. Econ. Business, Spring 1974; Anthony Lawrence, “Estimation of an Aggregate Industry Production Function Using the Capacity Distribution of Micro Units: Mid- western Coal”, Elect& Power Research Institute, Palo Alto, California (June 1977); Alan Halvorson, “Productivity in Underground Coal Mines”, partial draft of a Ph.D., Economics, Dissertation submitted to George Washington University, Nov. 1978; A. S. Herman, Mon. Labor Rev., Feb. 1977; Editorial, “The Yardstick of Productivity: Is It High Tons per Manday or Is It Low Cost Per Ton. v”, Coal Age, July 1975, p. 93; E. Cohn et al.. The Bifuminous Coal Industry: A Forecasf Pennsylvania State University, University Park (1975).
13. G. R. Neumann and J. P. Nelson. “Regulation and Safety: The Effect of Coal Mine Health and Safety Act of 1969” (Unpublished Paper), p. 28. Pennsylvania State University, University Park, Pennsylvania (1979).
14. Opf. Cif 2. IS. N. Nerlove, 1. Farm Econ. 40.301 (1958).
Copyright © 2022 FDOKUMEN