impact of hazardous alcohol consumption on family ...
135
IMPACT OF HAZARDOUS ALCOHOL CONSUMPTION ON FAMILY FUNCTIONING IN RURAL SOUTH INDIA- A CROSS SECTIONAL STUDY DISSERTATION SUBMITTED IN PARTIAL FULFILLMENT OF THE REQUIREMENT OF THE TAMILNADU DR. M.G.R MEDICAL UNIVERSITY, CHENNAI, FOR THE DEGREE OF MD BRANCH-XV (COMMUNITY MEDICINE) EXAMINATION TO BE HELD IN APRIL, 2017
-
Upload
khangminh22 -
Category
Documents
-
view
3 -
download
0
Transcript of impact of hazardous alcohol consumption on family ...

IMPACT OF HAZARDOUS ALCOHOL
CONSUMPTION ON FAMILY
FUNCTIONING IN RURAL SOUTH
INDIA- A CROSS SECTIONAL STUDY
DISSERTATION SUBMITTED IN PARTIAL FULFILLMENT OF
THE REQUIREMENT OF THE TAMILNADU DR. M.G.R
MEDICAL UNIVERSITY, CHENNAI, FOR THE DEGREE OF MD
BRANCH-XV (COMMUNITY MEDICINE) EXAMINATION TO BE
HELD IN APRIL, 2017

ORIGINALITY CERTIFICATE

CERTIFICATE
This is to certify that “ IMPACT OF HAZARDOUS DRINKING
ON FAMILY FUNCTIONING IN RURAL SOUTH INDIA - A
CROSS SECTIONAL STUDY” is a bona fide work of Dr. Martina
Shalini A J in partial fulfillment of the requirements for the M. D
Community Medicine examination (Branch XV) of the Tamilnadu
Dr. M. G. R. Medical University, Chennai, to be held in April,
2017.
Principal:
Guide Head of the Department
Dr. Shantidani Minz Dr. Jasmin Helan Prasad
Professor Professor and Head
Department of Community Health Department of Community Health
Christian Medical College, Vellore Christian Medical College, Vellore

DECLARATION
I hereby declare that the investigations that form the subject matter for the thesis
entitled “IMPACT OF HAZARDOUS ALCOHOL CONSUMPTION ON FAMILY
FUNCTIONING IN RURAL SOUTH INDIA- A CROSS SECTIONAL STUDY” was carried out
by me during my term as a post graduate student in the Department of Community
Health, Christian Medical College, Vellore. This thesis has not been submitted in part or
full to any other university.
Dr. Martina Shalini A J,
Department of Community Health,
Christian Medical College,
Vellore – 632 002

ACKNOWLEDGEMENTS
I am very grateful to
My guide Dr. Shantidani Minz, without whose patience and constant motivation, this
work would not be possible.
My co-guide Dr. Anuradha Rose for invaluable help in completing this thesis.
The Head of the Department Dr. Jasmine, for putting me on the right path and for her
advice and assistance in keeping my progress on schedule.
My professor Dr. Kurien George, for his valuable and constructive suggestions during
the planning and analysis of this research work.
All Professors of our department , for their guidance and suggestions.
Mr. Vijayakumar, Mr. Dhinakaran, Mr. Senthil , Mr. Saravanan for their help in
collecting data.
The health aides and PTCHWs who accompanied and aided in data collection
Mr. Saravanakumar for constructive recommendations during analysis.
All staff in CHAD for their support
All my batchmates and my family for their support and encouragement

ACRONYMS
APC - Adult per capita consumption of pure alcohol
APGAR - Adaptability, Partnership, Growth, Affection, and Resolve
AUDIT - Alcohol Use Disorders Identification Test
CHAD - Community Health And Development
CMC - Christian Medical College
DALY - Disability Adjusted Life Years
GDP - Gross Domestic Product
ICD - International Classification of Diseases
IMFL - Indian Made Foreign Liquor
IRB - Institutional Review Board
NFHS - National Family Health Survey
PTCHW- Part Time Community Health Worker
QOL - Quality Of Life
TASMAC- Tamilnadu State Marketing Corporation
WHO - World Health Organisation
WHO-QOL BREF – World Health Organisation Quality Of Life Brief form

LIST OF TABLES
Table 3 1: Common alcoholic beverages in india ……………… ……………………7
Table 3 2: Cutoff scores for hazardous drinking and dependence…..………………..16
Table 3 3: Domains of the AUDIT score…………………………..…………………16
Table 3 4: Classification of family crises………………………...…………………...26
Table 4 1: Profile of CHAD peripheral team…………………………………………32
Table 5 1: Baseline characteristics ……………………………………………………42
Table 5 2: Categories of unskilled work…………………...…………………………43
Table 5 3: Marital status of study population…………...……………………………43
Table 5 4: Prevalence of hazardous drinking………...………………………………44
Table 5 5: Drinking patterns across age categories……………...…………………...46
Table 5 6: Sociodemographic characteristics of phase 2 respondents………………..46
Table 5 7: Family and Marital details……………...…………………………………49
Table 5 8: Comparison of baseline variables…………………………………………50
Table 5 9:Pattern of alcohol drinking and spouse’s perception of family functioning 54
Table 5 10:Pattern of alcohol drinking and domestic violence…………………..…...55
Table 5 11:Alcohol drinking pattern and spouse’s Quality of life……………………56
Table 5 12:Alcohol drinking pattern and physical domain of Quality of life………...57
Table 5 13:Alcohol drinking pattern and psychological domain of Quality of life…..57
Table 5 14:Alcohol drinking pattern and social domain of Quality of life………...…58
Table 5 15:Alcohol drinking pattern and environmental domain of quality of life…..58
Table 5 16:Pattern of alcohol drinking and presence of Common Mental health
Disorders in spouse…………………………………………………………………...59
Table 5 17:Determinants of Perception of Family Functioning………………………61

Table 5 18 Determinants of domestic violence……………………………………….64
Table 5 19: Determinants of quality of life…………………………………………...67
Table 5 20:Domestic violence and family functioning…………..…………………...68
Table 5 21:Domestic violence and quality of life…………………………………….69
Table 5 22:Logistic regression model for factors associated with perception of family
functioning…………………………………………………………………………….70
Table 5 23: Logistic regression model for factors associated with domestic violence.71
Table 5 24:Logistic regression model for factors associated with quality of life….....72

LIST OF FIGURES
Figure 3 1: Relationship between individual and family health………………………23
Figure 4 1: Flowchart for phase 1 sampling method………………………………….36
Figure 4 2: Flowchart for phase 2 sampling method………………………………….37
Figure 4 3: Flowchart of study procedure…………………………………………….39
Figure 5 1: Classification of hazardous drinkers. ……………………………………..45
Figure 5 2: Comparison of income among the three drinking pattern groups. ……….53
Figure 5 3: Loan in the family and perception of family functioning………………...62
Figure 5 4:Drinking pattern and perception of family functioning…………………...63
Figure 5 5: Drinking pattern and domestic violence………………………………….65
Figure 5 6: Socioeconomic status and domestic violence…………………………….66
Figure 5 7: Type of family and domestic violence……………………………………66
Figure 5 8: Relationship between hazardous drinking and measures of family
functioning……………………………………………………………………………73

CONTENTS
1 INTRODUCTION AND JUSTIFICATION……………………….1
2 AIM AND OBJECTIVES………………………………………….3
3 LITERATURE REVIEW…………………………………………..4
3.1ALCOHOL AS A PUBLIC HEALTH PROBLEM…………….…4
3.1.1 Prevalence and patterns of alcohol use………………………4
3.1.2 Alcohol related problems…………………………….............9
3.1.3 Definitions…………………………………..........................14
3.1.4 Screening and diagnosing alcohol use disorders…………....15
3.2Alcoholism and family……………………………………………19
3.2.1 The family concept……………………………………….....19
3.2.2 Definitions…………………………………………………..19
3.2.3 Types of families……………………………………………20
3.2.4 Family functioning………………………………………….22
3.2.5 Family life cycle…………………………………………….24
3.2.6 Determinants of family functioning ………………………..26
3.2.7 Measurement of family functioning………………………...27
3.2.8 Impact of alcohol on the family ……………………………28
4 MATERIALS AND METHODS…...…………………………….31
5 RESULTS…………………………………………………………42
5.1 Quantitative analysis……...………………………………………..42

5.2 Qualitative analysis………………………………………………...74
6 DISCUSSION……………………………………………………...76
7 CONCLUSIONS…………………………………………………...81
8 RECOMMENDATIONS…………………………………………..82
9 LIMITATIONS…………………………………………………….83
10 BIBLIOGRPHY……………………………………………………84
11 ANNEXURES
Annexure I- AUDIT questionnaire and proforma
Annexure II-Proforma for Phase II
Annexure III- Family APGAR Questionnaire
Annexure IV-WHOQOL-BREF Questionnaire
Annexure V- GHQ-12 Questionnaire
Annexure VI- HITS Questionnaire
Annexure VII- Information sheet for Phase I- English
Annexure VIII- Information sheet for Phase I- Tamil
Annexure IX- Information sheet for Phase II- English
Annexure X- Information sheet for Phase II- Tamil
Annexure XI- Written informed consent – English
Annexure XII- Written informed consent- Tamil
Annexure XIII- IRB Clearance

1
1 INTRODUCTION AND JUSTIFICATION
Excessive alcohol consumption is a significant cause for morbidity and mortality
throughout the world. However various social and cultural attitudes play a role in the
burden of alcohol abuse and its ill-effects. According to the WHO global status report
on alcohol and health, India had annual adult per capita consumption (APC) of 2.59
litres (litres of pure alcohol consumed by every person aged 15 years or older) (1).
Studies in India show that the prevalence of alcohol use varies based on the social
and environmental factors.
Impact of alcoholism
Unlike other substances of abuse, alcohol is often accepted in the community as a
recreation and a medium for social bonding. In some religions, alcoholic beverages
are a part of festivities, while some religions prohibit alcohol use altogether. For
example, in north India “bhang” (preparation of marijuana leaves) is an important
accompaniment in Holi celebrations. These practices are important as the NFHS-3
found that alcohol and cannabis were the commonest substances of initiation, and act
as gateway drugs for abuse of other substances and injectables (2).
More than 60 years ago the Bhore committee in its report suggested that the revenue
from alcohol sales should be diverted to efforts dedicated to reduce alcohol
consumption in the community stating that “there was little economic merit in a
system of taxation which raises any considerable part of the public revenue from the

2
sale of alcohol” while ignoring the considerable damage caused by excessive
consumption (3). But in spite of several studies identifying alcohol consumption as
the cause of significant mortality and morbidity, very few checks are in place to
monitor and reduce alcohol consumption in the community. Existing laws for sale of
alcohol including restriction of sales to minors, sale timings and penalty for drunken
driving remain on paper with inadequate enforcement in practice. Like other
substances of abuse, alcohol is a cause for mortality, morbidity and significant
economic loss. It is directly through loss of productivity and indirectly through the
damage caused by accidents and violence aggravated by its consumption.
The immediate family bears the brunt of financial and psychological stress due to
alcoholism. However, despite several studies on the effects of alcoholism, very few
studies have tried to assess the dynamics of the entire family and how the severity of
alcoholism affects family functioning as a unit. This study aims to bridge this gap in
knowledge. By understanding the impact of hazardous alcohol consumption on
spouses and children, we aim to provide the basis for developing interventions and
strategies to help affected families and also address family issues in programmes
aimed at alcoholics or hazardous drinkers.

3
2 AIM AND OBJECTIVES
Aim
To assess the impact of hazardous drinking on family functioning.
Objectives
1) To estimate the prevalence of hazardous drinking among married men in the
25-60 age group in Kaniyambadi block.
2) To study the effect of hazardous alcohol consumption on family dysfunction.

4
3 LITERATURE REVIEW
3.1 ALCOHOL AS A PUBLIC HEALTH PROBLEM
Substance use disorders, especially alcohol use disorder, affect the individual and
society in many ways. The direct link between alcohol abuse and a range of physical
health problems like liver diseases, cardiovascular diseases, some cancers and a
range of behavioral disorders, is well documented. Alcohol abuse is currently linked
to over 200 diseases and injuries (4). In 2012, around 5.1% of the global burden of
disease was estimated to be due to alcohol use disorders (1). Morbidity and mortality
risks due to alcohol were higher in lower income countries, compared to higher
income countries. The above estimate communicates only part of the impact of
harmful use of alcohol.
Harmful use of alcohol also creates considerable negative health and social
consequences, for people other than the drinker. These effects are difficult to measure
and hence are not included in estimates of impact of alcohol use disorders (5). While
the deleterious health impacts of hazardous drinking are well known, the significant
social and economic consequences are not sufficiently studied.
3.1.1 Prevalence and patterns of alcohol use.
3.1.1.1 World
Alcohol is, both the most consumed beverage in the world and the most abused
substance. The amount of alcohol consumed per adult (more than 15 years of age),

5
is at 6.13 litres of pure alcohol (1). To give context to that data, 1 litre of pure alcohol
is equivalent to 20 litres of beer, 8.33 litres of wine or 2.5 litres of spirits (6). This is
an estimate of both recorded and unrecorded alcohol consumption in the world. Out
of this, 28.6% was unrecorded alcohol consumption. The proportion of unrecorded
alcohol consumption was higher in low income countries, posing the additional
health risks (7). Since 1990 the amount of alcohol consumed in the South east Asian
region has increased by 68%(8).
The type of alcoholic beverages consumed also differs from country to country. The
most common beverages are beer, wine and spirits. Beer which has the least alcohol
content is also one of the oldest beverages. It is produced by fermenting cereals, most
commonly malted barley, while wine is produced by fermenting grapes. Spirits are
distilled alcoholic beverages which have an alcohol content by volume of at least
20%. This includes drinks like vodka, whiskey, brandy, gin, tequila etc. (9).
Beer is the most consumed alcoholic beverage in the region of the Americas
accounting for 54.7% of Adult per capita consumption(APC). The most common
drinks in the European region were beer and wine. In contrast, almost 71% of the
APC in the SEAR region was in the form of spirits (distilled drinks) (1).
3.1.1.2 India
The amount of alcohol consumed in India has been steadily increasing (10).
According to the National Household Survey of Drug use, 21% of adult males in
India consume alcohol (11). However, other studies reveal that the proportion varies
in different population groups. A study done to estimate the prevalence of alcohol

6
consumption among tea plantation workers in Assam, found that 69.3% of males and
54% of females used alcohol (12). A study on industrial workers in Goa, revealed
that 68.6% of that population consumed alcohol. One third of those who consumed
alcohol in this population were hazardous drinkers (13). A similar study in
Pondicherry estimated prevalence of alcohol consumption at 59.6%(14).
A study in Karnataka which only included men in the age group 16-49 years, found
alcohol usage to be around 38.1%, and more than half of those who used alcohol,
were problem drinkers (15). A study in Kolkata slum area reported that while 65%
of the respondents were current alcohol consumers only 8% of the current drinkers
had a harmful or hazardous drinking pattern (16). A study in the Bangalore which
examined alcohol in the context of neighborhood found slum and rural areas had
higher prevalence of frequent heavy drinkers. However infrequent heavy drinkers
were more common in urban areas (17).
The prohibition movement instituted during Independence, survived till the mid-
1960s, when it was reverted by several states (18). Gujarat was the only state to retain
prohibition. There was a second wave of prohibition laws, enacted in the 1990s.
However, these were soon rolled back as governments lost nearly 20-25% of alcohol
related revenue, and an increase in the sale of illicit liquor (19). Recently Kerala and
Bihar have initiated prohibition measures. The concept of prohibition remains
enshrined in the Indian Constitution, with Article 47 declaring that the State should
endeavor “to bring about the prohibition of intoxicating drugs which are injurious to
health” (20). However, alcohol sales are still a major source of revenue in several
states including Tamil Nadu (21).

7
Table 3-1: Common alcoholic beverages in India (22)
3.1.1.3 Tamil Nadu
The prevalence of alcohol consumption varies within the state. A study done in
Villupuram district in 2012, shows a prevalence of alcohol consumption of 9.4% and
a hazardous drinking prevalence of 3.7% (23). A previous study done in rural region
in Vellore, in 2008 shows that the prevalence of alcohol consumption was 46.7 %,
with hazardous drinking at 14.2% (24). A 2011 study conducted in an urban slum in
Vellore, showed the prevalence of alcohol consumption was 46.1%, while the
prevalence of hazardous drinking was 31.4%(25).
Alcoholic
beverage
Source Percentage of
alcohol by
volume
Standard drink
Beer Cereals 3-4 300-400 mL
Wine Grapes 5-13 100-200mL
Fortified wine Grapes 14-20 60-90mL
Distilled spirits Fruits, cereals, sugarcane 40 30 mL
Arrack Coconut flowers,
sugarcane
33 40 mL
Toddy Palm sap, coconut flowers 5-10 200 mL
IMFL Molasses, grain 42 30 mL

8
The most consumed alcoholic beverage in urban areas is Indian made foreign liquor,
compared to rural areas where country liquor used to be the preferred drink (18). This
trend has changed in recent years with the easy availability of Indian Made Foreign
Liquor(IMFL), through the government run TASMAC retail shops. This change has
also reduced the consumption of illicit and illegal liquor, but has increased the overall
consumption of alcohol (26).
Tamil Nadu State Marketing Corporation (TASMAC)
Tamil Nadu was one of the earliest states to enforce prohibition as early as 1937.
Since then, the prohibition has been lifted intermittently depending on government
policies. In 1981, two corporations were formed to regulate alcohol production and
sales in the state: The Tamil Nadu Spirit Corporation, which was responsible for the
production of alcoholic beverages and the Tamil Nadu State Marketing Corporation,
which was responsible for regulating sales of alcohol in the state. While the Tamil
Nadu Spirit Corporation was closed down within a few years, TASMAC took over
the entire wholesale distribution of alcohol in the state. After multiple incidents
involving methanol consumption which resulted in manifold casualties, the Tamil
Nadu State Marketing Corporation took over control of all retail alcohol sales and
currently has monopoly over all legal alcohol sales in the state (27).
3.1.2 Alcohol related problems
Alcohol related problems are responsible for more than 4% of Disability Associated
Life Years lost, accounting for 69,375 DALYs a year (1). 38.8% of these are due to

9
neuropsychiatric conditions related to alcohol misuse. Alcohol related problems have
a wide range, and depend on a variety of factors, such as volume and pattern of
drinking.
For most diseases causally associated with alcohol, there is a dose response
relationship. In addition to the volume, the pattern of consumption also affects the
consequences of drinking (28). Injuries and cardiovascular morbidity appear to
depend more on the pattern of drinking. Heavy episodic drinking negates the benefit
of low risk drinking patterns on cardiovascular diseases. Other factors like economic
and cultural factors also determine the extent of harm caused by alcohol misuse.
3.1.2.1 Physical health consequences
Alcohol related problems are the eighth highest cause of mortality throughout the
world, and is estimated to be responsible for 25% of road accidents and 40 % of
accidents at work (29). Alcohol is also named a necessary cause in 30 ICD disease
codes and is a component cause in at least 200 disease codes (30).
a. Neuropsychiatric conditions
Alcohol use disorders are a major cause of alcohol related morbidity. These disorders
are chronic in nature, and the recovery is characterized by repeated cycles of periods
of abstinence and relapse (31). There is a need for vigilance by the patients and the

10
treating professionals to disrupt this vicious cycle of abstinence, relapse and
treatment. Several studies show that affective disorders, especially major depression,
are linked to alcohol dependence (32), (33). While both alcohol dependence and
major depression may be due to common social, genetic and environmental factors,
a few longitudinal studies demonstrate a causal link between alcohol dependence and
depression (34). However, the morbidity and mortality due to affective disorders are
not included in the alcohol attributable disease burden because of the complex causal
pathways (35).
b. Gastrointestinal diseases
Alcohol is a major cause in certain gastrointestinal system diseases like liver cirrhosis
and pancreatitis. There is an exponential increase in the risk of liver cirrhosis and
pancreatitis with higher levels of alcohol consumption (36), (37), (38).
c. Cancer
Alcohol acts as a carcinogen in the epidemiology of cancers of colorectum, larynx,
pharynx, oesophagus and oral cavity (39), (40). Higher quantities of alcohol
consumption are also implicated in the etiology of cancers of breast and liver (41),
(42).
d. Cardiovascular diseases
Alcohol is significantly linked to coronary artery disease. It adversely affects blood
supply to the heart, heart rate and also beat variability. Alcohol consumption also
increases risk of hypertension, atrial fibrillation and hemorrhagic stroke (43). Light

11
to moderate red wine consumption has been shown to have beneficial effects on
atherosclerotic processes, by inhibiting atherogenesis. Several components of red
wine, especially alcohol, resveratrol, and polyphenolic compounds, also decrease
oxidative stress (44). However, this beneficial effect disappears with higher alcohol
consumption (45).
e. Injuries
Both intentional and unintentional injuries are related to alcohol consumption and
hazardous drinking (46). Unintentional injuries due to road traffic accidents, work
place accidents etc., are related to hazardous drinking patterns. Estimates place
alcohol as being the cause for 20% of road accident related head injuries admitted in
hospitals (1). Intentional injuries due to violence and self-harm attempts are linked
to hazardous drinking patterns. Spouses of alcoholics also experience domestic
violence more often.
f. Others
Fetal alcohol spectrum disorder associated with maternal alcohol consumption
during pregnancy is characterized by distinctive facial features, intellectual and
growth retardation and behavioral disorders (47), (48). Alcohol is also known to
affect the bone mineral density and the balance between oxidants and antioxidants in
the body (49). Alcohol consumption is implicated in audio vestibular diseases (50).
Binge drinking can cause rhabdomyolysis, and in consequence acute tubular necrosis
and acute renal failure (51). It also worsens diabetes and makes sugar control
difficult, by its actions on liver function (52).

12
While alcohol has no direct causal link to infectious diseases, excessive consumption
weakens immune system and increases risk of diseases like tuberculosis and
pneumonia especially in immunocompromised patients (53), (54). Alcohol also
affects compliance of medicines in diseases like tuberculosis and acquired
immunodeficiency syndrome and hence affects the outcome (55), (56).
3.1.2.2 Social consequences of alcohol
Alcohol is often a cause for family discord and social disturbances. The impact of
alcohol on society is often tied to the responses and attitudes of other people.
Intoxication, dependence and withdrawal states often result in poor performance at
work and in relationship obligations. Alcohol affects a person’s competence in social
and family responsibilities, impacts the quality of parenting and often causes
dysfunction in relationships. Alcohol misuse by a person leads to neglect and abuse
of their dependents and also affects others around. A study which examined the
relation between alcohol consumption and violence among industrial workers in
Goa, concluded that men with harmful use of alcohol were more prone to be
perpetrators of violence (57). Often people living with alcohol use disorders,
especially those with dependence symptoms, are excluded and marginalized by the
society. Several surveys have shown that alcohol users receive low priority in health
care delivery systems, which is often due to health workers’ attitude towards drinking
(58).

13
Domestic violence is a societal problem which is rooted in societal norms, cultural
attitudes and a deeply paternalistic mindset (59). In fact, both men and women
throughout the country, believed that wife-beating was justified under certain
circumstances. Very often, financial and work related stress is used to justify
domestic violence. Also the fact that women have insufficient support systems may
contribute to the widespread prevalence of domestic violence. Though domestic
violence is considered a separate entity, studies indicate that intimate partner
violence is exacerbated by alcohol. On a national level, 46% of women reported
having experienced violence when their partners consumed alcohol. Alcohol
consumption increased the probability of domestic violence by 17%. Even in
Gujarat, where alcohol is prohibited, alcohol increased the probability of women
experiencing violence (both physical and sexual) at the hands of a partner by 26%
(60).
3.1.2.3 Economic consequences of alcohol
According to a systematic review published in 2009, the cost of alcohol misuse on
the society is significant, and can be up to 5.44% of GDP. The revenue from sales
and excise tax on alcohol often conceals the underlying adverse financial impact on
the society. This includes direct costs like health care cost, research and prevention
costs, costs of crime and law enforcement, costs of property damage or loss and
indirect costs due to premature mortality, reduced productivity, incarceration, loss of
employment or early retirement etc. (61).
14
The economic impact of alcoholism on a single family can be extremely high. In
India household expenditure on alcohol varies between 3- 45% of their income.
Frequent drinkers in Delhi spent almost 24% of their incomes on alcohol alone (62).
Healthcare costs for families with an alcoholic member can be twice as high as
families without an alcoholic member (63). In addition to healthcare costs, the
financial burden is further increased by losses to family income caused by
absenteeism and loss of employment. In families whose earnings are already low,
heavy drinking further ruins the financial development and results in heavy debts
(64).
3.1.3 Definitions
1. Hazardous drinking
“is a pattern of alcohol consumption, that increases the risk of harmful consequences
for the user or others”. Hazardous drinking patterns are of public health significance,
despite the absence of any current disorder in the individual user.
2. Harmful use of alcohol
refers to” alcohol consumption that results in consequences to physical and
mental health”.
3. Alcohol dependence
refers to “a spectrum of symptoms that develop after repeated alcohol use. It
includes a strong desire to consume alcohol, difficulty limiting intake, persisting

15
consumption in spite of problems, a higher priority given to alcohol, increased
tolerance and also physical withdrawal symptoms” (65).
4. Alcohol related problem
Any of the range of problems attributable to alcohol which may be physical,
mental or social (66).
3.1.4 Screening and diagnosing alcohol use disorders.
Identifying problem drinkers is necessary in several situations like the emergency
room, clinics, population surveys on substance abuse etc. An array of screening
instruments is available to detect and diagnose unhealthy alcohol use. A few of the
important screening instruments are given below
a. Alcohol Use Disorders Identification Test (AUDIT)
The AUDIT is a 10 question screening instrument which is considered widely to be
the most accurate in screening for alcohol use disorders. It assesses recent alcohol
use, alcohol dependence symptoms, and alcohol-related problems.
It has been validated in more than six countries and multiple languages. The cross
national standardization makes this instrument ideal for international use (67). The
AUDIT questionnaire’s total score reveals both the susceptibility to alcohol
dependence and the severity of involvement (66).
Table 3-2: Cutoff scores for hazardous drinking and dependence
Score Interpretation Intervention
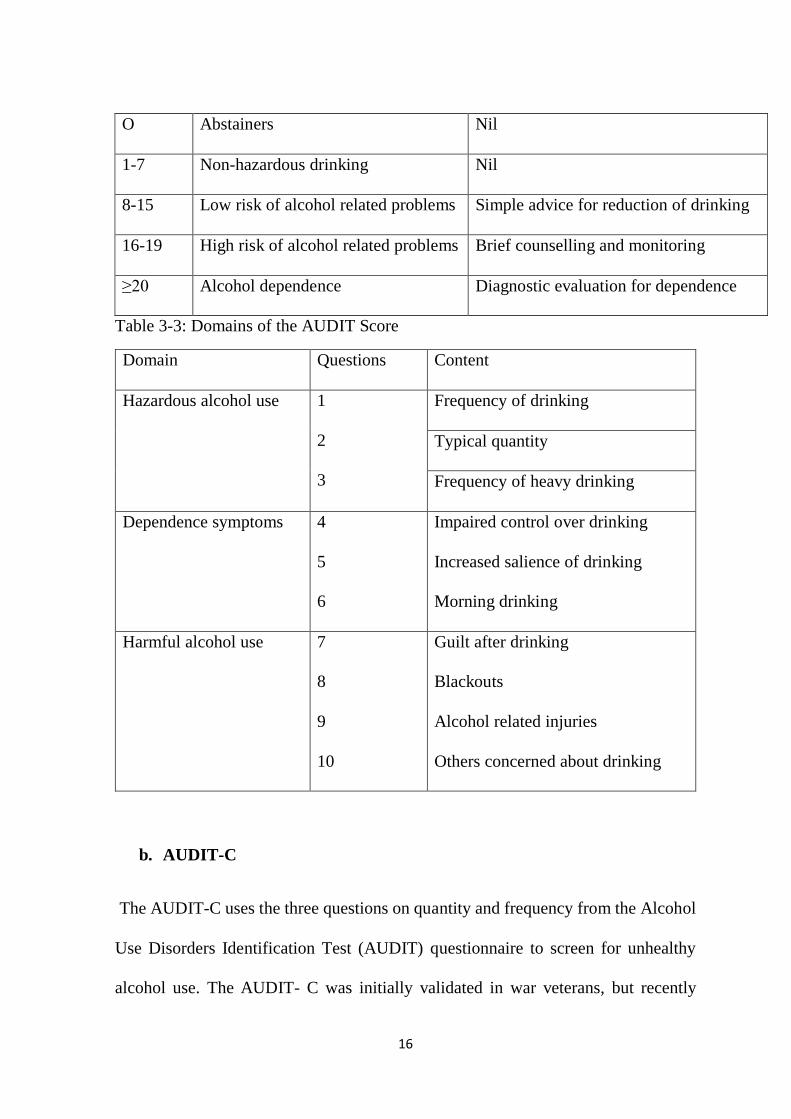
16
O Abstainers Nil
1-7 Non-hazardous drinking Nil
8-15 Low risk of alcohol related problems Simple advice for reduction of drinking
16-19 High risk of alcohol related problems Brief counselling and monitoring
≥20 Alcohol dependence Diagnostic evaluation for dependence
Table 3-3: Domains of the AUDIT Score
Domain Questions Content
Hazardous alcohol use 1
2
3
Frequency of drinking
Typical quantity
Frequency of heavy drinking
Dependence symptoms 4
5
6
Impaired control over drinking
Increased salience of drinking
Morning drinking
Harmful alcohol use 7
8
9
10
Guilt after drinking
Blackouts
Alcohol related injuries
Others concerned about drinking
b. AUDIT-C
The AUDIT-C uses the three questions on quantity and frequency from the Alcohol
Use Disorders Identification Test (AUDIT) questionnaire to screen for unhealthy
alcohol use. The AUDIT- C was initially validated in war veterans, but recently

17
studies demonstrating validity in primary care have also shown good sensitivity and
specificity. The AUDIT-C is briefer than the original AUDIT questionnaire, but
needs further studies to be widely accepted (68).
c. CAGE questionnaire
The CAGE questionnaire has four questions which were designed for detection of
the DSM IV criteria for substance abuse and dependence. A single affirmative
answer is screen positive. However, the CAGE questionnaire alone cannot detect the
entire spectrum of unhealthy use. The CAGE questionnaire can also be included in
screening tests that measure other health-related behaviors like exercise and smoking
(69).
d. Quantity /Frequency questionnaire
The quantity /frequency questionnaire is a rapid assessment of number of drinking
days and overall quantity of alcohol consumption, through recall of the past 30 days.
It has been validated for use in adolescents and adults. Unlike the AUDIT
questionnaire, it does not assess for problems related to problem drinking or
dependence (70). A similar questionnaire is the Fractional Graduated Frequency
questionnaire (F-GF), which also has a good correlation with the AUDIT
questionnaire (67).
e. The Brief Michigan Alcoholism Screening Test (BMAST)

18
The BMAST is a 10 question screening test, which is a subset of the Michigan
Alcoholism Screening Test (MAST), which has been found reliable in both clinical
and non-clinical settings. The BMAST was found as effective as the AUDIT in
identifying problem drinking and dependence symptoms (71).
f. TWEAK
The TWEAK questionnaire is a five item questionnaire which screens for harmful
alcohol use in women. The test was originally validated in pregnant women.
TWEAK is an acronym for Tolerance, Worried relatives, Eye opener, Amnesia and
Cut down. It can be self-administered or administered by health workers in face to
face interview (72).
g. Alcohol, Smoking and Substance involvement screening test (ASSIST)
The ASSIST questionnaire consists of more than 80 items, and the exact number
depends on the number of substances that the patient reports using in their lifetime.
The length of the questionnaire prevents ASSIST from being used as a common
screening test. However, it provides additional information which will be useful in
further assessment and intervention. A score of 4 or above on the ASSIST
questionnaire indicates harmful use of a substance, while a score of 27 and above
indicates dependence. There are computerized tests available which reduce the time
required for scoring (73).

19
3.2 ALCOHOLISM AND FAMILY
3.2.1 The family concept
While the family as a concept has existed from time immemorial, the scientific study
of its role in health, is recent in origin. An individual’s physical and mental health is
related, at least in part to the social environment of their developmental years. A
family provides this environmental, that is crucial to the biological development,
mental health and nurturing of essential coping mechanisms, all of which are central
to the health and functioning of an adult. A family can be identified as successful
either by the success of its individual members, or its facilitation of satisfactory
interaction among its members.
3.2.2 Definitions
Family
A family unit was defined by George Murdock as "a social unit identified by a
common residence, financial cooperation, and reproduction (74). It includes adults
of both sexes, at least two of whom maintain a socially approved sexual relationship,
and one or more children, own or adopted, of the sexually cohabiting adults. This
definition excludes single parent families and homosexual relationships. This
definition however is considered outdated and restrictive by current experts (75).
Popenoe in his article defines a family a merely a “small domestic group of kin
consisting of at least one adult and one dependent person” (76). This structural rather
than a functional definition has been criticized as an extremely simplified
interpretation of the modern family.

20
The United Nations defines a family as “those members of the household who are
related, to a specified degree, through blood, adoption or marriage” (77).
Healthy family functioning is the “effective coping of the family unit with cultural,
environmental, psychosocial, and socioeconomic stresses throughout the family life
cycle” (78).
Family dysfunction- A dysfunctional family is one “where the relationships among
family members are not conducive to emotional and physical health” (79).
3.2.3 Types of families
There are a number of different family types based on the structure.
Two Generation Families
Nuclear family refers to a small family unit with only two generations in the
household: the parents and their children. While this was the traditional family type
in western civilization, it is becoming increasingly common all around the world. In
India, urbanization and change in the nature of interpersonal relationships, has led to
a rise in the number of nuclear families. The other forms of a nuclear family are the
nuclear pair (married couple without children), the broken nuclear family (a fragment
of a former nuclear family, e.g., a widow with unmarried children living together)
and the supplemented nuclear family (a nuclear family plus one or more unmarried /
separated / widowed relatives of the parents, other than married children) (80).
21
The one-parent family refers to a family unit which consists of a single parent
(divorced or unmarried) and their children.
Three Generation Families
All the types of extended families consist of at least three generations: the
grandparents, parents, and their children. While some of the different types of
extended families may be either polygynous or polygamous, most refer to
monogamous relationships
The Joint family which includes both patriarchal and matriarchal families, consists
of the grandparents, the married sons, the grandchildren, and also the grandfather's
or grandmother's siblings, nieces, grandnieces, and in many cases, other kin. This
type of family used to be the most common type of family around the world and still
is considered to be the most traditional form of family in many countries. The head
of this family is either the patriarch or matriarch, who controls the finances, makes
decisions and is responsible for the welfare of the family. While the patriarchal
family is most common the matriarchal family is considered to have been the norm
in older civilizations. The patriarchal joint family is the most common traditional
family in India, but recent trends are towards a transitional family structure due to
modern principles of equality of individuals, equal status for women and increasing
focus on individual aspirations (81).
The stem (simply called “extended”) family consists of the grandparents, one set of
parents and their children. The grandfather or grandmother usually act as the head of

22
the family. The parents in this case, usually refers to the eldest son of the
grandparents and his spouse, who inherit the family property and continue the family
legacy. The other sons and daughters usually leave the household upon marriage, but
may be provided monetary assistance or inherit a part of the family wealth. This type
of family is the traditional family in central European countries, such as Austria,
southern Germany, but now is common throughout the world.
The fully extended family, also called zadruga in the Balkan countries has a structure
similar to that of the joint family, but cousins and other kin are also included as
members of the family (75).
3.2.4 Family functioning
Family functioning is one of the most under researched and one of the most
misinterpreted concepts. While the concept of family is cross cultural, it is at the
same time, diverse and ambiguous. However, there is an increasing need to study the
role of the family in individual health and societal development. Being the society’s
primary unit and agency there is an urgent need to identify elements which strengthen
the coping ability of families. The family unit is an individual’s main source for
fulfilling the common needs of survival. The family as an agency guides the
individual’s interaction with the society. Therefore, an individual’s health and
function in the society is linked inextricably with the family’s function (82). While
studies have examined the role of family dysfunction in mental health disorders, the
influence of a functioning family on a healthy individual is often not investigated.

23
With the changing cultural and societal patterns bringing additional stresses in the
form of varying relationship roles and alternative lifestyles, the understanding of
determinants of good family function becomes essential (83).
Figure 3-1: Relationship between individual and family health.
The role of family in health is of interest to professionals in different fields, including
sociologists, mental health professionals and public health professionals. A family’s
wellbeing in addition to influencing the health of its members, also affects the social
and economic development of the society.
3.2.5 Family life cycle
The life cycle of a family involves six stages: courtship, marriage, childbirth,
childhood, adolescence and old age (84), (85). Thereby the family plays a role in the
formation, growth, maturation and devolution of an individual. However, an
individual’s different phases of the family cycle are often in different family units.
Individual's health
Family healthSocietal health

24
3.2.5.1 Childhood
Studies indicate that dysfunctional changes in the family during the crucial period of
childhood is linked to mental health disorders (86), (87). The nature of interaction of
a family with the society in general, with the neighbors, the law enforcement and
public policies, defines the type of adults the children of the family will grow into.
The family’s interpersonal relationship impact the way children cope with stresses
(88).
3.2.5.2 Parenthood
While the coping capabilities of the parents depend on their individual experiences,
the coping and functioning of the family depends in major part on the parents
themselves. Studies have shown the link between childhood experiences and parental
behavior (89). In spite of behavioral patterns and coping skills being rooted in
childhood exposure, some studies have demonstrated capacity for modification of
parental behavior (90). Pathological gamblers are more likely to have experienced
neglect in childhood or grown up in dysfunctional families (91).
3.2.5.3 Adolescence
The most important phase in psychological growth is adolescence. Being the period
of rapid changes, both physically and psychologically, it is also the most vulnerable
phase in the life cycle. A study on teenagers found that violent juvenile offenders
were more likely to belong to dysfunctional families (92). A study on exposure to
community violence among a sample of 263 African American and Latino males

25
found that youngsters from dysfunctional and struggling families were more likely
to be exposed to violence in the community. However, on examining the risk of
youngsters perpetrating violence, it was found that youth exposed to high levels of
community violence were less likely to be perpetrators of violence, when their
families functioned well across multiple dimensions, compared to youngsters whose
families were dysfunctional (93). A study on lying behavior in adolescents,
concluded that parent child relationships and parenting practices and communication
were associated with lying and other behavioral problems in adolescence (94). In a
study on eating disorders, young women who had eating disorders were more likely
to secure dysfunctional scores on the family assessment device (95). Studies suggest
that suicidal behavior suggest that suicidal behavior in adolescence is linked to
family dysfunction (96).
3.2.5.4 Old age
There are insufficient studies on the impact of family functioning and aging.
However recent studies suggest that family and emotional support has a protective
effect against cognitive decline and promotes healthy aging (97).
3.2.6 Determinants of family functioning
A lot of external factors affect family functioning. Studies show a significant
association between poverty and family functioning especially in the domains of
communication and interpersonal relationship (98). Interpersonal communication
among the family members is an important determinant of family functioning (99).
A study of parent-child relationships, found that trust and good communication was

26
linked to the perception of good family functioning by both the parents and children
(100). The presence and occurrence of crises can have a significant effect on the
functioning of a family. Family crises could be due to factors external to the family,
but could also be due to behavior or health status of a family member. The following
table shows the various types of family crises.
Table 3-4: Classification of family crises. (83)
s.no Group Example
1 Dismemberment Death, Separation, War
2 Accession Pregnancy, Stepfather, Orphaned kin,
adoption,
Aged parents
3 Demoralization Infidelity, Alcoholism, Drug abuse,
Delinquency
3.2.7 Measurement of family functioning
Objectively measuring family health and functioning is difficult, sometimes
impossible. However, several instruments have been developed to measure various
aspects of family functioning.
Family assessment device (FAD)

27
The family assessment device was developed based on the McMaster model of
family functioning and aims to measure the family’s capabilities in the following
domains: Problem Solving, Communication, Roles, Affective Responsiveness,
Affective Involvement, Behavior Control and General Functioning (101). The FAD
is validated for use among several ethnic groups (102).
Family Assessment Measure (FAM)
The family assessment measure is based on the Process Model of Family
Functioning. The Process Model of family functioning studies seven key dimensions:
task accomplishment, role performance, communication, affective expression,
involvement, control, values and norms. The FAM can score these dimensions at
three levels: the whole family, dyadic relationships and individual functioning (103),
(104).
Family Adaptability and Cohesion Evaluation Scale (FACES)
Cohesion is the interpersonal attachment between family members, whereas
adaptability refers to a family’s capability of evolving its structure, roles and rules in
the face of crises or stress. The FACES is a self-report instrument developed by
Olson and his colleagues, based on the circumplex model of family functioning and
is one of the standard family assessment devices used today. However as other
approaches like family narratives became popular, the use of this dimension based
scale has reduced in clinical practice (105).
Family APGAR

28
The family APGAR is a five question instrument developed by Smilkstein which
measures the individual’s satisfaction with the family support and functioning. The
term APGAR, is an acronym of the domains under inquiry: Adaptation, Partnership,
Growth, Affection and Resolve. Studies demonstrate the family APGAR has been
used with families with children, teenagers and elders (106), (107), (108). While the
family APGAR is no longer recommended for clinical use, it is still appropriate for
screening population for dysfunction.
3.2.8 Impact of alcohol on the family
3.2.8.1 Impact on the spouses
A community study on physical spousal violence against women by Govindappa et
al. showed that women whose husbands regularly consumed alcohol were more
likely to experience verbal and physical abuse at the hands of their spouses. The
authors in the above study conclude that the disinhibition caused by alcohol and its
capacity to enhance existing feelings of frustration along with the husband’s narrow
perception of women’s failure to comply with existing gender norms is thought to
increase the occurrence of verbal and physical abuse (109).
A study in three low income areas in Mumbai found an association between pattern
of drinking (i.e. heavy drinking vs overindulgent drinking) and occurrence of
domestic violence. Greater exposure to alcohol in childhood was found to increase
occurrence of both verbal and physical violence towards the spouse (110). A study
on the predictors of spouses’ alcohol related functioning and depressive symptoms

29
concluded that the spouses of older adults whose late-life drinking problems remit
can attain normal functioning. The study also found that spouses of older adults who
continued to have drinking problems experienced more depressive symptoms (111).
A study by Homish et al. concluded that while spouses’ marital alcohol problems
affect wives’ depressive symptoms, alcohol problems in women does not influence
husbands’ depressive symptoms (112).
3.2.8.2 Impact on marriage
Waldron et al. in a study based in Australia examined the association between history
of alcohol dependence and survival of marriages. They found that moderate delays
in marriage were associated with alcohol dependence for both women and men. Also
among participants who have ever been married, alcohol dependence was predictive
of early separation, with similar effects observed for women and men (113).
3.2.8.3 Effect on children’s well-being
Klostermann K (2009) et al. in their study on children of alcoholics found that they
are more likely to develop externalizing problems such as conduct disorder,
oppositional defiant disorder, delinquency, and attention deficit disorder, and
internalizing behaviors such as depression and anxiety. Also children of alcoholics
tended to have early onset of alcohol use, and were also more likely to progress to
alcohol use disorders (114). In India data from the NHFS 2 showed a significant
association between household tobacco and alcohol usage and child health. Children

30
with alcoholic fathers were more prone to be malnourished, and also had a higher
infant mortality rate. A Case Control Study on school dropouts conducted in an urban
slum in Mumbai concluded that the number of school dropouts was found to be
significantly higher in the children of alcohol-dependent males as compared to
children with non-drinking/ non-dependent drinking pattern fathers (115). According
to a study by Stanley and Vanitha C (2008), the majority of children of alcoholics
manifest lower levels of self-esteem and a lesser degree of adjustment than children
of abstainers (116). However, while addiction and substance abuse can sabotage
family functioning, a study by Farrell et al. suggests that family cohesion can and
does buffer the effects of father’s problem drinking, on their children.

31
4 MATERIALS AND METHODS
4.1 STUDY AREA
This study was conducted in the rural revenue block of Kaniyambadi, located in
Vellore district. This particular block encompasses 82 villages with a total population
of around 1,13,200 permanent residents and has been served by the Community
Health department of Christian Medical College through the community health and
development (CHAD) programme for the past 60 years. The community health and
development (CHAD) programme provides primary health care for the block through
a peripheral team and subsidized secondary care through a 120 bedded hospital.
The first tier of the peripheral team is the Part Time Community Health Workers
(PTCHWs), who are trained volunteers from the community and act as the first
contact between the CHAD programme and the community. They also collect
information regarding births, deaths, marriages, pregnancies and outcomes and
report to the Health aides. Each PTCHW is responsible for a population of 1500.
The next tier are the Health aides who are staff of Christian Medical College. They
live and work in the community and are responsible for a population of 5000. The
health aides record disease and vital events in the community with the help of the
PTCHWs. They are supervised by the Public health nurse who are each responsible
for a population of 20,000. The Public health nurse is in turn supervised by a doctor
of the Community health department. The services of the peripheral team consist of
doctor run clinic, nurse run clinics, in addition to the home visits conducted by the
health aides and PTCHWs. Doctor run clinics are held once a month and each clinic

32
covers four to six villages. The clinics are held in pre-determined locations and focus
on antenatal care and children. Health education is provided on relevant topics. In
addition, people with chronic diseases also get monthly check ups through the doctor
run clinics. Nurse run clinics are held fortnightly. The public health nurse follows up
patients at home to check for complications and compliance. The health aides assist
the PHN in identifying high risk patients and defaulters.
The government healthcare system caters to the needs of people in the block through
four Primary health care centres and 17 health Subcentres. The Government Medical
College and Hospital functions as the tertiary healthcare centre. The Primary health
care centres provide 24 services for childbirth, along with antenatal, immunization
outreach services.
Table 4-1: Profile of CHAD peripheral team.
Team member Population
responsible for
Responsibilities
PTCHW 1000-2000 Collects information on vital and social
events
HEALTH AIDES 3000-5000 Home visits, record vital events and health
related data
PHN 15,000-20,000 Nurse run clinics and home visits
REGISTRAR 20,000-30,000 Doctor run clinic
In addition to providing health care the Community medicine department also
maintains a Health information system storing population details, disease related

33
information and vital events of the block population. Information on vital events and
morbidities is collected by PTCHWs, confirmed and recorded by the health aides.
The information is then verified by data managers and entered in the electronic health
information system.
4.2 STUDY DESIGN
The study design is cross -sectional study. This was conducted in two phases. Phase
one aimed to estimate the prevalence of hazardous drinking in the study population.
In the second phase the spouses of phase one study participants were enrolled as
respondents, in order to study family functioning.
4.3 STUDY POPULATION
4.3.1 First phase
Inclusion criteria
The study population in the first stage were married men in the 25 to 60 age
group who are permanent residents of Kaniyambadi block.
Exclusion criteria
Mentally challenged individuals
Hearing and/or speech impaired

34
4.3.2 Second phase
Inclusion criteria
Wives of the men interviewed in the first stage formed the study population for the
second stage of the study.
Exclusion criteria
1. Persons with known mental illness,
2. Hearing and/or speech impaired.
4.4 SAMPLE SIZE
Phase I
Prevalence of hazardous drinking of 15 % was taken to calculate sample size. This
is from on a previous study in the area (24).
n = 4pq/d2
= 4*15*85/32
= 566
multiplying by 1.2 for design effect
566 * 1.2 = 680
adding 10% for nonresponse and rounding off, n=750

35
Phase II
• A Previous study showed that around 65 % of wives of alcoholics reported low
quality of life compared to 35 % of wives of men who were either abstainers or social
drinkers. (117)
N = 2 *50*50*7.84
30 2
= 43 Rounding off n= 50 in each group.
4.5 SAMPLING METHOD
4.5.1 First phase
Cluster sampling was used to select the initial respondents from the Community
Medicine Health information system population database using simple random
sampling.
The following figure shows the sampling method for phase 1 of the study.
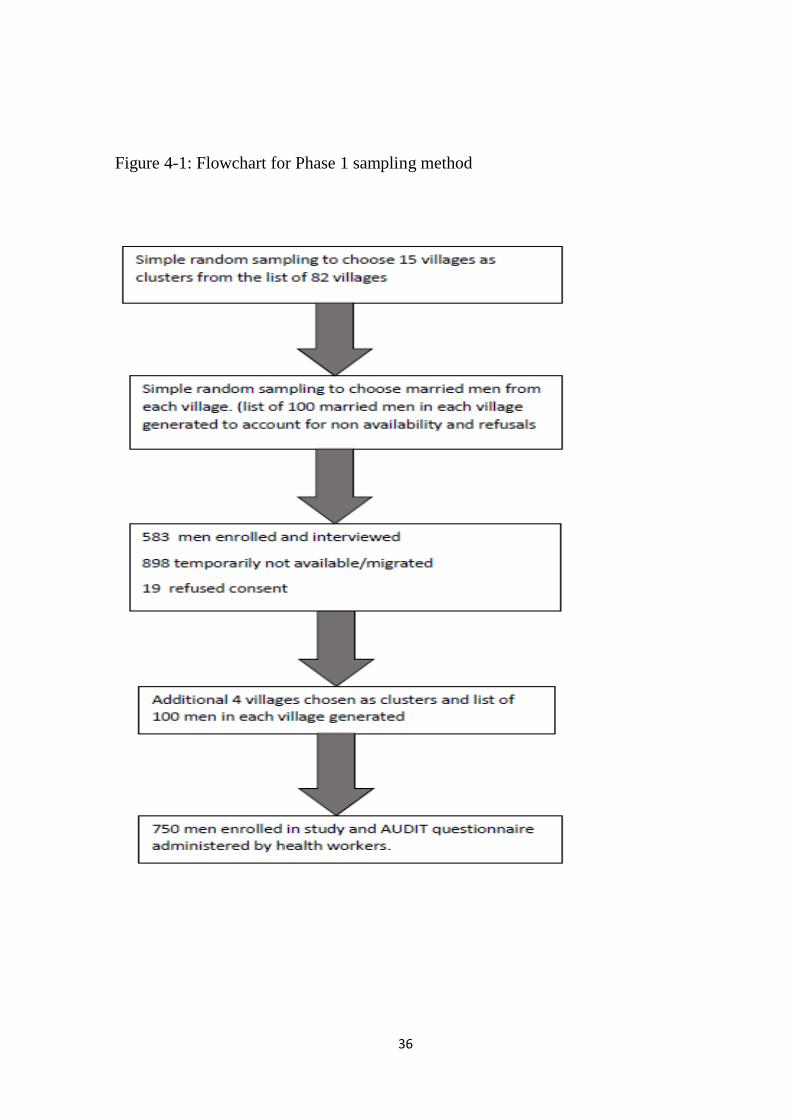
36
Figure 4-1: Flowchart for Phase 1 sampling method

37
4.5.2 Second phase
Figure 4-2: Flowchart for Phase 2 sampling method.
The respondents from stage 1 were classified on the basis of their AUDIT scores as
Abstainers (AUDIT Score 0), non- hazardous / social drinkers (AUDIT Score <8),
* without details of husband’s drinking
pattern

38
and hazardous drinkers (AUDIT >/=8). A sample of 150 was selected by simple
random sampling method with equal distribution among the three groups and the
wives of the selected men were contacted and enrolled
4.6 STUDY PROCEDURE
750 married men were enrolled in phase 1 of the study using cluster sampling
method. The AUDIT questionnaire was administered by trained field workers and
Demographic details and marital status were recorded. The information was then
entered in Epidata and analyzed using SPSS. Based on the AUDIT questionnaire the
respondents were classified as Abstainers, Social drinkers and Hazardous alcohol
drinkers.
The wives of 150 men were contacted by the primary investigator and enrolled
in the phase 2 of the study. This list had an equal distribution of respondents among
the three above mentioned groups. A questionnaire which included demographic and
marital details along with validated questionnaires for assessing perception of family
functioning, quality of life, presence of domestic violence and presence of Common
Mental health disorders were administered by the primary investigator.

39
Figure 4-3: Flowchart of study procedure.

40
4.7 ETHICS
The study was approved by the institutional review board and ethics committee of
Christian Medical College, Vellore.
All participants who requested treatment for alcohol dependence were offered
treatment in Mental Health Centre, CMC. Respondents who had physical health
problems related to alcohol consumption were referred to CHAD hospital for
treatment.
In the second phase of the study, women who were screen positive for presence of
common mental health disorders were given referral to CHAD hospital for further
management. Though provision was made for counselling of women who requested
help or treatment for diseases or distress due their husbands’ drinking, none availed
of this facility.
4.8 TOOLS
4.8.1 Phase 1
1. A questionnaire regarding demographic details.
2. Alcohol Use Disorders Identification Test questionnaire to assess alcohol
consumption pattern of the respondents. A score of 8 or above was considered
as hazardous drinking behavior (66).

41
4.8.2 Phase 2
3. A questionnaire regarding the demographic details and marital details.
4. Family APGAR questionnaire - to determine perception of family functioning
5. The WHOQOL- BREF to determine quality of life
6. The HITS questionnaire to screen for the presence of domestic violence
7. The GHQ 12 questionnaire to screen for the presence of common mental
health disorders.
4.9 BIAS
In order to avoid interviewer bias during data collection, the drinking behavior
of the husband was not revealed to the principle investigator and data
collection during the first phase of the study was done by field workers.
Selection bias was avoided by using a simple random sampling method to
choose respondents for the second phase of study.
Random misclassification of drinking behavior was avoided by using the
validated AUDIT questionnaire.
Reduction of non-response bias was done with the help of existing field
workers, like health aides and PTCHWs, and also with rapport building and a
comprehensive information sheet

42
5 RESULTS
5.1 QUANTITATIVE ANALYSIS
5.1.1 Phase 1
In the first phase of the study the AUDIT questionnaire was administered to 750
married men in the age group 25- 60 years from 19 villages. The socio demographic
characteristics of the population are described below.
Table 5-1: Baseline Characteristics
Variable No. Percentage
Age
(mean = 39.5
SD = 6.598)
25-29 68 9.1
30-34 126 16.8
35-39 158 21.1
40-44 173 23.1
45-49 168 22.4
50-54 56 7.5
55-59 1 0.1
Education Nil 20 2.7
Primary 50 6.7
Middle 205 27.3
High school 281 37.5
Higher secondary/diploma 130 17.3
Graduate or above 64 8.5
Occupation Unemployed 12 1.6
Unskilled workers 202 26.9
Semi-skilled 72 9.6
Skilled 193 25.7
Clerk, farmer, shop 198 26.4
Semiprofessional 72 9.6
Professional 2 0.3
The majority of the respondents are between 36-50 years of age with a mean of 39.5
(S.D 6.598) years. There are fewer respondents in the less than 30 years and above

43
50 years’ age groups. Around 63.3 % of the study population had studied at least up
to high school while 2.7 % did not receive any formal education. Out of the 750
respondents 64 (8.5%) were graduates or had a higher educational qualification. 12
of the study participants were currently unemployed. The most common occupation
category was unskilled work amounting to 26.9%. Among the unskilled workers
73.2% were involved in non-agricultural work as shown in the table below.
Table 5-2: Categories of unskilled work.
No. %
Agricultural labour 74 36.8
Non-agricultural daily wage work 128 73.2
Table 5-3: Marital status of study population.
No. Percentage
Currently married 744 99.2
Separated 4 0.5
Widowed 2 0.3
Among the 750 married men in the study, 4 (0.5%) were currently separated from
their wives as shown in the table above. However, this is likely to be an underestimate
since remarriages were not reported.

44
Prevalence of harmful alcohol use
The prevalence of problem drinking was estimated based on the AUDIT
questionnaire
Men with an AUDIT score of ≥ 8 were considered to be problem or hazardous
drinkers. Among problem drinkers AUDIT scores in the range of 8-15 represent a
medium level of alcohol related problems whereas scores of 16 and above
represented a high level of alcohol problems and AUDIT scores of 20 or above
suggest alcohol dependence
Table 5-4:Prevalence of Hazardous Drinking.
Around 46.9% of the respondents said they abstain from alcohol. Currently 53.1 %
of the married men consume alcohol of which more than half (59.2%) were
hazardous drinkers. Among the 236 respondent who were classified as hazardous
drinkers 53 (22.5%) fall into the category of alcohol dependence.
Category No. Percentage 95% CI
Abstainers (AUDIT SCORE 0) 352 46.9 43.25 - 50.54
Social drinkers (AUDIT SCORE 1-7) 162 21.6 18.59 - 24.61
Hazardous drinkers (AUDIT SCORE ≥ 8) 236 31.5 28.11 - 34.89

45
Figure 5-1: Classification of Hazardous drinkers.
The severity of hazardous drinking based on AUDIT scores is shown in the graph
above. Around 23% of men with hazardous pattern of alcohol consumption were
found to have alcohol dependence and 18% were high risk problem drinkers.
Hazardous drinking behavior across age categories
Drinking behavior was found to be similar across all age categories as shown in the
table below.
14043
53
Categories of Hazardous Drinking N=236
Medium risk
problem drinkers
High risk problem
drinkers
Alcohol dependence
46
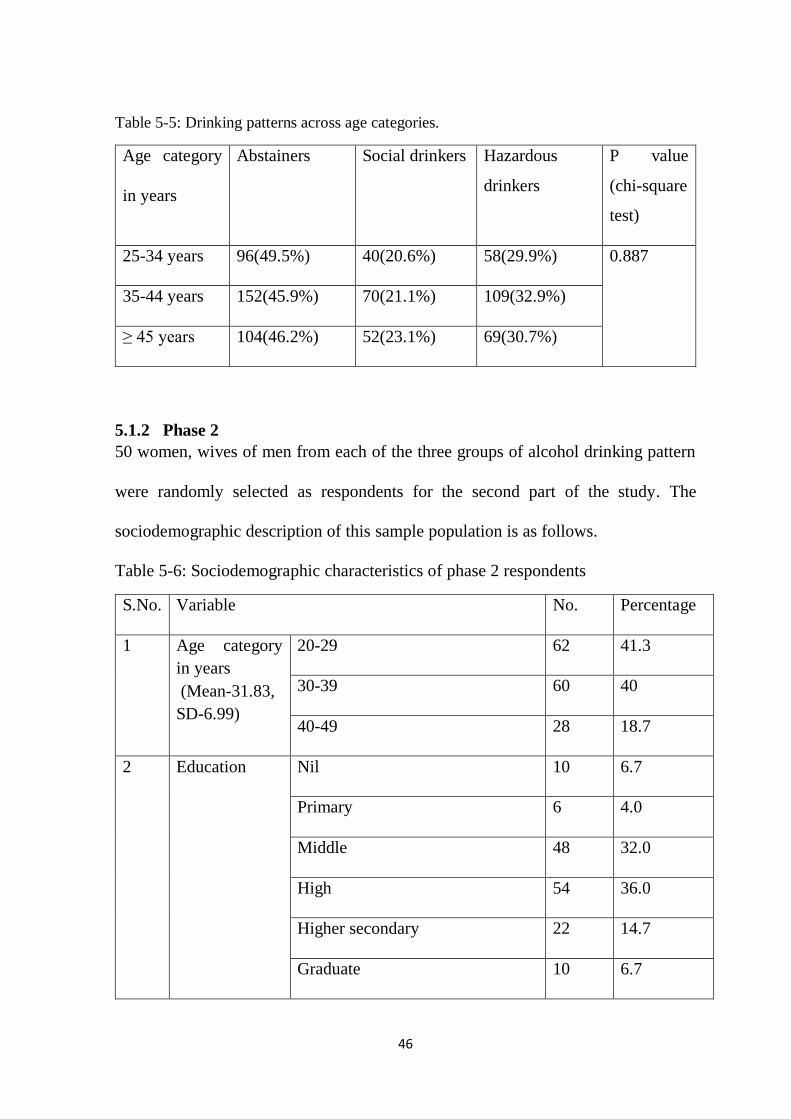
Table 5-5: Drinking patterns across age categories.
Age category
in years
Abstainers Social drinkers
Hazardous
drinkers
P value
(chi-square
test)
25-34 years 96(49.5%) 40(20.6%) 58(29.9%) 0.887
35-44 years 152(45.9%) 70(21.1%) 109(32.9%)
≥ 45 years 104(46.2%) 52(23.1%) 69(30.7%)
5.1.2 Phase 2
50 women, wives of men from each of the three groups of alcohol drinking pattern
were randomly selected as respondents for the second part of the study. The
sociodemographic description of this sample population is as follows.
Table 5-6: Sociodemographic characteristics of phase 2 respondents
S.No. Variable No. Percentage
1 Age category
in years
(Mean-31.83,
SD-6.99)
20-29 62 41.3
30-39 60 40
40-49 28 18.7
2 Education Nil 10 6.7
Primary 6 4.0
Middle 48 32.0
High 54 36.0
Higher secondary 22 14.7
Graduate 10 6.7
47
3 Whether
working
Housewife 81 54.0
Working 69 46.0
4 Occupation
(n=69)
Unskilled 54 78.3
Skilled 5 7.2
Clerk, farmer, shopkeeper 5 7.2
Semi professional 5 7.2
5 Type of house ≥5 room 11 7.3
3-4 rooms 58 38.7
1-2 rooms 59 39.3
Tiled house 17 11.3
Hut 5 3.3
6 Socioeconomic
status
Modified
Kuppusamy
scale 2015
Upper middle 25 16.7
Lower middle 65 43.3
Upper lower 60 40.0
7 Self-help
group member
Yes 61 40.7
No 89 59.3
8 Self-help
group leader
(N=61)
Yes 5 8.2
No 56 91.8

48
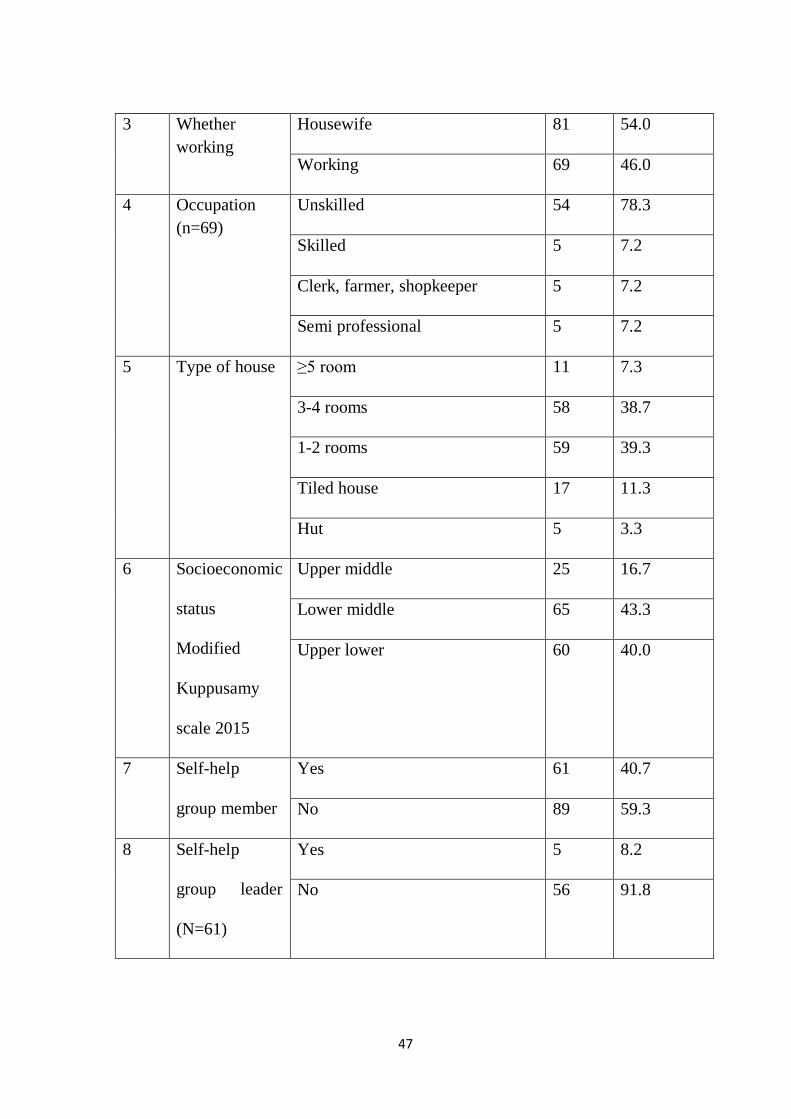
The mean age of the respondents was 31.8 with a range from 20 to 47 years. The
respondents’ age reflects the ages of participants in phase 1 of the study and smaller
number in age groups 40 and above is reflection of the fewer male participants in age
groups 50 years and above. 6.7 % of the respondents had no formal education.
However more than half the respondents (57.4%) had a high school education or
higher. 46 % of the respondents were working women. However out of the 69
working women the majority (78.3%) were involved in unskilled work. Among the
study population only 5 lived in thatched huts. Among the 128 respondents living in
terraced houses, more than half lived in houses with 3 or more rooms. 60% of the
study population belonged to the upper middle and lower middle socioeconomic
class. The remaining 40% of respondents belonged to the upper lower class. There
were no study respondents belonging to the lower or upper socioeconomic classes.
The above table shows that 40% of women in the study were members of self-help
groups. Of these 8% were held leadership posts in their Self-help group.
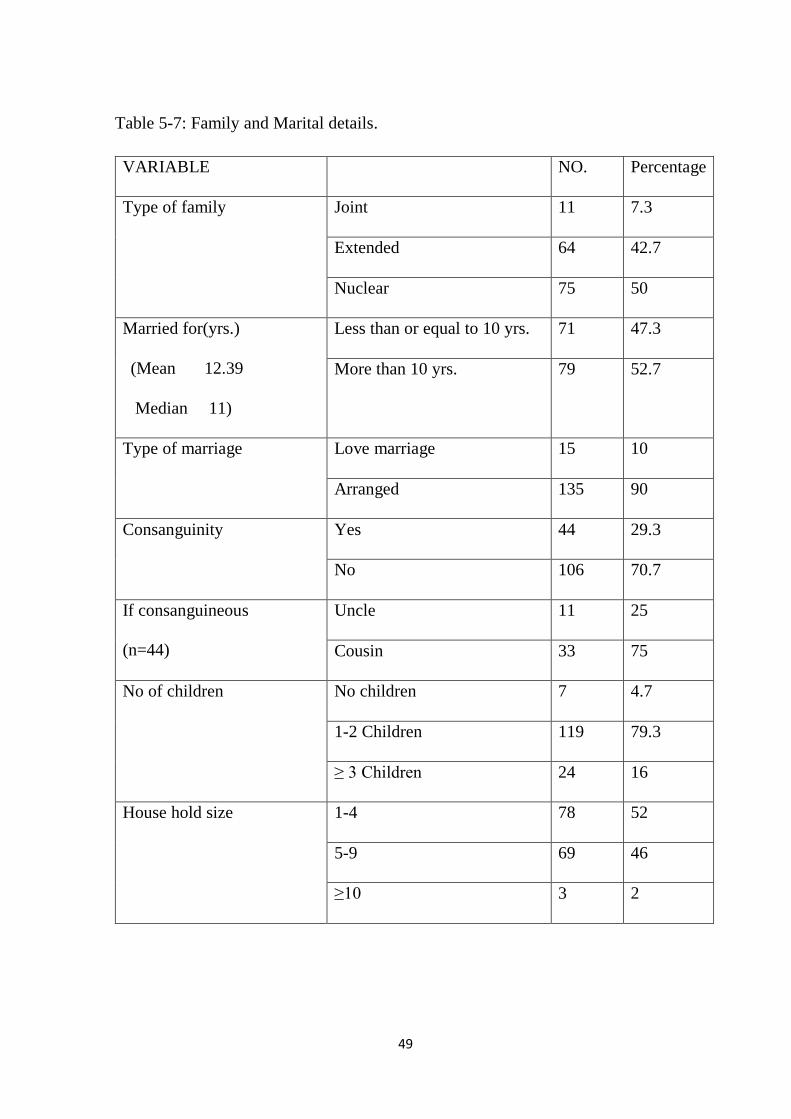
Family and Marital details
Half the respondents (n=75) belonged to nuclear families and the mean household
size was 4. Around half of the respondents had been married for more than 10 years
and 24 respondents had 3 or more children. More than three fourth of the respondents
had 1 -2 children and the household size was four or less in 52% of the respondents.
Arranged marriage was the norm, with 90% of the study women having had arranged
marriages. Almost one third of all marriages were consanguineous marriages.
Among the women who had consanguineous marriage, three fourth were married to
their first cousins.
49
Table 5-7: Family and Marital details.
VARIABLE NO. Percentage
Type of family Joint 11 7.3
Extended 64 42.7
Nuclear 75 50
Married for(yrs.)
(Mean 12.39
Median 11)
Less than or equal to 10 yrs. 71 47.3
More than 10 yrs. 79 52.7
Type of marriage Love marriage 15 10
Arranged 135 90
Consanguinity Yes 44 29.3
No 106 70.7
If consanguineous
(n=44)
Uncle 11 25
Cousin 33 75
No of children No children 7 4.7
1-2 Children 119 79.3
≥ 3 Children 24 16
House hold size 1-4 78 52
5-9 69 46
≥10 3 2

50
Comparison of baseline variables among different spousal drinking pattern
Table 5-8: Comparison of Baseline variables.
Variable Abstainers
N=49
Social
drinkers
N=50
Hazardous
drinkers
N=51
P value
(chi-
square
test)
Age category in
years
20-29 18(36.7%) 21(42%) 23(45.1%) 0.255
30-39 21(42.9%) 16(32%) 23(45.1%)
40-49 10(20.4%) 13(26%) 5(9.8%)
Type of family
Joint 1(2%) 7(14%) 3(5.9%) 0.188
Extended 23(46.9%) 21(42%) 20(39.2%)
Nuclear 25(51.1%) 22(44%) 28(54.9%)
Husbands
education
Nil 0 1(2%) 4(7.8%) 0.033
Primary 3(6.1%) 1(2%) 1(2%)
Middle 11(22.4%) 10(20%) 20(39.2%)
High school 20(40.8%) 25(50%) 18(35.3%)
Higher secondary 8(16.8%) 11(22%) 7(13.7%)
Graduate or
above
7(14.3%) 2(4%) 1(2%)
Husbands
occupation
Unemployed 1(2%) 0 0 0.106
Unskilled
workers
8(16.3%) 12(24%) 19(37.3%)
Semi-skilled 3(6.1%) 8(16%) 3(5.9%)
Skilled 15(30.6%) 14(28%) 18(35.3%)
Clerk, farmer,
shop
19(38.8%) 12(24%) 8(15.7%)
Semiprofessional 2(4.1%) 4(8%) 3(5.9%)
Professional 1(2%) 0 0

51
Respondents
education
Nil 3(6.1%) 5(10%) 2(3.9%) 0.689
Primary 3(6.1%) 2(4%) 1(2%)
Middle 18(36.7%) 13(26%) 17(33.3%)
High school 15(30.6%) 21(42%) 18(35.3%)
Higher
secondary/diplo
ma
5(10.2%) 7(14%) 10(19.6%)
Graduate or
above
5(10.2%)
2(4%)
3(5.9%)
Family income Mean 12367 12410 9010 0.024
Socioeconomic
status
Upper middle 12(24.5%) 11(22%) 2(3.9%) 0.001
Lower middle 26(53.1%) 21(42%) 18(35.3%)
Upper lower 11(22.4%) 18(36%) 31(60.8%)
Loan in family
Yes 42(85.7%) 35(70%) 36(70.6%) 0.121
No 7(14.3%) 15(30%) 15(29.4%)
Working/not
Working 20(40.8%) 29(58%) 20(39.2%) 0.112
Housewife 29(59.2%) 21(42%) 31(60.8%)
Self-help group
member
No 29(59.2%) 32(64%) 28(54.9%) 0.648
Yes 20(40.8%) 18(36%) 23(45.1%)
Married for
years
</=10 years 22(44.9%) 24(48%) 25(49%) 0.912
>10 years 27(55.1%) 26(52%) 26(51%)
Type of
marriage
Arranged
marriage
45(91.8%) 46(92%) 44(86.3%) 0.551
Love marriage 4(8.2%) 4(8%) 7(13.7%)
Consanguinity
Yes 12(24.5%) 16(32%) 16(31.4%) 0.661
No 37(75.5%) 34(68%) 35(68.6%)

52
The above table compares the baseline variables among the different drinking
patterns. Hazardous drinking was present in all occupational categories. However,
the number of hazardous drinkers was more among unskilled workers, and the
number of abstainers were more among clerical and agricultural land owners. Type
of marriage, duration of marriage and membership in self-help groups was similar in
all patterns of drinking.
The husband’s education in the abstainers and non-hazardous drinkers’ groups were
similar with 71.4% and 76 % respectively having a high school or higher education,
compared to 51% in the hazardous drinkers group. The proportion of working women
was similar across all categories of drinking pattern.
There was a statistically significant difference in the socioeconomic status, income
and husband’s education among the three drinking patterns. While in both the
abstainers and non-hazardous drinkers’ groups around half the respondents belonged
to the lower middle socioeconomic class, more than half (60.8%) of the respondents
in the hazardous drinkers group belonged to the upper lower socioeconomic group.
Additionally, families in the hazardous drinking group had a lower mean monthly
income than the other two groups, as shown in the figure below.

53
Figure 5-2: Comparison of income among the three drinking pattern groups.
Effects of pattern of drinking on family functioning
Family functioning in this study is considered by the following components
a) Perception of family support by the spouse (Family APGAR),
b) Presence of domestic violence (HITS questionnaire)
c) Quality of Life (WHO-QOL BREF)
d) Presence of mental health problems(GHQ-12)
e) Presence of school dropouts among children

54
A) Perception of Family Support by the Spouse (Family APGAR),
The family APGAR questionnaire has five questions, with a possible score of 0-2 for
each question. The standard cutoff for good family functioning is a score of 7 or
above.
The prevalence of dysfunction based on the spouses’ perception was 49% in the
hazardous drinkers group compared to 32.7% and 36% respectively in the abstainers
and non-hazardous drinkers group
Table 5-9:Pattern of alcohol drinking and spouse’s perception of family functioning.
Family dysfunction
(Family APGAR
score <7)
Good functioning
(Family Apgar
score ≥ 7)
P value
(chi-square
test)
Abstainers 16(32.7%) 33(67.3%) 0.207
Non-hazardous drinkers 18(36%) 32(64%)
Hazardous drinkers 25(49%) 26(51%)
The table reveals that there was no statistically significant difference in the
perception of family functioning among the spouses of men belonging to the three
different drinking pattern groups.
B) Presence of Domestic Violence (HITS questionnaire)
The HITS questionnaire is a four item questionnaire and each item has a possible
score of 1-5. A score of 10 or above is considered to be screen positive for domestic
violence (118).

55
The prevalence of domestic violence in the hazardous drinkers group was 31.4%,
which was significantly different from the abstainers and nonhazardous drinkers’
groups. The prevalence of domestic violence in the abstainers group was 8.2% and
the non-hazardous drinkers group was 10%.
Table 5-10:Pattern of alcohol drinking and domestic violence
Presence of
Domestic violence
(HITS score >10)
Negative for
domestic violence
(HITS score <10)
P value
(chi-square
test)
Abstainers 4(8.2%) 45(91.8%) 0.002
Non-hazardous drinkers 5(10%) 45(90%)
Hazardous drinkers 16(31.4%) 35(68.6%)
C) Quality of Life (WHO-QOL BREF)
The WHO-QOL score is a 26 item questionnaire. There is no standard cut-off for a
score more than the median value is considered good quality of life (119), (120).
The non-hazardous drinkers group had the lowest prevalence of low quality of life at
38%. Also 62% of the respondents in the hazardous drinkers group had a lower
quality of life. The median quality of life score for the sample population was 64.6.

56
Table 5-11:Alcohol drinking pattern and spouse’s quality of life.
Low quality of life
QOL≤median
(64.6)
High quality of life
QOL>median
(64.6)
P value
(Chi-square
test)
Abstainers 23(46.9%) 26(53.1%) 0.042
Non-hazardous drinkers 19(38%) 31(62%)
Hazardous drinkers 32(62.7%) 19(37.3%)
There is a worsening of Quality of life with increase in drinking pattern. Hazardous
drinkers group had the highest prevalence of low quality of life.
WHO-QOL BREF domains
The WHO- QOL BREF also gives scores in four domains namely: physical,
psychological, social and environmental. The study shows a statistically significant
difference among the three groups only in the environmental domain. The
respondents in the non-hazardous drinkers group had the lowest prevalence of low
quality in the environmental domain (32%). As shown in the following tables in all
domains of quality of life, the hazardous drinkers group had the higher prevalence of
low quality of life, but the difference among the groups was not statistically
significant.

57
Table 5-12:Alcohol drinking pattern and physical domain of quality of life.
Low quality of life
QOL ≤ median (50)
High quality of life
QOL>median (50)
P value
(chi-square
test)
Abstainers 29(59.2%) 20(40.8%) 0.069
Non-hazardous drinkers 23(46%) 27(54%)
Hazardous drinkers 35(68.6%) 16(31.4%)
Table 5-13:Alcohol drinking pattern and psychological domain of quality of life.
Low quality of life
QOL ≤ median (58)
High quality of life
QOL>median (58)
P value
(chi-square
test)
Abstainers 22(44.9%) 27(55.1%) 0.248
Non-hazardous drinkers 22(44%) 28(56%)
Hazardous drinkers 30(58.8%) 21(41.2%)

58
Table 5-14:Alcohol drinking pattern and social domain of quality of life.
Low quality of
life
QOL ≤ median
(50)
High quality of
life
QOL>median
(50)
P value
(chi-square
test)
Abstainers 30(61.2%) 19(38.8%) 0.667
Non-hazardous drinkers 28(56%) 22(44%)
Hazardous drinkers 33(64.7%) 18(35.3%)
Table 5-15:Alcohol drinking pattern and environmental domain of quality of life.
Low quality of
life
QOL ≤ median
(50)
High quality of
life
QOL>median
(50)
P value
(chi-square
test)
Abstainers 20(40.8%) 29(59.2%) 0.038
Non-hazardous drinkers 16(32%) 34(68%)
Hazardous drinkers 29(56.9%) 22(43.1%)
D) Presence of Mental Health Problems(GHQ-12)
Among the 150 respondents five were screen positive for presence of common
mental health disorders. A score of 3 and above was taken as screen positive for
presence of common mental disorders (121).

59
Table 5-16:Pattern of alcohol drinking and presence of common mental health disorders in spouse.
Presence of Common
Mental Disorders
No Common
Mental Disorders
P value
(chi-square
test)
Abstainers 2(4.1%) 47(95.9%) 0.801
Non-hazardous drinkers 1(2%) 49(98%)
Hazardous drinkers 2(3.9%) 49(96.1%)
There was no statistically significant difference in the prevalence among the three
groups. However, this might be attributable to the small number of women who were
screen positive for presence of common mental health disorders.
E) School Drop-outs
Among the 150 respondents, two had children who had dropped out of school before
8th standard. One respondent belonged to the nonhazardous drinkers group, while the
other belonged to the hazardous drinkers group. When asked about the reason both
women attributed their children dropping out of school to the children’s academic
failure.
Among all the different components of family functioning studied presence of
domestic violence and quality of life of the respondents are found to be associated
with the alcohol drinking pattern of the husbands.

60
Determinants of family functioning
Bivariate analysis was done to identify other factors that may influence family
functioning. Factors included for analysis were personal, marital factors and the
husband’s drinking pattern. For this the respondents were classified into two
categories on the basis on their husband’s drinking pattern as the hazardous drinkers
group and the non-hazardous / nondrinkers group. Of the total 150 respondents, 51
belonged to the hazardous drinkers group and 99 were in the nonhazardous/
nondrinkers group.
The other factors included for analysis were socioeconomic status, age of the
respondent, education of the respondent and spouse, type of family and marriage,
duration of marriage, whether the respondent is working, self-help group
membership and presence of loan.
Relationship between social factors and wives’ perception of family functioning
as measured by family APGAR.
The following table shows the associations between perception of family functioning
by the respondent and its association with the husband’s drinking pattern and other
social factors. Hazardous drinking was not associated statistically with the perception
of family functioning by the spouse. Other sociodemographic factors like age of the
respondent, education of the couple, type of family, and marriage did not influence
the perception of family functioning. Only the presence of loan in the family was a
significant risk factor.

61
Table 5-17:Determinants of perception of family functioning.
Family
dysfunction
(Family
APGAR<7)
Good
family
functioning
(Family
APGAR≥7)
P value
(chi-
square
test)
Odd’s ratio
(95%
confidence
interval)
Alcohol
Consumption
Hazardous 25(49%) 26(51%) 0.081 1.83
(0.92-3.65) Nonhazardous/
Non drinkers
34(34.3%) 65(65.7%)
Socioeconomic
status
Lower 29(48.3%) 31(51.7%) 0.065 1.871
(0.95-3.65 Middle 30(33.3%) 60(66.7%)
Age </=32yrs 28(34.1%) 54(65.9%) 0.153 0.62
(0.32-1.19) >32 yrs. 31(45.6%) 37(54.4%)
Respondents
Education
Middle school
and less
26(40.6%) 38(59.4%) 0.78 1.09
(0.57-2.13)
High school and
above
33(38.4%) 53(61.6%)
Husband’s
education
Middle school
and less
20(39.2%) 31(60.8%) 0.983 0.990
(0.49-1.98)
High school and
above
39(39.4%) 60(60.6%)
Type of family Non-nuclear 25(33.3%) 50(66.7%) 0.132 0.60
(0.31-1.16) Nuclear 34(45.3%) 41(54.7%)
Married years </=10 22(31%) 49(69%) 0.47 0.51
(0.26-0.99) >10 37(46.8%) 42(53.2%)
Type of
marriage
Arranged 56(41.5%) 79(58.5%) 0.10 2.84
(0.765-10.5) Love 3(20%) 12(80%)
Self-help
group member
No 36(40.4%) 53(59.6%) 0.735 1.12
(0.58-2.19 Yes 23(37.7%) 38(62.3%)
Working Housewife 29(35.8%) 52(64.2%) 0.337 0.73
(0.38-1.40) Working 30(43.5%) 39(56.5%)
Loan in family Yes 22(59.5%) 15(40.5%) 0.004* 3.01
(1.40-6.47) No 37(32.7%) 76(67.3%)

62
The above table shows the bivariate analysis of baseline variables, hazardous
drinking etc. with perception of family dysfunction Among the various factors
considered only the presence of loan in the family was associated with the perception
of family functioning by the wife. The proportion of dysfunction was 59.5% among
those with presence of loan in the family, compared to 32.7% among those with no
loan.
Figure 5-3:Loan in the family and perception of family functioning.
The prevalence of family dysfunction was higher among hazardous drinkers as
shown in the figure below. The prevalence of dysfunction was 49% in the hazardous
drinkers group, compared to 34% in the non-hazardous/ non-drinkers group.
However, this difference was not statistically significant.
22
37
15
76
0%
20%
40%
60%
80%
100%
Loan in family No loan in family
n= 150
Dysfunctonal family Good functioning

63
Figure 5-4:Drinking pattern and perception of family functioning.
Relationship between social factors and domestic violence
The following table explains the association between alcohol consumption and
various social factors. Hazardous drinking, lower socioeconomic status, type of
family and presence of loan in the family were factors significantly associated with
presence of domestic violence. Education, occupation category, type and duration of
marriage and membership in self-help groups were not linked to presence of
domestic violence.
2534
2665
0%
10%
20%
30%
40%
50%
60%
70%
80%
90%
100%
Hazardous drinker Non hazardous/non drinkers
dysfunctional good functioning
N=150

64
Table 5-18 Determinants of domestic violence.
Presence of
domestic
violence
No domestic
violence
p value
(Chi-
square
test)
OR
(95%
confidence
interval)
Alcohol
Consumption
Hazardous 16(31.4%) 35(68.6%) 0.001* 4.57
(1.85-11.30) Nonhazardous/
Non drinkers
9(9.1%) 90(90.9%)
SES Lower 16(26.7%) 44(73.3%) 0.007* 3.27
(1.35-8.01) Middle 9(9.1%) 90(90.9%)
Age </=32yrs 12(14.6%) 70(85.4%) 0.460 0.73
(0.31-1.72) >32 yrs. 13(19.1%) 55(80.9%)
Respondent’s
Education
Middle school
and less
13(20.3%) 51(79.7%) 0.301 1.57
(0.66-3.72)
High school
and above
12(14%) 74(86%)
Husband’s
education
Middle school
and less
10(19.6%) 41(80.4%) 0.488 1.37
(0.57-3.30)
High school
and above
15(15.2%) 84(84.8%)
Type of
family
Non-nuclear 7(9.3%) 68(90.7%) 0.016* 0.33
(0.13-0.84) Nuclear 18(24%) 57(76%)
Married years </=10 10(14.1%) 61(85.9%) 0.481 0.69
(0.29-1.68) >10 15(19%) 64(81%)
TYPE OF
MARRIAGE
ARRANGED 24(17.8%) 111(82.2%) 0.27 3.027
(0.30-24.13) LOVE 1(6.7%) 14(93.3%)
SELF-HELP
GROUP
MEMBER
NO 14(15.7%) 75(84.3%) 0.71 0.85
(0.36-2.08) YES 11(18%) 50(82%)
WORKING HOUSEWIFE 11(13.6%) 70(64.9%) 0.272 0.62
(0.26-1.47) WORKING 14(20.3%) 55(79.7%)
Loan Yes 13(35.1%) 24(64.9%) 0.001* 4.56(1.85-
11.24 No 12(10.6%) 101(89.4%)

65
Among the 25 respondents who screened positive for domestic violence, more than
half (64%) were in the hazardous drinkers group.
Figure 5-5: Drinking pattern and domestic violence
In addition, the husband’s drinking pattern, other factors like socioeconomic status,
type of family and presence of loan in the family were significantly associated with
presence of domestic violence.
Women in lower socioeconomic class according to Kuppusamy scale were 2.05
times more likely to experience domestic violence, compared to women in middle
socioeconomic class.
16
9
35
90
0%
20%
40%
60%
80%
100%
Hazardous drinkers Non hazardous/non drinkers
n=150
presence of domestic violence no domestic violence

66
Figure 5-6: Socioeconomic status and domestic violence.
There was higher prevalence of domestic violence in nuclear families, but there was
no statistically significant association.
Figure 5-7: Type of family and domestic violence.
169
4490
0%
20%
40%
60%
80%
100%
LOWER MIDDLE
N=150
Presence of domestic violence No domestic violence
187
5768
0%
20%
40%
60%
80%
100%
Nuclear family Non nuclear family
n=150
Presence of domestic violence No domestic violence

67
Relationship between social factors and Quality of life.
Table 5-19: Determinants of Quality of Life.
Poor QOL
(QOL≤
Median
(64))
Good QOL
(QOL>Median
(64))
P value
(chi-
square
test)
Odds Ratio
(95%
confidence
interval)
Alcohol
Consumptio
n
Hazardous 32(62.7%) 19(37.3%) 0.025* 2.29
(1.14-4.57) Nonhazardous/
Non drinkers
42(42.2%) 57(57.6%)
Socio-
economic
status
Lower 36(60%) 24(40%) 0.033* 2.05
(1.06- 3.99) Middle 38(42.2%) 52(57.8%)
Age </=32yrs 36(43.9%) 46(56.1%) 0.144 0.62
(0.32- 1.18) >32 yrs. 38(55.9%) 30(44.1%)
Respondents
Education
Middle school
and less
32(50%) 32(50%) 0.888 1.05
(0.55-2.01)
High school
and above
42(48.8%) 44(51.2%)
Husband’s
education
Middle school
and less
30(58.8%) 21(41.2%) 0.095 1.79
(0.90- 3.54)
High school
and above
44(44.4%) 55(55.6%)
Type of
family
Nuclear 40(53.3%) 35(46.7%) 0.327 1.38
(0.73- 2.62) Non-nuclear 34(45.3%) 41(54.7%)
Married
years
</=10 30(42.3%) 41(57.7%) 0.100 0.58
(0.31-1.11) >10 44(55.7%) 35(44.3%)
Type of
marriage
Arranged 67(49.6%) 68(50.4%) 0.831 1.13
(0.39- 3.28) Love 7(46.7%) 8(53.3%)
Self-help
group
member
No 46(51.7%) 43(48.3%) 0.486 1.26
(0.66- 2.42) Yes 28(47.5%) 33(52.5%)
Working Housewife 36(44.4%) 45(55.6%) 0.194 0.65
(0.34-1.25) Working 38(55.1%) 31(44.9%)
Loan in
family
Yes 26(70.3%) 11(29.7%) 0.003* 3.20
(1.44- 7.10) No 48(42.5%) 65(57.5%)

68
Bivariate analysis between various social factors and alcohol consumption with
quality of life is shown in the table above. Alcohol consumption was found to be
associated to quality of life, with an Odd’s ratio of 2.29. The other factors associated
with quality of life were loan in the family and socioeconomic status.
Relationship between domestic violence and other outcome variables.
An analyses of the relationship between the outcome variables was done and is
shown in the table below.
Women who experienced domestic violence were more likely to have perceived
family dysfunction. The risk of dysfunction was 6.73 times higher in women who
were screen positive for domestic violence.
Table 5-20:Domestic violence and family functioning.
Family
dysfunction
(Family
APGAR<7)
Good family
functioning
(Family
APGAR≥7)
P value
(chi-square
test)
Odds Ratio
(95%
confidence
interval)
Presence of
domestic violence
19(76%) 6(24%) 0.001 6.73
(2.50-
18.14) No domestic
violence
40(32%) 85(68%)

69
Table 5-21:Domestic violence and Quality of Life.
Quality of life
≤Median
Quality of life
>Median
P value Odds Ratio
Presence of domestic
violence
23(92%) 2(8%) 0.0001 16.69
(3.77-
73.91) No domestic violence 57(40.8%) 74(59.2%)
As shown in the table above there was a higher prevalence of low quality of life in
women who experienced domestic violence. The risk of low quality of life in women
who experienced domestic violence was 16.69 times higher than in women who did
not experience domestic violence.
Multivariate model
Multivariate analysis was done to estimate the independent effect of hazardous
drinking on the measures of family functioning viz. perception of family functioning,
presence of domestic violence and quality of life

70
Table 5-22:Logistic regression model for factors associated with perception of family
functioning.
s.no. Variables B-
coefficient
Sig Adjusted
Odds ratio
95%Confidence
interval for odds
ratio
Lower Upper
1. Hazardous
drinking
.389 .368 1.476 .632 3.445
2. Age -.022 .967 .978 .339 2.824
3. Respondent’s
education
-.305 .462 .737 .326 1.664
4. Housewife or
working
-.170 .672 .843 .384 1.854
5. Husband’s
education
-.677 .166 .508 .195 1.326
6. Socioeconomic
status
.484 .322 1.622 .623 4.221
7. Type of
marriage
.901 .234 2.463 .558 10.870
8. Duration of
marriage
-.808 .140 .446 .153 1.303
9. Type of family -.264 .507 .768 .352 1.676
10. Presence of loan .896 .051 2.449 .997 6.015
11. Presence of
common mental
disorders
1.889 .156 6.616 .485 90.218
12. Presence of
domestic
violence
1.319 .020* 3.741 1.231 11.374
Domestic violence was the significant risk factor for family dysfunction as measured
by family APGAR.

71
Binary logistic regression was done for various factors against presence of domestic
violence.
Table 5-23: Logistic regression model for factors associated with domestic violence
s.no. Variables B-
coefficient
Sig Adjusted
Odds ratio
95%Confidence
interval for odds ratio
Lower Upper
1. Age .045 .952 1.046 .238 4.594
2. Perception of
family
functioning
1.300 .024* 3.671 1.183 11.388
3. Presence of loan 1.163 .046* 3.201 1.020 10.048
4. Whether working -.489 .400 .613 .197 1.913
5. Presence of
common mental
disorders
.288 .830 1.334 .096 18.621
6. Duration of
marriage
-.140 .849 .870 .207 3.649
7. Type of family -.927 .108 .396 .128 1.227
8. Husband’s
education
-.602 .365 .548 .149 2.014
9. Type of marriage 1.035 .358 2.816 .310 25.611
10. Hazardous
drinking
1.466 .010* 4.333 1.428 13.146
11. Socioeconomic
status
.507 .441 1.660 .457 6.032
12 Respondents
education
.368 .528 1.444 .461 4.520
Husband’s hazardous drinking behavior and presence of debt in the family were the
only significant risk factor for domestic violence as shown in the table above.

72
Table 5-24:Logistic regression model for factors associated with quality of life.
s.no. Variables B-
coefficient
Sig Adjusted
Odds
ratio
95%Confidence
interval for odds
ratio
Lower Upper
1. Hazardous
drinking
.454 .298 1.575 .669 3.705
2. Respondent’s
age
-.299 .581 .741 .256 2.144
3. Respondent’s
education
-.536 .201 .585 .258 1.330
4. Housewife or
working
-.371 .350 .690 .317 1.503
5. Husband’s
education
.448 .331 1.565 .634 3.860
6. Socioeconomic
status
.025 .958 1.026 .404 2.601
7. Type of marriage -.264 .669 .768 .229 2.575
8. Duration of
marriage
-.607 .267 .545 .186 1.592
9. Type of family .019 .961 1.019 .472 2.199
10. Presence of loan .977 .039* 2.656 1.048 6.728
11. Domestic
violence
2.532 .001* 12.573 2.647 59.720
Multivariate analysis was done to determine independent risk factors of low quality
of life.
Domestic violence and presence of loan in the family were the only variable
significantly associated with poor quality of life.

73
The multivariate analysis of various factors with family functioning revealed
significant association with domestic violence. The logistic regression analysis
between domestic violence and various factors revealed the association of hazardous
drinking and presence of family loan with domestic violence. No other factor was
found to be significantly linked to hazardous drink.
Conceptually the findings of the study can be understood by the figure given below.
Figure 5-8:Relationship between Hazardous drinking and measures of Family Functioning
Therefore, while hazardous drinking behavior is directly linked to domestic violence,
both spousal perception of family dysfunction and quality of life are indirectly linked
to hazardous drinking through their association with domestic violence as shown in
the figure above. Debt in the family is likely to be related to hazardous drinking
Domestic violence
Quality of life
Perception of family
dysfunction
Hazardous drinking Debt

74
directly, and though associated with domestic violence significantly, its role is likely
to be indirect through drinking behavior.
5.2 QUALITATIVE ANALYSIS
Though no qualitative study methods were used during the study, copious field notes
were collected. Given below is a summary of data from the field notes.
Status of women in the society
During data collection, many respondents could not be identified by their names
alone or even coupled with their husbands’ names. The father in law’s name and
husband’s occupation were used to identify women. The community had no trouble
identifying women who had leadership posts in self-help groups and women who
worked in the 100 days’ work (MGNREGA).
In a few instances, married women were using first names other than their own
names. On further enquiry it was found that the new names had been given by them
in laws for ease of use. One mother in law said “It is difficult for me to remember
and call her by her real name, so we call her by this name”.
These instances indicate that the visible identity of a married woman in the
community is only as a daughter in law and many women do not have an individual
identity.
Domestic violence
Most women who experienced domestic violence also, found ways to justify it. “He
only hits me when I irritate him”, “He hits me when I do something wrong”, “He hits
75
me only when he is drunk” were common answers. These comments are indicative
of the social acceptance or social sanction for wife beating. The pain experienced by
these women is difficult to quantify.
Some women felt social restrictions more hurtful than physical violence “I wish he
would let me visit my parents, I don’t mind if he hits me”. “I can’t bear it when he
shouts at me in front of the street, I don’t mind when he hits me inside the house”. “I
have to go sleep in the neighbor’s house when he comes home drunk to not get hit”.
These sentiments were echoed by several women.
Factors influencing domestic violence.
Some women with history of domestic violence in the past, did not experience
violence currently. The birth of a child, especially a son seemed to reduce the
domestic violence in some families. However, this was not a universal response.
“After my son was born my husband has not hit me”. “My children stop him from
hitting me now”, “My son questions him when he tries to hit me, so he just walks
out”. “If I had a son he would protect me from my husband”, were some of the
sentiments expressed.

76
6 DISCUSSION
Excessive alcohol consumption has recently emerged as a widespread social evil in
India and is getting renewed attention with several women’s groups calling for
control and prohibition of alcohol sales. The aim of this study was to delineate the
effects of hazardous drinking on the family and its functioning and in the process to
estimate the prevalence of hazardous drinking pattern among married men. Initial
examination of literature on the topic, showed that the deleterious effects of excessive
alcohol consumption on health have been studied in depth. Further research in the
area of alcohol misuse is focused on treating the physical effects of excessive alcohol
consumption including dependence. The indirect effects of alcohol misuse especially
the burden on their family however, have not been investigated in detail.
In order to assess the impact of hazardous drinking on family, the study was planned
and conducted in two phases. In the first phase, a sample of 750 men were enrolled
and interviewed to assess the prevalence of hazardous drinking. Following this, in
the second phase the wives of a sample of 150 phase 1 respondents were enrolled,
and were then interviewed on their family and social details.
In order to measure family functioning, several parameters were used. The spouse’s
perception of family support measured by the family APGAR questionnaire, the
presence of common mental health disorders measured by the GHQ12 questionnaire
and the wife’s Quality of life as measured by the WHO-QOL BREF scale were the
main subjective measures used to indicate level of functioning of the family. In

77
addition, presence of domestic violence as measured by the HITS questionnaire,
presence of school dropouts among children were also taken as indicators.
The analysis of the results of the first phase of the study revealed that the prevalence
of hazardous drinking among married men in the 25-60 years’ age group is 31.5%
and the prevalence of alcohol dependence is 7%. A previous study in the
Kaniyambadi block published in 2009 had shown a prevalence of hazardous drinking
of 14.2% (24). Even though the current study was conducted only among married
men, the prevalence of hazardous drinking is considerably higher. A significant
proportion of married men in the CHAD programme database, from which the
sample was selected were unavailable due to their jobs. These jobs included
nonagricultural unskilled work as well as higher occupation categories like clerical
and army jobs. A large number of eligible men from a few clusters, refused consent
to participate in the study and it is likely that men who had refused consent consumed
alcohol excessively. Hence there is a probability that the prevalence of hazardous
alcohol consumption prevalence in the community is an underestimate.
In phase two of the study, 150 wives were selected from all three drinking categories
by simple random sampling. While comparing the baseline variables of the study
sample, there are certain significant differences in the sociodemographic
characteristics of wives of hazardous drinkers as compared to the rest. The Husband’s
education was lower in the hazardous drinkers’ group, with more than half with
education of middle school or lower, compared to around one fourth in the other two
groups. Socioeconomic status was significantly lower in the hazardous drinking
group, while approximately one fourth of respondents in both the non-drinkers and

78
non-hazardous drinkers’ groups belonged to the upper middle socioeconomic status
according to Kuppusamy scale. Mean monthly family income in the hazardous
drinkers group was lower than the other two groups. These results were similar to
previous studies which showed an adverse relationship between alcohol drinking
behavior and financial status (122). However, it is noted that occupational status of
the respondent and the occupation of the husband were similar in all drinking
behavior groups. Other variables like loan in family, membership in self-help groups,
type and duration of marriage were also similar across all three groups.
Looking at the measures of family functioning, we considered several outcome
measures.
Wives’ perception of family functioning and quality of life were subjective
components, while presence of domestic violence, presence of common mental
health disorders and school drop-out rates in children were recorded as quantifiable
measures of family functioning.
There were very few dropouts among the children of the respondents and hence this
variable was not used in the final analysis. A study in Mumbai had shown that school
drop-out rates were higher among children of alcoholics (115), however that
difference was not observed in this study. The government’s successful
implementation of schemes to ensure universal education may be considered as the
reason behind this.
Similarly, presence of common mental health disorders among respondents was also
low with only five women screening positive. This small number could not
demonstrate a difference between various drinking patterns. Good social support and

79
a supportive health system is likely to be the reason for this. however the study did
not explore this in detail.
Domestic violence was found to be significantly associated with hazardous drinking
in husband. This is in accordance with previous studies done in India and elsewhere
(59), (17). Alcohol consumption alone cannot be taken as the cause for domestic
violence. Its roots lie deeper, in the society’s patriarchal mindset and cultural values
which accept domestic violence as an acceptable way to discipline women. However,
the occurrence and severity of domestic violence is exacerbated by alcohol
consumption.
The prevalence of perception of family dysfunction by the wife was higher in the
hazardous drinkers group compared to the non-drinkers/ non-hazardous drinkers
group, but the difference was not statistically significant. Since no studies on
association between family functioning as alcohol consumption exist, there is a need
for more studies, especially using qualitative study methods. Perception of family
dysfunction by the wife was significantly associated with the presence of a loan in
the family and domestic violence in the initial analysis. However, on regression
model the association between presence of loan in the family and perception of
family dysfunction disappears. Domestic violence emerges as the only factor
independently associated with perception of poor family functioning.
Similarly, on analyzing the possible factors associated with wives’ quality of life,
hazardous drinking was not found to be a factor influencing quality of life. Presence
of loan in the family and presence of domestic violence were the two variables
independently influencing quality of life.

80
While both perception on family functioning by the wife using family APGAR and
quality of life were not significantly associated with hazardous drinking, both these
variables are found to be significantly associated with the presence of domestic
violence. Therefore, we can conclude that there is an indirect association between
perception of family dysfunction and hazardous drinking, which is evident through
presence of domestic violence.
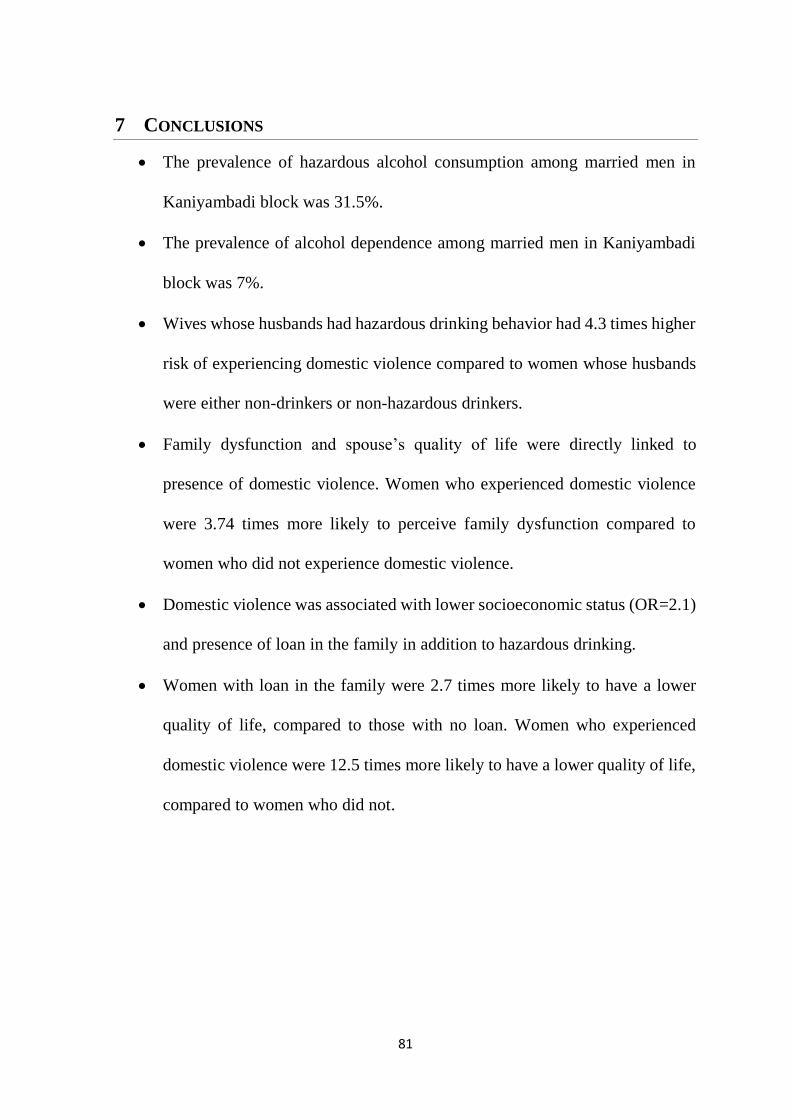
81
7 CONCLUSIONS
The prevalence of hazardous alcohol consumption among married men in
Kaniyambadi block was 31.5%.
The prevalence of alcohol dependence among married men in Kaniyambadi
block was 7%.
Wives whose husbands had hazardous drinking behavior had 4.3 times higher
risk of experiencing domestic violence compared to women whose husbands
were either non-drinkers or non-hazardous drinkers.
Family dysfunction and spouse’s quality of life were directly linked to
presence of domestic violence. Women who experienced domestic violence
were 3.74 times more likely to perceive family dysfunction compared to
women who did not experience domestic violence.
Domestic violence was associated with lower socioeconomic status (OR=2.1)
and presence of loan in the family in addition to hazardous drinking.
Women with loan in the family were 2.7 times more likely to have a lower
quality of life, compared to those with no loan. Women who experienced
domestic violence were 12.5 times more likely to have a lower quality of life,
compared to women who did not.

82
8 RECOMMENDATIONS
Further studies are needed to study the effects of hazardous drinking on family
functioning. Family functioning cannot be completely assessed by means of
quantifiable variables. Hence qualitative research methods and a combination
of subjective and objective tools are needed to gain a better understanding of
alcohol drinking behavior and its effects on interpersonal family relationships
and overall family functioning
Since alcohol behavior of an individual may not remain constant over their
lifetime, the change in drinking behavior can also influence functioning of the
family. Longitudinal studies to evaluate the change in drinking pattern and its
effect on family functioning, and coping behavior of the family are needed.
These will be useful to develop and evaluate various counselling interventions
for the family.
No studies have examined the influence of social support and supportive
health care systems on the family coping with stress related to a family
member’s substance and alcohol misuse disorders. Further studies are needed
in this area.

83
9 LIMITATIONS
Only the current drinking pattern of the husband was considered in this study.
The previous drinking behavior and its influence were not taken into account.
Since the prevalence of hazardous drinking was based on self-reporting by the
respondents, this prevalence could be an underestimate because of hidden
drinkers who might not have revealed their accurate drinking pattern.
Since only currently married men and their wives were included as
participants in this study, dysfunction measured can be assumed to be an
underestimate. This is because alcohol use/ abuse may be a reason for
separation and divorce.
Since the women enrolled as respondents were only wives of men who have
consented to participate in the first phase of the study the estimates of
prevalence of family dysfunction is expected to be much lower than reality.
The respondents in the second phase of the study, often revealed the drinking
behavior of their husband during the course of the interview. Hence blinding
the principle investigator to the drinking pattern of husbands was not
successful.

84
10 BIBLIOGRAPHY
1. Global status report on alcohol and health, 2014 [Internet]. 2014 [cited 2016
Sep 30]. Available from:
http://apps.who.int/iris/bitstream/10665/112736/1/9789240692763_eng.pdf?u
a=1
2. A profile of youth in India. National Family Health Survey (NFHS-3), India,
2005-06. | POPLINE.org [Internet]. [cited 2016 Sep 30]. Available from:
http://www.popline.org/node/207744
3. Bhore committee,1946 | National Health Portal Of India [Internet]. [cited 2016
Sep 30]. Available from: http://www.nhp.gov.in/bhore-committee-1946_pg
4. World Health Organization, editor. Global status report on alcohol and health.
Geneva, Switzerland: World Health Organization; 2011. 286 p.
5. WHO | Is harmful use of alcohol a public health problem? [Internet]. WHO.
[cited 2016 Oct 1]. Available from: http://www.who.int/features/qa/66/en/
6. Slováčková T, Birčiaková N, Stávková J. Forecasting Alcohol Consumption in
the Czech Republic. Procedia - Soc Behav Sci. 2016 May;220:472–80.
7. Organisation mondiale de la santé. Global status report on noncommunicable
diseases 2014: attaining the nine global noncommunicable diseases targets; a
shared responsibility. Geneva: World Health Organization; 2014.
8. Alcohol use around the globe: new data trends [Internet]. [ EpiAnalysis ]. 2012
[cited 2016 Sep 30]. Available from:
https://epianalysis.wordpress.com/2012/02/28/alcohol/
9. Adusi-Poku Y. Pregnant Women and Alcohol Use in the Bosomtwe District of
the Ashanti Region [Internet]. 2011 [cited 2016 Sep 30]. Available from:
http://ir.knust.edu.gh/handle/123456789/1187
10. Benegal V. India: alcohol and public health. Addiction. 2005 Aug
1;100(8):1051–6.
11. Pal H, Srivastava A, Dwivedi SN, Pandey A, Nath J. Prevalence of Drug Abuse
in India through a National Household Survey. 2015 [cited 2016 Sep 30];
Available from: http://www.currentsciencejournal.info/issuespdf/SND-
AIIMS.pdf
12. Medhi GK, Hazarika NC, Mahanta J. Correlates of alcohol consumption and
tobacco use among tea industry workers of Assam. Subst Use Misuse.
2006;41(5):691–706.

85
13. Chagas Silva M, Gaunekar G, Patel V, Kukalekar DS, Fernandes J. The
prevalence and correlates of hazardous drinking in industrial workers: a study
from Goa, India. Alcohol Alcohol Oxf Oxfs. 2003 Feb;38(1):79–83.
14. Easwaran M, Bazroy J, Jayaseelan V, Singh Z. Prevalence and determinants of
alcohol consumption among adult men in a coastal area of south India. Int J
Med Sci Public Health. 2015;1.
15. Nayak MB, Korcha RA, Benegal V. Alcohol use, mental health, and HIV-
related risk behaviors among adult men in Karnataka. AIDS Behav. 2010
Aug;14 Suppl 1:S61-73.
16. Patterns of Alcohol Consumption among Male Adults at a Slum in Kolkata,
India [Internet]. [cited 2016 Sep 30]. Available from:
https://www.ncbi.nlm.nih.gov/pmc/articles/PMC3312362/
17. Gururaj G, Benegal V, Girish N, Kavita R. Alcohol use and implications for
public health: Patterns of use in four communities. Indian J Community Med.
2010;35(2):238.
18. Murthy P. Culture and alcohol use in India. World Cult Psychiatry Res Rev.
2015;10:27–39.
19. Rahman L. Alcohol prohibition and addictive consumption in India. Lond UK
Lond Sch Econ [Internet]. 2003 [cited 2016 Sep 30]; Available from:
http://128.243.80.167/gep/documents/conferences/2003/pg-conf-
2003/rahman-2003.pdf
20. Singh S. Article 47 Constitution of India [Internet]. [cited 2016 Sep 30].
Available from: http://www.indianconstitution.in/2016/05/article-47-
constitution-of-india.html
21. World Health Organization, editor. Burden and socio-economic impact of
alcohol: the Bangalore study. New Delhi: World Health Organization,
Regional Office for South-East Asia; 2006. 72 p. (Alcohol control series).
22. Types of Alcoholic Beverages | Alcohol Web India [Internet]. [cited 2016 Oct
6]. Available from: https://www.alcoholwebindia.in/content/types-alcoholic-
beverages
23. Kumar S. G, K.C. P, L. S, E. S, Vinayagamoorthy, Kumar V. Prevalence and
Pattern of Alcohol Consumption using Alcohol Use Disorders Identification
Test (AUDIT) in Rural Tamil Nadu, India. J Clin Diagn Res JCDR. 2013
Aug;7(8):1637–9.

86
24. John A, Barman A, Bal D, Chandy G, Samuel J, Thokchom M, et al. Hazardous
alcohol use in rural southern India: nature, prevalence and risk factors. Natl
Med J India. 2009 Jun;22(3):123–5.
25. Kim S, Rifkin S, John SM, Jacob KS. Nature, prevalence and risk factors of
alcohol use in an urban slum of Southern India. Natl Med J India. 2013
Aug;26(4):203–9.
26. The alcohol economy | Business Line [Internet]. [cited 2016 Sep 30]. Available
from: http://www.thehindubusinessline.com/economy/the-alcohol-
economy/article5436924.ece
27. Mani MK. Bottoms up. Natl Med J India. 2003 Dec;16(6):331–2.
28. Rehm J, Gmel G, Sempos CT, Trevisan M. Alcohol-related morbidity and
mortality. Alcohol Res Health. 2003;140:C00–C97.
29. World Health Organization. Alcohol and injury in emergency departments:
summary of the report from the WHO collaborative study on alcohol and
injuries. Geneva, Switzerland: World Health Organization; 2007.
30. WHO | International Classification of Diseases [Internet]. [cited 2016 Sep 30].
Available from: http://www.who.int/classifications/icd/en/
31. Hon J. Treating Alcoholism as a Chronic Disease. 2003 [cited 2016 Sep 30];
Available from: http://hsrc.himmelfarb.gwu.edu/sphhs_policy_facpubs/261/
32. Lynskey MT. The comorbidity of alcohol dependence and affective disorders:
treatment implications. Drug Alcohol Depend. 1998 Nov 1;52(3):201–9.
33. Davis L, Uezato A, Newell JM, Frazier E. Major depression and comorbid
substance use disorders. Curr Opin Psychiatry. 2008 Jan;21(1):14–8.
34. Fergusson DM, Boden JM, Horwood L. TEsts of causal links between alcohol
abuse or dependence and major depression. Arch Gen Psychiatry. 2009 Mar
1;66(3):260–6.
35. Global burden of disease attributable to mental and substance use disorders:
findings from the Global Burden of Disease Study 2010 [Internet]. [cited 2016
Sep 30]. Available from:
http://www.sciencedirect.com/science/article/pii/S0140673613616116
36. Irving HM, Samokhvalov AV, Rehm J. Alcohol as a Risk Factor for
Pancreatitis. A Systematic Review and Meta-Analysis. Jop. 2009 Jul
6;10(4):387–92.

87
37. Rehm J, Taylor B, Mohapatra S, Irving H, Baliunas D, Patra J, et al. Alcohol
as a risk factor for liver cirrhosis: A systematic review and meta-analysis. Drug
Alcohol Rev. 2010 Jul 1;29(4):437–45.
38. The Recurrence of Acute Alcohol-Associated Pancreatitis Can Be Reduced: A
Randomized Controlled Trial [Internet]. [cited 2016 Sep 30]. Available from:
http://www.sciencedirect.com/science/article/pii/S0016508508020751
39. Cho E, Smith-Warner SA, Ritz J, van den Brandt PA, Colditz GA, Folsom AR,
et al. Alcohol Intake and Colorectal Cancer: A Pooled Analysis of 8 Cohort
Studies. Ann Intern Med. 2004 Apr 20;140(8):603–13.
40. The relationship of the use of tobacco and alcohol to cancer of the oral cavity,
pharynx or larynx [Internet]. [cited 2016 Sep 30]. Available from:
http://www.sciencedirect.com/science/article/pii/0002961063901375
41. Liver cancer: Descriptive epidemiology and risk factors other than HBV and
HCV infection [Internet]. [cited 2016 Sep 30]. Available from:
http://www.sciencedirect.com/science/article/pii/S0304383508008689
42. Alcohol and Breast Cancer in Women: A Pooled Analysis of Cohort Studies |
Feb 18, 1998 | JAMA | JAMA Network [Internet]. [cited 2016 Sep 30].
Available from:
http://jama.jamanetwork.com/article.aspx?articleid=187252&=nbsp%3B%2C
nbsp%3B
43. Association of alcohol consumption with selected cardiovascular disease
outcomes: a systematic review and meta-analysis | The BMJ [Internet]. [cited
2016 Sep 30]. Available from:
http://www.bmj.com/content/342/bmj.d671.abstract
44. Lippi G, Franchini M, Favaloro EJ, Targher G. Moderate red wine
consumption and cardiovascular disease risk: beyond the “French paradox.”
Semin Thromb Hemost. 2010 Feb;36(1):59–70.
45. de Gaetano G, Cerletti C, European project. FAIR CT 97 3261 Project
participants. Wine and cardiovascular disease. Nutr Metab Cardiovasc Dis
NMCD. 2001 Aug;11(4 Suppl):47–50.
46. Cassie AB, Allan WR. Alcohol and Road Traffic Accidents. Br Med J. 1961
Dec 23;2(5268):1668–71.
47. Streissguth AP. Fetal alcohol syndrome: A guide for families and communities.
Vol. xxvii. Baltimore, MD, US: Paul H Brookes Publishing; 1997. 306 p.

88
48. Ethanol-Induced Apoptotic Neurodegeneration and Fetal Alcohol Syndrome |
Science [Internet]. [cited 2016 Sep 30]. Available from:
http://science.sciencemag.org/content/287/5455/1056
49. Felson DT, Zhang Y, Hannan MT, Kannel WB, Kiel DP. Alcohol Intake and
Bone Mineral Density in Elderly Men and Women The Framingham Study.
Am J Epidemiol. 1995 Sep 1;142(5):485–92.
50. Verma RK, Panda NK, Basu D, Raghunathan M. Audiovestibular dysfunction
in alcohol dependence. Are we worried? Am J Otolaryngol. 2006
Aug;27(4):225–8.
51. Deighan CJ, Wong KM, Mclaughlin KJ, Harden P. Rhabdomyolysis and acute
renal failure resulting from alcohol and drug abuse. QJM. 2000 Jan 1;93(1):29.
52. Howard AA, Arnsten JH, Gourevitch MN. Effect of Alcohol Consumption on
Diabetes MellitusA Systematic Review. Ann Intern Med. 2004 Feb
3;140(3):211–9.
53. Parry C, Rehm J, Poznyak V, Room R. Alcohol and infectious diseases: an
overlooked causal linkage? Addiction. 2009 Mar 1;104(3):331–2.
54. Brayton RG, Stokes PE, Schwartz MS, Louria DB. Effect of Alcohol and
Various Diseases on Leukocyte Mobilization, Phagocytosis and Intracellular
Bacterial Killing. N Engl J Med. 1970 Jan 15;282(3):123–8.
55. Grodensky CA, Golin CE, Ochtera RD, Turner BJ. Systematic review: effect
of alcohol intake on adherence to outpatient medication regimens for chronic
diseases. J Stud Alcohol Drugs. 2012 Nov;73(6):899–910.
56. Martin LR, Williams SL, Haskard KB, DiMatteo MR. The challenge of patient
adherence. Ther Clin Risk Manag. 2005 Sep;1(3):189–99.
57. D’Costa G, Nazareth I, Naik D, Vaidya R, Levy G, Patel V, et al. Harmful
alcohol use in goa, India, and its associations with violence: a study in primary
care. Alcohol Alcohol. 2006 Dec 15;42(2):131–7.
58. Glannon W. Responsibility, alcoholism, and liver transplantation. J Med
Philos. 1998 Feb;23(1):31–49.
59. Arthur c, Clark r. Determinants of domestic violence: A Cross-National Study.
Int J Sociol Fam. 2009;35(2):147–67.
60. National Family Health Survey [Internet]. [cited 2016 Oct 1]. Available from:
http://rchiips.org/nfhs/nfhs3.shtml

89
61. Thavorncharoensap M, Teerawattananon Y, Yothasamut J, Lertpitakpong C,
Chaikledkaew U. The economic impact of alcohol consumption: a systematic
review. Subst Abuse Treat Prev Policy. 2009 Nov 25;4:20.
62. Global burden of disease and injury and economic cost attributable to alcohol
use and alcohol-use disorders [Internet]. [cited 2016 Sep 28]. Available from:
http://www.sciencedirect.com/science/article/pii/S0140673609607467
63. Bradley CJ, Zarkin GA. An inpatient profile of patients with a substance abuse
diagnosis in Maryland. J Subst Abuse Treat. 1997 Apr;14(2):155–62.
64. Samarasinghe D. Alcohol and poverty: some connections. FORUT Oslo. 2009;
65. Organization WH. The ICD-10 classification of mental and behavioural
disorders : diagnostic criteria for research. CIM-10/ICD-10 : Classification
internationale des maladies Dixième révision Chapitre V(F) : troubles mentaux
et troubles du comportement : critères diagnostiques pour la recherche
[Internet]. 1993 [cited 2016 Oct 1]; Available from:
http://www.who.int/iris/handle/10665/37108
66. Babor TF, Higgins-Biddle JC, Saunders JB, Monteiro MG. Audit. Alcohol Use
Disord Identif Test AUDIT Guidel Use Prim Care [Internet]. 2001 [cited 2016
Sep 29]; Available from:
http://pftp.paho.org/Public/NMH/Alcohol/Cartagena/Articulos%20USB/Audi
tBro-
3.pdf?Mobile=1&Source=%2F_layouts%2Fmobile%2Fview.aspx%3FList%
3De0923874-ac8b-4798-b0ae-be309b53f0b8%26View%3Db9b59ee1-e24f-
4a75-8826-
6b6128274b00%26RootFolder%3D%252FPublic%252FNMH%252FAlcoho
l%252FCartagena%252FArticulos%2520USB%26CurrentPage%3D1
67. Saunders JB, Aasland OG, Babor TF, De La Fuente JR, Grant M. Development
of the Alcohol Use Disorders Identification Test (AUDIT): WHO
Collaborative Project on Early Detection of Persons with Harmful Alcohol
Consumption-II. Addiction. 1993 Jun 1;88(6):791–804.
68. Bradley KA, DeBenedetti AF, Volk RJ, Williams EC, Frank D, Kivlahan DR.
AUDIT-C as a brief screen for alcohol misuse in primary care. Alcohol Clin
Exp Res. 2007 Jul;31(7):1208–17.
69. Schafer J, Cherpitel CJ. Differential item functioning of the CAGE, TWEAK,
BMAST and AUDIT by gender and ethnicity. Contemp Drug Probl. 1998 Jun
1;25(2):399–409.
70. Poikolainen K, Podkletnova I, Alho H. Accuracy of quantity–frequency and
graduated frequency questionnaires in measuring alcohol intake: comparison

90
with daily diary and commonly used laboratory markers. Alcohol Alcohol.
2002;37(6):573–576.
71. Connor JP, Grier M, Feeney GFX, Young RM. The validity of the Brief
Michigan Alcohol Screening Test (bMAST) as a problem drinking severity
measure. J Stud Alcohol Drugs. 2007 Sep;68(5):771–9.
72. Cherpitel CJ. Brief screening instruments for alcoholism. Alcohol Res Health.
1997;21(4):348.
73. Humeniuk R, Ali R, WHO ASSIST Phase II Study Group. Validation of the
Alcohol, Smoking and Substance Involvement Screening Test (ASSIST) and
Pilot brief Intervention: A technical report of Phase II Findings of the WHO
ASSIST Project. Geneva: World Health Organization; 2006.
74. Murdock GP. Social structure. Vol. xvii. Oxford, England: Macmillan; 1949.
387 p.
75. Anastasiu I. The Social Functions Of The Family. Euromentor J Stud Educ
[Internet]. 2012 [cited 2016 Oct 1];3. Available from:
http://www.ceeol.com/content-files/document-208849.pdf
76. Popenoe D. American Family Decline, 1960-1990: A Review and Appraisal. J
Marriage Fam. 1993;55(3):527–42.
77. United Nations, Statistical Office. Principles and recommendations for a vital
statistics system. New York: United Nations; 2014.
78. David HP. Healthy family functioning: a cross-cultural appraisal. Bull World
Health Organ. 1978;56(3):327–42.
79. Kintner M, Boss PG, Johnson N. The Relationship between Dysfunctional
Family Environments and Family Member Food Intake. J Marriage Fam.
1981;43(3):633–41.
80. Sonawat R. Understanding families in India: a reflection of societal changes.
Psicol Teor E Pesqui. 2001 Aug;17(2):177–86.
81. MULLATTI L. Families in India: Beliefs and Realities. J Comp Fam Stud.
1995;26(1):11–25.
82. Epstein NB, Bishop DS, Levin S. The McMaster Model of Family
Functioning. J Marital Fam Ther. 1978 Oct 1;4(4):19–31.
83. Statistical indices of family health. Report of a WHO Study Group. World
Health Organ Tech Rep Ser. 1976;(587):1–92.
84. Neighbour RH. The family life-cycle. J R Soc Med. 1985;78(Suppl 8):11–5.

91
85. Carter EA, McGoldrick M, editors. The expanded family life cycle: individual,
family, and social perspectives. 3rd ed., classic ed. New York: Pearson Allyn
& Bacon; 2005. 541 p. (Allyn and Bacon classics in education).
86. Reid JB, Patterson GR. The development of antisocial behaviour patterns in
childhood and adolescence. Eur J Personal. 1989 Jun 1;3(2):107–19.
87. Herring S, Gray K, Taffe J, Tonge B, Sweeney D, Einfeld S. Behaviour and
emotional problems in toddlers with pervasive developmental disorders and
developmental delay: associations with parental mental health and family
functioning. J Intellect Disabil Res. 2006 Dec 1;50(12):874–82.
88. Bögels SM, Brechman-Toussaint ML. Family issues in child anxiety:
Attachment, family functioning, parental rearing and beliefs. Clin Psychol
Rev. 2006 Nov;26(7):834–56.
89. Marcenko MO, Kemp SP, Larson NC. Childhood experiences of abuse, later
substance use, and parenting outcomes among low-income mothers. Am J
Orthopsychiatry. 2000;70(3):316–26.
90. Banyard VL. The impact of childhood sexual abuse and family functioning on
four dimensions of women’s later parenting. Child Abuse Negl. 1997 Nov
1;21(11):1095–107.
91. Ciarrocchi J, Hohmann AA. The family environment of married male
pathological gamblers, alcoholics, and dually addicted gamblers. J Gambl
Behav. 5(4):283–91.
92. Gorman-Smith D, Tolan PH, Zelli A, Rowell L. The relation of family
functioning to violence among inner-city minority youths. J Fam Psychol.
1996;10(2):115–29.
93. Gorman-Smith D, Henry DB, Tolan PH. Exposure to Community Violence
and Violence Perpetration: The Protective Effects of Family Functioning. J
Clin Child Adolesc Psychol. 2004 Aug 1;33(3):439–49.
94. Jenkins JM, Smith MA. Marital Disharmony and Children’s Behaviour
Problems: Aspects of a Poor Marriage that Affect Children Adversely. J Child
Psychol Psychiatry. 1991 Jul 1;32(5):793–810.
95. McGrane D, Carr A. Young Women at Risk for Eating Disorders: Perceived
Family Dysfunction and Parental Psychological Problems. Contemp Fam
Ther. 24(2):385–95.
96. Martin G, Rotaries P, Pearce C, Allison S. Adolescent suicide, depression and
family dysfunction. Acta Psychiatr Scand. 1995 Nov 1;92(5):336–44.

92
97. Seeman TE, Lusignolo TM, Albert M, Berkman L. Social relationships, social
support, and patterns of cognitive aging in healthy, high-functioning older
adults: MacArthur Studies of Successful Aging. Health Psychol.
2001;20(4):243–55.
98. Banovcinova A, Levicka J, Veres M. The Impact of Poverty on the Family
System Functioning. Procedia - Soc Behav Sci. 2014 May 15;132:148–53.
99. Peterson R, Green S. Families First-Keys to Successful Family Functioning.
Communication. 2009 [cited 2016 Oct 2]; Available from:
https://vtechworks.lib.vt.edu/handle/10919/48300
100. Kerr m, Stattin h, Trost k. To know you is to trust you: parents’ trust is rooted
in child disclosure of information. J Adolesc. 1999 Dec 1;22(6):737–52.
101. Epstein NB, Baldwin LM, Bishop DS. The Mcmaster family assessment
device*. J Marital Fam Ther. 1983 Apr 1;9(2):171–80.
102. Morris TM. Culturally Sensitive Family Assessment: An Evaluation of the
Family Assessment Device Used with Hawaiian-American and Japanese-
American Families. Fam Process. 1990 Mar 1;29(1):105–16.
103. Skinner H, Steinhauer P, Sitarenios G. Family Assessment Measure (FAM)
and Process Model of Family Functioning. J Fam Ther. 2000 May
1;22(2):190–210.
104. The Family Assessment Measure - Canadian Journal of Community Mental
Health [Internet]. [cited 2016 Oct 2]. Available from:
http://www.cjcmh.com.www.nrcresearchpress.com/doi/abs/10.7870/cjcmh-
1983-0018?journalCode=cjcmh
105. Rodick JD, Henggeler SW, Hanson CL. An evaluation of the family
adaptability and cohesion evaluation scales and the circumplex model. J
Abnorm Child Psychol. 14(1):77–87.
106. Silva MJ da, Victor JF, Mota FR do N, Soares ES, Leite BMB, Oliveira ET, et
al. Analysis of psychometric properties of family APGAR with elderly in
northeast Brazil. Esc Anna Nery. 2014 Sep;18(3):527–32.
107. Muyibi AS, Ajayi I-OO, Irabor AE, Ladipo MMA. Relationship between
adolescents’ family function with socio-demographic characteristics and
behaviour risk factors in a primary care facility. Afr J Prim Health Care Fam
Med [Internet]. 2010 Oct 29 [cited 2016 Oct 2];2(1). Available from:
http://www.ncbi.nlm.nih.gov/pmc/articles/PMC4565908/
108. Austin JK, Huberty TJ. Revision of the Family APGAR for use by 8-year-olds.
Fam Syst Med. 1989;7(3):323–7.

93
109. Govindappa L, Pankajakshi B. A community study on violence among wives
of alcoholics. DELHI PSYCHIATRY JOURNAL. 17(2):323–7.;
110. Berg MJ, Kremelberg D, Dwivedi P, Verma S, Schensul JJ, Gupta K, et al. The
Effects of Husband’s Alcohol Consumption on Married Women in Three Low-
Income Areas of Greater Mumbai. AIDS Behav. 2010 Aug;14(Suppl 1):S126–
35.
111. Moos RH, Schutte KK, Brennan PL, Moos BS. Personal, family and social
functioning among older couples concordant and discordant for high-risk
alcohol consumption. Addict Abingdon Engl. 2011 Feb;106(2):324–34.
112. Homish GG, Leonard KE, Kearns-Bodkin JN. Alcohol use, alcohol problems,
and depressive symptomatology among newly married couples. Drug Alcohol
Depend. 2006 Jul 27;83(3):185–92.
113. Waldron M, Heath AC, Lynskey MT, Bucholz KK, Madden PAF, Martin NG.
Alcoholic Marriage: Later Start, Sooner End. Alcohol Clin Exp Res. 2011
Apr;35(4):632–42.
114. Klostermann K, Chen R, Kelley ML, Schroeder VM, Braitman AL, Mignone
T. Coping behavior and depressive symptoms in adult children of alcoholics.
Subst Use Misuse. 2011;46(9):1162–8.
115. Pinto VN, Kulkarni RN. A Case Control Study on School Dropouts in Children
of Alcohol-Dependent Males Versus that in Abstainers/Social Drinkers’
Children. J Fam Med Prim Care. 2012 Jul;1(2):92–6.
116. Stanley S, Vanitha C. Psychosocial Correlates in Adolescent Children of
Alcoholics- Implications for Intervention. Int J Psychosoc Rehabil. 12(2):67–
80.
117. Sharon P. Perceived Quality Of Life Among Wives Of Alcoholics And Wives
Of Non-alcoholics – A Comparative Study. Soc Sci. 4(12).
118. Sherin KM, Sinacore JM, Li XQ, Zitter RE, Shakil A. HITS: a short domestic
violence screening tool for use in a family practice setting. Fam Med. 1998
Aug;30(7):508–12.
119. Rose A, Shashidhara YN, others. Quality of life of people with non
communicable diseases. Nitte Univ J Health Sci [Internet]. 2015 [cited 2016
Oct 6];5(3). Available from:
http://search.ebscohost.com/login.aspx?direct=true&profile=ehost&scope=sit
e&authtype=crawler&jrnl=22497110&AN=113841066&h=%2BD%2FZYlD
rM8zfR0BIaINdQed2vRSni%2Bf0uSDQZz6lQPmnols5MPmln25yYPtXs5
%2F%2Bi6WZOwaakXGmqABO%2FV2ufg%3D%3D&crl=c

94
120. Abbreviated World Health Organization Quality of Life questionnaire
(WHOQOL-Bref) in north Indian patients with bronchial asthma: an
evaluation using Rasch analysis : npj Primary Care Respiratory Medicine
[Internet]. [cited 2016 Oct 6]. Available from:
http://www.nature.com/articles/npjpcrm20141#t2
121. Kuruvilla A, Pothen M, Philip K, Braganza D, Joseph A, Jacob KS. The
validation of the Tamil version of the 12 item general health questionnaire.
Indian J Psychiatry. 1999;41(3):217–21.
122. Rathod SD, Nadkarni A, Bhana A, Shidhaye R. Epidemiological features of
alcohol use in rural India: a population-based cross-sectional study. BMJ Open.
2015 Dec 1;5(12):e009802.

I
11 ANNEXURES
ANNEXURE I – AUDIT QUESTIONNAIRE AND PROFORMA
FOR PHASE 1

II

III

IV
ANNEXURE II - PROFORMA FOR DATA COLLECTION FOR
PHASE 2
Impact of hazardous drinking on family functioning in Rural South India- a cross sectional
study.
1. Study no. B__
2. Husband’s study no.A___ 3. Date __/__/____
3. Name:_____________________________
4. Husband’s name:_____________________
5. Village name:_______________________
6. Street name:________________________
7. Age : ___ years
8. Education of head of family
1 Illiterate
2 Primary school
3 Middle school
4 High school
5 Post high school diploma
6 Graduate or post graduate
7 Professional/ honours
9. Occupation of the head of the family: ___________
1 Unemployed
2 Unskilled worker
3 Semi-skilled
4 Skilled
5 Clerical, shop-owner, farmer

V
6 Semi-professional
10 Professional
10. Approximate family income per month Rs. __________
11. Type of house
1. own house with 5 or more rooms
2. Own house with 3-4 rooms
3. Rented/Govt. house with 5 or more rooms
4. Own house with 1-2 rooms
5. Rented/Govt. house with 3-4 rooms
6. Rented/Govt. house with 1-2 rooms
7. Own tiled house
8. Rented tiled house
9. thatched hut
12. Does your family have any outstanding loan
13. Education of the respondent:_________(last
grade completed) code __
14. What is your current employment
1-housewife
2-employed
15. If employed currently what do you work as _____________ code___
16. How much do you earn per month? Rs _________
17. Did you ever have a different employment?
18. If yes what did you work as _____________ code__
19. How much did you earn in the previous work Rs_________
20. Do you belong to any self- help group
21. If yes, Do you hold any leadership post in the self- help group
Marital details
Yes No
Yes No
Yes No

VI
22. For how many years have you been married ______ yrs
23. Type of marriage
1. Arranged 2. Love marriage
24. Is your husband a near relation
If yes how 1. Cousin
2. uncle
3. others ___________________
Children
25. Number of living children
26. Details
S.no Age Sex Education(completed
grade
Occupation
27. If any children have dropped out of school before 10th grade then please give the
reason _________________________
Personal details
28. Do you have any chronic medical illness?
29. If yes details
1. Hypertension
2. Diabetes
3. Bronchial asthma/COPD
4. Others___________
30. Do you currently use any of the following
1. Cigarette/beedi
2. Alcohol
3. Chewing tobacco
Yes No
Yes No

VII
4. Others___________________
31. Have you ever used any of the following substances
1. Cigarette/beedi
2. Alcohol
3. Chewing tobacco
4. Others___________________
32. Type of family
1. Joint family
2. Extended family
3. Nuclear family
33. No.of members in the family______
34. Do any of your children use any of the following
1. Cigarette/beedi
2. Alcohol
3. Chewing tobacco
4. Others___________________
35. GHQ-12 Score
36. Qol-Bref Score
37. Hits score
38. Family apgar score

VIII
ANNEXURE III- FAMILY APGAR QUESTIONNAIRE

IX
ANNEXURE IV- WHO QOL BREF QUESTIONNAIRE

X

XI

XII
ANNEXURE V- GHQ 12 QUESTIONNAIRE

XIII
ANNEXURE VI- HITS SCREENING QUESTIONNAIRE FOR DOMESTIC
VIOLENCE

XIV
ANNEXURE VII- INFORMATION SHEET PHASE 1 ENGLISH

XV

XVI
ANNEXURE VIII- INFORMATION SHEET FOR PHASE 1 TAMIL

XVII

XVIII

XIX
ANNEXURE IX- INFORMATION SHEET FOR PHASE 2 ENGLISH

XX

XXI
ANNEXURE X- INFORMATION SHEET FOR PHASE 2 -TAMIL

XXII

XXIII

XXIV
ANNEXURE XI- WRITTEN INFORMED CONSENT FORM -ENGLISH

XXV

XXVI
ANNEXURE XII- WRITTEN INFORMED CONSENT FORM- TAMIL

XXVII

XXVIII
ANNEXURE XIII- IRB CLEARANCE FORM

XXIX

XXX