Impact of Georgia’s Teenage and Adult Driver Responsibility Act
16
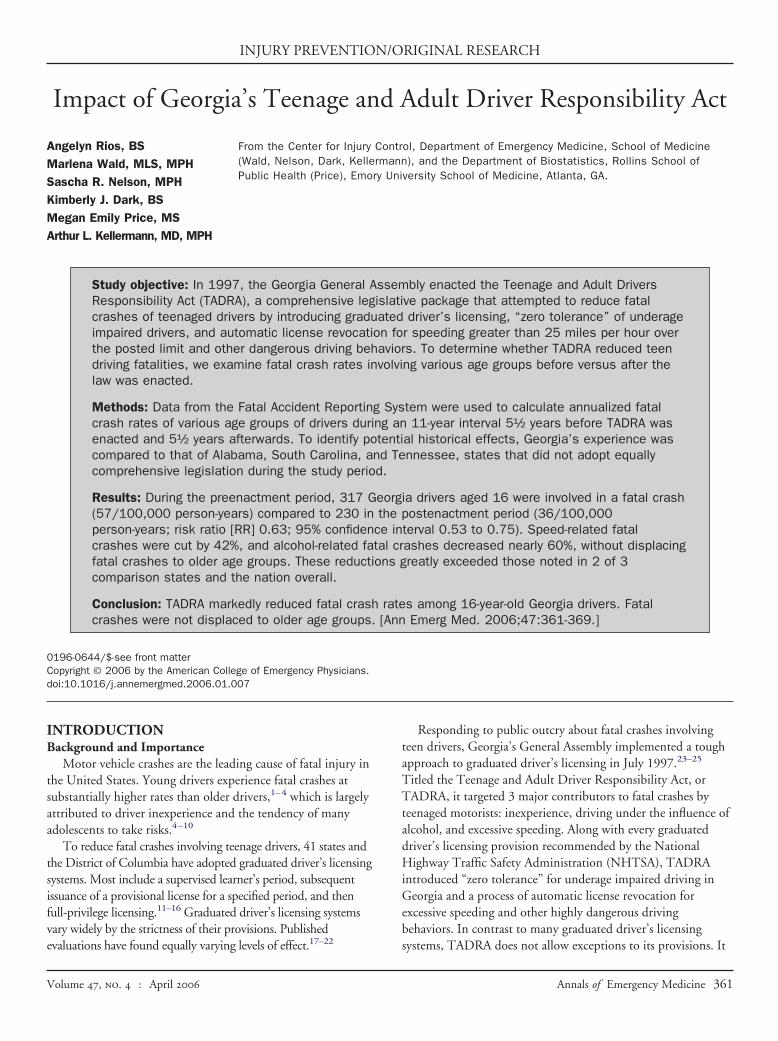
INJURY PREVENTION/ORIGINAL RESEARCH Impact of Georgia’s Teenage and Adult Driver Responsibility Act Angelyn Rios, BS Marlena Wald, MLS, MPH Sascha R. Nelson, MPH Kimberly J. Dark, BS Megan Emily Price, MS Arthur L. Kellermann, MD, MPH From the Center for Injury Control, Department of Emergency Medicine, School of Medicine (Wald, Nelson, Dark, Kellermann), and the Department of Biostatistics, Rollins School of Public Health (Price), Emory University School of Medicine, Atlanta, GA. Study objective: In 1997, the Georgia General Assembly enacted the Teenage and Adult Drivers Responsibility Act (TADRA), a comprehensive legislative package that attempted to reduce fatal crashes of teenaged drivers by introducing graduated driver’s licensing, “zero tolerance” of underage impaired drivers, and automatic license revocation for speeding greater than 25 miles per hour over the posted limit and other dangerous driving behaviors. To determine whether TADRA reduced teen driving fatalities, we examine fatal crash rates involving various age groups before versus after the law was enacted. Methods: Data from the Fatal Accident Reporting System were used to calculate annualized fatal crash rates of various age groups of drivers during an 11-year interval 5½ years before TADRA was enacted and 5½ years afterwards. To identify potential historical effects, Georgia’s experience was compared to that of Alabama, South Carolina, and Tennessee, states that did not adopt equally comprehensive legislation during the study period. Results: During the preenactment period, 317 Georgia drivers aged 16 were involved in a fatal crash (57/100,000 person-years) compared to 230 in the postenactment period (36/100,000 person-years; risk ratio [RR] 0.63; 95% confidence interval 0.53 to 0.75). Speed-related fatal crashes were cut by 42%, and alcohol-related fatal crashes decreased nearly 60%, without displacing fatal crashes to older age groups. These reductions greatly exceeded those noted in 2 of 3 comparison states and the nation overall. Conclusion: TADRA markedly reduced fatal crash rates among 16-year-old Georgia drivers. Fatal crashes were not displaced to older age groups. [Ann Emerg Med. 2006;47:361-369.] 0196-0644/$-see front matter Copyright © 2006 by the American College of Emergency Physicians. doi:10.1016/j.annemergmed.2006.01.007 INTRODUCTION Background and Importance Motor vehicle crashes are the leading cause of fatal injury in the United States. Young drivers experience fatal crashes at substantially higher rates than older drivers, 1–4 which is largely attributed to driver inexperience and the tendency of many adolescents to take risks. 4 –10 To reduce fatal crashes involving teenage drivers, 41 states and the District of Columbia have adopted graduated driver’s licensing systems. Most include a supervised learner’s period, subsequent issuance of a provisional license for a specified period, and then full-privilege licensing. 11–16 Graduated driver’s licensing systems vary widely by the strictness of their provisions. Published evaluations have found equally varying levels of effect. 17–22 Responding to public outcry about fatal crashes involving teen drivers, Georgia’s General Assembly implemented a tough approach to graduated driver’s licensing in July 1997. 23–25 Titled the Teenage and Adult Driver Responsibility Act, or TADRA, it targeted 3 major contributors to fatal crashes by teenaged motorists: inexperience, driving under the influence of alcohol, and excessive speeding. Along with every graduated driver’s licensing provision recommended by the National Highway Traffic Safety Administration (NHTSA), TADRA introduced “zero tolerance” for underage impaired driving in Georgia and a process of automatic license revocation for excessive speeding and other highly dangerous driving behaviors. In contrast to many graduated driver’s licensing systems, TADRA does not allow exceptions to its provisions. It Volume , . : April Annals of Emergency Medicine 361
-
Upload
independent -
Category
Documents
-
view
1 -
download
0
Transcript of Impact of Georgia’s Teenage and Adult Driver Responsibility Act
INJURY PREVENTION/ORIGINAL RESEARCH
Impact of Georgia’s Teenage and Adult Driver Responsibility Act
Angelyn Rios, BSMarlena Wald, MLS, MPHSascha R. Nelson, MPHKimberly J. Dark, BSMegan Emily Price, MSArthur L. Kellermann, MD, MPH
From the Center for Injury Control, Department of Emergency Medicine, School of Medicine(Wald, Nelson, Dark, Kellermann), and the Department of Biostatistics, Rollins School ofPublic Health (Price), Emory University School of Medicine, Atlanta, GA.
Study objective: In 1997, the Georgia General Assembly enacted the Teenage and Adult DriversResponsibility Act (TADRA), a comprehensive legislative package that attempted to reduce fatalcrashes of teenaged drivers by introducing graduated driver’s licensing, “zero tolerance” of underageimpaired drivers, and automatic license revocation for speeding greater than 25 miles per hour overthe posted limit and other dangerous driving behaviors. To determine whether TADRA reduced teendriving fatalities, we examine fatal crash rates involving various age groups before versus after thelaw was enacted.
Methods: Data from the Fatal Accident Reporting System were used to calculate annualized fatalcrash rates of various age groups of drivers during an 11-year interval 5½ years before TADRA wasenacted and 5½ years afterwards. To identify potential historical effects, Georgia’s experience wascompared to that of Alabama, South Carolina, and Tennessee, states that did not adopt equallycomprehensive legislation during the study period.
Results: During the preenactment period, 317 Georgia drivers aged 16 were involved in a fatal crash(57/100,000 person-years) compared to 230 in the postenactment period (36/100,000person-years; risk ratio [RR] 0.63; 95% confidence interval 0.53 to 0.75). Speed-related fatalcrashes were cut by 42%, and alcohol-related fatal crashes decreased nearly 60%, without displacingfatal crashes to older age groups. These reductions greatly exceeded those noted in 2 of 3comparison states and the nation overall.
Conclusion: TADRA markedly reduced fatal crash rates among 16-year-old Georgia drivers. Fatalcrashes were not displaced to older age groups. [Ann Emerg Med. 2006;47:361-369.]
0196-0644/$-see front matterCopyright © 2006 by the American College of Emergency Physicians.doi:10.1016/j.annemergmed.2006.01.007
INTRODUCTIONBackground and Importance
Motor vehicle crashes are the leading cause of fatal injury inthe United States. Young drivers experience fatal crashes atsubstantially higher rates than older drivers,1–4 which is largelyattributed to driver inexperience and the tendency of manyadolescents to take risks.4–10
To reduce fatal crashes involving teenage drivers, 41 states andthe District of Columbia have adopted graduated driver’s licensingsystems. Most include a supervised learner’s period, subsequentissuance of a provisional license for a specified period, and thenfull-privilege licensing.11–16 Graduated driver’s licensing systemsvary widely by the strictness of their provisions. Published
evaluations have found equally varying levels of effect.17–22Volume , . : April
Responding to public outcry about fatal crashes involvingteen drivers, Georgia’s General Assembly implemented a toughapproach to graduated driver’s licensing in July 1997.23–25
Titled the Teenage and Adult Driver Responsibility Act, orTADRA, it targeted 3 major contributors to fatal crashes byteenaged motorists: inexperience, driving under the influence ofalcohol, and excessive speeding. Along with every graduateddriver’s licensing provision recommended by the NationalHighway Traffic Safety Administration (NHTSA), TADRAintroduced “zero tolerance” for underage impaired driving inGeorgia and a process of automatic license revocation forexcessive speeding and other highly dangerous drivingbehaviors. In contrast to many graduated driver’s licensing
systems, TADRA does not allow exceptions to its provisions. ItAnnals of Emergency Medicine 361

Georgia’s Teenage and Adult Driver Responsibility Act Rios et al
also includes a meaningful and inescapable sanction—automaticlicense revocation—for those who violate its provisions.
Goals of This InvestigationTwo assessments conducted shortly after TADRA was
enacted revealed that fatal crashes involving 16- and 17-year-olddrivers promptly and sharply decreased.26,27 Both evaluationswere limited, however, by short follow-up intervals and possibleconfounding because of historical effects. To determine whetherTADRA’s effects were real and sustained, we analyzed data for alonger period. We also compared Georgia’s experience with thatof 3 neighboring states that enacted weaker graduated driver’slicensing laws during the same period.28–31
MATERIALS AND METHODSData Collection and Processing
Data on fatal crashes in Georgia and the neighboring statesof Alabama, South Carolina, and Tennessee were obtained from
Editor’s Capsule Summary
What is already known on this topicGraduated driver licensing systems have been adopted by41 states to reduce teenage fatality rates from motorvehicle crashes. Although published results of theselicensing statutes have been promising, regulations varywidely among states and results may vary, depending onthe specifics of implementation.
What question this study addressedThis study analyzed the effects of Georgia’s Teenage andAdult Driver Responsibility Act (TADRA), enacted inJuly 1997. Two analyses conducted shortly after theimplementation of TADRA indicated a sharp decrease inteenage mortality rates from motor vehicle crashes. Thegoal of the investigation was to determine whetherTADRA’s effects were sustained during a longer period.
What this study adds to our knowledgeThe investigators found that Georgia’s graduated driverlicensing system led to a 37% decrease in teenagemortality rates from motor vehicle crashes, which wassustained over time. The comprehensive nature ofTADRA’s provisions is likely a significant contributingfactor to the magnitude of the sustained reduction inteenage mortality rates.
How this might change clinical practiceThis study does not change clinical practice but haspolicy implications. States should consider the adoptionof comprehensive graduated driver’s licensing systemssuch as TADRA to reduce teenage mortality rates frommotor vehicle crashes.
NHTSA’s Fatality Analysis Reporting System (FARS). FARS
362 Annals of Emergency Medicine
captures data on all crashes in the United States that occur onpublic roadways and result in 1 or more deaths within 30 daysof the crash. FARS includes more than 180 driver, vehicle,scene, and crash variables. It is the criterion standard for studiesof this type.
Securing FARS data for calendar years 1992 through 2002allowed us to compare fatal crash rates by various age groups ofdrivers for 5½ years before and after TADRA was enacted inJuly 1997. A “driver fatal crash” was defined as a motor vehiclecrash involving a driver of a specified age that resulted in thedeath of the driver, another occupant of the driver’s vehicle, anoccupant of another vehicle struck by the driver’s vehicle, apedestrian, or multiple victims in the same crash. To calculateage-specific driver fatal crash rates, population data andintercensus estimates were obtained from the US Census Bureaufor calendar years 1992 to 2002.32 Because census and FARSdata are stripped of individual identifiers, our study was grantedexempt review by our university’s institutional review board.
TADRA was enacted during the 1997 session of the GeorgiaGeneral Assembly and took effect on July 1 of that year.23 Itcontains 3 major sets of provisions. Under TADRA, a class Dlicense is issued to persons aged at least 16 years who have held avalid instruction permit for 12 months and who, during thepreceding 12 months, were not convicted of driving under theinfluence of alcohol, hit and run, leaving the scene of anaccident, or any driving offense for which 4 or more points areassessed. Applicants must either complete an approved drivereducation course and 20 hours of supervised driving, including6 hours at night, or 40 hours of supervised driving, including 6hours at night. A parent or guardian must sign an affidavitattesting that the required hours of supervised driving weredone. When it was enacted, TADRA specified that class Dlicense holders could not legally drive between 1 AM and 5 AM.Also, class D holders could not operate a vehicle containingmore than 3 passengers younger than 21 years who were notmembers of the driver’s immediate family. These last 2provisions were strengthened in 2001 (Appendix E1, availableonline at http://www.annemergmed.com).33,34
Class D restrictions remain in effect until age 18. At thatpoint, an unrestricted class C license may be obtained if thedriver has held a valid class D license for at least 12 months andhas not been convicted of driving under the influence ofalcohol, hit and run, leaving the scene of an accident, or anydriving offense for which 4 or more points are assessed. Noteens younger than 18 years are issued an instructional permit ordriver’s license unless they are enrolled in or have graduatedfrom high school or they have a parent’s permission to withdrawfrom school. The instructional permit or driver’s license issuspended if an individual younger than 18 years drops out ofschool without parental permission, misses 10 consecutive daysof school without an excuse, or is suspended from school forthreatening or striking a teacher or school employee, possessingdrugs or alcohol on school property, or possessing a weapon on
school property.Volume , . : April

Rios et al Georgia’s Teenage and Adult Driver Responsibility Act
Under TADRA, any individual younger than 21 years anddetermined to have a blood alcohol concentration of 0.02 mg/dL or more within 3 hours of driving is guilty of driving underthe influence of alcohol. An offender automatically forfeits hisor her driver’s license for a minimum of 6 months. In Georgia,first conviction can also result in significant monetary penalties,jail time, and mandatory community service.
TADRA specifies that if drivers younger than 21 years arecited for speeding more than 24 miles per hour (MPH) over theposted limit (eg, 55 MPH in a zone posted for 30 MPH or 90MPH in a zone posted for 65 MPH), they automatically forfeittheir license for 6 months. Other offenses that trigger automaticlicense revocation include hit and run, leaving the scene of anaccident, racing or eluding an officer, reckless driving, any trafficoffense for which 4 or more points are assessed, underagepurchasing or attempting to purchase an alcoholic beverage, anddriving under the influence of alcohol. A first offense leads toautomatic license revocation for 6 months. A second offense (orany driving under the influence of alcohol with a blood alcoholconcentration of .08 or more) results in 12 months’ revocation.
In 2001, the Georgia General Assembly extended TADRA’scurfew hours for 16- and 17-year-old drivers to midnight to 6AM. It also restricted who can ride with a provisional driverduring the first 6 months to immediate family members.33,34
Primary Data AnalysisTo assess TADRA’s impact, we calculated driver fatal crash
rates for various age strata (16, 17, 18, 19, 20, 21 to 24, and�25 years) for 5½ years before enactment and 5½ yearsimmediately after enactment of the law. To identify whichprovisions were more effective, we examined TADRA’s impacton rates of fatal crashes involving alcohol (denoted by the FARSvariable “driver drinking”), speeding (denoted by the FARSvariables “driving too fast for conditions” or “in excess of postedspeed”), and late-night driving (denoted by the hour the fatalcrash occurred). To address the possibility that any decrease inGeorgia’s fatal crash rate was due to historical effects such asrising rates of seatbelt use, we compared Georgia’s experiencewith that of Alabama, South Carolina, and Tennessee, 3neighboring states that adopted weaker versions of graduateddriver’s licensing during the study period (Appendix E1,available online at http://www.annemergmed.com). Finally, todetermine whether TADRA might exert lasting effects on youngdrivers, we compared the fatal crash rate of the first cohort of16-year-old drivers to reach age 21 under TADRA (ie, 2002) tothe fatal crash rate among Georgia drivers who turned 21 in1997, the year TADRA went into effect.
Fatal crash rates were calculated by dividing the total numberof fatal crashes involving a driver of a particular age group bythe number of citizens in that age group during thecorresponding period and multiplying by 100,000. Rates werecalculated separately for drivers aged 16, 17, 18, 19, 20, 21 to24, and 25 years or older. Statistical significance was determinedusing �2, with � set at P�.01. Rate ratios and 95% confidence
intervals (CIs) were calculated as well. A generalized linearVolume , . : April
model was used to examine the effect of state (Georgia versusthe other 3 states), time (pre- versus postenactment), driver age,and the interaction between state and time. In this model, weused an overdispersed Poisson regression, which fit the datawell.35
RESULTSDuring the preenactment period, 317 Georgia drivers aged
16 were involved in a fatal crash (57/100,000 person-years)compared to 230 in the postenactment period (36/100,000person-years; RR 0.63; 95% CI 0.53 to 0.75), which representsa decrease of 37% compared to the preenactment period. BeforeTADRA, 16-year-old Georgians had a fatal crash rate 77%higher than that of Georgians aged 25 and older. After TADRA,the rate of fatal crashes among 16-year-old drivers in Georgiawas only 12.8% higher than that of drivers aged 25 and older.Enactment of TADRA was also associated with a significantdecrease in fatal crashes involving 17-year-old drivers, but thedecrease was not as great (54.8/100,000 preenactment to 44.4postenactment; RR 0.81; 95% CI 0.69 to 0.95). Fatal crashrates did not increase among 18-year-old drivers or any olderage group (Figure 1; Table E1, available online athttp://www.annemergmed.com).
After enactment of TADRA, the rate of speed-related fatalcrashes involving 16-year-old drivers was cut nearly in half,from 20.3/100,000 person-years to 10.3 (RR 0.51; 95% CI0.38 to 0.69). Among 17-year-old drivers, speed-related fatalcrashes decreased 25.1%, although this trend did not reachstatistical significance. Eighteen-year-old drivers were the onlyage group that did not experience a decrease in speed-relatedfatal crash rates (Figure 2; Table E2; available online at http://www.annemergmed.com).
In Georgia, fatal crashes involving impaired drivers youngerthan 18 years are rare. However, once drivers reach age 18, therate of alcohol-involved fatal crashes climbs steadily, peaking inthe 21- to 24-year age group. After TADRA was enacted,alcohol-related fatal crashes involving 16-year-old driversdecreased 62.1%, from 4.1/100,000 person-years preenactmentto 1.6 person-years postenactment (RR 0.38; 95% CI 0.18 to0.80). Alcohol-related fatal crashes among 17-year-old driversdecreased as well, but the difference was not statisticallysignificant (Figure 3; Table E3 available online athttp://www.annemergmed.com).
After enactment of TADRA, late-night fatal crashesinvolving 16-year-old drivers decreased 18% in the midnight to3 AM period and 36% in the 3 to 6 AM period. However,comparable or even greater decreases were noted in the 6 AM tonoon intervals and between 3 PM and midnight (data notshown, Figure E1; available online athttp://www.annemergmed.com).
During the 11-year study, overall rates of restraint use inGeorgia gradually increased from 50.6% in 1992 to 77.0% in2002.36 Georgia does not report age-specific rates of restraint use.FARS reports indicate whether restraints were worn by the driver or
occupants in a fatal crash but therefore offer at best only an indirectAnnals of Emergency Medicine 363

ver a
s by
Georgia’s Teenage and Adult Driver Responsibility Act Rios et al
measure of rates of restraint use. Although FARS data indicate thatrestraint use by 16-year-old Georgia drivers involved in a fatal crashsignificantly increased, from 34.4% in the preenactment period to54.2% in the postenactment period, and use by 16-year-old
16 y.o. 17 y.o. 18 y.o.
0
10
20
30
40
50
60
70
Rat
e p
er1
00,
00
0 P
op
ula
tio
n
Before: January 1992 to June 1997
After: July 1997 to December 2002
0.63 0.81 0.97Age Group
Rate Ratio(95% CI) (0.53-.75) (0.69-0.95) (0.83-1.12)
Figure 1. Fatal crash rates by dri
17 y.o.16 y.o. 18 y.o.
0
5
10
15
20
25
Rat
e p
er1
00,
00
0 P
op
ula
tio
n
0.51 0.75 1.04
Age Group
Rate Ratio
(95% CI) (0.38-0.69) (0.54-1.04) (0.77-1.39)
Before January 1992 to June 1997
After July 1997 to December 2002
Definiton: Speeding consisted of 'Driving too Fast for Cond
Figure 2. Speed-related fatal crash rate
passengers in fatal crashes increased from 29.4% preenactment to
364 Annals of Emergency Medicine
52.7% postenactment, similar or even greater increases in restraintuse were observed among other age groups that did not experiencecomparable decreases in fatal crash rates in the post-TADRAinterval (Table E4, available online at http://www.
19 y.o. 20 y.o. 21-24 y.o. 25+ y.o.
ver Age
0.92 0.93 0.88 0.99
.79-1.07) (0.79-1.08) (0.81-0.95) (0.96-1.03)
ge, pre- versus post-enactment.
y.o. 20 y.o. 21-24 y.o. 25+ y.o.
0.66 0.67 0.61 0.87
.48-0.93) (0.49-0.93) (0.52-0.72) (0.80-0.96)
iver Age
r In Excess of Posted Speed'
driver age, pre- versus post-enactment.
Dri
(0
19
(0
Dr
itions o
annemergmed.com).
Volume , . : April

s by
Rios et al Georgia’s Teenage and Adult Driver Responsibility Act
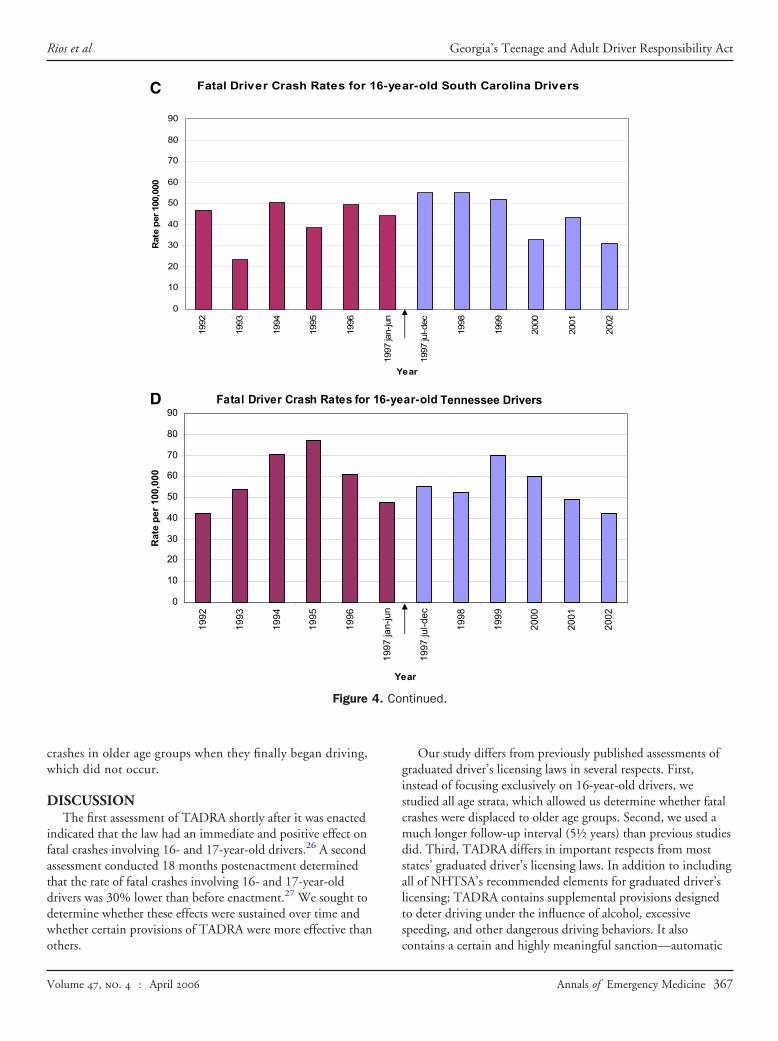
When TADRA took effect in July 1997, the rate of fatalcrashes involving 16-year-old Georgia drivers immediatelydecreased and did not return to preimplementation levelsduring the follow-up period (Figure 4A). No discernablepatterns were observed in the 3 comparison states (Figure 4B-D). The decrease in Georgia was significant (P�.01) but not inthe 3 comparison states.35
During the postenactment period, in Alabama there was amoderate decrease in fatal crashes involving 16- and 17-year-olds. In Tennessee, slight decreases were observed in all groupsexcept 18-year-olds. In South Carolina, fatal crash ratesincreased in all age groups (Table E5; available online at http://www.annemergmed.com). Before TADRA, fatal crash ratesamong 16-year-old Georgia drivers were similar to those of 16-year-old drivers in the 3 comparison states. After TADRA,Georgia’s rate of fatal crashes involving 16-year-old drivers was32% lower than Alabama’s, 18% lower than South Carolina’s,and 34% lower than Tennessee’s.
The first group of 21-year-old drivers to grow up underTADRA (ie, turned 21 in 2002) had a fatal crash rate 38%lower than that of Georgia drivers who turned 21 in 1997, theyear that TADRA was enacted. Speed-related fatal crashes of21-year-old drivers in 2002 were half that of 21-year-old driversin 1997, and the rate of alcohol-involved fatal crashes was 74%lower. Individuals involved in a fatal crash in 2002 had fewerprevious convictions for speeding, driving under the influenceof alcohol, or other dangerous driving infractions and fewerlicense suspensions for any reason than those who were involvedin a fatal crash in 1997 (Table E6, available online at http://
18 y.o.17 y.o.16 y.o.
0
2
4
6
8
10
12
14
16
18
Rat
e p
er1
00,
00
0 P
op
ula
tio
n
0.38 0.70 0.96
Age Group
Rate Ratio
(95% CI) (0.18-0.80) (0.40-1.25) (0.65-1.41)
Before: January 1992 to June 1997
After: July 1997 to December 2002
Definition: Alcohol involvement was from the FARS variable
by investigating officers at the crash scene
Figure 3. Alcohol-related fatal crash rate
www.annemergmed.com).
Volume , . : April
LIMITATIONSLocal or state law enforcement officers compile FARS reports
at the scene of the crash. It is possible that officers’ notation ofcontributing factors to a crash may be influenced byenforcement priorities in vogue at the time. We hoped to trackenforcement of TADRA by analyzing driver’s licensesuspensions before and after enactment. Unfortunately, stateofficials did not compile revocation data with sufficient rigor toallow this. Anecdotally, news of license suspensions circulatedwidely among teens, possibly amplifying the law’s deterrenteffect.
Increasing usage of safety belts may have contributedsomewhat to the overall decrease in fatal crash rates in thepostenactment period,37,38 but it is unlikely that belt use wasthe determining factor in the sharp decrease among 16-year-olds. First, safety belt use by drivers and occupants involved infatal crashes increased more among Georgia’s 18-year-olds thanamong 16-year-olds, without a commensurate decrease in fatalcrash rates. Second, there is no reason to believe that safety beltuse by 16-year-olds increased more in Georgia than in the 3comparison states. Finally, if restraint usage was, indeed, thedetermining factor, we would have expected fatal crash rates of16-year-old drivers to steadily decrease. Instead, we observed anabrupt and sustained decrease in fatal crashes that coincidedwith enactment of TADRA (Figure 4A).
In the past, highway safety researchers used counts oflicensed drivers as the denominator for calculating fatal crashrates. Unfortunately, it is no longer possible to obtain consistent
25+ y.o.21-24 y.o.20 y.o.y.o.
.68 0.77 0.67 0.82
6-1.00) (0.56-1.07) (0.57-0.78) (0.76-0.88)
er Age
Drinking' from the assessment
driver age, pre- versus post-enactment.
19
0
(0.4
Driv
'Driver
state-specific data about licensed drivers in the youngest age
Annals of Emergency Medicine 365

Georgia’s Teenage and Adult Driver Responsibility Act Rios et al
groups. The only national source of information on licenseddrivers is the Federal Highway Administration’s HighwayStatistics Series Table DL-22.39 In 1989, a Federal HighwayAdministration committee decided that the enumeration oflicensed drivers should not include class P (ie, instructionalpermit) holders or drivers with limited-use or restricted licenses.As a result of this rule change, Federal Highway Administrationstatistics significantly undercount drivers in the youngest agegroups, in which issuance of class P and class D restrictedlicenses is common, especially in states with graduated driver’s
Fatal Driver Crash Rates fo
0
10
20
30
40
50
60
70
80
90
1992
1993
1994
1995
1996
Rat
e p
er 1
00,0
00
Fatal Driver Crash Rates fo
0
10
20
30
40
50
60
70
80
90
1992
1993
1994
1995
1996
Rat
e p
er 1
00,0
00
A
B
Figure 4. Annual fatal crash rates involving 16-year-old driveContinued.
licensing laws.
366 Annals of Emergency Medicine
If TADRA merely discouraged many 16-year-olds fromobtaining a driver’s license, the decrease in fatal crash ratespost-TADRA might be due to fewer young drivers on theroad, rather than any meaningful change in driver behavior.State statistics indicate otherwise. Between 1992 and 2002,the annual number of 16-year-olds obtaining a driver’slicense in Georgia grew by 24.5% (unpublished data,Georgia Department of Motor Vehicles). Unfortunately, wecould not obtain comparable statistics from the comparisonstates. Had tens of thousands of 16-year-olds delayed
- year-old Georgia Drivers
1997
jul-d
ec
1998
1999
2000
2001
2002
ear
year- old Alabama Drivers19
97 ju
l-dec
1998
1999
2000
2001
2002
ear
A, Georgia; B, Alabama; C, South Carolina; D, Tennessee.
r 16
1997
jan-
jun
Y
r 16-
1997
jan-
jun
Y
rs in
licensure because of TADRA, we should have seen more fatal
Volume , . : April
. Co
Rios et al Georgia’s Teenage and Adult Driver Responsibility Act
crashes in older age groups when they finally began driving,which did not occur.
DISCUSSIONThe first assessment of TADRA shortly after it was enacted
indicated that the law had an immediate and positive effect onfatal crashes involving 16- and 17-year-old drivers.26 A secondassessment conducted 18 months postenactment determinedthat the rate of fatal crashes involving 16- and 17-year-olddrivers was 30% lower than before enactment.27 We sought todetermine whether these effects were sustained over time andwhether certain provisions of TADRA were more effective than
0
10
20
30
40
50
60
70
80
90
1992
1993
1994
1995
1996
Rat
e p
er 1
00,0
00
Fatal Driver Crash Rates for 1
C
D
Fatal Driver Crash Rates for 16
0
10
20
30
40
50
60
70
80
90
1992
1993
1994
1995
1996
Rat
e p
er 1
00,0
00
Figure 4
others.
Volume , . : April
Our study differs from previously published assessments ofgraduated driver’s licensing laws in several respects. First,instead of focusing exclusively on 16-year-old drivers, westudied all age strata, which allowed us determine whether fatalcrashes were displaced to older age groups. Second, we used amuch longer follow-up interval (5½ years) than previous studiesdid. Third, TADRA differs in important respects from moststates’ graduated driver’s licensing laws. In addition to includingall of NHTSA’s recommended elements for graduated driver’slicensing; TADRA contains supplemental provisions designedto deter driving under the influence of alcohol, excessivespeeding, and other dangerous driving behaviors. It also
1997
jul-d
ec
1998
1999
2000
2001
2002
ar
ar-old Tennessee Drivers
ar- old South Carolina Drivers
1997
jul-d
ec
1998
1999
2000
2001
2002
ear
ntinued.
1997
jan-
jun
Ye
6- ye
- ye
1997
jan-
jun
Y
contains a certain and highly meaningful sanction—automatic
Annals of Emergency Medicine 367

Georgia’s Teenage and Adult Driver Responsibility Act Rios et al
license revocation—for individuals who violate its provisions.Finally, rather than simply report Georgia’s experience, wecompared it to that of 3 neighboring states, a strategyrecommended by McCartt.40
Our findings suggest that TADRA has achieved impressiveresults. Five and a half years after enactment, the fatal crash rate of16-year-old Georgia drivers was 37% lower than in thepreenactment period. This effect size is equal to that reported instates in which graduated driver’s licensing has been most successful(Appendix E2, available online at http://www.annemergmed.com).We found no evidence of displacement to older age groups. In fact,fatal crashes involving 17-year-old drivers also decreased.
Before TADRA, speeding accounted for one third of all fatalcrashes involving 16-year-old drivers in Georgia. After TADRA,speed-related fatal crashes involving this age group were cut inhalf. Alcohol-related fatal crashes decreased by more than 60%.These findings suggest but do not prove that TADRA’ssupplemental provisions were important contributors to theoverall impact of the law.
To exclude historical effects, we compared Georgia’sexperience to that of 3 neighboring states that adopted weakerversions of graduated driver’s licensing.28–31,41 Two of the 3states experienced modest decreases in fatal crash rates, whereasrates increased in the third state. None of the 3 statesexperienced decreases as great as those observed in Georgia.Nationwide, fatal crash rates involving 16-year-old driversdecreased an average of 14.8% during the 11-year study, half ofthat observed in Georgia during the same period.
Why was TADRA not more effective among older teens? Atage 16, most teens are still living at home and subject to thesupervision of parents or guardians.42,43 By 17 years of age,many adolescents have acquired enough driving experience tobecome overconfident. They may also be less responsive toparental disapproval. By age 18 years, many teens are livingindependently. They may also find it easier to obtain alcohol.
One way to quantify the potential impact of TADRA is toproject the number of fatal crashes that might have occurred ifGeorgia had not adopted the law. Using Alabama’s moderatedecrease in fatal crash rates as the “best case” and SouthCarolina’s increase as the “worst case,” between 220 and 430additional fatal crashes might have occurred during the 5½-yearfollow-up interval if the Georgia General Assembly had failed toenact TADRA. Because a fatal crash can claim more than 1 life,the number of lives saved was probably higher still.
In conclusion, enactment of TADRA was associated with a37% decrease in the rate of fatal crashes involving 16-year-olddrivers. Fatal crashes were not displaced to older age groups.TADRA’s benefits were sustained over time. If other statesadopt similarly comprehensive approaches to graduated driver’slicensing, they may realize similar benefits.
Supervising editor: Brent R. Asplin, MD, MPH
Paul J. Tremont was the National Highway Traffic Safety
Administration (NHTSA) project officer who assisted with this368 Annals of Emergency Medicine
project. The opinions, findings, and recommendationscontained herein are those of the authors and do notnecessarily represent those of the NHTSA.
Author contributions: AR, MW, and AK conceived the study,designed the analysis, and obtained research funding. AR andMW obtained the FARS and US Census data. AR conductedkey data analyses, assisted by SN, KD and MEP. SN and KDcreated the tables and figures. MEP conducted additionalstatistical analyses. MW researched the legislative history andlegal review; AK drafted the manuscript, and all authorscontributed substantially to its revision. AK and AR takeresponsibility for the paper as a whole.
Funding and support: This research was supported, in part, bythe National Highway Traffic Safety Administration (NHTSA),US Department of Transportation, under CooperativeAgreement No. DTNH22-03-H-05147.
Publication dates: Received for publication June 22, 2005.Revisions received October 18, 2005, and December 12,2005. Accepted for publication January 6, 2006.
Presented at the Society for Academic Emergency Medicineannual meeting, May 2005, New York, NY.
Reprints not available from the authors.
Address for correspondence: Arthur L. Kellermann, MD, MPH,Department of Emergency Medicine, Emory University Schoolof Medicine, 1365 Clifton Road, Suite B6200, Atlanta, GA30322; 404-778-2600, fax 404-778-2630; [email protected].
REFERENCES1. United States Department of Transportation, National Highway
Traffic Safety Administration. Addressing the Safety IssuesRelated to Younger and Older Drivers: A Report to Congress.United States Department of Transportation, National HighwayTraffic Safety Administration; 1993.
2. Liu JY, Mooney DP, Meyer MM, et al. Teenage driving fatalities.J Pediatr Surg. 1998;33:1084-1088.
3. McKnight AJ, McKnight AS. The behavioral contributors to highwaycrashes of youthful drivers. Annu Proc Assoc Adv Automot Med.2000;44:321-333.
4. Gonzales MM, Dickinson LM, DiGuiseppi C, et al. Student drivers:a study of fatal motor vehicle crashes involving 16-year-olddrivers. Ann Emerg Med. 2005;45:140-146.
5. O’Malley PM, Johnston LD. Unsafe driving by high school seniors:national trends from 1976 to 2001 in tickets and accidents afteruse of alcohol, marijuana and other illegal drugs. J Stud Alcohol.2003, 64:305-312.
6. Ulmer RG, Williams AF, Preusser DF. Crash involvements of 16-year-old drivers. J Safety Res. 1997;28:97-103.
7. Williams AF. Teenage drivers: patterns of risk. J Safety Res.2003;34:5-15.
8. Mayhew DR, Simpson HM, Pak A. Changes in collision ratesamong novice drivers during the first months of driving. Accid AnalPrev. 2003;35:683-691.
9. Phebo L, Dellinger AM. Young driver involvement in fatal motorvehicle crashes and trends in risk behaviors, United States,1988-95. Inj Prev. 1998;4:284-287.
10. Martinez R. Teen crash victims: who are these people and why
are they here? Ann Emerg Med. 2005;45:155-156.Volume , . : April
f.
Rios et al Georgia’s Teenage and Adult Driver Responsibility Act
11. Insurance Institute for Highway Safety. U.S. licensing systems foryoung drivers: laws as of January 2005. Available at:http://www.hwsafety.org/safety%5Flaws/us_licensing_systems.pdAccessed March 8, 2005.
12. Waller PF. The genesis of GDL. J Safety Res. 2003;34;17-23.13. Shope JT, Molnar LJ. Graduated driver licensing in the United
States: evaluation results from the early programs. J Safety Res.2003;34:63-69.
14. Simpson HM. The evolution and effectiveness of graduatedlicensing. J Safety Res. 2003:34:25-34.
15. Fildes B, Langford J. Graduated licensing programmes and young-driver crashes. Lancet. 2002;359:725-726.
16. National Highway Traffic Safety Administration. Graduated driverlicensing systems. Ann Emerg Med. 2005;45:639.
17. Agent K, Steenbergen L, Pigman J, et al. Impact of the GraduatedDriver License Program in Kentucky on Teen Motor VehicleCrashes. Lexington, KY: Kentucky Injury Prevention and ResearchCenter; 2001.
18. Foss RD, Feaganes JR, Rodgman EA. Initial effects of graduateddriver licensing on 16-year-old driver crashes in North Carolina.JAMA. 2001;286:1588-1592.
19. Hyde LK, Cook LJ, Knight S, et al. Graduated driver licensing inUtah: is it effective? Ann Emerg Med. 2005;45:147-154.
20. Office of the Governor’s Highway Safety Representative, OhioDepartment of Public Safety. Evaluation of Ohio’s graduateddriver license program. Available at:http://www.publicsafety.ohio.gov/news/gdlreport.pdf. AccessedMarch 8, 2005.
21. Shope JT, Molnar LJ, Elliott MR, et al. Graduated driver licensingin Michigan: early impact on motor vehicle crashes among 16-year-old drivers. JAMA. 2001;286:1593-1598.
22. Ulmer RG, Preusser DF, Williams AF, et al. Effect of Florida’sgraduated licensing program on the crash rate of teenage drivers.Accid Anal Prev. 2000;32:527-532.
23. 40 OCGA 5 §22, 24,57.1.24. 14 Georgia State University Law Review 203 (December, 1997).25. Firestone D. Bid to raise driving age is roiling rural Georgia. New
York Times. March 14, 2001:A-12.26. Rios AM, Georgia Highway Safety 1999 Fact Book: A Report on
Highway Safety in Georgia. Atlanta, GA: Governor’s Office of
Highway Safety; 1999:8–9.Volume , . : April
27. Rios AM, Young Drivers in Georgia: The Teenage and Adult DriverResponsibility Act, a Supplement to the Georgia Highway Safety2000 Fact Book. Atlanta, GA: Governor’s Office of HighwaySafety; 2000.
28. 54 Alabama Law Review 1473 (Summer, 2003).29. South Carolina Code Annotated 1 §175,176,180.30. Tennessee Code Annotated 6 §3017.31. Tennessee Code Annotated 50 §301-304, 311, 312, 322.32. US Department of Commerce, Census Bureau. Estimates of the
population of the United States by single year of age and sex.Available at: http://www.census.gov/popest/datasets.html.Accessed April 11, 2005.
33. 40 OCGA 5 § 26 and 40 OCGA 6 § 391.34. 18 Georgia State University Law Review 205 (Fall, 2001).35. McCulloch CE, Searle SR. Generalized, Linear, and Mixed Models.
New York, NY: John Wiley & Sons; 2001:135-155.36. University of Georgia, Cooperative Extension Service, Survey
Research Center. Georgia Governor’s Office of Highway Safety:Occupant Protection Survey. Athens, GA: University of Georgia;2002.
37. Loeb PD. The effectiveness of seat belt legislation in reducingvarious driver-involved injury rates in California. Accid Anal Prev.1993;25:189-197.
38. McKnight RH, Dawson SK. Seat belt use in Kentucky: acomparison of five measures. J Kentucky Med Assoc. 1996;94:110-114.
39. US Department of Transportation, Federal HighwayAdministration, Highway Statistical Series. Report identifying statedriver licenses and fees. Available at: http://www.fhwa.dot.gov/ohim/hsguide/ch4.pdf. Accessed March 29, 2005.
40. McCartt AT. Graduated driver licensing systems: reducing crashesamong teenage drivers. JAMA. 2001;286:1631-1632.
41. Williams AF, Mayhew DR. Graduated Licensing: A Blueprint forNorth America. Arlington, VA: Insurance Institute for HighwaySafety, Highway Loss Data Institute; 2003.
42. Beck KH, Shattuck T, Raleigh R, et al. Does graduated licensingempower parents to place greater restrictions on their newlylicensed teens’ driving? Health Educ Behav. 2003;30:695-708.
43. Simons-Morton BG, Hartos JL. How well do parents manage
young driver crash risks? J Safety Res. 2003;34:91-97.Did you know?
You can save your online searches and get the results by e-mail.
Visit www.annemergmed.com today to see what else is new online!
Annals of Emergency Medicine 369

369.e1 Anna
ivers in speeding-related fatal crashes in Georgia before and after enactment of TADRA, number and rateulation.*
Before AfterChange in Age-Specific Rate, %
RateRatioNumber Rate Number Rate
113 20.3 66 10.3 �49.12 0.5178 14.0 67 10.5 �25.12 0.7582 15.2 100 15.7 3.63 1.0485 14.8 65 9.9 �33.52 0.6686 14.9 66 10.1 �32.75 0.67
373 16.0 244 9.7 �39.12 0.61963 3.9 965 3.4 �12.63 0.87
1992 to June 1997; after July 1997 to December 2002.
ivers in alcohol-involved fatal crashes in Georgia before and after enactment of TADRA, number and rate pulation.*
Before AfterChange in Age-Specific Rate, %
RateRatioNumber Rate Number Rate
23 4.1 10 1.6 �62.12 0.3826 4.7 21 3.3 �29.59 0.7048 8.9 54 8.5 �4.4 0.9659 10.3 46 7.0 �32.22 0.6876 13.2 67 10.2 �22.74 0.77
381 16.3 273 10.9 �33.31 0.671521 6.2 1428 5.1 �18.14 0.82
1992 to June 1997; after July 1997 to December 2002.
orgia drivers in fatal crashes before and after enactment of TADRA, number and rate per 100,000 popula
Before AfterChange in Age-Specific Rate, %
RateRatioNumber Rate Number Rate
317 57.0 230 36.1 �36.8 0.63306 54.8 284 44.4 �19.1 0.81339 62.6 385 60.4 �3.5 0.97316 55.2 335 50.8 �7.8 0.92306 53.2 324 49.3 �7.2 0.93
1,300 55.8 1,228 49.0 �12.1 0.887,882 32.1 8,991 32.0 �0.5 0.99
1992 to June 1997; after July 1997 to December 2002.
Table E2. Dr per100,000 pop
Driver’sAge, y 95% CI
16 0.38–0.6917 0.54–1.0418 0.77–1.3919 0.48–0.9220 0.49–0.93
21–24 0.52–0.72�24 0.80–0.96
*Before January
Table E3. Dr er100,000 pop
Driver’sAge, y 95% CI
16 0.18–0.8017 0.40–1.2518 0.65–1.4119 0.46–1.0020 0.56–1.07
21–24 0.57–0.78�24 0.76–0.88
*Before January
Table E1. Ge tion.*
Driver’sAge, y 95% CI
16 0.53–0.7517 0.69–0.9518 0.83–1.1219 0.79–1.0720 0.79–1.08
21–24 0.81–0.95�24 0.96–1.03
*Before January
ls of Emergency Medicine Volume 47, . : April

Table E4. Seat belt usage by drivers and passengers in fatal crashes in Georgia before and after enactment of TADRA, numberand percentage belted.*
Driver’sAge, y Occupant
Before After
Change, %RateRatio 95% CINumber Rate Number Rate
16 Driver 109 34.4 125 54.3 19.9 2.27 1.60–3.22Passenger 102 29.4 128 52.7 23.3 2.67 1.90–3.76Total occupants 211 31.8 253 53.5 21.7 2.47 1.94–3.15
17 Driver 94 30.7 167 58.8 28.1 3.22 2.29–4.52Passenger 84 30.2 123 50.8 20.6 2.39 1.67–3.42Total occupants 178 30.5 290 55.1 24.6 2.80 2.19–3.58
18 Driver 86 25.4 185 48.1 22.7 2.72 1.98–3.73Passenger 66 22 166 62.2 40.2 5.83 4.03–8.42Total occupants 152 23.8 351 53.8 30 3.74 2.94–4.74
�24 Driver 2,911 36.9 4,998 55.6 18.7 2.14 2.01–2.28Passenger 1,281 32.2 2,324 46.1 13.9 1.80 1.65–1.96Total occupants 4,192 35.3 7,322 52.2 16.9 2.00 1.90–2.10
*Before January 1992 to June 1997; after July 1997 to December 2002.
Table E5. Drivers in fatal crashes before and after enactment of TADRA by state, number and rate per 100,000 population.*
Driver’s Age, y Population
Before
Population
AfterRateRatio 95% CINumber Rate Number Rate
Georgia16 555,849 317 57.0 638,024 230 36.1 0.63 0.53–.7517 557,993 306 54.8 640,103 284 44.4 0.81 0.69–0.9518 541,423 339 62.6 637,158 385 60.4 0.97 0.83–1.1219 572,815 316 55.2 658,934 335 50.8 0.92 0.79–1.0720 575,712 306 53.2 656,951 324 49.3 0.93 0.79–1.0821–24 2,331,907 1,300 55.8 2,505,619 1,228 49.0 0.88 0.81–0.95�24 24,531,405 7,882 32.1 28,135,895 8,991 32.0 0.99 0.96–1.03
Alabama16 337,896 232 68.7 344,089 183 53.2 0.77 0.64–0.9417 353,025 235 66.6 358,083 201 56.1 0.84 0.70–1.0218 341,222 206 60.4 354,695 264 74.4 1.23 1.03–1.4819 356,925 257 72.0 363,441 274 75.4 1.05 0.88–1.2420 355,836 253 71.1 361,162 242 67.0 0.94 0.79–1.1221–24 1,402,550 916 65.3 1,356,391 806 59.4 0.91 0.83–1.00�24 14,911,945 5,838 39.1 15,838,143 5,788 36.5 0.93 0.90–0.97
South Carolina16 286,289 120 41.9 300,453 132 43.9 1.05 0.82–1.3417 298,994 133 44.5 317,600 168 52.9 1.19 0.95–1.4918 291,490 197 67.6 318,643 224 70.3 1.04 0.86–1.2619 309,390 175 56.6 333,955 211 63.2 1.12 0.91–1.3720 311,976 204 65.4 335,888 234 69.7 1.07 0.88–1.2921–24 1,258,835 747 59.3 1,244,555 775 62.3 1.05 0.95–1.16�24 12,873,265 4,478 34.8 14,237,855 5,664 39.8 1.14 1.10–1.19
Tennessee16 399,159 239 59.9 423,456 231 54.6 0.89 0.74–1.0717 402,611 268 66.6 430,360 242 56.2 0.84 0.71–1.0118 389,264 289 74.2 426,157 332 77.9 1.05 0.90–1.2319 408,101 291 71.3 437,879 321 73.3 1.0281 0.88–1.2120 408,573 285 69.8 435,493 302 69.3 0.99 0.85–1.1721–24 1,641,313 1,021 62.2 1,651,956 994 60.2 6.60 6.18–7.05�24 18,550,441 6,407 34.5 20,369,597 6,783 33.3 0.96 0.930–1.00
*Before January 1992 to June 1997; after July 1997 to December 2002.
Volume 47, . : April Annals of Emergency Medicine 369.e2

Table E6. Characteristics of drivers aged 21 years in fatal crashes in Georgia after enactment of TADRA compared with driversaged 21 years in 1997 before TADRA enactment, number and rate per 100,000 population.*
Age 21 y in 1997 Age 21 y in 2002Change in Age-Specific Rate, %
RateRatio 95% CINumber Rate Number Rate
Driver HistorySpeeding convictions 51 50.1 25 19.5 �61.1 0.39 0.24–0.63Alcohol convictions 7 6.9 2 1.6 �77.3 0.23 0.05–1.09Other convictions 29 28.5 12 9.4 �67.1 0.33 0.17–0.65License suspensions 26 25.3 9 7 �72.5 0.28 0.13–0.59
Driver crash eventTotal crashes 72 70.7 56 43.7 �38.2 0.62 0.44–0.88Speeding crashes 24 23.6 15 11.7 �50.4 0.50 0.26–0.94Alcohol crashes 27 26.5 9 7 �73.6 0.26 0.12–0.56
*Before January 1992 to June 1997; after July 1997 to December 2002.
369.e3 Annals of Emergency Medicine Volume 47, . : April

Appendix E1. Comparisons of key features of the graduated licensing laws for Georgia, Alabama, Tennessee, and South Carolina(as of August 31, 2004).
Specific Feature of Law,Date(s) Implemented
Georgia, 2001,Revised
Alabama,2002
Tennessee,2001
SouthCarolina, 1998
Learners’ permitsDriving permits can be issued to persons as
young as 15 yX X X X
At 14 if a hardshipsituation is proven
X
Written parental consent required to securea permit (legal guardians and other legallyrecognized family members �21 y mayconsent as well)
X X X XWith proof of
insurance
X
Graduated license processWritten parental consent required to secure
a conditional license (legal guardians andother legally recognized family members�21 y may consent as well)
X X X XWith proof of
insurance
Conditional license issued after specifiednumber of months
X12 mo
X12 mo
X6 mo
X6 mo
Conditional license issued after documentednumber of hours of behind-the-wheeldriving with licensed parent or guardian
X40 h (6 At night)
X30 h
X50 h (10 At night)
X40 h (10 At night)
Conditional license issued after documentedsuccessful completion of a high schooldrivers’ education class or a state-authorized driving school to fulfill behind-the-wheel experience
X X X
Age of driving instructor limited to �21 y(parents, guardians, or other instructors)
X
Conditional license issued after thesuccessful completion of a written test
X X X X X
Passenger restrictionsRestrictions about the number of
passengers in vehicle of conditionallicense holder
XNot �3
XNot �3
X�4
X�1
X�2
During the first 6 mo of a conditionallicense, only immediate family memberscan be transported by the driver
X
Specific features of lawCurfewsHolders of a conditional license are subject
to a curfew period when they are notallowed to drive
X1-5 AM
XCurfew extended to
midnight–6 AM
XMidnight–6 AM
X11 PM–6 AM
XMidnight–6 AM
Suspension of license: linkage tosecondary education
Provisions to address and link schoolsuspension and expulsion informationfrom state Department of Education tosuspension of conditional license by DMV
X X X
Conditional license issuance and rightslinked to school attendance or successfulsecondary school completion (eg,graduation or GED)
X X X X
Suspension of license: moving violationsWritten request for revocation of license
may be made by parent, guardian, orother legally recognized adult
X
Conditional driver with 4 or more points onhis or her license for moving violations willhave license suspended (such violationsinclude reckless driving, not wearing aseatbelt, leaving the scene of anaccident, hit and run, resisting or eludinglaw enforcement officers)
X X X XSix points required,
rather than 4points
Volume 47, . : April Annals of Emergency Medicine 369.e4

Appendix E1. Comparisons of key features of the graduated licensing laws for Georgia, Alabama, Tennessee, and South Carolina(as of August 31, 2004).
Specific Feature of Law,Date(s) Implemented
Georgia, 2001,Revised
Alabama,2002
Tennessee,2001
SouthCarolina, 1998
Conditional driver with 2 suspensions of hisor her license will have license revokedand have to undergo a period revocationand retesting/reapplication
X X X
Suspension of license: DUI“Zero tolerance” for any driver �21 y with a
BAC �.02, which will lead to immediatesuspension of his or her license
X X X
Specific features of the lawConditional driver arrested for DUI with a
BAC of �.08 will have a 6-mo revocationof license
X X
Conditional driver arrested for DUI with aBAC of �.08 will have his or her licenserevoked and will have to undergo a retestof on-road driving skills
X
Conditional drivers arrested for DUI willspend a minimum of 1 day in jail, perform40 hours of community service
X
ExemptionsIndividuals who are �16 y, who are married,
emancipated minors, or heads ofhousehold are exempt from theconditional licensing process
No No Yes No No
Behind-the-wheel driving experience may bewaived at the request of parent orguardian
No No Yes No No
Exemption to conditional licensing processfor high school graduates �18 y
No No No Yes No
Exemptions about the number ofpassengers for occasions in whichconditional license holder is transportingparent(s) or guardian(s) or going to andfrom school with siblings or otherunrelated individuals
No No Yes Yes Yes
Modifications to increase the number ofpassengers may be requested andgranted on petition of parent(s),guardian(s), or school officials
No No Yes No Yes
Specific feature of the lawCurfew exceptions for conditional license
holders allow them to drive if they aredriving to and from work, in an emergencysituation, to or from a religious event,with parent(s) or guardian(s) in car
Yes Rescinded X XWritten note
required; hunting/fishing tripincluded too
XAlso includes
travel foropportunity foremployment
Exemptions to this law for military personnel No No Yes Yes YesExemptions to this law for drivers from other
states, with valid licensesNo No Yes Yes Yes
Exemptions for the driving of agriculturalvehicles by minors
Yes Yes Yes Yes Yes
Insurance Institute of Highway Safety’srating of state GDL law (Williams andMayhew41)
n/a Good Fair Good Marginal
BAC, Blood alcohol concentration; DUI, driving under the influence of alcohol.
369.e5 Annals of Emergency Medicine Volume 47, . : April

Appendix E2. Peer-reviewed evaluations of state graduated licensing laws.*
State Date Enacted Periods Evaluated Populations Studied Effect Size Reported
Florida (Ulmer, 2000) 7/1996Amended 2001
1995 Vs 1997 Primary group: 17-y-old drivers,with analyses of 15, 16,and 18-y-olds
Comparison groups:25- to 54-y-old drivers;Florida data compared to that
of similar age groups inAlabama
Fatal or injury crashes for 16-y-olddrivers:
1995: 5,570/172,554population estimate for 16-y-olds
1996: 5,781/182,640population estimate for 16-y-olds
1997: 5,388/185,689population estimate for 16-y-olds
Postenactment decrease per1,000 16-y-old drivers: �10%
Kentucky (Agent, 2001) 10/1996 1993–1995Vs 1997–1999
Primary group: 16- to 17-y-oldsComparison groups: 19-y-olds
and above
Postenactment decreases per1,000 16-y-old drivers:
Crashes: �30%Injury crashes: �33%Fatal crashes: �31%
Michigan (Shope, 2001) 4/1997 1996 Vs 1998 and 1999 Primary group: 16-y-oldsComparison group: Drivers
�25 y
Driver fatal crashes for 16-y-olds:1996: 54/1,000 population1998: 41/1,000 population1999: 37/1,000 populationAdjusted risk of a fatal crash
among 16-y-old drivers: �25%North Carolina (Foss, 2001) 12/1997 1999 Vs 1996
1999 vs 1997Primary group: 16-y-oldsComparison group: drivers 25–
54 y
Driver fatal crashes for 16-y-olds:1996: 5/1,111 all crashes per
10,000 population1997: 5/1,181 all crashes per
10,000 population1999: 2/855 all crashes per
10,000 populationPostenactment decrease in fatal
crash rate per 1,000 16-y-olddrivers: �57%
Ohio (Kilgore, 2001) 10/1997Amended 2004
1988–1999Subanalyses for 1999 vs
1996 and 1997
Primary group: 16-y-oldsComparison group: drivers 25–
54 y old
Driver fatal crashes for 16-y-olds:1996: 57/10,000 registered
drivers1997: 49/10,000 registered
drivers1999: 47/10,000 registered
drivers1988: 64/10,000 registered
driversPostenactment reduction in fatal
crash rate per 1,000 16-y-olddrivers: �17.5%
Utah (Hyde, 2004) 7/1999 1/1996–6/19997/1/1999–6/30/2001
Primary group: 16-y-olds Postenactment crashes per1,000 16-y-old drivers: totalcrashes: �5%; injury crashes:no significant difference
*Principal author of article used to extract data in parentheses beneath state name.
Volume 47, . : April Annals of Emergency Medicine 369.e6

MN-2:59 AM 3:00-5:59 AM 6:00-8:59 AM 9:00-11:59 AM Noon-2:29 PM 3:00-5:59 PM 6:00-8:59 PM 9:00-11:59 PM-60
-50
-40
-30
-20
-10
0
10
20
30
40
Time Period
Dec
reas
e in
Rat
e
+
+
+
+
Figure E1. Percent change in fatal crash rates involving 16-year-old drivers by time of day before and after enactment of
TADRA in Georgia, 1992-2002. (Rate per 100,000 population).369.e7 Annals of Emergency Medicine Volume 47, . : April