Impact of Capital Adequacy and Cost Income Ratio on ...
13
International Journal of Management Research, Vol. 8, No. 1, June 2017 6 Impact of Capital Adequacy and Cost Income Ratio on Performance of Nepalese Commercial Banks Radhe Shyam Pradhan Uniglobe College (affiliated to Pokhara University), Kathmandu, Nepal E-mail: [email protected] Pratikshya Parajuli Free Lance Researcher, Kathmandu, Nepal Abstract This study examines the effect of capital adequacy and cost income ratio on the performance of Nepalese commercial banks. The return on assets and net interest margin are the dependent variables. The independent variables are capital adequacy ratio, cost income ratio, debt to equity ratio, equity capital to assets, bank size and liquid ratio. The main sources of the data include various Banking and Financial Statistics and Bank Supervision Reports published by Nepal Rastra Bank and annual reports of the selected commercial banks. This study is based on the secondary sources of the data that are collected from 20 Nepalese commercial banks through 2009-10 to 2014-15 leading to a total of 120 observations. The regression models are estimated to test the significance and effect of capital adequacy and cost income ratio on the performance of Nepalese commercial banks. The study shows that there is positive relationship of bank size with return on assets. This indicates that larger the banks, higher would be the return on assets. However, the study shows that there is negative relationship of capital adequacy, cost income ratio, equity capital to total assets ratio and liquidity ratio with return on assets. This indicates that increase in capital adequacy ratio, cost income ratio, equity capital to total assets ratio and liquidity ratio leads to increase in return on assets. Similarly, the study observed that higher the equity capital to total assets, lower would be the return on assets. Similarly, the study observed that there is a negative relationship of cost income ratio and liquidity ratio with return on equity. This indicates that higher the cost income ratio and liquidity ratio, lower would be the return on equity. The regression results show that bank size has positive impact on bank performance. However, the study reveals that capital adequacy ratio, cost income ratio, and equity capital to total assets has negative impact on return on assets. Keyword: capital adequacy, debt to equity, bank size, liquidity Introduction A strong financial system stimulates investment by funding productive business opportunities, mobilizing savings, allocating resources and facilitating trade of goods and services. Kinnon (1973) reported that the efficiency of a financial system plays an important role in determining the rate of savings, investment decisions, technological innovations and hence the rate of economic growth.
-
Upload
khangminh22 -
Category
Documents
-
view
1 -
download
0
Transcript of Impact of Capital Adequacy and Cost Income Ratio on ...

International Journal of Management Research, Vol. 8, No. 1, June 2017
6
Impact of Capital Adequacy and Cost Income Ratio on Performance of Nepalese Commercial Banks
Radhe Shyam Pradhan
Uniglobe College (affiliated to Pokhara University), Kathmandu, Nepal E-mail: [email protected]
Pratikshya Parajuli Free Lance Researcher, Kathmandu, Nepal
Abstract
This study examines the effect of capital adequacy and cost income ratio on the performance of Nepalese commercial banks. The return on assets and net interest margin are the dependent variables. The independent variables are capital adequacy ratio, cost income ratio, debt to equity ratio, equity capital to assets, bank size and liquid ratio. The main sources of the data include various Banking and Financial Statistics and Bank Supervision Reports published by Nepal Rastra Bank and annual reports of the selected commercial banks. This study is based on the secondary sources of the data that are collected from 20 Nepalese commercial banks through 2009-10 to 2014-15 leading to a total of 120 observations. The regression models are estimated to test the significance and effect of capital adequacy and cost income ratio on the performance of Nepalese commercial banks. The study shows that there is positive relationship of bank size with return on assets. This indicates that larger the banks, higher would be the return on assets. However, the study shows that there is negative relationship of capital adequacy, cost income ratio, equity capital to total assets ratio and liquidity ratio with return on assets. This indicates that increase in capital adequacy ratio, cost income ratio, equity capital to total assets ratio and liquidity ratio leads to increase in return on assets. Similarly, the study observed that higher the equity capital to total assets, lower would be the return on assets. Similarly, the study observed that there is a negative relationship of cost income ratio and liquidity ratio with return on equity. This indicates that higher the cost income ratio and liquidity ratio, lower would be the return on equity. The regression results show that bank size has positive impact on bank performance. However, the study reveals that capital adequacy ratio, cost income ratio, and equity capital to total assets has negative impact on return on assets.
Keyword: capital adequacy, debt to equity, bank size, liquidity
Introduction A strong financial system stimulates investment by funding productive business opportunities, mobilizing savings, allocating resources and facilitating trade of goods and services. Kinnon (1973) reported that the efficiency of a financial system plays an important role in determining the rate of savings, investment decisions, technological innovations and hence the rate of economic growth.

International Journal of Management Research, Vol. 8, No. 1, June 2017
7
Banking has become an important feature, which renders service to the people in financial matters, and its magnitude of action is extending day by day. The capital structure of banks is highly regulated. Capital adequacy helps bankers and regulators to absorb any shocks that the bank may experience. Capital plays an important role in reducing the number of bank failures and losses to depositors. Capital adequacy plays a crucial role for reducing different risk components in banking industry, and it is necessary to reduce moral hazard and competitiveness. Furthermore, banks must have enough capital to provide funds for its internal needs and for expansion as well as ensure security for depositors. Adequacy of capital is also affected by expected economic conditions of the entire economy. According to the Christian et al. (2008), capital adequacy measures provide significant information regarding a firm's returns; while a few of the individual variables representing asset quality and earnings are informative. Size and growth and loan exposure measures do not appear to have any significant explanatory power when examining returns. Fiordelisi et al. (2010) revealed that higher level of capital tends to have a positive effect on efficiency
levels of the banks. Banks are expected to absorb the losses from the normal earnings, but there may be
some unanticipated losses which cannot be absorbed by normal earnings. Capital becomes useful on
such abnormal loss situation to cushion off the losses. In this way, capital plays an insurance function.
Adequate capital in banking is a confidence booster. It provides the customer, the public and the
regulatory authority with confidence in the continued financial viability of the bank. Capital (equity and
long-term debt) represents a source of funds to the bank along with deposits and borrowings. Pringle
(1971) observed that an undercapitalized bank will find itself subjected to high levels of short-term
borrowing at potentially high excess costs during periods of tight money. Flamini et al. (2009) suggested
that bank returns are affected by macroeconomic variables, suggesting that macroeconomic policies
that promote low inflation and stable output growth to boost credit expansion. Cotter (1966) noted
capital does affect lending and it has implications for the performance of banks as financial
intermediaries and hence for the allocation of real resources within the economy.
Berger (1995) found evidence for a positive relationship between the ratios of capital to assets and
returns on equity. The study further, argued that a higher capital ratio (with reduced risk of bankruptcy)
should reduce a bank’s cost of funds, both by reducing the price of funds and the quantity of funds
required, thus improving a bank’s net interest income and hence profitability. Smirlock (1985) found a
positive and significant relationship between size and bank profitability. Additionally, Pasiouras and
Kosmidou (2007) also found that larger banks might have a higher degree of production and loans
diversification than smaller ones. Naceur and Goaied (2008) studied the banking performance of twelve
Tunisian deposit banks over the period of 1995-2005 and found a significant positive relationship
between size and return on assets. Similarly, Sinkey and Greenawalt (1991) concluded that larger banks
are more profitable than smaller ones.
The importance of bank profitability can be assessed at the microeconomic level and macroeconomic
level (Aburime, 2009). At the microeconomic level, the result is essential for the competition and it is the
source of funds. At the macroeconomic level, a solid and profitable banking sector can withstand
International Journal of Management Research, Vol. 8, No. 1, June 2017
8
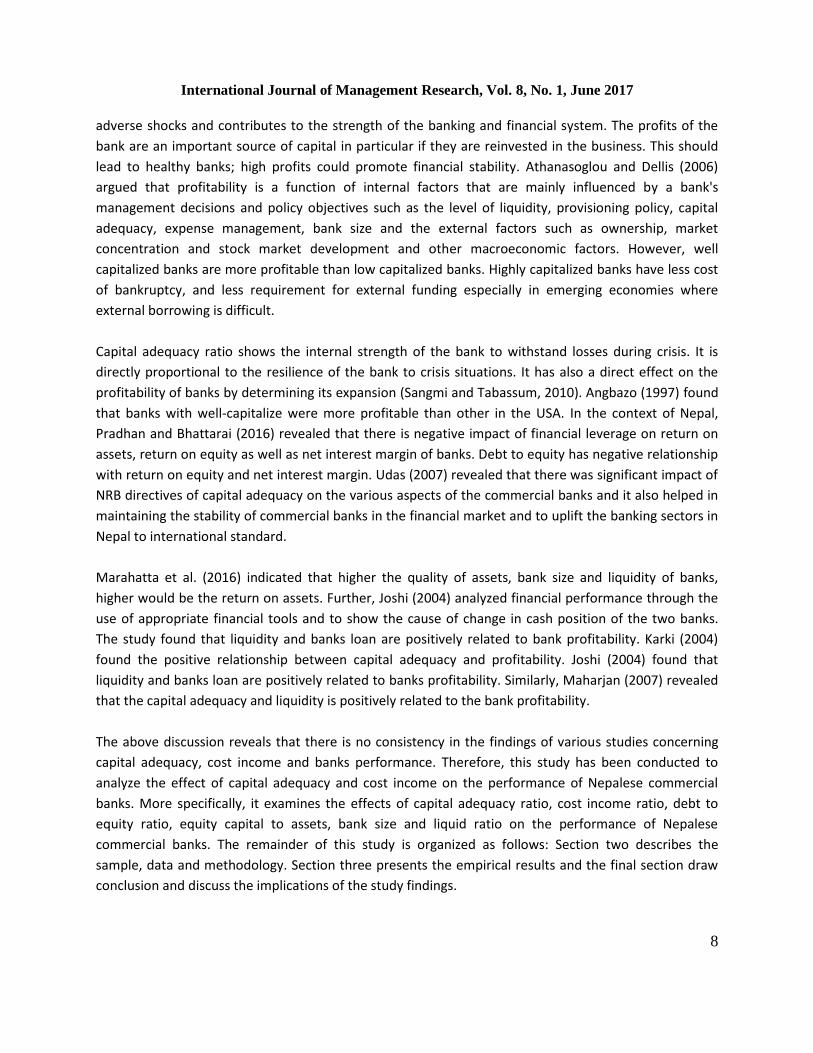
adverse shocks and contributes to the strength of the banking and financial system. The profits of the
bank are an important source of capital in particular if they are reinvested in the business. This should
lead to healthy banks; high profits could promote financial stability. Athanasoglou and Dellis (2006)
argued that profitability is a function of internal factors that are mainly influenced by a bank's
management decisions and policy objectives such as the level of liquidity, provisioning policy, capital
adequacy, expense management, bank size and the external factors such as ownership, market
concentration and stock market development and other macroeconomic factors. However, well
capitalized banks are more profitable than low capitalized banks. Highly capitalized banks have less cost
of bankruptcy, and less requirement for external funding especially in emerging economies where
external borrowing is difficult.
Capital adequacy ratio shows the internal strength of the bank to withstand losses during crisis. It is
directly proportional to the resilience of the bank to crisis situations. It has also a direct effect on the
profitability of banks by determining its expansion (Sangmi and Tabassum, 2010). Angbazo (1997) found
that banks with well-capitalize were more profitable than other in the USA. In the context of Nepal,
Pradhan and Bhattarai (2016) revealed that there is negative impact of financial leverage on return on
assets, return on equity as well as net interest margin of banks. Debt to equity has negative relationship
with return on equity and net interest margin. Udas (2007) revealed that there was significant impact of
NRB directives of capital adequacy on the various aspects of the commercial banks and it also helped in
maintaining the stability of commercial banks in the financial market and to uplift the banking sectors in
Nepal to international standard.
Marahatta et al. (2016) indicated that higher the quality of assets, bank size and liquidity of banks,
higher would be the return on assets. Further, Joshi (2004) analyzed financial performance through the
use of appropriate financial tools and to show the cause of change in cash position of the two banks.
The study found that liquidity and banks loan are positively related to bank profitability. Karki (2004)
found the positive relationship between capital adequacy and profitability. Joshi (2004) found that
liquidity and banks loan are positively related to banks profitability. Similarly, Maharjan (2007) revealed
that the capital adequacy and liquidity is positively related to the bank profitability.
The above discussion reveals that there is no consistency in the findings of various studies concerning
capital adequacy, cost income and banks performance. Therefore, this study has been conducted to
analyze the effect of capital adequacy and cost income on the performance of Nepalese commercial
banks. More specifically, it examines the effects of capital adequacy ratio, cost income ratio, debt to
equity ratio, equity capital to assets, bank size and liquid ratio on the performance of Nepalese
commercial banks. The remainder of this study is organized as follows: Section two describes the
sample, data and methodology. Section three presents the empirical results and the final section draw
conclusion and discuss the implications of the study findings.

International Journal of Management Research, Vol. 8, No. 1, June 2017
9
Methodological Aspects The study is based on the secondary data, which were gathered for 20 commercial banks in Nepal from 2009/10 to 2014/15 leading to a total of 120 observations. The data are collected from various issues of Banking and Financial Statistics and Bank Supervision Report published by Nepal Rastra Bank and annual reports of the selected commercial banks. Table 1 shows the number of commercial banks selected for the study along with the study period and number of observations. Table 1: Number of commercial banks selected for the study along with the study period and number of observations
S.N Name of the banks Study Period Observations
1 Agricultural Development Bank (ADBL) 2009/10-2014/15 6
2 Citizen bank Ltd (CZBIL) 2009/10-2014/15 6
3 Everest Bank Ltd (EBL) 2009/10-2014/15 6
4 Himalayan Bank Ltd (HBL) 2009/10-2014/15 6
5 Janata Bank Ltd (JBNL) 2009/10-2014/15 6
6 Kumari Bank Ltd (KBL) 2009/10-2014/15 6
7 Laxmi Bank Ltd (LBL) 2009/10-2014/15 6
8 Machhapuchchhre Bank Ltd (MBL) 2009/10-2014/15 6
9 Nabil Bank limited (NABIL) 2009/10-2014/15 6
10 Nepal Bangladesh Bank Ltd (NBB) 2009/10-2014/15 6
11 Nepal Bank Ltd (NBL) 2009/10-2014/15 6
12 Nepal Credit & Commerce Bank (NCCB) 2009/10-2014/15 6
13 Nepal Investment Bank Ltd (NIBL) 2009/10-2014/15 6
7
7
14 Nepal SBI Bank Ltd (SBI) 2009/10-2014/15 6
15 NMB Bank Ltd (NMB) 2009/10-2014/15 6
16 Prime Commercial Bank Ltd (PCBL) 2009/10-2014/15 6
17 Siddhartha Bank Ltd (SBL) 2009/10-2014/15 6
18 Standard Chartered Bank Ltd (SCB) 2009/10-2014/15 6
7
7
19 Sunrise Bank Ltd (SRBL) 2009/10-2014/15 6
7
7
20 Rastriya Banijya Bank Limited(RBB) 2009/10-2014/15 6
7
7
Total number of observations 120
Thus, the study is based on 120 observations.
The model As the first approximation, the model estimated in this study assumes that performance of the Nepalese commercial banks depends on capital adequacy, cost income ratio, debt to equity, equity capital to assets, bank size and liquid ratio. Therefore, the model takes the following form:
ROA=β0+β1CA+β2CIR+β3ECA+β4DE+β5LR+β6BS+έ NIM=β0+β1CA+β2CIR+β3ECA+β4DE+β5LR+β6BS+ έ
Where,

International Journal of Management Research, Vol. 8, No. 1, June 2017
10
ROA = Return on assets ROE = Return on equity NIM = Net interest margin CA = Capital adequacy CIR = Cost to income ratio ECA = Equity capital to total assets ratio DE = Debt to equity ratio LR = Liquidity ratio BS = Bank size Return on Assets (ROA) Return on assets show percentage of how profitable a company’s assets are in generating revenue. The ratio measures the efficiency of a firm at generating profits from each unit of assets employed. Companies that require large initial investments will generally have lower return on assets. It shows the company’s ability to generate profits before leverage, rather than by using leverage. It is calculated by dividing a company’s net income by its total assets, and is displayed as a percentage. The higher ROA is regarded as better because the company is earning more money on less investment (Naceur, 2003). Net Interest Margin (NIM) Net interest margin calculated by dividing net interest income by average earning assets. It is usually expressed as a percentage of what the financial institution earns on loans in a time period and other assets minus the interest paid on borrowed funds divided by the average amount of the assets on which it earned income in that period. Net interest margin measures the gap between the interest income the bank receives on loans and securities and interest cost of its borrowed funds. A higher net interest margin could reflect riskier lending practices associated with substantial loan loss provisions (Khrawish, 2011). Capital adequacy (CAQ) The capital adequacy ratio (CAR) is a measure of a bank's capital. It is expressed as a percentage of a bank's risk weighted credit exposures. According to Mathuva (2009), bank profitability is positively related to the core capital ratio and tier 1 risk based capital ratio. Capital adequacy is more important for financial institutions of developing economies, because it provides more strength to survive in the financial crises and increased safety for depositors in difficult macroeconomics (Deger and Adem, 2011). Angbazo (1997) found that net interest margins are positively related to core capital. Based on it, this study develops the following hypothesis: H1: There is positive relationship between capital adequacy and bank performance. Equity Capital to Total Assets Ratio (ECA) Capital to assets ratio is an endogenous variable for determining profitability. Banks with a higher level of capital are viewed as having a safety net in case of liquidation. Being better insured from bankruptcy they also enjoy a lower cost of capital contributing to their profitability. A well-capitalized bank has more flexibility to both pursue unexpected opportunities and deal with unpredicted losses and is thus more profitable. Capital to assets ratio is an endogenous variable for determining profitability. According to Oladele et al. (2012), there exists a strong positive relation between equity capital to total assets and
International Journal of Management Research, Vol. 8, No. 1, June 2017
11
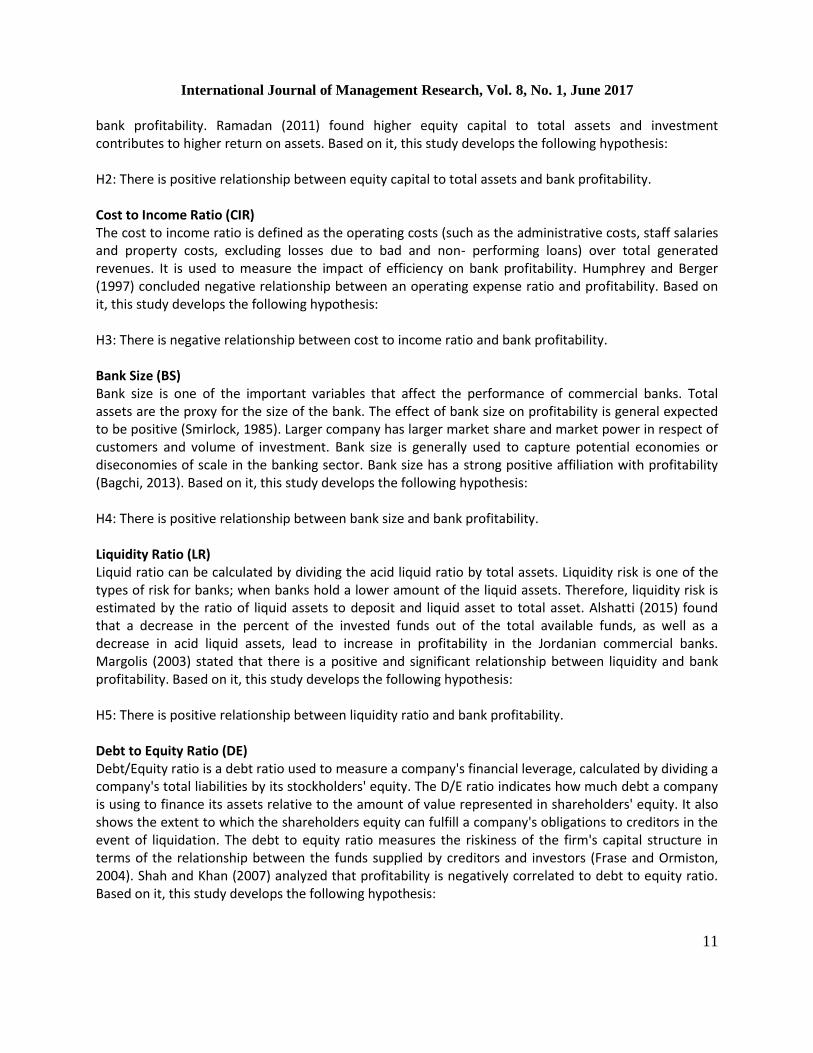
bank profitability. Ramadan (2011) found higher equity capital to total assets and investment contributes to higher return on assets. Based on it, this study develops the following hypothesis: H2: There is positive relationship between equity capital to total assets and bank profitability. Cost to Income Ratio (CIR) The cost to income ratio is defined as the operating costs (such as the administrative costs, staff salaries and property costs, excluding losses due to bad and non- performing loans) over total generated revenues. It is used to measure the impact of efficiency on bank profitability. Humphrey and Berger (1997) concluded negative relationship between an operating expense ratio and profitability. Based on it, this study develops the following hypothesis: H3: There is negative relationship between cost to income ratio and bank profitability. Bank Size (BS) Bank size is one of the important variables that affect the performance of commercial banks. Total assets are the proxy for the size of the bank. The effect of bank size on profitability is general expected to be positive (Smirlock, 1985). Larger company has larger market share and market power in respect of customers and volume of investment. Bank size is generally used to capture potential economies or diseconomies of scale in the banking sector. Bank size has a strong positive affiliation with profitability (Bagchi, 2013). Based on it, this study develops the following hypothesis: H4: There is positive relationship between bank size and bank profitability. Liquidity Ratio (LR) Liquid ratio can be calculated by dividing the acid liquid ratio by total assets. Liquidity risk is one of the types of risk for banks; when banks hold a lower amount of the liquid assets. Therefore, liquidity risk is estimated by the ratio of liquid assets to deposit and liquid asset to total asset. Alshatti (2015) found that a decrease in the percent of the invested funds out of the total available funds, as well as a decrease in acid liquid assets, lead to increase in profitability in the Jordanian commercial banks. Margolis (2003) stated that there is a positive and significant relationship between liquidity and bank profitability. Based on it, this study develops the following hypothesis: H5: There is positive relationship between liquidity ratio and bank profitability. Debt to Equity Ratio (DE) Debt/Equity ratio is a debt ratio used to measure a company's financial leverage, calculated by dividing a company's total liabilities by its stockholders' equity. The D/E ratio indicates how much debt a company is using to finance its assets relative to the amount of value represented in shareholders' equity. It also shows the extent to which the shareholders equity can fulfill a company's obligations to creditors in the event of liquidation. The debt to equity ratio measures the riskiness of the firm's capital structure in terms of the relationship between the funds supplied by creditors and investors (Frase and Ormiston, 2004). Shah and Khan (2007) analyzed that profitability is negatively correlated to debt to equity ratio. Based on it, this study develops the following hypothesis:

International Journal of Management Research, Vol. 8, No. 1, June 2017
12
H6: There is negative relationship between debt to equity ratio and bank profitability. Results and discussion Table 2 presents the descriptive statistics of the selected dependent and independent variables during the period 2009/10 to 2014/15. Table 2: Descriptive statistics
Variable N Minimum Maximum Mean Std. Dev
ROA 120 -0.25 14.07 1.88 2.36
ROE 120 -78.32 102.37 17.85 20.62
CAQ 120 -11.24 69.29 10.30 7.57
CIR 120 22.4 118.22 43.49 16.61
ECA 120 -9.69 59.18 7.77 6.77
DE 120 -81.04 101.2 10.18 17.73
LR 120 5.05 150.94 18.77 14.15
BS 120 21.58 25.74 24.41 0.68
This table shows the descriptive statistics of dependent and independent variables of commercial banks for the study period 2009/10 to 2014/15. The dependent variables are return on assets (ROA defined as net income divided by total assets in percentage) and return on equity (ROE defined as the ratio of net income to total shareholders' equity in percentage) whereas, capital adequacy (CAQ defined as core capital divided by total assets, in percentage), cost income ratio (CIR defined as operating expenses to operating income in percentage), equity capital to total assets (ECA defined as total equity divided by total assets in percentage), debt to equity ratio (DE defined as total liabilities to total equity in times), liquidity ratio (LR defined as liquid fund divided by total assets in percentage), bank size (BS measured in terms of total assets, Rs in million) are independent variables. Table 2 shows that return on assets ranges from a minimum of -0.25 percent to a maximum of 14.07 percent leading to an average of 1.88 percent. The average return on equity of selected banks during the study period is noticed to be 17.85 percent with minimum of -78.32 percent and a maximum of 102.37 percent. Likewise, capital adequacy has minimum ratio of -11.24 percent to maximum of 69.29 percent with an average ratio of 10.30 percent. Cost to income ratio ranges from a minimum of 22.4 percent to maximum of 118.22 percent with an average of 43.49 percent. Equity capital to total assets ratio of selected banks ranges from a minimum of -9.69 percent to maximum of 59.18 percent with an average of 7.77 percent. Similarly, debt to equity ratio ranges from a minimum of -81.04 times to the maximum of 10.18 times, leading to an average of 10.18 times. Liquidity ratio ranges from a minimum of 5.05 percent to the maximum of 18.77 percent with an average of 18.77 percent. Correlation analysis Having indicated the descriptive statistics, the Pearson correlation coefficients have been computed and results are presented in the Table 3.

International Journal of Management Research, Vol. 8, No. 1, June 2017
13
Table 3: Pearson correlation matrix
ROA ROE CAQ CIR ECA DE LR
ROA 1 ROE 0.226* 1
CAQ -0.106 0.078 1 CIR -0.268** -0.337** -0.195* 1
ECA -0.105 0.067 0.972** -0.15 1 DE 0.043 0.783** 0.091 -0.161 0.104 1
LR -0.119 -0.093 0.600** 0.008 0.565** -0.092 1
BS 0.472** 0.16 -0.618** 0.076 -0.601** 0.076 -0.366**
** Sign indicates that correlation is significant at 1 percent level. * Sign indicates that correlation is significant at 5 percent level. This table shows the bivariate Pearson correlation coefficients between dependent and independent variables. The dependent variables are return on assets (ROA defined as net income divided by total assets in percentage) and return on equity (ROE defined as the ratio of net income to total shareholders' equity in percentage) whereas, capital adequacy (CAQ defined as core capital divided by total assets, in percentage), cost income ratio (CIR defined as operating expenses to operating income in percentage), equity capital to total assets (ECA defined as total equity divided by total assets in percentage), debt to equity ratio (DE defined as total liabilities to total equity in times), liquidity ratio (LR defined as liquid fund divided by total assets in percentage), bank size (BS measured in terms of total assets, Rs in million) are independent variables. Table 3 shows that there is positive relationship of debt to equity ratio and bank size with return on assets. This means that higher the debt-equity ratio, higher would be the return on assets. It also indicates that higher the bank size, higher would be the return on assets. However, there is negative relationship of capital adequacy, cost income ratio, equity capital to total assets ratio and liquidity ratio with return on assets. This means that higher the capital adequacy, lower would be return on assets. It also indicates that higher the cost income ratio, lower would be the return on assets. Similarly, the study observed that higher the equity capital to total assets, lower would be the return on assets. The result also shows that there is positive relationship of capital adequacy, equity capital to total assets, bank size and debt to equity ratio with return on equity. This means that higher the capital adequacy, higher would be return on equity. It also indicates that higher the equity capital to assets, higher would be return on equity. Similarly, the study observed that larger the bank, higher would be the return on equity. However, there is negative relationship of cost income ratio and liquidity ratio with return on equity. This means that increase in higher the cost income ratio and liquidity ratio leads to increase in return on equity. Regression analysis Having indicated the Pearson correlation coefficients, the regression analysis has been performed and the results are presented in the Table 4, which shows the regression result of capital adequacy, cost income ratio, debt to equity ratio, equity capital to assets, bank size and liquid ratio on return on assets.

International Journal of Management Research, Vol. 8, No. 1, June 2017
14
Table 4 shows that the beta coefficient of debt to equity ratio and bank size are positive with return on assets. This indicates that higher the debt to equity ratio, higher would be the return on assets. This finding is consistent with the findings of Angbazo (1997). The result also indicates that larger the bank, higher would be the return on assets, which is significant at 1 percent level of significance. This finding is consistent with the findings of Bagchi (2013). Table 4: Estimated regression results of CAQ, CIR, ECA, DE, LR and BS on return on assets
Model Intercept Regression coefficient of Adj_R
2 SEE F
CAQ CIR ECA DE LR BS
1 2.22 (6.10)***
-0.03 (-1.16)
0.003 2.35 1.34
2 3.54 (6.04)***
-0.04 (-3.03)***
0.06 2.28 9.16
3 2.17 (6.60)***
-0.04 (-1.15)
0.003 2.35 1.33
4 1.82 (7.31)***
0.01 (0.47)
0.01 2.37 0.22
5 2.25 (6.30)***
-0.02 (-1.30)
0.01 2.35 1.70
6 -38.26 (-5.55)***
1.65 (5.82)***
0.22 2.09 33.86
7 -55.05 (-6.33)***
-0.09 (-3.01)***
2.29 (6.59)***
0.27 2.02 22.63
8 -38.36 (-5.90)***
-0.04 (-3.10)***
1.73 (6.46)***
0.31 1.97 27.06
9 -53.72 (-6.12)***
-0.11 (-2.85)***
0.01 (0.56)
-0.01 (-0.74)
2.25 (6.42)***
0.25 2.04 11.04
10 -51.51 (-6.17)***
-0.07 (-2.43)**
-0.04 (-3.54)***
2.23 (6.69)***
0.33 1.93 20.77
The asterisk signs (***) and (**) indicate that the results are significant at 1 percent and 5 percent level respectively.
The results are based on the panel data of 20 commercial banks with 120 observations for the period of 2009/2010 to 2014/15 by using linear regression model. The model is ROAit=β0+β1CAit+β2CIRit+β3ECAit+β4DEit+β5LRit+β6BSit+ έit where, ROA is return on assets defined as net income divided by total assets, in percentage is the dependent variable and CAQ is capital adequacy defined as core capital divided by total assets, in percentage, CIR is cost income ratio defined as operating expenses to operating income, in percentage, ECA is equity capital to total assets defined as total equity divided by total assets in percentage, DE is debt to equity ratio defined as total liabilities to total equity, in times, LR is liquidity ratio defined as liquid fund divided by total assets, in percentage, BS is bank size defined as natural logarithm of total assets in million are independent variables. The study also reveals that the beta coefficient of capital adequacy, cost income ratio, equity capital to total assets, and liquidity ratio are negative with return on assets. This indicates that higher the capital adequacy ratio, lower would be the return on assets. This finding is consistent with the findings of Barnor and Odonkor (2012). The negative beta coefficient of cost income ratio indicates that higher the cost income ratio, lower would be the return on assets, which is significant at 5 percent level of

International Journal of Management Research, Vol. 8, No. 1, June 2017
15
significance. This finding is consistent with the findings of Oino (2015). The result also indicates that higher the equity capital to total assets, lower would be return on assets. This finding is consistent with the findings of Goddard et al. (2004). Likewise, the result indicates that higher the liquidity ratio, lower would be the return on assets. This finding is consistent with the findings of Pasiouras and Kosmidou (2007) and contradicts with the findings of Margolis (2003). The regression of capital adequacy, cost income ratio, equity capital to total assets, debt-equity ratio, bank size and liquidity ratio on net interest margin is presented in Table 5. Table 5 shows that beta coefficient is positive for cost income ratio and bank size with net interest margin. This indicates that higher the cost income ratio, higher would be the net interest margin. However, the coefficients are not significant at 5 percent level of significance. This finding is consistent with the findings of Ramadan (2011). The positive beta coefficient of bank size indicates that lager the bank, higher would be the net interest margin, where coefficients are not significant at 5 percent level of significance. This finding is consistent with the findings of Sufian (2010). Table 5: Estimated regression results of CAQ, CIR, ECA, DE, LR and BS on net interest margin
Model
Intercept Regression of NIM R2
SEE F
CAQ CIR ECA DE LR BS
1 3.42 (23.73)***
-0.01 (-0.93)
0.001 0.93 0.86
2 3.01 (12.60)***
0.01 (1.38)
0.007 0.93 1.89
3 3.33 (25.54)***
-0.002 (-0.17)
0.008 0.94 0.03
4 3.43 (33.90)***
-0.003 (-0.55)
0.006 0.94 0.31
5 3.67 (26.80)***
-0.02 (-3.19)***
0.07 0.90 10.15
6 -5.91 (-1.98)**
0.38 (3.10)***
0.07 0.90 9.59
7 3.83 (23.83)***
-0.12 (-2.58)**
-0.16 (3.12)***
-0.01 (1.23)
-0.02 (-3.25)***
0.14 0.87 5.88
8 -3.8 (-0.96)
0.01 (1.15)
-0.004 (-0.78)
-0.01 (-2.33)**
0.26 (2.04)**
0.10 0.89 4.31
9 -0.92 (-2.44)**
-0.12 (-2.59)**
0.01 (0.93)
-0.16 (3.17)***
0.50 (3.37)***
0.15 0.86 6.10
10 -10.66 (-2.88)***
-0.06 (3.6)***
0.01 (1.94)*
-0.01 (-1.57)
-0.03 (-4.01)***
0.56 (3.77)***
0.19 0.84 6.39
The asterisk signs (***) and (**) indicate that the results are significant at 1 percent and 5 percent level respectively. The results are based on the panel data of 20 commercial banks with 120 observations for the period of 2009/2010 to 2014/15 by using linear regression model. The model is NIMit=β0+β1CAit+β2CIRit+β3ECAit+β4DEit+β5LRit+β6BSit+ έit where, NIM is net interest margin defined as net interest income divided by total assets, in percentage is the dependent variable and CAQ is capital

International Journal of Management Research, Vol. 8, No. 1, June 2017
16
adequacy defined as core capital divided by total assets, in percentage, CIR is cost income ratio defined as operating expenses to operating income, in percentage, ECA is equity capital to total assets defined as total equity divided by total assets in percentage, DE is debt to equity ratio defined as total liabilities to total equity, in times, LR is liquidity ratio defined as liquid fund divided by total assets, in percentage, BS is bank size defined as natural logarithm of total assets in million are independent variables. The study also reveals negative beta coefficient for capital adequacy, equity capital to total assets, debt to equity ratio and liquidity ratio with net interest margin. This indicates that higher the capital adequacy, lower would be the net interest margin. This finding is consistent with the findings of Barnor and Odonkor (2012). The result also indicates that higher the equity capital to total assets, lower would be the net interest margin. This finding is consistent with the findings of Wasiuzzaman and Tarmizi (2003). Similarly, the negative beta coefficient of debt to equity ratio reveals that higher the debt equity ratio, lower would be the net interest margin. However, the coefficients are not significant at 5 percent level of significance. This finding is consistent with the findings of Pradhan and Bhattarai (2016). The result indicates that higher the liquidity ratio, lower would be the net interest margin. The beta coefficient is significant at 5 percent level of significance. This finding is consistent with the findings of Pasiouras and Kosmidou (2007). Summary and Conclusion Capital adequacy plays a crucial role for reducing different risk components in banking industry, and it is necessary to reduce moral hazard and competitiveness. Furthermore, banks must have enough capital to provide funds for its internal needs and for expansion as well as ensure security for depositors. Adequacy of capital is also affected by expected economic conditions of the entire economy. The capital structure of banks is highly regulated. Capital adequacy helps bankers and regulators to absorb any shocks that the bank may experience. Capital plays an important role in reducing the number of bank failures and losses to depositors. This study attempts to determine the effect of capital adequacy ratio, cost income ratio, debt to equity ratio, equity capital to assets, bank size and liquid ratio. The study is based on the secondary data of 20 commercial banks with 120 observations for the period of 2009/10 to 2014/15. The study reveals that there is positive relationship of debt to equity ratio with return on assets. This means that higher the debt-equity ratio, higher would be the return on assets. It also indicates that higher the bank size, higher would be the return on assets. However, there is negative relationship of capital adequacy, cost income ratio, equity capital to total assets ratio and liquidity ratio with return on assets. This means that higher the capital adequacy, lower would be return on assets. It also indicates that higher the cost income ratio, lower would be the return on assets. Similarly, the study observed that higher the equity capital to total assets, lower would be the return on assets. The result also shows that there is positive relationship of capital adequacy, equity capital to total assets, bank size and debt to equity ratio with return on equity. This means that higher the capital adequacy, higher would be return on equity. It also indicates that higher the equity capital to assets, higher would be return on equity. Similarly, the study observed that larger the bank, higher would be the return on equity. The regression results show that beta coefficients are positive and significant for bank size at 5 percent level of significance. The study also reveals that beta coefficients are negative for capital adequacy ratio, cost income ratio, and equity capital to total assets. However, the beta coefficients are not significant at 5 percent level of significance.

International Journal of Management Research, Vol. 8, No. 1, June 2017
17
References Aburime, U. (2009). Determinats of bank profitability company levels: Evidence from Nigeria.
International Journal of Economics, 3(2), 231-237. Angbazo, L. (1997). Commercial bank net interest margins, default risk, interest-rate risk, and off-
balance sheet banking. Journal of Banking and Finance, 21(1), 55-87. Athanasoglou, P., and M. Dellis (2006). Determinants of bank profitability in the South Eastern European
region. Bank of Greece Working Paper. Bagchi, B. (2013). Liquidity-profitability relationship: Empirical evidence from Indian fast moving
consumer goods firms. International Journal of Applied Management Science, 5(4), 355-376. Barnor, C., and T. Odonkor (2012). Capital adequacy and the performance of Ghanaian banks. Journal of
Business Research, 6(1), 1-6. Berger, A. N. (1995). The profit-structure relationship in banking-tests of market-power and efficient-
structure hypotheses. Journal of Money, Credit and Banking, 27(2), 404-431. Christian, C., J. Moffitt, and L. Suberly (2008). Fundamental analysis for evaluating bank performance:
What variables provide the greatest insight into future earnngs. Journal of Banking and Accounting, 22(1), 17-24.
Deger, A., and A. Adem (2011). Bank specific and macroeconomic determinants of commercial bank profitablity: Emprical evidence from Turkey. Business and Economics Research Journal, 2(2), 139-152.
Goddard, P. Molyneux, and J. Wilson (2004). The profitability of European bank: A cross sectional and dynamic panel analysis. Journal of Managerial Finance, 72(3), 363-381.
Humphrey, D., and A. Berger (1997). Efficiency of financial institutions: International survey directions for future research. European Journal of Operational Research, 98(3), 175-212.
Joshi, R. K. (2004). Liquidity ratio and profitability of the banks. The Journal of Nepalese Business Studies, 2(4), 12-18.
Marahatta, S., S. Devkota, S. D. Shrestha, S. Pradhan , and S. Bhandari (2016). Determinants of banks performance: A case of Nepalese commercial banks. Nepalese Journal of Management, 3(1), 82-94.
Mathuva, D. (2009). Capital adeqquacy, cost income ratio and the performance of commercial banks: The Kenyan scenario. The International Jounal of Applied Economics and Finance, 3(2), 35-47.
Margolis, P., and R, W. (2003). Foreign banks profit and commercial banks in Nepal: A malmquist index approach. Journal of Financial Economics, 8(5), 533-539.
Oino, I. (2015). Competitiveness and determinants of bank profitability in Sub-Saharan Africa. International Journal of Economics and Finance, 7(10), 151-162.
Oladele, P. O., A. Sulaiman, and L. Akeke (2012). Determinants of bank performance in Nigeria. International Journal of Business and Management, 2(2), 23-48.
Pasiouras, F., and K. Kosmidou (2007). Factors influencing the profitabiity of domestic and foreign commercial banks in the Eurpoean Union. Research of International Business and Finance, 21(2), 222-237.
Pradhan, R. S., and M. Bhattarai (2016). Financial leverage and firm performance: A case of Nepalese commercial banks. Nepalese Journal of Business, 3(1), 1-14.
Ramadan, I. Z. (2011). Bank specific determinants of Islamic banks profitability: An emprical study of the Jordanian market. International Journal of Academic Research, 3(6), 73-80.
Shah, A., and S. Khan (2007). Determinats of capital structure: Evidence from Pakistani panel data. International Journal of Business Research, 3(4), 265-282.
Shrestha, B. P. (2012). Impact of liquidity on profitability of commercial banks in Nepal. Nepalese Journal of Management, 5(1), 27-38.

International Journal of Management Research, Vol. 8, No. 1, June 2017
18
Smirlock, M. (1985). Evidence on the (NoN) relationship between concerntration and profitability in banking. Journal of Money, Credit and Banking, 17(1), 69-83.
Sufian, F. (2010). Developments in the profitability of the Thailand banking sector: Panel evidence from the post Asian crisis period. International Journal of Economics and Accounting, 1(2), 161-179.
Udas, C. K. (2007). Evidence about capital adequacy and its significance to commercial banks. Journal of Banking and Finance, 8(5), 69-75.
Wasiuzzaman, S., and H. Tarmizi (2010). Profitability of Islamic bank in Malaysia: An empirical analysis. Journal of Islamic Economic, Banking and Finance, 6(4), 53-68.
Welch, P. (2006). Measuring efficiency in the finance factory: Time for a rethink. Journal of Financial Transformation, 18(7), 12-20.
Cotter, R. (1966). Capital ratios and capital adequacy. The International Journal of Applied Economics and Finance, 3(2), 35-47.
Fiordelisi, F., D. Marques-Ibanez, & P. Molyneux, (2010). Efficiency and risk in European banking. Macroprudential Research Network, 2(3), 3-37.
Flamini, V., C. Mcdonald, & L. Schumacher (2009). The determinants of commercial bank profitability in Sub Saharan Africa. IMF Working Paper.
Frase, & A. Ormiston, (2004). Understanding Financial Statements. New Jersey: Pearson prentice hall. Karki, L. (2004). Liquidity ratio with loan and advances. Journal of Nepalese Business Studies, 2(4), 32-45. Khrawish, H. (2011). Determinants of commercial bank profitability: Evidence from Jordan. International
Research Journal of Finance and Economcs, 5(2), 19-45. Kinnon M.C. (1973). Money and capital in economic development. The American Political Science
Review, 68(4), 1822-1824. Maharjan, M. (2007). Impact of liquidity in the economy. Journal of Management, 9(2), 34-41. Sangmi, M., & N. Tabassum (2010). Analyzing financial performance of commercial banks in India:
Application of CAMEL model. Pakistan Journal of Commercial Social Sciences, 4(1), 40-55. Sinkey, J., & M. Greenawalt (1991). Loan-loss experience and risk taking behavior at large commercial
banks. Journal of Financial Services Research, 5(1), 43-59.