Impact of Farmer Field Schools on Agricultural Productivity and Poverty in East Africa
Upload
khangminh22Category
view
0download
0
Supported by Tech Mahindra
Foundation
Impact assessment for Arise schools

Private and confidential, please do not share Page 2
Prepared by
Samhita Social Ventures
Anushree Parekh
Poorvaja Prakash
Rasikha Venkat
Richa Mukerjee
18th May 2015
Samhita Social Ventures,
502, Atlanta Centre, Sonawala Cross Lane,
Goregaon (East), Mumbai - 400 063

Acknowledgements
This evaluation would not have been possible without the kind support and help of many organizations.
We would like to extend our sincere thanks to all of them.
We are thankful to Tech Mahindra Foundation for giving us this opportunity by commissioning the
evaluation in the best interest of the CSR programs.
We would also like to express our gratitude to Masoom and its staff, especially Girija Tulpule, Vishvajeet
Pawar, Nikita Ketkar and all the program managers for providing necessary information regarding the
project and also for their constant support in completing the project.
Our thanks and appreciations also go to the individuals who participated in this exercise, especially the
school principals, teachers and students who participated in this study.

Private and confidential, please do not share Page 4
Contents
Executive Summary ............................................................................................................................5
1. Introduction ...................................................................................................................................9
2. Research design ........................................................................................................................... 11
2.1 Research objectives .................................................................................................................... 11
2.2 Research methods ...................................................................................................................... 11
2.3 Sampling .................................................................................................................................... 12
2.4 Research tools ............................................................................................................................ 12
2.5 Key Performance Indicators ........................................................................................................ 12
2.6 Analysis plan .............................................................................................................................. 15
2.7 Limitations of the study .............................................................................................................. 15
3. Macro analysis ............................................................................................................................. 17
3.1 SSC Pass Percentage ................................................................................................................... 17
3.2 Enrolment .................................................................................................................................. 24
3.3 Attendance ................................................................................................................................ 27
3.4 Bridge course ............................................................................................................................. 30
3.5 Classroom instruction and teaching methods .............................................................................. 32
3.6 Students’ experience and aspirations .......................................................................................... 34
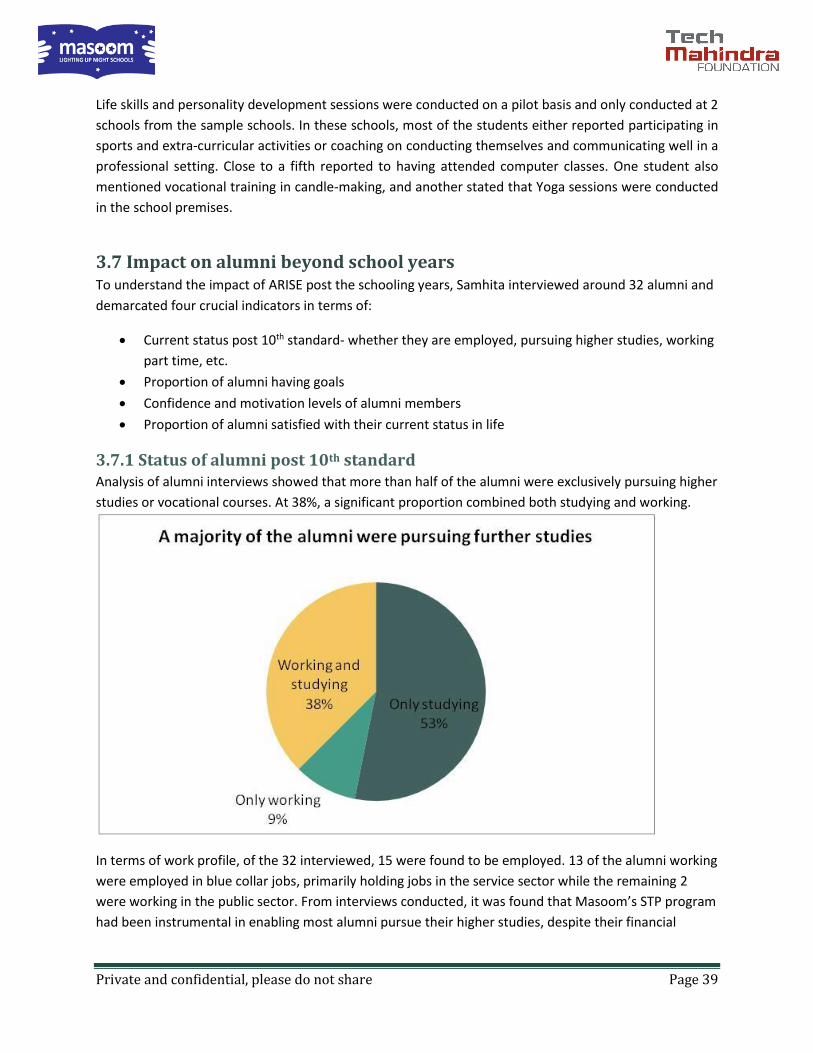
3.7 Impact on alumni beyond school years ....................................................................................... 39
3.8 Activating SMDC ......................................................................................................................... 42
4. Micro level analysis ...................................................................................................................... 46
4.1 Overall school index ................................................................................................................... 46
4.2 Index for old vs new schools ....................................................................................................... 47
4.3 Best and worst performing indicators for the schools .................................................................. 48
4.3 Comparing the index to the baseline ........................................................................................... 52
5. Strengths, areas of improvements and recommendations ............................................................. 54
Appendix 1- School level index for 2014 and 2015 ............................................................................. 57

Private and confidential, please do not share Page 5
Executive Summary
Tech Mahindra Foundation’s (henceforth, TMF) ‘ARISE’ school program is specifically tailored to meet
the needs of individuals such as Anuradha who dropout from mainstream day schools due to
disadvantaged socio-economic backgrounds by strengthening the night schools in Maharashtra. The
program aims to support youth learning while they earn, achieve full potential and improve their
standard of living by improving the night school education system.
Samhita Social Ventures was commissioned to undertake an evaluation of the program to assess the
outcomes and impact created, understand strengths and provide recommendations for improvement.
The specific objectives of the study were to:
1) Assess effectiveness of program in achieving the social impact
2) Identify strengths and weaknesses in the model
3) Provide recommendations for improvement
In order to assess outcomes, two main methods were followed – baseline-endline and treatment
(schools that benefitted from ARISE) and control (schools that did not benefit from ARISE). A variety of
tools such as key informant interviews (KIIs), structured surveys, and retrospective pre-test was used to
assess stakeholders. Two customized psychometric tests were created to assess students’ self-esteem
and attitudes towards schools. The sample covered for this study included 9 treatment schools (5 old
and 4 new) and 3 comparison schools.
Key findings from evaluation
Improvements in SSC pass rates One of the key aspects of the ARISE school program was to improve the SSC pass percentages in night
schools.
Meet Anuradha Chauhan - a 25 year old woman living in Mumbai with her husband and a daughter.
Anuradha dropped out of school in 7th grade owing to financial burdens and was married
subsequently. Anuradha had given up all hopes of being able to complete her schooling and
achieving her dreams. She not only completed her schooling, ranked 1st amongst all night schools
students in the 10th standard exams, but also acquired a scholarship from a private institution to
pursue her Chartered Accountancy.
Anuradha attributes this success to Masoom that provided her an opportunity to reenter the
education system and complete her schooling, enabling her to dream bigger.

Private and confidential, please do not share Page 6
To that effect, it was seen that SSC pass rates saw a steady improvement since program inception with
the average pass rate improving from 36% (for 2 schools) in 2008-09 to 76% in 2013-14 (for 30 schools)
and is higher than 65% in control schools (3 schools).
SSC pass rate was positively related to attendance rates and teaching methodology. Principals also
attributed instituting the SSC improvement plan to improved SSC rates, especially the provision of input,
such as SSC guides, mobile laboratories, nutrition and extra classes for students.
Improvement in enrolment ARISE has been successful in stemming the tide of falling enrolment in night schools, with treatment
schools showing 19% improvement in enrolment figures between 2013-14 and 2014-15, which was
significantly higher than the control schools which saw a 25% decline in enrolment for the same year.
Principals from treatment schools attributed enrolment drives as a major reason for improved
enrolment in night schools.
No significant change in attendance With an average attendance rate of 60% in 2014-15, the sampled treatment schools saw an overall
decline by 3 percentage points from 2013-14. Wide variations were seen in attendance at individual
school levels, with 5 schools showing declined attendance rates and 4 schools showing an increase in
attendance figures for the same year. In terms of attendance for all 30 schools, it was seen that average
attendance was 65% with a marginal overall improvement of 2 percentage points in 2014-15 from the
previous year.
Class wise attendance across all 30 schools revealed that attendance figures for 8th and 9th standards
were found to be poor as compared to class 10th, with a significant difference of 14 percentage points.
Low take-up of bridge course Take-up of the bridge course was found to be low with only 34% students reporting to have undergone
the bridge course either in 8th or 9th. Take-up was found to be especially low amongst students of the 8th
standard. The finding was triangulated by Masoom’s internal grading tool that indicates that 8 out 9
treatment schools had scored 2 points or less in timely implementation of the bridge course, pointing
towards a relatively weak performance. Teachers from one particular school were divided on the
necessity of the bridge course.
The biggest advantage reported by students who had undertaken the course was that it helped them
revised old concepts and cope with school term. None of the control schools had a similar concept in
place.
Enhanced students’ experience and aspirations In terms of students’ experiences and aspirations, four key aspects- effort from teachers for SSC,
availability of relevant materials, students’ attitudes towards school and self-esteem were studied. An
overwhelming majority (94%) of students said that teachers took special efforts to prepare them for the
SSC examinations apart from the usual teaching. Students in treatment schools said they had access to

Private and confidential, please do not share Page 7
science laboratories and guide books as opposed to students from control schools. However, use of the
science laboratories appeared erratic and ad hoc in some schools.
Students’ attitudes towards school was found to be highly positive as students from both treatment and
control schools reported they were satisfied or highly satisfied with their schooling experience. In terms
of self-esteem, it was seen that students from treatment schools expressed slightly higher self-esteem
compared to students from control schools (37% in treatment schools vs 23% in control schools). It
could be hypothesized that the career counseling could be reasons for higher self-esteem among
treatment school students.
Activating SMDC in schools All treatment schools had SMDCs set up post the ARISE, whereas control schools reported SMDCs on
paper but none were functional. In terms of frequency of meetings, a majority of SMDC members
reported to meeting at least once a quarter, although internal data showed that 8 out 9 schools scored 2
or less points on SMDC meetings with specific agenda. Further, it was found that 43% SMDC members
reported to neither being involved nor contributing to the school development plan and less than 50%
of members reported to contributing to books and stationery fund. Overall, it was seen that SMDC
members were active in their individual capacity, not as a body.
It can be hypothesized that the low involvement exhibited by members could be attributed to two
reasons- a) parents’ work schedules b) students in night schools are considerably older in age and
parents do not feel the same sense of responsibility towards these students as opposed to younger
children.
Performance of individual schools Samhita constructed an internal index using 19 evaluation parameters1 to assess the best and worst
performing schools and strengths and weaknesses. It was found that 2 out of the 9 schools were ranked
A, 3 were ranked B, 4 were ranked C and none of the schools fell in the D category. Different schools
have done well across different parameters.
Strengths and areas of improvement
Strengths of the program Encouraging enrolment through enrolment drives
Provision of critical inputs- materials and meals
Headmaster’s buy-in and mentorship to teachers
SSC Improvement plan
Trustee involvement
Regular monitoring and supervision through dedicated program managers
1 Samhita and Masoom jointly decided on 19 key evaluation parameters on which to grade schools.

Private and confidential, please do not share Page 8
Areas of improvement and recommendations Recommendations for short-run
Ensuring regular attendance
Boosting take-up of bridge course
Strengthening activities for SMDC
Reducing the burden on program managers
Streamlining objectives and prioritizing outcomes to focus on 4-5 key indicators
Recommendation for medium to long run
Training teachers on pedagogy, though it should be undertaken on a pilot basis after investing
substantial efforts in researching best practices and evidence around different models
Advocacy for enhancing classroom environment in night schools

Private and confidential, please do not share Page 9
1. Introduction
Background In India, the concept of night schools is unique to the state of Maharahstra. There are close to 190 night
schools run in the state, with 130 in the city of Mumbai. The genesis of night schools globally can be
traced back to the advent of industrialization and the need to cater to educational needs of working
class. The first night school in Maharashtra was opened by Mahatma Jyotirao Phule mainly for lower
castes. Over the years, the night schools evolved to address the needs of immigrants and adults who
worked in the textile mills in Mumbai during the day.
Night schools in Mumbai are generally run by private trusts but receive government aid for teachers’
salaries, operate on BMC premises and fall under the Municipal Corporation of Greater Mumbai. They
mostly cater to students of the higher secondary classes (8th to 10th) and are run in five mediums --
Marathi, Hindi, English, Urdu and Kannada. In terms of academics, night schools are on par with day
schools and share the same curriculum and SSC examination system, though the instructional time is
restricted to just three hours from 6.30 to 9.30 pm.
In recent times, the schools have faced several challenges in terms of lack of recognition from the
government, absence of supporting ecosystem, increased competition from private schools,
redevelopment in the catchment areas etc., leading to closure.
It is against this backdrop that Masoom, a non-profit organization with a passion for effecting impactful
interventions in the night schools of Mumbai, works in Mumbai. Masoom is currently the only
organization which has developed a program to cater to the needs of night school students. With its
vision of helping youth ‘learn while they earn’, Masoom aims to enable night school students reach their
full potential through educational and policy support.
About the ARISE school program
The ‘ARISE’ school program is specifically tailored to meet the needs of the night school and the
individual students who are mainly school dropouts from poor socio-economic background, most of
them working during the day and supporting their families. The project aims to support youth learning
while they earn, achieve full potential and improve their standard of living by improving the night school
education system.
The project follows a Three-pronged Model to achieve its aim:
1. Educational infrastructure building and support: This component includes providing textbooks,
notebooks, workbooks, science mobile laboratory, maths-kits, extra-tuition classes and special
moderator sessions for students appearing for SSC examination, etc.
2. Capacity Building support: This component has training workshops for teachers and students,
personalized counselling, English conversation classes, field visits, home visits vocational
guidance and nutritional support.
Private and confidential, please do not share Page 10
3. Advocacy: Last but not least, advocacy has a very important component of the program.
Masoom will try to get the government to take more responsibility of the night schools.
Through various project interventions the project is expected to enhance the teaching and learning
environment in night schools, build leadership quality and employability skills among students and
facilitate stakeholder participation, ownership of the program and local partnership for improved school
based management and sustenance of the Program.
This report presents the findings of a third party evaluation of the ARISE school program carried out
by Samhita Social Ventures.

Private and confidential, please do not share Page 11
2. Research design
2.1 Research objectives The objective of Samhita’s impact evaluation was to –
1. Assess the effectiveness of program in achieving social impact i.e. the degree to which ARISE
school program is meeting its intermediate goals
2. Establish a model for the night schools by identifying the strengths and potential areas of
development in the model
3. Develop Masoom team’s capacity for evaluative thinking and change
The evaluation addressed the two objectives mentioned above through primary research, combining
quantitative and qualitative analysis.
2.2 Research methods For primary research, Samhita broadly followed a combination of three methods –
1. Baseline-endline method – this method measures the performance variables before the
program and after the program and the change (if any) can be attributed to the intervention. In
this case, the baseline used is based on the data collected in 2013-14 by Masoom. Samhita
conducted an endline, aligning the survey to the baseline to the extent possible in February
2015.
2. Treatment-control method- this method assumed two categories of respondents- the
treatment group (i.e. schools who were a part of ARISE) and the control group (the comparison
group i.e. schools who were not a part of ARISE). The method was used to establish the
outcome variables for the program and compare and contrast the performance.
Under ideal circumstances, the changes in the outcomes over a period of time in the treatment
group to those in the control group can be measured via base-line and end-line surveys and
attributed to the intervention. However, since there was no baseline for the control group in
this case, it was not possible to assess the outcomes before the intervention and thus difficult to
establish the extent or pace of change and/ or account for exogenous factors that could have
contributed to the change. The control group in this evaluation was mainly used to compare the
present performance.
3. Retrospective pre- test method – this method was effective in understanding the effect of the
intervention amongst the beneficiaries as the method tests respondents’ knowledge before and
after an intervention.

Private and confidential, please do not share Page 12
2.3 Sampling Samhita combined a probability-based stratified random sampling method with convenience based
sampling2 to select the schools for the study. The universe of 25 schools was stratified into two types of
schools – old schools (pre 2013-14) and new schools (2013-14 onwards). The stratification was
undertaken to account for any possible variations that may have resulted from the overall change in
Masoom’s approach in 2012. A sample size of around a third of the strata i.e. a total of 9 out of 25
schools was chosen for the treatment group. The sample for the control group covered 3 schools.
The table below shows the final sample size and design -
No. of schools Sample size
Treatment schools
Pre 2013-14 8 5
2013-14 onwards 17 4
Total for treatment 25 9
Control school - 3
Total sample 12
2.4 Research tools Following tools were employed through the course of the evaluation:
Structured survey – this survey was used to gather quantitative data from students, teachers
and SMDC members. All the response categories and codes were pre decided, aligned to the
baseline conducted by Masoom. The survey was either self-administered or facilitated by a
skilled enumerator, based on literacy levels of the respondent.
Scale tests – the evaluation adapted and contextualized two well established scale tests to
assess different aspects of students’ experience – Rosenberg test to assess their self-esteem and
confidence and Anderson Test to assess their education experience in night schools.
Key informant interview (KII) – A key informant interview is an in-depth interview with
individuals on the relevant subjects. The tool is also often used to support the findings from
quantitative data, particularly understanding the ‘why’ and ‘how’ of a phenomenon. The KII was
used to collect information from school principals.
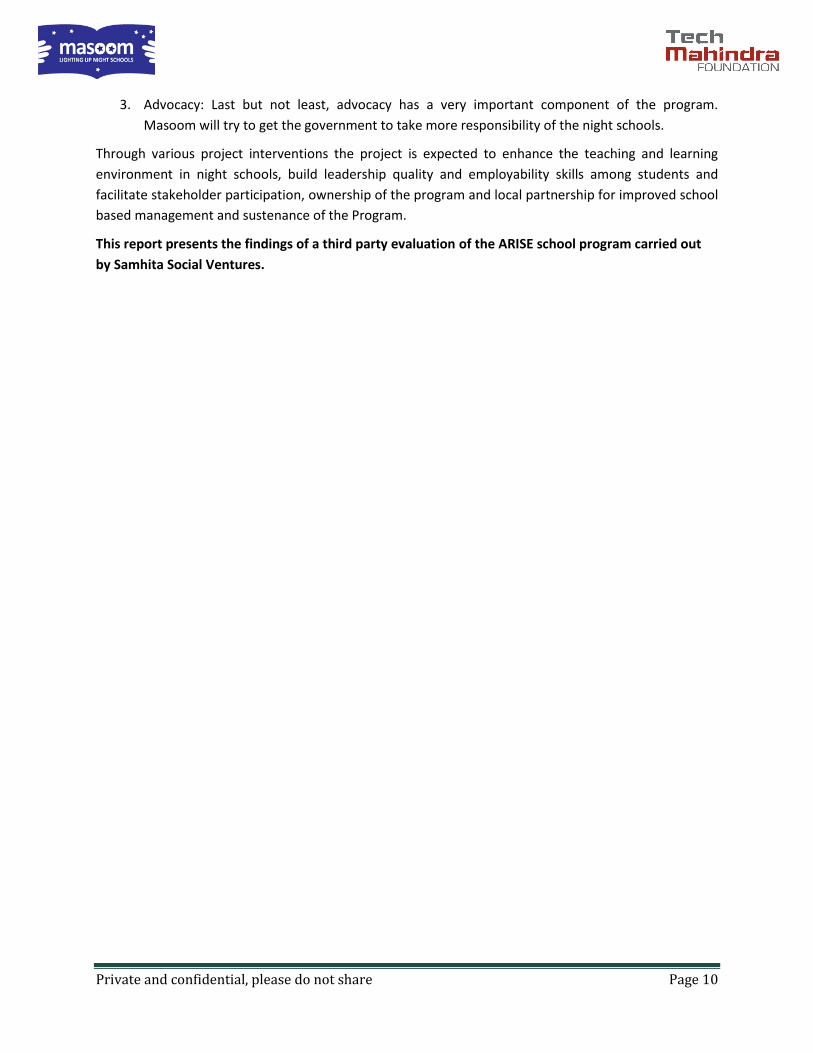
2.5 Key Performance Indicators Samhita and Masoom mutually agreed on the following key performance indicators that needed to be
measured and assessed to determine the outcomes of ARISE. The table below lists these KPIs, their sub
components and matches the stakeholder that is the primary source of information for that particular
sub component.
2 The convenience based sampling was used to exclude schools were getting permission for research was deemed difficult and include schools that were of personal interest to Masoom’s donor.
Private and confidential, please do not share Page 13
Sr No
Evaluation Parameters
Sub components Suggested weightages (%)
Stakeholder/ primary source of information
1 Alumni - have they reached their aspired future?
% of alumni who have gone on to pursue higher education, vocational training or jobs
10 Principal’s perceptions
% of alumni who are satisfied with their current status
Alumni
Confidence and motivation levels of alumni Alumni
2 SSC pass percentage SSC pass percentage over the last 4 years and the extent of change
10 Principal via admin records
3 Attendance School attendance rate as a seven month average from July 2014 to Jan 2015
8 Principal via admin records
Extent of change in the rate for the same period as above in 2013-14
Principal via admin records
4 Headmaster - As an effective administrator
Existence of a SMDC and the nature of work done by the committee including the maintenance of records
8 Principal
Maintenance of attendance, dropout and student and alumni records
Principal
Organization of an enrollment drive Principal
Existence of alumni association and work done by the same
Principal
Relationship with trustees Principal
5 Infrastructure - access to audio visual material ,science labs, evening meals and library
Availability of audio visual material, science labs and library
6 Principal
6 SMDC - Contribution in raising notebooks textbooks and SSC material and school participation in school issues.
Frequency of the meetings 6
Contribution in raising notebooks textbooks and SSC material
SMDC
Contribution of the SMDC through discussions, planning and execution
SMDC
7 Enrolment – no. of new students enrolled
Increase in the number of new students over the past year
5 Principal (via records)
8 Headmaster - As Mentor to teachers
Existence of professional development opportunities for teachers
5 Principal
Organization of staff engagement meetings by HM, frequency and management (setting agenda and the nature of the agenda)
Principal
Existence of incentive and accountability systems for teachers
Principal
9 Headmaster - Inclusive and holistic experience to
Organization of extracurricular activities for students
5 Principal

Private and confidential, please do not share Page 14
students
Organization of life skills sessions for students Principal
Organization of vocational and career awareness programs for students
Principal
Organization of a role model program Principal
10 Headmaster - Vision for the school
Existence and nature of status of plans for the school including- SSC improvement plan
5 Principal
Existence and nature of plan for the school including school attendance plan
Principal
Existence and nature of plan for the school including policy for students with special needs
Principal
11 Infrastructure – education material like students getting notebooks , textbooks, SSC material , bridge course
Access to material (stationery) 4 Principal
Access to SSC guide Principal
Existence of a bridge course prior to students joining the school
Principal
12 Infrastructure - Nutrition
Access to the nutrition program offered by Masoom
4 Principal
13 Students - educational experience
Extent of confidence level amongst students 5 Students scale
Extent of motivation level amongst students Students scale
Extent of satisfaction with the teaching quality Students
Utility level of the Bridge course, SSC guide and other stationery provided
Students
Extent of satisfaction with the vocational and life skills programs
Students
14 Students - aware about various vocations
% of students who have a future goal 4 students
Extent of awareness of different vocations Students
% of students who know how to reach that goal Students
15 Teacher - relationship with the students
Homework given and % of students completing homework
4 Teachers
Extent of feedback given by teachers to students Teachers
16 Parents - Attendance in PTAs and parents aware about issues
Frequency of PTA 3 Principal
Attendance rates amongst parents in the last 3 PTA meetings
Principal
Extent of awareness about school level happenings such as student progress, attendance, new initiatives in the school etc
Principal
17 Teacher - Classroom Instruction
Methods used by the teacher within the classroom
3 Teachers

Private and confidential, please do not share Page 15
Environment within the classroom (presence of works on walls etc)
Teachers
18 Teachers - Teaching learning process
Do teachers attend workshops conducted by Masoom or the Government?
3 Teachers
Frequency of preparation of lesson plans Teachers
Content of the lesson plans Teachers
19 Dropout % of students who have dropped out in the last year
2 Principal
Extent of change from last year Principal
100
2.6 Analysis plan The analysis presented in the report followed two levels –
Macro level – this entailed combined analysis for all 9 treatment schools on three main parameters –
SSC pass percentage, enrolment and attendance. This level of analysis presents the relationship
between key variables based on trends and comparison with the baseline data and the control group
wherever relevant. The aim here is to give an overall sense of impact of the program as a whole. Macro
analysis also looks at the outcomes of some individual components of ARISE such as bridge course,
methods of classroom teaching, educational experience of students etc.
Micro level – this entails school-level analysis for all 9 schools, comparing current performance with the
baseline year and analyzing the best performing and the worst performing parameters across schools.
2.7 Limitations of the study 1. Lack of sufficient sample
One of the limitations of the study is the lack of a sufficiently large enough sample for the alumni and
the SMDC members across the schools. The lack of a substantial sample among the alumni prevents the
study from making conclusions that will be true for the larger universal set of alumni. A second
stakeholder for whom the research team was unable to get a sufficient sample was the SMDC members.
This was due to lack of sufficient engagement with the SMDC members prior to the study. The SMDC
intervention is still in the nascent stages and this prevented the research team from being able to reach
out to a significant sample of members.
2. Lack of disaggregated data for the baseline from 2013-2014
While Masoom had the overall school grades for the baseline in April 2013 and end line in April 2014,
there was no disaggregated data for the same period. This meant that the findings from the primary
study could not be compared with the 2013 baseline but the 2014 baseline. This limits the study from
comparing the progress made in 2 years and now looks at the time frame of less than a year. Longer
term change for all 9 schools therefore cannot be measured.

Private and confidential, please do not share Page 16
3. Comparability of parameters with baseline
Given the lack of clarity in the markings of the baseline study, not all of the parameters from the primary
study could be directly compared with the parameters from the baseline. Wherever possible, the study
has ensured that the parameters studied by the research team is as closely aligned with the information
collected during the baseline. Second, not all information covered by the primary study has a baseline
comparison (information on students’ confidence, motivation or awareness levels was not collected
during the baseline)
4. Difficulty in attribution
While the study has utilized the treatment-control method to understand the differences across
parameters between schools that have been a part of this program and schools that have not, the lack
of baseline information for the control schools limits the researchers from mapping the changes across
control schools for the same time period. This therefore means that while the study can identify the
changes made after Masoom’s intervention, direct attribution of those changes only to the Masoom
NTSP is not possible because the study is unable to identify the difference between changes that have
taken place in both treatment and control schools. These changes therefore could have resulted due to
any other external circumstances as well.

Private and confidential, please do not share Page 17
3. Macro analysis
The macro analysis is divided into parts-
1. Analysis for all 9 treatment schools on three main parameters – SSC pass percentage, enrolment
and attendance
2. Findings on some key aspects of ARISE – the bridge course, teaching methods, student
motivation and educational experience, SMDC involvement
3.1 SSC Pass Percentage One of the key parameters that has been associated with the ARISE school program is the change in the
SSC (10th standard graduating examination) results or in other words, the proportion of students who
are able to pass that exam. Passing this exam provides student with the opportunity to explore other
possibilities either through further studies, vocational training or jobs. It is a means through which
students can move along their learning curve and obtain sustainable livelihoods in the future. Low pass
results are often likely to be indicative of a non-conducive learning environment at the school, low levels
of self-motivation and lack of preparation. Increase in the SSC pass rate therefore is one indicator of a
positive outcome that is expected from Masoom’s intervention. Given below are the results from the
analysis.
3.1.1 Performance since 2008-2009 across all of the 30 schools

Private and confidential, please do not share Page 18
From the chart given above, it is clear that the average pass percentage across the 30 schools from
2008-2009 has undergone small changes since Masoom’s intervention, though the change has not been
linear.
Apart from the result in 2010-2011 and 2011-2012, the pass percentage on an average has increased
year on year. From 36% in 2008-2009, the pass percentage increased to 76% in 2013-2014. 2010-2012
was the low point in the trend, but since then, the pass percentage consistently improved.
Given the small classroom strengths of 10th standard classes (typically around 20 students), it is
important to note that only increases or decreases over 10 percentage points are likely to be significant.
Also, these are averages across the entire universe of schools and are likely to be affected by the
extreme performances of different schools. In order to understand the nuances of factors that affect
this, it is important to analyse these findings for a smaller sub-set of schools among the 9 schools that
have been sampled for this research.
3.1.2 Change in pass percentages for sampled schools from 2012-13 to 2013-
14
As shown by the chart above, the SSC pass percentage has increased from 2013 for 5 out of the 9
schools. Among the remaining 4 schools, the percentage declined by less than 10 percentage points
(meaning that the overall number of students who had failed was likely to have increase by 1 or 2 at the
maximum).
Private and confidential, please do not share Page 19
Out of the 9 schools, nearly half (4) were marked as A grade as per Masoom’s internal grading (more
than 80% pass rate) in 2013-2014 as opposed to 3 in 2012-13. While one school was ranked at the
bottom grade in 2012-2013, there were no schools in that grade in 2013-2014; the grade D school
showed tremendous improvement and climbed to grade B in 2013-14.
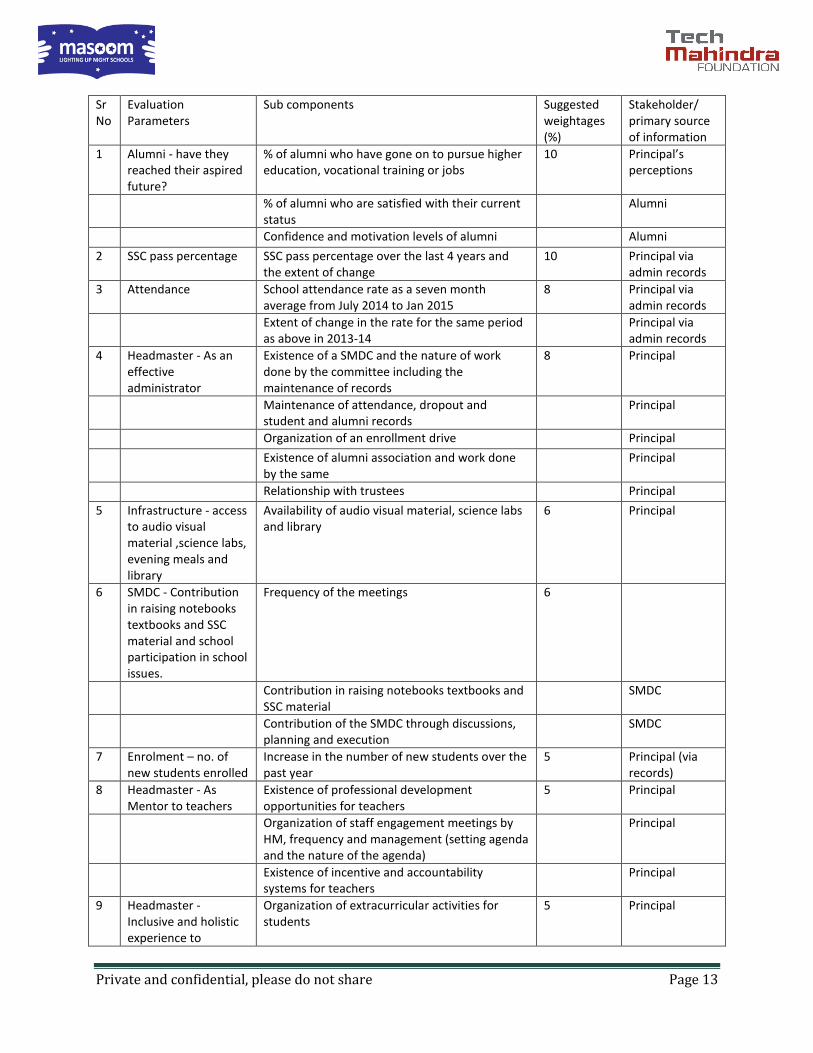
3.1.3 Old vs. New Schools Given the extent of variation amongst the schools, it is interesting to understand if length of association
with Masoom has any bearing on the SSC pass rate. These schools have therefore been divided into old
(schools which have been a part of the program before 2013-2014) and new (schools which have been a
part of the program since 2013-2014)
Given below is the table the summarized the results in 2013-2014 for the new (4) and old schools (5).
Type of schools Less than 50% 50-70% 70-90% More than 90%
New 0% 50% 25% 25%
Old 20% 0% 40% 40%
As shown by the table, out of the 4 new schools, while none of them had pass percentages of less than
50%, only 2 out of the 4 schools (50%) have had pass percentages of over 70%. As opposed to this, 80%,
i.e. 4 out of the 5 old schools have had pass percentages of more than 80% with one school, having a
pass percentage of less than 50%. This one schools remains an outlier from the performances of the old
schools, which have otherwise been performing better than the new schools.
If one were to look at the average pass percentages for old and new schools, the results are almost the
same with the average among the 4 new schools being 79.03% and the average among the old schools
being 76. 68%, this difference of less than 2.5 percentage points is negligible. However, again the
average rate for the old school is significantly being pulled down by the one school and for the
remaining old schools, the average is 84.75% indicating the scale of difference if not for this one
particular school.
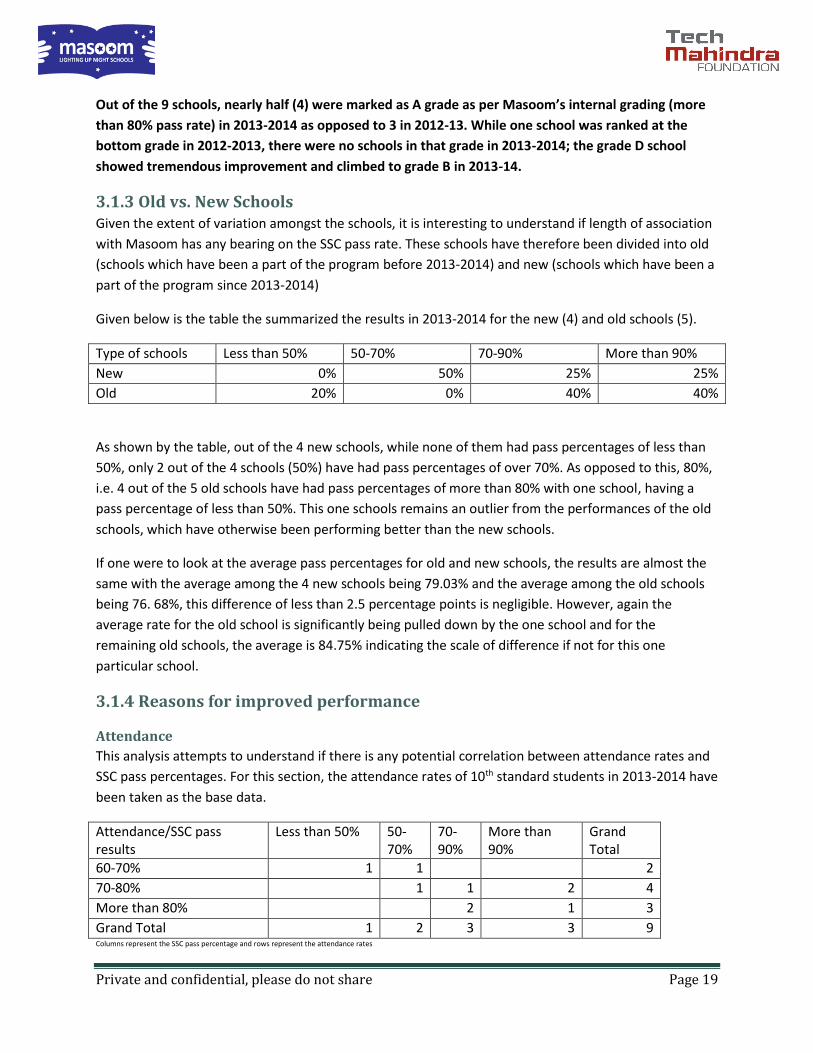
3.1.4 Reasons for improved performance
Attendance
This analysis attempts to understand if there is any potential correlation between attendance rates and
SSC pass percentages. For this section, the attendance rates of 10th standard students in 2013-2014 have
been taken as the base data.
Attendance/SSC pass results
Less than 50% 50-70%
70-90%
More than 90%
Grand Total
60-70% 1 1 2
70-80% 1 1 2 4
More than 80% 2 1 3
Grand Total 1 2 3 3 9 Columns represent the SSC pass percentage and rows represent the attendance rates

Private and confidential, please do not share Page 20
As shown by the table above, the attendance rates for 10th standard students across all 9 schools
exceeded 60% in 2013-2014. The data also indicates that higher attendance rates were in general
associated with higher SSC pass rates. For e.g. all 3 schools with more than 80% attendance reported
pass rates of over 70%. On the other hand, both the schools with attendance of less than 70% reported
pass rates of below 70%. The sample strongly suggests a positive relationship between attendance and
SSC pass percentages, however this is not representative for the entire universe of 30 schools where
attendance and SSC pass percentages did not have a positive correlation.
Attendance and SSC pass performance could also be determined by students’ motivation. The research
revealed that the motivation for joining night school was varied - 28% of the 40 students who answered
the question cited better job prospects as a reason, 23% cited a desire to pursue higher education after
completing Class 10, 23% said they had failed a class and therefore dropped out of day schools. A few
students also said they required either 8th standard or certificate for obtaining driving license or
promotions in BMC jobs.
Teaching methodology
Another possible variable that affects the SSC pass percentage is the pedagogy followed by the teachers
in the school. Masoom ranked the school’s performance based on the methodology that the teachers
follow into 4 grades- D, C, B and A. During the baseline in 2014 which was likely to be the practice
throughout 2013-2014, it was found that 3 schools were ranked C meaning that the teachers were using
rote methods such as students copying from the board and reciting, 5 were ranked B indicating that the
students were engaged in the class, asking questions, using interactive methods etc and one school was
ranked grade A indicating self-learning and group methods.
Grade for teaching methodology Less than 50% 50-70%
70-90%
90-100%
Grand Total
C 1 1 1 3
B 1 2 2 5
A 1 1
Grand Total 1 2 3 3 9
As shown by the table given above, out of the 3 schools ranked C, 1 out of the 3 schools had a pass
percentage of at least 70%. On the other hand, out of the 5 schools ranked B, 4 out of the 5 schools had
pass rates of at least 70%. Finally the one school ranked A had a pass rate of between 90 and 100%. This
can also be looked at in terms of average SSC pass percentage for each of these sets of schools and this
is 61.73% for the C grade schools, 84.48% for the B grade schools and 92 for the one A grade schools
indicating that schools that follow high order teaching pedagogy as defined by Masoom are likely to get
better results as defined by the SSC pass percentages. There is also a strong co-relation of 0.67 between

Private and confidential, please do not share Page 21
the two, indicating that the methods used in the classroom is likely to have a positive outcome on the
SSC rates3.
Instituting the SSC improvement plan
A majority of the principals attributed the improvement to change in the school functioning,
particularly defining a plan for improving pass percentages. The interviews revealed that some of the
activities under the SSC improvement plan were implemented only after Masoom’s intervention.
Further, even if some schools were taking these steps prior to Masoom’s intervention, the proportion of
schools implementing these steps have increased post the intervention according to the principals.
Providing direct inputs
Masoom’s interventions led to significant changes in input oriented activities , i.e., the last 4 steps given
on the graph above, which could have improved SSC results. Before Masoom, only 11%, 0%, 11% and
22% of the schools emphasized upon analysis of answer papers, conducting moderator sessions,
distributing SSC material and providing individual guidance in order to increase the SSC pass rate. Post
the intervention, this changed to 56%, 33%, 100% and 44% respectively.
3 Given that the disaggregated data on the methodology just followed by the 10th standard teachers alone is not available, this
grading might suffer the limitation of taking into account all teachers and not just the 10th standard ones.
Private and confidential, please do not share Page 22
11% of schools were providing meals before ARISE, compared to 100% after ARISE. 7out of 9 principals
strongly felt that providing meals/ snacks in the evening to
students helped to improve attendance, which in turn could
have resulted in better SSC results.
Process driven steps
Post Masoom’s intervention, greater proportion of the schools
reported implementation of processes in order to improve the
SSC results. Examples of this include 89% of schools holding
regular meetings with the teachers as opposed to half of that
number before, 56% of schools emphasizing on providing
regular feedback to children as opposed to 22% before the
intervention and 78% emphasizing on attendance as opposed
to nearly just a third of that before the intervention. 7 out of 9
principals stated that the teacher meetings were platforms for
discussing student learning and student related issues, thereby
indicating that it was not just the occurrences of the regular
meetings but the emphasis on the types of issues discussed
that was likely to have a bearing on the SSC pass results.
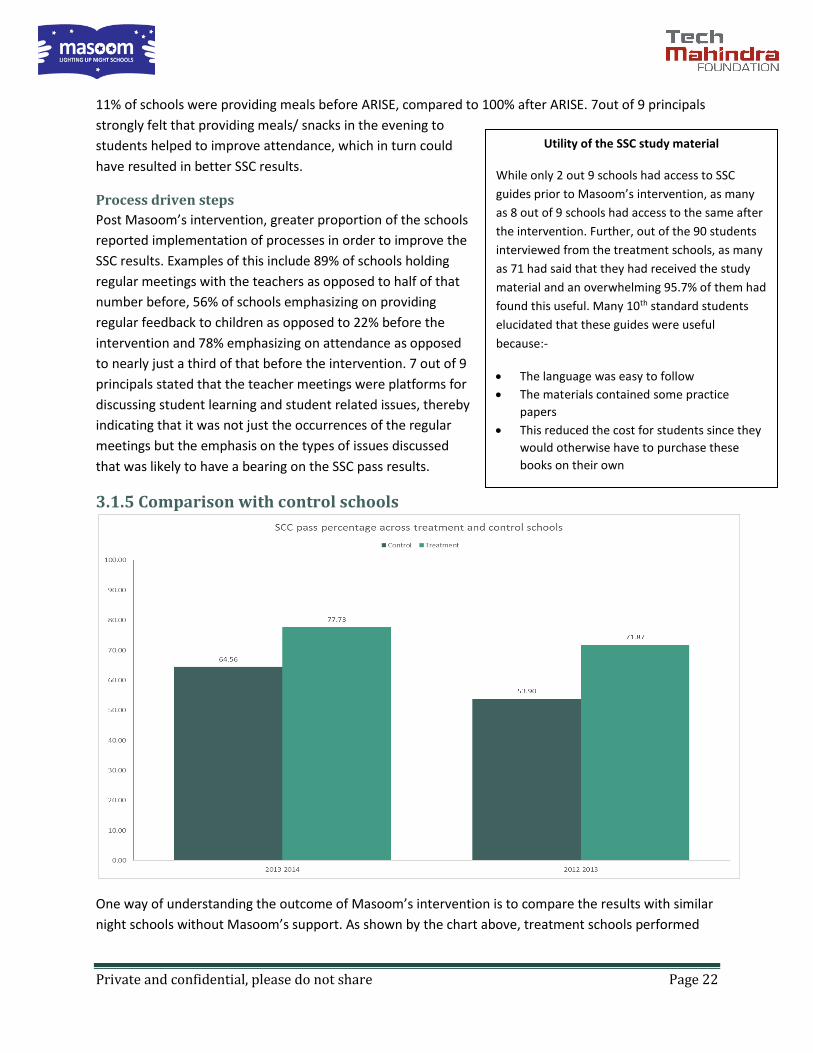
3.1.5 Comparison with control schools
One way of understanding the outcome of Masoom’s intervention is to compare the results with similar
night schools without Masoom’s support. As shown by the chart above, treatment schools performed
Utility of the SSC study material
While only 2 out 9 schools had access to SSC
guides prior to Masoom’s intervention, as many
as 8 out of 9 schools had access to the same after
the intervention. Further, out of the 90 students
interviewed from the treatment schools, as many
as 71 had said that they had received the study
material and an overwhelming 95.7% of them had
found this useful. Many 10th standard students
elucidated that these guides were useful
because:-
The language was easy to follow
The materials contained some practice
papers
This reduced the cost for students since they
would otherwise have to purchase these
books on their own

Private and confidential, please do not share Page 23
significantly better than the control schools in both 2012-2013 and 2013-2014, with almost a 13
percentage point difference in the pass rate between treatment and control schools in both years.
It could be hypothesized that one of the reasons for this difference in performance could be the
organization’s intervention. This can be ascertained by looking at the differences in the priorities of the
SSC improvement plan as shown below. A selection of various aspects of the SSC improvement plan has
been selected for this comparison. However, it should be kept in mind that the small sample size of the
control schools restricts the researchers from making universe wide assertions.
As shown by the chart above, greater proportion of treatment schools were executing specific steps to
improve the SSC pass rates. While 67% of treatment schools were separating strong and weak students
in order to provide the right attention to the different groups of students, only 1 in 3 control schools
were doing the same. Similarly while 78% of the treatment schools were emphasizing attendance as a
means to improve SSC performance only 1 in 3 control schools had reported doing the same. Two areas
where in greater or equal proportion of control school principals had reported performing the task
included distribution of basic material and conducting extra classes. However, interviews with principals
revealed that in one control school the SSC material was distributed only to a select few students due to
lack of funds to cover the entire batch.
Private and confidential, please do not share Page 24
3.2 Enrolment Another key indicator of the outcome of ARISE is the change in the enrolment figures post the
intervention. Enrolment is often a function of many factors including price, quality and appropriate
model of education, demand for education and extent of awareness.
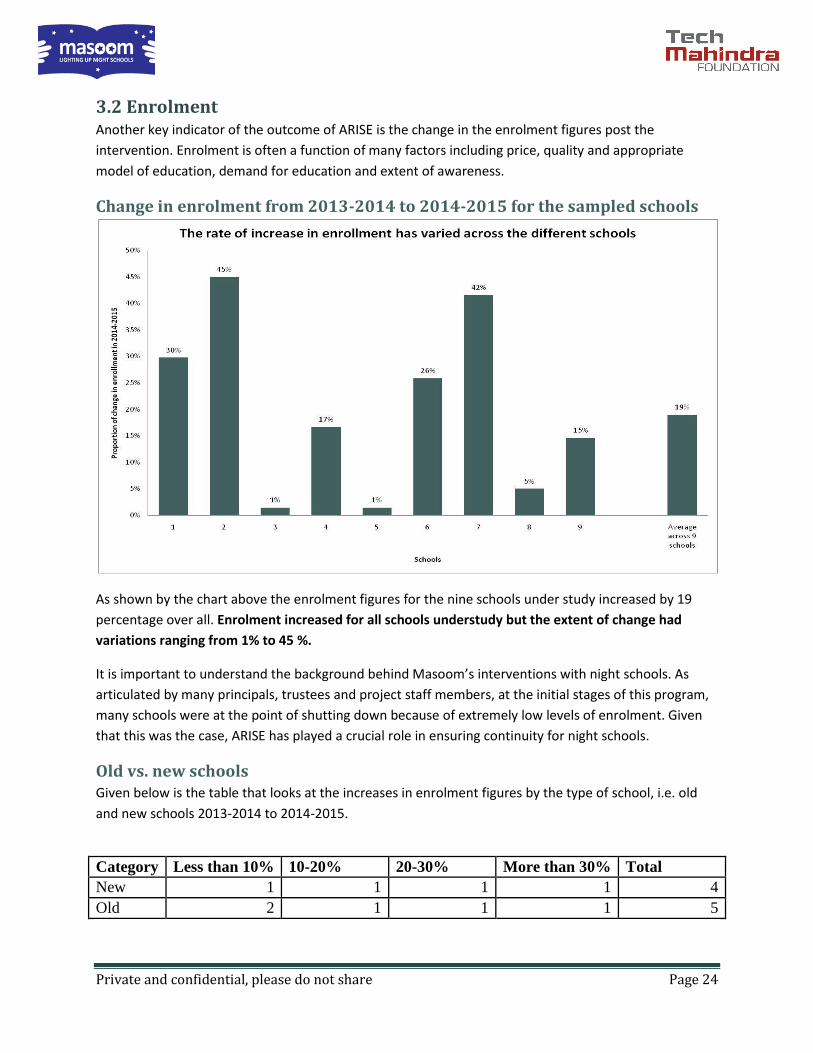
Change in enrolment from 2013-2014 to 2014-2015 for the sampled schools
As shown by the chart above the enrolment figures for the nine schools under study increased by 19
percentage over all. Enrolment increased for all schools understudy but the extent of change had
variations ranging from 1% to 45 %.
It is important to understand the background behind Masoom’s interventions with night schools. As
articulated by many principals, trustees and project staff members, at the initial stages of this program,
many schools were at the point of shutting down because of extremely low levels of enrolment. Given
that this was the case, ARISE has played a crucial role in ensuring continuity for night schools.
Old vs. new schools Given below is the table that looks at the increases in enrolment figures by the type of school, i.e. old
and new schools 2013-2014 to 2014-2015.
Category Less than 10% 10-20% 20-30% More than 30% Total
New 1 1 1 1 4
Old 2 1 1 1 5

Private and confidential, please do not share Page 25
As shown by the table, 3 out of 4 new schools i.e. 75% of the new schools have had an increase in
enrolment of more than 10%. On the other hand, 3 out of 5 old schools i.e. 60% of the old schools have
had increases in enrolment of more than 10% from 2013-2014 to 2014-2015.
However, in terms of absolute strength, the old schools still have higher enrolment numbers but the
extent of increase is marginally lower than the increase witnessed by the new schools (the enrolment
had actually decreased in the 2013-14 among the old schools).
Therefore new schools have seen better performances as far as extent of increase in enrolment is
concerned.
Reasons for increase in enrolment
1. Enrolment drives
According to the Masoom’s data collection in 2014-2015, 4 out of 9 schools were ranked Grade A in
terms of their enrolment drive efforts, with the remaining school ranked B.
Samhita’s analysis of this data showed that while the enrolment rates on an average increased by 27%
for the schools that were ranked A, it had increased by
15% for the other 5 schools indicating that there could be
a potentially strong link between the enrolment drives
and extent of increase in enrolment.
It could be hypothesized that the extent of awareness and
visibility on the existence and utility of night schools could
have increased among the community due to enrolment
drives organized by the school under ARISE, thus
increasing enrolment.
At least five of the principals pointed out that the enrolment drive efforts undertaken by Masoom have
played a crucial role in increasing enrolment figures in the schools.
The interactions with school principals also revealed that Masoom volunteers too were involved with
the enrolment drive, particularly in mobilizing the community, current and past students. Trustee
involvement too was pointed out to be a critical factor.
2. Enrolment and state of infrastructure
State of infrastructure could be an indication of ‘attractiveness’ of a school to the public. This section
looks at whether the status of infrastructure has any link with the extent of increase in enrolment. This
data is from the baseline information collected by Masoom in 2014-2015
Extent of infrastructure/increase in enrolment rate
Less than 10%
10-20% 20-30% More than 30%
Grand Total
40% infra 2 1 3
60% infra 1 2 2 5
If Masoom had not implemented its
enrolment drive, the enrolment rates
of the students would have dropped
drastically.
- A school principal

Private and confidential, please do not share Page 26
80% infra 1 1
As shown by the table above, the data shows mixed results. While the only school that has over 80% of
the infrastructure facilities as per Masoom’s grading (i.e. schools with e learning kits, computer
education faculty, playground, separate rooms for office and vocational training and school uniform
along with the other basic essentials) has increased its enrolment rate by more than 30%, one of the two
schools with only 40% of the infrastructure available (separate toilets, benches, duster, science lab
provided by Masoom and nutrition plan) has achieved that as well. The trend shows a mild positive
relationship between the two and a statistical correlation of 0.42 also indicates the same, positive but
not strong association between the two.
Challenges to increasing enrolment
Principals pointed out that the schools were not successful in increasing enrolment figures because of
the stigma and low opinions that the community still had on night schools. The principal pointed out
that many in the community still saw the night school as an option only for those who ‘failed’ in the
daytime schools. Some students reinforced this view when they stated that they were ashamed of
attending nigh schools and got teased by their friends in the community.
Comparison with control schools
As shown by the graph above, while the enrolment among the treatment schools on an average had
increased by 19%, the enrolment figures for the control schools declined by 25%, from 2013-2014 to
2014-2015. It was also found that the enrolment figures had declined in 2 out of the 3 control schools,
while the third school had a marginal increase. The extent of decline is largely influenced by one school.
The reduction is an indication that Masoom’s intervention has played a role in the growth of the
treatment schools, particularly from this indicator’s point of view. One of the principals from the control
school also felt that while during the ‘informal’ enrolment period, they had a lot of students

Private and confidential, please do not share Page 27
registering/showing interest, the numbers declined massively during the actual enrolment and this
indicates that the control schools are unable to maintain the interest levels.
3.3 Attendance Another key indicator of outcomes for ARISE is the attendance rate since that is a means of measuring
the effectiveness of the school in retaining children, ensuring that children have a regular presence in
the classroom and therefore ensure constant learning as well. Given below is the average attendance
rates across the schools for a seven month period between July and January in 2013-2014 and the same
period in 2014-2015. The period was chosen due to availability of full data.
As shown by the chart, the attendance rate on an average across the sampled schools declined
marginally by 3 percentage points from 2013-2014 to 2014-2015.
However, the data showed a fair degree of variability among the different schools. The attendance rate
had declined for 5 schools during this period and extent of decline ranged from 2% to 14% points. On
the other hand, 4schools saw marginal improvements. Therefore, while on the whole, the attendance
rates have been more or less similar, the decline in the attendance rates for 5 out of the 9 schools with 4
out of the 5 schools witnessing a decline of more than 5 percentage points is a cause for concern. It is
also important to note that this was representative of the overall pattern for all the 30 schools that
Masoom is working with. The average attendance rate for the same seven month period increased
marginally from 62% in 2013-2014 to 64% in 2014-2015 indicating that the overall trends were similar.
Within the 30 schools, the attendance rates had increased for 15 schools and declined for 15 schools,
with the extent of increase ranging from 0.7% points to 51.9% points and the extent of decline being

Private and confidential, please do not share Page 28
almost equally steep ranging from 0.2% points to 42.4% points. This therefore once again suggests that
there is inconsistency within the schools’ performances
The average attendance rate of 60% is marked as ‘B’ by Masoom indicating that there is greater room
for improvement for all schools.
It is interesting to note that the degree of change in the attendance varied based on the month. In July,
when most schools had been open for less than a month, attendance rates had actually increased by 8
percentage points in 2014 as opposed to 2013. This increase was seen in 6 out of the 9 sampled schools.
On the other hand, October had the opposite result with the attendance rates decreasing in 2014 for all
nine schools as compared to the same month in 2013. This indicates that while during the initial periods
of functioning, the increasing enrolment was usually associated with high attendance rates, the schools
were unable to maintain this high level of attendance throughout the year.
Further, on an average, there was also a wide disparity in the attendance rate for students in the 8th and
9th as opposed to the 10th standard. Across both years, it was found that the average attendance rates
for the 7 month period across all 30 schools for 10th standard students was at least 14% points greater
than that of the 8thand 9th standard. For e.g., in 2014-2015, the attendance rates for the 10th standard
students was 74% as opposed to an average of 59% for both 8th and 9th standard students. Similarly, in
2013-2014, the attendance rates for the 10thstandard students were 75% as opposed to an average of
55% for 8th and 9th standard students. While it is encouraging to note that the attendance rates for 8th
and 9th standard students had improved in 2014-2015, the data clearly showed that the overall
attendance rate has been significantly negatively affected by the low rates for the 8thand 9th standard
students. One possible reason for this could be the relatively low level or significance that regular
attendance has on 8th and 9th standard students as opposed to those in the 10th who need to pass the
10th standard exams in order to move up their career. The level of motivation therefore could play a role
in this.
Old vs New schools
Type of School 2013-2014 2014-2015
New 68% 57%
Old 59% 62%
As shown by the table given above, attendance rates saw a similar pattern of better performance among
old schools in 2014-2015. The average attendance rates among old schools in 2014-2015 were 62% as
opposed to 57% among the new schools. However, this is completely the opposite in the previous year
(2013-14), with the new schools performing much better than the old schools. The data therefore shows
that in 2014-2015, while the average attendance rates for old schools have marginally increased, the
same for new schools have steeply declined.

Private and confidential, please do not share Page 29
Co-relation between efforts to improve attendance and attendance rates
The data from the baseline does not seem to suggest any relationship between the grades associated
with the efforts to improve attendance and the actual attendance rates. For e.g., according to the
primary research data 7 out of the 9 schools had reported conducting all of the activities that were
associated with the highest grade given by Masoom for improving attendance including the HM and
teachers making monthly home visits. However, the attendance rates even among these 7 schools were
extremely varied. Similarly in the previous year, according to the Masoom’s internal grading 6 out of the
9 schools were ranked C indicating that these schools were not making home visits or interacting with
parents during meets but just interacting with students to increase their attendance rates. However,
even among these students, the average attendance rates were more than 60%.
One of the reasons for this could be that the quality of conversations, the extent to which parents have
understood the principal and the teacher, circumstances, inherent motivation of the child all are likely to
play a role in improving the attendance rate than the just the number of home visits or phone calls.
Change in attendance since Masoom’s intervention- Perceptions of school principals
While the data on attendance shows a decline in the attendance rate from 2013-2014 to 2014-2015, this
does show the extent of change since the year of Masoom’s intervention. Since this data is not available,
the principals’ perceptions can be used as a proxy for this. All 9 principals resoundingly felt that the
attendances had improved since Masoom’s intervention. In fact, many of them felt that because of
Masoom’s intervention they have paid a lot more emphasis and attention to the attendance rates. Given
below are the reasons for this increase as perceived by the school principals.

Private and confidential, please do not share Page 30
As shown by the data, the provision of infrastructure, the number of home visits and calls and the
provision of nutrition/meals by Masoom have turned out to be the strongest reasons for improvement
in attendance post the intervention according to the school principals. These were also consistently
indicated that the strongest benefits of the program by the different stakeholders as well. Some of the
principals had also indicated other reasons such as the improvement in the quality of teaching, the
provision of life skills for students, increased involvement of parents and awards for students. Other
reasons included writing to the employers directly to let the students attend school regularly.
Overall, it is clear that attendance needs to be more consistent across most schools. Further, given that
attendance rates of 10th standard students and SSC pass percentages are strongly linked, this is an even
more important reason for schools to improve their performance in attendance.
3.4 Bridge course The bridge course is an academic initiative started by
Masoom for students enrolling in the 8th and 9th
standards with the intention of brining those who have
been away from school for along time on par with 8th or
9th standard curriculum. This course was administered
for around a month before the start of the school term
and included subjects like English, mathematics,
Marathi, Hindi and Science. A baseline was administered
before the course to assess the students’ level and an
endline after the course to assess the change.
The schools were provided with a separate ‘bridge
course’ booklet that consisted the relevant subjects and
teachers were trained on it. While focus was not on the
teaching-learning methodologies, the emphasis lay on
adequate and proper administration of the course such that students benefit from it during their tenure
at the night schools.
3.4.1 Low take-up Overall only 34% of all students (31 out of 90) had attended the bridge course. The distribution was
skewed across classes - 38% of class 8 students attested to having undergone the bridge course, 76%
from 9th standard and close to 14% from 10th standard reported to have taken the bridge course when
they were in 8th or 9th. On an average, 57% of the students from only the 8th and 9th standards have
undergone the bridge course.
Internal data from Masoom collected for all 30 schools shows a lower take up of the bridge course with
an average of 23% students who have undergone the bridge course. The highest take up reported by
one school was at 46%, less than half.
… It is very useful because students
get a basic idea about the syllabus
that is going to be taught in the
due course, they get to know the
basics of the subjects. They have
experienced a long break in their
education hence they definitely
need this course…
-Principal at Agarkar school

Private and confidential, please do not share Page 31
It was found that among those students that did not take the bridge course, a majority was not
informed or unaware about the bridge course while others felt that they did not need the course. Some
10th standard students also reported that they had joined the school directly in 10th and hence did not
attend the course.
3.4.2 Utility of the course
Of the student who attended the course, responses were largely positive. Majority of the students (63%)
felt that the bridge course helped them cope with school, 47% felt that it helped them revise concepts
that they may have forgotten while 23% felt that it helped improve specific skills/subject knowledge
while 7% felt that it was their first time learning to read and write. 7% also reported that through the
bridge course they came to like their teachers and felt their teachers were good.
Principals and teachers had overwhelmingly positive reports about the course, hailing it as an important
part of ARISE program as it benefitted students, particularly in preparation for their exams. Nine out of
10 teachers interviewed had implemented the course and felt that the biggest benefit of the bridge
course was that it helped students understand concepts better and helped them refresh their memory
of basic concepts taught in the past, though some teachers expressed skepticism about students’
performance post the course.
Two separate teacher interviews at Agarkar school revealed that the bridge course was not adopted in
their school, despite the principal’s favorable views. Teachers from Agarkar were hostile towards the
course and reported that they were capable of teaching similar concepts with their own curriculum in
the classes.

Private and confidential, please do not share Page 32
None of the control schools had a formal or a systematic bridge course.
3.5 Classroom instruction and teaching methods A total of ten teachers working across the nine sample schools were interviewed. They were asked
questions related to pedagogy and their capacity.
3.5.1 Method of teaching
Teachers seemed to be mainly relying on more traditional methods of teaching before and after ARISE.
Before ARISE, 9 out of 10 teachers insisted on reading textbook and 7 used the blackboards. 3 teachers
also used group activities such as role play and group discussions and 2 teachers reported rote learning.
These methods continued to be used even after ARISE, with a notable difference in the number of
teachers using interactive aids. While only 2 teachers used interactive aids earlier as many as 9 of them
reported using them regularly in classrooms after Masoom began operating in their schools. This
increase in the use of visual aids could be attributed to provision of projectors and supporting apparatus
by Masoom. A teacher also stated that he was able to demonstrate experiments in Science class using
Masoom's mobile laboratory.
3.5.2 Improved capacity to teach Making lesson plans
All teachers reported that they prepared lesson plans – 1 teacher said he/she did it only once a year, 2
teachers reported to preparing the plans on monthly basis and 6 teachers did it on weekly basis. This
seemed to be a regular practice before ARISE as well.

Private and confidential, please do not share Page 33
In terms of the content of the plan, teachers stated that they mostly included the objectives, i.e. target
portion to be completed per week/month and methods of teaching most commonly figured in their
lesson plans. Some teachers also made a note of the significant points per unit, and prepared a question
bank to assess the students' grasp of knowledge. One teacher also said that he left out those segments
that he felt might be difficult for students to grasp. Teaching plans were not made available for the
researchers to assess.
Ensuring completion of homework and timely feedback
8 out of 10 teachers said that they gave their students homework every week. Amongst them, 7 said
that less than half the students managed to complete their homework on time before Masoom's
intervention as shown by the graph below. However, only 2 teachers said that less than 50% of the
students submitted their homework in time after ARISE was initiated, indicating an improvement. A
major reason cited was that a lot of students also worked alongside, and were therefore not up to date
with assignments.
Similarly, the number of teachers who did not correct homework or provide feedback on time reduced
after ARISE was started, and a corresponding increase was seen in the number of those who provided
feedback in a day, as shown by the graph below. While three teachers said they did not correct
homework at all before Masoom, only one teacher continued this practice post-intervention. There was
a corresponding increase seen in the number of respondents who provided feedback in a day, which
rose by 50% from four teachers before Masoom to six since Masoom’s intervention. Lastly, one
respondent maintained the same habit of taking two days to complete homework correction and
providing feedback on the second day.

Private and confidential, please do not share Page 34
Story of change - Rohan Kumar
Rohan Kumar, along with his mother and
brother studies in the 9th standard at the night
school. His brother and he joined the night
school as they had to study while working as
their father had passed away a few years back.
Their mother enrolled as she did not want her
future daughter-in-law to feel that she is
uneducated and to equip herself with basic
education.
Rohan and his brother want to complete their
10th and either pursue higher studies or apply
to a better job. Masoom helped them
understand that night schools are not only for
those who failed but also for those interested
in alternate education options.
Teacher training
All interviewed teachers received training from both the Government’s Education Department and as
well as from Masoom. While the Masoom training was conducted over a day, government trainings
were two days long.
Most teachers cited curriculum development as an area they received training in, while six teachers said
they were trained in classroom teaching methods. Three teachers said they were briefed about
interaction and behavior with students, while some also said that they received training on components
of Masoom’s Program such as an STP Program general training(3) and Bridge Course Training(4).
Additionally one respondent said (s)he was given training on food and textbooks distribution.
Teachers were asked to give their feedback on the effectiveness of training programs undergone by
them. The opinion was split with half of the teachers believing that there were areas in which they
needed more training/skill development.
The common view was that they wished to receive more inputs on teaching methods for ease of
understanding, and to motivate students. Another area cited was time management, as the teacher felt
that time available to finish the syllabus was
insufficient given that the Night Schools functioned
for a shorter duration of time in a day. Lastly, a
teacher expressed the desire to understand student
psyche in order to personalize teaching methods.
3.6 Students’ experience and
aspirations 31 students from the control schools and 90
students from the treatment schools were
interviewed by the Samhita team. For the purpose
of comparison, both groups were asked common
questions about their education experience as well
as aspirations.
Students’ education experience
Four key aspects were considered to assess
students’ educational experience – support from
teachers for SSC, availability of relevant materials
and infrastructure, their attitudes towards the
school and their self esteem.
Private and confidential, please do not share Page 35
3.6.1 Teacher Support for SSC Examination Out of the 53 students currently in Class 10 in the Treatment Group, 94% answered in the affirmative
when asked if teachers took special efforts to prepare for the SSC Examination, over and above usual
teaching.
As shown by the graph above, over 80% of the students cited extra classes before regular school hours,
or on Sundays as a common practice followed to ensure maximum studying takes place in the run up to
the SSC Examination. Also widely mentioned were tips for examinations, which included practicing
questions important from an examination perspective, solving previous years’ papers, and emphasizing
on concepts that are likely to be more scoring. 77% of the students said this was a key measure taken by
their teachers. Other forms of effort children identified were provision of guides and reference material
(51%), one-on-one support(47%), conducting practical Science experiments(36%) and timely
feedback(21%). Several students also felt that the Moderator Sessions, wherein external teachers
conducted lectures for a few years during the academic session, were a commendable effort on part of
their School.
When asked which efforts were most effective to them, 36% of the students said one-on-one support,
23% said extra classes and examination tips, while a few also said reference material and Moderator
Sessions, were most helpful.
As pointed out in previous section, receiving timely feedback from teachers also enhanced the overall
classroom experience for students.
3.6.2 Educational Infrastructure Students were asked whether they were provided infrastructural support by their schools. The Night
Schools supported by Masoom showed more favorable results, as depicted by the graph below.
74% of the students in the Treatment Schools said they had access to a Mobile Laboratory, as opposed
to only 29% of the students in the Control Schools who reported using a Science Laboratory in their
school premises. Students in the Masoom-supported schools could recall having observed or performed
experiments of Physics and Chemistry. 70% of them found the mobile laboratories useful as they felt the
experiments acted as visual aids thereby reinforcing their understanding of concepts, while 66%
believed it made learning interesting and enjoyable as experiments such as the litmus test were visually
appealing to them. There were however, 26% of students in the Treatment Schools who did not have
access to laboratories, a sizeable proportion. Over half of these students had never the laboratory
apparatus, while 26% of them had only seen demos but not performed any experiments themselves.
One student even said that he saw the laboratory for the first time on the day of his examination.

Private and confidential, please do not share Page 36
Similarly, a larger proportion of students in the Treatment Schools also reported that they had received
guides and other reference material, as is evident from the 60 percentage point difference between the
Treatment and Control Groups, in proportion of students answering in the affirmative when asked if
they received any study material. Guides such as ‘21’ and ‘Apekshit’ were mentioned by most students
in the Masoom-supported schools, and some said they were also provided with stationary. Barring two
students who did not find the guides useful, 43% were of the opinion that it helped them prepare better
for their examinations, as they contained past years’ papers. 36% believed it was easier to comprehend
than prescribed textbooks, as concepts were explained in simpler language or with greater clarity. 15%
of the students also found the guides to be more concise, and to-the-point.
3.6.3 Attitudes and feelings towards school A psychometric test4 was administered to each student containing ten questions in statement, each
rated on a five point scale - ranging from strongly disagree to strongly agree. The maximum score for
this test was therefore 50. The graph below shows the overall performance of student:
4 https://cyfernetsearch.org/sites/default/files/PsychometricsFiles/Anderson-Attitudes%20Towards%20School%20%28Grades%206-12%29.pdf

Private and confidential, please do not share Page 37
Since they joined the night schools, 67% of the students scored above 40 points, while 27% of them
scored between 31 and 40 points. Therefore, while roughly 94% of the students were fairly satisfied
with their schooling experience, a majority had a highly satisfactory experience. The responses in the
control school were similar, with 70% of them scoring above 40.
3.6.4 Students’ aspirations and self esteem Masoom strives to improve students’ aspirations and self-esteem by providing them with life skills
training and career counseling. The Rosenberg Test5 was administered to every student in control and
treatment group in order to gauge their self-esteem. The test consisted of seven question marked n a
five point scale with 35 being the highest score possible. The graph below captures overall performance
of students in each group of schools:
5 http://www.yorku.ca/rokada/psyctest/rosenbrg.pdf
Private and confidential, please do not share Page 38
Story of change - Anuradha Chauhan
She is Masoom’s star student, having scored 91% in
the 10th standard board exams, achieving the 1st
rank in the state.
She came from a financially disadvantaged family,
but post-marriage and a baby, her husband
motivated her to continue her studies which she had
discontinued after the 7th (day school).
The British Asian trust has agreed to fund her dream
to become a Chartered Accountant and she has
travelled to London as part of the scholarship and
even had dinner with Prince Charles.
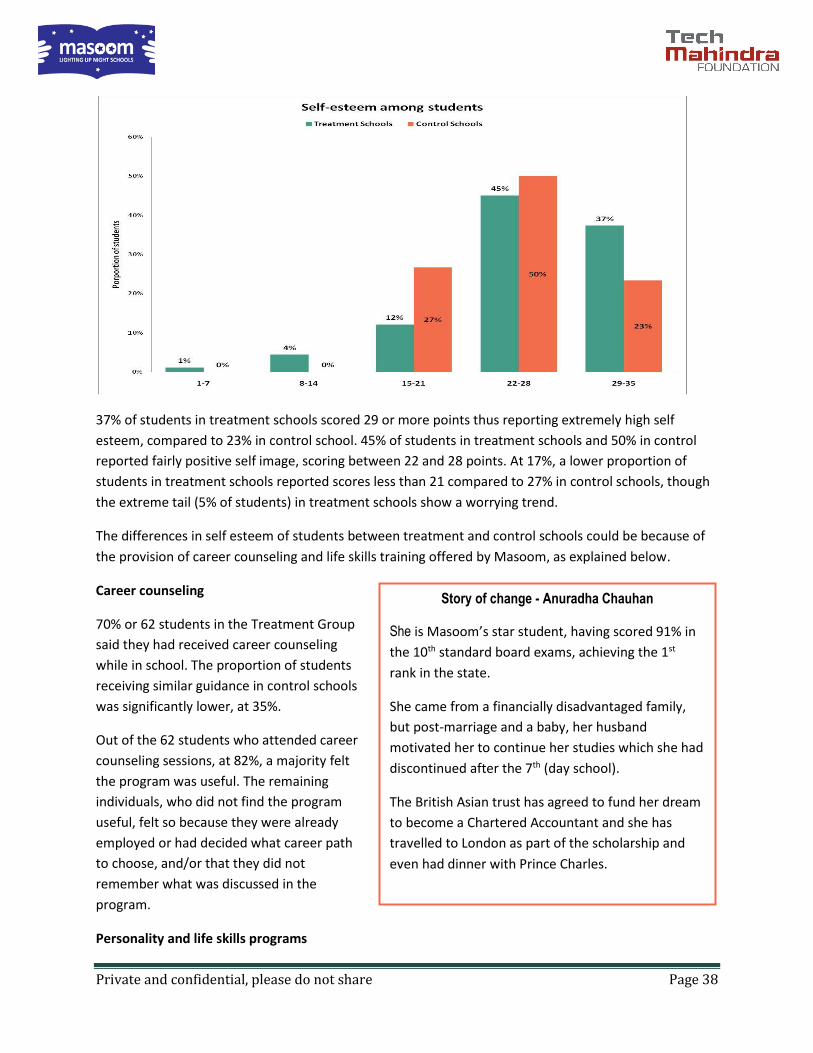
37% of students in treatment schools scored 29 or more points thus reporting extremely high self
esteem, compared to 23% in control school. 45% of students in treatment schools and 50% in control
reported fairly positive self image, scoring between 22 and 28 points. At 17%, a lower proportion of
students in treatment schools reported scores less than 21 compared to 27% in control schools, though
the extreme tail (5% of students) in treatment schools show a worrying trend.
The differences in self esteem of students between treatment and control schools could be because of
the provision of career counseling and life skills training offered by Masoom, as explained below.
Career counseling
70% or 62 students in the Treatment Group
said they had received career counseling
while in school. The proportion of students
receiving similar guidance in control schools
was significantly lower, at 35%.
Out of the 62 students who attended career
counseling sessions, at 82%, a majority felt
the program was useful. The remaining
individuals, who did not find the program
useful, felt so because they were already
employed or had decided what career path
to choose, and/or that they did not
remember what was discussed in the
program.
Personality and life skills programs
Private and confidential, please do not share Page 39
Life skills and personality development sessions were conducted on a pilot basis and only conducted at 2
schools from the sample schools. In these schools, most of the students either reported participating in
sports and extra-curricular activities or coaching on conducting themselves and communicating well in a
professional setting. Close to a fifth reported to having attended computer classes. One student also
mentioned vocational training in candle-making, and another stated that Yoga sessions were conducted
in the school premises.
3.7 Impact on alumni beyond school years To understand the impact of ARISE post the schooling years, Samhita interviewed around 32 alumni and
demarcated four crucial indicators in terms of:
Current status post 10th standard- whether they are employed, pursuing higher studies, working
part time, etc.
Proportion of alumni having goals
Confidence and motivation levels of alumni members
Proportion of alumni satisfied with their current status in life
3.7.1 Status of alumni post 10th standard Analysis of alumni interviews showed that more than half of the alumni were exclusively pursuing higher
studies or vocational courses. At 38%, a significant proportion combined both studying and working.
In terms of work profile, of the 32 interviewed, 15 were found to be employed. 13 of the alumni working
were employed in blue collar jobs, primarily holding jobs in the service sector while the remaining 2
were working in the public sector. From interviews conducted, it was found that Masoom’s STP program
had been instrumental in enabling most alumni pursue their higher studies, despite their financial
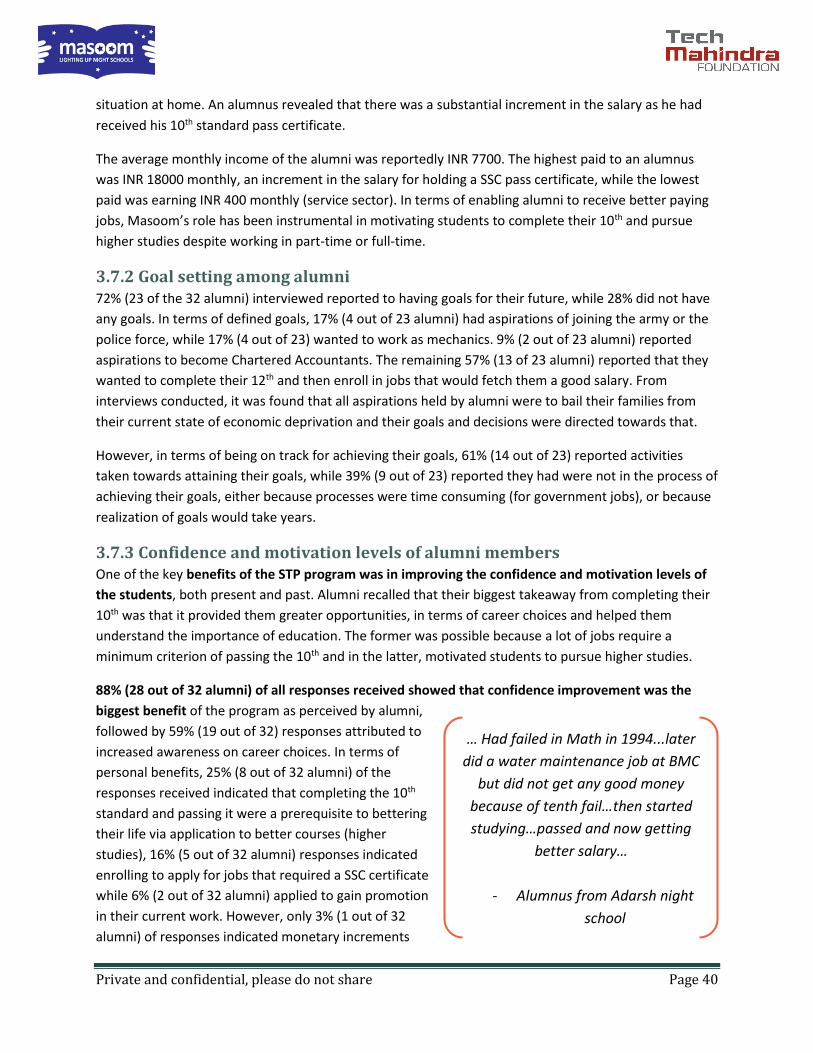
Private and confidential, please do not share Page 40
situation at home. An alumnus revealed that there was a substantial increment in the salary as he had
received his 10th standard pass certificate.
The average monthly income of the alumni was reportedly INR 7700. The highest paid to an alumnus
was INR 18000 monthly, an increment in the salary for holding a SSC pass certificate, while the lowest
paid was earning INR 400 monthly (service sector). In terms of enabling alumni to receive better paying
jobs, Masoom’s role has been instrumental in motivating students to complete their 10th and pursue
higher studies despite working in part-time or full-time.
3.7.2 Goal setting among alumni 72% (23 of the 32 alumni) interviewed reported to having goals for their future, while 28% did not have
any goals. In terms of defined goals, 17% (4 out of 23 alumni) had aspirations of joining the army or the
police force, while 17% (4 out of 23) wanted to work as mechanics. 9% (2 out of 23 alumni) reported
aspirations to become Chartered Accountants. The remaining 57% (13 of 23 alumni) reported that they
wanted to complete their 12th and then enroll in jobs that would fetch them a good salary. From
interviews conducted, it was found that all aspirations held by alumni were to bail their families from
their current state of economic deprivation and their goals and decisions were directed towards that.
However, in terms of being on track for achieving their goals, 61% (14 out of 23) reported activities
taken towards attaining their goals, while 39% (9 out of 23) reported they had were not in the process of
achieving their goals, either because processes were time consuming (for government jobs), or because
realization of goals would take years.
3.7.3 Confidence and motivation levels of alumni members One of the key benefits of the STP program was in improving the confidence and motivation levels of
the students, both present and past. Alumni recalled that their biggest takeaway from completing their
10th was that it provided them greater opportunities, in terms of career choices and helped them
understand the importance of education. The former was possible because a lot of jobs require a
minimum criterion of passing the 10th and in the latter, motivated students to pursue higher studies.
88% (28 out of 32 alumni) of all responses received showed that confidence improvement was the
biggest benefit of the program as perceived by alumni,
followed by 59% (19 out of 32) responses attributed to
increased awareness on career choices. In terms of
personal benefits, 25% (8 out of 32 alumni) of the
responses received indicated that completing the 10th
standard and passing it were a prerequisite to bettering
their life via application to better courses (higher
studies), 16% (5 out of 32 alumni) responses indicated
enrolling to apply for jobs that required a SSC certificate
while 6% (2 out of 32 alumni) applied to gain promotion
in their current work. However, only 3% (1 out of 32
alumni) of responses indicated monetary increments
… Had failed in Math in 1994...later
did a water maintenance job at BMC
but did not get any good money
because of tenth fail…then started
studying…passed and now getting
better salary…
- Alumnus from Adarsh night
school

Private and confidential, please do not share Page 41
since completing 10th standard.
Qualitative information gained from the alumni revealed that apart from boosting morale and providing
them a sense of direction in life, Masoom’s greatest contribution was to enable alumni to strive for
more than they had envisioned. Through all the interviews, it was learned that Masoom’s STP program
was looked at as a second chance where alumni managed to turn their lives around and this was their
greatest takeaway apart from actual education gained.
3.7.4 Overall satisfaction with life An overwhelming 85% (27 out of 32) of the alumni reported to being satisfied (44%) and extremely
satisfied (41%) with the current status of their lives. 9% (3 out of 32 alumni) were unable to provide a
conclusive answer, being neither satisfied nor dissatisfied with their current situation, while 6% (2 out of
32 alumni) were dissatisfied. When probed for reasons of dissatisfaction, the alumnus responded that
the inability to turn his expectation of a job into a reality was making him dissatisfied with life.

Private and confidential, please do not share Page 42
3.8 Activating SMDC One of the key objectives of ARISE was to activate SMDCs in schools, involve them in school related
activities and encourage participation and ownership. Samhita interviewed 14 SMDC members from all
schools to understand their views.
Prior to the intervention, most schools did not have a separate committee where parents and alumni
members were involved to discuss about school related activities. Since Masoom’s intervention, all
schools have set up the SMDC.
3.8.1 Frequency of SMC meetings In terms of frequency of SMDC meetings, despite efforts taken to initiate and conduct regular meetings,
only 21% reported to monthly meetings, 43% of the SMDC members reported to meeting once a
quarter, 14% who reported that meetings happened once in 6 months and 7% reported only annual
meetings. Another 14% (2 out of 14) reported never having been to meetings. This is shown in the graph
below.
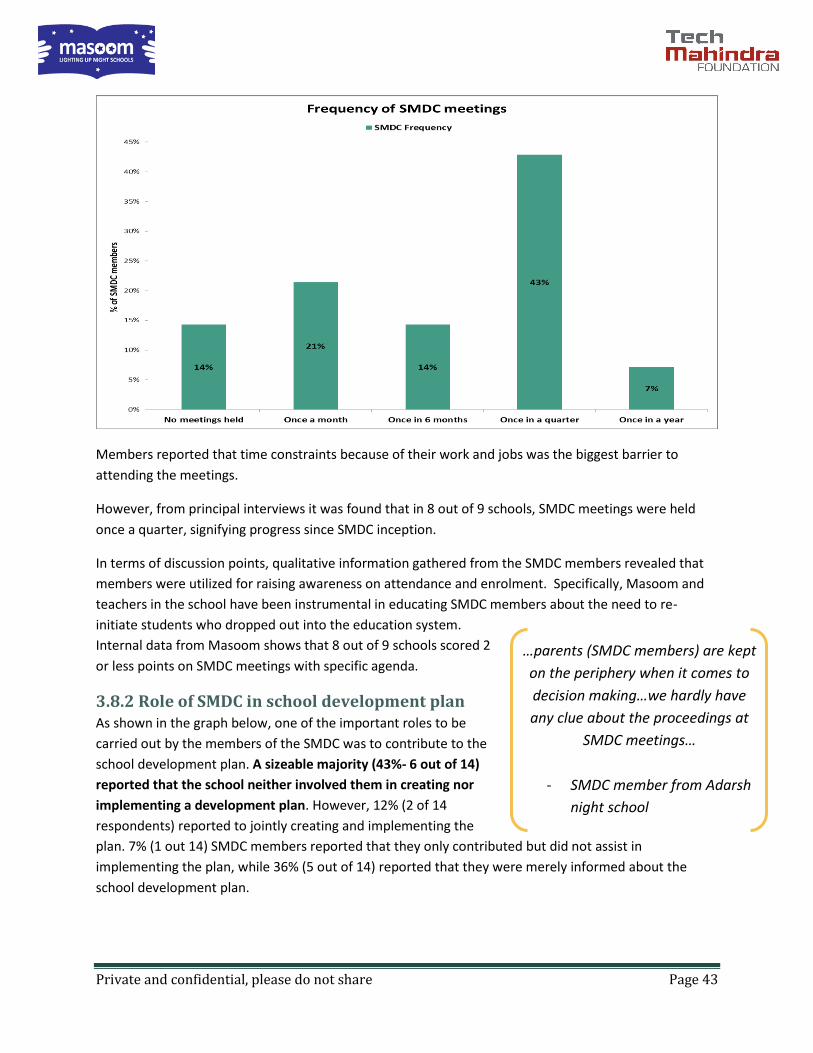
Private and confidential, please do not share Page 43
Members reported that time constraints because of their work and jobs was the biggest barrier to
attending the meetings.
However, from principal interviews it was found that in 8 out of 9 schools, SMDC meetings were held
once a quarter, signifying progress since SMDC inception.
In terms of discussion points, qualitative information gathered from the SMDC members revealed that
members were utilized for raising awareness on attendance and enrolment. Specifically, Masoom and
teachers in the school have been instrumental in educating SMDC members about the need to re-
initiate students who dropped out into the education system.
Internal data from Masoom shows that 8 out of 9 schools scored 2
or less points on SMDC meetings with specific agenda.
3.8.2 Role of SMDC in school development plan As shown in the graph below, one of the important roles to be
carried out by the members of the SMDC was to contribute to the
school development plan. A sizeable majority (43%- 6 out of 14)
reported that the school neither involved them in creating nor
implementing a development plan. However, 12% (2 of 14
respondents) reported to jointly creating and implementing the
plan. 7% (1 out 14) SMDC members reported that they only contributed but did not assist in
implementing the plan, while 36% (5 out of 14) reported that they were merely informed about the
school development plan.
…parents (SMDC members) are kept
on the periphery when it comes to
decision making…we hardly have
any clue about the proceedings at
SMDC meetings…
- SMDC member from Adarsh
night school
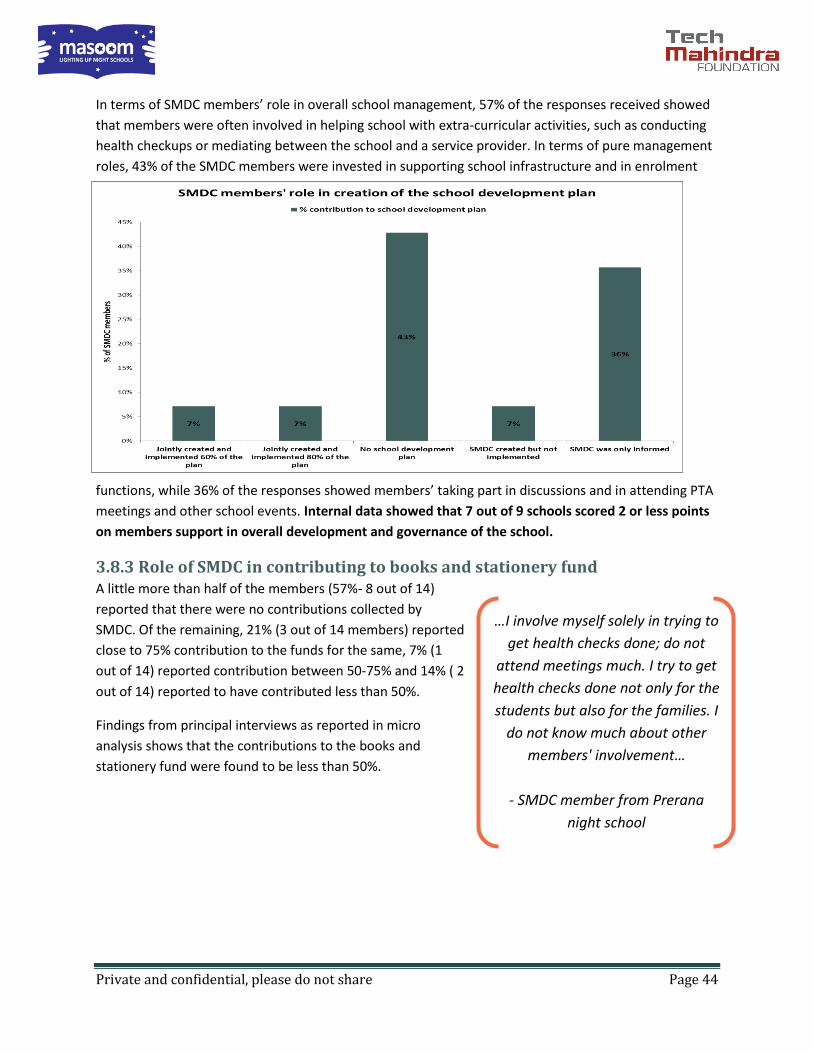
Private and confidential, please do not share Page 44
In terms of SMDC members’ role in overall school management, 57% of the responses received showed
that members were often involved in helping school with extra-curricular activities, such as conducting
health checkups or mediating between the school and a service provider. In terms of pure management
roles, 43% of the SMDC members were invested in supporting school infrastructure and in enrolment
functions, while 36% of the responses showed members’ taking part in discussions and in attending PTA
meetings and other school events. Internal data showed that 7 out of 9 schools scored 2 or less points
on members support in overall development and governance of the school.
3.8.3 Role of SMDC in contributing to books and stationery fund A little more than half of the members (57%- 8 out of 14)
reported that there were no contributions collected by
SMDC. Of the remaining, 21% (3 out of 14 members) reported
close to 75% contribution to the funds for the same, 7% (1
out of 14) reported contribution between 50-75% and 14% ( 2
out of 14) reported to have contributed less than 50%.
Findings from principal interviews as reported in micro
analysis shows that the contributions to the books and
stationery fund were found to be less than 50%.
…I involve myself solely in trying to
get health checks done; do not
attend meetings much. I try to get
health checks done not only for the
students but also for the families. I
do not know much about other
members' involvement…
- SMDC member from Prerana
night school

Private and confidential, please do not share Page 45

4. Micro level analysis
4.1 Overall school index This section of the analysis looks to understand each school’s performance, the progress made from last
year and the parameters in which the school was doing well and areas of improvement.
The construction of the school index consists of a total of 19 parameters (listed in the methodology
chapter) that have been awarded different weights according to the priorities of the ARISE school
program.
Each of these schools have been scored across the different parameters out of a total of 100 points
according to a set of guides that follows the internal marking system of Masoom wherever possible, in
cases where such data was not collected by Masoom in the past, the points have been awarded in
relative terms and guides constructed by Samhita.
Given below are the points for each school under the sample of this study. Please see appendix 1 for
detailed calculations of the index
*Please note that these are adjusted scores since there were SMDC interviews conducted in only 3 schools and dropout
information was unavailable for 2 schools.

Private and confidential, please do not share Page 47
As shown by the graph given above, there is a fair degree of variability between the ranging from a low
of 70.08 points for Ahilya Night School to a high of 87.36 points for Agarkar Night School with the
average school level score being 76.48.
5 out of the 9 schools therefore were found to have school index scores that were below the average
score. It is also important to note that given the number of parameters that has been built into the
index; even the smallest of differences are significant.
In order to understand these results better, the researchers also graded the schools according to the
following categories-
Grade A- 80 or more
Grade B- 75 to 80 points
Grade C- 70 to 75 points
Grade D- 65 to 70 points
The data therefore shows that 2 out of the 9 schools were ranked A, 3 were ranked B, 4 were ranked C
and none of the schools fell in the last category.
Different schools have done well across different parameters. For e.g., while Agarkar Night School, the
top school under this sample had the highest scores across all schools for Alumni, SSC results (tied with
Sahakar), HM as an effective school leader, the SMDC’s contribution, HM as a mentor to the teachers
(tied with BVM), HM providing a holistic schooling experience for students (tied with Prerana), HM
having a strong vision for the school, good relationship between teachers and students (tied with 2
other schools), active PTAs and classroom instruction by teachers. Sahakar night school on the other
hand performed the best in attendance rates and Prerana scored the highest across the student
experience parameter and the teaching-learning process. It is also important to observe that the data
also shown that the top 3 schools were also found to be scoring extremely high in the most important
parameters as well.
4.2 Index for old vs new schools Type of school 70-75 75-80 More than 80 Grand Total
New 3 1 4
Old 1 2 2 5
As shown by the table above, old schools had higher school index scores. Out of the 4 new schools, 3 of
them have scored between 70 and 75 points, i.e. grade C and 1 between 75 and 80 points, i.e grade B.
On the other hand, out of the 5 old schools, only 1 of them scored between 70 and 75 points and 2 of
them scored more than 80 points i.e. grade A.
It was also observed that the average score among old schools was 79.31, as compared to 73 points
among the new schools. This is also a pattern that was seen across most schools and is a broad finding
across this study.

Private and confidential, please do not share Page 48
4.3 Best and worst performing indicators for the schools While the school index scores given in the previous section provides an overall picture of the
performances of the schools, it does not give an indication of the areas in which the schools were doing
well and the areas that the schools require significant support with. The table below gives a snap shot of
the average score per parameter and hence the comparable percentages.
No. Evaluation Parameters Percentage Average Out of a total of
1 Infrastructure- Nutrition 100.0% 4.00 4
2 Infrastructure – education material like students getting notebooks , textbooks, SSC material , bridge course
96.3% 3.85 4
3 Headmaster - As Mentor to teachers 91.1% 4.56 5
4 Infrastructure - access to audio visual material ,science labs and library
88.9% 5.33 6
5 Enrolment - 86.7% 4.33 5
6 Student- extent of awareness 82.8% 3.31 4
7 Alumni - have they reached their aspired future?
79.4% 7.94 10
8 SSC pass percentage 76.9% 7.69 10
9 Teachers - Teaching learning process 76.9% 2.31 3
10 Teacher - relationship with the students 75.9% 3.04 4
11 Student education experience 75.8% 3.79 5
12 Headmaster - As an effective administrator
75.2% 6.01 8
13 Headmaster - Vision for the school 74.4% 3.72 5
14 Headmaster - Inclusive and holistic experience to students
68.3% 3.42 5
15 Parents - Attendance in PTAs and parents aware about issues
62.0% 1.86 3
16 Attendance 58.9% 4.60 8
17 Dropout 55.4% 1.11 2
18 SMDC - Contribution in raising notebooks textbooks and SSC material and school participation in school issues.
50.9% 3.06 6
19 Teacher - Classroom Instruction 46.3% 1.39 3
The top three best performing areas for the schools

Private and confidential, please do not share Page 49
1. Infrastructure - meals and materials
Given that the index measures the access to the infrastructure across the schools, it is also important to
understand the utility of this infrastructure for various purposes. The principals across the 9 schools
clearly indicated that the infrastructure support that they received from Masoom was extremely
important and useful in a number of ways.
An overwhelming 100% of the principals elucidated that the provision of infrastructure particularly
meals had helped to improve attendance and concentration levels as many students came directly from
work, felt tired and did not have the energy to study without a meal. The ‘projector’ helped to retain
students’ interest in the class.
Other benefits of the infrastructure provision as opined by the principals included helping the teachers
execute new teaching methods, particularly the science labs and audio-visuals (78% of principals),
improving the students SSC pass results through improved concentration and interest (44%) and making
the school more welcome (33%). Interestingly, 89% of principals also attributed their perception of
improved attendance since the intervention to the provision of such infrastructure. 7 out of the 9
principals had in fact stated that the infrastructure provision was one of the key benefits of the program.
Further, it is also important to understand that most of the schools did not get access to these facilities
before Masoom’s intervention. It is only in the case of library provision where greater number of schools
had access to it before the program than after. Apart from that, access to quality infrastructure such as
the audio-visual, science lab, the SSC guide and meals had improved post Masoom’s intervention.
Even more importantly, as reported earlier, the students interviewed also clearly opined the utility of
the infrastructure as well. Close to half of the students interviewed had stated that the mobile labs
helped make their classes more fun and had also made the concepts easier for them to understand.
The impact of infrastructural provision is further highlighted when one looks at the extent of access
available for schools that are not under Masoom’s intervention. Among the 3 control schools, none of
them had access to school meals and all 3 of them had expressed the need for the same during the
research team’s interactions with them. Similarly, 89% of the Masoom schools had audio-visual facilities
as opposed to only 1 in 3 control schools.
2. HM’s mentorship with the schools
One of the key features of the Masoom program is the support given to the HM in not just being the
school leader but also a mentor to the teachers. One indicator of this is organizing meetings with the
teachers regularly - while all principals said that they had these meetings prior to the intervention, they
had become more regular after the intervention. While 3 out of 9 school principals had reported that
they held their meetings at random prior to the intervention, none of the principals reported having
meetings at random post the intervention.
Further, all of the principals unanimously reported that they found these meetings extremely useful,
starting from improving the communication between the teachers and the principals, being able to

Private and confidential, please do not share Page 50
discuss more wide range of issues from student learning issues to their placement situation, student
behaviour, stress upon enrolment, being able to appreciate teachers and identify strategies and plans
for improving student performance.
Another aspect of effective mentorship is to appreciate the teachers and establish systems for good
accountability. While 2 principals reported that they did not have such systems before Masoom’s
intervention, none of the schools reported the same after the intervention. Further, 4 principals
reported that they had constituted awards and forums to appreciate outstanding work after the
intervention, only one school had done this before the intervention.
2 out of the 3 control school principals also reported the constitution of awards for the teachers,
indicating that these processes are now also beginning to be set across other night schools
The three worst performing indicators across the 9 schools
1. Teaching- classroom instruction
Classroom instruction was the worst performing indicators for the schools based on the primary data
collected. This is actually heavily influenced by the ‘classroom environment’ indicator across the schools.
Out of the 9 schools, only 1 had charts/children’s work displayed in the classes, 2 teachers reported that
they have the material but only use it when required but do not display in the classes and the rest
reported neither of the two things. Many of the teachers also reported that the night schools were not
allowed to put any materials by the day schools and this is a gauge of the ‘lesser importance’ given to
the night school schools. While this is not a high priority area for Masoom, it presents an opportunity for
better pedagogical systems in night schools since these according to secondary research have direct
outcomes on the learning levels of students and therefore might affect the SSC results at a later stage.
2. SMDC
SMDC’s contribution to the school management has been the 2nd worst performing parameter for the
schools. The interactions with the principals and SMDC members showed that Masoom is in the initial
stages of their intervention with respect to the SMDC. However, considering that only 1 out of the 9
schools had an SMDC set up prior to the intervention, the fact that all of the schools had a functional
SMDC is progress.
An important component of the Masoom program is to identify the SMDC members as contributing to
the school’s resources by raising funds for the same. Despite the intervention, 2 out of the 9 school
principals reported that their SMDC contributed no funds, 6 reported that less than 50% of the
resources required was contributed by them and 1 principal said that they contributed between 50 and
75%. It should be noted that SMDC members were available for interview only in 3 schools and hence
not all of the sub-parameters could be entered and this might have brought the average down slightly.
However, the fact that the school was not able to gather 3-4 members for the research itself is an
indication that the committee may not be an active participant in the school management.

Private and confidential, please do not share Page 51
Out of the 3 control schools, 2 had set up an SMDC on paper and had not contributed anything to the
school.
3. Dropout in night school
Dropout rates were in general found to be high across the schools sampled. Some principals mentioned
that they found it difficult to retain the students. Given below is the dropout rate for 2014-2015 and
2013-2014 across the sampled schools. Information on dropout rates was not available in 2 schools.
As shown by the chart given above, the average dropout rates were about 10%. Between 2013-14 and
14-15, drop-out rate as reported by principals, had declined in 6 out of the 7 schools and increased in
one school.
Dropout is an area of concern for these schools due to the high proportion of students who continue to
discontinue their studies. The principals elucidated quite a few reasons for students to dropout out of
school –
All 9 school principals strongly felt that one reason was that many students were unable to
balance their work and school well
4 out of the 9 principals reported the migratory nature of the students’ jobs which meant they
kept shifting localities.
Inter-connected to this was the migratory nature of their parents’ jobs which also served as a
hindrance to their children’s education.
Distraction by their peers and student’s unwillingness to be disciplined by the school were also
reasons provided by a few principals for students to dropout. 2 principals in particular felt that
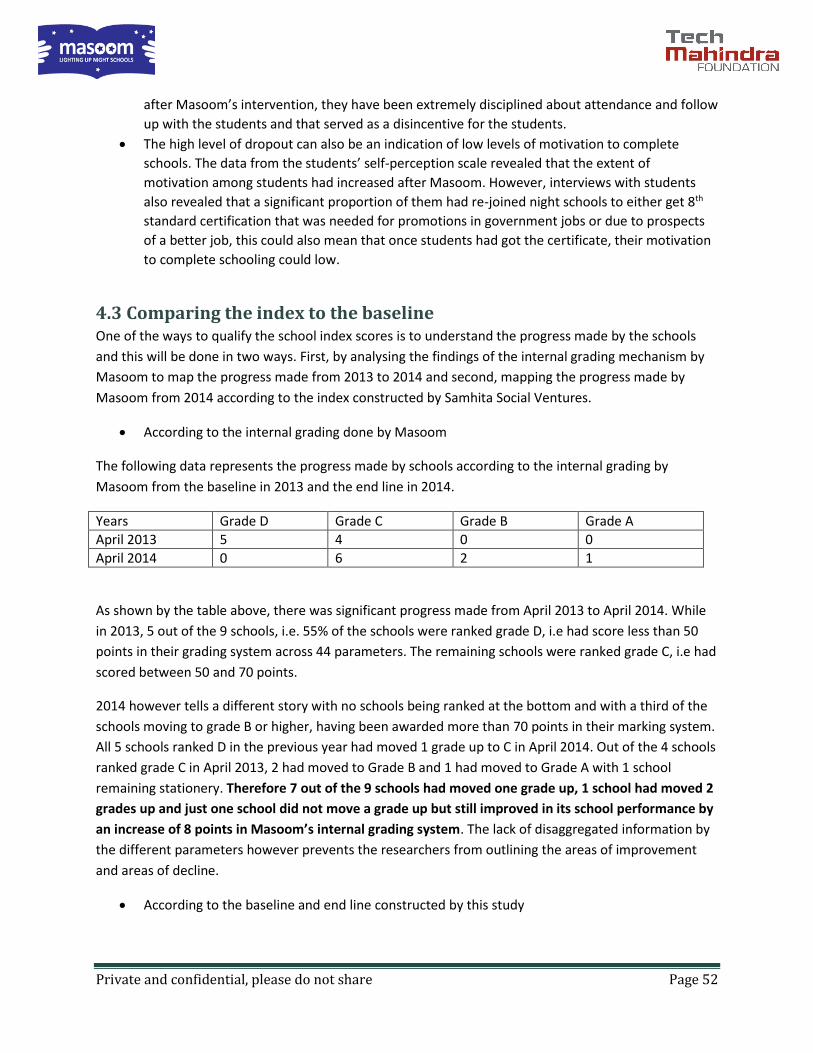
Private and confidential, please do not share Page 52
after Masoom’s intervention, they have been extremely disciplined about attendance and follow
up with the students and that served as a disincentive for the students.
The high level of dropout can also be an indication of low levels of motivation to complete
schools. The data from the students’ self-perception scale revealed that the extent of
motivation among students had increased after Masoom. However, interviews with students
also revealed that a significant proportion of them had re-joined night schools to either get 8th
standard certification that was needed for promotions in government jobs or due to prospects
of a better job, this could also mean that once students had got the certificate, their motivation
to complete schooling could low.
4.3 Comparing the index to the baseline One of the ways to qualify the school index scores is to understand the progress made by the schools
and this will be done in two ways. First, by analysing the findings of the internal grading mechanism by
Masoom to map the progress made from 2013 to 2014 and second, mapping the progress made by
Masoom from 2014 according to the index constructed by Samhita Social Ventures.
According to the internal grading done by Masoom
The following data represents the progress made by schools according to the internal grading by
Masoom from the baseline in 2013 and the end line in 2014.
Years Grade D Grade C Grade B Grade A
April 2013 5 4 0 0
April 2014 0 6 2 1
As shown by the table above, there was significant progress made from April 2013 to April 2014. While
in 2013, 5 out of the 9 schools, i.e. 55% of the schools were ranked grade D, i.e had score less than 50
points in their grading system across 44 parameters. The remaining schools were ranked grade C, i.e had
scored between 50 and 70 points.
2014 however tells a different story with no schools being ranked at the bottom and with a third of the
schools moving to grade B or higher, having been awarded more than 70 points in their marking system.
All 5 schools ranked D in the previous year had moved 1 grade up to C in April 2014. Out of the 4 schools
ranked grade C in April 2013, 2 had moved to Grade B and 1 had moved to Grade A with 1 school
remaining stationery. Therefore 7 out of the 9 schools had moved one grade up, 1 school had moved 2
grades up and just one school did not move a grade up but still improved in its school performance by
an increase of 8 points in Masoom’s internal grading system. The lack of disaggregated information by
the different parameters however prevents the researchers from outlining the areas of improvement
and areas of decline.
According to the baseline and end line constructed by this study
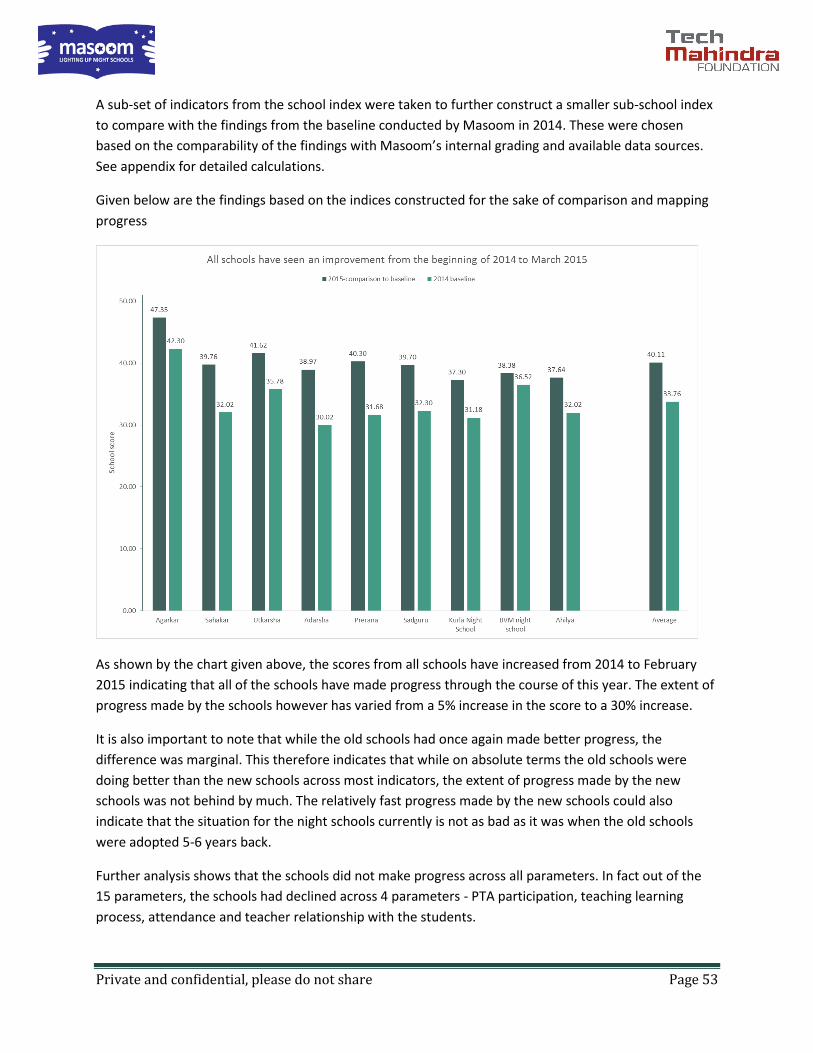
Private and confidential, please do not share Page 53
A sub-set of indicators from the school index were taken to further construct a smaller sub-school index
to compare with the findings from the baseline conducted by Masoom in 2014. These were chosen
based on the comparability of the findings with Masoom’s internal grading and available data sources.
See appendix for detailed calculations.
Given below are the findings based on the indices constructed for the sake of comparison and mapping
progress
As shown by the chart given above, the scores from all schools have increased from 2014 to February
2015 indicating that all of the schools have made progress through the course of this year. The extent of
progress made by the schools however has varied from a 5% increase in the score to a 30% increase.
It is also important to note that while the old schools had once again made better progress, the
difference was marginal. This therefore indicates that while on absolute terms the old schools were
doing better than the new schools across most indicators, the extent of progress made by the new
schools was not behind by much. The relatively fast progress made by the new schools could also
indicate that the situation for the night schools currently is not as bad as it was when the old schools
were adopted 5-6 years back.
Further analysis shows that the schools did not make progress across all parameters. In fact out of the
15 parameters, the schools had declined across 4 parameters - PTA participation, teaching learning
process, attendance and teacher relationship with the students.
Private and confidential, please do not share Page 54
5. Strengths, areas of improvements and recommendations
5.1Strengths of the program 1. Encouraging enrolment through enrolment drives
One of the strongest and most successful aspects of the program was to initiate enrolment drives. In a
scenario where falling enrolment rates have been plaguing night schools and forcing closures,
encouraging enrolment through enrolment drives involving principals, teachers and alumni in
community drives is seen as a life-saver for the night schools. This method also ensures that community
members are aware of non-mainstream education and enroll in night schools.
2. Provision of critical inputs- materials and meals
Headmasters and students were appreciative of Masoom’s support in providing inputs, mostly the SSC
materials and meals. Principals reported that attendance had improved because of the meals program
as working students found meals to be an incentive and motivating factor to attend schools. Students
reported that the guides and science laboratories helped them better prepare for their SSC
examinations, having an impact on SSC results as well.
3. Headmaster’s buy-in and mentorship to teachers
The contribution and involvement of headmasters in the entire life cycle of ARISE has been one of the
strongest factors that has facilitated smooth functioning of the program. Program managers admitted
that without the cooperation of the head masters it would have been difficult to initiate and sustain the
program. Since the introduction of ARISE, head masters have successfully implemented systems and
processes for encouraging teachers’ participation in schools’ activities.
4. SSC Improvement plan
ARISE has been able to contribute to better SSC pass rates in schools, mainly due to the implementation
of the SSC pass rate improvement plan. Under this plan, the schools have volunteered to undertake a
variety of activities, including conducting extra classes, moderator sessions etc.
5. Trustee involvement
Securing buy-in from trustees is a critical part of the program since it creates ownership of the initiative
at the top of the system. The interviews indicate that the trustees were heavily invested in facilitating
ARISE at the schools. They took it upon themselves to look for funders and external sponsors to provide
books, stationery, and guides for the students. It was also found that trustees conduct regular update
meetings and frequently visit schools to review status of ARISE and to address any issues.
6. Regular monitoring and supervision through dedicated program managers

Private and confidential, please do not share Page 55
Program managers are the liaison between Masoom and the schools and have supported the
implementation of ARISE in schools. Program managers are responsible for ensuring that inputs to
schools are being utilized by the teachers via classroom observations and regular meetings with the
head masters. They also help in identifying school-level gaps and customizing the plans to suit their
individual requirements. They ensure that teachers and headmasters function as a cohesive unit within
the school.
4.2 Areas of improvement and recommendations Recommendations for short-run
1. Ensuring regular attendance
While ARISE stresses on implementing activities to improve enrolment, the attendance rate of students,
particularly in classes 8th and 9th has been relatively poor. The study acknowledges the challenges faced
in improving attendance, especially because of the work constraints they face. However, a focused
approach on retaining students throughout the year (especially during festival seasons) through diligent
follow-ups may help in improving attendance. Similarly, incentives such as picnics, sports activities, life-
skills sessions may also help in 8th and 9th grades.
2. Boosting take-up of bridge course
Currently, only students in 8th and 9th grades are offered the bridge course and the take-up of the course
is relatively low. The bridge course plays a significant role in ensuring that students who have been out
of the schooling system for long yeas are able to revise their concepts. Given that many students join
the schools directly in 10th grade, one suggestion would be to implement bridge course for all grades
and ensure that all students are undertaking the course. There is also a need to make students and
teachers more aware on the importance of enrolling for the bridge and completing it.
3. SMDC strengthening
The SMDC strengthening activities could be seen as performing poorly compared to other aspects of
ARISE. The study found poorer than expected outcomes in areas of frequency of SMDC meetings, their
involvement and contribution to school plans. It was also found that members do not function as a
unified school body but rather act out in their individual capacities. Arguably, given that the SMDC
program is still in its infancy and such initiatives take longer periods to produce results, this can be an
area where Masoom might see better results in the future years.
However, ensuring that 2-3 active of the SMDC are made responsible for facilitating and monitoring
meetings, committing and meeting targets would help to define a definite path for the SMDC on annual
basis. Some of the barriers to parental involvement could be their time constraints and the older age
profile of students wherein guardians feel less ‘responsible’, a recommendation would be to include
more alumni as part of the SMDC rather than guardians as the former may be able to connect better to
schools.
4. Burden on program managers

Private and confidential, please do not share Page 56
Program managers are currently supervising 5 schools each. This reduces the time available per school
and effective monitoring of the schools, as schedules for schools may vary owing to festivals, holidays,
etc., disrupting program managers’ plans for a particular school. Further, extra responsibilities, such as
undertaking life skill sessions and facilitating donor visits draws attention away from core program
manager duties. A suggestion to lessen the burden would be to reduce the number of schools per
program manager and contract external partners to undertake the life skill sessions. This would ensure
that program managers have focused responsibilities and enable effective oversight of their schools.
5. Streamlining objectives and prioritizing outcomes
It would be advisable to measure ARISE’s performance on 4-5 key indicators (rather than the 20 odd
defined in this study) that are central to ARISE’s objectives and within the program’s control. To this
end, articulating a theory of change with clearly delineated inputs, outputs and outcomes and
assumptions underlying the outcomes would be helpful.
Recommendation for medium to long run
6. Training teachers on pedagogy
While academic intervention involving pedagogy training may seem like a logical next step for ARISE, it
should be understood that the students are older and may require a different orientation to teach such
as aspects from adult literacy and continuing educations programs. A study is needed to evaluate these
options and commission trainings on these methods, particularly on behavioral adjustments and
motivation levels for teachers as most of them also work in day-schools. In-classroom training sessions
could also help the teachers and reduce the time spent out of the classroom.
7. Advocacy for enhancing classroom environment in night schools
An advocacy campaign with the HMA to reduce the disparity between day and night schools particularly
with aspects such as not allowing night schools to put up displays in classroom or enable greater
enrolment support for schools could yield valuable results in terms on child-friendly pedagogy.
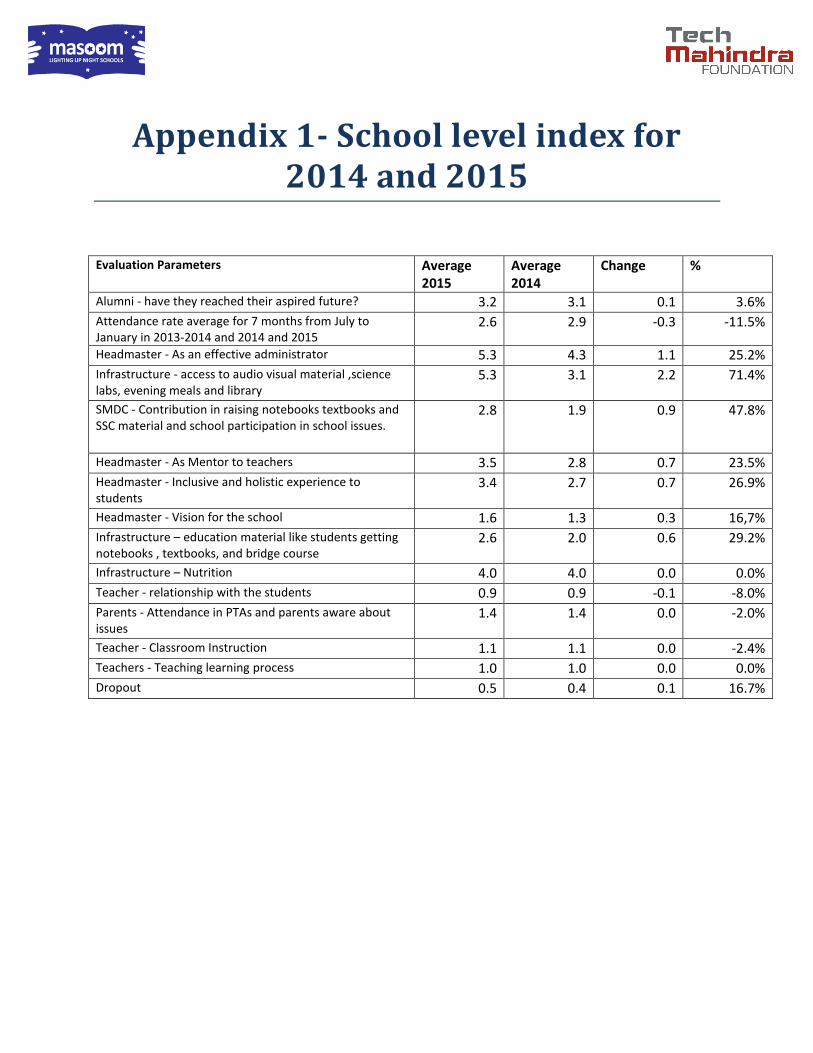
Appendix 1- School level index for 2014 and 2015
Evaluation Parameters Average 2015
Average 2014
Change %
Alumni - have they reached their aspired future? 3.2 3.1 0.1 3.6%
Attendance rate average for 7 months from July to January in 2013-2014 and 2014 and 2015
2.6 2.9 -0.3 -11.5%
Headmaster - As an effective administrator 5.3 4.3 1.1 25.2%
Infrastructure - access to audio visual material ,science labs, evening meals and library
5.3 3.1 2.2 71.4%
SMDC - Contribution in raising notebooks textbooks and SSC material and school participation in school issues.
2.8 1.9 0.9 47.8%
Headmaster - As Mentor to teachers 3.5 2.8 0.7 23.5%
Headmaster - Inclusive and holistic experience to students
3.4 2.7 0.7 26.9%
Headmaster - Vision for the school 1.6 1.3 0.3 16,7%
Infrastructure – education material like students getting notebooks , textbooks, and bridge course
2.6 2.0 0.6 29.2%
Infrastructure – Nutrition 4.0 4.0 0.0 0.0%
Teacher - relationship with the students 0.9 0.9 -0.1 -8.0%
Parents - Attendance in PTAs and parents aware about issues
1.4 1.4 0.0 -2.0%
Teacher - Classroom Instruction 1.1 1.1 0.0 -2.4%
Teachers - Teaching learning process 1.0 1.0 0.0 0.0%
Dropout 0.5 0.4 0.1 16.7%
Copyright © 2022 FDOKUMEN