Headquarters Army in Korea Eighth United States Army Korea ...
Upload
khangminh22Category
view
1download
0
30 31
IJIE Int. J. Indust. Entomol. 35(1) 30-38 (2017)ISSN 1598-3579, http://dx.doi.org/10.7852/ijie.2017.35.1.30
© 2017 The Korean Society of Sericultural Sciences
Received : 4 Aug 2017 Revised : 24 Aug 2017Accepted : 1 Sep 2017
Keywords: Parnassius bremeri, Endangered species, Microsatellite, Molecular marker
The red-spotted apollo butterfly, Parnassius bremeri Bremer, 1864 (Lepidoptera: Papilionidae), is an endangered species in South Korea. Development and application of molecular markers to assess population genetics perspectives can be used as a basis to establish effective conservation strategies. In this study, we developed 12 microsatellite markers specific to P. bremeri using Illumina paired-end sequencing and applied the markers to South Korean populations to understand population characteristics. Genotyping of 40 P. bremeri individuals from three localities showed that at each locus, the observed number of alleles ranged from 6 to 22 and the observed and expected heterozygosities were 0.500-1.00 and 0.465 to 0.851, respectively. Significant deviation from the Hardy–Weinberg equilibrium was not observed in all loci studied. The population based FST and RST collectively suggest that at least the Samcheok population in northernmost Gangwon Province has a significant divergence from the remaining two populations (P < 0.01), and this result is also reflected in the forewing length. Further studies with an increased sample size will be necessary to draw robust conclusions and devise conservation strategies.
© 2017 The Korean Society of Sericultural SciencesInt. J. Indust. Entomol. 35(1), 30-38 (2017)
Introduction
The red-spotted apollo butterfly, Parnassius bremeri Bremer, 1864 (Lepidoptera: Papilionidae) is distributed throughout Russia, Korea, and China, and is noticed mostly in open landscapes in the mountainous rock fields, mountaintop rocks, and riverside rock land (Kim et al., 1999; Ko et al., 2004). In Korea, adult butterflies appear once a year between May and June, and several species of Sedum plants serve as hosts (Ko et al., 2004). This species has historically been detected in a broad
region of the Korean peninsula, but in the last decade only three localities in central regions formed a certain population size (Park and Kim, 1997; Ko et al., 2004; Kim et al., 2011a, 2011b), and is thus listed as a second-degree endangered wild insect in Korea (Kim, 2005).
Previously, P. bremeri has been studied for its ecology, dispersal pattern of metapopulations, host plants, and possible alternative habitats (Park and Kim, 1997; Kim et al., 1999; Ko et al., 2004; Kim et al., 2011a, 2011b, Kim et al., 2012). From a genetics perspective, full-mitochondrial genome of P.
*Corresponding author.Iksoo KimDepartment of Applied Biology, College of Agriculture & Life Sciences, Chonnam National University, Gwangju 61186, Republic of Korea. Tel: +82-62-530-5117 / FAX: +82-62-530-2079E-mail: [email protected]
Development and validation of microsatellite markers for the endangered red-spotted apollo butterfly, Parnassius bremeri (Lepidoptera: Papilionidae), in South Korea
Min Jee Kim1, Su Yeon Jeong1, Sung Soo Kim2, and Iksoo Kim1,*1College of Agriculture & Life Sciences, Chonnam National University, Gwangju, 61186, Republic of Korea2Research Institute for East Asian Environment and Biology, Seoul, 05207, Republic of Korea
Abstract

30 31
Int. J. Indust. Entomol. Vol. 35, No. (1), pp. 30-38 (2017)
Sequence analysis for DNA barcoding region
For species identification, the DNA barcoding region, corresponding to a partial mitochondrial (mt) COI gene sequence (658 bp for Lepidoptera; Hebert et al., 2003) was sequenced from all individuals genotyped for microsatellite loci. To amplify the DNA barcoding region, PCR was performed under the following conditions: an initial denaturation step at 94°C for 7 min; 30 cycles of 94°C for 1 min, 50°C for 1 min, and 72°C for 1 min; and a final extension step of 72°C for 7 min. The primers for the COI gene were adapted from Folmer et al. (1994): LCO1490 (5'-GGTCAACAAATCATAAAGATATTGG-3') and HCO2198 (5'-TAAACTTCAGGGTGACCAAAAAATCA-3'). The PCR products were purified using a PCR Purification Kit (Bioneer, Korea). Electrophoresis was performed in 0.5X TAE (Tris-Acetate EDTA) buffer using 0.5% agarose
bremeri has been examined for its evolutionary characteristics and phylogenetic relationships in Lepidoptera (Kim et al., 2009). Further, DNA barcoding region was employed to sequence the genome of P. bremeri individuals with different number of eyespots on wings, but no relationship between the number of eyespots and haplotype was found (Lee, unpublished data). Nevertheless, no study on population genetics has been conducted in P. bremeri to date.
In this study, using the Illumina paired-end sequencing technique, we newly developed 12 microsatellite markers from P. bremeri, which represents a first for this species. Given the limited access to this endangered species, coupled with its rarity, the results of the population genetic analysis of P. bremeri are, of necessity, based on examination of only a limited number of individuals from three South Korean localities.
Materials and Methods
Sampling, morphological examination, and DNA extraction
Adults of P. bremeri were sampled from three localities (Uiseong, Gyeongsangbuk-do; Yeongdong, Chungcheongbuk-do; and Samcheok, Gangwon-do; Fig. 1) in South Korea during June 2015. Detailed description and coordinates are being omitted to ensure the protection of the insect species. For each location, we obtained the necessary permission to collect from the respective offices. For the collected samples, we examined several morphological characteristics such as forewing length, body length, and wing pattern element to identify existing distinctions among the populations. The measurements were subjected to an analysis of variance (ANOVA) using JMP software ver. 11.1.1 (SAS Institute, Cary, N.C., USA). The statistical significance of pairwise comparisons on forewing length among populations was evaluated by the Tukey-Kramer HSD test. Considering majority of specimens were males (9 out of 10 from Uiseong, 8 out of 10 from Yeongdong, and 16 out of 20 individuals from Samcheok populations) only males were included for the analysis. Total DNA was extracted from the hind legs using a Wizard Genomic DNA Purification Kit in accordance with the manufacturer’s instructions (Promega, USA).
Fig. 1. Sampling location of Parnassius bremeri in South Korea. General locality names are are as follows: 1, Uiseong, Gyeongsangbuk-do; 2, Yeongdong, Chungcheongbuk-do; and 3, Samcheok, Gangwon-do.
32 33
Min Jee Kim et al. Development and validation of microsatellite markers for Parnassius bremeri
Data analyses
Number of alleles, effective number of alleles, observed heterozygosity (HO; Weir, 1990), and expected heterozygosity (HE; Weir, 1990) were calculated using GenAlEx ver. 6.5 (Peakall and Smouse, 2012). Allelic richness (AR) standardized for variation in sample size was calculated using FSTAT 2.9.3.2 (Goudet, 2001). FIS (Hartl and Clark, 1997), which measures the deficiency in heterozygosity due to non-random mating, was estimated for each locus using GenAlEx ver. 6.5 (Peakall and Smouse, 2012). Genotypic linkage disequilibrium (LD) between all pairs of loci, as well as deviation of genotypic frequencies from Hardy-Weinberg equilibrium (HWE), were tested using GENEPOP Web ver. 4.2 (Raymond and Rousset, 1995; Rousset, 2008) by the Markov-chain approach modified from Guo and Thompson (1992) with 10,000 steps of dememorization and iteration. The 95% significance levels for both HWE and LD tests were adjusted using a Bonferroni correction (Rice, 1989). FST, which is estimated based on the infinite allele model of mutation (Weir and Cockerham, 1984) and RST, estimated based on the sum of squared size difference, assuming a stepwise mutation process (Slatkin, 1995) were calculated using Arlequin v. 3.5 (Excoffier and Lischer, 2010). The significance of the FST and RST after adjustment using the Bonferroni correction was obtained using Fisher’s exact test based on 10,000 permutations.
Results and discussion
Morphological and barcode identification
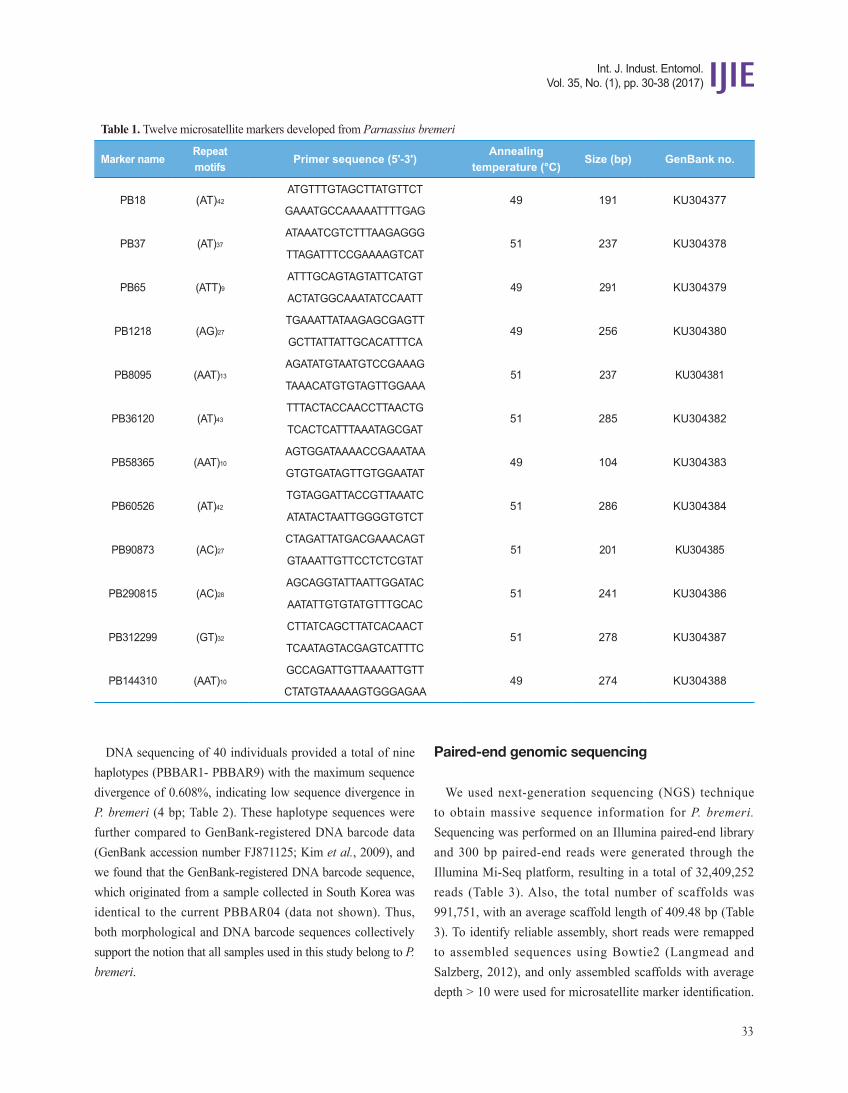
Morphological examination showed that all specimens similarly possessed the typical morphology of P. bremeri. The measurement of forewing length, however, revealed differences among the populations, although body length, wing pattern element, and other morphological measurements were similar: 37-45 mm in Uiseong population with an average of 41 mm, 37-42 mm in Yeongdong population with an average of 39 mm, and 35-39 mm in Samcheok population with an average of 37 mm. Statistical analysis of the forewing length highlighted significant differentiation of the Samcheok population from the remaining two populations (p < 0.0001). Thus, these morphological differences are worthy of a scrutiny, though with extensive sampling.
gels to confirm successful DNA amplification. DNA sequencing was performed using the ABI PRISM® BigDye® Terminator v. 3.1 Cycle Sequencing Kit with an ABI 3100 Genetic Analyzer (PE Applied Biosystems, Foster City, CA, USA). All PCR products were sequenced from both directions. The sequences of both DNA strands from each individual were aligned using ClustalW2 program (Larkin et al., 2007; http://www.ebi.ac.uk/Tools/msa/clustalw2), to obtain a consensus gene sequence. Different haplotypes were chosen for all individuals differing by one or more nucleotides by performing unordered pairwise comparisons among sequences, using PAUP v. 4.0b (Swofford, 1999). Haplotype designations were applied to the new sequences as they were discovered (i.e., PBBAR01, PBBAR02, PBBAR03, and so forth). The GenBank accession numbers for these sequences are MF538534-MF538573.
Paired-end genomic sequencing with Illumina Mi-Seq
For the construction of DNA library, the quality and concentration of the extracted DNA were measured using a NanoDrop spectrophotometer (NanoDrop Technologies, Wilmington, DE, USA). About 200 ng of purified genomic DNA was sheared into ~550 bp fragments using a Covaris S220 ultrasonicator (Covaris, Woburn, MA) and processed to generate a paired-end library using a TrueSeqnano DNA Library Kit (Illumina, San Diego, CA). Detailed experimental procedure is described in Kim et al. (2017).
Development of microsatellite markers and genotyping
The microsatellite sequences with 2-6 repeat motifs were mined using the Msatcommander program (Faircloth, 2008). Candidate microsatellite loci were validated by PCR using primers designed in Primer 3 (Rozen and Skaletsky, 2000). One of the primer pairs for each locus was labeled with 6-carboxyfluorescein (6-FAM) fluorescent dye (Gencube, Korea; Yue and Orban, 2000). PCR was performed under the following conditions: an initial denaturation step at 95°C for 3 min; 30 cycles of 94°C for 30 s, 49-51°C for 30 s, and 72°C for 1 min; and a final extension step of 72°C for 5 min (Table 1). Detailed experimental procedure is described in Kim et al. (2017).
32 33
Int. J. Indust. Entomol. Vol. 35, No. (1), pp. 30-38 (2017)
Paired-end genomic sequencing
We used next-generation sequencing (NGS) technique to obtain massive sequence information for P. bremeri. Sequencing was performed on an Illumina paired-end library and 300 bp paired-end reads were generated through the Illumina Mi-Seq platform, resulting in a total of 32,409,252 reads (Table 3). Also, the total number of scaffolds was 991,751, with an average scaffold length of 409.48 bp (Table 3). To identify reliable assembly, short reads were remapped to assembled sequences using Bowtie2 (Langmead and Salzberg, 2012), and only assembled scaffolds with average depth > 10 were used for microsatellite marker identification.
DNA sequencing of 40 individuals provided a total of nine haplotypes (PBBAR1- PBBAR9) with the maximum sequence divergence of 0.608%, indicating low sequence divergence in P. bremeri (4 bp; Table 2). These haplotype sequences were further compared to GenBank-registered DNA barcode data (GenBank accession number FJ871125; Kim et al., 2009), and we found that the GenBank-registered DNA barcode sequence, which originated from a sample collected in South Korea was identical to the current PBBAR04 (data not shown). Thus, both morphological and DNA barcode sequences collectively support the notion that all samples used in this study belong to P. bremeri.
Table 1. Twelve microsatellite markers developed from Parnassius bremeri
Marker nameRepeat motifs
Primer sequence (5'-3')Annealing
temperature (°C)Size (bp) GenBank no.
PB18 (AT)42ATGTTTGTAGCTTATGTTCT
49 191 KU304377GAAATGCCAAAAATTTTGAG
PB37 (AT)37ATAAATCGTCTTTAAGAGGG
51 237 KU304378TTAGATTTCCGAAAAGTCAT
PB65 (ATT)9ATTTGCAGTAGTATTCATGT
49 291 KU304379ACTATGGCAAATATCCAATT
PB1218 (AG)27TGAAATTATAAGAGCGAGTT
49 256 KU304380GCTTATTATTGCACATTTCA
PB8095 (AAT)13AGATATGTAATGTCCGAAAG
51 237 KU304381TAAACATGTGTAGTTGGAAA
PB36120 (AT)43TTTACTACCAACCTTAACTG
51 285 KU304382TCACTCATTTAAATAGCGAT
PB58365 (AAT)10AGTGGATAAAACCGAAATAA
49 104 KU304383GTGTGATAGTTGTGGAATAT
PB60526 (AT)42TGTAGGATTACCGTTAAATC
51 286 KU304384ATATACTAATTGGGGTGTCT
PB90873 (AC)27CTAGATTATGACGAAACAGT
51 201 KU304385GTAAATTGTTCCTCTCGTAT
PB290815 (AC)28AGCAGGTATTAATTGGATAC
51 241 KU304386AATATTGTGTATGTTTGCAC
PB312299 (GT)32CTTATCAGCTTATCACAACT
51 278 KU304387TCAATAGTACGAGTCATTTC
PB144310 (AAT)10GCCAGATTGTTAAAATTGTT
49 274 KU304388CTATGTAAAAAGTGGGAGAA

34 35
Min Jee Kim et al. Development and validation of microsatellite markers for Parnassius bremeri
Development of microsatellite markers and genotyping
We initially selected 50 candidate microsatellites for testing the availability of primer sites, amplification efficiency, degree of polymorphism, and specificity for target loci. Of these, 12 were eventually selected and used for subsequent genotyping. The PCR parameters and GenBank accession numbers of the 12 loci are listed in Table 1.
The availability of these 12 microsatellite markers ranged from 0.925 to 1, with an average of 0.992, indicating an overall high genotyping success (Table 5). For each locus,
Consequently, 97,399 scaffolds with an average length of 713.518 bp were obtained (Table 4). Trinucleotide repeats were the most abundant class of microsatellites (3,726 regions) detected in the P. bremeri genome, followed by dinucleotide (1,923 regions) and tetranucleotide (1,139 regions) repeats (Table 4).
Table 2. Pairwise comparisons among nine haplotypes obtained from mitochondrial COI gene sequence of Parnassius bremeri
Haplotype 1 2 3 4 5 6 7 8 9
1. PBBAR1 - 0.152 0.456 0.152 0.152 0.152 0.152 0.304 0.152
2. PBBAR2 1 - 0.608 0.304 0.304 0.304 0.304 0.456 0.304
3. PBBAR3 3 4 - 0.304 0.304 0.608 0.608 0.456 0.608
4. PBBAR4 1 2 2 - 0.304 0.304 0.304 0.152 0.304
5. PBBAR5 1 2 2 2 - 0.304 0.304 0.456 0.304
6. PBBAR6 1 2 4 2 2 - 0.304 0.456 0.304
7. PBBAR7 1 2 4 2 2 2 - 0.456 0.304
8. PBBAR8 2 3 3 1 3 3 3 - 0.456
9. PBBAR9 1 2 4 2 2 2 2 3 -
Numbers above the diagonal are mean distance values; numbers below the diagonal are absolute distance values.
Table 3. Summary statistics of Illumina Mi-Seq paired-end (2X300) read sequence data and de novo assembly of Parnassius bremeri genome
Sequencing Data Summary
Platform Mi-Seq
Library Type Paired-end
Read Length (bp) 300
# of Reads 32,409,252
Total bp 9,755,184,852
Assembled Genome Summary
Scaffolds # 991,751
N50 683
N80 318
N90 146
Longest (Shortest) scaffolds bp 13,238 (100)
GC level 35.02%
Scaffolds bp 406,098,606
Scaffolds average length 409.48
Table 4. Summary statistics of filtered scaffolds of Parnassius bremeri genome for microsatellite marker identification
Scaffolds (>10X, >90% coverage)
Scaffolds # 97,399
N50 796
Scaffolds bp 69,495,940
Average coverage 30.40X
Scaffolds average length 713.518
Perfect microsatellite sequences 13,179
Di-nucleotides 1,923
Tri-nucleotides 3,726
Tetra-nucleotides 1,139
Octa-nucleotides 226
Hexa-nucleotides 30
34 35
Int. J. Indust. Entomol. Vol. 35, No. (1), pp. 30-38 (2017)
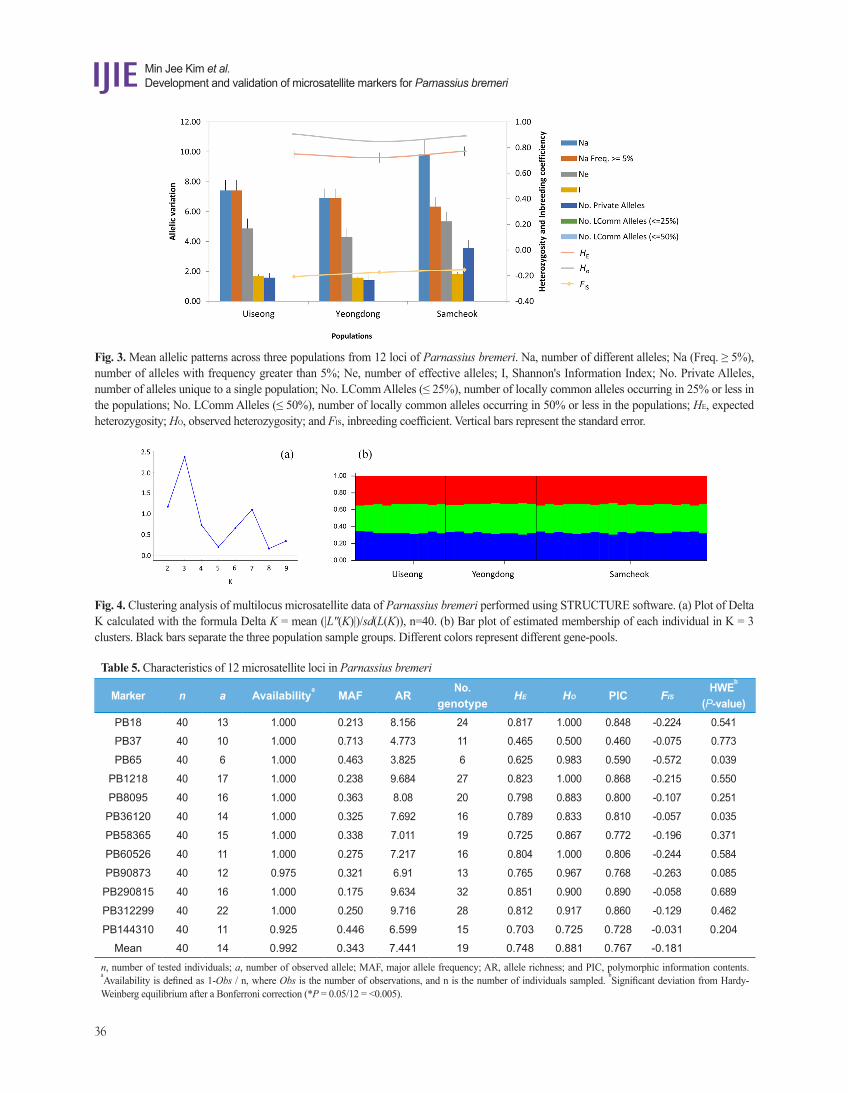
None of the three populations showed evidence of inbreeding (FIS = -0.207 ~ -0.154). The within-population gene diversity, which corresponds to the HE in the diploid data, ranged from 0.722 (Yeongdong and Uiseong) to 0.750 (Samcheok). The analysis of the FST and RST values between populations indicated that FST revealed all populations pairs to have statistically significant differences, whereas RST revealed only Samcheok as the population differentiated from other populations with statistical significance (Table 6).
The disjunctive distributions or regional extinction in populations would result in genetic isolation among populations as a consequence of genetic drift when compared to populations that are interconnected by gene flow (Templeton, 1998). Considering the status of P. bremeri that is listed as an endangered species with a limited number of populations, the genetic subdivision detected by the FST and RST can easily be inferenced, as a consequence of regional extinction, possibly caused by habitat change and reduced host availability. With regard to dispersal, a ‘mark-release-recapture’ study among the patches of a locality in South Korea has found more frequent dispersal among closer patches rather than distant patches with a dispersal distance of less than 300 meters in majority of P. bremeri (Kim et al., 2011a). These ecological and behavioral factors may have concomitantly affected to current population subdivision detected by FST and RST, although this speculation is based only on a limited sample size.
Examination of the likelihood scores from the 10 replicate run across K-values from 1-10 indicated that the optimal K-value was 3, suggesting that the P. bremeri in South Korea is composed of three genetic groups (Fig. 4). The assignment results of K = 3 showed that all sampled individuals exhibited admixture from the three gene-pools with roughly equal contributions, but this admixture was not correlated to geographical and gene pool assignments. Thus, there was no consistent results between the FST, and RST data, forewing length (Table 6; Fig. 2) and the STRCCTURE analysis (Fig. 4). Considering many other typical population genetics studies that use a large sample size (e.g., Kim et al., 2017), our current dataset is very limited. Thus, an expanded study with an elaborate sample size is required to examine our current observations.
In conclusion, microsatellite markers in the past have been developed from several species of Parnassius (Meglécz et al.,
the allele numbers ranged from 6 (locus PB65) to 22 (locus PB312299), with a mean number of 14. The major allele frequency ranged from 0.175 (locus PB290815) to 0.713 (locus PB37). The locus PB290815, which provided the third highest allele number next to PB312299 and PB1218 showed the highest number of genotypes (32). The lowest genotype number (6) was found in the locus PB65 and the average genotype number was 19. The HO and HE values ranged from 0.500 to 1.00 (mean = 0.881) and 0.465 to 0.851 (mean = 0.748), respectively, indicating somewhat higher HO. Positive FIS values, which indicate a heterozygote deficiency, were not observed in any locus. No locus was found to be significantly different from HWE after applying the Bonferroni correction (P = 0.05/12 ≤ 0.005). The tests for genotypic LD showed no significant allele associations among the 12 loci after applying the Bonferroni correction, suggesting that all loci can be considered to be independent markers.
Population genetics analysis
The Samcheok population, in which nearly twice the number of individuals were analyzed twice compared to other populations revealed a significantly higher number of different alleles (9.833 ± 0.999 vs. 7.417 ± 0.712 in Uiseong and 6.917 ± 0.621 in Yeongdong) and number of private alleles (3.583 ± 0.999 vs. 1.583 ± 0.313 in Uiseong and 1.417 ± 0.379 in Yeongdong; Fig. 3). However, other allelic patterns across populations indicate an absence of obvious difference among populations.
Fig. 2. Plot of the forewing length according to Parnassius bremeri populations. The forewing length for Samcheok population was significantly different from the remaining populations (p < 0.001). Vertical bars indicate standard deviations. Horizontal bars indicate standard deviations. The horizontal line across populations indicate mean value of forewing length (38.8 mm).
36 37
Min Jee Kim et al. Development and validation of microsatellite markers for Parnassius bremeri
Fig. 3. Mean allelic patterns across three populations from 12 loci of Parnassius bremeri. Na, number of different alleles; Na (Freq. ≥ 5%), number of alleles with frequency greater than 5%; Ne, number of effective alleles; I, Shannon's Information Index; No. Private Alleles, number of alleles unique to a single population; No. LComm Alleles (≤ 25%), number of locally common alleles occurring in 25% or less in the populations; No. LComm Alleles (≤ 50%), number of locally common alleles occurring in 50% or less in the populations; HE, expected heterozygosity; HO, observed heterozygosity; and FIS, inbreeding coefficient. Vertical bars represent the standard error.
Fig. 4. Clustering analysis of multilocus microsatellite data of Parnassius bremeri performed using STRUCTURE software. (a) Plot of Delta K calculated with the formula Delta K = mean (|L''(K)|)/sd(L(K)), n=40. (b) Bar plot of estimated membership of each individual in K = 3 clusters. Black bars separate the three population sample groups. Different colors represent different gene-pools.
Table 5. Characteristics of 12 microsatellite loci in Parnassius bremeri
Marker n a Availabilitya MAF ARNo.
genotype HE HO PIC FIS
HWEb
(P-value)PB18 40 13 1.000 0.213 8.156 24 0.817 1.000 0.848 -0.224 0.541
PB37 40 10 1.000 0.713 4.773 11 0.465 0.500 0.460 -0.075 0.773
PB65 40 6 1.000 0.463 3.825 6 0.625 0.983 0.590 -0.572 0.039
PB1218 40 17 1.000 0.238 9.684 27 0.823 1.000 0.868 -0.215 0.550
PB8095 40 16 1.000 0.363 8.08 20 0.798 0.883 0.800 -0.107 0.251
PB36120 40 14 1.000 0.325 7.692 16 0.789 0.833 0.810 -0.057 0.035
PB58365 40 15 1.000 0.338 7.011 19 0.725 0.867 0.772 -0.196 0.371
PB60526 40 11 1.000 0.275 7.217 16 0.804 1.000 0.806 -0.244 0.584
PB90873 40 12 0.975 0.321 6.91 13 0.765 0.967 0.768 -0.263 0.085
PB290815 40 16 1.000 0.175 9.634 32 0.851 0.900 0.890 -0.058 0.689
PB312299 40 22 1.000 0.250 9.716 28 0.812 0.917 0.860 -0.129 0.462
PB144310 40 11 0.925 0.446 6.599 15 0.703 0.725 0.728 -0.031 0.204
Mean 40 14 0.992 0.343 7.441 19 0.748 0.881 0.767 -0.181
n, number of tested individuals; a, number of observed allele; MAF, major allele frequency; AR, allele richness; and PIC, polymorphic information contents. aAvailability is defined as 1-Obs / n, where Obs is the number of observations, and n is the number of individuals sampled.
bSignificant deviation from Hardy-
Weinberg equilibrium after a Bonferroni correction (*P = 0.05/12 = <0.005).

36 37
Int. J. Indust. Entomol. Vol. 35, No. (1), pp. 30-38 (2017)
8, 92-94.
Folmer O, Black M, Hoeh W, Lutz R, Vrijenhoek R (1994) DNA
primers for amplification of mitochondrial cytochrome c oxidase
subunit I from diverse metazoan invertebrates. Mol Mar Biol
Biotechnol 3, 294-299.
Guo SW, Thompson EA (1992) Performing the exact test of Hardy-
Weinberg proportions for multiple alleles. Biometrics 48, 361-372.
Goudet J (2001) FSTAT: A program to estimate and test gene diversities
and fixation indices (version 2.9.3). http://www2.unil.ch/popgen/
softwares/fstat.htm. Accessed 31 May 2017.
Hartl DL, Clark AG (1997) Principles of population genetics (3rd ed).
Sinauer Associates, Sunderland.
Hebert PD, Cywinska A, Ball SL, deWaard JR (2003) Biological
identifications through DNA barcodes. Proc Biol Sci 270, 313-321.
Keyghobadi N, Roland J, Strobeck C (1999) Influence of landscape on
the population genetic structure of the alpine butterfly Parnassius
smintheus (Papilionidae). Mol Ecol 8, 1481-1495.
Kim YS (2005) Illustrated Book of Korean Butterflies in Color. Kyo-
Hak Pub. Co., Seoul, Korea.
Kim MI, Baek JY, Kim MJ, Jeong HC, Kim KG, Bae CH et al(2009)
Complete nucleotide sequence and organization of the mitogenome
of the red-spotted apollo butterfly, Parnassius bremeri (Lepidoptera:
Papilionidae) and comparison with other lepidopteran insects. . Mol
Cells 29, 1-10.
Kim DS, Cho YB, Koh JK (1999) The factors of local disappearance
and a plan of restoration for Parnassius bremeri form Okchon-gun,
Korea. Korean J Environ Biol 17, 469-479.
Kim S-R, Kim K-Y, Jeong JS, Kim MJ, Kim K-H, Choi G-H et al
(2017) Population genetic characterization of the Japanese oak
silkmoth, Antheraea yamamai (Lepidoptera: Saturniidae), using
novel microsatellite markers and mitochondrial DNA gene sequences.
Genet Mol Res 16, gmr1602908.
Kim DS, Kwon YJ, Kim DH, Kim CH, Seo MH, Park SJ et al (2011a)
Habitat restoration initiative for endangered species Parnassius
bremeri (Lepidoptera: Papilionidae) in Korea. Journal of the Korean
Institute of Landscape Architecture 39, 98-106.
Kim DS, Park SJ, Cho Y, Kim KD, Tho JW, Seo HS et al (2012) The
analysis and conservation of patch network of endangered butterfly
Parnassius bremeri (Lepidoptera: Papilionidae) in fragmented
landscapes. Korean J Appl Entomol 51, 23-31.
Kim DS, Park DS, Kwon YJ, Seo SJ, Kim CH, Park SJ et al (2011b)
Metapopulation structure and movement of a threatened butterfly
Parnassius bremeri (Lepidoptera: Papilionidae) in Korea. Korean J
Appl Entomol 50, 97-105.
1998; Keyghobadi et al., 1999; Petenian et al., 2005; Mira et al., 2014), but no microsatellite markers were developed specifically from P. bremeri. In this study, we succeeded in developing a suite of polymorphic microsatellite markers for P. bremeri. These markers will be used to study the population genetics structure of undiscovered Asian populations and additional South Korean populations of P. bremeri. Although our data is based on a limited sample size, the genotyping results indicate that P. bremeri populations in South Korea are somewhat differentiated from one another, particularly, the northern Samcheok population. Probably, regional extinction, along with dispersal behavior may have caused such subdivision. As more samples are collected from diverse regions of Asia, including South Korea, further scrutinized data analysis will be performed.
Acknowledgements
This work was supported by a grant from the National Institute of Biological Resources (NIBR), funded by the Ministry of Environment (MOE) of the Republic of Korea (NIBR201603204).
References
Excoffier L, Lischer HE (2010) Arlequin suite ver 3.5: a new series of
programs to perform population genetics analyses under Linux and
Windows. Mol Ecol Resour 10, 564-567.
Faircloth BC (2008) msatcommander: detection of microsatellite repeat
arrays and automated, locus-specific primer design. Mol Ecol Resour
Table 6. Analysis of genetic differentiation between pairs of Parnassius bremeri populations
1. Uiseong 2. Yeongdong 3. Samcheok
1. Uiseong 0 -0.00533 0.07562**
2. Yeongdong
0.01862** 0 0.05974**
3. Samcheok
0.02486** 0.03599** 0
**, P < 0.01.Below diagonal, FST; and above diagonal, RST.

38 PB
Min Jee Kim et al. Development and validation of microsatellite markers for Parnassius bremeri
Raymond M, Rousset F (1995) GENEPOP (ver 1.2): population
genetics software for exact tests and ecumenicism. J Hered 86, 248-
249.
Rice WR (1989) Analyzing tables of statistical tests. Evolution 43, 223-
225.
Rousset F (2008) genepop’007: a complete re-implementation of the
genepop software for Windows and Linux. Mol Ecol Resour 8, 103-
106.
Rozen S, Skaletsky H (2000) Primer3 on the WWW for general users
and for biologist programmers. Methods Mol Biol 132, 365-386.
Slatkin M (1995) A measure of population subdivision based on
microsatellite allele frequencies. Genetics 139, 457-462.
Swofford DS (1999) PAUP* 4.0: phylogenetic analysis using parsimony
(*and other methods). Version 4b2. Sinauer Associates, Sunderland,
Mass.
Templeton AR (1998) Nested clade analyses of phylogeographic data:
testing hypotheses about gene flow and population history. Mol Ecol 7,
381-397.
Weir SW (1990) Genetic data analysis II. Sinauer Associates,
Sunderland
Weir BS and Cockerham CC (1984) Estimating F-statistics for the
analysis of population structure. Evolution 38, 1358-1370.
Yue GH, Orban L (2000) Rapid isolation and characterization of
microsatellites from the genome of Asian arowana (Scleropages
formosus, Osteoglossidae, Pisces). Mol Ecol 9, 1007-1009.
Ko MS, Lee JS, Kim CH, Kim SS, Park KT (2004) Distributional Data
and Ecological Characteristics of Parnassius bremeri Bremer in
Korea. Korean J Appl Entomol 43, 7-14.
Langmead B, Salzberg SL (2012) Fast gapped-read alignment with
Bowtie 2, Nat Methods 9, 357-359.
Larkin MA, Blackshields G, Brown NP, Chenna R, McGettigan PA,
McWilliam H et al. (2007). Clustal W and Clustal X version 2.0.
Bioinformatics 23, 2947-2948.
Meglécz E, Pecsenye K, Varga Z, Solignac M (1998) Comparison
of differentiation pattern at allozyme and microsatellite loci in
Parnassius mnemosyne (Lepidoptera) populations. Hereditas 128, 95-
103.
Mira Ó, Martínez JG, Dawson DA, Tinaut A, Sánchez-Prieto C (2104)
Twenty new microsatellite loci for population structure and parentage
studies of Parnassius apollo nevadensis (Lepidoptera; Papilionidae).
J Insect Conserv 18, 771-779.
Park KT, Kim SS (1997) Atlas of butterflies. Korea Research institute of
bioscience and biotechnology and center for insect systematic, Korea.
Peakall R, Smouse PE (2012) GenAlEx 6.5: genetic analysis in Excel.
Population genetic software for teaching and research. Bioinformatics
28, 2537-2539.
Petenian F, Meglecz E, Genson G, Rasplus JY, Faure E (2005) Isolation
and characterization of polymorphic microsatellites in Parnassius
apollo and Euphydryas aurinia (Lepidoptera). Mol Ecol Notes 5,
243-245.
Copyright © 2022 FDOKUMEN