id/eprint/2378/ - LBS Research Online - London Business School
203
LBS Research Online Lihui Tian Government, governance and finance: some corporate finance issues in China’s emerging stock market Thesis This version is available in the LBS Research Online repository: Tian, Lihui (2003) Government, governance and finance: some corporate finance issues in China’s emerging stock market. Doctoral thesis, University of London: London Business School. DOI: https://doi.org/10.35065/NUWQ5163 Users may download and/or print one copy of any article(s) in LBS Research Online for purposes of research and/or private study. Further distribution of the material, or use for any commercial gain, is not permitted.
-
Upload
khangminh22 -
Category
Documents
-
view
0 -
download
0
Transcript of id/eprint/2378/ - LBS Research Online - London Business School

LBS Research Online
Lihui TianGovernment, governance and finance: some corporate finance issues in China’s emerging stockmarketThesis
This version is available in the LBS Research Online repository: https://lbsresearch.london.edu/id/eprint/2378/
Tian, Lihui
(2003)
Government, governance and finance: some corporate finance issues in China’s emerging stockmarket.
Doctoral thesis, University of London: London Business School.
DOI: https://doi.org/10.35065/NUWQ5163
Users may download and/or print one copy of any article(s) in LBS Research Online for purposes ofresearch and/or private study. Further distribution of the material, or use for any commercial gain, isnot permitted.
GOVERNMENT, GOVERNANCE, AND FINANCE
-Some Corporate Finance Issues in China's Emerging Stock Market
Lihui Tian
Thesis submitted in fulfillment of The requirements for the degree of
PhD at the
London Business School University of London
Program Authorized to Offer Degree:
PhD Programme at the London Business School
October 2002
Lon

London Business School University of London
Abstract
GOVERNMENT, GOVERNANCE, AND FINANCE -Some Corporate Finance Issues in China's Emerging Stock Market
Lihui Tian
This thesis documents the ownership and control, capital structures and initial public offerings of China's modem firms listed on its burgeoning stock market. I find that there is a U-shaped relation with a higher left end between the values of firms and the sizes of government shareholdings; managerial agency costs increase with the sizes of bank loans; and that governmental interests-centered financial regulations and China-specific investments risks bring about China's IPO underpricing as severe as 267%. Three main findings show the profound impacts of the government on corporate governance and financial development. There are two hands of the government influencing the firms: a grabbing hand and a helping hand. The Chinese government is intelligent and sophisticated, but some social elites - both the managers and the bureaucrats -benefit from the widespread businesses of the government at the expense of corporate wealth.

TABLE OF CONTENTS
List of Figures .............................................................................................................................................. ii List of Tables ............................................................................................................................................... iii Acknowledgement
....................................................................................................................................... v Abbreviations
............................................................................................................................................. vi
Introduction ................................................................................................................................................. i
Chapter 1: Government Shareholding and the Value of China's Modem Firms ........................... 6 1. Introduction ...................................................................................................................................... 7 2. Modern Firms in China and the Emerging Stock Market ...................................................... 10 3. Ultimate Shareholding Structure and the Government Shareholder ................................... 20 4. Government Shareholder and the Determinants of Corporate Value ................................ 28 5. The Overall Impact of Government Shareholding is Detrimental ...................................... 35 6. The Two Hands of the Chinese Government Shareholder .................................................. 42 7. Conclusion ....................................................................................................................................... 60 Appendix 1. Data Sources
................................................................................................................ 62 Appendix 2. Shanghai State Asset Management System ............................................................ 63
Chapter 2: Debt Governance, Bank Capture and Soft Budget Constraints .................................. 64 1. Introduction .................................................................................................................................... 65 2. China's Modem Firms and Financial Institutions ................................................................... 67 3. Capital Structure and Soft Budget Constraints ........................................................................ 74 4. Data Samples, Proxies and Univatiate Analysis ....................................................................... 81 5. Multivariate Regressions ............................................................................................................... 94 6. Further Discussion ..................................................................................................................... 111 7. Conclusion .................................................................................................................................... 114 Appendix 1: Data Sample: Sources and Data Selection ........................................................... 116 Appendix 2: Multivariate Regressions: Models, Control Variables and Methods .............. 118 Appendix 3: Scatterplot Matrices of Debt and Managerial Exploitation ............................. 121
Chapter 3: Financial Institutions, Investment Risks and Detemiinants of the Chinese IPO Underpricing ............................................................................................................................................ 123
1. Introduction ................................................................................................................................. 124 2. China's Primary Market ............................................................................................................. 128 3. Detertninants of the Chinese IPO Underpricing .................................................................. 139 4. Data, Empirical Methods and Tests ........................................................................................ 150 5. Further Discussion ..................................................................................................................... 177 6. Conclusion .................................................................................................................................... 178
Condusion ............................................................................................................................................... 180
BibRography ............................................................................................................................................ 185

LIST OF FIGURES
1. Illustration of Chapter 1: Ownership and Control 3
2. Illustration of Chapter 2: Capital Structure 4
3. Illustration of Chapter 3: Initial Public Offerings 5
4. State Shareholding and Corporate Value (U-shaped Curve) 45
5. Rationalization of the U-shaped Relation 53
6. Simplified Financial Structure of China's Modem Firms 68
7. Theoretical Framework and Development of Contradictory Hypotheses 76
8. Scatterplot Matrices of Debt and Managerial Exploitation 121
9. IPO Underpricing around the World 124
10. P/E Comparison 137
11. Analytical Framework of IPO Underpricing in China 141
ii

LIST OF TABLES
Chapter I
I. I. Simplified Balance Sheets of Chinese Public Listed Companies 15
1.2. Chinese Stock Market 17
1.3. Official Share Classes 20
1.4. Shareholding Structures of Chinese Quoted Firms 23
1.5. Corporate Performance along the State Shareholding Spectrum 31
1.6. Definition and Signs of Variables 33
1.7. Comparing the Value and Characteristics of Firms 36
1.8. Corporate Value in Different Enterprises 38
1.9. Corporate Value and Government Shareholding: 1 43
1.10. Corporate Value and dovernment Shareholding: 11 47
1.11. Helping Hand of the Government 57
Chapter 2
2.1. Financial Leverages 69
2.2. Bad Loans 73
2.3. Administration Cost 85
2.4. Cash Retention 87
2.5. Board-member Turnover 89
2.6. Spectrum of Managerial Agency Costs on Financial Leverage 93
2.7. Regressions of Administration Cost 96
iii
2.8. Regressions of Investment Ratio 99
2.9. Regressions of Board-member Turnover 103
2.10. Regressions of Managerial Exploitation 105
Chapter 3
3.1. China's Stock Market Development from 1992 to 2000 130
3.2. Share Classes on China's Stock Market 132
3.3. Underwriters and Underwriting Methods in China 134
3.4. Literature Survey of China's Initial Public Offerings 140
3.5. Descriptive Statistics and Univariate Analyses 152
3.6. Ownership Types of Issuers 160
3.7. Time Gap between Offering Date and Flotation Date 162
3.8. Determinants of Listing Time Lags
3.9. Determinants of Initial Returns
166
172
iv

ACKNOWLEDGEMENT
The emotional support from my parents and my sister is essential to the completion of this thesis. The author wishes to express sincere appreciation to Professor Saul Estrin and Professor Julian Franks for their guidance, encouragement, and time spent during the last five years.
Chapter 1 benefits from the comments of James Ang, Alun Bevan, Ken Charman, Saul Estrin, Julian Franks, William Megginson, JP Mei, Larry Lang, Mario Nuti, Enrico Perotd, Lawrence Rose, Henri Servaes, Oren Sussman, Eli Talmor, Paolo Volpin and participants of the seminars at the London Business School, Cardiff Business School, Columbia Business School, Brunel University and Lancaster University, the Fords International Finance Conference (2000) and the 2 nd Asian Corporate Governance Conference (2002). Ile working paper of this chapter won the best-papet award from the Global Finance Conference (Beijing, 2002).
Chapter 2 benefits from the comments of Saul Estrin, Julian Franks, David Li, Mario Nuti, Jan Svejnar, TJ Wong and the participants of the seminars at INSEAD, Lancaster University, London Business School, the University of Michigan and the CES/HKUST Annual Meeting (2002). This chapter was nominated for the GFA best- paper award and it has been invited to be presented in Financial Management Association Annual Meeting (2002) and the American Social Science Association Annual Meetings (2003).
Chapter 3 benefits from the discussions with Sumon Bhaumik, Saul Estrin, Julian Franks, Jevons Lee, William Megginson, Enrico Petotti and the participants of the ESRC/CEA Finance and Accounting Meeting in Cardiff (2002) and the EU/FEEM Conference on Privatization, Corporate Governance and Financial Development in Milan (2002).
Data collection for my thesis would not have been possible without the help of Tianguang Wang and Dr. Yaping Xu from the China Securities Regulatory Commission, President Yun Xia from the Hairong Co., and Dr Houqi Zhang from the Hua Xia Securities Co. The Center for New and Emerging Markets at the London Business School also sponsored the one-year subscription of the Taiwan Economic journal data set. The core data set was provided by Hui Gong, the former Vice President of Genius Company.
The core financial support of the Centre for the New and Emerging Markets at the London Business School is gratefully acknowledged. The PhD programme, Department of Finance and Department of Economics at the London Business School also support my research and conference activities. I received further support from the following institutes: the China Securities Regulation Commission, the Chinese Economic Association (UKý, the Chinese Economist Society (North America), the Darden Business School, the European Union TMR Project, the Financial Service Exchange, the London Goodenough Trust, the Peking University, the Review of Economic Studies, the Royal Economic Society, the Tinbergen Institute (Visiting PhD Researcher hosted by Professor Enrico Perotti, from December 1999 to January 2000) and the William Davidson Institute at the University of Michigan Business School (William Davidson Visiting Fellow hosted by Professor Jan Svejnar, from September 2001 to June 2002). Besides the names mentioned above, Tim Ambler, Simon Commander, Cheol Eun, Judith Fry, Kenneth Liberthal, Paul Geroski, David Goldreich, Richard Portes, Andrew Scott and other members of the London Business School also provided their support.
V

GLOSSARY AND ABBREVIATIONS
CF Corporate Finance
COE Collective-Owned Enterprise
CSRC China Securities Regulation Commission
IPO, Initial Public Offering
NSE Non-State Owned Enterprise
PLC Public Usted Company
POE Private-Owned Enterprise
SBC Soft Budget Constraints
SEO Seasoned Equity Offering
SIP Share Issue Privatization
SOE State-Owned Enterptise
SSE Shanghai Stock Exchange
SZSE Shenzhen Stock Exchange
vi

Introduction: Government, Governance, and Finance
The role of the government is usually recognized as a topic of political economy, but
is at the center of the study of corporate finance in some new and emerging markets,
particularly China. Using a newly assembled data set from the firms listed on China's
stock market, this thesis documents the profound impacts of the government on
corporate governance and financial development in China.
In Chapter 1,1 examine the ownership and control of 826 corporations listed
on China's stock market, and find that government shareholding therein is notably
large. Its effect on corporate value is negative, but non-monotonic. Up to a certain
threshold, corporate value decreases as govenunent shareholding stakes increase, but
beyond this threshold, as government shareholding stakes continue to increase,
corporate value also begins to do so. I develop a view of the goverment shareholder
as an entity that can be both detrimental and beneficial to the companies in which it
holds shares.
I examine the governance role of debt under soft budget constraints in Chapter
2. Using a sample of modem firms listed on China's burgeoning stock market, I find
that in contrast to standard finance theories, debt facilitates managerial exploitation of
corporate wealth. An increase in bank loans increases the size of managerial perks by
and free cash flows, or it decreases corporate value. The failure of debt governance is
attributable to the institutional setting of China, where the government owns large
banks and firms.
Documenting an average first-day IPO return of 267% in Chapter 3,1 question
the rationale of such severe underpricing in the primary market. I find that financial
regulations and investment risks bring about severe IPO underpricing. The
government regulator sets a cap on pricing IPO shares and stipulates the IPO quotas to
I

control the supply of IPO shares. Regulatory underpricing is a unique feature of
China's primary market. Furthermore, besides the asymmetric information about the
quality of IPO firms, there are some Chinese-specific investment risks. There is a long
time gap between going public and going for flotation. Lockup risks come with the
illiquidity of IPO subscribers' investment. The investors in China's primary market
further discount the IPO shares with tunneling risks and grabbing risks. These
Chinese financial institutions rationalize the severe Chinese EPO underpricing. In
addition, the length of the listing time lag is endogenizied on insider shareholdings
and underwriting costs, which shows some faint traces of rent-seeking activities in
China's primary market. This chapter suggests that the complex web of the Chinese
government's political and financial interests and private benefits of some social elites
underlies the Chinese financial institutions.
From three different issues on China's emerging stock market, I conclude that
the Chinese government is sophisticated in its widespread business empire, but that
some social elites can exploit the conflict of governmental interests in business and
extract private benefits.
The impacts of the Chinese government on corporate governance and financial
development are specified to several empirical research questions and examined in the
three chapters of this thesis. As each of them discusses a particular topic in corporate
finance, they are self-contained, with an introduction, literature review, hypotheses,
methodology, empirical findings, interpretations and conclusions. To aid the
understanding of my arguments, I present summary charts of the three chapters in the
following pages. '
1 The literature reviews of corporate governance and the institutional description of modem Chinese firms on the stock market, given in my M. Phil. Thesis, are not fully incorporated here due to the space, although it would assist a newcomer to this topic in understanding this thesis. These writings, of more than two hundred pages, are available upon request.
2

Figure I
Illustration of Chapter 1
Pyramids Cross- Reciprocal-
shareholding shareholding
Ultimate Shareholding Structure of China's Stock Market
3 V
0
C) 0
S 3
(1) r
a S
0 S C) 0
0 a, 0
a, C 0
0>
Comparison
mixed enterprises are valued lower than the enterprises without any government shares
Government Shareholder in Control
Key to Understanding\ y China's Modern Firm
& "s Stock M arketý to
firrns under control of the govt shareholder are valued lower than those under control of the a non- govern. shareholder
Grabbing Hand of Govt. Shareholder
I U-shaped relationship
Regression between the size of
___I ____ government shareholding
stakes and corporate value
Helping Hand of Govt. Shareholder
Interpretation the U-shape with Graphs
Statelmsecl C, ), p,,,, t,
Total Effect
Shareholding Structure State Shareholding and Corporate Value Linder Method of La Porta et al 1999
F
27 26 25 24
30% 2.3 2.2 21
2
ý7 7 0 10 20 30 40 50 60 70 80 - . State Shareholding r
(o wx, )
LR, h, 2 W
3

FigUrc 2
Illustration of Chapter 2 Thnore: ical Fraiiiework and Developf-w of Cowradniory, Hypotheses
Threat of Redýc Bank Managenal "ea M. mt. orig Dismissal Ro
I Business of The State
-G7nment
Interlerence
-ve nment Government
of Firms I
Debt-G. ý., rian. Soft Bu at Constramls
Reduce ? Facilitate
Managerial Research Question What is the governance E. Pl. itation role of debi under soft budget constraints?
Entrenchment Eýpi,. -b., Idmg
Institutional Background China's Modern Firms
A-t
Large & publicly-financed companies Modern governance structure
P-1-- oipiai DýW . -11. th, 6p, nim-l Intensive product market competition umoll, 0 bank,
Government shareholder in control Creditors are government-owned banks
Methodology
C), "'Pt've statistics distributions, difference of means and medians, cluster comparison spectrum distributions etc Econometric regressions cross-sectiontil drd panel methodologies, univanate and multivanate analyses, Hadi methods of outliers control etc.
Summary of Enipir, al Fir fi, j,
4W
' 1,21 !,: and y '-, J, [. - ',
Debt is not an effective instrument of corporate governance under soft budget constraints:
The cash-hard-out hypothesis is supportedý Budget constraints needs to be hardened to reduce managerial exploitation and avoid a financial crisis,
The source of soft budget constraints is the business role of the government,
Privatization reduces the problem of soft budget constraints and competition helps to reinstate the governance role of
debt
4

Figure 3
Illustration of Chapter 3
Anýflytical Framework
P Auluig. Up. - ........ ........................... ....... ..... ------ ....
Offering S Investor Subscription ! 1ýý T
(Q
Exlenwx) Govemmem-A Imarests
and Private Berets
Imider Shares Lobbytng Cost Issuers' )( Ownership
Authoritarian Urderpricing-An Intelligent CkNenmwn:.
Fiolation Tims Gamo-SophisticAtod Rent Seekers-
T, " Gap be%ý hcq Offenng nrd
Marclato(y Ceiling
Rotation of Offertng Mul: jpliers (Listing Quota
61
Excesswe Underpricipq
PoliticAl --I-
Financial
_Hypolhesl., --, Hypothesis Hypo s --
>
5
Chapter 1:
Government Shareholding and the Value of China's Modern Firms

i. Introduction
A new corporate China is emerging. Different from the well-known Chinese state-
owned enterprises (SOEs), China's modem firms have modem corporate governance
structures and strong cash flows. Some of them are publicly listed on stock exchanges
and China's stock market has become second to Japan in Asia. Since China is coming
to be among the most influential players on the world economic stage, it is essential to
understand China's modem firms. In this chapter, I document the features of these
Chinese public listed companies (PLCs) and show the profound impact of government
shareholding on corporate performance.
Using the method of La Porta, Lopez-de-Silanes and Shleifer (LLS, 1999) and
Franks and Mayer (2001), 1 reveal the ultimate shareholding structures of firms listed
on the Chinese stock market. The separation of cash flow rights and voting rights
through pyramids and cross-shareholdings is found to be marginal, but the control is
highly concentrated. The government is the majority shareholder of 31.4% of Chinese
PLCs. It holds stakes greater than 10% in 41.2% of PLCs. Government shareholding
on China's stock market is significantly higher than in developed economies and other
emerging markets, documented by Claessens et al. (2000), and Faccio and Lang
(2002). For example, there are only 5% of French PLCs having a large government
shareholder with over 10% shareholding stakes, although France is known for its
large state-owned sector. I argue that the key to understanding the new corporate
China is the role of the government shareholder.
Mainstream economists generally view the government as a detrimental
7

determinant of corporate performance. 2 Shleifer and Vishny (1998) suggest that
private ownership should be preferred to public ownership, because the government
has a "grabbing hand" that extorts firms for the benefit of politicians and bureaucrats
at the expense of corporate wealth. Examining this hypothesis within the context of
China's modem firms, I demonstrate the profound impact of government
shareholding on corporate value. The overall impact of state shareholding on the
corporate value of China's PLCs is negative: mixed enterprises 3 are valued lower than
enterprises without any government shareholding, and enterprises under the control of
a -government shareholder are valued lower than enterprises under the control of a
non-government shareholder. However, this relation between corporate value and the
size of government shareholding stakes is not monotonic. As shown when graphed
corporate value on government shareholding, it is a U-shaped curve, rising higher on
the left than on the right. 4 When the government is a relatively small shareholder-up
to a certain threshold between 30% and 40%, corporate values decrease as
government shareholding stakes increase. This finding supports the hypothesis that
the Chinese government shareholder has a grabbing hand. However, as government
shareholding stakes increase beyond this threshold and become relatively large,
corporate value begins to increase. This finding suggests that the government
shareholder has another hand that helps the firms under its control.
'For example, analyzing enterprises fully-owncd by the state (SOEs) and surnmarizing the theoretical literature, Vickers and Yarrow (1988) argue that state ownership is inefficient. Megginson and Netter (2001) conclude that "[the weight of empirical research] is now decisively in favor of the proposition that private owned firms are more efficient and more profitable than otherwise comparable state-owned firms. 99
3 Mixed enterprises are firms whose ownerships consist of a mix of both government and private owners. For example, the PLCs in my sample are partially owned by the government. Firms with no overnment shareholding may be loosely termed as private enterprises. This chapter follows the research approach of Morck, Shleifer and Vishny (1988) and McConnell and
Servaes (1990). Morck et al. (1988) document the non-monotonic relation between management ownership and market value of the firm; McConnell and Servaes (1990) document the concave relation between insider ownership and Tobin's Q. These studies take the ownership variables as being cross- sectionally continuous and find the relation between corporate value and the size of the shareholding stakes of a certain type of owners in a large sample of firms.
8

That the government's relation with the companies in which it holds shares
can be both detrimental and beneficial is due to the fact that the government acts with
a combination of political and financial interests. Based on government shareholding
stakes, political interference in corporate operation has a negative impact on firms, but,
as I argue in this chapter, there is a limit to the extent to which a government can take
advantage of a company and its corporate wealth. Damaging actions are balanced by
the benefits that the government can provide. To maximize its financial gains based
on corporate cash flows, the government shareholder provides a company in which it
holds high stakes with preferential treatments-for example, a tax rebate or a
favorable ordering contract.
Concentrating on the study of the impact of government shareholding on
corporate value, I make the following contributions: First, by describing the
shareholding structure of Chinese firms, this chapter enriches the map of ownership
structures around the world (LLS 1999, Claessens et al. 2000, and Faccio and Lang
2000). Second, by focusing the study on a particular shareholder-the government-
this chapter contributes to the knowledge of the impact of shareholding structures on
corporate value (Shleifer and Vishny 1997). It is the first work to develop a view of a
two-handed government. Third, with evidence from China of the overall detrimental
effect of government ownership, this chapter complements the mixed-enterprise
literature (e. g., Boardman and Vining 1989) and privatization literature (e. g.,
Megginson et al. 1994). Fourth, by examining the effects of government shareholding
and statistically documenting other corporate finance factors, this chapter contributes
towards a better understanding of the firms emerging on the Chinese stock market
today. However, the data availability refrains me from extending the discussion to
social welfares.
This chapter proceeds as follows: Section 2 describes institutional settings of
9

China's public listed companies. Section 3 documents the shareholding structures. I
present the research hypothesis, proxies and regression models in Section 4. Section 5
finds that the overall impact of government shareholding on corporate value is
negative. Section 6, however, shows that there are also some incremental positive
impacts when the government is a large shareholder. The conclusion is given in
Section 7.
2. Modern Firms in China and the Emerging Stock
Market
China has undertaken a grand reform to restructure its corporate sector and modernize
corporate governance structures. The features of modem firms are presented here.
Some of the best modem firms are listed on China's stock market. I also introduce the
emerging stock market in this section.
2.1 Enterprise Reform
Under the Communist Party and the austere repression it engineered through
the Cultural Revolution, very few private enterprises existed. Most large-sized
enterprises were either fully owned by the state (SOEs) or collectively owned by a
community (COEs). In 1978, SOEs provided 77.6% and COEs 22.4% of the industrial
GDP. Property rights of firms are ambiguous. SOEs were usually controlled by a
multitude of bureaucrats both in central and local government, and thus depended
heavily on the Communist Party for corporate governance. Every community had a
controlling center that was normally a branch of the Communist Party. COEs are also
controlled by the communist government. Enterprises in China before the advent of
10

reform were virtually sub-units of society rather than commercial entities in their own
right. For example, all financing was paid out of the state budget, the prices of
production factors and products were fixed, and the government set production targets.
Furthermore, enterprises were required to provide their employees with housing,
schooling, and even a funeral service when they died. Under the egalitarian policies of
the government, managerial pay was not much higher than the wages given to
workers. The core problem of firms was lack of incentives.
The economic enviromnent began to change when enterprises in China began
to be restructured through the clarification of property rights, changes in corporate
governance, and the use of commercial modes of operation.
The owner of an SOE is specified as either the central government or local
governments. Specifically, the ministers or the local governors control these SOEs, on
behalf of the prime minister. The clarification of property rights often involves
5 recapitalization and partial privatization. Some SOEs and most COEs have been
restructured to joint stock companies that have more than one owner to contribute the
equity capital. One-share-one-vote is law in these joint stock companies. Clarifying
property rights and pairing control rights with residual returns would provide an
incentive to maximize the value of these enterprises (Li, 1997). According to figures
produced by the National Bureau of Statistics in China in 1999, joint stock companies
made up 3.3% of the total number of firms in China, but provided 7.3% of the total
industrial GDP and 14.6% of total profits. Although the number of joint stock
companies grew 28% per year between 1994 and 1998, their contribution to the GDP
grew 36% per year over the same period.
Political control of firms has been significantly reduced. In the past, managers
5 As a matter of fact, the Chinese govermnent does not recognize the term "privatization", because the diversification of ownership and the dilution of the control rights do not directly sell out the state assets.
11

were monitored through employee associations and the enterprise branches of the
Communist Party, but since 1993 the law has explicitly forbidden the secretaries of
the various branches of the Communist Party to interfere with corporate management.
According to the 1988 Enterprise Law, the secretaries shall "guarantee and supervise
the implementation of the guiding principles and policies of the Party and the State in
the enterprises". Although the Communist Party nevertheless continues to be
ideologically influential 6 it deprives the Communist Party of decision-making rights
in the firms. The managerial responsibility system was introduced under which power
was fully delegated to the managers. However, managerial exploitation of corporate
wealth became a core problem. In 1994, a set of modem governance structures was
introduced by the Company Law. 7 It regulates China's modem firms and includes
some good practices of western firms.
The firms have to be commercially operated under the rule of market
competition, since China has evolved from a "command" economy to a market-
oriented economy, after two decades of reform. The more competitive conditions of
supply and demand decide the levels of prices. Finances are now raised through banks
and other creditors. Firms now have to pay out dividends to their shareholders, pay
back interest and principal to their creditors, and pay tax to the government. They
have become true commercial entities, although China's new economy is still
characterized by, widespread government ownership coupled with weak legal
enforcement of the new legislation that governs the economy.
6 The ideological influence in question mainly influences personnel matters rather than daily corporate operation. According to the results of questionnaires, a paper under the review of the Journal of Financial Quantitative Analysis finds that the Communist party is still influential, but that the magnitude of the influence does not depend on whether it is a firm with or without government ownership, nor on the size of government shareholding. This finding implies that the Communist party is rather a macro factor of corporate performance in this country under a communist government. My chapter on the micro factors of corporate performance therefore reasonably leaves aside the direct influence of the Communist party. 7 The Company Law was revised in 1999, but follows the same spirit of the 1994 Company Law.
12

2.2 Corporate Governance
Together with depriving the Communist Party secretaries of their role in
corporate governance, the 1994 Company Law stipulates that the board of directors
monitors the managers. Under the one-share-one-vote system, directors are elected at
a general meeting of shareholders. The board of directors is usually composed of the
delegates of the large shareholders. The large shareholders may nominate managers to
be members of the board. When the government is a large shareholder, the former
party secretary or some retired bureaucrat is assigned as the chairman of the board.
Since March 1999, regulatory authorities have been able to promote external directors
to the board.
Once elected, the duties of directors include approving annual reports and
corporate strategy, appointing a general manager, and monitoring corporate
management. The directors have the power to intervene in corporate management
when necessary. There is also a so-called supervisory board whose members are
mainly employees of the firm. Supervisory boards have inherited the employee
associations from the former planned economy and play an advisory role. In essence,
the governance structure of China's modem firms is the one-tier board system. This
model of Chinese corporate governance is fundamentally different from the German-
Japanese bank-based model and the East-Asian family-based model.
Monitored by the board of directors, the general manager is in charge of the
daily operation of the enterprise. Both his and the other managers' bonuses are tied to
corporate performance. The top management team can be shareholders of the
company, but these shares cannot be transferred during their tenure and securities
laws require that managerial shareholdings be disclosed to the public. My data set
shows that managers hold, on average, only 0.005% of the total shares in public listed
13

companies. The trivial extent of their shareholding stakes partly comes from the fact
that the incentive scheme of stock options is seldom used in China. However,
managers can benefit from a number of perquisites such as corporate cars, housing
benefits, and entertainment bills.
2.3 Financial Features ofPublic Listed Companies
The typical balance sheet of Chinese PLCs is significantly different from
SOEs, but similar to the firms in developed countries.
Table I in the following page reports that the ratio of total liability to total
assets is 49% and the ratio of debt to total assets is 21%. Since there is no corporate
bond market in China, debt finance in PLCs is mainly in the form of bank loans.
Overall, China's PLCs are not heavily in debt. The average current ratio of quoted
companies is 2.0 and the quick ratio is 1.5, indicating that their liquidity is generally
adequate. These modem firms are different from the financial situation of highly
leveraged SOEs.
The average total assets of China's PLCs come to US$180 million. Of total
assets, 53% are current assets and 36% fixed assets. In 1998, the average net asset per
share was US$ 0.31 and the average earning per share was US$ 0.025. The largest
industrial quoted company, Shanghai Petrochemical Company Limited, has total
assets of US$2.7 billion, fixed assets of US$1.4 billion and an income of US$1.26
billion. The total assets of the smallest Chinese PLC Xiamen Xfongzhen are only
US$14.3 million, with an income of US$4.4 million. Chinese PLCs have an average
age of 14 years and a median age of seven years. Most of these PLCs are either newly
formed or were older companies that were restructured during the period of reform in
China. SOEs differ from most PLCs because they were founded under the former
central planning system.
14

C-0)
C:
V
Cq 4)
u CN 0
C/)
.0 (U
c, oý -ci CU
. ID 0
-C Gn
0 144 0
4. = 0
-i tu
.0
03
0
c m LO C: ) CO (» N Lin le LO N C) -e ci A
00 Co C%i U') ý- le C) LD lKt ý
cý (» ei (6 6 CD P.: cc; c; cý Ir- LD
r- c» Co u-) cý iý- ri Co le: -, i cs (D PZ cý
(0
cr) 0 00
6 rý 4 (Z ý Co C . LO Ce ý- ý- e nt
Ln em ce cý (0 e (0 (»
LO Mý C)
cý Lti ai IJ6 C, cd Cö CD C: ) ei le LO c14 e--
>, z3
CM 0
-2 0:: , UL 0 u) -oi u--)
2.4 The Emerging Stock Market
The Chinese stock market comprises the Shanghai Securities Exchange (SSE)
and the Shenzhen Stock Exchange (SZSE), which began to operate in December 1990
and July 1991, respectively. There is no fundamental difference between the two
stock exchanges in terms of legislation and regulations. The purpose of separating the
stock market into two stock exchanges is to encourage competition between them.
The Chinese regulatory authority is the China Securities Regulation Commission
(CSRC), founded in October 1992. The CSRC stipulates disclosure rules and
governance regulations.
The Chinese stock market has grown rapidly. Table 2 shows that between
1992 and 1998, market capitalization increased at an average rate of 84.7% per year.
At the end of 1998, total market capitalization was about a quarter of China's GDP.
The number of listed companies grew by 62% annually, from 53 PLCs in 1992 to 851
PLCs in 1998.
However, this market is still in its early stages of development, as reflected by
its high volatility, unfair trading, and the frequency with which policy talks take place.
By the end of 1998, the turnover rate of share transactions was as high as 291% and
price/earnings ratios were as high as 33.4. Second, as an emerging market with the
features of a transitional economy, the legal enforcement of the necessary legislation
in China is relatively weak and illegal activities such as insider trading and market
manipulation are widespread. Third, to control the risks of the stock market and
establish a mature market, the government frequently holds policy talks. For example,
16

eq
ca I-
CIS
"; W S., -
o 44. 0W
0
U cd
w as 0
C-qs
Cd
.00
u
C's 4
00 )-4
0
'o v
Cd
0 010 iý
cd Irl - ca
,,, -0 ml
J9
0 Cd
im, Cd V
.. . 1.1 p- Iýp
. "s 0 00 to
0 cd 4)
CN
ti 0 . El r,
*;; 0 0
> .0 1ý
oa. u 93 4ý 1: 3 000
*, Ell c" $ý -= cqs En 0 cts 4;
>
.00 cl P.
0
cqs P0 w 08) 65
-2 0 0
-10 0
C4
Co oý)
00
P- 0) 0')
C»
C)
0)
CY)
Co le (D C, j ý Co m rl_
ý Lo «) ý (3) r- (0 ce) N OD 00 Mt
CM (» OD r-: cli LD OD CC) C, 4
ýN CO ý Lin (0 1 M (0 nt 0
r- OD Lti
r- C: ) tn ýt 3N 2 Lt) (» le 00 m - 3 CO CC) d
LO
CC) C, 4 CD CO LO ri (» p2 (Z ýt ý (0
C) cc; C: ) C: )
3ý Liý (0 ý CO M r- (» r, - - Igt 0 LD CI) - (6 cli 9
Am- CO xt te le m P') CO
C%j
Tt cf) U) Lf) Cr) 04 ý Ct) qtt C, j Cj ý It 00 (D .4 ll-ý -: ol or) C14 rl_ ce) CY) 0") co CD
CV) r, -
r- CD cl r- 0 CY) Lr) (D t) C) m ?Z cý N LO (N ci C'4 r1-
0) Co LO C%i
C» Irt r4 v) 00 u-) (n r) m Lxi Cý in ri Co m ui vi (iý
T- Mý r- LO -r- CO
: 0) co co ý- -0 (3) co qt c) ()) I- C'4 r.: 6 Cý T- C-4 T- ý It It I-
CO ý C)
04 co 0 Cl) co r- co CVI) 0)
(=; r, ý C. -) co Cý r-- cli C6 -: CV) CY) OD N
0) 04 0) m a) Itt 't N C'i Cý C') U. ) C'4 C'4 C; 1: clq
00 It co r- C%j
0
ce) C14
Co
Tý
CV) CD
r- (Y) It CV) 0) 00 4 Cý C14 C14 CV) CY)
(D (. 0 (3) 04 04 co (3i V-: "gr ce) Itt
C%4 CV) It (3) C>
1: ui LO C) ce) 0
(Do r- LO 0) CC)
I- N U) cf) 00 r- vi C; I, - IRT C, 4 V-
V- c1r) U') r- 't ý Cl) N Cý c"i 14,1**
IIII
0- cn U) . 9? 0- . c: 2- 0m
(n CL Co
0 l', E c: rz E C a) Xm0 -im cu 00m0 M- u) ým > CM N C» >, c3) 0cccbc: r-
CL E (L) (2. cu m (D (U (D
,0 '5 E Co Co : tt Co Co >2ý Co U) 0 (0 (0 ý000 CIL r_ oý
ý -Fo .-0 c: u Q-Et. - (0 > a) (2 00 L- :3- Z h- ci 1- k- En
a:
N

a policy commentary talk on the high P/E ratios of the stock market at the end of 1996
brought down the stock index by 10%. The policy talks may disturb the natural
evolution of the stock market. Fourth, the market is segmented: about 60.8% of shares
are restricted in tenns of their tradability; only 4.9% of shares are allowed to be
invested in a foreign currency, yet the Chinese currency is not freely exchangeable.
Foreign investors are not allowed to invest in tradable A shares, but only in the thin
B-share market.
Ultimate Shareholding Structure and the
Government Shareholder
With the data sample from the Chinese stock market, I document the shareholding
structures of the PLCs and discuss some of their other characteristics. I find that the
main characteristic of Chinese PLCs is the presence of a government shareholder in
control.
3.1 Data Sample
My data is based on audited annual reports from the PLCs and share price data
from the stock exchanges. Taiwan Economic Journal (TEJ) is a leading data vendor
on Chinese PLCs, but the TO database has a large number of missing values.
Domestic investment bankers and security analysts tend to use the Genius database.
Therefore, I have constructed a new data set based on both these databases and
several other complementary sources (see Appendix 1). This newly assembled data
set covers accounting information, the holding stakes of large shareholders, and daily
share prices from 1994 to 1998. During this period the regulatory framework was
18

relatively consistent8 . The description of corporate features and mapping of ownership
structures are based on 1988 data, which is the most recent data available.
My data sample excludes fund management companies, since their operations
are distinctly different from those of industrial firms, 9 and also firms that do not issue
shares to domestic investors. 10 The sample I use to examine the relation between state
shareholding and corporate value includes 287 companies in 1994,311 in 1995,517
in 1996,719 in 1997, and 826 in 1998. Altogether, my main data set has 2660 firm-
year observations.
3.2 Shareholding Structures of Chinese Quoted Firms
Chinese PLCs are generally organized and operated along the same lines as
successful western firms. However, the shareholding structures of Chinese PLCs are
unique.
In the Chinese stock market, share ownership is officially classified into state,
legal-person, employee, tradable-A shares, and shares denominated in a foreign
currency. Although these various classifications of stock exist, all Chinese PLCs
follow the one-share-one-vote rule with all shares. However, the classification system
cited above was originally designed to facilitate the regulation of trading activities,
8 The 1994 Company Law formally legislates and governs joint-stock companies. In the same year, the China Securities Regulatory Commission introduced a series of six rules called Contents and Form of The Information Release by PLCs, which formatted the annual reports. In 1999, a new version of the Company Law based on the 1993 Company Law was introduced. 9 Furthermore, due to regulations, the government is not allowed to own fund management companies. '0 Otherwise, I would have had to use the share prices from the foreign investors' market. However, the market values may not be comparable, for example, as a result of the home bias problem (Cooper and Kaplanis, 1994).
19

(L) 0
0 . CD
0
0
CU -m g
.9u e
U
,02
2Ub. -Z 0
J3
e .0
ci 94. 4ý 0 00
.i -c .
e "; ý Ici
jm KZ 4) 4. ) ci
'0
rn ä tz -0 0ý
.2 cm 0. -0
Cli 92
91 to
CC> (7) LO E'3' cz Co r_ Co (D OD c-) r-- cn e3, c> c) m to C: ) cn - C, 3 C: ) C: ) CD u-)
C, 1) CO CD 00 C> C> ýzr c1111 CD
0') C%i cli CD Co
c; ! ýý c; cz; m cli r--) C» p3 C> C: )
cz; ( ý cý c; c; c5 -Z CD cz CD le
cz; cý cs CD c: Co
s ; ý , . ýý c c: z c
r- ,» Co 4(ýý c:: Co (D Co ý7; Co i7ý, CD ei -e Qý, u-) CD C> CO CD - C: ) CI) - C) - 5ý, c> Lo M (0 CD 00 C» Gý, CD cli
r2 c20 C> 00 C> cm (Z) 00 m (D (» cýI, C> (D C> c20 (D -e C: ) x- ýt
23 ý2ý c=; c; c; c; c; c; cý -: CD ! ýý cý cý c; ci cý
g Co U') C> Co -e g rg c> ; -, g c: D r. - LO (Z) Co ; <Z (Z) CD jr 4 c> g C, 4 (D Co r-- z; ý, ý C: ) r- 0-i Ci cýA ce Co
Z ; rli C%4 CD 00 C, 4 (D CD (D CD ýt a
le- (Z: ) -e C> Cý. c> cý cý ! ýý cý cý ci ýý cý -: cý ýý c; c: i czi c; ci ci
,0 - ;; ý: ' CZ) Co (2) sý CD 00 r-- CD c> C: ) ý, (D le r- s' CZ) r. - 0') (»
00 *e CD OD «) C'4 CD CO
ý* 1-e C> cli r, 4 rý (2 C: ) C, 4 C, 4 CD 0) m x- C) CD
G c% (Z) C, 2 CD CI)
W) C, 4 C) t- c:: ) ý (D ýzr
- cý c, > c:; c:; c:; ýý c:; c; ci ý: s c:; -Z c; ! ýý ci c; c> cýs CD, C>
ýt c7) ýt ;: -� CD Co c, ) rý C> Co Co -, c2, cn c-) ; Z, c) CD CO l'n CD 00 C) r*I CD C) e sý CD r-- - Cl> CD (Z) C-4 isý CD r. - (D Cl> (Z) - gý CI) C, 4 CD Co
c; c:; cz; C, 4 C, 4 CD Co m x- C) C)
cý ýý c; cý cý ! ýý cý - CD cz, CD cli
cý ýý c; cý C) N- C> CD
cý (cýS cý czi
�er -Am 10 ce 0 c,
9) ö» U- A -: 0 0
ce -, 0 u f) 0 2. 0 to rA 0 cu 2i m mm In !J -u 1.4 cud
u 0
CZ *5= u-
> ýr to 5 IU U= W k. u2
"0 , . - m
IV CM cu bU t. rn -U "CJ Q) ý pý gý Z$ !2
u W ýg .2e . 4.1 L--
r .: 3 . j ;. CIJ A 0
ý4 9) geu 0 t2 000 2
(L) (D vi >,
-0 ý- - ý; - -a 20 0 gl UU N4 Lln
0 k. C4Z4 020t
4ý V. U 0 4. ) - , .. 5 . -2 r, ce 0 43
. ý2 U) >, 0 Z0 U) ý1
vi 2 0 bo
ce
r3 0 Ln
"e 1. - 0
cu A* u2 < <
ý 0 Ei - -> Ei uM b- '
, ýI Ur-
0 C>" =009: 4
cj 93 Ln . Ee 2. -V 0-5=
9 .0 0 ul>
rn 00 10 ý- 0 -3 o ýc :ßu; :ib. CJ 0
0X0 * rn N. 0
ce ;. - P. ýc ýi f. 0 cu ce , , ýg ,j k. 'ZJ
-ci !2G u- 10
tko cý 0ý ce 0 ko 121
ý: 1. -1 CU . . - >, 0 cj
rA ýQ -0 tu 1
k4 n
0 "0 u >, r. F. '
r, ) -S ce Mu > p. =0 cu 0 >U
0 . -
c> mg 92
5 0 4) 0 00 ce t31 U2
00 Z
-5 2- , 2*
< ce M-Z, k.
.4S ri W92? le u 4 "- 9 uuý0
9= r- ; - L 4ý ü g ý, 0 .g
2 öz ýa -5*:: >ý A cu «, cl 2 -- -9Q .1 01 ýý; ýI, m"oe ä2 ä. t)
9 5e ,4 . a) 2 ý 5 . .
4- _>, n -Vp. 9 E! -ti E .-05W
C, 3 är§ 0 t- o= - . 0 1.. 4) ;j
(A
Mg J 0e0 -4 M cu *= M (. ) U
zi 9 )
, 'ä
A 0 C) g2. U 4. > m ba
ý. tu ý. 0 gn 4. ) cl cl tio (n 42 cor t. ) 0
. tu 0
- to 10 - ce cz rA to Im
rA 0 &)
.I c) gl S ý3 e
=, N. -0 wU00 10 0 1: 3 , e: rý 2 >,. O M e cl - 0 -v 9a 2xg cn
0 0 0 u 0 M
,1 0 ci - , --. 5 -4 - cn ' lu >, u0 , 0
to -ci
ci 0mu>, m (U , . to 93 t3 0
e (5 "0 lu u >% -A-W iz u04w zi m (L) (A ýf Mw CA W Q)
0* 9) AAm 10 ýW 4. =e 0
. le 4) -cj --
ý ul 00 -0 g r. "2 0 0 ý, '. ' ý. ' z3 . 41
0 ;31: 1 . =0
0 ji 0 ce ci 23 öß ju we gl .2 Ei g 1
= .!:,
rn rn
0 =Z u0 U 4) Ln n
�, Z (4 tu . 0 0 m u2 2 >
00 00
5e 4) 2 je 0- *->, b. A
0 Q 93 Ei >, 5 93 ce
@ - 9. ) 0 cu u2 .2 4ý 93 00 -8 2-0 U 0 2 0 CM zi
2 cn 0. )
pý 0
,8 tn >, m tu 93 2 A) 2 -ci
u ii A 2 e? ý - t) u
2 "0 0 1) 12 4) A0
u0 le Z
ý: ,0 ci U
2?
0 - -, 1 l'U rq A
ce Z) 50ob 2.
cn G
m 0
5 X 0 Gn =
.2 . 2ýý tD»
0 ý e 0 -0 -e .m i C, 3 0 4.4 1 0 < cli 9 E V
0, ce k.
4)
.0 12. Ici 0 z3
ID
C., 0 gý m-U >
0 - z3 ta e
W ýg e>0 c ýM ým e> rj Me 0' .0 rA 0 to 9) -0
:m ýg r. fg 0
41 . ýh
m tu
u-ww , i, g0
u öo 0 -p 0 40. -0
U2 9 X j5 Ln 9) En
0
U) E
m CF) (0 i2 m CL ý
E 2? 0 4-- g cu cM - CO m U) Lu
M
(n C- 0=P, CO «a .-
C> C14

rather than to actually classify different ownership types, and the boundaries between
the various categories are not clear cut. For instance, institutional shareholders do not
necessarily own only legal-person shares, and foreign shareholders can own shares
other than those denominated in foreign currency. However, most of the cuffent
research about the impact of shareholding structures on corporate value in China's
quoted companies (for example, Xu and Wang 1999, Qi et al. 2000) uses this
classification system.
In this chapter, I use the cut-off method of LLS (1999) and Franks and Mayer
(2001) to document the ultimate shareholding structures of these Chinese firms, which
is a method that detennines the ultimate shareholder whose holding is larger than a
certain threshold. " It does so by examining pyramids, cross-shareholdings, and
reciprocal shareholdings. For example, a 10% threshold traces only the ultimate
shareholders who hold more than 10% of a company. 12
The method defines a pyramid as an entity that has a shareholding in one
public listed company, which in turn owns another corporation, and so on. That is, if
A holds a substantial part of B and B holds a substantial part of C, the relation
between A and C is a pyramid. Cross-shareholding is defined as a condition that
exists when a company has a controlling shareholder and owns shares in a firm that
belongs to its chain of control. That is, if A holds part of B, and B holds part of A, the
relation is a cross-shareholding. Reciprocal shareholding occurs when a company
owns part of itself. The calculations of ultimate shareholding rights are based on the
lowest holding rights in the chain tracing back to the ultimate shareholders.
In China, the law requires that the size of the shareholding stakes of the largest
ten shareholders be released to the public. Among 846 PLCs, 167 companies reported
11 Aggregating the shares of these individual shareholders is not very meaningful because they usually do not exert their voting powers collaboratively. 12 Ile weakest-link concept (LLS 1999) is adopted here. If company A holds x% of company B, and company B holds yO/o of company C, it follows that company A holds min(x%, yo/o) of company C.
21

another PLC among the ten largest shareholders in 1998. These shareholders had an
average holding size of 1.5%. However, even using the minimal threshold of 10%,
only 19 firms involve pyramids or cross-shareholdings. That is, there are 19 cases in
which an ultimate shareholder holds more than 10% of a company through another
quoted company. In a sense, this finding reflects the youth of the Chinese stock
market. I also find, according to the 10% cut-off level, the ratio of cash flow rights to
voting rights is 99%. Thus, the separation of ownership and control is marginal 13 .
Panel A in table 4 summarizes the shareholding fractions of the largest
shareholders (and therefore ultimate owners) of the 846 quoted companies in my
sample who own more than 50%, 30%, or 10% of the voting equity. The government
shareholdei is the largest shareholder of 44%, and the majority shareholder of 31%, of
these sampled PLCs.
The reasoning behind the choice of these three thresholds is as follows:
holding more than 50%, the majority shareholder has absolute control; the CSRC
takes 30% as the relative control threshold; and Claessens et aL (2000) and Faccio
and Lang (2002) take 10% as a controlling threshold.
If I take 30% of voting shares as the threshold for control, I find that the
government controls 38% of the sampled PLCs. If I use 10% of voting shares as the
threshold for control, then the government controls 44% of the sampled PLCs.
Compared with findings in developed economies and emerging market, 14 a
government shareholder in control is at least quantitatively a salient feature of public
13 Tlds fact reduces the difficulty of examining the impact of the government shareholder in the following sections. 14 It contrasts distinctly with other countries (Claessens el aL 2000, and Faccio and Lang 2000). LLS (1999) admit that the high government shareholding in their report is due to a bias in the sample selection towards very large firms.
22

. JD
F2
44 g3 0--
CD
M cu
U. ý
0
-o-M
w
0 Ei c> u >
le j
0 Zi
CD g. eý
4 ci -0 >. Z. =b CU
k! 00 *ä
22 CL) tu 9
0
4) 0 (D
m0 Z. S 0. .C2 00
10 -3 0 u)
cu 0
iu, ri
C: M CL cu
ca E (D u=
-0
0
0c Z: ýe
-0 .I C: ) CY)
-0
'0 Z
cu
(1) (D 0) L- ca
-i
eý ' 12 ) Co r2 U ce) T- (0
rn gý
r4 lq: , cc! (4 0 LO
clq CD r 'l:
N :
r. 0 Lz,
ý " , q r- lzt
(P ,9 r4 Ci Cli 0 C, 4 ci 0 (0 (0 Co
ci p2 N 00
Cý r, -: f*-: CD (0 't ci cý cö
N (0 Co :2 ýc3 CO
C: ) CO ýe (0 ei cq cý ýg V CF) - 'n m 6- (0
C) Co 00 le Co; . Gn
(1) - x:
ei c*IJ
0 All
uý cý 00 -4 0N 00 ci c; 4 r-: 5 Ln LO . IL)
e 0 C
Cj 0ý T7 cý Cý cq m0 Lo (D ci C> u Co
ce CL E C» 0 cli L
N. 'CJ u
AU M
.qN.
A 0 E =- LL m , to
0 1 c3 01 -= > 0 90 m, 2 fi
or . :30 ý> et IL) W
ße- 06 0 (U 0 0 a
LL r: . - E Z: G c .2 - 0
1
CO cm CD - 12 0 In = m ýr . (D
0E- ' c2. %
0) E c: 0 = .. %0
rq 2 -m 2 om m
00 LL « F- LL U) u -
z3 > cl 0
IT It 4t Nil Rt C5 C; C; C; C;
114: V: llý llý 't C) 00a0
Uý 4i Uý Uý Uý C) (D 00 (D
Co rl_ Co r- (0 c5 öäö c5
OD (» Co C) C)
c: i d6 cý ö
Q (D (D 1, - 04
Cý Cý 1: Cý Cý
cq cq q9" ce) IRT CY) Lc) nt
V- r- T. - CO r-
cc; Cý C;
Lo Lo T- ý
cNi 1: 6 cNi It Nzr It It
0 7ö £: j-
(0 Co
(D
E c:
c (D 0> E0 EA
0 (n 0 r_ 00 cm m
CL CL L- g) - U) 0 r- w An in-
w m Eý CEL 0) m (1) (D x
C-L LU W
rn rq

listed Chinese companies. 15 Therefore, to understand modem firms in China today, it
is necessary to understand the impact of government shareholding.
There is no individual or family in China owning more than 10% of the shares
in a PLC, because it is actually stipulated by the government that no single individual
investment account is allowed to hold more than 0.5% of one PLC. Thus, a rich
Chinese family must present itself as a private joint-stock company. Only in this guise
will the family be able to hold a large block of shares in a PLC.
For example, the largest shareholder of Orient PLC is the Orient Group,
which, although actually an entrepreneur-owned finn, is registered as a joint-stock
company. 16 The entrepreneur, Zhang Hongwei, holds directly only 4.85% of this PLC
and sits as the president of Orient PLC, yet there is no question that Mr. Zhang is the
largest shareholder of the Orient Group. However, the ownership structure of an
unlisted joint stock company is not released to the public. In this way, presenting
themselves as an unlisted firm, rich families can circumvent the 5% limitation.
However, before 1998, known cases of these "disguised" large family-shareholders
were very few.
Panel B in table 4 shows a highly concentrated ownership structure. On
average, the five largest shareholders account for 60.6% of the total outstanding
shares, compared with 25.4% in the United States and 33.1% in Japan (Prowse 1998).
More strikingly, the largest shareholder holds more than 40% of the equity in these
Chinese PLCs.
15 A significant proportion of PLCs are under the control of another domestic company. Having encountered the same problem as other researchers, I could not trace the ultimate shareholder of a company not listed on the stock market. Thus, there is, admittedly, a bias towards revealing the ultimate shareholding structures under the methodology of LLS (1999). However, this bias only strengthens my argument in this chapter, that the government shareholder in the China's PLCs is highly influential. 16 The LLS method cannot trace the owners of unlisted firms. My data set does not allow me to improve the LLS method. That is, some of the domestic unlisted companies are disguised family owners. Despite this fact, it does not bias my study on the impact of government shareholding on corporate value.
24

3.3 Government Shareholding in Chinese Firms
I calculate government shareholding as the proportion of state-owned shares to
total shares. I define state-owned shares as those shares directly owned by the
government or its economic institutions. The government itself is composed of the
central government and local governments 17 . China is a politically centralized country
and the heads of local communist governments are usually assigned by the central
communist government rather than elected by the local community. Thus the central
government is essentially the owner of any state-owned shares and local governments
execute the order of the central government. For example, Appendix 2 shows the
organizational structure of the regional state-shareholding management system in
Shanghai City in a PLC. The structure shows that the State Council ultimately takes
responsibility for the government shares in PLCs. Although I argue that both the local
government ownership and the central government ownership are government
ownership and they are not different on handling the firms they hold in Chinese
communist system, it would be nicer to empirically present the non-significant
difference between central government ownership and local government ownership.
However, my data set does not allow me to do so.
Given that government shares are managed and controlled by functionaries
working in the government bureaucracy, government shares are, in effect, managed
by bureaucrats. In contrast, indirect government shareholding is not the bureaucracy
shareholding, because the intermediate joint stock company stands in the way of the
influence of government officials, and a joint-stock company is not a government
17 In China, the government ownership of firms is at or above the administration level of county or city. The collective ownership of small towns or villages is taken as collective ownership of the community. A local Chinese government may govern a population as large as a small country.
25

agent but acts in its own corporate interests. 's
Government functionaries treat the government shareholder differently from
other shareholders, and serve governmental interests by collecting the revenues of
corporate operations and reallocating resources for political purposes. For example,
the government holds 88.6% of shares in the firm Qinggong Machinery. This holding
is the largest share stake of the government in any PLC. The other shareholders in
Qinggong Machinery are family investors and some township-village enterprises. The
government agent that controls the government's shareholding is the Shanghai
Electronics Group (an SOE), which is fully owned by the state and operated like a
department of the Shanghai Municipal Government. The mayor of the Shanghai
Municipal Government and his management committee, the members of which are
assigned by the central government in Beijing, decide who will be appointed general
manager of the Shanghai Electronics Group and who will be the board members of
the Shanghai Light Industry Machinery Company Limited. There are 15 directors on
the board. 19 Mr. Zhao Dingzhai was assigned by the government shareholder to be
both the President and the General Manager. Communist Party secretaries, one deputy
general manager, the chainnan of the labor union, the chief accountant, and the chief
engineer sit on the board, as do six managers of other SOEs who are the
representatives of the government shareholder. The other directors are the managers
of other joint-stock companies who hold legal-person shares. There were no external
directors or directors from these small family-shareholders on the board.
18 Technically, the traceable pyramids and cross-shareholding of the government shareholder is marginal and a change of around 1% in state shares does not change my empirical results. 19 http: //www. cninfo. corrLcri/finalpage/1988-01-07/148346. htnil
26

3.4 Non-Government Shareholders
All othcr shareholdcrs, that is, thosc not designatcd as govcniment
shareholders, are generally referred to as non-govermnent shareholders. These
shareholders include both institutional and individual shareholders. As described in
Section 3.2, the shareholdings of individual shareholders are dispersed. Institutional
shareholders can be financial companies, foreign companies, collective holding
entities, or other domestic industrial companies.
The category of "other domestic industrial company" includes the group
company that has the PLC as its flagship. These companies include collective
enterprises, township-village enterprises, joint stock companies, companies with
foreign ownership, and entrepreneur-led firms. Since the detailed ownership
structures of these companies are not available to the public, my data sets do not allow
me to give a statistical count of these companies, but a description in the following.
Collective enterprises are owned by a small community, for instance a
residential district of a city. Township-village enterprises are also collective
enterprises, but are located in rural areas. These small local communities require
financial returns on their investments. Different from the government, these owners
are very limited in their ability to provide support to their PLCs, which are large-sized
enterprises that have expanded extensively beyond local communities.
Joint-stock companies and companies with foreign ownership may have
government ownership, but they are not the SOEs and they pursue their own financial
interests. The government may exert pressure on these firms to make them pursue its
political interests, but the extent to which it can do so is quite limited compared with
that of the direct government ownership in some PLCs.
Banks are forbidden to purchase and trade in PLCs, although in the past banks
27

have held some PLC shares. Investment trusts, mutual funds, and securities
companies may have some government ownership, but they are fully commercialized
and pursue profits rather than social welfare.
Thus, in a PLC, there is a marked difference between the nature of the
government shareholder and its activities and that of the non-government shareholders.
This difference is characterized by the government's pursuit of its own political
interests and its capability of helping or harming the firm in the process. In China,
non-government shareholders are obviously greatly affected by the government
shareholder, but there are at least some limits on how far the government may affect
the other shareholders in its efforts to realize its political interests.
4. Government Ownership and Determinants of
Corporate Value
In this section, I briefly review the literature on the detrimental government
shareholder, describe our proxies of corporate performance, and present a multivariate
model specification.
4.1 Hypothesis of the Detrimental Government Owner
The general consensus is that government ownership negatively influences
corporate performance. Among large and publicly financed joint stock companies, the
detrimental role of the partial government ownership is mainly due to the
government's interference in corporate activity in the name of its political interests,
which is based on its voting rights from its shareholdings (Shleifer and Vishny 1994).
Political interference is nonnally at the expense of corporate profitability (Boycko et
28

aL 1996). For example, politicians, through the control rights of state shareholding,
may deliberately transfer resources of firms to their political supporters (Shleifer and
Vishny 1998). Therefore, the government is viewed as a grabbing hand that snatches
at corporate wealth, which is called the detrimental hypothesis in this thesis.
Much of the empirical literature supports this theoretical view that state
ownership is detrimental to corporate value. These studies can be classified as either
dynwnic or static in approach.
Comparing corporate performance before and after privatization, the dynamic
approach finds that reducing or eliminating state ownership improves corporate
performance. Such comparisons indicate that therefore, government ownership is
generally detrimental (e. g., Megginson et al. 1994).
Most studies that have used the static approach to compare fully-state-owned
enterprises, mixed enterprises, and private enterprises find that private enterprises
outperform both mixed enterprises and SOEs (e. g., Boardman and Vining 1989),
although their samples of mixed enterprises are small. Thus, both static and dynamic
researches suggest that government shareholding is detrimental to corporate
profitability. The 1990s wave of privatizations around the world is a reflection of the
consensus of the detrimental government ownership.
However, there have been instances of government actions in corporate
activity that have been beneficial. Blanchard and Shleifer (1998) observe that the
Chinese government provides a helping hand to various types of firms. 20 For example,
the Shenzhen Municipal Government has a special committee to assist associated
PLCs in financial distress. These methods include making it easier for a firm to obtain
bank credit and the promotion of a firm's products. In light of these facts, this chapter
20 Again, the paper under the review of JFQA proposes that the Communist Party in enterprises poses a negative performance, but the authors admit that their study is not closely related to government shareholding.
29

investigates whether or not the detrimental view of government ownership still holds
in China's modem firms.
4.2 Measures of Corporate Value
An effective and efficient way of investigating the role of the govenunent in
modem firms is to examine the impact of government shareholding on corporate
performance and profitability. I use both a market-value measure and an accounting-
value measure to approximate corporate value in the reported tables.
Tobin's Q is an adjusted measure of the market value of the firm. I calculate
the Q as the sum of market value of equity and book value of debt all over book value
of total assets. This simplified Q is a good substitute for the actual Tobin's Q and has
been widely adopted in the recent empirical corporate finance literature. For instance,
Chung and Pruitt's study (1994) shows the explanatory power of simplified Q is at
least 96.6% of Lindenberg and Ross's forraulation of Tobin's Q (1981). More
important, the simplified Q avoids arbitrary assumptions about depreciation and
inflation rates. Some researchers argue that share prices may not reflect the intrinsic
value of the firms in China because it is an emerging market. To be cautious, I use an
accounting measure of corporate performance that complements Q, as the value of a
finn is decided by its profitability. Following the conventions of corporate finance
literature, I use the return on assets (ROA) as my proxy for profitability.
4.3 Spectrum Distribution of Corporate Value
To understand the relation between state shareholding and corporate value,
table 5 presents Q and ROA under the ten percentile distribution of the size of
government shareholding stakes. About one third of companies have no state
shareholding, and their profitability is significantly higher than other companies. Then,
30

as the stake of state shareholding increases, corporate value appears to decrease. This
trend reverses when state shareholding reaches about 40%. Finally, when state
shareholding is in the 80% to 90% range, corporate value again seems to decrease.
However, there are few firms in this range and outliers may have a big influence. This
observed pattern requires examination by rigorous econometric investigations.
4.4 A Regression Model
Any investigation of the relation between two economic variables requires
regression methods. Although univariate regressions are not subject to the multi-
collinearity problem, they suffer from spurious correlations due to missing control
variables. Multivariate regressions are preferred.
31

0 . %n "0
ce
0
.eg0 - 0
u2 d)
O>
A0 t4 .u F-
< X 0
. r, - cu cu te
. -0 02
> 204.,
u0
4. 0
QO -cj IZJ tu CY 0
"0 -14
ce 1 '> m
10 2
00 < c> C)
m c3 - CD m Co - Co 0) In- P) 9 tr) 3 le le LO 7 ti) LO to LO u3 (3 c2) ci CZ) Z (3 (Z c3 c2h (3 cs cs c; cs c; c; cs cs c; to to (0 le 0 cn 00 nt (0
' CY ci (0 CD OD r_ (0 OD CY) 0U ) C) CO (0 ,4 Co CY) le 0 (0 e)
C: ) ( 0 C c
cli cli cli cý vý cý cli cý cý cli 0
C\i
0E CO LI) ........ C: ) (0
0" N C%J CD C-J c> (» r, - cq , (C) Z EL r- v- C, 4 r) cl (1 C 4 cli
, "- Z le C, 4 X-- (3 e CI) ' M V ) cv) P) cm 't le P) le CY) q, c2) CD CD CD CD CD c3 ZZ CD CD cs cs cs cs cs c; cs cs cs cs cs
Co N e2 (7) C, 4 ý» 00 cl ý- LO 0) (0 (7) a t- ýt Co LO ce) C, 4 le Lf) rli 01) (0 c7) cý oý oý ný <rý uý uý Cý cq 9 r1.:
C%i CIY C%4 NN CY N C, 4 C%i c\I N
4- to 0E
m LO CD No ce m 0" Z LL-
't ci m ci N Co r- 00 rl_ LO N
Co
LO X- Co (3 X- Co (2) (n 00 M CO ýo le 11. LO tr) KO le ýo e ýo to
CD CD Ch CD CD C. ) CD (3 c> CD Z d cs cs (Z; cs cs cs cs cs cs cs C) (0 (1 M C) CO CO U') (0 r, -
a (3) (0 (0 el (0 C, 4 C) e ýt (0 C) c4 -: 9 uý cý cxý p,.: oý cý "I: c)ý
m ce N C%i N r4 r4 rli e2 C, 4 N
4- U) C) E '0me Co r- r- Co -e C» 0 Z LL
(0 ce) Nm r- N Co Co -e
IX) ci m (0 m c> c> N CN (0 cn 10 CY) P) 3 to LO (0 V) V) le V)
(3 (3 c3 (2) CD CD Z c3 C: ) Ch
cc cs cs cs cs cs cs cs cs cs cs cs C) ýýN (» (0 p- M C) M
' (0
cy r, - U') CY ýU ) CO le r- CY) le le pl: uý r*-: Ci uý ýzt pl-: (P cq >ý le N rli CM rli N rli rY N r-i r4 rli
4- U)
c) E 22 cy Co cn -t r- r- -e 0 s- 0 C'4 e-- e (0 p- (0 p2
ýý c3 le c%j (n Co Co (3 N LO l
m )2 43 LO X LO ll' ti
' CJ CD CD (Z) Z) Z C: 3 cs cs cs c; cs cs cs cý e c: i cs LO (n e r- (D LE) (0 0 le le CO M C» r- (0 C) Lir) 00 OD C» m le C)
r*I 11 l 113 v r- I < C r" 00
C» I: 4: ý : ý : lý I ! : (R
Cß 0E
0C ti Lo Lo Co r4 Li) 3 Z FL u m (N ci
,e CNI c. OD Nmm2m «) C t L NL CN 9
O o o Oem LO (3 ci Q C) CD ci CD c3 ci (Z) cz
Q: ee cs d cs de cs cs cs (Z; 't f- et f- - (0 CO p- a) Co m LO CF) 0 r- (D LO le 't le te m X- C, 4 Li) C» cc! 0 r- r- (0 Co C) Co (0 7
r4 cý 4: -: 44 rý 4 cý r4
4-- CI) 0E
0 " (D e (3) r- N l- CO 3 V) Lin CO ý-M cr) N C, 4 ?, - Co . Z FL CN
(D CD 00000 (D C) CD (Z ýg T- Nm %t LO Co t- Co m CD ,
U) 111111t1 l>
cz (D 0 (D (D C) C) 22 c 0 F- C, 4 V) ýt LO ýo r- Co
eq en

My multivariate regression model is specified as follows:
Value =C+a* State +A* Ownership +, 82 * Asset +, 83 * Capital +, 84 * Traits +, fl5 * Time +e
where Value is corporate value; State represents of the percentage of government
shares among total shares; Ownership is the control of other types of owners,
including ownership concentration, non-govermnent shareholder's holding, and
managerial shareholding; Asset accounts for the characteristics of corporate size,
including the size, structure and growth; Capital represents the capital structure of the
firm; and Traits covers other characteristics of the firm, including firm age, industrial
classification and whether trading in SSE or SZSE. I also control the effect of time on
the relation between corporate value and government shareholding, which captures
rapid institutional changes and macroeconomic shocks in different years.
I introduce the dependent variable State in Section 2.3 and my independent
variable of Value in Section 4. L The specification of control variables is based on the
current literature in empirical corporate finance, the availability of related data for
China's PLCs, and the seriousness of multi-collinearity problems.
Table 6 presents the definitions, calculation methods, and the predicated signs
of the variables used in this chapter. It also provides some selected supporting
references for each control variable. 21
21 Due to lack of space and the author's concentration on the main research question, this version only briefly describes the control variables. Interested readers can require a copy of detailed discussions on the selection of the control variables.
33

Table 6
Definition and Signs of Variables Variables Definitions Supporting literature Predicated Empirical
QA proxy of Tobin's Q as the adjusted market value of the firm. It is calculated as the Chung & Pruitt 94 FM, summary of market value of equity and book value of debt over book value of assets. Shin & Stulz 98 WE
ROA A proxy of corporate accounting profitability. It is calculated as the net profit over total assets.
Private A dummy variable of ownership. If the government is a shareholder of an enterprise, Boardman & Vining ++ it is 0; otherwise, 1.89 J. Law & Eco.
Private A dummy variable of ownership. If the government is the largest shareholder of an + + Large enterprise, it is 0; otherwise, 1.
State The cash flow rights of the government as well as approximately the voting rights of U the government. It is calculated as state-owned shares over total common shares. State2 is the squared form of State. State 0-30% is calculated as min(State, 30%); State 300/o-50% as max(min(State, 50%), 30%)-30%; State 50-90% as max(State, 500/o)-50%.
Herrindahl jA An indicator of ownership concentration. Calculated as F(S 2)/10 where Si is the + +
large shareholders' holding fraction, i is from I to 10.
Second A dummy variable of ownership. If the second largest shareholder has more than Gomes & Novaes 99 + 0 10% voting rights, it is 1; otherwise, 0. Wharton
Manager Managerial shareholding. It is calculated as the total shares held by senior managers Morck et al. 88 JFE + 0 for Q; over total common shares. + for
ROA
Size Corporate size. It is calculated as the log form of total assets as for Q and Market-to- Chh1bber & Majumdar + - for Q; Book value; log form of sales as for ROA and other accounting profit measures. 99 J. Law & Eco. + for
ROA
Tangible An indicator of the asset structure or the capital intensity. It is calculated as fixed Demsetz & Lehn 85 assets over total assets. RE
Gear An indicator of the capital structure. It is calculated as total liability over the book Titman & Wessels 88 + value of total assets. JF
Age Firm age. It is calculated as the number of years a firm has existed since it was founded.
Exchange Stock exchange. It is I if the firms are listed on Shanghai Stock Exchange; 0 if they ?0 for are listed on Shenzhen Stock Exchange. ROA: +
for Q
Industry The industries in which a firm mainly operates. The 21-industry classification is Montgomery& used, including agriculture, chemical industry, conglomerate, construction, electricity Werneffelt 88 AER; equipment, information technology, electronics, finance, food & wine, machinery, Schmalensee 85 AER metal, motor, papers, petrochemicals, pharmaceuticals, real estate, shopping and travel, textile, transport, utility and others.
Year The effect of time. Four dummy variables represent the data in different years. It covers the years 1994,1995,1996,1997 and 1998.
34

5. The Overall Impact of Government
Shareholding Is Detrimental
Based on the hypothesis of a detrimental government shareholder, here I examine 1)
whether the companies with partial state ownership are valued lower than those
without any state ownership, 2) whether the companies in which the government is
the controlling shareholder are valued lower than those with a non-goverrunent
controlling shareholder, and 3) whether corporate value is a negative function of the
size of government shareholding stake. These are the three specifications of the
hypothesis of government shareholding being detrimental.
5.1 Classification ofModern Firms
To examine my hypothesis of the government shareholder as having a
negative effect on corporate performance, I classify the modem firms on the Chinese
stock market as mixed enterprises (ME) and private enterprises (NSE)22 ; enterprises
whose largest shareholder is the government (SL) and those with a non-government
shareholder as the largest shareholder (NSL); enterprises in which the majority
shareholder is the government (Smaj) and those where a non-govemment entity is the
majority shareholder (NSmaj).
The classical approach in examining the efficiency of government ownership
is to compare state-owned enterprises, mixed enterprises, and private enterprises (e. g.,
Boardman and Vining 1989). Although there are no SOEs in my data set of PLCs and
22 NSEs represent Non-State-owned-Enterprises, in which there are no state shares. The "private enterprises" here include the companies owned by many individuals and institutes. The abbreviation of NSEs avoids the confusion with the private enterprises fully owned by one entrepreneur.
35

the so-called private enterprises here are joint stock companies, this approach still
makes sense. However, the impact of government ownership on corporate value
depends not only on whether there exists government shareholding in a PLC, but also
on whether that government shareholder is in control.
5.2 Comparison
The so-called "private" enterprises on the stock market are actually enterprises
without state shares (NSEs). As described in Section 3.4, the owners of these
enterprises include both institutions and families. Enterprises with a state shareholding
of more than zero but less than 100% arc known as mixed enterprises (MEs).
Table 7 finds that NSEs perform significantly better than MEs. The mean of
the Q in NSEs is 19% higher than in MEs, and the ROA is 18% higher. This finding
supports Specification I of the detrimental hypothesis that firms with partial
government ownership perform worse.
Another way to examine the overall influence of the government shareholder
is to categorize firms into those with the govemment as the largest shareholder and
those with a non-government shareholder as the largest shareholder. The shareholder
who holds the largest stake is often the controlling shareholder, as there are few
instances in China of collaboration between other shareholders to counter the largest
shareholder. 23
23 Although the law allows proxies of voting rights, proxy rights are seldom used in China. The first proxy war occurred in 2000 when Tong Baihui collected proxies to control Shenli Gufen.
36

Table 7
Comparing the Value and Characteristics of Firms 11iis table presents some firm characteristics and compares them among different ownership types of enterprises. NSEs are enterprises with no state shareholding, also called private enterprises. NSLs are firms whose largest shareholder is not the state (non-state largest shareholder) and SLs are firms where the State is the largest shareholder. A NSmaj is an enterprise in which the major shareholder is a non- government entity. A Smaj is an enterprise in which the government holds more than 50% of shares. The comparison of means is based on Student T statistics. It is significantly different, except for the ROE. Under the whole data set, without ruling out outliers, the Mann-Whitney U test compares the medians of the two samples with the null hypothesis that median(ME)=median(NSE), if taking the
MEs and NSEs as an example. The statistics are Unse = nnsenme +n nse (n
nsee +
Snse 2
Ume = nnsenme + nme (nme + Sme
- It indicates whether there are significant differences by 2
asterisks against the latter column of the compared variables; *** as p or z -value: 5 I %, ** p or z- value:! ý 5%, *p or z -value: 5 10%.
Items NSEs MEs NSL SL NSmaj Smaj All Q Mean 2.935 2.467*** 2.817 2.457*** 2.995 2.547*** 2.604
Median 2.547 2.197*** 2.450 2.190*** 2.603 2.303*** 2.291
ROA Mean 0.059 0.050*** 0.056 0.050*** 0.074 0.054*** 0.053 Median 0.063 0.054*** 0.063 0.054*** 0.074 0.056*** 0.058
SECOND Mean 0.276 0.385*** 0.199 0.465*** 0.324 0,870*** 0.199 Median 0 0*** 0 0*** 0 1 *** 0.000
MANAGER Mean 0.006% 0.004%*** 0.006% 0.004%*** 0.032% 0.008%*** 0.005% Median 0.002% 0.001 %*** 0.002% 0.001 %*** 0.000% 0.000%*** 0.001%
SIZE Mean 8.470 8.555*** 8.471 8.571*** 8.563 8.676*** 8.530 Median 8.412 8.540*** 8.413 8.559*** 8.509 8.645 8.501
TANGIBLE Mean 0.248 0.246 0.247 0.246 0.248 0.251 0.246 Median 0.215 0.222 0.216 0.223 0.219 0.225 0.219
GEAR Mean 0.398 0.441 0.407 0.443*** 0.370 0.477*** 0.429 Median 0.393 0.440*** 0.400 0.448*** 0.373 0.459*** 0.424
AGE Mean 11.764 17.497*** 13.372 17.517*** 12.089 15.545** 15.820 Median 7 8*** 7 8"* 7 7 8
Observabons 778 1882 1089 1571 348 1028 2660
37
Table 7 finds that enterprises that have the government as the largest shareholder
have a significantly lower value and profitability than do those in which a non-
government shareholder holds the largest share of equity. If the government is the largest
shareholder, simplified Tobin's Q decreases by 14% and ROA decreases by 12%.
1 further group firms by whether the majority shareholder is the government.
Table 7 finds that Q is 2.5 and ROA 5.4% where the majority shareholder is the
government, and Q is 3.0 and ROA 7.4% where the majority shareholder is not the
government. This finding is consistent with Specification 2 that the firms under the
control of the government are valued lower than the firms under the control of a
commercial entity.
5.3 Regression
Table 7 also compares the corporate features of Chinese firms. There is certainly a
concern that state shareholding and corporate value of the firms may be correlated
through other factors. Thus, taking the different types of enterprises as dummy variables,
multivariate regressions are required to examine the hypothesis of detrimental
government shareholding.
Table 8 presents the OLS and MLP multivariate regressions. This table confirms
that enterprises without a government shareholder perform better than enterprises with a
government shareholder. It also confirms that enterprises in which the government is the
largest shareholder perform better than those in which a non-government entity is the
largest shareholder. The highly significant coefficient of the Herfindhal index also
suggests that ownership concentration creates value in Chinese firms.
38
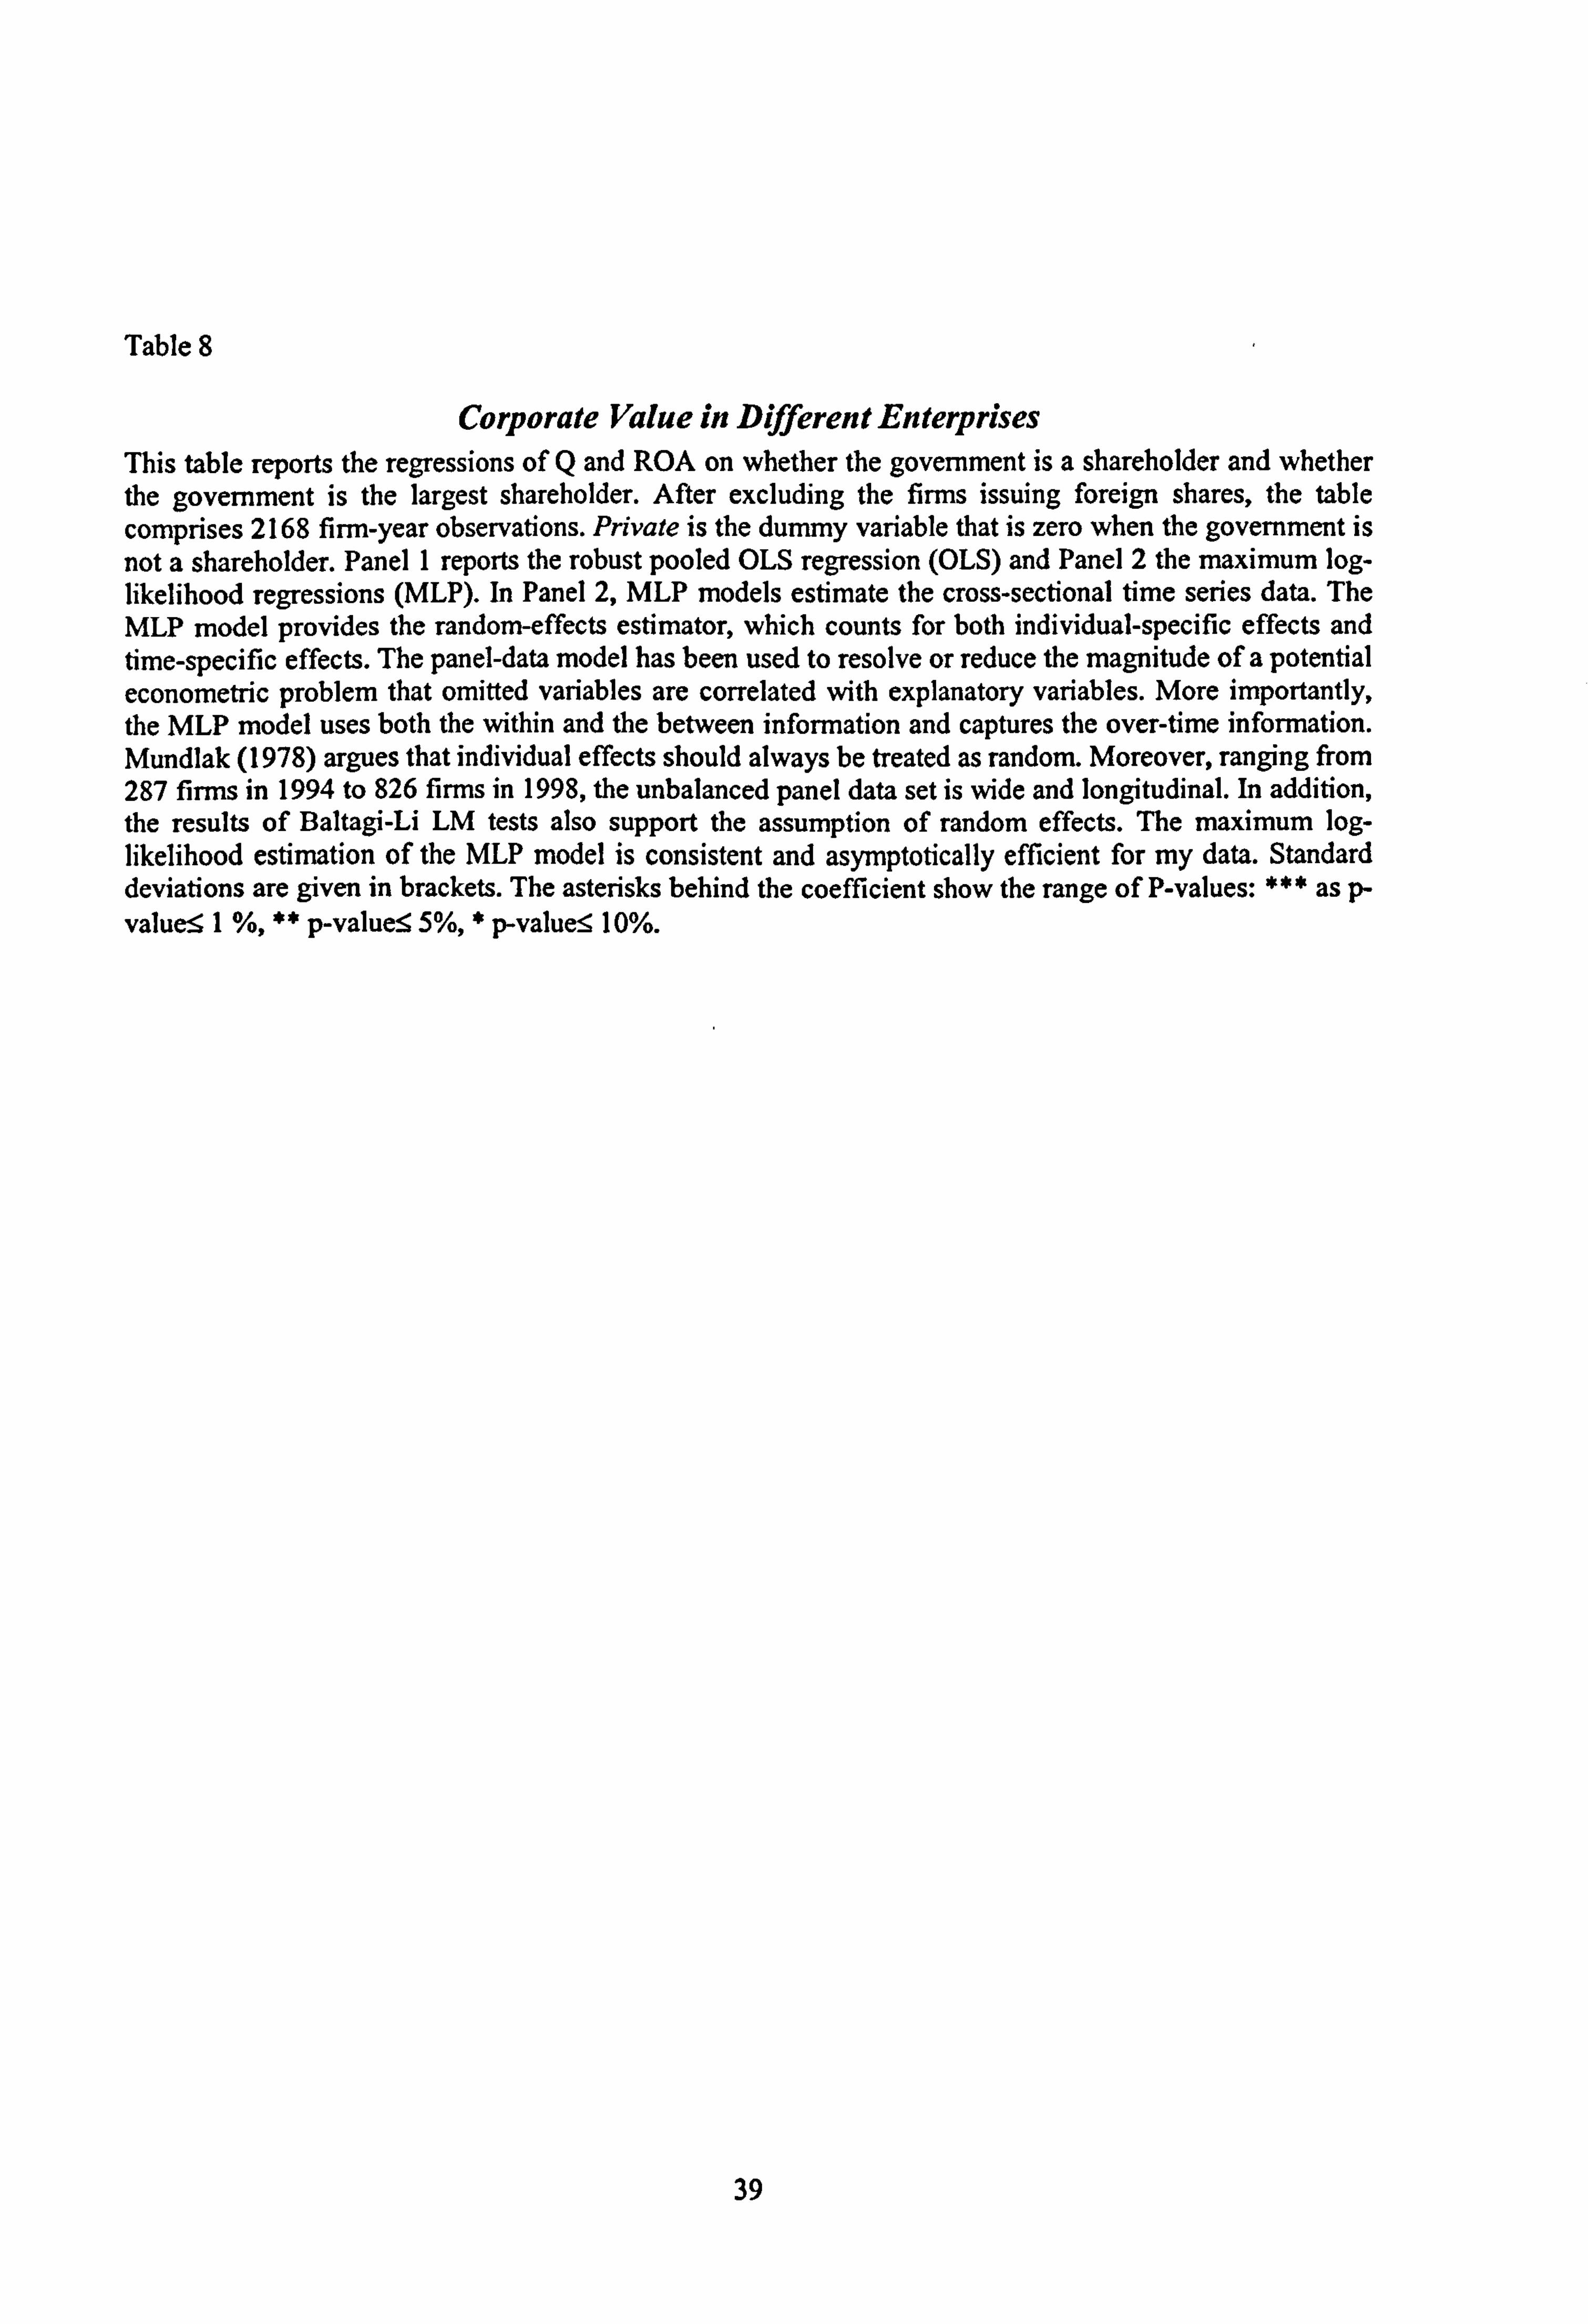
Table 8
Corporate Value in Different Enterprises This table reports the regressions of Q and ROA on whether the government is a shareholder and whether the government is the largest shareholder. After excluding the firms issuing foreign shares, the table comprises 2168 firm-year observations. Private is the dummy variable that is zero when the government is not a shareholder. Panel I reports the robust pooled OLS regression (OLS) and Panel 2 the maximum log- likelihood regressions (MLP). In Panel 2, MLP models estimate the cross-sectional time series data. The MLP model provides the random-effects estimator, which counts for both individual-specific effects and time-specific effects. The panel-data model has been used to resolve or reduce the magnitude of a potential econometric problem that omitted variables are correlated with explanatory variables. More importantly, the MLP model uses both the within and the between information and captures the over-time information. Mundlak (1978) argues that individual effects should always be treated as random. Moreover, ranging from 287 firms in 1994 to 826 firms in 1998, the unbalanced panel data set is wide and longitudinal. In addition, the results of Baltagi-Li LM tests also support the assumption of random effects. The maximum log- likelihood estimation of the MLP model is consistent and asymptotically efficient for my data. Standard deviations are given in brackets. The asterisks behind the coefficient show the range of P-values: *** as p- value: 5 I %, ** p-value: 5 5%, * p-value_-, ý 10%.
39

Panel 1: OLS regressions
Q ROA Pdvate 0.221ý 0.006"
(0.035) (0.003)
Private Large 0.171*** 0.006- (0.058) (0.003)
Second 0.105* 0.089 -0.006 -0.004 (0.052) (0.072) (0.004) (0.003)
Manager 0.181 0.410 0.303' 0.318' (1.399) (1.866) (0.064) (0.075)
Herl'indahl 6.455' 6.511 ' 0.194' 0.191ý (1.614) (2.016) (0.061) (0.068)
Size -0.573" -0.591ý 0.025ý 0.032ý (0.061) (0.082) (0.004) (0.005)
Tangible -0.490 -0.498 -0.028 -0.028** (0.371) (0.231) (0.016) (0.010)
Gear -1.711 ý -1.728ý -0.161ý -0.166ý (0.435) (0.369) (0.022) (0.026)
Age -0.004ý -0.005ý -0.0002ý -0.0002" (0,001) (0-001) (0-0001) (0-0001)
Exchange -0.179" -0.178" -0.004 -0.004 (0.052) (0.051) (0.003) (0.002)
Industry Yes. Yes. Yes. Yes.
Year Yes. Yes. Yes. Yes.
Constant 8.231' 8.110ý -0.115' -0.110ý (0.549) (0.531) (0.027) (0.028)
R-squared 0.489 0.501 0.410 0.436 F statistic 34.93 34.81 14.80 14.01 Significance 0.000 0.000 0.000 0.000
40

Panel 2: MLP regressions
Q ROA Pdvate 0.228- 0.006"*
(0.063) (0.002)
Private Large 0.163' 0.005" (0.061) (0.002)
Second 0.113* 0.180 -0.004 -0.004 (0.065) (0.124) (0.003) (0.004)
Manager 0.601 0.824 0.291" 0.297" (2.845) (2.823) (0.141) (0.123)
Heffindahl 9.363ý 9.232ý 0.297ý 0.295ý (2.035) (2041) (0.081) (0.090)
Size -0.606' -0.601*" 0.031"* 0.039' (0.068) (0.062) (0-001) (0.004)
Tangible -0.431 -0.428 -0.029 -0.029 (0.210) (0.206) (0.007) (0.005)
Gear -1.422' -1.431' -0.153' -0.157' (0.172) (0.165) (0.005) (0.006)
Age -0.004 -0.005 -0.0002* -0.0003" (0.002) (0.002) (0-000) (0-000)
Exchange -0.120 -0.118 -0.001 -0.002 (0.070) (0-091) (0.005) (0.003)
Industry Yes. Yes. Yes. Yes.
Year Yes. Yes. Yes. Yes.
Constant 8.359' 8.351 ' -0.138*** -0.142' (0.625) (0.634) (0.014) (0.026)
Log-likelihood -4361.5 -4371.1 4013.5 4211.2 ChiA2 statistics 409.12 412.61 767.34 756.36 Significance 0.000 0.000 0.000 0.000
41

Taken together, tables 7 and 8 confirm the hypothesis of government shareholding as
detrimental. Ceteris paribus, non-government shareholders are more efficient than a
government shareholder. These findings lead to the conclusion that with corporate value,
government shareholding does matter and is largely detrimental.
With the first large sample of mixed enterprises, 24 this chapter finds that private
enterprises perform better than mixed enterprises. This conclusion is consistent with the
empirical finding of Boardman and Vining (1989). Furthermore, the evidence from China
corroborates the dynamic privatization studies.
Adopting the approach of Megginson et al. (1994), Chen et al. (2000) find that
there is no significant improvement in value after share privatization. Their findings
support the argument that state ownership is irrelevant to corporate performance. An
alternative interpretation could argue that the gradual shift from a seller's market to a
buyer's market, and the intensified competition, explain the empirical findings of Chen et
al. (2000). Nevertheless, finding the overall impact of state ownership to be detrimental,
our study shows that China is not an exception from that government ownership is
generally detrimental.
6. The Two Hands of the Chinese Government
Shareholder
In this section, I examine the regression relations between corporate value and the size of
goverment shareholding. In contrast to the straightforward view of government
shareholding as being simply detrimental to the performance of a firm, I find a U-shaped
24 The findings of Vining and Boardman (1990) include as mixed enterprises those partly owned by a special fund.
42

relation, which I interpret as illustrative of a view of the government as having two hands
- one grabbing and the other helping.
6.1 Further Development of the View of Government Shareholding as
Detrimental
In joint-stock companies, the greater the shareholding stake of a shareholder, the
greater is the shareholder's influence and the greater the fraction of residual cash flow
that accrues to the shareholder. The nature and type of the shareholder will naturally
affect the relation between it and corporate value, which will change as the influence of
the particular shareholder in question increases. Morck et aL (1988) show that there is
non-monotonic relation between corporate value and the size of managerial shareholding
in which the elements increase, decrease, and then increase again. McConnell and
Servaes (1990) show that there is an inverted-U shaped relation between the value of the
finn and the size of insider ownership. Under the hypothesis of the government as
shareholder being detrimental to a firm, corporate value decreases with increased
government shareholding.
To examine Specification 3 that corporate value is a negative function of the size
of the government shareholding stake, I regress corporate value on the simple form of
state shareholding in mixed enterprises. However, whether the analysis is univariate or
multivariate, table 9 shows that the coefficients of State are not significant. The influence
of the government as shareholder does not grow more detrimental as the size of its
shareholding stakes grows larger. Thus, in the Chinese context, an assessment of the
influence of the government shareholder is not fully consistent with that of the classical
view that it is purely and simply detrimental.
43

Table 9
Corporate Value and Government Shareholding: I
This table reports the regressions of Q and ROA on the fraction of government shareholding. The table comprises 2168 firm-year observations, after ruling out the firms with B shares. Panel I presents the results of the robust pooled OLS regression (OLS) and Panel 2 the maximum likelihood random effect panel model regression (MLP). Standard deviations are given in brackets. The asterisks behind the coefficient show the range of P-values: *** as p-value: 5 I p-value:! ý 5%, * p-value:! ý 10%.
Panel 1: OLS Regressions
Q ROA State -0.343 -0.358 0.006 0.005
(0.222) (0.821) (0.015) (0.007)
Second -0.082 -0.005** (-2.041) (0.002)
Manager -0.986 1.203 (-1.976) (-1.765)
Large Private -0.361*** 0.007** (0.064) (0.003)
Size -0.597*** 0.027*** (0.063) (0.007)
Tangible -0.507** -0.023*** (0.223) (0.007)
Gear -1.722*** -0.163*** (0.360) (0.023)
Age -0.005*** -0.025*** (0.001) (0.007)
Exchange -0.166*** -0.004 (0.051) (0.002)
Industry Yes. Yes. Yes. Yes.
Year Yes. Yes. Yes. Yes.
Constant 2.612*** 8.005*** 0.076*** -0.115*** (0.243) (0.538) (0-009) (0.025)
R-squared ---------
0.112 ......... ..
0.216 ---- - ----- 0.065
----- - ----- 0.277
F statistic 25.83 34.48 7.40 13.68 Significance 0.000 0.000 0.000 0.000
44

Panel B: MLP Regressions
ROA State -0.365 0.205 -0.012 0.003
(0.312) (0.182) (0.013) (0.007)
Second 0.075 -0.005 (0.066) (0.004)
Manager 1.062 0.287** (2.943) (0.101)
Large Private 0.232** 0.007 (0.087) (0.004)
Size -0.623*** 0.035*** (0.067) (0.004)
Tangible -0.437** -0.031*** (0.212) (0.007)
Gear -1.428*** -0.165*** (0.172) (0-008)
Age -0.005** -0.039*** (0.002) (0.010)
Exchange -0.106* -0.001 (0.059) (0.002)
Industry Yes. Yes. Yes. Yes.
Year Yes. Yes. Yes. Yes.
Constant 2.884*** 8.234*** 0.113*** -0.141*** (0.214) (0.527) (0-009) (0.036)
Log-likelihood -4453 -4345 3913 4134 ChiA2 statistics 224.8 423.3 223.6 734.5 Significance 0.000 0.000 0.000 0.000
45

6.2 A U-shaped Relation
Using descriptive statistics, table 5 suggests that there is indeed a relation between
state shareholding and corporate value, which may not be monotonic. In this section I use
polynomial regressions to examine this relation.
Table 10 finds that the coefficient of State is significant and negative and that of
StateA2 is significant and positive. This regression result means that the statistical relation
between state shareholding and corporate value resembles the following stimulated chart:
State Shareholding and Corporate Value
2.7 2.6- 2.5- AP
0 2.41 '00001" 2.3 2.2 2.1
2 0 10 20 30 40 50 60 70 80
State Shareholding
Up to a certain threshold, a finn's value decreases as the shareholding stake of the
government increases, but beyond this threshold corporate value begins to increase with
increased sizes in the government's shareholding stakes. The turning points are relatively
stable in the 301/o-40% range of government shareholding, depending on the model
specification. It is a U-shaped pattern with a higher left end than right end. With the
institutional backgrounds and the related regression method (see Appendix 3), 1 confirm
that the size of government shareholdings causes the distribution of corporate values.
46

Table 10
Corporate Value and Government Shareholding: H This table reports the regressions of Q and ROA on the fraction of government shareholding, using 2168 firm-year observations -after ruling out the firms with B shares-. State2 is the squared form of state shareholding (State). Panel I presents the results of the robust pooled OLS regression (OLS) and Panel 2 the maximum likelihood random effect panel model regression (MLP). Standard deviations are given in brackets. The asterisks behind the coefficient show the range of P-values: *** as p-value-< I %, ** p-value:! ý 5%, * p-value: 5 10%. Panel A: OLS Reeressions
Q ROA State -2.296- -1.694- -0.069ý -0.034"
(0.346) (0.337) (0.015) (0.018)
State2 2.823ý 2.563ý 0.086"* 0.044** (0.448) (0.416) (0.027) (0.020)
Second 0.208' -0.006 (0.075) (0.003)
Manager 1.208 0.343ý (1.773) (0.080)
Private Large 0.415** 0.015' (0.186) (0.004)
Size -0.644ý 0.014ý (0.062) (0.004)
Tangible -0.527" -0.031 ý (0.223) (0.007)
Gear -1.665ý -0.166' (0.358) (0.025)
Age -0.005ý -0.0002ý (0.001) (0-0001)
Exchange 0.161*** -0.002 (0.041) (0.002)
Industry Yes. Yes. Yes. Yes. Year Yes. Yes. Yes. Yes. Constant 2.685ý 8.456ý 0.085ý -0.099"*
(0.217) (0.525) (0.011) (0.030)
R-squared 0.131 0.238 0.087 0.296 F statistic 27.09 35.23 8.34 12.62 Significance 0.000 0.000 0.000 0.000 Turning point 0.408 0.291 0.385 0.389
47
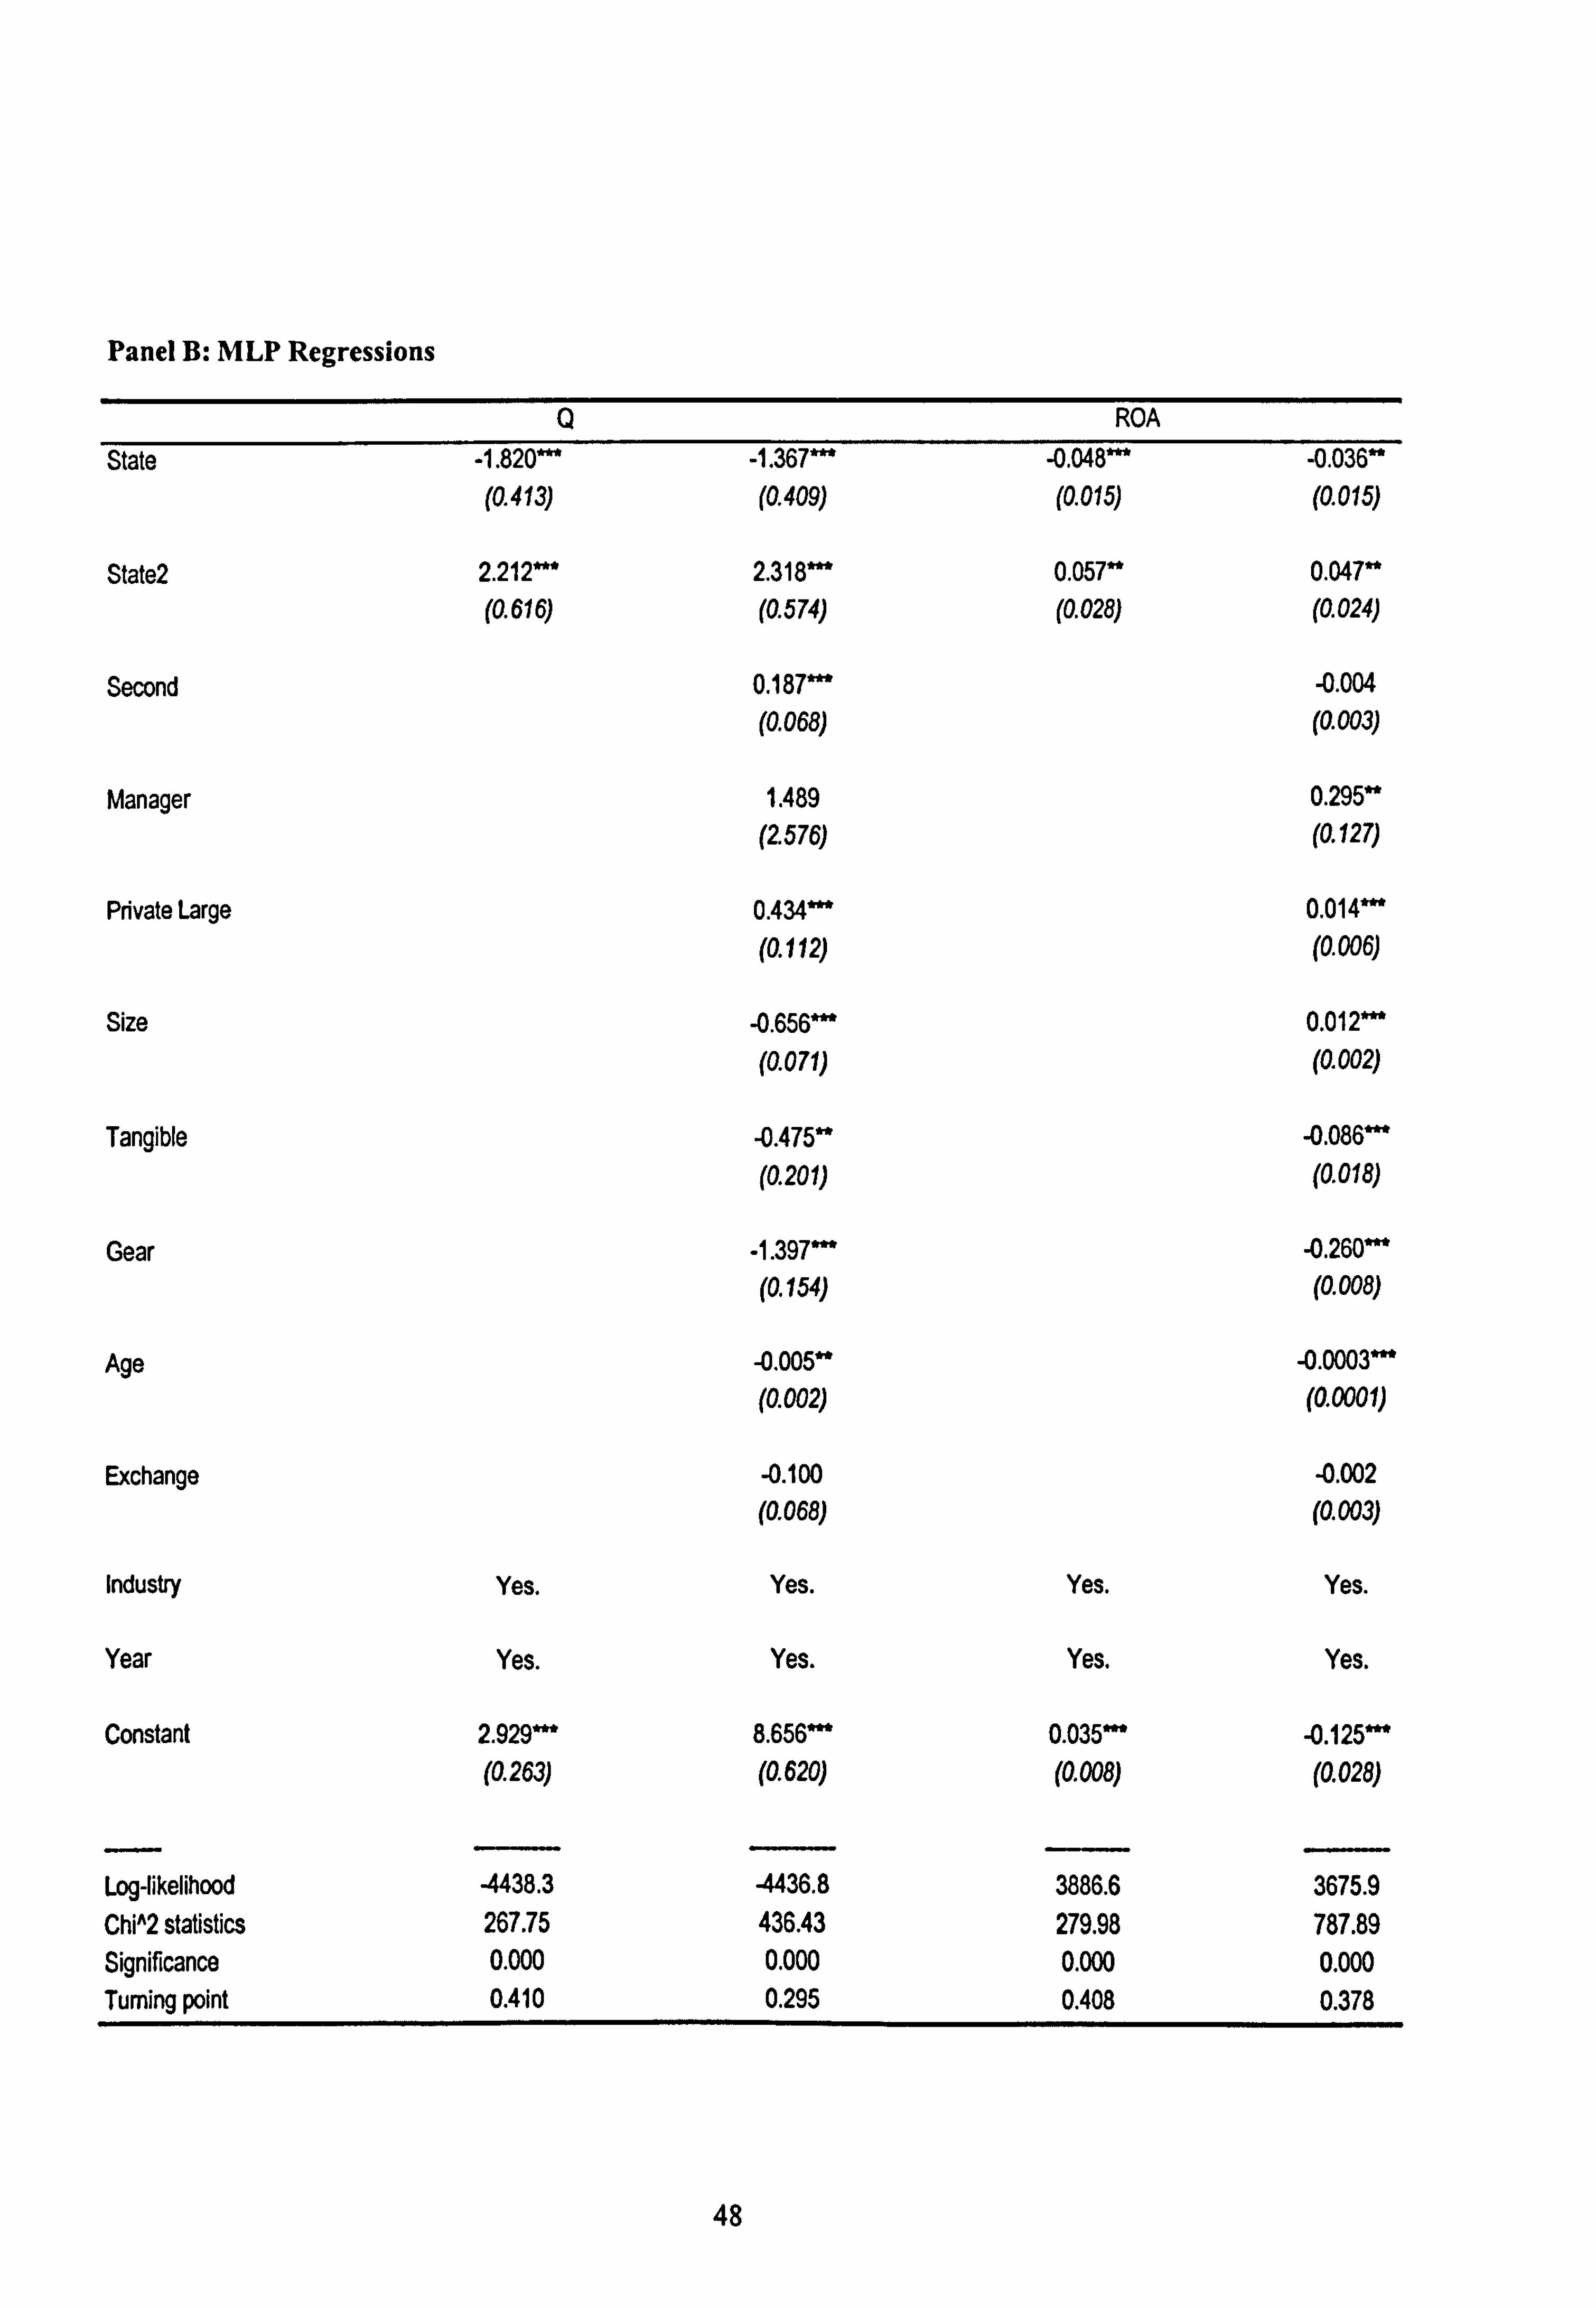
Panel B: MLP Regressions
ROA State -1.820ý -1.367ý -0.048ý -0.036-
(0.413) (0.409) (0.015) (0.015)
State2 2.212"* 2.318' 0.057" 0.047" (0.616) (0.574) (0.028) (0.024)
Second 0.187ý -0.004 (0.068) (0.003)
Manager 1.489 0.295" (2576) (0.127)
Private Large 0.434ý 0.014ý (0.112) (0.006)
Size -0.656ý 0.012ý (0.071) (0.002)
Tangible -0.475" -0.086' (0.201) (0.018)
Gear -1.397ý -0.260"* (0.154) (0-008)
Age -0.005" -0.0003*** (0.002) (0.0001)
Exchange -0.100 -0.002 (0.068) (0.003)
Industry Yes. Yes. Yes. Yes.
Year Yes. Yes. Yes. Yes.
Constant 2.929ý 8.656' 0.035ý -0.125"* (0.263) (0.620) (0-008) (0.028)
Log-likelihood -4438.3 -4436.8 3886.6 3675.9 ChiA2 statistics 267.75 436.43 279.98 787.89 Significance 0.000 0.000 0.000 0.000 Turning point 0.410 0.295 0.408 0.378
48

Although the aggregated impact of government ownership is negative, as proved
in Section 5, the above finding challenges the theory that state ownership leads to
inefficiency, because my results show that the impact of government shareholding on a
firm is not necessarily detrimental. It is incrementally detrimental when the government's
shareholding stakes are relatively small. The relation becomes positive and incrementally
beneficial to the firm when, after a certain threshold has been crossed, government
shareholding stakes are relatively large.
This U shape implies that a shareholding structure with a large non-government
shareholder is preferable, followed by a shareholding structure with a large government
shareholder. A dispersed shareholding structure is least preferable.
6.3 Endogeneity and Robustness of the UShape
Section 6.2 finds that there is a U-shaped pattern between state shareholding and
corporate value. The reason may be that the government bases its decision on the amount
of shares to buy in a given firm on the corporate profitability and value of the firm in
question. If there is some causality from corporate value to state shareholding, it could
happen through three channels. The first is initial public offerings. The government
shareholder may sell more shares in enterprises that have higher profitability. The second
is SEOs or seasoned equity offerings. After the IPOs, the government may increase its
shareholding based on the firm's profitability. The third is the market for partial-stake
transfers, since the government is forbidden by law from participation in the open market.
The change of state shareholding in these three processes may be based on corporate
value.
49

Timely ordering is a necessary condition of causality. I tested whether the past
distribution of corporate profitability correlates to the change of state shareholding stakes.
The signs of ROA-, remain insignificant when the model specifications are changed with
more control variables. Statistically, if there is no correlation, there cannot be any
causality. That is, historical corporate performance does not decide the distribution of
state shareholding. It is consistent with the situation in China that liquidation of the
government's equity stake in a company does not aim at raising fiscal revenue25. The
ideology of the Communist Party dominates the financial interest of the government in
the IPOs. The goal of selling part of state ownership is to restructure enterprises 26 .
With regard to SEOs, the central government encourages its agents that directly
hold state shares to maintain its former position in corporate control. However, it does not
allocate a sufficient budget for the seasoned equities. Therefore, the purchase of SEOs is
decided not by corporate profitability, but by the budgetary constraints of the agents
holding state shares. In practice, the controlling rights of the government shareholder are
normally diluted during SEOs.
As for the block transfer of state shares, it is also targeted at enterprise
restructuring. There are a number of cases in which the government grants its shares to
strategic investors. 27 For example, the government gave away its shares in Tianjin Meilun
to Tianjin Taida Group Co. in 1997. The Securities Times found that state-share transfers,
including both grant transfers and negotiated transfers, usually aim at injecting new
25 Since 2000, the government has been discussing redirecting their focus on selling shares under the financial need to build a social security. system. 26 "Measures on the Shareholding Experimenf', issued by the State Council, 15 May 1992. 27 According to China Security Daily in 2000, about one third of state-share transfers were free grants in 1998.
so

capital into a company and updating its technology, rather than raising revenue for the
govermnent. 28
Thus, corporate value does not decide the distribution of state shareholding. The
significant non-monotonic relation between state shareholding and corporate performance
is caused by impacts that derive from the equity stakes of the govermnent.
Another potential problem is the accuracy of the proxies of corporate value. To be
cautious, I tested other measures of corporate performance, including excess value 29 11
return on sales, return on equity, net margin and return on capital employed. The results
support the findings based on Tobin's Q and ROA.
In specifying the model with control variables, I followed corporate finance
literature. I performed more sensitivity tests by adjusting the set of control variables; for
example, by adding the sales-growth ratio and removing the tangibility ratio. The results
are consistent with the reported tables.
I also examined the potential nonlinearity of the control variables and included
their squared forms or cubic forms during sensitivity analyses. However, I found that
most nonlinear forms of control variables tend to have insignificant coefficients. The
signs for the independent variables remained the same with different sets of control
variables.
My analyses crosschecked for the potentially undue influence of outliers on the
empirical results. The median regressions performed are consistent with the results
reported in the tables. The results in the tables are robust if the Hadi dummies are added
28 http: //www. p5w. net/company/200009/09/ýsyj2OOOO9O9Ol 10. html 29 Excess value is the premium of Tobin's Q, based on the industrial medians.
51

to capture the multiple outliers in the multivariate analysis. The DFITS test suggests that
the regressions reported are generally robust.
I applied different regression methods to confirm the results. In my analysis of
categorized enterprises, I performed the discriminant analyses and logit analyses with the
artificial setting, using the types of the enterprises as success rates. I found results similar
to those of the comparison statistics and dummy-variable regressions. I also performed
the piecewise regressions for table 9 and table 10. The results are consistent with my
arguments. Therefore, I report only the nested tables.
6.4 Rationalization of the UShape
While this U-shaped empirical result is of interest of and in itself, it provides
supports the political economy of the government shareholder. That is, the government
has both political interests and financial interests, which consequently brings about the
two hands of the government, -one is to gab and the other is to help. With the
interpretations in the subsections, the following chart summarizes my interpretation of
this U-shaped finding.
52

0 01
Govemment ParOality.
..........
0 State-based CorDorate Governance State Shari
Total Effect
Political Interference *-------------------------
6.4.1 The Grabbing Hand of Political Interference
The hypothesis of the government shareholder as having a detrimental effect on
corporate value is based on the view that the government has a grabbing hand that
interferes in corporate operation as it pursues its political interests. For example, the
Sinopec Shanghai Petrochemical Company Limited, which has the govemment as
majority shareholder, hired 38,000 employees for its core operation even though it could
have gotten by with far fewer people. Although it tried to lay off 17,000 employees, its
government shareholder did not allow it to do so. Further, this firm was forced to find
jobs for its employees. It only succeeded in doing so for 13,000 of the employees it had
originally planned to lay off, yet it must continue to pay the wages for the remaining
4,000. Although this satisfies the government shareholder's political interests and
benefits society, it is at the expense of corporate wealth.
In the context of a joint stock company, the extent to which the government
shareholder may interfere in corporate activity in the pursuit of its political interests
53

depends on the extent of its voting rights. Generally, as its voting rights increase so does
the extent of its interference. However, the likelihood and magnitude of political
interference stops increasing once the shareholding stakes of the government have
reached a certain size and have become relatively large.
All else being equal, the influence of the government on a finn in which the
government shareholder owns 51% of shares is the same as that in a firm in which the
government owns 85%. That is, after the controlling stake threshold, which varies with
the specific shareholding structure of a company, has been passed, the probability and
magnitude of political interference reach their maximum.
aB -
av Assigning the threshold as 01, there are >0 and-<O if a<01 where Vis
ad aB
corporate value, B is the private benefits from political interference and a is the fraction
aB of voting rights. When a> 01 )-=0, which partly explains why the coefficient of State
ea
is insignificant in table 9.
6.4.2 The Helping Hand of the Government on Corporate Governance
The government shareholder can be helpful. For example, to reduce managerial
agency costs, a government-dominated shareholding structure is more effective than a
3 dispersed shareholding structure under a weak legal enforcement. 0 This point can be
illustrated by the case of Monkey King Co. With no large shareholder to monitor its
" Black (2000) outlines five institutions for the dispersed shareholding structure to be effective on corporate governance: 1) effective regulation of the securities market; 2) accounting rules, independent audits and extensive financial disclosure; 3) a sophisticated accounting and banking profession; 4) a stock exchange with meaningful listing standards; and 5) company and insider liability for false and or misleading information. Chinese stock market, so far, has not reached these five conditions. I therefore have the sequence of effectiveness of corporate governance: the firms with a large commercial shareholder, the firms with a large government shareholder and the firms without a large shareholder-dispersed shareholding structure.
54

activities, this firm squandered its cash flows and manipulated the accounting reports. It
might have been prevented from happening had the firm had a large government
shareholder to oversee management activities, provide corporate governance, and protect
the cash flow rights of the company to which its own financial interests would have been
closely linked. Corporate governance of the government shareholder may not be as strong
as that of the governance of a commercial shareholder, but it exists. For example, the
Chinese State Council has issued an explicit policy guideline to remove the managers
from firms under government control if those managers have been responsible for losses
for three years running. The government-controlled shareholding structure is not most
effective as for corporate governance, but it is better than a dispersed shareholding
structure.
If there is to be state-based corporate governance within a firm, the shareholding
stake of the government must be sufficiently large, because if its voting rights are small,
it is difficult for the government to control the managers. In addition, small voting rights
mean cash flow rights are also small, and since monitoring managers is costly, 31 a
government shareholder with small voting rights has little incentives to do so. Naturally,
as the size of the government's shareholding stakes increases and the proportion of cash
flow received by the government shareholder starts to outweigh the monitoring cost of
the managers, the government shareholder has more incentive to provide corporate
governance.
If I denote G the cost of corporate governance and 02 as a threshold, there are
31 Costs lie in the allocation of good bureaucrats, time loss, and the effort of monitoring. In addition, it should be noted that with regard to incentives for providing corporate governance, there is not much difference between the case of a government shareholder and other shareholders.
55
OG >0 and
av >0 when a>02;
aG =0 when a< 02.
aa aG aa
If using the board-member turnover as a proxy of corporate governance, there is
no significant relation between the frequency of board-member turnovers and the size of
government shareholding when the government is a small shareholder. When the
government is a controlling shareholder, the board-member turnovers increase with
increasing the size of government shareholding. Panel A in table 11 supports this
interpretation.
6.4.3 The Helping Hand of the Government on Preferential Treatment
A particular characteristic of the government shareholder that makes it markedly
different from other shareholders is its ability to provide a wide range of preferential
treatment. The partiality includes biased regulations when the government is a regulator,
preferential loans when the government is a creditor, a large order for products when the
government is a consumer, and discounted sales of production factors when the
government is a producer. For example, Fu-Jian Expressway PLC received direct
subsidies from the government to a sum of US$18 million, which represented 58% of its
profits.
56

Table 11: Helping Hands of the Government
This table examines whether a large government shareholder has a helping hand. Based on Table 10,40% is chosen to classify the whole sample into Sample A where the government shareholder holds less than 40%; and Sample B where the government shareholder holds more than 40%. This table reports the robust regression results after adjusting the outliers with Hadi procedure in 1998, because my dataset only records the subsidies in 1998, sourced from Securities Times. The frequency of board-member turnover approximates the governance role of a shareholder, which is the dependent variable in Panel A. Panel B uses the government subsidies as the dependent variable, which approximates the preferential treatment of the government shareholder.
Panel A: Board-member Turnovers and Government Sbareboldin Sample A Sample B
State 0.055 0.406*** (0.118) (0.173)
Debt 0.196 0.254 (0.164) (0.160)
Size -0.054*** -0.037** (0.017) (0.019)
Tangible -0.024 0.038 (0.069) (0.080)
Herfindhal 2.244** -0.582 (0.913) (1.583)
Age -0.002** -0.002** (0.001) (0.001)
Industry Yes Yes
Constant 1.537*** 1.058*** (0.350) (0.381)
F test 8.07 8.28 Significance 0.000 0.000 R-squared 0.027 0.037
Panel 13: Subsidies and Govemment Shareholding Sample A Sample B
State 0.892 0.325** (0.278) (0.158)
Size 6.310** 5.254*** (2.908) (1.260)
Debt -1.941 0.839 (2.470) (0.686)
Industry Yes Yes
Constant -1.530*** 1.083*** (0.450) (0.315)
F test 6.69 8.28 Significance 0.000 0.000 R-squared 0.194 0.274
57

However, government partiality comes at the expense of the financial interests or
even political interests of the government. Therefore, the government has no incentive to
provide such costly partiality to a firm in which its cash flow rights are small. Thus, the
extent of preferential treatment provided by the government is correlated to its cash flow
rights.
There are cis >0 and av
>0 when a>03 , where S denotes the cost of aa as
government partiality; av
=0 when a<03. aa
If using the subsidies from the government as a proxy of government partiality,
there is no significant relation between the size of subsidies and the size of government
shareholding when the government is a small shareholder. When the government is a
controlling shareholder, the subsidies increase with increasing the size of government
shareholding. Panel B in table II supports this interpretation.
Table 11 shows that the beneficial effects of a large government shareholder
comes from two channels-corporate governance and preferential treatments, which are
not in conflict.
6.4.4 Synergy of the Grabbing Hand and the Helping Hand
Based on the behaviors of political predation, corporate governance, and
preferential treatment, the utility function of the government shareholder is as
follows:
58

U=a*V+B-G-S
Subject to:
0: 5 a <1
V=v G+v O+v S -VB
where VO is corporate value independent of a, VG is value changed by G, Vs by S, VjB by B.
Therefore
Set ýp<O, and (p<03, when V< 01, we have av
0; ea
Set V/ > 02 and V/ > 03, when V/ > 01,
where (p < V.
we have av 2a
Thus, the relation between the shareholding stakes of the government
shareholder 32 and corporate value is negative until a certain threshold and positive
beyond this threshold. The U-shaped empirical relation is a result of the aggregated
impact of the government shareholder's different goals, i. e., its political and financial
interests. Its political interests bringing about the reallocation of corporate resources are
detrimental to a firm. But when it is pursuing its financial interests, which lie in its cash
flow rights and thus the size of its shareholding, the government provides corporate
governance and acts with benevolence and partiality. If corporate value is the main
" The simplified descriptive model here does not differentiate between voting rights and cash flow rights because the one-share-one-vote system makes the separation of voting rights and cash flow rights in China marginal.
59

consideration, the balance between the government's pursuit of these two main interests
must be firmly tipped towards the financial and not the political. This bent explains why
the value of a finn decreases as government shareholding stakes increase until a certain
threshold, since when the government is a small shareholder it has no incentive to
provide the preferential treatment and benevolence that would outweigh the
disadvantages of its political interference. 33 If the presence of a government shareholder
is to be beneficial to a firm, its shareholding stakes must be relatively large. In this way,
both the government shareholder and non-government shareholders work towards the
common goal of corporate value.
Conclusion
Government shareholding is a particularly characteristic feature of Chinese PLCs, and
this shareholder plays a significantly large role in the shareholding structures of public
listed companies in China. According to the findings in this chapter, the overall impact of
government shareholding appears to be detrimental to a firm's corporate value. This
finding supports the new evidence from China and contributes to the existing empirical
literature on the inefficiency of state ownership.
However, the detrimental impact of state shareholding is not monotonic, and
companies where the government shareholder has high voting rights are not necessarily
always valued lower. The relation between the size of the government's shareholding
33 It also implies that solely-state-owned-enterprises (SOEs) are theoretically more profitable than mixed enterprises, all else being equal. However, in reality, SOEs are not monitored by the stock market and most Chinese SOEs have not yet built up modem corporate governance structures.
60

stakes and corporate value is, on the contrary, U-shaped, caused by the tension between
the activities and political interests of the government on the one hand, and on the other,
its financial interests. Up to a certain threshold, as government shareholding stakes
increase but remain relatively small, the government's financial incentives are not
sufficient for its helping hand to provide the costly benevolent treatment that would
compensate for the negative effects of its grabbing hand, which pursues political interests
beneficial to society but detrimental to corporate value. When government shareholding
stakes increase beyond this threshold and become relatively large, state shareholding can
have a positive impact on a firm. Only then does the government have enough of a
financial interest in a company to provide it with the preferential treatment that the firm
would be hard put to find elsewhere.
Clearly, if corporate value is the main consideration and state shareholding is a
feature of a company's shareholding structure, the size of the government's shareholding
must be large enough for it to pursue its financial rather than political interests. Thus,
both government and non-government shareholders would be working in harmony.
However, given that the overall impact of government shareholding is negative, I believe
full privatization to be preferable for the profitability of a firm. On the other hand, the
optimal business strategy would be to buy out state shares in one shot and require that the
government fully retreat from a firm.
Having documented the features of China's PLCs and having found the role of the
government shareholder in them to be so significant, in this chapter I propose that the role
of the government shareholder be a new topic of study in financial institutions.
61
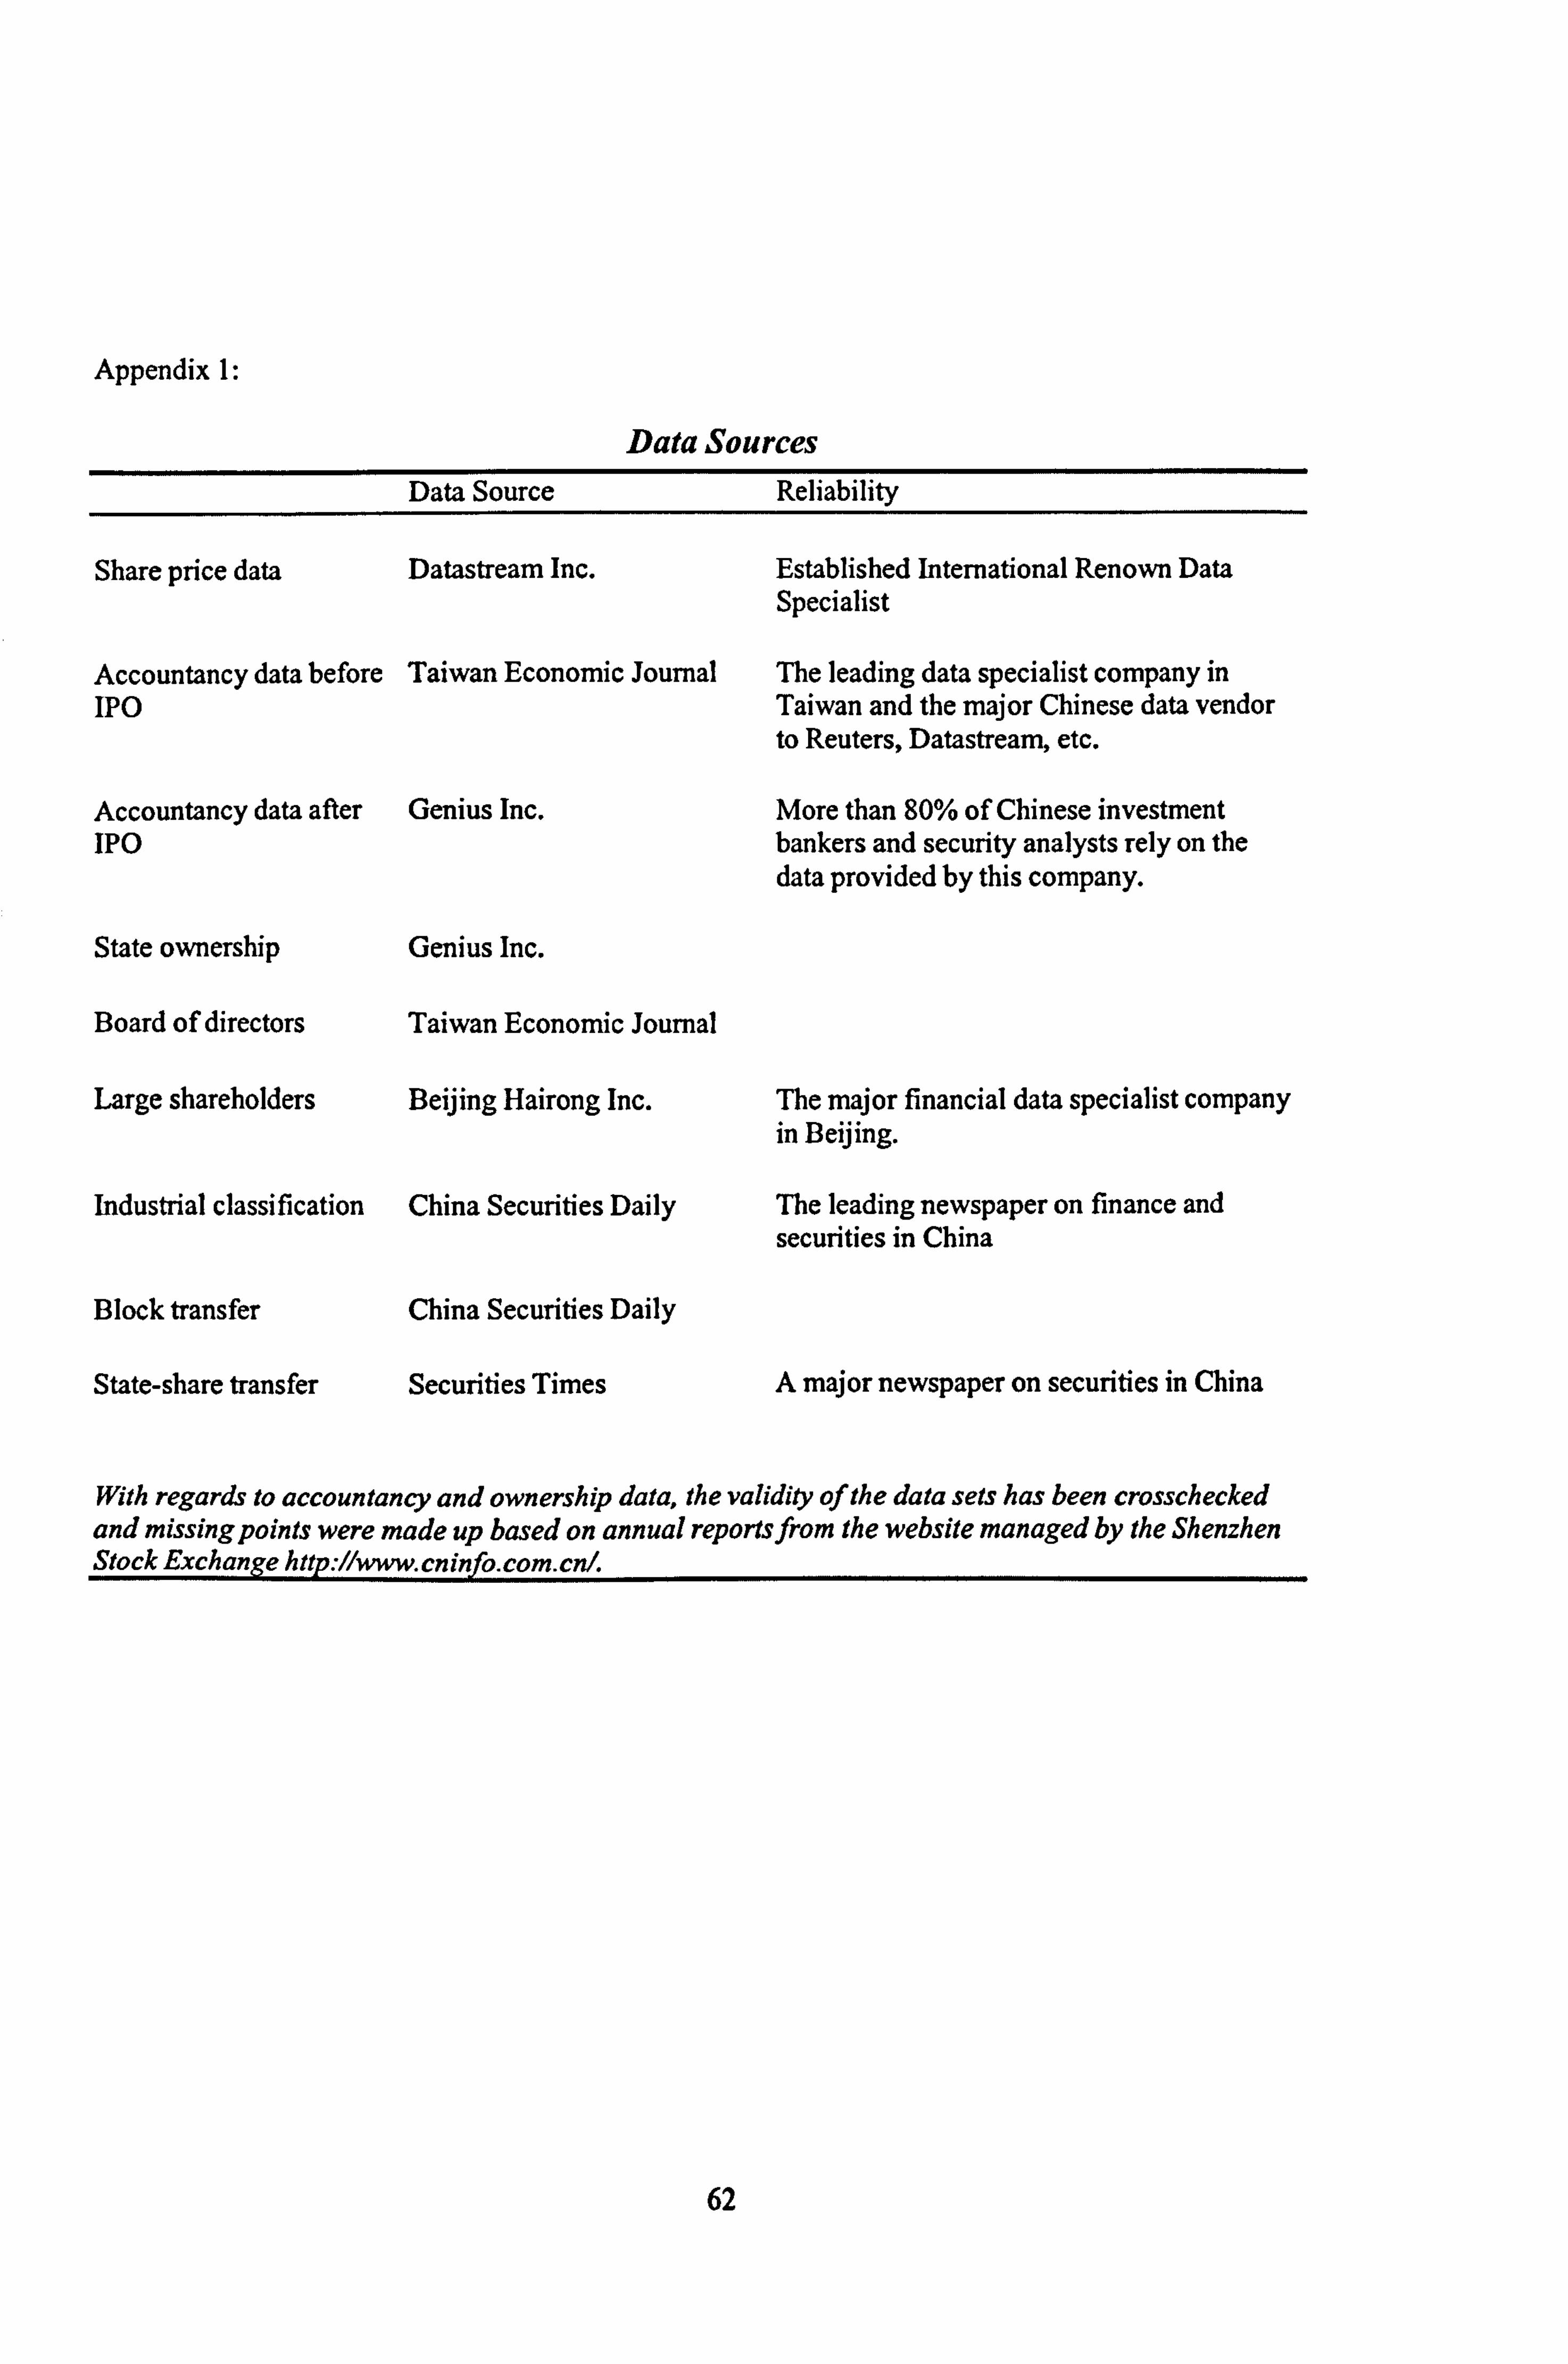
Appendix 1:
Data Sources Data Source Reliability
Share price data Datastrearn Inc. Established International Renown Data Specialist
Accountancy data before Taiwan Economic Journal The leading data specialist company in NO Taiwan and the major Chinese data vendor
to Reuters, Datastream, etc.
Accountancy data after Genius Inc. More than 80% of Chinese investment TPO bankers and security analysts rely on the
data provided by this company.
State ownership Genius Inc.
Board of directors Taiwan Economic Journal
Large shareholders Beijing Hairong Inc. The major financial data specialist company in Beijing.
Industrial classification China Securities Daily The leading newspaper on finance and securities in China
Block transfer China Securities Daily
State-share transfer Securities Times A major newspaper on securities in China
With regards to accountancy and ownership data, the validity of the data sets has been crosschecked and missingpoints were made up based on annual reportsfrom the website managed by the Shenzhen Stock Exchange http: //ýww. cnplýý. com. cnl.
62

Appendix 2
Shanghai State Asset Management System
This chart illustrates the organizational form of the Shanghai State Asset Management System.
The arrows represent the control, which can be implemented by nominating or appointing the
crucial official in this pyramid. The state asset management system also covers state
shareholdings. As a general rule, agencies with direct control responsible for specific public listed
companies can be numerous, but this organizational chart shows that the control of the
government and ultimately the Communist Party on these numerous agencies is considerable.
I Shanghai Municipal Government Mayor I
State Asset Committee Mayor+ >30 Heads of Municipal Agencies
I Central Government I
I State Asset Management Office I
State Asset Operating Companies (Holding Companies)
State Asset Group Companies (Fortner Bureau)
State Shares
I Operating Entities I I Operating Entities I
State Shares
I Operating Entities I
63

Chapter 2:
Debt Governance, Bank Capture, and Soft Budget Constraints
64

iL. Introduction
Corporate capital structure is an instrument of corporate governance, and financial
disciplines are crucial to corporate performance. 34 Jensen and Meckling (1976) and
Dewatripont and Tirole (1994) argue that debt keeps a tight rein on managerial agency
costs. The governance role of debt comes from the threat of bankruptcy (Aghion and
Bolton 1992), the reduction of free cash flows (Jensen 1986), and due diligence
monitoring by creditors (Diamond 1984).
Finance theories are developed in the western economies. In the former
communist economies, Kornai (1980) observes the stylized fact of soft budget constraints,
under which the lack of bankruptcy enforcement brings about the problem of bad loans.
This phenomenon also exists in other new and emerging markets. However, so far, this
essential economic institution is largely ignored by the mainstream finance literature. It
remains a question what role debt serves in corporate governance under soft budget
constraints.
The public listed companies (PLCs) in China provide a laboratory in which to
study this question. Moving towards a mixed economy, the Chinese government
restructures state-owned enterprises into joint stock companies that have more than one
owner and lists the "star" companies on its emerging stock market. Meanwhile, the
government ownership of firms and banks is widespread. As political interests intervene
34 This view is accepted by practitioners. For instance, Financial Times quoted Jonathan Meggs, a partner of JP Morgan, "... leverage is a financial discipline" on June 10,2001.
65

with commercial decisions, government ownership holds back the enforcement of
bankruptcy and the budget constraints of China's modem firms are soft.
There are some theoretically surprising but institutionally intuitional findings
within my Chinese PLCs' panel data set. An increase in financial leverage increases the
size of managerial perquisites and free cash flows. The relation between debt levels and
board-member turnovers is not statistically significant. These findings suggest that debt
governance does not function in China; on the contrary, debt encourages managerial
agency costs. Bank loans expand the resources under the control of the managers and so
facilitate managerial agency costs. I further find that the facilitator role of debt on
managerial agency costs is more significant in the government-controlled companies, but
it becomes much less serious in the commercial-entity-controlled companies. Debt does
provide a role of governance in cntrepreneurs-controlled firms. The source of
dysfunctional debt governance is the soft budget constraints that arise from government
ownership.
Soft budget constraints are intrinsic in the businesses of the state. When the
government plays a major role in the business, the budget constraints become soft and
consequently, debt governance stops functioning. Because the Chinese government has a
widespread business empire, the Chinese corporate governance problem is more
profound than that of East Asian firms before crisis, although the closed Chinese capital
market escaped the brunt of the 1997 Asia financial meltdown. With integration into the
global market, the peculiar relation between debt and managerial agency costs
documented in this chapter could eventually engulf China in a financial crisis. There is a
Sword of Damocles looming over the future of this emerging economy.
66

I organize this chapter as follows. Section 2 describes the institutional background
of China's modem firms and reviews the literature on capital structure and soft budget
constraints. Section 3 develops the conceptual framework and presents the competing
hypotheses. Section 4 describes the data and presents the univariate analysis. Section 5
presents the empirical findings of the multivariate regressions. Section 6 discusses the
relation between debt and managerial agency costs. I conclude this chapter in Section 7.
2. China's Modern Firms and Financial Institutions
China has a bank-dominated financial system, 35 but the stock market has been growing
very fast in the last decade. This section introduces China's modem firms, its stock
market and its banking sector. The institution of soft budget constraints, which causes the
problem of bad loans, has not changed fundamentally.
2.1 China's Modem Firrns
Since 1978, China has gradually transformed from the centrally planned system to
a market oriented economy, as well as having undergone a massive corporate
restructuring. Starting from 1993, the government promoted the "modem enterprise
system" to restructure the state-owned enterprises to be joint stock companies. 36 The
financial structure of these modem firms is illustrated in the following chart.
35 Total loans reached US$ 1.1 trillion and the ratio of loans to GDP exceeds 100% (Merrill Lynch, 2000). 36 According to China's Communist Party Congress in 1993, the modem enterprises are defined as "clarified property rights, clearly defined responsibility and authority, separation of enterprises from the government administration and scientific internal managernent".
67

Simplified Financial Structure of China's Modern Firms
Assets Liabilities
Productive capital Debt owed to the government- controlled banks
Equity in the firms owned by the government, institutions and households
The ownership of these firms is clarified. They have more than one owner. The
government is a large block shareholder, but there arc no golden shares. 37 The
government asset management companies and other agents of the government hold the
shares and report to a special branch of the government-the Bureau of State Asset
Administration. The controlling rights of the government shareholder are dependent on
the sizes of government shareholding.
These companies also use debt financing. So far, there is no domestic market for
corporate bonds in China yet. Except for temporary financing from enterprise arrears or
trade credits, the major liabilities of these companies are bank loans. The banks are
forbidden to own shares of a company. 38
" Golden shares are shares with control restrictions, normally the veto right to major strategic decisions. 3g This rule came into effect in 1995, but it does not require a bank to sell out its shares in a firm purchased before 1995.
68

Table 1: Financial Leverages
The table reports the means, standard deviations, and medians of the proxies of capital structures for my sample of companies listed on either the Shanghai Securities Exchange or the Shenzhen Stock Exchange. The leverage ratios are based on the accounting reports. Panel 1 reports the leverage ratios of two samples: total firms and the firm listed in the year 1992 that excluding the noise brought by newly-listed firms each year. Panel B reports the aggregated numbers compared with other countries. The figures for the United States, United Kingdom, Japan, and Germany are from Rajan and Zingales (1995). The figures for South Korea, India, Turkey, Brazil, and Mexico are from Booth et aL (200 1).
Panel 1: Leveraae Ratios In China's PLCs from 1994 to 1998 1994 1995 1996 1997 1998 Total
Liability to Total Assets All Firms 287 311 517 719 826
mean 0.413 0.461 0.445 0.417 0.422 0.429 median 0.412 0.458 0.455 0.415 0.416 0.424
Firms Listed in the Same Year 1992 39 39 39 39 39 mean 0.437 0.477 0.482 0.495 0.546 0.487 median 0.445 0.489 0.494 0.497 0.503 0.484
Bank Loans to Total Assets All Firms 287 311 517 719 826
mean 0.205 0.225 0.224 0.212 0.215 0.216 median 0.193 0.212 0.216 0.201 0.206 0.206
Firms Listed in the Same Year 1992 39 39 39 39 39 mean 0.211 0.239 0.252 0.268 0.287 0.251 median 0.233 0.235 0.243 0.261 0.265 0.243
Bank Loans to Capital All Firms 287 311 517 719 826
mean 0.457 0.481 0.475 0.454 0.453 0.461 median 0.471 0.499 0.498 0.475 0.467 0.479
Firms Listed in the Same Year 1992 39 39 39 39 39 mean 0.610 0.615 0.634 0.649 0.675 0.636 median 0.641 0.633 0.630 0.651 0.652 0.640
Observations 287 311 517 719 826 2660
Panel 2: International Comparison
No. of Firms Time Period Nonequity Liabilities to Total Assets
Debt to Total Assets
Debt to Capital
China 287-826 1994-1998 0.43 0.22 0.46 United States 2580 1991 0.58 0.27 0.37 United Kingdom 608 1991 0.56 0.24 0.34 Germany 191 1991 0.76 0.16 0.39 Japan 514 1991 0.75 0.42 0.63 South Korea 49 1985-1991 0.30 India 99 1980-1990 0.67 Turkey 45 1983-1990 0.59 Brazil 49 1985-1991 0.30 Mexico 99 1984-1990 0.34
69
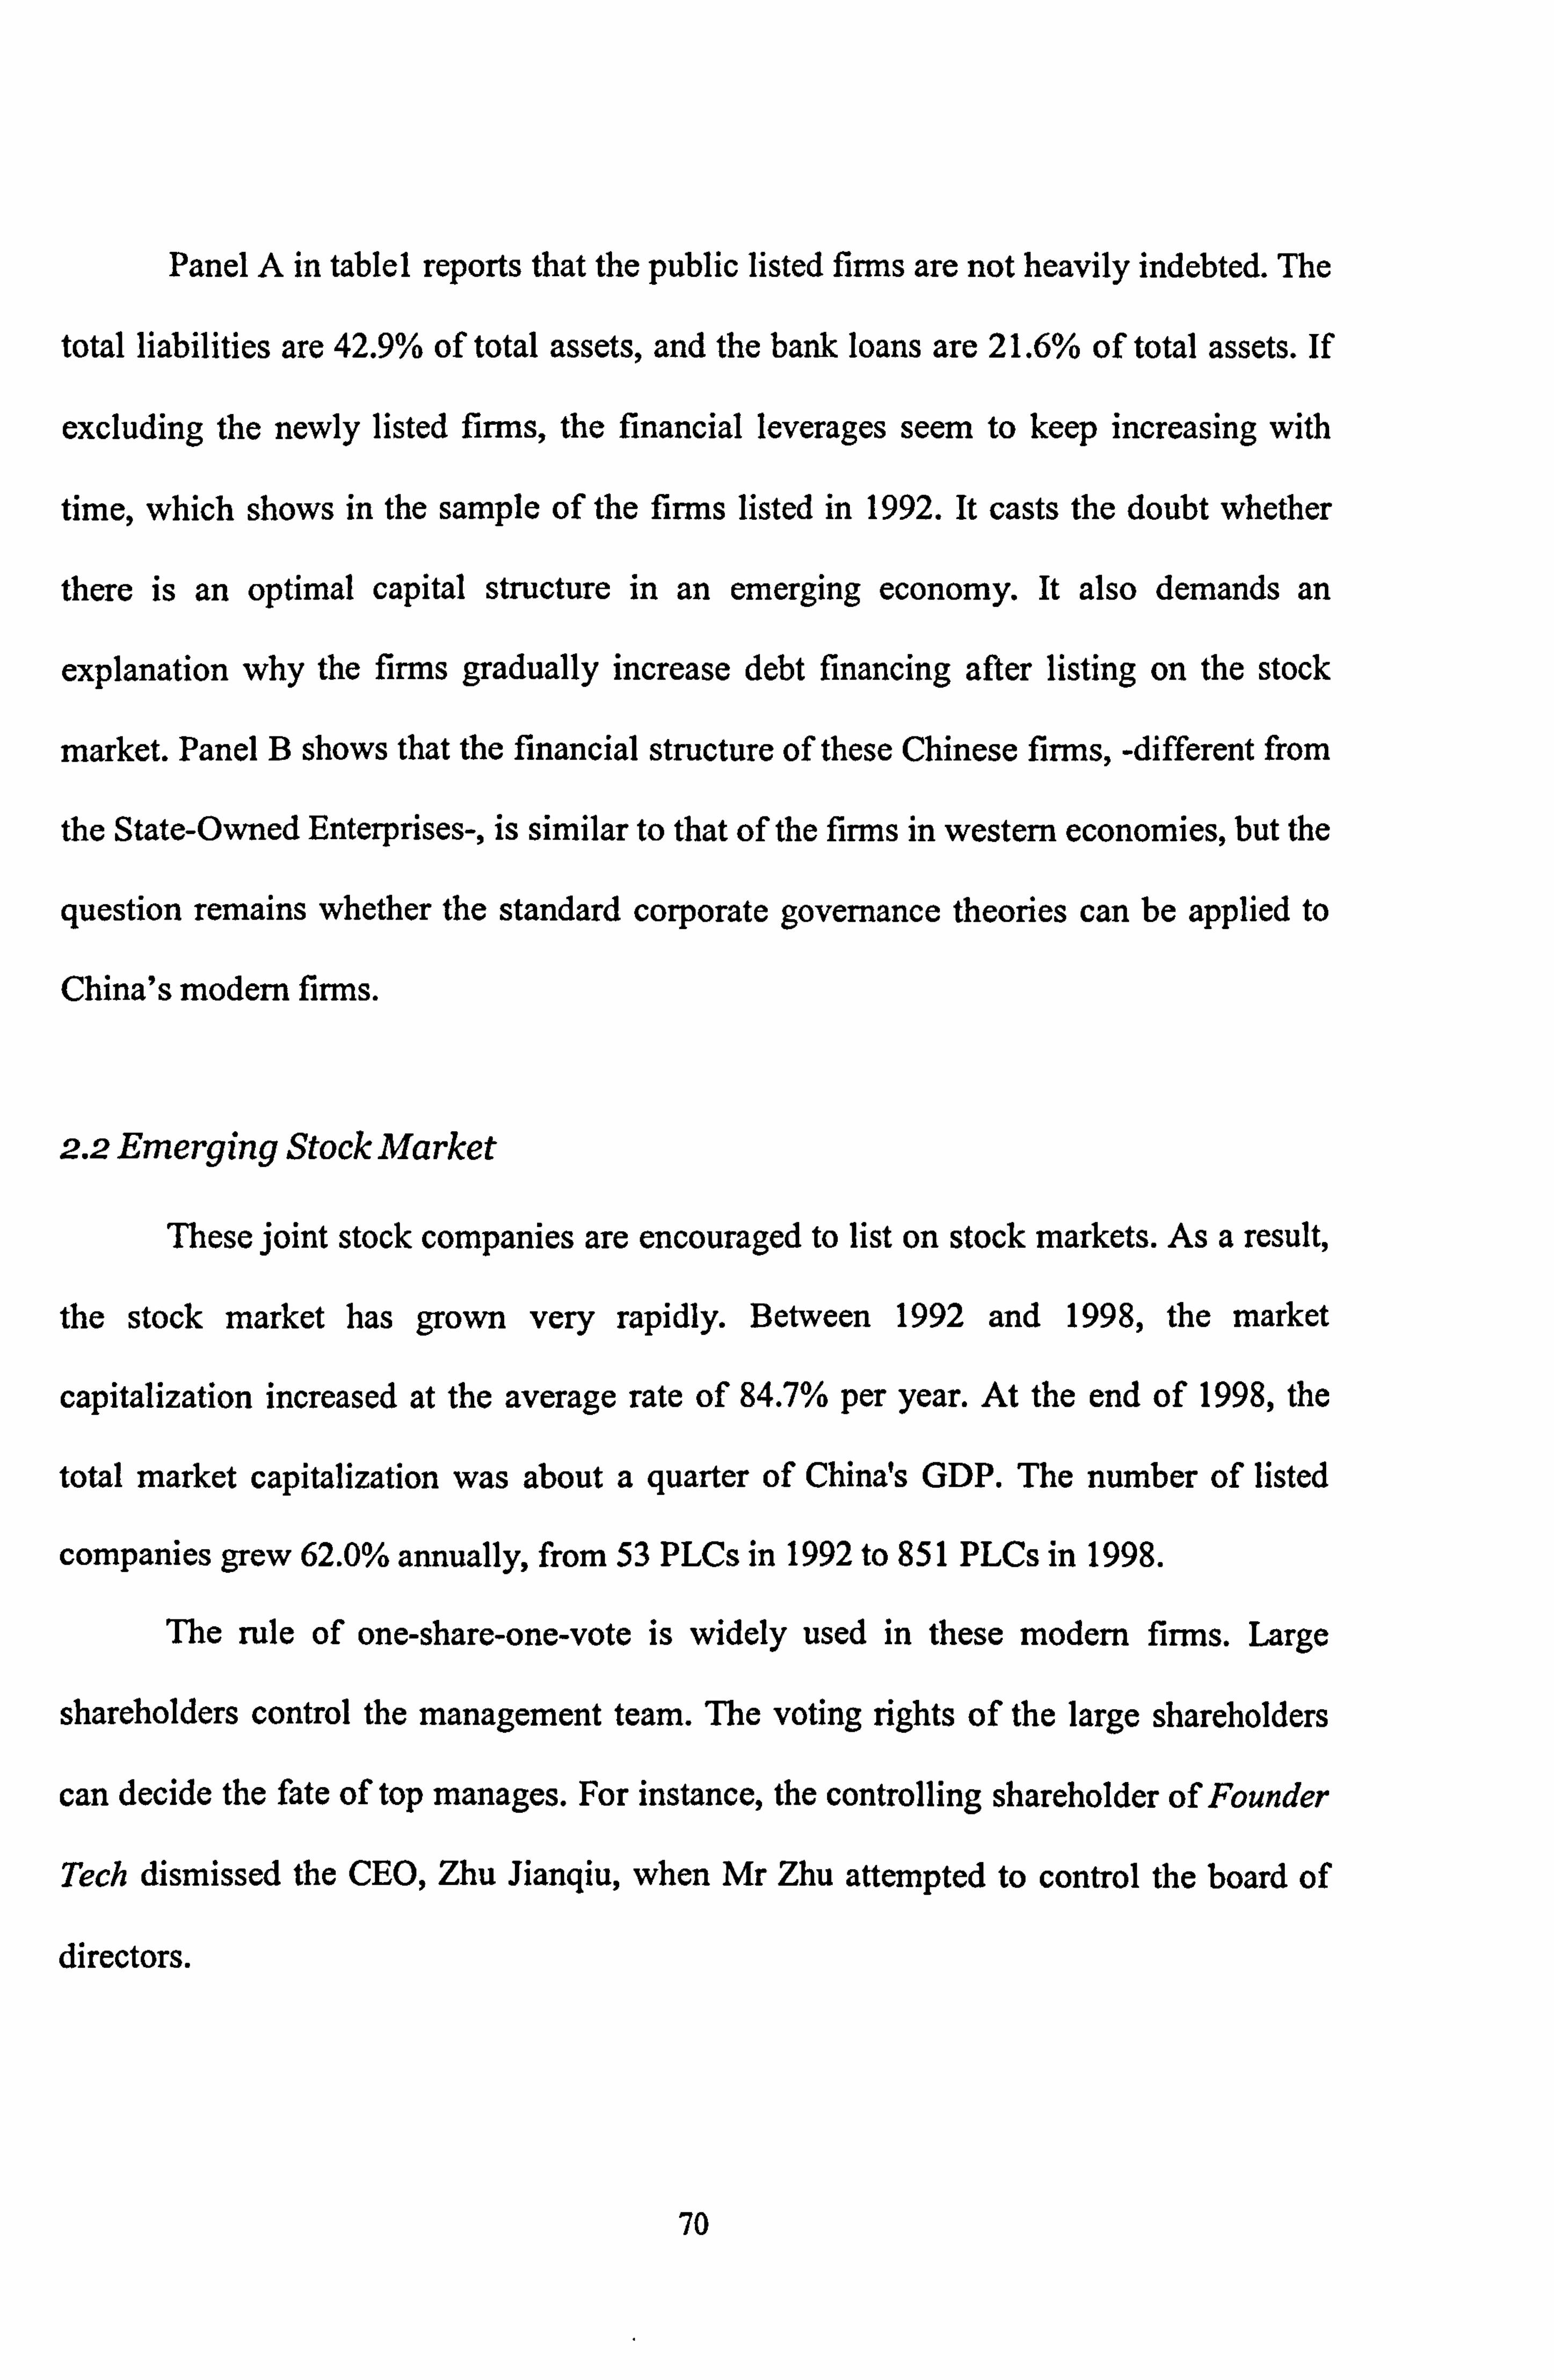
Panel A in tablel reports that the public listed firms are not heavily indebted. The
total liabilities are 42.9% of total assets, and the bank loans are 21.6% of total assets. If
excluding the newly listed firms, the financial leverages seem to keep increasing with
time, which shows in the sample of the firms listed in 1992. It casts the doubt whether
there is an optimal capital structure in an emerging economy. It also demands an
explanation why the firms gradually increase debt financing after listing on the stock
market. Panel B shows that the financial structure of these Chinese firms, -different from
the State-Owned Enterprises-, is similar to that of the firms in western economies, but the
question remains whether the standard corporate governance theories can be applied to
China's modem firms.
2.2 Emerging Stock Market
These joint stock companies are encouraged to list on stock markets. As a result,
the stock market has grown very rapidly. Between 1992 and 1998, the market
capitalization increased at the average rate of 84.7% per year. At the end of 1998, the
total market capitalization was about a quarter of China's GDP. The number of listed
companies grew 62.0% annually, from 53 PLCs in 1992 to 851 PLCs in 1998.
The rule of one-share-one-vote is widely used in these modem firms. Large
shareholders control the management team. The voting rights of the large shareholders
can decide the fate of top manages. For instance, the controlling shareholder of Founder
Tech dismissed the CEO, Zhu Jianqiu, when Mr Zhu attempted to control the board of
directors.
70

There are frequent mergers and acquisitions in SSE and SZSE. The Boston
Consultancy Group ranked China the third largest merger and acquisition market in
Asia, 39 although the hostile takeovers are relatively rare. The transfer of state shares and
legal person shares is undertaken as block transfers over the counter. After a merger or an
acquisition, the shareholders often reshuffle the directors and top managers.
The internal governance of the board of directors and the external governance of
the market for corporate control function in China. However, there is still no formal code
of bankruptcy. There is only reluctant enforcement of the trial code of Bankruptcy Law. 40
This incomplete legal infrastructure is due to the social pressures of unemployment and
the ideology of communisms. Very few large firms have been liquidated and no PLCs
have gone into bankruptcy until very recently. 41 The budget constraints on these modem
firms are soft.
2.3 Banking Sector and Non-Performing Loans
Debt finance for China's modem firms comes from 40,000 financial institutions
in China. However, the banking industry is dominated by the four fully state-owned
commercial banks (the "Big Four"), which provide more than 80% of all corporate loans.
Under the Commercial Banking Law of 1995, these banks should manage credit risks and
"' The Southern Metropolitan Newspaper quoted Jim Hemerling, a Vice President of Boston Consultancy Group, on September 7h, 2001. ' The Enterprises Bankruptcy Law was legislated in 1986, which is only a trial version and the formal version is still under discussion. It entitles the government owner to the right of a two-year restructuring period for enterprises that are in default before liquidation. It assigns top priority to pension and other welfare obligations. Employees' claims on their salaries and other welfares receive priority over debt creditors during liquidation. 41 In 2001, the Huarong Asset Management Company and other two creditors requested the Hubei Supreme Court to liquidate the Monkey King PLC. It is expected to be the first bankruptcy case of a public listed company.
71

pursue profits, but Lardy (1998) argues that reform in China has so far done little to
improve the allocation and use of bank capital.
Because the government is the sole owner of these four banks, it still exerts great
influence over the commercial banking sector through its ownership rights. Under the
administration of the government, the central bank also attempts to compel commercial
banks to issue the policy loans. 42 For example, in 1998 the central bank issued a guideline
to commercial banks indicating that they should guarantee reasonable funds to state-
owned enterprises (Hanli Consultancy Ltd, 1998). Because of the career concerns of
bankers, the government-owned commercial banks closely follow the direction of the
central bank and the government. And because of unemployment pressure, the
government has few incentives to see its loss-making firms liquidated. However, the
government can ensure that its firms have a steady source of capital through the banks
owned by the government. It thus reduces the incentives for the banks to monitor the
firms. On the other hand, firm managers can hold up the government's political interests
to force the banks to lend as much as the banks can afford. When a loan is due, the firms
make new loans, thus rolling over the old loans. Soft budget constraints inevitably induce
badloans.
42 Compared with central banks in western economies, PBC is assigned a larger power in regulating financial institutions. For example, it sets the lending rate. Commercial banks are allowed to vary the centrally governed rates by only 10% for lending to large-sized enterprises, and up to 30% for other enterprises.
72

Table 2: Bad Loans
This table describes the severity of problem loans in China. Part A summarizes some studies to estimate the size of bad loans among total loans, and the cost to clean up the bad loans. Part B cites a research report by UBS Warburg and presents the table of total bad loans (in billions of Chinese RMB). Part C cites a research report from Merrill Lynch and compares the problem of China with the rest of the Asian countries.
Part A: Summary of Studies on Problem Loans in China Study Period Estimate
Problem loans (as percentage of outstanding loans) LI (1998) End of 1996 24.4%
Mid-1997 29.2% CCER (1998) 1997 24.0% Fan (1999) 1997 26.1%
1998 28.3% Dal Xianglong (2001, interview with FT) 2001 28.0%
Clean up costs (as percentage of GDP) Moody 1999 18.8% Dornbusch and Givazzi (1999) 1999 25.0% Standard and Poor 2001 50.0%
Part B: UBS Warburg Estimation of Non-Performing Loans of Individual Banks (2001)
Rrnb bn CC13 ICBC ABC Wars Total Total loans 1,386.3 1,543.1 958A 1,238.5 5,124.3 Estimated Gmis NPL 443.6 540.1 383.4 356.1 1,723.2 Gron NPL ratio (%) 32% 35% 40% 28A% 34%
ChIrtaConstruclion Bank (CCBY, InclushialMmmercial Bank of China (ICBCý Agriculure Bank of China (ABC) Source: One dat&awned bank's 20DO annual report UBS Warburg esft*, s
Part C: Merrill Lynch Estimation of the Cleaning Up Cost (2001) 609L -
49% -
30%.
2VJL -
los-
V%. ' ains kda Indonesia Ablayis Phdippines Soulh Kare s Thailmnd
73

Table 2 of Chapter 2 in the following page provides an overview of the severity of
the bad-loan problem in China. In an interview with the Financial Times, the governor of
China's central bank admits that nonperforming loans at the Big Four come to about 25%
of total loans. Some academic papers estimate the rate at about 40% and Standard & Poor
provides a figure of 50%. Some banks are technically insolvent, since the nonperforming
loans are even larger than net assets, but with the ultimate backing of the government, the
trust of depositors remains.
These bad loans are not a legacy of the former planned economy, but they started
to accumulate during the reform period. That is, there is a momentum to increase the size
of bad loans, which could eventually lead to a collapse of China's economy. 43
3- Capital Structure and Soft Budget Constraints
Surveying classical corporate finance literature, I define the term managerial agency costs,
present the three dimensions of debt governance, clarify the concept of soft budget
constraints, and develop theoretical hypotheses for empirical testing. My framework of
the role of debt in managerial agency costs is presented in the chart of the following page.
43 In fact, the Chinese economy suffers from many of the same debilitating structural problems that long plagued to Korea, Thailand, Malaysia, and Indonesia, including the fragile bank-dominated financial systems, poor prudential surveillance, weak central bank regulation, and a largely state-owned financial sector that is almost insolvent. China emerged unscathed from the Asian financial crisis because of its control of foreign exchanges on capital accounts. However, this Pandora's Box has to be opened with the deepening reform and as China integrates into the world economy. This study of debt governance sheds lights on whether China is sliding into a financial crisis (Lardy 1998) and on how China can avoid a potential crisis.
74

3.1 Managerial Agency Cost
In a joint stock company where ownership and control are separate, agency costs
arise. The agents behave so as to maximize their own interests rather than the interests of
their principals. Agency costs induced by the managers include managerial slackness,
risk aversion, and exploitation of the firm. This chapter discusses managerial agency
costs with three dimensions: excessive perks, empire building, and entrenchment.
3.2 Debt Govemance
Corporate governance is a set of mechanisms designed to control managerial
agency costs. Debt is an instrument of corporate governance. Debt governance functions
by acting as a threat to sack incumbent managers under financial distress. As for going
concerns, debt forces out free cash flows and encourages due diligence monitoring
activities.
75

0
2 U
() rfl
0
0 I-.
I 10 r-
4) 0
0 Ew 0
.e Ici
E Ln a E (D (a M
CO
46
U) E
:3E CIS (D = > 0
0
co it:: .0 0
CL
co = E LU
(1). s m LL z (D
E E 0 CL 0
0 E cc -1 co 0 0)
a a- (a CL x CD -ý3 m
M LLI r- co ui
(D CL
rn
J3 a) 13
N
tl--" t0

First, a high financial leverage is associated with a high probability of financial
distress which causes managerial replacement. Aghion and Bolton (1992) model the shift
of control to debt holders when profits are low. Gilson (1990) shows that creditors take
over the dominant role in disciplining the managers when firms are in financial distress.
The empowered creditors tend to replace incumbent managers that were assigned by the
shareholders. 44 On the other hand, debt plays a role in pre-committing the shareholders to
penalize the managers for their value destroying exploitation, because the shift of control
to creditors drives out the private benefits of the controlling shareholder. Debt also has an
incentive effect on shareholders' monitoring efforts. With a sample of British firms,
Franks et aL (2002) find that the turnovers of board-members is higher when the financial
leverages are higher. 45
Secondly, Grossman and Hart (1982) and Jensen (1986) argues that debt carves
out free cash flows and reduces managerial agency costs. Free cash flow is cash flow that
remains after the firm has completed its positive net present value (NPV) projects. Under
the separation of ownership and control, the managers are reluctant to pay out cash flows
to shareholders, but prone to overexpanding corporate operations and to "empire-
building". Debt functions to force out cash flows to repay interest and loan principal.
Moreover, debt holders can impose rules and restrictions on management through an
indenture and the availability of remedies for breach thereunder. The debenture caveats
44 If laid off due to exploiting corporate wealth, the managers are punished with the reputation effect in the managerial labor market (Fama and Jensen 1983a, b). 45 Harris and Raviv (1988) and Stulz (1988) argue that with an increase of leverages, the voting rights of outsiders are reduced and the voting rights of the insiders increase. The managers are therefore prone to entrenchment. However, the average voting rights of the management teams in China's PLCs were as small as 0.005% of the total shares. The Stulz leverage impact is not expected to be influential in the Chinese context. Therefore, the classical corporate finance theory should follow the governance hypothesis. Friend and Lang (1988) and Berger et A (1997) provide empirical evidence that financial leverages are negatively correlated to managerial entrenchment in developed economies.
77

of loans restrict the over expansion of corporate operation. By containing the propensity
for overinvestment, debt improves corporate value. McConnell and Servaes (1995) find
that firm leverage is positively correlated with firm value when a firm's growth
opportunities are scarce.
Thirdly, the theory of financial intennediation argues that banks have incentives
to collect information and monitor firms to ensure the returns to the depositors (e. g.,
Diamond 1984). Bankers' specialized knowledge helps to reduce asymmetric information.
Moreover, typical bank loans are short tenn. When bank loans are renewed, the bank
actively investigates corporate quality and evaluates the investment risk (Shleifer and
Vishny 1997). If there are excessive managerial perks, banks tend to reject additional
funding. Consequently, it signals to the market the quality of firm management and may
trigger a disciplinary action from equity holders on the managers. Harris and Raviv (1990)
model the informational role of debt. Debt financing therefore improves corporate
performance by inducing due diligence monitoring by creditors.
In summary, classical corporate finance theories argue that high leverages reduce
managerial agency costs and strengthen corporate governance (e. g., Jensen and Meckling
1976, and Harris and Raviv 1991). Kaplan (1989) find that a high financial leverage
coming with leveraged buyouts has a positive effect on corporate performance.
3.3 Soft Budget Constraints
Ile classical corporate finance theories on debt governance take hard budget
constraints as granted. However, Kornai (1980) observes that the finns in fonner planned
78

economies face the soft budget constraints. 46 1 define the soft budget constraints as the
perceived re-negotiability of debts under political interference. This concept of soft
budget constraints is a strong form of the Dewatripont-Maskin concept (1995). Political
benefits are also a rationale for refinancing loss-makers. Under soft budget constraints,
the firms in default expect refinancing instead of bankruptcy. Contract fulfillment is
therefore dependent on bargaining. Political pressures from the government also soften
the budget constraints imposed by banks.
Under soft budget constraints, debt governance becomes weak. The shift of
control from shareholders to creditors is blocked by political interference. If the
government is the controlling shareholder, it tends to retain its control by exerting
pressure on creditors. Without the threat of the shift of control dejure, the managers in de
facto control are not concerned with the dissatisfaction of the creditors. The agent who
represents the government has little concern for the loss of private benefits, since there is
no shift of control from shareholders to creditors. Bankers' disapproval does not trigger
the disciplinary action from shareholders in this setting.
A going concern normally pays back its interest and loan principal, but it does not
necessarily lead to the conclusion that debt forces out the cash flows. On the flip side,
bank lending injects capital into firms. If the credit is soft, the firm keeps making new
loans to pay back old loans. Meanwhile, the managers can use bank capital to expand
corporate operations. Empire building is thus promoted by debt under soft budget
46 Dewatripont and Maskin (1995) show that when creditors have limited information on the future return of an investment and cannot commit to terminating ex post unprofitable projects, there is a soft-budget- constraint problem. The sunk costs of initial financing provide creditors the incentive to continue their finance, even when the firm cannot pay back some interest and loans. This holdup problem is universal.
79
constraints. Bankers actually hand out cash to the managers without the governance
implication
The creditors pressured by the government have no incentive to monitor debtors
and how the credit is used. It is the pressure of the government that imposes the soft
budget constraints on creditors. The bankers' incentive to undertake due diligence
monitoring on corporate business operations is diminished under bureaucratic
coordination of economic activities.
The theory of soft budget constraints therefore predicts that debt cannot reduce
managerial agency costs. On the contrary, it may facilitate managerial exploitation. When
banks renegotiate with firms and allow the rollover under political pressure, managerial
agency costs are exacerbated. This argument is consistent with the theory of politicians
and the firm (Shleifer and Vishny 1994). In fact, World Bank (2000) argues that the East
Asian financial crisis in 1997 partly comes from dysfunctional debt governance.
3.4 Hypotheses
Based on the framework presented in Chart 2 and the above discussion, the
following contradictory hypotheses are developed:
Hypothesis CF. - Higher leverage constrains managerial agency costs.
This corporate finance hypothesis of debt governance can be stated as being that
there is a negative relation between financial leverage and the scale of managerial perks,
a positive relation between financial leverage and the possibility of an over-investment
problem, and a negative relation between financial leverage and the magnitude of a
managerial entrenchment problem. All else equal, managerial agency costs result in low
80

efficiency and drives down the value of the firm. 47 Tben, it should be projected that
higher leverage is associated with higher efficiency and higher corporate value.
Hypothesis SBC. - Higher leveragefacilitates managerial agency costs.
In contrast to classical corporate finance theories, the theory of soft budget
constraints suggests that bank loans do not constrain managerial agency costs, which is
the alternative hypothesis to Hypothesis CF. A higher leverage is associated with larger
managerial perks and a more serious problem of over-investment. Since the soft budget
constraints come from political pressures, Hypothesis SBC further suggests that the
facilitator role of debt is stronger if the firms are more closely affiliated with the
govemment.
4. Data Samples, Proxies and Univariate AnalYsis
Based on the 1994-1998 annual reports and share performance of all Chinese PLCs, a
new data set is assembled (Appendix 1). This section describes the data and provides the
univariate analysis of the governance role of debt.
47 Managerial exploitation damages corporate value. That is, in a large sample of firms in a semi-strong efficient stock market, corporate value carries information on the magnitude of managerial exploitation. If debt provides governance, a highly leveraged firm should be valued high, cewls paribus, as a higher financial leverage reduces further the magnitude of managerial exploitation. In addition, Ang el aL (2000) suggest that corporate efficiency also reflects the scale of agency costs within a firm.
81

4.1 Ownership Cluster
Tian (2000) argues that state shareholding is a main feature of China's public
listed companies. Kornai (1992) argues that the softness of budget constraints depends on
ownership, and state ownership is a fundamental cause of soft budget constraints.
Relatively speaking, state owned enterprises face the softest budget constraints; the
collective enterprises face less soft budget constraints and the private enterprises face
hard budget constraints. Therefore clustering samples by ownership is a way to examine
the relation between soft budget constraints and debt governance.
In descriptive statistics, I group the firms into four clusters: 1) the dispersed
shareholding structure in which the largest shareholder holds less than 30% of total
shares; 2) the state-controlled shareholding structure in which the government
shareholder holds more than 30%; 3) the institutional-shareholder-controlled
shareholding structure in which the non-government institutional shareholder holds more
than 30%; and 4) the entrepreneur-led shareholding structure in which an entrepreneur
founds and leads the firm. The 30% cut-off threshold is based on a CSRC regulation that
names 30% as the relative control threshold. Whilst this threshold is arbitrary, my results
do not change when I try other cut-off points.
In the regression analysis of Section 5,1 further group the finns into three clusters
to compare the coefficients of the independent variable: 1) firms under the control of the
government shareholder, 2) firms that the government has a significant shareholding
stake but not stays in control, and 3) firms under the control of an entrepreneur. In the
reported tables, I adopt 40% as the controlling stake, which is based on the turning point
of the U-shaped relation between the size of government shareholding and corporate
82

value, documented in Chapter 1. When the government holds more than 10%, the
government is a significant shareholder. This further classification of the firms with
government ownership is to examine the consistence of this chapter with chapter 1. My
qualitative conclusions derived from the quantitative findings do not vary on the choice
of thresholds. This classification helps to examine the effect of government ownership in
the relation between agency costs and bank loans.
4.2 Financial Leverages
Since there is not an active domestic corporate bond market in China and trade
credits for transaction purposes do not contribute significantly to corporate governance,
debt governance is the governance based on bank loans. My main measure of financial
leverage is therefore the ratio of the amount of bank loans to total assets. This ratio shows
the liability of the firm, suggests the probability of financial distress, and approximates
the influence of bankers in corporate management. A high gearing ratio in the firm
should trigger a prudent lending policy by its banks and a stronger governance effect of
bank monitoring. I also examined other forrns of gearing ratios, but my basic conclusion
does not vary with different forms of gearing ratios.
To examine whether there is a distribution pattern of managerial agency costs on
financial leverage, I group the firms into three clusters: low-debt firms whose financial
leverage is below 10%; middle-debt firms with the leverage between 10% and 30%; and
high-debt firms with leverage above 30%.
83

4.3 Managerial Perks
Managerial perks are the hidden income for management teams. In fact, such
perks represent the main income for Chinese managers, since the average nominal annual
salary of the general managers is only $4,667.48 It is a normal practice for a firm to pay
for the phone, taxi and dinner bills of the senior managers' family members.
Most perquisites for managers are not explicitly reported in the annual reports
formulated by the CSRC, but they inflate the accounting item of administration cost.
Administration cost records the administration expenditure in organizing and managing
corporate operation. It includes the expenses of the top management team and the
administrative staff and the cost that should be born by the company as a whole, such as
corporate cars, traveling expenses, entertainment expenses and other service bills. Among
the data reported in the annual report, the item of administration cost serves as the best
indicator of managerial perks. I normalize the administration costs by sales, which
controls for both size and operation effects. The quantitative difference among the
administration cost ratios in different firms approximates the degree of perks taken by the
managers.
48 Wang (1998) shows the annual income of the general managers of 146 PLCs on the Shanghai Stock Exchange was only RMB 38,650 in 1997, although there are some cases of high bonuses for management teams.
84

cu M :i ýC, 0 *. = ee - r- 0) -: ý 4) ce u .
52 rn cn 0=0X -u ý, tz 1.1 9) -- . - ýUbZ 0) Z -- C, 0.
0 C) ýB-
ci i-. . --r. = KA 2 "m
- tu ýD m
0 ID 0)
Ei g- r- % 'm ev )- , :i Ce 0
, Q) ,M=
r. öz >0, u
r. 1-1 -x'- tu .. N. r-
X' os, -wýQ, -
c, b rn -. r-
12 --
ýe '0 LZ- 0
1-- 0 ýe 1. Z= 4) z3 -. "0 -=0ý. uu
- tu 00- 4j, -0- ýo 4. -
-8 2 Eý -e ýý 0-=4, 4. 0
e :j0 00e0 CD (U
,n i-- (D �. p b) in P- E (D 0
0"
0 >0
9: C
0 ýN A J., ' -0 0> 30
to 00 ZJ r. -j-, "0 0 1-- ce 9 >, - E- eý 0ý eý CU A.,
(U ", 2 t> 0= -CJ .- e, u -i-. -eeM to "0 > b. C. ) zi tn ). (A
0 zi A c) cu
CU *8 0 0 CL 2 .-e .- *J-- 'ö 10 o-m cm - A-- 2 tj 9 *Z: -, 0 in 220ý: -4-5 m ;2 -0 b) (U
.Z0 A-- rA 0 IV 0 11) 1-- 2 fi 2e
-r-- r. Q "s *. F, 0 1-- - = CU w i-. u >% » (D :i cu 0" 32
(A 0 . 42 l'- 0 .-02== )- c) 4) , "ö =
Lz r. -ci ý- ' LZ ;Z 4)
. ý2 -0 M. - ce
-0 > ,29
41 AM-
ý. 12 -b ýa -2 -a 2 04 . - 0u", j . 1,0 w ý: k.
n". 0ým 0
9 Ei -. ,2g c> :2 ý4 0 .. 10 tn in -zi ýr >ý 0 =W 4) 0 (A u
-v ZJ Z "9, j, ti MI JM -, e .00-, 4 *, -.
E0ä0 -ýý 'lý ou 0 oe P4 r. . -- jm
Pee -ci -r- .. e c", l, ' u ý, 'CJ 4=4-
00.0 tu 10 (n t) 12
JA !eEgEM03029 cn ý<-22
tý. u gl. E t) U. C. 0u06M Z5 E LA "0 1. ZZ-
e2 C) LO U)
-0 4£) N (0
C%i 0
C: ) (0 1-
r, - 11- (D
-"- r- C: )
(0 Lf)
CD C: ) (0 -ffl (Z; ö ö Ci C'4
0 ý- r-
co> > Co CO> > r-i
C)ýo (M
cý :> <> D R<< C)
:<< C: )
cý CD (
* Co Ln *
: to *+m r, - +* C'4 11-
CD C) ci
C: )
" c
LC) >> C: )
OD >< 9
(D <> < OD Cý
LC)
w C)
l> : r- 4 C)
: c(00 0 40
> b. to- 44 C)
120 C)
4 ci 4 4d 4 -F C: 5 44 ci
0
.E
(V) OD >> (D
r4 CO (D >>
ci (» <> -0 CD <<
(0 OD 9
m CD ( CD D
Co r, -
CO r-
CD CD (D ce
(0 c9 00 >>
G) CO >>
CO (D <>
C) CD e2
R<> <> R< < 9.4 (D C) (D (D
CO (JO
C: ) (0
l> (0
c (7) r, - c
Co (0 c
c5 ý
(D ý
CD ý
(D
CI L U)
> CY) >> C> c> C> C, 4 <>
CD C) Ln
> 0
m im J2 (D cu
2 1 Q - (D
j
te) 00
Table 3 presents the distribution of perks by ownership and leverage clusters. The
average ratio of administration cost to total sales is 9.1%. The firms with a dispersed
shareholding structure spend $0.111 on administration for each dollar of the sales; state-
controlled firms $0.090; institutional-shareholder-controlled firms $0.086; and
entrepreneur-led firms $0.081. Perks vary among firms with different ownership types
and ownership affects corporate governance. With increasing financial leverage, it is
striking to find that the ratio of administration expense to sales increases. When the firms
have a low debt burden, the average administration ratio is 8.7%; a debt burden in the
middle range, 8.8%; above 30%, 10.2%. In the cluster of state-controlled firms, the
increasing pattern of administration ratio with the debt levels is most significant.
4.4 Free Cash Flows
Free cash flow is cash flow left over after the firm has exhausted its projects of
positive NPV. It has a significant positive correlation with the cash retention ratio, which
is also called the plowback ratio. The retention ratio is calculated as one minus the payout
ratio, which is the dividends per share over the earnings per share. This ratio measures
the proportion of earnings retained after paying out dividends to shareholders, and it
serves as a proxy of free cash flow. It is the fraction of distributable cash flows that a
company invests in new projects.
86

Z! Vý tZI
9
(L) -zi Q) -Mý
j>" lý . ý2 "3 1- ,e-, - ä6 :2 -5 0ý 0 Er. 00 to 0 -. -& *g m -'- 0. , e in -Z 9)
>%. r. j- i-- e lý je. r- .E02.2 2E- �j 0-ý; 90
-t -
E -;, -0 = -, a .->, -o :ý '0 20 ý, i 9. > *-2ýE= "8 b) ý l' ei ;.. 12 =, 5u& Je 220,
--, 51 u -i-. A *, 9 22 0 ö- -0 g> e
,' *g v9g'- .E-ý .4- (L) '0't; 5 >,
21 .. 0 ,j u0
121 eu
0 rn =
.2 -9 -- >m *z- P. -- to 1-- -0 23 -. m e oi E -5 ý: ý. - 7ýr -0 '-. .
9) 0 Ici - g; '0 ýroýO -0 mi
r 4 -Z. t -5 e> LM 2 En ei
. LII- 5,20 -2 ýg 2 ll, >, e: - c2. c11131
0 JO-- j. s
"w
oo JO-- 0 ul
.m Ln l', G Q) t)
> 0 0" 20 0 "0
rn to 4. "0 0- CU uE EU c) (U u -14 m, r.
, ed J'- ;: -Z7e 0 Uh e ý, Z' ;5 «-E, 3
-t; g) - -2 r- "y .2Zm gl (D C) Zi. 0-0 *ýr- *i-- gme eij
-0 4) 0 .-- t) ýi r. 0u-
e 0. -= =5- .- IL) ;Zu. - ýo c)
ýD 62 *E -2 -e. E-, a) ;ý >c ZQ ei 0SMß.
jz 0u
k. 4. lu .4. , EI, -4 1-1 0eZ 00 C> -4 Z=
0 (L) iz 0E-. 1--: =9
LA
u04Z rZ = *5 2Z 'Z t) Eý -0 ce W 9 -. A -2 -- ;ý92 im ý, : ýi 4) >. 0M -rj
.2 -ci gE0 -ý3 -j 14 tr. -a 4. ) g 2 -ci 4) 0 W00 ce u 4. )
JJ r, r. c2 0 -ýJ ' ý: 1 4-, oý -=
00 -0 '-K, 0U00 (D = rn (U 14. M9Q
GOI
gDý., 0 00 q> rn -0 ý3 -14 2Z0
3. - - 'Eb 00 40A. (4 0 li 9 ti. -
ei, Ici . 5.9 - . ý: IS2 s.
9u ;5E>0. Q-00'
0 (Y) C) C14 U)
U) m U') I- (D
C14 0
C) C) C) CO
LO
- co
i C) 0 C) CC)
C, 4 a c 0
C) U. ) >>
co co <> Cý
0 - <>
Lf) CC)
I- <> 'o t*ý < cq "':
0
CD CY)
Cl C) 44
+ 44 CD 4 rl-
44C; C)
44 C)
44V.: C)
4 V.: (D
CL r- .t>>
CO C') > <>
co C3) go, <>
r- " C
Lf) c w
r- <> CR CR R co
LD 44
0 U) ** 0 0
++ a. t- 4 rl-
44 C5 0)
44 ci 0
44 00 4 4
0
. - U) Sý
(: ) C, ) >> -
CD 0) >> ce)
co <> < *
co r-
t,. 0) 0 . r - 0 <> t": 00 ,: .1 1 : (D
C; 0 C)
10.0.0 It S, 0
C) 30 Q C)
0 C)
co 44 44
, 44':
CO (0 0>>
co r- >
U) ý <> 0
ýt t-
C) CIO
rl- <> "% < cq r": 6 C) 0 CD
C, C) w 10, C)
C) **
CD W it.
C) C)
4 0
44ý: 0
44 ** 4 4 V (D
C L U)
i5 U) 0 o)
Cl 0) r- >>
CC) co 00
0) T- 00
CN cr)
ci C5 I
c; ci U)
II
0 U) 0
.0 0 .0 CD ca
?: ýo ýD _r_ 0)
'Fu -
(D V)
- 0
I 0 I-
wo Ml
r- 00

Table 4 shows that, by increasing bank loans, the finns have a higher retention
ratio. On average, firms with a high financial leverage retain distributable earnings 6%
higher than those with a low financial leverage. This increasing pattern of plowback
ratios is significant in the government-controlled and the entrepreneur-led firins. Table 4
also shows that a low-leveraged firin with a dispersed shareholding structure has the
highest retention ratio, 90.5%. A dispersed shareholding structure has the worst equity
govemance.
Due to the inaccuracy of the plowback ratios as an approximation of free cash
flows, I also used the ratio of capital expenditureý9 normalized by sales to examine the
magnitude of investment. I find a similar pattern of distribution to that in table 4.
4.5 Managerial Entrenchment
Board member tumovers are a measure that approximates the problem of
managerial entrenchment. Taiwan Economic Journal data set reports the names of
directors on an annual basis. Board member turnover is calculated as the number of exits
from the board over the total number of corporate directors.
49 Capital expenditure is the sum of China's GAAP items of short-term investment, long-term investment and construction in place.
88

C)
ci 0 b. N. E- t! ýý -0 5 Q "C (U
0 00 J-- 0
(L) u04. IC 0u "0
v 10
0 1. CI, o r- 0 c> en 0 -1-. , *Z S �, - e Wý to öz -0
:s 4-- V r. 0 cu 94-. r. 0 >u4,
A rA U= 0-
0- = "CJ 0
- go, g3tE,, = 22 eZ*0e
,0G; 9) -0 $ý -CJ «)
gE ci 0 ý. 0u- -ci
00 m > 0 CU 0 rA rU, -- 1) j3 w--4
U 1- :j -Z'- 0--: 9) ;a02 U) -ý0
ýo 0 4'- (n 2 4ý .0
"- ti- .2 r- -i-- e00 - -- =0- -= u ýc , 12 m0ý: -, M M "ö = "0 uU
41 J :i
= -, i Z3, r- 0, -. e ,bm S- eý>, ce 2 &) En r- 'ZJ , g--
.Q0 0 c2.2 1., cn - .
111 0= 1-, In = i-. Z '15 J. - = >, 02, 'n 00 M', 0 ý.
ö20 0 -oa -
,w 4) b, CU > ý2 '0
2 b) '-
ß. .-ZU .- Cd (U N- ýýj-- 2 1-- M>' 0) 9)
.e (A 0U cl 2-=., Z
> 0- 0 "0
0U s
to E-- lý - 0
0 zi 00 b) > c> 00-. t-5 M
. :e ýý ' rn ýg �, .-w. 0 rz 40. E80
1-- to 'A n :s . -
-ci 0 a-. A9E --: -- ý. ýUJ V'% cl
u0 iz ID C40Un rn U 4. tr, C)
N 42 ,06
0 -o Me >-
. ,m- cj Ei 0 0 L) ýg ttG0
zý tn (U . ID >- -0 0 -- k2 9 4.11--- rn 0
:2 c�, . lý --o--4
U to 0. -0 EI 6 . 2: ö 0--u
jl, cz cýe WAo0 110 = (U
e) t2 -, -,, 0U2 No-
10 1-- 4) tu < -0
e- 9ý t) -rc ti. -
-0 ZI 0 ý. -: 00nw- g r_ A -r, e0Zb. 0M`, 00-ZZ0- CA
2 ý-b rn i-- - . -
,0u0. -. = Z= CU ý. 0 k) tun 9 14n) OU
EI2 b. >, rz &) ý3
.- c) j -. . 35 &)
-2 in 0- ýa .-0 -0 .. - :S -0 0- -5 w, 0Q JL)
60,
Q) :ß05
C, 2 ö0 "0 92 ý: E1 l>I 0 ci, 2 ýo0 rr, . 42 ý. b4 C 4) .
, ce S- 4- ý: e3 t) eE90=-e .2 ; '. '- -, 4
21 e ý. 9 -. e 4-. -C2i n . 1*DI
it (D 0 CY)
C, 4 C) cli
(0 LC)
U) LD r, - (0
n Li)
0) a) 00
U) r1- (0
LO
- ce)
c5 CY) Cl
ci (D C'4
a 0 F- (1 (» >
m LO (0
(0
(0 <>
,0 C) : (» C%4 , r-
ýý >(O -4 ce,
c5 ci
ci (1) "
(0 Ln >> V) Co > > 00 C> -0 Llý <
Lf) ý Ilý Lin OD
w CD C: )
C: ) Ci C: )
Ci CD
= (» CO > <>
M 00
> <> Le) e0 C: )
C: )
c5 CD
N>> eý
C, 4 >< :4 CI) (0 <> < <
C)
00 C)
< C) (D
CY e2 6> Mt
C> +*
ci 4d 4 -4 m a)
Ci . U) i5
" (D >>
C: )
<< rl_ LO Ill
N Co
ci ý (D LO
m c 0 (D
(D T) A)
- 1 .j
c
ON 00

Table 5 does not show that there is a significant distribution pattern when there is
a change in debt levels. However, the firms with dispersed shareholding structures have
the lowest annual turnover of board members, 45.7%. Board member turnovers increase
in the sequence: the government-controlled firms, institutional-shareholder-controlled
firms, and entrepreneur-led firms. This finding is consistent with the governance
hierarchy of ownership: private ownership, state ownership and dispersed shareholding
structure. Table 5 also shows that the firms with a low leverage and with a dispersed
shareholding structure have the lowest turnover ratio, 40.1%. The firms with a high
leverage and with the entrepreneur-led shareholding structure have the highest frequency
of board-member turnovers at 54.7%. However, in contrast to Franks et al. (2002), the
frequency of management turnovers is not significantly higher when the debt is higher in
Chinese PLCs, except for the firms under the control of an entrepreneur.
4.6 Comprehensive Proxies
The above sections examine managerial agency costs from three aspects and this
section introduces the index of managerial agency costs to present the general relation
between managerial agency costs and debt financing. The index of managerial agency
costs is generated through factor-analysis of administration costs, capital expenditures
and board-member turnovers. The procedure of factor analysis is reported in appendix 3.
The regression on these three dimensions of managerial agency costs explains about 90%
90

of the principal factor-the index of managerial agency costs. Factor analysis tests whether
my three proxies have a common underlying factor, provides a support for the goodness
of my proxies and for the empirical robustness of my conceptual framework of
managerial agency costs. In addition, it generates a parsimony index of managerial
agency costs and assists in the articulation of the relation between managerial agency
costs and debt.
Ang et al. (2000) uses the expense ratio to approximate agency costs in the firm.
This ratio is operating expense scaled by annual sales. As a measure of efficiency, it
indicates how effectively or ineffectively the managers operate the firm. Ang et al. (2000)
compare the expense ratios in firms with many shareholders and then in owner-manager
firms that theoretically have no managerial agency costs. Using American data, they find
that there is an insignificant negative relation between financial leverage and expense
ratio. From their argument, I can conclude that a firm with a high expense ratio has a
relatively high agency cost. Even without the control sample of the owner-manager firm,
the variance of expense ratios shows the variance of the magnitude of agency costs in
different firms. This efficiency ratio provides an auxiliary measure of managerial agency
costs.
Managerial agency costs damage the intrinsic value of the firm. The most often
used value measure is Tobin's Q. Following Perfect and Wiles (1994) and Chung and
Pruitt (1994), 1 use the simplified Tobin's Q, which is measured as the sum of market
value of equity plus book value of debt all over book value of total assets. This simplified
Tobin's Q is widely adopted in the literature to avoid arbitrary assumptions about
depreciation and inflation rates (e. g., Shin and Stulz, 1998). Tobin's Q is driven by
91

market valuation of the firm. 50 A firm that has excessive managerial agency costs should
be valued low. Solely based on the governance arguments, Hypothesis CF argues that
there is a positive correlation between debt and Q. However, besides the effect of
managerial agency costs, the cost of financial distress, tax shield and the market
perception of debt affect the relation between financial leverage and corporate value. In
an economy with hard budget constraints, debt makes multiple contributions to corporate
value (e. g., McConnell and Servaes, 1995). Soft budget constraints further complicate the
relation between corporate value and debt. By excluding the cost of financial distress, the
market still attempts to assess the quality of the firms by their financial leverage. Both of
my hypotheses do not clearly predict the relation between corporate value and debt in the
real world, since debt is not just an instrument of corporate governance. However, the
relation between Tobin's Q and leverage is itself an interesting empirical question and I
provide a test in following sessions, with some caveats.
Table 6 presents the distribution of the proxies of managerial agency costs on the
10% quantiles of the bank loans to total assets. Some patterns of the data distribution are
visible, but it demands rigorous econometric investigation.
50 Share prices in China are a highly controversial measure. Some journalists regard this stock market as the castle in the air. However, except for some notorious stories of share price manipulations, I find that there is a strong correlation between share price and ROA among 826 firms.
92

t') ; Z)
rjý Q
u
t: i E4
"U 9
(V) OD (9 (3) OD C) m r, - Lf) 0 cu cli cli m r, - (0 G) CY) r, - (0
(D ýt C) 00ý 0) 0 CD OD (0 E cý cý cli cý cý 0
CY 10 2 rm- 0 r
(0 CO n CO CM (0 00 CO ý- (M 0 e (0 OD ýt r, - C, 4 LO CO
. a) 00 cý 17 .
0ý cý cý r1: r1.: (C!
E C, 4 C'4
t- U') C%J ce) C) LO '
A ) LO 00 't r- m C, 4 (Y) C) MU 0 (0 (0 (0 r, - r- r- r, - r, - r_ r- E ci öö ci cs ö c5 ci ö ci
0 r_ . (D
r- (0 (n to C C: ) ci e2 cq -e ' ) (0 r- r, - OD CD CD C, 4 LO r- U
> 0 E C) C) CD 00 C) C: ) C: ) CD CD
(D r- e LD nt C) C) N ' rz ) (» (D (C) rý LO c9 (0 U
> 0 LD le le le le le
Eä 0 E ci öäöööö6 c5 ä 0
0 Zr - 13
, LD M ce (» LO C) LD M00 LC) e (A
0 . CD
M 0
C) C: ) ) (0 (N r- CD LO 1- c C, 3 cr) m Igt ei l; r ce) m xt le
m0 re 0 E CD oö6 c5 6ö
cli (0 U) NN cq r-- Co cq i <O «) C-4 t (0 C: ) co (D 0
P. r- CO 0 r1- ý r1- el C'4 -I: E ö c5 öö4 ci :ý9 CD
�; u 0 75
c: (D
.
l , 4 00 e 0 CD C) N C, 4 C r- rl_ r- CC) r- r- Co
E 0 (D C: ) öö ci ö c; c; 6
> r m ce N (1 Ne r- ý (0 r- 0 _ 00 CO (D CI, 1 C: )
, 4 ce 9 (: ý c4 cý cý C CD 0 CD CD 00000 CD
90 Z- Im- N LD r_ 0) m a) ei le 0 (D ' >
* : . ) (0 (D (0 r_ (0 r- r, - Co Co U
000 CD CD CD (D 0 Z 0 - « cu CD (D ..... :j o C) 00 CD CD (D C) ci c; ä
0 - r- (0 CD (0 ei -e Co ý» - c: ä 1: Z Cj ii H cn Co CD q, r, - N (» m , % j ce co Co NC 4c
0 1
te 0 1 0 le A, - r- (0 0 (0 ei to
.......... (D to (3i ce (0 C) e r- C, 1 m (N C, 4 C%4 m ci
e .0 C, 4 (V) e tn (0 r- CO (D - 92 "
rn 011

5. Multivariate Regressions
In this section, I present the empirical findings of multivariatc regressions. A positive
relation is found between debt levels and the magnitude of managerial agency costs in the
full sample, but not in the cntrepreneur-controllcd firms. Government ownership is a
necessary condition for bank lending to facilitate managerial agency costs, although the
government shareholder can provide some kind of corporate governance when it is in
control. This conclusion is based on the empirical findings with a number of econometric
methods. In the following sessions, I report the findings with the fixed-effect panel
regressions, GMM Arellano-Bond regressions and the instrumental variable regressions.
The GMM regressions and instrumental variable regressions theoretically help to control
for the usual caveat of endogeneity problem in empirical corporate finance literature,
although testing the hypotheses CF and SBC only requests to show the directions of
correlations between debt and managerial agency costs. 51
5.1 Administration Cost and Debt
Table 7 shows that the administration cost ratio rises when the financial leverage
increases. In the fixed-effect regressions, 1% higher financial leverage is associated with
51 This chapter attempts to establish the role of debt as a facilitator of managerial agency costs under soft budget constraints, which only needs to prove the positive correlation between managerial agency costs and debt financing. The positive correlations documented in previous tables support the soft budget constraints hypothesis and reject the application of the corporate finance hypothesis into Chinese firms. This causality problem isn't a big concern of this chapter, but I control it with the instrumental variable regressions that allow a feedback system between managerial agency costs and financial leverages. I instrument the financial leverages on the proxies of managerial agency costs lagged one year and other deten-ninants of capital structure to report the CIV regression results in the previous tables. The regression results are also examined with the Arellano-Bond GMM method, which arguably handles the endogenity problem.
94

2.4% higher of administration costs. In the GMM regressions, it increases the ratio of
administration costs by 2.2%. This effect becomes more significant when the financial
leverages are endogenized 52 in the robust instrumental variable regressions clustering on
years. 1% financial leverage increases the ratio of administration cost by 3.7%. This
increase indicates that managers in a highly leveraged finn enjoy large expense accounts.
Debt does not prevent managers from squandering corporate wealth, which contradicts
Hypothesis CF. On the contrary, bank lending increases the resources under the
managers' control and promotes a large expense account of administration. This finding
supports Hypothesis SBC.
Columns 4,5 and 6 presents the clustering robust IV regressions in the
subsamples: 1) firms under the control of the government shareholder, 2) firms that the
government has a significant shareholding stake but not stays in control, and 3) finns
under the control of an entrepreneur. The testing of our hypotheses should focus on the
comparison of column 4 with column 6. The comparison of column 5 with column 6
checks the robustness of the findings on the effect of government ownership. The
comparison of column 4 with column 5 checks whether the government controlling
shareholder has a helping hand, as argued in Chapter 1.
52 Following Booth et aL (2001), 1 use tax rates, risk, tangible, size, ROA and MBV as the determinants of financial leverages. I also test the managerial agency costs as the determinants of financial leverages, which builds a feedback system similar to the instrumental variable regressions. Because the focus of this chapter on testing the governance effect of debt, these tables on another paper about the determinants of capital structure are not reported in this chapter, although they are available upon requests.
95
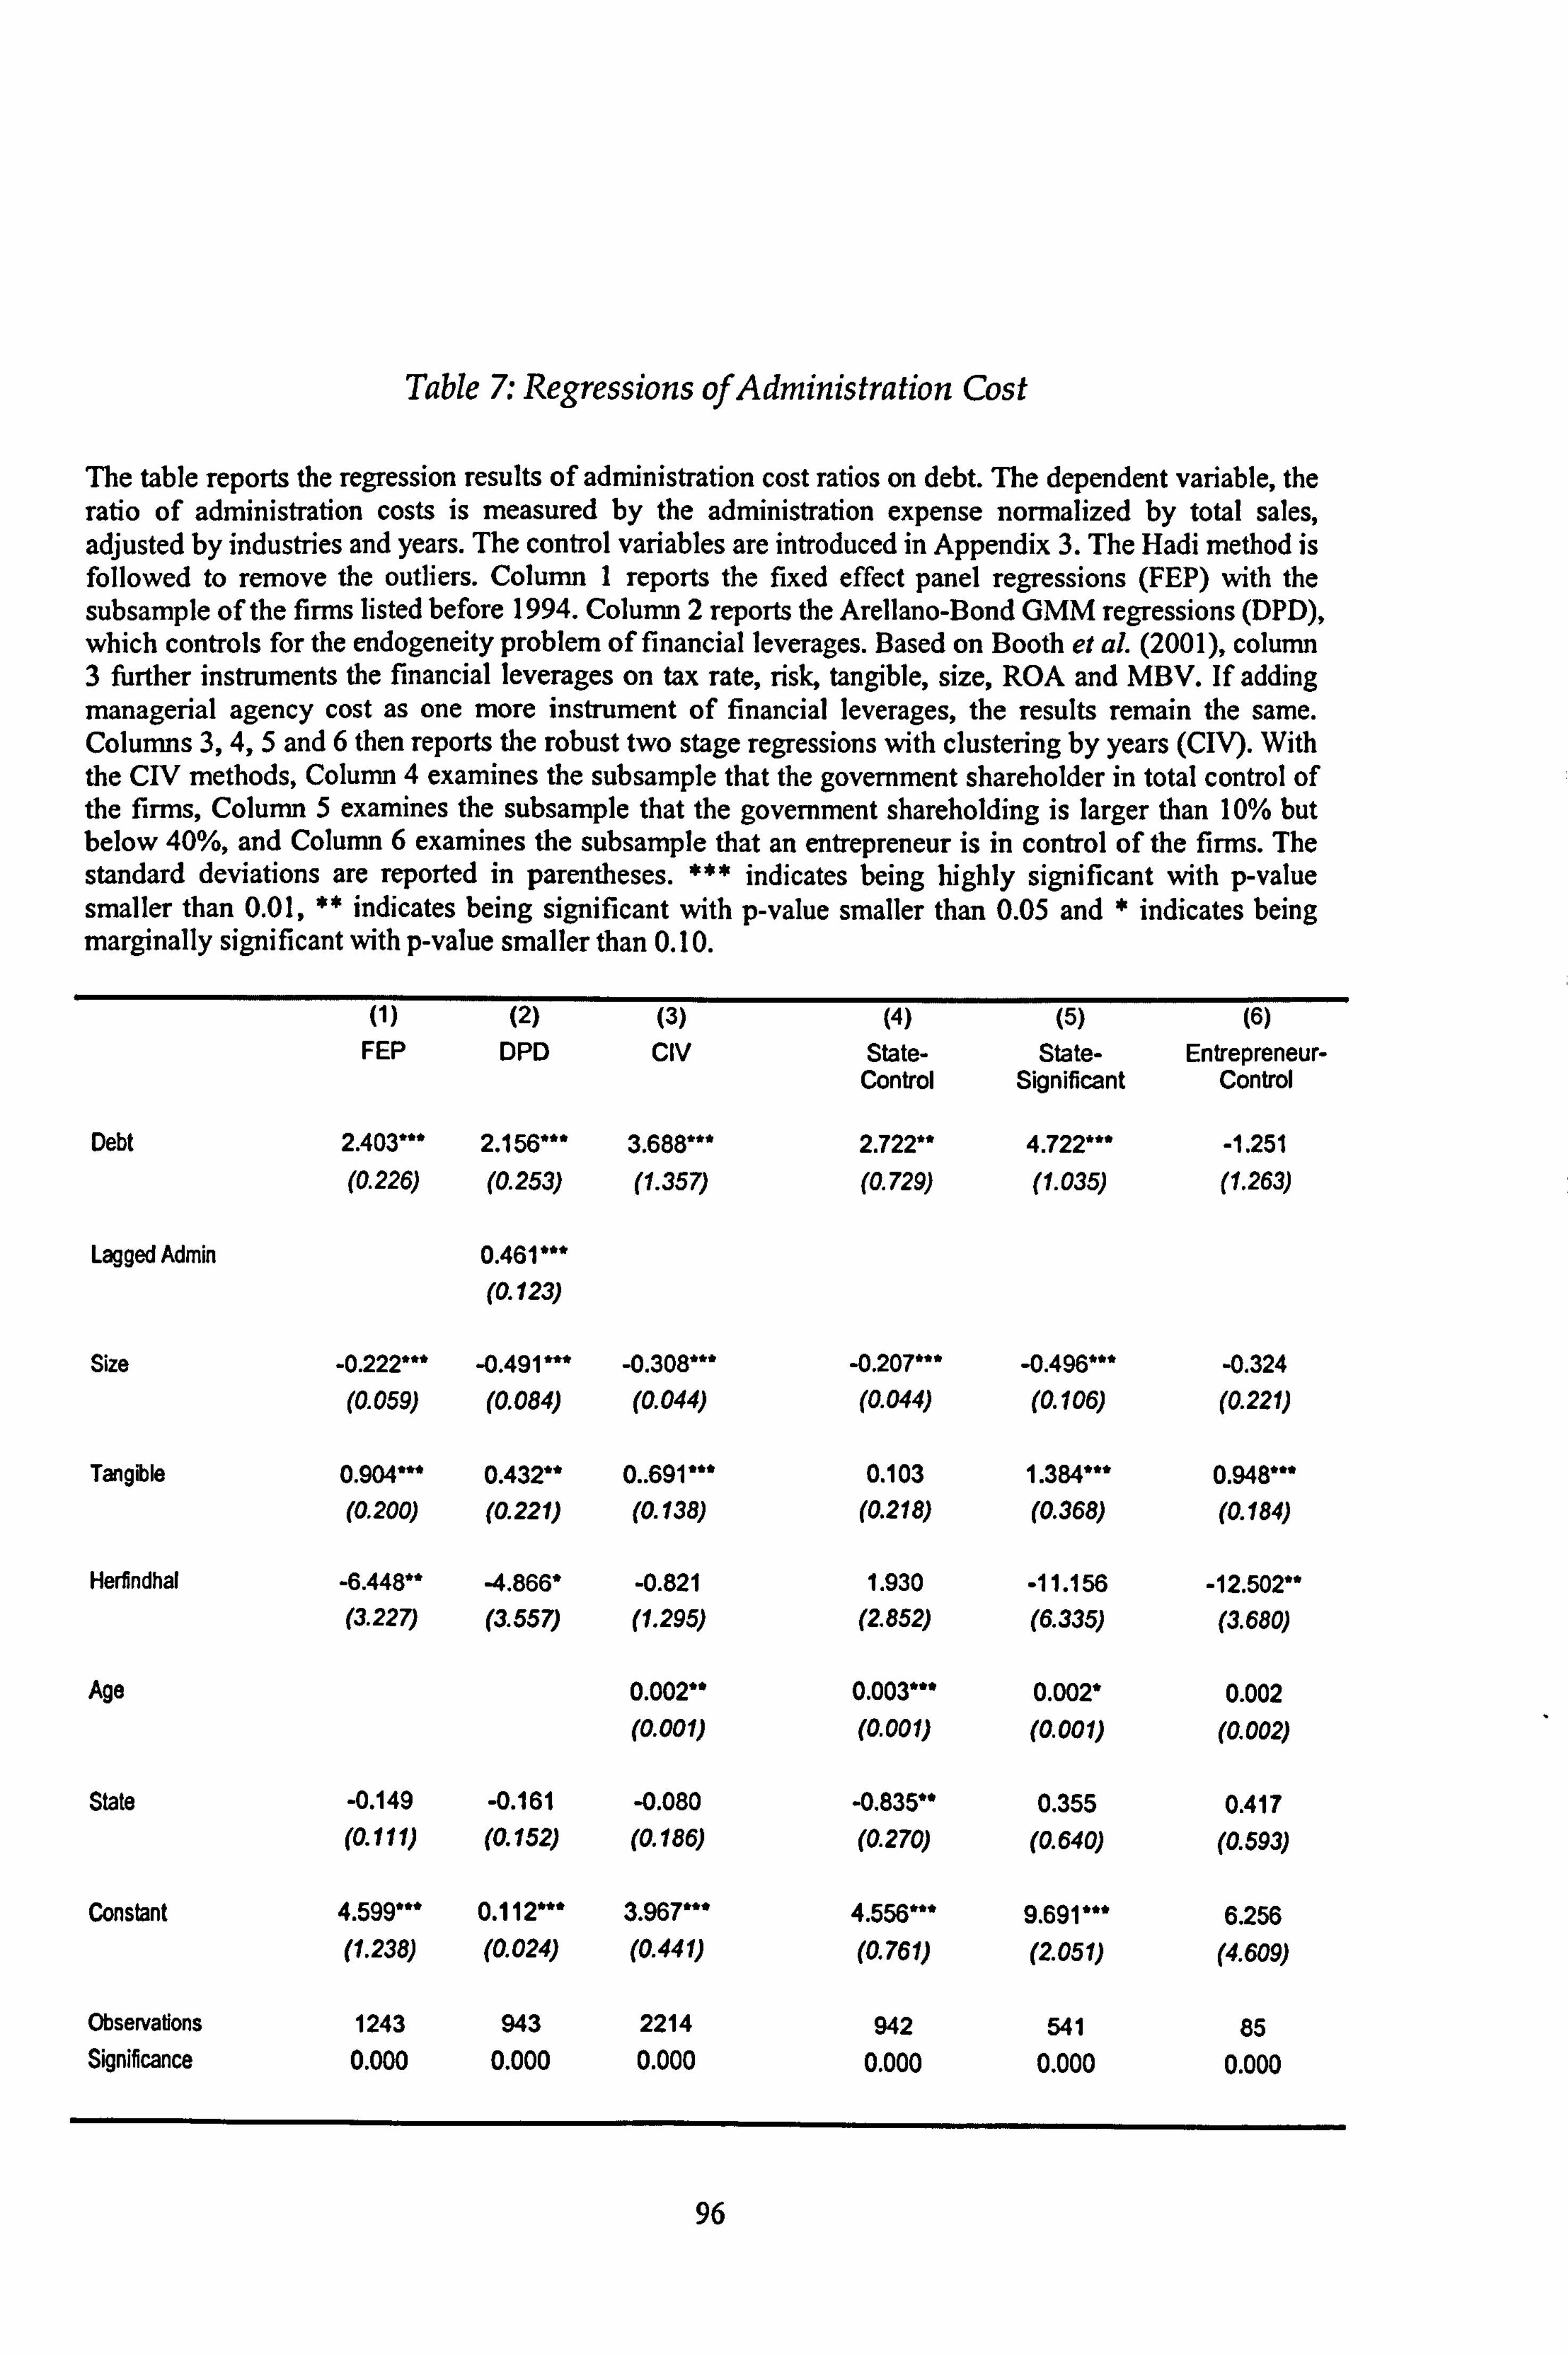
Table 7. Regressions ofAdministration Cost
The table reports the regression results of administration cost ratios on debt. The dependent variable, the ratio of administration costs is measured by the administration expense normalized by total sales, adjusted by industries and years. The control variables are introduced in Appendix 3. The Hadi method is followed to remove the outliers. Column I reports the fixed effect panel regressions (FEP) with the subsample of the firms listed before 1994. Column 2 reports the Arellano-Bond GMM regressions (DPD), which controls for the endogeneity problem of financial leverages. Based on Booth et aL (2001), column 3 further instruments the financial leverages on tax rate, risk, tangible, size, ROA and MBV. If adding managerial agency cost as one more instrument of financial leverages, the results remain the same. Columns 3,4,5 and 6 then reports the robust two stage regressions with clustering by years (CIV). With the CIV methods, Column 4 examines the subsample that the government shareholder in total control of the firms, Column 5 examines the subsample that the government shareholding is larger than 10% but below 40%, and Column 6 examines the subsample that an entrepreneur is in control of the firms. The standard deviations are reported in parentheses. *** indicates being highly significant with p-value smaller than 0.01, ** indicates being significant with p-value smaller than 0.05 and * indicates being marginally significant with p-value smaller than 0.10.
(1) (2) (3) (4) (5) (6) FEP DPD Civ State- State- Entrepreneur-
Control Significant Control
Debt 2.403*** 2.156*** 3.688*** 2.722** 4.722*** -1.251 (0.226) (0.253) (1.357) (0.729) (1.035) (1.263)
Lagged Admin 0.461 *** (0.123)
Size -0.222*** -0.491 *** -0.308*** -0.207*** -0.496*** -0.324 (0.059) (0.084) (0.044) (0.044) (0.106) (0.221)
Tangible 0.904*** 0.432** 0.. 691 *** 0.103 1.384*** 0.948*** (0.200) (0.221) (0.138) (0.218) (0.368) (0.184)
Herfindhal -6.448** -4.866* -0.821 1.930 -11.156 -12.502** (3.227) (3.557) (1.295) (2.852) (6.335) (3.680)
Age 0.002** 0.003*** 0.002* 0.002 (0.001) (0.001) (0.001) (0.002)
State -0.149 -0.161 -0.080 -0.835** 0.355 0.417 (0.111) (0.152) (0.186) (0.270) (0.640) (0.593)
Constant 4.599*** 0.112*** 3.967*** 4.556*** 9.691*** 6.256 (1.238) (0.024) (0.441) (0.761) (2.051) (4.609)
Observations 1243 943 2214 942 541 85 Significance 0.000 0.000 0.000 0.000 0.000 0.000
96

Column 6 reports that there is not a significant relation between the size of bank
loans and administration costs in the firms under the control of an entrepreneur, although
the sign of debt coefficient is negative. Under the control of an entrepreneur, the relative
size of administration cost does not increase with the size of bank loans, but has an
insignificant tendency to decrease. The distribution of administration cost does not
correspond with the distribution of debt. It is sharply in contrast to columns 4 and 5,
which report a significant positive relation between debt and administration cost. The
positive signs of column 1,2 and 3 for the full sample come from the firins with a
significant government shareholder. Comparing column 4 with column 5,1 find that,
when the government is a large shareholder but has no controlling position,
administration costs increases 4.7 times with a larger size of bank loans. When the
government shareholder is in control, bank loans still facilitates administration costs, but
with a smaller magnitude. The coefficient of debt ratio is 2.7 in the subsample with a
controlling government shareholder. It suggests that with a significant but not controlling
government shareholder, the manager has a free hand to use bank loans for perks. When
there is a controlling shareholder, even which is the government, managerial exploitation
of bank loans is somehow contained. When the controlling shareholder is a private
investor, the manager cannot make use of bank loans to increase his luxuries. That is,
debt does not facilitate managerial perks in those firms that are under the control of a
commercial entity.
I use the log form of total assets in this regression, in order to approximate the
size to reduce the multi-collinearity with this ratio of administration cost to sales. I find
that large firms have a low administration ratio. This finding implies that they benefit
97

from economies of scale. Furthermore, a large firm draws the attention of the media and
faces better monitoring. The monitoring helps to reduce the managerial perks. I further
find that the firms whose assets are more specific and more tangible have a higher
administration cost ratio. These firms involve more administration staff to manage these
assets. Consistent with the governance effect of large shareholders, I find that ownership
concentration helps to reduce administration cost in the fixed-effect panel regressions and
GMM regressions. Although all the coefficients of state are negative, they are not
significant in the full sample. In the subsample of a controlling government shareholder, I
find that, with increasing the size of government shareholding, the ratio of administration
cost decreases. Chapter I argues that the government can provide monitoring efforts and
tend to provide better governance to the firms it holds a larger shareholding stake. The
finding in table 7 is consistent with this argument.
5.2 Capital Expenditure and Debt
Table 8 reports a strongly positive relation between the ratio of capital
expenditure and financial leverage. A 1% increase in financial leverage increases the
ratio of capital expenditure over total sales 2% or 3%. A positive relation between cash
retention and bank loans is also found, which is not reported here. Other things being
equal, a firm that has a higher ratio of earnings retention has a larger proportion of free
cash flow and a larger propensity towards over-investment. The findings with either the
investment ratio or the cash retention ratio show that, on the contrary to Jensen (1986)s
argument that debt shall push out free cash flows in the firms, bank loans in China
encourages the managers to retain more cash to squander and overexpand the firms with
inefficient investment projects. Hypothesis SBC is supported.
98

Table 8: Regressions of Investment Ratio
The table reports the regression results of capital expenditure ratio on debt. The investment ratio is measured by one minus the dividend ratio, adjusted by industries and years. The control variables are introduced in Appendix 3. The Hadi method is followed to remove the outliers. Column I reports the fixed effect panel regressions (FEP) with the subsample of the firms listed before 1994. Column 2 reports the Arellano-Bond GMM regressions (DPD), which controls for the endogeneity problem of financial leverages. Based on Booth et aL (2001), column 3 further instruments the financial leverages on tax rate, risk, tangible, size, ROA and MBV. If adding managerial agency cost as one more instrument of financial leverages, the results remain the same. Columns 3,4,5 and 6 then reports the robust two stage regressions with clustering by years (CIV). With the CIV methods, Column 4 examines the subsample that the government shareholder in total control of the firms, Column 5 examines the subsample that the government shareholding is larger than 10% but below 40%, and Column 6 examines the subsample that an entrepreneur is in control of the firms. The standard deviations are reported in parentheses. *** indicates being highly significant with p-value smaller than 0.01, ** indicates being significant with p- value smaller than 0.05 and * indicates being marginally significant with p-value smaller than 0.10.
(1) (2) (3) (4) (5) (6) FEP DPD CIV State- State- Entrepreneur-
Control Significant Control
Debt 1.875** 3.377*** 2.783*** 0.957** 7.218** 5.568 (0.426) (1.062) (0.348) (0.345) (1.594) (5.353)
Lagged Invest -0.501 *** (0.135)
Size -0.093 -0.298* -0.128** -0.052 -0.426* -0.494 (0.114) (0.114) (0.037) (0.026) (0.177) (0.479)
Tangible -4.180*** -1.432*** -0.958*** -0.744*** -1.010* -0.247* (0.387) (0.421) (0.169) (0.110) (0.445) (0.189)
Herfndhal -1.800 -2.897 -3.582 -8.315 -1.420 -8.137 (6.254) (3.561) (1.317) (7.852) (10.259) (10.378)
Age 0.002* 0.003*** -0.001 0.038 (0.001) (0-001) (0-001) (0.023)
State -0.450 -0.371 -0.223*** 0.705** 0.969** 0.812 (0.219) (0.126) (0.035) (0.199) (0.322) (1.247)
Constant 3.334 3.329*** 3.208** 1.201 9.413* 10.129*** (2.416) (0.244) (0.799) (0.566) (3.758) (2.854)
Observations 1243 943 2217 939 530 85 Significance 0.000 0.000 0.000 0.000 0.000 0.000
99

Column 4 in table 8 shows that there is a highly significant positive relation
between financial leverage and investment ratios in the government-controlled companies.
The positive effect of debt on investment is much larger when the government
shareholder is not in control of the firm. It suggests that the controlling government
shareholder may discourage the firm managers to misuse bank loans and overexpend the
firms, to some extent. A manager in a firm with some government ownership but without
the control of a government shareholder may have a free hand to use debt financing to
overinvest to build a managerial empire.
However, when an entrepreneur-controlled firm has a higher ratio of bank loans,
it tends to have less free cash flows and reduce its investment scope. Jensen (1986) is
supported in this subsample of entrepreneur-controlled firms. Government ownership of
the firms not only dysfunction the governance role of debt, but turns bank loans to be a
facilitator of managerial agency costs.
I find that the tangible ratio-fixed assets to total assets-has a negative impact
on the investment ratio. The firms with a large proportion of intangible assets tend to
invest more. For instance, the IT sector requires intensive investment. I do not find a
significant impact of ownership concentration on the investment ratio. A large
shareholder does not seem to influence the management team for paying out larger
dividends. However, this finding does not necessarily invalidate the governance argument
of large shareholders, supported in table 7 and 9. In addition to the governance effect on
the management team, a large shareholder also tends to take advantage of small
shareholders. Instead of paying out the dividends to all shareholders, a large shareholder
100

may cash out with transfer pricing at the expense of small shareholders. The anecdotes on
China's stock market support this interpretation on the insignificant Herfindhal
coefficient on cash retention.
5-3 Board-member Turnover and Debt
Table 9 investigates whether debt has an impact on managerial entrenchment.
Board member turnover is the converse of managerial entrenchment. In the regressions
presented in table 9, the coefficients of debt are negative, which suggests that a firm with
a higher debt ratio may have a low frequency of board-member turnovers. However, in
the full sample, the negative coefficients in the fixed effect regressions and GMM
regressions are not significant. In the IV regressions, it is only marginally significant.
Although it cannot be concluded that debt encourages managerial entrenchment, I find
that debt financing does not provide a governance role in China, on the contrary to the
argument of Franks et al (2001).
In columns 4,5 and 6, the coefficient of debt turns to be positive in the
entrepreneur-controlled firms, although it is not significant. Due to missing points of
board-member turnovers, the sample size of entrepreneur-controlled firms is small, which
can be a reason of the insignificant results. Debt financing, however, has a negative effect
in reducing managerial entrenchment in columns 4 and 5. Under government ownership,
debt financing is correlated to an entrenched management team. This effect is not
significant when the government becomes a controlling shareholder. When the
government has the control of firms, managers may not be able to use their connections
with creditors to play around shareholders and entrench themselves in the offices.
101

Actually, a larger sized state ownership increase the turnover of board-members, which
suggests that the government provides a better quality of corporate governance in the
firms it has larger cash flow rights.
I further decompose my sampled firms into going concerns and loss makers. The
coefficient of bank loans remains insignificant. 53 Therefore, there is no evidence to
support the view that debt affects managerial entrenchment, even in the finn in financial
distress where the Aghion-Bolton shift of corporate control (1992) from shareholders to
creditors is expected. Hypothesis CIF is rejected by the Chinese data, but this finding fits
the broad framework of Hypothesis SBC. In fact, there are very few cases where bankers
have succeeded in removing incumbent management teams.
Whether the firms are under the control of the government or a commercial entity
does not change the ineffectiveness of financial leverage on managerial entrenchment, as
reported in column 4 and 5. Bankers generally have no significant impact on managerial
replacement, since the Aghion-Bolton shift of corporate control seldom happens in
Chinese PLCs under the weak enforcement of the trial code of bankruptcy.
53 To be concise, I do not present the regression tables in the decomposition format.
102

Table 9: Regressions of Board-member Turnover
The table reports the regression results of board-member turnover frequency on debt. The dependent variable, the ratio of board-member turnover is by the annual number of resigning directors in the board over the total number of directors. The control variables are introduced in Appendix 3. The Hadi method is followed to remove the outliers. Column I reports the fixed effect panel regressions (FEP) with the subsample of the firms listed before 1994. Column 2 reports the Arellano-Bond GMM regressions (DPD), which controls for the endogeneity problem of financial leverages. Based on Booth et aL (2001), Column 3 further instruments the financial leverages on tax rate, risk, tangible, size, and MBV. If adding managerial agency cost as one more instrument of financial leverages, the results remain the same. Columns 3,4,5 and 6 then reports the robust two stage regressions with clustering by years (CIV). With the CIV methods, Column 4 examines the subsample that the government shareholder in total control of the firms, Column 5 examines the subsample that the government shareholding is larger than 10% but below 40%, and Column 6 examines the subsample that an entrepreneur is in control of the firms. The standard deviations are reported in parentheses. *** indicates being highly significant with p-value smaller than 0.01, ** indicates being significant with p-value smaller than 0.05 and * indicates being marginally significant with p-value smaller than 0.10.
(1) (2) (3) (4) (5) (6)
FEP DPD Civ State- State- Entrepreneur- Control Significant Control
Debt -1.182 -1.251 -2.695* -2.966 -2.681* -2.144
(1.123) (1.267) (1.258) (1.983) (1.212) (1.722)
Lagged Board -0.064 (0.057)
Lagged ROA -0.299** 0.087 -0.701* 0.217 -1.225* -5.693* (0.054) (0.186) (0.392) (0.517) (0.662) (3.310)
Size 0.013 0.179** -0.101 -0.004 0.426* 0.003 (0.009) (0.077) (0.123) (0.030) (0.177) (0.124)
Tangible -0.038*** -0.034** -0.007 -0.096 -0.356 -0.311 (0.004) (0.019) (0.392) (0.131) (0.210) (0.491)
Herfindhal -0.040 0.434 1.936* -1.327 1.875 2.611 ** (0.200) (1.981) (1.072) (2.326) (4.581) (1.257)
Age -0.0004 -0.002*** -0.003** -0.002 0.012* (0.0004) (0.001) (0.001) (0.002) (0.007)
State 0.103 0.109 0.125* 0.073* 0.281 0.252 (0.057) (0.086) (0.073) (0.022) (0.423) (0.334)
Constant 0.093 0.267*** 0.255 0.245 1.106 0.526 (0.274) (0.021) (0.472) (0.593) (0.997) (2.500)
Observations 651 229 1116 506 268 35 Significance 0.000 0.000 0.000 0.001 0.047 0.098
103

Column 6 in table 9, however, shows that a concentrated shareholding structure
significantly increases the frequency of board member turnovers and reduces managerial
entrenchment. The change of managers depends on the controlling shareholder. A
sufficiently large shareholding stake is necessary for the success in removing a manager.
The ratio of ownership concentration is not significant in the samples of a significant but
not controlling government shareholder and a controlling government. The size variable
is negatively associated with board member turnovers. Merger and acquisition happens in
small sized companies more frequently than in large sized companies. I further find that
firm age has a positive impact on managerial entrenchment. The reshuffling of a board of
directors is a selection process. Having selected the right people, the firms with a longer
history tend to have a more stable board of directors.
5.4 General Effects ofFinancial Leverage
Table 10 in the following pages further examines the general effect of financial
leverage on managerial agency costs, corporate efficiency and corporate value.
5.4.1 Managerial Agency costs
Panel A in table 10 finds that there is a significantly positive relation between the
indexes of managerial agency costs and debt financing. This index rises 13.7% when the
financial leverage increases by 1%. Debt financing significantly encourages managerial
agency costs.
104

Table 10: Regressions of Managerial Agency costs
The table reports regression results of three comprehensive proxies of managerial agency costs on debt are reported. Panel I reports the results taking the managerial agency cost ratio as dependent variable that is loaded by the factors of administration cost, cash retention, and board-member turnover. Following Ang et A (2000), panel 2 reports the results taking the corporate efficiency ratio as a dependent variable that is measured as operating expense scaled by annual sales. The control variables are introduced in appendix 3. The Hadi method is followed to remove the outliers. Based on Booth et aL (2001), this table instruments the financial leverages on tax rate, risk, tangible, size, ROA and MBV. If adding managerial agency cost as one more instrument of financial leverages, the results remain the same. The reported results are based on the robust two stage regressions with clustering by years (CIV). With the CIV methods, colurrin I examines the full sample, column 2 examines the subsample that the government shareholder in total control of the firms, column 3 examines the subsample that the government shareholding is larger than 10% but below 40%, and column 4 examines the subsample that an entrepreneur is in control of the firms. The standard deviations are reported in parentheses. *** indicates being highly significant with p-value smaller than 0.01, ** indicates being significant with p-value smaller than 0.05 and * indicates being marginally significant with p-value smaller than 0.10.
Panel A: Factor-loaded Index of Managerial Agency Cost
(1) (2) (3) (4) Total State- State- Entrepreneur-
Control Significant Control
Debt 13.692** 3.079*** 14.003*** -6.625* (4.615) (0.249) (2.846) (2.815)
Size -0.111 -0.420 -0.307 -0.155 (0.129) (0.253) (0.219) (0.193)
Tangibfe 0.197 -1.903 1.257 0.618 (0.293) (0.992) (0.984) (0.955)
Age 0.003* 0.003** -0.009 0.004 (0.001) (0.001) (0.005) (0.019)
Herfindhal -6.975* 1.902 -8.995** (2.607) (1.719) (2.634)
State -0.637 -1.411* 0.204 0.619 (0.292) (0.582) (1.367) (0.954)
Constant 2.555 -7.291 5.860 3.281 (2.762) (5.167) (4.514) (3.827)
Observations 1573 678 370 49 Significance 0.000 0.000 0.000 0.000
105

Panel B: Expense Ratio as Proxy of Managerial Agency Costs
(1) (2) (3) (4) Total State- State- Entrepreneur-
Control Significant Control
Debt 1.362** 1.532* 2.559*** -0.279 (0.297) (0.646) (0.224) (0.209)
Size -0.026* -0.053*** 0.037 -0.048* (0.012) (0.013) (0.027) (0.022)
Tangible 0.034 0.028 0.014 0.038 (0.028) (0.048) (0.051) (0.067)
Age -0.0002 -0.0002 -0.001 0.001 (0.0002) (0.0003) (0.001)) (0.002)
Herfindhal -0.0002 1.902 0.004 (0.0002) (1.719) (0.019)
State -0.067 0.033 0.116 0.054
(0.042) (0.151) (0.146) (0.073)
Constant 0.512* 1.440*** 0.530 0.987*
(0.239) (0.290) (0.600) (0.444)
Observations 2350 982 558 102 Significance 0.000 0.000 0.000 0.000
106

Panel C: Corporate Value and Financial Leverage
(1) (2) (3) (4)
Total State- State- Entrepreneur- Control Significant Control
Debt -1.115** -0.972** -1.296** -0.475 (0.318) (0.292) (0.403) (0.297)
Size -0.190 -0.044 -0.240** -0.662*** (0.110) (0.078) (0.086) (0.128)
Tangible 0.030 -0.055 -0.160 -0.014 (0.124) (0.256) (0.120) (0.517)
Age -0.003** 0.003 -0.002** -0.009 (0.001) (0.002) (0.001) (0.004)
Herfindhal 3.391 ** 13.077* -2.402 (1.520) (6.122) (3.083)
State -0.081 ** 0.595*** -0.945* 0.095 (0.027) (0.122) (0.412) (0.390)
State2 1 . 091* (0.472)
Constant 4.192 0.919 5.222 13.791
(2.289) (1.624) (3.879) (10.554)
Observations 2356 984 559 102
Significance 0.000 0.000 0.000 0.000
107

The relation between managerial agency costs and debt financing is, however,
negative in the entrepreneur-controlled firms. The loans from state-owned banks reduce
the index of managerial agency costs by 6.7%, which is marginally significant.
Hypothesis CF is supported here. Private ownership allows debt financing to provide a
governance role on managerial behaviors. Consisting with hypothesis SBC, columns 4
and 5 find that debt financing turns to be a facilitator of managerial agency costs when
the firm has a significant proportion of government ownership. With increasing 1% bank
loans, the index of managerial agency costs increases 14.0% when the government holds
more than 10% and less than 40% of ownership in the firm, or 5.1% when the
government holds more than 40%. This finding is consistent with Tian (2000) that argues
government-based corporate governance is worse than governance provided by a large
private shareholder, but better than the governance vacuum with a dispersed shareholding
structure. Comparing with column 4, the firms in column 5 has a relatively dispersed
structure. When the government is a large shareholder, its voting rights crowd out the
governance from private shareholders. If the cash flow rights of the government
shareholder is not large enough and the government is not in a firmly controlling position,
the mangers may have a free hand to exploit corporate wealth. The managers can also
maneuver to dysfunction the monitoring from the government-owned banks. The
managers in government-controlled firms take advantages of bank loans at a smaller
magnitude than these in the column-5 firms.
Panel A also shows that a more established firm with a longer history tends to be
associated with higher managerial agency costs. The management team in a newly
founded firm takes less advantage of corporate wealth. This finding suggests a
108
deteriorated quality of corporate governance after listing, which is driven by the fimis
under the control of the government. The concentration of ownership decreases the index
of managerial agency costs. It suggests that equity governance functions in China, even
where the budget constraints are soft. The equity governance is stronger in the firms
controlled by an entrepreneur. In the firms controlled by the government, the government
shareholder provides the governance rather than other large shareholders and the
reduction of managerial agency costs by state ownership has a significantly smaller
magnitude than the ownership concentration in the firms controlled by the entrepreneurs.
1, however, cannot find a significant relation between managerial agency costs and debt
financing. A large government shareholder without a controlling position may
dysfunction equity governance, as well as debt governance.
5.4.2 Corporate Efficiency
Ang et aL (2000) suggests that the ratio of operating expense to total assets is a
proxy for agency costs, although it is essentially an indicator of corporate inefficiency. I
find that it conforms to the argument of last section. There is a positive relation between
the expense ratio and debt ratio. If the ratio of bank loans to total assets increases by 1%,
the ratio of operating expense to total assets rises by 1.4%. When the firm is highly
leveraged, corporate efficiency is low and so vice versa. Debt cannot push the managers
to reduce costs or improve efficiency. On the contrary, the efficiency of the government-
controlled firms is even lower with a larger size of banking loans. If managers can access
the low-risk bank credit and have more free money, the firm is under less pressure to
survive and has less incentive to be efficient.
109

I found that a large-sized firm has a lower expense ratio in the full sample. A
large listed firm can be run more efficient. It also suggests that Chinese firms shall pursue
the economy of scales. However, in column 3, the sign of the coefficient of company size
becomes insignificantly positive.
5.4.3 Corporate Value
In table 10, panel 3 presents the significant negative relation between Tobin's Q
and debt ratio. The increase of leverage decreases market value of the firms. Although
there are other interpretations on this relation, my finding provides the support to
Hypothesis SBC. 54 When bank loans are large, the market perceives the problem of
managerial exploitation and devalues these firms, since large loans are associated with a
high probability of tunneling and empire building. When the firms under the controlling
shareholder as the government, corporate values decreases 1.0% with a 1% larger ratio of
bank loans to total assets. When the government has no controlling position, corporate
value decreases 1.3%. When an entrepreneur stays in control, the market does not
perceive bank loans as a negative signal.
In my set of control variables, I find that corporate value is high when the firm
has a concentrated shareholding structure, supporting Shleifer and Vishny (1986) and
Shleifer and Vishny (1997). However, I cannot find a significant relation between
corporate value and ownership concentrations in the firms under the control of
54 As suggested in Section 3, there is no clear predication of Hypothesis CF on the relation between financial leverage and corporate value. Titman and Wessels (1988) and Rajan and Zingales (1995) find that there is a negative relation between the market-to-book value and debt ratios in developed markets. Their findings may be driven by the risk of financial distress (Fama and French 1992) and by the tendency for firms to issue SEOs when P/E Tatios are high, which decreases the leverage ratios (Rajan and Zingales 1995).
110

entrepreneurs. With instrumentalizing capital structures on its determinants, column I
confirms the U-shaped relation between corporate value and the sizes of government
shareholding. It is further confinned with the negative relation when the government is
not a controlling shareholder and the positive relation when the government holds more
than 40%.
I also find that a firm with a longer history has a lower value in column 3. A
larger-sized finn has lower corporate value in the state-significant firms and
entrepreneur-controlled firms, but I cannot find a significant relation between value and
size in the govemment-controlled firms.
6. Further Discussions
This section discusses whether these two hypotheses are contradictory. I argue that banks
are not only snared by the firm managers but also trapped by the government owner.
6.1 Are Hypothesis CF and Hypothesis SBC Contradictory?
I set up the two competing hypotheses to highlight an implicit assumption of
classical finance theory that firms operate under hard budget constraints. When soft
budget constraints are the institutional reality in an emerging market economy, such as
China, debt governance fails to function. Debt then plays a facilitator role for managerial
agency costs. Under soft budget constraints, the theory of debt governance collapses.
That is, soft budget constraints are a blind spot in corporate finance theories so far. The
debt governance theory is correct in its implicit assumptions for well-established markets,
III

but it should not be applied to emerging markets. Put another way, these two hypotheses
are contradictory with their predictions, but the logic is intrinsically consistent.
6.2 Whose Fault, Firm Managers or Bankers?
Managerial agency costs of bank loans require at least two cooperative players:
firm managers and bankers. Under the principal-agent theory, effective corporate
governance is necessary to control managerial agency costs. Managers in government-
controlled firms are subject to the government-based corporate governance, which is
better than the corporate governance with dispersed shareholding structures, but the
distortion exists. The government shareholder not only pursues cash flows from the firm,
but also promotes social welfare. The private interests of bureaucrats further complicate
the role of the government shareholder. Within the government's business "empire", the
career promotion of a firm manager not only depends on corporate performance, but also
on how well the managers follow the wills of the government and bureaucrats.
On the other hand, firm managers can hold up the political concerns of the
government on social problems from shutting down a government-controlled firm and
keep borrowing from the banks to expand the resources under their control and exploit
corporate wealth for personal benefits. The magnitude of managerial agency costs
increases with the size of bank loans.
This moral hazard also exists for the bankers of govemment-owned banks. La
Porta et A (2000) argues that the banks under the control of the government are
politicized. Because of government ownership, typical Chinese bankers perceive
themselves as the financial agents of the government. The bankers follow the orders of
112

the government to providing the government-controlled firms capital rather than take care
of the profitability of their own banks. The blame for a low profitability in the banking
sector is often shifted to the policy loans that take place under the direction of the
government. Because of the ultimate backing of the government, these banks have no
fear of bankruptcy. The classical incentive problem of SOEs also exists in these
government-owned banks. Relying on the government owner, the banks are not strongly
motivated to provide due-diligence monitoring. On the contrary, such bankers may tend
to lend to a firm with a high managerial agency costs, since a corrupted firm manager
will share the private benefits with some individual bankers.
In the process to shifting capital from government-owned banks to government-
controlled firms, the firrn managers put some money into their own pockets and squander
other money for personal purposes. There are some cases that some Chinese managers
with a nominal annual salary of $4,667 bought real estate in London or lose millions in a
Las Vegas casino. This corruption problem is so extensive that the cleaning-up cost of
bad loans may reach half the Chinese GDP.
The moral blame of managerial exploitation of bank loans should be attributed to
both firm managers and bankers, but the fundamental cause is the institutional
arrangement of government ownership. When the government becomes a businessman,
its own complex interests provide the opportunity for some individuals to capture
personal benefits. Dual government ownership of banks and firms inevitably causes soft
budget constraints and the failure of debt governance.
113

Conclusion
The traditional corporate finance theory argues that debt governance is "harder" than
equity governance (Williamson 1988). Debt governance functions by threatening to sack
incumbent managers whose firms are under financial distress, forcing out free cash flows
in going concerns and encouraging due diligence monitoring activities. Using the data of
the companies on China's stock market, I find that financial leverages are associated with
decreasing Tobin's Q, increasing expense ratios and increasing administration
expenditures. There is a failure of debt governance. Furthermore, I find that firms under
the control of a government shareholder have a higher integration of debts and
managerial agency costs. The softness of budget constraints influences the magnitude of
the correlation between bank loans and managerial agency costs.
I argue that soft budget constraints fundamentally change the governance role of
debt. Under soft budget constraints, debt is a catalyst for managerial agency costs. That is,
debt gives the managers a free hand over a larger pool of capital. Over-investmcnt and
tunneling destroy shareholder value. The problem of debt governance in China is even
more profound and deep-rooted than that of pre-crisis East Asian countries. The
facilitator role of debt in managerial agency costs could one day bring down the Chinese
economic giant.
Soft budget constraints result from the widespread businesses of the government.
The dual government owne rship of the banks and enterprises inevitably results in
114

bureaucratic coordination of economic activities. 55 Due to the political benefits of social
stability, this coordination rationally obstructs bankruptcies. Firm managers can snare the
financial institutions of banks. Surveying competition and corporate governance literature
on central and eastern European economies, Estrin (2002) argues that privatization alone
is not enough, enterprise reform also requires effective corporate governance and hard
budget constraints. However, this chapter suggests that privatization is a pre-condition for
hard budget constraints. The fundamental correction of the failure of debt governance
requires the government to desist from owning and conducting business.
55 My findings concerning the governance vacuum in government-control firms, with the major creditors as the government-owned banks, provides new evidence to support the inefficiency of government ownership of banks (La Porta, Lopez-de-Silanes and Shleifer 2000). The argument of governance failure enriches their "political" theories.
115

Appendix i: Data Sample: Sources and Data Selection
There are three main electronic databases of annual reports. Internationally, the leading data vendor is the Taiwan Economic Journal (TEJ), but the TEJ database has a large number of missing values. The domestic investment bankers and securities analysts tend to use the Genius database. The Hairong database provides information on the large
shareholders' holding stakes. My data set also combines some information from other
sources. In 1994, the Company Law that formally legislates the organizational form of the
joint stock companies with the Anglo-American featured corporate governance structures
took effect. In the same year, the China Securities Regulatory Commission introduced a
series of six rules called the Contents and Forms of the Information Release by PLO,
which fortriatted the annual reports. My data sample therefore starts from 1994.
Describing corporate features and mapping of the ownership structures are based on the
most recent data of 1998.
This chapter imposed two restrictions on my sample. It excluded fund
management companies, as their operations are distinctly different from industrial
firms. 56 It also excluded the firms that do not issue shares for domestic investors; 57
otherwise, I would have had to use the share prices from the markets of foreign investors,
but such market values are not comparable. After these restrictions, the sample used to
examine the relation between state shareholding and corporate value includes 287
companies in 1994,311 in 1995,517 in 1996,719 in 1997 and 826 in 1998. Altogether,
the main data set used in this chapter has 2660 firm-year observations. The following table reports the sources of my database. The main data source is
the Genius database, but I complement it using a number of other databases. With regards
to accountancy and ownership data, the validity of the data sets is crosschecked, and
missing points were made up, based on annual reports from a website of the Shenzhen
Stock Exchange http: //www. cninfo. com. cn/.
56 Furthermore, due toregulations, fund management companies are excluded the government shareholder. 57 A-shares are the shares denominated in Chinese currency and traded on either the SSE or the SZSE. There are also so-called B-shares, H-shares and N-shares, which are mainly for foreign investors.
116

Data Sources Reliability
Share price data Datastrearn Inc. Established International Renown Data Specialist
Accountancy data Taiwan Economic Journal The leading data specialist company in before IPO Taiwan and the major Chinese data
vendor to Reuters, Datastream etc.
Accountancy data after Genius Inc. More than 80% Chinese investment IPO bankers and security analysts rely on
the data provided by this company.
State ownership Genius Inc.
Board of directors Taiwan Economic Journal
Large shareholders Beijing Hairong Inc. The major financial data specialist company in Beijing.
Industrial classification Securities Times A leading newspaper on finance and securities in China
117

AppendiX 2: Multivariate Regressions: Models, Control Variables and Methods
Here, I introduce the basic setting of my econometric model and its variations. The
definitions of variables are presented.
Model Set-up
Examining the relation between financial leverage and managerial agency costs,
the basic model to estimate is:
Managerial Agency Costs= C+a* Debt +B* FirmCharacters +6
Following the conceptual framework in Section 2, the dependent variables of
managerial agency costs are perks, entrenchment and empire building. I use factor
analysis to load the principal components and construct the variable of managerial agency
costs. The independent variable of debt is mainly reported with the ratios of total bank
loans to total capital, but other gearing ratios are also tested. Based on the available data,
I control for a range of firm-specific shocks. It includes shareholding structure,
managerial shareholding, firm size, firm age, asset specificity and profitability.
Following Berger and Ofek (1995), 1 control for the industry-specific shocks by 58
normalizing dependent variables on their medians for the same industry. I also control
for the time-specific shocks by nornializing dependent variables on the five-year medians
of the same firm, since the macro environment keeps changing with time in China.
Discussing the influence of soft budget constraints, I not only test the interaction
term of debt and budget constraints, but also examine the impact of debt on managerial
agency costs within different groups that face different budget constraints. I then compare
the regression coefficients in different groups to show the differences in the impact of
debt on managerial agency costs.
58 There are two kinds of industrial classifications for Chinese PLCs. One is the five-industry code: manufacturing, trade, utility, real estate and conglomerates. It is used by most studies on Chinese PLCs (for example, Xu and Wang 1999), but the industry effects cannot be well captured by this over-simplified industry classification (Chen and Jiang 2000). The other is a two digit standard industrial classification as 21-industry-code, which is used in this chapter. Adopting this two-digit industrial classification is a significant technical feature of this study.
118

Factor Loading Analysis ofManagerial Agency costs
This table shows our construction of the artificial managerial agency cost ratios. Based on eigenvalues, Panel I shows that the three principal components of
administration-cost ratio, board-member-turnover ratio and investment ratio demand a
main common factor as Factor 1, which is the index of managerial agency costs. Panel 2
reports the influences of these three components on the index of managerial agency costs.
Panel 1: Principal Factors of Admin. Cost, Board Turnover and Investment Ratio
Factor Eigenvalue Difference Proportion Cumulative
1 0.320 0.321 2.473 2.473 2 -0.001 0.188 -0.011 2.461 3 -0.189 -1.461 1.000
Panel 2: Factor Loading for Managerial Agency costs Variable Exploitation Uniqueness Bartlett Score
Admin Cost 0.399 0.841 1.187 Board Turnover -0.047 0.998 -1.139 nvestment Ratio 0.398 0.842 1.187
Control Variables
The factors of size, tangibility, age, ownership and profitability can induce
spurious correlations between proxies of managerial agency costs and financial leverages.
Size With regard to economic fundamentals, large-sized firms have scale
economies and better access to bank credits (Chhibber and Majumdar 1999). On the other hand, corporate size affects governance. For instance, a large-sized firin draws the
attentions of the media and therefore closer monitoring. I control for size effect in my
multivariate analysis. Tangibility The asset structure or the assets' tangibility influences firms'
growth and corporate valuation (Vilasuso and Minkler, 2001). The scales of managerial agency costs probably systematically vary with the structure of corporate assets.
119

Mortgage borrowing depends on the tangibility of assets and so asset structure influences
capital structure. A spurious correlation between managerial agency costs and financial
leverage is therefore induced by tangibility. In addition, the tangibility ratio also helps to
identify the growth potential of a company. Age A firm with a long history can establish its reputation in the debt market
and so firm age influences debt ratios. On the other hand, managerial agency costs, such
as the entrenchment problem, is expected to vary with firm age. Finn age needs to be
controlled for.
Shareholding structure Corporate governance literature (Shleifer and Vishny 1997) argues that a concentrated shareholding structure improves' corporate
governance and therefore reduces managerial agency costs. The creditors decide their lending policies and scales with reference to the shareholding structures. Herfindhal
index is a proxy of the shareholding concentration by calculating the weight of the ten largest shareholders' holding stakes.
120

W 11-01
to -el
Piz 9 cl
04
10
le
M, te
. 15 cu ,0
le
. ID
e
4o . 92 (0
0 m im
0
cö
4
CO
0 C. )
ot
4> 04 0
<0 00*
V I
1> vo 'o
*


Chapter 3:
Financial Institutions, Investment Risks, and Determinants of the Chinese IPO Underpricing
123

1. Introduction
China's new stock market has grown rapidly. Starting from scratch in 1991, this market
has become the second largest stock market in Asia within about a decade. One unique
feature of this stock market is severe IPO underpricing. The average first-day returns are
267% with the median as 13 1%, which is higher than other countries around the world.
300%-fT - ___ IM
250%
200%
150%
C
100%
50%
0% !J Iýd """ ýaQý931W lpd 1"-AL'Uý&' IM If, WII; IM old IM " 'ýA If" NPI PXI IM MMI 'ý" "M
EM -jlj 0 -FU TM-, -E 20 MM ýi =0 Uý
n<j! LL M (13 U3
CL) - IM CU a) Z0 Q- 0
<M a) Z CL
a) W U) Z
ZD
Comparing with industrialized countries, why are the Chinese IPO underpricings
so severe? This chapter addresses this question by documenting the deterrnmants of
initial returns of the Chinese IPO shares.
China Securities Regulatory Commission (CSRC) requires to price IPO shares
with net earnings per share multiplying by a fixed multiplier. The issuers choose the
specific multiplier, but the regulator sets the cap. Although the average price/earning
ratios in the Chinese secondary market were over 30 most of the time, the multiplier was
124

set as between 15 and 20 from 1992 to 1999. It is binding for most firms. At least 100%
of underpricing comes from this regulation. Econometric investigations show that the
pricing cap contributes to 134% underpricing, although it interprets only 24% of the
variance of initial returns. Besides the pricing cap, the government also imposes the "IPO
quotas", which restrict the quantity of TO supplies and enlarge the scales of underpricing.
From 1991 to 2000, the total equity capital raised in the primary market is RMB Y656
billion and the TO shares count for 22% of total shares in the public listed firms.
Empirically, the sizes of offerings significantly decrease initial returns, which interpret
4% of the variance of initial returns. Financial regulations are a main determinant of
China's TO underpricing.
The investment risks coming from asymmetric information about the value of TO
firms can interpret the universal TO underpricing around the world. Besides it, there are
some particular investment risks of the Chinese primary market, including lockup risks,
tunneling risks and grabbing risks. Investment risks capture about a half of variance of
initial returns.
After making public offerings, the firms need wait in a queue to be floated, which
produces a long listing time lag with the average as 305 days and the median as 34 days.
During this period, IPO subscribers' investment is locked up. Illiquidity of equity
investment shall be compensated with discounts of share pricing. I find that one day's
delay of the flotation increases the initial returns by 0.4% in China, which captures 38%
of the variance of initial returns in the univariate analyses. I further find that, the length of
the lag is not exogenous, but depends on insider shareholdings and underwriting costs. It
125
suggests that there are some faint traces of rent-seeking activities in China's primary
market.
During a long lockup period, managerial agency costs can keep reducing
corporate value. Before going for trading on the stock exchanges, there are no signal from
share prices and no market for corporate control. Insider control and weak corporate
governance, however, are featured with China's unlisted firms. Stealing of corporate
assets is a big concern of IPO subscribers, who inject new capital into the firms. IPO
shares need to be discounted with tunneling risks. I find that the sizes of insider
shareholdings are a negative determinant of initial returns. With a larger sized insider
shareholding, insiders are less inclined to destroy corporate values by tunneling and IPO
underpricing becomes less severe. It shows corporate governance plays a role in the
Chinese IPO underpricing.
Being another feature of Chinese 1POs, the largest issuer is the government. In my
sample, 66% IPOs are share issue privatizations (SIPs), in which the government sells
part of ownership in State-owned enterprises (SOEs) to the public. Shleifer and Vishny
(1998) argue that the government owner has a grabbing hand, which ensnares corporate
wealth to maximize social welfare. The grabbing risks in former SOEs shall compensate
the locked-up IPO subscribers with a discount of SIP shares. However, my data shows
that there is no pricing differential between SOEs and private-owned enterprises. The
sizes of state shares do not significantly influence initial returns, either. The government
shareholder may not only have a grabbing hand but also have a helping hand, which
disguise the direct effect of issuers' ownerships on initial returns (Tian 2000). On the
supply side, this insignificant effect of issuers' ownerships suggests that SOEs go public
126

for new capital and therefore price IPO shares as high as private issuers (Dewcnter and
Malatesta 1997). This chapter suggests that, different from Biais and Perotti (2002), the
political interests of the Chinese government are pursued through financial regulations
rather than through deliberate underpricing of SlPs, which would further sacrifice the
financial interests of the government.
Financial institutions do matter (Allen 2001). This chapter concludes that the
Chinese financial institutions, including both financial regulations and investment risks,
bring about severe IPO underpricings.
This chapter makes the following contributions to the IPO literature. First, by
providing a novel analytical framework and concrete empirical evidences, this chapter
contributes to rationalizing the Chinese IPO underpricings. Second, with systematically
documenting China's primary market and econometrically examining the determinants of
initial returns, this chapter contributes to investment strategies in China's emerging stock
market, which is opening to foreign investors. Third, this chapter casts some light on
understanding the role of the Chinese government and therefore adds a political
dimension to the financial phenomenon.
This article is organized as follows: Section 2 describes China's enterprises
reform and its primary market. In section 3,1 review the IPO and SIP literatures and
present my hypotheses of investment risks and financial regulations. Section 4 examines
the determinants of initial returns with univariate and multivariate analyses. Section 5
further discusses the underlying motivation of regulatory underpricing. Section 6
concludes this chapter.
127

2. China's Primary Market
This section illustrates the features of China's stock markets and provides the institutional
backgrounds of share issue privatizations. This young stock market is a complex web of
the government's political and financial interests as well as of private benefits.
2.1 China's Emerging Stockmarket
There are two stock exchanges on the Chinese stock market, the Shanghai
Securities Exchange (SSE) and the Shenzhen Stock Exchange (SZSE), founded in
December 1990 and April 1991 respectively. The regulatory authority is the China
Securities Regulation Commission (CSRC), founded in October 1992. With the legal
origin of socialist laws, China's financial institutions featured with interventionism of the
government into market places. Under the direct administration of the Chinese central
government, China Securities Regulatory Commission (CSRQ functions as an
authorized ministry governing the stock market. Although legal enforcements are
typically weak in emerging markets, CSRC regulations are effectively implemented with
their high publicities.
The government sets two main objectives to develop this stock market: 1) to tap
domestic savings; and 2) to reform unprofitable, inefficient state-owned enterprises. 59 As
a symbol of capitalism, the stock market was one of the most controversial issues in
China. With the voting rights based on their investment, shareholders decide corporate
59 The stock market mainly serves to raise capital for enterprises and to reform the SOEs, according to the speeches of Liu Hongru, the then CSRC chairman in January 1994 and Li Peng, the then Prime Minister in September 1997. In contrast, the British government under the Thatcher administration sets the privatization goals as 1) raise new revenue for the state; 2) promote economic efficiency; 3) reduce government interference in the economy; 4) promote wider share-ownership; 5) provide the opportunity to introduce competition; and 6) develop the nation's capital market.
128

strategic matters. The rule of one-share-one-vote is the law in Chinese PLCs. It implies
that capital employs labor in these firms and in the firms modeled after PLCs in China,
but such a capital-labor relationship is taken as exploitations in the Marxist theories. The
conservative wing of the government opposed the development of a stock market, which
was initially founded as an experiment in 199 1. The then paramount political leader made
the clear pledge to close it down if this experiment turned out to be against the interests
of the people. 60 However, under the leadership of the reformists and the management of
the CSRC, the stock market has become an indispensable part of Chinese economic life
in only eleven years.
In table 1,1 report the rapid development of the Chinese stock market. Between
1992 and 2000, the market capitalization increased at the average rate of 57.5% per year.
At the end of 2000, the total market capitalization was over half of China's GDP. The
number of listed companies grew 62.0% annually, from 53 PLCs in 1992 to 1088 PLCs
in 2000. Increasing by 26 times from 1992, there were 58-million investment accounts by
2000. If one family has one investment account, there are 16.7% of households invested
in stocks. Given that most of investors live in a city, a rough estimate is that nearly a half
of urban families participated in the stock market in 2000. Still under the leadership of
Communist Party, China has been significantly transformed into a society of investors.
This expanding stock market also provides a platform for large-scale privatization. With
attracting equity investors, severe IPO underpricings contribute to the development of
China's stock market and the transition of the society.
60 In a talk during his famous tour of south China (January 22 nd , 1992), Deng Xiaoping said "whether securities and stock markets are good, whether they are dangerous, whether they only belong to capitalism, and whether they can be used in socialism are allowed to keep observing, but we should do the experiment. Trying for a couple of years, if correct, open it up; if wrong, close it down. "
129

tn
c4.0 00
.00 Eý B- 4. - zj EA ; - = ý, iz
cu -0 00
0 _X cýO 1,2
01 0
t) 0 , ,m 4. C, 3
0
e0 <D >A CD = CD .=0
.. ti-- ;u 14. - r.
u 10 0 "C U
; zb e* 9, 0
> -g 0 -c mc
X
1.4 X
w rA "0
0 0 OD r- IT Nt
co 0') Y) 00 0)
fl m co r-- C) -: CR CR -:
0 co OD C C) ,
- U'j 0 co 0) 00 CV
- 00
' C14 : ': - C14 LO LO U ) U )
CD CF)
0 Lf) 14, LO
't 0) r- CN (D C)
(C! I, - i co i
0) (3) - ce) 00 1- CY) Cf)
cN CIO
l I"
Oo CY)
C) (0 C*4 00 co
rl- C-i
I, - It CII) U')
C) C, 4 q C) U) OC) 00
4 c)
Cý (Y) V) C%4
(3) V) 04
CY) 0) C\l CF) 0) LO LO
C) CY) 0) CN
: 14, CII)
Ci c4 tl- r- V) c) ci 1 CV) Itt
C-i CNJ
6 ce)
(0 co 't It tl- C) 7 r- I- cl , d: Uý -: q cý CD Cl)
' . I- LO ý- Clj
Y ý LO IRt c1r)
ý C) C 4U ) CV 0) C ) c1r) CV) ý C14
Lf) CY)
04 ý CY) C\l (0 Lc) Cf) ý, ý Lo C) "ý
0) q: qrý N CY) (Y) C6 LO ý U) to c3i L6 C'4 It
It 0)
C) 00 00 14, CO ý 0ý OC) ý Lq Cl C) IR
CY)
- .. ': , 4: C) CY)
, C-4 0) co V- cf) C)
04 ý rz
C: )
V 00
CY) Cl) Zý Cl C) CY) C14 IRt co IQ r*.: N
co CY) CY) U) CY) co lqt Cl) V)
co CN N C4 I
0 týz
t
C%4 0)
CV) C*j q,
C") C) e
N 00 'IT 0) C14
0) c ) LO C6 I, - CN vi Cý
0 0 cn
c m 0 cu 40-0 CL U) E0 x C: 15 (1) C 0) E c M 0 a) L) F U)
(1) CD
10 C r- 0) N
r- = 0) N
(D > :3
a) r : F3 ca -0 (a :3 '
S ac M (D
c r_ ca a)
0 0 0
> 2m
42) CL
:ýE MD Fu >
(1) =
== CO U) L: ) U) U)
CL co 0
L) <
1 (a
' 10 ( ) 0) U) 0 (a
Z 0
? . >1 a CL w (1) CO 3: (o ýo E w
45 (1) CD 0 o co >
LL z 0 13- a
0 rn
On the other hand, the Chinese stock market is still in the early stage of
development. 61 Firstly, there are many anecdotes of corruptions in the primary market
and insider trading in the secondary market. Rent-seeking activities are reportedly
rampant. Secondly, the government frequently intervenes in the market. For instance, a
policy commentary on the high P/E ratios of the stock market at the end of 1996 brought
down the stock index 32% in two weeks. 62 The government also uses other methods to
influence this market to achieve its policy targets, including IPO quotas documented in
this chapter. Thirdly, the market is segmented. Table 2 in the following page presents the
official classification of shares. About 60.8% shares are restricted in tradability. Only
4.9% shares are denominated in foreign currency, whereas the Chinese currency is not
freely exchangeable. On the other hand, foreign investors were only allowed to invest in
the thin B-share market till very recently. 63 It separates domestic investors from
international investors and severe 1PO underpricing happens only in the domestic stock
market.
61 Wu Jinglian, a preeminent Chinese economist, compared the Chinese stock market to a casino when be discussed some illegal activities of some traders. However, the investors continue investing in this stock market and most economists argue that the problems within the Chinese stock market are on the track to be corrected, although they are relatively more severe than these in developed economies. 62 On December I Ph, 1996, when the stock index was 1258, CSRC announced twelve measures to strictly regulate the stock market and People Daily published a commentary article. The stock market immediately crashed. On December 25h, 1996, the index was 855. 63 The qualified financial institutional investors were implemented at the end of 2002, which allows the very large investors, like Morgan Stanley, to invest in China's A-share market.
131

-0 r_ coi
> 0
u0 ýn "C (D --
421
: 11 r. :i 00
0 L) 0 0 -, gj L4
0 ti ;ý QU 4.
ce
0
- (L) 0e
cu u0
gý e
CO U. ) ECEý, CD Co rý CO (Z) (DO ce 5ý, c> r- M cz (Z) «) P-) ýý C: ) c) c12 CD C) - 5ý, CD Lt) CI) Co
MýC: ) C% (»
- C, 4 C, 4 C) Co e) (N CD (» - mý CD CD
(D Co CD c21 CD 1-e
a 4 C: ) C) cm
c:; cý c: i c5 ! Cýý CD c:; c; ýý c:; -: a; ýý cý cý c; ! ýý c=; cý
(0 c> Co (0 i73, c> m a Qi' u-) CD - Sý- c> Lt. ) c» i73ý CD C, 4 C»
c> co ý7; ci cý cc! c> CO C: ) ; s; r? C-4 C)
e> - C) - c> C: )
cn CO (D CO c) c> c> e
cl) C> CD 00 c> - CD --e
- cý cs cz, c> (Z) tc, > cý C: 5 cý cýS c: i -: c; �zý> cý cý ci ! ýý cý ci
c> Co ýe ; -, - CD ce c> ý C: ) c) C> Ln r-- b- CF) C»
c> Co m C, 4 c> Co r-- LO CD 00 C, 4 C, 4 C> OD - CO CD C) m cý4 C> CD
C: ) Co CD C> C> Izt
e c> r-_ CD CD -e
cý eýý cý c; cý ! ýý c5 c; c; cýCS c; -Z C=i c; c> CD, cs cý
'r, - ;; > CD Co `e C> Co CD Eý, CD Co le C: ) cq c> c) r-- e cl c> ll I El IA r- C: ) r-_ cý Co
cý> Cli C: ) 00 m
CIY C: ) 0) i C> C: )
m C) (D e c > to 4 C: ) r-_
c:: ) N- C> ýe
C=i c:; cz; c: i c; cý c=; cýS c; cý cýS cý cý c5 p c: i ci
c:, Co Co g C-) m --- gg ýr Z& C) r- Cm (Z) r- P- C) 00 M cýJ CD OD
Co LO C: ) Co C, 4 CIY CD 00
CD rl_ CD C> m x- CD CD
- C-2 CD (Z) C: ) C: ) C> -
Co cý> CD c> ý c>
ci C c; c> cý 2ý cý c> cý cýS c; -: c: i cý. c:; cý c; cý<s ci C=i
- ý; ue .2-
0 0% t) r, 0% -
S t) 20 ýe !ýZ A- ß.
.ý4, R :2= ý4 9
ýg to ID
m ce = Ici . c) 0
=u- -a
r- P. 0 .=U r >U
", "L» -, .9 tn 10 �3 tj r
ce
ýM -
W t9 2e a) 14
0 ký ce >< ce -CJ Q) - pý 0
:1 0M
- . -A IV 0 2 .-ET4 Ea pý
r. tr. ' 9) ,u
= i. 2 402 14
rX= Z
-, m cu
0 to 20ZQ ý 2
Gn E &) 4 U0b. c)
-0 - ZA
M-
ý
U . 0 0- ,. r-
E x ' >ý 0 u . - 4 > <ü ýý- 0 Z! m u- - cu
0- 0 . . 0. -
,z. ýC. - - l
-m e p. ý N. E Z) , ) k. u m. -u
> UMU0 4-. c) r- < (L) u
.m
20 O = >
. - Ln -0
JD ýi ý ctý U=0
>- E > OZ .< , Ln "a c) ý 8 -0
0 %
. iz .= A-- fA k.
00 CA
9
(L) pý &) >
0 s. 0 4-- ce 1. = ýi P. 2: 0 CU
tu tn U. 0
Co ßý U ;ý -0
t) -0 cu - t) 'ZJ
m gz ý 0) (1 JD -0U 1 ID U CIL- JD ý. ce
, (U r- u0 0 -5
121
E ce -, 9 -g 102 n. 2 s4 W -U4C
- >ý rA 10 cn -0 0 t :
>, AE0 ;9 e (U bo tu 4) .>e. r. 0 rA
>u
u cn 0 r ce (L) 0 u 4- ý. = u0 ce
: : g- tý W J
rýý! zj u2 . 84 0 ý,
ý4 0 8 . to 0
9 ;j - =-
ý: -m Z 0 A c71 -,. d A
- 0 =U-0 C ý. . - m ce to 9
vi w < to - ;ýU
E tho 4. t vi &) r. 0
ä.
m' to e t> ý, 9
-5- - -- 0 ýb2
0., --u "0 ce
>c -g E==
u. e 14 e
s . .4
(D r- ce 42
Zg ýc2 r
g 'J
Z. O W
bo t- 0
4, u 6
'-, 4 . -., : u2 4:
gý En 1,11 =
(A Z CU 1 = IZJ u
K > Ci. 0 .0
to Ln c: ; 0
'; EE ý00
10
. Eý - ce r c) 0 Q) Ici -
12 0 to 0 cj .EuE 21 0 rj r, . (4 ,
*42 ce N. &) > JI p -ci
.v t) -- .-,
=2 "0 - EýE cn 0
:ee = W= ce
w Co r. b. 0u .I t> i - -0 0
9) 1-- 9
O ý- ý r- .-0
0u = u2
r. - ge 0Z E ýý 0 - >� ce E 1. - W N "0
u cn >l 0 c> 0 0 to -cj r. u 4., to r- r. -ci 0 . P. lu U -0 -U *r- t: *
*ý; -= Gn ä ce m - !m= 'm En tr. 9n
U cj u ce
g* 20 g2 0u- 00-- :i -u cu
ti. - uU ce gi m -h U &. cu 0- ,::
:r W. 01 J = *4 m 9 0 z2 0 tu äC
1-- - bo 9 r. - ä ýr. 2 &) 8.. Co =
. ý: Z 0< M t) c) 4)
E «, m0 0 , 1
9 A (n =
- '11 5 cu 0n - ý= rA
- :D2 mZ I
E 0 -4: 0 0 04-- r- u- 0 t) fj gn
*4 8> in 0 1. u
- r m 0 4-.
= u ce >ý A-
=2 ß. 0 0 >,. M -= ;14. %Z 00 0 r. u X
rA 0== U- 0
- 0 '
(L)
jz Q ý> to N. r. p c: m0'. ' Q U
j - C) rn ý vl v u r4 u
,ýZ- 0 ch v to
CU = 0 "0 = CA N 41r 6 gz
,0, ý. A .=- X ýj r. - U- r. Am . ce Z0 4.
. 0 cu 0 "0 1 ce 0X
- 4-. 4) 0-0 CJ :s < u2 =9 r. ; 4)
c2. ce Co s. 5 -0 ,
to W
rz 9 Z;
2 =e' Q (n
"s 0 ' 2 rA M u 9)
ýe !ý `) 0 ce zi IL) 0 r:
öo .äe0 j . -0 ;s0
1 e E. Z, -
,0 e2 . !ýý
. R r, ' IL)
2 t ýa 10 2v -, i 0 0 to 4ý p. -lE >J r. 42 0
u 12
Gn cu m cn a) 92. 8
-2 U) CO) to *s -2 j, »-
m cu -0 2 2 2 2E0 r- 0- m alm (L) m -i Co
to cu - W En
mcM cn ,. c- Pi
rq rn

More importantly, the government is not only the regulator, but also a major
investor on the stock market. Based on the method of La Porta et al. (1999), Tian (2000)
shows the ultimate shareholding structures of these PLCs. Although pyramids, cross
shareholdings, and reciprocal shareholdings are not widely used in China, the
government directly owns 28% of all the shares of China's public listed companies and
ultimately controls 44% of China's public listed companies. There are huge financial
interests of the government in the stock market.
The heavy weight of government shareholding comes from the history of China's
PLCs. Share issue privatizations are a significant feature of China's emerging markets.
Tracing down the antecedents of 771 listed companies, I find that there are 63.8% of SIN
among total IPOs. The other issuers are joint-stock companies, township-village firms
and entrepreneur-led firms.
2.2 Underwriting and Share Allocations
Company Law (1994,1999) stipulates the following conditions for a company to
apply for listing on the stock market: 1) it has share capital of at least RMB Y50 million
(US$6 million); 2) it is newly-formed under the 1994 Company Law or has a three-year
track record; 3) it has more than 1000 shareholders who each hold shares with a nominal
value of over RMB YIOOO; 4) it has offered at least 25 percent of its shares to the public
or at least 15 percent if the share capital of the company is more than RMB Y400 million
(US$46 million); 5) it has not committed any serious violations of government
regulations in the last three years. These PLCs are therefore large-sized profitable modem
firms. In fact, the rest of China's enterprises take the PLCs as role models.
133

tl
u
71
t: l
-0 (1) ge w r. CA 0 rA 0
0
10 . - W
0 m
Ci. "0
"2 ý9 mo
ci
10 0
0 (L)
.%g ä la
(A to
>
ý -0 Q
f
rn Q.
W
, 0 0 = 0
E2 0 -w om 0 - 4 -ý4 o 0
0 o 0 so
a- U) - 10 -z; u bo to u
N M
M u (/I U u cn V) a v) cj, ) m
: 73- . C-- OR 04 LO co (0 It 0) 0) CV) qt U) u-I q-
oi c) c6
o (6
C) u)
0) 4 m 4 0) i -1 6 c) i v v co
Aý r- -7 cl OR Uý ', - Uý v: (3ý cý
U. ) C) V) 0)
ýt C*4 00
C) C) (D
CY) (3) 'tt
: I, - CO RCT
Cf) M Ict
Itt M M
co cv) (1)
0) 04 Cl)
D U)
co
00 C')
C'4 co
m 04 , 00
C14 co ý co
0) F-
ýý M (D
U) 04 C-4
'0
0 U u 6 6
6 U , w . o L)
.a
0
C/3 [A rA u
-
"
-
rp
*
-45
u -
u
*= =: ) C/3 4 Z g g Z C/I to a) En (U A co . u r. V. to - 6 -tý I ý
0 0 Z u cd >
04 CO '-T to co I'- CO M
CIO
m c Z) 012-
t) l::
%; = -
ý2 -0 Cf) 0 AD ß 0 i f= 0
0 Gn
N u2
> Ln rA 0
0 t) -,
4. E
05 vr-,
,
ci tz.
0
�o, 4")' CU 0-
- 0. Co cj bu "=
:j
- Co 2 > e
ce - 0. U 5.
92
0,0 mu
0ý -0 Ei . ýn
tz. u -ci lý u ý. .2 00 cn 0 C, cn 0, U >, r': A .2R "> 40 >. -4
2 , 44. 0 1.
cu e. ýn Z
0 r- n. 0 ce n �i
=0 Ln Pw -0
'n >, u P. ' (A j. U U
9-2. ý: ýe 0 14
= 0 >u0. u9u >u 9 g. 2 .= 9 g, m' Ei -Z 4 . ý -ZU V) LO (»
Co e2 Ln
LU
0 CD OD
0- r- LD (» ;Z
U) -0 c 0 0 c Ci.
(D 0 0 ri
CY) ,A -
-r- u) 0
(D CI) c
in. A > U) 0 CL
O< L u) a: 2 c 0 tu
'IT m

During the initial public offerings of these companies, the investment bankers
mostly work as brokers and lead the selling of shares to the public. The issuers often have
the responsibility for unsold shares, although the shares are usually oversubscribed.
Underwriters, in this chapter, broadly mean the sale managers of offering shares.
Table 3 reports that the top ten underwriters have 64.8% of the IPO market. Most
of them are associated with the government and are very well connected to the regulation
authority. For instance, the top three national brokers, Huaxia, Guotai and Nanfang, were
directly founded by the central bank and the managers were former high-profile
bureaucrats.
Although there are as many as 129 underwriters in this competitive market, most
of them make substantial profits. The average net profitability of investment bankers is
24.45%, whereas the PLCs' profitability was 9.03% in 2000. As discussed in the
following section, the P/E gap between the primary market and the secondary market
gives these investment bankers an easy life. In China, underwriting of equity shares is
called "the profession that makes big money even when they take naps all the day". 64
The underwriting methods consist of online offering, 65 certificate application, and
saving-deposit lottery, besides some issues that occurred before formulating the
underwriting procedures. Panel B in table 4 reports these allocation methods. The
tradable-A shares for the public to purchase are normally oversubscribed and all the three
64 Quoted from China Securities Daily (December 27h, 2001). 65 With utilizing the trading system of the SSE or the SZSE, the main underwriter works as the sole seller of the offered shares of one company and the investors apply to purchase at the offer price during the offer period. The main underwriter organizes the lottery of the application for initial offered shares and the winners of the lottery become the shareholders at the offer price. This method of online offering has been frequently used during the recent years.
135

methods use some lottery systems to allocate them to the applicants. In the lottery
mechanism, the probability of receiving hugely underpriced IPO shares depends on the
amount of applicant capital. A large investor has a better opportunity to be allocated with
some TO shares.
2-3 Pricing Methods and IPO quotas
As an emerging market and a transition economy, China is featured with the
frequent changes of regulations. Before founding the stock exchanges, there was no
regulation on pricing of shares issued to the public. There were 90 PLCs issued shares in
1980s' and face values of shares were often taken as issuing prices. Since 1991, it was
stipulated that issuing shares have to be authorized by the government regulator and the
allocation method of IPO shares shall use the lottery method. The disclosure requirements
of IPO firms were specified in 1994.
The CSRC ruled out of the auctioning method, including book building, since it
puts the offering prices out of the control of the regulator. The pricing method was
stipulated as the multiplier method until 1999. The offering price is required to be the
product of net earnings per shares and a chosen multiplier. 66 An issuer sets a ratio as the
offering multiplier with references to the price-earning ratios of similar firms on the stock
market. However, the offer price, particularly the multiplier, has to be validated by the
CSRC. In several internal guidelines issued during different periods, the CSRC sets the
ceiling of the multiplier as 15 to 20 times earnings, which is the pricing cap of IPO shares.
66 In most periods, the CSRC requests the firms to use predicated corporate earnings after authorized by charted accounts. However, from end of 1996 to September 1997, the CSRC requires the IPO firms to use predicated earnings as a main determinant of IPO prices.
136

As following chart, there is a gap between the average P/E ratio in the secondary
market and the IPO pricing multipliers. Since the P/E ratios in the secondary market are
usually more than 30, the government regulator intentionally brings about severe
underpricing with the multiplier cap.
P/E Comparison
90.00
80.00 70.00
60.00
jjj 50.00
40.00
30.00 t
20.00 - 10.00
0.00 1993
0 IPO Pricing Multiplier 0 Secondary Market P/E
Before 2000, the CSRC also exercised a strict quota control of public offerings
and flotation. 67 The CSRC only allows a certain amount of new shares to be public
offered and be floated on the stock exchanges and rations the quotas to each of the 29
central government ministries that oversee various industries, and the 32 provinces,
municipalities, and autonomous regions. In essence, it is a licensing mechanism that
promotes rent-seeking activities. The enterprises desiring for going public have to devote
67 The system of quota control and restricted applying has been replaced by the model of recommending by the local government or tile ministries and examining and authorizing by the CSRC in 200 1.
137
1994 1995 1996 1997 1998 1999 2000

resources to competing for the quota. After being allowed to make initial offerings, the
firms still need apply for a date to be floated onto the stock exchanges. Because of the
urgent need of capital, many firms make public offerings and collect IPO proceeds before
knowing a date of flotation. There is consequently a time gap between going public and
going for listing. With a median of 34 days, this listing time lag can range from three
days to 12 years.
Controlling the pricing, stipulating the IPO quotas and assigning a waiting period
for flotation in a strong seller's market, the CSRC creates severe IPO underpricing in a
China. This chapter devotes to understanding the determinants of IPO underpricing
before 1999.
At the end of 1998, the Security Law was stipulated, which allows that the issuers
and underwriters decide the prices of IPOs, but it shall be still authorized by the
regulator. 68 The pricing cap is then gradually phrased out. The Guotaian database reports
the initial returns of the firms listed till end of 2000. The average initial returns of the
firms listed in 2000 are 151%. As the average initial returns of the firms listed before
2000 are 284%, it can be taken that the regulation of pricing caps brings about 133% IPO
underpricing. The effect of pricing caps on initial returns is econometrically investigated
in section 4.
68 In March 2001, the CSRC abolishes the IPO quota and pricing of 1POs depends on the demand and supply in the market. There are some firms still having high initial return. Baodao Gufen (600130) uses the P/E multiplier as 49.71 and achieved the first-day returns as 119.06%, but Chengming B (2488) seasoned A-shares with the P/E multiplier as 30 and only has the first-day return as 6.97%. Book building begins to be popular in China.
138

3. Determinants of the Chinese IPO Underpricing
This section reviews the literature of initial public offerings and share issue privatizations
and proposes the hypotheses of financial regulations and investment risks to interpret
severe Chinese underpricing.
3.1 Analytical Framework
There are some papers documenting the extraordinarily high underpricing of
Chinese IPOs. A comprehensive survey is provided in table 4.
Using different data sets from different data sources, these papers report that the
average initial returns range from 142% to 949%, the median range from 119% to 24 1 %.
All of them find the fact of severe IPO underpricing in China. With some problematic
econometric methodology, 69 they make the attempt to investigate the determinants of
underpricings, including listing time lags, offering sizes, non-tradable shares, offering
proceeds etc. Some papers further make the attempts to rationalize the Chinese
underpricing with the classical theories of asymmetric information. In contrast, some of
them argue that China's institutional features bring about this extraordinary underpricing,
particularly the long listing time lags. The rationale of Chinese IPO extraordinary
underpricing has not been concluded or articulated yet. New research is needed.
69 Comparing the means and medians in these papers, the distribution of all the used samples in existing research is highly skewed. I use the Shapiro-Wilk W test to confirm the non-bell-shape distribution of initial returns in China, but the regression methods of the existing papers on China's TO underpricing adopted the regressions-mainly OLS-with the assumption of normality.
139

,z
PL,
ti : 11
-Z
IQ
I
10
. C. 2
"0
ýE -0 U E. ) 10
ý
s (D
-ll
43 -ci
fn 0
4) to b.
0 4 0
40.
.
CL. il> > 6 0- 00 C. 112 0 Ei öZ 0
0 "0 *Z r. cu ,u r.
c3- U ri ed 4. c) 0
IL)
5E "- 9 :ý c, -, e »2 Z
K 0- ä Ivill 0 a
jt- t- 2 E r. -0 e2 e 1.0 cn 1
E (A 4) , u 8. ýz
70 .: Z 0 pý IL) 0
l= . ý!
9) N >
Ei rA U ý * -Z: "0 - ý =lu - n, '
- *Ei 1- 0 0 Z 4ý Z C) 0 to , ýO
(A + ++ ++ ++
2 .9 (A 0 (A =
0.0 40 rn Gn cn rA
u= 0 0
ý 110 0 0 0 0 W.
, -2
0 cý - (> 0-,
.Z cu ß. eti
4.0 9. ) -ci Q g - , .2 1.2 1.2 -. Z ,e c6)
Z 00 00
rq %0
011 ýe
V) rn
rq cý rq
V-b r-
A - rn ýt 0% rn - -j
10 IZ rn V) %. 0 0, (D 00
all Ch Ch (> CYN ON
Cw
E ei "0 to 9.2-
i c9 rA
c ce P , ,5 < e
0 1
et ý Z
ID = -0 ei in
LA u w
- 2 Ciw E t! rq
00 0
00 kn
ce Gn r4 fn vi vi
c> 1 c% >!, ' , '-
. rq 8 ' , (D % cm u CD
ýw- 2 1-1 :2 L - e (D CU
;4 '0
cl ký 93 et e' 0. � -1 ii 27 a:
CL4 gi pý -0 t g
Z ý, :Z* Z
ý, ý Mg
(D IT

The scarcity of capital is a common feature of emerging markets. Although going
public is costly, many firms compete for IPO quotas. Because of the restriction of capital
flows, if not being an entrepreneur, China's domestic institutions and households can
either deposit their money in banks or invest in shares. Given the bad-loan problem of
China's banks (Tian 2001) and the low interests of deposits, there is a high demand for
equity investments. IPO shares in China are rather like a good, which is different from
industrialized countries. The analysis of demands and supplies fits the Chinese situation.
My analytical framework of IPO pricing is formulated as the following chart.
P
pa 1
pa ...............
Pf pf-I PIE
'' .... 11 ........... T), t4r-onc, ran Al
Offering Shares Investor Subscription
QL QC QF.
D.. -
The demand curve of the investors is BE and the supply curve of the issuers is OD.
In a competitive primary market, the equilibrium of demand and supply, point E, prices
the IPO shares at PEwith issuing QE amount of shares. The demands of investors are
actually depressed at this stage, which is because of the asymmetric information about the
intrinsic values of the IPO firms. The process of public offerings disseminates
information. After knowing better the quality of IPO firms, the demand of shares
increases and the demand curve shifts from BE to GH on the first day of trading. Since
141
the quantity of IPO shares cannot be changed immediately, there is a temporary rigidity
of supplies. The supply curve is OEF. On the first day of public trading, the share price
therefore increases from PE to PF. This IPO investment risk is rather universal, which
may also induce Chinese underpricing. 70
The Chinese regulator uses IPO quotas to restrict the amount of issuing shares and
the supply curve of IPOs consequently becomes the line OTG. The market equilibrium
shifts from E to B. Furthermore, the government regulator stipulates a pricing gap as the
line ACD, which requires that the pricing of issuing shares must be below P.. Because
of the high demand for equity investments, most of issuing shares shall be priced at Pm.
The partial equilibrium of the primary market is consequently becomes A. Investors
purchase QL amount of issuing shares at price P.. Financial regulations of pricing caps
and IPO quotas consequently induce a shortage of issuing shares as AC. On the first
trading day in the secondary market, the regulatory pricing cap is demolished; whereas,
the immediate supply of issuing shares remains the same. Because of the supply shortage
AC, the prices of IPO shares shift from Pm to PB and the market reaches the new
equilibrium at point B. The gap of AB is the regulatory underpricing. I hypothesize that
financial regulations bring about Chinese underpricing.
Similar to the rationale for the change from PE to P., the share prices further
shift from PB to PGwhen the repressions of demand by IPO investment risks are relieved.
I further hypothesize that investment risks are another main determinant of China's IPO
underpricings.
70 The so-called investment risks are to capture the depressed demands. To some extent, the investment risks may include the risks originally generated from Chinese particular financial regulations.
142

3.2 Investment Risks
IPO underpricing is a universal phenomenon. There is 18% of money left on the
table in Anglo-American primary markets during the last two decades (Loughran, Ritter
and Rydqvist 1994, updated in 2001). The theory of asymmetric information is so far the
most recognized interpretation of underpricing rationales. It argues that the investors are
afraid of the winners'curse (Rock 1986) or a negative information cascade (Welch 1992).
IPO subscribers' worries mean that there are investment risks of primary market. The
IPO-specific investment risks depress the demand of investors, which is relieved after
flotation. It provides a theoretical foundation of the shift of demand curves from BE to
GH in the above chart.
This shift of EPO demand curves and the consequent change of equilibrium prices
also exists in the Chinese primary market. Furthermore, it shall be larger in China than
the Anglo-American economy; not only because the information is more asymmetric in
an emerging market, but also because there are some Chinese-specific investment risks.
High IPO investment risks are compensated with high returns on the first-day trading.
The following sections specify the Chinese IPO investment risks. My sub-hypotheses of
investment risks may not cover all of the risks in Chinese primary markets, but it can
provide a good test of the demand shift from BE to GH in the above chart.
3.2.1 Infonnational Risk
Beatty and Rock (1986) argue that the expected underpricing is an increasing
function of uncertainty. IPO underpricing of a better-known firm is lower. A larger-sized
143
firm is better known than a smaller-sized firm. A firm with a longer history is better
known than one with a shorter history.
Following the universal theory of asymmetric information, some IPO investment
risks can be examined by:
Hypothesis 1.1: Initial returns of IPOs are a negative function of corporate size;
Hypothesis 1.2: Initial returns of IPOs are a negative function of corporate history.
3.2.2 Lockup Risk
There is normally no liquidity in primary markets and the subscribers have to hold
the shares till flotation. Different from Anglo-American markets, the listing time lag in
China is unusually long. The average listing time lag is 305 days with a median as 34
days. For instance, the Chengdu Hoist Ltd issued shares to the public at RMB YI in
January 1990, but was floated on the Shenzhen Stock Exchange in March 1998. During
more than eight years, there is no liquidity for TO subscribers of the Chengdu Hoist Ltd.
In another extreme case, a firm even needs wait for twelve years to go for public trading.
The long listing time lag means the problem of illiquidity, which is the lockup risk.
Similar to informational risks, this Chinese specific investment risk depresses demands in
the primary market. If the lockup risk of a firm is higher, investors shall require a higher
compensation by discounting its IPO shares further.
Hypothesis 1.3: Initial returns of IPOs are a positive function of listing time lags.
3.2.3 Tunneling Risk
If the shares of a firm are listed on the stock exchanges, the change of share prices
may promote the board of directors or the market for corporate control to discipline bad
144

managers. However, during the lockup period, the IPO subscribers cannot sell out the
shares. Share prices cannot change and there is no signal to prevent from some moral
hazards that destroy the value of the firm. With the long listing time lag in China, weak
corporate governance is more costly to investors in primary market than these in
secondary market. Johnson et aL (2000) terms expropriations of corporate assets by
insiders as tunneling. The investment risks of weak corporate governance during a long
lockup period are called as tunneling risks in this chapter.
Moral hazards of corporate insiders may happen by cheap-selling of IPO shares,
which tunnels corporate wealth at the expense of the owners. Shleifer and Vishny (1986)
and Kaplan and Minton (1994) argue that a firm with a larger block shareholder has
better governance. Large shareholding blocks improve corporate governance as large
shareholders exert great influence and remove managers who do not maximize
stockholders' wealth. As discussed in section 2, share blocks in China are non-tradable
shares, including the legal-person shares and state shares.
Hypothesis 1.4: Initial returns of IPOs are a negative function of the size of non-
tradable shares.
Jensen and Meckling (1976) argue that managerial ownership aligns the interests
of managers with the owners. McConnell and Servaes (1990) show that, up to a certain
point, corporate value increases with insider ownership. By the Chinese share
classifications, employee ownership is insider ownership, which provides the incentives
for managers and employees to protect corporate wealth. When a firm has high employee
ownership, insiders shall be reluctant to underprice the firms in the primary market.
Hypothesis 1.5: The size of insider ownership is a determinant of initial returns.
145

Another stream of IPO theories argues that underwriters may take advantage of
their superior knowledge of market conditions to intentionally underprice offerings.
Taranto (2001) shows IPO underpricing maximizes underwriters' profits. With
underpricing, the underwriters create excess demand and make the offering an "event" to
induce buyers (Shiller 1990). Underpricing therefore saves the marketing effort of
underwriters and also ingratiates underwriters with buy-side clients (Baron and
Holmstrom 1980 and Baron 1982). When they allocate shares to their favored clients,
underwriters profit from collateral business (Fulghieri and Spiegel 1993). Underwriters
further profit from underpricing when they act as post-IPO market makers (Ellis et aL
2000). Underwriters have incentives to tunnel corporate assets by underpricing at the
expense of the issuers. With a higher payment on underwriting fees, the issuers may
persuade the underwriters to refrain from internationally underpricing IPO shares.
Underwriting fees can reduce the tunneling risks of underwriters.
On the other hand, the underwriting costs are directly deducted from corporate
values. The demand of IPO shares can be depressed when there is no knowledge about
the specific underwriting costs. It is relieved after reporting the actual underwriting costs
after finishing IPOs. When the underwriting costs are high, the after-listing returns shall
be lower.
Hypothesis 1.6: Underwriting costs are a determinant of initial returns.
3.2.4 Grabbing Risk
Shleifer and Vishny (1998) argue that the government has a grabbing hand. As
Chinese laws have protected property rights, the firms with government ownership are
more likely to be ensnared by the government than private enterprises. Ensnaring
146

corporate assets is a process rather than a sudden act. A long lockup period brings about
this grabbing risk in the primary market. After listing on the stock market, the publicity
of corporate matters is largely improved and the government shareholder is relatively less
inclined to take advantage of corporate wealth at the expense of other shareholders.
Furthermore, investors in the secondary market have the option to exit before the value of
the firms decreases too much. Investors in the secondary market are less worried about
the grabbing hand than these in the primary market. Therefore, grabbing risks depress the
demand of shares during IPOs.
The literature of share issue privatizations argues that IPO underpricing of State-
owned enterprises is different from private enterprises. Assuming that the government
pursues privatization revenues, Perotti (1995) argues that the investors still remain
uncertain about the commitment of the govemment towards privatization. The
govemment may renationalize the SIP firms or grab corporate wealth for social welfares.
It implies that share issue privatizations have this particular grabbing risk.
Schmidt (2000) and Biais and Perotti (2002) show that, to ensure political power,
a market-oriented government should underprice IPO shares of SOEs in fixed-price
offers and then ration the shares to median-class voters. This Machiavellian strategic
underpricing builds up political supports for the reformist government. Jones et aL (1999)
show privatized firms are often dramatically underpriced. Corporate wealth is taken for
the political usage through IPO underpricings.
Share issue privatizations may lead to severe underpricing. The above arguments
differentiate share issue privatizations that the government is the owner of the issuers
147
from other initial public offerings where a non-government shareholder is an owner. If
there are grabbing risks in the primary market, ownership of the issuers matters.
Hypothesis 1.7: Ownership types of the issuers are a determinant of underpricing.
3.3 Financial Regulations
In the American Finance Association 2001 presidential speech, Allen (2001)
argues that finance theories have to take proper account of the role of financial
institutions. Regulatory framework is centered of financial institutions. These Chinese
IPOs are not issued in a competitive market, but arranged by an administrative plan. The
above analytical chart shows that the financial regulations of the fixed-pricing method
and IPO quotas bring about extraordinary IPO underpricing in China.
3.3.1 Earning Multiplier
The Chinese IPOs is priced under the eaming-multiplier method and the
multipliers are normally capped between 15 and 20 in different periods. The price cap in
competitive industries is set to promote the interests of the Chinese government, although
the pricing-cap literature argues it helps to improve corporate efficiency in privatized
monopoly industries (Beesley and Littlechild 1989). The CSRC stipulates the multiplier
caps with its internal guidelines. In most cases, the final choice of a specific earning
multiplier is apparently the bargaining result between the issuer and the regulator.
However, due to the scarcity of capitals in China, the firms wishing to go public to raise
capital are too many for the newly emerged stock market to take. The regulator has to
work as a doorkeeper of IPOs. In order to be allowed to make public offerings, an issuer
has to follow the regulator's opinion. The regulator has the dominant bargaining position.
148

The IPO pricing cap is literally mandatory. I suggest that earning multipliers play a role
in IPO underpricing.
Hypothesis 2.1: IPO multiplier is a determinant of initial returns.
3.3.2 IPO Quotas
The Chinese regulation authority not only restricts the prices of the IPO shares,
but also controls the supplies amount. Consulting with other ministries of the central
government, CSRC sets a periodic plan how many shares shall be allowed to be publicly
issued and rations this plan to local governmental authorities. The total supply of IPO
shares is periodically fixed and the issuing amount of each firm is controlled by CSRC.
As shown in the above, if the issuing size of a finn is larger than another firm, the line of
GT moves towards the right and the immediate after-listing price should be lower.
Hypothesis 2.2: Initial returns are a negative function of issuing sizes.
3.3.3 Oversubscription Rate
Under the offering quotas, the investors in the primary market are not ensured to
get the shares they subscribe. The underwriters allocate the shares by lotteries with
various specific methods. The lottery success rate of IPO applications reflects the
interaction of controlled supplies and depressed demands in the primary market. I use the
inverse of lottery rate as the rate of oversubscriptions.
Hypothesis 2.3: Oversubscription rates of IPO applications are a determinant of
initial returns.
149
4. Data, Empirical Methods, and Tests
This section describes my data samples, discusses the testing of hypotheses, and reports
the empirical findings. The measures of variables and econometric methods are presented
in the related tables.
4.1 Data Sources
This chapter combines the IPO, accounting and ownership data from the
databases of Guotaian, the Taiwan Economic Journal (TEJ), the Genius, the Hairong and
the SDC. These data are based on the company reports, audited by charted accountants.
The Thomas Financial International provides the share price data. My IPO sample
consists of 1124 firms going public from 1991 to 2000. Based on the IPO prospectuses
from 1990 to 1996,1 further collected data on the ownership types of issuers by hand.
4.2 Empirical Methods
Table 5 presents the descriptive statistics of hypothesized determinants of initial
returns. The spectrum of initial returns is grouped to six groups. The overpriced IPOs
with negative initial returns and the superstar IPOs with initial returns over 1000% are the
two ends of the spectrum. I then equally divide the rest of the firms into four groups by
the 25% percentiles of initial returns between 0% and 1000%.
Row I reports the means and medians of initial returns in its own category. The
average initial returns of 1124 firms are 267% with the median as 13 1 %. The Kurtosis of
initial returns is 26.7 and skewness 4.3. The Kernel density of initial returns is graphed as
bellow, which is not a bell-shaped distribution. The Shapiro-Wilk test strongly rejects the
normality of initial retuns. This data sample is highly skewed.
ISO

. 15
.1
C
. 05
0
One shall not estimate a highly skewed data sample with the ordinary least square
regressions, but, as in table 4, most of the Chinese IPOs papers have not taken much care
of the data structure. I'his chapter handles the highly skewed IPO data sample with the
bootstrap methods for both the means and medians. The Tobit method is also used when
regressing with earning multipliers, given that the data is naturally censored with the
pricing cap.
I report the univariate regression coefficients in table 5 and the multivariate in
table 9.
151
IR Kernel Density Estimate

* rý t2 ; Z)
'Z
,Z
-ý: cu r. a ,0, ý . -
0 0 LM 0
) C> - - v) :J- &) k- t .= Ei p- -. i
0
0 0 rn r, ) �6 t
C, 6 rn
-t cý
«) c; '; , , . týn. co 0 ', ' A- z
ý. A'. 0 cj u
cz 9 1
D; u t: 4 .
CL c> rq
>u> ur
- ce 10 D; 2 '; (U w- vl w 1-t
= -C2 VI 00 0 00 %10 L4 -0 g5" "0 0 e 00 CD C> r- 0% l'e - 0 e - rn
%0 . 45 -90.0 0> E
0. - u. KA * ý-4 .2 CY
9:. r- rA
0, -ý* ci '-, -2 0 uu a j .
0 C, 4 r: %2. ,K
CU > J, 8. .0 'ý g t: vi , r, r. '
.2' "s 0 tu «E (P - ! C, r- ý2 en o c> r- (7, oo (D ýo
m C'j CY% tA
'e r-
't - �;
r- �i Q) 0--u. W :j. =Zý
0 -- -0 9 - m 00
:j0r. 0 0-- ce u
cl, . CJ b. r. &) = Gn U0 "0 :1 cu rA :i lu = 00 cýO CU ý04. ) (A ei 0 t: - ,
c4 0
4 . 2 V r- u ZS 00 ;ý= **
e Ei -- t: e - wý 'z C, 4 o' (-i rn
c <2, ' ri ei
2 ýc .-C, 4 ýý .. 2- a) V- (D
- C: ) -
00 rn rq ý 00 rq rn Z,
zj U 'A
Q) 0 EL - ýemb CY
0 7, . ý T- 0-2 C> '. ' , -9 0*m--. - Pý 0 j2. = - 0 . j LZ ei fr? u 4.41 12.14- coý
&) U-2; 0 cu 0 - >N
-- t: vl %D "0 lzý 00 cý r- r- rn (> V)
-d0 0 o A .>ý Z
r9E r-: > >< 0e- -W m
- Z5 83 C> -ZJ ti- C) ýU U 4. C3F
ýa -ti 0W ta), - ýn ý cm 009 42 0 Ch
- (: r- %D (Z r- rn (D - tri en oý
00 ri
0, rq r- oo 6eE- e=Ug . - 0 0)^ zi :J06. IE 12 0 Er
-! d 0 > Ei
, -Z - $ý 'U t) u :100 j4 u. 0eQuu -0 A--. 1 ý7. b- u c> u0 CU = 4. ,j
42 9A
E -0
rz - m r-
%p -
«e - e
00 00
(3 CD vi
ýe : . rn c> ) 00
CD rn n fý r, ,
JM 00
0 Ln
0 (n 0-0
.-E .- q> c) A-- E ýä - v 12 9ý gf *E "0 .Z
N ci coý "8
4) 00 Ei "i! 2 uý -4 Z i-- uum6
J., =0. cd o k. bo -- > J2
W < < to
rA ni In 0
e0E- m
M rh
0 c
=eý 4ý &) ý (U 0 F Ni
0 Z
55 j2 b2 b. = 9 r. -; g tz Ln -; g (U ce t)
C> 0 >m0 r- - _w U ý. W ýd
eq tn

* * * * * rn - 00 " *
vi * *
* *
* * fn 2, f,
<D 00 00 r-
ll: vi
z 0ý v-,
1 t cý oo , r
r ri
p r- rý
rn r-1 t) f ) r4
�0 vi p C) ý ' vý ;Z «e rq cý d 00 CL rlý rn
,n `t rn -e rn rn r- c-o 00 r4 wý c> ri IQ - V- ci c; -i ci ýI: r.: C, 0 - ý; 4ý (> C> (0 cu
=Z Ct
(D ýe v-i en 00 c> c; 09 Icý ýI: rz r
en �i ID t: (D (D - - 00 00 rl en r ) r14 - - rý4 -
CY
C, 4
.2 "0 C) e 00 (Z C, 4 ýt i i V-b 00 49
CY
C> 0 �� > %0 0, ý, 0 (D ýý
A ý -! c4
ý 0
6 rý - 4
0, C", cý - ir
cý c; ý - rn le ýo f ) - - 00 -
ri N __: __; vý r-: kr; rz r4 10
(2% -
CD (D rq (4 el) r4 fl) rn
rq - 00 le 00 C> V) en .0 .0 ri Cyý Igt (> -
C:! 00 rn - 0
cý (5 - - (: 00 en rn rn CN - - 1
22
to Ei
;6 -0 - w -<> I Z= 7z -2 -
c 0 0 0 u
1. ý
*E En 13 ul Q LO) ce
1 - 5 u :
tn 0
:D rn h. w 0 ci
1-% 1--, 1--, (D - r-i en 00
rn vi

4.3 Univariate Analysis
Although row 3 in table 5 does not show an obvious distribution pattern of
corporate assets on the spectrum of initial returns, the coefficient of logarithm of
corporate assets is highly significant in column 8. A firm with a larger corporate size has
lower initial returns. It is consistent with the argument that a large-sized firm is better
known to the public and better information reduces underpricing. Hypothesis 1.1 is
supported.
A firm with a longer corporate history shall also be relatively better known and
therefore it should be less underpriced. However, row 4 shows an elder firm tends to have
higher underpricing. Hypothesis 1.2 is not supported. Row 3 and row 4 seem to have
contradictory results.
The listing time lag is incredibly long. On the average, a firm going public has to
wait for 10 months before listing. As for the median, a firm also needs wait for more than
a month. In the overpriced category, there are 74% of the firms issuing shares before
1994 when the regulations were not well established. In the regressions, one day delay of
listing increases initial returns by 0.4%. The R-squared is 38% in the mean regressions
and 34% in the median regressions. Being locked up in IPO investments, IPO subscribers
require a discount of IPO shares. Hypothesis 1.3 of lockup risks is supported. Given the
significance of the lockup risk, a further analysis is given in section 4.5.
The listing time lag may help to interpret why the univariate relation between
initial returns and corporate ages is positive. The correlation between the listing lags and
corporate ages is 48.3%, which is significant at 99% level. Hypothesis 1.2 shall be further
tested with the multivariate regressions that control the listing time lags.
154

Row 6 shows that the firms with large block shareholdings are less underpriced.
During a long lockup period, IPO subscribers are reasonably concerned on managerial
exploitation and a price discount of tunneling risks is demanded. By theory, the risk
decreases with an increased size of block shareholdings. Consequently, initial returns
become lower. Hypothesis 1.4 is supported. As a long listing time lag is a condition for
the existence of the particular governance risk in primary markets, the test of hypothesis
1.4 also needs control for the lockup durations.
There is not a distribution pattern of managerial shareholding or a significant
relation between initial returns and the sizes of managerial shareholdings. Row 7,
however, shows how marginal the sizes of managerial shareholdings are. On the average,
the Chinese managers only hold 0.5% of total shares. The median is as small as 0.1%.
Managerial shareholdings have to be reported to the public every half a year and it is
locked-up during the whole tenure of the managers. It possibly cannot send the after-
listing market a clear signal on the alignment of managerial interests and corporate
interests on the first-day trading.
I, however, find a decreasing distribution pattern of insider shareholdings on
initial returns. Insider shareholdings are approximated by employee shares. The average
size of employee shares is as high as 12% of total shares. These shares are distributed to
managers, employees and friends of the firm at the offering price. Except for managerial
shareholdings, employee shares are freely tradable after the authorization of CSRC. This
authorization may take half a year to be made after flotation. Given the size of employee
shares, outsiders shall perceive it as the alignment of insider interests with corporate
interests. The insiders with their own shareholdings have smaller incentives to tunnel
155

corporate assets and destroy corporate values. When the size of insider shareholdings
rises, the discount of tunneling risks becomes smaller and the IPO underpricing is lower.
Different from row 7, hypothesis 1.6 is supported by row 8.
Hypothesis 1.7 suggests that underwriters can take advantage of the firms during
public offerings. Issuers may pay a high fee to buy off the underwriters, but the
underwriting costs depress the demand of IPO shares. After floating, the risk of
underwriters' ensnaring is relieved. Since the final costs of underwriting are deducted out
of corporate values, the upward shift of the demand curve is at a smaller magnitude when
underwriting costs are larger. Row 9 provides the supporting evidence of this hypothesis.
For unclear reasons, the data of underwriting costs is missing in all the firms with initial
returns above 1000% in the Genius IPO database; whereas, the Guotaian database has
even more missing values of underwriting costs.
The possibility of political intervention is called as the grabbing risk. However,
the sizes of government shareholdings do not provide a good proxy of this risk. As
argued in Tian (2000), the government shareholder has double faces. With large-sized
government shareholding, the grabbing risk increases till a maximum point, but the
tunneling risk decreases with a better corporate monitoring than the dispersed
shareholding structure. The government may even provide some preferential treatments
to its closely held firms to increase corporate value, like tax rebates. Besides the grabbing
hand, the government also has a helping hand. Row 10 confirms that there is not a
monotonic relation between initial returns and the size of government shareholding. The
univariate analysis of grabbing risks will be further discussed in the following section.
156

In a short summary, my hypothesis of investment risks is generally supported in
the univariate analyses.
Row 11 shows a clearly decreasing distribution pattern of issuing sizes on initial
returns. Issuing sizes measure the supplies of IPO shares, which are a determinant of
initial returns. With increasing the issuing size, underpricing becomes smaller. The
superstar firms that achieves above 1000% have the average issuing size of RMB 24
million, much smaller than other firms. Hypothesis 2.1 is strongly supported.
Row 12 shows that the eaming multiplier is a positive determinant of initial
returns. Earning multipliers are chosen by the issuing firms, but they have to be set below
the pricing caps, which follow the internal periodic guidelines of CSRC. If there were no
pricing caps, the initial returns of an IPO on the secondary market shall have been
relatively lower with a higher multiplier decided by the high demands. Under the pricing
caps, I find that the earning multiplier is a positive determinant of initial returns. When
the multiplier gets close to the pricing cap, the decision-makers of this issuer shows the
care of corporate wealth and a good bargaining capability with the regulator. Ile market
may take it a positive signal of the quality of corporate management. Hidden behind the
earning multipliers, pricing caps influence initial returns. Hypothesis 2.2 is supported.
Table 5 also investigatges the interaction of controlled supplies and demands.
Row 13 shows that the after-listing market valuation increases with an increased
oversubscription rate. Supporting hypothesis 2.3, it confirms that initial returns are a
result of the interaction of demands and supplies in the primary market. My analytical
framework of China's IPO underpricings is empirically grounded.
157

4.4 Types of Issuers
Except for the grabbing risk, table 5 presents a clear picture of the hypothesized
determinants of IPO underpricing in China. To investigate the grabbing risk, I use
ownership types to classify the issuers into State-Owned Enterprises (SOEs), Collective-
Owned Enterprises (COEs), Joint-Stock Companies (JSCs), Township-Village
Enterprises (TVEs) and Entrepreneur-Owned Enterprises (EOEs). SOEs are fully owned
by the government and directly controlled by the government. Public offerings of the
SOEs are share issue privatizations. COEs are the firms owned by a local community.
Although the government has a big influence on most of local communities, the
government does not own COEs. The influence of politicians on COEs is significantly
less than SOEs. JSCs are the firms having more than one owner. Both the SOEs and
COEs can be one of the owners of a JSC. The politicians can also influence JSCs, but the
probability and the magnitude of political intervention in JSCs are much less than in
SOEs. As both the COEs and JSCs have more than one owner, I group them together and
name them as institution-owned enterprises (IOEs). TVEs should be the enterprises
owned by a village or a small town, but many private enterprises are disguised as TVEs.
More importantly, the TVEs are often under the control of a "strong man" and they are
operated as a family-owned enterprise. EOEs are typically private owned enterprises. I
therefore group the TVEs and COEs together and call them private-owned enterprises
(POEs).
Table 6 presents the distributions of key variables of different types of issuers. In
my sample, 63.8% of listing firms were state-owned enterprises, 31.4% institutions-
owned enterprises, and 4.8% private-owned enterprises.
158

The average first-day returns of the SOE issuers are 255%, IOEs 264%, and POEs
327%, although the medians are much smaller. The significance of the mean difference is
examined with the Johnson corrected T test. This test shows the initial returns of SOEs
and IOEs are significantly less than the size of POEs. The Mann-Whitney U test on the
medians confirms that the POEs have a significantly higher first-day return. It is
consistent with the empirical findings in firms from Canada, Japan and Malaysia
(Dewenter and Malatesta 1997). It seems to support the argument that IPO subscribers
are worried about the grabbing hand of the government, but the hypothesis of grabbing
risks need further investigations with control variables.
There is no significant difference among the offering multipliers due to the large
variance. The SOE issuers are not priced significantly higher than the IOEs or POEs. The
issuing proceeds are also homogenously distributed among these three types of issuers.
The government-owned enterprises pursue the issuing proceeds as much as the private
owned enterprises. It implies that the significant differences of initial returns between
SOEs and POEs may result from some missing variables.
159

I lZI F-4
A CL) = C)
l> 00 ýb AW-- t) Ei A ý2 E t) &) ýo (L) 0
0 t)
CE
.- filo -
. 2-, u, 10
a) vi �; i-- to AD 10 9)
., j r- "9 -5 5t 0.0 -tn -r- r. ! 4Z4
,r8.4. )
"g 10 0 ýo 2 ;6 > r. .- a). 0. )
a)
. ýc et
*E 505
0
83 'u 4)
.0e- . 52 e öz e -, -, CDJ . --
5 F- i2
ce
> 0
02 .- ti ., 7- ce rn r- -- ,UA ýä7 "= 4) 10 tr. 4) 0 : ý: -: s , b. t; -ti ,= 04 u= Kn g6
E
.- r4 -0 ýo .
- 4. q> --
Öl) 0 cl ": ß ý
=m 10 Iti
2 'CJ 4
uiý 40 0 0E0 ci
ý 04 a) IT 't co Cl)
C14 U) 00 ': 't- LO U)
U) 00 C14 Ui Lci ca cNi 0 F-
4 4 4 4
M
0) 0 "t
t co U)
ce) ce) LU
0 C*4 C'4
V Uý ai 6 ; C6 L6 C )
4 4 4
cn CV) 0 ýt
C*4 co (3) r- N
* co
w co cc) T- d cli C i q Cq U) LO
4 4 4
U) ce) U) m
C14 0 CC) ý- (3) C)
w ce) r- co IR IR 0 co Cý LO U)
U)
C: a C N c T r- . Lu
ca -0 (a a C13 -0 (L) a) (1) (1) (D CD
U)
CL
ca 0 CM (L E C: ca :3
10 1 0
0 , ýo

4.5 Listing Time Lags
Before reporting the multivariate analysis of determinants of initial returns, this
section further examines the lockup risk. As discussed in section 4.3, the listing time lag
is a main factor of IPO underpricing, counting for 50% variance in the univariate analysis.
Interestingly, similar to China, there is also a long listing time lag in Malaysia, where EPO
underpricing is 104%.
4.5.1 Endogeneity and Gamesmanship
In China, the length of the listing time lag is not a choice of issuing firms, but a
decision of the government regulator. The issuers have no idea when the flotation can
happen after going public, but it remains a question whether they can influence on
decision-makings of the regulator.
Because the holders of employee shares are not allowed to trade their shares
immediately after listing, these insiders cannot gain from high initial returns. The insiders,
however, can benefit from reduced lockup risks if the shares are listed earlier. After
listing, the insider shares can then be traded in half a year and it soon provides liquidity.
The advertisement effect and the probability of season equity offerings also add value to
the firm. Insiders therefore prefer to shorten the listing time lag. Can they manage the
listing time lag?
161
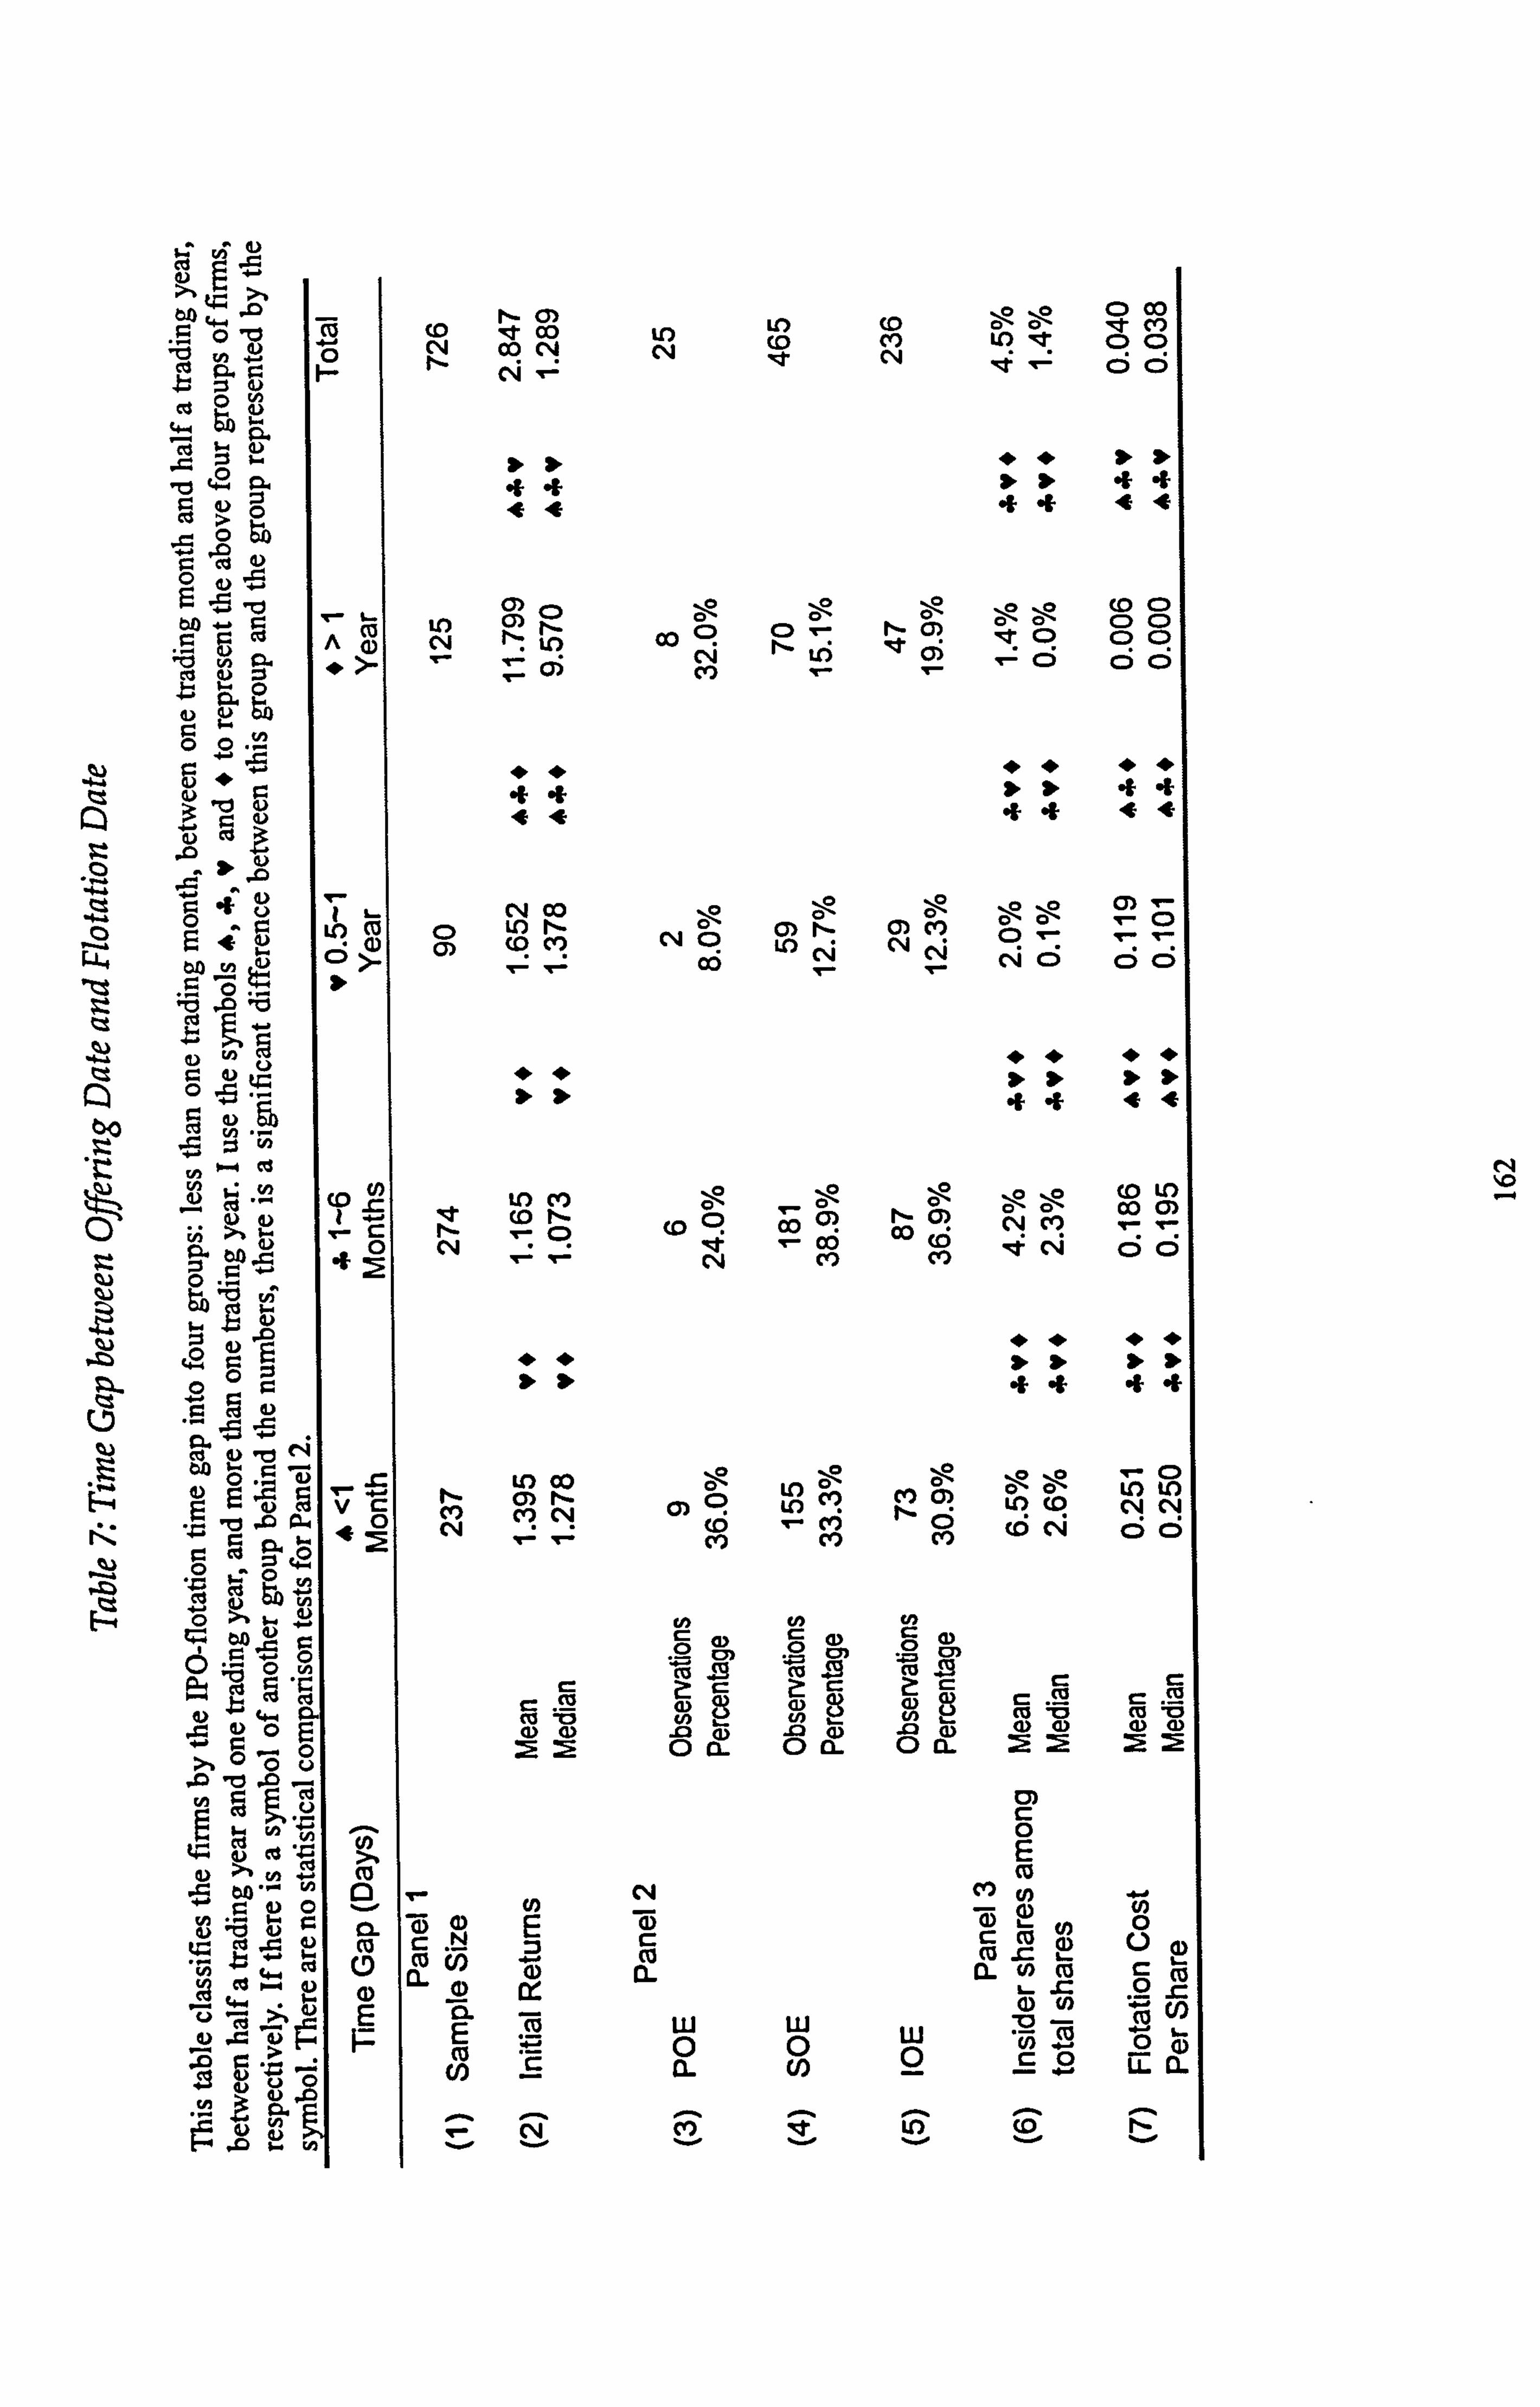
.. d) 9.
to ý iz Ei 0v
r- 01) OD tr) LO (C)
V -0 0
ä 0 00
m . 0 rli
r- c9 C, 4 (0
le ( ) cli
LD i
C: ) C> ää
b 10 C%l ý- ý
, :
>
5 o, -. r-, (7) (D C) C: )
r** cý CD C: ) c c : In Co
rq r1- tii ý ý
Z *> cr) C) C) C)
0 e) U =4
Z ý: 10 (L) 9u 4 -4 44 44
-2 u
l> (U AD
.2 ýg 2i t> 1 L- N CC) -. -0 äo- -., 0 -. -p 171 T. - CD
Lc) u) ;
C) LO rl_ N CD Lo p
cli c., 1 0, ; u c > cö c 10 ýo 10
t2 9 ýu -2 0 0
u kE: .2 LO 10 In ý 0 ;Aý, 2- 1
,c le r, -
(0 r- cý (09 Co oý 0 oý (0 r4 ei .. IV7 '17
u to - e 0 4 cq
-"- 00 ýt C, 4 C) 0
-= 0 u 4
-0 �; 0
0 r.
0
o ýE r m
"ý LO 00 L r) -., - --c-, -. 0, -LC)
LS: > iz
F - rz . g) ed - 0P
VC 0
r- m
m r- c4) N
C) (» ; LO Ci
- V ti r-
Gý 0
LO (0 N cq
rzz cj . -4 r- &. e 0 4 2
N 4 lr-: cc m ( ) e2 (0 N ci 6
2 r- c 5 c2 0 - 8. r 0 Z
0 U)
(D 0' (D 0 Z, 0 c: » 0
t: 5 4. CL * 9) 0E cu (D (L) c2 a) . 92 (L) 2 en 0 0) (D G) (D (1)
0 C) 11- C) CL 0 ci
.0 'CJ 0-
0
ce E g) >, , Z! m (0 -r- m-0 0 - C, 4 m U) ý, rý 00 ,A--N. =
10 u - CL -ö 0
to E - Q 0 Z
c: to 0
Co Co (A tý 2ý 4) (D
EL 0 0 12- a- U) m c
0 (0 tý . 1-,
fi >% - ce mg E CL E w w :p -ffi = > F- U) 0 (1)
Z: .0ww
N 1.0

4.5.2 Descriptive Statistics
To better present my data, I separate my sample into four groups of firms. Finns
are floated onto the stock exchange for public trading 1) in less than one trading month, 2)
between one month and half a trading year, 3) between half a year and one year, and 4)
more than a year. I use actual trading days to measure the months and years.
Panel I in table 7 reconfirms the results reported in row 5 of table 5. There is no
significant difference between the initial returns when the gap is less than half a year.
Initial returns increase with the length of the listing time lag after half a year. Most of
Chinese PLCs publish semi-annual company reports, which are not required by charted
accountants.
Row 3 shows that there is a larger variance of listing time lags for private-owned
firms to get listed. Of these, 36% begin to be publicly traded on the stock exchange
within one month, but 32% of them need to wait for more than one year. The percentages
of POEs in both the left tail and the right tail of the distribution are higher than SOEs and
COEs. There is perhaps a game between the CSRC and the private-owned firms. Some
POEs may lobby skillfully for a timely flotation and they succeed in gaining favors from
some officials in the regulation authority. Some POEs, however, are not good at lobbying
and the CSRC puts them to the end of the flotation waiting list. In contrast, the
distribution of the number of SOEs by time to flotation is concentrated in the range up to
less than half a year and it is higher than the percentage of institutions-owned enterprises
in that range. Ile evidences of the favoritism by the CSRC are not strong in this
statistical investigation, though.
163

Panel 3 in table 8 investigates the distribution of insider shares in the categories of
listing time lags. The insider shares are standardized on the total shares. On the average,
insider shares count for 6.5% of total shares with a lag of less than a month, 4.2% in these
of half a year and 2% in these of one year. There seems to be a declining pattern of listing
time lags on the size of insider shares, in which there is a shorter lag when there are a
larger proportion of insider shares.
With severe IPO underpricings, the shareholders of insider shares normally make
handsome gains, although they have to wait longer to trade the shares and pocket the
money. Considering the controlled supplies, the listing lag cannot bring about such a
sharply decreasing pattern for insider shares. In addition, the insiders have no idea about
the length of the listing time lag when they subscribe the IPO shares. It is the sizes of
insider shareholdings that cause the change of listing time lags.
Allocating insider shares to influential bureaucrats is bribery, but the firm
managers can legally pay a middleman to handle the flotation process. The middleman is
normally the broker. The fee paid to the broker is recorded as underwriting costs. Row 7
further examines whether underwriting costs have some pattern in relation to the length
of listing lag. 71 Tle general pattern is that, with increasing underwriting costs per share,
the firms get listed earlier. It seems to be a buyoff of the listing time lags.
71 The average underwriting cost per share for the firms to be floated in more than one year is RMB V0.06 per share and the median is RMB V0.00, since some firms did not use a broker to make the public offerings and they issue the shares themselves. The cost is recorded as part of the administration cost. It is consistent with an administration cost per share as high as 0.74 in this category.
164

4.5.3 Regression Analysis
The variable of listing time lags is transformed with the logarithm in table 8.1
then examine the effects of issuers' types, insider ownership, lobbying costs as well as
the market cycles on the listing time lags.
4.5.3.1 Ownership Types
When I regress upon the listing lag only with the dummies of POE and IOE, the
coefficients are insignificant. In fact, column I is not a valid econometric model, since
the F-statistic is not significant.
Column 2 shows that, when controlling for insider shares, the coefficients of POE
and IOE are significantly positive. That is, if all the firms have the same proportion of
insider shares, an SOE issuer has a shorter time gap between the offering date and the
flotation date. There is a sequence of listing time lags: POEs the longest, IOEs the second
longest, and SOEs the shortest. The proportion of insider shares in SOEs is significantly
less than in POEs and IOEs, which interprets the indifferent finding without controlling
the insider-shares effect.
165
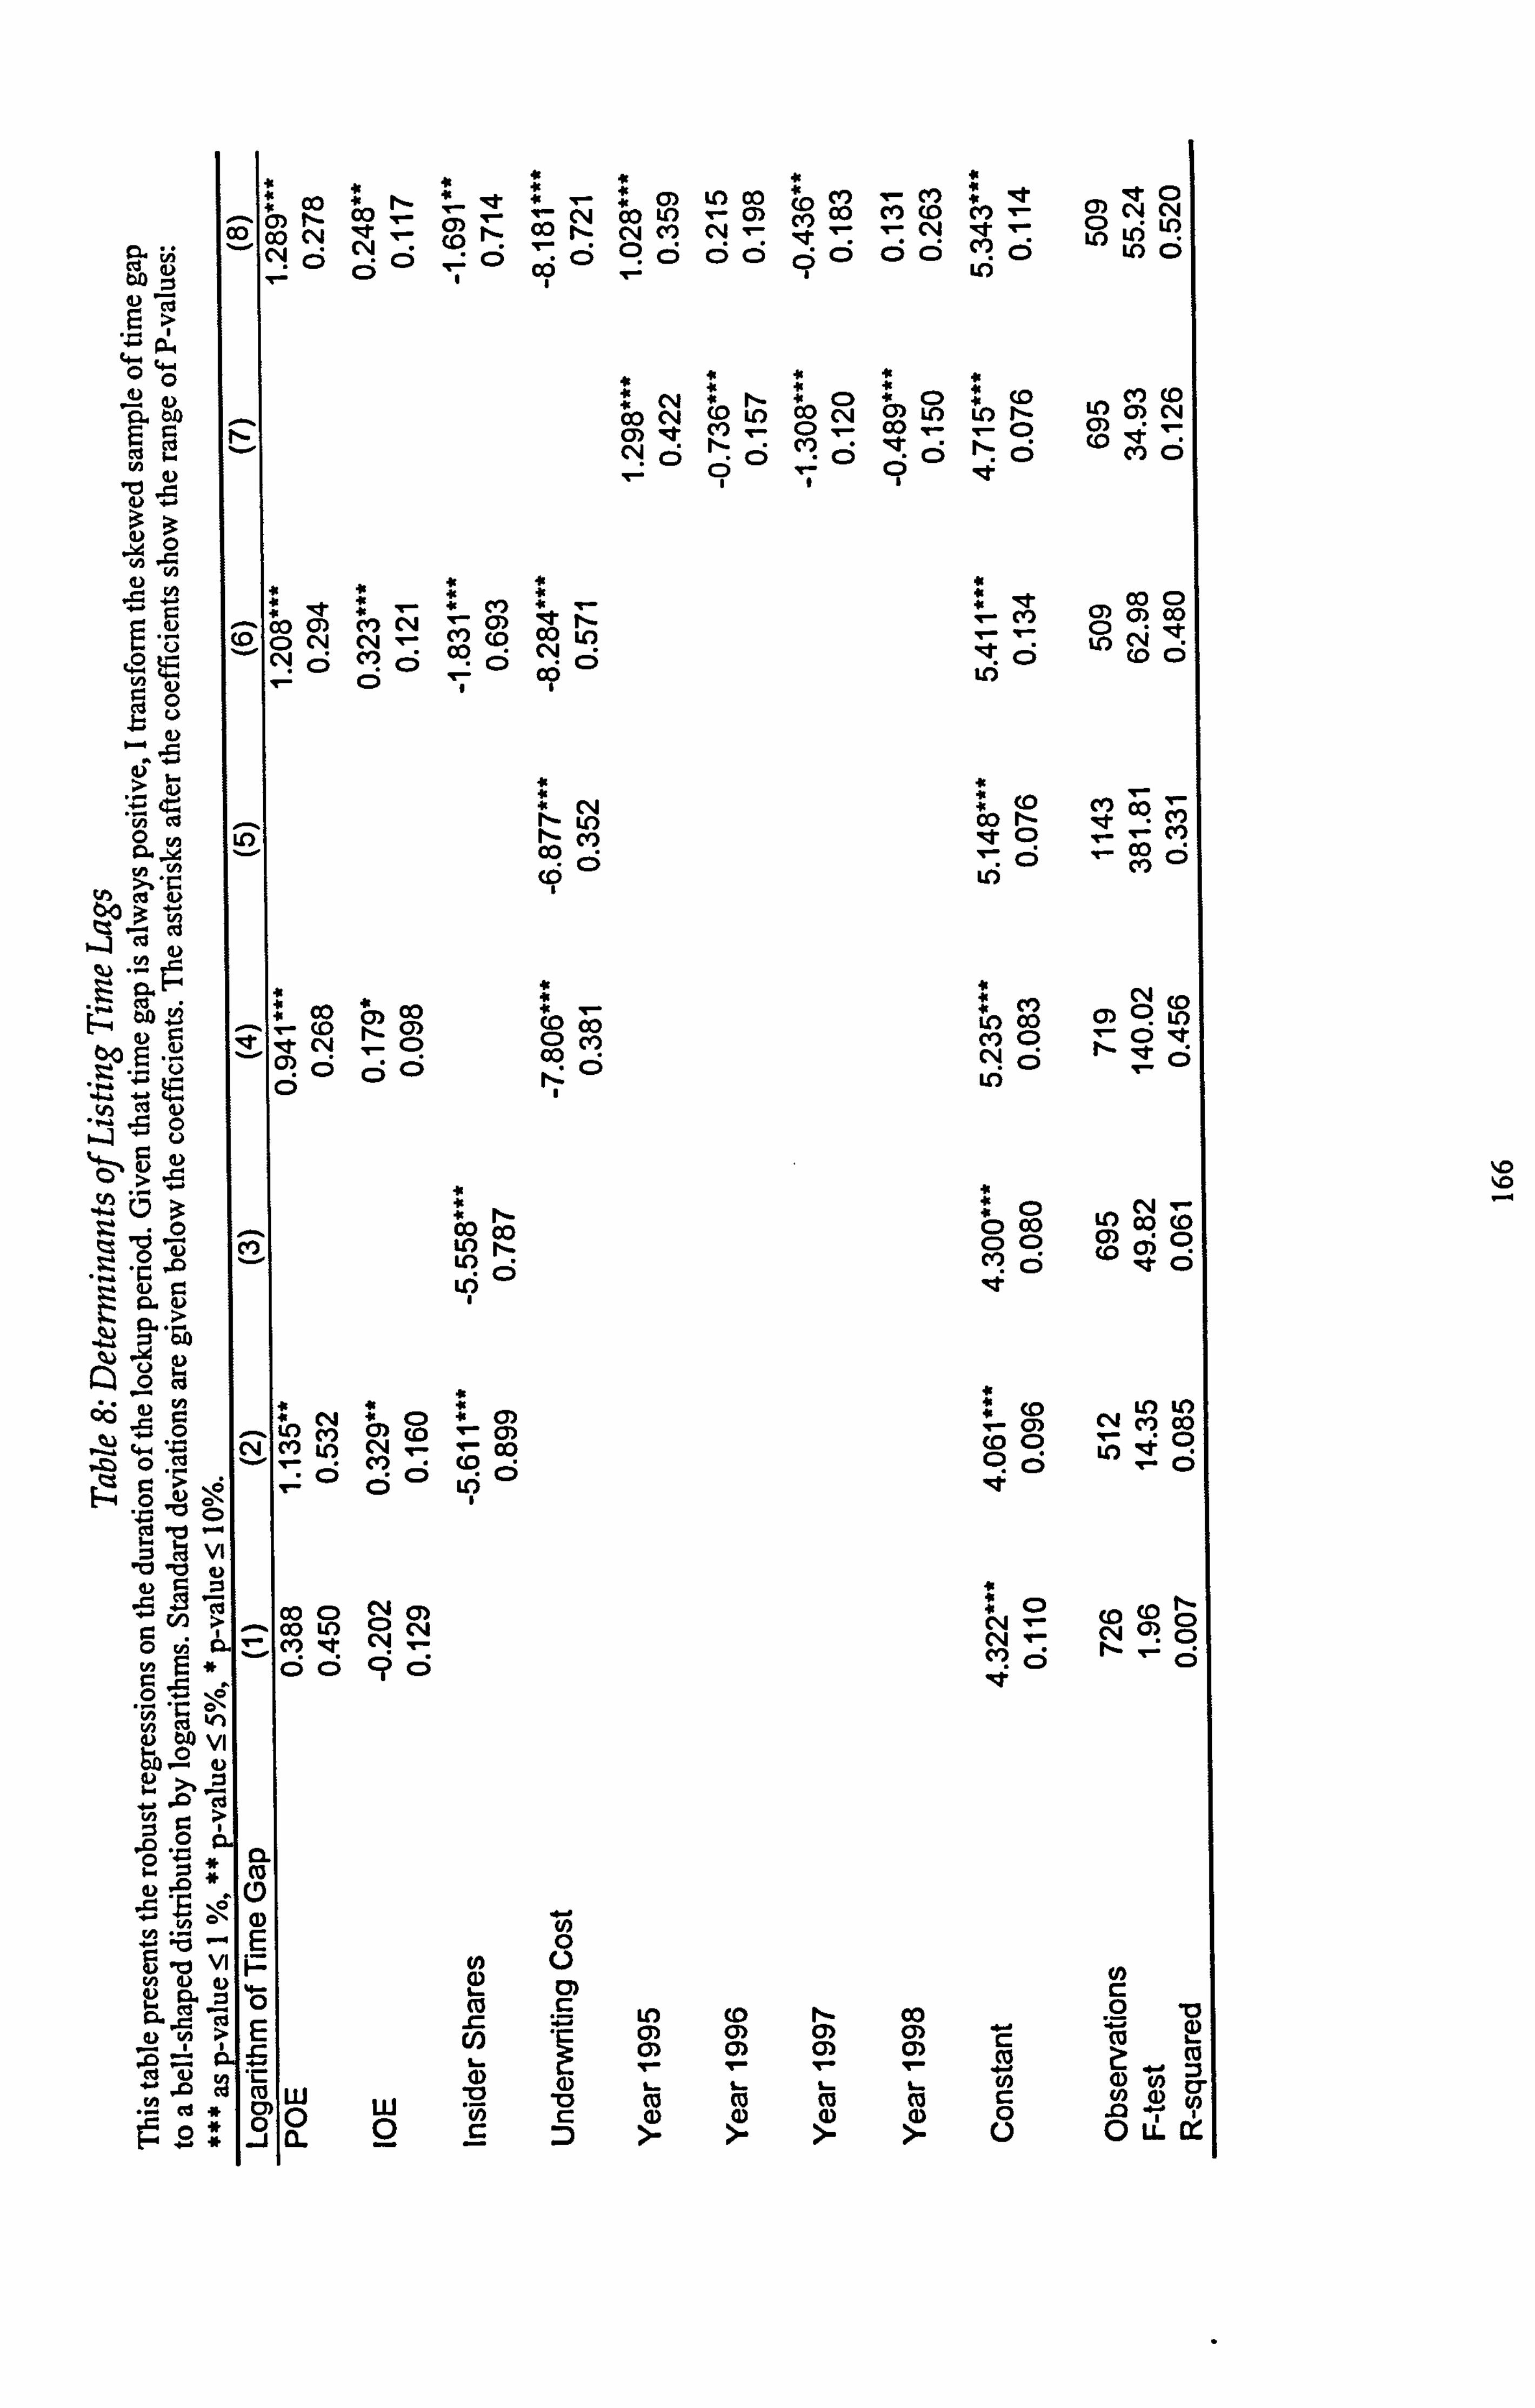
cc) cr) f- OD , , ý '2" r-
ý 04 CO r--
m
CO LD N Co
U. ) Co «m Co r- M ci Co Ný
M (0 c- vi e
't N C. 4 i ul
5 3
1
1 1 OD c4 C'4 5 cl 0 0 ö , cý c5
e: ;0 6 (5
: 0 c) ci ci
i 9 U) 0
5 r c: C> C 6 c LO #
, r, P,
1 00 C) c") ý! (» 't r-
OD 42
a C, 4 Cli
Cq (C: ) c( 3 00 C:
5 LC) C'!
cz; 52 cu , 9
u I= ca W
00 cli
CY) c; ; V) ; (1) C
"0 - t= ,
,4 Eb
cýo "N
4. * C, 4 to C-4
R r- (D U) M
* cI CO C'4 C) 0 *0) Lr) CO co *U) I-
0 U) (y) oý C'4
' C*l 'D
0) .t 04
ý C;
ý- Cl cj V: ý t,.: ci (0 :r :
CY) 9
I C? .t
CV) C) 0ý co
, ') C'J (Do c; U')
"001
r- r1-
CO r- -e (D
cý , %- M CO 00 c;
ý»
c; ý Co
c5
u)
(0 C: ) CY3 ce) CD C, 4 ö c;
Ln
CO CO U) : - LD ö
4ý
OOD LO CO (0 C: ) C) C» ci ö 10 nt
4. co LO ti)
ý (7) C%j
CY) 00 coo C)
C; LID
ci C)
CV3 LD CA cc) ' c=5: ,0u -: ö Ci Cý ö T- 0
g vi
OD c> Co Lo C) cýA m 't cl '-7
r= c5 ö C? (D
VI
b) 00 - 2 >, Z] 0 -ci , W r- > Z.. 0 CL
-8 -= . :3 CL
1. * 0 ýo «, G ýe M (D (D E
%A
0
E
,m2 -2 Co * M a) LLJ
0w lý- 2 **
-cj CL L: )
,0 (0 (0 fl- NýC: ) T- C-A 0
cs
ca . r- U)
a)
0 0 c3)
Ln (0 r- Co C) 0) (» C»
CO L- Vo 0 >
ß_ (0 9) >
L- (0
b- (0 a) >
Co c
(1) r_
cu 2
o LL Cý
0

4.5.3.2 Insider Shares
Column 3 presents the effect of insider ownership without the influence of
issuers' types. The significantly negative coefficient of insider shares suggests that
insider shares clearly play a role in reducing the listing time lags. With a larger
proportion of shareholdings, the insiders are better motivated to push through the
flotation process.
No data is available on the allocation of insider shares, but some insider shares are
illegally allocated to some bureaucrats and they help to reduce the listing time lag. Some
sense of the whole can be gained from individual cases. For instance, Daqing Lianyi
Petroleum arranged 941,500 shares at the offer price to 17 top local officials and to 44
deputy local officials in the city of Daqing. The shares of Daqing Lianyi were
underpriced by 15 1%. Mr Na Fengqi, the head of the tax bureau of Daqing, gained profits
of RMB Y740,000 after selling out the offering shares. The flotation waiting time Daqing
Lianyi was less than 3 weeks, among the shortest 10% time gaps to float on the stock
exchange.
For another example, the firm Kangsal Group issued shares to the public without
employee shares in February 1990. The firm did not push through the flotation till the
employee shares were issued in 1996. Wu Wenying, a former state advisory counselor
and Xu Penghan, a former vice minister helped the firm Kangsai Group to get the quota
from CSRC to go public in the same year, since the Kangsai Group specially arranged
the sale of the employee shares to their relatives at the offer price, to which they were not
entitled. The wife of Xu Penghan bought 40,000 shares at the offer price of RMB VI and
received 43,600 shares for free. She profited by RMB Y796,000 when the Kangsai Group
repurchased these shares at the price of RMB YlO. The son of Wu Wenying bought
167

100,000 shares at the offer price and profited RMB =Y890,000 when the employee shares
became tradable. The IPO shares of Kangsai were underpriced by 905%. This extreme
case is taken as an outlier in my regressions, but it shows a widespread problem about
insider shares.
The above two cases of IPO bribes became known only after the investigation of
the prosecutors, which show the tip of the iceberg. Some social elites, including some
firm managers, some investment bankers, and some governmental officials, profit from
buying the insider shares at the offer price and selling out after the lockup period. The
listing time lags are influenced by a special interest group, including employees of the
firm, privileged business associates and targeted influential bureaucrats.
4.5.3.3 Underwriting Costs
Column 5 looks at the isolated effect of underwriting costs on the length of lockup
periods. I find that by increasing one unit of payment to the broker, the waiting time is
reduced by nearly 7 days. The underwriting cost accounts for 33% of listing time lags. If
excluding the historical cases, where the issuers issued shares themselves instead of
going through a brokerage house, the sign of the underwriting cost remains significantly
negative.
All else equal, the underwriting costs approximate the lobbying costs.
Underwriting costs are a kind of "ransom" to shorten the long lockup period, which is set
by the regulator. Since the Chinese underwriters are well connected to the regulator, the
underwriting fees provide incentives for the underwriters lobby some CSRC officials and
get the firms listed earlier. When the issuers pay higher underwriting fees, the
underwriters are better motivated to lobby and the listing time lag therefore becomes
shorter.
168

The underwriting cost is the other dimension that blurs the effect of issuers' types.
When I control for the underwriting cost per share in column 4, the coefficients of POE
and IOE become significant. The coefficient of POE is 0.94 and IOE 0.18, significant at
the 5% level. It means that, if the underwriting costs were the same and the SOE issuers
needed one week to be floated onto the stock exchange, private-owned firms had to wait
in the queue for 1.94 weeks and institutions-owned finns waited for 1.18 weeks.
The government-owned enterprises are not priced lower than other enterprises,
but they are listed earlier than other enterprises, ceteris paribus. It possibly comes from
the preferential treatments for the government regulator towards the firms owned by the
government. This favoritism of the CSRC is consistent with Tian's argument (2000) on
the helping hand of a large government shareholder, which offsets the grabbing risks in
SIPS.
However, when the private owned enterprises pay a higher underwriting fee for
intensive lobbying, the favoritism of the CSRC disappears. The median of underwriting
fees paid by the POEs is 0.23 per share; IOEs 0.15 and SOEs 0.14. This pecking order is
significant in terms of the Student T statistics for the means and the ranksum, statistics for
the medians.
Column 6 pools the effects of insider shares and lobbying costs together and my
arguments hold. Table 8 and table 9 therefore show that both the benefits for some
individuals and lobbying efforts help to get listing earlier. There is some gamesmanship
in managing listing time lags.
4.5.3.4 Market Cycles
169

The above two sections show that private benefits are a determinant of listing
time lags. I further examine whether the CSRC uses the lockup as a lever to develop the
stock market.
Table I shows the market cycle in China. In the Shanghai Stock Exchange, the
P/E ratio was 23.5 in 1994,15.7 in 1995, and over 30 from 1996 to 1998. The market was
bearish in 1994 and 1995. The stock index has a similar pattern of ups and downs. If the
government regulator is devoted to financial market development, the stability of the
stock market is a goal to pursue. One shall see that regulators float firrns with a long time
gap during the bear market and the firms with a short time gap during the hot market.
Column 7 investigates whether there is a market-cycle effect. I find that the firms
floated in 1995 have a significantly longer listing time lag. Because a long lag boosts the
initial returns, this arrangement helps to advance the stock index and attract investors. In
the hot markets of 1997 and 1998, the firms floated have a significantly shorter time gap.
It helps to cool down the market. Choosing by different time gaps, the timing to float a
firm on the stock exchange can also be a policy tool to achieve its political goals.
4.6 Determinants ofInitial Retums
The above section suggests that the variable of listing time lags has to be
instrumented in the multivariate regressions of initial returns. With this instrumental
variable, table 9 pools the hypothesized variables to investigate the determinants of initial
retums.
Some dependent variables of initial returns in table 9 are adjusted by market
indexes and industries. Ile SSE composite index is used to adjust the initial returns of
170
the firms listed on the Shanghai Stock Exchange and the SZSE composite index used for
the firms listed on the Shenzhen Stock Exchange. The industrial code is the 21-industry
classification by the Securities Times. Numerically, table 9 is not necessarily
straightforwardly correspondent to table 5.
The regression method used in the multivariate analyses is mainly the
instrumental variable robust regression with bootstrapped standard errors. The first stage
regression is to control the endogeneity of listing time lag, which has similar results to
table 8, and it is not reported here to save the space. I use the pricing cap as the constant.
As for the IPO eaming multipliers, the Tobit method is used.
Column I reports the significance of pricing caps. The dependent variable is
unadjusted initial returns in order to report the magnitude of the pricing-cap effect. I find
that the pricing caps raise initial returns by 134.7%. Section 2.3 reports that, after
deregulation of the pricing cap, the average initial returns decrease by 133.5%. Iberefore,
the pricing cap roughly brings about 134% of IPO underpricing. As the average
underpricing from 1992 to 2000 is 267%, the regulation of pricing cap counts for a half
of severe Chinese underpricing.
171

rA r 2 00 ce .20 ý4.
A 04 -2
- 4) ,Z *Z: 0 0 Gn p. 0 -, c2c3 CKJ * r-, *
bo -zj X
r- N. (U 0 ZJ >>' vi 00 10 :j -CJ
c) rA _, d u ce E0 ýo V k. 5 'JE 0ý*, P- -l'- c> «r- b 9) :J c2 - - :3 ce -5 W AD u fi 0 (n `ý cý - cu .Zg>
ro- ý2 E- r 0 -0 -4,0 u
ý00000 Ex 10 s= tn 2- E0 *E j-, rý r. öß 7
e
4ý 00 VI
20-, u e0 rý .-0 IL) rA :se zi il 9 12 E ce -m 004. > 20 u Th = ýu Z ti z3
"0 Pg 10 r, A AD *
&) U10
0 «vý w
ti = e. . -0 *4 =-0, r> rA 'J 0
12. -
r- -0 -ý lu -. *; -- 4. e 9. ) L- w .=M ýr- 1. - m
, r. 0 pý Z c) u C) A-- 0U bo 0 0= -4 JIK, 4-. 15 0 Cl.
0- r- ,0 cu m '-. ce e
-, 4 0 �s oZ0-o vi =, - 10 0 -M .>E Ei r" ý- 0 CU rý tu =
0 0D
4- 00 0
CU 93-. 12. rq ce 0 c3.0 ýr -ci te --0, A ce 0 r4 - C. ) tý
0 1-1 j- X=U :J", u ;A r4 >< t) In >% 000=0 'A cu :i
. t2 fA 4 -, ..
j rý .-1m .0o., 4 0E=Z *g 0 >, E -0 ý -0 2 4. ) 12 -0 e0--. 2 Z :i .- r_ 2 '0 cu p . 3'- =2u lüý ý: U g', lý
ZJ .-- *G; 11) ý> r. ý t) 0 ICJ 0 r 4-. 4 b. .--ý: ý ý) 1: 1 4 -% Cl. 4. ) -'4 ýg r: �j g)
-- .- -c ce
-4ý .-ý le tu 1v-m-=-v-, e- o --, -0 .E Ci. 10 0 t: E>00 4-1 0
; 21 Ici -ý; j > P. >
wyý 12 Ln -- .ýU00e0 Ln C D; 0 Z 4.
e0 0 12,1 - ýt Eu -3 ý . 00-1 'Z
ý2>0r. tn CU 10 0U MM
C) 0 3W .-0 Co 0, r. J-- , bd ý eu = (L) 'je rA mýA -0 CU
S-0ý cn ci
lZ g. Ei ýg -
- t-n e- ; lý "0 ý-, je,, (L) > tt ýZ 0 -ri
E0 0- 1-- '0 ýQ 2,0w :10 ý4 j- :10 -j-, 0 -! bý902- 000 (A - ee =0
,ý00><> lu i9t, - 00
-0 r= _GO2 r_ lu = r- -, r, 0.. s- ub0 -r 1--g m- . Ln x cu G p. ZX e -: -2 in N- zj 4. ) E
u2 2 Er 0 -: S =a_,
ýQ IJ t) (D
CJ - fi u
in ce (L) U ce u J-- vi > -g -0 - £3d -5 = .-2.
m 4, > 41, E b. 12
0>
,i "Or- -i r .. ý- 4. ) 4. ) tn 4. zi CU (n 92.. -
-1
u x, - 0== 1-. 000 tn -o b. -N ce -0�, 0 .- -0 Ei =-
9- ;ü ýý u -, = .- iz cn s0 to "0 (n c- di, 09=u 4) u e 2. -= :j 'y
6-. 0
-= to C, (n 10 CA -0 >% o t-o = "r, >% ci .Ir. Ici e. ý 15 926.
0u -0 je 9 r. u k2 x-te -zj
9) - Ici ce , «t: tn g: 4 A004. ) e E.
20jimonooýt U &, wý - g) 10 70 u 2. e t, ce v0u
». F- +ý (A
> 43 U) 00 C) u= ti. - 0 Ln X ý.: 0>
-5 JJ
9 A,
eo -5
F. LS
e r) e ýa
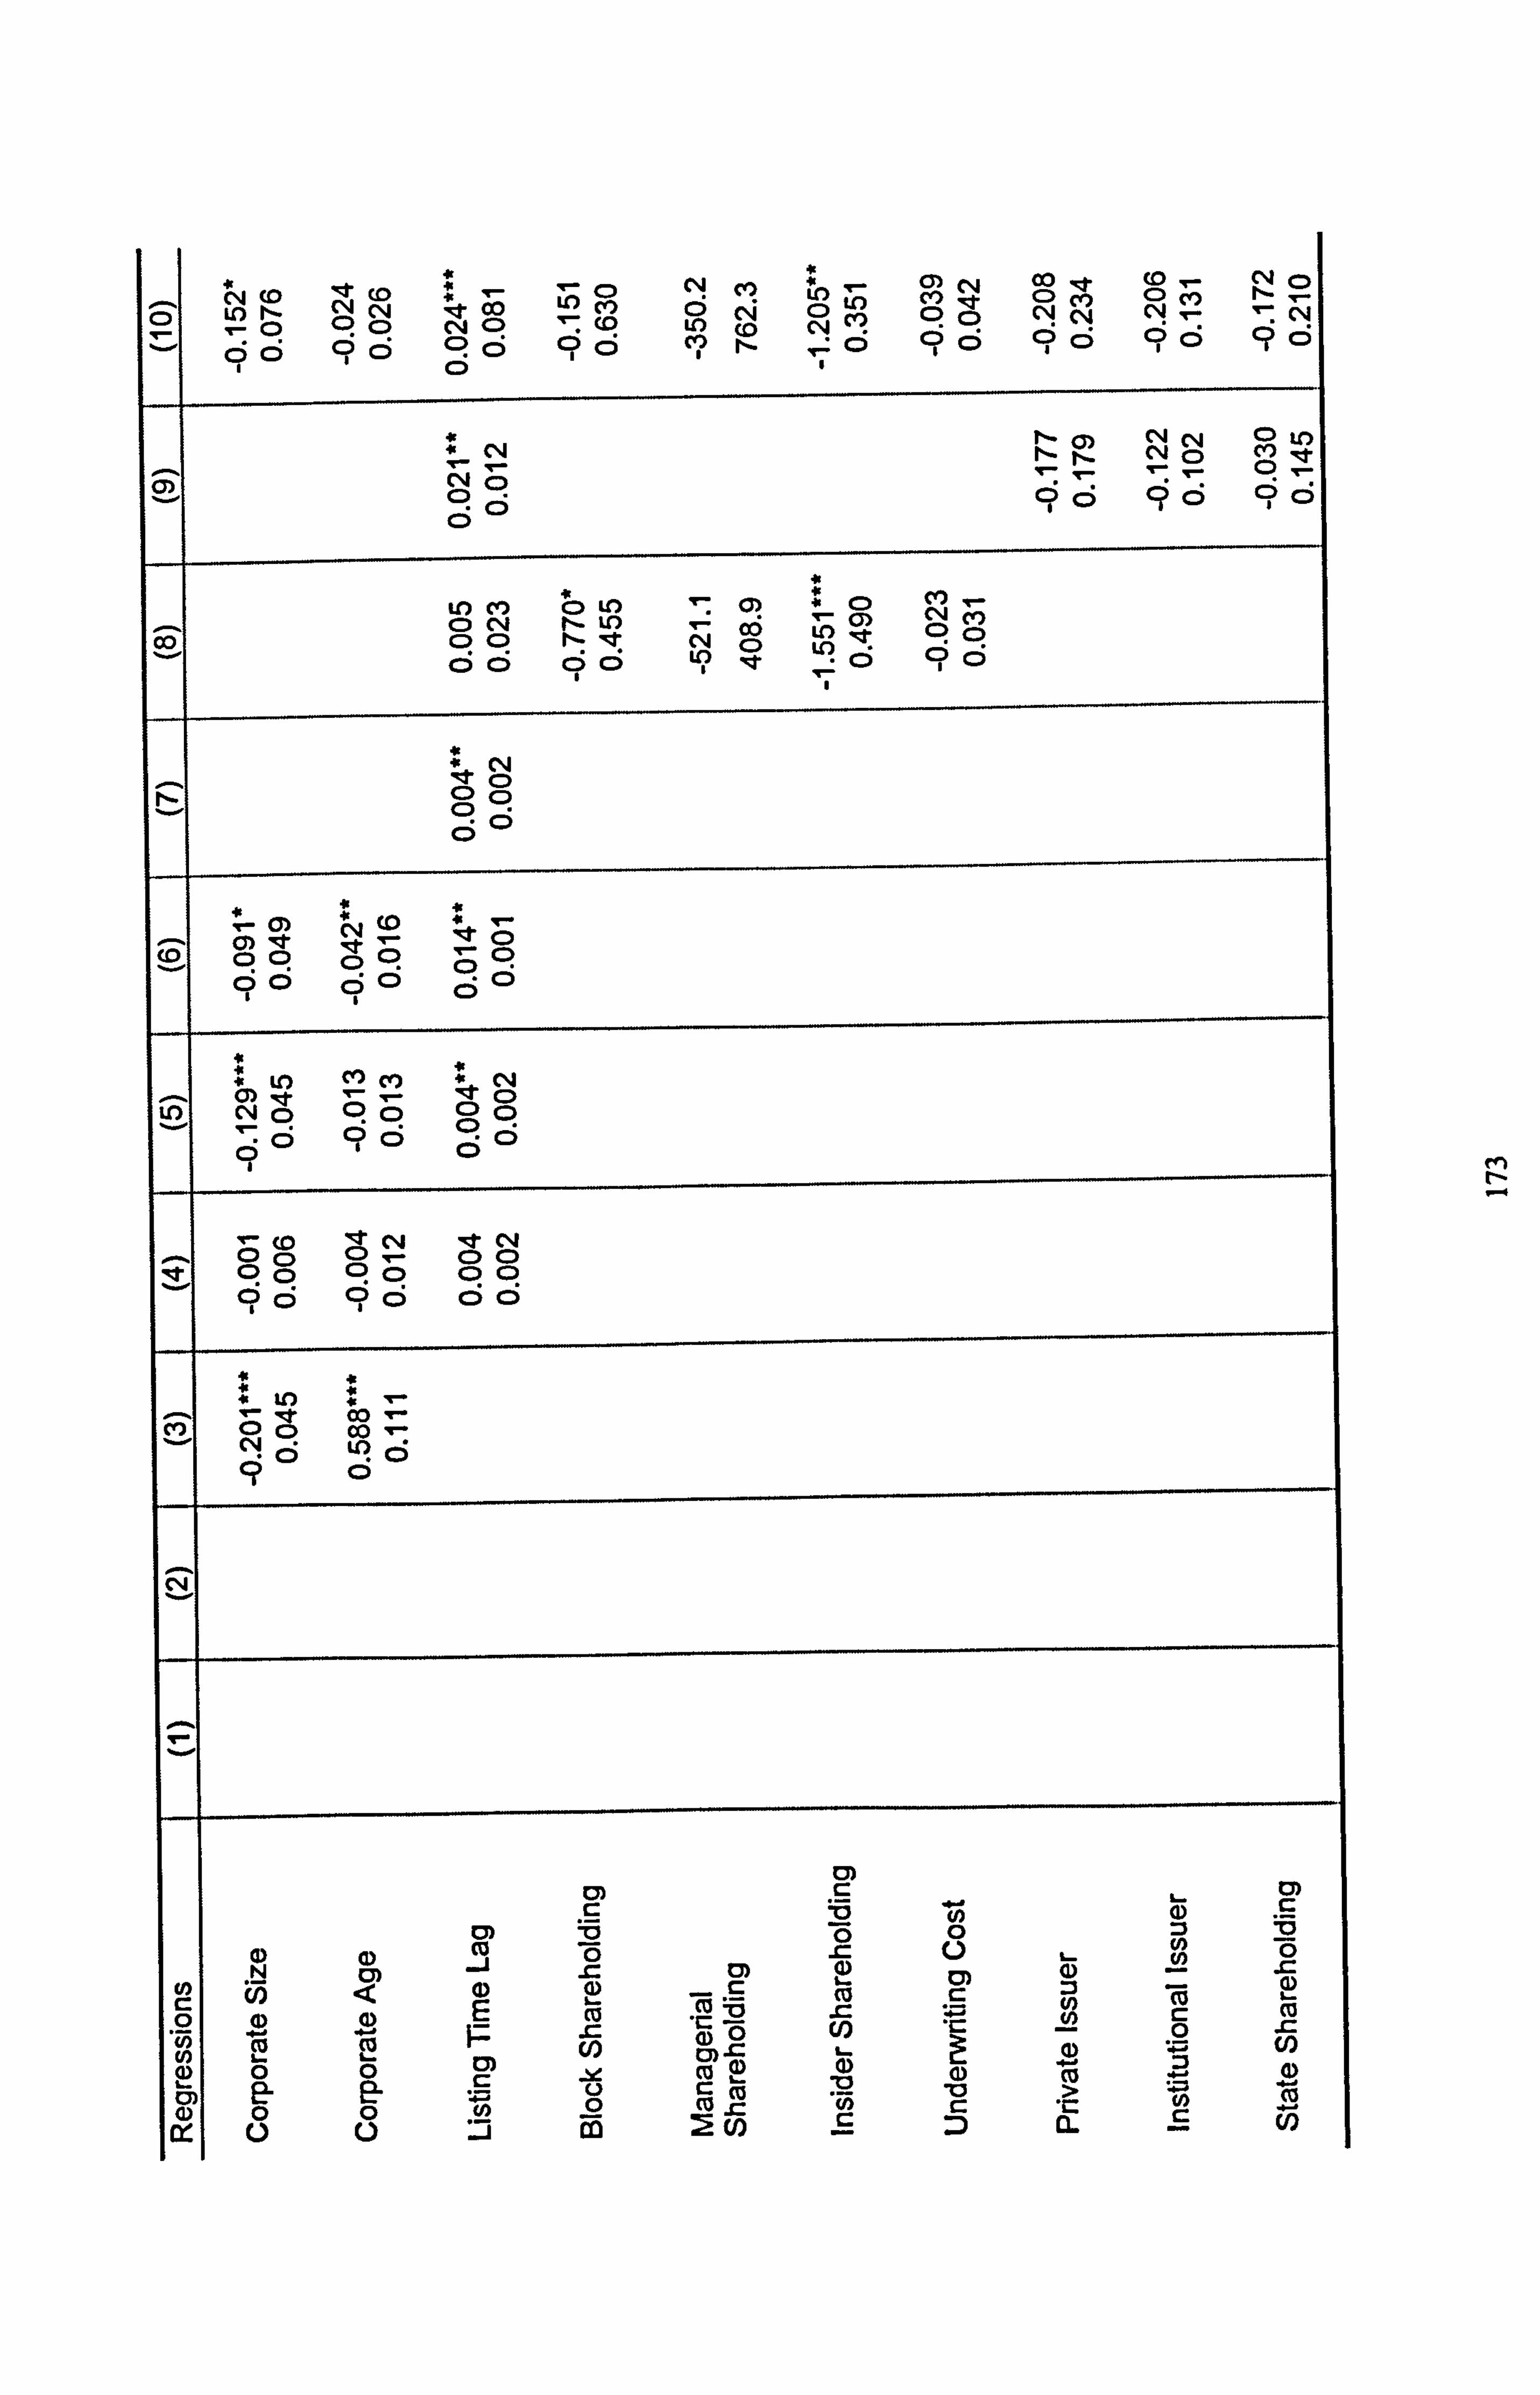
C) 04 CO LO 1-
Iýt C. 0 04 04 00 LO M cl
0 C-4
4. - U') C) to
Y
(7) C'4 Q 't 9 C)
00 "t C) ce) C14 04
(0, - C) M cl! -
C14 C) -: C-4
ý0 c5 C5
q C: ) 9 C5
04 C) q ci
-: CR
90 U) co C? r--
C ) N. 0 C? C; C; c; 9 C; 96
C)
04 -
11-0) 1-
NN CN C: )
CD U. ) Cl) T - C14 C)
T- c; c;
T- - c;
C)
C;
LO M C) CN
C) LO r-- Lo
I
0ý ý co '
c) CY) LO '. T
C'f) 04 Cw) C) (=) C) C)
C; ci r- q Cý C;
C 4 C: ) L? ,t Uý Ci C5
C'4 C) C) C) C) C; c;
V- 0) co
- (D 09 C: ) 0 ý C> a C; o
4. Lf)
0) Cl) ce) -
4g Cq "t
U) C, 4 , 9 C)
b C: )
c? C=; C;
I- (C) 0 C) I-T C%j C) I-
--t C14 C) C) ýý 0
l q c) oo
c6i 9 C; C; C;
R ý .t C) Cý (X) 00
04 c; C;
0) M
:2 (1) CD
0 0) m
0 'a
0 0 0 L-
U) "D 7E)
V) N 05
CY) <
-1 (1) (D
L 0)
-c 2
co 0) G
(1) :3
2
'6 a) L- C:
0 (1) (D G - ca ca : F3 r
U) W c
0 ca
J-
M CD 0) . a U)
CI 0 & )
0 L)
ca ý a Co ýo (1) ýo
w (D - 2 a)
It l 0
L) 0 L) 0 :D o co
(a A J) a r_ CL co C: U)
N -4

.x C) ý- N el 0
(V) (0 le CI') c> C)
x 0
0
c> m v- (0 ý (D
0 c-i C, 4 C) ý CO CD (0 - C) -
, w- 6 (5 ö cý C: ) (Z; c5
* OD (0 (0 O LC) cli m 0 C: )
Co ce) LD c\I
C: ) (0 CY) C: ) 0 cý N a C C: )
; ö cý cý
0 ci C! el
00 q
Co (0 N in ý c) 0
«,
" ýt C) Co
Ln C: ) r3 OD , p: t ý
c, i cý C: ) cý C) cý
CD
c5 (0 - C: ) C 4 C)
(Z; 0 C C) C: ) C>
C) LC) % C j cý
00
r, - C> (14 clq (D C) C: ) 0
Lt) (0 (oco
C%4 r- Co .
cý cý
c? 0 ci c5 cý 6 Ci (5 C 4
, C%j N
CO LO
12 C, 4 ö
CO
") ci P
LO 0 OD q: C) : Z,
C) in U') CD C: ) 0) 9P
* (%j C: ) e C, 4 C) o- C'4 ý ýt 9
: ý-
(D 0 C: ) CD
« CO CY) Lir) C, 4
C) LO C) C) le C) CD c-i (0
- U
c; ce o cý ä Ci ci c; ci
0 00
c) ce) CO ý C) 0c 4 l» Ci ci o0
0
C (D 0 0-0
.0 =C 0) C)
c3) 75 2. - =m (0 C: r Z
Z U)
0
EL (D ý t) cm
(Mg 0 u5 w oý 0 0w 12-

Besides the pricing cap, column 2 examines the effects of issuing sizes, IPO
multipliers, and oversubscription rates. The findings in rows 11,12, and 13 of table 5 are
confirmed here. Issuing sizes, which are the supplies of IPO shares, are a negative
determinant of initial returns. Under the pricing cap, the price gap of PB Pm reduces
when the supply curve shifts rightward. The choice of an IPO multiplier also sends a
positive signal to the market on the quality of the firm management. Oversubscription
rates positively influence on adjusted initial returns. Similar results are found in columns
7,8,9,10. In summary, the multivariate regressions support that financial regulations are
a main cause of IPO underpricings in China.
Column 3 shows that corporate size is a negative determinant of initial returns,
but corporate age is positive. Similar to the contradictory findings in rows 3 and 4 of
table 5, the hypothesis of informational risks is supported only by the test of corporate
sizes, but rejected by the test of corporate ages. However, I find that corporate age is
48.3% correlated to the listing time lag, which is significant at 99% level in the pairwise
correlation test. When including the variable of listing time lag, the whole regression
becomes insignificant in column 4. Column 5 further includes the institutional setting of
the pricing cap. Interestingly, the coefficient of corporate age becomes negative. That is,
under the settings of a long lockup period and the pricing cap, corporate age is a negative
determinant of initial returns. An elder firin is better known and the market requires a less
discount of informational risks. Column 6 supports the theory of asymmetric information.
However, the coefficient of corporate age becomes insignificant in column 10. It should
be admitted that the test of corporate age is therefore less robust, but there are no strong
evidences to reject the hypothesis 1.1, either. One reasonable conjecture is that most of
175

Chinese public listed companies are newly founded or restructured and the variance of
corporate ages is small. Therefore, the magnitude of informational asymmetry may not be
well approximated by corporate age. Given that corporate asset is a significant negative
determinant of initial returns, I have some evidences that the risk of informational
asymmetry on corporate quality plays a role in deciding initial returns. Only interpreting
0.5% variance of initial returns, informational risks shall not be a big concern of the
Chinese IPO subscribers in a strong sellers' market.
Column 7 reports the effect of the instrumented listing time lag. 'Me firms with
longer lockup periods have higher initial returns. The hypothesis of lockup risk is
supported.
Column 8 examines tunneling risks with controlling for financial regulations and
lockup periods. The negative coefficient of block shareholdings is weakly significant.
That is, a larger sized shareholding block is associated with a lower initial returns and a
lower discount of tunneling risk. It, however, becomes insignificant in column 10.
Consistent with the univariate analysis, there is no significant effect of managerial
shareholding on IPO underpricing. The coefficient of insider shareholding is significantly
negative. A further alignment of insider interests with corporate interests decreases the
discount of tunneling risk and reduces IPO underpricing. As for the tunneling of
underwriters, the coefficient of underwriting costs is not significant coefficient, although
it remains negative. The effect of lobbying intensities does not seem to hold here. It may
come from the correlation to the listing time lag, which has captured underwriting costs
in its instruments. In summary, insider shareholdings provides the evidence of tunneling
risk in column 8.
176

Controlling for financial regulations and lockup periods, column 9 examines the
grabbing risk. The dummy variable of private issuers is 1 when the issuer is private-
owned; otherwise, it is 0. Institutional issuer is I when the issuer is owned by a non-
government institution. Columns 9 and 10 show that there is no significant relation
between the issuers' types and adjusted initial returns in the multivariate regressions. The
coefficient of the size of state shareholding is not significant, either. As. discussed, the
government shareholder has double faces and the grabbing risk cannot be projected by a
monotonic analysis. The types of issuers' ownership are not a direct determinant of initial
returns.
5. Further Discussion
Table 9 finds that there is no significant difference in pricing state-owned
enterprises (SOEs), institution-owned enterprises (IOEs) and private-owned enterprises
(POEs). Comparing with the non-government issuers, the government issuers have the
same motivation to pursue the offering proceeds (Perotti 1995). SOEs are therefore
priced about the same as POEs. It is consistent with the Chinese policy goal that the stock
market should serve to provide new capital to the former state-owned enterprises.
However, the indifference of pricing between SOEs and commercial enterprises
do not stop from severe TO underpricing, on the whole. The above empirical analyses
clearly show that the Chinese government uses IPO quotas, pricing caps, and listing time
lags to increase TO underpricing. Why does the government push towards severe
underpricing with financial regulations? Schmidt (2000), and Biais and Perotti (2001)
argue that, to ensure the political power, a market-oriented government should underprice
177

shares in fixed-price offers and then ration the shares to median-class voters. The Chinese
stock market was set up as an experiment in a communist regime and the reform-minded
leaders need gain political supports and reach a social consensus for the stock market
ruled by capital and for gradual privatizations. It makes sense for the goverru-nent to
pursue its political interests at the expense of its financial interests, which are maximized
under the regulatory framework. In fact, with severe IPO underpricing, China's stock
market develops so fast to become the Asian second largest stock market in less than a
decade. It attracts millions of investors in a short time. The community of shareholders is
widespread and very quickly reaches down to the grassroots. It helps China to transform
from a labor-led society to an investor-centered one. Even privatization gradually
becomes viable and popular in this country, which is controlled by the same communist
government. Regulatory underpricing can be a political maneuver.
With severe IPO underpricing under the regulatory framework, the Chinese
government pursues its political interests. Free riding on the government, some social
elites pocket personal gains in IPO underpricings. There are some gamesmanship and
rent-seeking activities associated with regulatory underpricing, although my dataset
prevents me from carrying on a detailed study of private benefits in China's primary
market. The complex web of political and financial interests of the government and
private benefits of some elites in power shall be the fundamental motivation to produce
267% IPO underpricing from 1991 to 1999 in China.
178

6. Conclusion
This chapter documents severe IPO underpricing in China and rationalizes it with
studying its determinants. The first-day return of 1124 new issues from 1991 to 2000 is
267% on the average and 133% for the median. Providing an original analytical
framework, this chapter proposes the institutional hypotheses of financial regulations and
investment risks.
The government regulator stipulates IPO quotas and pricing caps. The IPO quota
restricts the supplies of IPO shares. The pricing caps bring about a demand gap and it
boosts the buying of shares in the first-day of public trading. Empirically, these
regulations count for more than a half of severe underpricing in China.
Similar to Anglo-American markets, asymmetric information on the quality of the
firm causes IPO underpricing, but it is far from being a major determinant of initial
returns in China. Besides the effects of Chinese financial regulations, I find that the
Chinese-specific investment risks also largely contribute to severe underpricing. After
going public, the IPO firms have to wait in a long queue to go for flotation. This
illiquidity induces lockup risks. During the long lockup period, IPO subscribers are
concerned on tunneling risks and require a discount of IPO shares. The personal interests
of corporate insiders, underwriters and regulators, can influence the length of the lockup
period. During the long lockup period, I find that the IPO investors also require a
discount of tunneling risks. Due to the double faces of the government shareholder, there
is no concrete evidence of grabbing risks in the primary market.
Why are the Chinese IPO underpricings so substantial? It comes from the Chinese
financial regulations and the Chinese investment risks. Behind the veil of regulatory
179

underpricing, one shall see the complex web of the govemment's political and financial
interests and private benefits.
180

Conclusion
"The whole duty ofgoverntnent is to prevent crinze and to preserve contracts. " - Lord Melbourne (English statesman, prime minister, 1779-1848)
Discussing the issues of ownership and control, capital structures and initial public
offerings in China's stock market, this thesis documents the profound role of the
government in corporate governance and financial development and contributes to
corporate finance and political economy literature. The empirical findings and
theoretical arguments of this thesis have some policy implications for developing
corporate China as well as for other new and emerging economies.
Review
In Chapter 1,1 document the ultimate shareholding structure of the firms
traded on China's stock market and find that government shareholding is notably
large. I further examine the relation between the size of government shareholding and
corporate value. The total effect of government ownership on corporate performance
is negative, but it is non-monotonic. When the government is a small shareholder,
corporate value decreases as the size of government shareholding stake increases.
When the government is a large shareholder, corporate value increases with a larger
size of government shareholding. Interpreting this U-shaped finding, I develop the
two-hand view of the government. To comply with its political interests, the
government has a grabbing hand to seize corporate wealth. The influence of this
grabbing hand depends on the voting rights of the government shareholder. When the
181
cash flow rights of the government are sufficiently large, the government gives the
firm a helping hand via preferential treatments and some efforts of equity governance.
In Chapter 2,1 document the capital structures of China's public listed
companies and examine the role of debt in corporate governance by setting up a
conceptual framework of managerial exploitation. I find that managerial perks and
free cash flows are larger in finns with a higher financial leverage, but bank loans
have no significant influence on the problem of managerial entrenchment. Corporate
efficiency and value decrease as financial leverage increases. I also find that the
relation between financial leverage and managerial exploitation varies into the
ownership type of the firms. When the government is a large shareholder, bank loans
significantly promote managerial exploitation. When a commercial entity is a large
shareholder, debt does not reduce managerial exploitation, but the facilitator role of
debt is not evident. I argue that the failure of debt governance results from the
institutional setting of China: the govem-ment owns both large banks and firms.
In Chapter 3,1 show that the pursuits of government's political and financial
interests and social elites' private benefits can coexist. This chapter documents severe
underpricing and the extensive share issue privatizations in China's primary market.
The Chinese institutions, including financial regulations and specific investment risks,
rationalize the severe Chinese IPO undcrpricing. The severe underpricing is
regulatory underpricing and forced by the govenunent regulator, which is conjectured
as being motivated by the political interests of the reformist government to develop
the capitalist stock market and transform the society. However, the government also
pursues its financial interests to maximize the offering revenues under its own
regulatory framework, which is supported with the finding that share issue
privatizations are priced at the same level as privately owned enterprises. Meanwhile,
lobbying costs and insider shares affect the length of listing time lags. It may suggest
182

that some bureaucrats play the time game of flotation to pocket personal gains, but
this flotation time game is not at the immediate expense of the government.
Summary
Examining the issues of ownership and control, capital structures, and initial
public offerings, this thesis illustrates the picture that an intelligent government
maximizes its financial and political interests and some sophisticated social elites
exploit the business interests of the government for private benefits in an emerging
market, where the government calls the shots due to a weak legal infrastructure.
The Chinese government is intelligent. Using both a grabbing hand and a
helping hand to influence the firms, the government attempts to maximize its utility
function that consists both of financial interest and of political interest. This argument
is supported by the evidence of the U-shaped relationship between the size of
government shareholding and corporate value and the evidence of the authoritarian
underpricing in the primary market. Meanwhile, sophisticated individuals take
advantage of the government. Some bureaucrats not only work for the interests of the
government, but also attempt to pocket personal gains by setting the rents. Managerial
exploitation is perhaps more noticeable than the flotation time game played by some
bureaucrats. In the widespread business empire of the government, some firm
managers capture the government-owned banks and debt governance becomes a
failure. In summary, the government can be helpful on corporate governance and
financial development even with extensive rent-seeking activities of some social elites,
but the businesses of the government damage market competition and cause the
failure of debt governance.
183

Contributions
This thesis covers a wide range of literature and makes some original
contributions. The U-shaped finding and two-hand view of the government enriches
the government ownership literature (e. g., Shleifer and Vishny 1998) and these new
evidences from China are also related to the Chinese puzzle in the transition
economics literature (e. g., Blanchard and Shleifer 2000). The finding of debt
governance's failure integrates the soft budget constraints literature into corporate
finance literature (e. g., Jensen and Meckling 1976, and Harris and Raviv 1991). The
investigation of severe underpricing in the primary market and the argument of
private benefits develop the share issue privatization literature (e. g., Perotti 1995,
Biais and Perotti 2002) as well as the initial public offerings literature (e. g., Ritter and
Welch 2002). 1 believe some of the future research on emerging-market corporate
finance will follow the line of understanding the role of the government.
This thesis is also an extensive exercise in state-of-art econometric methods.
The robust OLS regressions, maximum log-likelihood panel regressions, Arellano-
Bond GMM regressions, bootstrap regressions and instrumental variable regressions
are reported in three chapters.
Policy Suggestions
By investigating corporate finance issues in China, the empirical findings and
theoretical arguments of this thesis can generate some general policy implications,
although it is well beyond the academic studies of this thesis. With its widespread
184

business activities, the government has been making a significant contribution to the
grand Chinese refonn starting in 1978, but the final success of the transition toward a
mature market economy requires the government to retreat from owning or doing
businesses.
The government is the driving force of China's grand reform. With its firms
and banks, the government gradually wipes out the legacy of the planned economic
system, builds up the institutions of market competition, and maintains the stability of
the society in this massive transformation. An active government in business is
helpful during the transition period in cultivating institutions, such as the stock market.
However, it comes with a cost, in a long term view. Taking advantage of the
government's magisterial power, the sophisticated social elites inevitably pursue
private benefits in the extensive business empire of the government, which destroys
corporate value and social welfare, distorts the mechanisms of market competition,
and can eventually bring down the emerging Chinese economy in a manner
resembling what happened in other Asian emerging economies in 1997.
When the institutions of market competition are installed, the Chinese
government has to fundamentally change its role to let the market function properly.
The government's two hands should be tied up to prevent misuse by corrupt elites,
which can be achieved through privatizing the government's business. This thesis
shall guide to a general policy suggestion that the government should finally retreat
from corporate sectors and cease to play a major role in business, which is essential as
for the success of the Chinese grand transition towards a market economy.
185

Bibliography
Aggarwala, Rajesh K, Laurie Krigmanb and Kent L. Womacka, 2002. Strategic IPO Underpricing, Information Momentum, and Lockup Expiration Selling. Journal of Financial Economics 66: 105-137.
Aghion, Philippe and Patrick Bolton, 1992. An Incomplete Contracts Approach to Financial Contracting. Reziew ofEconomic Studies 59(3): 473-494.
Allen, Franklin, 2001. Presidential Address: Do Financial Institutions Matter? Journal of Finance 56(4): 1165-1175.
Allen, Franklin and Gerald R. Faulhaber, 1989. Signaling by Underpricing in the IPO Market. Journal of Financial Economics 23: 303-323.
Anderson, Theodore W. and Cheng Hsiao, 1981. Estimation of Dynamic Models with Error Components. Journal of The American StatislicalAssodation 76: 59 8-606.
Anderson, lbeodore W. and Cheng Hsiao, 1982. Formulation and Estimation of Dynamic Models Using Panel Data. Journal ofEconometricr 18: 47-82.
Ang, James S, Rebel A. Cole and James Wuh Lin, 2000. Agency Costs and Ownership Structure. Journal offinance 55(l): 81-106.
Aharony, Joseph, Chi-Wen jevons Lee and T. J. Wong, 2000. Financial Packaging of IPO Firms in China. Journal ofAcrounfinT Reseamb 38 (1): 103-12 6.
Arellano, Manuel and Stephen Bond. 1991. Some tests of specification for panel data: Monte Carlo evidence and an application to employment equations. Review ofEconomir StuSes 58: 277-297.
Baron, David P. and Bengt Holmstrom, 1980. The Investment Banking Contract for New Issues Under Asymmetric Information: Delegation and the Incentive Problem. Journal offinance 35(5): 1115-1118.
Baron, David P, 1982. A Model of the Demand for Investment Banking Advising and Distribution Services for New Issues. Journal offinance 37: 955-976.
Beatty, Randolph P. and Jay R. Ritter, 1986. Investment Banking, Reputation, and the Underpricing of Initial Public Offerings. Journal ofFinandalEconomicr 15: 213-232.
Beesley, Michael E. and Stephen C. Littlechild, 1989. The Regulation of Privatized Monopolies in the United Kingdom. RAND Journal ofEconomicr 20(3): 454-472.
Berger, Philip G. and Eli Ofek, 1995. Diversification's Effect on Firm Value. Journal ofFinandal Economics 37: 39-65.
Berger, Philip G., Eli Ofek and David L. Yermack, 1997. Managerial Entrenchment and Capital Structure Decisions. Journal ofFinance 52(4): 1411-1438.
Berglof, Erik and Ernst-Ludwig von Thadden, 1994. Short-Term versus Long-Term Interests: Capital Structure with Multiple Investors.. Quarfer#Journal ofEconomics 109: 1055-1084.
186

Biais, Bruno and Enrico Perottiý 2002. Machiavellian Privatization. American Economic Review 92(l): 240-258.
Black, Bernard S., 2001. The Legal and Institutional Preconditions for Strong Securities Markets. UCLA Law Review 48: 781-858.
Blanchard, Olivier and Andrei Shleifer, 2000. Federalism -with and without Political Centralization: China versus Russia. NBER Working Paper No. 7616.
Boardman, Anthony E. and Aidan I- Vining, 1989. Ownership and Performance in Competitive Environments: A Comparison of the Performance of Private, Mixed and State-owned Enterprises. journal ofLaw and Economics 32: 1-33.
Booth Laurence, Varouj Aivazian, Ash Demirguc-Kunt and Vojislav Maksimovic, 2001. Capital Structures in Developing Countries. Journal offinance 5 6(l): 87-130.
Booth, James R and Lena Chua, 1995. Ownership, Dispersion, Costly Information and IPO Underpricing. Journal offinancial Economics 41: 291-310.
Boycko, Maxim, Andrei Shleifer, and Robert W. Vishny, 1996. A Theory of Privatization. EconomicjournallO& 309-319.
Brennan, Michael and Julian R. Franks, 1997. Underpricing, Ownership and Control in Initial Public Offerings of Equity Securities In the U. Y_ Journal offinandal Economics 45: 391-413.
Broadman, Harry G., 2002. The Business(es) of the Chinese State. WorldEconomy, forthcoming.
Buchanan, James M. and Gordon Tullock, 1962. The Calculus of Consent. Ann Arbor: University
of Michigan Press.
Chan, Kalok, John KC Wei and Junbo Wang, 2002. Underpid)ýg and Long-term Perý'omance ofIPOs in China. Hong Kong University of Science & Technology Working Paper.
Chemmanur, Thomas J. and Paolo Fulghieri, 1994. Investment Bank Reputation, Information Production, and Financial Intermediation. Journal offinance 49(l): 57-79.
Chen, Gongmeng and Ning Gao, 2000. IPO Underpricing Degree and Reasons in China. FinandalResearrhjournal (Chinese), 8: 1-15.
Chen, Gongmeng, Michael Firth, and Oliver Rui, 2000. Have China's Enterprise Reforms Led to Improved Efficiency and Profitability for Privatized SOEs? Working Paper, Hong Kong Polytechnic University.
Chen, Xiao and Jiang Dong, 2000. Ownership Pluralization, Firm Performance and Intra- industry Competition. Economic Researchjournal (Chinese) 2: 28-35.
Chhibber, Pradeep and Sumit Majumdar, 1999. Foreign Ownership and Profitability: Property Rights, Control and the Performance of Firms in Indian Industry. Journal of Law and Economics 42(l): 209-238.
ChL Jing and Carol Padgett, 2002. Short-Run Underpricing and Its Characteristics in Chinese IPO Markets. Working Paper, University of Reading.
Chowdhry, Bhagwan and Ann Sherman, 1996. International Differences in Over-Subscription and Underpricing of IPOs. Journal of Cqorate Finance 2: 359-381.
187

Chung, Kee H. and Stephen Pruitt, 1994. A Simple Approximation of Tobin's Q. Finandal Mana gement 23 (3): 70-74.
Claessens, Stijn, Simon Djankov, and Larry H. P. Lang, 2000. The Separation of Ownership and Control in East Asian Corporations. Journal offinandal Economics, 58(1-2): 81-112.
Cooper, Ian and Evi Kaplanis, 1994. Home Bias in Equity Portfolios, Inflation Hedging, and International Capital Market Equilibrium. Retiew offinandalSlu&es 7(l): 45-60.
Datar, Vinay and David Mao, 1998. Initial Public Offerings in China: Why Is Underpricing So Severe? Seattle University Working Paper.
Demsetz, Harold and Kenneth Lehn, 1985. The Structure of Corporate Ownership: Causes and Consequences. Journal ofPolificalEconomy 93: 1155-77.
Dewatripont Mathias and Eric Maskin, 1995. Credit and Efficiency in Centralized and Decentralized Economies. Retiew ofEconomic Stu&es 62: 541-555.
Dewatripont, Mathias and jean Tirole, 1994. A Theory of Debt and Equity: Diversity of Securities and Manager-Shareholder Congruence.. QuarterlyjournalofEconomics 109(4): 1027-1054.
Dewenter, Kathryn L and Paul H. Malatesta, 1997. Public Offerings of State-Owned and Privately-Owned Enterprises: An International Comparison. Journal offinance 52(4): 1659-1679.
Diamond, Douglas W., 1984. Financial Intermediation and Delegated Monitoring. Retiew of Economic Stu&es 51: 393-414.
.Y rn Diamond, Douglas W., 1991. Debt Maturity Structure and Liquidity Risk. Quaderl, jou al of Economics 106: 1027-1054.
Ellis, Katrina, Roni Michaely, and Maureen O'Hara, 2000. When the Underwriter Is the Market Maker. An Examination of Trading in the IPO Aftermarket. Journal offinance 55(3): 1039-1074.
Estrin, Saul, 2002. Competition and Corporate Governance in Transition. Journal of Economic Per3pectives 16(l): 101-124.
Faccio Mara, Larry H. P. Lang and Leslie Young, 2002. Debt and Corporate Governance. Social Science Research Network, working paper.
Faccio, Mara and Larry H. P. Lang, 2002. The Separation of Ownership and Control: An Analysis of Uldmatc Ownership in Western European Corporations. Journal offinandal Economics 65(3): 365-395.
Fama, Eugene F. and Michael C. Jensen, 1983a. The Separation of Ownership from Control. journal ofLaw and Economics 26: 301-325.
Fama, Eugene F. and Michael C. Jensen, 1983b. Agency Problems and Residual Claims. journal of Law and Economics 26: 327-349.
Fama, Eugene F, and Kenneth R. French, 1992. The Cross-Section of Expected Stock Returns. Journal of Finance 47 (2): 427-46 5.
Fama, Eugene F. and Kenneth R. French, 1995. Size and Book-to-Market Factors in Earnings and Returns. Journal offinance 50(l): 131-155.
Fluck, Zsuzsanna, 1998. Optimal Financial Contracting- Debt versus Outside Equity. Retiew of FinandalStuSes 11: 383-418.
188

Franks, Julian R. and Colin Mayer, 2001. Ownership and Control of German Corporations. Review of FinandalStu&es 14: 943-977.
Franks, Julian R_ and Kjell Nyborg, 1996. Control Rights, Debt Structure, and the Loss of Private Benefits: The Case of the U. K Insolvency Code. Review offinandalStuses 9: 1165-1210.
Franks, Julian R., Colin Mayer and Luc Renneboog 2002. Who Disciplines Management in Poorly Performing Companies? Journal offinandalInterme&ation 10(3-4): 209-248.
Friend, Irwin, and Larry H. P. Lang, 1988. An Empirical Test of the Impact of Managerial Self- interest on Corporate Capital Structure. Journal offinance 45: 617-627.
Fulghieri, Paolo and Matthew Spiegel, 1993. A Theory of the Distribution of Underpriced Initial Public Offers by Investment Banks. Journalof Economics andManaTement Stratqy 2(4): 509-530.
Gale, Douglas and Martin Hellwig, 1985. Incentive-Compatible Debt Contracts: The One-Period Problem. Review ofEconomic Stu&es 52(4): 647-663.
Gilson, Sturt C., 1990. Bankruptcy, Boards, Banks and Block Holders. Journal of Financial Economics 27: 355-387.
Gomes, Armando and Walter Novaes, 1999. Multiple Large Shareholders in Corporate Governance. Rodney L. White Center for Financial Research at the Wharton Business School, Working Papers.
Gomulka, Stanislaw, 1985. Kornai's Soft Budget Constraint and the Shortage Phenomenon: A Criticism and Restatement. Economics ofPlanning 19(l): 1 -11.
Gorton, Gary and Frank A. Schmid, 2000. Universal Banking and the Performance of German Firms. Journal offinandal Economics 58(1-2): 29-80.
Grinblatt, Mark and Chuan Yang Hwang, 1989. Signaling and the Pricing of New Issues. journal offinance 44: 393-420.
Grossman, Sanford J. and Oliver D. Hart, 1982. Corporate financial structure and managerial incentives, in J. McCall, Ed.: The Economics of Information and Uncertainty (Chicago: University of Chicago Press. )
Grossman, Sanford J. and Oliver D. Hart, 1994. The Costs and Benefits of Ownership: A lbeory of Vertical and Lateral Integration. Journal ofPolifical Economy 94(4): 691-719.
Gu, Anthony Y. X., 2001. Privatization, Firm Size, and IPO Performance: Evidence from Chinese "A" Share Issues, Working Paper, State University of New York.
Hanli Consultancy Limited, 1998. Banking Reform & Central Bank's Policies. China Economy Dgest, 1998 (3).
Hansen, Lars P., 1982. Large Sample Properties of Generalized Method of Moments Estimators. Econometrica 50: 1029-1054.
Harris, Milton and Artur Raviv, 1988. Corporate Governance: Voting Rights and Majority Rules. JoumalofFinandalEconomics20(l-2): 203-35.
Harris, Milton and Artur Raviv, 1990. Capital Structure and the Informational Role of Debt. Journal of Finance 45 (2): 321-349.
189

Harris, Milton and Artur Raviv, 1991. The T'heory of Capital Structure. Journal of Finance 46(l): 297-355.
Hart, Oliver, 1995. Firms, Contacts, and Financial Structurr. Oxford: Oxford University Press.
Hart, Oliver and John Moore, 1995. Debt and Seniority. An Analysis of the Role of Hard Claims in Constraining Management. American Economic Review 85(3): 567-585.
Hart, Oliver and John Moore, 1998. Default and Renegotiation: A Dynamic Model of Debt.
. Quarter
. 1y, Journal of E co n omicr 113 (1): 1 -4 1.
Hellman, Joel and Mark Schankerman, 2000. Intervention, Corruption and Capture: the Nexus between Enterprises and the State. European Bank for Reconstruction and Development, Working Paper No. 58.
Ibbotson, Roger G., 1975. Price Performance of Common Stock New Issues. Journal offinandal Economics 2: 235-272.
Jensen Michael C. and William H. Meckling, 1976. Theory of the Firm: Managerial Behavior, Agency Costs and Ownership Structure. Journal offinandal Economicy 3: 305-360.
Jensen, Michael C., 1986. The Agency Costs of Free Cash Flow. Corporate Finance and Takeovers. American Economic Redew 76(2): 323-329.
Jensen, Michael C., 1993. The Modern Industrial Revolution, Exit, and the Failure of Internal Control Systems. Journal ofFinance 48(3): 831-880.
Jensen, Michael C. and William H. Meckling, 1976. Theory of the Firm: Managerial Behavior, Agency Costs, and Ownership Structure. Journal offinandalEconomiar 3(4): 305-360.
Jones, Steven L, William L Megginson, Robert C. Nash and Jeffery M. Netter, 1999. Share Issue Privatizations as Financial Means to Political and Economic Ends. Journal of Financial Economicr 53: 217-253.
Johnson, Simon, Rafael La Porta, Florencio Lopez-de-Silanes, and Andrei Shleifer, 2000. Tunneling. Amerkan Economic Retiew. - Papers amdPrvcee&ngs 90(2): 22-27.
Kaplan, Steve, 1989. The Effect of Management Buyouts on Operating Performance and Value. Journal ofFinandalEconomicrN: 581-618.
Kaplan, Steven N., and Bernadette Minton, 1994. Appointments of Outsiders to Japanese Boards: Determinants and Implications for Managers. JournalofFixandalEconomic 36(2): 225-258.
Kang, Jun Koo and Anil ShivadasanL 1995. Firm Performance, Corporate Governance and Top Executive Turnover in Japan. Journal offinandal Economics 38: 29-58.
Kay, John A. and David J. lbompson, 1986. Privatisation: A Policy in Search of a Rationale. EconomirJournal 96(381): 18-32.
Kole, Stacey R. and Harold J. Mulherin, 1997. The Government as a Shareholder: A Case from the United States. Journal ofLaw andEconomics 40(l): 1-22.
KomaL Janos, 1980. Economics ofShortaTe. Amsterdam: North-Holland.
Komaiý Janos, 1992. The Soda&t Sýysfem. Princeton, NJ: Princeton University Press.
190

La Porta, Rafael, Florencio Lopez-de-Silanes, and Andrei Shleifer 1999. Corporate Ownership around the World. Journal ofFinance 54(2): 471-517.
La Porta, Rafael, Florencio Lopez-de-Silanes, Andrei Shleifer, and Robert Vishny, 1999. The Quality of the Government. Journal ofl-aw, Economics and 0gani. Zation 15 (1): 222-279.
La Porta, Rafael, Florencio Lopez-de-Silanes and Andrei Shleifer, 2000. Government Ownership of Banks. Journal ofFinance 57(l): 265-301.
Lang, Larry H. P., Eli Ofek and Rene M. Stulz 1996. Leverage, Investment, and Firm Growth. Journal of Financial Economics 40 (1): 3 -29.
Lardy, Nicholas R., 1998. China. r Unfinished Economic Revolution. Brookings Institution Press: Washington, DC.
Liý Weiý 1997. The Impact of Economic Reform on the Performance of Chinese State Enterprises, 1980-1989. Journal ofPolitical Economy, 105(5): 1080-1106.
Lindenberg, Eric B. and Stephen A. Ross, 1981. Tobin's Q Ratio and Industrial Organization. Journal ofBusiness 54(l): 1-32.
Loughran, Tim and Jay R. Ritter, 1995. The New Issues Puzzle. Journal offinance 50 (1), 23-5 1.
Loughran Tim, Jay R. Ritter, and Kristian Rydqvist, 1994. Initial Public offerings: International Insights. Padfic-BasinFinancejournal2: 165-199.
Luiý Li and Wende Liý 2001. A Study of the First Day High Return of IPOs on China's Stock Market. Peking University, Working Paper.
Mace, Myles, 1971. Directors, M ytb and Reality. Boston: Harvard Business School Press.
Mauer, David and Lemma Senbet, 1992. The Effect of the Secondary Market on the Pricing of Initial Public Offerings: Theory and Evidence. Journal offinandal and_QuantitafiveAnaAsir 27: 55- 79.
McConnell, John J. and Henri Servaes, 1990. Additional Evidence on Equity Ownership and Corporate Value. Journal offinandal Economics 27: 595-612.
McConnell, John J. and Henri Servaes, 1995. Equity Ownership and the Two Faces of Debt. Journal of FinandalEconomics 39: 131-157.
Megginson, William L andjeffcry M Netter, 2001. From State to Market: A Survey of Empirical Studies on Privatization. Journal ofEconomic liferaturr 39(2): 321-389.
Megginson, William L, Robert C. Nash, and Matthias Van Randenborgh, 1994. The Financial and Operating Performance of Newly Privatized Firms: An International Empirical Analysis. Journal offinance 49,403-452.
Mok, Henry M. K and Y. V. HuL 1998. Underpricing and Aftermarket Performance of IPOs in Shanghai, China. Padfic-BasinFinancejournal6: 453-474.
Montgomery, Cynthia A. and Birger Wernerfelt (1988): Diversification, Ricardian Rents, and Tobin's Q. RAND Journal ofEconomicr 19: 623-632.
Morck Randall, Andrei Shleifer and Robert W. Vishny, 1988. Management Ownership and Market Valuation: An Empirical Analysis. Journal offinandalEconomics 20: 293-316.
191

Moulton, Brent R., 1986. Random Group Effects and the Precision of Regression Estimates. Journal ofEconometficr 32(3): 385-397.
Mundlak, Yair, 1978. On the Pooling of Time Series and Cross Section Data. Econometrica 46(l): 69-85.
Myers, Stewart C., 1977. Determinants of Corporate Borrowing. Journal offinandal Economics 5: 147-175.
Peltzman, Sam, 1976. Towards a More General Theory of Regulation. Journal of Law and Economics 20: 322-340.
Perfect, Steven B. and Kenneth W. Wiles 1994. Alternative Constructions of Tobin's Q: An Empirical Comparison. Journal ofEmpiricalFinance 1(3-4): 313-341.
Perottiý Enrico C., 1995. Credible Privatization. American Economic Review 85 (4): 847-859.
Pregibon, Daryl, 1981. Logistic Regression Diagnostics. Annals ofStatisfiar 9: 705-724.
Prowse, Stephen D., 1998. The Structure of Corporate Ownership in Japan. Journal offinance 47: 1121-1140.
Qiý Daqing, Woody Wu and Hua Zhang, 2000. Shareholding Structure and Corporate Performance of Partially Privatized Firms: Evidence from Listed Chinese Companies. Pacific- Basin FinanceJournal, forthcoming.
Rajan, Raghuram, and Luigi Zingales, 1995. What Do We Know about Capital Structure? Some Evidence from International Data. Journal offinance 50: 1421-1460.
Ritter, Jay R. and Ivo Welch, 2002. A Review of IPO Activity, Pricing, and Allocations. Journal of Finance, 57(4): 1795-1828.
Rock, Kevin, 1986. Why New Issues Arc Underpriced? Journal offinandal Economics 12: 187-212.
Schmalensee, Richard, 1985. Do Markets Differ Much? American Economic Review 75: 341-351.
Schmidt, Klaus M., 2000. The Political Economy of Mass Privatization and the Risk of Expropriation. Eurvpean Economic Review 44(2): 393-421.
Segal, Ilya B, 1998. Monopoly and Soft Budget Constraint. RAND Journal ofEconomics 29(3): 596- 609.
Shiller, Robert J., 1990. Market Volatility and Investor Behavior. American Economic Retiew. Papers andProcee&jgs 80(2): 58-62.
Shin, Hyun-Han and Rene R. Stulz, 1998. Are Internal Capital Markets Efficient? The_Quartelby Journal of Economics 113(2): 531-552.
Shleifer, Andrei and Robert W. Vishny, 1986. Large Shareholders and Corporate Control. journal of PoliticalEconomy 94(3): 461488.
ShIcifer, Andrei and Robert W. Vishny, 1994. Politicians and Firrns. ua erl, .Q rt yJournalofEconomicr 109(4): 995-1025.
Shleifer, Andrei and Robert W. Vishny, 1997. A Survey of Corporate Governance. Journal of Finance 52(2): 737-783.
192

Shleifer, Andrei and Robert W. Vishny, 1998. The Grabbin nd- mm n ,g Ha Gove et Patboýgies and Their
Cures. Cambridge, MA: Harvard University Press.
Smith, Clifford W. and Jerold B. Warner, 1979. On Financial Contracting- An Analysis of Bond Covenants. Journal offinancialEconomicr 7: 117-161.
Smith, Clifford W. and Ross I- Watts, 1992. The Investment Opportunity Set and Corporate Financing, Dividend, and Compensation Policies. Journal offinandal Economics 32: 263-292.
Stigler, George J., 1971. Ile Theory of Economic Regulation. BelljournalqfEconomiks2: 3-21.
Stiglitz, Joseph, 1994. Wbitber Capitalism. Cambridge, MA: The MIT Press.
Stulz, Rene R., 1988. Managerial Control of Voting Rights: Financing Policies and the Market for Corporate Control. Journal offinandal Economics 20(l): 25-54.
Stulz, Rene R., 1990. Managerial Discretion and Optimal Financing Policies. Journal ofFinandal Economics 26: 3-27.
Su, Dongwei and Belton M. Fleisher, 1998. What Explains the I-Egh IPO Returns in China? y 2: 5-20.
. ging Market. Quarferl, Emeý
Su, Dongwei and Belton M. Fleisher, 1999. An Empirical Investigation of Underpricing in Chinese IPOs. Paaific-BasinFinancejournal7: 173-202.
Taranto, Mark, 2001. Why Investment Banks Underprice IPOs: Because They Can. University of California, Berkeley, Working Paper.
Tian, Lihuiý 1999. A Taxonomy of Corporate Governance. Unpublished manuscript, London Business School.
Tian, Lihuiý 2000. Government Shareholding and the Value of China's Modem Firms. Institute of Finance and Accounting at the London Business School, Working Paper No. 319.
Tian, Lihuiý 2001. Debt Governance, Bank Capture and Soft Budget Constraints: An Empirical Analysis of an Emerging Market. Center for New and Emerging Markets at the London Business School, Working Paper No. 27.
Tian, LihuL 2002. Excessive IPO Underpricing, the Government Issuer and the Flotation Time Game. Center for New and Emerging Markets at the London Business School, Working Paper No. 28.
Titman, Sheridan and Roberto Wessels, 1988. The Determinants of Capital Structure Choice. Journal offinance 43(l): 1-19.
Townsend, Robert M., 1979. Optimal Contracts and Competitive Markets with Costly State Verification. Journal ofEconomic Theo! y 21(2): 265-93.
Unnamed paper, 2002. Under the review ofjournal offinandal and uanfita iveAna i No. 8947. .Qt JIS S'
Vilasuso, Jon and Alanson Minkler, 2001. Agency Costs, Asset Specificity and the Capital Structure of the Firm. Journalof Economic Bebatior and Organi. Zation 44: 55-69.
Vickers, John and George Yarrow, 1988. Privati! Zation: An EconomicAnaly'sis. Cambridge, MA: The MIT Press.
193

Vining, Aidan R. and Anthony E. Boardman, 1990. Ownership versus Competition: Efficiency in Public Enterprise. Public Cboice 73: 205-239.
Wang, Yianying, 1988. How Much Do General Managers of Public Listed Companies Receive Annually? Public Listed Companies (Chinese) 88: 8-15.
Weiý Shang-jin and Tao Wang, 1997. The Siamese Twins: Do State-Owned Banks Favor State- Owned Enterprises in China? Cbina Economic Review 8(l): 19-29.
Welch, Ivo, 1989. Seasoned Offerings, Imitation Costs, and the Underpricing of Initial Public Offerings. journal offinance 44: 421-449.
Welch, Ivo, 1992. Sequential Sales, Learning, and Cascades. journal of Finance 47: 695-732.
Williamson, Oliver E, 1988. Corporate Finance and Corporate Governance. Journal of Finance 43(3): 567-591.
World Bank, 2000. Cor . porate Governance in EastAsia. Washington DC: World Bank Publications.
Xu, Xiaonian and Yan Wang, 1999. Ownership Structure and Corporate Governance in Chinese Stock Companies. Cbina Economic Review 10: 75-98.
194