Identifying the bandwagon effect in two-round elections
27
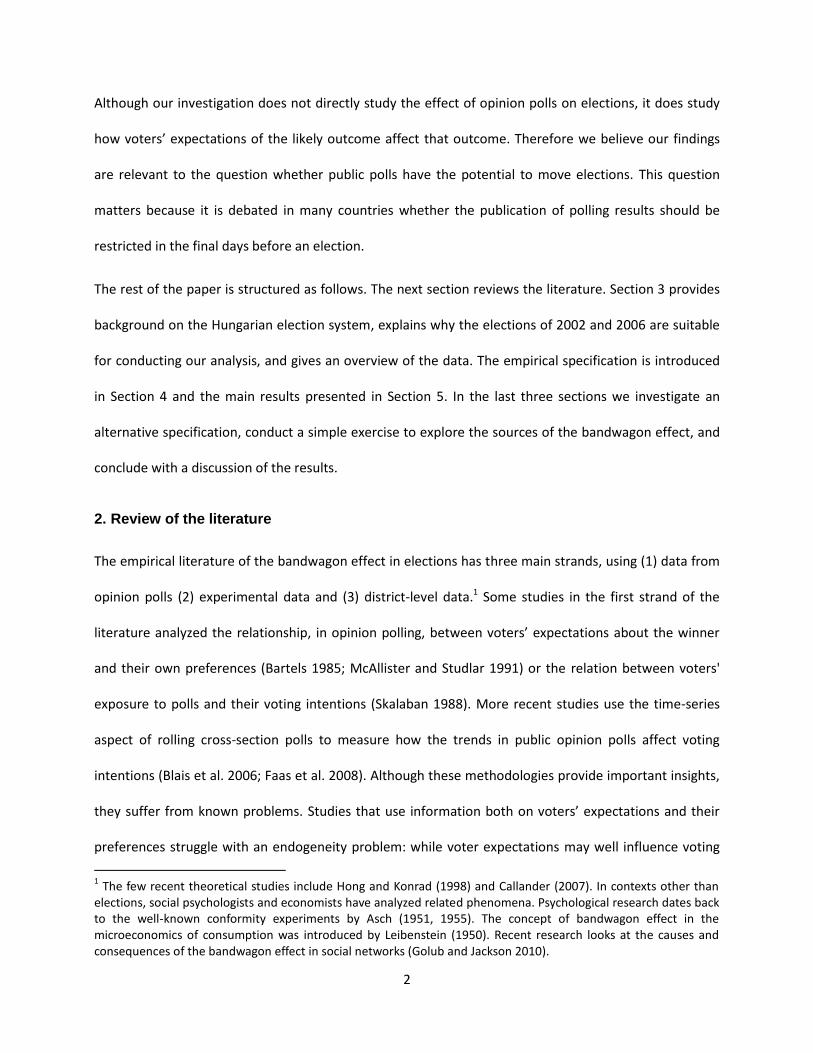
Identifying the bandwagon effect in two-round elections * Áron KISS a,+ and Gábor SIMONOVITS b a Central Bank of Hungary (MNB) b Stanford University, Department of Political Science November 2013 Abstract We propose a new method to test for the existence of the bandwagon effect, the notion that voters are more likely to vote for a given candidate if they expect the candidate to win. Two-round election systems with a large number of single-member districts offer an ideal testing ground because results from the first round provide a better benchmark for voter expectations than any possible alternative measure. Using data from the 2002 and 2006 general elections in Hungary, we find that the lead of a candidate in the first round is magnified by about 10 percent in the second round, controlling for country-wide swings of the electorate between the two rounds and for the behavior of voters of smaller parties. A separate exercise suggests that at least part of the effect is caused by the lower probability of individuals voting in the second round if their preferred candidate is likely to lose by a large margin. Keywords: Bandwagon effect; underdog effect; two-round elections; runoff; turnout; West Coast effect JEL Classification: D72, D80 * This research had been conducted before Áron Kiss started working at the European Commission. Opinions expressed in this paper are those of the authors and do not reflect the views of their past or present institutions. The authors would like to thank Ivo Bischoff, Benny Geys, Kai Konrad, Balázs Muraközy, Christian Pfeil, Gábor Tóka, Balázs Váradi, participants of the PolBeRG seminar at Central European University (Budapest), the Meeting of the Hungarian Association for Economics in 2011, and the European Public Choice Society Meeting 2013 (Zürich), as well as four anonymous referees and the Editor in Chief, for useful comments and suggestions. Any remaining error or omission is our responsibility. + Corresponding author. Current address: European Commission, Directorate General for Economic and Financial Affairs. E-mail: Aron.Kiss(at)gmail.com.
-
Upload
independent -
Category
Documents
-
view
0 -
download
0
Transcript of Identifying the bandwagon effect in two-round elections
Identifying the bandwagon effect in two-round elections*
Áron KISSa,+ and Gábor SIMONOVITSb
a Central Bank of Hungary (MNB)
b Stanford University, Department of Political Science
November 2013
Abstract
We propose a new method to test for the existence of the bandwagon effect, the notion
that voters are more likely to vote for a given candidate if they expect the candidate to
win. Two-round election systems with a large number of single-member districts offer an
ideal testing ground because results from the first round provide a better benchmark for
voter expectations than any possible alternative measure. Using data from the 2002 and
2006 general elections in Hungary, we find that the lead of a candidate in the first round is
magnified by about 10 percent in the second round, controlling for country-wide swings of
the electorate between the two rounds and for the behavior of voters of smaller parties. A
separate exercise suggests that at least part of the effect is caused by the lower
probability of individuals voting in the second round if their preferred candidate is likely to
lose by a large margin.
Keywords: Bandwagon effect; underdog effect; two-round elections; runoff; turnout; West
Coast effect
JEL Classification: D72, D80
* This research had been conducted before Áron Kiss started working at the European Commission. Opinions
expressed in this paper are those of the authors and do not reflect the views of their past or present institutions. The authors would like to thank Ivo Bischoff, Benny Geys, Kai Konrad, Balázs Muraközy, Christian Pfeil, Gábor Tóka, Balázs Váradi, participants of the PolBeRG seminar at Central European University (Budapest), the Meeting of the Hungarian Association for Economics in 2011, and the European Public Choice Society Meeting 2013 (Zürich), as well as four anonymous referees and the Editor in Chief, for useful comments and suggestions. Any remaining error or omission is our responsibility. + Corresponding author. Current address: European Commission, Directorate General for Economic and Financial Affairs. E-mail: Aron.Kiss(at)gmail.com.
1
1. Introduction
In the context of elections, the bandwagon effect refers to the notion that voters are more likely to vote
for a candidate if they expect the candidate to win. In an early theoretical analysis of the bandwagon
effect, Simon (1954) connected the issue to the question whether forecasting is possible at all in the
social sciences: the forecast may affect the event after all. The first systematic empirical studies include
the analysis of Gallup and Rae (1940), who argued against the existence of the bandwagon effect, and
that of Lazarsfeld et al. (1948) who found some evidence for it. Empirical evidence has been inconclusive
ever since. As Blais et al. (2006) summarize: “The existence of [bandwagon] effects in elections is not
well established, but it would be imprudent to rule out the possibility of such effects.”
In this paper we apply a new research design that enables us to estimate the bandwagon effect in the
context of large-scale elections. Exploiting the features of a two-round election system with a large
number of single-member districts, we estimate the bandwagon effect using district-level data from the
general elections of 2002 and 2006 in Hungary. The bandwagon effect is operationalized as an increase
in the lead of a candidate from the first round election to the second. Identification is based on cross-
district variation in the support for major-party candidates after controlling for the behavior of voters of
small parties and year-specific country-wide swings of the electorate between both rounds.
We find strong evidence for the existence of the bandwagon effect. We find that a first-round lead is, on
average, magnified by about 10% in the second round. The effect is statistically significant across
specifications and in both years separately. Besides the main results we obtain plausible estimates for
the second-round behavior of voters of small parties. We also find evidence of a significant swing of the
electorate toward one party in 2002 but not in 2006. Finally, we conduct a simple exercise to explore the
source of the bandwagon effect. We find that it is at least partly driven by the lower probability of voters
turning out in the second round if their preferred candidate is likely to lose by a large margin.
2
Although our investigation does not directly study the effect of opinion polls on elections, it does study
how voters’ expectations of the likely outcome affect that outcome. Therefore we believe our findings
are relevant to the question whether public polls have the potential to move elections. This question
matters because it is debated in many countries whether the publication of polling results should be
restricted in the final days before an election.
The rest of the paper is structured as follows. The next section reviews the literature. Section 3 provides
background on the Hungarian election system, explains why the elections of 2002 and 2006 are suitable
for conducting our analysis, and gives an overview of the data. The empirical specification is introduced
in Section 4 and the main results presented in Section 5. In the last three sections we investigate an
alternative specification, conduct a simple exercise to explore the sources of the bandwagon effect, and
conclude with a discussion of the results.
2. Review of the literature
The empirical literature of the bandwagon effect in elections has three main strands, using (1) data from
opinion polls (2) experimental data and (3) district-level data.1 Some studies in the first strand of the
literature analyzed the relationship, in opinion polling, between voters’ expectations about the winner
and their own preferences (Bartels 1985; McAllister and Studlar 1991) or the relation between voters'
exposure to polls and their voting intentions (Skalaban 1988). More recent studies use the time-series
aspect of rolling cross-section polls to measure how the trends in public opinion polls affect voting
intentions (Blais et al. 2006; Faas et al. 2008). Although these methodologies provide important insights,
they suffer from known problems. Studies that use information both on voters’ expectations and their
preferences struggle with an endogeneity problem: while voter expectations may well influence voting
1 The few recent theoretical studies include Hong and Konrad (1998) and Callander (2007). In contexts other than
elections, social psychologists and economists have analyzed related phenomena. Psychological research dates back to the well-known conformity experiments by Asch (1951, 1955). The concept of bandwagon effect in the microeconomics of consumption was introduced by Leibenstein (1950). Recent research looks at the causes and consequences of the bandwagon effect in social networks (Golub and Jackson 2010).
3
intentions, the reverse is also likely to happen as voters project their wishes onto their expectations.2 In
studies that concentrate on the time-series aspect of polls, there is the danger that what appears as a
causal effect of public polls on movements in the researcher’s rolling poll is rather the effect of a third
causal factor, exogenous to both sets of polls. Generally, controlling for voter expectations by means of
public opinion polls is a very blunt tool since polls are imprecise, different voters may be aware of
different polls, and it is unclear how well voters can recall them. In contrast, our method controls for
voter expectations about the runoff election by looking at the results of the first round. First-round
results are perfectly observable for the voter as well as the researcher for each district separately, and
they arguably supply more salient information than any opinion poll.
Another large strand of the literature took an experimental approach to test the existence of the
bandwagon effect (Navazio 1977; Ceci and Kain 1982; Marsh 1985; Nadeau et al. 1993; Goidel and
Shields 1994; Morwitz and Pluzinski 1996; Mutz 1997; Sonck and Loosveldt 2010). Subjects in these
studies are given information in various random treatments about public opinion on a certain political
issue, or current election contest, before their own attitudes are asked. While these methodologies
successfully solve the problems of causality and control, they too have weaknesses. First, it is difficult to
assess whether the effects measured are long-lasting and whether they have a real impact on elections.
Second, even accepting their external validity, these studies are not designed to quantify the magnitude
of bandwagon effect in actual elections. In contrast, our method is able to provide an estimate of the
magnitude of the bandwagon effect in real-world elections.
District-level data have been used in the past to assess how voters’ expectations of the likely outcome of
an election affects their behavior. The literature on the so-called ‘West Coast effect’ analyzed whether
election results on the West Coast of the United States are affected by exit polls in Eastern states where
2 Bartels (1985), Skalaban (1988) and McAllister and Studlar (1991) all address this problem of reverse causality and
try to control for it in different ways. See also Krizan et al. (2010) for a recent analysis focusing on the projection effect.
4
polls close earlier.3 While the first studies found no such effects (Fuchs 1966; Mendelsohn 1966;
Tuchman and Coffin 1971), some studies analyzing the 1980 elections did find that turnout was
suppressed on the West Coast because the presidential race turned out to be less close than expected
(Jackson 1983; Delli Carpini 1984; Sudman 1986). Whether this effect benefited the winning side (as Delli
Carpini found based on district-level data) or the losing side (as Jackson found based on micro-level
evidence) is not settled.4 In any case, the effect on the outcome of the election seems to be small even
when there is an effect, although Delli Carpini argues that down-ballot races were affected in a non-
trivial way.
Besides the literature on the West Coast effect, a recent paper by Hodgson and Maloney (2013) studies
the bandwagon effect on British election data over the 1885-1910 period. In these elections, districts
voted on different days during a two-week period, thus allowing the effect of early results on later
contests to be studied. The authors find evidence for a bandwagon effect peaking on about the 8th day of
the election (giving a swing of about 1.65% to the national winner in contests on this day), fading
afterwards. Our methodology also uses the timing of elections to identify the bandwagon effect, but our
parameter of interest is different. Hodgson and Maloney (2013) estimate how the election result in a
district would change if the election were held a given number of days later. In the present paper, in
contrast, we estimate whether there is a benefit to being in the lead in a given district beyond the
original size of the lead. If so, how much benefit does an additional one-percentage-point lead mean to
the leader?5 This ‘bandwagon parameter’ is sought by many studies in the previous literature but our
methodology based on two-round elections is the first that is able to give precise estimates.6
3 This link between the West Coast and bandwagon effects has been made by Hodgson and Maloney (2013).
4 Lott (2005) found evidence for a similar effect in the 2000 presidential election in Florida. Turnout was reduced in
10 counties of the Western ‘Panhandle’ where, due to the different time zone from the rest of the state, polls closed later. The low turnout was apparently due to the fact that television networks called the Florida race early (and, as it turned out, wrongly). 5 Separately, we are also able to test whether the national leader enjoys a boost in runoff elections but we find no
evidence for this. The only year when there seems to be a large swing between both rounds in our data is 2002, and
5
Based on the literature review it appears useful to distinguish between the concepts of the ‘individual-
level’ and the ‘aggregate-level’ bandwagon effect. The individual-level bandwagon effect is the notion
that some voters convert to become supporters of the leading candidate (whether out of conformity or
because voters learn something from the judgments of other voters). The aggregate-level bandwagon
effect is the notion that the leading candidate derives an electoral advantage of being perceived by
voters to be in the lead. In this study we take the second view on the bandwagon effect since we are
working with district-level aggregate data. We emphasize, however, that it is the aggregate-level
bandwagon effect that matters for any policy debate concerning the effects of the publication of polls
(or exit polls or early results) on election outcomes. The aggregate effect is consistent with many micro-
level processes: for example, turnout may be higher among supporters of the leading candidate, or lower
among supporters of the losing candidate, with no actual ‘conversion’ of voters taking place. We try to
explore the reasons behind our aggregate findings in a separate exercise in Section 7.
3. Background and data
3.1. The Hungarian election system
The Hungarian system of parliamentary elections was created in 1989 and no major modifications were
made to it until 2011. The system was a combination of proportional and majoritarian elements: of the
386 seats, 152 were filled under a proportional rule based on regional party lists, 176 were elected
directly in single-member districts, and 58 seats were allocated in a compensatory system to increase
proportionality.
The feature of the system that is most important for our purpose is that the 176 directly elected
representatives were elected in a two-round election. The first round was decisive only if a candidate
the swing benefits the losing side. 6 Two-round elections have been used to identify the effect of the closeness of an election on turnout (Fauvelle-
Aymar and Francois 2006; Simonovits 2012). We are not aware of any study using two-round elections to identify the bandwagon effect.

6
received more than 50% of the valid votes cast. Otherwise, a second round (runoff) election was held 14
days later for which the three candidates with the largest number of votes qualified (along with any
further candidate who received at least 15% of the vote; the qualification of a fourth candidate,
however, was extremely rare). Starting in 1998 it was typical for parties to withdraw third-placed
candidates and endorse one of the leading ones in the first-past-the-post second round.
3.2. Choice of election years suitable for the analysis
There are three criteria that make an election ideal for the application of our method:
1) There should be many districts with runoff elections between the candidates of the same
parties.
2) The runoff elections should be between two candidates (not three).
3) The two leading candidates should have high vote shares in the first round.
Criterion 1 is necessary because our method is based on a cross-sectional comparison of districts in the
same election. Criterion 2 is important because third candidates have the potential to complicate the
regression analysis greatly, for several reasons. First, third candidates may not all be of the same party,
which would need to be controlled for. Second, and more importantly, issues of strategic voting would
complicate the analysis. Finally, Criterion 3 is important if the party structure is more fragmented. If
competing party alliances have important members besides the leaders, then the first-round result of
the leading parties says little about the competitive standing of both alliances in a particular district.
Rather, we must look at the competitive standing of the alliances as a whole to know who is leading (and
by how much).
Based on these criteria, the Hungarian elections of 2002 and 2006 are ideal for the study of the
bandwagon effect in two-round elections; other Hungarian elections fail to fulfil at least one criterion.
Between 1990 and 2010 Hungary held six elections under the same two-round system. In the 2010
7
election most individual districts were decided in the first round; only 57 runoffs took place, 53 of which
were three-candidate races. In contrast, almost all districts in 1990 and 1994 went into a runoff, but only
41 and 12, respectively, were two-candidate races.
There were only three elections (1998, 2002 and 2006) in which the same major parties, the center-left
Socialist Party and center-right Fidesz, faced off in a large number of two-candidate runoff elections, but
only in 2002 and 2006 is Criterion 3 fulfilled. While in 2002 and 2006 the vote share of major-party
candidates was around 40%, or more, in the first round, it was only around 30% in 1998. An additional
advantage of analyzing the 2002 and 2006 elections together is that the party structure, including the
secondary party preferences of voters, remained fairly stable during these four years. Thus, it is possible
to combine these two elections, while it is not possible to pool the districts of 1998 in the same analysis.
Therefore, the main analysis in this paper focuses on the 2002 and 2006 elections in Hungary. The
analysis of the 1998 election, included in the Appendix, confirms that taking into account party alliances
makes a difference in an election for which the vote share of major parties is relatively small (but it is
shown not to matter in the two other elections in Section 6). Secondary voter preferences are found to
be very different in 1998 than in the next two elections. The estimated bandwagon effect in 1998 is,
however, comparable to the main results of the paper, once party alliances are taken into account.
3.3. The sample
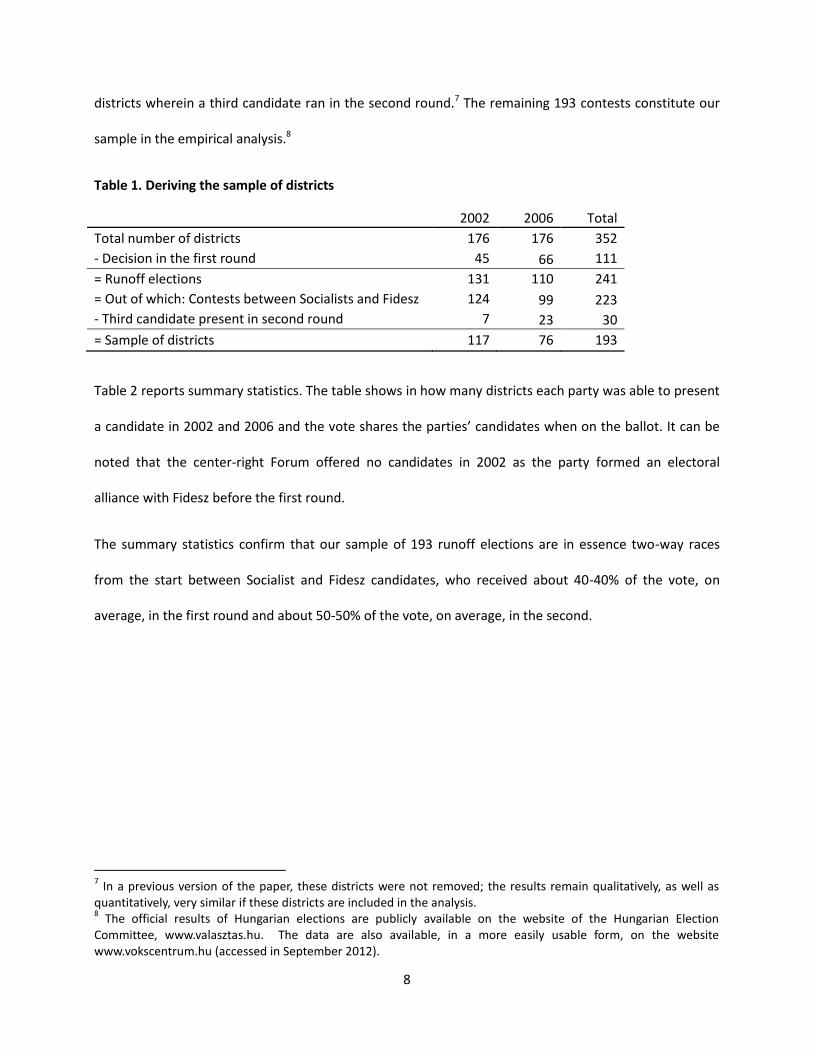
Table 1 shows how our sample is chosen from the 352 single-mandate district elections from the two
election years. The elections in 111 of these districts were decided in the first round. Of the remaining
241 districts, only in 223 did the two major parties face off in the runoff. We removed 30 of these
8
districts wherein a third candidate ran in the second round.7 The remaining 193 contests constitute our
sample in the empirical analysis.8
Table 1. Deriving the sample of districts
2002 2006 Total
Total number of districts 176 176 352
- Decision in the first round 45 66 111
= Runoff elections 131 110 241
= Out of which: Contests between Socialists and Fidesz 124 99 223
- Third candidate present in second round 7 23 30
= Sample of districts 117 76 193
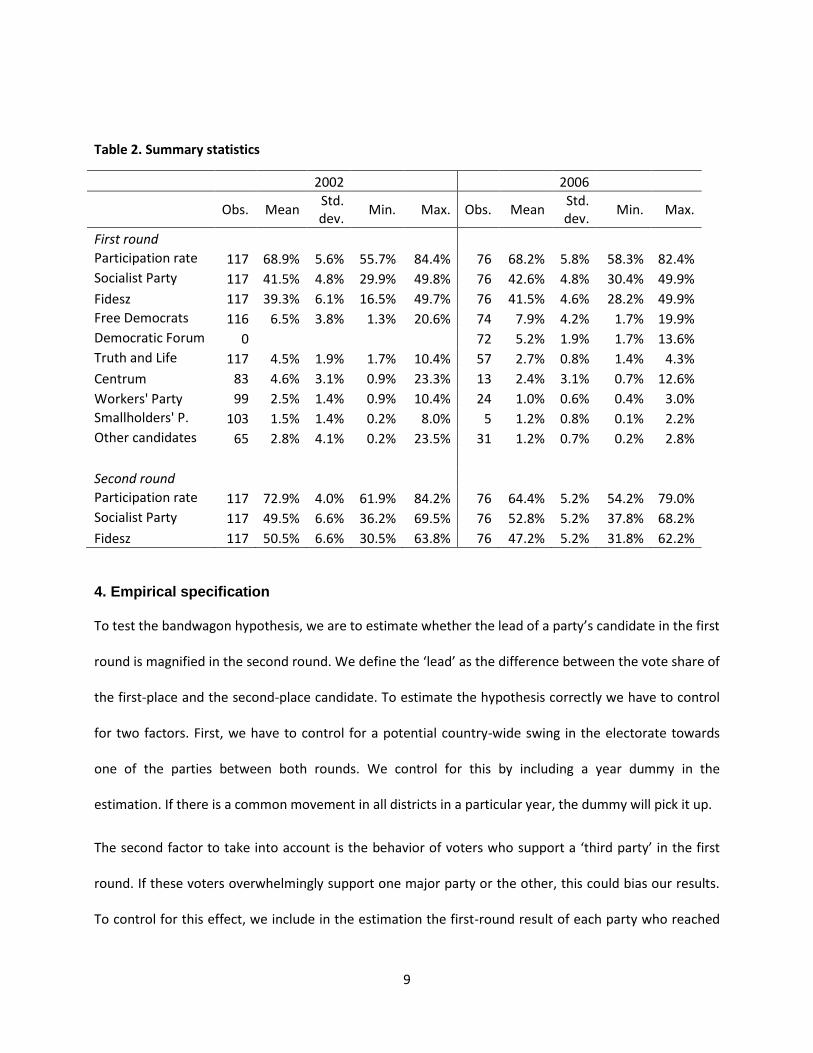
Table 2 reports summary statistics. The table shows in how many districts each party was able to present
a candidate in 2002 and 2006 and the vote shares the parties’ candidates when on the ballot. It can be
noted that the center-right Forum offered no candidates in 2002 as the party formed an electoral
alliance with Fidesz before the first round.
The summary statistics confirm that our sample of 193 runoff elections are in essence two-way races
from the start between Socialist and Fidesz candidates, who received about 40-40% of the vote, on
average, in the first round and about 50-50% of the vote, on average, in the second.
7 In a previous version of the paper, these districts were not removed; the results remain qualitatively, as well as
quantitatively, very similar if these districts are included in the analysis. 8 The official results of Hungarian elections are publicly available on the website of the Hungarian Election
Committee, www.valasztas.hu. The data are also available, in a more easily usable form, on the website www.vokscentrum.hu (accessed in September 2012).
9
Table 2. Summary statistics
2002 2006
Obs. Mean
Std. dev.
Min. Max. Obs. Mean Std. dev.
Min. Max.
First round
Participation rate 117 68.9% 5.6% 55.7% 84.4% 76 68.2% 5.8% 58.3% 82.4%
Socialist Party 117 41.5% 4.8% 29.9% 49.8% 76 42.6% 4.8% 30.4% 49.9%
Fidesz 117 39.3% 6.1% 16.5% 49.7% 76 41.5% 4.6% 28.2% 49.9%
Free Democrats 116 6.5% 3.8% 1.3% 20.6% 74 7.9% 4.2% 1.7% 19.9%
Democratic Forum 0
72 5.2% 1.9% 1.7% 13.6%
Truth and Life 117 4.5% 1.9% 1.7% 10.4% 57 2.7% 0.8% 1.4% 4.3%
Centrum 83 4.6% 3.1% 0.9% 23.3% 13 2.4% 3.1% 0.7% 12.6%
Workers' Party 99 2.5% 1.4% 0.9% 10.4% 24 1.0% 0.6% 0.4% 3.0%
Smallholders' P. 103 1.5% 1.4% 0.2% 8.0% 5 1.2% 0.8% 0.1% 2.2%
Other candidates 65 2.8% 4.1% 0.2% 23.5% 31 1.2% 0.7% 0.2% 2.8%
Second round
Participation rate 117 72.9% 4.0% 61.9% 84.2% 76 64.4% 5.2% 54.2% 79.0%
Socialist Party 117 49.5% 6.6% 36.2% 69.5% 76 52.8% 5.2% 37.8% 68.2%
Fidesz 117 50.5% 6.6% 30.5% 63.8% 76 47.2% 5.2% 31.8% 62.2%
4. Empirical specification
To test the bandwagon hypothesis, we are to estimate whether the lead of a party’s candidate in the first
round is magnified in the second round. We define the ‘lead’ as the difference between the vote share of
the first-place and the second-place candidate. To estimate the hypothesis correctly we have to control
for two factors. First, we have to control for a potential country-wide swing in the electorate towards
one of the parties between both rounds. We control for this by including a year dummy in the
estimation. If there is a common movement in all districts in a particular year, the dummy will pick it up.
The second factor to take into account is the behavior of voters who support a ‘third party’ in the first
round. If these voters overwhelmingly support one major party or the other, this could bias our results.
To control for this effect, we include in the estimation the first-round result of each party who reached

10
1% of the vote on the national scale and, as a separate variable, the vote share of the remaining
(independent and other) candidates (see the row “Other candidates” in Table 2). If the first-round vote
share of a third party significantly affects the second-round difference between both major parties, we
will be able to infer the second preference of its voters. Controlling for them helps us separate their
decisions from the bandwagon issue: any unexpected increase in the leader’s vote share will not be due
to the second preference of third-party voters. Thus, we estimate the following equation:
(Fidesz–Socialist)i,y,2 = b · (Fidesz–Socialist)i,y,1 + ∑p (ap · OtherCandp ,i,y,1) + ∑t (ct · Yeart ) + εi,y
Here, (Fidesz–Socialist)i,y,r is the lead of the Fidesz candidate over the Socialist candidate in district i, year
y and round r, in percentage points; OtherCandp ,i,y,1 is the vote share of candidate p (other than the two
major parties) in the first round in the year and district in question; Yeart is the year dummy for year t;
while εi,y is the error term.
The bandwagon effect is then equivalent to the hypothesis that the coefficient b > 1. The case b = 1
corresponds to the situation wherein, after taking into account the potential country-wide swing
between rounds and the behavior of voters who voted for a small party in the first round, there is no
further shift toward the party that had the lead in the first round in a given district. A coefficient b < 1
would correspond to the case where, after controlling for all factors mentioned, a first-round lead tends
to decrease in the second round. If this is so, we would find evidence for an ‘underdog effect’.
Are there further confounding factors that could affect our results? Here we make the argument that
one particular confounding factor, strategic voting, is not likely to bias our results. Strategic voting occurs
when an individual does not vote for his or her preferred party in order to influence the outcome of the
election in a more effective way.9 The most often analyzed type of strategic voting is to avoid casting a
‘wasted vote’: supporters of small parties may vote for another party that has a better chance of
9 For a thorough treatment on strategic voting, see Cox (1997).

11
winning. In our analysis, strategic voting in this sense cannot occur in the second round because we are
concentrating on two-candidate runoffs.10
The only type of strategic voting that may occur in our sample materializes in the first round: it may
involve minor-party supporters voting for a major party’s candidate (to help it over the 50% threshold,
perhaps) or, the other way round, with major-party voters casting a first-round vote for a minor-party
candidate (perhaps to increase the chance that this candidate, rather than a fourth one, qualifies for the
runoff). In any case, these voters are observationally equivalent to other voters of the candidates they
support. Their second-round behavior is controlled for by including the vote share of minor parties in our
regressions.
5. Results
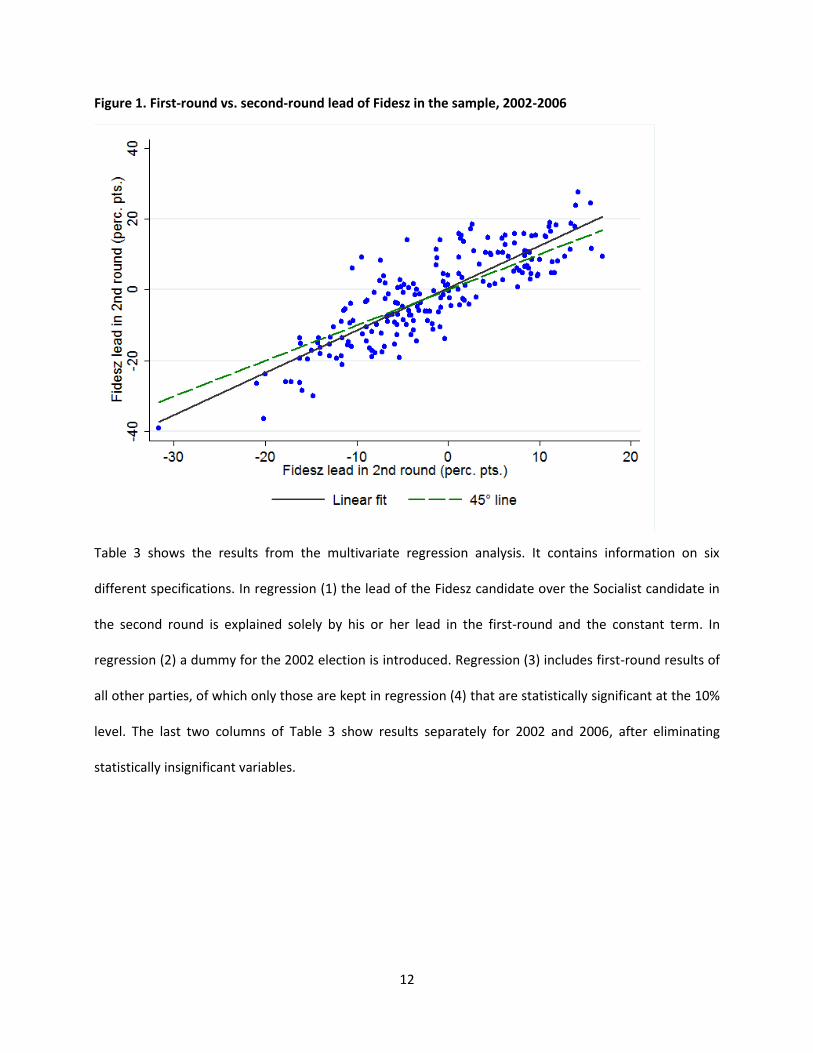
Before turning to the multivariate regression results let us inspect the dependent variable plotted
against the main explanatory variable. Figure 1 shows the percentage-point difference between both
major parties in the first round and the second round as a scatter plot. There are two auxiliary lines: the
dashed line marks the set of points for which the difference in the first round is equal to the difference in
the second round (‘the 45 degree line’), while the solid line is the fitted bivariate regression line.
Figure 1 is consistent with the bandwagon hypothesis: The party having the lead after the first round was
likely to widen its lead in percentage points. There is, however, considerable variance in the data
unexplained by the simple bivariate analysis.
10
In a complementary project, Kiss (2012) analyses strategic voting in Hungarian general elections in the period 1990-2010, focusing on three-candidate runoff contests.
12
Figure 1. First-round vs. second-round lead of Fidesz in the sample, 2002-2006
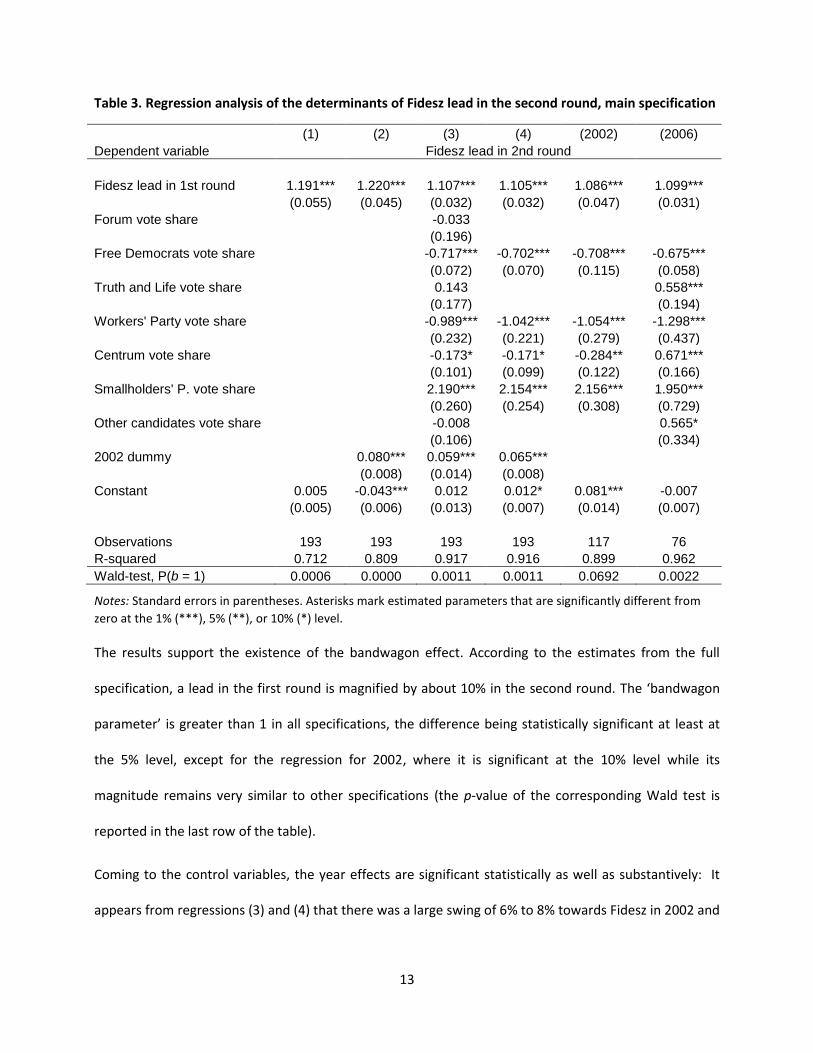
Table 3 shows the results from the multivariate regression analysis. It contains information on six
different specifications. In regression (1) the lead of the Fidesz candidate over the Socialist candidate in
the second round is explained solely by his or her lead in the first-round and the constant term. In
regression (2) a dummy for the 2002 election is introduced. Regression (3) includes first-round results of
all other parties, of which only those are kept in regression (4) that are statistically significant at the 10%
level. The last two columns of Table 3 show results separately for 2002 and 2006, after eliminating
statistically insignificant variables.
13
Table 3. Regression analysis of the determinants of Fidesz lead in the second round, main specification
(1) (2) (3) (4) (2002) (2006)
Dependent variable Fidesz lead in 2nd round
Fidesz lead in 1st round 1.191*** 1.220*** 1.107*** 1.105*** 1.086*** 1.099***
(0.055) (0.045) (0.032) (0.032) (0.047) (0.031)
Forum vote share
-0.033
(0.196)
Free Democrats vote share
-0.717*** -0.702*** -0.708*** -0.675***
(0.072) (0.070) (0.115) (0.058)
Truth and Life vote share
0.143
0.558***
(0.177)
(0.194)
Workers' Party vote share
-0.989*** -1.042*** -1.054*** -1.298***
(0.232) (0.221) (0.279) (0.437)
Centrum vote share
-0.173* -0.171* -0.284** 0.671***
(0.101) (0.099) (0.122) (0.166)
Smallholders' P. vote share
2.190*** 2.154*** 2.156*** 1.950***
(0.260) (0.254) (0.308) (0.729)
Other candidates vote share
-0.008
0.565*
(0.106)
(0.334)
2002 dummy
0.080*** 0.059*** 0.065***
(0.008) (0.014) (0.008)
Constant 0.005 -0.043*** 0.012 0.012* 0.081*** -0.007
(0.005) (0.006) (0.013) (0.007) (0.014) (0.007)
Observations 193 193 193 193 117 76
R-squared 0.712 0.809 0.917 0.916 0.899 0.962
Wald-test, P(b = 1) 0.0006 0.0000 0.0011 0.0011 0.0692 0.0022
Notes: Standard errors in parentheses. Asterisks mark estimated parameters that are significantly different from
zero at the 1% (***), 5% (**), or 10% (*) level.
The results support the existence of the bandwagon effect. According to the estimates from the full
specification, a lead in the first round is magnified by about 10% in the second round. The ‘bandwagon
parameter’ is greater than 1 in all specifications, the difference being statistically significant at least at
the 5% level, except for the regression for 2002, where it is significant at the 10% level while its
magnitude remains very similar to other specifications (the p-value of the corresponding Wald test is
reported in the last row of the table).
Coming to the control variables, the year effects are significant statistically as well as substantively: It
appears from regressions (3) and (4) that there was a large swing of 6% to 8% towards Fidesz in 2002 and
14
perhaps a swing of 1%, or none at all, towards Fidesz in 2006. These estimated year effects are
confirmed when regressions are run for both years separately.
The results of regression (3) show that the voters of some minor parties affected the second round
significantly, while voters of other parties did not. An example for the latter is Forum in 2006. The party
did not run separately in 2002, but distanced itself from Fidesz, its former ally, by 2006.
Two further variables lack statistical significance in regression (3): the vote share of extreme-right Truth
and Life and the vote share of ‘Other candidates’. These two groups appear to behave differently across
years: more than half of their voters support Fidesz in 2006, while they are neutral on average in 2002.
The explanation might be the change in incumbency status: Fidesz ran as the incumbent in 2002 while
the Socialists were in that role in 2006. If, as is likely, voting for the extreme right or very small parties
contains an element of protest, it seems logical that voters of these parties were less inclined to vote for
Fidesz when it was the incumbent. Similarly, voters of Centrum appear to have behaved differently
across years.
Turning to the parties whose voters influenced the second-round vote significantly, it appears that voters
of the Free Democrats (a liberal coalition partner of the Socialist Party in the 1994–1998 and 2002–2008
periods) supported the Socialist candidates by a 70 point margin. In contrast, all voters of the Workers'
Party (a party seeing itself as the true successor of the pre-transition state party) appear to have
supported the Socialist candidates in the second round. Both coefficients are very robust across years
and specifications, providing support to our claim that the party system was quite stable between 2002
and 2006.
Finally, voters of the Smallholders' Party (a coalition partner of Fidesz between 1998 and 2002 that lost
much of its significance by 2002 following scandals and breakups) supported candidates of Fidesz
strongly in the second round. In fact, it appears that for every vote the Smallholders’ Party got in the first
15
round Fidesz gained about two votes in the second round. A possible explanation is that many former
voters of the Smallholders’ Party were demotivated enough by the weakening of their party to abstain in
the first round, but could be mobilized to vote for the Fidesz candidate in the second round, especially in
the rural areas that had been the stronghold of the Smallholders' Party before its demise.
The explanatory power of the fully specified model is very high, which should come as no surprise given
that we use all relevant information from the first round to predict the outcome of the second. Taking
into account the year dummies increases the R-squared of the model from around 70% to 80%, while
taking into account the vote share of the other parties increases the R-squared to over 90%. At the same
time, it appears that the 2002 elections were more turbulent than those in 2006. Besides the fact that
there was a large country-wide swing between the two rounds, the explanatory power of our regression
model is also lower for 2002 (90%) than for 2006 (96%).
6. Robustness of the results: ‘alliance specifications’
In this section we consider the possibility that what really matters is not the lead of one candidate over
the other, but the lead of one electoral alliance over the other.11 We employ two different ways of
classifying parties into electoral alliances. In the first classification (‘small alliances’) we define the
Socialists and the Workers’ Party as the left-wing alliance, and Fidesz and the Smallholders’ Party as the
right-wing alliance. This is justified, as we estimated that voters of these minor parties give their full
support to these major parties in the second round. In the other classification (‘large alliance’) we add
the Free Democrats to the left-wing alliance. Although the support of their voters for Socialist candidates
11
An earlier version of the paper included another alternative specification in which vote shares were defined not as percentages of valid votes but as votes cast as a percentage of the number of eligible voters. That definition is, however, inferior to our main specification because a uniform increase in the participation rate between both rounds biases the bandwagon coefficient upwards (and vice versa). Overall, results from this alternative specification are similar to our baseline results, although, as predicted, the estimated bandwagon effect is larger in 2002 (when participation increased between both rounds) and lower and statistically not significant in 2006 (when participation declined between both rounds).
16
fell far short of 100%, the two parties were coalition partners and had formed an explicit electoral
alliance going into the runoff elections in both years.
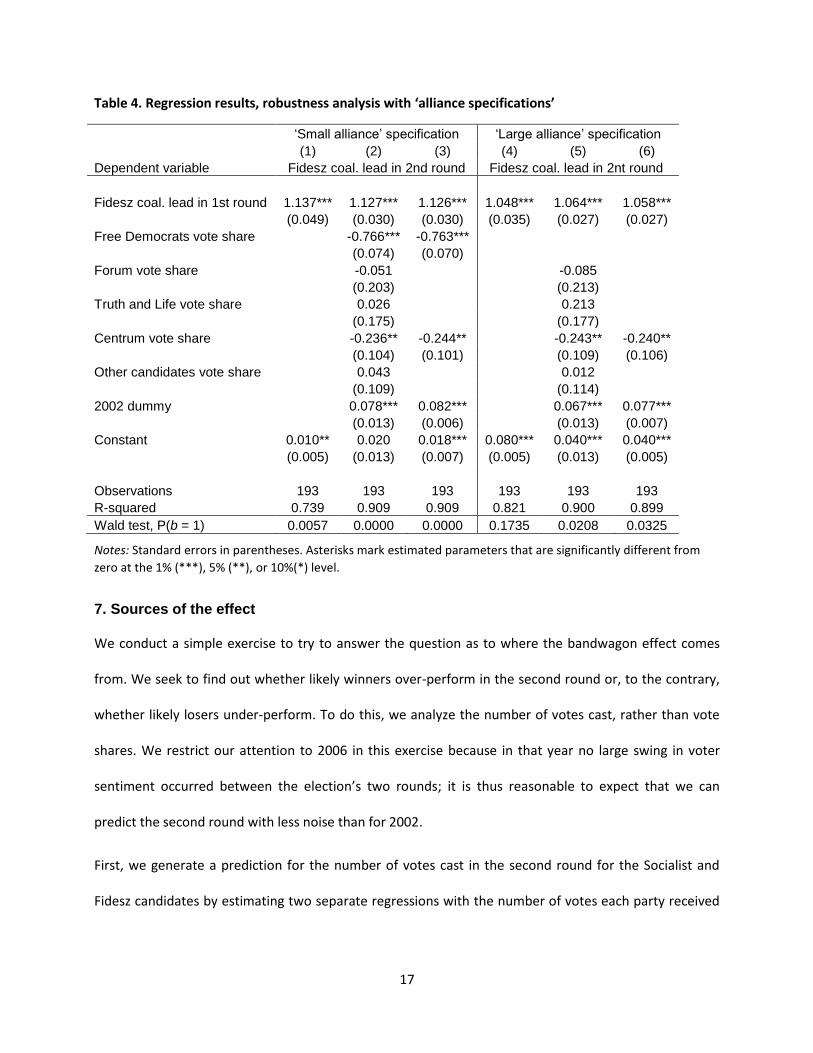
Table 4 summarizes the regression results. The first block of the Table (columns 1-3) reports results from
the small-alliance specification, while the second block (columns 4-6) reports results from the large-
alliance specification. The results are broadly in line with those from the main specification. The
estimated effects of the control variables are very similar to the baseline results, although the year
effects are somewhat more pronounced than in the baseline results. The estimated bandwagon effect is
somewhat larger than in the baseline results (about 13%) in the small-alliance case, while it is somewhat
smaller (about 6%) in the large-alliance case. The estimated bandwagon coefficient is always statistically
significantly different from 1 at least at the 5% level, except in column (4) before control variables are
introduced in the large-alliance specification.
Intuitively, it makes sense that the estimated bandwagon effect declines when Free Democrats are
included in the alliance of the Socialists. The ‘large alliance’ implies bigger leads for the Socialist
candidates while, on average, only 70% of the Free Democratic vote materializes as the alliance’s
supporters in the second round. But this result might also indicate that Free Democratic voters were
more likely to vote for the Socialist candidates when the lead of the alliance was narrow than when it
was wide.
17
Table 4. Regression results, robustness analysis with ‘alliance specifications’
‘Small alliance’ specification ‘Large alliance’ specification
(1) (2) (3) (4) (5) (6)
Dependent variable Fidesz coal. lead in 2nd round Fidesz coal. lead in 2nt round
Fidesz coal. lead in 1st round 1.137*** 1.127*** 1.126*** 1.048*** 1.064*** 1.058***
(0.049) (0.030) (0.030) (0.035) (0.027) (0.027)
Free Democrats vote share
-0.766*** -0.763***
(0.074) (0.070)
Forum vote share
-0.051
-0.085
(0.203)
(0.213)
Truth and Life vote share
0.026
0.213
(0.175)
(0.177)
Centrum vote share
-0.236** -0.244** -0.243** -0.240**
(0.104) (0.101) (0.109) (0.106)
Other candidates vote share
0.043
0.012
(0.109)
(0.114)
2002 dummy
0.078*** 0.082*** 0.067*** 0.077***
(0.013) (0.006) (0.013) (0.007)
Constant 0.010** 0.020 0.018*** 0.080*** 0.040*** 0.040***
(0.005) (0.013) (0.007) (0.005) (0.013) (0.005)
Observations 193 193 193 193 193 193
R-squared 0.739 0.909 0.909 0.821 0.900 0.899
Wald test, P(b = 1) 0.0057 0.0000 0.0000 0.1735 0.0208 0.0325
Notes: Standard errors in parentheses. Asterisks mark estimated parameters that are significantly different from
zero at the 1% (***), 5% (**), or 10%(*) level.
7. Sources of the effect
We conduct a simple exercise to try to answer the question as to where the bandwagon effect comes
from. We seek to find out whether likely winners over-perform in the second round or, to the contrary,
whether likely losers under-perform. To do this, we analyze the number of votes cast, rather than vote
shares. We restrict our attention to 2006 in this exercise because in that year no large swing in voter
sentiment occurred between the election’s two rounds; it is thus reasonable to expect that we can
predict the second round with less noise than for 2002.
First, we generate a prediction for the number of votes cast in the second round for the Socialist and
Fidesz candidates by estimating two separate regressions with the number of votes each party received
18
in the first round as explanatory variables. The regression results, available from the authors on request,
cross-validate our earlier findings about the behavior of the smaller parties’ voters.
From these predictions, we derive an expected outcome of the second round. We rank the districts
according to this expected outcome from the most left-leaning to the most right-leaning and create four
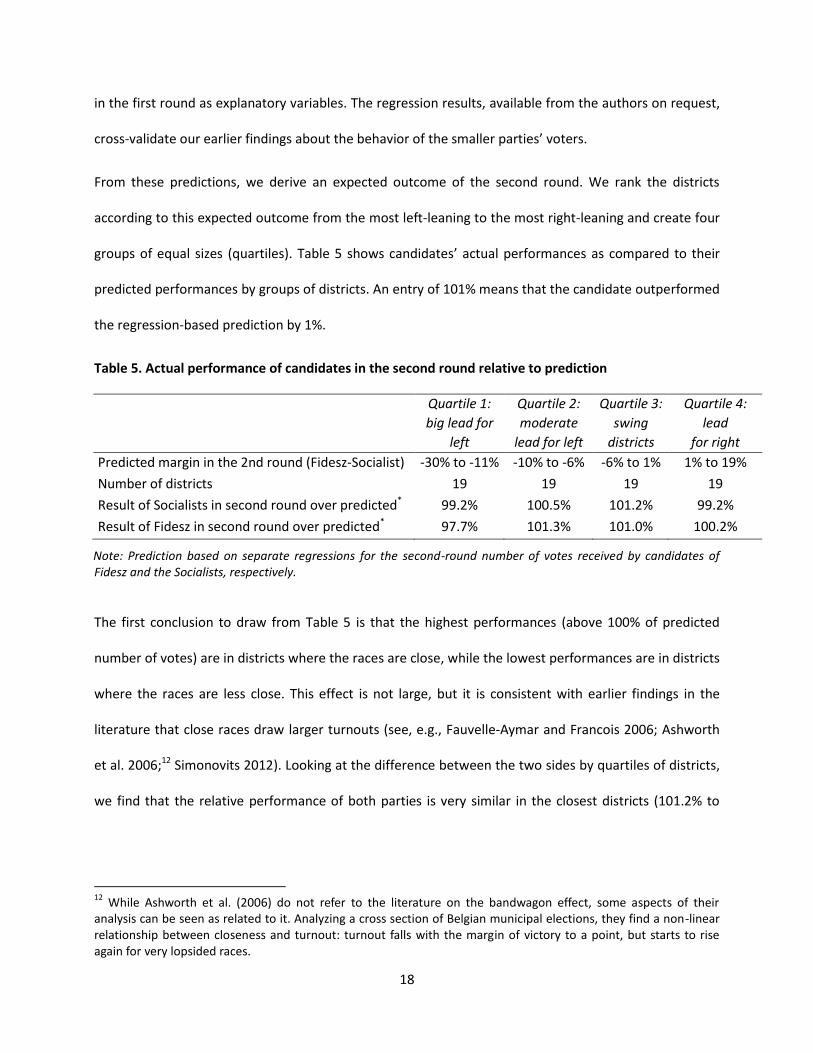
groups of equal sizes (quartiles). Table 5 shows candidates’ actual performances as compared to their
predicted performances by groups of districts. An entry of 101% means that the candidate outperformed
the regression-based prediction by 1%.
Table 5. Actual performance of candidates in the second round relative to prediction
Quartile 1:
big lead for
left
Quartile 2:
moderate
lead for left
Quartile 3:
swing
districts
Quartile 4:
lead
for right
Predicted margin in the 2nd round (Fidesz-Socialist) -30% to -11% -10% to -6% -6% to 1% 1% to 19%
Number of districts 19 19 19 19
Result of Socialists in second round over predicted* 99.2% 100.5% 101.2% 99.2%
Result of Fidesz in second round over predicted* 97.7% 101.3% 101.0% 100.2%
Note: Prediction based on separate regressions for the second-round number of votes received by candidates of Fidesz and the Socialists, respectively.
The first conclusion to draw from Table 5 is that the highest performances (above 100% of predicted
number of votes) are in districts where the races are close, while the lowest performances are in districts
where the races are less close. This effect is not large, but it is consistent with earlier findings in the
literature that close races draw larger turnouts (see, e.g., Fauvelle-Aymar and Francois 2006; Ashworth
et al. 2006;12 Simonovits 2012). Looking at the difference between the two sides by quartiles of districts,
we find that the relative performance of both parties is very similar in the closest districts (101.2% to
12
While Ashworth et al. (2006) do not refer to the literature on the bandwagon effect, some aspects of their analysis can be seen as related to it. Analyzing a cross section of Belgian municipal elections, they find a non-linear relationship between closeness and turnout: turnout falls with the margin of victory to a point, but starts to rise again for very lopsided races.
19
101.0% in Quartile 3), while Fidesz candidates appear to have performed slightly better (relative to
prediction) in moderately left-leaning districts (101.3% to 100.5% in Quartile 2).
It is the results of Quartiles 1 and 4 of districts that may point to a possible explanation of the
bandwagon effect. While both parties performed worse or equal to prediction in these districts, the side
expected to lose under-performed even more than the side expected to win. In districts with a large lead
for the left (Quartile 1), Socialist candidates received about 99.2% of the predicted votes, while
candidates of Fidesz received only about 97.7% of predicted votes. In districts with a lead for the right
(Quartile 4) the difference is somewhat smaller: Fidesz candidates received about 100.2% of predicted
votes, while Socialist candidates received about 99.2%.
This simple exercise indicates that at least part of the bandwagon effect found in this study is caused by
the fact that voters turn out with a slightly lower probability in districts in which their preferred
candidate is likely to lose by a large margin.
To collect some more evidence whether the bandwagon effect appears to be nonlinear in our sample,13
we experimented with ‘quadratic’ variants of our main regressions reported in Table 3 (a ‘squared’ lead
of Fidesz was multiplied by -1 in cases where the Socialists were in the lead). When introducing the
quadratic term in our main specification, the linear term becomes smaller than unity (although the
difference is not statistically significant), while the quadratic term is positive and statistically significant.
This gives some further support to the notion that the bandwagon effect is nonlinear and increasing with
the lead. At the same time, adding the quadratic term hardly improves the explanatory power of the
model.
13
We would like to thank an anonymous referee for suggesting the analysis of possible nonlinearity.
20
8. Conclusion
While the bandwagon effect has received a significant amount of scholarly attention, its substantive
importance has not been confirmed empirically. In this paper we attempted to fill this gap by applying a
research design that allows for quantifying the effect in the context of large-scale elections. We analyzed
district-level data from the general elections of 2002 and 2006 in Hungary and operationalized the
bandwagon effect as an increase in the lead of a candidate from the first round election to the second.
Our results suggest that the bandwagon effect was indeed present and quite substantive in the elections
analyzed. On average, the difference in the vote shares of the two largest parties was magnified by about
10% between the two rounds. This finding is robust to the inclusion of controls and to different
measures of the lead.
In a separate exercise we have explored the sources of the bandwagon effect. We found that at least
part of the effect comes from districts where one of the candidates was expected to win by a large
margin. In these districts both parties under-performed relative to what could be expected based on the
first-round result, but the party expected to lose under-performed by 1 to 1.5 percentage points more.
The finding that a large electoral margin in the first round discourages turnout on the losing side more
than on the winning side is consistent with findings of Delli Carpini (1984) but contradicts those of
Jackson (1983), both of whom found a ‘West Coast effect’ in the 1980 U.S. presidential election.
While it is notably hard to make causal claims with observational data, we have argued that alternative
explanations, most notably strategic voting in the second round, cannot explain our results since our
sample consists of two-candidate runoffs. At the same time, since our analysis is based on district-level
data, our results are consistent with different micro-level explanations. An important avenue for future
research would be to address this problem by incorporating both individual and aggregate level variables
into a model of the bandwagon effect.
Turning to the conclusions of the analysis for policy, we note that although our research did not analyze
the effect of public opinion polls on elections, our findings in favor of the existence of the aggregate-level
bandwagon effect support the view that polls have the potential to influence elections. Our results
suggest that, consistent with one type of the West-Coast effect, polls can effect elections by discouraging
some voters from participating if their preferred candidate appears likely to lose.
21
Appendix: Analysis of the 1998 election
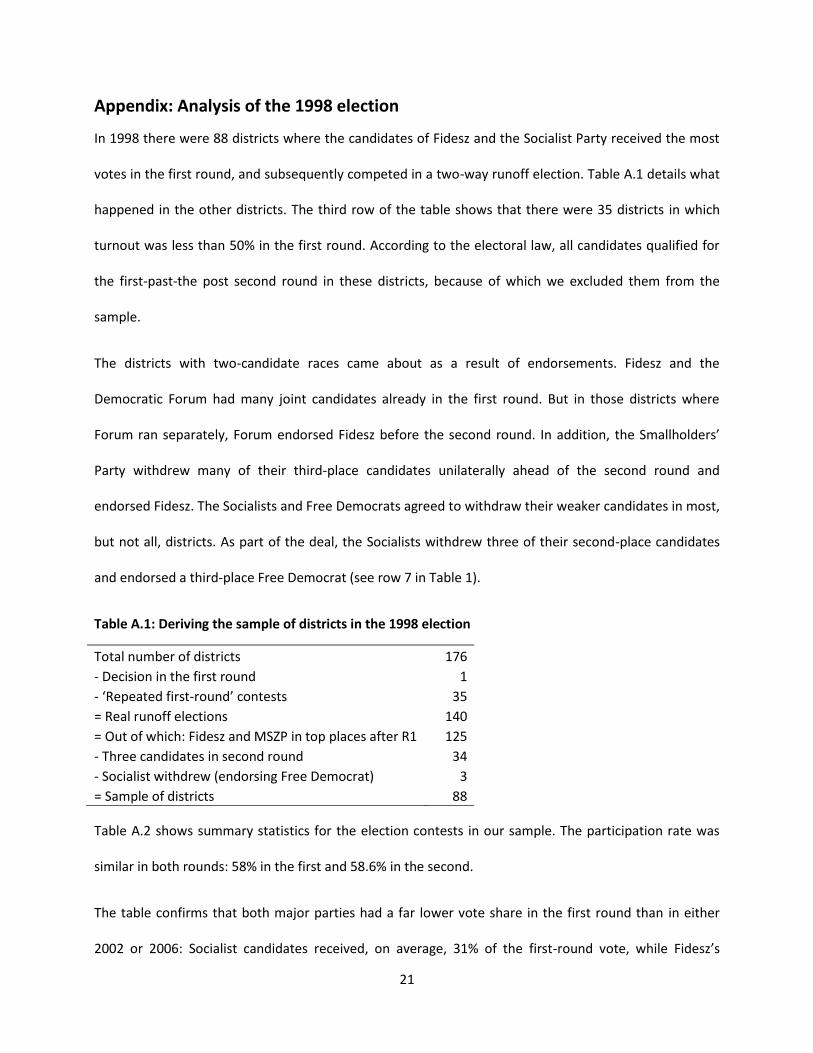
In 1998 there were 88 districts where the candidates of Fidesz and the Socialist Party received the most
votes in the first round, and subsequently competed in a two-way runoff election. Table A.1 details what
happened in the other districts. The third row of the table shows that there were 35 districts in which
turnout was less than 50% in the first round. According to the electoral law, all candidates qualified for
the first-past-the post second round in these districts, because of which we excluded them from the
sample.
The districts with two-candidate races came about as a result of endorsements. Fidesz and the
Democratic Forum had many joint candidates already in the first round. But in those districts where
Forum ran separately, Forum endorsed Fidesz before the second round. In addition, the Smallholders’
Party withdrew many of their third-place candidates unilaterally ahead of the second round and
endorsed Fidesz. The Socialists and Free Democrats agreed to withdraw their weaker candidates in most,
but not all, districts. As part of the deal, the Socialists withdrew three of their second-place candidates
and endorsed a third-place Free Democrat (see row 7 in Table 1).
Table A.1: Deriving the sample of districts in the 1998 election
Total number of districts 176
- Decision in the first round 1
- ‘Repeated first-round’ contests 35
= Real runoff elections 140
= Out of which: Fidesz and MSZP in top places after R1 125
- Three candidates in second round 34
- Socialist withdrew (endorsing Free Democrat) 3
= Sample of districts 88
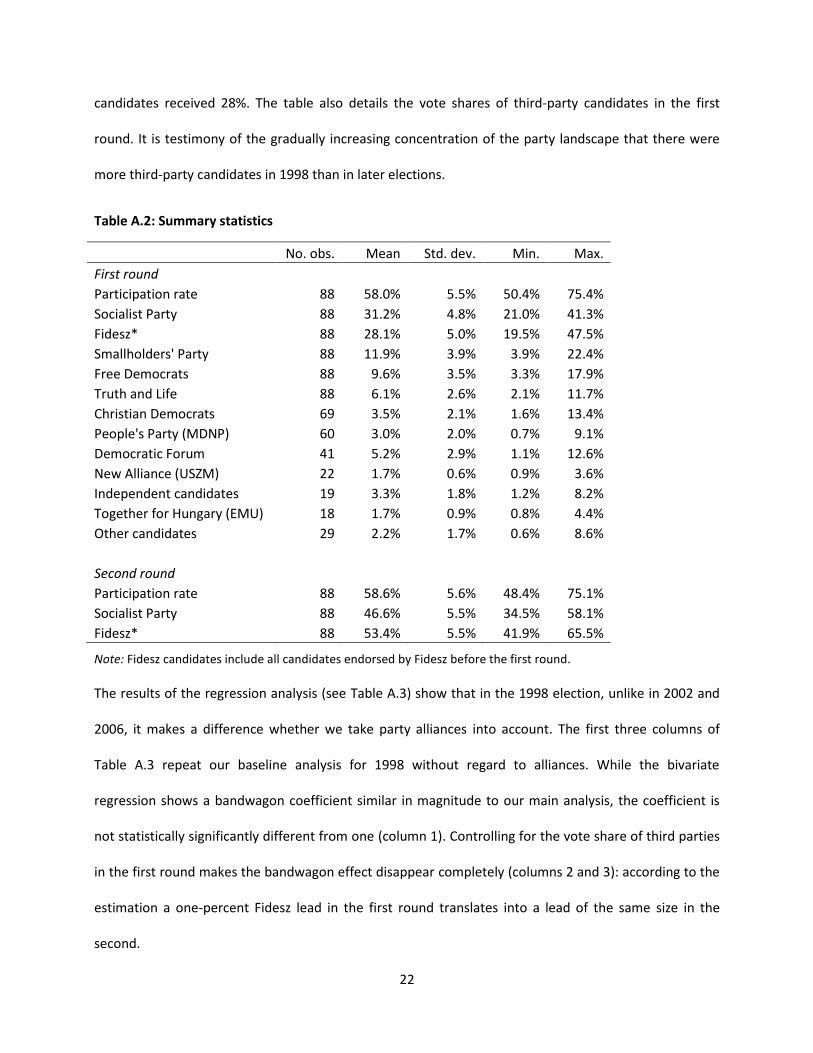
Table A.2 shows summary statistics for the election contests in our sample. The participation rate was
similar in both rounds: 58% in the first and 58.6% in the second.
The table confirms that both major parties had a far lower vote share in the first round than in either
2002 or 2006: Socialist candidates received, on average, 31% of the first-round vote, while Fidesz’s
22
candidates received 28%. The table also details the vote shares of third-party candidates in the first
round. It is testimony of the gradually increasing concentration of the party landscape that there were
more third-party candidates in 1998 than in later elections.
Table A.2: Summary statistics
No. obs. Mean Std. dev. Min. Max.
First round Participation rate 88 58.0% 5.5% 50.4% 75.4%
Socialist Party 88 31.2% 4.8% 21.0% 41.3%
Fidesz* 88 28.1% 5.0% 19.5% 47.5%
Smallholders' Party 88 11.9% 3.9% 3.9% 22.4%
Free Democrats 88 9.6% 3.5% 3.3% 17.9%
Truth and Life 88 6.1% 2.6% 2.1% 11.7%
Christian Democrats 69 3.5% 2.1% 1.6% 13.4%
People's Party (MDNP) 60 3.0% 2.0% 0.7% 9.1%
Democratic Forum 41 5.2% 2.9% 1.1% 12.6%
New Alliance (USZM) 22 1.7% 0.6% 0.9% 3.6%
Independent candidates 19 3.3% 1.8% 1.2% 8.2%
Together for Hungary (EMU) 18 1.7% 0.9% 0.8% 4.4%
Other candidates 29 2.2% 1.7% 0.6% 8.6%
Second round Participation rate 88 58.6% 5.6% 48.4% 75.1%
Socialist Party 88 46.6% 5.5% 34.5% 58.1%
Fidesz* 88 53.4% 5.5% 41.9% 65.5%
Note: Fidesz candidates include all candidates endorsed by Fidesz before the first round.
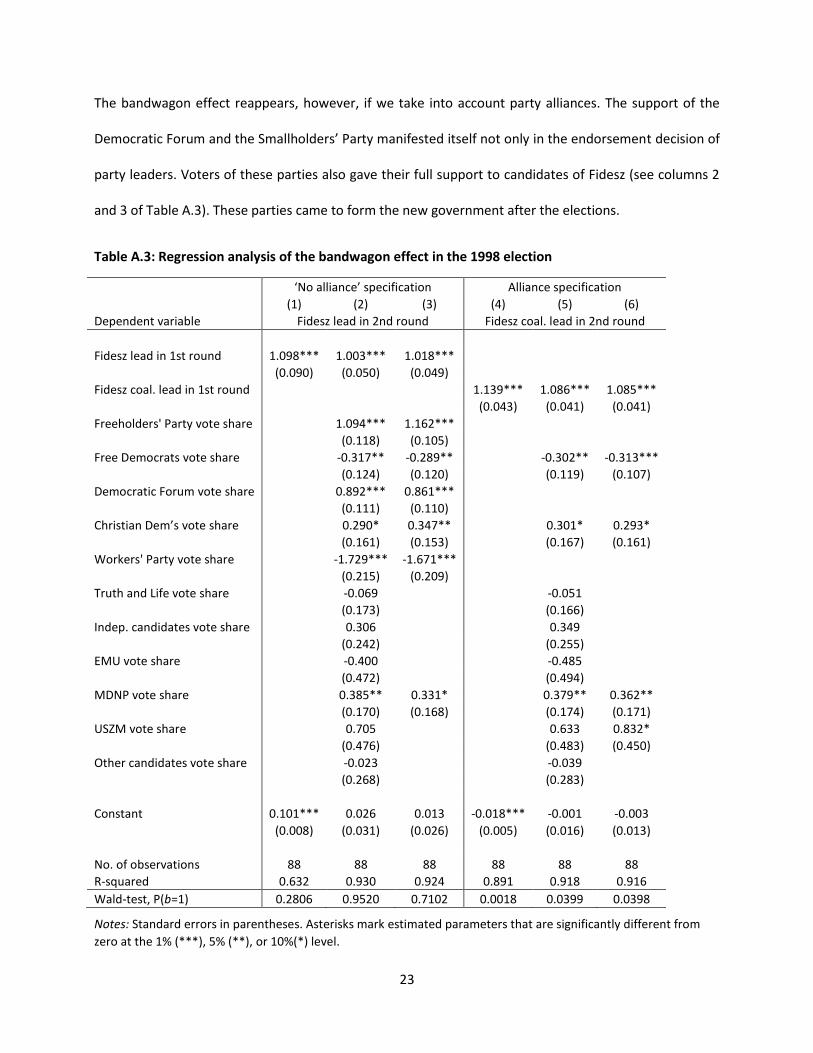
The results of the regression analysis (see Table A.3) show that in the 1998 election, unlike in 2002 and
2006, it makes a difference whether we take party alliances into account. The first three columns of
Table A.3 repeat our baseline analysis for 1998 without regard to alliances. While the bivariate
regression shows a bandwagon coefficient similar in magnitude to our main analysis, the coefficient is
not statistically significantly different from one (column 1). Controlling for the vote share of third parties
in the first round makes the bandwagon effect disappear completely (columns 2 and 3): according to the
estimation a one-percent Fidesz lead in the first round translates into a lead of the same size in the
second.
23
The bandwagon effect reappears, however, if we take into account party alliances. The support of the
Democratic Forum and the Smallholders’ Party manifested itself not only in the endorsement decision of
party leaders. Voters of these parties also gave their full support to candidates of Fidesz (see columns 2
and 3 of Table A.3). These parties came to form the new government after the elections.
Table A.3: Regression analysis of the bandwagon effect in the 1998 election
‘No alliance’ specification Alliance specification
(1) (2) (3) (4) (5) (6)
Dependent variable Fidesz lead in 2nd round Fidesz coal. lead in 2nd round
Fidesz lead in 1st round 1.098*** 1.003*** 1.018***
(0.090) (0.050) (0.049)
Fidesz coal. lead in 1st round
1.139*** 1.086*** 1.085***
(0.043) (0.041) (0.041)
Freeholders' Party vote share
1.094*** 1.162***
(0.118) (0.105)
Free Democrats vote share
-0.317** -0.289**
-0.302** -0.313***
(0.124) (0.120)
(0.119) (0.107)
Democratic Forum vote share
0.892*** 0.861***
(0.111) (0.110)
Christian Dem’s vote share
0.290* 0.347**
0.301* 0.293*
(0.161) (0.153)
(0.167) (0.161)
Workers' Party vote share
-1.729*** -1.671***
(0.215) (0.209)
Truth and Life vote share
-0.069
-0.051
(0.173)
(0.166)
Indep. candidates vote share
0.306
0.349
(0.242)
(0.255)
EMU vote share
-0.400
-0.485
(0.472)
(0.494)
MDNP vote share
0.385** 0.331*
0.379** 0.362**
(0.170) (0.168)
(0.174) (0.171)
USZM vote share
0.705
0.633 0.832*
(0.476)
(0.483) (0.450)
Other candidates vote share
-0.023
-0.039
(0.268)
(0.283)
Constant 0.101*** 0.026 0.013 -0.018*** -0.001 -0.003
(0.008) (0.031) (0.026) (0.005) (0.016) (0.013)
No. of observations 88 88 88 88 88 88
R-squared 0.632 0.930 0.924 0.891 0.918 0.916
Wald-test, P(b=1) 0.2806 0.9520 0.7102 0.0018 0.0399 0.0398
Notes: Standard errors in parentheses. Asterisks mark estimated parameters that are significantly different from
zero at the 1% (***), 5% (**), or 10%(*) level.
24
On the political left, while the Socialists entered into an electoral alliance with their coalition partners
the Free Democrats, it appears that the voters of this party supported Socialist candidates to a much
lesser degree than in subsequent elections. It is estimated in column 2 and 3 that Socialist candidates
received only about 30% of Free Democratic support in the runoff. In contrast, Workers’ Party voters
appear to have given their full support to the Socialist candidate in the second round.
Based on these observations, the exercise was repeated to reflect functioning party alliances. The
alliance of Fidesz was assumed to include the Forum and the Smallholders’ Party, while the alliance of
the Socialists was assumed to include the Workers’ Party. We decided against including the Free
Democrats in the Socialists’ coalition (and the Christian Democrats in that of Fidesz) because it is
estimated that less than half of their voters supported the respective major party candidate in the
second round.
The results of the ‘Alliance specification’ are shown in columns (4) to (6) of Table A.3. The bivariate
regression shows a bandwagon coefficient of 1.13, statistically significantly above 1. Taking into account
the vote share of third parties makes the coefficient become smaller (about 1.085), but still statistically
significantly higher than 1 at the 5% level. The coefficients of the other parties remain very close to the
‘No alliance’ estimates.
In sum, the analysis finds evidence for the bandwagon effect in the 1998 election, comparable in
magnitude to our analysis of 2002 and 2006, but only once party alliances are taken into account. These
findings make sense since the major parties received only about 30% of the vote each in the first round,
a much smaller share than in 2002 and 2006. As the voters of 1998 seem to have done, the researcher
must look into the results of other parties to find out ‘who was in the lead’ in a given district after the
first round.
25
References
Asch, S. E. (1951). Effects of group pressure upon the modification and distortion of judgment. In Guetzkow, H. (Ed.): Groups, Leadership, and Men. Pittsburgh, PA: Carnegie Press.
Asch, S. E. (1955). Opinions and social pressure. Scientific American 193 (5): 31–35.
Ashworth, J., Geys, B., and Heyndels, B. (2006). Everyone likes a winner: An empirical test of the effect of electoral closeness on turnout in a context of expressive voting. Public Choice 128, 383-405.
Bartels, L. (1985). Expectations and preferences in presidential nomination campaigns. American Political Science Review 79 (3), 804-815.
Blais, A., Gidengil, E., and Nevitte, N. (2006). Do polls influence the vote? In Brady, H. and Johnston, R. G. C. (Eds.): Capturing Campaign Effects. Ann Arbor: University of Michigan Press.
Callander, S. (2007). Bandwagons and momentum in sequential voting. Review of Economic Studies 74, 653-684.
Ceci, S. J., and Kain, E. L. (1982). Jumping on the bandwagon with the underdog: The impact of attitude polls on polling behavior. Public Opinion Quarterly 46, 228-242.
Cox, G. W. (1997). Making votes count: Strategic coordination in the world's electoral systems. Cambridge University Press.
Delli Carpini, M. X. (1984). Scooping the voters? The consequences of the networks' early call of the 1980 presidential race. Journal of Politics 46 (3), 866-885.
Faas, T., Mackenrodt, C., and Schmitt-Beck, R. (2008). Polls that mattered: Effects of media polls on voters’ coalition expectations and party preferences in the 2005 German parliamentary election. International Journal of Public Opinion Research 20 (3), 299-325.
Fauvelle-Aymar, C., and Francois, A. (2006). The impact of closeness on turnout: An empirical relation based on a study of a two-round ballot. Public Choice 127, 469-491.
Fuchs, D. A. (1966). Election-day radio-television and Western voting. Public Opinion Quarterly 30, 226-236.
Gallup, G., and Rae, S. F. (1940). Is there a bandwagon vote? Public Opinion Quarterly 4, 244-249.
Goidel, R. K., and Shields, T. G. (1994). The vanishing marginals, the bandwagon, and the mass media. Journal of Politics 56 (3), 802-810.
Golub, B., and Jackson, M. O. (2010). Naive learning in social networks and the wisdom of crowds. American Economic Journal: Microeconomics 2(1): 112-149.
Hodgson, R. and Maloney, J. (2013). Bandwagon effects in British elections, 1885-1910. Public Choice, forthcoming.
Hong, C. S., and Konrad, K. A. (1998). Bandwagon effects and two-party majority voting. Journal of Risk and Uncertainty 16 (2), 165-172.
Jackson, J. E. (1983). Election night reporting and voter turnout. American Journal of Political Science 27(4), 615-635.
Kiss, A. (2012). Identifying strategic voting in two-round elections. Unpublished manuscript.
26
Krizan, Z., Miller, J. C., and Johar, O. (2010). Wishful thinking in the 2008 U.S. presidential election. Psychological Science 21, 140–146.
Lazarsfeld, P., Berelson, B., and Gaudet, H. (1948). The people’s choice: How the voter makes up his mind in a presidential campaign. New York: Columbia University Press.
Leibenstein, H. (1950). Bandwagon, snob, and Veblen effects in the theory of consumers' demand. Quarterly Journal of Economics 64 (2), 183–207.
Lott Jr., J. R. (2005). The impact of early media election calls on Republican voting rates in Florida’s western Panhandle counties in 2000. Public Choice 123 (3-4), 349-361.
McAllister, I., and Studlar, D. T. (1991). Bandwagon, underdog or projection: opinion polls and electoral choice in Britain, 1979-1987. Journal of Politics 53 (3), 720-741.
Marsh, C. (1985). Back on the bandwagon: The effect of opinion polls on public opinion. British Journal of Political Science 15 (1), 51-74.
Mendelsohn, H. (1966). Election-day broadcasts and terminal voting decisions. Public Opinion Quarterly 30, 212-225.
Morwitz, V. G., and Pluzinski, C. (1996). Do polls reflect opinions or do opinions reflect polls? The impact of political polling on voters' expectations, preferences and behavior. Journal of Consumer Research 23 (1), 53-67.
Mutz, D. C. (1997). Mechanics of momentum: Does thinking make it so? Journal of Politics 59 (1), 104-125.
Nadeau, R., Cloutier, E., and Guay, J. H. (1993). New evidence about the existence of a bandwagon effect in the opinion formation process. International Political Science Review 14 (2), 203-13.
Navazio, R. (1977). An experimental approach to bandwagon research. Public Opinion Quarterly 41 (2), 217-225.
Simon, H. A. (1954). Bandwagon and underdog effects and the possibility of election predictions. Public Opinion Quarterly 18 (3), 245-253.
Simonovits, G. (2012). Competition and turnout revisited: The importance of measuring expected closeness accurately. Electoral Studies 31 (2), 364-371.
Skalaban, A. (1988). Do the polls influence elections? Some 1980 evidence. Political Behavior 10 (2), 136-150.
Sonck, N., and Loosveldt, G. (2010). Impact of poll results on personal opinions and perceptions of collective opinion. International Journal of Public Opinion Research 22 (2), 230-255.
Sudman, S. (1986). Do exit polls influence voting behavior? Public Opinion Quarterly 50 (3), 331-339.
Tuchman S., and Coffin, T. E. (1971). The influence of election night television broadcasts in a close election. Public Opinion Quarterly 40, 315-326.