Identifying Children at Risk for Language Impairment or ...
16
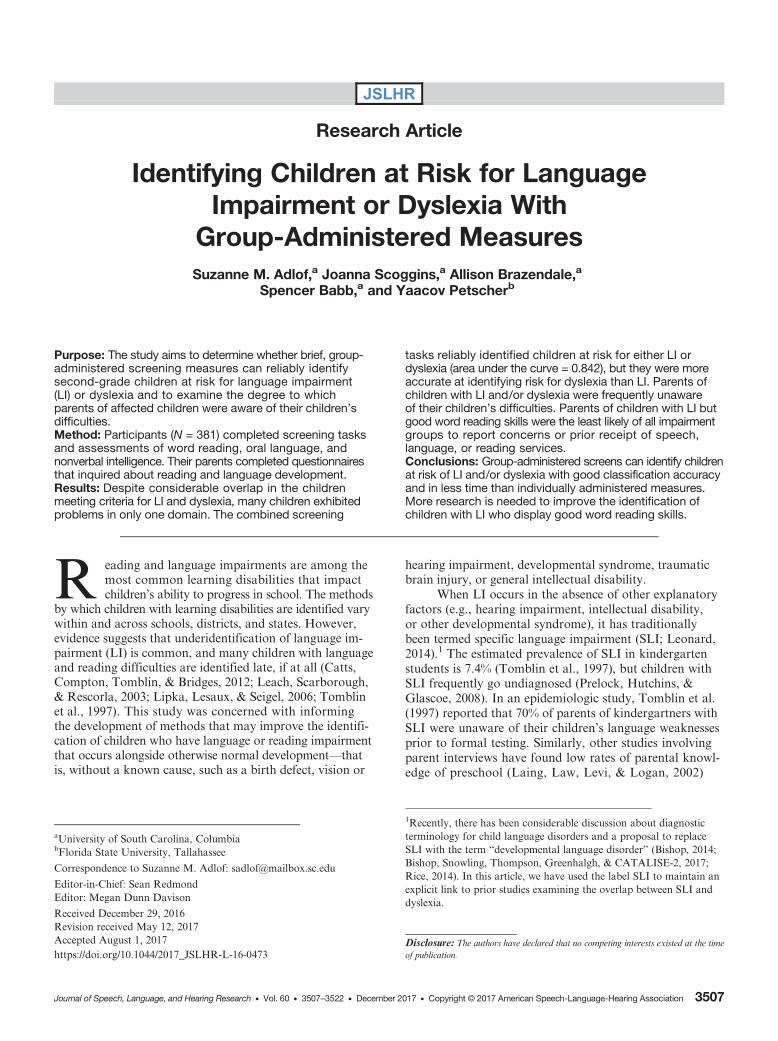
JSLHR Research Article Identifying Children at Risk for Language Impairment or Dyslexia With Group-Administered Measures Suzanne M. Adlof, a Joanna Scoggins, a Allison Brazendale, a Spencer Babb, a and Yaacov Petscher b Purpose: The study aims to determine whether brief, group- administered screening measures can reliably identify second-grade children at risk for language impairment (LI) or dyslexia and to examine the degree to which parents of affected children were aware of their children’s difficulties. Method: Participants (N = 381) completed screening tasks and assessments of word reading, oral language, and nonverbal intelligence. Their parents completed questionnaires that inquired about reading and language development. Results: Despite considerable overlap in the children meeting criteria for LI and dyslexia, many children exhibited problems in only one domain. The combined screening tasks reliably identified children at risk for either LI or dyslexia (area under the curve = 0.842), but they were more accurate at identifying risk for dyslexia than LI. Parents of children with LI and/or dyslexia were frequently unaware of their children’s difficulties. Parents of children with LI but good word reading skills were the least likely of all impairment groups to report concerns or prior receipt of speech, language, or reading services. Conclusions: Group-administered screens can identify children at risk of LI and/or dyslexia with good classification accuracy and in less time than individually administered measures. More research is needed to improve the identification of children with LI who display good word reading skills. R eading and language impairments are among the most common learning disabilities that impact children’s ability to progress in school. The methods by which children with learning disabilities are identified vary within and across schools, districts, and states. However, evidence suggests that underidentification of language im- pairment (LI) is common, and many children with language and reading difficulties are identified late, if at all (Catts, Compton, Tomblin, & Bridges, 2012; Leach, Scarborough, & Rescorla, 2003; Lipka, Lesaux, & Seigel, 2006; Tomblin et al., 1997). This study was concerned with informing the development of methods that may improve the identifi- cation of children who have language or reading impairment that occurs alongside otherwise normal development—that is, without a known cause, such as a birth defect, vision or hearing impairment, developmental syndrome, traumatic brain injury, or general intellectual disability. When LI occurs in the absence of other explanatory factors (e.g., hearing impairment, intellectual disability, or other developmental syndrome), it has traditionally been termed specific language impairment (SLI; Leonard, 2014). 1 The estimated prevalence of SLI in kindergarten students is 7.4% (Tomblin et al., 1997), but children with SLI frequently go undiagnosed (Prelock, Hutchins, & Glascoe, 2008). In an epidemiologic study, Tomblin et al. (1997) reported that 70% of parents of kindergartners with SLI were unaware of their children’s language weaknesses prior to formal testing. Similarly, other studies involving parent interviews have found low rates of parental knowl- edge of preschool (Laing, Law, Levi, & Logan, 2002) 1 Recently, there has been considerable discussion about diagnostic terminology for child language disorders and a proposal to replace SLI with the term “developmental language disorder” (Bishop, 2014; Bishop, Snowling, Thompson, Greenhalgh, & CATALISE-2, 2017; Rice, 2014). In this article, we have used the label SLI to maintain an explicit link to prior studies examining the overlap between SLI and dyslexia. a University of South Carolina, Columbia b Florida State University, Tallahassee Correspondence to Suzanne M. Adlof: [email protected] Editor-in-Chief: Sean Redmond Editor: Megan Dunn Davison Received December 29, 2016 Revision received May 12, 2017 Accepted August 1, 2017 https://doi.org/10.1044/2017_JSLHR-L-16-0473 Disclosure: The authors have declared that no competing interests existed at the time of publication. Journal of Speech, Language, and Hearing Research • Vol. 60 • 3507–3522 • December 2017 • Copyright © 2017 American Speech-Language-Hearing Association 3507
-
Upload
khangminh22 -
Category
Documents
-
view
0 -
download
0
Transcript of Identifying Children at Risk for Language Impairment or ...
JSLHR
Research Article
aUniversity ofbFlorida State
Corresponden
Editor-in-ChiEditor: Mega
Received DecRevision receAccepted Aughttps://doi.org
Journal of Speec
Identifying Children at Risk for LanguageImpairment or Dyslexia With
Group-Administered Measures
Suzanne M. Adlof,a Joanna Scoggins,a Allison Brazendale,aSpencer Babb,a and Yaacov Petscherb
Purpose: The study aims to determine whether brief, group-administered screening measures can reliably identifysecond-grade children at risk for language impairment(LI) or dyslexia and to examine the degree to whichparents of affected children were aware of their children’sdifficulties.Method: Participants (N = 381) completed screening tasksand assessments of word reading, oral language, andnonverbal intelligence. Their parents completed questionnairesthat inquired about reading and language development.Results: Despite considerable overlap in the childrenmeeting criteria for LI and dyslexia, many children exhibitedproblems in only one domain. The combined screening
South Carolina, ColumbiaUniversity, Tallahassee
ce to Suzanne M. Adlof: [email protected]
ef: Sean Redmondn Dunn Davison
ember 29, 2016ived May 12, 2017ust 1, 2017/10.1044/2017_JSLHR-L-16-0473
h, Language, and Hearing Research • Vol. 60 • 3507–3522 • December 2
tasks reliably identified children at risk for either LI ordyslexia (area under the curve = 0.842), but they were moreaccurate at identifying risk for dyslexia than LI. Parents ofchildren with LI and/or dyslexia were frequently unawareof their children’s difficulties. Parents of children with LI butgood word reading skills were the least likely of all impairmentgroups to report concerns or prior receipt of speech,language, or reading services.Conclusions: Group-administered screens can identify childrenat risk of LI and/or dyslexia with good classification accuracyand in less time than individually administered measures.More research is needed to improve the identification ofchildren with LI who display good word reading skills.
Reading and language impairments are among themost common learning disabilities that impactchildren’s ability to progress in school. The methods
by which children with learning disabilities are identified varywithin and across schools, districts, and states. However,evidence suggests that underidentification of language im-pairment (LI) is common, and many children with languageand reading difficulties are identified late, if at all (Catts,Compton, Tomblin, & Bridges, 2012; Leach, Scarborough,& Rescorla, 2003; Lipka, Lesaux, & Seigel, 2006; Tomblinet al., 1997). This study was concerned with informingthe development of methods that may improve the identifi-cation of children who have language or reading impairmentthat occurs alongside otherwise normal development—thatis, without a known cause, such as a birth defect, vision or
hearing impairment, developmental syndrome, traumaticbrain injury, or general intellectual disability.
When LI occurs in the absence of other explanatoryfactors (e.g., hearing impairment, intellectual disability,or other developmental syndrome), it has traditionallybeen termed specific language impairment (SLI; Leonard,2014).1 The estimated prevalence of SLI in kindergartenstudents is 7.4% (Tomblin et al., 1997), but children withSLI frequently go undiagnosed (Prelock, Hutchins, &Glascoe, 2008). In an epidemiologic study, Tomblin et al.(1997) reported that 70% of parents of kindergartners withSLI were unaware of their children’s language weaknessesprior to formal testing. Similarly, other studies involvingparent interviews have found low rates of parental knowl-edge of preschool (Laing, Law, Levi, & Logan, 2002)
1Recently, there has been considerable discussion about diagnosticterminology for child language disorders and a proposal to replaceSLI with the term “developmental language disorder” (Bishop, 2014;Bishop, Snowling, Thompson, Greenhalgh, & CATALISE-2, 2017;Rice, 2014). In this article, we have used the label SLI to maintain anexplicit link to prior studies examining the overlap between SLI anddyslexia.
Disclosure: The authors have declared that no competing interests existed at the timeof publication.
017 • Copyright © 2017 American Speech-Language-Hearing Association 3507

and school-age children’s LI (Conti-Ramsden, Simkin, &Pickles, 2006).
Dyslexia is defined as a specific learning disabilitythat is characterized by difficulties with accurate and/or flu-ent word reading and spelling, which is unexpected in thecontext of other cognitive abilities and the use of effectiveinstructional practices (Lyon, Shaywitz, & Shaywitz, 2003).Estimates of the prevalence of dyslexia vary, depending onidentification criteria, but generally range between 5% and10% (Catts, Adlof, Hogan, & Weismer, 2005; Shaywitz,Shaywitz, Fletcher, & Escobar, 1990). We are unaware ofcurrent estimates of identification rates for dyslexia. Be-cause reading skills are directly taught and measured inschools, we hypothesize that rates of underidentificationcould be lower for children with dyslexia than for childrenwith SLI.
Both SLI and dyslexia have a negative influenceon the development of reading comprehension skills inaffected children (Catts, Bridges, Little, & Tomblin, 2008;Snowling, Muter, & Carroll, 2007). For children with dys-lexia, reading comprehension is primarily impeded by diffi-culty in recognizing printed words; however, some childrenwith dyslexia also experience oral language weaknessesthat can exacerbate comprehension difficulties (Catts et al.,2005; McArthur, Hogben, Edwards, Heath, & Mengler,2000; Ransby & Swanson, 2003; Snowling, Bishop, &Stothard, 2000). Turning to children with SLI, the samedeficits that make comprehension of oral language difficult(e.g., deficits in semantics, syntax, and discourse skills)also impede comprehension of written language (Botting,Simkin, & Conti-Ramsden, 2006; Kelso, Fletcher, & Lee,2007). In addition, many children with SLI (but not all) ex-perience word reading difficulties (Catts et al., 2005; Kelsoet al., 2007).
Separate Versus Co-occurring Readingand/or Language Impairment
In the last two decades, much attention has beenpaid to the frequent co-occurrence of oral language andreading impairments, including SLI and dyslexia (Bishop& Snowling, 2004; Catts et al., 2005; McArthur et al., 2000;Ramus, Marshall, Rosen, & van der Lely, 2013). In a largesample drawn from an epidemiologic study, Catts et al.(2005) found that 18%–36% of children with SLI in kinder-garten met criteria for dyslexia in the later school grades,and 15%–19% of children with dyslexia between secondand eighth grades had a history of SLI in kindergarten.Reported rates of overlap between the two conditions havebeen larger in studies that employed convenience samplesdrawn from clinics. For example, McArthur et al. (2000)found that 55% of children with dyslexia had impaired orallanguage and 51% of children with SLI had a reading dis-ability. Catts et al. (2005) hypothesized that clinical sam-ples may be more likely to include more severely impairedindividuals who are more likely to have concomitant con-ditions than population-based samples. That is, parentsand teachers may be more likely to notice and refer for
3508 Journal of Speech, Language, and Hearing Research • Vol. 60 •
evaluation or intervention children who have difficultiesin both word reading and broader language skills thanchildren with problems in just one domain. In a similarvein, studies of 8- to 10-year-old “poor comprehenders,”children who demonstrate poor reading comprehensiondespite good word recognition (and many of whom alsomeet criteria for SLI), have also reported that parents andteachers are frequently unaware of their children’s lan-guage deficits until formal testing occurs (Adlof & Catts,2015; Nation, Clarke, Marshall, & Durand, 2004). Nationand colleagues (2004) suggested that difficulties with speecharticulation and accurate or fluent reading may be moreobvious to parents and teachers, and therefore, childrenwith these problems may be more likely to be referred toclinical specialists for evaluation than children with deficitsin language but not speech or word reading.
Approaches to Language and Reading ScreeningIn an effort to improve the identification of children
needing special education services, many schools have im-plemented universal screening procedures, whereby all chil-dren undergo a brief assessment to determine whetherthey are meeting developmental benchmarks or whetherfurther evaluation is needed. Universal screens for speechand language difficulties are often administered at preschoolor kindergarten orientations. After kindergarten, speechand language screens are generally administered in schoolsonly in response to a teacher or parent request (Ehren &Nelson, 2005). In schools that use response to intervention(RTI) frameworks, universal screening for reading difficul-ties is usually conducted at the beginning of each primarygrade, with subsequent benchmark assessments administeredin the middle and at the end of the school year (Reschly,2014).
In schools that use RTI frameworks for identificationand service delivery, universal screens are an importantcomponent of Tier 1 (Davis, Lindo, & Compton, 2007;Reschly, 2014). In such frameworks, children who score be-low the cut point on a universal screen at Tier 1 are thenreferred to Tier 2, where they receive more intensive in-struction and more frequent progress monitoring to deter-mine whether further evaluation or intervention is needed.However, screening procedures can also be used in schoolsthat use more traditional means of identifying childrenwho qualify for special education services; in these cases,a failed screen typically leads to a referral for a comprehen-sive evaluation. In both RTI and traditional frameworks,the purpose of screening is to quickly identify individualswho may benefit from further assessment or observation.Thus, the screening measure itself should be cost andtime efficient and relatively easy to implement (Jenkins &Johnson, n.d.). For the screen to be useful in practice, itmust also yield high classification accuracy, such that it re-liably distinguishes individuals who do or do not have poorlanguage or reading abilities. In practice, educators aresometimes more willing to accept a higher rate of false posi-tive errors (where children without impairment are flagged
3507–3522 • December 2017
as needing progress monitoring or assessment) than falsenegative errors (where children with true impairments aremissed). However, it is important to note that both typesof errors can lead to misallocation of resources, which canbe quite costly (Davis et al., 2007).
Most existing screening tools intended for identifyingchildren at risk for LI are designed for individual adminis-tration. Examples of commercially available screens forstudents in the primary and elementary school grades in-clude the Clinical Evaluation of Language Fundamentals–Fifth Edition (Wiig, Semel, & Secord, 2013) and theDiagnostic Evaluation of Language Variation–ScreeningTest (DELV-ST; Seymour, Roeper, & de Villiers, 2003).Researcher-developed screening protocols have also beentested, including psycholinguistic tasks from experimentalstudies (e.g., nonword repetition and sentence repetition;Archibald & Joanisse, 2009). The administration time forthese individually administered screens ranges from 5 to20 min, and scoring time is generally just a few minutes.Classification accuracy statistics for these screens rangefrom fair to good, with sensitivity estimates from 81% to93% and specificity estimates from 57% to 87%;2 however,it is not known how well these screens perform for chil-dren with co-occurring language and word reading impair-ments versus LIs that occur in children with typical wordreading abilities.
Both individual- and group-administered screensare available to identify children at risk for reading diffi-culties. Examples of individually administered screensinclude the Predictive Assessment of Reading (Wood,2013; Wood, Hill, Meyer, & Flowers, 2005), which requiresapproximately 15 min per student, as well as the widely usedDynamic Indicators of Basic Early Literacy Skills (Good& Kaminski, 2002), which requires 5 min per student persubtest. Examples of group-administered reading screensinclude the Test of Silent Word Reading Fluency (TOSWRF;Mather, Hammill, Allen, & Roberts, 2004) and the Test ofSilent Reading Efficiency and Comprehension (Wagner,Torgesen, Rashotte, & Pearson, 2010); each can be admin-istered in approximately 5–10 min. The reference standardused to measure classification accuracy has varied across ex-aminations of each screen, but accuracy statistics range fromfair to good for both individual- and group-administeredscreens, with sensitivity of 77%–93% and specificity of 65%–
92% (Johnson, Pool, & Carter, 2011; Mather et al., 2004;Smolkowski & Cummings, 2015; Wagner et al., 2010; Woodet al., 2005). Similar to the case of oral language screens, itis not known how well these reading screens perform forchildren with co-occurring language and word reading
2The DELV-ST manual does not report sensitivity and specificity, but weestimated them from the data provided in the manual. The DELV-STprovides four score classifications with regard to risk for languageimpairment: lowest risk, low-medium risk, medium-high risk, andhighest risk. For the calculation of sensitivity and specificity, weconsidered the first two categories as screening passes and the lattertwo categories as screening failures.
impairments versus reading impairments that occur in chil-dren with typical language abilities.
Study PurposeChildren with language and reading impairments
experience increased risk for academic failure, under-employment, and negative socioemotional outcomes com-pared to their peers with good reading and language skills(Daniel et al., 2006; Johnson, Beitchman, & Brownlie,2010; Mugnaini, Lassi, La Malfa, & Albertini, 2009). It isimportant to identify children with language or reading im-pairment as early as possible so that interventions can beimplemented to facilitate positive outcomes. Previous stud-ies have suggested that children with LI may be particu-larly likely to “fly under the radar” (e.g., Tomblin et al.,1997) until subsequent reading problems become apparent(Catts et al., 2012; Nation et al., 2004). The preceding re-view revealed several language screening tools that providesatisfactory classification accuracy, but all were individu-ally administered. When considered for universal screening atscale—at classroom, school, and district levels—individuallyadministered screens can be highly costly and time consuming.However, a sufficiently accurate, group-administered lan-guage screen could provide a relatively time- and cost-effective means for schools to identify children who needfurther observation or evaluation of their oral languageskills.
This study was part of a larger project involving chil-dren with SLI, dyslexia, or typical development, whichused group screenings as part of a recruitment strategy(Adlof, 2016). The screening battery included two brief,norm-referenced measures intended for group administra-tion, including one that primarily targeted word readingskills (TOSWRF) and one that targeted sentence compre-hension (Listening Comprehension subtest of the GroupReading Assessment and Diagnostic Evaluation [GRADELC]; Williams, 2001); administration of both screens toan entire classroom required less than 30 min. The firstobjective of this study was to evaluate the ability of thesebrief, group-administered screening measures to identifychildren at risk for language and/or reading impairment.Given prior studies of group-administered reading screens(Johnson et al., 2011; Mather et al., 2004) and the estab-lished rate of overlap of reading and language impairment(Catts et al., 2005; McArthur et al., 2000), we hypothesizedthat group-administered screens would provide acceptablelevels of classification accuracy for identifying childrenwith reading and language impairment, overall. However,no previous studies have evaluated screening accuracy forseparate versus co-occurring word reading or oral languageproblems.
The second study objective was to examine the extentto which parents of children meeting standard criteria forLI or dyslexia would be aware of their children’s difficul-ties. Past studies of children with language or reading com-prehension impairment (e.g., Adlof & Catts, 2015; Nationet al., 2004; Tomblin et al., 1997) led us to hypothesize that
Adlof et al.: Classroom Screens for LI and Dyslexia 3509

few parents would have concerns about their children’slanguage development. We are unaware of any recent stud-ies examining parent knowledge of dyslexia in unselectedsamples; thus, this study was the first to compare ratesof parent knowledge of children with separate versus co-occurring LI and dyslexia. We hypothesized that parentsof children with combined dyslexia and LI would be morelikely to report concerns about their children’s skills thanparents of children with difficulties in a single domain.
MethodThis study was conducted as part of a larger study
involving children with SLI, dyslexia, or typical develop-ment, and the screening battery was used as part of therecruitment strategy (Adlof, 2016). Study procedures wereapproved by the University of South Carolina InstitutionalReview Board. Two cohorts of children participated in aca-demic year 2013–2014 (Year 1) and 2014–2015 (Year 2),respectively; their data were pooled for the analyses in thisstudy. The study procedures involved two steps: (a) class-room screening and (b) individual assessment.
Classroom ScreeningTrained research assistants administered language
and reading screening measures to second-grade class-rooms. All students in each classroom were screened atthe same time.
ParticipantsParticipants were drawn from 37 second-grade class-
rooms in Year 1 and 40 second-grade classrooms in Year 2.In total, the screening sample included 1,496 cases, in-cluding 732 children in Year 1 and 764 children in Year 2.The mean age of the students was 7.8 years (SD = 0.43).Thirty-two of the Year 1 classrooms and all of the Year 2classrooms were from a single school district, with districtdemographics for second-grade students as follows: 53%boys, 47% girls; 64% White–non-Hispanic, 27% Black–non-Hispanic, 6% Hispanic, 3% two or more races, and< 1% American Indian or Asian/Pacific Islander (NationalCenter for Education Statistics, 2015). Fifty-six percent ofchildren in the district qualified for free or reduced lunch(South Carolina Department of Education, 2017). Theremaining five classrooms in Year 1 were from a singleschool in a different district, with the following district demo-graphics for second-grade students: 48% boys, 52% girls;43% White–non-Hispanic, 30% Black–non-Hispanic,21% Hispanic, < 1% American Indian/Alaskan, 1% Asian/Pacific Islander, 5% two or more races (National Centerfor Education Statistics, 2015). Fifty-eight percent of stu-dents in the school qualified for free or reduced lunch(South Carolina Department of Education, 2017). Toprotect student identities, students’ screening forms weremarked with a numeric identification code, and classroomteachers maintained the link between student names andcodes.
3510 Journal of Speech, Language, and Hearing Research • Vol. 60 •
Screening MeasuresThe GRADE LC (Williams, 2001) was selected to
screen for potential LI. This subtest contains 17 items,intended to assess vocabulary and grammar as well ashigher-level language structures (e.g., inference, idiomcomprehension), and administration time is approximately20 min. Children were given a booklet of picture sets. Foreach item, the examiner read a brief passage (usually asentence) aloud, and children were asked to mark whichpicture, from a set of four, best matched what they heard.The GRADE manual reports coefficient alpha = .60 andsplit-half reliability = .75 for Level 2, Form A, as was usedin this study. Although these reliabilities are less thandesired, we were unaware of other group-administered,norm-referenced oral language measures for second-gradestudents. According to the GRADE manual, the low reli-abilities may be partially related to ceiling effects amongchildren with no oral language problems who generally findthe LC subtest very easy. Thus, it was possible that this sub-test could identify children with language difficulty, evenif it was not reliable at discriminating average from verygood performance.
Form A of the TOSWRF (Mather et al., 2004) wasselected to screen for potential word reading difficulties.In the TOSWRF, children were presented with severallines of unrelated words without spaces between them andinstructed to draw a line between as many real words aspossible within a 3-min time limit. Students were instructedto complete each row of text sequentially. According tothe manual, when a student skips more than one row, thescore is considered invalid. The test manual reports thattest–retest reliability is .92. Because it is a speeded test,coefficient alpha is not calculated for the TOSWRF.
Individual AssessmentFollowing screening, some students were invited to
participate in follow-up individual testing. A planned miss-ing data design was used in this study (Enders, 2010), suchthat diagnostic assessments were deliberately administeredto some individuals and not others. Teachers were pro-vided a report of scores for all students in their classroomand asked to distribute study information to children whomet specific scoring criteria, which were intended to iden-tify likely candidates for the larger project. In Year 1, weinvited children whose screening scores suggested that theymight have language and/or reading difficulties and chil-dren who obtained good scores on both the reading andlanguage screening measures. Thus, teachers were asked todistribute invitations to students who met any of the follow-ing criteria: (a) scored ≤ 25th percentile on the TOSWRF,(b) had a GRADE LC stanine score of ≤ 3, or (c) scored≥ 40th percentile on TOSWRF and had a GRADE LC sta-nine score of > 5. The criteria were modified for Year 2,such that more students were invited in order to meet therecruitment goals for that year. Specifically, in Year 2, theGRADE LC cutoff for “poor” performance was changed
3507–3522 • December 2017

to a stanine score of ≤ 4, and the corresponding cutofffor “good” performance was changed to a stanine scoreof ≥ 5.
Parents were provided with a packet of study infor-mation, including informed consent documents and a par-ent questionnaire, and invited to enroll their children infurther study activities, if desired. Eligibility criteria forchildren to participate in follow-up testing were (a) writteninformed consent from the children’s parents and verbalassent from the child; (b) identification as a native Englishspeaker; and (c) no reports of uncorrected vision, hearing,or other impairment that would interfere with the child’sability to complete the individual assessments. The parentquestionnaire was used to verify eligibility. In addition tobasic demographic questions and questions about hearing,vision, motor, and other physical/medical history, parentswere asked two questions that were used to assess theirawareness of potential language or reading difficulties intheir child. Specifically, parents were asked, “Has yourchild ever received speech, language, reading, or other spe-cial education services? If yes, please describe,” and “Doyou have any concerns about your child’s reading or lan-guage abilities? If yes, please describe.”
Upon receipt of informed consent and parent ques-tionnaires, follow-up tests were individually administeredover one to three sessions, as needed, given student andclassroom schedules. The average amount of time be-tween screening and follow-up testing was 92 days (SD =28.3 days). Follow-up testing occurred in quiet areas ofthe school with limited distractions. Follow-up assessmentswere video- and audio-recorded and scored from the re-cordings by trained research assistants. Gift cards forschool supplies were given to each class in recognition ofstudent and teacher time and effort in participating in thestudy.
ParticipantsA total of 1,121 students were invited to participate
in individual assessments. Informed consents were returnedfor 485 students. The final analysis sample included381 children who met all inclusionary criteria, as determinedby the parent questionnaire, and for whom both screeningmeasures (TOSWRF, GRADE LC) and both diagnosticmeasures (Clinical Evaluation of Language Fundamentals–Fourth Edition [CELF-4; Semel, Wiig, & Secord, 2004]and Woodcock Reading Mastery Tests–Third Edition[WRMT-III; Woodcock, 2011]) were available. These par-ticipants had a mean age of 7.74 years (SD = .40), and54% were girls (46% boys). Their reported races were63%White, 29.7% Black/African American, and 3.6% other/multiple races, with 3.7% not reported. Reported ethnicitieswere 2% Hispanic/Latino, 64% non-Hispanic/Latino, and34% not reported.
Language AssessmentThe Core Language Score from the CELF-4 (Semel,
Wiig, & Secord, 2004) was used to identify children withLI. The four subtests reflected in the composite score are
Concepts and Following Directions, which measures thechild’s ability to understand and follow verbal instructionsof increasing length and complexity; Word Structure,which assesses morphology and pronoun use; RecallingSentences, which assesses the child’s ability to listen tospoken sentences of increasing length and complexity andrepeat them aloud verbatim; and Formulated Sentences,which assesses the child’s ability to generate a spoken sen-tence using a word provided by the examiner. A few chil-dren in the sample were 9 years or older. These childrendid not complete the Word Structure subtest, but insteadcompleted the Word Classes subtest, which assesses achild’s ability to understand and explain semantic relation-ships between words. According to the test manual, theinternal consistency reliability of the Core Language scoreof the CELF-4 ranges from .94 to .95 for the age groupsrepresented in our study (7;0–9;11 [years;months]). In thisstudy, children who scored at least 1 SD below the mean(standard score ≤ 85) were classified as having LI. Accord-ing to the CELF-4 test manual, this cut score results in100% sensitivity and 82% specificity of classification.
Dialectical ConsiderationsThis study was conducted in a region of the country
where many people speak a nonmainstream dialect suchas African American English or Southern White English.Because the CELF-4 contains some items that test mor-phosyntactic features that contrast between mainstreamand nonmainstream American English dialects, it was im-portant to ensure that our language classifications werevalid for individuals who spoke a nonmainstream dialect.That is, it was important to ensure that children withtypical language abilities who spoke a nonmainstreamdialect were not misclassified as having LI (cf. Hendricks& Adlof, 2017). We used the DELV-ST (Seymour, Roeper,& deVilliers, 2003) to verify the LI status for children whospoke a nonmainstream dialect. The DELV-ST is dividedinto two parts. Part I, Language Variation Status, is usedto measure the amount of nonmainstream dialect featureuse in the child’s spoken language productions. Raw scoresfrom Part I are used to derive one of three classifications:strong variation, some variation, and no variation. Part II,Diagnostic Risk Status, is used to assess a child’s risk forLI, with four possible classifications of diagnostic risk:highest risk, medium-high risk, low-medium risk, andlowest risk. The DELV-ST manual reports reliability interms of interexaminer decision consistency. Accordingto the manual, 92% of participants in the DELV-ST reli-ability sample were classified the same or within one cat-egory for language variation status (Part I), and 84% ofparticipants were classified the same or within one cate-gory for diagnostic risk status (Part II) on both screeningoccasions.
In the current study, most of the children who ini-tially scored below the CELF-4 cutoff and showed “some”or “strong” variation on the DELV-ST Part I were alsodetermined to be of medium-high to high risk for LI onthe DELV-ST Part II. The Appendix contains a flowchart
Adlof et al.: Classroom Screens for LI and Dyslexia 3511

3Specifically, 89% of the participants classified as LI (120/135) hadTONI-4 standard scores of > 85, 7% (10/135) had TONI-4 standardscores of between 75 and 85, one had a TONI-4 standard score of 68,and 3% (4/135) were missing TONI-4 data. Likewise, 88% of theparticipants meeting the dyslexia criteria (91/103) had TONI-4 standardscores of > 85, 7% (7/103) had TONI-4 standard scores between 75and 85, one had a TONI-4 standard score of 68, and 4% (4/103) weremissing TONI-4 data. Within the group of participants classified ashaving neither LI nor dyslexia (i.e., typically developing group), 84%(181/216) had TONI-4 scores of > 85, one had a TONI-4 standardscore of 79, and 16% (34/216) were missing TONI-4 data.
detailing how dialectical variations were considered in theassignment of LI status in the current study. Followingthis process, 135 of 140 (96%) of the children who initiallyscored ≤ 85 on the CELF-4 were classified as languageimpaired. The remaining five children who initially scoredbelow the CELF-4 cutoff were ultimately classified as hav-ing typical language based on adjustments for dialecticalvariation.
Word Reading AssessmentThe Word Identification and Word Attack subtests
from the WRMT-III (Woodcock, 2011) were used to iden-tify children with word reading difficulties commensuratewith dyslexia. The Word Identification subtest requireschildren to read real English words of increasing difficulty,whereas the Word Attack subtest requires children to readpronounceable pseudowords of increasing difficulty. Ac-cording to the test manual, split-half reliability for theWord Identification subtest is .94 and split-half reliabilityfor the Word Attack subtest is .92 for second-grade stu-dents. These subtests combine to form a cluster score,Basic Skills. According to the test manual, reliability forthe Basic Skills cluster is .96 for second-grade students,using a formula recommended by Feldt and Brennan (1989)and Guilford (1954). Children who scored at least 1 SD be-low the mean on the Basic Skills cluster were classified asdyslexic. Although the WRMT-III manual does not provideinformation regarding sensitivity and specificity, this cutoffis comparable to other studies that have used the WRMT-III(or previous versions) for identifying dyslexia (e.g., Cattset al., 2005; Joanisse, Manis, Keating, & Seidenberg, 2000;Siegel, 2008). The WRMT-III manual provides descrip-tive statistics for a sample of individuals with learningdisabilities in the area of reading. Our selection of an85 standard score cutoff would identify the majority of in-dividuals in this subgroup, who achieved a mean of 76.8(SD = 11.9).
Nonverbal IntelligenceThe Test of Nonverbal Intelligence–Fourth Edition
(TONI-4; Brown, Sherbenou, & Johnsen, 2010) was usedto assess nonverbal cognitive skills. According to the testmanual, the internal consistency of the TONI-4 is .94–.96for the age groups represented in this study. Some partici-pants (n = 40) were missing data on the TONI-4. Most ofthese (n = 34) were children who were considered typicallydeveloping (TD) based on the CELF-4 and WRMT-IIIbut who did not participate in the larger study and thuswere not administered the TONI-4. In this study, we usedthe TONI-4 for purely descriptive purposes, and no deci-sions for participant inclusion or exclusion were made onthe basis of this test. Our rationale was that it was impor-tant for the screening measures to accurately classify allchildren at risk for language or reading impairment, re-gardless of whether the difficulties were “specific” to lan-guage and/or reading or commensurate with nonverbalcognitive abilities (cf. Fletcher et al., 1994; Rice, 2016).However, the vast majority of the participants in the
3512 Journal of Speech, Language, and Hearing Research • Vol. 60 •
impairment groups showed normal nonverbal cognitiveskills.3
Scoring ReliabilityIn Year 1, all screening measures and assessments
were double scored by trained research assistants to ensurereliability, and disagreements were reconciled through dis-cussion with the lead assessor and/or principal investigator(third author and first author, respectively). In Year 2, allscorers were required to pass a scoring test before scoringprotocols independently. Scorers kept a log of tests thatthey had scored, and a random sample of at least 20% ofeach scorer’s list was double-scored for assessing reliability.Because participants wrote their own answers on screeningprotocols and the initial scorers marked up the protocols,screening reliability scorers were not blind to initial scores.Reliability was assessed as the percentage of agreementson summary scores and was 94% for TOSWRF standardscore and 99% for GRADE LC stanine score. Reliabilityscorers for all individually administered assessments usedblank protocols and video/audio recordings of the as-sessments and were blind to initial scores. Reliabilitywas assessed as the by-item agreement for each of the in-dividually administered measures and was 92.8% forCELF-4, 96.5% for WRMT-III, 99.3% for TONI-4, and92% for DELV-ST.
ResultsDescriptive statistics for the screening measures are
provided in Table 1 for the full screening sample and forthe subset of children who participated in individual test-ing. Note that, within the full screening sample, some chil-dren only completed one measure and/or had invalidscores for the TOSWRF, leading to unequal Ns for thesetwo measures. The mean scores of the screening sampleand the individual testing sample were not significantly dif-ferent for either the TOSWRF (t = 1.68, p = .09) or theGRADE LC (t = 0.82, p = .41). In the individual testingsample, LI and dyslexia (DYS) criteria were applied indepen-dently of each other. Thus, each child could meet the criteriafor one (either LI-only or DYS-only), both (LI+DYS), orno impairment (TD). In this sample, 54% of children meetingthe criteria for LI also met the criteria for DYS, and 71%of children meeting the criteria for DYS also met the cri-teria for LI (see Figure 1). Thus, there was considerable
3507–3522 • December 2017

Table 1. Means and standard deviations for screening measuresin screening sample and diagnostic sample.
Measure
Screening sample Diagnostic sample
N M SD N M SD
TOSWRF SS 1,429 100.14 13.88 381 98.79 14.04GRADE LC stanine 1,440 4.76 2.11 381 4.66 2.16
Note. TOWSRF SS = Test of Silent Word Reading Fluency StandardScore; GRADE LC = Group Reading Assessment and DiagnosticEvaluation Listening Comprehension subtest.
overlap between word reading and language difficulties, butthere were also many children who showed difficulty in onedomain and typical performance in the other. Table 2 pro-vides descriptive statistics for children who were classifiedas LI-only, DYS-only, LI+DYS, or TD.
Screening Performance for LI and/or DYSOur first research objective was to determine how
well brief classroom screens could identify second-gradestudents with LI and/or DYS, as determined by individu-ally administered diagnostic measures. We began by ex-amining correlations between group-administered andindividually administered measures. A small but signifi-cant correlation between scores on the two group screeningmeasures (TOSWRF and GRADE LC) was observed inboth the full screening sample r = .21 (p < .001) and thesmaller individualized testing sample r = .24 (p < .001).Table 3 displays correlations between scores on the groupscreening measures and scores on the diagnostic measures(WRMT-III and CELF-4) for the individual assessmentsample. Although both group screens were significantly cor-related with both diagnostic assessments, we were surprisedthat the correlation between the word reading screeningmeasure (TOSWRF) and the language diagnostic measure
Figure 1. Venn diagram illustrating the overlap between studentsmeeting criteria for language impairment (LI) and/or dyslexia (DYS).Of the 135 children meeting the criteria for LI, 73 (54%) also met thecriteria for DYS. Of the 103 children meeting the criteria for DYS,73 (71%) also met the criteria for LI. LI-only = language impairmentwithout dyslexia; DYS-only = dyslexia without language impairment;LI+DYS = combined language impairment and dyslexia.
(CELF-4; r = .58, p < .001) was larger than the correla-tion between the language screening (GRADE LC) andlanguage diagnostic measure (CELF-4; r = .38, p < .001).
Logistic regression and receiver operating character-istic (ROC) curves were used to examine how well thescreening measures differentiated children with LI or DYSfrom children with typical language and reading skills.Recall that participant recruitment procedures resulted insome data being missing completely at random (MCAR).Little’s test of MCAR was used to statistically evaluate theextent to which the data aligned with this assumption ofthe data (Little, 1988). Results for the MCAR test affirmedthat an assumption of MCAR was tenable, χ2(2) = 2.77,p = .251, indicating that the missing data could be addressedvia estimation methods. Therefore, we used maximum like-lihood estimation in the logistic regression models as ameans to leverage the available data. The logistic procedurein SAS (SAS Institute Inc., 2013) was used for the logisticregression and area under the curve (AUC) estimation(Schatschneider, 2013). Note that in each model the N forthe typical comparison group varied for each prediction aschildren in the LI-only group (who met criteria for LI butnot DYS) were considered to have typical reading skills andchildren in the DYS-only group (who met criteria for DYSbut not LI) were considered to have typical language skills.
We ran three groups of logistic regression modelspredicting the risk of LI (including LI-only and LI+DYS)versus typical language (TD and DYS), DYS (includingDYS-only and LI+DYS) versus typical reading (TD andLI), and either LI or DYS (including LI-only, DYS-only,and LI+DYS) versus TD. For the prediction of risk for LIversus typical language, GRADE LC scores were entered inthe first logistic regression model; the second model includedboth GRADE LC and TOSWRF scores. In the prediction ofrisk for DYS versus typical reading, the modeling procedurewas reversed. In the prediction of either impairment, a singlemodel was run with both predictors. The predicted probabili-ties from the models containing both predictors were savedas composite risk scores for use in ROC curve analysis.
ROC curves were used to evaluate overall classifica-tion accuracy. A ROC curve is a plot of the sensitivity ofthe screening measure (i.e., the true positive rate) againstits false positive rate (i.e., 1 − specificity) for every possi-ble screening score. The AUC provides an estimate of thescreening accuracy: For all possible pairs of individuals,where one member of the pair is impaired and the other isnot impaired, the AUC indicates the percentage of timesthe screen will assign a higher risk status to the impairedmember of the pair. A measure with chance-level accuracywill result in a diagonal line and an AUC value of .50.As a rule of thumb, AUC values between .7 and .8 areusually considered acceptable, values between .8 and .9 areconsidered excellent, and values above .9 are outstanding(Hosmer & Lemeshow, 2000). For each risk outcome (LI,DYS, either impairment), we generated ROC curves foreach screening measure individually, as well as the com-posite risk score derived from the logistic regression models(i.e., predicted probability score from full model).
Adlof et al.: Classroom Screens for LI and Dyslexia 3513

Table 2. Subgroup descriptive statistics for screening and diagnostic measures and parent report.
Measure
TD LI-only DYS-only LI+DYS
(n = 216) (n = 62) (n = 30) (n = 73)
TOSWRF SS mean (SD) 105.62a 95.66b 88.23c 85.56c(11.66) (12.14) (7.77) (10.65)
GRADE LC stanine mean (SD) 5.24a 3.58b 4.93a 3.78b(2.02) (1.96) (2.12) (2.10)
CELF-4 Core Language SS mean (SD) 102.47a 78.13b 94.80c 73.04d(9.55) (6.59) (6.96) (8.87)
WRMT-III Basic Skills SS mean (SD) 104.63a 94.37b 80.23c 74.47d(11.14) (7.73) (3.32) (7.38)
TONI-4 SSa mean (SD) 106.78a 100.42b 99.86b 95.09c(8.92) (9.49) (8.46) (8.77)
Parent concern about reading or language skills 7.4%a 24.2%b 46.7%c 37.0%b,cParent-reported child history of speech, language, or reading service 6.9%a 14.5%a,b 20.0%b,c 38.4%cCombined parent concern and/or history of service 13.9%a 29.0%b 60.0%c 56.2%c
Note. Groups that share subscripts (a–d) are not significantly different from each other, p > .05. All other comparisons are significantly different,p < .05. TD = typical development; LI-only = language impairment without dyslexia; DYS-only = dyslexia without language impairment; LI+DYS =both language impairment and dyslexia; TOSWRF = Test of Silent Word Reading Fluency; SS = standard score; GRADE LC = Group ReadingAssessment and Diagnostic Evaluation Listening Comprehension subtest; CELF-4 = Clinical Evaluation of Language Fundamentals–FourthEdition; WRMT-III = Woodcock Reading Mastery Tests–Third Edition; TONI-4 = Test of Nonverbal Intelligence–Fourth Edition.aThe sample size for the TONI-4 was smaller than other assessments (TD n = 182, LI-only n = 60, DYS-only n = 28, LI+DYS n = 71).
Tables 4–6 report the results of the logistic regressionmodels for each predicted outcome, and Table 7 reportsthe results of the ROC curve analyses. For the predictionof risk of LI, the model including GRADE alone wassignificantly better than chance, resulting in a nearly accept-able level of classification accuracy (AUC = .699). How-ever, the full model including TOSWRF was significantlybetter, resulting in greatly improved classification accuracy(AUC = .792). A different pattern of results was found forthe prediction of risk of DYS, such that TOSWRF scoresalone resulted in a very high level of classification accuracy(AUC = .857), and the addition of GRADE scores didnot improve the prediction. For the prediction of risk foreither impairment, both TOSWRF and GRADE LCscores were statistically significant in the model. The AUCfor the composite risk score (.842) was considerably greaterthan the AUC for the GRADE LC alone (.676) and
Table 3. Correlations between group screening and individualassessment measures in the individual assessment sample (N = 381).
Measures 1 2 3 4
1. TOSWRF SS 12. GRADE LC stanine .24* 13. CELF-4 Core Language SS .58* .38* 14. WRMT-III Basic Skills SS .71* .23* .69* 1
Note. TOSWRF = Test of Silent Word Reading Fluency; SS =standard score; GRADE LC = Group Reading Assessment andDiagnostic Evaluation Listening Comprehension subtest; CELF-4 =Clinical Evaluation of Language Fundamentals–Fourth Edition;WRMT-III = Woodcock Reading Mastery Tests–Third Edition.
*p < .001
3514 Journal of Speech, Language, and Hearing Research • Vol. 60 •
only slightly larger than the AUC for the TOSWRFalone (.833).
Overall, the results indicated that the addition ofGRADE LC in the combined model made a small improve-ment to overall classification accuracy over the modelwith TOSWRF by itself. To examine how well the screensidentified children with single versus combined deficits,we examined for each subgroup (i.e., LI-only, LI+DYS,DYS-only, TD) the distribution of TOSWRF scores andcomposite risk scores (i.e., predicted probability) from thefinal model predicting risk for either LI or DYS. These twomeasures showed comparable AUC values; GRADE LC wasnot considered by itself due to its substantially lower AUC.The boxplots in Figures 2 and 3 show the range of scores ex-hibited by each subgroup on the composite risk score andthe TOSWRF. The dotted line plotted on each graph displaysthe cut score associated with an overall sensitivity of .8. As
Table 4. Results of logistic regression models predicting risk oflanguage impairment (n = 135) versus typical language (n = 246).
Model Predictor β SE β Wald’s χ2 df p OR
1a GRADE LC −0.36 0.06 37.32 1 < .001 0.70Constant 1.06 0.28 14.95 1 < .001
2b GRADE LC −0.31 0.07 22.36 1 < .001 0.74TOSWRF −0.08 0.01 54.99 1 < .001 0.93Constant 8.25 1.04 63.36 1 < .001
Note. Subscript a: Model 1 summary statistics: χ2 = 44.14, df = 1,p < .001; −2 log likelihood = 456.95. Subscript b: Model 2 summarystatistics: χ2 = 113.48, df = 2, p < .001; −2 log likelihood = 387.60.GRADE LC = Group Reading Assessment and Diagnostic EvaluationListening Comprehension subtest; TOSWRF = Test of Silent WordReading Fluency.
3507–3522 • December 2017

Table 5. Results of logistic regression models predicting risk ofdyslexia (n = 103) versus typical reading (n = 278).
Model Predictor β SE β Wald’s χ2 df p OR
1a TOSWRF −0.12 0.01 82.47 1 < .001 0.89Constant 10.02 1.18 72.18 1 < .001
2b TOSWRF −0.11 0.01 78.08 1 < .001 0.89GRADE LC −0.05 0.07 0.48 1 .483 0.96Constant 10.08 1.19 72.21 1 < .001
Note. Subscript a: Model 1 summary statistics: χ2 = 82.47, df = 1,p < .001; −2 log likelihood = 132.01. Subscript b: Model 2 summarystatistics: χ2 = 82.38, df = 2, p < .001; −2 log likelihood = 132.49.TOSWRF = Test of Silent Word Reading Fluency; GRADE LC =Group Reading Assessment and Diagnostic Evaluation ListeningComprehension subtest.
can be inferred from the boxplots, the three impairedgroups scored significantly differently than the TD groupon both screening measures (all ps < .001). However, theLI-only group displayed a wider range of TOSWRF scoresand composite risk scores than the DYS-only or LI+DYSgroup, such that more of the LI-only group’s scores over-lapped with the TD group. Thus, the screening measureswere somewhat less effective at identifying LI-only partici-pants than LI+DYS or DYS participants. Table 8 indicatesthe cut score, overall false positive rate, and rate of missesfor the three impaired subgroups associated with overallsensitivity rates of .7, .8, and .9 for the TOSWRF and com-bined screen. These values suggest that the addition of theGRADE LC to the TOSWRF in the combined screen leadsto small decreases in the overall false positive rate and therate of misses in the LI-only group and a small increase inmisses for the LI+DYS and DYS-only groups.
Parent Awareness of LI and/or DYSOur second research objective was to examine whether
parents of children with single deficits—either LI-only orDYS-only—were aware of their children’s difficulties at thesame rate as parents of children with combined LI+DYS. Thelast three rows in Table 2 indicate the percentage of parentsof children in each group who (a) reported concerns abouttheir child’s language or reading skills; (b) reported thattheir child had previously received services for speech,
Table 6. Results of logistic regression models predicting risk of eitherlanguage or reading impairment (n = 165) versus typical development(n = 216).
Predictor β SE β Wald’s χ2 df p OR
TOSWRF −0.10 0.01 79.17 1 < .001 0.90GRADE LC −0.25 0.06 15.38 1 < .001 0.78Constant 10.99 1.18 87.55 1 < .001
Note. Model summary statistics: χ2 = 152.56, df = 2, p < .001; −2log likelihood = 368.77. TOSWRF = Test of Silent Word ReadingFluency; GRADE LC = Group Reading Assessment and DiagnosticEvaluation Listening Comprehension subtest.
language, or reading; or (c) reported either concerns orprior services. Z tests (two-tailed) of the collapsed responsesindicated that parents of children in the DYS-only andLI+DYS groups reported concerns and/or prior receipt ofservices significantly more often than parents of children inthe LI-only group (LI-only vs. DYS-only, p = .004; LI-onlyvs. LI+DYS, p = .001), whereas the difference between theLI+DYS group and DYS-only group was not significant(p = .73). Parents of children in all three impairment groupswere significantly more likely to report concerns than parentsof children in the TD group (all ps < .007). Overall, ques-tionnaire responses suggested that a considerable percentageof parents across all three impairment groups were unawareof their children’s difficulties and that parents were morelikely to be aware of reading difficulties than oral languagedifficulties.
DiscussionThis study first examined the ability of brief, classroom-
administered screening measures to accurately identifysecond-grade students with language or reading impair-ment. In light of concerns about the amount of time thatis spent on assessments in schools (cf. Plank & Condliffe,2013), screening tools that provide quick identification ofstudents who may need a closer look while protecting in-structional time can be very valuable. Overall, the classifi-cation accuracies achieved by the combination of the twogroup-administered measures in this study were all above .8,which is considered outstanding (Hosmer & Lemeshow,2000). These classification accuracies were as good as orbetter than the individually administered measures de-scribed in the introduction, which require considerablymore time to administer and score. We were able to admin-ister the combined screening battery in less than 30 min perclassroom. Scoring time averaged less than 5 min per stu-dent. Thus, in total, risk status could be determined for aclassroom of 20 students in approximately 2 hr, includingthe administration and scoring of both measures. Further-more, no special equipment was required, as both mea-sures required only paper and pencil. Thus, these resultsindicate the validity of brief, group-administered mea-sures for identifying children at risk for language or readingimpairment. Furthermore, there is potential for such group-administered tools to provide accurate identification withconsiderable savings compared to the time, personnel, andequipment required for individual administration of screen-ing measures.
Overall, the results supported the usefulness of theTOSWRF to a much greater extent than the GRADE LC.The TOSWRF provided excellent classification accuracyfor identifying children with DYS or LI + DYS and accept-able classification accuracy for identifying children with LIbut good word reading scores. By itself, the GRADE LCwas not sufficiently discriminating, but it did help improvethe accuracy of classification of children with LI but goodword reading scores and reduce the false positive rate (therate of falsely classifying TD children as being at risk). The
Adlof et al.: Classroom Screens for LI and Dyslexia 3515

Table 7. Areas under the curve (AUC) and 95% confidence intervals (CI) for predicting risk of language impairment(LI), dyslexia (DYS), or either impairment from individual and combined screening measures.
Prediction outcome Impairment n Typical n AUC 95% CI
Risk of LI vs. typical languageGRADE LC 135 246 .699 .644–.755TOSWRF .778 .730–.826Composite .792 .746–.838
Risk of DYS vs. typical word readingTOSWRF 103 278 .857 .818–.896GRADE LC .602 .537–.666Composite .852 .812–.891
Risk of LI or DYS vs. typical word reading and languageTOSWRF 165 216 .833 .792–.875GRADE LC .676 .622–.731Composite .842 .802–.882
Note. GRADE LC = Group Reading Assessment and Diagnostic Evaluation Listening Comprehension subtest;TOSWRF = Test of Silent Word Reading Fluency.
superior discrimination of the TOSWRF for identifyingword reading problems as compared to the GRADE LC’sidentification of language problems may be partially ex-plained by the fact that the TOSWRF was more similar tothe diagnostic reading task (WRMT-III) than the GRADELC was to the diagnostic language task (CELF-4). Boththe TOSWRF and the WRMT-III focused on the readingof single words (or pseudowords). In contrast, a wider arrayof tasks (following multistep directions, understanding andproducing grammatical morphemes in isolation and in
Figure 2. Distribution of scores on composite screen by sub80% sensitivity overall. TD = typical development; LI-only =dyslexia without language impairment; LI+DYS = combined
3516 Journal of Speech, Language, and Hearing Research • Vol. 60 •
sentences, repeating sentences, generating sentences, andcompleting morphosyntactic cloze tasks) were evaluated inthe CELF-4 than in the GRADE LC.
The TOSWRF also provided better discriminationthan the GRADE LC for identifying language problems.One possible explanation is that the TOSWRF likely tappedinto language skills including vocabulary knowledge andmetalinguistic awareness, as children were required to iden-tify the boundaries of real words amidst other real words.Another potential explanation relates to the scaling of the
group. Dotted line indicates cut score associated withlanguage impairment without dyslexia; DYS-only =language impairment and dyslexia.
3507–3522 • December 2017

Figure 3. Distribution of scores on Test of Silent Word Reading Fluency by subgroup. Dotted line indicates cut score associated with 80%sensitivity overall. TD = typical development; LI-only = language impairment without dyslexia; DYS-only = dyslexia without language impairment;LI+DYS = combined language impairment and dyslexia; TOSWRF SS = Test of Silent Word Reading Fluency standard score.
GRADE LC items. Specifically, the difference in raw scoresbetween a stanine score of 3 (11th to 23rd percentiles) anda stanine score of 6 (77th to 89th percentiles) was only threepoints out of a maximum of 17. As noted previously, theGRADE LC manual indicated that ceiling effects in thenorming sample were related to the fact that the task is veryeasy for students without receptive oral language problems.However, our data suggested that the task was also rela-tively easy for many of the students who met the criteria forLI. Specifically, 21% of the participants meeting the criteriafor LI (including 15/62 in the LI-only group and 13/73 inthe LI+DYS group) missed no more than one item on theGRADE LC, and an additional 27% (including 12/62 in theLI-only group and 24/73 in the LI+DYS group) missed nomore than three items. In comparison, 34.5% of children
Table 8. Screening performance for language impairment + dyslexia subgcombined screen.
Screeningmeasure
Cutscore
Overallsensitivity
Overall falsepositive rate
LI-only
Num. missed Pr
TOSWRF 106 .90 .49 15100 .80 .27 2496 .70 .17 29
Combined screen 0.27 .90 .38 110.40 .80 .24 210.54 .70 .17 28
Note. LI-only = language impairment without dyslexia; DYS-only = dyslexiand dyslexia.
with typical language skills (including 8/30 in the DYS-onlygroup and 77/216 in the TD group) missed three or moreitems on the GRADE LC. In summary, although signifi-cant mean differences were observed between the groupswith typical language skills versus LI, the distributions ofboth raw and stanine scores between groups showed consid-erable overlap. We note that the GRADE LC was usedbecause we were unaware of other group-administered,norm-referenced oral language measures that could be ad-ministered in the same or less time for our larger project.However, it is possible that better classification accuracycould be achieved using a sentence comprehension task thatinvolved a better selection of items or by adapting othertypes of tasks for group administration. Overall, our resultsunderscore the potential of group-administered assessments
roups with Test of Silent Word Reading Fluency (TOSWRF) versus
DYS-only LI+DYS
oportion Num. missed Proportion Num. missed Proportion
.24 1 .03 1 .01
.39 3 .10 6 .08
.47 7 .23 13 .18
.18 2 .07 3 .04
.34 4 .13 7 .10
.45 7 .23 13 .18
a without language impairment; LI+DYS = both language impairment
Adlof et al.: Classroom Screens for LI and Dyslexia 3517

for the identification of at-risk children, but there is roomfor improvement.
An important strength of this study was its consider-ation of separate versus co-occurring reading and languageproblems. The measures we employed resulted in accurateclassification of children at risk overall, but they tendedto miss children from the LI-only group at higher rates thanthe DYS and LI+DYS groups. We are unaware of any priorstudies that have evaluated screening accuracy for separateversus co-occurring LI and DYS. However, an importantquestion is how well children with LI, but not DYS, canbe reliably identified with other available screening mea-sures, whether group or individually administered. Childrenwith LI are at risk for significant reading comprehensionproblems even if their word reading abilities appear adequate(Catts et al., 2006; Clair, Durkin, Conti-Ramsden, & Pickles,2010; Nation et al., 2004; see also Adlof, Catts, & Lee,2010; Spencer, Quinn, & Wagner, 2014). Thus, it is criticalto have reliable methods of identifying this group of childrenavailable as early as possible so that intervention can beprovided to prevent or ameliorate reading comprehensiondifficulties.
Our second research objective was to examine theextent to which parents of second-grade students meetingtraditional criteria for language or word reading impair-ment might be aware of their children’s difficulties, as mea-sured by responses to a parent questionnaire indicatingconcerns about their children’s language or reading abili-ties or their children’s prior receipt of speech, language, orreading services. Overall, the results suggested that manyto most parents of children meeting traditional criteria forlanguage or reading impairment (40%–71%) were unawareof their children’s difficulties. Of the three impairmentgroups, parents of children in the LI-only group (who hadrelatively good word reading skills) were the least likely toreport concerns and/or prior receipt of services. They weresignificantly less likely to report concerns and/or prior his-tory than parents of children in the DYS group and theLI+DYS group (29% vs. 60% and 56.2%, respectively). Wehad hypothesized that parents would be more likely to re-port concerns for children with both word reading and orallanguage problems than children with problems in onlyone domain. Instead, these results suggest that parentswere more aware of word reading problems than oral lan-guage problems. These results converge with the findingsof other studies of preschool and school-age children withSLI, in which few parents were aware of their children’slanguage difficulties (Conti-Ramsden et al., 2006; Lainget al., 2002; Tomblin et al., 1997). Many children with LIin the early grades go on to have subsequent difficulty withreading comprehension, even if their word reading skillsdevelop normally (Catts, Adlof, & Weismer, 2006; see alsoCatts et al., 2012), and studies of poor comprehenders (manyof whom meet the criteria for LI) have also reported lowlevels of parent and/or teacher knowledge of oral languageweakness (Adlof & Catts, 2015; Nation, et al., 2004). Ifparents are generally unaware of their children’s difficul-ties, they may also be unlikely to seek early intervention
3518 Journal of Speech, Language, and Hearing Research • Vol. 60 •
services, unless the risk for potential problems is broughtto their attention, for example, through universal screeningprocedures. Our results indicated that children meeting thecriteria for LI but not DYS were least likely to be identi-fied by parents or screening measures as being at risk. Thus,more research is needed to develop efficient yet accuratescreens that can identify children who present with LI inspite of good word reading ability.
To our knowledge, this study is the first since Cattset al. (2005) to examine all four groups (LI-only, DYS-only,LI+DYS, TD) within a community-based sample versuspreidentified clinical samples. Although it was not a specificresearch question for this study, we observed that the rateof overlap between LI and DYS in the current sample washigher than expected based on Catts and colleagues’ (2005)population-based sample. Catts et al. found that 18%–33%of children with a history of SLI in kindergarten went onto have DYS in second grade and 15%–19% of childrenwith DYS in second grade had a history of SLI in kinder-garten. In contrast, the current study found that 54% ofchildren meeting the criteria for LI also met the criteriafor DYS and 71% of the children with DYS also metthe criteria for LI. Differences in rates of overlap amongpast studies have generally been attributed to differencesin recruitment—clinical referral versus population-basedsamples—but the similarity of recruitment techniques be-tween the two studies (see Tomblin et al., 1997, for detailedexplanation of the participant screening and recruitment)suggests that other factors must be at play. It is possiblethat slight differences in the measures used to identify LIand DYS in each study could explain some differences.Another important difference between this study and Cattset al. (2005) is that, in the current study, the LI and DYSlabels were applied based on tests administered at the samepoint in time, whereas SLI in Catts et al.’s study was deter-mined by kindergarten language performance and dys-lexia by second-grade reading performance. Although LI isgenerally thought to be a persistent condition, it is likelythat at least some children’s language status would havechanged between kindergarten and second grade (Tomblin,Zhang, Buckwalter, & O’Brien, 2003). In addition, the par-ticipants in this study were recruited from a different geo-graphic region and were more racially diverse than in theCatts et al. (2005) study (see also Tomblin et al., 1997).Furthermore, there may be differences between the twosamples in home and school language and literacy experi-ences that explain differences in rates of overlap. For ex-ample, the children in the Catts et al. (2005) study wereenrolled in primary school in the mid-1990s. Since that time,evidence-based reading instruction has received consider-able attention in research and educational policy (Gerstenet al., 2008; No Child Left Behind Act of 2001). Thus, dif-ferences between the samples in the number of childrenwho showed poor word reading performance due to poorinstruction, as opposed to genetic or neurobiologically basedimpairment (cf. Vellutino, Fletcher, Snowling, & Scanlon,2004), might explain some differences in rates of overlapbetween this study and Catts et al. (2005). Although our
3507–3522 • December 2017

data do not allow us to draw strong conclusions, they dohighlight the need for additional population-based studies toinvestigate separate versus co-occurring LI and dyslexia.Despite the higher rate of overlap in this study, it is impor-tant to note that some children did show unique profiles ofdeficit in one domain and relative strength in the other. At-tending to the differences between the LI and DYS profilesis important, as they have different needs for intervention.
Before concluding, we acknowledge several caveatsand limitations that should be addressed in future studies.First, this study involved a single grade level, secondgrade. This time point was selected because it is a timewhen word reading ability can be reliably assessed—aftera child has had at least 2 years of reading instruction inschool. However, the screening measures employed inthis study may perform differently with other age groups,and they may not work well for very young children. Sec-ond, although our criteria for DYS were similar to thoseemployed in past studies (Catts et al., 2005; Joanisse et al.,2000; Siegel, 2008), we cannot rule out the possibility thatsome children classified as dyslexic in this study may havehad poor reading instruction. Our rationale was that allchildren who showed significant word reading difficultiesshould be identified for further observation, whether thatbe a comprehensive evaluation or a high-quality Tier 2 in-struction, which is intended to rule out poor reading instruc-tion as a causal factor (Reschly, 2014). However, the extentto which each type of word reading difficulty (i.e., definedwith /without consideration of response to instruction)overlaps with LI is an important question for future study.Third, our conclusions about parental awareness of chil-dren’s skills were drawn from responses to two open-endedquestionnaire items. Although our results converge with othercited studies that have reported low parental awareness oflanguage deficits (e.g., Adlof & Catts, 2015; Conti-Ramsdenet al., 2006; Laing et al., 2002; Nation et al., 2004; Tomblinet al., 1997), it is possible that different results would beobtained with other methods of assessing parent awareness.We also did not query teachers about their awareness ofstudents’ reading or language weaknesses, but it is likelythey would have a higher level of awareness than parents,especially with regard to word reading skills. Future studiescould investigate whether including information obtained fromteachers improves the performance of group-administeredscreens (cf. Whitworth, Davies, Stokes, & Blain, 1993).Fourth, although our sample size was relatively large com-pared to past evaluations of LI screens and of LI and DYSsubgroups, it came from a single region of the country andprimarily a single school district. Whereas the overall patternsobserved in this study are likely valid for other geographicareas, the specific cut scores that best discriminate chil-dren at risk for LI or DYS in this sample may differ fromthose for other regions. Finally, although our data metstatistical assumptions for data MCAR, missing data none-theless can introduce bias regardless of mechanism or level.Thus, future studies with more complete data would bevaluable to test whether the findings replicate what hasbeen presented here.
ConclusionThis study found that brief, group-administered
screening measures were able to efficiently identify at-riskchildren with overall high classification accuracy. Thegroup screens provided excellent identification of childrenwith dyslexia and co-occurring dyslexia and LI, but theywere less accurate at identifying children with LI but goodreading skills. In addition, we found that parents of second-grade children meeting standard criteria for LI or dys-lexia were frequently unaware of their children’s languageand reading difficulties, and parents of children with LIbut good word reading skills were least likely to reportconcerns. Further study is needed to consider other agegroups and geographic regions and to develop protocols toreliably identify children with LI but good word readingskills.
AcknowledgmentsThis research was supported, in part, by funding from the
National Institutes of Health (R03DC013399) to the Universityof South Carolina (PI: Adlof ). We thank the participants of thisstudy and the teachers and schools who assisted us with screeningand recruitment and provided space and time for assessment. Wethank research assistants from the SCROLL Lab at the Universityof South Carolina for their help with data collection and process-ing, including Sheida Abdi, Pooja Adarkar, Ellen Ashley, FaithBaumann, Alex Cattano, Rebecca Duross, Madison Goehring,Amanda Harris, Katie Harrison, Alison Hendricks, Alyssa Ives,Hannah Kinkead, Pooja Malhorta, Sara Mallon, Elaine Miller,Hannah Patten, Caroline Smith, Sheneka White, and KimberlyWood. We are also grateful to Alison Hendricks for comments onan earlier version of this manuscript.
ReferencesAdlof, S. M. (2016, July). Spoken word learning in children with
SLI, dyslexia, and typical development. Paper presented at themeeting of the Society for the Scientific Study of Reading,Porto, Portugal.
Adlof, S. M., & Catts, H. W. (2015). Morphosyntax in poorcomprehenders. Reading and Writing, 28, 1051–1070.
Adlof, S. M., Catts, H. W., & Lee, J. (2010). Kindergarten pre-dictors of second versus eighth grade reading comprehensionimpairments. Journal of Learning Disabilities, 43, 332–345.
Archibald, L. M., & Joanisse, M. F. (2009). On the sensitivity andspecificity of nonword repetition and sentence recall to lan-guage and memory impairments in children. Journal of Speech,Language, and Hearing Research, 52, 899–914.
Bishop, D. V. (2014). Ten questions about terminology for chil-dren with unexplained language problems. International Jour-nal of Language & Communication Disorders, 49(4), 381–415.
Bishop, D. V., & Snowling, M. J. (2004). Developmental dyslexiaand specific language impairment: Same or different? Psycho-logical Bulletin, 130, 858–886.
Bishop, D. V., Snowling, M. J., Thompson, P. A., Greenhalgh, T.,& CATALISE-2. (2017). Phase 2 of CATALISE: A multi-national and multidisciplinary Delphi consensus study of prob-lems with language development: Terminology. Journal ofChild Psychology and Psychiatry, 58, 1068–1080. https://doi.org/10.1111/jcpp.12721
Adlof et al.: Classroom Screens for LI and Dyslexia 3519

Botting, N., Simkin, Z., & Conti-Ramsden, G. (2006). Associatedreading skills in children with a history of specific languageimpairment (SLI). Reading and Writing, 19, 77–98.
Brown, L., Sherbenou, R., & Johnsen, S. (2010). Test of NonverbalIntelligence–Fourth Edition. Austin, TX: Pro-Ed.
Catts, H. W., Adlof, S. M., Hogan, T. P., & Weismer, S. E. (2005).Are specific language impairment and dyslexia distinct dis-orders? Journal of Speech, Language, and Hearing Research,48, 1378–1396.
Catts, H. W., Adlof, S. M., & Weismer, S. E. (2006). Languagedeficits in poor comprehenders: A case for the simple view ofreading. Journal of Speech, Language, and Hearing Research,49, 278–293.
Catts, H. W., Bridges, M. S., Little, T. D., & Tomblin, J. B.(2008). Reading achievement growth in children with languageimpairments. Journal of Speech, Language, and HearingResearch, 51, 1569–1579.
Catts, H. W., Compton, D., Tomblin, J. B., & Bridges, M. S.(2012). Prevalence and nature of late-emerging poor readers.Journal of Educational Psychology, 104, 166–181.
Clair, M. C., Durkin, K., Conti-Ramsden, G., & Pickles, A. (2010).Growth of reading skills in children with a history of specificlanguage impairment: The role of autistic symptomatology andlanguage-related abilities. British Journal of DevelopmentalPsychology, 28, 109–131.
Conti-Ramsden, G., Simkin, Z., & Pickles, A. (2006). Estimatingfamilial loading in SLI: A comparison of direct assessmentversus parental interview. Journal of Speech, Language, andHearing Research, 49, 88–101.
Daniel, S. S., Walsh, A. K., Goldston, D. B., Arnold, E. M.,Reboussin, B. A., & Wood, F. B. (2006). Suicidality, schooldropout, and reading problems among adolescents. Journalof Learning Disabilities, 39, 507–514.
Davis, G. N., Lindo, E. J., & Compton, D. L. (2007). Childrenat risk for reading failure; constructing an early screeningmeasure. Teaching Exceptional Children, 39, 32–37.
Ehren, B. J., & Nelson, N. W. (2005). The responsiveness to inter-vention approach and language impairment. Topics in LanguageDisorders, 25, 120–131.
Enders, C. K. (2010). Applied missing data analysis. New York,NY: Guilford Press.
Feldt, L. S., & Brennan, R. L. (1989). Reliability. In R. L. Linn(Ed.), Educational measurement (3rd ed., pp. 104–146). New York,NY: Macmillan.
Fletcher, J. M., Shaywitz, S. E., Shankweiler, D. P., Katz, L.,Liberman, I. Y., Stuebing, K. K., . . . Shaywitz, B. A. (1994).Cognitive profiles of reading disability: Comparisons of dis-crepancy and low achievement definitions. Journal of Educa-tional Psychology, 86, 6–23.
Gersten, R., Compton, D., Connor, C. M., Dimino, J., Santoro, L.,Linan-Thompson, S., & Tilly, W. D. (2008). Assisting studentsstruggling with reading: Response to intervention and multi-tier intervention for reading in the primary grades. A practiceguide (NCEE 2009-4045). Washington, DC: National Centerfor Education Evaluation and Regional Assistance, Insti-tute of Education Sciences, U.S. Department of Education.Retrieved from http://ies.ed.gov/ncee/wwc/publications/practiceguides/
Good, R. H., & Kaminski, R. A. (Eds.). (2002). Dynamic Indica-tors of Basic Early Literacy Skills–Sixth Edition. Eugene, OR:Institute for the Development of Educational Achievement.Retrieved from http://dibels.uoregon.e
Guilford, J. P. (1954). Psychometric methods (2nd ed.). New York,NY: McGraw-Hill Education.
3520 Journal of Speech, Language, and Hearing Research • Vol. 60 •
Hendricks, A. E., & Adlof, S. M. (2017). Language assessmentwith children who speak nonmainstream dialects: Examiningthe effects of scoring modifications in norm-referenced assess-ment. Language, Speech, and Hearing Services in Schools, 48(3),168–182.
Hosmer, D. W., & Lemeshow, S. (2000). Applied logistic regression(2nd ed.). Hoboken, NJ: Wiley.
Jenkins, J. R., & Johnson, E. (n.d.). Universal screening for read-ing problems: Why and how should we do this. RTI actionnetwork. Retrieved from http://www.rtinetwork.org/essential/assessment/screening/readingproblems
Joanisse, M. F., Manis, F. R., Keating, P., & Seidenberg, M. S.(2000). Language deficits in dyslexic children: Speech percep-tion, phonology, and morphology. Journal of ExperimentalChild Psychology, 77, 30–60.
Johnson, C. J., Beitchman, J. H., & Brownlie, E. B. (2010).Twenty-year follow-up of children with and without speech-language impairments: Family, educational, occupational, andquality of life outcomes. American Journal of Speech-LanguagePathology, 19, 51–65.
Johnson, E. S., Pool, J. L., & Carter, D. R. (2011). Validity evi-dence for the Test of Silent Reading Efficiency and Compre-hension (TOSREC). Assessment for Effective Intervention, 37,50–57.
Kelso, K., Fletcher, J., & Lee, P. (2007). Reading comprehensionin children with specific language impairment: An examinationof two subgroups. International Journal of Language & Com-munication Disorders, 42, 39–57.
Laing, G. J., Law, J., Levin, A., & Logan, S. (2002). Evaluationof a structured test and a parent led method for screeningfor speech and language problems: Prospective populationbased study. BMJ, 325, 1152. https://doi.org/10.1136/bmj.325.7373.1152
Leach, J. M., Scarborough, H. S., & Rescorla, L. (2003). Late-emerging reading disabilities. Journal of Educational Psychol-ogy, 95, 211–224.
Leonard, L. B. (2014). Children with specific language impairment(2nd ed.) Cambridge, MA: MIT Press.
Lipka, O., Lesaux, N. K., & Siegel, L. S. (2006). Retrospectiveanalyses of the reading development of grade 4 students withreading disabilities: Risk status and profiles over 5 years.Journal of Learning Disabilities, 39, 364–378.
Little, R. J. (1988). A test of missing completely at random formultivariate data with missing values. Journal of the AmericanStatistical Association, 83, 1198–1202.
Lyon, G. R., Shaywitz, S. E., & Shaywitz, B. A. (2003). A defini-tion of dyslexia. Annals of Dyslexia, 53, 1–14.
Mather, N., Hammill, D. D., Allen, E. A., & Roberts, R.(2004). Test of Silent Word Reading Fluency. Austin, TX:Pro-Ed.
McArthur, G. M., Hogben, J. H., Edwards, V. T., Heath, S. M.,& Mengler, E. D. (2000). On the “specifics” of specific readingdisability and specific language impairment. Journal of ChildPsychology and Psychiatry, 41, 869–874.
Mugnaini, D., Lassi, S., La Malfa, G., & Albertini, G. (2009). In-ternalizing correlates of dyslexia. World Journal of Pediatrics,5, 255–264.
National Center for Education Statistics. (2015). Common core ofdata local education agency universe survey: School year 2013–2014 provisional data version 1a. U.S. Department of Educa-tion. Washington, DC: Author. Retrieved from https://nces.ed.gov/ccd/pubagency.asp
Nation, K., Clarke, P., Marshall, C. M., & Durand, M. (2004).Hidden language impairments in children: Parallels between
3507–3522 • December 2017

poor reading comprehension and specific language impairment.Journal of Speech, Language, and Hearing Research, 47, 199–211.
No Child Left Behind Act of 2001, Pub. L. No. 107-110, § 115,Stat. 1425 (2002).
Plank, S. B., & Condliffe, B. F. (2013). Pressures of the season:An examination of classroom quality and high-stakes account-ability. American Educational Research Journal, 50, 1152–1182.
Prelock, P. A., Hutchins, T., & Glascoe, F. P. (2008). Speech-language impairment: How to identify the most commonand least diagnosed disability of childhood. The MedscapeJournal of Medicine, 10(6), 136.
Ramus, F., Marshall, C. R., Rosen, S., & van der Lely, H. K.(2013). Phonological deficits in specific language impairmentand developmental dyslexia: Towards a multidimensionalmodel. Brain, 136, 630–645.
Ransby, M. J., & Swanson, H. (2003). Reading comprehensionskills of young adults with childhood diagnoses of dyslexia.Journal of Learning Disabilities, 36, 538–555.
Reschly, D. J. (2014). Response to intervention and the identifica-tion of specific learning disabilities. Topics in Language Dis-orders, 34, 39–58.
Rice, M. L. (2014). Advocating for SLI. Commentary on Bishop,D. V. M., 2014, Ten questions about terminology for childrenwith unexplained language problems. International Journalof Language and Communication Disorders, 49, 381–415.
Rice, M. L. (2016). Specific language impairment, nonverbal IQ,attention-deficit/hyperactivity disorder, autism spectrum dis-order, cochlear implants, bilingualism, and dialectal variants:Defining the boundaries, clarifying clinical conditions, andsorting out causes. Journal of Speech, Language, and HearingResearch, 59, 122–132.
SAS Institute Inc. (2013). SAS/STAT ® 9.4 Software. Cary, NC:SAS Institute Inc.
Schatschneider, C. (2013). I am ROC curves (and so can you).In Y. Petscher, C. Schatschnieder, & D. Compton (Eds.),Applied quantitative analysis in education and the social sci-ences (pp. 65–92). New York, NY: Routledge.
Semel, E., Wiig, E. H., & Secord, W. A. (2004). Clinical Evalua-tion of Language Fundamentals–Fourth Edition (CELF-4).San Antonio, TX: Harcourt.
Seymour, H. N., Roeper, T., & de Villiers, J. G. (2003). DiagnosticEvaluation of Language Variation–Screening Test. Bloomington,MN: Pearson.
Shaywitz, S. E., Shaywitz, B. A., Fletcher, J. M., & Escobar,M. D. (1990). Prevalence of reading disability in boys andgirls: Results of the Connecticut Longitudinal Study. Journalof the American Medical Association, 264, 998–1002.
Siegel, L. S. (2008). Morphological awareness skills of Englishlanguage learners and children with dyslexia. Topics in Lan-guage Disorders, 28, 15–27.
Smolkowski, K., & Cummings, K. D. (2015). Evaluation of theDIBELS diagnostic system for the selection of native and
proficient English speakers at risk of reading difficulties. Jour-nal of Psychoeducational Assessment, 34, 103–118.
Snowling, M., Bishop, D. V. M., & Stothard, S. E. (2000). Ispreschool language impairment a risk factor for dyslexia inadolescence? Journal of Child Psychology and Psychiatry, 41,587–600.
Snowling, M. J., Muter, V., & Carroll, J. (2007). Children at fam-ily risk of dyslexia: A follow-up in early adolescence. Journalof Child Psychology and Psychiatry, 48, 609–618.
South Carolina Department of Education. (2017). E-rate free andreduced meal eligibility data file 2013–2014. Columbia, SC:South Carolina Department of Education. Retrieved from http://ed.sc.gov/districts-schools/nutrition/meal-programs/national-school-lunch-program/e-rate-free-and-reduced-meal-eligibility-data/
Spencer, M., Quinn, J. M., & Wagner, R. K. (2014). Specificreading comprehension disability: Major problem, myth,or misnomer? Learning Disabilities Research & Practice, 29,3–9.
Tomblin, J. B., Records, N. L., Buckwalter, P., Zhang, X.,Smith, E., & O’Brien, M. (1997). Prevalence of specific lan-guage impairment in kindergarten children. Journal of Speech,Language, and Hearing Research, 40, 1245–1260.
Tomblin, J. B., Zhang, X., Buckwalter, P., & O’Brien, M. (2003).The stability of primary language disorder four years afterkindergarten diagnosis. Journal of Speech, Language, andHearing Research, 46, 1283–1296.
Vellutino, F. R., Fletcher, J. M., Snowling, M. J., & Scanlon,D. M. (2004). Specific reading disability (dyslexia): Whathave we learned in the past four decades? Journal of ChildPsychology and Psychiatry, 45, 2–40.
Wagner, R. K., Torgesen, J. K., Rashotte, C. A., & Pearson, N. A.(2010). Test of Silent Reading Efficiency and Comprehension.Austin, TX: Pro-Ed.
Whitworth, A., Davies, C., Stokes, S., & Blain, T. (1993). Iden-tification of communication impairments in preschoolers: Acomparison of parent and teacher success. Australian Journalof Human Communication Disorders, 21, 112–123.
Wiig, E. H., Semel, E., & Secord, W. A. (2013). Clinical Evaluationof Language Fundamentals–Fifth Edition (CELF-5). Bloomington,MN: NCS Pearson.
Williams, K. T. (2001). Group Reading Assessment and DiagnosticEvaluation. Circle Pines, MN: American Guidance Service.
Wood, F. B. (2013). Predictive Assessment of Reading: Technicalmanual. Winston Salem, NC: Wake Forest School of Medi-cine. Retrieved from http://www.redesetgrow.com/wp-content/uploads/PAR2BTechManual.pdf
Wood, F. B., Hill, D. F., Meyer, M. S., & Flowers, D. L. (2005).Predictive Assessment of Reading. Annals of Dyslexia, 55,193–216.
Woodcock, R. W. (2011). Woodcock Reading Mastery Tests–ThirdEdition (WRMT-III). Bloomington, MN: Pearson.
Adlof et al.: Classroom Screens for LI and Dyslexia 3521

Appendix
Process of determining language impairment (LI) status for participants who spoke nonmainstream American Englishdialects (NMAE) versus mainstream American English dialects (MAE). Children with CELF-4 standard scores of ≤ 85 com-pleted the DELV-ST to determine language variation status and obtain dialect-neutral screen of LI risk status, if needed. Chil-dren who spoke MAE according to the DELV-ST were classified as LI if they scored ≤ 1 SD below the mean on the CELF-4.Children who showed “some” or “strong” variation from MAE (DELV-ST Part I) were only classified as LI if (a) they alsoshowed medium-high to high risk for LI (DELV-ST Part II) or (b) their CELF-4 standard score remained ≤ 85 after applyingscoring modifications, as recommended by the CELF-4 manual. Scoring modifications were also applied for five individuals whodid not complete the DELV-ST. CELF-4 = Clinical Evaluation of Language Fundamentals–Fourth Edition; DELV-ST = DiagnosticEvaluation of Language Variation–Screening Test; SS = standard score.
3522 Journal of Speech, Language, and Hearing Research • Vol. 60 • 3507–3522 • December 2017