Identifying appropriate land-use mix measures for use in a ...
20
Abstract: Walkability indices can guide planning and policy for more sustainable and liveble cities. Land-use mix is an important component of walkability that can be measured in a number of ways. Many land- use mix measures require fine-scaled land-use data that are not always available, especially when analyzing walkability across larger geographic extents. This study investigated the feasibility of calculating a national walkability index in Australia, using metropolitan Melbourne as a case study. The study focused on the dual challenges of selecting an appro- priate measure of land-use mix and identifying an appropriate land-use data source. We calculated an entropy land-use mix measure with three differ- ent Australian land-use datasets. Our comparison of the resulting land- use mix measures highlighted the differences in the land-use datasets and led to our conclusion that none of the three land-use datasets was appropriate for use in a national land-use mix measure. Therefore, we also developed two new exploratory “intensity” measures of land use — daily living and local living — that were able to be calculated na- tionally with readily available data. Modelled associations with trans- port walking and comparisons with the entropy land-use mix measures indicate that these new measures were appropriate for assessing na- tional land use in a national walkability index. Identifying appropriate land-use mix measures for use in a national walkability index Article history: Received: December 12, 2016 Received in revised form: February 1, 2018 Accepted: May 18, 2018 Available online: October 10, 2018 Copyright 2018 Suzanne Mavoa, Claire Boulangé, Serryn Eagleson, Joshua Stewart, Hannah M Badland, Billie Giles-Corti, Lucy Gunn http://dx.doi.org/10.5198/jtlu.2018.1132 ISSN: 1938-7849 | Licensed under the Creative Commons Attribution – Noncommercial License 4.0 e Journal of Transport and Land Use is the official journal of the World Society for Transport and Land Use (WSTLUR) and is published and sponsored by the University of Minnesota Center for Transportation Studies. T J T L U http://jtlu.org V. 11 N. 1 [2018] pp. 681–700 Suzanne Mavoa (corresponding author) University of Melbourne [email protected] Serryn Eagleson University of Melbourne [email protected] Hannah M Badland Royal Melbourne Institute of Technology [email protected] Lucy Gunn Royal Melbourne Institute of Technology [email protected] Claire Boulangé Royal Melbourne Institute of Technology [email protected] Joshua Stewart Victorian Department of Economic Development, Jobs, Transport and Resources, Melbourne [email protected] Billie Giles-Corti Royal Melbourne Institute of Technology [email protected]
-
Upload
khangminh22 -
Category
Documents
-
view
1 -
download
0
Transcript of Identifying appropriate land-use mix measures for use in a ...

Abstract: Walkability indices can guide planning and policy for more sustainable and liveble cities. Land-use mix is an important component of walkability that can be measured in a number of ways. Many land-use mix measures require fine-scaled land-use data that are not always available, especially when analyzing walkability across larger geographic extents.
This study investigated the feasibility of calculating a national walkability index in Australia, using metropolitan Melbourne as a case study. The study focused on the dual challenges of selecting an appro-priate measure of land-use mix and identifying an appropriate land-use data source.
We calculated an entropy land-use mix measure with three differ-ent Australian land-use datasets. Our comparison of the resulting land-use mix measures highlighted the differences in the land-use datasets and led to our conclusion that none of the three land-use datasets was appropriate for use in a national land-use mix measure. Therefore, we also developed two new exploratory “intensity” measures of land use — daily living and local living — that were able to be calculated na-tionally with readily available data. Modelled associations with trans-port walking and comparisons with the entropy land-use mix measures indicate that these new measures were appropriate for assessing na-tional land use in a national walkability index.
Identifying appropriate land-use mix measures for use in a national walkability index
Article history:Received: December 12, 2016Received in revised form: February 1, 2018Accepted: May 18, 2018Available online: October 10, 2018
Copyright 2018 Suzanne Mavoa, Claire Boulangé, Serryn Eagleson, Joshua Stewart, Hannah M Badland, Billie Giles-Corti, Lucy Gunnhttp://dx.doi.org/10.5198/jtlu.2018.1132ISSN: 1938-7849 | Licensed under the Creative Commons Attribution – Noncommercial License 4.0
The Journal of Transport and Land Use is the official journal of the World Society for Transport and Land Use (WSTLUR) and is published and sponsored by the University of Minnesota Center for Transportation Studies.
T J T L U http://jtlu.orgV. 11 N. 1 [2018] pp. 681–700
Suzanne Mavoa (corresponding author)University of [email protected]
Serryn EaglesonUniversity of [email protected]
Hannah M BadlandRoyal Melbourne Institute of [email protected]
Lucy GunnRoyal Melbourne Institute of [email protected]
Claire BoulangéRoyal Melbourne Institute of Technology [email protected]
Joshua StewartVictorian Department of Economic Development, Jobs, Transport and Resources, [email protected]
Billie Giles-CortiRoyal Melbourne Institute of [email protected]

682 JOURNAL OF TRANSPORT AND LAND USE 11.1
1 Introduction
Substantial evidence that neighborhoods with higher densities, mixed land uses, and more connected streets are associated with higher levels of walking for transport (Sallis, Floyd, Rodríguez, & Saelens, 2012). Neighborhood characteristics that support walking - residential density, land-use mix and street connectivity — are often combined into composite walkability indices (Owen et al., 2007; Frank et al., 2010; Christian et al., 2011; Witten et al., 2012; Mayne et al., 2013). Recently the frequently used “walkability index” (Frank et al., 2010) was successfully applied in examining associations between the built environment and health across 17 cities in 14 countries (Adams et al., 2014). Comparisons of many cities across diverse countries such as this are extremely helpful for confirming the relationship be-tween urban design and active transport. The study also provided insights as to whether the walkability index could be generalized, and under what circumstances.
While the walkability index is widely and successfully used, it can be problematic to produce. In some countries such as Australia it is difficult to find a nationally consistent land-use dataset that can be used to develop the land-use measure. This makes exploring built environment similarities and differ-ences within and between cities within the same country challenging (Giles-Corti et al., 2014). There is also scope for improvement in the index, particularly in its interpretation. The land-use component is complex, often not readily understood by policy makers, and does not provide insights into which types of land uses would encourage more walking.
Nonetheless, a walkability index can identify inequities across cities and guide local and state urban planning investments (World Health Organization, 2010). Within Australia policy-makers and plan-ners are increasingly interested in the sustainability and livability of cities (Western Australian Planning Commission, 2007; Major Cities Unit, 2011; Department of Planning and Environment, 2014; State of Victoria, 2014). Increasing the walkability of a neighborhood or city can contribute to reaching these objectives (Hooper, Giles-Corti, & Knuiman, 2014). The availability of a walkability index created us-ing comparable data would facilitate national built environment and health research, and enable neigh-borhoods and cities within the country to be benchmarked, compared and monitored. The Australian National Livability Study, funded by The Australian Prevention Partnership Centre cre-ated an opportunity to develop a national transport-specific walkability index for use in all Australian capital cities relevant to transport-related walking behaviors (Giles-Corti et al., 2014). The study pro-posed using a walkability index common in population health (Frank et al., 2010; Christian et al., 2011), which has been associated with walking for transport in Australian adults in selected neigh-borhoods from a limited number of cities (Owen et al., 2007; Christian et al., 2011; Mayne et al., 2013). Two of the three walkability components used in these indices — dwelling density and street connectivity — could be replicated easily using existing national Australian spatial data (i.e., dwelling counts from the Australian Bureau of Statistics, and road network data currently available from a range of sources such as PSMA Australia) (Giles-Corti et al., 2014). The third component of the walkability index — land-use mix — was challenged by the lack of nationally consistent land-use data, and the limitations of the commonly used entropy land-use mix method. The Australian Collaborative Land Use and Management Program (ACLUMP) is a consortium of Australian Government, and state and territory government partners that promotes the development of nationally consistent land-use data for Australia (The Australian Collaborative Land Use and Management Program, 2015). However, this focuses on agricultural land uses, and does not provide urban data at a sufficiently high resolution for the calculation of walkability indices. Urban focused land-use data are generally available in some form from local, state, and federal government departments. Unfortunately these datasets: are not standard-ized across (and sometimes within) Australian states and territories; can be challenging to source; often require a large amount of cleaning and processing before use; and land zoning data available through
683Identifying appropriate land-use mix measures for use in a national walkability index
planning schemes do not necessarily represent current land use. A readily accessible and suitable national land-use dataset is therefore an unmet need for calculating walkability indices across Australian cities. Regularly collected data would be ideal, allowing for measures to be re-calculated and tracked over time.
In addition to challenges presented by the lack of land-use data, the measure of land-use mix com-monly used in the walkability index has a number of limitations. The walkability index uses an entropy land-use mix method- based on Shannon’s Diversity Index (Frank et al., 2010; Christian et al., 2011). The measure is further detailed in the methods section of this manuscript. One notable limitation is that it assesses the relative proportion of different land uses, rather than distinguishing between the types of land uses. For example, an area with 50% residential and 50% recreational land use would score the same as an area with 50% retail and 50% commercial. Or, an area with 10% residential and 90% retail would score the same as an area with 90% residential and 10% retail (Hess, Moudon, & Logsdon, 2001; Brown et al., 2009; Yamada et al., 2012). As Manaugh and Kreider (2013) argue, there is a lack of theory and evidence around the implicit assumption that an even land-use distribution is superior to an uneven distribution. The entropy measure also does not assess the interaction between land uses, for example whether they are contiguous or separate (Hess et al., 2001; Manaugh & Kreider, 2013). Brown et al. (2009) describe further limitations of the entropy measure that include potential masking of qualitative differences in walkability, the “missing land-use problem” where land uses are present in an area but not included in the entropy score can result in mis-assessment of the true walkability, and that an entropy land-use measure may not adequately assess land-use mix if only a small number of land uses are included. Further, a land-use mix score of 0-1 is difficult for urban planners and designers to interpret and apply to create more walkable neighborhoods.
Given the limitations associated with the entropy-based land-use mix measure alternate measures of land-use mix are worth considering. Indeed, there are multiple methods for measuring land-use mix in common use (Brown et al., 2009; Brownson, Hoehner, Day, & Forsyth, 2009; Song & Rodríguez, 2005; Song, Merlin, & Rodríguez, 2013), with measures categorized as measures of “accessibility”, “in-tensity”, or “patterns” (Song & Rodriguez, 2005). Accessibility land-use mix measures assess the ease with which residents can reach mixed land-use activities; intensity measures assess the volume or mag-nitude of mixed-land uses, and pattern measures — of which the entropy index is an example - assess the evenness of land uses in an area (Song & Rodríguez, 2005). Notably, as Gehrke and Clifton (2014) point out, whether or not accessibility and intensity are considered to be measures of land-use mix, de-pends on the definition of land-use mix being considered. This highlights that the subtle differences in land-use mix definitions have resulted in conceptually different measures.
Previous research assessing different land-use mix measures points towards the potential of alter-nate, simpler measures. Lee and Moudon (2006) demonstrated that distance measures to daily destina-tions (an accessibility measure) are simple and effective alternatives to more complex measures of land-use mix and connectivity. A later study comparing different land-use measures and the relationship with BMI, overweight, and obesity demonstrated that the presence of walkable land uses was more important for the walkability of neighborhood than the entropy score of land-use mix (Brown et al., 2009), which measures evenness of land uses. Indeed, from an individual’s perspective the presence of somewhere to walk to is more directly related to the decision to walk for transport, than an abstract measure of the balance of land uses. Similarly, direct measures are easy to translate into policies and interventions (Lee & Moudon, 2006), which makes it easier when communicating findings to policy-makers and practi-tioners.
Accordingly, our study had two aims: 1) to identify a land-use dataset that was appropriate for use in a national transport-specific walkability index; and 2) to develop a simpler, alternate measure of land-use mix relevant to walking for transport behaviors that focuses on the presence of walkable land uses and has reduced data requirements. This study compared three land-use datasets using the standard
684 JOURNAL OF TRANSPORT AND LAND USE 11.1
entropy “pattern” land-use mix measure and developed two new destination-based “intensity” measures of land use. We examined the associations between the different land-use measures and walking for transport.
2 Methods
2.1 VISTA
Demographic and walking data were sourced from the 2009/2010 Victorian Integrated Survey of Travel and Activity (VISTA). VISTA is a one-day household travel survey administered by the Victorian De-partment of Economic Development, Jobs, Transport, and Resources across Victoria, Australia. The sur-vey recorded socio-demographic information for a household and its residents. It also captured all self-reported travel made by individuals on a survey day, including trips, mode of travel, distance travelled, and trip origins and destinations. Data custodians generated the latitude and longitude of residential addresses, and trip origin and destination locations. To protect privacy the coordinates of the residential addresses were randomly offset from the actual household location by 0 – 70 m (The Urban Transport Institute, 2011).
VISTA adult participants (aged 18 years and over) residing in urban Metropolitan Melbourne were selected for this analysis using the Sections of State (Australian Bureau of Statistics, 2011a) and Metro-politan Boundary (State of Victoria, 2014) classifications. We focused on urban participants only as the walkability index has been theorized and previously tested for use in urban contexts (Giles-Corti et al., 2014). Our final sample excluded participants who did not undertake any travel (regardless of mode) within their residential neighborhood during the survey period (n=16,890), as they were potentially lim-ited by factors unrelated to characteristics of the neighborhood built environment (e.g., illness, injury).
Consistent with previous Australian research (Christian et al., 2011), and for the purpose of catego-rizing neighborhood trips, the residential neighborhood was defined as a 1600 m road network buffer created around the residential address. The road network buffer was calculated in ArcGIS v 10.2 (ESRI, Redlands) using a street network dataset sourced from VicMap Transport (Department of Sustainability and Environment, 2012d) with non-walkable roads, such as highways and on and off-ramps, removed prior to analysis.
The (then) Victorian Department of Transport and the University of Melbourne Human Ethics Advisory Group approved use of the VISTA data. Informed consent was obtained from all study par-ticipants.
2.2 Walking for transport
Since the study was interested in transport walking only, the outcome measure was a binary classification of “any” or “no” walking for transport in the neighborhood. As we were testing and comparing walk-ability indices generated around a person’s home, only trips undertaken in the residential neighborhood were included. VISTA categorized trips based on the destination and purpose, which we used to identify likely walking for transport trips. Trips and/or destinations (that were unlikely to be for the purposes of walking for transport were excluded. The trip exclusion criteria were: trip purpose = walking the dog; or trip purpose = other recreation and the destination = park or forest or lake/reservoir or bay/beach or river/creek.
Geocoded residential addresses and trip start and end points were imported into ArcGIS. The Or-igin-Destination function in the ArcGIS Network Analyst extension was used to calculate the walkable road network distance from every residential address to every trip segment start and end point. Custom R scripts calculated the number of walking for transport trip segments that started and/or ended within

685Identifying appropriate land-use mix measures for use in a national walkability index
1600 m of the residential address for each participant. Neighborhoods were categorized as having any (≥1) or no (=0) walking for transport trips.
2.3 Residential neighborhood classification
This study calculated walkability indices at the 1600 m scale for each participant. This scale was chosen based on previous research in Australia (Learnihan, Van Niel, Giles-Corti, & Knuiman, 2011; Villan-ueva et al., 2014) and a transport planning rule of thumb where 1600 m represents 20 minutes spent walking (Daniels & Mulley, 2013). Residential neighborhoods were created by calculating pedestrian road network buffers around residential addresses.
2.4 Neighborhood disadvantage
A measure of the Australian Bureau of Statistics 2011 Index of Socioeconomic Relative Disadvantage (IRSD) was assigned to each household based on the statistical area 1 (SA1) where the household was located (Australian Bureau of Statistics, 2011d).
2.5 Spatial measures
2.5.1 Transport-specific walkability indicesAll three transport-specific walkability indices were calculated using the same formula, but used data from three different sources (described below).
2.5.2 Dwelling densityGross dwelling density for all three walkability indices was calculated by dividing the number of dwell-ings (Australian Bureau of Statistics, 2011c) by the neighborhood area in hectares.
2.5.3 Street connectivityStreet connectivity for all three walkability indices was calculated by dividing the number of 3-or-more-way intersections by the neighborhood area in square kilometers. Intersections were derived from the road network (VicMap Transport, 2012).
2.5.4 Land useThree measures of entropy land-use mix — a “pattern” measure of land-use mix — were calculated us-ing three different land-use datasets: “bench mark” from Victorian Valuer General Office (VGO) data, and “custom” and “meshblock” data from the Australian Bureau of Statistics (ABS). The latter two were chosen because of their national coverage. All are described in detail in the following section.
Land-use categories in each dataset were classified into four or five land-use categories of interest. Ideally we would have used five land-use classes in all cases, however, lack of data prevented this when using the “meshblock” data source. These categories were selected based on previous Australian research where an entropy land-use mix measure that includes residential, retail, commercial, civic, and recre-ation uses was more strongly associated with walking for transport in adults (Christian et al., 2011). Therefore, while public open space is sometimes included in land-use mix measures, we excluded it from our transport-walking specific entropy land-use mix measure. Other research has also excluded specific land uses from entropy land-use mix measures (Duncan et al., 2010). Land classifications not falling into one of the nominated categories (e.g., industrial, agricultural) were excluded from land-use mix calculations. The area of each land-use category in each participant’s neighborhood was calculated in ArcGIS. Land-use mix was calculated using an entropy formula derived from the Shannon index
686 JOURNAL OF TRANSPORT AND LAND USE 11.1
(Shannon & Weaver, 1949) based on that used by Frank, Schmid, Sallis, Chapman, & Saelens (2005):
Where LUM is the land-use mix score, pi is the proportion of the neighborhood covered by the land use i against the summed area for land-use categories of interest, and n is the number of land-use categories of interest. A land-use mix score of 1 indicates the highest mix possible, and is considered “most walkable”. In contrast a score of 0 indicates the area contains a single land use, which is considered the “least walkable.”
The three walkability components were standardized using a z-score, and then summed to create the three walkability indices.
2.5.5 “Bench mark” datasetThe “bench mark” land-use dataset was created using 2010 data supplied by the VGO. This dataset is difficult to obtain nationally and unavailable in some areas. In Victoria, the dataset is compiled from valuation information collected by each of the 79 local government authorities into a state-wide prop-erty database. This process is conducted every two years. VGO data were provided for Victoria at the property-level, using the Australian Valuation Property Classification Code (AVPCC) (Department of Sustainability and Environment, 2012a). The APVCC in addition to Site Value, Capital Improved Value and Net Annual Value forms part of every property valuation in accordance with the Valuation of Land Act 1960. The AVPCC codes provide a single classification for each property (e.g., aged care com-plex, disability housing, amusement park, health clinic) with the complete list and specifications avail-able from the Victorian Department of Planning and Local Infrastructure (Department of Sustainability and Environment, 2012a). The following steps were taken to prepare the VGO data for this study:
1. The AVPCC codes were reclassified to align with the five land uses of interest: retail, commer-cial, civic, recreation (excluding public open space), and residential. Where there were multiple land uses on a land parcel, a single land use was assigned based on a priority order specified above. This follows the approaches taken by Christian et al. (2011) and Giles-Corti et al. (2014).
2. Properties that were not classified as one of the five land uses of interest were excluded from subsequent analyses.
2.5.6 “Custom” datasetA customized parcel-level land-use dataset was created using a combination of parcel boundaries (De-partment of Sustainability and Environment, 2012c), zoning data (Department of Sustainability and Environment, 2012b), and geocoded business points data (Pitney Bowes Ltd, 2014). These data are readily available nationally, with the business points obtainable on a fee-for-service basis.
1. The derived land-use layer was created following a similar process to that described by Leslie et al. (2007). The steps were:
2. Zoning data were categorized into the five identified land-use categories (residential, retail, com-mercial, industrial, or “other”) based on the zoning codes. Each land parcel was assigned the land-use category of the zone it was located in. Zones represent the types of land uses that could potentially be located in an area, but do not necessarily represent what is actually in an area.
3. Business points — which represent actual land uses — were coded in accordance with the Australian National Standard Information Code (ANZSIC) associated with each point. Busi-ness points categorized as “other” were removed from the subsequent analyses. The ANZSIC

687Identifying appropriate land-use mix measures for use in a national walkability index
classification has been developed by statistics and taxation agencies in Australia and New Zea-land for the production of industry statistics, and aims to align with the International Standard Industrial Classification of All Economic Activities.
4. To better represent actual land use, parcels that contained one of the remaining business points were re-classified to the land-use category of the business point. Parcels that contained more than one of the remaining business points (i.e., if there was more than one business located on a land parcel) were re-classified based on the same priority used when creating the VGO land-use dataset.
2.5.7 “Meshblock” datasetThe final land-use dataset was generated from 2011 meshblock data derived from the ABS. Meshblocks are the smallest national unit for statistical geography in Australia and most populated meshblocks con-tain between 30 and 60 dwellings (Australian Bureau of Statistics, 2011a). The ABS uses the dominant land use to assign one of ten categories to each meshblock: water, parkland, residential, industrial, com-mercial (includes retail), education, hospital/medical, agricultural, transport, other (Australian Bureau of Statistics, 2012).
The meshblock dataset used in analyses was created from four land uses identified as relevant: com-mercial, civic (comprising education and hospital/medical), industrial, and residential. Direct alignment with the remaining land-use categories used for the other two datasets was not possible.
2.6 Comparison of land-use datasets
Table 1 compares how the land uses are assigned categories for each of the three datasets. This table also shows that, within the Metropolitan Melbourne study area, the overall areas for each land-use category differ substantially for the three datasets. Similarly, Table 1 also shows that the areas of the land uses within individual participants 1600 m buffers differ substantially. Notably, the benchmark and custom land-use datasets are relatively similar with key differences in commercial and civic land uses. The mesh-block dataset is substantially different, reflecting the coarse scale that land uses are defined at, as well, as a coarser land use categorization.
Table 1: Comparison of land-use areas (Ha) in metropolitan Melbourne (MM) and participant 1600 m buffers for the three land-use datasets1
Land-use category Land-use datasets
Benchmark Custom Meshblock
MM areatotal
Participantmean (SD)
MM area total
Participantmean (SD)
MM areatotal
Participantmean (SD)
Residential 3517.7 252.0(23.7)
2657.6 208.1 (262.7) 1707.5 316.4 (186.4)
RetailCommercial
75.348.7
8.0 (11.6)16.4 (23.7)
105.7222.6
28.3 (53.6)7.8 (29.5)
568.52NA2
32.6 (25.7)NA
Civic 102.1 14.1 (31.8) 53.0 11.0 (19.8) 62.0 17.5 (110.1)
Recreation3 78.1 4.0 (11.5) 68.3 5.2 (13.0) NA NA
Excluded4 1180.1 145.7 (854.5)
2601.7 4155.4
1 Total land area of Metropolitan Melbourne considered in this study was 8,824.0 km.22The meshblock dataset includes commercial and retail land uses in a single category.3Excluding public open space.4Area in excluded land uses. This includes water and road.

688 JOURNAL OF TRANSPORT AND LAND USE 11.1
Differences in land use representation between the datasets are further demonstrated for an area in an inner Melbourne suburb (Figure 1) and Melbourne central business district (CBD) (Figure 2). The bench mark and custom land-use datasets are finer-grained as they relied on point or property level data, while the meshblock dataset used area level data. All datasets revealed the same general geographic pat-terns including the main commercial and residential areas. However, Figure 2 shows that the meshblock dataset does not adequately capture the mixture of land uses in the CBD.
a)
b)
c)
≤
0 0.5 10.25km
LegendRetail
Commercial
Civic
Recreation
Retail/Commercial
Residential
Figure 1: Comparison of land use representations of: a) bench mark; b) custom; and c) meshblock land-use datasets in an inner Melbourne suburb. “Recreation” = Parkland in the meshblock dataset.
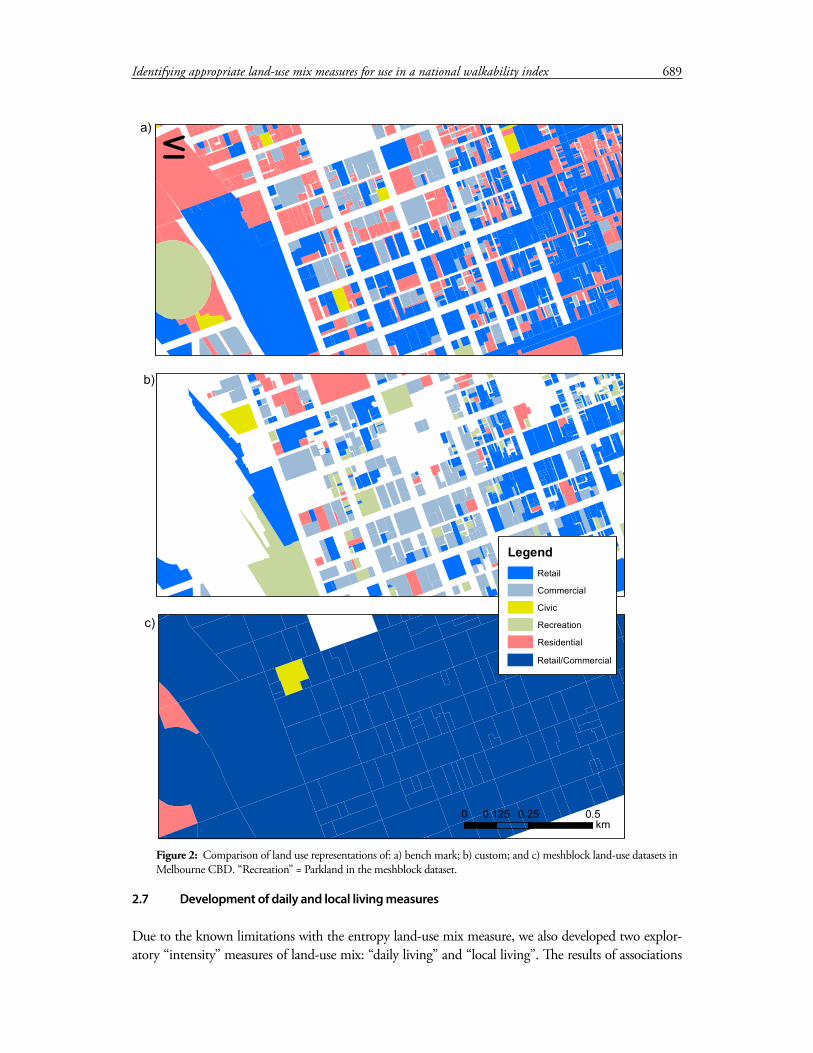
689Identifying appropriate land-use mix measures for use in a national walkability index
a)
b)
c)
≤
0 0.25 0.50.125km
LegendRetail
Commercial
Civic
Recreation
Retail/Commercial
Residential
2.7 Development of daily and local living measures
Due to the known limitations with the entropy land-use mix measure, we also developed two explor-atory “intensity” measures of land-use mix: “daily living” and “local living”. The results of associations
Figure 2: Comparison of land use representations of: a) bench mark; b) custom; and c) meshblock land-use datasets in Melbourne CBD. “Recreation” = Parkland in the meshblock dataset.
690 JOURNAL OF TRANSPORT AND LAND USE 11.1
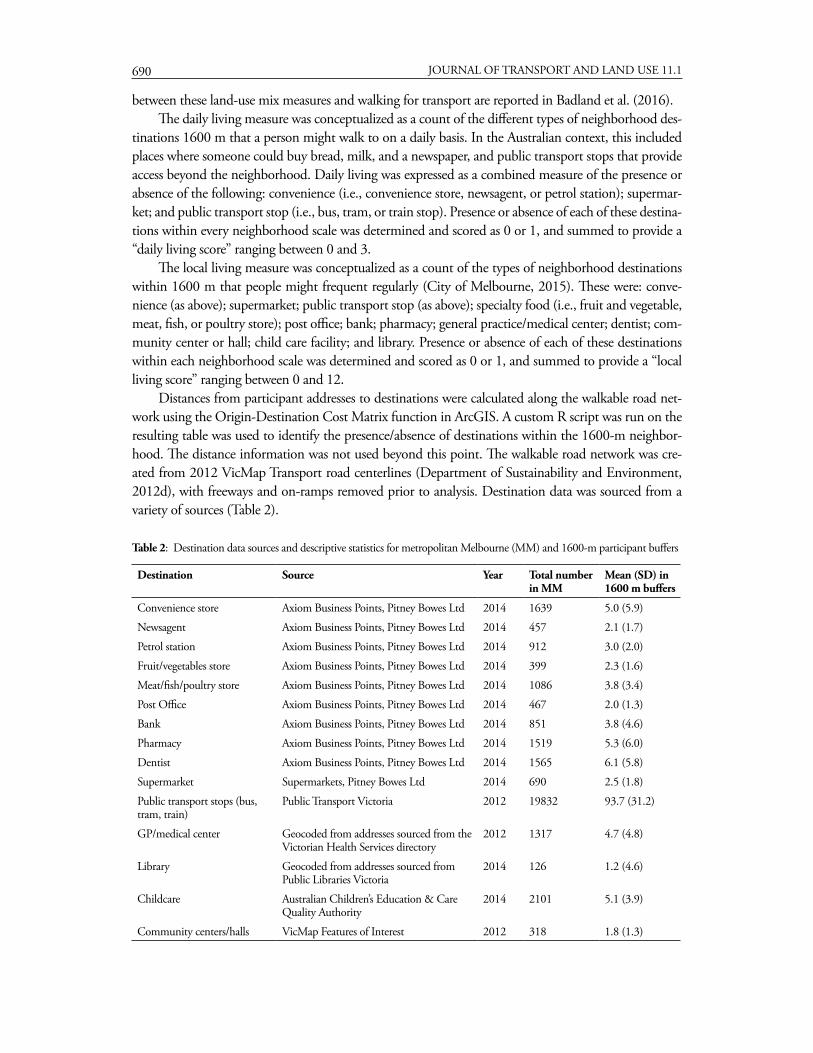
between these land-use mix measures and walking for transport are reported in Badland et al. (2016).The daily living measure was conceptualized as a count of the different types of neighborhood des-
tinations 1600 m that a person might walk to on a daily basis. In the Australian context, this included places where someone could buy bread, milk, and a newspaper, and public transport stops that provide access beyond the neighborhood. Daily living was expressed as a combined measure of the presence or absence of the following: convenience (i.e., convenience store, newsagent, or petrol station); supermar-ket; and public transport stop (i.e., bus, tram, or train stop). Presence or absence of each of these destina-tions within every neighborhood scale was determined and scored as 0 or 1, and summed to provide a “daily living score” ranging between 0 and 3.
The local living measure was conceptualized as a count of the types of neighborhood destinations within 1600 m that people might frequent regularly (City of Melbourne, 2015). These were: conve-nience (as above); supermarket; public transport stop (as above); specialty food (i.e., fruit and vegetable, meat, fish, or poultry store); post office; bank; pharmacy; general practice/medical center; dentist; com-munity center or hall; child care facility; and library. Presence or absence of each of these destinations within each neighborhood scale was determined and scored as 0 or 1, and summed to provide a “local living score” ranging between 0 and 12.
Distances from participant addresses to destinations were calculated along the walkable road net-work using the Origin-Destination Cost Matrix function in ArcGIS. A custom R script was run on the resulting table was used to identify the presence/absence of destinations within the 1600-m neighbor-hood. The distance information was not used beyond this point. The walkable road network was cre-ated from 2012 VicMap Transport road centerlines (Department of Sustainability and Environment, 2012d), with freeways and on-ramps removed prior to analysis. Destination data was sourced from a variety of sources (Table 2).
Table 2: Destination data sources and descriptive statistics for metropolitan Melbourne (MM) and 1600-m participant buffers
Destination Source Year Total number in MM
Mean (SD) in 1600 m buffers
Convenience store Axiom Business Points, Pitney Bowes Ltd 2014 1639 5.0 (5.9)
Newsagent Axiom Business Points, Pitney Bowes Ltd 2014 457 2.1 (1.7)
Petrol station Axiom Business Points, Pitney Bowes Ltd 2014 912 3.0 (2.0)
Fruit/vegetables store Axiom Business Points, Pitney Bowes Ltd 2014 399 2.3 (1.6)
Meat/fish/poultry store Axiom Business Points, Pitney Bowes Ltd 2014 1086 3.8 (3.4)
Post Office Axiom Business Points, Pitney Bowes Ltd 2014 467 2.0 (1.3)
Bank Axiom Business Points, Pitney Bowes Ltd 2014 851 3.8 (4.6)
Pharmacy Axiom Business Points, Pitney Bowes Ltd 2014 1519 5.3 (6.0)
Dentist Axiom Business Points, Pitney Bowes Ltd 2014 1565 6.1 (5.8)
Supermarket Supermarkets, Pitney Bowes Ltd 2014 690 2.5 (1.8)
Public transport stops (bus, tram, train)
Public Transport Victoria 2012 19832 93.7 (31.2)
GP/medical center Geocoded from addresses sourced from the Victorian Health Services directory
2012 1317 4.7 (4.8)
Library Geocoded from addresses sourced from Public Libraries Victoria
2014 126 1.2 (4.6)
Childcare Australian Children’s Education & Care Quality Authority
2014 2101 5.1 (3.9)
Community centers/halls VicMap Features of Interest 2012 318 1.8 (1.3)

691Identifying appropriate land-use mix measures for use in a national walkability index
2.8 Statistical analysis
The agreement between the spatial measures was assessed with Spearman correlations. The land use and destination measures were standardized (i.e., divided by the standard deviation) to enable comparison. Demographic differences between neighborhood travelers and neighborhood walkers were assessed us-ing t-tests.
Due to the nested structure of the VISTA dataset — with participants located within households and statistical areas — m logistic regression models were used to evaluate the association between the three walkability components — dwelling density, street connectivity and land-use mix — and the odds of an adult undertaking at least one walking for transport trip within the residential neighborhood on the survey day. A separate model was run for each combination of the five land-use/destination mea-sures. The models were adjusted for sex, age, household structure, household income, employment status, study status, whether an individual has a license to drive a vehicle, household vehicle availability, survey day of week (weekend or weekday), and neighborhood disadvantage. Results from the logistic regression models are presented as estimated odds ratios (OR). Analyses were conducted using Stata IC v.13.0 (StataCorp LP, Texas, USA).
3 Results
The final sample of travelers consisted of 16,890 adults aged 18 years and over residing in Metropolitan Melbourne who made at least one trip (regardless of mode) within their residential neighborhood on survey day. Of these, 3,505 made at least one walking for transport trip within 1,600 m of their home address. Characteristics of the population sample were presented in Badland, Mavoa et al. (2016). Table 3 compares the sample and spatial characteristics at 1,600 m of all travelers and those who walked for transport. Living in neighborhoods characterized by higher average dwelling density, street connectivity, land-use mix (all three versions), daily living scores, and local living scores was associated with residents walking for transport.
Table 3: Characteristics of sample and spatial measures for the study sample and neighborhood transport walkers at 1600 m
Neighborhood travelersn = 16,890 (sample used in
the analysis)
Neighborhood transport walkersn = 3,505
Sample characteristics n (%) n (%) p-value
Sex ≤ 0.001
Female 8,777 (51.9) 2,000 (57.1)
Age (years) ≤ 0.05
Mean (SD) 45.5 (16.0) 45.0 (17.5)
Household structure ≤ 0.001
Sole person 1,820 (10.8) 584 (16.7)
Couple no children 4,713 (27.9) 1,036 (29.5)
Couple with children 7,609 (45.1) 1,215 (34.7)
Single parent 1,112 (9.3) 228 (6.5)
Other 1,636 (9.7) 442 (12.6)
Employment status ≤ 0.001
Fulltime 8,505 (50.4) 1,428 (40.7)
Part-time 2,753 (16.3) 567 (16.2)

692 JOURNAL OF TRANSPORT AND LAND USE 11.1
Neighborhood travelersn = 16,890 (sample used in
the analysis)
Neighborhood transport walkersn = 3,505
Sample characteristics n (%) n (%) p-value
None 5,632 (33.3) 1,510 (43.1)
Studying status ≤ 0.001
Yes 1,761 (10.4) 563 (16.1)
No 15,129 (89.6) 2,942 (83.9)
Vehicle license ≤ 0.001
Yes 15,953 (94.4) 2,925 (83.5)
No 937 (5.6) 580 (16.5)
≥ 1 vehicle available in household ≤ 0.001
Yes 16,282 (96.4) 2,999 (85.6)
No 608 (3.6) 506 (14.4)
Survey day of week ≤ 0.001
Weekend 4,230 (25.0) 800 (22.8)
Weekday 12,660 (75.0) 2,705 (77.2)
Any transport walking in the neighborhood on survey day ≤ 0.001
Yes 3,505 (20.7) 3,505 (100.0)
No 13,385 (79.3) NA
Transport walking trips in the neighborhood on survey day ≤ 0.001
0 trips 13,385 (79.3) 0 (0.0)
1 or 2 trips 2,764 (16.4) 2,764 (78.9)
≥ 3 trips 741 (4.4) 741 (21.1)
Spatial measure characteristics
Mean dwelling density (SD) 8.5 (5.9) 11.8 (7.0)
Mean street connectivity (SD) 69.0 (24.30) 80.3 (38.0)
Mean benchmark land-use mix (SD) 0.27 (0.18) 0.34 (0.20)
Mean meshblock land-use mix (SD) 0.49 (0.19) 0.55 (0.17)
Mean custom land-use mix (SD) 0.32 (0.17) 0.38 (0.17)
Mean daily living score (SD) 1.49 (0.98) 1.98 (0.92)
Mean local living score (SD) 7.55 (3.23) 9.23 (2.68)
Key: SD = standard deviation; LUM = land-use mix; NA = not applicable. p ≤ 0.001 for all cases.
Table 4 presents correlations between the spatial measures at 1600 m. Daily living and local living were highly correlated. Correlations were moderate between the land-use mix measures, and high between both the daily and local living measures.
693Identifying appropriate land-use mix measures for use in a national walkability index
Table 4: Spearman correlations at 1600 m for the spatial measures
Dwelling density
Connectivity Bench mark land-use mix
Custom land-use mix
Meshblock land-use mix
Daily Living
Dwelling density
Connectivity 0.67
Bench mark land-use mix
0.34 0.45
Custom land-use mix
0.35 0.40 0.55
Meshblock land-use mix
0.27 0.43 0.64 0.55
Daily Living 0.63 0.43 0.40 0.37 0.30
Local Living 0.63 0.45 0.49 0.42 0.41 0.86
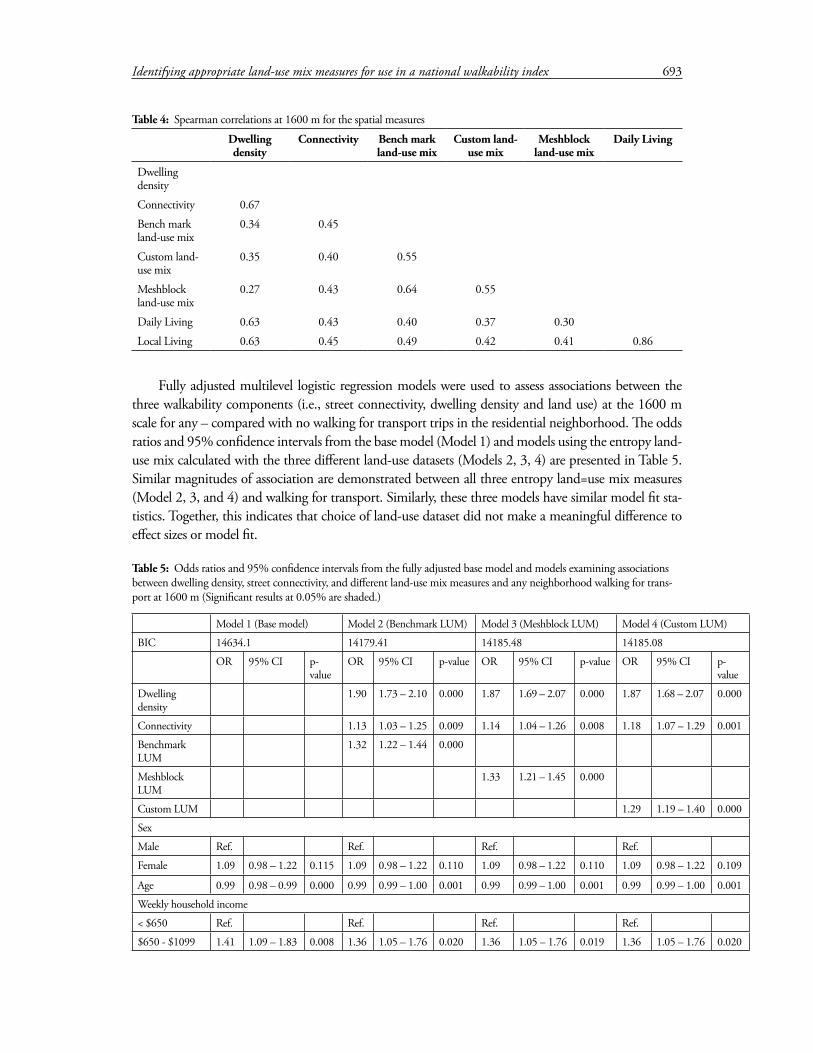
Fully adjusted multilevel logistic regression models were used to assess associations between the three walkability components (i.e., street connectivity, dwelling density and land use) at the 1600 m scale for any – compared with no walking for transport trips in the residential neighborhood. The odds ratios and 95% confidence intervals from the base model (Model 1) and models using the entropy land-use mix calculated with the three different land-use datasets (Models 2, 3, 4) are presented in Table 5. Similar magnitudes of association are demonstrated between all three entropy land=use mix measures (Model 2, 3, and 4) and walking for transport. Similarly, these three models have similar model fit sta-tistics. Together, this indicates that choice of land-use dataset did not make a meaningful difference to effect sizes or model fit.
Table 5: Odds ratios and 95% confidence intervals from the fully adjusted base model and models examining associations between dwelling density, street connectivity, and different land-use mix measures and any neighborhood walking for trans-port at 1600 m (Significant results at 0.05% are shaded.)
Model 1 (Base model) Model 2 (Benchmark LUM) Model 3 (Meshblock LUM) Model 4 (Custom LUM)
BIC 14634.1 14179.41 14185.48 14185.08
OR 95% CI p-value
OR 95% CI p-value OR 95% CI p-value OR 95% CI p-value
Dwelling density
1.90 1.73 – 2.10 0.000 1.87 1.69 – 2.07 0.000 1.87 1.68 – 2.07 0.000
Connectivity 1.13 1.03 – 1.25 0.009 1.14 1.04 – 1.26 0.008 1.18 1.07 – 1.29 0.001
Benchmark LUM
1.32 1.22 – 1.44 0.000
Meshblock LUM
1.33 1.21 – 1.45 0.000
Custom LUM 1.29 1.19 – 1.40 0.000
Sex
Male Ref. Ref. Ref. Ref.
Female 1.09 0.98 – 1.22 0.115 1.09 0.98 – 1.22 0.110 1.09 0.98 – 1.22 0.110 1.09 0.98 – 1.22 0.109
Age 0.99 0.98 – 0.99 0.000 0.99 0.99 – 1.00 0.001 0.99 0.99 – 1.00 0.001 0.99 0.99 – 1.00 0.001
Weekly household income
< $650 Ref. Ref. Ref. Ref.
$650 - $1099 1.41 1.09 – 1.83 0.008 1.36 1.05 – 1.76 0.020 1.36 1.05 – 1.76 0.019 1.36 1.05 – 1.76 0.020

694 JOURNAL OF TRANSPORT AND LAND USE 11.1
Model 1 (Base model) Model 2 (Benchmark LUM) Model 3 (Meshblock LUM) Model 4 (Custom LUM)
BIC 14634.1 14179.41 14185.48 14185.08
OR 95% CI p-value
OR 95% CI p-value OR 95% CI p-value OR 95% CI p-value
$1100 - $1649 1.22 0.94 – 1.57 0.138 1.18 0.91 – 1.52 0.206 1.19 0.92 – 1.53 0.185 1.19 0.92 – 1.53 0.190
$1650 - $2499 1.21 0.93 – 1.59 0.162 1.14 0.88 – 1.49 0.318 1.16 0.89 – 1.51 0.277 1.15 0.88 – 1.50 0.309
>= $2500 1.41 1.08 – 1.86 0.012 1.24 0.95 – 1.61 0.110 1.24 0.96 – 1.62 0.103 1.24 0.95 – 1.61 0.115
Household structure
Sole person Ref. Ref. Ref. Ref.
Couple no children
0.87 0.70 – 1.08 0.206 0.99 0.79 – 1.23 0.909 0.99 0.79 – 1.24 0.914 0.99 0.80 – 1.25 0.988
Couple with children
0.56 0.44 – 0.70 0.000 0.75 0.59 – 0.94 0.013 0.74 0.59 – 0.94 0.012 0.76 0.60 – 0.95 0.018
Single parent 0.59 0.43 – 0.80 0.001 0.73 0.54 – 0.99 0.039 0.74 0.55 – 1.00 0.049 0.75 0.55 – 1.01 0.056
Other 0.81 0.62 – 1.07 0.140 0.89 0.68 – 1.17 0.419 0.89 0.68 – 1.17 0.419 0.91 0.69 – 1.20 0.503
Employment status
Fulltime Ref. Ref. Ref. Ref.
Part-time 1.44 1.22 – 1.70 0.000 1.46 1.23 – 1.72 0.000 1.46 4.24 – 1.73 0.000 1.45 1.23 – 1.72 0.000
None 1.95 1.67 – 2.28 0.000 2.02 1.73 – 2.36 0.000 2.02 1.73 – 2.36 0.000 2.02 1.73 – 2.36 0.000
Study status
No Ref. Ref. Ref. Ref.
Yes 1.50 1.23 – 1.84 0.000 1.43 1.16 – 1.75 0.001 1.43 1.17 – 1.75 0.001 1.45 1.19 – 1.78 0.000
Vehicle license
No Ref. Ref. Ref. Ref.
Yes 0.15 0.11 – 0.19 0.000 1.15 0.12 – 0.20 0.000 0.15 0.12 – 0.20 0.000 0.15 0.12 – 0.20 0.000
Household vehicle
No Ref. Ref. Ref. Ref.
Yes 0.04 0.03 – 0.06 0.000 0.06 0.04 – 0.09 0.000 0.06 0.04 – 0.09 0.000 0.06 0.04 – 0.09 0.000
SEIFA 1.08 1.05 – 1.12 0.000 1.02 1.00 – 1.05 0.109 1.03 1.00 – 1.06 0.044 1.01 0.98 – 1.04 0.599
Models replacing land-use mix with the land use intensity measures of daily living and local living are presented in Table 6. The odds of any walking for transport were higher when daily or local living measures were used compared with the entropy land-use mix measures. Moreover, the model fit statis-tics for the daily and local living models were slightly lower than for the entropy land-use mix models, indicating better model fit. The highest odds and best model fit was for the local living measure model. This was consistent across the three scales tested.
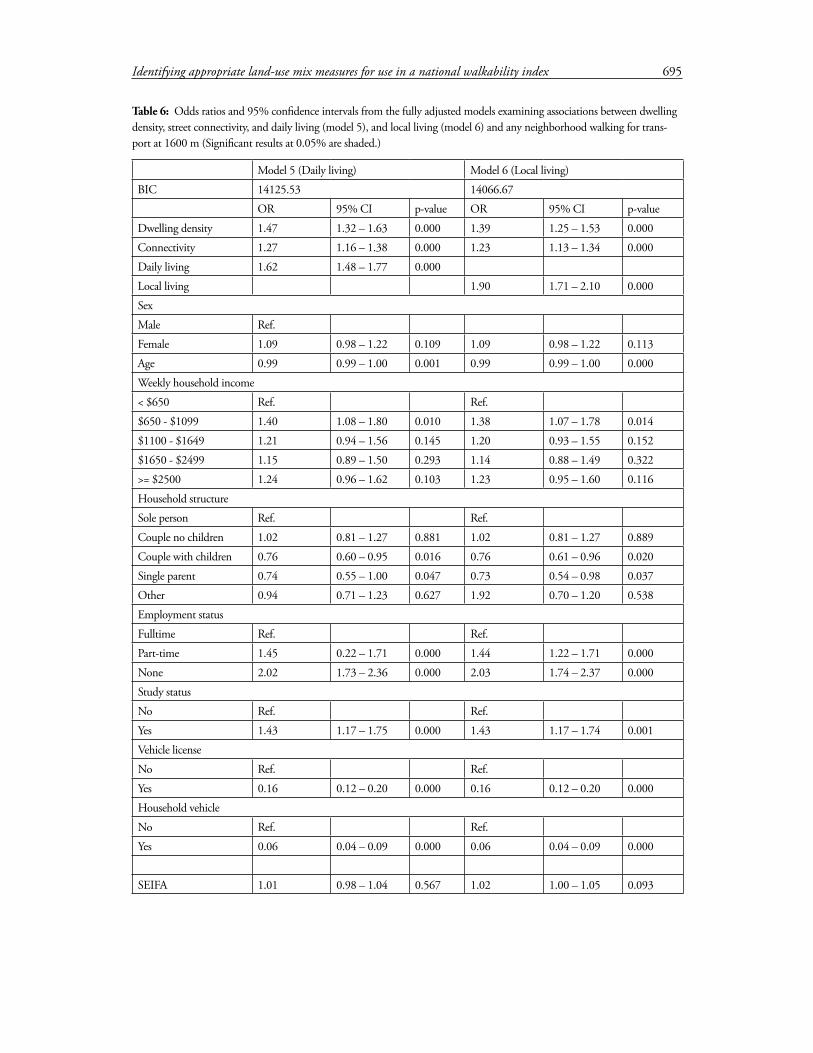
695Identifying appropriate land-use mix measures for use in a national walkability index
Table 6: Odds ratios and 95% confidence intervals from the fully adjusted models examining associations between dwelling density, street connectivity, and daily living (model 5), and local living (model 6) and any neighborhood walking for trans-port at 1600 m (Significant results at 0.05% are shaded.)
Model 5 (Daily living) Model 6 (Local living)
BIC 14125.53 14066.67
OR 95% CI p-value OR 95% CI p-value
Dwelling density 1.47 1.32 – 1.63 0.000 1.39 1.25 – 1.53 0.000
Connectivity 1.27 1.16 – 1.38 0.000 1.23 1.13 – 1.34 0.000
Daily living 1.62 1.48 – 1.77 0.000
Local living 1.90 1.71 – 2.10 0.000
Sex
Male Ref.
Female 1.09 0.98 – 1.22 0.109 1.09 0.98 – 1.22 0.113
Age 0.99 0.99 – 1.00 0.001 0.99 0.99 – 1.00 0.000
Weekly household income
< $650 Ref. Ref.
$650 - $1099 1.40 1.08 – 1.80 0.010 1.38 1.07 – 1.78 0.014
$1100 - $1649 1.21 0.94 – 1.56 0.145 1.20 0.93 – 1.55 0.152
$1650 - $2499 1.15 0.89 – 1.50 0.293 1.14 0.88 – 1.49 0.322
>= $2500 1.24 0.96 – 1.62 0.103 1.23 0.95 – 1.60 0.116
Household structure
Sole person Ref. Ref.
Couple no children 1.02 0.81 – 1.27 0.881 1.02 0.81 – 1.27 0.889
Couple with children 0.76 0.60 – 0.95 0.016 0.76 0.61 – 0.96 0.020
Single parent 0.74 0.55 – 1.00 0.047 0.73 0.54 – 0.98 0.037
Other 0.94 0.71 – 1.23 0.627 1.92 0.70 – 1.20 0.538
Employment status
Fulltime Ref. Ref.
Part-time 1.45 0.22 – 1.71 0.000 1.44 1.22 – 1.71 0.000
None 2.02 1.73 – 2.36 0.000 2.03 1.74 – 2.37 0.000
Study status
No Ref. Ref.
Yes 1.43 1.17 – 1.75 0.000 1.43 1.17 – 1.74 0.001
Vehicle license
No Ref. Ref.
Yes 0.16 0.12 – 0.20 0.000 0.16 0.12 – 0.20 0.000
Household vehicle
No Ref. Ref.
Yes 0.06 0.04 – 0.09 0.000 0.06 0.04 – 0.09 0.000
SEIFA 1.01 0.98 – 1.04 0.567 1.02 1.00 – 1.05 0.093
696 JOURNAL OF TRANSPORT AND LAND USE 11.1
4 Discussion
We compared the suitability of three land-use datasets for calculating a national transport-specific walk-ability index across Australian capital cities, using Melbourne as a case study. The Victorian VGO land-use data was the bench mark because it is fine-grained and detailed, however it is not available nationally. It was compared with two national land-use datasets: custom and meshblock. We also developed two new exploratory “intensity” measures - daily living and local living. These were compared with the entro-py land-use mix measure commonly used to calculate walkability indices, which has known limitations. We found moderate correlations across the three land-use mix measures. Since these measures were calculated using the same method, this highlights the differences in the land-use data sources. There were also moderate correlations between the entropy based land-use measures and daily and local living, suggesting the different types of measures detect slightly different aspects of the built environment. This aligns with previous research comparing entropy with other types of land-use measure (Brown et al., 2009; Merlin, 2014; Lee & Moudon, 2006) and is not surprising considering the different rationales, data, and processes used to create the measures.
Our results can inform the selection of land-use datasets for conducting national research on land-use mix and walkability indices in Australia. Differences in the representation of land use by the three datasets are apparent in Figures 1 and 2. The relative coarseness of the meshblock dataset is particularly noticeable in the CBD, and suggests it is inappropriate for use in these areas. Furthermore, the ABS notes that meshblock land-use categories indicate the main planned land use rather than the actual use (Australian Bureau of Statistics, 2011b). We therefore recommend that the meshblock dataset may be suitable for broad scale indicators of land use across Australia excluding urban areas, where a custom dataset similar to that used here is more appropriate.
Nevertheless, the meshblock dataset is appealing for urban planners, policymakers and researchers because it is freely available, requires little spatial processing, and is updated with each census. It has the potential to be amended for use in urban areas by including additional land-use categories and/or information about the percentage area of land uses within a meshblock. This would enhance its research applications, and provide major efficiency improvements and cost savings in the field of urban studies.
We have confirmed that the lack of nationally consistent and detailed urban land-use data is a problem in Australia. The scarcity of such information globally limits the comparison of spatial inequi-ties within and between cities (Frank et al., 2010). This study demonstrates that a customized land-use measure is feasible, but not ideal due to access costs, and data processing and knowledge requirements. In Australia, ACLUMP have successfully coordinated nationally consistent land-use mapping. A similar effort focused on fine-scale data in urban areas would be beneficial.
The results also indicate that, as found in previous research (Brown et al., 2009; Merlin, 2014; Lee & Moudon, 2006), the entropy land-use measures are not capturing exactly the same aspects as other types of land-use measure. However, they also indicate that the daily and local living measures capture aspects of the land-use mix component of the walkability index and perhaps are more specific measures of destinations that people walk to than entropy measures of mixed use. Indeed, in some ways the lo-cal living measure captures the essentials of the walkability index — dwelling density (having sufficient density to support the location of destinations in an area), connectivity (being able to walk between two places in a relatively direct manner), and land-use mix (a proxy for destinations to walk to). Since the local living measure is a measure of places people can walk to, it may be a more direct measure of walk-ability than the walkability index, whose components (including entropy mixed use) are proxies.
The daily and local living measures suffer from the same equal apportionment assumption as the entropy land-use mix measures. For example an area with one public transport stop and one super-

697Identifying appropriate land-use mix measures for use in a national walkability index
market will score the same as an area with one library and one childcare center, yet the two areas may support different travel patterns. However, the land-use categories used in the daily and local living measures were specifically chosen to be relevant for transport walking, something that is often not the case with land-use categories used in entropy measures. Regardless, the daily and local living measures produced similar results as the entropy land-use measure, yet they are comparatively simpler and less computationally intensive to calculate, more policy-relevant, easier to communicate, and less likely to lead to misleading results. Future research could build on these exploratory land-use mix measures with further empirical analysis to confirm our findings and to assist in developing travel behavior theory. This is not to say that the components of the walkability index are not important for walking, especially as our analyses only demonstrated moderate correlations between dwelling density, connectivity, and the various land-use measures. Further research is still needed to disentangle the relative roles of, interactions between, and synergistic effects of various built environment characteristics on walking behavior.
4.1 Limitations
The meshblock dataset results should be applied with caution since the travel survey data used in this study excluded the Metropolitan Melbourne CBD. Consequently, associations between walkability and walking for transport within the CBD were not assessed. However, as previously described, the national meshblock dataset does not adequately represent the detailed land-use patterns present in the CBD and should not be used for this purpose. Another limitation is that the entropy land-use mix measure does not capture vertical mixing, and instead assigns a singular land use to each parcel lot or meshblock.
The daily and local living measures did not include school destinations. It is possible that some of the neighborhood walking trips recorded included parents walking their children to school, and this was not considered. This may have attenuated the findings observed.
This study only assessed the three most common components of the walkability index (dwelling density, street connectivity, and land-use mix). While the street connectivity measure was calculated us-ing a common protocol for buffers (Adams et al., 2014), this measure incorporates potential redundancy since the area of the network buffer and the number of intersections are correlated. The retail floor area ratio component (Frank et al., 2010) could not be calculated due to lack of data. The study was further limited by temporal mismatches between the outcome data (2009/2010) and the data used to create the walkability indices (2010 - 2014). Finally, each of the land-use datasets was deemed a priori as poten-tially suitable for being associated with walking for transport. However, this may not have been the case.
5 Conclusion
In seeking to create an Australian specific national transport walkability index, this study provides in-sights relevant to an international audience. We demonstrated the differences in land-use data from different sources and synthesized a national land-use data set that can be used for mixed use calculations. We also demonstrated that there was a statistically significant relationship between our exploratory des-tination-based measures — daily and local living — with walking for travel. Therefore, while the daily and local living measures are likely to capture slightly different aspects of the environment compared to the entropy land-use mix measure, the daily and local living measures are appropriate for assessing national walkability. Further, the results can guide the selection of datasets for use in an Australian walk-ability index, and inform the development of similar measures in other countries. A nationally consis-tent, freely-available, and detailed land-use dataset is ideal but where missing — as in Australia — we showed that creating a custom dataset is feasible.

698 JOURNAL OF TRANSPORT AND LAND USE 11.1
Acknowledgements
SM was in part supported by an ARC funded Linkage project: Understanding how local and regional accessibility are associated with active travel, and related health and economic impacts (LP140100680) and is also supported by an NHMRC Early Career Fellowship (#1121035).
SM, HB, LG, and CB were in part supported by VicHealth, and the National Health and Medi-cal Research Council (NHMRC) Centre of Research Excellence in Healthy Liveable Communities (#1061404). HB is supported by an RMIT University Vice Chancellor’s Senior Research Fellowship.
SM, HB, and SE were in part supported by The Australian Prevention Partnership Centre (#9100001) with funding provided by NHMRC, ACT Health, NSW Health, the Australian National Preventive Health Agency, the Hospitals Contribution Fund of Australia and the HCF Research Foun-dation are gratefully acknowledged. BGC was supported by an NHMRC Senior Principal Research Fellow Award (#1107672) and VicHealth.
Thanks to Julianna Rozek for editing, proof-reading, and formatting the manuscript.Thanks also go to the data custodians Victorian Department of Economic Development, Jobs,
Transport, and Resources and Department of Environment and Primary Industries, Australian Bureau of Statistics, Australian Children’s Education & Care Quality Authority, Pitney Bowes Ltd and Public Transport Victoria for providing VISTA and spatial data.
699Identifying appropriate land-use mix measures for use in a national walkability index
References
Adams, M. A., Frank, L. D. , Schipperijn, J., Smith, G., Chapman, J., Christiansen, L. B., Coffee, N., Salvo, D., du Toit, L., & Dygrýn, J. (2014). International variation in neighborhood walkability, transit, and recreation environments using geographic information systems: The IPEN adult study. International Journal of Health Geographics, 13, 43.
Brown, B. B., Yamada, I., Smith, K. R., Zick, C. D., Kowaleski-Jones, L., & Fan, J. X. (2009). Mixed land use and walkability: Variations in land-use measures and relationships with BMI, overweight, and obesity. Health and Place, 15(4), 1130–1141.
Brownson, R. C., Hoehner, C. M., Day, K., & Forsyth, A. (2009). Measuring the built environment for physical activity: State of the science. American Journal of Preventive Medicine, 36(4), S99–S123.
Christian, H. E., Bull, F. C., Middleton, N. J., Knuiman, M. W., Divitini, M. L.,Hooper, P., Amaras-inghe, A., & Giles-Corti, B. (2011). How important is the land-use mix measure in understanding walking behavior? Results from the RESIDE study. International Journal of Behavioral Nutrition and Physical Activity, 8, 55.
Daniels, R., & Mulley, C. (2013). Explaining walking distance to public transport: The dominance of public transport supply. Journal of Transport and Land Use, 6(2), 5–20.
Duncan, M. J., Winkler, E., Sugiyama, T., Cerin, E., Leslie, E., & Owen, N. (2010). Relationships of land-use mix with walking for transport: Do land uses and geographical scale matter? Journal of Urban Health, 87(5), 782–795.
Department of Planning and Environment. (2014). A plan for growing Sydney. Sydney: Department of Planning and Environment.
Frank, L., Sallis, J., Saelens, B., Leary, L., Cain, K., Conway, T., & Hess, P. (2010). The development of a walkability index: Application to the Neighborhood Quality of Life Study. British Journal of Sports Medicine, 44, 924–933.
Frank, L. D., Schmid, T. L., Sallis, J. F., Chapman, J., & Saelens, B. E. (2005). Linking objectively measured physical activity with objectively measured urban form — Findings from SMARTRAQ. American Journal of Preventive Medicine, 28(2), 117–125.
Gehrke, S., & Clifton, K. (2014). Operationalizing land use diversity at varying geographic scales and its connection to mode choice: Evidence from Portland, Oregon. Transportation Research Record: Journal of the Transportation Research Board, 2453, 128–136.
Giles-Corti, B., Badland, H., Mavoa, S., Turrell, G., Bull, F., Boruff, B., Pettit, C., Bauman, A., Hooper, P., & Villanueva, K. (2014). Reconnecting urban planning with health: A protocol for the develop-ment and validation of national livability indicators associated with noncommunicable disease risk behaviors and health outcomes. Public Health Research and Practice, 25(1), e2511405.
Giles-Corti, B., Macaulay, A., Middleton, N., Boruff, B., Bull, F., Butterworth, I., Badland, H., Mavoa, S., Roberts, R., & Christian, H. (2014). Developing a research and practice tool to measure walk-ability: A demonstration project. Health Promotion Journal of Australia, 25, 160–166.
Giles-Corti, B., Mavoa, S., Eagleson, S., Davern, M., Roberts, R., & Badland, H. M. (2014). Transport Walkability Index: Melbourne. Melbourne: The University of Melbourne.
Hess, P. M., Moudon, A. V., & Logsdon, M. G. (2001). Measuring land-use patterns for transportation research. Land Development and Public Involvement in Transportation, 1780, 17–24.
Hooper, P., Giles-Corti, B., & Knuiman, M. (2014). Evaluating the implementation and active living impacts of a state government planning policy designed to create walkable neighborhoods in Perth, Western Australia. American Journal of Health Promotion, 28(sp3): S5–S18.
Learnihan, V., Van Niel, K. P., Giles-Corti, B., & Knuiman, M. (2011). Effect of scale on the links between walking and urban design. Geographical Research, 49(2), 183–191.

700 JOURNAL OF TRANSPORT AND LAND USE 11.1
Lee, C., & Moudon, A. V. (2006). The 3Ds + R: Quantifying land use and urban form correlates of walking. Transportation Research Part D: Transport and Environment, 11(3), 204–215.
Major Cities Unit. (2011). Our cities, our future: A national urban policy for a productive, sustainable and livable future. Australian Government: Department of Infrastructure and Transport.
Manaugh, K., & Kreider, T. (2013). What is mixed use? Presenting an interaction method for measur-ing land-use mix. Journal of Transport and Land Use, 6(1), 63–72.
Mayne, D. J., Morgan, G. G., Willmore, A., Rose, N., Jalaludin, B., Bambrick, H., & Bauman, A. (2013). An objective index of walkability for research and planning in the Sydney Metropolitan Re-gion of New South Wales, Australia: An ecological study. International Journal of Health Geographics, 12, 61.
Merlin, L. A. (2014). Measuring community completeness: Jobs—housing balance, accessibility, and convenient local access to nonwork destinations. Environment and Planning B: Planning and Design, 41(4), 736–756.
Owen, N., Cerin, E,. Leslie, E., Dutoit, L., Coffee, N., Frank, L. D., Bauman, A. E., Hugo, G., Saelens, B. E., & Sallis, J. F. (2007). Neighborhood walkability and the walking behavior of Australian adults. American Journal of Preventive Medicine, 33(5), 387–395.
Sallis, J. F., Floyd, M. F., Rodríguez, D. A., & Saelens, B. E. (2012). Role of built environments in physi-cal activity, obesity, and cardiovascular disease. Circulation, 125(5), 729–737.
Shannon, C. E., & Weaver, W. (1949). Evolution and measurement of species diversity. Taxon, 21, 213–251.
Song, Y., Merlin, L., & Rodriguez, D. (2013). Comparing measures of urban land--use mix. Computers, Environment and Urban Systems, 42, 1–13.
Song, Y. & Rodríguez, D. A. (2005). The measurement of the level of mixed land uses: a synthetic ap-proach. Carolina Transportation Program White Paper Series, Chapel Hill, NC.
State of Victoria. (2014). Plan Melbourne — Metropolitan planning strategy. Melbourne: Department of Transport.
Villanueva, K., Knuiman, M., Nathan, A., Giles-Corti, B., Christian, H., Foster, S., & Bull, F. (2014). The impact of neighborhood walkability on walking: Does it differ across adult life stage and does neighborhood buffer size matter? Health and Place, 25, 43–46.
Western Australian Planning Commission (2007). Livable neighborhoods: A Western Australian govern-ment sustainable cities initiative. Perth: Western Australia Planning Commission.
Witten, K., Blakely, T., Bagheri, N., Badland, H., Ivory, V., Pearce, J., Mavoa, S., Hinckson, E., & Schofield, G. (2012). Neighborhood built environment and transport and leisure physical activity: Findings using objective exposure and outcome measures in New Zealand. Environmental Health Perspectives, 120(7), 971.
Yamada, I., Brown, B. B., Smith, K. R., Zick, C. D., Kowaleski-Jones, L., & Fan, J. X. (2012). Mixed land use and obesity: An empirical comparison of alternative land-use measures and geographic scales. The Professional Geographer, 64(2), 157–177.