
Identification of sequence-dependent DNA features correlating to activity of DNA sites interacting...
17
Identification of sequence-dependent DNA features correlating to activity of DNA sites interacting with proteins Mikhail P. Ponomarenko 1 , Julia V. Ponomarenko 1 , Anatoly S. Frolov 1 , Nikolay L. Podkolodny 2 , Ludmila K. Savinkova 1 , Nikolay A. Kolchanov 1 and G. Christian Overton 3 1 Laboratory of Theoretical Genetics, Institute of Cytology & Genetics, 10 Lavrentyev Avenue, Novosibirsk, 630090, 2 Laboratory of Information Technologies in Computational Geophysics, Institute of Computational Mathematics & Mathematical Geophysics, 6 Lavrentyev Avenue, Novosibirsk, 630090, Russia and 3 Center for Bioinformatics, University of Pennsylvania, 1312 Blockley Hall (6021), 418 Guardian Drive, Philadelphia, PA 19104-6145, USA Received on November 27, 1998; revised and accepted on April 29, 1999 Abstract Motivation: The commonly accepted statistical mechanical theory is now multiply confirmed by using the weight matrix methods successfully recognizing DNA sites binding regulatory proteins in prokaryotes. Nevertheless, the recent evaluation of weight matrix methods application for transcription factor binding site recognition in eukaryotes has unexpectedly revealed that the matrix scores correlate better to each other than to the activity of DNA sites interacting with proteins. This observation points out that molecular mechanisms of DNA/protein recognition are more complicated in eukaryotes than in prokaryotes. As the extra events in eukaryotes, the following processes may be considered: (i) competition between the proteins and nucleosome core particle for DNA sites binding these proteins and (ii) interaction between two synergetic/antagonist proteins recognizing a composed element compiled from two DNA sites binding these proteins. That is why identification of the sequence-dependent DNA features correlating with affinity magnitudes of DNA sites interacting with a protein can pinpoint the molecular event limiting this protein/DNA recognition machinery . Results: An approach for predicting site activity based on its primary nucleotide sequence has been developed. The approach is realized in the computer system ACTIVITY, containing the databases on site activity and on conformational and physicochemical DNA/RNA parameters. By using the system ACTIVITY, an analysis of some sites was provided and the methods for predicting site activity were constructed. The methods developed are in good agreement with the experimental data. Availability: The database ACTIVITY is available at http://wwwmgs.bionet.nsc.ru/systems/Activity/ and the mirror site, http://www.cbil.upenn.edu/mgs/systems/activity/ Contact: [email protected] Introduction The statistical mechanical theory developed by Berg and von Hippel (1987, 1988) is now commonly accepted. In particular, it is confirmed with successful recognition of DNA sites binding regulatory proteins in prokaryotes by using the weight matrix methods. Nevertheless, recent evaluation of these methods applied to eukaryotic transcription factor binding sites has unexpectedly demonstrated that the matrix scores correlate better to each other than to protein/DNA activity magnitudes (Roulet et al., 1998). Probably, the reason is that molecular mechanisms of DNA/protein recognition are more complicated in eukaryotes than in prokaryotes. Fot the events specific in eukaryotes, competition between proteins and nucleosome core particles for DNA sites binding these proteins (Godde et al., 1995; Edmondson and Roth, 1996) may be referred. In addition, the synergistic/antagonist interaction between two proteins recognizing a composed element, or DNA site pair binding these proteins, may be essential for tissue-specific gene transcription initiation in eukaryotes (French et al., 1998). Owing to these reasons, identification of the sequence-dependent DNA features correlating with the affinity magnitudes of the DNA site interacting with a given protein can pinpoint the molecular event limiting this protein/DNA recognition machinery. The present work was carried out within the framework of this intensively developing direction in bioinformatics. The problem of predicting site activity based on the site sequence was first formulated by McClure and co-workers (Mulligan et al., 1984), who have suggested the method for predicting activity of Escherichia coli promoters according to promoter sequence similarity to consensus. Stormo et al. Vol. 15 nos 7/8 1999 Pages 687-703 687 E Oxford University Press 1999 BIOINFORMATICS
-
Upload
independent -
Category
Documents
-
view
0 -
download
0
Transcript of Identification of sequence-dependent DNA features correlating to activity of DNA sites interacting...
Identification of sequence-dependent DNAfeatures correlating to activity of DNA sitesinteracting with proteins
������� �� ���� ��� ����� �� ���� �������� �� ������ ������ �� �������� ������� �� ��������������� �� ������� �� �� ���!��� "� ��#
���$����� % &� � ����� � ���!� '!����� % ���(� ) � ���!� �* ���� �� �
�� � � ��!�$��!�� +#**,*� ���$����� % '%����� & ���(� ! �
�-������� � -��!��!� '!����� % �-������� ���� �����! ) ���� �������
� -��!��!� + ���� �� � �� � � ��!�$��!�� +#**,*� .�!!�� �� # � � %�
/��%������!� 0�� �!��� % � !������� �#�� /���� � 1��� 2+*��3� 4�5 �������
6��� � ������ �-���� �� �,�*47+�48� 0��
�������� �� ������ �� ����� ������� ��� �������� �� ����� �� ����
Abstract
Motivation: The commonly accepted statistical mechanicaltheory is now multiply confirmed by using the weight matrixmethods successfully recognizing DNA sites binding regulatoryproteins in prokaryotes. Nevertheless, the recent evaluation ofweight matrix methods application for transcription factorbinding site recognition in eukaryotes has unexpectedlyrevealed that the matrix scores correlate better to each otherthan to the activity of DNA sites interacting with proteins. Thisobservation points out that molecular mechanisms ofDNA/protein recognition are more complicated in eukaryotesthan in prokaryotes. As the extra events in eukaryotes, thefollowing processes may be considered: (i) competition betweenthe proteins and nucleosome core particle for DNA sites bindingthese proteins and (ii) interaction between twosynergetic/antagonist proteins recognizing a composed elementcompiled from two DNA sites binding these proteins. That iswhy identification of the sequence-dependent DNA featurescorrelating with affinity magnitudes of DNA sites interactingwith a protein can pinpoint the molecular event limiting thisprotein/DNA recognition machinery.Results: An approach for predicting site activity based on itsprimary nucleotide sequence has been developed. Theapproach is realized in the computer system ACTIVITY,containing the databases on site activity and on conformationaland physicochemical DNA/RNA parameters. By using thesystem ACTIVITY, an analysis of some sites was provided andthe methods for predicting site activity were constructed. Themethods developed are in good agreement with theexperimental data.Availability: The database ACTIVITY is available athttp://wwwmgs.bionet.nsc.ru/systems/Activity/ and the mirrorsite, http://www.cbil.upenn.edu/mgs/systems/activity/
Contact: [email protected]
Introduction
The statistical mechanical theory developed by Berg and vonHippel (1987, 1988) is now commonly accepted. In particular,it is confirmed with successful recognition of DNA sitesbinding regulatory proteins in prokaryotes by using the weightmatrix methods. Nevertheless, recent evaluation of thesemethods applied to eukaryotic transcription factor bindingsites has unexpectedly demonstrated that the matrix scorescorrelate better to each other than to protein/DNA activitymagnitudes (Roulet et al., 1998). Probably, the reason is thatmolecular mechanisms of DNA/protein recognition are morecomplicated in eukaryotes than in prokaryotes. Fot the eventsspecific in eukaryotes, competition between proteins andnucleosome core particles for DNA sites binding theseproteins (Godde et al., 1995; Edmondson and Roth, 1996)may be referred. In addition, the synergistic/antagonistinteraction between two proteins recognizing a composedelement, or DNA site pair binding these proteins, may beessential for tissue-specific gene transcription initiation ineukaryotes (French et al., 1998). Owing to these reasons,identification of the sequence-dependent DNA featurescorrelating with the affinity magnitudes of the DNA siteinteracting with a given protein can pinpoint the molecularevent limiting this protein/DNA recognition machinery. Thepresent work was carried out within the framework of thisintensively developing direction in bioinformatics.
The problem of predicting site activity based on the sitesequence was first formulated by McClure and co-workers(Mulligan et al., 1984), who have suggested the method forpredicting activity of Escherichia coli promoters according topromoter sequence similarity to consensus. Stormo et al.
��� �8 ! 9:5 �,,,
��( ! +5979*#
687� Oxford University Press 1999
BIOINFORMATICS
M.P.Ponomarenko et al.
688
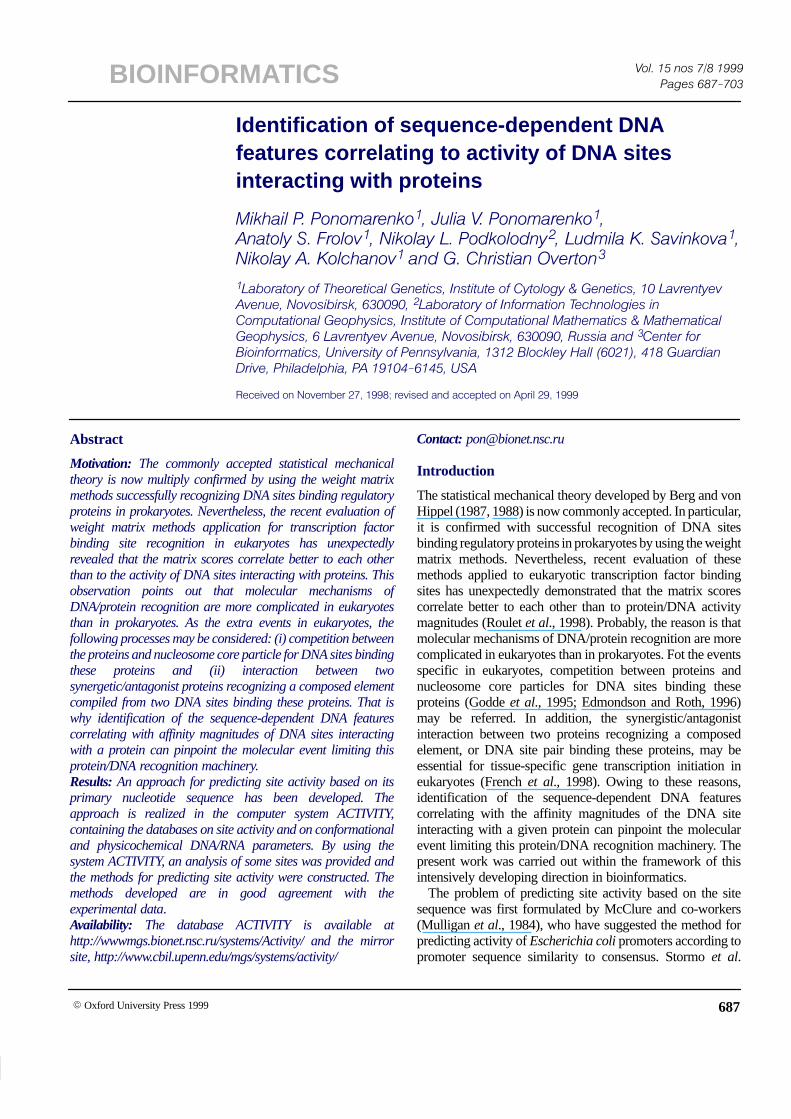
Fig. 1. The basic scheme of the ACTIVITY system. The databases and tools are boxed; arrows show the input/output data transfer pathways;solid lines, Web-available resources; broken lines, encapsulated resources.
(1986) have introduced the weight matrices for predicting siteactivity. Berg and von Hippel (1988), based on thestatistical–mechanical theory of DNA–protein interactions,have proposed the approach for predicting site activity byapplying frequency matrices. Weight matrices were also usedfor identifying the affinity of E.coli ribosomes to syntheticRNA (Barrick et al., 1994). Jonsson and co-workers (1993)were the first to apply a neural network technique forpredicting the strength of E.coli promoters. Later on, thisapproach was applied to predicting the transcriptional activityof Inrs and TATA box promoters in eukaryotes (Kraus et al.,1996). Although thousands of the sites with the knownactivities are currently familiar, prediction of site activity inaccordance with its sequence was demonstrated only inseveral concrete experiments.
In the present paper, we present the system ACTIVITY,which is the next stage of the previously developed systemSITEVIDEO (Kel et al., 1993). The novel ACTIVITY systemallows various DNA features to be revealed, e.g. contextualDNA features (Ponomarenko et al., 1997a), conformationaland physicochemical features (Ponomarenko et al., 1997b,c),which are significantly correlated with DNA site activitymagnitudes. Using the system ACTIVITY, we performed ananalysis of various sites and developed the site activityprediction methods fitting the experimental data reasonablywell. It was demonstrated that these DNA features are usefulfor scientific and practical use. For example, it is possible (i)to explain the limiting event of the protein/DNA machinery
and (ii) to construct the tools for predicting site activities by‘sequence–activity’ linearly additive approximations(Kolchanov et al., 1998).
System and methods
The basic scheme of the ACTIVITY system is shown inFigure 1. This system consists of two parts: the Web-availabledatabase part and the encapsulated knowledge discovery part.
The database part of the ACTIVITY system has beenimplemented by using the Sequence Retrieval System (SRS)Version 5.1 with internal version of the programminglanguage ICARUS. It has been successfully compiled on theSilicone Graphic platform, under UNIX64 version 6.1. Thedatabase part is Web available via SRS server by URL = <http://sgi.sscc.ru/>. The major blocks of the system are: theSRS user’s Interface; the ACTIVITY database on functionalsite activities; the PROPERTY database on context-dependentconformational and physicochemical B-DNA parameters; theKNOWLEDGE database containing the significant featuresof the functional sites determined experimentally, and theprograms for predicting activity of these sites.
The knowledge discovery part of the ACTIVITY systemhas been implemented in the C language of the ANSIstandard. It has been successfully compiled on the Intel PCplatform using the Borland C compiler, Version 4.5, underWindows95. This part is encapsulated because it takes over 24h to analyse a single input data set.
Functional DNA site activity
689
Linear–additive approximation for predicting siteactivity
The specific activity of site F is assumed to be determined bythe context-dependent features of its nucleotide sequence Sn,namely, statistical, physicochemical and conformational ones.These features may be divided into (i) obligatory features,determining the basal level of the site activity, similar in all thesite sequences Sn and (ii) facultative features, individual foreach site sequence Sn, providing the modulation of the siteactivity level from the basal activity. Then, within the limits ofthe linear–additive approximation, the activity of the site withthe nucleotide sequence Sn is described by the equation:
F(Sn) � F0(Sn) ��M
m�1
Fm � Xm(Sn) (1)
where F0(Sn) is the basal activity of the given type site, whichis determined by obligatory features representative for thegiven site type in the sequence Sn; {Xm}m = 1,M are facultativefeatures of the site and Fm is the impact of the facultativefeature Xm in site activity F.
ACTIVITY, functional sites activities database
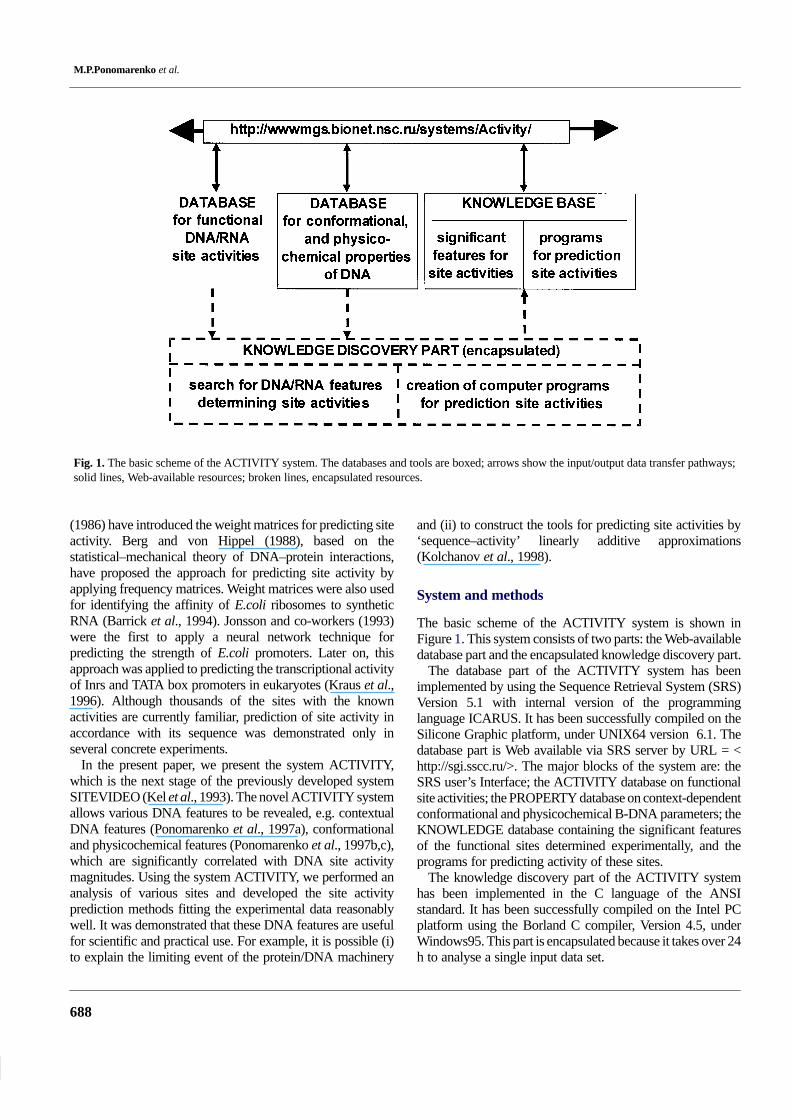
As the initial information for analysing the site activity, thesets of nucleotide sequences provided with experimentallymeasured specific activity values expressed in correspondingunits are considered. This information is stored in the databaseACTIVITY on the site activities. For this purpose, a specialformat compatible with the language SRS for the automatedtreatment of queries like ‘data search’ (Etzold and Argos,1993) was applied. One entry describes a single experiment.An example of an ACTIVITY database entry is shown inFigure 2.
Context-dependent features of the sites
In the system ACTIVITY, the weighted concentrations ofmono-, di-, tri- and tetranucleotides different for the sitesequences are considered as the statistical features of thenucleotide context of the site. For the sequence S = s1 … si …sL of length L, the weighted concentration of theoligonucleotide Z = z1 … zj … zm of length m is estimated bythe equation:
XZmw(S) � �L–m�1
i�1
w(i) � �z (sisi�1���Si�m–1) (2)
where 1 ≤ m ≤ L; δZ(sisi + 1 … si + m – 1) is the function denotingthe presence ‘1’ or absence ‘0’ of oligonucleotide Z in the ithposition of the sequence S; si ∇ {A, T, G, C}; zj ∇ {A, T, G, C,W = A/T, R = A/G, M = A/C, K = T/G, Y = T/C, S = G/C,B = T/G/C, V = A/G/C, H = A/T/C, D = A/T/G,N = A/T/G/C}; w(i) is the function of position’s significance
Fig. 2. An entry of the ACTIVITY database by the example of theUSF/DNA affinity (Bendall and Molloy 1994).
[0 ≤ w(i) ≤ 1], which permits the observation that differentoligonucleotides provide the most considerable impact if theyare located in different site positions to be accounted for. The
M.P.Ponomarenko et al.
690
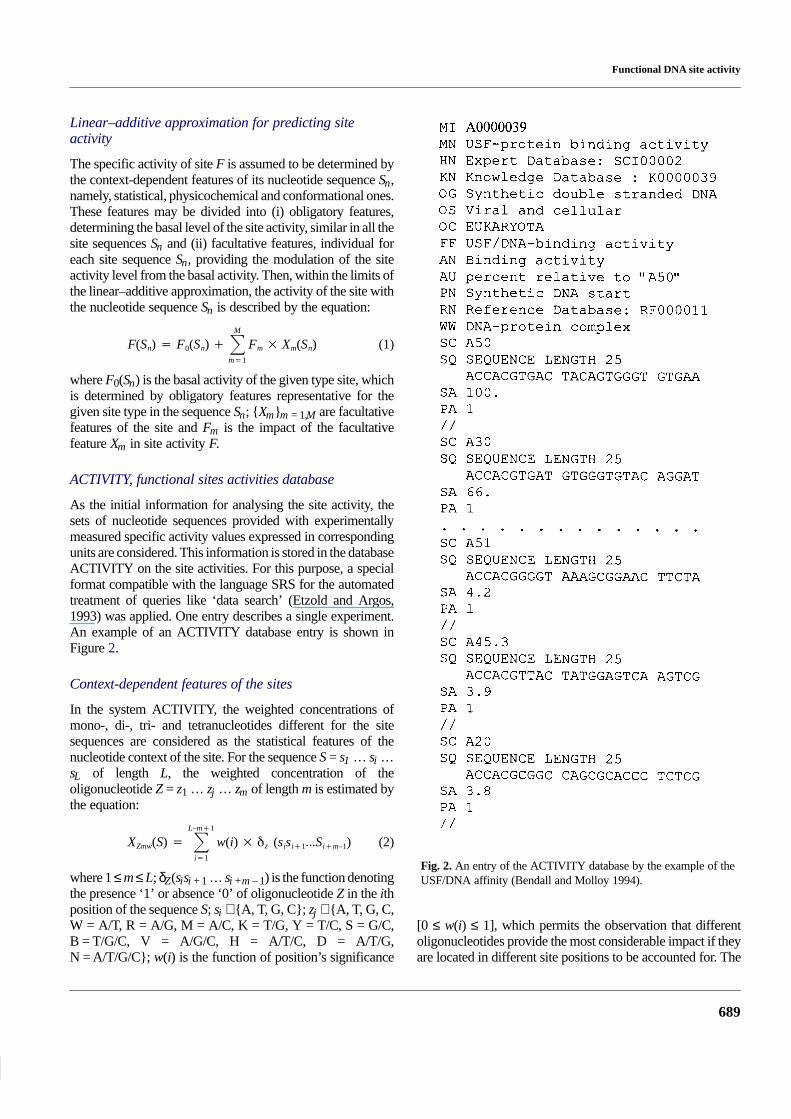
Fig. 3. Examples of weight functions w(i) revealing the significance of the ith position of the site.
examples of such weight functions w(i) are given in Figure 3.A total of 180 weight functions w(i) is utilized in the systemACTIVITY.
The increasing bulk of experimental data gives evidencethat site activity is to a large extent determined byphysicochemical and conformational properties (for example,see Starr et al., 1995; Kim et al., 1996; Meierhans et al., 1997).
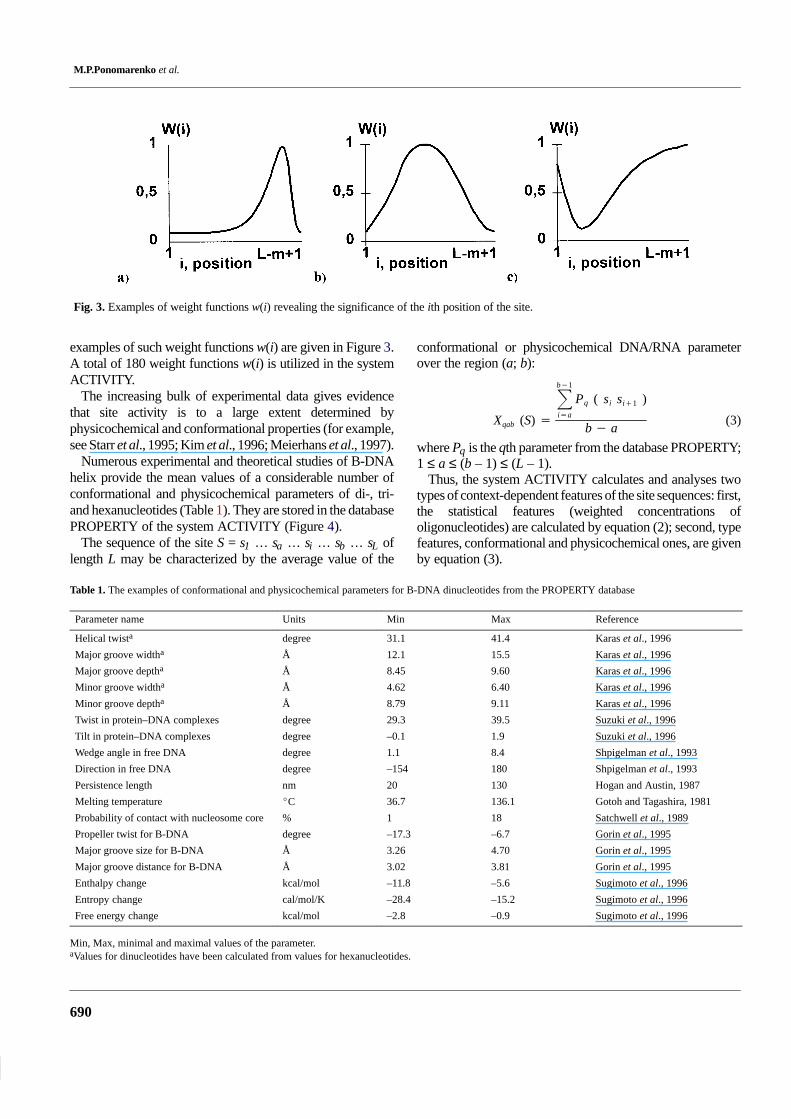
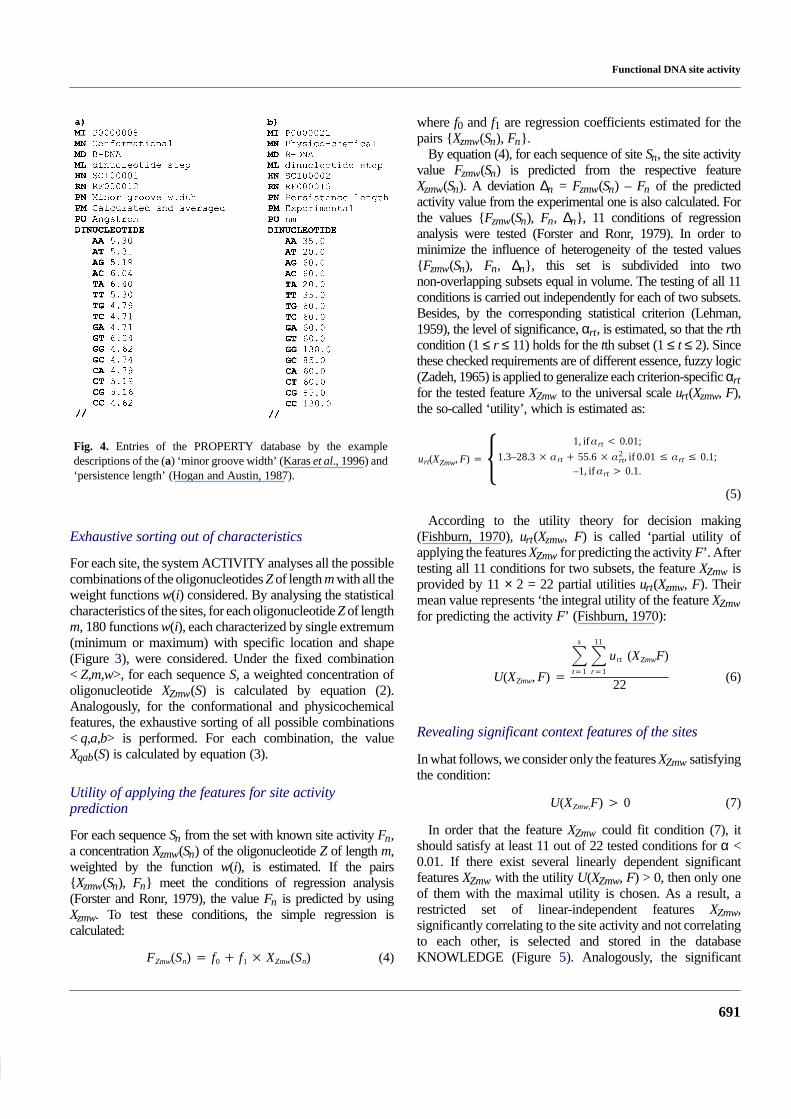
Numerous experimental and theoretical studies of B-DNAhelix provide the mean values of a considerable number ofconformational and physicochemical parameters of di-, tri-and hexanucleotides (Table 1). They are stored in the databasePROPERTY of the system ACTIVITY (Figure 4).
The sequence of the site S = s1 … sa … si … sb … sL oflength L may be characterized by the average value of the
conformational or physicochemical DNA/RNA parameterover the region (a; b):
Xqab (S) �
�b�1
i�a
Pq ( si si�1 )
b � a(3)
where Pq is the qth parameter from the database PROPERTY;1 ≤ a ≤ (b – 1) ≤ (L – 1).
Thus, the system ACTIVITY calculates and analyses twotypes of context-dependent features of the site sequences: first,the statistical features (weighted concentrations ofoligonucleotides) are calculated by equation (2); second, typefeatures, conformational and physicochemical ones, are givenby equation (3).
Table 1. The examples of conformational and physicochemical parameters for B-DNA dinucleotides from the PROPERTY database
Parameter name Units Min Max Reference
Helical twista degree 31.1 41.4 Karas et al., 1996
Major groove widtha Å 12.1 15.5 Karas et al., 1996
Major groove deptha Å 8.45 9.60 Karas et al., 1996
Minor groove widtha Å 4.62 6.40 Karas et al., 1996
Minor groove deptha Å 8.79 9.11 Karas et al., 1996
Twist in protein–DNA complexes degree 29.3 39.5 Suzuki et al., 1996
Tilt in protein–DNA complexes degree –0.1 1.9 Suzuki et al., 1996
Wedge angle in free DNA degree 1.1 8.4 Shpigelman et al., 1993
Direction in free DNA degree –154 180 Shpigelman et al., 1993
Persistence length nm 20 130 Hogan and Austin, 1987
Melting temperature �C 36.7 136.1 Gotoh and Tagashira, 1981
Probability of contact with nucleosome core % 1 18 Satchwell et al., 1989
Propeller twist for B-DNA degree –17.3 –6.7 Gorin et al., 1995
Major groove size for B-DNA Å 3.26 4.70 Gorin et al., 1995
Major groove distance for B-DNA Å 3.02 3.81 Gorin et al., 1995
Enthalpy change kcal/mol –11.8 –5.6 Sugimoto et al., 1996
Entropy change cal/mol/K –28.4 –15.2 Sugimoto et al., 1996
Free energy change kcal/mol –2.8 –0.9 Sugimoto et al., 1996
Min, Max, minimal and maximal values of the parameter.aValues for dinucleotides have been calculated from values for hexanucleotides.
Functional DNA site activity
691
Fig. 4. Entries of the PROPERTY database by the exampledescriptions of the (a) ‘minor groove width’ (Karas et al., 1996) and‘persistence length’ (Hogan and Austin, 1987).
Exhaustive sorting out of characteristics
For each site, the system ACTIVITY analyses all the possiblecombinations of the oligonucleotides Z of length m with all theweight functions w(i) considered. By analysing the statisticalcharacteristics of the sites, for each oligonucleotide Z of lengthm, 180 functions w(i), each characterized by single extremum(minimum or maximum) with specific location and shape(Figure 3), were considered. Under the fixed combination< Z,m,w>, for each sequence S, a weighted concentration ofoligonucleotide XZmw(S) is calculated by equation (2).Analogously, for the conformational and physicochemicalfeatures, the exhaustive sorting of all possible combinations< q,a,b> is performed. For each combination, the valueXqab(S) is calculated by equation (3).
Utility of applying the features for site activityprediction
For each sequence Sn from the set with known site activity Fn,a concentration Xzmw(Sn) of the oligonucleotide Z of length m,weighted by the function w(i), is estimated. If the pairs{Xzmw(Sn), Fn} meet the conditions of regression analysis(Forster and Ronr, 1979), the value Fn is predicted by usingXzmw. To test these conditions, the simple regression iscalculated:
FZmw(Sn) � f0 � f1 � XZmw(Sn) (4)
where f0 and f1 are regression coefficients estimated for thepairs {Xzmw(Sn), Fn}.
By equation (4), for each sequence of site Sn, the site activityvalue Fzmw(Sn) is predicted from the respective featureXzmw(Sn). A deviation ∆n = Fzmw(Sn) – Fn of the predictedactivity value from the experimental one is also calculated. Forthe values {Fzmw(Sn), Fn, ∆n}, 11 conditions of regressionanalysis were tested (Forster and Ronr, 1979). In order tominimize the influence of heterogeneity of the tested values{Fzmw(Sn), Fn, ∆n}, this set is subdivided into twonon-overlapping subsets equal in volume. The testing of all 11conditions is carried out independently for each of two subsets.Besides, by the corresponding statistical criterion (Lehman,1959), the level of significance, αrt, is estimated, so that the rthcondition (1 ≤ r ≤ 11) holds for the tth subset (1 ≤ t ≤ 2). Sincethese checked requirements are of different essence, fuzzy logic(Zadeh, 1965) is applied to generalize each criterion-specific αrtfor the tested feature XZmw to the universal scale urt(Xzmw, F),the so-called ‘utility’, which is estimated as:
urt(XZmw, F) �� 1, if�rt � 0.01;
1.3–28.3 � �rt � 55.6 � �2rt, if 0.01 �rt 0.1;
–1, if�rt 0.1.
(5)
According to the utility theory for decision making(Fishburn, 1970), urt(Xzmw, F) is called ‘partial utility ofapplying the features XZmw for predicting the activity F’. Aftertesting all 11 conditions for two subsets, the feature XZmw isprovided by 11 × 2 = 22 partial utilities urt(Xzmw, F). Theirmean value represents ‘the integral utility of the feature XZmwfor predicting the activity F’ (Fishburn, 1970):
U(XZmw, F) �
�s
t�1
�11
r�1
urt (XZmwF)
22(6)
Revealing significant context features of the sites
In what follows, we consider only the features XZmw satisfyingthe condition:
U(XZmw,F) 0 (7)
In order that the feature XZmw could fit condition (7), itshould satisfy at least 11 out of 22 tested conditions for α <0.01. If there exist several linearly dependent significantfeatures XZmw with the utility U(XZmw, F) > 0, then only oneof them with the maximal utility is chosen. As a result, arestricted set of linear-independent features XZmw,significantly correlating to the site activity and not correlatingto each other, is selected and stored in the databaseKNOWLEDGE (Figure 5). Analogously, the significant
M.P.Ponomarenko et al.
692
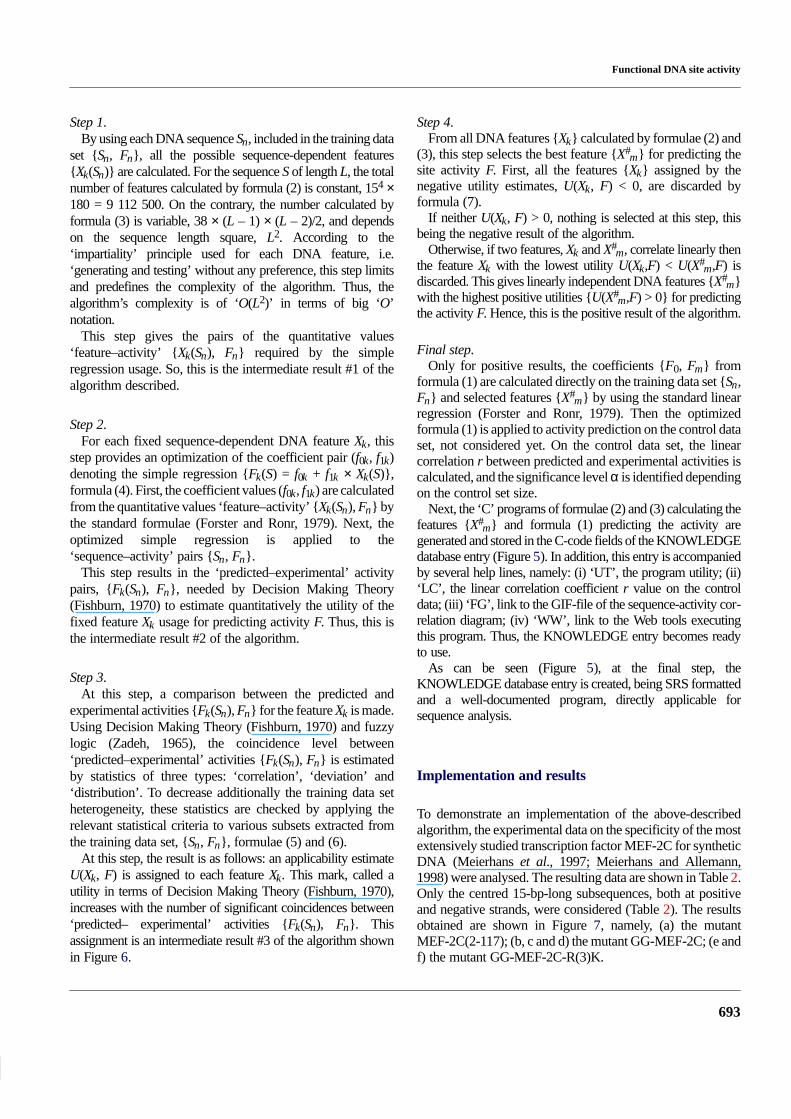
Fig. 5. An entry of the KNOWLEDGE database.
conformational and physicochemical features Xqab areselected.
Construction of the method for predicting siteactivity
Using the features selected for the site and applying themultiple linear regression, an optimization of the canonicalequation (1) is performed for constructing the method for siteactivity prediction. C-code of the program enabling thecalculation of the site activity value for an arbitrary sequenceis automatically generated by the system ACTIVITYaccording to the optimized equation (1) and is stored in theKNOWLEDGE database (Figure 5).
Algorithm
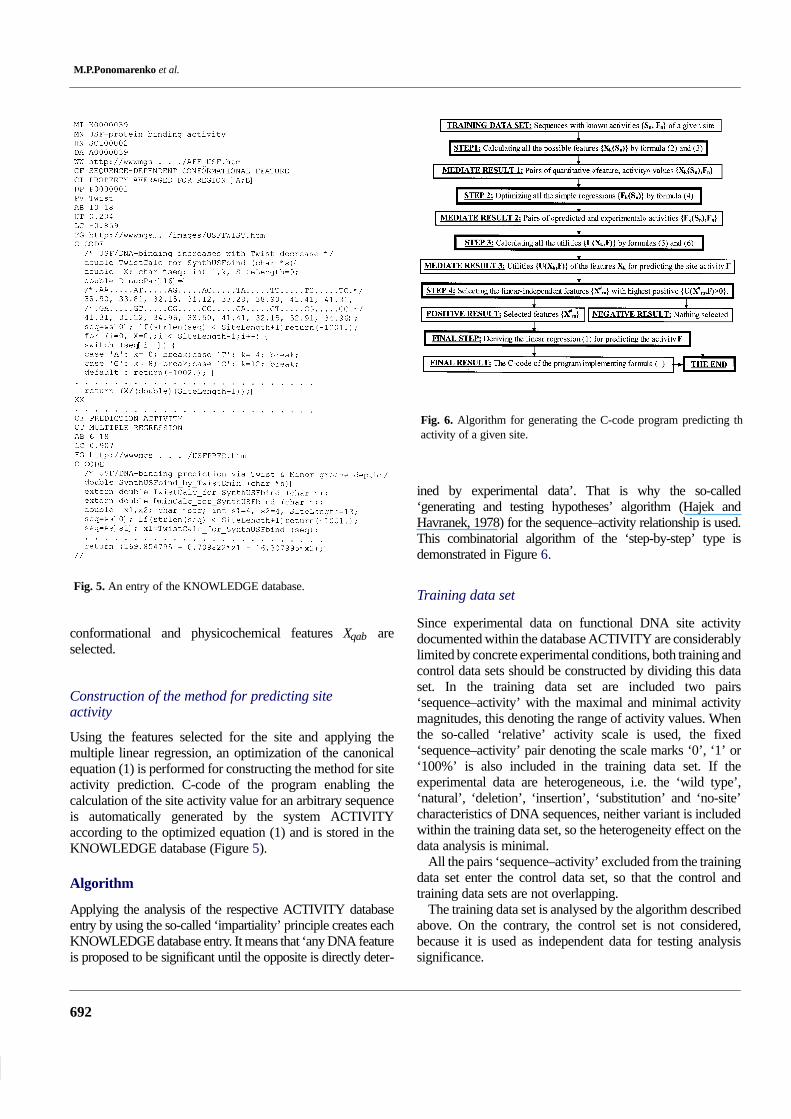
Applying the analysis of the respective ACTIVITY databaseentry by using the so-called ‘impartiality’ principle creates eachKNOWLEDGE database entry. It means that ‘any DNA featureis proposed to be significant until the opposite is directly deter-
Fig. 6. Algorithm for generating the C-code program predicting thactivity of a given site.
ined by experimental data’. That is why the so-called‘generating and testing hypotheses’ algorithm (Hajek andHavranek, 1978) for the sequence–activity relationship is used.This combinatorial algorithm of the ‘step-by-step’ type isdemonstrated in Figure 6.
Training data set
Since experimental data on functional DNA site activitydocumented within the database ACTIVITY are considerablylimited by concrete experimental conditions, both training andcontrol data sets should be constructed by dividing this dataset. In the training data set are included two pairs‘sequence–activity’ with the maximal and minimal activitymagnitudes, this denoting the range of activity values. Whenthe so-called ‘relative’ activity scale is used, the fixed‘sequence–activity’ pair denoting the scale marks ‘0’, ‘1’ or‘100%’ is also included in the training data set. If theexperimental data are heterogeneous, i.e. the ‘wild type’,‘natural’, ‘deletion’, ‘insertion’, ‘substitution’ and ‘no-site’characteristics of DNA sequences, neither variant is includedwithin the training data set, so the heterogeneity effect on thedata analysis is minimal.
All the pairs ‘sequence–activity’ excluded from the trainingdata set enter the control data set, so that the control andtraining data sets are not overlapping.
The training data set is analysed by the algorithm describedabove. On the contrary, the control set is not considered,because it is used as independent data for testing analysissignificance.
Functional DNA site activity
693
Step 1.By using each DNA sequence Sn, included in the training data
set {Sn, Fn}, all the possible sequence-dependent features{Xk(Sn)} are calculated. For the sequence S of length L, the totalnumber of features calculated by formula (2) is constant, 154 ×180 = 9 112 500. On the contrary, the number calculated byformula (3) is variable, 38 × (L – 1) × (L – 2)/2, and dependson the sequence length square, L2. According to the‘impartiality’ principle used for each DNA feature, i.e.‘generating and testing’ without any preference, this step limitsand predefines the complexity of the algorithm. Thus, thealgorithm’s complexity is of ‘O(L2)’ in terms of big ‘O’notation.
This step gives the pairs of the quantitative values‘feature–activity’ {Xk(Sn), Fn} required by the simpleregression usage. So, this is the intermediate result #1 of thealgorithm described.
Step 2.For each fixed sequence-dependent DNA feature Xk, this
step provides an optimization of the coefficient pair (f0k, f1k)denoting the simple regression {Fk(S) = f0k + f1k × Xk(S)},formula (4). First, the coefficient values (f0k, f1k) are calculatedfrom the quantitative values ‘feature–activity’ {Xk(Sn), Fn} bythe standard formulae (Forster and Ronr, 1979). Next, theoptimized simple regression is applied to the‘sequence–activity’ pairs {Sn, Fn}.
This step results in the ‘predicted–experimental’ activitypairs, {Fk(Sn), Fn}, needed by Decision Making Theory(Fishburn, 1970) to estimate quantitatively the utility of thefixed feature Xk usage for predicting activity F. Thus, this isthe intermediate result #2 of the algorithm.
Step 3.At this step, a comparison between the predicted and
experimental activities {Fk(Sn), Fn} for the feature Xk is made.Using Decision Making Theory (Fishburn, 1970) and fuzzylogic (Zadeh, 1965), the coincidence level between‘predicted–experimental’ activities {Fk(Sn), Fn} is estimatedby statistics of three types: ‘correlation’, ‘deviation’ and‘distribution’. To decrease additionally the training data setheterogeneity, these statistics are checked by applying therelevant statistical criteria to various subsets extracted fromthe training data set, {Sn, Fn}, formulae (5) and (6).
At this step, the result is as follows: an applicability estimateU(Xk, F) is assigned to each feature Xk. This mark, called autility in terms of Decision Making Theory (Fishburn, 1970),increases with the number of significant coincidences between‘predicted– experimental’ activities {Fk(Sn), Fn}. Thisassignment is an intermediate result #3 of the algorithm shownin Figure 6.
Step 4.From all DNA features {Xk} calculated by formulae (2) and
(3), this step selects the best feature {X#m} for predicting the
site activity F. First, all the features {Xk} assigned by thenegative utility estimates, U(Xk, F) < 0, are discarded byformula (7).
If neither U(Xk, F) > 0, nothing is selected at this step, thisbeing the negative result of the algorithm.
Otherwise, if two features, Xk and X#m, correlate linearly then
the feature Xk with the lowest utility U(Xk,F) < U(X#m,F) is
discarded. This gives linearly independent DNA features {X#m}
with the highest positive utilities {U(X#m,F) > 0} for predicting
the activity F. Hence, this is the positive result of the algorithm.
Final step.Only for positive results, the coefficients {F0, Fm} from
formula (1) are calculated directly on the training data set {Sn,Fn} and selected features {X#
m} by using the standard linearregression (Forster and Ronr, 1979). Then the optimizedformula (1) is applied to activity prediction on the control dataset, not considered yet. On the control data set, the linearcorrelation r between predicted and experimental activities iscalculated, and the significance level α is identified dependingon the control set size.
Next, the ‘C’ programs of formulae (2) and (3) calculating thefeatures {X#
m} and formula (1) predicting the activity aregenerated and stored in the C-code fields of the KNOWLEDGEdatabase entry (Figure 5). In addition, this entry is accompaniedby several help lines, namely: (i) ‘UT’, the program utility; (ii)‘LC’, the linear correlation coefficient r value on the controldata; (iii) ‘FG’, link to the GIF-file of the sequence-activity cor-relation diagram; (iv) ‘WW’, link to the Web tools executingthis program. Thus, the KNOWLEDGE entry becomes readyto use.
As can be seen (Figure 5), at the final step, theKNOWLEDGE database entry is created, being SRS formattedand a well-documented program, directly applicable forsequence analysis.
Implementation and results
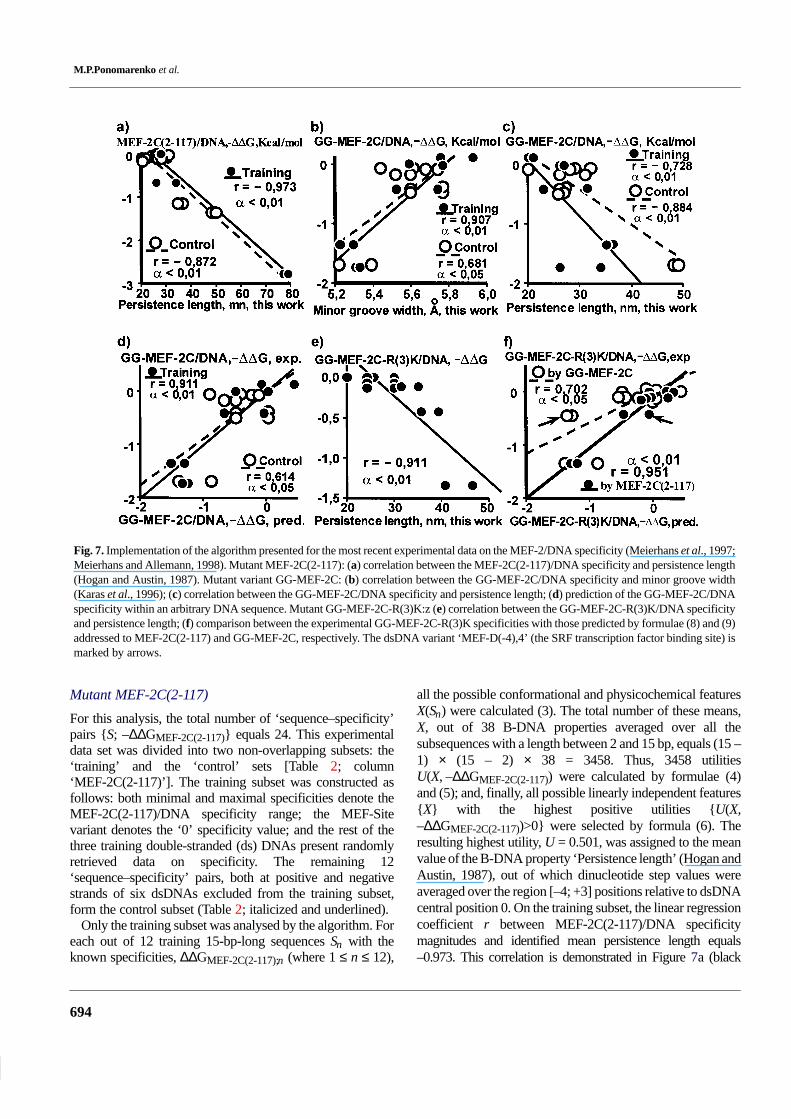
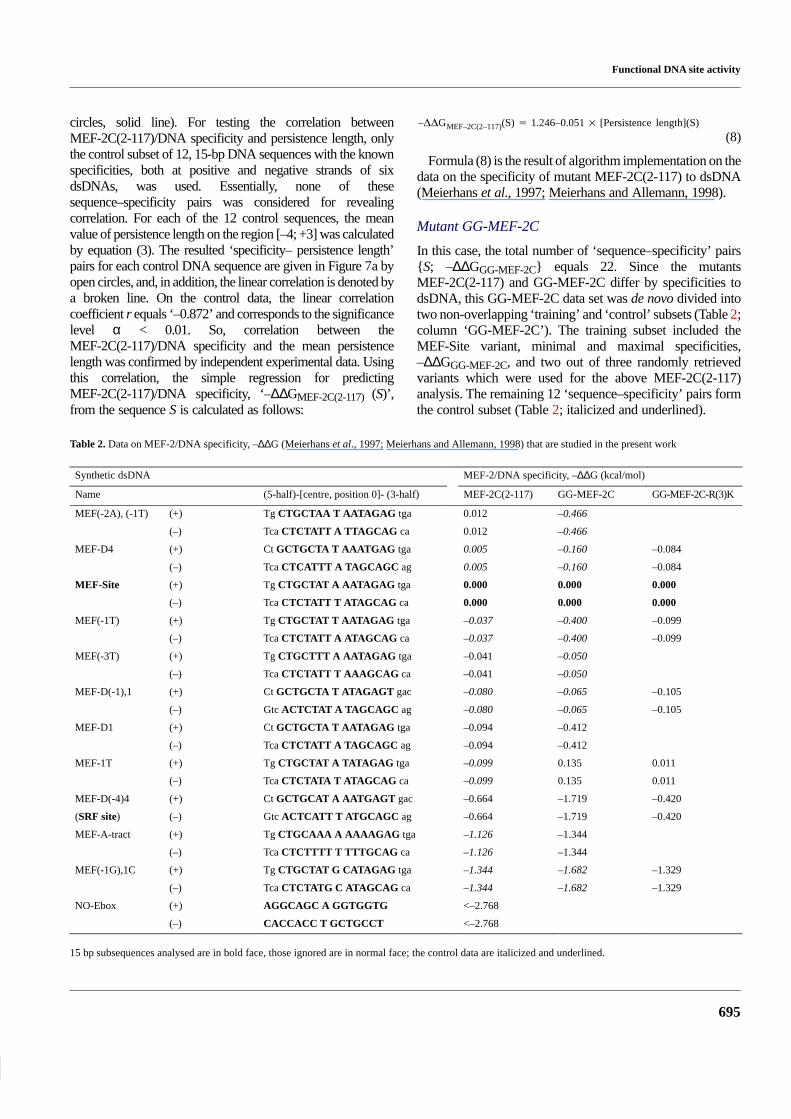
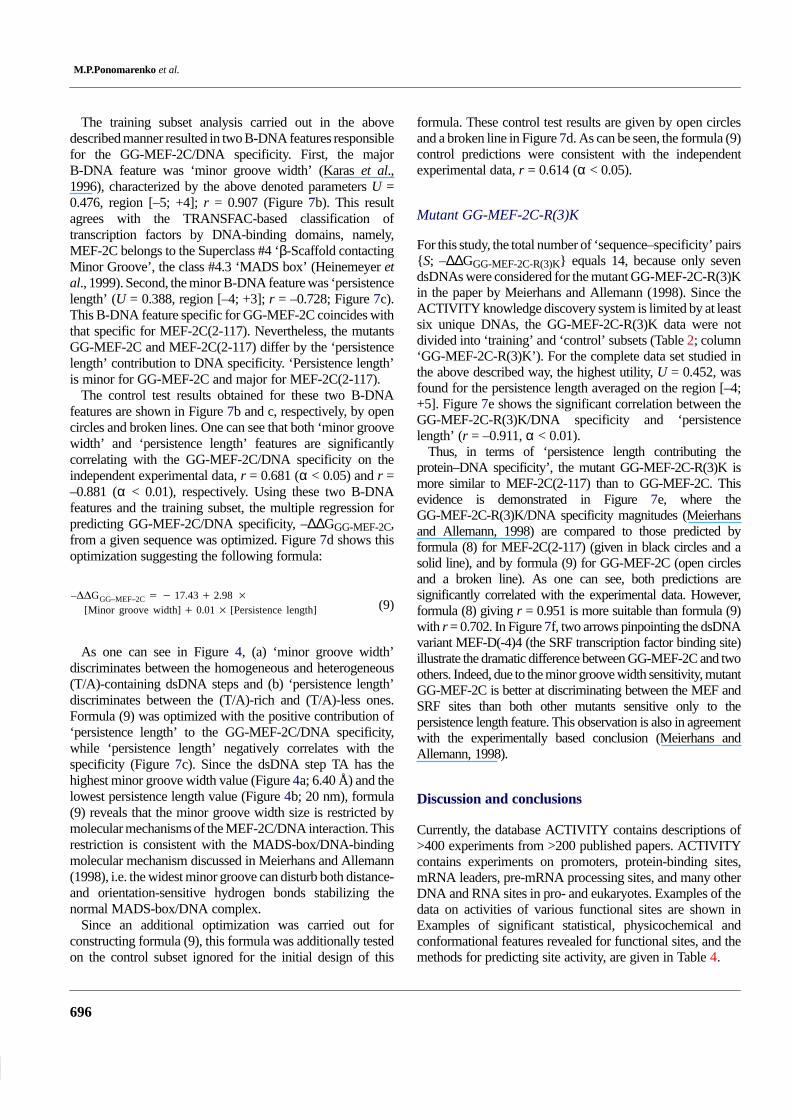
To demonstrate an implementation of the above-describedalgorithm, the experimental data on the specificity of the mostextensively studied transcription factor MEF-2C for syntheticDNA (Meierhans et al., 1997; Meierhans and Allemann,1998) were analysed. The resulting data are shown in Table 2.Only the centred 15-bp-long subsequences, both at positiveand negative strands, were considered (Table 2). The resultsobtained are shown in Figure 7, namely, (a) the mutantMEF-2C(2-117); (b, c and d) the mutant GG-MEF-2C; (e andf) the mutant GG-MEF-2C-R(3)K.
M.P.Ponomarenko et al.
694
Fig. 7. Implementation of the algorithm presented for the most recent experimental data on the MEF-2/DNA specificity (Meierhans et al., 1997;Meierhans and Allemann, 1998). Mutant MEF-2C(2-117): (a) correlation between the MEF-2C(2-117)/DNA specificity and persistence length(Hogan and Austin, 1987). Mutant variant GG-MEF-2C: (b) correlation between the GG-MEF-2C/DNA specificity and minor groove width(Karas et al., 1996); (c) correlation between the GG-MEF-2C/DNA specificity and persistence length; (d) prediction of the GG-MEF-2C/DNAspecificity within an arbitrary DNA sequence. Mutant GG-MEF-2C-R(3)K:z (e) correlation between the GG-MEF-2C-R(3)K/DNA specificityand persistence length; (f) comparison between the experimental GG-MEF-2C-R(3)K specificities with those predicted by formulae (8) and (9)addressed to MEF-2C(2-117) and GG-MEF-2C, respectively. The dsDNA variant ‘MEF-D(-4),4’ (the SRF transcription factor binding site) ismarked by arrows.
Mutant MEF-2C(2-117)
For this analysis, the total number of ‘sequence–specificity’pairs {S; –∆∆GMEF-2C(2-117)} equals 24. This experimentaldata set was divided into two non-overlapping subsets: the‘training’ and the ‘control’ sets [Table 2; column‘MEF-2C(2-117)’]. The training subset was constructed asfollows: both minimal and maximal specificities denote theMEF-2C(2-117)/DNA specificity range; the MEF-Sitevariant denotes the ‘0’ specificity value; and the rest of thethree training double-stranded (ds) DNAs present randomlyretrieved data on specificity. The remaining 12‘sequence–specificity’ pairs, both at positive and negativestrands of six dsDNAs excluded from the training subset,form the control subset (Table 2; italicized and underlined).
Only the training subset was analysed by the algorithm. Foreach out of 12 training 15-bp-long sequences Sn with theknown specificities, ∆∆GMEF-2C(2-117);n (where 1 ≤ n ≤ 12),
all the possible conformational and physicochemical featuresX(Sn) were calculated (3). The total number of these means,X, out of 38 B-DNA properties averaged over all thesubsequences with a length between 2 and 15 bp, equals (15 –1) × (15 – 2) × 38 = 3458. Thus, 3458 utilitiesU(X, –∆∆GMEF-2C(2-117)) were calculated by formulae (4)and (5); and, finally, all possible linearly independent features{X} with the highest positive utilities {U(X,–∆∆GMEF-2C(2-117))>0} were selected by formula (6). Theresulting highest utility, U = 0.501, was assigned to the meanvalue of the B-DNA property ‘Persistence length’ (Hogan andAustin, 1987), out of which dinucleotide step values wereaveraged over the region [–4; +3] positions relative to dsDNAcentral position 0. On the training subset, the linear regressioncoefficient r between MEF-2C(2-117)/DNA specificitymagnitudes and identified mean persistence length equals–0.973. This correlation is demonstrated in Figure 7a (black
Functional DNA site activity
695
circles, solid line). For testing the correlation betweenMEF-2C(2-117)/DNA specificity and persistence length, onlythe control subset of 12, 15-bp DNA sequences with the knownspecificities, both at positive and negative strands of sixdsDNAs, was used. Essentially, none of thesesequence–specificity pairs was considered for revealingcorrelation. For each of the 12 control sequences, the meanvalue of persistence length on the region [–4; +3] was calculatedby equation (3). The resulted ‘specificity– persistence length’pairs for each control DNA sequence are given in Figure 7a byopen circles, and, in addition, the linear correlation is denoted bya broken line. On the control data, the linear correlationcoefficient r equals ‘–0.872’ and corresponds to the significancelevel α < 0.01. So, correlation between theMEF-2C(2-117)/DNA specificity and the mean persistencelength was confirmed by independent experimental data. Usingthis correlation, the simple regression for predictingMEF-2C(2-117)/DNA specificity, ‘–∆∆GMEF-2C(2-117) (S)’,from the sequence S is calculated as follows:
–��GMEF–2C(2–117)(S) � 1.246–0.051 � [Persistence length](S)
(8)
Formula (8) is the result of algorithm implementation on thedata on the specificity of mutant MEF-2C(2-117) to dsDNA(Meierhans et al., 1997; Meierhans and Allemann, 1998).
Mutant GG-MEF-2C
In this case, the total number of ‘sequence–specificity’ pairs{S; –∆∆GGG-MEF-2C} equals 22. Since the mutantsMEF-2C(2-117) and GG-MEF-2C differ by specificities todsDNA, this GG-MEF-2C data set was de novo divided intotwo non-overlapping ‘training’ and ‘control’ subsets (Table 2;column ‘GG-MEF-2C’). The training subset included theMEF-Site variant, minimal and maximal specificities,–∆∆GGG-MEF-2C, and two out of three randomly retrievedvariants which were used for the above MEF-2C(2-117)analysis. The remaining 12 ‘sequence–specificity’ pairs formthe control subset (Table 2; italicized and underlined).
Table 2. Data on MEF-2/DNA specificity, –∆∆G (Meierhans et al., 1997; Meierhans and Allemann, 1998) that are studied in the present work
Synthetic dsDNA MEF-2/DNA specificity, –∆∆G (kcal/mol)
Name (5-half)-[centre, position 0]- (3-half) MEF-2C(2-117) GG-MEF-2C GG-MEF-2C-R(3)K
MEF(-2A), (-1T) (+) Tg CTGCTAA T AATAGAG tga 0.012 –0.466
(–) Tca CTCTATT A TTAGCAG ca 0.012 –0.466
MEF-D4 (+) Ct GCTGCTA T AAATGAG tga 0.005 –0.160 –0.084
(–) Tca CTCATTT A TAGCAGC ag 0.005 –0.160 –0.084
MEF-Site (+) Tg CTGCTAT A AATAGAG tga 0.000 0.000 0.000
(–) Tca CTCTATT T ATAGCAG ca 0.000 0.000 0.000
MEF(-1T) (+) Tg CTGCTAT T AATAGAG tga –0.037 –0.400 –0.099
(–) Tca CTCTATT A ATAGCAG ca –0.037 –0.400 –0.099
MEF(-3T) (+) Tg CTGCTTT A AATAGAG tga –0.041 –0.050
(–) Tca CTCTATT T AAAGCAG ca –0.041 –0.050
MEF-D(-1),1 (+) Ct GCTGCTA T ATAGAGT gac –0.080 –0.065 –0.105
(–) Gtc ACTCTAT A TAGCAGC ag –0.080 –0.065 –0.105
MEF-D1 (+) Ct GCTGCTA T AATAGAG tga –0.094 –0.412
(–) Tca CTCTATT A TAGCAGC ag –0.094 –0.412
MEF-1T (+) Tg CTGCTAT A TATAGAG tga –0.099 0.135 0.011
(–) Tca CTCTATA T ATAGCAG ca –0.099 0.135 0.011
MEF-D(-4)4 (+) Ct GCTGCAT A AATGAGT gac –0.664 –1.719 –0.420
(SRF site) (–) Gtc ACTCATT T ATGCAGC ag –0.664 –1.719 –0.420
MEF-A-tract (+) Tg CTGCAAA A AAAAGAG tga –1.126 –1.344
(–) Tca CTCTTTT T TTTGCAG ca –1.126 –1.344
MEF(-1G),1C (+) Tg CTGCTAT G CATAGAG tga –1.344 –1.682 –1.329
(–) Tca CTCTATG C ATAGCAG ca –1.344 –1.682 –1.329
NO-Ebox (+) AGGCAGC A GGTGGTG <–2.768
(–) CACCACC T GCTGCCT <–2.768
15 bp subsequences analysed are in bold face, those ignored are in normal face; the control data are italicized and underlined.
M.P.Ponomarenko et al.
696
The training subset analysis carried out in the abovedescribed manner resulted in two B-DNA features responsiblefor the GG-MEF-2C/DNA specificity. First, the majorB-DNA feature was ‘minor groove width’ (Karas et al.,1996), characterized by the above denoted parameters U =0.476, region [–5; +4]; r = 0.907 (Figure 7b). This resultagrees with the TRANSFAC-based classification oftranscription factors by DNA-binding domains, namely,MEF-2C belongs to the Superclass #4 ‘β-Scaffold contactingMinor Groove’, the class #4.3 ‘MADS box’ (Heinemeyer etal., 1999). Second, the minor B-DNA feature was ‘persistencelength’ (U = 0.388, region [–4; +3]; r = –0.728; Figure 7c).This B-DNA feature specific for GG-MEF-2C coincides withthat specific for MEF-2C(2-117). Nevertheless, the mutantsGG-MEF-2C and MEF-2C(2-117) differ by the ‘persistencelength’ contribution to DNA specificity. ‘Persistence length’is minor for GG-MEF-2C and major for MEF-2C(2-117).
The control test results obtained for these two B-DNAfeatures are shown in Figure 7b and c, respectively, by opencircles and broken lines. One can see that both ‘minor groovewidth’ and ‘persistence length’ features are significantlycorrelating with the GG-MEF-2C/DNA specificity on theindependent experimental data, r = 0.681 (α < 0.05) and r =–0.881 (α < 0.01), respectively. Using these two B-DNAfeatures and the training subset, the multiple regression forpredicting GG-MEF-2C/DNA specificity, –∆∆GGG-MEF-2C,from a given sequence was optimized. Figure 7d shows thisoptimization suggesting the following formula:
–��GGG–MEF–2C � � 17.43 � 2.98 �
[Minor groove width] � 0.01 � [Persistence length] (9)
As one can see in Figure 4, (a) ‘minor groove width’discriminates between the homogeneous and heterogeneous(T/A)-containing dsDNA steps and (b) ‘persistence length’discriminates between the (T/A)-rich and (T/A)-less ones.Formula (9) was optimized with the positive contribution of‘persistence length’ to the GG-MEF-2C/DNA specificity,while ‘persistence length’ negatively correlates with thespecificity (Figure 7c). Since the dsDNA step TA has thehighest minor groove width value (Figure 4a; 6.40 Å) and thelowest persistence length value (Figure 4b; 20 nm), formula(9) reveals that the minor groove width size is restricted bymolecular mechanisms of the MEF-2C/DNA interaction. Thisrestriction is consistent with the MADS-box/DNA-bindingmolecular mechanism discussed in Meierhans and Allemann(1998), i.e. the widest minor groove can disturb both distance-and orientation-sensitive hydrogen bonds stabilizing thenormal MADS-box/DNA complex.
Since an additional optimization was carried out forconstructing formula (9), this formula was additionally testedon the control subset ignored for the initial design of this
formula. These control test results are given by open circlesand a broken line in Figure 7d. As can be seen, the formula (9)control predictions were consistent with the independentexperimental data, r = 0.614 (α < 0.05).
Mutant GG-MEF-2C-R(3)K
For this study, the total number of ‘sequence–specificity’ pairs{S; –∆∆GGG-MEF-2C-R(3)K} equals 14, because only sevendsDNAs were considered for the mutant GG-MEF-2C-R(3)Kin the paper by Meierhans and Allemann (1998). Since theACTIVITY knowledge discovery system is limited by at leastsix unique DNAs, the GG-MEF-2C-R(3)K data were notdivided into ‘training’ and ‘control’ subsets (Table 2; column‘GG-MEF-2C-R(3)K’). For the complete data set studied inthe above described way, the highest utility, U = 0.452, wasfound for the persistence length averaged on the region [–4;+5]. Figure 7e shows the significant correlation between theGG-MEF-2C-R(3)K/DNA specificity and ‘persistencelength’ (r = –0.911, α < 0.01).
Thus, in terms of ‘persistence length contributing theprotein–DNA specificity’, the mutant GG-MEF-2C-R(3)K ismore similar to MEF-2C(2-117) than to GG-MEF-2C. Thisevidence is demonstrated in Figure 7e, where theGG-MEF-2C-R(3)K/DNA specificity magnitudes (Meierhansand Allemann, 1998) are compared to those predicted byformula (8) for MEF-2C(2-117) (given in black circles and asolid line), and by formula (9) for GG-MEF-2C (open circlesand a broken line). As one can see, both predictions aresignificantly correlated with the experimental data. However,formula (8) giving r = 0.951 is more suitable than formula (9)with r = 0.702. In Figure 7f, two arrows pinpointing the dsDNAvariant MEF-D(-4)4 (the SRF transcription factor binding site)illustrate the dramatic difference between GG-MEF-2C and twoothers. Indeed, due to the minor groove width sensitivity, mutantGG-MEF-2C is better at discriminating between the MEF andSRF sites than both other mutants sensitive only to thepersistence length feature. This observation is also in agreementwith the experimentally based conclusion (Meierhans andAllemann, 1998).
Discussion and conclusions
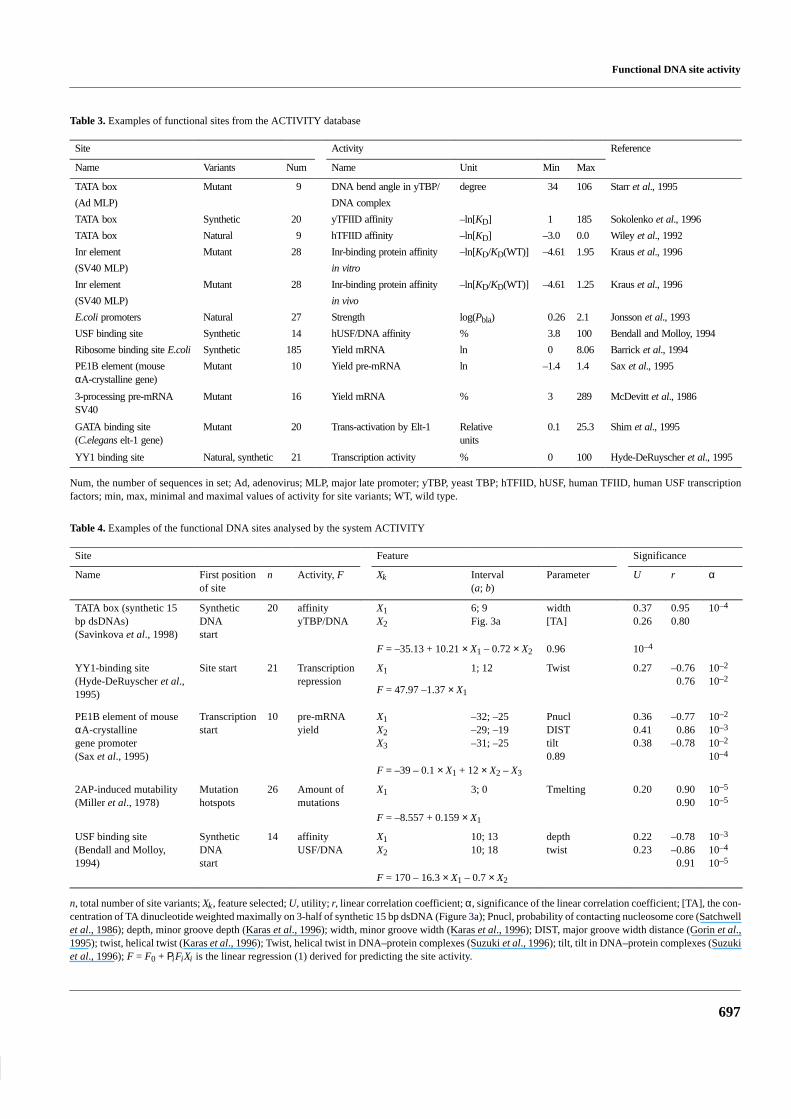
Currently, the database ACTIVITY contains descriptions of>400 experiments from >200 published papers. ACTIVITYcontains experiments on promoters, protein-binding sites,mRNA leaders, pre-mRNA processing sites, and many otherDNA and RNA sites in pro- and eukaryotes. Examples of thedata on activities of various functional sites are shown inExamples of significant statistical, physicochemical andconformational features revealed for functional sites, and themethods for predicting site activity, are given in Table 4.
Functional DNA site activity
697
Table 3. Examples of functional sites from the ACTIVITY database
Site Activity Reference
Name Variants Num Name Unit Min Max
TATA box Mutant 9 DNA bend angle in yTBP/ degree 34 106 Starr et al., 1995
(Ad MLP) DNA complex
TATA box Synthetic 20 yTFIID affinity –ln[KD] 1 185 Sokolenko et al., 1996
TATA box Natural 9 hTFIID affinity –ln[KD] –3.0 0.0 Wiley et al., 1992
Inr element Mutant 28 Inr-binding protein affinity –ln[KD/KD(WT)] –4.61 1.95 Kraus et al., 1996
(SV40 MLP) in vitro
Inr element Mutant 28 Inr-binding protein affinity –ln[KD/KD(WT)] –4.61 1.25 Kraus et al., 1996
(SV40 MLP) in vivo
E.coli promoters Natural 27 Strength log(Pbla) 0.26 2.1 Jonsson et al., 1993
USF binding site Synthetic 14 hUSF/DNA affinity % 3.8 100 Bendall and Molloy, 1994
Ribosome binding site E.coli Synthetic 185 Yield mRNA ln 0 8.06 Barrick et al., 1994
PE1B element (mouseαA-crystalline gene)
Mutant 10 Yield pre-mRNA ln –1.4 1.4 Sax et al., 1995
3-processing pre-mRNASV40
Mutant 16 Yield mRNA % 3 289 McDevitt et al., 1986
GATA binding site(C.elegans elt-1 gene)
Mutant 20 Trans-activation by Elt-1 Relativeunits
0.1 25.3 Shim et al., 1995
YY1 binding site Natural, synthetic 21 Transcription activity % 0 100 Hyde-DeRuyscher et al., 1995
Num, the number of sequences in set; Ad, adenovirus; MLP, major late promoter; yTBP, yeast TBP; hTFIID, hUSF, human TFIID, human USF transcriptionfactors; min, max, minimal and maximal values of activity for site variants; WT, wild type.
Table 4. Examples of the functional DNA sites analysed by the system ACTIVITY
Site Feature Significance
Name First positionof site
n Activity, F Xk Interval(a; b)
Parameter U r α
TATA box (synthetic 15bp dsDNAs)(Savinkova et al., 1998)
SyntheticDNAstart
20 affinityyTBP/DNA
X1X2
6; 9Fig. 3a
width[TA]
0.370.26
0.950.80
10–4
F = –35.13 + 10.21 × X1 – 0.72 × X2 0.96 10–4
YY1-binding site Site start 21 Transcription X1 1; 12 Twist 0.27 –0.76 10–2
–2(Hyde-DeRuyscher et al.,1995)
repressionF = 47.97 –1.37 × X1
0.76 10
PE1B element of mouseαA-crystallinegene promoter(Sax et al., 1995)
Transcriptionstart
10 pre-mRNAyield
X1X2X3
–32; –25–29; –19–31; –25
PnuclDISTtilt0.89
0.360.410.38
–0.770.86
–0.78
10–2
10–3
10–2
10–4
F = –39 – 0.1 × X1 + 12 × X2 – X3
2AP-induced mutability(Miller et al., 1978)
Mutationhotspots
26 Amount ofmutations
X1 3; 0 Tmelting 0.20 0.900.90
10–5
10–5
F = –8.557 + 0.159 × X1
USF binding site(Bendall and Molloy,1994)
SyntheticDNAstart
14 affinityUSF/DNA
X1X2
10; 1310; 18
depthtwist
0.220.23
–0.78–0.86
0.91
10–3
10–4
10–5
F = 170 – 16.3 × X1 – 0.7 × X2
n, total number of site variants; Xk, feature selected; U, utility; r, linear correlation coefficient; α, significance of the linear correlation coefficient; [TA], the con-centration of TA dinucleotide weighted maximally on 3-half of synthetic 15 bp dsDNA (Figure 3a); Pnucl, probability of contacting nucleosome core (Satchwellet al., 1986); depth, minor groove depth (Karas et al., 1996); width, minor groove width (Karas et al., 1996); DIST, major groove width distance (Gorin et al.,1995); twist, helical twist (Karas et al., 1996); Twist, helical twist in DNA–protein complexes (Suzuki et al., 1996); tilt, tilt in DNA–protein complexes (Suzukiet al., 1996); F = F0 + ΡiFiXi is the linear regression (1) derived for predicting the site activity.
M.P.Ponomarenko et al.
698
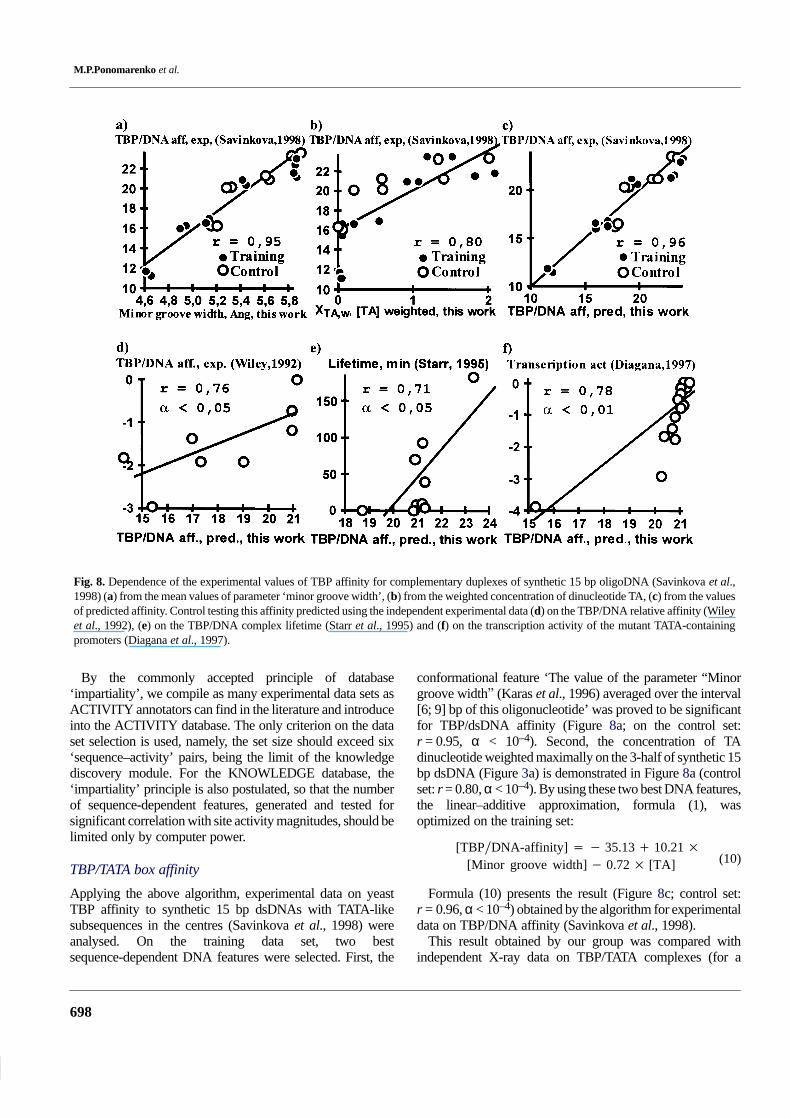
Fig. 8. Dependence of the experimental values of TBP affinity for complementary duplexes of synthetic 15 bp oligoDNA (Savinkova et al.,1998) (a) from the mean values of parameter ‘minor groove width’, (b) from the weighted concentration of dinucleotide TA, (c) from the valuesof predicted affinity. Control testing this affinity predicted using the independent experimental data (d) on the TBP/DNA relative affinity (Wileyet al., 1992), (e) on the TBP/DNA complex lifetime (Starr et al., 1995) and (f) on the transcription activity of the mutant TATA-containingpromoters (Diagana et al., 1997).
By the commonly accepted principle of database‘impartiality’, we compile as many experimental data sets asACTIVITY annotators can find in the literature and introduceinto the ACTIVITY database. The only criterion on the dataset selection is used, namely, the set size should exceed six‘sequence–activity’ pairs, being the limit of the knowledgediscovery module. For the KNOWLEDGE database, the‘impartiality’ principle is also postulated, so that the numberof sequence-dependent features, generated and tested forsignificant correlation with site activity magnitudes, should belimited only by computer power.
TBP/TATA box affinity
Applying the above algorithm, experimental data on yeastTBP affinity to synthetic 15 bp dsDNAs with TATA-likesubsequences in the centres (Savinkova et al., 1998) wereanalysed. On the training data set, two bestsequence-dependent DNA features were selected. First, the
conformational feature ‘The value of the parameter “Minorgroove width� (Karas et al., 1996) averaged over the interval[6; 9] bp of this oligonucleotide’ was proved to be significantfor TBP/dsDNA affinity (Figure 8a; on the control set:r = 0.95, α < 10–4). Second, the concentration of TAdinucleotide weighted maximally on the 3-half of synthetic 15bp dsDNA (Figure 3a) is demonstrated in Figure 8a (controlset: r = 0.80, α < 10–4). By using these two best DNA features,the linear–additive approximation, formula (1), wasoptimized on the training set:
[TBP�DNA-affinity] � � 35.13 � 10.21 �
[Minor groove width] � 0.72 � [TA] (10)
Formula (10) presents the result (Figure 8c; control set:r = 0.96, α < 10–4) obtained by the algorithm for experimentaldata on TBP/DNA affinity (Savinkova et al., 1998).
This result obtained by our group was compared withindependent X-ray data on TBP/TATA complexes (for a
Functional DNA site activity
699
review, see Jou et al., 1996). The three-dimensional (3D) datahave established that TBP protein binds DNA mainly (i) byintercalating two phenylalanine side chains into the minorgroove of the 8 bp region with asymmetrical consensusTATAAAA and (ii) by making the hydrogen bond and van derVaals’ contacts between the protein and closely 3D-locatedDNA atoms. As can be seen, the importance of the TATA boxminor groove width feature (Figure 8a) is in agreement withTBP/TATA complex 3D structures (Jou et al., 1996). Thepositive correlation between TA dinucleotide concentrationand TBP/DNA affinity magnitudes (Savinkova et al., 1998)shown in Figure 8b is commonly accepted. However,according to formula (10), TA dinucleotide weightedmaximally under the 3-half of the TATA box (Figure 3a)contributes negatively to TBP/DNA affinity. This negativecontribution agrees with asymmetry of the TATA boxconsensus TATAAAA, the 3-half of which is, indeed,no-‘TATA’ (Jou et al., 1996). Since the dsDNA step TA hasthe highest minor groove width, 6.40 Å (Figure 4), thesymmetrical TATA box should have the widest minor groovethat can disturb the distance- and orientation-sensitivehydrogen bonds and van der Vaals’ contacts stabilizing thenormal TBP/TATA complex (Jou et al., 1996). Interestingly,this conclusion on the TBP/TATA complex is also inagreement with the above-described formula (9) for theMEF-2C/DNA specificity (Figure 7). Thus, both the TBP andMEF-2C proteins belonging to the Superclass #4 ‘β-Scaffoldcontacting Minor Groove’ (Heinemeyer et al., 1999) arecharacterized by two significant DNA features. The ‘minorgroove width’ is the common and major feature, whereas theminor features are differing and limiting the size of the minorgroove width.
In addition, we verified formula (10) by using several otherindependent experimental data on (i) TBP/DNA relativeaffinity (Wiley et al., 1992), (ii) TBP/DNA complex lifetime(Starr et al., 1995) and (iii) transcription activity of the mutantTATA-containing promoters (Diagana et al., 1997). Thesecontrol test results are shown in Figure 8d, e and f,respectively. Notably, TATA box activity variances arereliably explained by application of formula (10) to threeindependent experiments.
YY1 repression activity
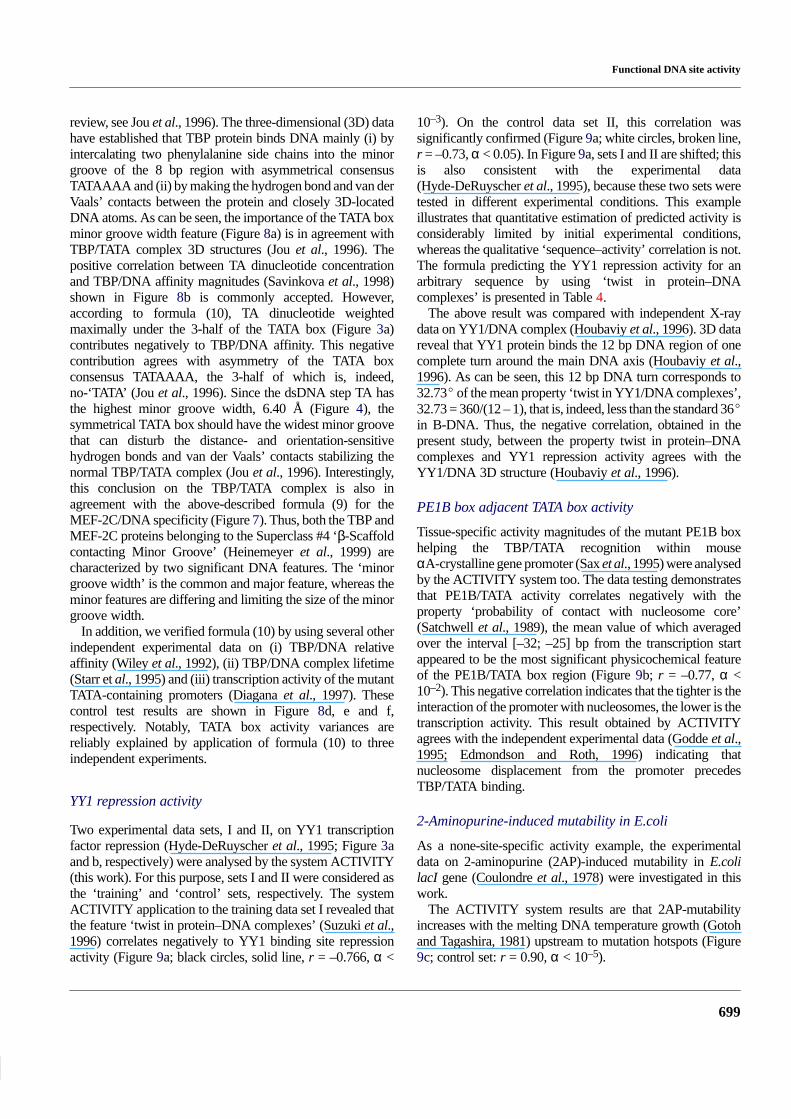
Two experimental data sets, I and II, on YY1 transcriptionfactor repression (Hyde-DeRuyscher et al., 1995; Figure 3aand b, respectively) were analysed by the system ACTIVITY(this work). For this purpose, sets I and II were considered asthe ‘training’ and ‘control’ sets, respectively. The systemACTIVITY application to the training data set I revealed thatthe feature ‘twist in protein–DNA complexes’ (Suzuki et al.,1996) correlates negatively to YY1 binding site repressionactivity (Figure 9a; black circles, solid line, r = –0.766, α <
10–3). On the control data set II, this correlation wassignificantly confirmed (Figure 9a; white circles, broken line,r = –0.73, α < 0.05). In Figure 9a, sets I and II are shifted; thisis also consistent with the experimental data(Hyde-DeRuyscher et al., 1995), because these two sets weretested in different experimental conditions. This exampleillustrates that quantitative estimation of predicted activity isconsiderably limited by initial experimental conditions,whereas the qualitative ‘sequence–activity’ correlation is not.The formula predicting the YY1 repression activity for anarbitrary sequence by using ‘twist in protein–DNAcomplexes’ is presented in Table 4.
The above result was compared with independent X-raydata on YY1/DNA complex (Houbaviy et al., 1996). 3D datareveal that YY1 protein binds the 12 bp DNA region of onecomplete turn around the main DNA axis (Houbaviy et al.,1996). As can be seen, this 12 bp DNA turn corresponds to32.73� of the mean property ‘twist in YY1/DNA complexes’,32.73 = 360/(12 – 1), that is, indeed, less than the standard 36�in B-DNA. Thus, the negative correlation, obtained in thepresent study, between the property twist in protein–DNAcomplexes and YY1 repression activity agrees with theYY1/DNA 3D structure (Houbaviy et al., 1996).
PE1B box adjacent TATA box activity
Tissue-specific activity magnitudes of the mutant PE1B boxhelping the TBP/TATA recognition within mouseαA-crystalline gene promoter (Sax et al., 1995) were analysedby the ACTIVITY system too. The data testing demonstratesthat PE1B/TATA activity correlates negatively with theproperty ‘probability of contact with nucleosome core’(Satchwell et al., 1989), the mean value of which averagedover the interval [–32; –25] bp from the transcription startappeared to be the most significant physicochemical featureof the PE1B/TATA box region (Figure 9b; r = –0.77, α <10–2). This negative correlation indicates that the tighter is theinteraction of the promoter with nucleosomes, the lower is thetranscription activity. This result obtained by ACTIVITYagrees with the independent experimental data (Godde et al.,1995; Edmondson and Roth, 1996) indicating thatnucleosome displacement from the promoter precedesTBP/TATA binding.
2-Aminopurine-induced mutability in E.coli
As a none-site-specific activity example, the experimentaldata on 2-aminopurine (2AP)-induced mutability in E.colilacI gene (Coulondre et al., 1978) were investigated in thiswork.
The ACTIVITY system results are that 2AP-mutabilityincreases with the melting DNA temperature growth (Gotohand Tagashira, 1981) upstream to mutation hotspots (Figure9c; control set: r = 0.90, α < 10–5).
M.P.Ponomarenko et al.
700
Fig. 9. Examples of the ACTIVITY predictions: (a) YY1 repression (Hyde-DeRuyscher et al., 1995) correlates with ‘twist in protein–DNAcomplexes’; (b) the transcription activity of mouse αA-crystalline gene promoter containing the PE1B/TATA box (Sax et al., 1995) correlateswith ‘probability of contact with nucleosome core’; (c) the 2-aminopurine induced mutability (Miller et al., 1978) correlates with ‘meltingtemperature’. Dependence of transcription factor USF-DNA binding affinities (Bendall and Molloy, 1994) from the mean values of parameter(d) ‘helical twist’, (e) ‘minor groove depth’ and (f) comparison of the predicted and experimental affinities. The formulae predicting theabove-demonstrated activities are given and described in Table 4.
This result obtained by ACTIVITY was compared toindependent experimental data on the 2AP-mutabilitymolecular mechanism (Mhaskar and Goodman, 1984). In theexperiment cited, it was established that 2AP can be sequenceindependently replicated by mispairing 2AP:C instead of thenucleotide G. In what follows, this 2AP sequence dependentlyuncorrected by repair machinery can be misread as thenucleotide A analogue. Finally, substitution T appears insteadof C. This experiment has also identified that repair errors aresignificantly more frequent just to the right from the G:C pairsthan the A:T pairs.
Since the melting temperature of G:C pairs is higher thanthat of A:T pairs (Gotoh and Tagashira, 1981), the correlation,detected in this work, between melting temperature upstreammutation hotspots and 2AP-mutability magnitudes is inagreement with independent experimental data on the2AP-mutability molecular mechanism (Mhaskar andGoodman, 1984).
The importance of the DNA region upstream of the2AP-induced mutation hotspot was first computationallysupported by Stormo et al. (1986). As can be seen, the resultobtained by ACTIVITY is in agreement with computationpreviously observed (Stormo et al., 1986).
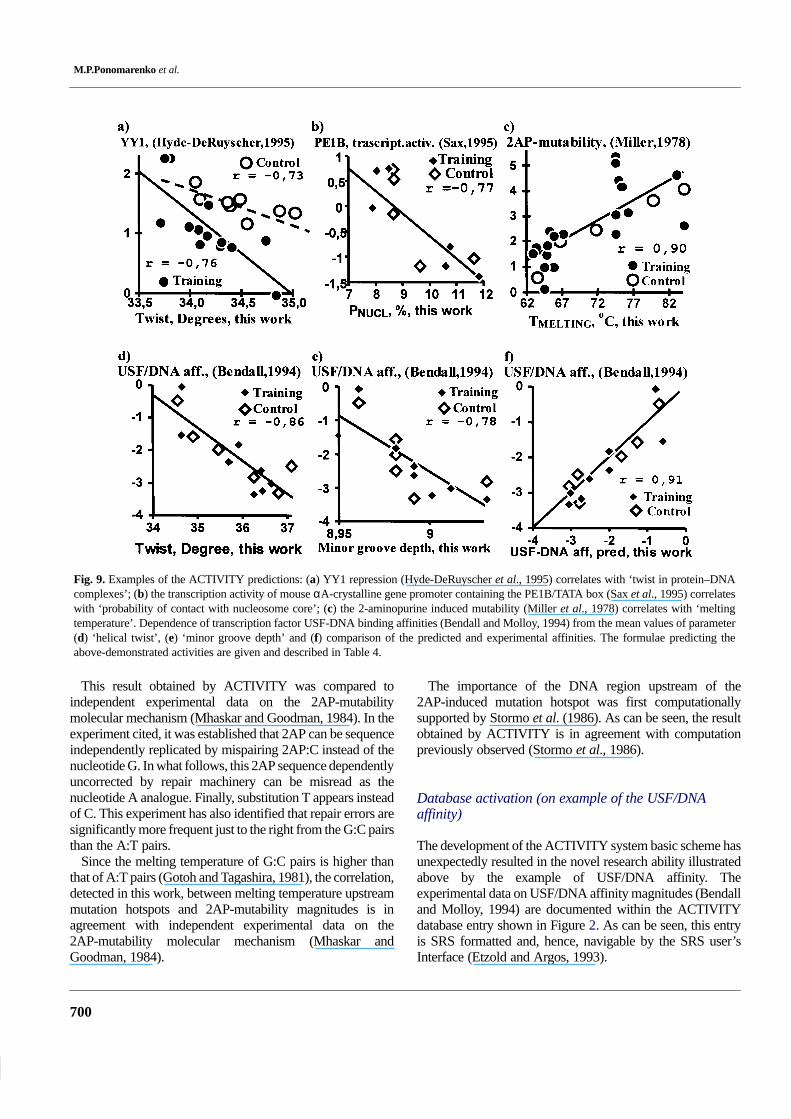
Database activation (on example of the USF/DNAaffinity)
The development of the ACTIVITY system basic scheme hasunexpectedly resulted in the novel research ability illustratedabove by the example of USF/DNA affinity. Theexperimental data on USF/DNA affinity magnitudes (Bendalland Molloy, 1994) are documented within the ACTIVITYdatabase entry shown in Figure 2. As can be seen, this entryis SRS formatted and, hence, navigable by the SRS user’sInterface (Etzold and Argos, 1993).
Functional DNA site activity
701
Fig. 10. An example of the database ACTIVITY usage (‘database activation’ mode). (A) The ACTIVITY entry on the USF/DNA affinitymagnitudes. (B) The KNOWLEDGE entry on USF/DNA affinity correlation with DNA features. (C) The tools predicting USF/DNA affinityby applying the above correlations. (D) An example of an output window for promoter of Syrian hamster HMG CoA reductase gene (EMBL:M15960, fragment [181; 197]) containing the experimatelly identified USF site (bold face and underlined): TRANSFAC: R00711;GTGCCCGTTCTCCGCCCGGGGTGCGAGCAGTGGGCGGTTGTTAAGGCGACCGTTCGTGACGTAGGCCGTCAGGCCGACA-GCCGCCCGGCGATTGGCTAGGCGATCGGACGATCCTTTCT). The data analysis pathway is given by solid arrows and the resultinterpretation pathway by broken arrows.
On experimental data (Bendall and Molloy, 1994), theACTIVITY system demonstrates that USF/DNA affinitymagnitudes correlate with twist (Figure 9d; r = –0.86, α <10–4) and minor groove depth (Figure 9e; r = –0.78, α < 10–3),dinucleotide values of which were taken from Karas et al.(1996). By using these two DNA features, the multipleregression predicting the USF/DNA affinities from anarbitrary DNA sequence was optimized (Table 4), controltested (Figure 9f; r = –0.91, α < 10–5) and, finally, storedwithin the KNOWLEDGE database entry shown in Figure 5.As can be seen from the figure, the KNOWLEDGE databaseentry on USF/DNA affinity prediction is SRS formatted and,hence, searchable by the SRS user’s Interface (Etzold andArgos, 1993).
Figure 10 exemplifies a scenario for (A) ACTIVITY and(B) KNOWLEDGE database usage, (C) the search forWeb-based tools predicting (D) the profile of the USF/DNAaffinity along arbitrary DNA sequences. In this figure, thesolid arrows navigate via user’s data analysis, and the broken
lines navigate via interpretations followed from this analysis.Indeed, this is the novelty.
In conclusion, it should be stressed that for each caseconsidered, the system ACTIVITY deals with informationobtained in concrete experimental conditions. So, it revealsthe peculiarities of the sites and constructs the method forpredicting site activity significant for these particularexperimental conditions. In future, we plan to increase thebulk of experimental data on activity of functional sites andthe set of conformational and physicochemical DNAparameters within the system ACTIVITY. In addition, morecomplex models accounting for the mutual influence ofsignificant DNA features on site activity will supplement thelinear–additive model of predicting site activity.
Acknowledgements
The work was supported the Russian Foundation for BasicResearch, the Russian Human Genome Program, the Russian
M.P.Ponomarenko et al.
702
State Committee on Science and Technology, IntegratedProgram of Siberian Department of Russian Academy ofSciences, and grant NIH 5-R01-RR04026-08. The authors aregrateful to Dr G.Orlova for assistance in translation fromRussian into English.
References
Barrick,D.,Villanueba,K., Childs,J., Kalil,R., Schneider,T.D.,Lawrence,C.E., Gold,L. and Stormo,G.D. (1994) Quantitative analysisof ribosome binding sites in E.coli. Nucleic Acids Res., 22, 1287–1295.
Bendall,A.J. and Molloy,P.L. (1994) Base preferences for DNA bindingby the bHLH-Zip protein USF: effects of MgCl2 on specificity andcomparison with binding of Myc family members. Nucleic Acids Res.,22, 2801–2810.
Berg,O.G. and von Hippel,P.H. (1987) Selection of DNA binding sites byregulatory proteins. Statistical-mechanical theory and application tooperators and promoters. J. Mol. Biol., 193, 723–750.
Berg,O.G. and von Hippel,P.H. (1988) Selection of DNA binding sites byregulatory proteins. II. The binding specificity of cyclic AMP receptorprotein to recognition sites. J. Mol. Biol., 200, 709–723.
Coulondre,C., Miller,J.H., Farabaugh,P.J. and Gilbert,W. (1978)Molecular basis of base substitution hotspots in Escherichia coli.Nature, 274, 775–780.
Diagana,T.T., North,D.L., Jabet,C., Fiszman,M.Y., Takeda,S. andWhalen,R.G. (1997) The transcriptional activity of a muscle-specificpromoter depends critically on the structure of the TATA element and itsbinding protein. J. Mol. Biol., 265, 480–493.
Edmondson,D.G. and Roth,S.Y. (1996) Chromatin and transcription.FASEB J., 10, 1173–1182.
Etzold,T. and Argos,P. (1993) SRS—an indexing and retrieval tool for flatfile data libraries. Comput. Appl. Biosci., 9, 49–57.
Fishburn,P.C. (1970) Utility Theory for Decision Making. Jonh Wiley andSons, New York.
Forster,E. and Ronr,B. (1979) Methoden der korrelations- und regressionsanalyse. Verlag Die Wirtschaft, Berlin.
French,K., Quandt,K. and Werner,T. (1998) Muscle actin genes: a firststep towards computational classification of tissue specific promoters.In Silico Biol., 1, 29–38.
Godde,J.S., Nakatani,Y. and Wolffe,A.P. (1995) The amino-terminal tailsof the core histones and the translational position of the TATA boxdetermine TBP/TFIIA association with nucleosomal DNA. NucleicAcids Res., 23, 4557–4564.
Gorin,A.A., Zhurkin,V.B. and Olson,W.K. (1995) B-DNA twistingcorrelates with base-pair morphology. J. Mol. Biol., 247, 34–48.
Gotoh,O. and Tagashira,Y. (1981) Stabilities of nearest-neighbor doubletsin double-helical DNA determined by fitting calculated melting profilesto observed profiles. Biopolymers, 20, 1033–1042.
Hajek,P. and Havranek,T. (1978) Mechanizing Hypothesis Formation—Mathematical Foundations for a General Theory. Springer Verlag,Heidelberg.
Heinemeyer,T. et al. (1999) Expanding the TRANSFAC database towardsan expert system of regulatory molecular mechanisms. Nucleic AcidsRes., 27, 318–322.
Hogan,M.E. and Austin,R.H. (1987) Importance of DNA stiffness inprotein–DNA binding specificity. Nature, 329, 263–266.
Houbaviy,H.B., Usheva,A., Shenk,T. and Burley,S.K. (1996) Cocrystalstructure of YY1 bound to the adeno-associated Virus P5 Initiator. Proc.Natl Acad. Sci. USA, 93, 13577–13582.
Hyde-DeRuyscher,R.P., Jennings,E. and Shenk,T. (1995) DNA bindingsites for the transcriptional activator/repressor YY1. Nucleic Acids Res.,23, 4457–4465.
Jonsson,J., Norberg,T., Carlsson,L., Gustafsson,C. and Wold,S. (1993)Quantitative sequence-activity models (QSAM)—tools for sequencedesign. Nucleic Acids Res., 21, 733–739.
Juo,Z.S., Chiu,T.K., Leiberman,P.M., Baikalov,I., Berk,A.J. andDickerson,R.E. (1996) How proteins recognize the TATA box. J. Mol.Biol., 261, 239–254.
Karas,H., Knuppel,R., Schulz,W., Sklenar,H. and Wingender,E. (1996)Combining structural analysis of DNA with search routines for thedetection of transcription regulatory elements. Comput. Appl. Biosci.,12, 441–446.
Kel,A.E., Ponomarenko,M.P., Likhachev,E.A., Orlov,Y.L., Ischenko,I.V.,Milanesi,L. and Kolchanov,N.A. (1993) SITEVIDEO: a computersystem for functional site analysis and recognition. Investigation of thehuman splice sites. Comput. Appl. Biosci., 9, 617–627.
Kim,J., de Haan,G. and Shapiro,D.J. (1996) DNA bending betweenupstream activator sequences increases transcriptional synergy.Biochem. Biophys. Res. Commun., 226, 638–644.
Kolchanov,N.A., Ponomarenko,M.P., Ponomarenko,J.V.,Podkolodny,N.L. and Frolov,A.S. (1998) Functional sites in pro- andeukaryotic genomes: computer models for predicting activity. Mol. Biol.(USSR), 32, 255–267 (in Russian).
Kraus,R.J., Murray,E.E., Wiley,S.R., Zink,N.M., Loritz,K.,Gelembiuk,G.W. and Mertz,J.E. (1996) Experimentally determinedweight matrix definitions of the initiator and TBP binding site elementsof promoters. Nucleic Acids Res., 24, 1531–1539.
Lehman,E.L. (1959) Testing Statistical Hypotheses. John Wiley and Sons,New York.
McDevitt,M.A., Hart,R.P., Wong,W.W. and Nevins,J.R. (1986) Se-quences capable of restoring poly(A) site function define twodistinct downstream elements. EMBO J., 5, 2907–2913.
Meierhans,D. and Allemann,R.K. (1998) The N-terminal methionine is amajor determinant of the DNA binding specificity of MEF-2C. J. Biol.Chem., 273, 26052–26060.
Meierhans,D., Sieber,M. and Allemann,R.K. (1997) High affinity bindingof MEF-2C correlates with DNA bending. Nucleic Acids Res., 25,4537–4544.
Mhaskar,D.N. and Goodman,M.F. (1984) On the molecular basis oftransition mutations. Frequency of forming 2-aminopurine-cytosinebase mispairs in the G × C----A × T mutational pathway by T4 DNApolymerase in vitro. J. Biol. Chem., 259, 11713–11717.
Miller,J.H., Coulondre,C. and Farabaugh,P.J. (1978) Correlation ofnonsense sites in the lacI gene with specific codons in the nucleotidesequence. Nature, 274, 770–775.
Mulligan,M.E., Hawley,D.K., Entriken,R. and McClure,W.R. (1984)Escherichia coli promoter sequences predict in vitro RNA polymeraseselectivity. Nucleic Acids Res., 12, 789–800
Ponomarenko,M.P., Kolchanova,A.N. and Kolchanov,N.A. (1997a)Generating programs for predicting the activity of functional sites.J. Comput. Biol., 4, 83–90.
Functional DNA site activity
703
Ponomarenko,M.P., Ponomarenko,J.V., Kel,A.E. and Kolchanov,N.A.(1997b) Computer analysis of conformational features of the eukaryoticTATA-box DNA promoters. Mol. Biol. (USSR), 31, 733–740 (inRussian).
Ponomarenko,M.P., Savinkova,L.K., Ponomarenko,J.V., Titov,I.I.,Kel,A.E. and Kolchanov,N.A. (1997c) Simulating the eukaryotic TATAbox sequences. Mol. Biol. (USSR), 31, 726–732 (in Russian).
Roulet,E., Fisch,I., Bucher,P. and Mermod,N. (1998) Evaluation ofcomputer tools for prediction of transcription factor binding sites ongenomic DNA. In Silico Biol., 1, 21–28.
Satchwell,S.C. and Travers,A.A. (1989) Asymmetry and polarity ofnucleosomes in chicken erythrocyte chromatin. EMBO J., 8,229–238.
Satchwell,S.C., Drew,H.R. and Travers,A.A. (1986) Sequenceperiodicities in chicken nucleosome core DNA. J. Mol. Biol., 191,659–675.
Savinkova,L.K., Sokolenko,A.A., Rau,V.A., Kobzev,V.F.,Ponomarenko,M.P., Ponomarenko,J.V. and Kolchanov,N.A. (1998)Quantitative computer-assisted analysis of the TATA-binding proteinaffinity for complementary duplexes of synthetic oligodeoxy-ribonucleotides. In Kolchanov,N.A., Borovskikh,E., Chirikiva,G.,Afonnikov,D. and Lavryushev,S. (eds), Proceedings of the FirstConference on Bioinformatics of Genome Regulation and Structure:BGRS’98, 1. IC&G, Novosibirsk, pp. 165–169.
Sax,C.M., Cvelk,A., Kantorow,M., Gopal-Srivastava,R., Iligan,J.G.,Ambulos,N.P. and Piatigorsky,J. (1995) Lens-specific activity of themouse alphaA-crystallin promoter in the absence of a TATA box:functional and protein binding analysis of the mouse alpha A-crystallinPE1 region. Nucleic Acids Res., 23, 442–451.
Shim,Y.H., Bonner,J.J. and Blumenthal,T. (1995) Activity of a C. elegansGATA transcription factor, ELT-1, expressed in RT yeast. J. Mol. Biol.,253, 665–676.
Shpigelman,E.S., Trifonov,E.N. and Bolshoy,A. (1993) CURVATURE:software for the analysis of curved DNA. Comput. Appl. Biosci., 9,435–440.
Sokolenko,A.A., Sandomirskii,I.I. and Savinkova,L.K. (1996) Inter-action of yeast TATA-binding protein with short promotor segments.Mol. Biol. (Mosk) 30, 279–285 (Russian).
Starr,D.B., Hoopes,B.C. and Hawley,D.K. (1995) DNA bending is animportant component of site-specific recognition by the TATA bindingprotein. J. Mol. Biol., 250, 434–446.
Stormo,G.D., Schneider,T.D. and Gold,L. (1986) Quantitative analysis ofthe relationship between nucleotide sequence and functional activity.Nucleic Acids Res., 14, 6661–6679.
Sugimoto,N., Nakano,S., Yoneyama,M. and Honda,K. (1996) Improvedthermodynamic parameters and helix initiation factor to predict stabilityof DNA duplexes. Nucleic Acids Res., 24, 4501–4505.
Suzuki,M., Yagi,N. and Finch,J.T. (1996) Role of base-backbone andbase-base interactions in alternating DNA conformations. FEBS Lett.,379, 148–152.
Wiley,S.R., Kraus,R.J. and Mertz,J.E. (1992) Functional binding of the‘TATA’ box binding component of transcription factor TFIID to the –30region of TATA-less promoters. Proc. Natl Acad. Sci. USA, 89,5814–5818.
Zadeh,L.A. (1965) Fuzzi sets. Inf. Control, 8, 338–353.