Identification of odour sources in an industrial park from resident diaries statistics
10
This article appeared in a journal published by Elsevier. The attached copy is furnished to the author for internal non-commercial research and education use, including for instruction at the authors institution and sharing with colleagues. Other uses, including reproduction and distribution, or selling or licensing copies, or posting to personal, institutional or third party websites are prohibited. In most cases authors are permitted to post their version of the article (e.g. in Word or Tex form) to their personal website or institutional repository. Authors requiring further information regarding Elsevier’s archiving and manuscript policies are encouraged to visit: http://www.elsevier.com/copyright
Transcript of Identification of odour sources in an industrial park from resident diaries statistics

This article appeared in a journal published by Elsevier. The attachedcopy is furnished to the author for internal non-commercial researchand education use, including for instruction at the authors institution
and sharing with colleagues.
Other uses, including reproduction and distribution, or selling orlicensing copies, or posting to personal, institutional or third party
websites are prohibited.
In most cases authors are permitted to post their version of thearticle (e.g. in Word or Tex form) to their personal website orinstitutional repository. Authors requiring further information
regarding Elsevier’s archiving and manuscript policies areencouraged to visit:
http://www.elsevier.com/copyright
Author's personal copy
Identification of odour sources in an industrial park from resident diaries statistics
Jacques Nicolas a,*, Marie Cors c, Anne-Claude Romain a, Julien Delva b
aResearch group “Environmental Monitoring”, Department of Environmental Sciences and Management, University of Liège, Avenue de Longwy, 185, B6700 Arlon, BelgiumbOdometric s.a., Arlon, Belgiumc Inter-Environnement Wallonie, Namur, Belgium
a r t i c l e i n f o
Article history:Received 28 April 2009Received in revised form27 January 2010Accepted 29 January 2010
Keywords:Odour annoyanceSocial participationDiary reportResidentPanel
a b s t r a c t
A methodology based on social participation through the use of resident diaries was applied to evaluatethe odour annoyance in the surroundings of an industrial park in Belgium during one year. The studiedarea covers about 8 km2 and includes13 potential odour emitting facilities. The network involved 44residents in the survey, among whom 19 were particularly considered for a detailed analysis. The ques-tionnaire aimed at providing an odour rating twice-daily on a 6-level scale together with an odour type.
The fact that the response rate corresponding to “no-odour” was high (79%) is particularly discussed.Some tests are proposed to check the plausibility of the answers, the coherence within clusters ofresidents and the individual performance of respondents to discriminate among odour ratings. Theodour rose is presented as an attractive and visual tool, particularly suited in the case of multi-sourceareas, to map the different odour emissions, to point out the most worrying ones, to identify otherscreating less annoyance and possibly new unpredicted ones. The resident diary method has proven to beparticularly useful, conjointly to other ones, to the case of multi-sources facilities in large areas, when thepurpose is the assessment of the long-term evolution of odour annoyance.
� 2010 Elsevier Ltd. All rights reserved.
1. Introduction
Malodours emitted by multi-source facilities, like industrialcomplexes, have become a major concern for local authoritiesbecause the resulting annoyance in the neighbourhood is generallyhigh compared to a single source one. In the case of such multi-source odour emissions especially, common chemical analyses orodour concentration measurement methods are not often appli-cable. The resulting global annoyance cannot actually be assessedneither by physiological techniques nor by the methods of physicalchemistry (VDI, 1993). Socio-economical factors, like the relationsbetween the resident and the different companies, the gender ortime spent at the current address influence the odour acceptability(Cavalini et al., 1991; Steinheider and Winneke, 1993; Pierrette andMoch, 2009). It is well known that the absence or presence ofbackground odours may also have a significant effect (Nicell, 2009).Multi-source industrial plants are likely to add to those influencesthe fact that both the background itself and the emerging odoursare complex mixtures of different odour types, which fluctuatewith time.
A possible way of assessing the odour annoyance in such casescould be the use of an atmospheric dispersion model. Howevermodels calculate the odour exposure, depending on the occurrencefrequencies and on the concentration of odours. Odour impact onneighbouring population is a wider concept, involving additionalcharacteristics, like odour hedonic tone and offensiveness orintensity to quantify the odour level. Trying to estimate odourimpact from odour exposure requires the availability of dose e
response relationships which are sometimes deduced for specificfacilities, such as sewage treatment works (Van Broeck and VanLangenhove, 2000; Miedema et al., 2000), but not for complexmulti-source plants.
Hence, it is essential to make a global assessment of the odourannoyance, using the residents themselves as measuring tools.Social participation and strong community involvement in detect-ing odour events may provide an attractive solution to identifyodour sources and to assess odour annoyance, while offeringsignificant public relations benefits for the concerned stakeholders(Tapper and Sudbury, 1991). Such a monitoring technique is pre-sented in this paper, applied to a multi-source industrial area andwith the aim of demonstrating the concept, particularly relevant forenvironmental management and regulation. Resident diary resultsbring a complementary light with respect tomore traditional odourassessment methods.
* Corresponding author. Tel.: þ32 63 230857; fax: þ32 63 230800.E-mail address: [email protected] (J. Nicolas).
Contents lists available at ScienceDirect
Atmospheric Environment
journal homepage: www.elsevier .com/locate/atmosenv
1352-2310/$ e see front matter � 2010 Elsevier Ltd. All rights reserved.doi:10.1016/j.atmosenv.2010.01.046
Atmospheric Environment 44 (2010) 1623e1631
Author's personal copy
2. Possible methodologies of population survey
Such an approach, involving social participation, may be appliedin three ways:
� collecting and analysing complaints data,� administering and analysing one-shot surveys concerning localresidents,
� questioning resident panellists on repeated occasions or askingthem to regularly complete odour diaries.
Collecting data on complaints has several drawbacks (VDI,1993). Complaints are only made in case of significant odourimpact and concern only a small portion of the population. Absenceof complaint does not automatically mean that there is no odour,because many people never make complaints. On the contrary,some people make frequent complaints, even for trivial causes.
“Once-only” surveys have the great advantage over complaintsstatistics in that a representative sample of the population can beselected (VDI, 1993). The main result obtained by such surveys isthe cumulative experience of respondents over a long period oftime. Different types of surveys can be tested. Van Broeck and VanLangenhove (2000) compared telephone and postal surveymethods and preferred the telephone method. The main reasonswere the short completion time (about 5 min per respondent), thehigher response rates and the simple interpretation of the results.
Whatever the method used, the questionnaire must be based onexperience gained by previous studies. Questions must be formu-lated in such a way that the survey evaluates the situation of theentire group of emitting facilities within one or two years, so thatseasonal effects could be taken into account. Different “model”questionnaires are used or adapted to the specific situation(Seffelaar et al., 1992; Radon et al., 2004). For instance, the GermanVDI guideline (VDI, 1997) proposes 10 questions about pollutionand annoyance reaction.
In each case, authors stress the particular importance of thesample choice to warrant that a representative statement con-cerning the degree of odour annoyance in the affected populationcan be achieved. Usually, the sample must be selected randomly inthe investigated area and must respect the demographic profile ofthe region, i.e. having the same proportions as the eligible pop-ulation of age class, gender, category of living area (land use),profession etc. Once-only survey methods supply different results,for example, the global profile of the questioned population bymeans of factor analyses (Seffelaar et al., 1992), or concen-trationeannoyance relations for homogeneous industrial or agri-cultural sectors (Van Broeck and Van Langenhove, 2000; Miedemaet al., 2000), or contextual and individual factors linked with thelevel of odour annoyance for a given population (Pierrette andMoch, 2009; Radon et al., 2004; Steinheider and Winneke, 1993).The disadvantage of single-shot surveys is that such results cannotbe broken down to cover individual events. They are the image ofthe accumulated sensation of annoyance and cannot be used todescribe its time variation.
Using the method of resident diaries or regular questioning ofa population panel partially corrects those weaknesses. It allowsboth monitoring odour events on a short-time-basis and assessingthe global annoyance profile, by integrating the whole datacollection over long periods. Moreover, the resident answersprovide information about both the presence and the absence ofodour. The method is also much cheaper than systematic expertanalyses. Its main disadvantage is the longer period during whichpeople must be involved. So, it is seldom possible to set upa random population sample and to respect the demographicprofile of the investigated zone. Resident diaries generally involve
volunteers who are recruited in the estimated immission area(Wing et al., 2008; Aitken and Okun, 1992; Gallego et al., 2008).Sometimes, odour panellists are selected for living within or adja-cent to a predefined spatial grid, but anyway, they have to accept tobe regularly questioned (Guo et al., 2003). In any case, it is alwaysuseful to train the panel members before the study, either by odourintensity estimation of a set of butanol dilutions (Nimmermarket al., 2005; Guo et al., 2003) or by asking participants to choosewhich of different vials has an odour (Wing et al., 2008) or at leastby inviting them to attend preliminary community meetingshelping to design the data collection (Aitken and Okun, 1992).
The responses of resident panellists may be used to fulfildifferent objectives.
� The most obvious goal is the public awareness and its betterunderstanding of odour generation and dispersion.
� On a more scientific level, a second goal is the monitoring ofodour events and their connection with environmental orweather variables. Data processing may lead to the distributionin space and time of the annoyance. More particularly, it shouldbe possible to demonstrate the differences existing betweenodour annoyance in the investigation area and in a neutralcontrol area.
� Some model developers are also using resident diary results tocalibrate or to validate their models (Nimmermark et al., 2005).
� Outcomes of repeated questioning of resident panellists mayalso aim at calibrating a doseeresponse relationship for thedefinition of odour impact criteria (Gallego et al., 2008).
� Correct processing and reporting of such data by an experi-enced and acknowledged scientific team represents animportant weight in negotiations with the operator of thefacility or with public authority. This could result in correctingthe production process, or re-designing it, or setting up odourreduction or remediation systems.
� By means of remote control, a sampling pump can be activatedby the potentially affected people during episodes when highodour intensity is perceived (Gallego et al., 2008). This way,odours are dynamically sampled for further analysis in thelaboratory and the results may be used to identify the origin ofthe annoyance, which is particularly useful in situationsinvolving unpredictable odour occurrences.
The present paper discusses the applicability, advantages,disadvantages and limitations of the resident diary method in thecase of an industrial park in Belgium. For this particular case study,it discusses also the possible uses of the method and stresses thepossibility of mapping odour sources by odour roses.
3. Materials and methods
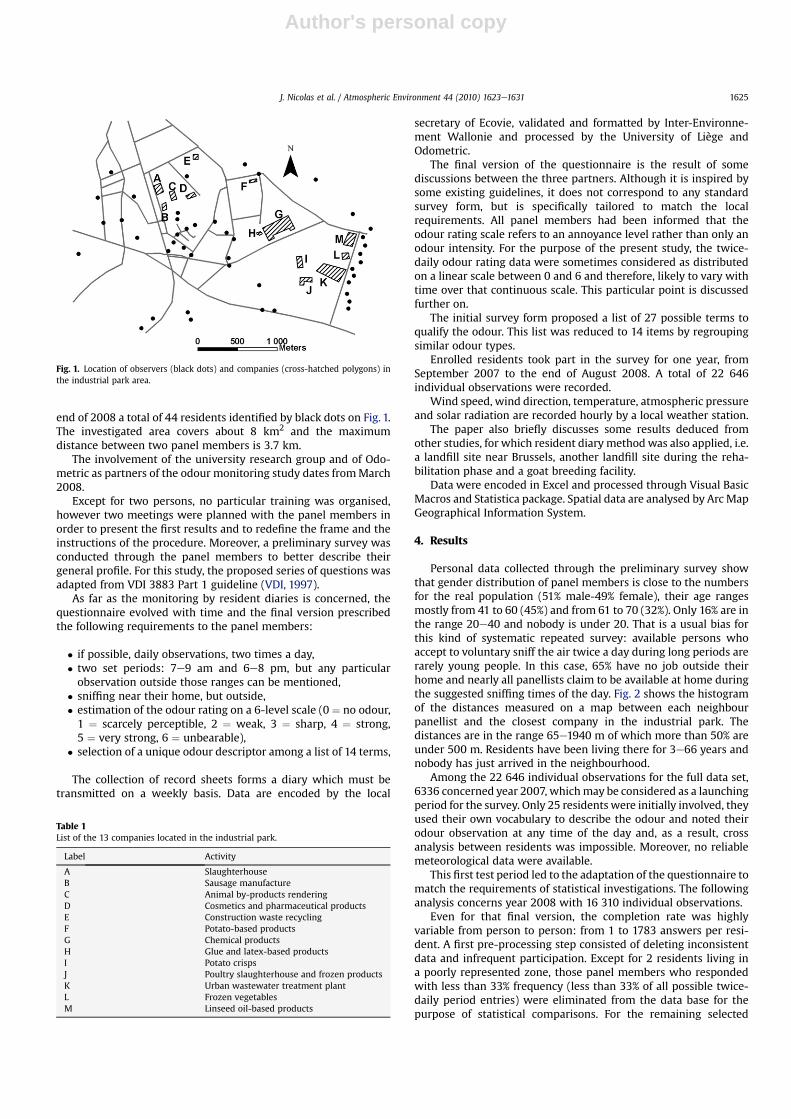
The case study concerns an industrial park in Belgium. Prevail-ing wind directions are North-East and chiefly South-West. Theindustrial zone is situated in an urban area, with a populationdensity of about 1300 inhabitants per km2 for the whole city (48%male and 52% female). The population by age is: under 20 years,24%, 20e65, 58% and over 65 years, 18%. Fig. 1 shows the studiedindustrial area with main roads and the 13 companies involved inthe global odour annoyance.
All 13 companies are potentially odour emitters. Table 1 indi-cates their activity. As seen on the figure, the industrial park can beseparated into twomain parts: theWest part, with companies AeE,and the East part, including companies FeM.
The network of volunteer residents was instigated in September2007 on the initiative of Ecovie, a local environment association.Beginning with a handful of persons, the network included at the
J. Nicolas et al. / Atmospheric Environment 44 (2010) 1623e16311624
Author's personal copy
end of 2008 a total of 44 residents identified by black dots on Fig. 1.The investigated area covers about 8 km2 and the maximumdistance between two panel members is 3.7 km.
The involvement of the university research group and of Odo-metric as partners of the odour monitoring study dates fromMarch2008.
Except for two persons, no particular training was organised,however two meetings were planned with the panel members inorder to present the first results and to redefine the frame and theinstructions of the procedure. Moreover, a preliminary survey wasconducted through the panel members to better describe theirgeneral profile. For this study, the proposed series of questions wasadapted from VDI 3883 Part 1 guideline (VDI, 1997).
As far as the monitoring by resident diaries is concerned, thequestionnaire evolved with time and the final version prescribedthe following requirements to the panel members:
� if possible, daily observations, two times a day,� two set periods: 7e9 am and 6e8 pm, but any particularobservation outside those ranges can be mentioned,
� sniffing near their home, but outside,� estimation of the odour rating on a 6-level scale (0 ¼ no odour,1 ¼ scarcely perceptible, 2 ¼ weak, 3 ¼ sharp, 4 ¼ strong,5 ¼ very strong, 6 ¼ unbearable),
� selection of a unique odour descriptor among a list of 14 terms,
The collection of record sheets forms a diary which must betransmitted on a weekly basis. Data are encoded by the local
secretary of Ecovie, validated and formatted by Inter-Environne-ment Wallonie and processed by the University of Liège andOdometric.
The final version of the questionnaire is the result of somediscussions between the three partners. Although it is inspired bysome existing guidelines, it does not correspond to any standardsurvey form, but is specifically tailored to match the localrequirements. All panel members had been informed that theodour rating scale refers to an annoyance level rather than only anodour intensity. For the purpose of the present study, the twice-daily odour rating data were sometimes considered as distributedon a linear scale between 0 and 6 and therefore, likely to vary withtime over that continuous scale. This particular point is discussedfurther on.
The initial survey form proposed a list of 27 possible terms toqualify the odour. This list was reduced to 14 items by regroupingsimilar odour types.
Enrolled residents took part in the survey for one year, fromSeptember 2007 to the end of August 2008. A total of 22 646individual observations were recorded.
Wind speed, wind direction, temperature, atmospheric pressureand solar radiation are recorded hourly by a local weather station.
The paper also briefly discusses some results deduced fromother studies, for which resident diary method was also applied, i.e.a landfill site near Brussels, another landfill site during the reha-bilitation phase and a goat breeding facility.
Data were encoded in Excel and processed through Visual BasicMacros and Statistica package. Spatial data are analysed by Arc MapGeographical Information System.
4. Results
Personal data collected through the preliminary survey showthat gender distribution of panel members is close to the numbersfor the real population (51% male-49% female), their age rangesmostly from 41 to 60 (45%) and from 61 to 70 (32%). Only 16% are inthe range 20e40 and nobody is under 20. That is a usual bias forthis kind of systematic repeated survey: available persons whoaccept to voluntary sniff the air twice a day during long periods arerarely young people. In this case, 65% have no job outside theirhome and nearly all panellists claim to be available at home duringthe suggested sniffing times of the day. Fig. 2 shows the histogramof the distances measured on a map between each neighbourpanellist and the closest company in the industrial park. Thedistances are in the range 65e1940 m of which more than 50% areunder 500 m. Residents have been living there for 3e66 years andnobody has just arrived in the neighbourhood.
Among the 22 646 individual observations for the full data set,6336 concerned year 2007, whichmay be considered as a launchingperiod for the survey. Only 25 residents were initially involved, theyused their own vocabulary to describe the odour and noted theirodour observation at any time of the day and, as a result, crossanalysis between residents was impossible. Moreover, no reliablemeteorological data were available.
This first test period led to the adaptation of the questionnaire tomatch the requirements of statistical investigations. The followinganalysis concerns year 2008 with 16 310 individual observations.
Even for that final version, the completion rate was highlyvariable from person to person: from 1 to 1783 answers per resi-dent. A first pre-processing step consisted of deleting inconsistentdata and infrequent participation. Except for 2 residents living ina poorly represented zone, those panel members who respondedwith less than 33% frequency (less than 33% of all possible twice-daily period entries) were eliminated from the data base for thepurpose of statistical comparisons. For the remaining selected
Fig. 1. Location of observers (black dots) and companies (cross-hatched polygons) inthe industrial park area.
Table 1List of the 13 companies located in the industrial park.
Label Activity
A SlaughterhouseB Sausage manufactureC Animal by-products renderingD Cosmetics and pharmaceutical productsE Construction waste recyclingF Potato-based productsG Chemical productsH Glue and latex-based productsI Potato crispsJ Poultry slaughterhouse and frozen productsK Urban wastewater treatment plantL Frozen vegetablesM Linseed oil-based products
J. Nicolas et al. / Atmospheric Environment 44 (2010) 1623e1631 1625

Author's personal copy
panel members, responses were considered to be sufficiently reli-able to avoid any weighting when averaging the odour ratings. Thefinal table considered only 19 residents and 11 713 valid reportedobservations, among which 6409 were for common imposedperiods (“morning” for 7e9am and “evening” for 6e8 pm).However, all involved residents were kept for other analyses, suchas odour type statistics or odour roses.
A first essential result deduced from the odour ratings data file isthat 79% of the observations correspond to “no-odour” (0 on theodour rating scale). This means that, overall, a majority of timeperiods are odour-free in the neighbourhood. From a statisticalpoint of view, this means that the distribution of odour ratingvalues is largely left-skewed, forbidding considering time-averagevalues as reliable statistical characteristics for a given period. Forodour ratings above 0, distribution is close to normal and allows theapplication of statistics. To test the performances of respondents todiscriminate among odour ratings in that upper part of the scale,we calculated a coefficient of discernment (CD), as suggested byAitken and Okun (1992), and defined, for each respondent, as:
CD ¼ 1� ðs1�6=smaxÞ (1)
where, s1e6 is standard deviation of the number of responses foreach of the 6 ratings, from 1 to 6, smax is the maximum standarddeviation for the number of responses above 0 for this specificrespondent (standard deviation is maximum if the respondentcircled always the same odour rating above 0).
The CD may vary from 0 (poor discernment, only one of the 6ratings used by the respondent) to 1 (the respondent uses the fullscale range).
In our case, for the 19 considered residents, CD varies from 0.33to 0.79 with a mean value of 0.55. These results indicate, for mostpeople, rather good discrimination performances for the odourrating. This was not the case for all residents at the beginning of thesurvey. Some people, feeling particularly annoyed by the odour,always circled 5 or 6 on the rating scale. After having beenexplained that their data were unusable to assess the odour emis-sion variability and to point out the main pollution sources in theindustrial park, they corrected their behaviour and used the fullodour rating scale range.
For such a large area under investigation and especially becauselocal residents are influenced by different odour sources, quitehomogeneous clusters of panel members have to be formed. It iswell known that the number of clusters and the number of
respondents in each cluster largely determine the statistical results(Van Broeck and Van Langenhove, 2000). Moreover, in order toisolate the specific impact of odour emissions from other possibleeffects on the neighbourhood, at least one cluster must be situatedoutside the influence area and should be used as a reference cluster.
The reliability of the odour rating statistical results withina cluster depends on the number of residents in a cluster. Forexample, confidence intervals around a mean value are propor-tional to 1 over the square root of n, where n is the sample size.
Unsupervised clustering, such as correspondence analysis, justbased on the existing data, led to incoherent group formation forthe case under investigation. The similarity of answers given forodour rating or even odour type is not a reliable criterion forclustering, especially when considering so few observers. So, thesingle criterion used to form spatial clusters was eventually thesimple geographical location. Fig. 3 shows the six identified clusterson the map. They were delineated with the aim of representing 6different zones with respect to azimuth directions and to thecloseness of odour sources. Table 2 gives their characteristics. Theobservation completion rate is calculated as the percentage of validobservations with respect to all possible data entries.
Unfortunately, despite the successful enrolment of residents forthis survey, it is difficult to form clusters including more than 4 or 5reliable respondents. It is especially true for the South-West zone,located at more than 1350 m away from any odour source andwhich could have been considered as reference zone, but the 4residents had to be eliminated due to infrequent responses. Moregenerally speaking, this is an important drawback of the residentdiary method. Even in ideal cases, it is really difficult to keep theresident motivation for long observation periods when practicallyno odour is recorded in the reference control zones. In thisparticular case study, that was not such a big problem since anyupwind cluster could be considered as a control zone with respectto other ones. Moreover, the rare responses from the ‘control group’were always ‘no odour’.
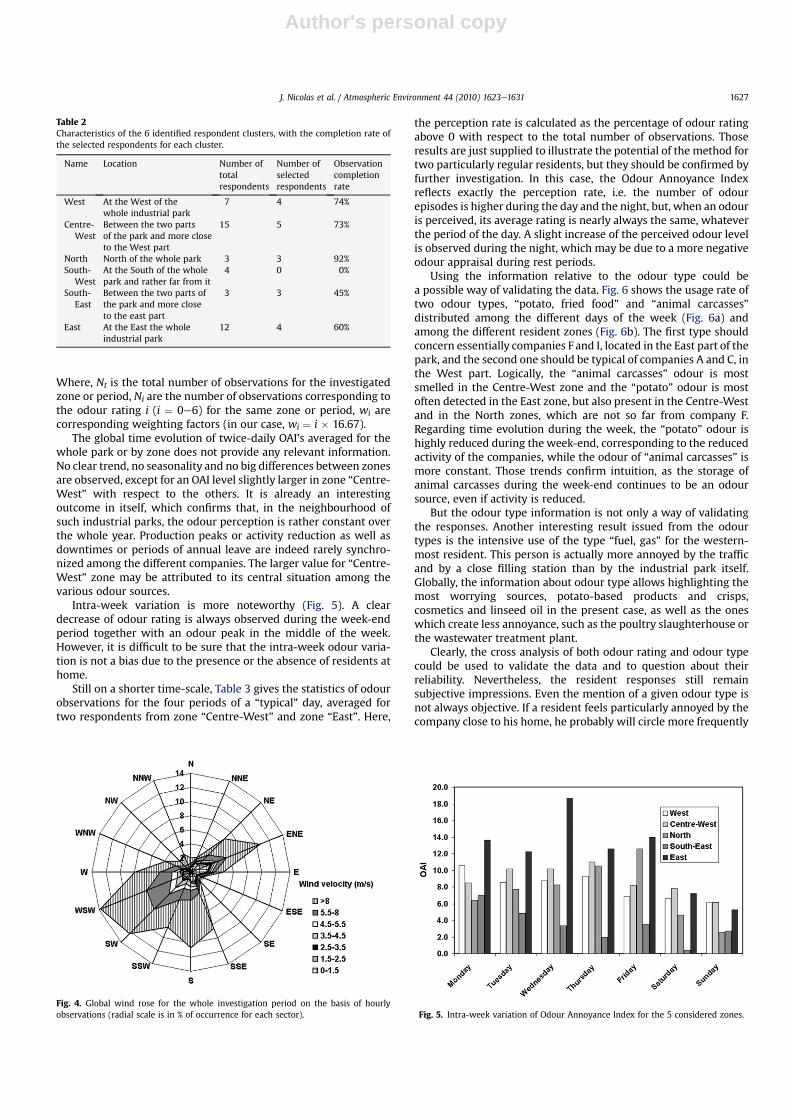
As shown on the wind rose of Fig. 4, the survey period wascharacterized by winds from South-West and North-East, corre-sponding to the prevailing wind directions for the area. In order toappreciate the time evolution of odour rating, we calculated anOdour Annoyance Index (OAI) defined as (VDI, 1993):
OAI ¼ 1Nt
X6
i¼0
wiNi (2)
Fig. 2. Histogram of measured distances from panel members to the closest odoursource.
Fig. 3. Six clusters of residents with comparable estimated odour exposure in theindustrial park.
J. Nicolas et al. / Atmospheric Environment 44 (2010) 1623e16311626
Author's personal copy
Where, Nt is the total number of observations for the investigatedzone or period, Ni are the number of observations corresponding tothe odour rating i (i ¼ 0e6) for the same zone or period, wi arecorresponding weighting factors (in our case, wi ¼ i � 16.67).
The global time evolution of twice-daily OAI's averaged for thewhole park or by zone does not provide any relevant information.No clear trend, no seasonality and no big differences between zonesare observed, except for an OAI level slightly larger in zone “Centre-West” with respect to the others. It is already an interestingoutcome in itself, which confirms that, in the neighbourhood ofsuch industrial parks, the odour perception is rather constant overthe whole year. Production peaks or activity reduction as well asdowntimes or periods of annual leave are indeed rarely synchro-nized among the different companies. The larger value for “Centre-West” zone may be attributed to its central situation among thevarious odour sources.
Intra-week variation is more noteworthy (Fig. 5). A cleardecrease of odour rating is always observed during the week-endperiod together with an odour peak in the middle of the week.However, it is difficult to be sure that the intra-week odour varia-tion is not a bias due to the presence or the absence of residents athome.
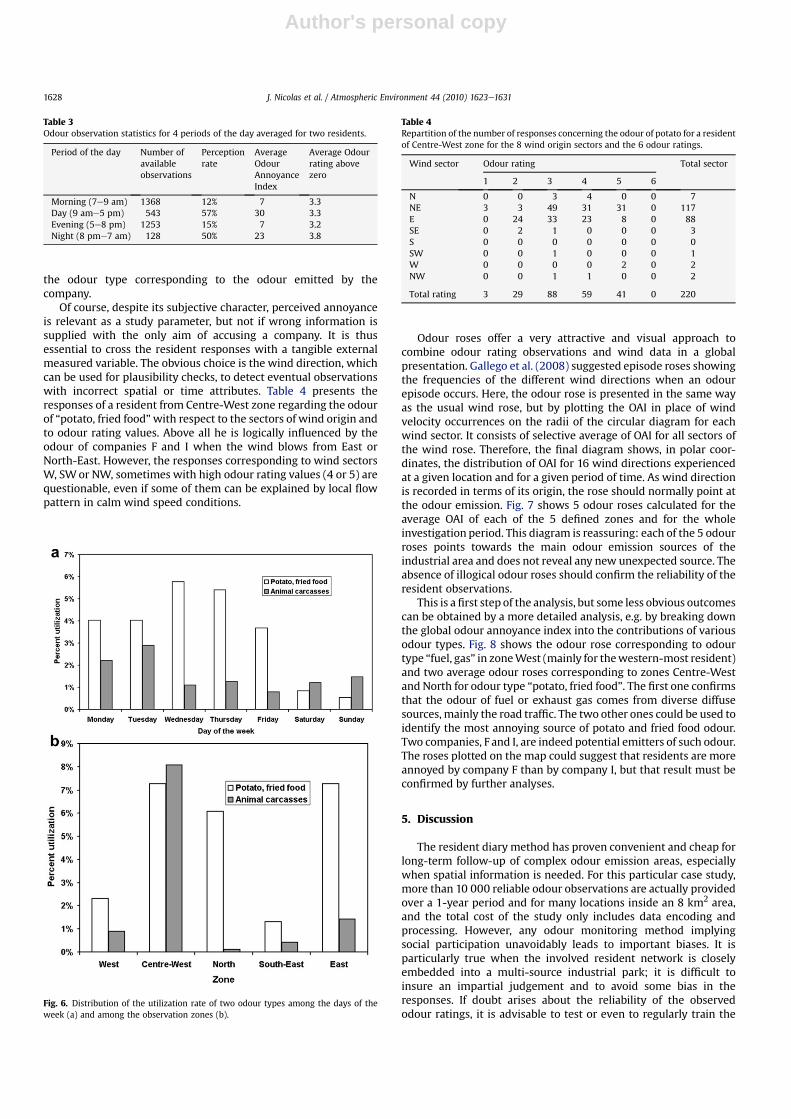
Still on a shorter time-scale, Table 3 gives the statistics of odourobservations for the four periods of a “typical” day, averaged fortwo respondents from zone “Centre-West” and zone “East”. Here,
the perception rate is calculated as the percentage of odour ratingabove 0 with respect to the total number of observations. Thoseresults are just supplied to illustrate the potential of the method fortwo particularly regular residents, but they should be confirmed byfurther investigation. In this case, the Odour Annoyance Indexreflects exactly the perception rate, i.e. the number of odourepisodes is higher during the day and the night, but, when an odouris perceived, its average rating is nearly always the same, whateverthe period of the day. A slight increase of the perceived odour levelis observed during the night, which may be due to a more negativeodour appraisal during rest periods.
Using the information relative to the odour type could bea possible way of validating the data. Fig. 6 shows the usage rate oftwo odour types, “potato, fried food” and “animal carcasses”distributed among the different days of the week (Fig. 6a) andamong the different resident zones (Fig. 6b). The first type shouldconcern essentially companies F and I, located in the East part of thepark, and the second one should be typical of companies A and C, inthe West part. Logically, the “animal carcasses” odour is mostsmelled in the Centre-West zone and the “potato” odour is mostoften detected in the East zone, but also present in the Centre-Westand in the North zones, which are not so far from company F.Regarding time evolution during the week, the “potato” odour ishighly reduced during the week-end, corresponding to the reducedactivity of the companies, while the odour of “animal carcasses” ismore constant. Those trends confirm intuition, as the storage ofanimal carcasses during the week-end continues to be an odoursource, even if activity is reduced.
But the odour type information is not only a way of validatingthe responses. Another interesting result issued from the odourtypes is the intensive use of the type “fuel, gas” for the western-most resident. This person is actually more annoyed by the trafficand by a close filling station than by the industrial park itself.Globally, the information about odour type allows highlighting themost worrying sources, potato-based products and crisps,cosmetics and linseed oil in the present case, as well as the oneswhich create less annoyance, such as the poultry slaughterhouse orthe wastewater treatment plant.
Clearly, the cross analysis of both odour rating and odour typecould be used to validate the data and to question about theirreliability. Nevertheless, the resident responses still remainsubjective impressions. Even the mention of a given odour type isnot always objective. If a resident feels particularly annoyed by thecompany close to his home, he probably will circle more frequently
Table 2Characteristics of the 6 identified respondent clusters, with the completion rate ofthe selected respondents for each cluster.
Name Location Number oftotalrespondents
Number ofselectedrespondents
Observationcompletionrate
West At the West of thewhole industrial park
7 4 74%
Centre-West
Between the two partsof the park and more closeto the West part
15 5 73%
North North of the whole park 3 3 92%South-
WestAt the South of the wholepark and rather far from it
4 0 0%
South-East
Between the two parts ofthe park and more closeto the east part
3 3 45%
East At the East the wholeindustrial park
12 4 60%
Fig. 4. Global wind rose for the whole investigation period on the basis of hourlyobservations (radial scale is in % of occurrence for each sector). Fig. 5. Intra-week variation of Odour Annoyance Index for the 5 considered zones.
J. Nicolas et al. / Atmospheric Environment 44 (2010) 1623e1631 1627
Author's personal copy
the odour type corresponding to the odour emitted by thecompany.
Of course, despite its subjective character, perceived annoyanceis relevant as a study parameter, but not if wrong information issupplied with the only aim of accusing a company. It is thusessential to cross the resident responses with a tangible externalmeasured variable. The obvious choice is the wind direction, whichcan be used for plausibility checks, to detect eventual observationswith incorrect spatial or time attributes. Table 4 presents theresponses of a resident from Centre-West zone regarding the odourof “potato, fried food”with respect to the sectors of wind origin andto odour rating values. Above all he is logically influenced by theodour of companies F and I when the wind blows from East orNorth-East. However, the responses corresponding to wind sectorsW, SWor NW, sometimes with high odour rating values (4 or 5) arequestionable, even if some of them can be explained by local flowpattern in calm wind speed conditions.
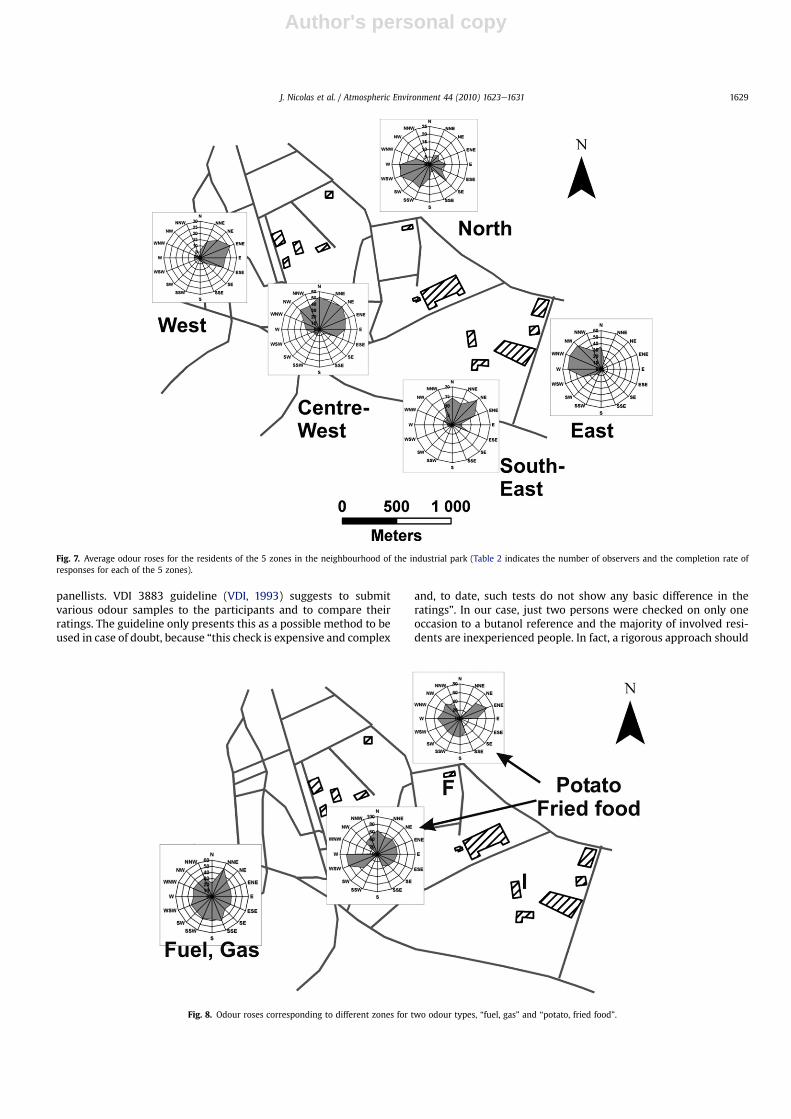
Odour roses offer a very attractive and visual approach tocombine odour rating observations and wind data in a globalpresentation. Gallego et al. (2008) suggested episode roses showingthe frequencies of the different wind directions when an odourepisode occurs. Here, the odour rose is presented in the same wayas the usual wind rose, but by plotting the OAI in place of windvelocity occurrences on the radii of the circular diagram for eachwind sector. It consists of selective average of OAI for all sectors ofthe wind rose. Therefore, the final diagram shows, in polar coor-dinates, the distribution of OAI for 16 wind directions experiencedat a given location and for a given period of time. As wind directionis recorded in terms of its origin, the rose should normally point atthe odour emission. Fig. 7 shows 5 odour roses calculated for theaverage OAI of each of the 5 defined zones and for the wholeinvestigation period. This diagram is reassuring: each of the 5 odourroses points towards the main odour emission sources of theindustrial area and does not reveal any new unexpected source. Theabsence of illogical odour roses should confirm the reliability of theresident observations.
This is a first step of the analysis, but some less obvious outcomescan be obtained by a more detailed analysis, e.g. by breaking downthe global odour annoyance index into the contributions of variousodour types. Fig. 8 shows the odour rose corresponding to odourtype “fuel, gas” in zoneWest (mainly for thewestern-most resident)and two average odour roses corresponding to zones Centre-Westand North for odour type “potato, fried food”. The first one confirmsthat the odour of fuel or exhaust gas comes from diverse diffusesources, mainly the road traffic. The two other ones could be used toidentify the most annoying source of potato and fried food odour.Two companies, F and I, are indeed potential emitters of such odour.The roses plotted on the map could suggest that residents are moreannoyed by company F than by company I, but that result must beconfirmed by further analyses.
5. Discussion
The resident diary method has proven convenient and cheap forlong-term follow-up of complex odour emission areas, especiallywhen spatial information is needed. For this particular case study,more than 10 000 reliable odour observations are actually providedover a 1-year period and for many locations inside an 8 km2 area,and the total cost of the study only includes data encoding andprocessing. However, any odour monitoring method implyingsocial participation unavoidably leads to important biases. It isparticularly true when the involved resident network is closelyembedded into a multi-source industrial park; it is difficult toinsure an impartial judgement and to avoid some bias in theresponses. If doubt arises about the reliability of the observedodour ratings, it is advisable to test or even to regularly train the
Table 3Odour observation statistics for 4 periods of the day averaged for two residents.
Period of the day Number ofavailableobservations
Perceptionrate
AverageOdourAnnoyanceIndex
Average Odourrating abovezero
Morning (7e9 am) 1368 12% 7 3.3Day (9 ame5 pm) 543 57% 30 3.3Evening (5e8 pm) 1253 15% 7 3.2Night (8 pme7 am) 128 50% 23 3.8
Fig. 6. Distribution of the utilization rate of two odour types among the days of theweek (a) and among the observation zones (b).
Table 4Repartition of the number of responses concerning the odour of potato for a residentof Centre-West zone for the 8 wind origin sectors and the 6 odour ratings.
Wind sector Odour rating Total sector
1 2 3 4 5 6
N 0 0 3 4 0 0 7NE 3 3 49 31 31 0 117E 0 24 33 23 8 0 88SE 0 2 1 0 0 0 3S 0 0 0 0 0 0 0SW 0 0 1 0 0 0 1W 0 0 0 0 2 0 2NW 0 0 1 1 0 0 2
Total rating 3 29 88 59 41 0 220
J. Nicolas et al. / Atmospheric Environment 44 (2010) 1623e16311628
Author's personal copy
panellists. VDI 3883 guideline (VDI, 1993) suggests to submitvarious odour samples to the participants and to compare theirratings. The guideline only presents this as a possible method to beused in case of doubt, because “this check is expensive and complex
and, to date, such tests do not show any basic difference in theratings”. In our case, just two persons were checked on only oneoccasion to a butanol reference and the majority of involved resi-dents are inexperienced people. In fact, a rigorous approach should
Fig. 7. Average odour roses for the residents of the 5 zones in the neighbourhood of the industrial park (Table 2 indicates the number of observers and the completion rate ofresponses for each of the 5 zones).
Fig. 8. Odour roses corresponding to different zones for two odour types, “fuel, gas” and “potato, fried food”.
J. Nicolas et al. / Atmospheric Environment 44 (2010) 1623e1631 1629
Author's personal copy
be applied at the time of selecting panel members who shouldcomply with different criteria concerning both power of discrimi-nation and odour rating assessment and who should be checked atregular intervals (typically 6 months). Such requirement isdemanding and nearly impossible to apply for long-term surveywith unpaid volunteers. The present study shows that periodicalmeetings with the panel together with cross validation againstmore neutral parameters may be sufficient as long as only globaltrends are expected. If necessary, the survey should be completedwith dispersion modelling results based on odour emission ratemeasurements.
An additional bias could arise from the absence of residentsduring holiday time or during the week-end or from the fact thatpeople are sleeping during the night and that they do not realizethat the area is experiencing a bad odour episode. It is thus essentialto make a clear distinction between the absence of response andthe recording of an odour-free event.
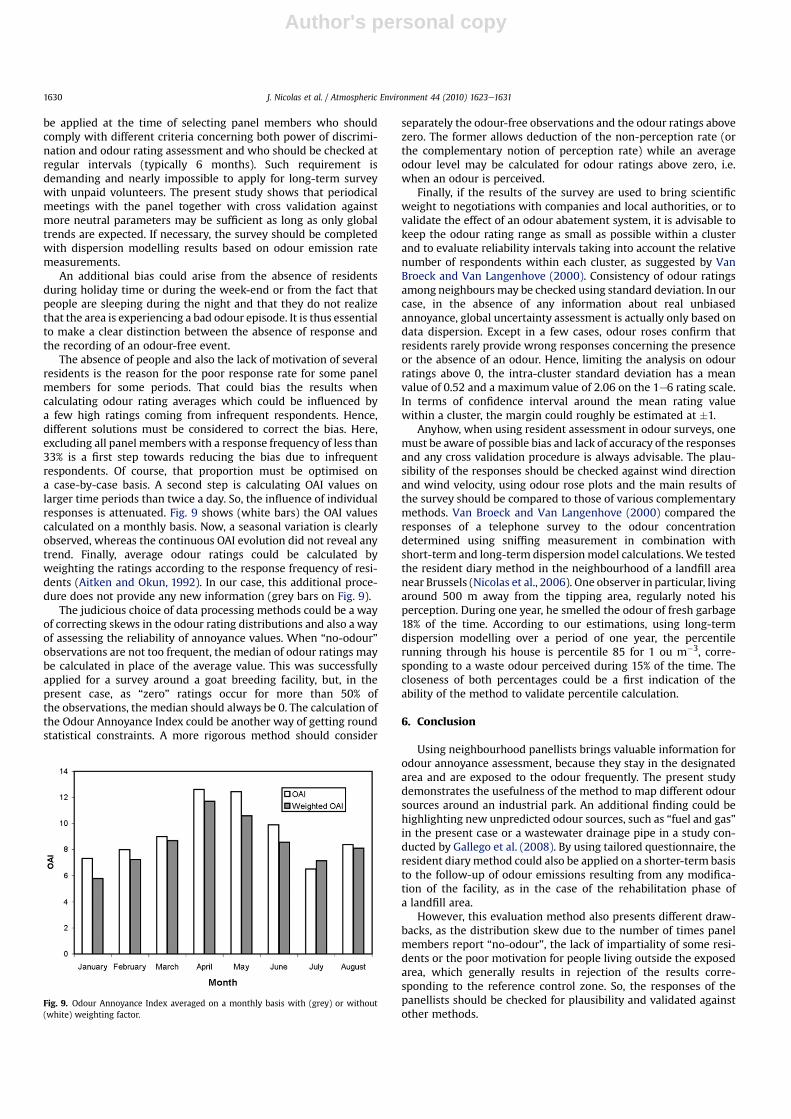
The absence of people and also the lack of motivation of severalresidents is the reason for the poor response rate for some panelmembers for some periods. That could bias the results whencalculating odour rating averages which could be influenced bya few high ratings coming from infrequent respondents. Hence,different solutions must be considered to correct the bias. Here,excluding all panel members with a response frequency of less than33% is a first step towards reducing the bias due to infrequentrespondents. Of course, that proportion must be optimised ona case-by-case basis. A second step is calculating OAI values onlarger time periods than twice a day. So, the influence of individualresponses is attenuated. Fig. 9 shows (white bars) the OAI valuescalculated on a monthly basis. Now, a seasonal variation is clearlyobserved, whereas the continuous OAI evolution did not reveal anytrend. Finally, average odour ratings could be calculated byweighting the ratings according to the response frequency of resi-dents (Aitken and Okun, 1992). In our case, this additional proce-dure does not provide any new information (grey bars on Fig. 9).
The judicious choice of data processing methods could be a wayof correcting skews in the odour rating distributions and also a wayof assessing the reliability of annoyance values. When “no-odour”observations are not too frequent, the median of odour ratings maybe calculated in place of the average value. This was successfullyapplied for a survey around a goat breeding facility, but, in thepresent case, as “zero” ratings occur for more than 50% ofthe observations, the median should always be 0. The calculation ofthe Odour Annoyance Index could be another way of getting roundstatistical constraints. A more rigorous method should consider
separately the odour-free observations and the odour ratings abovezero. The former allows deduction of the non-perception rate (orthe complementary notion of perception rate) while an averageodour level may be calculated for odour ratings above zero, i.e.when an odour is perceived.
Finally, if the results of the survey are used to bring scientificweight to negotiations with companies and local authorities, or tovalidate the effect of an odour abatement system, it is advisable tokeep the odour rating range as small as possible within a clusterand to evaluate reliability intervals taking into account the relativenumber of respondents within each cluster, as suggested by VanBroeck and Van Langenhove (2000). Consistency of odour ratingsamong neighboursmay be checked using standard deviation. In ourcase, in the absence of any information about real unbiasedannoyance, global uncertainty assessment is actually only based ondata dispersion. Except in a few cases, odour roses confirm thatresidents rarely provide wrong responses concerning the presenceor the absence of an odour. Hence, limiting the analysis on odourratings above 0, the intra-cluster standard deviation has a meanvalue of 0.52 and a maximum value of 2.06 on the 1e6 rating scale.In terms of confidence interval around the mean rating valuewithin a cluster, the margin could roughly be estimated at �1.
Anyhow, when using resident assessment in odour surveys, onemust be aware of possible bias and lack of accuracy of the responsesand any cross validation procedure is always advisable. The plau-sibility of the responses should be checked against wind directionand wind velocity, using odour rose plots and the main results ofthe survey should be compared to those of various complementarymethods. Van Broeck and Van Langenhove (2000) compared theresponses of a telephone survey to the odour concentrationdetermined using sniffing measurement in combination withshort-term and long-term dispersionmodel calculations.We testedthe resident diary method in the neighbourhood of a landfill areanear Brussels (Nicolas et al., 2006). One observer in particular, livingaround 500 m away from the tipping area, regularly noted hisperception. During one year, he smelled the odour of fresh garbage18% of the time. According to our estimations, using long-termdispersion modelling over a period of one year, the percentilerunning through his house is percentile 85 for 1 ou m�3, corre-sponding to a waste odour perceived during 15% of the time. Thecloseness of both percentages could be a first indication of theability of the method to validate percentile calculation.
6. Conclusion
Using neighbourhood panellists brings valuable information forodour annoyance assessment, because they stay in the designatedarea and are exposed to the odour frequently. The present studydemonstrates the usefulness of the method to map different odoursources around an industrial park. An additional finding could behighlighting new unpredicted odour sources, such as “fuel and gas”in the present case or a wastewater drainage pipe in a study con-ducted by Gallego et al. (2008). By using tailored questionnaire, theresident diarymethod could also be applied on a shorter-term basisto the follow-up of odour emissions resulting from any modifica-tion of the facility, as in the case of the rehabilitation phase ofa landfill area.
However, this evaluation method also presents different draw-backs, as the distribution skew due to the number of times panelmembers report “no-odour”, the lack of impartiality of some resi-dents or the poor motivation for people living outside the exposedarea, which generally results in rejection of the results corre-sponding to the reference control zone. So, the responses of thepanellists should be checked for plausibility and validated againstother methods.
Fig. 9. Odour Annoyance Index averaged on a monthly basis with (grey) or without(white) weighting factor.
J. Nicolas et al. / Atmospheric Environment 44 (2010) 1623e16311630
Author's personal copy
Acknowledgements
The authors gratefully acknowledge Mrs Sylvia Vannesche, fromEcovie association, for her availability, her rigour and her patience inorganising theresidentnetworkandcollectingandencoding thedata.
References
Aitken, M.D., Okun, M.F., 1992. Quantification of wastewater odors by the affectedpublic. Water Environment Research 64, 720e727.
Cavalini, P.M., Koeter-Kemmerling, L.G., Pulles, M.P.J., 1991. Coping with odourannoyance and odour concentrations: three field studies. Journal of Environ-mental Psychology 11, 123e142.
Gallego, E., Soriano, C., Roca, F.X., Perales, J.F., Alarcón, M., Guardino, X., 2008.Identification of the origin of odour episodes through social participation,chemical control and numerical modelling. Atmospheric Environment 42,8150e8160.
Guo, H., Jacobson, L.D., Schmidt, D.R., Nicolai, R.E., 2003. Evaluation of the influenceof atmospheric conditions on odor dispersion from animal production sites.Transactions of the ASAE 46, 461e466.
Miedema, H.M., Walpot, J.I., Vos, H., Steunenberg, C.F., 2000. Exposure-annoyancerelationships for odour from industrial sources. Atmospheric Environment 34,2927e2936.
Nicell, J.A., 2009. Assessment and regulation of odour impacts. Atmospheric Envi-ronment 43, 196e206.
Nicolas, J., Craffe, F., Romain, A.C., 2006. Estimation of odor emission rate fromlandfill areas using the sniffing team methd. Waste Management 26,1259e1269.
Nimmermark, S.A., Jacobson, L.D., Schmidt, D.R., Gay, S.W., 2005. Predictions by theodor from feedlots, setback estimation tool (OFFSET) compared with observa-tions by neighbourhood monitors. Journal of Air and Waste ManagementAssociation 55, 1306e1314.
Pierrette, M., Moch, A., 2009. A. Etude des prédicteurs de la gêne olfactive auxabords d'un site industriel. Psychol. fr 54, 259e270.
Radon, K., Peters, A., Praml, G., Ehrenstein, V., Schulze, A., Hehl, O., Nowak, D., 2004.Livestock odours and quality of life of neighbouring residents. Annals of Agri-cultural and Environmental Medicine 11, 59e62.
Seffelaar, A.M., van der Zalm, C.J., Daamen, D.D., Dijksterhuis, G.B., Punter, P.H., 1992.A comparison of odour annoyance survey results. Staub. Reinhaltung der Luft52, 209e213.
Steinheider, B., Winneke, G., 1993. Industrial odours as environmental stressors.Exposure-annoyance associations and their modification by coping age andperceived health. Journal of Environmental Psychology 13, 353e363.
Tapper, N.J., Sudbury, A.W., 1991. Mapping odor sources from complaint statistics I:identifiying the major source. Journal of Air and Waste Management Associa-tion 41, 433e441.
Van Broeck, G., Van Langenhove, H., 2000. Development of a methodology to set upodour-quality objectives for sewage-treatment plants in Flanders. Journal of theChartered Institution of Water and Environmental Management 14, 318e324.
VDI, 1993. Effects and Assessment of Odours. Determination of AnnoyanceParameters by Questioning. Repeated Brief Questioning of Neighbour Panellists.Guideline VDI 3883 e Part 2. Verein Deutscher Ingenieure e Beuth Verlag,Düsseldorf, Germany.
VDI, 1997. Effects and Assessment of Odours. Psychometric Assessment of OdourAnnoyance. Questionnaires. Guideline VDI 3883 e Part 1. Verein DeutscherIngenieure e Beuth Verlag, Düsseldorf, Germany.
Wing, S., Horton, R.A., Marshall, S.W., Thu, K., Tajik, M., Schinasi, L., 2008. Airpollution and odor in communities near industrial swine operations. Environ-mental Health Perspectives 116, 1362e1368.
J. Nicolas et al. / Atmospheric Environment 44 (2010) 1623e1631 1631