No Pig Atoll: Island Biogeography and the Extirpation of a Polynesian Domesticate
PLANTS DNA EXTRACTION AND BARCODING 1
Identification of Hawaiian and Polynesian Plants along with an
Investigation of their Phylogenetics by means of DNA Extraction
and Barcoding
Helmi Merkhi
BIOL 2053
April 20th, 2015
PLANTS DNA EXTRACTION AND BARCODING 2
Identification of Hawaiian and Polynesian Plants along with an
Investigation of their Phylogenetics by means of DNA Extraction
and Barcoding
As humans expanded, their need to distinguish the
multitude of organisms with which they interact increased. The
method of taxonomy started during the classical era. The ancient
Greeks and Romans began classifying and naming organisms.
Particularly those that were useful to them like medical plants
and certain beneficial animals. They made names for the animals
they hunted and those that were dangerous to them, as well as,
plants that helped make healing remedies to cure the sick (Knapp,
2007). More recently however, in 1753, Carl Linnaeus, a Swedish
natural scientist implemented a logical system of taxonomic
classification. In the traditional Linnaean system of
classification, which is still widely used today, the kingdoms of
life are subdivided, in a hierarchic manner, into successively
PLANTS DNA EXTRACTION AND BARCODING 3
narrower categories. These categories are phylum, class, order,
family, genus, and species (Skinner & Murck, 2011). The
conventional organisms’ binomial nomenclature used today is
derived from this taxonomic system.
Certain processes like mutations, speciation, genetic drift
and natural selection lead to today’s spectacular biodiversity.
Yet on the other hand, urbanization, logging, climate change, and
the increasing numbers of human-introduced invasive species lead
to what is called the 6th mass extinction biologists currently
monitor. Consequently, the taxonomy field became very useful for
organizing and keeping track of the various species along with
detecting and managing invasive alien ones. Hawaii sets a good
example with its numerous exotic species on the verge of
extinction. The forest structure no longer resembles its native
past with 50% of its plant taxa at risk of endangerment and 8.33%
declared extinct (Sakai et al., 2002). With globalization and
tourism as a main industry, taxonomy is needed more than ever
before in order to distinguish the native Hawaiian species from
the invasive alien ones. Identifying alien species is a first
PLANTS DNA EXTRACTION AND BARCODING 4
step towards taking the right measures to preserve the native
species.
In the same taxonomy context, new technologies have been
implemented to enable the identification of the numerous
organisms with higher precision. A relatively new method of DNA
extraction and barcoding is now used worldwide. DNA extraction
serves to obtain and purify the DNA from its surrounding cellular
environment through a certain biochemical procedure. DNA
barcoding serves a different purpose; it is designed to use a
specific DNA sequence to serve as a unique species identifier.
The two procedures work together as the DNA obtained from the
extraction is analyzed and sequenced in the DNA barcoding
procedure. The two methods are fundamental to the experiment
carried in this lab. From a holistic perspective, the goal of
this lab is to identify a number of native Hawaiian and
Polynesian plants by means of DNA extraction and barcoding.
A phylogenetic tree depicting the evolutionary relationships
of the plant species studied is the ultimate result of the lab.
However, to reach such result multiple steps are taken. The task
PLANTS DNA EXTRACTION AND BARCODING 5
starts with DNA extraction. The obtained DNA is then amplified
and enhanced through a process called PCR (Polymerase chain
reaction). Gel electrophoresis is a sub-step that allows the
monitoring of the quality of the amplified DNA, before it is
barcoded. The sequencing and identification of the species relies
on certain computer programs which are DNA subway and BLAST
(basic local alignment search tool). Once identified, the
different plant species are organized into a phylogenetic tree
using another program named PHYLIP. The plants were pre-
identified in order to test the efficiency of the entire process
by comparing the results to the true plants’ species.
Three hypotheses were tested throughout this lab. The first
was related to the DNA extraction, PCR amplification and gel
electrophoresis. It was hypothesized that correctly following the
procedure for DNA extraction and PCR amplification will result in
a successful DNA extract that is humanely visible. It was
predicted that if the DNA extraction and PCR are carried out
correctly, then DNA bands will be visible in the gel. The second
hypothesis pertained to the efficiency of DNA barcoding with rbcL
PLANTS DNA EXTRACTION AND BARCODING 6
(RuBisCO) gene. For this section it was hypothesized that the
identified plant species from the DNA BLASTN program would be
identical to the true identity of the plants. It was predicted
that if rbcL gene holds enough genetic information then the
BLASTN program will precisely identify the different species of
the plants. The third hypothesis is related to the phylogenetic
section of the experiment. It was hypothesized that the resulting
Neighbor Joining (NJ) phylogenetic tree would depict the
evolutionary relationships of plant species in a correct and
logical manner. It was predicted that if the phylogenetic tree
depicts the proper evolutionary relationships of the different
plants than the rbcL gene is suitable for this task.
Methods
1. DNA extraction, PCR amplification and gel electrophoresis:
The first step was to choose 2 plant leaves from the 20
specimens available. The objective of the first section of the
experiment was to isolate the DNA (Deoxyribonucleic acid) from
the plant tissue. The larger end of a 1000 µL pipette was pressed
against the plant leaves to collect a small disk of the plant’s
PLANTS DNA EXTRACTION AND BARCODING 7
tissue. The Larger leaves were saved as voucher specimens. To
prevent cross-contamination, a new pipette tip was used for each
plant specimen. It is also important to note that labeling was a
critical part throughout the entire identification procedure. The
specimens were then placed into 1.5 mL tubes followed by 100 µL
of nuclei lysis solution. This solution is used to disintegrate
the organelles surrounding the DNA like the chloroplasts and
mitochondria.
The next step was inserting a plastic pestle in the inner
surface of the 1.5 mL tube to grind up the rigid plant material
such as the cell walls. 500 mL of nuclei lysis were added to the
test tubes which were then incubated for 10 minutes in a 65 °C
water bath. The next step was adding 3 mL of RNase to degrade the
RNA as it is not the target DNA for this experiment. The tubes
were then incubated again for 15 minutes in a 37 °C water bath.
200 µL of protein precipitation solution was added and the test
tubes were then placed in the vortex machine for 5 seconds. The
next step was to incubate the test tubes in an ice bath for 5
minutes.
PLANTS DNA EXTRACTION AND BARCODING 8
The next step is fundamental to the DNA extraction
procedure. The test tubes are placed in a micro-centrifuge for 4
minutes at maximum speed in order to separate the pellet and the
cell debris from the DNA. 600 µL of the clear supernatant
solution was then transferred to a new test tube were it was
mixed with another 600 µL solution of isopropanol. The mixture
was micro-centrifuged again for 1 minute. Differently from the
previous step however, it is the pellet that contained the DNA
and not the supernatant solution. The isolated pellet was then
washed with a 70% ethanol solution and micro-centrifuged again
for 1 minute. The DNA pellet was once separated from its ethanol
solvent solution and left to air dry for 15 minutes.
Once the ethanol solution completely evaporated, 100 µL of
DNA rehydration solution was added in which the final DNA pellet
dissolved. Finally the test tubes were incubated overnight at 4°C
and stored at -20 °C. 2.5 µL from each solution was extracted for
the Polymerase chain reaction (PCR). The main PCR steps are:
first, heating at 94 °C to denature DNA strands. Second, cooling
at 55°C to anneal primers to template. Lastly, warming at 72 °C
PLANTS DNA EXTRACTION AND BARCODING 9
to activate the polymerase, which extends primers and replicates
DNA. The three steps cycle is repeated 35 times in order to
amplify the DNA sequence.
To check the quality of the resulting DNA sequence from the
PCR, a method of gel electrophoresis is employed. In general
terms, the DNA sequences are loaded into separate wells in a gel.
The left most well of the gel is filled with a DNA marker. The
gel is placed in an electrophoresis chamber with the wells close
to the black (negative) electrode. On a voltage of 130V the gel
is left to electrophorese for 20 to 30 minutes. Because DNA
nucleotides have different sizes and charges, they will migrate
towards the red (positive) electrode which indicates the success
of the DNA extraction and PCR. The gels are stained with
CaliforniaBLU stain which allows the visibility of the DNA bands.
2. Barcoding with the rbcL Gene:
The DNA samples pertaining to successful gel
electrophoresis were selected and sent to certain laboratories to
be analyzed and transformed to computer DNA trace files. These
trace files are then uploaded to an online computer program
PLANTS DNA EXTRACTION AND BARCODING 10
called DNA subway. The program electronically turns the trace
files into a barcode and allows the user to perform certain tasks
such as locating sequences of god quality and trimming out
sequences of mediocre quality. The program also allows the user
to pair up the forward and reverse sequences to locate possible
mutations or mismatches. The finalized DNA sequences are then
copied into another program called BLAST. This program compares
the DNA sequences to the ones previously saved into an online
database. The data base is implemented by the National Center of
Biotechnology Information (NCBI). The program matches the
sequences and yields the name of the organism to which the DNA
sequence belongs.
3. Phylogenetics using the rbcL gene:
The last part of the experiment was creating a
phylogenetic tree that represents the evolutionary relationships
between the identified plant species. The neighbor joining (NJ)
tree is a final depiction of the evolutionary closeness of the
studied plant species based on their rbcL genetic information. A
PLANTS DNA EXTRACTION AND BARCODING 11
subprogram of the DNA subway called PHYLIP NJ is used to generate
the phylogenetic tree.
Results
1. DNA extraction, PCR amplification and gel electrophoresis:
For this part of the experiment, the effectiveness of the
DNA extraction technique along with the PCR amplification are
tested. It was hypothesized that carefully following the standard
procedure for DNA extraction and PCR would successfully yield a
DNA extract. It was predicted that if the DNA extraction and PCR
were successful than DNA bands will be humanely visible through
the gel electrophoresis. Since the process of isolating the
plant’s DNA from its tissue is very long and intricate, the
margin of error is quite large. A good method to verify the
quality of the extracted and amplified plant rbcL DNA, before
moving into the DNA barcoding process, is gel electrophoresis.
This method revolves around certain DNA characteristics; the
difference sizes of its composing nucleotides as well as their
different negative charges. The resulting gel after staining with
CaliforniaBLU is shown in figure 1.
PLANTS DNA EXTRACTION AND BARCODING 12
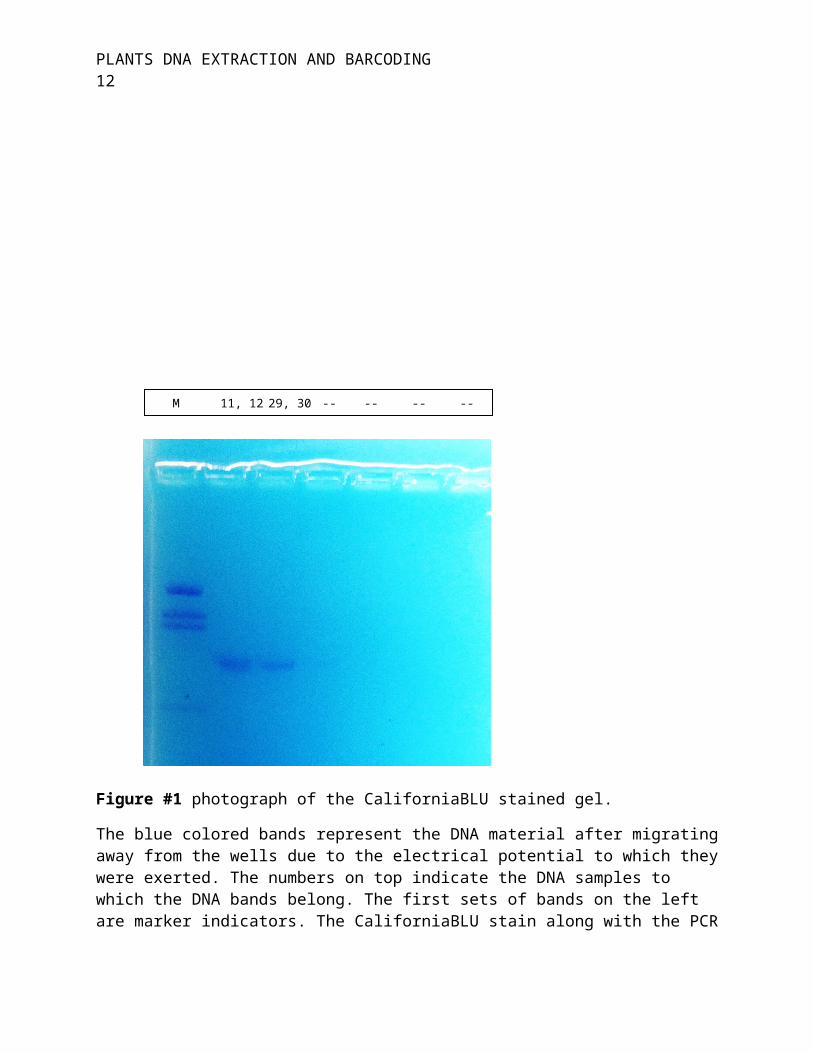
Figure #1 photograph of the CaliforniaBLU stained gel.
The blue colored bands represent the DNA material after migratingaway from the wells due to the electrical potential to which theywere exerted. The numbers on top indicate the DNA samples to which the DNA bands belong. The first sets of bands on the left are marker indicators. The CaliforniaBLU stain along with the PCR
M 11, 12 29, 30 -- -- -- --
PLANTS DNA EXTRACTION AND BARCODING 13
amplification largely contributed to making the DNA sequences visible.
The two bands that formed belong to four DNA samples. Since
each two samples came from the same plant species, it was
acceptable to combine them. The DNA band from samples 11 and 12
and the DNA band from samples 29 and 30 reacted to the
electrophoreses process by migrating towards the positive
electrode. And most significantly, they are clearly visible.
Therefore, both the hypothesis and the prediction for this
section were confirmed.
2. Barcoding with the rbcL Gene:
In this section, the capability of the rbcL gene to contain
enough genetic information for the correct species identification
is tested. In other words, the objective of this section is to
test whether or not, DNA from the rbcL gene is enough to identify
an unknown species. It was hypothesized that the identified plant
species from the DNA BLASTN program would be identical to the
true identity of the plants. It was predicted that if the rbcL
PLANTS DNA EXTRACTION AND BARCODING 14
gene holds enough genetic information then the BLASTN program
will precisely identify the different species of the plants. The
results from this section are organized in the following table.
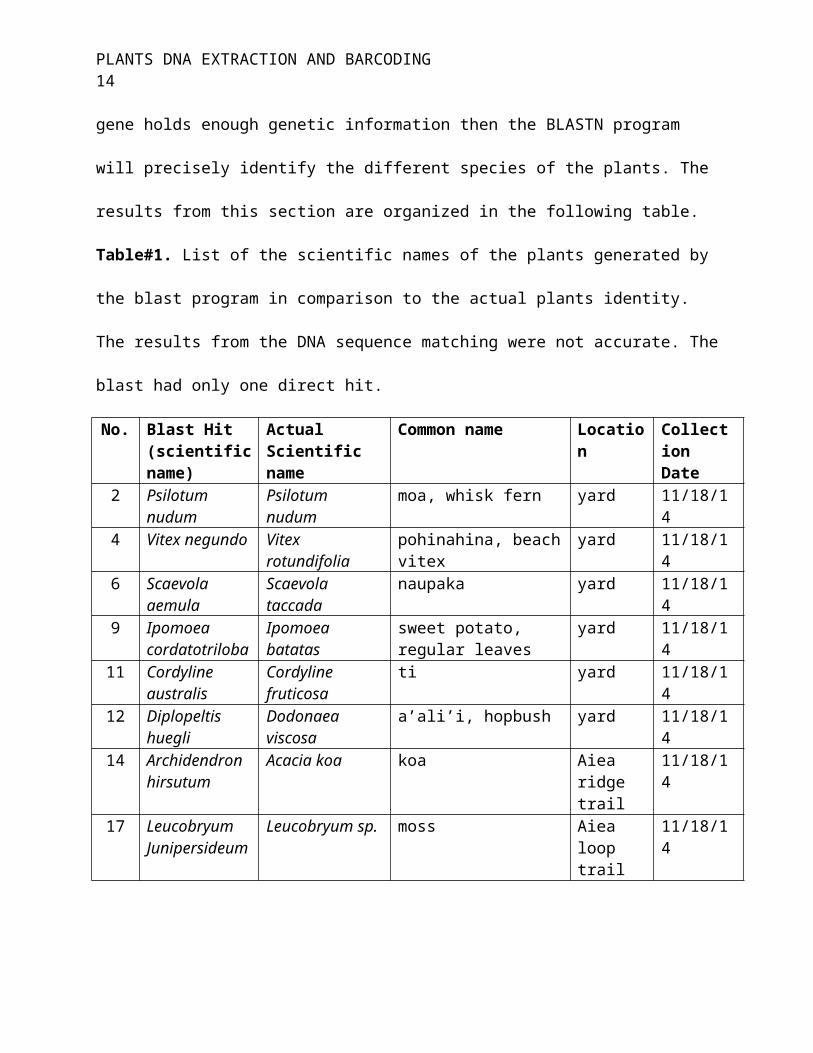
Table#1. List of the scientific names of the plants generated by
the blast program in comparison to the actual plants identity.
The results from the DNA sequence matching were not accurate. The
blast had only one direct hit.
No. Blast Hit (scientificname)
Actual Scientific name
Common name Location
Collection Date
2 Psilotum nudum
Psilotum nudum
moa, whisk fern yard 11/18/14
4 Vitex negundo Vitex rotundifolia
pohinahina, beachvitex
yard 11/18/14
6 Scaevola aemula
Scaevola taccada
naupaka yard 11/18/14
9 Ipomoea cordatotriloba
Ipomoea batatas
sweet potato, regular leaves
yard 11/18/14
11 Cordyline australis
Cordyline fruticosa
ti yard 11/18/14
12 Diplopeltis huegli
Dodonaea viscosa
a’ali’i, hopbush yard 11/18/14
14 Archidendron hirsutum
Acacia koa koa Aiea ridge trail
11/18/14
17 Leucobryum Junipersideum
Leucobryum sp. moss Aiea loop trail
11/18/14
PLANTS DNA EXTRACTION AND BARCODING 15
Only one plant species out of eight DNA samples was
accurately identified. The Psilotum nudum, a native Hawaiian whisk
fern often referred to as moa or moa nehele in Hawaiian. The
identification of the other seven species wasn’t completely off,
yet, it was not correct. As a result, both the hypothesis and the
prediction were refuted for this section.
3. Phylogenetics using the rbcL gene:
This section of the experiment tests whether the phylogeny
from DNA subway matches the general understanding of plant
evolution. In different terms, whether or not the genetic
information from rbcL gene are suitable for phylogeny. It was
hypothesized that the resulting Neighbor Joining (NJ)
phylogenetic tree would depict the evolutionary relationships of
plant species in a correct and logical manner. It was predicted
that if the phylogenetic tree depicts the proper evolutionary
relationships of the different plants than the rbcL gene is
suitable for this task. At first, the program PHYLIP NJ generated
a non-logical phylogenetic tree. It placed the Psilotum nudum and
the Leucobryum sp. as sister species in the same clade, sharing a
PLANTS DNA EXTRACTION AND BARCODING 16
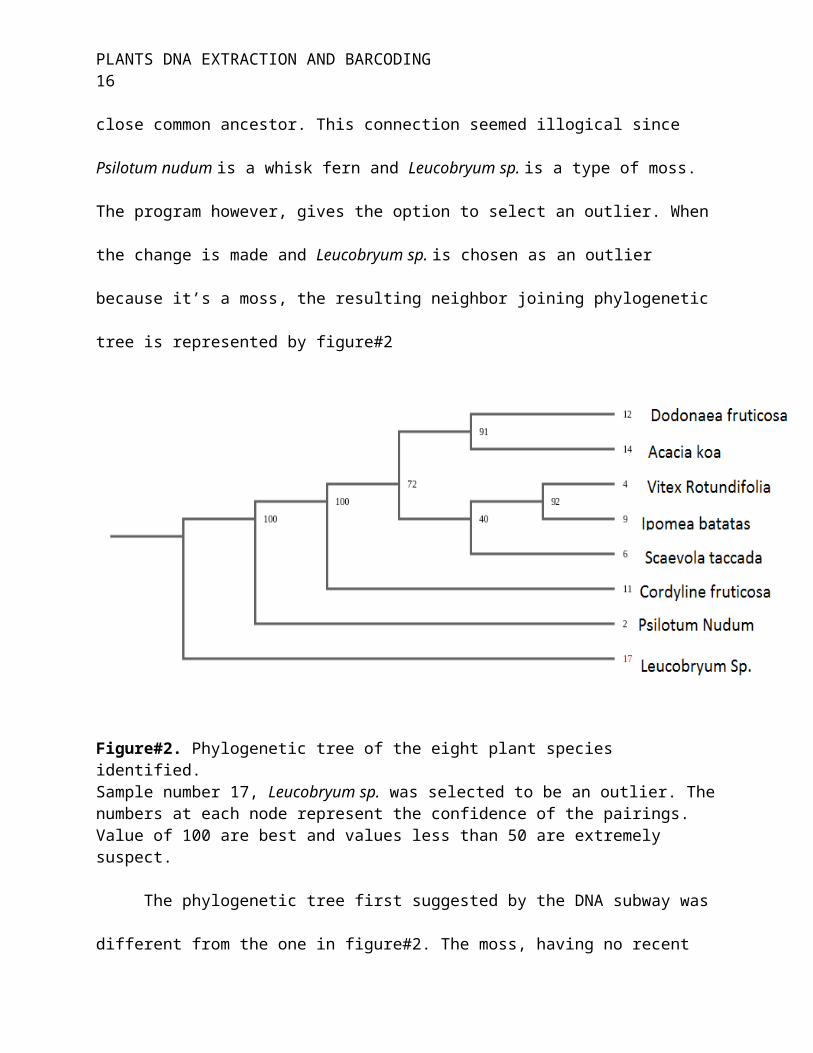
close common ancestor. This connection seemed illogical since
Psilotum nudum is a whisk fern and Leucobryum sp. is a type of moss.
The program however, gives the option to select an outlier. When
the change is made and Leucobryum sp. is chosen as an outlier
because it’s a moss, the resulting neighbor joining phylogenetic
tree is represented by figure#2
Figure#2. Phylogenetic tree of the eight plant species identified. Sample number 17, Leucobryum sp. was selected to be an outlier. Thenumbers at each node represent the confidence of the pairings. Value of 100 are best and values less than 50 are extremely suspect.
The phylogenetic tree first suggested by the DNA subway was
different from the one in figure#2. The moss, having no recent
PLANTS DNA EXTRACTION AND BARCODING 17
common ancestor with any other plant species is key to testing
the authenticity of the phylogeny automatically produced by the
program. Failure to generate a logical phylogenetic tree reflects
on the validity of the use of rbcL as a lone DNA source. The DNA
sequence taken from the rbcL gene is either incompatible or not
enough to create a phylogenetic tree. As a result, both the
hypothesis and the prediction for this section were refuted.
Discussion
This experiment had three objectives: The first one was
testing the effectiveness of the standard DNA extraction and PCR
procedures. The second one was examining the capacity of the rbcL
gene to provide enough genetic information in order to identify
multiple plant samples. The third objective of this experiment is
to verify whether or not the rbcL gene alone is suitable for
phylogeny.
The first hypothesis was related to the DNA
extraction, PCR amplification and gel electrophoresis. It was
hypothesized that correctly following the procedure for DNA
extraction and PCR amplification will result in a successful DNA
PLANTS DNA EXTRACTION AND BARCODING 18
extract that is humanely visible. This hypothesis was supported
by the results. As predicted, DNA bands appeared in the gel at
the end of the gel electrophoresis procedure. Two DNA bands,
pertaining to four plant samples, migrated from the negative
electrode to the positive electrode and were clearly visible
(figure#1).
This is important because not only it means that DNA
extraction and PCR amplification procedures were carried out
correctly, but it also gives credibility to the complex and
intricate procedure itself. In the big image, such procedure is
critical to the advancement of biology as a whole, especially
that DNA analysis is widely used today for a multitude of
purposes. Additionally, this procedure allows non experts in the
taxonomy field to identify any organism. A good example is the
story of the two eleven graders from New York who were able to
detect numerous market substitutions through DNA extraction and
barcoding.
The second hypothesis pertained to the efficiency of
DNA barcoding with rbcL (RuBisCO) gene. For this section it was
PLANTS DNA EXTRACTION AND BARCODING 19
hypothesized that the identified plant species from the DNA
BLASTN program would be identical to the true identity of the
plants. It was predicted that if rbcL gene holds enough genetic
information then the BLASTN program will precisely identify the
different species of the plants. Neither the hypothesis not the
prediction were supported by the results. Only one of the eight
plant species was accurately identified (table#1). However, the
BLASTN program was 75% efficient in determining the plants’
genus. Six out of the eight plants had a matching genus.
Failure to identify the exact plant species could be
due errors. The intricate DNA extraction procedure comes with a
wide margin for error. For example the use of a pipette tip twice
by mistake or the mislabeling of one of the test tubes could lead
to contamination and ultimately to a misidentification of the
species. It is important to mention that due to contamination,
samples 8, 20, and 21 had a bad quality barcodes. Prevention of
such contamination could have slightly altered the results. But
in general, it is concluded that the genetic information from
rbcL might not be enough to precisely identify any unknown
PLANTS DNA EXTRACTION AND BARCODING 20
species. Today, species are sometimes subdivided even further
into subspecies, varieties, or types (Skinner & Murck, 2011).
With the science continuously aiming for higher level of detail
and more precision, relying on the genetic information from rbcL
gene alone is not enough. Further research and programs have to
be developed to expand the DNA barcoding to larger sequences
including rbcL and COI and other genes. This would allow for a
higher precision in the identification of unknown species and
even subspecies. This would be important in numerous fields such
as biodiversity preservation and taxonomy.
The last section of this experiment was designed to
test the suitability of the rbcL gene for phylogenetic studies. A
phylogenetic tree was constructed through a subprogram of the
genetic subway using the genetic barcodes extracted from the rbcL
gene. It was hypothesized that the resulting Neighbor Joining
(NJ) phylogenetic tree would depict the evolutionary
relationships of plant species in a correct and logical manner.
It was predicted that if the phylogenetic tree depicts the proper
evolutionary relationships of the different plants than the rbcL
PLANTS DNA EXTRACTION AND BARCODING 21
gene is suitable for this task. Both the hypothesis and the
prediction for this section were refuted by the results.
The generated phylogenetic tree had a moss and a whisk
fern in the same clade as if they had a close common ancestor.
This is not plausible and it is probably why the program had the
option to alter the phylogenetic by choosing the outlier.
Manually selecting the moss as an outlier (figure#2) resulting in
a more logical tree with higher confidence rates. Only one
pairing confidence was under 50. It is concluded from such
results the genetic information provided by the rbcL gene alone
might not be enough to form an accurate phylogenetic tree. This
could be due to the fact that this gene was picked by the
scientific community for barcoding and not for phylogenetic
analysis. It is more likely to get an accurate phylogenetic tree
if the genetic barcoding includes multiple gene. Additionally, to
further investigate the evolutionary relationships between
organisms, the genetic information has to be supplemented by the
morphological traits of the organisms.

PLANTS DNA EXTRACTION AND BARCODING 22
PLANTS DNA EXTRACTION AND BARCODING 23
Literature Cited
Knapp, S. (2007, March). What's in a name? A history of Taxonomy.
In Natural History
Museum. Retrieved April 18, 2015, from
http://www.nhm.ac.uk/nature-online/science-of-natural-
history/taxonomy-systematics/history-taxonomy/session1/
Sakai, A.K. et al. (2002) Patterns of endangerment in the Hawaiian flora. Systematic
Biology 52, 276-302
Skinner, B. & Murck, B. (2011). The blue planet: an introduction to earth system
science. Hoboken, NJ: Wiley
Copyright © 2022 FDOKUMEN