Identification of games and sex-related activity profile in junior ...
17
Full Terms & Conditions of access and use can be found at https://www.tandfonline.com/action/journalInformation?journalCode=rpan20 International Journal of Performance Analysis in Sport ISSN: 2474-8668 (Print) 1474-8185 (Online) Journal homepage: https://www.tandfonline.com/loi/rpan20 Identification of games and sex-related activity profile in junior international badminton Daniel Rojas-Valverde, Carlos D. Gómez-Carmona, Jaime Fernández- Fernández, Juan García-López, Vicente García-Tormo, David Cabello- Manrique & José Pino-Ortega To cite this article: Daniel Rojas-Valverde, Carlos D. Gómez-Carmona, Jaime Fernández- Fernández, Juan García-López, Vicente García-Tormo, David Cabello-Manrique & José Pino-Ortega (2020): Identification of games and sex-related activity profile in junior international badminton, International Journal of Performance Analysis in Sport, DOI: 10.1080/24748668.2020.1745045 To link to this article: https://doi.org/10.1080/24748668.2020.1745045 Published online: 15 Apr 2020. Submit your article to this journal View related articles View Crossmark data
-
Upload
khangminh22 -
Category
Documents
-
view
0 -
download
0
Transcript of Identification of games and sex-related activity profile in junior ...
Full Terms & Conditions of access and use can be found athttps://www.tandfonline.com/action/journalInformation?journalCode=rpan20
International Journal of Performance Analysis in Sport
ISSN: 2474-8668 (Print) 1474-8185 (Online) Journal homepage: https://www.tandfonline.com/loi/rpan20
Identification of games and sex-related activityprofile in junior international badminton
Daniel Rojas-Valverde, Carlos D. Gómez-Carmona, Jaime Fernández-Fernández, Juan García-López, Vicente García-Tormo, David Cabello-Manrique & José Pino-Ortega
To cite this article: Daniel Rojas-Valverde, Carlos D. Gómez-Carmona, Jaime Fernández-Fernández, Juan García-López, Vicente García-Tormo, David Cabello-Manrique &José Pino-Ortega (2020): Identification of games and sex-related activity profile in juniorinternational badminton, International Journal of Performance Analysis in Sport, DOI:10.1080/24748668.2020.1745045
To link to this article: https://doi.org/10.1080/24748668.2020.1745045
Published online: 15 Apr 2020.
Submit your article to this journal
View related articles
View Crossmark data

Identification of games and sex-related activity profile injunior international badmintonDaniel Rojas-Valverde a,b, Carlos D. Gómez-Carmona c, Jaime Fernández-Fernández d,Juan García-López d, Vicente García-Tormo d, David Cabello-Manriquee and José Pino-Ortega f
aCentro De Investigación Y Diagnóstico En Salud Y Deporte (CIDISAD), Escuela Ciencias Del MovimientoHumano Y Calidad De Vida (CIEMHCAVI), Universidad Nacional, Heredia, Costa Rica; bResearch Group onAdvances in Sport Training and Physical Conditioning, Sport Science Faculty, University of Extremadura,Caceres, Spain; cOptimization of Training and Sport Performance Research Group (GOERD). Sport ScienceFaculty. University of Extremadura, Caceres, Spain; dHuman Movement and Sport Performance ResearchGroup (AMRED). Department of Physical Activity and Sport Sciences, Universidad De León, Spain;eDepartment of Physical Education and Sport. Sport Science Faculty. University of Granada, Granada, Spain;fDepartment of Physical Activity and Sport Sciences. International Excellence Campus “Mare Nostrum”. SportScience Faculty, University of Murcia, San Javier, Spain
ABSTRACTThe aims of the present study were (a) to analyse the activity profilein U’18 Badminton players during an international tournament and(b) to compare the games and sex-related differences. Twenty-fourplayers (women = 14; men = 10) were assessed using inertialmeasurement units with ultra-wideband indoor tracking system.Eleven variables were extracted after principal component analysis(PCA). Differences between games and gender were performed bymixed analysis of variance. In men, PCA of the whole gameexplained 89.2% and in women 75.7%. The most representativevariables in men’s and women’s were relative distance and max-imum accelerations (PC1). The players’ activity profile was (men vswomen) 44.6 ± 3.8 vs 43.5 ± 5.2 m/min in relative distance,25.9 ± 1.9 vs 24.7 ± 1.9 n/min in relative acceleration, 3.87 ± 0.3 vs3.47 ± 0.4 m/s2 in maximum acceleration, 175.5 ± 9.4 vs173.2 ± 15.6 bpm in average heart rate. Sex-related differenceswere found in maximum accelerations (p < 0.01) and relative accel-erations (p < 0.01) and in relative distance by games. The workloaddynamics during games and between sexes should be addressedby team staff in order to develop effective tactical and recoverystrategies during badminton tournaments.
ARTICLE HISTORYReceived 9 December 2019Accepted 17 March 2020
KEYWORDSRacket sports; time-motionanalysis; indoor tracking;inertial devices; loaddemands
1. Introduction
Badminton is a racket sport characterised by intermittent actions composed of repetitiveshort periods of exercise with rapid changes of direction combined with explosive burstslasting between 1-to-9 seconds and short recovery periods of low-intensity activity
CONTACT Carlos D. Gómez-Carmona [email protected] Training Optimization and Sport PerformanceResearch Group (GOERD). Department of Didactics of Music, Plastic and Body Expression. Sport Science Faculty, Universityof Extremadura. Avenida De La Universidad S/n, Caceres 10071, Spain
INTERNATIONAL JOURNAL OF PERFORMANCE ANALYSIS IN SPORThttps://doi.org/10.1080/24748668.2020.1745045
© 2020 Cardiff Metropolitan University
(standing or walking for 6-to-15 seconds), that result in an effective playing time of 40–50% (Fernandez-Fernandez et al., 2019; Fuchs et al., 2014; Phomsoupha & Laffaye, 2015).These activity locomotion patterns produce physiological responses associated with theexercise intensity showing relatively high heart rate (HR) responses (80-to-90% ofmaximum heart rate (HRmax)) (Cabello-Manrique & González-Badillo, 2003; Deka etal., 2017), moderate oxygen uptake (O2) with values around 70% of maximum oxygenuptake (VO2max), and low-to-moderate blood lactate (up to 5 mmol.L−1). These high-intensity levels can be maintained due to the ratio between playing and resting phases,which is about 1:2 (Phomsoupha et al., 2017), and also because of the longer breaks inplay (i.e. 2-min breaks between games or a 60-s break when one side reaches 11-points)(Fernandez-Fernandez et al., 2013).
Competitive badminton matches are typically comprised of a best of 3-set formatto 21-points, with total match durations at the top level ranging in men between2994 ± 1160 and 2745 ± 928 s and in women 2848 ± 995 during the 2010 and 2012world-series tournaments and 2016 Olympic Games (Chiminazzo et al., 2018; Gawinet al., 2015). Knowledge of the workload profile during competition is fundamentalfor designing effective physical conditioning programmes. In this regard, the loaddemands could be influenced by (a) gender, where men engaged in longer rallies,executing more strokes per rally, and with a longer match duration than women,although no differences in physiological and biochemical markers was found(Fernandez-Fernandez et al., 2013; Rampichini et al., 2018), and (b) consecutivematches during a tournament with greater neuromuscular (loss of counter-movementjump height), physiological (%HRMAX), psychological (RPE) and biochemical stress(blood lactate, proteins, glucose, ketone bodies, erythrocytes) (Abian-Vicen et al.,2014; Fernandez-Fernandez et al., 2013).
In this regard, since badminton is an indoor sport, only video recordings have beenused to monitor players’ activity profiles (Barris & Button, 2008). In recent years, newdevices have been developed called electronic performance and tracking systems (EPTS).These devices integrate multiple sensors (e.g. accelerometer, gyroscope, magnetometer)(Wu et al., 2007), and tracking technology that allowing accurate and reliable assessmentin sports played indoor and in reduced spaces (Bastida-Castillo et al., 2019, 2018;Luteberget et al., 2018). Several studies have been recently published using this technol-ogy in order to quantify badminton loads, through accelerometer variables such as peakacceleration and accumulated accelerometer load (PlayerLoadTM) per axis and perintensity ranges (Abdullahi et al., 2019; Sasaki et al., 2018; Wylde et al., 2018).Quantifying this information during real or simulated badminton matches may helpcoaches to provide objective knowledge about the demands of badminton play, ulti-mately improving the development of effective training and recovery programmes.
The EPTS provide a great amount of variables related to the workload profile, such asthe magnitude and frequency of actions/skills (impacts, jumps, steps, landings, changesof direction) and travel (distance, speed, accelerations) that are defined as big data (Rojas-Valverde, Gómez-Carmona et al., 2019). In this regard, in order to reduce the amount ofdata obtained and make the subsequent analysis a little bit easier, a statistical techniqueconducted in other research areas (e.g. mathematics) has been proposed and implemen-ted in sport science (Federolf et al., 2014; Rojas-Valverde, Sánchez-Ureña et al., 2019;Svilar et al., 2018). The aim of PCA is to select a small number of variables that are not
2 D. ROJAS-VALVERDE ET AL.
self-correlated and explains a high percentage of the total variance of the analysed data(Rojas-Valverde, Sánchez-Ureña et al., 2019). However, to the best of our knowledge, noprevious study has been conducted in racket sports using PCA methodology.
Therefore, due to the need to understand the most important variables that influenceperformance in badminton, the aims of this study were (a) To analyse the activity profileduring an U’18 International badminton tournament and (b) To compare the games andsex-related differences in load demands.
2. Methods
2.1. Design
A cross-sectional design with natural groups was employed in the current study toanalyse the activity profile of badminton players during a U’18 youth internationaltournament and to compare the match games and sex-related differences in the workloaddynamics.
2.2. Participants
Twenty-four elite junior Spanish badminton players (10 men and 14 women; age16.2 ± 0.8 years, body mass 63.5 ± 6.6 kg, height 173.2 ± 6.3 cm) participated in thisstudy. The players were ranked between 1 and 20 in their respective national singlesranking (U’18), they trained 18.2 ± 1.6 h per week and had a training background of7.2 ± 1.4 years. The participants were not taking medications for the duration of the studyand had been free of musculoskeletal injuries during the previous 3 months. Beforetaking part in the study, participants and their parents/guardians were fully informedabout the protocol and provided their written informed consent. The Institutional EthicsBoard approved the procedures in accordance with the latest version of the Declarationof Helsinki.
2.3. Procedures
The assessment of the singles matches was conducted using inertial measurement units(IMU, WIMU PRO™, RealTrack Systems, Almería, Spain), which include differentsensors to record data on time-motion (outdoor: Global Navigation Satellite System,GNSS; indoor: Ultra-Wideband, UWB), and specific actions/skills (accelerometer, gyro-scope, magnetometer) and link with other sensors (Ant+, Bluetooth, Wi-Fi). All playerswore a special neoprene vest and the IMU was attached at the interscapular level prior tothe warm-up for each match. Besides, players wore an HR band (GARMINTM, Olathe,KA, USA) that sent data to the IMU through Ant+ technology (Molina-Carmona et al.,2018). The sampling frequency of the sensors was 18 Hz for UWB, 100 Hz for accel-erometer, magnetometer and gyroscope and 2 Hz for HR telemetry.
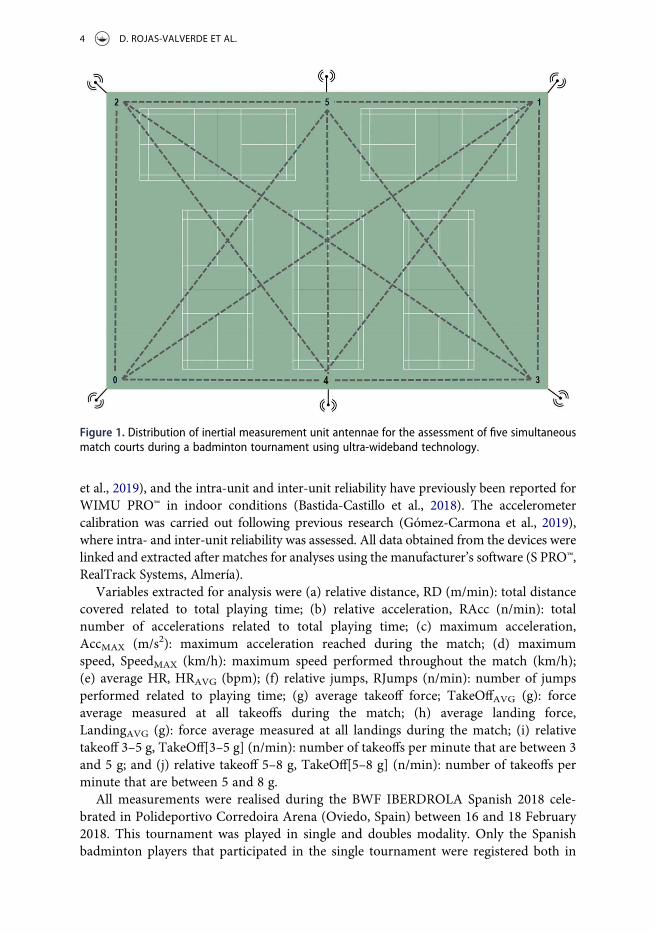
UWB indoor tracking technology was used for time-motion analysis. In order tomonitor the whole arena (including five courts), six antennae were placed on the perimeterof the arena in order to monitor five matches at the same time (see Figure 1). The UWBequipment calibration was performed following previous study protocols (Bastida-Castillo
INTERNATIONAL JOURNAL OF PERFORMANCE ANALYSIS IN SPORT 3
et al., 2019), and the intra-unit and inter-unit reliability have previously been reported forWIMU PRO™ in indoor conditions (Bastida-Castillo et al., 2018). The accelerometercalibration was carried out following previous research (Gómez-Carmona et al., 2019),where intra- and inter-unit reliability was assessed. All data obtained from the devices werelinked and extracted after matches for analyses using the manufacturer’s software (S PRO™,RealTrack Systems, Almería).
Variables extracted for analysis were (a) relative distance, RD (m/min): total distancecovered related to total playing time; (b) relative acceleration, RAcc (n/min): totalnumber of accelerations related to total playing time; (c) maximum acceleration,AccMAX (m/s2): maximum acceleration reached during the match; (d) maximumspeed, SpeedMAX (km/h): maximum speed performed throughout the match (km/h);(e) average HR, HRAVG (bpm); (f) relative jumps, RJumps (n/min): number of jumpsperformed related to playing time; (g) average takeoff force; TakeOffAVG (g): forceaverage measured at all takeoffs during the match; (h) average landing force,LandingAVG (g): force average measured at all landings during the match; (i) relativetakeoff 3–5 g, TakeOff[3–5 g] (n/min): number of takeoffs per minute that are between 3and 5 g; and (j) relative takeoff 5–8 g, TakeOff[5–8 g] (n/min): number of takeoffs perminute that are between 5 and 8 g.
All measurements were realised during the BWF IBERDROLA Spanish 2018 cele-brated in Polideportivo Corredoira Arena (Oviedo, Spain) between 16 and 18 February2018. This tournament was played in single and doubles modality. Only the Spanishbadminton players that participated in the single tournament were registered both in
Figure 1. Distribution of inertial measurement unit antennae for the assessment of five simultaneousmatch courts during a badminton tournament using ultra-wideband technology.
4 D. ROJAS-VALVERDE ET AL.
men and women. In this tournament participated youth players of different countries (inalphabetic order, Belgium, Brazil, Chile, Denmark, England, Finland, France, Guatemala,India, Ireland, Italy, Japan, Mauritius, Netherlands, Peru, Portugal, Romania, Spain,Sweden, Switzerland, United States and Uruguay). A total of 35 matches were measured,21 for the women (best women defeated in quarter-final) and 14 for the men (two playersdefeated in semi-finals).
First and second games were played to the best of 21 points following InternationalBadminton Federation Rules. Timeouts of 2 min between games and 1-min rest periodswhen one side reached 11 points were taken. The third set was played to the best of 11points. In order to have consistent measures, due to the differences between regulargames and third games, in the present investigation, only the first two games wereconsidered for analyses. The two games selected for analysis were distributed in thefollowing four games: (a) from the start of the game until the leading score reached 11points; (b) from when the leading score reached 11 points until the end of 1st set; (c) fromthe beginning of the 2nd set until the leading score reached 11 points; and (d) from whenthe leading score reached 11 points until the end of the 2nd set)
In addition, the duration of the different units of analysis was (men vs women, inseconds): (a) total match, 1410 ± 451.06 vs 1127.43 ± 283.05; (b) first game,315.21 ± 104.75 vs 256.60 ± 49.39; (c) second game, 315.57 ± 102.48 vs274.59 ± 113.23; (d) third game, 379.86 ± 149.02 vs 303.57 ± 89.50; and (e) fourthgame, 401.71 ± 240 vs 264.43 ± 68.78. For this reason, considering the differencesbetween games and total match duration, only relative and maximum variables wereconsidered for analysis (McLaren et al., 2018).
2.4. Statistical analysis
A total of 51 variables were examined for each part of the game and sex in the respectivecorrelation matrix prior to a Principal Component Analysis (PCA) in order to selectuncorrelated representative variables; firstly, r < 0.7 correlation between variables wasconsidered for extraction (Tabachnick & Fidell, 2007). PCA was performed followingpreviously published guidelines (Federolf et al., 2014; Rojas-Valverde, Sánchez-Ureña etal., 2019). Then, variables with variance = 0 were excluded. The 11 selected variablesthrough the previous processes were scaled and centred (Z-score). PCA was suitableconsidering Kaiser-Meyer-Olkin values (KMO = 0.63–0.066) and Barleth Sphericity testsignificance (p < 0.05) (Bartlett, 1954; Kaiser, 1960). Eigenvalues >1 were considered forthe extraction of principal components (Kaiser, 1960). A VariMax-orthogonal rotationmethod was performed in order to identify high correlations of components and guar-antee that each principal component offered different information. A threshold of 0.6 ineach PC loading was retained for interpretation, extracting the highest factor loadingwhen a cross-loading was found between components.
Mixed analysis of variance was performed in order to explore differences by matchgames and sex. The magnitude of the differences was qualitatively interpreted usingpartial omega squared (ωp2) as follows: <0.01 trivial; >0.01 small; >0.06 moderate and>0.14 large (Cohen, 1988). Instead, sex-related differences were analysed by t-test ofindependent sample for whole match variables. The magnitude of differences was inter-preted using Cohen’s d (d) as follows: 0–0.2 insignificant; 0.2–0.5 low; 0.5–0.8 moderate
INTERNATIONAL JOURNAL OF PERFORMANCE ANALYSIS IN SPORT 5
and >0.8 high (Cohen, 1988). Statistical differences were considered if p < 0.05. Dataanalysis was performed using the Statistical Package for the Social Sciences (SPSS, IBM,SPSS Statistics, v.22.0 Chicago, IL, USA), and graphs were made using Prism software(GraphPad Software, San Diego, CA).
3. Results
After PCA analysis in men, the activity profile of the whole match was explained in 89.2%of total variance by four principal components (PC1: RD, AccMAX, HRAVG, RJumps; PC2:RAcc, TakeOffAVG; PC3: LandingAVG; PC4: SpeedMAX, TakeOff[3–5 g], TakeOff[5–8 g]).Three to four PCs were extracted for each selected game, explaining 80.7–88.3% of totalvariance. The PC1 explained 33.1% (RD, SpeedMAX, HRAVG), 35.9% (RAcc, TakeOffAVG,TakeOff[5–8 g]), 35.8% (RD, RJumps, TakeOff[3–5 g]) and 47.3% (AccMAX, SpeedMAX)of the total variance in each part of the games. The variables that explained most of thevariance were RD (1st, 3rd games and whole match), SpeedMAX (1st, 4th games), HRAVG
(1st game and whole match), AccMAX (4th game and whole match), RAcc, TakeOffAVGand TakeOff[5–8 g] (2nd game), RJumps (3rd game and whole match) and TakeOffAVG(3rd game) (see Table 1).
In women, the activity profile of the whole match was explained in 75.7% of totalvariance by four principal components (PC1: RD, AccMAX, RJumps; PC2: HRAVG,TakeOffAVG, TakeOff[5–8 g]; PC3: RJumps, TakeOff[3–5 g]; PC4: RAcc). Four to fivePCs were extracted for each part of the game, explaining 74.2–88% of the total variance.The PC1 explained 39.4% (RD, SpeedMAX, HRAVG, LandingAVG), 30.5% (RD, AccMAX),28.9% (RD, AccMAX) and 32.2% (RD, AccMAX, SpeedMAX) of total variance in each part ofthe matches. The main variables extracted were RD (1st–4th games and whole match),AccMAX (4th game and whole match), SpeedMAX (1st game and whole match), HRAVG
(1st, 4th game and whole match), RJumps (whole match) and TakeOff[3–5 g] (3rd game)(see Table 2).
Table 3 shows the comparative analysis of badminton players’ activity profiles betweengames and sex. No significant interaction (sex vs games) was found in external workloadvariables (RD, RAcc, AccMAX, SpeedMAX, RJumps, TakeOffAVG, TakeOff[3–5 g], TakeOff
[5–8 g]) or internal load variables (HRAVG). Main effect analysis showed significantinteraction (p < 0.01) by sex in RAcc and AccMAX, and significant interaction(p = 0.03) by games in RD.
Figure 2 shows sex-related differences in the variables analysed. Results showedsignificant differences in RAcc (p < 0.01, d = 0.64, moderate effect) and AccMAX
(p < 0.01, d = 1.08, high effect), with higher values in men. No significant differenceswere found in the rest of the variables.
4. Discussion
No previous research has analysed the locomotion and specific actions through UWBtechnology and identified the principal variables that explained the total variance of loaddemands in young men and women badminton players in different parts of the match.The aims of the present study were to analyse the activity profile in badminton usingprincipal component analysis as a data reduction technique and to explore sex-related
6 D. ROJAS-VALVERDE ET AL.

Table1.
Men
principalcom
ponent
analysisby
gamewith
respectiveeigenvalue,variances
and%varianceexplained.
Gam
e1st
2nd
3rd
4th
Who
leMatch
PC1
23
41
23
41
23
41
23
12
34
Eigenvalue
3.65
2.14
1.83
1.3
3.94
2.99
1.71
1.06
3.94
2.91
1.48
1.05
5.2
2.12
1.56
4.09
2.66
1.67
1.39
Variance
33.14
19.43
16.66
11.72
35.86
27.19
15.58
9.67
35.79
26.47
13.49
9.55
47.25
19.29
14.21
37.19
24.18
15.17
12.65
%Variance
33.14
52.58
69.24
80.96
35.86
63.04
78.63
88.3
35.79
62.26
75.7
85.3
47.25
66.53
80.75
37.19
61.37
76.54
89.19
RD(m
/min)
.88
.74
.73
.68
.76
RAcc
(n/m
in)
−.71
.92
.67
.6.94
Acc M
AX(m
/s2 )
.86
.91
--
--
.86
.87
Speed M
AX(km/h)
.79
−.81
.86
.92
.7HR A
VG(bpm
).7
.8.77
.71
.78
RJum
ps(n/m
in)
.7.91
.87
.76
.85
TakeOffAVG(g)
.86
.95
.76
--
-.63
Land
ing A
VG(g)
--
--
.68
.92
.81
.95
TakeOff[3–5
g](n/m
in)
.94
.88
.92
.86
−.78
TakeOff[5–8
g](n/m
in)
.94
.89
.82
.85
.72
PC:Prin
cipalcom
ponent;RD:Relativedistance;RAcc:Relativeaccelerations;Acc
MAX:Maximum
acceleration;Speed M
AX:Maximum
speed;HR A
VG:Heartrateaverage;RJum
ps:Relativejumps;TakeO
ffAVG:
Takeoff
gforceaverage;Landing A
VG:landing
gforceaverage;TakeOff[3–5
g]:num
berof
takeoff
sperminutethat
arebetween3and5g;TakeOff[5–8
g]:num
berof
takeoff
sperminutethat
are
between5and8g.
INTERNATIONAL JOURNAL OF PERFORMANCE ANALYSIS IN SPORT 7
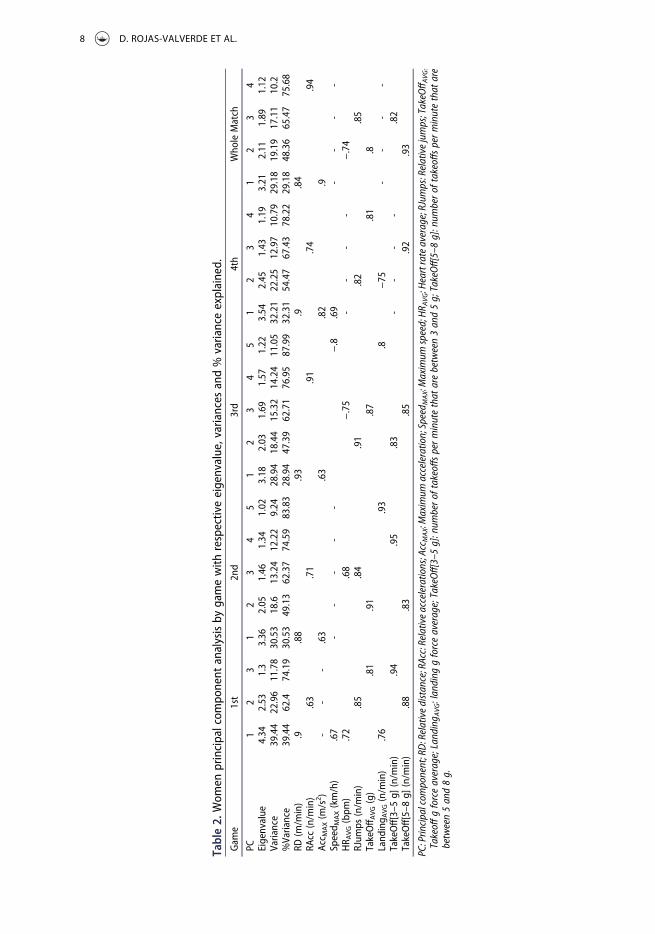
Table2.
Wom
enprincipalcom
ponent
analysisby
gamewith
respectiveeigenvalue,variances
and%
varianceexplained.
Gam
e1st
2nd
3rd
4th
Who
leMatch
PC1
23
12
34
51
23
45
12
34
12
34
Eigenvalue
4.34
2.53
1.3
3.36
2.05
1.46
1.34
1.02
3.18
2.03
1.69
1.57
1.22
3.54
2.45
1.43
1.19
3.21
2.11
1.89
1.12
Variance
39.44
22.96
11.78
30.53
18.6
13.24
12.22
9.24
28.94
18.44
15.32
14.24
11.05
32.21
22.25
12.97
10.79
29.18
19.19
17.11
10.2
%Variance
39.44
62.4
74.19
30.53
49.13
62.37
74.59
83.83
28.94
47.39
62.71
76.95
87.99
32.31
54.47
67.43
78.22
29.18
48.36
65.47
75.68
RD(m
/min)
.9.88
.93
.9.84
RAcc
(n/m
in)
.63
.71
.91
.74
.94
Acc M
AX(m
/s2 )
--
-.63
.63
.82
.9Speed M
AX(km/h)
.67
--
--
-−.8
.69
--
--
HR A
VG(bpm
).72
.68
−.75
--
--
−.74
RJum
ps(n/m
in)
.85
.84
.91
.82
.85
TakeOffAVG(g)
.81
.91
.87
.81
.8Land
ing A
VG(n/m
in)
.76
.93
.8−75
--
--
TakeOff[3–5
g](n/m
in)
.94
.95
.83
--
--
.82
TakeOff[5–8
g](n/m
in)
.88
.83
.85
.92
.93
PC:Prin
cipalcom
ponent;RD:Relativedistance;RAcc:Relativeaccelerations;Acc
MAX:Maximum
acceleration;Speed M
AX:Maximum
speed;HR A
VG:Heartrateaverage;RJum
ps:Relativejumps;TakeO
ffAVG:
Takeoff
gforceaverage;Landing A
VG:landing
gforceaverage;TakeOff[3–5
g]:num
berof
takeoff
sperminutethat
arebetween3and5g;TakeOff[5–8
g]:num
berof
takeoff
sperminutethat
are
between5and8g.
8 D. ROJAS-VALVERDE ET AL.
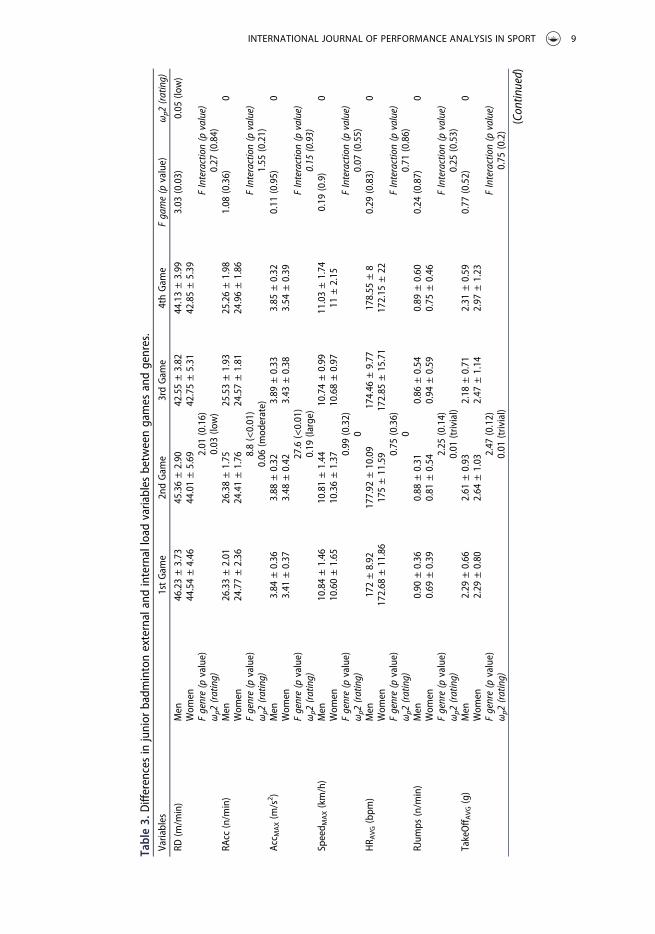
Table3.
Differencesin
junior
badm
intonexternalandinternalload
variables
betweengames
andgenres.
Variables
1stGam
e2ndGam
e3rdGam
e4thGam
eFgame(p
value)
ωp2
(rating)
RD(m
/min)
Men
46.23±3.73
45.36±2.90
42.55±3.82
44.13±3.99
3.03
(0.03)
0.05
(low)
Wom
en44.54±4.46
44.01±5.69
42.75±5.31
42.85±5.39
Fgenre(p
value)
2.01
(0.16)
FInteraction(p
value)
ωp2
(rating)
0.03
(low)
0.27
(0.84)
RAcc
(n/m
in)
Men
26.33±2.01
26.38±1.75
25.53±1.93
25.26±1.98
1.08
(0.36)
0Wom
en24.77±2.36
24.41±1.76
24.57±1.81
24.96±1.86
Fgenre(p
value)
8.8(<0.01)
FInteraction(p
value)
ωp2
(rating)
0.06
(mod
erate)
1.55
(0.21)
Acc M
AX(m
/s2 )
Men
3.84
±0.36
3.88
±0.32
3.89
±0.33
3.85
±0.32
0.11
(0.95)
0Wom
en3.41
±0.37
3.48
±0.42
3.43
±0.38
3.54
±0.39
Fgenre(p
value)
27.6(<0.01)
FInteraction(p
value)
ωp2
(rating)
0.19
(large)
0.15
(0.93)
Speed M
AX(km/h)
Men
10.84±1.46
10.81±1.44
10.74±0.99
11.03±1.74
0.19
(0.9)
0Wom
en10.60±1.65
10.36±1.37
10.68±0.97
11±2.15
Fgenre(p
value)
0.99
(0.32)
FInteraction(p
value)
ωp2
(rating)
00.07
(0.55)
HR A
VG(bpm
)Men
172±8.92
177.92
±10.09
174.46
±9.77
178.55
±8
0.29
(0.83)
0Wom
en172.68
±11.86
175±11.59
172.85
±15.71
172.15
±22
Fgenre(p
value)
0.75
(0.36)
FInteraction(p
value)
ωp2
(rating)
00.71
(0.86)
RJum
ps(n/m
in)
Men
0.90
±0.36
0.88
±0.31
0.86
±0.54
0.89
±0.60
0.24
(0.87)
0Wom
en0.69
±0.39
0.81
±0.54
0.94
±0.59
0.75
±0.46
Fgenre(p
value)
2.25
(0.14)
FInteraction(p
value)
ωp2
(rating)
0.01
(trivial)
0.25
(0.53)
TakeOffAVG(g)
Men
2.29
±0.66
2.61
±0.93
2.18
±0.71
2.31
±0.59
0.77
(0.52)
0Wom
en2.29
±0.80
2.64
±1.03
2.47
±1.14
2.97
±1.23
Fgenre(p
value)
2.47
(0.12)
FInteraction(p
value)
ωp2
(rating)
0.01
(trivial)
0.75
(0.2)
(Continued)
INTERNATIONAL JOURNAL OF PERFORMANCE ANALYSIS IN SPORT 9
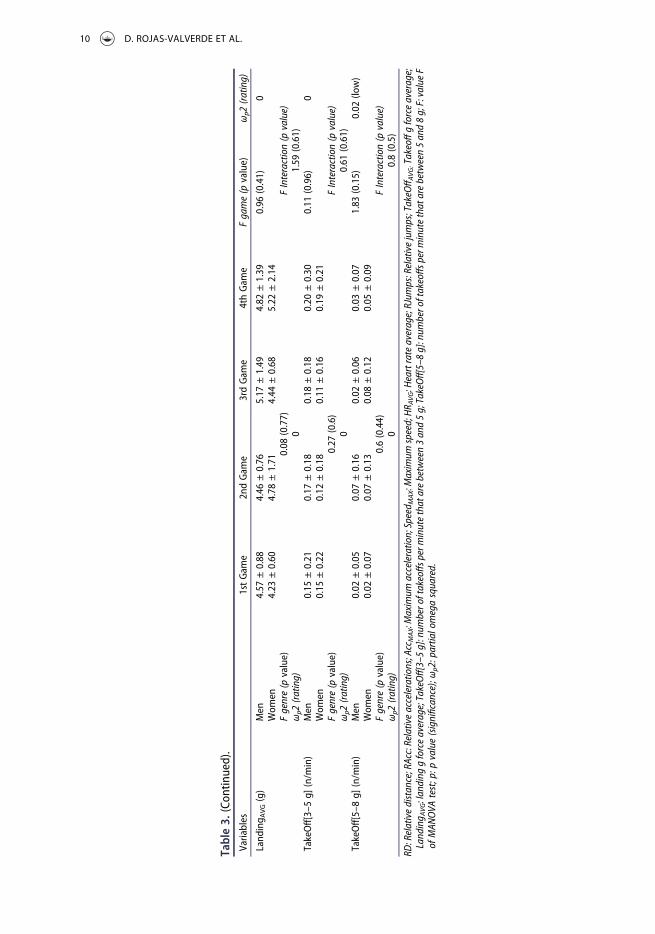
Table3.
(Con
tinued).
Variables
1stGam
e2ndGam
e3rdGam
e4thGam
eFgame(p
value)
ωp2
(rating)
Land
ing A
VG(g)
Men
4.57
±0.88
4.46
±0.76
5.17
±1.49
4.82
±1.39
0.96
(0.41)
0Wom
en4.23
±0.60
4.78
±1.71
4.44
±0.68
5.22
±2.14
Fgenre(p
value)
0.08
(0.77)
FInteraction(p
value)
ωp2
(rating)
01.59
(0.61)
TakeOff[3–5
g](n/m
in)
Men
0.15
±0.21
0.17
±0.18
0.18
±0.18
0.20
±0.30
0.11
(0.96)
0Wom
en0.15
±0.22
0.12
±0.18
0.11
±0.16
0.19
±0.21
Fgenre(p
value)
0.27
(0.6)
FInteraction(p
value)
ωp2
(rating)
00.61
(0.61)
TakeOff[5–8
g](n/m
in)
Men
0.02
±0.05
0.07
±0.16
0.02
±0.06
0.03
±0.07
1.83
(0.15)
0.02
(low)
Wom
en0.02
±0.07
0.07
±0.13
0.08
±0.12
0.05
±0.09
Fgenre(p
value)
0.6(0.44)
FInteraction(p
value)
ωp2
(rating)
00.8(0.5)
RD:Relativedistance;RAcc:Relativeaccelerations;Acc
MAX:Maximum
acceleration;Speed M
AX:Maximum
speed;HR A
VG:Heartrateaverage;RJum
ps:Relativejumps;TakeO
ffAVG:Takeoff
gforceaverage;
Landing A
VG:landing
gforceaverage;TakeOff[3–5
g]:num
beroftakeoffsp
erminutethatarebetween3and5g;TakeOff[5–8
g]:num
beroftakeoffsp
erminutethatarebetween5and8g;F:valueF
ofMAN
OVA
test;p:p
value(significance);ω
p2:partialomegasquared.
10 D. ROJAS-VALVERDE ET AL.
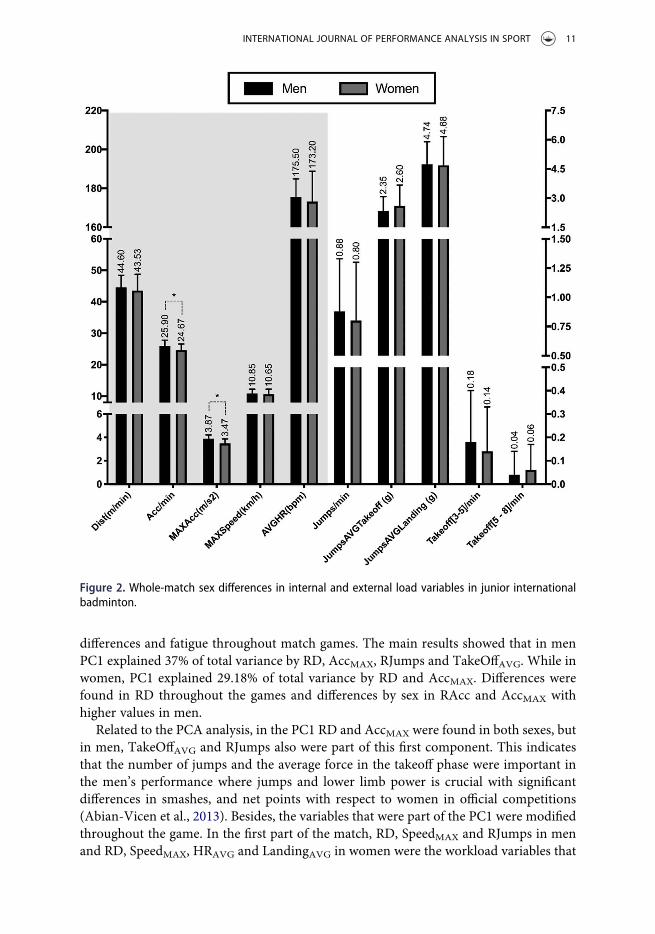
differences and fatigue throughout match games. The main results showed that in menPC1 explained 37% of total variance by RD, AccMAX, RJumps and TakeOffAVG. While inwomen, PC1 explained 29.18% of total variance by RD and AccMAX. Differences werefound in RD throughout the games and differences by sex in RAcc and AccMAX withhigher values in men.
Related to the PCA analysis, in the PC1 RD and AccMAX were found in both sexes, butin men, TakeOffAVG and RJumps also were part of this first component. This indicatesthat the number of jumps and the average force in the takeoff phase were important inthe men’s performance where jumps and lower limb power is crucial with significantdifferences in smashes, and net points with respect to women in official competitions(Abian-Vicen et al., 2013). Besides, the variables that were part of the PC1 were modifiedthroughout the game. In the first part of the match, RD, SpeedMAX and RJumps in menand RD, SpeedMAX, HRAVG and LandingAVG in women were the workload variables that
Figure 2. Whole-match sex differences in internal and external load variables in junior internationalbadminton.
INTERNATIONAL JOURNAL OF PERFORMANCE ANALYSIS IN SPORT 11

explain the highest part of total variance. However, in the last part of the second game,AccMAX and SpeedMAX in men and RD, AccMAX and SpeedMAX in women were thevariables that explain the greater percentage of total variance. This indicates thatthe volume of demands (RD, RJumps, LandingAVG) is the most important requirementat the start of the match. In contrast, at the end of the match, the high-intensity demands(SpeedMAX and AccMAX) explain the physical performance in the competition. Therefore,if the physical performance was different related to sex and throughout the game, thereshould be specialisation in training plans. Both sexes need to emphasise high-intensitylocomotion due to their importance for physical performance at the end of the matches.Additionally, men should also maximise technical actions that require jumps such assmashes or net points due to their importance for men’s physical performance duringbadminton matches.
In the present research, men performed significantly more RAcc (p < 0.01, d = 0.64)and AccMAX (p < 0.01, d = 1.08) than women. To the best of our knowledge, the presentstudy has been the first to analyse locomotion and skills in badminton. No previous studyhas analysed these variables in other racket sports, which makes comparisons difficult. Inother team sport modalities such as basketball (Scanlan et al., 2015) or handball(Michalsik & Aagaard, 2015) it has been found that women develop higher volumeloads (RD) and men higher intensity demands (RD>18 km/h; RAcc and AccMAX) duringofficial competition. Specifically, in badminton, men’s playing rhythm is faster and moreintense than women’s, according to previous research that found higher rally duration,more strokes per rally, smashes and net points that require more high-intensity locomo-tion and accelerations in men (Abian-Vicen et al., 2013; Fernandez-Fernandez et al.,2013).
However, no sex differences were found in the other variables analysed (SpeedMAX,HRAVG, RJumps, LandingAVG,TakeOff[3–5 g], TakeOffAVG and TakeOff[5–8 g]) despiteRD (p = 0.03). Previous studies showed no sex differences in several physiological/perceptual markers, such as HRAVG, percentage of maximum HR (%HRMAX), bloodlactate and rate of perceived exertion (Faude et al., 2007; Fernandez-Fernandez et al.,2013). Therefore, only the difference in the physical dynamics for badminton playbetween men and women is related to accelerations and high-intensity locomotion,that do not affect the volume of movements, internal load demands or jump capacity.
Finally, with respect to the demands in the different parts of the match, there werefound differences in RD. No previous research has analysed fatigue throughout the matchsets, but other research has analysed physiological and fatigue biomarkers betweenmatches in tournaments, with a tendency to an increase in values of HR, RPE and Laand a reduction of ROM and shoulder strength during the tournament (Faude et al.,2007; Fernandez-Fernandez et al., 2013, 2019). Maintaining maximum effort throughoutthe match without performance decreasing, presenting more intensity in the last part ofthe sets in both sexes is possible thanks to (a) a low effective playing time of 40-50%(Cabello-Manrique & González-Badillo, 2003; Fernandez-Fernandez et al., 2019; Fuchs etal., 2014; Phomsoupha & Laffaye, 2015), (b) 1:2 ratio between playing and resting phases(Phomsoupha et al., 2017), and (c) longer breaks in play (i.e. “timeouts” of 2 min betweengames or 1-min rest periods when one side reaches 11 points) (Fernandez-Fernandez etal., 2019). Therefore, to maintain the best performance throughout the match sets, andspecifically at the end of the sets, training sessions should combine high-intensity efforts
12 D. ROJAS-VALVERDE ET AL.
of very short duration (1-to-9 seconds) with short recovery periods of low-intensityactivity (standing or walking for 6-to-15 seconds). This training effort design simulatesthe competition demands (Cabello-Manrique & González-Badillo, 2003; Fernandez-Fernandez et al., 2019; Fuchs et al., 2014; Phomsoupha & Laffaye, 2015), and helps theplayer to develop a quick recovery between points with the aim of being at the bestphysical level for the next point and maintaining their best physical performancethroughout the match sets.
While the results of this study have provided information about the physical loaddemands of young badminton players during an international championship with con-secutive games per day recorded by an advanced tracking system, using principalcomponent analysis to determine the locomotion characteristics of the game based onfatigue throughout the sets of the game and sex-related differences, some limitations tothe study must be acknowledged. Although the sample used for this study is from younginternational badminton players, these results should be taken with caution whenapplying them to senior players. Due to the nature of the tournament, there werecontextual conditions that were not controlled such as rest and recovery between effortsthat could affect locomotor performance during the competition.
5. Conclusions
Relative distance, maximum acceleration, relative jumps and average TakeOff in men,and relative distance and maximum acceleration in women represented most of the totalvariance in the locomotion parameter selection by principal component analysis, beingconsidered determinants for U’18 badminton players sports performance. With respectto the demands in the different parts of the match, no differences were found betweenboth genders in any type of locomotion index, although the load dynamics presentedmore intensity in the last part of the sets (decisive phase to win the set), both in men andwomen. Regarding sex-related differences, relative acceleration and maximum accelera-tion presented higher values in men, so the volume of demands is similar in both sexes,the only difference being in the intensity of the locomotion.
New technology such as local positioning tracking systems and microsensor devicesallows the collection of data quickly and reliably in indoor conditions. These devicesprovide a large amount of data which is difficult to process to give a quick and simplereport to both athletes and coaching staff. To choose the most important variables ofbadminton that explain all variance of data, principal component analysis is a mathe-matical process that can reduce a large number of data to a small number of variables thatexplain the total behaviour in specific sport modalities.
Both genders obtained equal locomotion demands, but men performed more techni-cal actions that implied jumps. If the high-intensity demands are maintained throughoutthe game sets it is due to the continuous breaks between rallies and the intra-set andinter-set breaks during the games. Finally, in addition to jumps, men’s games are fasterthan women’s due to major demands in Relative Accelerations and MaximumAccelerations. Therefore, all these considerations should be taken into account whendesigning specific badminton simulated tasks, recovery programmes and strength andconditioning plans in order to achieve the best physical level and maintain the healthstatus of the athlete to avoid injuries.
INTERNATIONAL JOURNAL OF PERFORMANCE ANALYSIS IN SPORT 13
Acknowledgments
The authors would like to thank all the participants as well as their parents. Besides, we wouldlike to thank both Badminton Europe and Spanish Badminton Federation for giving thempermission to take part in this research and the International Technification BadmintonCentre in Oviedo.
Disclosure statement
No potential conflict of interest was reported by the authors.
Funding
The author Carlos D. Gómez Carmona was supported by a grant from the Ministerio deEducación, Cultura y Deporte [FPU17/00407]. This research received no specific grant from anyfunding agency in the public, commercial, or not-for-profit sectors.
ORCID
Daniel Rojas-Valverde http://orcid.org/0000-0002-0717-8827Carlos D. Gómez-Carmona http://orcid.org/0000-0002-4084-8124Jaime Fernández-Fernández http://orcid.org/0000-0002-5284-303XJuan García-López http://orcid.org/0000-0003-2834-3366Vicente García-Tormo http://orcid.org/0000-0002-8127-5393José Pino-Ortega http://orcid.org/0000-0002-9091-0897
References
Abdullahi, Y., Coetzee, B., & Van den Berg, L. (2019). Relationships between results of an internaland external match load determining method in male, singles badminton players. Journal ofStrength and Conditioning Research, 33(4), 1111–1118. https://doi.org/10.1519/JSC.0000000000002115
Abian-Vicen, J., Castanedo, A., Abian, P., Gonzalez-Millan, C., Salinero, J. J., & Coso, J. D. (2014).Influence of successive badminton matches on muscle strength, power, and body-fluid balancein elite players. International Journal of Sports Physiology and Performance, 9(4), 689–694.https://doi.org/10.1123/ijspp.2013-0269
Abian-Vicen, J., Castanedo, A., Abian, P., & Sampedro, J. (2013). Temporal and notationalcomparison of badminton matches between men’s singles and women’s singles. InternationalJournal of Performance Analysis in Sport, 13(2), 310–320. https://doi.org/10.1080/24748668.2013.11868650
Barris, S., & Button, C. (2008). A review of vision-based motion analysis in sport. Sports Medicine,38(12), 1025–1043. https://doi.org/10.2165/00007256-200838120-00006
Bartlett, M. S. A note on the multiplying factors for various χ2 approximations. (1954). Journal ofthe Royal Statistical Society. Series B (Methodological), 16 (2), 296–298. JSTOR. https://doi.org/10.1111/rssb.1954.16.issue-2
Bastida-Castillo, A., Gómez-Carmona, C. D., de la Cruz Sánchez, E., & Pino-Ortega, J. (2019).Comparing accuracy between global positioning systems and ultra-wideband-based positiontracking systems used for tactical analyses in soccer. European Journal of Sport Science, Epub:Ahead of Print, 19(9), 1157–1165. https://doi.org/10.1080/17461391.2019.1584248
Bastida-Castillo, A., Gómez-Carmona, C. D., De la Cruz Sánchez, E., & Pino-Ortega, J. (2018).Accuracy, intra- and inter-unit reliability, and comparison between GPS and UWB-based
14 D. ROJAS-VALVERDE ET AL.

position-tracking systems used for time–motion analyses in soccer. European Journal of SportScience, 18(4), 450–457. https://doi.org/10.1080/17461391.2018.1427796
Cabello-Manrique, D., & González-Badillo, J. J. (2003). Analysis of the characteristics of competitivebadminton. British Journal of Sports Medicine, 37(1), 62–66. https://doi.org/10.1136/bjsm.37.1.62
Chiminazzo, J. G. C., Barreira, J., Luz, L. S., Saraiva, W. C., & Cayres, J. T. (2018). Technical andtiming characteristics of badminton men’s single: Comparison between groups and play-offsstages in 2016 Rio Olympic Games. International Journal of Performance Analysis in Sport, 18(2), 245–254. https://doi.org/10.1080/24748668.2018.1463785
Cohen, J. (1988). Statistical power analysis for the behavioral sciences (2nd ed.). Erlbaum.Deka, P., Berg, K., Harder, J., Batelaan, H., & McGrath, M. (2017). Oxygen cost and physiological
responses of recreational badminton match play. The Journal of Sports Medicine and PhysicalFitness, 57(6), 760–765. https://doi.org/10.23736/S0022-4707.16.06319-2
Faude, O., Meyer, T., Rosenberger, F., Fries, M., Huber, G., & Kindermann, W. (2007).Physiological characteristics of badminton match play. European Journal of AppliedPhysiology, 100(4), 479–485. https://doi.org/10.1007/s00421-007-0441-8
Federolf, P., Reid, R., Gilgien, M., Haugen, P., & Smith, G. (2014). The application of principalcomponent analysis to quantify technique in sports: PCA quantification of technique.Scandinavian Journal of Medicine & Science in Sports, 24(3), 491–499. https://doi.org/10.1111/j.1600-0838.2012.01455.x
Fernandez-Fernandez, J., de la Aleja Tellez, J. G., Moya-Ramon, M., Cabello-Manrique, D., &Mendez-Villanueva, A. (2013). Gender differences in game responses during badminton matchplay. Journal of Strength and Conditioning Research, 27(9), 2396–2404. https://doi.org/10.1519/JSC.0b013e31827fcc6a
Fernandez-Fernandez, J., Lopez-Valenciano, A., Del Coso, J., Gallo-Salazar, C., Barbado, D.,Sabido-Solana, R., Ruiz-Perez, I., Moreno-Perez, V., Dominguez-Diez, M., & Cabello-Manrique, D. (2019). The effects of playing two consecutive matches in the shoulder rotationalprofiles of elite youth badminton players. Physical Therapy in Sport, 35, 56–62. https://doi.org/10.1016/j.ptsp.2018.11.004
Fuchs, M., Faude, O., Wegmann, M., & Meyer, T. (2014). Critical Evaluation of a Badminton-Specific Endurance Test. International Journal of Sports Physiology and Performance, 9(2), 249–255. https://doi.org/10.1123/ijspp.2012-0387
Gawin, W., Beyer, C., & Seidler, M. (2015). A competition analysis of the single and doubledisciplines in world-class badminton. International Journal of Performance Analysis in Sport, 15(3), 997–1006. https://doi.org/10.1080/24748668.2015.11868846
Gómez-Carmona, C. D., Bastida-Castillo, A., García-Rubio, J., Ibáñez, S. J., & Pino-Ortega, J.(2019). Static and dynamic reliability of WIMU PROTM accelerometers according to anatomicalplacement. Proceedings of the Institution of Mechanical Engineers, Part P: Journal of SportsEngineering and Technology, 233(2), 238–248. https://doi.org/10.1177/1754337118816922
Kaiser, H. F. (1960). The Application of Electronic Computers to Factor Analysis. Educational andPsychological Measurement, 20(1), 141–151. https://doi.org/10.1177/001316446002000116
Luteberget, L. S., Spencer, M., & Gilgien, M. (2018). Validity of the catapult clearsky t6 localpositioning system for team sports specific drills, in indoor conditions. Frontiers in Physiology,9,115. https://doi.org/10.3389/fphys.2018.00115
McLaren, S. J., Macpherson, T. W., Coutts, A. J., Hurst, C., Spears, I. R., & Weston, M. (2018). Therelationships between internal and external measures of training load and intensity in team sports:A meta-analysis. Sports Medicine, 48(3), 641–658. https://doi.org/10.1007/s40279-017-0830-z
Michalsik, L. B., & Aagaard, P. (2015). Physical demands in elite team handball: Comparisonsbetween male and female players. Journal of Sports Medicine and Physical Fitness, 55(9), 878–891.
Molina-Carmona, I., Gomez-Carmona, C. D., Bastida Castillo, A., & Pino-Ortega, J. (2018).Validez del dispositivo inercial WIMU PROTM️ para el registro de la frecuencia cardíaca enun test de campo. Sport-TK: Revista Euroamericana De Ciencias Del Deporte, 7(1), 81–86.https://doi.org/10.6018/321921
Phomsoupha, M., Berger, Q., & Laffaye, G. (2017). A multiple repeated sprint ability test forbadminton players involving four changes of direction: Validity and reliability (part 1). Journal
INTERNATIONAL JOURNAL OF PERFORMANCE ANALYSIS IN SPORT 15
of Strength and Conditioning Research, 32(2), 423–431. https://doi.org/10.1519/JSC.0000000000002307
Phomsoupha, M., & Laffaye, G. (2015). The science of badminton: game characteristics, anthro-pometry, physiology, visual fitness and biomechanics. Sports Medicine, 45(4), 473–495. https://doi.org/10.1007/s40279-014-0287-2
Rampichini, S., Limonta, E., Pugliese, L., Cè, E., Bisconti, A. V., Gianfelici, A., La Torre, A., &Esposito, F. (2018). Heart rate and pulmonary oxygen uptake response in professional badmin-ton players: Comparison between on-court game simulation and laboratory exercise testing.European Journal of Applied Physiology, 118(11), 2339–2347. https://doi.org/10.1007/s00421-018-3960-6
Rojas-Valverde, D., Gómez-Carmona, C. D., Gutiérrez-Vargas, R., & Pino-Ortega, J. (2019). Frombig data mining to technical sport reports: The case of inertial measurement units. BMJ OpenSport & Exercise Medicine, 5(1), 1–3. https://doi.org/org/doi:10.1136/bmjsem-2019-000565
Rojas-Valverde, D., Sánchez-Ureña, B., Pino-Ortega, J., Gómez-Carmona, C., Gutiérrez-Vargas,R., Timón, R., & Olcina, G. (2019). External workload indicators of muscle and kidneymechanical injury in endurance trail running. International Journal of EnvironmentalResearch and Public Health, 16(20), e3909. https://doi.org/10.3390/ijerph16203909
Sasaki, S., Nagano, Y., & Ichikawa, H. (2018). Loading differences in single-leg landing in theforehand- and backhand-side courts after an overhead stroke in badminton: A novel tri-axialaccelerometer research. Journal of Sports Sciences, 36(24), 2794–2801. https://doi.org/10.1080/02640414.2018.1474535
Scanlan, A. T., Dascombe, B. J., Kidcaff, A. P., Peucker, J. L., & Dalbo, V. J. (2015). Gender-specificactivity demands experienced during semiprofessional basketball game play. InternationalJournal of Sports Physiology and Performance, 10(5), 618–625. https://doi.org/10.1123/ijspp.2014-0407
Svilar, L., Castellano, J., Jukic, I., & Casamichana, D. (2018). Positional differences in elite basket-ball: Selecting appropriate training-load measures. International Journal of Sports Physiologyand Performance, 13(7), 947–952. https://doi.org/10.1123/ijspp.2017-0534
Tabachnick, B., & Fidell, L. (2007). Using Multivariate Statistics (6th ed.). Pearson Education.Wu, F., Zhang, K., Zhu, M., Mackintosh, C., Rice, T., Gore, C., & Hahn, A. (2007). An
Investigation of an Integrated Low-cost GPS, INS and Magnetometer System for SportApplications. Proceedings of the 20th International Technical Meeting of the SatelliteDivision of The Institute of Navigation (ION GPS 2007), p. 113–120, September 25–28, FortWorth, Texas, USA
Wylde, M. J., Lee, M. B. C., Chee Yong, L., & Callaway, A. J. (2018). Reliability and validity of GPS-embedded accelerometers for the measurement of badminton specific player load. Journal ofTrainology, 7(2), 34–37. https://doi.org/10.17338/trainology.7.2_34
16 D. ROJAS-VALVERDE ET AL.