Identification of Copy Number Variants Defining Genomic Differences among Major Human Groups
13
Identification of Copy Number Variants Defining Genomic Differences among Major Human Groups Lluı´s Armengol 1,2 , Sergi Villatoro 1 , Juan R. Gonza ´ lez 3 , Lorena Pantano 1 , Manel Garcı´a-Aragone ´s 1 , Raquel Rabionet 1 , Mario Ca ´ ceres 1 , Xavier Estivill 1,4,5 * 1 Genetic Causes of Disease Group, Genes and Disease Program, Center for Genomic Regulation (CRG-UPF) and CIBERESP, Barcelona, Catalonia, Spain, 2 Quantitative Genomic Medicine Laboratories (qGenomics), Barcelona, Catalonia, Spain, 3 Center for Research in Environmental Epidemiology (CREAL), Barcelona, Catalonia, Spain, 4 Genetics Unit, Department of Health and Experimental Life Sciences, Pompeu Fabra University (UPF), Barcelona, Catalonia, Spain, 5 National Genotyping Center (CeGen) Barcelona Genotyping Node, Center for Genomic Regulation (CRG-UPF), Barcelona, Catalonia, Spain Abstract Background: Understanding the genetic contribution to phenotype variation of human groups is necessary to elucidate differences in disease predisposition and response to pharmaceutical treatments in different human populations. Methodology/Principal Findings: We have investigated the genome-wide profile of structural variation on pooled samples from the three populations studied in the HapMap project by comparative genome hybridization (CGH) in different array platforms. We have identified and experimentally validated 33 genomic loci that show significant copy number differences from one population to the other. Interestingly, we found an enrichment of genes related to environment adaptation (immune response, lipid metabolism and extracellular space) within these regions and the study of expression data revealed that more than half of the copy number variants (CNVs) translate into gene-expression differences among populations, suggesting that they could have functional consequences. In addition, the identification of single nucleotide polymorphisms (SNPs) that are in linkage disequilibrium with the copy number alleles allowed us to detect evidences of population differentiation and recent selection at the nucleotide variation level. Conclusions: Overall, our results provide a comprehensive view of relevant copy number changes that might play a role in phenotypic differences among major human populations, and generate a list of interesting candidates for future studies. Citation: Armengol L, Villatoro S, Gonza ´ lez JR, Pantano L, Garcı ´a-Aragone ´ s M, et al. (2009) Identification of Copy Number Variants Defining Genomic Differences among Major Human Groups. PLoS ONE 4(9): e7230. doi:10.1371/journal.pone.0007230 Editor: Marc Bauchet, Max Planck Institute for Evolutionary Anthropology, Germany Received January 20, 2009; Accepted August 20, 2009; Published September 30, 2009 Copyright: ß 2009 Armengol et al. This is an open-access article distributed under the terms of the Creative Commons Attribution License, which permits unrestricted use, distribution, and reproduction in any medium, provided the original author and source are credited. Funding: The funders had no role in study design, data collection and analysis, decision to publish, or preparation of the manuscript. This work was supported by the Generalitat de Catalunya, the Spanish Ministry of Science and Innovation [SAF2008-00357 to X.E., MTM2008-02457 to J.R.G., and BFU2007-60930 to M.C.]; and the European Commission [AnEUploidy project; FP6-2005-LifeSciHealth contract #037627]. M.C. was supported by the Ramon y Cajal Program (Spanish Ministry of Science and Education). Competing Interests: The authors have declared that no competing interests exist. * E-mail: [email protected] Introduction Although any two humans are 99.9% identical at the nucleotide sequence level [1,2], many phenotypic differences are apparent in individuals within the same and from distinct human populations. Genetic diversity underlying the remaining 0.1% nucleotide differences has been postulated to contribute to phenotypic diversity among humans, and to population-specific susceptibility to disease and variability in the response to pharmacological treatments [3–5]. The different prevalence of Mendelian diseases reflects variability in allele frequencies for specific genes and haplotypes, and the relevance of ethnic background in the susceptibility to disease is recognized for several disorders [6], including cystic fibrosis [7–9], sickle cell anemia [10–14], and deafness [15], among many others. Similarly, there are differences in the prevalence of common disorders and associated genetic variants in human populations, such as the factor V Leiden (venous thromboembolic disease [16,17]), variants in the CARD15 gene (Crohn’s disease [18,19]), the CCR5–D32 variant (human immunodeficiency virus (HIV) infection and progression [20]), and APOE e4 (Alzheimer’s disease [21]). In addition, population- specific genetic variants could also influence the metabolism and response to drugs, exemplified by the population variability in the acetylating activity of the N-acetyltransferase 2 (NAT2) gene [22]. However, despite the progress on the identification of genes for inflammatory bowel disease and neurodegenerative disorders, little is known about the genetic contribution to the prevalence differences of other complex traits among human groups [6]. The current knowledge of divergence among major populations and subpopulations is based in the study of different sources of genetic variation within and amongst human populations [23–26]. The analysis of nucleotide and structural variability on human populations has shown that genetic clusters closely correspond with human groups defined by ethnicity or continental ancestry [27–29]. In agreement with human African origins, a higher amount of SNP allelic variability has been found in individuals of African ancestry, while individuals of Asian origin show the smallest amount of nucleotide diversity [27]. Another major conclusion from these studies is that for most nucleotide and small genomic changes (in/dels), intra-population differences among PLoS ONE | www.plosone.org 1 September 2009 | Volume 4 | Issue 9 | e7230
Transcript of Identification of Copy Number Variants Defining Genomic Differences among Major Human Groups
Identification of Copy Number Variants DefiningGenomic Differences among Major Human GroupsLluıs Armengol1,2, Sergi Villatoro1, Juan R. Gonzalez3, Lorena Pantano1, Manel Garcıa-Aragones1, Raquel
Rabionet1, Mario Caceres1, Xavier Estivill1,4,5*
1 Genetic Causes of Disease Group, Genes and Disease Program, Center for Genomic Regulation (CRG-UPF) and CIBERESP, Barcelona, Catalonia, Spain, 2 Quantitative
Genomic Medicine Laboratories (qGenomics), Barcelona, Catalonia, Spain, 3 Center for Research in Environmental Epidemiology (CREAL), Barcelona, Catalonia, Spain,
4 Genetics Unit, Department of Health and Experimental Life Sciences, Pompeu Fabra University (UPF), Barcelona, Catalonia, Spain, 5 National Genotyping Center (CeGen)
Barcelona Genotyping Node, Center for Genomic Regulation (CRG-UPF), Barcelona, Catalonia, Spain
Abstract
Background: Understanding the genetic contribution to phenotype variation of human groups is necessary to elucidatedifferences in disease predisposition and response to pharmaceutical treatments in different human populations.
Methodology/Principal Findings: We have investigated the genome-wide profile of structural variation on pooled samplesfrom the three populations studied in the HapMap project by comparative genome hybridization (CGH) in different arrayplatforms. We have identified and experimentally validated 33 genomic loci that show significant copy number differencesfrom one population to the other. Interestingly, we found an enrichment of genes related to environment adaptation(immune response, lipid metabolism and extracellular space) within these regions and the study of expression data revealedthat more than half of the copy number variants (CNVs) translate into gene-expression differences among populations,suggesting that they could have functional consequences. In addition, the identification of single nucleotidepolymorphisms (SNPs) that are in linkage disequilibrium with the copy number alleles allowed us to detect evidences ofpopulation differentiation and recent selection at the nucleotide variation level.
Conclusions: Overall, our results provide a comprehensive view of relevant copy number changes that might play a role inphenotypic differences among major human populations, and generate a list of interesting candidates for future studies.
Citation: Armengol L, Villatoro S, Gonzalez JR, Pantano L, Garcıa-Aragones M, et al. (2009) Identification of Copy Number Variants Defining Genomic Differencesamong Major Human Groups. PLoS ONE 4(9): e7230. doi:10.1371/journal.pone.0007230
Editor: Marc Bauchet, Max Planck Institute for Evolutionary Anthropology, Germany
Received January 20, 2009; Accepted August 20, 2009; Published September 30, 2009
Copyright: � 2009 Armengol et al. This is an open-access article distributed under the terms of the Creative Commons Attribution License, which permitsunrestricted use, distribution, and reproduction in any medium, provided the original author and source are credited.
Funding: The funders had no role in study design, data collection and analysis, decision to publish, or preparation of the manuscript. This work was supported bythe Generalitat de Catalunya, the Spanish Ministry of Science and Innovation [SAF2008-00357 to X.E., MTM2008-02457 to J.R.G., and BFU2007-60930 to M.C.]; andthe European Commission [AnEUploidy project; FP6-2005-LifeSciHealth contract #037627]. M.C. was supported by the Ramon y Cajal Program (Spanish Ministryof Science and Education).
Competing Interests: The authors have declared that no competing interests exist.
* E-mail: [email protected]
Introduction
Although any two humans are 99.9% identical at the nucleotide
sequence level [1,2], many phenotypic differences are apparent in
individuals within the same and from distinct human populations.
Genetic diversity underlying the remaining 0.1% nucleotide
differences has been postulated to contribute to phenotypic
diversity among humans, and to population-specific susceptibility
to disease and variability in the response to pharmacological
treatments [3–5]. The different prevalence of Mendelian diseases
reflects variability in allele frequencies for specific genes and
haplotypes, and the relevance of ethnic background in the
susceptibility to disease is recognized for several disorders [6],
including cystic fibrosis [7–9], sickle cell anemia [10–14], and
deafness [15], among many others. Similarly, there are differences
in the prevalence of common disorders and associated genetic
variants in human populations, such as the factor V Leiden
(venous thromboembolic disease [16,17]), variants in the CARD15
gene (Crohn’s disease [18,19]), the CCR5–D32 variant (human
immunodeficiency virus (HIV) infection and progression [20]), and
APOE e4 (Alzheimer’s disease [21]). In addition, population-
specific genetic variants could also influence the metabolism and
response to drugs, exemplified by the population variability in the
acetylating activity of the N-acetyltransferase 2 (NAT2) gene [22].
However, despite the progress on the identification of genes for
inflammatory bowel disease and neurodegenerative disorders, little
is known about the genetic contribution to the prevalence
differences of other complex traits among human groups [6].
The current knowledge of divergence among major populations
and subpopulations is based in the study of different sources of
genetic variation within and amongst human populations [23–26].
The analysis of nucleotide and structural variability on human
populations has shown that genetic clusters closely correspond
with human groups defined by ethnicity or continental ancestry
[27–29]. In agreement with human African origins, a higher
amount of SNP allelic variability has been found in individuals of
African ancestry, while individuals of Asian origin show the
smallest amount of nucleotide diversity [27]. Another major
conclusion from these studies is that for most nucleotide and small
genomic changes (in/dels), intra-population differences among
PLoS ONE | www.plosone.org 1 September 2009 | Volume 4 | Issue 9 | e7230
individuals account for the majority of variation, while differences
among major population groups represents a minimal fraction
[26,29–31]. However, this variation cannot be neglected.
Despite that the existence of structural variation in the human
genome has been known for a while (see [32] and [33] for review),
we only recently have started to recognize its real scope and wide-
spread nature [34–37]. This variation is present in different forms,
including insertions, deletions and inversions. Due to the relative
ease of identification, copy number variants (CNVs) are the most
studied and best recognized form of structural variation, and have
attracted much attention because of its potential to affect gene
expression [38,39].
Most studies aiming at the discovery of CNV regions have made
use of genome-wide approaches based on different array-based
comparative genomic hybridisation (aCGH) and comparative
genomic intensity (aCGI) platforms, and have provided partial
evidences of their nature, real size and/or population distribution.
The first comprehensive map of CNVs was produced in late 2006
[35] by the analysis of 270 HapMap reference samples using high-
density BAC arrays and Affymetrix 500 K EA chips. It allowed the
identification of 1,447 CNV regions (,360 Mb; 12% of human
genome), showing a 43% concordance between the two platforms.
A subsequent analysis of 71 individuals from three different human
populations using an equivalent high-density BAC array revealed
315 CNV regions, 40% of them not having been previously
reported [40]. A targeted high-density analysis of 1,153 known
CNVs (using oligonucleotide-based aCGH at a 1 Kb resolution)
on 30 HapMap samples, showed that 76% of CNV regions were
at least 50% smaller than previously reported [41]. More recently,
using a dense aCGI platform (Affymetrix 6.0), McCarroll and co-
workers refined the CNV knowledge on the HapMap samples and
identified 3,048 CNV regions, 40% of them not overlapping with
previously reported variants [42]. Furthermore, an in-depth study
using the Illumina HumanHap550 BeadChip surveyed copy
number variation on individuals from 29 different human
worldwide populations [29]. Although little experimental valida-
tion was performed, their analysis of 396 non-unique autosomal
loci revealed that CNV distribution parallels the population
structure reported by SNP data. All these studies highlight that,
except for those focusing on single or a reduced number of loci
[43–45], more detailed analysis of the loci is necessary to
determine their potential contribution to normal phenotypic
variation and disease susceptibility. In addition, although a big
proportion of the human genome has been suggested to be copy-
number variable, little is known about the functional consequences
of differences in population distribution of CNVs.
A series of studies have already linked rare and common CNVs
to complex diseases (such as Alzheimer’s disease, HIV and AIDS
susceptibility, chronic pancreatitis, autism or schizophrenia)
(reviewed in [46]) and established etiopathogenesis connecting
changes in copy number with alteration of expression levels of
dosage-sensitive genes. Apart from the direct effect on gene
expression, a link between some structural variants and predispo-
sition to disease-causing rearrangements has been proven,
especially for genomic disorders [47–50]. Thus, population-
specific differences of CNV frequency could make a certain
human population more prone to suffer certain types of disorders.
In this study we report the identification of CNVs that are
present in very different frequency in individuals from the three
phase I/II HapMap analysis panels [27] (YRI - Yoruba in Ibadan,
Nigeria; CEU - Utah residents with ancestry from Northern and
Western Europe; and CHB+JPT - Han Chinese in Beijing, China
and Japanese in Tokyo, Japan), representatives of sub-Saharan
Africa, Europe and East Asia, respectively. Most of the genomic
variants detected have already been described as CNVs, involve
genes, and modify, to a certain extent, their expression levels.
Furthermore, we show that these CNVs are sufficient to
discriminate population structure at the continental level, and
that some of them are embedded in population-specific haplo-
types. We finally provide evidences of the effect of natural selection
on the variants identified.
Results
Identification of population differences in CNV regionsWe have used aCGH [51,52] on Agilent and BAC-based
platforms to identify CNVs with different frequencies in three
representative human populations of African (YRI – Yoruba in
Ibadan, Nigeria), Asian (JPT – Japanse in Tokyo, Japan, and CHB
– Han Chinese in Beijing, China), and European (CEU – Utah
residents with ancestry from Northern and Western Europe)
ancestry. In order to dilute inter-individual variation and to enrich
inter-population differences, we pooled 50 unrelated DNA samples
from each of the four human groups studied in the HapMap
project [5,28]. For each group, we set up independent pools of
males and females, and carried out a total of sixteen aCGH
hybridization experiments on each platform, by confronting sex-
unmatched pools of individuals from the different populations
(Figure 1A). As a control, we performed an intra-population male
versus female hybridization to discard the probes that called a copy
number difference in this situation (see Methods), since we do not
expect copy number variability between genders of the same
group, other than those affecting the sexual chromosomes. The
circular design of the hybridization experiments (Figure 1A)
allowed us to determine the most likely population that carries the
variant (increase or decrease in copy number) with respect to the
other populations, assuming the most parsimonious scenario. In
addition, this design also allowed us to minimize the presence of
spurious positive signals (Figure 1B).
The global analysis of the aCGH data on the three array
platforms yielded a total of 111 loci whose copy number state
frequencies differed among populations (Table S1), including 59
gains, 43 losses, and 9 complex changes which showed a range of
variation that we could not assign to a single population (see
Methods). Because of the similarities observed between the JPT
and CHB groups, and since they both belong to a population of
Asian ancestry, we grouped them and will use the ASN (Asian)
term to refer to them. From the copy number changes that could
be assigned to a population, 26 were CEU-specific, 23 ASN-
specific and 53 YRI-specific (Table 1). The amount of copy
number changes found in the YRI population doubles that of any
of the other individual populations, and is concordant with
previous observations of higher frequency of changes for small,
intermediate and large-scale variants and insertion/deletion
polymorphisms [35,53]. Of the identified regions, 61% (n = 68)
overlap with previously reported CNVs, and 32% (n = 35) overlap
with segmental duplications.
Validation of the aCGH findingsTo confirm the changes detected with the aCGH platforms, we
performed exhaustive validation experiments using Multiplex
Ligation-dependent Probe Amplification (MLPA) [54] on individ-
ual DNAs from the HapMap collection. Depending on the length
of the variable segment, one or two MLPA probes per region were
designed, preferentially within genes (Table S2). We split the
predicted CNVs into three different categories depending on the
number of consecutive BAC or oligonucleotide probes that
supported the altered segment (1, 2 or .2 probes per region,
CNVs Differencing Human Groups
PLoS ONE | www.plosone.org 2 September 2009 | Volume 4 | Issue 9 | e7230
respectively; Table 2). We decided to validate putative CNVs from
all three groups, although we anticipated that the lower the
number of array probes supporting each segment the higher the
likeliness of being a false positive. In total, we analyzed 152 probes
in 4 different probe mixes (see Methods) that interrogated 93 of the
111 CNV regions, including 60 CNVs already described in the
literature and 33 potentially novel CNVs. Overall, after validation,
47% of the tested loci (n = 44) turned out to be variable, and the
majority of them (86%; n = 38) corresponded to already known
CNVs, thus only 6 were novel. Out of the 44 variable regions, 33
(75%) were concordant with the results observed in the aCGH
experiments, while the remaining 11 did not coincide with the
aCGH prediction or did not show significant differences among
populations. As expected, the validation rate of the CNVs varied
considerably depending on the number of supporting array
probes, and was low (33%) for group 1 (CNVs composed of only
1 altered probe) and much higher for groups 2 and 3 (73% and
72%, respectively) (Table 2). On the other hand, our results are
consistent with the observations made by others [36,41] in the
sense that the boundaries of many variants reported so far are not
precisely defined, because different MLPA probes located within
the same theoretical CNV did not behave uniformly (Figure S1).
Although direct comparison is difficult, as CNV region
boundaries identified by arrays cannot be well defined and
different array platforms use probes located in different regions, we
have estimated to what extent our results matched with previous
data deposited in the database of genomic variants (DGV - [55])
by evaluating reported frequencies of overlapping CNVs (Table
S3). Of the 33 CNV loci validated as showing populations
differences, in 13 of them we could not establish a concordance
with published results, either because the CNV was not previously
reported, there was not enough population information to
compare, or there were inconsistencies in the available data. In
80% of the remaining 20 cases (16/20), the copy number
frequencies we obtained matched with the available population
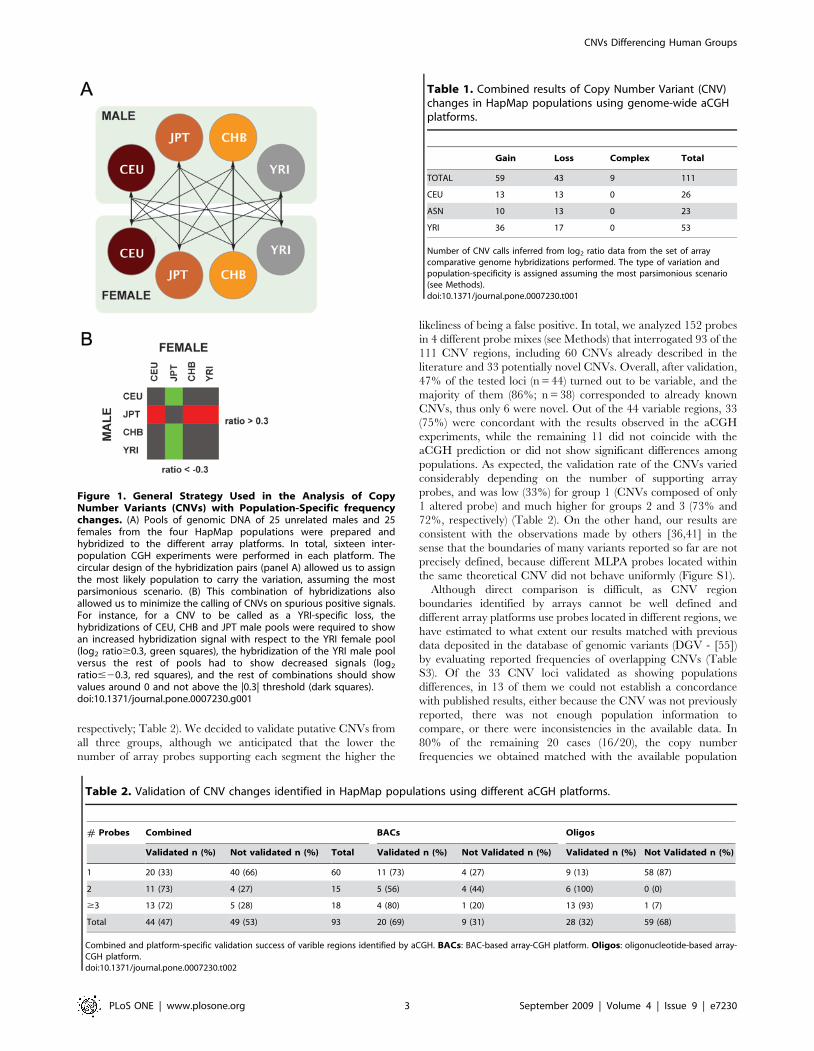
Table 1. Combined results of Copy Number Variant (CNV)changes in HapMap populations using genome-wide aCGHplatforms.
Gain Loss Complex Total
TOTAL 59 43 9 111
CEU 13 13 0 26
ASN 10 13 0 23
YRI 36 17 0 53
Number of CNV calls inferred from log2 ratio data from the set of arraycomparative genome hybridizations performed. The type of variation andpopulation-specificity is assigned assuming the most parsimonious scenario(see Methods).doi:10.1371/journal.pone.0007230.t001
Figure 1. General Strategy Used in the Analysis of CopyNumber Variants (CNVs) with Population-Specific frequencychanges. (A) Pools of genomic DNA of 25 unrelated males and 25females from the four HapMap populations were prepared andhybridized to the different array platforms. In total, sixteen inter-population CGH experiments were performed in each platform. Thecircular design of the hybridization pairs (panel A) allowed us to assignthe most likely population to carry the variation, assuming the mostparsimonious scenario. (B) This combination of hybridizations alsoallowed us to minimize the calling of CNVs on spurious positive signals.For instance, for a CNV to be called as a YRI-specific loss, thehybridizations of CEU, CHB and JPT male pools were required to showan increased hybridization signal with respect to the YRI female pool(log2 ratio$0.3, green squares), the hybridization of the YRI male poolversus the rest of pools had to show decreased signals (log2
ratio#20.3, red squares), and the rest of combinations should showvalues around 0 and not above the |0.3| threshold (dark squares).doi:10.1371/journal.pone.0007230.g001
Table 2. Validation of CNV changes identified in HapMap populations using different aCGH platforms.
# Probes Combined BACs Oligos
Validated n (%) Not validated n (%) Total Validated n (%) Not Validated n (%) Validated n (%) Not Validated n (%)
1 20 (33) 40 (66) 60 11 (73) 4 (27) 9 (13) 58 (87)
2 11 (73) 4 (27) 15 5 (56) 4 (44) 6 (100) 0 (0)
$3 13 (72) 5 (28) 18 4 (80) 1 (20) 13 (93) 1 (7)
Total 44 (47) 49 (53) 93 20 (69) 9 (31) 28 (32) 59 (68)
Combined and platform-specific validation success of varible regions identified by aCGH. BACs: BAC-based array-CGH platform. Oligos: oligonucleotide-based array-CGH platform.doi:10.1371/journal.pone.0007230.t002
CNVs Differencing Human Groups
PLoS ONE | www.plosone.org 3 September 2009 | Volume 4 | Issue 9 | e7230
data; while in the other 4 cases the information we obtained did
not agree with what it had been published beforehand. Thus, most
of the CNVs with population differences are independently
confirmed by various methods and supported by previously
existing evidences.
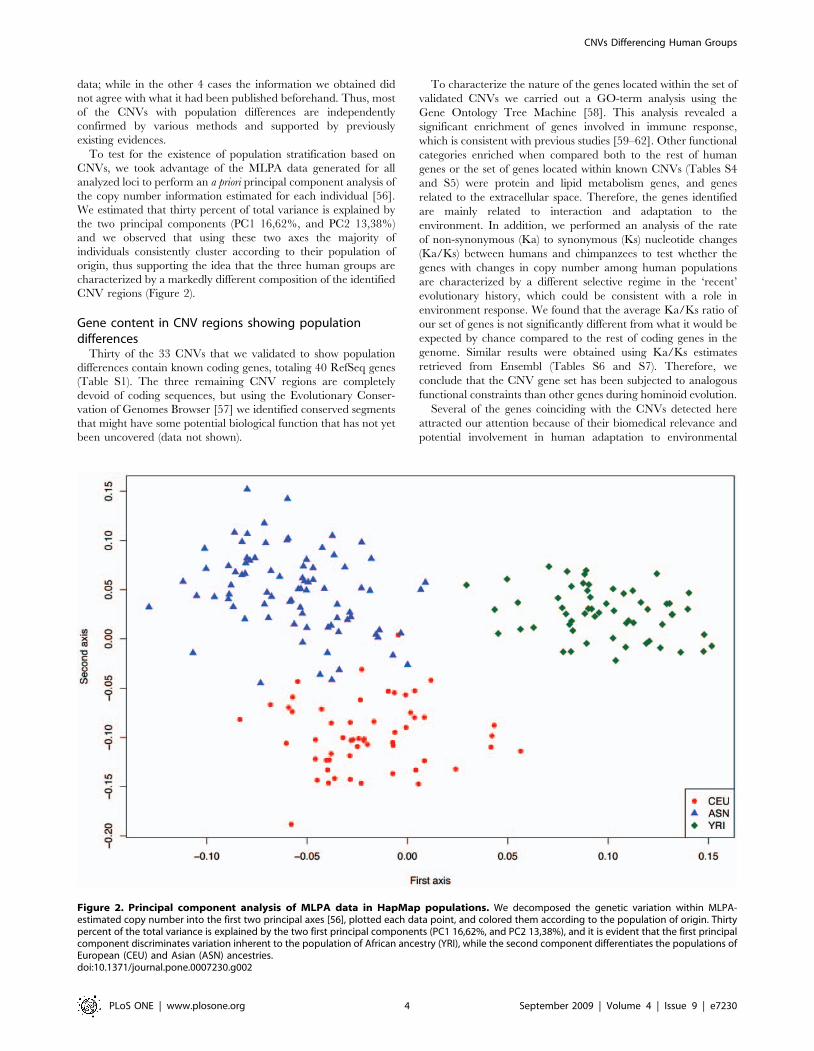
To test for the existence of population stratification based on
CNVs, we took advantage of the MLPA data generated for all
analyzed loci to perform an a priori principal component analysis of
the copy number information estimated for each individual [56].
We estimated that thirty percent of total variance is explained by
the two principal components (PC1 16,62%, and PC2 13,38%)
and we observed that using these two axes the majority of
individuals consistently cluster according to their population of
origin, thus supporting the idea that the three human groups are
characterized by a markedly different composition of the identified
CNV regions (Figure 2).
Gene content in CNV regions showing populationdifferences
Thirty of the 33 CNVs that we validated to show population
differences contain known coding genes, totaling 40 RefSeq genes
(Table S1). The three remaining CNV regions are completely
devoid of coding sequences, but using the Evolutionary Conser-
vation of Genomes Browser [57] we identified conserved segments
that might have some potential biological function that has not yet
been uncovered (data not shown).
To characterize the nature of the genes located within the set of
validated CNVs we carried out a GO-term analysis using the
Gene Ontology Tree Machine [58]. This analysis revealed a
significant enrichment of genes involved in immune response,
which is consistent with previous studies [59–62]. Other functional
categories enriched when compared both to the rest of human
genes or the set of genes located within known CNVs (Tables S4
and S5) were protein and lipid metabolism genes, and genes
related to the extracellular space. Therefore, the genes identified
are mainly related to interaction and adaptation to the
environment. In addition, we performed an analysis of the rate
of non-synonymous (Ka) to synonymous (Ks) nucleotide changes
(Ka/Ks) between humans and chimpanzees to test whether the
genes with changes in copy number among human populations
are characterized by a different selective regime in the ‘recent’
evolutionary history, which could be consistent with a role in
environment response. We found that the average Ka/Ks ratio of
our set of genes is not significantly different from what it would be
expected by chance compared to the rest of coding genes in the
genome. Similar results were obtained using Ka/Ks estimates
retrieved from Ensembl (Tables S6 and S7). Therefore, we
conclude that the CNV gene set has been subjected to analogous
functional constraints than other genes during hominoid evolution.
Several of the genes coinciding with the CNVs detected here
attracted our attention because of their biomedical relevance and
potential involvement in human adaptation to environmental
Figure 2. Principal component analysis of MLPA data in HapMap populations. We decomposed the genetic variation within MLPA-estimated copy number into the first two principal axes [56], plotted each data point, and colored them according to the population of origin. Thirtypercent of the total variance is explained by the two first principal components (PC1 16,62%, and PC2 13,38%), and it is evident that the first principalcomponent discriminates variation inherent to the population of African ancestry (YRI), while the second component differentiates the populations ofEuropean (CEU) and Asian (ASN) ancestries.doi:10.1371/journal.pone.0007230.g002
CNVs Differencing Human Groups
PLoS ONE | www.plosone.org 4 September 2009 | Volume 4 | Issue 9 | e7230
pressures. For example, the Haptoglobin-related protein (HPR) is
found in a CNV region that exhibits a higher copy number in the
YRI individuals than in the individuals from the other two
populations analyzed, and could be related to adaptation to
sleeping sickness disease (see Discussion). Other interesting genes
located within regions with considerable copy number differences
among populations include several that were previously known to
be variable and associated to different biomedical conditions
(GSTT1, UGT2B17, PRSS2 and APOBEC), as well as others that,
although associated to disease phenotypes, have not been reported
to be variable among populations. Among those, there are several
promising candidates that might be influencing different popula-
tion prevalence of diseases like age-related macular degeneration
(CFHR3) [63–67], cardiovascular disease (LPA) [68–73] and
chronic obstructive pulmonary disease (HCK) [74].
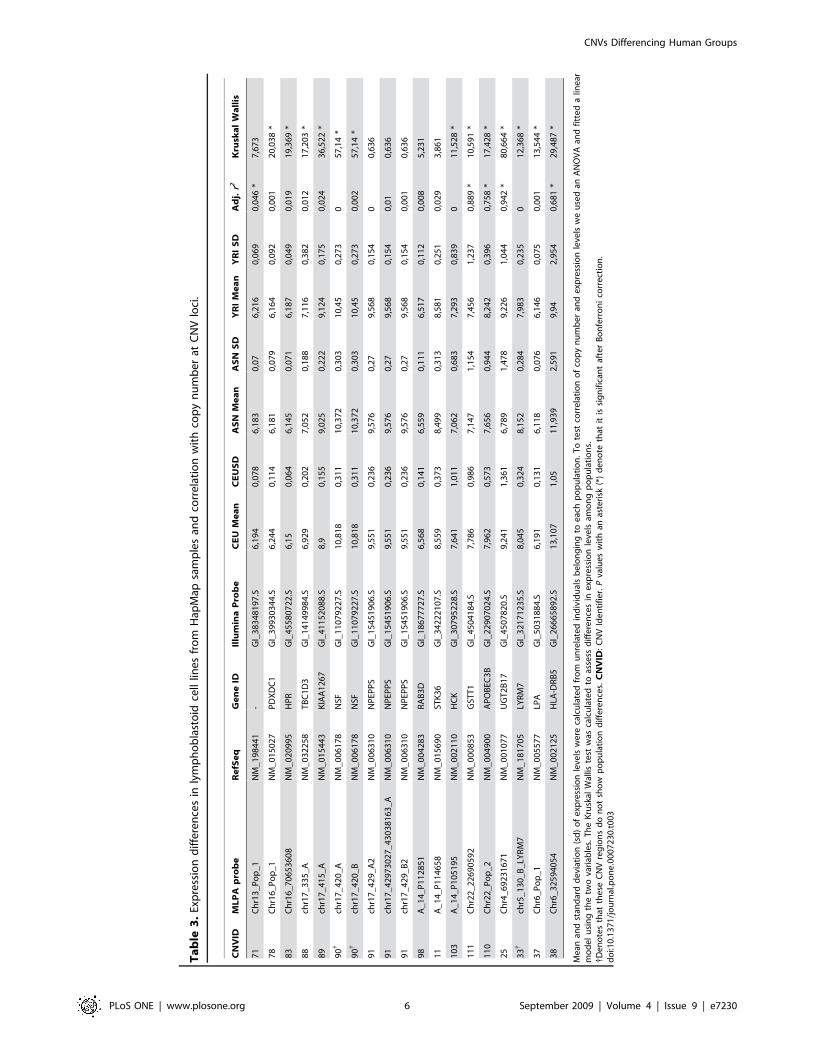
Contribution of the CNV changes identified to geneexpression variability
The most intuitive functional consequence of a change in
genomic dose is a change in gene-expression levels (i.e. more copies
imply higher expression, and vice versa). To check this, we identified
a total of 23 RefSeq genes contained within the 44 validated CNV
regions (regardless of showing population differentiation) for which
expression levels in lymphoblastoid cell lines, derived from the same
samples we analyzed, had previously been reported [38]. Of those,
16 transcripts exhibited average expression levels above the
threshold of the negative controls and were further considered.
First, we wanted to know to what extent global expression level of
genes within the variable regions could be attributable to copy
number differences. In total, five transcripts showed significant
correlation (P,0.0031, after Bonferroni correction) between copy
number and expression levels for the three populations combined,
which represents a slightly higher proportion (31%) than previously
reported [38] (Table 3). Second, when considering only the CNVs
with population-specific frequency changes, 10 out of 14 (71%)
transcripts showed significant expression differences among popu-
lations (Kruskal-Wallis Test; P,0.0036; after Bonferroni correction;
Table 3) and we could assess a positive correlation between
expression levels and the copy number in 60% of them (6 out of 10)
(Figure S2). One interesting instance is the UGT2B17 gene, whose
expression levels have been previously associated with specific cis-
acting SNPs [39,75], that we have found to be tightly correlated
with the copy number of the gene (Table 3), as previously reported
by others [38,76]. Thus, it seems reasonable to postulate that the
differences in copy number are responsible of controlling expres-
sion, and it is possible that the SNPs previously identified are mere
tags for the different copy number alleles. Nevertheless, when
assessing the relationship between CNVs and gene-expression, we
have to keep in mind that we solely used expression data that was
collected from a single tissue. In addition, it is important to note that
other genes were contained within the identified CNVs, but were
not included in our analysis because their expression levels were not
reported in the above-mentioned study or because the MLPA
probes we used did not coincide exactly with the gene. Given the
poor definition of CNV boundaries reported in the currently
available databases observed by others [36,41] and us, we decided
not to take into account the genes for which we have not directly
inspected copy number.
LD and SNP haplotype structure of population variableCNV regions
Although only a small proportion of human copy number
variation can be attributed to population differences [29,35], in
this work we specifically sought to enrich for this type of changes.
In order to check in more detail the underlying genetic
architecture of these regions, we examined the nucleotide variation
data from the HapMap project.
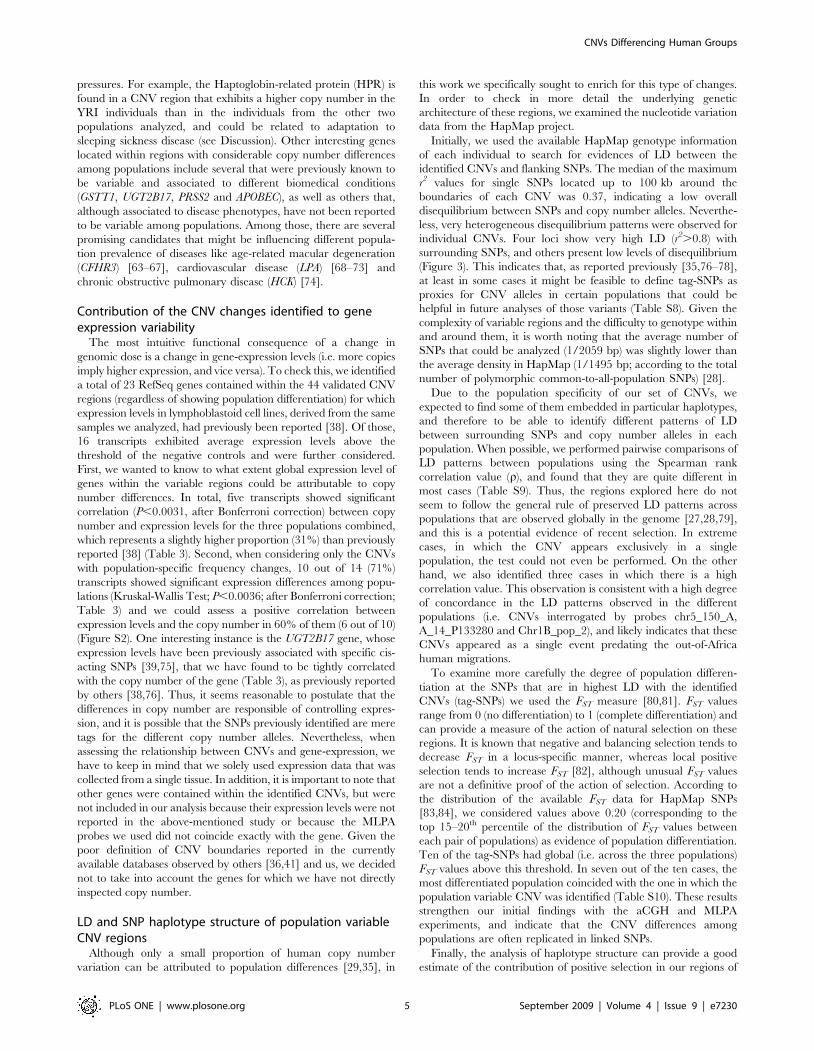
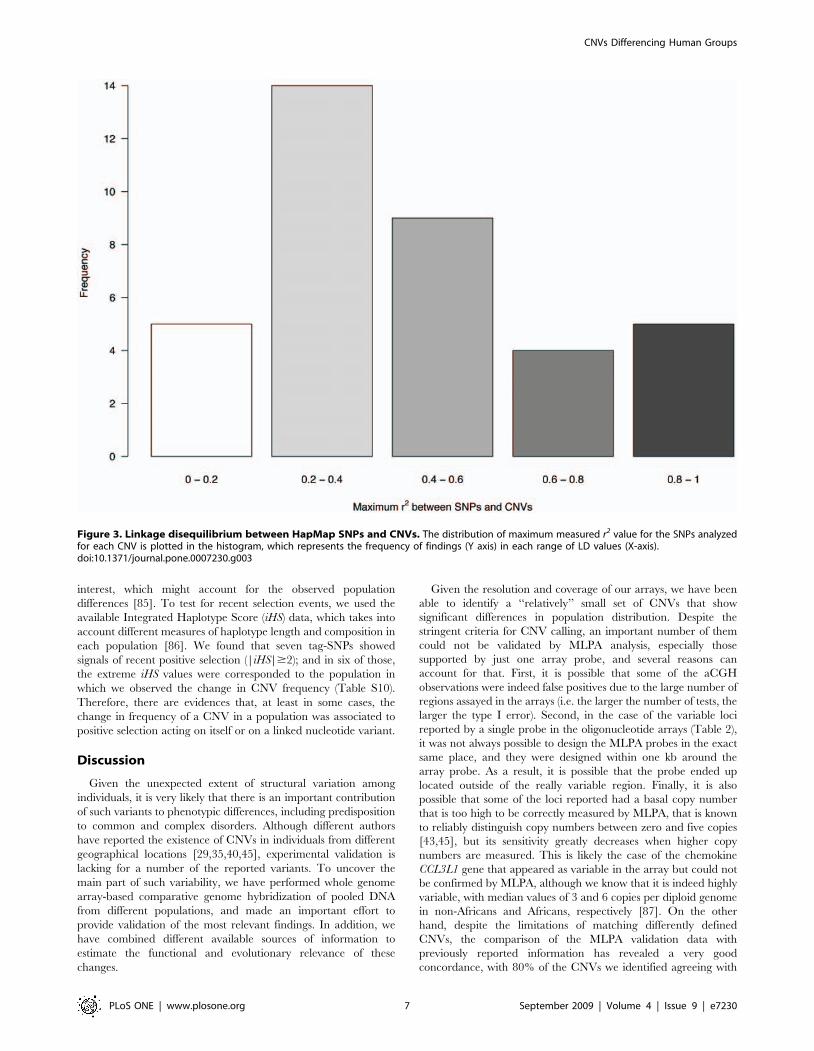
Initially, we used the available HapMap genotype information
of each individual to search for evidences of LD between the
identified CNVs and flanking SNPs. The median of the maximum
r2 values for single SNPs located up to 100 kb around the
boundaries of each CNV was 0.37, indicating a low overall
disequilibrium between SNPs and copy number alleles. Neverthe-
less, very heterogeneous disequilibrium patterns were observed for
individual CNVs. Four loci show very high LD (r2.0.8) with
surrounding SNPs, and others present low levels of disequilibrium
(Figure 3). This indicates that, as reported previously [35,76–78],
at least in some cases it might be feasible to define tag-SNPs as
proxies for CNV alleles in certain populations that could be
helpful in future analyses of those variants (Table S8). Given the
complexity of variable regions and the difficulty to genotype within
and around them, it is worth noting that the average number of
SNPs that could be analyzed (1/2059 bp) was slightly lower than
the average density in HapMap (1/1495 bp; according to the total
number of polymorphic common-to-all-population SNPs) [28].
Due to the population specificity of our set of CNVs, we
expected to find some of them embedded in particular haplotypes,
and therefore to be able to identify different patterns of LD
between surrounding SNPs and copy number alleles in each
population. When possible, we performed pairwise comparisons of
LD patterns between populations using the Spearman rank
correlation value (r), and found that they are quite different in
most cases (Table S9). Thus, the regions explored here do not
seem to follow the general rule of preserved LD patterns across
populations that are observed globally in the genome [27,28,79],
and this is a potential evidence of recent selection. In extreme
cases, in which the CNV appears exclusively in a single
population, the test could not even be performed. On the other
hand, we also identified three cases in which there is a high
correlation value. This observation is consistent with a high degree
of concordance in the LD patterns observed in the different
populations (i.e. CNVs interrogated by probes chr5_150_A,
A_14_P133280 and Chr1B_pop_2), and likely indicates that these
CNVs appeared as a single event predating the out-of-Africa
human migrations.
To examine more carefully the degree of population differen-
tiation at the SNPs that are in highest LD with the identified
CNVs (tag-SNPs) we used the FST measure [80,81]. FST values
range from 0 (no differentiation) to 1 (complete differentiation) and
can provide a measure of the action of natural selection on these
regions. It is known that negative and balancing selection tends to
decrease FST in a locus-specific manner, whereas local positive
selection tends to increase FST [82], although unusual FST values
are not a definitive proof of the action of selection. According to
the distribution of the available FST data for HapMap SNPs
[83,84], we considered values above 0.20 (corresponding to the
top 15–20th percentile of the distribution of FST values between
each pair of populations) as evidence of population differentiation.
Ten of the tag-SNPs had global (i.e. across the three populations)
FST values above this threshold. In seven out of the ten cases, the
most differentiated population coincided with the one in which the
population variable CNV was identified (Table S10). These results
strengthen our initial findings with the aCGH and MLPA
experiments, and indicate that the CNV differences among
populations are often replicated in linked SNPs.
Finally, the analysis of haplotype structure can provide a good
estimate of the contribution of positive selection in our regions of
CNVs Differencing Human Groups
PLoS ONE | www.plosone.org 5 September 2009 | Volume 4 | Issue 9 | e7230
Ta
ble
3.
Exp
ress
ion
dif
fere
nce
sin
lym
ph
ob
last
oid
cell
line
sfr
om
Hap
Map
sam
ple
san
dco
rre
lati
on
wit
hco
py
nu
mb
er
atC
NV
loci
.
CN
VID
ML
PA
pro
be
Re
fSe
qG
en
eID
Illu
min
aP
rob
eC
EU
Me
an
CE
US
DA
SN
Me
an
AS
NS
DY
RI
Me
an
YR
IS
DA
dj.
r2K
rusk
al
Wa
llis
71
Ch
r13
_P
op
_1
NM
_1
98
44
1-
GI_
38
34
81
97
.S6
,19
40
,07
86
,18
30
,07
6,2
16
0,0
69
0,0
46
*7
,67
3
78
Ch
r16
_P
op
_1
NM
_0
15
02
7P
DX
DC
1G
I_3
99
30
34
4.S
6,2
44
0,1
14
6,1
81
0,0
79
6,1
64
0,0
92
0,0
01
20
,03
8*
83
Ch
r16
_7
06
53
60
8N
M_
02
09
95
HP
RG
I_4
55
80
72
2.S
6,1
50
,06
46
,14
50
,07
16
,18
70
,04
90
,01
91
9,3
69
*
88
chr1
7_
33
5_
AN
M_
03
22
58
TB
C1
D3
GI_
14
14
99
84
.S6
,92
90
,20
27
,05
20
,18
87
,11
60
,38
20
,01
21
7,2
03
*
89
chr1
7_
41
5_
AN
M_
01
54
43
KIA
A1
26
7G
I_4
11
52
08
8.S
8,9
0,1
55
9,0
25
0,2
22
9,1
24
0,1
75
0,0
24
36
,52
2*
90{
chr1
7_
42
0_
AN
M_
00
61
78
NSF
GI_
11
07
92
27
.S1
0,8
18
0,3
11
10
,37
20
,30
31
0,4
50
,27
30
57
,14
*
90{
chr1
7_
42
0_
BN
M_
00
61
78
NSF
GI_
11
07
92
27
.S1
0,8
18
0,3
11
10
,37
20
,30
31
0,4
50
,27
30
,00
25
7,1
4*
91
chr1
7_
42
9_
A2
NM
_0
06
31
0N
PEP
PS
GI_
15
45
19
06
.S9
,55
10
,23
69
,57
60
,27
9,5
68
0,1
54
00
,63
6
91
chr1
7_
42
97
30
27
_4
30
38
16
3_
AN
M_
00
63
10
NP
EPP
SG
I_1
54
51
90
6.S
9,5
51
0,2
36
9,5
76
0,2
79
,56
80
,15
40
,01
0,6
36
91
chr1
7_
42
9_
B2
NM
_0
06
31
0N
PEP
PS
GI_
15
45
19
06
.S9
,55
10
,23
69
,57
60
,27
9,5
68
0,1
54
0,0
01
0,6
36
98
A_
14
_P
11
28
51
NM
_0
04
28
3R
AB
3D
GI_
18
67
77
27
.S6
,56
80
,14
16
,55
90
,11
16
,51
70
,11
20
,00
85
,23
1
11
A_
14
_P
11
46
58
NM
_0
15
69
0ST
K3
6G
I_3
42
22
10
7.S
8,5
59
0,3
73
8,4
99
0,3
13
8,5
81
0,2
51
0,0
29
3,8
61
10
3A
_1
4_
P1
05
19
5N
M_
00
21
10
HC
KG
I_3
07
95
22
8.S
7,6
41
1,0
11
7,0
62
0,6
83
7,2
93
0,8
39
01
1,5
28
*
11
1C
hr2
2_
22
69
05
92
NM
_0
00
85
3G
STT
1G
I_4
50
41
84
.S7
,78
60
,98
67
,14
71
,15
47
,45
61
,23
70
,88
9*
10
,59
1*
11
0C
hr2
2_
Po
p_
2N
M_
00
49
00
AP
OB
EC3
BG
I_2
29
07
02
4.S
7,9
62
0,5
73
7,6
56
0,9
44
8,2
42
0,3
96
0,7
58
*1
7,4
28
*
25
Ch
r4_
69
23
16
71
NM
_0
01
07
7U
GT
2B
17
GI_
45
07
82
0.S
9,2
41
1,3
61
6,7
89
1,4
78
9,2
26
1,0
44
0,9
42
*8
0,6
64
*
33{
chr5
_1
30
_B
_LY
RM
7N
M_
18
17
05
LYR
M7
GI_
32
17
12
35
.S8
,04
50
,32
48
,15
20
,28
47
,98
30
,23
50
12
,36
8*
37
Ch
r6_
Po
p_
1N
M_
00
55
77
LPA
GI_
50
31
88
4.S
6,1
91
0,1
31
6,1
18
0,0
76
6,1
46
0,0
75
0,0
01
13
,54
4*
38
Ch
r6_
32
59
40
54
NM
_0
02
12
5H
LA-D
RB
5G
I_2
66
65
89
2.S
13
,10
71
,05
11
,93
92
,59
19
,94
2,9
54
0,6
81
*2
9,4
87
*
Me
anan
dst
and
ard
de
viat
ion
(sd
)o
fe
xpre
ssio
nle
vels
we
reca
lcu
late
dfr
om
un
rela
ted
ind
ivid
ual
sb
elo
ng
ing
toe
ach
po
pu
lati
on
.T
ote
stco
rre
lati
on
of
cop
yn
um
be
ran
de
xpre
ssio
nle
vels
we
use
dan
AN
OV
Aan
dfi
tte
da
line
arm
od
el
usi
ng
the
two
vari
able
s.T
he
Kru
skal
Wal
liste
stw
asca
lcu
late
dto
asse
ssd
iffe
ren
ces
ine
xpre
ssio
nle
vels
amo
ng
po
pu
lati
on
s.{D
en
ote
sth
atth
ese
CN
Vre
gio
ns
do
no
tsh
ow
po
pu
lati
on
dif
fere
nce
s.C
NV
ID:
CN
VId
en
tifi
er.
Pva
lue
sw
ith
anas
teri
sk(*
)d
en
ote
that
itis
sig
nif
ican
taf
ter
Bo
nfe
rro
ni
corr
ect
ion
.d
oi:1
0.1
37
1/j
ou
rnal
.po
ne
.00
07
23
0.t
00
3
CNVs Differencing Human Groups
PLoS ONE | www.plosone.org 6 September 2009 | Volume 4 | Issue 9 | e7230
interest, which might account for the observed population
differences [85]. To test for recent selection events, we used the
available Integrated Haplotype Score (iHS) data, which takes into
account different measures of haplotype length and composition in
each population [86]. We found that seven tag-SNPs showed
signals of recent positive selection (|iHS|$2); and in six of those,
the extreme iHS values were corresponded to the population in
which we observed the change in CNV frequency (Table S10).
Therefore, there are evidences that, at least in some cases, the
change in frequency of a CNV in a population was associated to
positive selection acting on itself or on a linked nucleotide variant.
Discussion
Given the unexpected extent of structural variation among
individuals, it is very likely that there is an important contribution
of such variants to phenotypic differences, including predisposition
to common and complex disorders. Although different authors
have reported the existence of CNVs in individuals from different
geographical locations [29,35,40,45], experimental validation is
lacking for a number of the reported variants. To uncover the
main part of such variability, we have performed whole genome
array-based comparative genome hybridization of pooled DNA
from different populations, and made an important effort to
provide validation of the most relevant findings. In addition, we
have combined different available sources of information to
estimate the functional and evolutionary relevance of these
changes.
Given the resolution and coverage of our arrays, we have been
able to identify a ‘‘relatively’’ small set of CNVs that show
significant differences in population distribution. Despite the
stringent criteria for CNV calling, an important number of them
could not be validated by MLPA analysis, especially those
supported by just one array probe, and several reasons can
account for that. First, it is possible that some of the aCGH
observations were indeed false positives due to the large number of
regions assayed in the arrays (i.e. the larger the number of tests, the
larger the type I error). Second, in the case of the variable loci
reported by a single probe in the oligonucleotide arrays (Table 2),
it was not always possible to design the MLPA probes in the exact
same place, and they were designed within one kb around the
array probe. As a result, it is possible that the probe ended up
located outside of the really variable region. Finally, it is also
possible that some of the loci reported had a basal copy number
that is too high to be correctly measured by MLPA, that is known
to reliably distinguish copy numbers between zero and five copies
[43,45], but its sensitivity greatly decreases when higher copy
numbers are measured. This is likely the case of the chemokine
CCL3L1 gene that appeared as variable in the array but could not
be confirmed by MLPA, although we know that it is indeed highly
variable, with median values of 3 and 6 copies per diploid genome
in non-Africans and Africans, respectively [87]. On the other
hand, despite the limitations of matching differently defined
CNVs, the comparison of the MLPA validation data with
previously reported information has revealed a very good
concordance, with 80% of the CNVs we identified agreeing with
Figure 3. Linkage disequilibrium between HapMap SNPs and CNVs. The distribution of maximum measured r2 value for the SNPs analyzedfor each CNV is plotted in the histogram, which represents the frequency of findings (Y axis) in each range of LD values (X-axis).doi:10.1371/journal.pone.0007230.g003
CNVs Differencing Human Groups
PLoS ONE | www.plosone.org 7 September 2009 | Volume 4 | Issue 9 | e7230
previously published data. It is a fact that genome-wide platforms
have been a great tool for obtaining a global view of copy number
variation, but big efforts of validation on individual loci will be
required in the future prior to establish the impact of individual
CNVs in human health. In this regard, MLPA has proven to be an
easy, efficient, reliable and inexpensive method to validate copy
number variants in large sets of samples.
CNVs have been suggested to play an important effect on gene-
expression levels. In our study, 60% (6 out of 10) of the genes
showing inter-population expression differences associate with
copy number changes, which reinforce the view that these variants
are indeed important modulators of expression. The list of genes
whose expression differs among human groups and is correlated to
copy number includes, amongst others, genes involved in
xenobiotic detoxification (GSTT1), cellular immunity (APOBEC3B
and HLA-DRB5) and hormone metabolism (UGT2B17) (Table 3
and Table S1). Although in some cases we have been able to
corroborate the intuitive higher dose – higher expression
hypothesis, the effect of CNVs on expression can be far more
complex. Depending on the modification of the regulatory
landscape of specific genes, it has been shown that CNVs can
affect distant transcripts in cis or in trans, and even result in a
negative correlation between expression and copy number (more
copies, less expression) [38]. In addition, the inherent complexity
of the regulation of gene expression, with temporal and tissue-
specific patterns, makes it difficult to evaluate the global effect of
structural variation on expression from the available data coming
from only one tissue. In our case, the total number of genes whose
expression levels could be evaluated (i.e. because they had levels
above the negative control threshold) in relation to copy number
was only half of the total number of genes contained within the
regions identified.
Despite these limitations, we have observed a number of
population-specific copy number variants that affect genes
associated to different phenotypes and disorders, and are very
interesting candidates for future studies. For instance, we found
that YRI have significantly lower copy number of the CFHR3 gene
(Complement Factor H-Related gene 3) than CEU and ASN
individuals. In addition, we have observed that this variant is well
tagged by a SNP (rs16840639; r2 = 0.79) that shows a significant
population differentiation and exhibits signatures of recent positive
selection. Interestingly, the incidence of age-related macular
degeneration (AMD) shows racial differences [88,89], with lower
prevalence among individuals of African origin. It is thus tempting
to speculate about a connection between an AMD protective role
of the deletion [63–67], the population-specific pattern of AMD
prevalence, and our findings about copy number population
differences. Another attractive candidate is the haptoglobin-related
protein gene (HPR), which is found in a CNV that exhibits a
higher copy number in Yorubans than in the other two
populations analyzed, and the linked SNPs also show high FST
values among populations. The HPR is a key component of the
serological innate immunity system that protects humans and
other primates against Trypanosoma brucei brucei infection [90–92],
which causes sleeping sickness disease [93,94]. Therefore, it seems
likely that the limited geographical distribution of the Trypanosoma
brucei’s vector, the TseTse fly, which is endemic to Africa [95], has
influenced the elevated frequency of the high copy number alleles
in individuals of the African population. Finally, elevated plasma
levels of LPA gene product (lipoprotein A or Lp(a)) are associated
with increased risk for atherosclerosis and its main manifestations:
myocardial infarction, stroke and restenosis [21,68–71]. In this
direction, the increase in copy number of the LPA gene observed
in the ASN population is associated with lower gene-expression
levels (Table 3), which might explain, at least in part, the reduced
risk of cardiovascular disease in individuals of this background.
Genes contained in CNV regions with population copy-number
state frequency differences are enriched in functions related to
interaction with the environment. For that reason, the different
frequencies of these variants could be a sign of recent local
adaptation events that have favored certain haplotypes over others
in response to specific environmental conditions, related for
example to dietary restriction or exposition to pathogens. By
looking at the associated nucleotide variation, we have tried to
discern if the differences could be attributable to some biological
adaptation process driven by natural selection or just to random
genetic drift. The diverse LD patterns among populations, the
extensive population differentiation (high FST) and the presence of
long haplotypes (high absolute values of iHS) point to recent
positive selection acting to increase CNV frequency in a particular
population. Nevertheless, in other cases, the available evidences
suggest that genetic drift is the most likely responsible for the
observed differences in CNV population frequency. Therefore,
taken as a whole, the data obtained from the tag SNPs points that
there is not a general pattern of selection for the different CNVs
herein identified.
Our results highlight the importance of CNV differences among
populations and, although more detailed studies would be needed
to characterize their real functional consequences, provide a
validated set of CNVs that might contribute to phenotypic and
disease susceptibility differences among human populations. The
identification of these variants emphasize the utility of current
available platforms to evaluate copy-number differences genome-
wide and pinpoint the need to develop specific technologies to
reliably genotype CNVs in multiple individuals, since currently
available array platforms and other proposed approaches (CNV-
SNP tagging) might be hampered by the significant differences in
population distribution of some CNVs. The work presented here
represents a first step towards characterization of population
differences in genome structure and will need to be revisited when
denser and more precise tools to study structural variation are
available. In addition, it would also be important to evaluate the
impact on population-specific variation of balanced rearrange-
ments not detected by aCGH, such as inversions, that, although
putatively less frequent, could have a total genome coverage and
potential contribution to variation at least as important as that of
copy number changes [36,37].
Materials and Methods
aCGH on pooled DNA samples from differentpopulations
We performed array-based Comparative Genome Hybridiza-
tion (aCGH) on pools of samples from different populations to
detect CNVs. To obtain the pools, we used DNA extracted from
lymphoblastoid cell lines from the HapMap collection (obtained
from the Coriell Institute for Medical Research). The samples
consisted of 50 unrelated individuals (25 males and 25 females)
from four population groups: Yoruba from Ibadan, Nigeria (YRI),
Caucasians of European descent from Utah, USA (CEU),
Japanese from Tokyo, Japan (JPT), and Han Chinese from
Beijing, China (CHB). In order to complete the 50 unrelated
samples from Asian ancestry, we included individuals from
HapMap Plate 05. Individual DNA quality was assessed by
alkaline gel electrophoresis and the concentration was measured
using the PicoGreenH assay (Invitrogen, Life technologies,
Carlsbad, CA, US). 500 ng of DNA from each individual were
combined to obtain each population-specific pool, which gave
CNVs Differencing Human Groups
PLoS ONE | www.plosone.org 8 September 2009 | Volume 4 | Issue 9 | e7230
enough DNA for the several experiments using different array
platforms.
Three different genome-wide platforms were used to perform
the CNV detection: an in-house developed BAC-based array
consisting of ,32.000 BAC-derived probes from the Human 32 K
clone set library (kindly provided by Dr. Joris Veltman), a gene-
centered oligonucleotide array of ,44.000 probes (Human Agilent
44 K; Agilent Technologies Inc, Santa Clara, CA, US) and a
genome-wide oligonucleotide array of ,185.000 probes (Human
Agilent 185 K). The hybridization, washing and scanning of the
BAC-arrays was performed as described elsewhere [96], with
minor modifications. Briefly, 400 ng of test and control DNA were
labelled by random priming using the BioPrime Array CGH
Genomic Labelling System (Invitrogen, Life technologies, Carls-
bad, CA, US). The hybridization, washing and scanning of Agilent
arrays was performed following manufacturer’s instructions with
minor modifications. For each array, each population-specific pool
was hybridized against all the rest population pools in a sex-
unmatched specific manner (i.e. the male pool from a certain
population is hybridized with the pools of the opposite sex of the
other populations - Figure 1A). In addition, we performed a sex-
unmatched, intra-population hybridization to discard clone and
oligonucleotide probes behaving abnormally. Arrays were scanned
using an Agilent G2565BA MicroArray Scanner System (Agilent
Technologies Inc., Santa Clara, CA, US) and the acquired images
were analyzed using GenePix Pro 6.0 software (Axon, Molecular
Devices, Toronto, Canada) using the irregular feature finding
option. Extracted raw data was filtered and Lowess normalized
using Bacanal [97], an in-house web server implementation of the
Limma package developed within the Bioconductor project [98].
Genomic imbalances were determined based on the average
log2 of the Cy5/Cy3 ratios of the spotted replicates, and regions
were considered as amplified or deleted when probes exceeded the
60.3 threshold. The design of the hybridizations allowed us to
establish a priori combinations of hybridization intensity patterns to
assign the most likely population to carry the variation, assuming
the most parsimonious scenario (Figure 1B). The combination of
hybridizations also allowed us to minimize the calling of CNVs on
spurious positive signals. For instance, for a CNV to be called as a
YRI-specific loss, the hybridizations of CEU, CHB and JPT male
pools were required to show an increased hybridization signal with
respect to the YRI female pool (log2 ratio$0.3, green squares), the
hybridization of the YRI male pool versus the rest of pools had to
report decreased signals (log2 ratio#20.3, red squares), and the
rest of combinations should reveal equal intensities (dark squares)
(Figure 1B). Any number of consecutive probes that exhibited log2
ratios consistent with a population-specific CNV call after the
analysis of the combination of hybridizations on the same platform
was considered for further analysis. We discarded probes/clones
that exhibited discordant log2 ratios among the different
combinations. The high degree of similarity between the patterns
obtained in the CHB and JPT samples prompted us to combine
the data from both populations and to treat the two populations as
a single one named ASN (for Asian). Data obtained from each of
the three platforms was considered and analyzed independently.
Detection limits of aCGHIn order to estimate the lower limit of aCGH to detect copy
number changes among samples, we set up an experiment in
which we diluted DNA from an individual carrying a deletion of
known size at 7q11.23 (typical Williams-Beuren Syndrome
deletion) into a pool of normal DNA. We determined that we
were able to call a copy number change when the alteration was
present in between 20% and 30% of the chromosomes that
participated in the hybridization (data not shown).
MLPA validation and data analysisOligonucleotides for each probe were designed following the
recommendations of the proprietary of the MLPA technology
(MRC-Holland) using the automated web application called MLPA
ProSeek [99]. A total of 133 locus-specific MLPA probes were
combined in 5 different mixes to validate the findings. Each probe
mix was composed of about 30 probes targeting selected genomic
loci (Table S2). In the case of CNV loci reported by a single
oligonucleotide probe in the array, the MLPA probe was designed
within a window of 1 kb around the original position; otherwise, it
was designed within the altered region. Each probe mix contained
two extra control probes interrogating regions that are deleted and
duplicated in the positive control samples that were included in each
experiment, but are invariable in normal individuals. For validation,
we analyzed all individual samples included in the pools plus the rest
of individuals in HapMap plates 01 (90 CEU), 02 (90 ASN), 03
(90 YRI) and 05 (90 ASN) (Coriell). In addition, control samples
were included in each plate: two DNAs with known aberrations
(10q duplication, 22q deletion) plus 4 replicates of each of the male
pools used in the hybridizations. MLPA was performed as described
elsewhere [54], with minor modifications.
Although DNA concentration was controlled during the
preparation of the plates, for data analysis each sample was
normalized internally by dividing the height of each individual peak
by total sum of peaks heights (dosage quotient). In order to compare
results among plates, individual peak dosage quotients of each
sample were normalized against the mean dosage quotients of the
control samples included in each plate (pooled samples). Thus, a
value of 1.0 for a particular probe after normalization corresponds
to the population average copy number and does not necessarily
denote the usual copy dosage of 2 of a given locus. In order to
estimate the copy number state of each locus in each individual, we
developed a novel method that will be implemented in the R-
package called MLPAstats [100]. In brief, since the MLPA dosage
quotient ratios of the individuals at a certain locus are distributed
according to a mixture of normal distributions, it is possible to assign
to each individual a posterior probability of being located within one
of the normal distributions that represent each copy number state.
In order to assess if the copy number distribution was significantly
different among populations, we performed a Fisher test after
constructing contingency tables with copy number states and
number of individuals assigned to each state. To determine the
population in which a given CNV occurs, its distribution in each
population was compared in a pairwise manner also using a Fisher’s
test (or x2 test, depending on whether the number of individuals
carrying a specific copy number exceeded a certain threshold).
Expression dataExpression data for genes located within the identified CNVs
was obtained from [38], available at ftp://ftp.sanger.ac.uk/pub/
genevar/. We extracted the ‘‘globally’’ normalized information for
unrelated individuals for whom we had estimated the CNV status.
The existence of population-specific differences in expression levels
of probes was determined by comparing the expression data using
a Kruskal-Wallis test. In order to test for the relationship between
copy number and expression levels we performed an ANOVA by
fitting a linear model using the individuals’ copy number estimated
from MLPA and the expression data. Some of the genes located
within CNV regions were not included in the analysis because
their expression levels were below the average of negative control
genes included in the array (bacterial genes lysA, pheA, thrB and
CNVs Differencing Human Groups
PLoS ONE | www.plosone.org 9 September 2009 | Volume 4 | Issue 9 | e7230
trpF) across the different experiments (6.139), indicating that the
hybridization to the array probes is below the level of detection.
Gene ontology analysisWe used the Gene Ontology Tree Machine (GOTM - http://
bioinfo.vanderbilt.edu/gotm/) to measure the enrichment in GO
categories of the genes located within the CNVs showing
population differences in comparison with the rest of genes of
the human genome and the subset of genes located within known
CNVs. In order to identify GO categories with significantly
enriched gene numbers, the GOTM compares the distribution of
genes in the user’s set in each GO category to those in the
reference gene set. GOTM reports only those enrichments that are
statistically significant as determined by the hypergeometric test.
Further details on the statistical background for the comparison
between gene sets are given on the original publication [58].
Selective constraints of genes located within CNVsWe obtained information on rates of synonymous (Ks) and non-
synonymous (Ka) changes between humans and chimpanzees for
genes located within the validated CNVs from Ensembl (http://
www.ensembl.org/) and Khaitovich et al. [101]. To check for the
existence of significant Ka/Ks differences of our gene set, we
compared the average and median values with the values obtained
from 10000 permutations of the same number of RefSeq genes. The
P-value was calculated as the number of times that the Ka/Ks values
of the permuted sets equaled or exceeded the observed Ka/Ks
divided by the total number of permutations plus one [102]. Whole
data set of Ka/Ks values used is provided in Tables S6 and S7.
SNPs and CNVs associationWe used HapMart to retrieve the genotypes of all HapMap
SNPs (excluding monomorphic ones) in a window of 100 kb at
each side of the estimated CNV breakpoints, or around the
position of the MLPA probe that we used for the validation of
single oligonucleotide probe. The SNPassoc R package [103] was
then used to measure LD by calculating r2 between the set of SNP
genotypes and the copy number alleles. LD could only be
calculated for biallelic copy number variants. In addition, in some
cases, LD value could not be calculated because the CNV was
identified exclusively in non-unrelated HapMap individuals or in
individuals of Asian ancestry that were used in our analysis but
have not been genotyped as part of the HapMap. Pairwise
comparison of r2 LD patterns among different populations was
done using the Spearman’s rank correlation coefficient.
Evidences of natural selection on identified CNVsFor the tag-SNPs showing the highest linkage disequilibrium
with the identified copy number variants in the population where
the CNV was identified, we obtained the global and pairwise FST
values among populations for the Phase II HapMap SNPs from
[84]. To detect population differentiation, we assumed a relatively
strict threshold of global FST$0.2, and the comparison of pairwise
FST values (i.e. CEU vs YRI, CEU vs ASN, and YRI vs ASN) for a
given tag-SNP pointed out which population was more clearly
differentiated.
To test for signals of recent positive selection we compared,
among populations, the integrated Haplotype Score (iHS) of the
SNP that best tagged the variant in the population in which the
CNV differences were found. Absolute values of iHS over 2 are
generally accepted as signals of recent positive selection [86]. iHS
data for HapMap II SNPs was retrieved from the Haplotter
website (http://hg-wen.uchicago.edu/selection/index.html).
Supporting Information
Table S1 Details of regions interrogated with the MLPA probes
and summary of MLPA results obtained for each probe.
Conservation was only explored in regions that were confirmed
to be CNVs and did not contain genes. WGTP stands for Whole
Genome Tiling Path Array.
Found at: doi:10.1371/journal.pone.0007230.s001 (0.16 MB
XLS)
Table S2 Details of MLPA probes used in the study. Genomic
positions are referred to the hg18 UCSC genome assembly.
MLPA probes are composed of two oligonucleotides that would
only render an amplifiable product if properly ligated when bound
to the specific DNA sequence. Right oligonucleotide sequences are
entirely complementary to the target locus, while left oligonucle-
otide sequences are formed by the locus-specific sequence plus a
stuffer sequence that would allow distinguishing each product in
the mix. In the left sequence, stuffer sequence is lowercase and a
dash separates it from the specific sequence, that is either upper or
lowercase depending on the coincidence with a repeat identified
by Repeat Masker. VIC, NED and FAM are the fluorophores that
were used to label the specific universal primers combined in each
probe mix.
Found at: doi:10.1371/journal.pone.0007230.s002 (0.05 MB
XLS)
Table S3 Comparison of CNVs identified in this study and
previsouly existing information on the Database of Genomic
Variants (DGV). The agreement column states whether our
findings agree with previously published results (Agree), do not
agree (Disagree), or could not be verified (Unverifiable) either
because the CNV herein identified was not previously reported or
there were inconsistencies in the description of the CNV in the
original paper or in the Database of Genomic Variants.
Found at: doi:10.1371/journal.pone.0007230.s003 (0.04 MB
XLS)
Table S4 Gene Ontology Analysis (part I). Gene ontology
analysis of genes located within the identified CNVs reveals
enrichment in different functional categories when compared to
the rest of human genes.
Found at: doi:10.1371/journal.pone.0007230.s004 (0.02 MB
XLS)
Table S5 Gene Ontology Analysis (part II). Gene ontology
analysis of genes located within the identified CNVs reveals
enrichment in different functional categories when compared to
genes located within known CNVs.
Found at: doi:10.1371/journal.pone.0007230.s005 (0.01 MB
XLS)
Table S6 Comparison of Ka/Ks ratios of genes located within
population-specific CNV changes. For the Ensembl dataset, mean
and median values are calculated from dN/dS. For the
calculations on the Khaitovich dataset, we used the Ka/Ki
measure. P-values were calculated as the number of times that the
observed mean value exceeded or equaled the value in the
permutation analysis out of 10,000 permutations.
Found at: doi:10.1371/journal.pone.0007230.s006 (0.02 MB
XLS)
Table S7 Indexes of molecular evolution. All evolutionary
measures were published or available elsewhere as described in
the Methods section. Values were calculated by comparing human
versus chimpanzee sequences. Ka is the number of non-
synonymous nucleotide substitutions per non-synonymous site.
Ks is the number of synonymous nucleotide substitutions per
CNVs Differencing Human Groups
PLoS ONE | www.plosone.org 10 September 2009 | Volume 4 | Issue 9 | e7230
synonymous site. Ki is the number of substitutions per site in
interspersed repeats in a 250-kbp window around the center of
each gene (see Khaitovich et. al, 2005). dn/ds: number of non-
synonymous substitutions per non-synonymous site divided by the
number synonymous substitutions per silent site.
Found at: doi:10.1371/journal.pone.0007230.s007 (0.02 MB
XLS)
Table S8 Linkage disequilibrium for SNPs and CNVs. In the
table it is reflected the calculated r-squared value (r2) and the SNP
showing the maximum LD with the copy number state revealed by
the MLPA probes in the first column. Values were obtained for
each population independently and considering all populations
together. The column SNPs indicates the number of HapMap
SNPs retrieved for each analysed region flanking the CNV. For
three of the probes it was not possible to measure LD because
more than three copy number states were present (**) or because
no SNP data was available for individuals showing the CNV (***).
Found at: doi:10.1371/journal.pone.0007230.s008 (0.03 MB
XLS)
Table S9 Haplotype structure correlation between populations.
LD patterns correlation between populations was measured using
the Spearman’s rank correlation test. High Rho values indicate
correlation and p-values below 0,05 denote significance for the
correlation. For three of the probes it was not possible to measure
LD because more than three copy number states were present (**)
or because no SNP data was available for individuals showing the
CNV (***).
Found at: doi:10.1371/journal.pone.0007230.s009 (0.02 MB
XLS)
Table S10 Evaluation of selective pressures on SNPs tagging
CNVs. SNPs having the highest LD in the population in which the
CNV variant was identified are shown in the table. We have
recovered FST values calculated after pairwise population
comparisons from Barreiro et al, (2008). The Inferred Pop column
indicates to which population is attributable the differentiation,
according to pairwise comparisons of the SNP FST. We used a
strict criterion and assumed values above 0.20 to be indicative of
population differentiation. iHS stands for integrated Haplotype
Score (Voight et al, 2006) and absolute values higher than 2
indicate recent selection (marked with two asterisks). *: denotes
coincidence of the most differentiated population with the
population in which de CNV was identified. NA: indicates that
we could not find Fst calculations or iHS value for the given SNP.
None: indicates that we can not identify which is the differentiated
population using the observed values. It is also used to indicate
that no population has values above the iHS threshold considered
for recent selection. **: indicates an absolute value of iHS above 2.
Found at: doi:10.1371/journal.pone.0007230.s010 (0.07 MB
XLS)
Figure S1 Evaluation of copy number in large CNVs. MLPA
probes located within the same theoretical CNV do not show the
same copy number pattern neither, in consequence, the same
correlation with gene expression levels.
Found at: doi:10.1371/journal.pone.0007230.s011 (0.01 MB
PNG)
Figure S2 Correlation between copy number changes and
expression levels. Each coloured circle corresponds to the
measured copy number state plotted against expression levels for
each HapMap individual. Gene name for which expression levels
and copy numbers are depicted is shown in the title of each figure.
Left panel (A) shows four examples of CNVs identified in which
copy number is correlated with gene expression. Right panel (B)
exemplifies four cases in which copy number differences exist
among individuals from different populations, but it does not
translate into gene expression differences.
Found at: doi:10.1371/journal.pone.0007230.s012 (5.57 MB TIF)
Acknowledgments
We would like to thank Luis Barreiro and Lluıs Quintana-Murci for kindly
providing FST values calculations for the HapMap SNPs. We would also
like to thank Ferran Casals for his advice regarding molecular evolution
analyses.
Author Contributions
Conceived and designed the experiments: LA MC XE. Performed the
experiments: LA SV MGA MC. Analyzed the data: LA SV JRG MC.
Contributed reagents/materials/analysis tools: LA LP MC. Wrote the
paper: LA JRG RR MC XE.
References
1. Lander ES, Linton LM, Birren B, Nusbaum C, Zody MC, et al. (2001) Initialsequencing and analysis of the human genome. Nature 409: 860–921.
2. Venter JC, Adams MD, Myers EW, Li PW, Mural RJ, et al. (2001) The
sequence of the human genome. Science 291: 1304–1351.
3. Bamshad M, Wooding S, Salisbury BA, Stephens JC (2004) Deconstructing the
relationship between genetics and race. Nat Rev Genet 5: 598–609.
4. Daar AS, Singer PA (2005) Pharmacogenetics and geographical ancestry:implications for drug development and global health. Nat Rev Genet 6:
241–246.
5. Burchard EG, Ziv E, Coyle N, Gomez SL, Tang H, et al. (2003) The
importance of race and ethnic background in biomedical research and clinicalpractice. N Engl J Med 348: 1170–1175.
6. Botstein D, Risch N (2003) Discovering genotypes underlying human
phenotypes: past successes for mendelian disease, future approaches forcomplex disease. Nat Genet 33 Suppl: 228–237.
7. (1994) Population variation of common cystic fibrosis mutations. The Cystic
Fibrosis Genetic Analysis Consortium. Hum Mutat 4: 167–177.
8. Estivill X, Bancells C, Ramos C (1997) Geographic distribution and regional
origin of 272 cystic fibrosis mutations in European populations. The BiomedCF Mutation Analysis Consortium. Hum Mutat 10: 135–154.
9. Bobadilla JL, Macek M Jr, Fine JP, Farrell PM (2002) Cystic fibrosis: a
worldwide analysis of CFTR mutations–correlation with incidence data and
application to screening. Hum Mutat 19: 575–606.
10. Antonarakis SE, Boehm CD, Serjeant GR, Theisen CE, Dover GJ, et al. (1984)Origin of the beta S-globin gene in blacks: the contribution of recurrent
mutation or gene conversion or both. Proc Natl Acad Sci U S A 81: 853–856.
11. Kulozik AE, Wainscoat JS, Serjeant GR, Kar BC, Al-Awamy B, et al. (1986)Geographical survey of beta S-globin gene haplotypes: evidence for an
independent Asian origin of the sickle-cell mutation. Am J Hum Genet 39:239–244.
12. Lapoumeroulie C, Dunda O, Ducrocq R, Trabuchet G, Mony-Lobe M, et al.(1992) A novel sickle cell mutation of yet another origin in Africa: the
Cameroon type. Hum Genet 89: 333–337.
13. Nagel RL, Fabry ME, Pagnier J, Zohoun I, Wajcman H, et al. (1985)Hematologically and genetically distinct forms of sickle cell anemia in
Africa. The Senegal type and the Benin type. N Engl J Med 312: 880–884.
14. Pagnier J, Mears JG, Dunda-Belkhodja O, Schaefer-Rego KE, Beldjord C, etal. (1984) Evidence for the multicentric origin of the sickle cell hemoglobin gene
in Africa. Proc Natl Acad Sci U S A 81: 1771–1773.
15. Gasparini P, Rabionet R, Barbujani G, Melchionda S, Petersen M, et al. (2000)
High carrier frequency of the 35delG deafness mutation in European
populations. Genetic Analysis Consortium of GJB2 35delG. Eur J Hum Genet8: 19–23.
16. Ridker PM, Miletich JP, Hennekens CH, Buring JE (1997) Ethnic distributionof factor V Leiden in 4047 men and women. Implications for venous
thromboembolism screening. Jama 277: 1305–1307.
17. Shen MC, Lin JS, Tsay W (1997) High prevalence of antithrombin III, protein
C and protein S deficiency, but no factor V Leiden mutation in venousthrombophilic Chinese patients in Taiwan. Thromb Res 87: 377–385.
18. Hugot JP, Chamaillard M, Zouali H, Lesage S, Cezard JP, et al. (2001)Association of NOD2 leucine-rich repeat variants with susceptibility to Crohn’s
disease. Nature 411: 599–603.
19. Yamazaki K, Takazoe M, Tanaka T, Kazumori T, Nakamura Y (2002)
Absence of mutation in the NOD2/CARD15 gene among 483 Japanese
patients with Crohn’s disease. J Hum Genet 47: 469–472.
CNVs Differencing Human Groups
PLoS ONE | www.plosone.org 11 September 2009 | Volume 4 | Issue 9 | e7230
20. Stephens JC, Reich DE, Goldstein DB, Shin HD, Smith MW, et al. (1998)Dating the origin of the CCR5-Delta32 AIDS-resistance allele by the
coalescence of haplotypes. Am J Hum Genet 62: 1507–1515.
21. Farrer LA, Cupples LA, Haines JL, Hyman B, Kukull WA, et al. (1997) Effectsof age, sex, and ethnicity on the association between apolipoprotein E genotype
and Alzheimer disease. A meta-analysis. APOE and Alzheimer Disease MetaAnalysis Consortium. Jama 278: 1349–1356.
22. Vatsis KP, Martell KJ, Weber WW (1991) Diverse point mutations in the
human gene for polymorphic N-acetyltransferase. Proc Natl Acad Sci U S A88: 6333–6337.
23. Bowcock AM, Kidd JR, Mountain JL, Hebert JM, Carotenuto L, et al. (1991)Drift, admixture, and selection in human evolution: a study with DNA
polymorphisms. Proc Natl Acad Sci U S A 88: 839–843.
24. Bowcock AM, Ruiz-Linares A, Tomfohrde J, Minch E, Kidd JR, et al. (1994)High resolution of human evolutionary trees with polymorphic microsatellites.
Nature 368: 455–457.
25. Ramachandran S, Deshpande O, Roseman CC, Rosenberg NA, Feldman MW,
et al. (2005) Support from the relationship of genetic and geographic distance in
human populations for a serial founder effect originating in Africa. Proc NatlAcad Sci U S A 102: 15942–15947.
26. Rosenberg NA, Pritchard JK, Weber JL, Cann HM, Kidd KK, et al. (2002)Genetic structure of human populations. Science 298: 2381–2385.
27. HapMap C (2005) A haplotype map of the human genome. Nature 437:
1299–1320.
28. Frazer KA, Ballinger DG, Cox DR, Hinds DA, Stuve LL, et al. (2007) A
second generation human haplotype map of over 3.1 million SNPs. Nature
449: 851–861.
29. Jakobsson M, Scholz SW, Scheet P, Gibbs JR, VanLiere JM, et al. (2008)
Genotype, haplotype and copy-number variation in worldwide humanpopulations. Nature 451: 998–1003.
30. Barbujani G, Magagni A, Minch E, Cavalli-Sforza LL (1997) An apportion-
ment of human DNA diversity. Proc Natl Acad Sci U S A 94: 4516–4519.
31. Watkins WS, Rogers AR, Ostler CT, Wooding S, Bamshad MJ, et al. (2003)
Genetic variation among world populations: inferences from 100 Alu insertionpolymorphisms. Genome Res 13: 1607–1618.
32. Beckmann JS, Estivill X, Antonarakis SE (2007) Copy number variants and
genetic traits: closer to the resolution of phenotypic to genotypic variability. NatRev Genet 8: 639–646.
33. Hurles ME, Dermitzakis ET, Tyler-Smith C (2008) The functional impact of
structural variation in humans. Trends Genet 24: 238–245.
34. Tuzun E, Sharp AJ, Bailey JA, Kaul R, Morrison VA, et al. (2005) Fine-scale
structural variation of the human genome. Nat Genet 37: 727–732.
35. Redon R, Ishikawa S, Fitch KR, Feuk L, Perry GH, et al. (2006) Global
variation in copy number in the human genome. Nature 444: 444–454.
36. Kidd JM, Cooper GM, Donahue WF, Hayden HS, Sampas N, et al. (2008)Mapping and sequencing of structural variation from eight human genomes.
Nature 453: 56–64.
37. Korbel JO, Urban AE, Affourtit JP, Godwin B, Grubert F, et al. (2007) Paired-
end mapping reveals extensive structural variation in the human genome.
Science 318: 420–426.
38. Stranger BE, Forrest MS, Dunning M, Ingle CE, Beazley C, et al. (2007)
Relative impact of nucleotide and copy number variation on gene expressionphenotypes. Science 315: 848–853.
39. Stranger BE, Nica AC, Forrest MS, Dimas A, Bird CP, et al. (2007) Population
genomics of human gene expression. Nat Genet 39: 1217–1224.
40. de Stahl TD, Sandgren J, Piotrowski A, Nord H, Andersson R, et al. (2008)
Profiling of copy number variations (CNVs) in healthy individuals from three
ethnic groups using a human genome 32 K BAC-clone-based array. HumMutat 29: 398–408.
41. Perry GH, Ben-Dor A, Tsalenko A, Sampas N, Rodriguez-Revenga L, et al.(2008) The fine-scale and complex architecture of human copy-number
variation. Am J Hum Genet 82: 685–695.
42. McCarroll SA, Kuruvilla FG, Korn JM, Cawley S, Nemesh J, et al. (2008)Integrated detection and population-genetic analysis of SNPs and copy number
variation. Nat Genet 40: 1166–1174.
43. Armour JA, Palla R, Zeeuwen PL, den Heijer M, Schalkwijk J, et al. (2007)
Accurate, high-throughput typing of copy number variation using paralogue
ratios from dispersed repeats. Nucleic Acids Res 35: e19.
44. Kidd JM, Newman TL, Tuzun E, Kaul R, Eichler EE (2007) Population
stratification of a common APOBEC gene deletion polymorphism. PLoS Genet3: e63.
45. White SJ, Vissers LE, Geurts van Kessel A, de Menezes RX, Kalay E, et al.
(2007) Variation of CNV distribution in five different ethnic populations.Cytogenet Genome Res 118: 19–30.
46. Armengol L, Rabionet R, Estivill X (2008) The emerging role of structuralvariations in common disorders: initial findings and discovery challenges.
Cytogenet Genome Res 123: 108–117.
47. Gimelli G, Pujana MA, Patricelli MG, Russo S, Giardino D, et al. (2003)Genomic inversions of human chromosome 15q11–q13 in mothers of
Angelman syndrome patients with class II (BP2/3) deletions. Hum Mol Genet12: 849–858.
48. Osborne LR, Li M, Pober B, Chitayat D, Bodurtha J, et al. (2001) A 1.5
million-base pair inversion polymorphism in families with Williams-Beurensyndrome. Nat Genet 29: 321–325.
49. Stankiewicz P, Lupski JR (2002) Genome architecture, rearrangements and
genomic disorders. Trends Genet 18: 74–82.
50. Stankiewicz P, Shaw CJ, Dapper JD, Wakui K, Shaffer LG, et al. (2003)
Genome architecture catalyzes nonrecurrent chromosomal rearrangements.
Am J Hum Genet 72: 1101–1116.
51. Pinkel D, Segraves R, Sudar D, Clark S, Poole I, et al. (1998) High resolution
analysis of DNA copy number variation using comparative genomic
hybridization to microarrays. Nat Genet 20: 207–211.
52. Solinas-Toldo S, Lampel S, Stilgenbauer S, Nickolenko J, Benner A, et al.
(1997) Matrix-based comparative genomic hybridization: biochips to screen for
genomic imbalances. Genes Chromosomes Cancer 20: 399–407.
53. Conrad DF, Andrews TD, Carter NP, Hurles ME, Pritchard JK (2006) A high-
resolution survey of deletion polymorphism in the human genome. Nat Genet
38: 75–81.
54. Schouten JP, McElgunn CJ, Waaijer R, Zwijnenburg D, Diepvens F, et al.
(2002) Relative quantification of 40 nucleic acid sequences by multiplex
ligation-dependent probe amplification. Nucleic Acids Res 30: e57.
55. Iafrate AJ, Feuk L, Rivera MN, Listewnik ML, Donahoe PK, et al. (2004)
Detection of large-scale variation in the human genome. Nat Genet 36:
949–951.
56. Price AL, Patterson NJ, Plenge RM, Weinblatt ME, Shadick NA, et al. (2006)
Principal components analysis corrects for stratification in genome-wide
association studies. Nat Genet 38: 904–909.
57. Ovcharenko I, Nobrega MA, Loots GG, Stubbs L (2004) ECR Browser: a tool
for visualizing and accessing data from comparisons of multiple vertebrate
genomes. Nucleic Acids Res 32: W280–286.
58. Zhang B, Schmoyer D, Kirov S, Snoddy J (2004) GOTree Machine (GOTM):
a web-based platform for interpreting sets of interesting genes using Gene
Ontology hierarchies. BMC Bioinformatics 5: 16.
59. Cooper GM, Nickerson DA, Eichler EE (2007) Mutational and selective effects
on copy-number variants in the human genome. Nat Genet 39: S22–29.
60. Feuk L, Carson AR, Scherer SW (2006) Structural variation in the human
genome. Nat Rev Genet 7: 85–97.
61. Nguyen DQ, Webber C, Ponting CP (2006) Bias of selection on human copy-
number variants. PLoS Genet 2: e20.
62. Sharp AJ, Cheng Z, Eichler EE (2006) Structural variation of the human
genome. Annu Rev Genomics Hum Genet 7: 407–442.
63. Edwards AO, Ritter R 3rd, Abel KJ, Manning A, Panhuysen C, et al. (2005)
Complement factor H polymorphism and age-related macular degeneration.
Science 308: 421–424.
64. Hageman GS, Hancox LS, Taiber AJ, Gehrs KM, Anderson DH, et al. (2006)
Extended haplotypes in the complement factor H (CFH) and CFH-related
(CFHR) family of genes protect against age-related macular degeneration:
characterization, ethnic distribution and evolutionary implications. Ann Med
38: 592–604.
65. Haines JL, Hauser MA, Schmidt S, Scott WK, Olson LM, et al. (2005)
Complement factor H variant increases the risk of age-related macular
degeneration. Science 308: 419–421.
66. Hughes AE, Orr N, Esfandiary H, Diaz-Torres M, Goodship T, et al. (2006) A
common CFH haplotype, with deletion of CFHR1 and CFHR3, is associated
with lower risk of age-related macular degeneration. Nat Genet 38: 1173–1177.
67. Spencer KL, Hauser MA, Olson LM, Schmidt S, Scott WK, et al. (2008)
Deletion of CFHR3 and CFHR1 genes in age-related macular degeneration.
Hum Mol Genet 17: 971–977.
68. Brazier L, Tiret L, Luc G, Arveiler D, Ruidavets JB, et al. (1999) Sequence
polymorphisms in the apolipoprotein(a) gene and their association with
lipoprotein(a) levels and myocardial infarction. The ECTIM Study. Athero-
sclerosis 144: 323–333.
69. Celik T, Yuksel C, Iyisoy A, Isik E (2008) Lipoprotein(a) and coronary artery
disease: Ongoing debate. Nutr Metab Cardiovasc Dis.
70. Gaeta G, Cuomo S, Capozzi G, Foglia MC, Barra S, et al. (2007)
Lipoprotein(a) levels are increased in healthy young subjects with parental
history of premature myocardial infarction. Nutr Metab Cardiovasc Dis.
71. Hahmann HW, Schatzer-Klotz D, Bunte T, Becker D, Schieffer HJ (1999) The
significance of high levels of lipoprotein (a) compared with established risk
factors in premature coronary artery disease: differences between men and
women. Atherosclerosis 144: 221–228.
72. Ogorelkova M, Gruber A, Utermann G (1999) Molecular basis of congenital
lp(a) deficiency: a frequent apo(a) ‘null’ mutation in caucasians. Hum Mol
Genet 8: 2087–2096.
73. Ogorelkova M, Kraft HG, Ehnholm C, Utermann G (2001) Single nucleotide
polymorphisms in exons of the apo(a) kringles IV types 6 to 10 domain affect
Lp(a) plasma concentrations and have different patterns in Africans and
Caucasians. Hum Mol Genet 10: 815–824.
74. Zhang X, Mahmudi-Azer S, Connett JE, Anthonisen NR, He JQ, et al. (2007)
Association of Hck genetic polymorphisms with gene expression and COPD.
Hum Genet 120: 681–690.
75. Spielman RS, Bastone LA, Burdick JT, Morley M, Ewens WJ, et al. (2007)
Common genetic variants account for differences in gene expression among
ethnic groups. Nat Genet 39: 226–231.
76. McCarroll SA, Hadnott TN, Perry GH, Sabeti PC, Zody MC, et al. (2006)
Common deletion polymorphisms in the human genome. Nat Genet 38:
86–92.
CNVs Differencing Human Groups
PLoS ONE | www.plosone.org 12 September 2009 | Volume 4 | Issue 9 | e7230
77. Cooper GM, Zerr T, Kidd JM, Eichler EE, Nickerson DA (2008) Systematic
assessment of copy number variant detection via genome-wide SNPgenotyping. Nat Genet 40: 1199–1203.
78. Locke DP, Sharp AJ, McCarroll SA, McGrath SD, Newman TL, et al. (2006)
Linkage disequilibrium and heritability of copy-number polymorphisms withinduplicated regions of the human genome. Am J Hum Genet 79: 275–290.
79. Ke X, Hunt S, Tapper W, Lawrence R, Stavrides G, et al. (2004) The impactof SNP density on fine-scale patterns of linkage disequilibrium. Hum Mol
Genet 13: 577–588.
80. Excoffier L, Smouse PE, Quattro JM (1992) Analysis of molecular varianceinferred from metric distances among DNA haplotypes: application to human
mitochondrial DNA restriction data. Genetics 131: 479–491.81. Weir BS, Hill WG (2002) Estimating F-statistics. Annu Rev Genet 36: 721–750.
82. Nielsen R (2005) Molecular signatures of natural selection. Annu Rev Genet39: 197–218.
83. Weir BS, Cardon LR, Anderson AD, Nielsen DM, Hill WG (2005) Measures of
human population structure show heterogeneity among genomic regions.Genome Res 15: 1468–1476.
84. Barreiro LB, Laval G, Quach H, Patin E, Quintana-Murci L (2008) Naturalselection has driven population differentiation in modern humans. Nat Genet
40: 340–345.
85. Sabeti PC, Schaffner SF, Fry B, Lohmueller J, Varilly P, et al. (2006) Positivenatural selection in the human lineage. Science 312: 1614–1620.
86. Voight BF, Kudaravalli S, Wen X, Pritchard JK (2006) A map of recentpositive selection in the human genome. PLoS Biol 4: e72.
87. Gonzalez E, Kulkarni H, Bolivar H, Mangano A, Sanchez R, et al. (2005) Theinfluence of CCL3L1 gene-containing segmental duplications on HIV-1/AIDS
susceptibility. Science 307: 1434–1440.
88. Bressler SB, Munoz B, Solomon SD, West SK (2008) Racial differences in theprevalence of age-related macular degeneration: the Salisbury Eye Evaluation
(SEE) Project. Arch Ophthalmol 126: 241–245.89. Chang MA, Bressler SB, Munoz B, West SK (2008) Racial differences and
other risk factors for incidence and progression of age-related macular
degeneration: Salisbury Eye Evaluation (SEE) Project. Invest Ophthalmol VisSci 49: 2395–2402.
90. Drain J, Bishop JR, Hajduk SL (2001) Haptoglobin-related protein mediatestrypanosome lytic factor binding to trypanosomes. J Biol Chem 276:
30254–30260.
91. Vanhollebeke B, De Muylder G, Nielsen MJ, Pays A, Tebabi P, et al. (2008) A
haptoglobin-hemoglobin receptor conveys innate immunity to Trypanosoma
brucei in humans. Science 320: 677–681.
92. Vanhollebeke B, Nielsen MJ, Watanabe Y, Truc P, Vanhamme L, et al. (2007)
Distinct roles of haptoglobin-related protein and apolipoprotein L-I in
trypanolysis by human serum. Proc Natl Acad Sci U S A 104: 4118–4123.
93. Pays E, Vanhollebeke B, Vanhamme L, Paturiaux-Hanocq F, Nolan DP, et al.
(2006) The trypanolytic factor of human serum. Nat Rev Microbiol 4:
477–486.
94. Vanhamme L, Paturiaux-Hanocq F, Poelvoorde P, Nolan DP, Lins L, et al.
(2003) Apolipoprotein L-I is the trypanosome lytic factor of human serum.
Nature 422: 83–87.
95. Krafsur ES (2003) Tsetse fly population genetics: an indirect approach to
dispersal. Trends Parasitol 19: 162–166.
96. Buckley PG, Mantripragada KK, Benetkiewicz M, Tapia-Paez I, Diaz De
Stahl T, et al. (2002) A full-coverage, high-resolution human chromosome 22
genomic microarray for clinical and research applications. Hum Mol Genet 11:
3221–3229.
97. Lozano J Unpublished.
98. Gentleman RC, Carey VJ, Bates DM, Bolstad B, Dettling M, et al. (2004)
Bioconductor: open software development for computational biology and
bioinformatics. Genome Biol 5: R80.
99. Pantano L, Armengol L, Villatoro S, Estivill X (2008) ProSeeK: A web server
for MLPA probe design. BMC Genomics 9: 573.
100. Gonzalez JR, Carrasco JL, Armengol L, Vilaroto S, Jover L, et al. (2008)
Probe-specific mixed-model approach to detect copy number differences using
multiplex ligation-dependent probe amplification (MLPA). BMC Bioinfor-
matics 9: 261.
101. Khaitovich P, Hellmann I, Enard W, Nowick K, Leinweber M, et al. (2005)
Parallel patterns of evolution in the genomes and transcriptomes of humans
and chimpanzees. Science 309: 1850–1854.
102. Good PI (2000) Permutation Tests. A Practical Guide to Resampling Methods
for Testing Hypotheses. Berlin-Heidelberg-New York: Springer-Verlag.
103. Gonzalez JR, Armengol L, Sole X, Guino E, Mercader JM, et al. (2007)
SNPassoc: an R package to perform whole genome association studies.
Bioinformatics 23: 644–645.
CNVs Differencing Human Groups
PLoS ONE | www.plosone.org 13 September 2009 | Volume 4 | Issue 9 | e7230