Identification and validation of quantitative real-time reverse transcription PCR reference genes...
13
1 23 Plant Molecular Biology Reporter ISSN 0735-9640 Volume 30 Number 4 Plant Mol Biol Rep (2012) 30:929-939 DOI 10.1007/s11105-011-0404-4 Identification and Validation of Quantitative Trait Loci for Agronomic Traits in Advanced Backcross Breeding Lines Derived from Oryza rufipogon × Oryza sativa Cultivar MR219 Ratnam Wickneswari, M. A. R. Bhuiyan, Sabu Kalluvettankuzhy K., Li Sze Lim, Michael J. Thomson, Md. Kairudin Narimah, et al.
-
Upload
independent -
Category
Documents
-
view
3 -
download
0
Transcript of Identification and validation of quantitative real-time reverse transcription PCR reference genes...
1 23
Plant Molecular Biology Reporter ISSN 0735-9640Volume 30Number 4 Plant Mol Biol Rep (2012) 30:929-939DOI 10.1007/s11105-011-0404-4
Identification and Validation ofQuantitative Trait Loci for AgronomicTraits in Advanced Backcross BreedingLines Derived from Oryza rufipogon ×Oryza sativa Cultivar MR219Ratnam Wickneswari, M. A. R. Bhuiyan,Sabu Kalluvettankuzhy K., Li Sze Lim,Michael J. Thomson, Md. KairudinNarimah, et al.

1 23
Your article is protected by copyright and
all rights are held exclusively by Springer-
Verlag. This e-offprint is for personal use only
and shall not be self-archived in electronic
repositories. If you wish to self-archive your
work, please use the accepted author’s
version for posting to your own website or
your institution’s repository. You may further
deposit the accepted author’s version on a
funder’s repository at a funder’s request,
provided it is not made publicly available until
12 months after publication.
ORIGINAL PAPER
Identification and Validation of Quantitative Trait Locifor Agronomic Traits in Advanced Backcross Breeding LinesDerived from Oryza rufipogon × Oryza sativa Cultivar MR219
Ratnam Wickneswari & M. A. R. Bhuiyan &
Sabu Kalluvettankuzhy K. & Li Sze Lim &
Michael J. Thomson & Md. Kairudin Narimah &
Md. Zain Abdullah
Published online: 17 January 2012# Springer-Verlag 2012
Abstract A backcross breeding strategy was used to identifyquantitative trait loci (QTLs) associated with 14 traits in aBC2F2 population derived from a cross between MR219, anindica rice cultivar and an accession ofOryza rufipogon (IRGC105491). A total of 261 lines were genotyped with 96 micro-satellite markers and evaluated for plant morphology, yieldcomponents and growth period. The genetic linkage map gen-erated for this population with an average interval size of16.2 cM, spanning 1,553.4 cM (Kosambi) of the rice genome.Thirty-eight QTLs were identified with composite interval map-ping (CIM), whereas simple interval mapping (SIM) resulted in47 QTLs (LOD >3.0). The O. rufipogon allele was favourablefor 59% of QTLs detected through CIM. Of 261 BC2F2 fami-lies, 26 advanced backcross breeding lines (BC2F5) were usedfor QTL validation. These lines were selected on the basis of the
yield traits potentiality in BC2F3 and BC2F4 generations. Thefield trial was conducted at three different locations in Malaysiausing randomized complete block designwith three replications.Trait based marker analysis was done for QTL determination.Twenty-five QTLs were detected in BC2F5 generation whereas29 QTLs were detected in BC2F2 generation of the same pop-ulation. TwoQTLs (qPL-1 and qSPL-7) were not considered forvalidation due to their low R2 values and two QTLs (qPSS-3-2and qGW-3-2) were not detected in the BC2F5 population.Fifteen QTLs showed the beneficial effect to enhance thetrait value of the breeding lines. QTL validation aided toselect the promising lines for further utilization.
Keyword Backcross breeding . Composite intervalmapping .Oryza rufipogon .Oryza sativa . QTLidentification . QTL validation . Trait-based marker analysis
Introduction
The Asian cultivated rice (Oryza sativa L.) is an economicallyimportant crop that is a staple food for more than one-half ofthe world’s population. The world’s rice production is inade-quate and has been on a plateau in recent years despite manyadvances in conventional rice breeding. Domestication andlater on intensive breeding have further caused a geneticbottleneck of modern rice cultivars. The wild relatives in thegenus Oryza represent a valuable source of novel geneticvariation in rice that can be used to broaden the geneticbackground of cultivated rice in breeding programs (Brarand Khush 1997; Tanksley and McCouch 1997). Inter-specific hybridization of genetically divergent parents offersa way of widening the gene pool of cultivated rice and
R. Wickneswari (*) :M. A. R. Bhuiyan : L. S. Lim :M. K. NarimahSchool of Environmental and Natural Resource Sciences, Facultyof Science and Technology, Universiti Kebangsaan Malaysia,43600 Bangi, Selangor, Malaysiae-mail: [email protected]
S. Kalluvettankuzhy K.Jawaharlal Nehru Tropical Botanic Garden& Research Institute (JNTBGRI),Palode,Thiruvananthapuram 695562, India
M. J. ThomsonCrop and Environmental Sciences Division,International Rice Research Institute,Los Baños, Laguna, Philippines
M. Z. AbdullahUniversiti Malaysia Terengganu (UMT),21030 Kuala Terengganu, Terengganu, Malaysia
Plant Mol Biol Rep (2012) 30:929–939DOI 10.1007/s11105-011-0404-4
Author's personal copy

broadening the range of genetic variation available for plantimprovement. Hybridization programmes played active rolein rice to introduce qualitative characters from wild species orresistant lines into the elite breeding material, such as diseaseand insect resistance, male sterility (Brar andKhush 1997; Zhaoet al. 2010; Ashkani et al. 2011) and pericarp colour (Bhuiyan etal. 2011). Quantitative traits have been targeted in inter-specificcrossing programs (Tanksley and McCouch 1997) to introducethe genes from exotic sources for further improvement ofyield and yield related traits, which has been successful inmany crop species (Xiao et al. 1998; Zhao et al. 2010; Liuet al. 2011) reported that even though O. rufipogon is pheno-typically inferior for all of important traits, transgressive seg-regants outperformed over the O. sativa background cultivar.
The advanced backcross quantitative trait locus (AB-QTL) strategy was proposed by Tanksley and Nelson(1996) to simultaneously identify and transfer agronomical-ly useful QTLs from wild relatives of crops to their culti-vated counterparts to increase the genetic base available tobreeders. Although crop wild relatives may seem to havelittle agronomic value due to their low yield and weedycharacters, the AB-QTL strategy can identify “hiddenalleles” from the wild species that can increase the yieldpotential of cultivated cultivars (Tanksley and McCouch1997). Common wild rice (Oryza rufipogon Griff.) exhibitssignificant genetic diversity (Ngu et al. 2010) and has manyuseful genes which can improve the quality and yield po-tential of cultivated japonica and indica rice (Moncada et al.2001; Septiningsih et al. 2003; Thomson et al. 2003; Xiao etal. 1998). This study focuses primarily on the agronomictraits of the O. rufipogon accession IRGC 105491 to en-hance the grain yield of an elite Malaysian rice cultivar(MR219) of O. sativa ssp. indica. QTLs for different agro-nomic traits were identified in the BC2F2 population and thepopulation was phenotyped in the successive generations, i.e., BC2F3 and BC2F4 generation. On the basis of superioryield trait and phenotypic appearance, 26 advanced breed-ing lines were identified for QTL validation in BC2F5 gen-eration. The objectives of this study were: (1) to identifychromosomal regions of the rice genome controlling agro-nomic traits of interest; (2) to identify trait-enhancing allelesfrom O. rufipogon in a O. sativa ssp. indica background toprovide potentially useful breeding materials; (3) to deter-mine whether the same region affects more than one trait;(4) to validate the QTLs in selected advanced breeding lines.
Materials and Methods
Population Development, Field Trials and Trait Evaluation
The wild accession O. rufipogon and a Malaysian highyielding rice cultivar (MR219) were used in the crossing
program to develop BC2F2 population to enhance the traitpotentiality on yield components and growth period in therecurrent parent (Sabu et al. 2006). The cultivar MR219 wasused as the female recurrent parent and O. rufipogon wasused as the donor parent.
Microsatellite Marker Analysis for QTL Identification
Fresh leaves from ten individuals from each of 261 BC2F2families and two parents were used to extract DNA follow-ing a modified choloroform-based DNA extraction protocolby Murray and Thompson (1980). Microsatellite markerswere selected at approximately 15–20 cM interval across therice genome based on the published rice microsatellite frame-work map by Chen et al. (1997), Temnykh et al. (2000) andthe consolidated marker data by the International RiceMicrosatellite Initiative (IRMI) (McCouch et al. 2002).Markers were screened using two parents and were used insubsequent genotyping of the BC2F2 families. PCR conditionswere as described by Panaud et al. (1996) with the followingmodifications: the total reaction volume was scaled down to12.5 μl with a final reaction of 5 ng template DNA and 0.5unit Taq polymerase and a concentration of 0.2 μM of eachprimer, 100 μM of each dNTP, 1.5 mM MgCl2 and 1× PCRreaction buffer. The following thermalcycle profile was used:94°C for 5 min, followed by 35 cycles of 94°C for 30 s, 55°Cfor 30 s, and 72°C for 30 s, and lastly 5 min at 72°C. For somespecific cDNA-derived microsatellite markers, two differentannealing temperatures, 61°C and 67°C, were employed asdescribed by Temnykh et al. (2000). The forward primerswere fluorescently-labelled at 5′-end with either 6-FAM,VIC, NED or PET dye and incorporated into PCR for frag-ment detection using capillary separation on the ABI3100Genetic Analyzer (Applied Biosystems). Fragment lengthswere estimated with GeneScan Analysis Software and laterscored using Genotyper (Applied Biosystems).
Linkage Map Construction and Statistical Analysis
The linkage map was constructed based on segregation ofthe microsatellite marker loci using QGENE ver.4.3.8(Joehanes and Nelson 2008). Marker order was confirmedusing the complete genome sequence and sequencing resultsand physical distances based on Genome Annotation ver.3.Normality test was conducted and correlation among thetraits was also calculated.
Analysis for QTL Identification
The chromosomal location of QTLs was identified usinginterval mapping (IM) and composite interval mapping(CIM) in QGENE (Joehanes and Nelson 2008). The follow-ing parameters were selected for the mapping: the BC2F2
930 Plant Mol Biol Rep (2012) 30:929–939
Author's personal copy
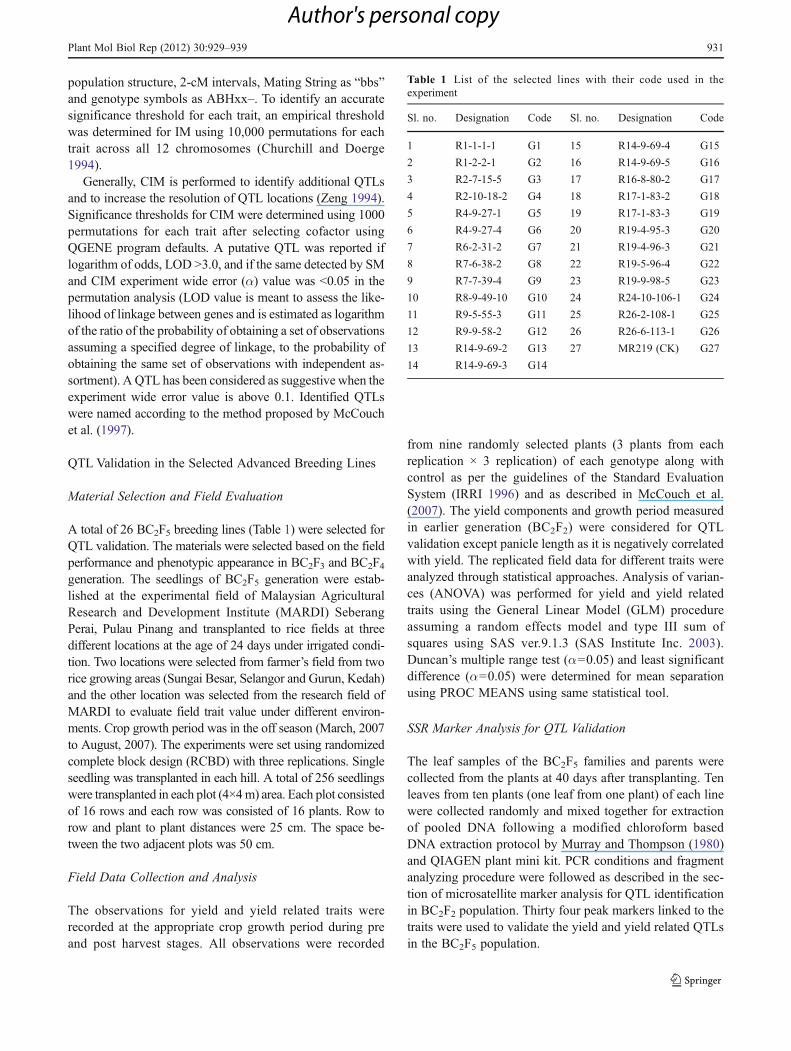
population structure, 2-cM intervals, Mating String as “bbs”and genotype symbols as ABHxx–. To identify an accuratesignificance threshold for each trait, an empirical thresholdwas determined for IM using 10,000 permutations for eachtrait across all 12 chromosomes (Churchill and Doerge1994).
Generally, CIM is performed to identify additional QTLsand to increase the resolution of QTL locations (Zeng 1994).Significance thresholds for CIM were determined using 1000permutations for each trait after selecting cofactor usingQGENE program defaults. A putative QTL was reported iflogarithm of odds, LOD >3.0, and if the same detected by SMand CIM experiment wide error (α) value was <0.05 in thepermutation analysis (LOD value is meant to assess the like-lihood of linkage between genes and is estimated as logarithmof the ratio of the probability of obtaining a set of observationsassuming a specified degree of linkage, to the probability ofobtaining the same set of observations with independent as-sortment). A QTL has been considered as suggestive when theexperiment wide error value is above 0.1. Identified QTLswere named according to the method proposed by McCouchet al. (1997).
QTL Validation in the Selected Advanced Breeding Lines
Material Selection and Field Evaluation
A total of 26 BC2F5 breeding lines (Table 1) were selected forQTL validation. The materials were selected based on the fieldperformance and phenotypic appearance in BC2F3 and BC2F4generation. The seedlings of BC2F5 generation were estab-lished at the experimental field of Malaysian AgriculturalResearch and Development Institute (MARDI) SeberangPerai, Pulau Pinang and transplanted to rice fields at threedifferent locations at the age of 24 days under irrigated condi-tion. Two locations were selected from farmer’s field from tworice growing areas (Sungai Besar, Selangor and Gurun, Kedah)and the other location was selected from the research field ofMARDI to evaluate field trait value under different environ-ments. Crop growth period was in the off season (March, 2007to August, 2007). The experiments were set using randomizedcomplete block design (RCBD) with three replications. Singleseedling was transplanted in each hill. A total of 256 seedlingswere transplanted in each plot (4×4m) area. Each plot consistedof 16 rows and each row was consisted of 16 plants. Row torow and plant to plant distances were 25 cm. The space be-tween the two adjacent plots was 50 cm.
Field Data Collection and Analysis
The observations for yield and yield related traits wererecorded at the appropriate crop growth period during preand post harvest stages. All observations were recorded
from nine randomly selected plants (3 plants from eachreplication × 3 replication) of each genotype along withcontrol as per the guidelines of the Standard EvaluationSystem (IRRI 1996) and as described in McCouch et al.(2007). The yield components and growth period measuredin earlier generation (BC2F2) were considered for QTLvalidation except panicle length as it is negatively correlatedwith yield. The replicated field data for different traits wereanalyzed through statistical approaches. Analysis of varian-ces (ANOVA) was performed for yield and yield relatedtraits using the General Linear Model (GLM) procedureassuming a random effects model and type III sum ofsquares using SAS ver.9.1.3 (SAS Institute Inc. 2003).Duncan’s multiple range test (α00.05) and least significantdifference (α00.05) were determined for mean separationusing PROC MEANS using same statistical tool.
SSR Marker Analysis for QTL Validation
The leaf samples of the BC2F5 families and parents werecollected from the plants at 40 days after transplanting. Tenleaves from ten plants (one leaf from one plant) of each linewere collected randomly and mixed together for extractionof pooled DNA following a modified chloroform basedDNA extraction protocol by Murray and Thompson (1980)and QIAGEN plant mini kit. PCR conditions and fragmentanalyzing procedure were followed as described in the sec-tion of microsatellite marker analysis for QTL identificationin BC2F2 population. Thirty four peak markers linked to thetraits were used to validate the yield and yield related QTLsin the BC2F5 population.
Table 1 List of the selected lines with their code used in theexperiment
Sl. no. Designation Code Sl. no. Designation Code
1 R1-1-1-1 G1 15 R14-9-69-4 G15
2 R1-2-2-1 G2 16 R14-9-69-5 G16
3 R2-7-15-5 G3 17 R16-8-80-2 G17
4 R2-10-18-2 G4 18 R17-1-83-2 G18
5 R4-9-27-1 G5 19 R17-1-83-3 G19
6 R4-9-27-4 G6 20 R19-4-95-3 G20
7 R6-2-31-2 G7 21 R19-4-96-3 G21
8 R7-6-38-2 G8 22 R19-5-96-4 G22
9 R7-7-39-4 G9 23 R19-9-98-5 G23
10 R8-9-49-10 G10 24 R24-10-106-1 G24
11 R9-5-55-3 G11 25 R26-2-108-1 G25
12 R9-9-58-2 G12 26 R26-6-113-1 G26
13 R14-9-69-2 G13 27 MR219 (CK) G27
14 R14-9-69-3 G14
Plant Mol Biol Rep (2012) 30:929–939 931
Author's personal copy
Results
Correlation Analysis Among the Traits
Table 2 shows the correlation coefficients among varioustraits in BC2F2 population. Correlation analysis revealed thehighest correlation positive value (r01.00, p<0.001) fortiller per plant vs. panicle per plant followed by spikeletper plant vs. grains per plant (r00.81, p<0.001). Some ofthe traits showed negative correlation in the population, e.g.,grain weight vs. grains per plant (r0−0.17).
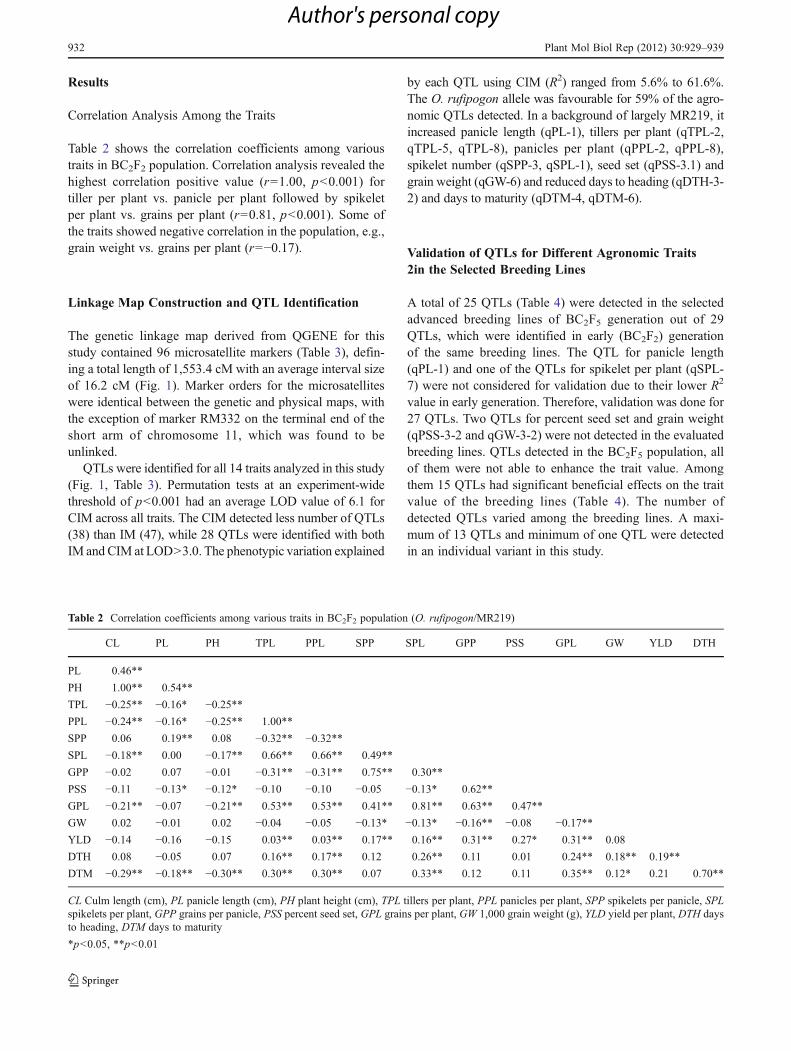
Linkage Map Construction and QTL Identification
The genetic linkage map derived from QGENE for thisstudy contained 96 microsatellite markers (Table 3), defin-ing a total length of 1,553.4 cM with an average interval sizeof 16.2 cM (Fig. 1). Marker orders for the microsatelliteswere identical between the genetic and physical maps, withthe exception of marker RM332 on the terminal end of theshort arm of chromosome 11, which was found to beunlinked.
QTLs were identified for all 14 traits analyzed in this study(Fig. 1, Table 3). Permutation tests at an experiment-widethreshold of p<0.001 had an average LOD value of 6.1 forCIM across all traits. The CIM detected less number of QTLs(38) than IM (47), while 28 QTLs were identified with bothIM and CIM at LOD>3.0. The phenotypic variation explained
by each QTL using CIM (R2) ranged from 5.6% to 61.6%.The O. rufipogon allele was favourable for 59% of the agro-nomic QTLs detected. In a background of largely MR219, itincreased panicle length (qPL-1), tillers per plant (qTPL-2,qTPL-5, qTPL-8), panicles per plant (qPPL-2, qPPL-8),spikelet number (qSPP-3, qSPL-1), seed set (qPSS-3.1) andgrain weight (qGW-6) and reduced days to heading (qDTH-3-2) and days to maturity (qDTM-4, qDTM-6).
Validation of QTLs for Different Agronomic Traits2in the Selected Breeding Lines
A total of 25 QTLs (Table 4) were detected in the selectedadvanced breeding lines of BC2F5 generation out of 29QTLs, which were identified in early (BC2F2) generationof the same breeding lines. The QTL for panicle length(qPL-1) and one of the QTLs for spikelet per plant (qSPL-7) were not considered for validation due to their lower R2
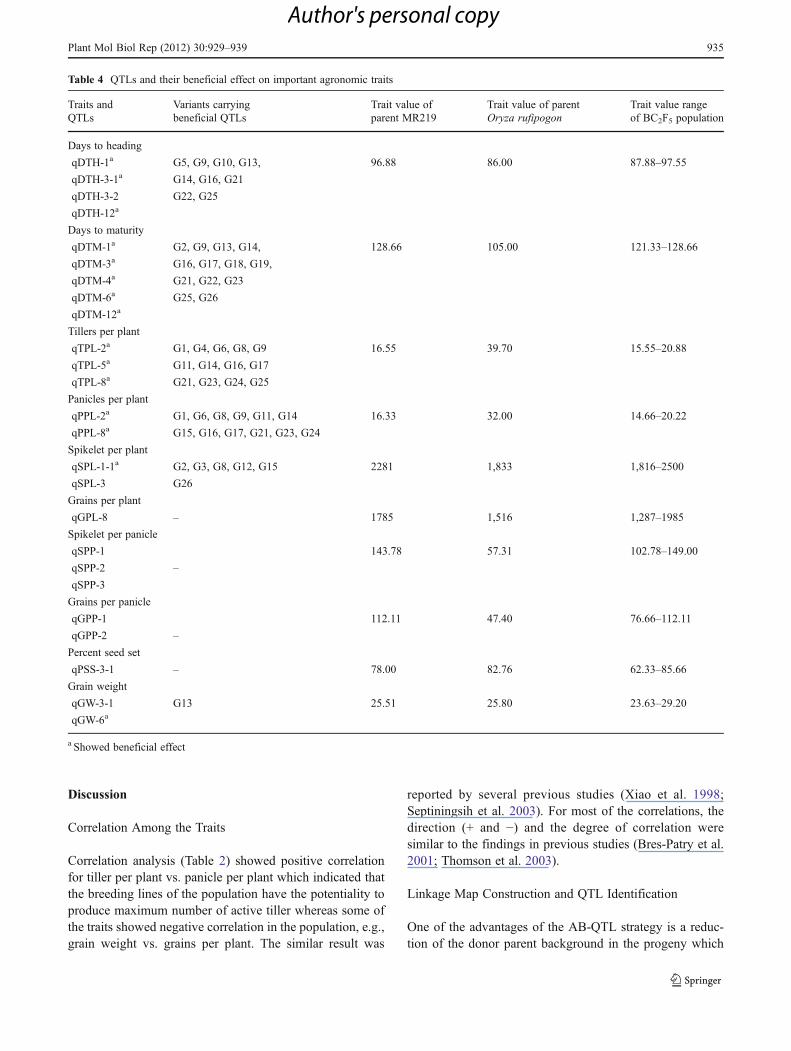
value in early generation. Therefore, validation was done for27 QTLs. Two QTLs for percent seed set and grain weight(qPSS-3-2 and qGW-3-2) were not detected in the evaluatedbreeding lines. QTLs detected in the BC2F5 population, allof them were not able to enhance the trait value. Amongthem 15 QTLs had significant beneficial effects on the traitvalue of the breeding lines (Table 4). The number ofdetected QTLs varied among the breeding lines. A maxi-mum of 13 QTLs and minimum of one QTL were detectedin an individual variant in this study.
Table 2 Correlation coefficients among various traits in BC2F2 population (O. rufipogon/MR219)
CL PL PH TPL PPL SPP SPL GPP PSS GPL GW YLD DTH
PL 0.46**
PH 1.00** 0.54**
TPL −0.25** −0.16* −0.25**
PPL −0.24** −0.16* −0.25** 1.00**
SPP 0.06 0.19** 0.08 −0.32** −0.32**
SPL −0.18** 0.00 −0.17** 0.66** 0.66** 0.49**
GPP −0.02 0.07 −0.01 −0.31** −0.31** 0.75** 0.30**
PSS −0.11 −0.13* −0.12* −0.10 −0.10 −0.05 −0.13* 0.62**
GPL −0.21** −0.07 −0.21** 0.53** 0.53** 0.41** 0.81** 0.63** 0.47**
GW 0.02 −0.01 0.02 −0.04 −0.05 −0.13* −0.13* −0.16** −0.08 −0.17**
YLD −0.14 −0.16 −0.15 0.03** 0.03** 0.17** 0.16** 0.31** 0.27* 0.31** 0.08
DTH 0.08 −0.05 0.07 0.16** 0.17** 0.12 0.26** 0.11 0.01 0.24** 0.18** 0.19**
DTM −0.29** −0.18** −0.30** 0.30** 0.30** 0.07 0.33** 0.12 0.11 0.35** 0.12* 0.21 0.70**
CL Culm length (cm), PL panicle length (cm), PH plant height (cm), TPL tillers per plant, PPL panicles per plant, SPP spikelets per panicle, SPLspikelets per plant, GPP grains per panicle, PSS percent seed set, GPL grains per plant, GW 1,000 grain weight (g), YLD yield per plant, DTH daysto heading, DTM days to maturity
*p<0.05, **p<0.01
932 Plant Mol Biol Rep (2012) 30:929–939
Author's personal copy
Table 3 QTLs for agronomic traits detected in the BC2F2 population analyzed through composite interval mapping (CIM) using 96 SSR markers
Sl. no. QTL Chr Marker interval Increased effect LOD R2 Add effect p α Peak marker
Plant morphology
Culm length (CL)
1. qCL-1-1 1 RM403–RM297 MR219 4.3 7.2 15.5 0.001 0.10 RM403
2. qCL-1-2 1 RM431 O.R. 23.8 34.3 11.9 0.001 0.01 RM431
3. qCL-3 3 RM60–RM517 O.R. 6.4 10.6 −9.3 0.001 0.01 RM231
4. qCL-9 9 RM105 O.R. 4.6 7.8 −3.6 0.001 0.10 RM105
Total 59.9
Plant height (PH)
5. qPH-1-1 1 RM493–RM488 O.R. 5.2 8.7 −16.6 0.001 0.05 RM493
6. qPH-1-2 1 RM431 O.R. 23.9 34.4 11.9 0.001 0.01 RM431
7. qPH-3 3 RM60–RM517 O.R. 6.4 10.7 −10.0 0.001 0.01 RM60
8. qPH-9 9 RM105 O.R. 4.6 7.8 −3.6 0.001 0.10 RM105
Total 61.6
Yield components
Panicle length (PL)
9. qPL-1 1 RM431 O.R. 7.2 11.9 0.3 0.001 0.10 RM431
Tillers per plant (TPL)
10. qTPL-2 2 RM250–RM266 O.R. 7.1 11.8 −2.2 0.001 0.01 RM208
11. qTPL-5 5 RM540 O.R. 3.3 5.7 −0.3 0.001 0.10 RM540
12. qTPL-8 8 RM25–RM344 O.R. 4.2 7.1 −1.1 0.001 0.05 RM25
Total 24.6
Panicles per plant (PPL)
13. qPPL-2 2 RM250–RM266 O.R. 7.6 12.6 1.9 0.001 0.01 RM208
14. qPPL-8 8 RM25–RM344 O.R. 3.5 6.0 −0.2 0.001 0.10 RM25
Total 18.6
Spikelets per panicle (SPP)
15. qSPP-1 1 RM428–RM294 MR219 8.4 13.7 5.2 0.001 0.01 RM259
16. qSPP-2 2 RM250–RM266 MR219 5.0 8.4 12.5 0.001 0.01 RM266
17. qSPP-3 3 RM231–RM157 O.R. 5.6 9.4 −7.9 0.001 0.01 RM517
Total 31.5
Spikelets per plant (SPL)
18. qSPL-1 1 RM259–RM294 O.R. 4.4 7.5 −208.0 0.001 0.01 RM259
19. qSPL-3 3 RM60–RM231 MR219 3.9 6.6 653.2 0.001 0.05 RM231
20. qSPL-7 7 RM11–RM234 MR219 3.3 5.6 180.0 0.001 0.10 RM11
Total 19.7
Grains per panicle (GPP)
21. qGPP-1 1 RM428–RM294 MR219 5.1 8.6 5.2 0.001 0.05 RM259
22 qGPP-2 2 RM208–RM266 MR219 3.7 6.4 13.6 0.001 0.05 RM208
Total 15
Grains per plant (GPL)
23. qGPL-8 8 RM25–RM339 MR219 4.1 7.0 143.0 0.001 0.05 RM344
Percent seed set (PSS)
24. qPSS-3-1 3 RM157–RM7 O.R. 4.6 7.8 −4.4 0.001 0.01 RM157
25. qPSS-3-2 3 RM156–RM532 MR219 4.5 7.7 33.4 0.001 0.01 RM156
Total 15.5
Grain weight (GW)
26. qGW-3-1 3 RM231–RM517 MR219 3.3 5.6 2.3 0.001 0.10 RM231
27. qGW-3-2 3 RM554–RM532 MR219 4.4 7.4 2.3 0.001 0.01 RM156
28. qGW-6 6 RM540–RM585 O.R. 5.7 9.6 −0.4 0.001 0.01 RM587
Total 22.6
Plant Mol Biol Rep (2012) 30:929–939 933
Author's personal copy
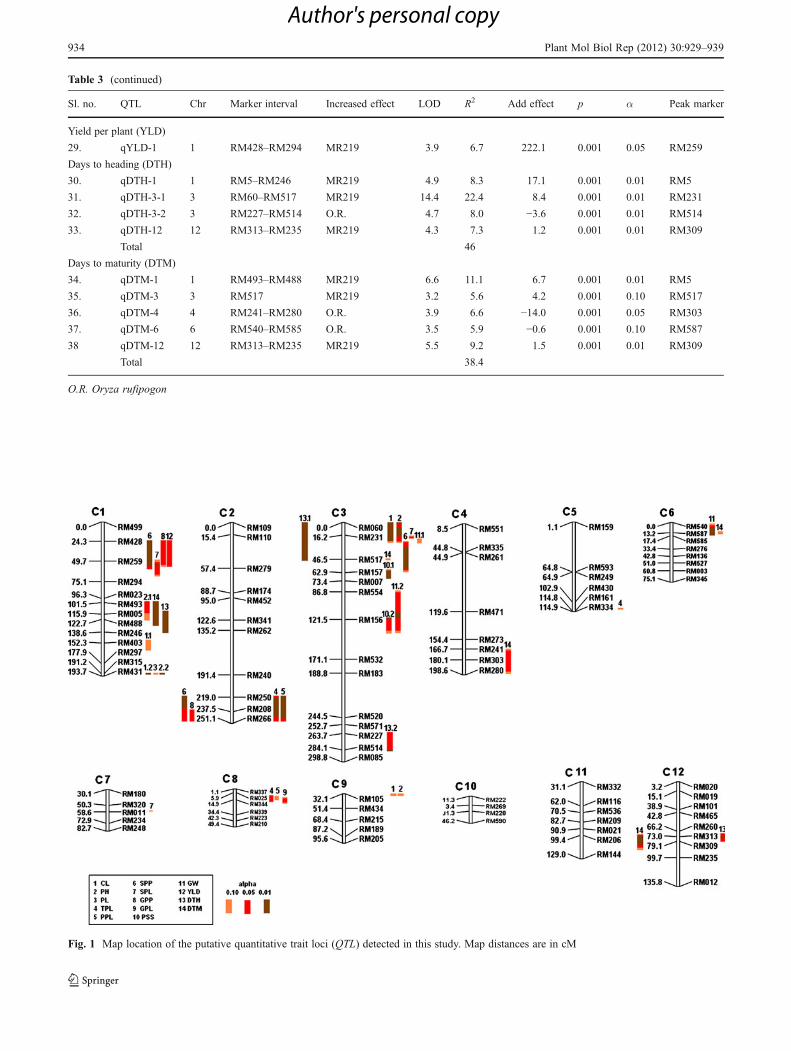
Table 3 (continued)
Sl. no. QTL Chr Marker interval Increased effect LOD R2 Add effect p α Peak marker
Yield per plant (YLD)
29. qYLD-1 1 RM428–RM294 MR219 3.9 6.7 222.1 0.001 0.05 RM259
Days to heading (DTH)
30. qDTH-1 1 RM5–RM246 MR219 4.9 8.3 17.1 0.001 0.01 RM5
31. qDTH-3-1 3 RM60–RM517 MR219 14.4 22.4 8.4 0.001 0.01 RM231
32. qDTH-3-2 3 RM227–RM514 O.R. 4.7 8.0 −3.6 0.001 0.01 RM514
33. qDTH-12 12 RM313–RM235 MR219 4.3 7.3 1.2 0.001 0.01 RM309
Total 46
Days to maturity (DTM)
34. qDTM-1 1 RM493–RM488 MR219 6.6 11.1 6.7 0.001 0.01 RM5
35. qDTM-3 3 RM517 MR219 3.2 5.6 4.2 0.001 0.10 RM517
36. qDTM-4 4 RM241–RM280 O.R. 3.9 6.6 −14.0 0.001 0.05 RM303
37. qDTM-6 6 RM540–RM585 O.R. 3.5 5.9 −0.6 0.001 0.10 RM587
38 qDTM-12 12 RM313–RM235 MR219 5.5 9.2 1.5 0.001 0.01 RM309
Total 38.4
O.R. Oryza rufipogon
Fig. 1 Map location of the putative quantitative trait loci (QTL) detected in this study. Map distances are in cM
934 Plant Mol Biol Rep (2012) 30:929–939
Author's personal copy
Discussion
Correlation Among the Traits
Correlation analysis (Table 2) showed positive correlationfor tiller per plant vs. panicle per plant which indicated thatthe breeding lines of the population have the potentiality toproduce maximum number of active tiller whereas some ofthe traits showed negative correlation in the population, e.g.,grain weight vs. grains per plant. The similar result was
reported by several previous studies (Xiao et al. 1998;Septiningsih et al. 2003). For most of the correlations, thedirection (+ and −) and the degree of correlation weresimilar to the findings in previous studies (Bres-Patry et al.2001; Thomson et al. 2003).
Linkage Map Construction and QTL Identification
One of the advantages of the AB-QTL strategy is a reduc-tion of the donor parent background in the progeny which
Table 4 QTLs and their beneficial effect on important agronomic traits
Traits andQTLs
Variants carryingbeneficial QTLs
Trait value ofparent MR219
Trait value of parentOryza rufipogon
Trait value rangeof BC2F5 population
Days to heading
qDTH-1a G5, G9, G10, G13, 96.88 86.00 87.88–97.55
qDTH-3-1a G14, G16, G21
qDTH-3-2 G22, G25
qDTH-12a
Days to maturity
qDTM-1a G2, G9, G13, G14, 128.66 105.00 121.33–128.66
qDTM-3a G16, G17, G18, G19,
qDTM-4a G21, G22, G23
qDTM-6a G25, G26
qDTM-12a
Tillers per plant
qTPL-2a G1, G4, G6, G8, G9 16.55 39.70 15.55–20.88
qTPL-5a G11, G14, G16, G17
qTPL-8a G21, G23, G24, G25
Panicles per plant
qPPL-2a G1, G6, G8, G9, G11, G14 16.33 32.00 14.66–20.22
qPPL-8a G15, G16, G17, G21, G23, G24
Spikelet per plant
qSPL-1-1a G2, G3, G8, G12, G15 2281 1,833 1,816–2500
qSPL-3 G26
Grains per plant
qGPL-8 – 1785 1,516 1,287–1985
Spikelet per panicle
qSPP-1 143.78 57.31 102.78–149.00
qSPP-2 –
qSPP-3
Grains per panicle
qGPP-1 112.11 47.40 76.66–112.11
qGPP-2 –
Percent seed set
qPSS-3-1 – 78.00 82.76 62.33–85.66
Grain weight
qGW-3-1 G13 25.51 25.80 23.63–29.20
qGW-6a
a Showed beneficial effect
Plant Mol Biol Rep (2012) 30:929–939 935
Author's personal copy
would limit the presence of negative phenotypes that mayotherwise mask positive QTLs from the wild relative. In thepresent study, minimal selection has been carried out whichhas the advantage of providing more statistical power to detectQTLs due to the presence of a larger number of O. rufipogonalleles. Accordingly, about 19% heterozygous genotypes wasobtained using the 96 markers among the BC2F2 families.Furthermore, a considerable amount of additive genetic vari-ation was found in these families (Sabu et al. 2006). Xiao et al.(1998) reported that 15%, 14% and 56% of the BC2 testcrossfamilies outperformed the commercial hybrid (V29A/Ce64)with respect to grain yield, grains per plant and 1,000 grainweight, respectively. For the same traits, 62.8%, 3.4% and74.8% of the BC2F2 families outperformed the recurrent fe-male parent, MR219. This could be attributed to the fact thateven though O. rufipogon is inferior in most of the traitsanalyzed, it positively contributed to yield enhancement inthe BC2F2 families.
The size of the donor chromosome segments determinesthe degree of linkage drag in a segregating population (Stamand Zeven 1981). QTL mapping resolution increased withshorter donor segments. Introgression of larger segmentsfrom O. rufipogon resulting from this study may presentproblems with regard to linkage drag. Negative traits maystill be linked to regions containing trait-enhancing QTLs.Therefore, for the development of any near-isogenic line(NIL), the smallest available introgression should be chosenin target regions. Selection for new recombination events insubsequent generations should be made to reduce any intro-gression and increase the resolution for the specific targetedQTLs. A large amount of variation was observed betweenthe two parents for most of the traits. In most cases, trans-gressive progenies that fell beyond the high or low mean ofthe two parents were observed. Transgressive segregationsuggested positive genotype × genotype variation where O.rufipogon alleles were found to augment performance in alargely MR219 genetic background. Although none of theprogenies had an earlier maturity date than the O. rufipogonparent, most of them matured earlier than the MR219 parentwith an average earlier maturity of 2 days.
Using CIM, lower number of QTLs were detected andthis was attributed to the use of cofactors that removedeffects of other background QTLs, thus filtering out thoseweak QTLs. Similarly, Moncada et al. (2001) reported lesserQTLs being detected with CIM than IM, althoughSeptiningsih et al. (2003) reported the opposite. By addingmore markers or using other methods (Li et al. 2011), theprobability and speed of detecting additional QTLs could beincreased. The percentage of beneficial alleles detected fromO. rufipogon is comparable to the percentages reported inprevious studies using the same donor parent by Xiao et al.(1998), Moncada et al. (2001) and Thomson et al. (2003)with the O. rufipogon alleles accounting for 51%, 56% and
53% of the beneficial alleles, respectively. A lower value of33% was however observed by Septiningsih et al. (2003).
Plant Morphology
Although O. rufipogon has a longer culm and is taller thanMR219 overall, QTL alleles from O. rufipogon conferred areduction in culm length and plant height. This representspositive alleles from O. rufipogon which could be utilized inbreeding programmes. QTLs for culm length qCL-1-2 andplant height qPH-1-2 contributed to the largest effect (R2
was 34.3 and 34.4) for each trait with LOD values of 23.8and 23.9, respectively. Interestingly, they were clustered inthe same region which corresponds to sd-1, a semidwarfgene which has been previously reported (Monna et al.2002; Sasaki et al. 2002). Over the years, QTLs for plantheight have consistently been detected in this same region inrice crosses involving different parents and environments(Moncada et al. 2001; Shen et al. 2001; Venuprasad et al.2002; Septiningsih et al. 2003; Thomson et al. 2003;).Coincidental map locations of QTLs and major genes whichaffect the same trait support the hypothesis that QTLs areallelic with major genes affecting the same trait (Robertson1985).
Yield Components
Even though transgressive segregation was observed inother yield component traits, O. rufipogon introgressionsincreasing yield per plant were not identified. Due to thelow degree of molecular marker saturation, there may not beenough markers to detect the fragment between two allelesfrom O. sativa. Alternatively, two or more loci controllingdifferent traits may be so closely linked that they are notmapped, resulting in the detection of only QTLs with largephenotypic effects. Most QTLs which affect yield probablyhave smaller effects which are undetected at the thresholdset for QTL declaration. Even though yield-improvingalleles from O. rufipogon were not identified, presence oftransgressive BC2F2 families for yield component traits maymean that they were caused by introgressed genes that werenot detected by QTL analysis. Grain weight was negativelycorrelated with other four major yield traits such as grainsper plant, grains per panicle, spikelets per plant and spikeletsper panicle (Table 3). Although these are components ofgrain yield, there were no similarities in the locations ofsignificant QTLs detected for grain weight and the otherfour traits (Fig. 1). This could be due to the effect of twoQTLs acting in opposite directions at the same location,eliminating any significant effect. Though panicles per plantand tillers per plant are highly correlated (Table 3), O.rufipogon alleles seem to act in opposite directions in acommon region on chromosome 2 (Table 4). The alleles
936 Plant Mol Biol Rep (2012) 30:929–939
Author's personal copy

from the wild rice increased panicles per plant at qPPL-2 butreduced tillers per plant at qTPL-2. Pleiotropic effect couldbe a contributing factor in this regard. Alternatively, if twoor more loci controlling different traits are closely linked,using larger segregating populations and continuous markersaturation of such regions can break the linkage, allowingselection for different traits. This could be carried outthrough selection of the best NILs and backcrossing themwith the recurrent MR219 parent. Thus, the possibility ofgenerating better lines for rice breeding will be increased.Moreover, the superiority of the identified BC2F2 familiesdue to the O. rufipogon alleles can be confirmed by analyz-ing the NILs. This will show whether the allelic effects werereal or were due to heterosis at the introgressed loci. Someof the beneficial alleles from O. rufipogon are directly usefulfor breeding purposes. QTLs for panicle length (qPL-1),tillers per plant (qTPL-5), days to heading (qDTH-3-2) anddays to maturity (qDTM-4) have beneficial effects from O.rufipogon improving the traits without being linked to anydeleterious QTLs. However, some of the potentially benefi-cial alleles were linked to negative agronomic character-istics. Although the O. rufipogon allele increased paniclelength at qPL-1, the same allele was also associated withincreased culm length (qCL-1-2) and plant height (qPH-1-2)at the same region. In this case, it is important in theimprovement process to be careful to avoid selecting nega-tive characteristics together with the beneficial ones. Iflinkage drag can be broken, the positive QTLs from O.rufipogon represent potentially useful materials for breed-ing. Moreover, QTLs with small effects can be combined inthe development of NILs. This can then be tested for QTL ×QTL interactions as a foundation for identifying those thatprovide positive effects.
Growth Period
The donor parent O. rufipogon matures earlier than MR219.The O. rufipogon allele contributed to earlier heading andmaturity at qDTH-3.2, qDTM-4 and qDTM-6. The O. rufi-pogon-derived QTL for earliness in heading was alsodetected by Kohn et al. (1997), Cai and Morishima (2002)and Thomson et al. (2003). However in their study therecurrent parent had matured earlier. This may be due togenotypic or environmental effects on inheritance of flower-ing time as demonstrated by QTL studies in other plants likeapricot (Campoy et al. 2011).
Comparison with Other Wild Rice QTL StudiesUsing the Same Donor Parent
McCouch et al. (2007) reported four other rice QTL studiesusing the same accession of O. rufipogon (IRGC 105491) asthe donor parent. These studies used different elite cultivars
as the recurrent parents, including V20A/Ce64, an eliteChinese hybrid cultivar (Xiao et al. 1998), Caiapo, an up-land japonica rice cultivar from Brazil (Moncada et al.2001), Jefferson, an elite tropical japonica rice cultivar fromthe United States (Thomson et al. 2003), and an elite indicarice cultivar from Indonesia, IR64 (Septiningsih et al. 2003).These studies enable comparisons to be made to identify O.rufipogon-derived alleles that are expressed across environ-ments and genetic backgrounds. O. rufipogon alleles gavean increased effect in plant height at qPH-1.2 in this study.The same effect was reported at ph1.1 in the advancedbackcross populations derived from Caiapo/O. rufipogon(Moncada et al. 2001), IR64/O. rufipogon (Septiningsih etal. 2003) and V20A/Ce64/O. rufipogon (Xiao et al. 1998)and reported as ph1.2 in the Jefferson/O. rufipogon advancedbackcross population (Thomson et al. 2003) also with thesame effect. qDTH-11 coincides with dth11.1 from the IR64background with similar allelic effect. At qSPP-1, a decreasein spikelets per plant is seen from the influence of the O.rufipogon allele. A similar effect is seen in the Jeffersonbackground at the same genomic location. qDTH-3-2 reportedhere coincides with dth1.1 from Thomson et al. (2003) anddth3.1 in the Caiapo (Moncada et al. 2001) and Jefferson(Thomson et al. 2003) genetic backgrounds with the sameallelic effect, i.e., theO. rufipogon allele causes earlier flower-ing. While theO. rufipogon alleles control earliness in flower-ing in the MR219 genetic background they seem to behavedifferently in the Caiapo and Jefferson backgrounds with theO. rufipogon alleles influencing lateness in flowering. Thismay be the result of a genotype by genotype or genotype byenvironment interaction.
Validation of QTLs for Different Agronomic Traitsin the Selected Breeding Lines
The QTLs identified in the BC2F5 generation controlled thetraits for yield component and growth period. Two QTLsqPSS-3-2 and qGW-3-2 were not detected in the evaluatedbreeding lines. These QTLs might have been degraded fromthe population during the advancement of the generation asthey were in heterozygous condition. Similar result wasobserved by Foolad et al. (2001), who noted that one majorQTL was not detected in their study which was identified ina previous study to identify salt tolerance QTLs in tomato.Sometimes, the absence of QTL(s) did not indicate poorperformance in the field implying presence of undetectedQTLs. Cho et al. (2007) supported similar results from aninvestigation of QTL evaluation in rice. The detected QTLsshowed an increased or decreased effect either from donorparent or recurrent parent or even from both of the parentsfor the traits. The direction of the effect of the QTLs wasanalyzed using the QTL analysis of BC2F2 population.Whatever be the effect (loss of function or over expression),
Plant Mol Biol Rep (2012) 30:929–939 937
Author's personal copy
the candidate markers identified are useful in validatingtheir function during fine mapping (Swamy and Sarla 2011).
Yield Components
Trait based marker analysis validated three QTLs for tillers perplant (qTPL-2, qTPL-5 and qTPL-8) in the 13 breeding lineswhich significantly enhanced the tiller number in the variants(Table 4). Similarly, two QTLs (qPPL-2, qPPL-8) for paniclesper plant were also validated in 11 breeding lines and both ofthe QTLs significantly increased the trait value (Table 4).Septiningsih et al. (2003) observed in a study, the QTLsqPPL-1-1, qPPL-1-2, qPPL-11-1 and qPPL-11-2 for paniclesper plant on chromosomes 1 and 11 which had the increasedeffect by IR64. Tian et al. (2006) also found two QTLs qPPL-1 and qPPL-2 had the positive effect which increased thepanicle number in Guichao 2, a high yielding commercialindica cultivar. qSPL-1 and qSPL-3 were detected for spike-lets per plant located on chromosomes 1 and 3. The increasedeffect was by O. rufipogon allele for spikelets per plant at onelocus on chromosome 1 and this QTL significantly increasedspikelets per plant in the population (Table 4). Both of thesetwo QTLs were found in the earlier generation (BC2F2). Nosignificant effect of the QTLs for grain per plant, spikelet perpanicle, grain per panicle and percent seed set was found inthe population for the trait value (Table 4). Septiningsih et al.(2003) found the similar result for the QTL on chromosome 3.Three QTLs (qGW-3-1, qGW-3-2 and qGW-6) were detectedin the BC2F2 population. The QTL qGW-6 was identified asthe significant QTL for grain weight in BC2F2 population(Table 4). Eight QTLs were detected for this trait byThomson et al. (2003) on chromosomes 1, 2, 3, 9, 10 and12, which had both increasing and decreasing effect of O.rufipogon.
Growth Period
Four QTLs for days to heading were detected on three chro-mosomes in the BC2F2 population where the O. rufipogonallele contributed to the largest beneficial effect for the trait.The QTL qDTH-3-2 significantly affected on earliness in thepopulation (Table 4). The allele from MR219 for the QTLqDTH-1 cused later heading in the population. Thomson et al.(2003) found that the QTLs for this trait also located onchromosomes 2, 4, 7 and 10 using the U.S. rice cultivarJefferson. Wang et al (2011) found a QTL for days to headingin chromosome 4. Five QTLs for days to maturity weredetected on five chromosomes namely chromosomes 1, 3, 4,6 and 12. The O. rufipogon allele caused earliness at two loci(qDTM-1-1 and qDTM-12) and late maturity at two loci viz.,qDTM-4 and qDTM-6. The QTLs for early maturity werecarried by seven breeding lines. Among these lines G26showed the significant earliness in the phenotypic evaluation
indicating that the QTLs which were carried by the lines isstable (Table 4). Some of the lines, e.g., G23, had the QTLs forboth early and late maturity but phenotypically they showedtheir late maturity. This result might be occured due to thesuperiority of the QTLs (qDTM-3) responsible for the latematurity. Septiningsih et al. (2003) found the QTLs qDTM-7-1 and qDTM-8-1 on chromosomes 7 and 8 were responsiblefor maturity. The O. rufipogon alleles at the QTL on chromo-some 1 was associated with earliness of heading was alsoassociated with earliness of maturity.
Conclusions
QTL clusters with high phenotypic variances and LOD scores,which coincide with QTLs located by other studies on differ-ent rice subspecies and crosses, may indicate the presence ofmajor loci controlling such traits. The precise location of eachQTL can be determined through higher resolution linkagemapping using isogenic lines. Further analysis for precisethe location of the QTL for grain weight is ongoing usingthe isolated isogenic line from the population. Information onthe QTL locations and effects would be helpful for marker-assisted breeding to improve agronomic traits and ultimatelyto increase grain yield. Analysis in different environmentsconfirmed the beneficial effect of the QTLs identified inearlier generation. Out of 25 QTLs, 15, which accounted for55%, were found to have the beneficial effect from O. rufipo-gon for different yield traits. The significant effect of the QTLswas observed in six traits (tillers per plant, panicles per plant,spikelet per plant, grain weight, days to heading and days tomaturity) where ten traits were validated in the population.The breeding lines from the population which carried thesignificant QTLs could be considered for direct use in thevariety development program or could be used as pre-breeding materials to develop new varieties.
Acknowledgements The authors are grateful to the Ministry of Sci-ence, Technology and Innovation (MOSTI) for research grant of thisstudy under the Project Nos. IRPA 01-03-03-001 BTK/ER/01 andUKM-ABI-NBD0001-2007 and express their gratitude to MalaysianAgricultural Research and Development Institute (MARDI) for theresearch facilities. Special thanks to Prof. Dr. Susan McCouch fromCornell University for technical advice on the first mapping populationdevelopment and SSR genotyping.
References
Ashkani S, Rafii MY, Rusli I, Sariah M et al (2011) SSRs for marker-assisted selection for blast resistance in rice (Oryza sativa L.).Plant Mol Biol Rep. doi:10.1007/s11105-011-0315-4 (OnlineFirst)
Bhuiyan MAR, Narimah MK, Abdul Rahim H, Abdullah MZ,Wickneswari R (2011) Transgressive variants for red pericarp
938 Plant Mol Biol Rep (2012) 30:929–939
Author's personal copy
grain with high yield potential derived from Oryza rufipogon ×Oryza sativa: field evaluation, screening for blast disease, QTLvalidation and background marker analysis for agronomic traits.Field Crop Res 121:232–239
Brar DS, Khush GS (1997) Alien introgression in rice. Plant Mol Biol35:35–47
Bres-patry C, Lorieux M, Clement G, Bangratz M, Ghesquiere A (2001)Heredity and genetic mapping of domestication-related traits in atemperate japonica weedy rice. Theor Appl Genet 102:118–126
Cai HW, Morishima H (2002) QTL clusters reflect character associationsin wild and cultivated rice. Theor Appl Genet 104:1217–1228
Campoy JA, Ruiz D, Egea J et al (2011) Inheritance of flowering time inapricot (Prunus armeniaca L.) and analysis of linked quantitativetrait loci (QTLs) using simple sequence repeat (SSR) markers. PlantMol Biol Rep 29:404–410
Chen X, Temnykh S, Xu Y, Cho YG, Mccouch SR (1997) Develop-ment of a microsatellite framework map providing genome-widecoverage in rice (Oryza sativa L.). Theor Appl Genet 95:553–567
Cho YG, Kang HJ, Lee JS, Lee YT, Lim SJ, Gauch H, Eun MY,McCouch SR (2007) Identification of quantitative trait loci in ricefor yield, yield components, and agronomic traits across years andlocations. Crop Sci 47:2403–2417
Churchill GA, Doerge RW (1994) Empirical threshold values forquantitative trait mapping. Genetics 138:963–971
Foolad MR, Zhang LP, Lin GY (2001) Identification and validation ofQTLs for salt tolerance during vegetative growth in tomato byselective genotyping. Genome 44:444–454
International Rice Research Institute (IRRI) (1996) Standard evalua-tion system for rice, 4th edn. International Rice Research Institute(IRRI), Manila, Philippines
Joehanes R, Nelson JC (2008) QGene 4.0, an extensible Java QTL-analysis platform. Bioinformatics 24:2788–2789
Kohn JR, Leyva N, Dossey R, Sobral B, Morishima H (1997) Quan-titative trait locus analysis of trait variation among annual andperennial ecotypes of Oryza rufipogon. Int Rice Res Notes 22:4–5
Li J, Wang X, Dong R, Yang Y, Zhou J, Yu C, Cheng Y, Yan C, Chen J(2011) Evaluation of high-resolution melting for gene mapping inrice. Plant Mol Biol Rep 29:979–985
Liu R, Zhang H, Zhao P, Zhang Z, Liang W et al (2011) Mining ofcandidate maize genes for nitrogen use efficiency by integratinggene expression and QTL data. Plant Mol Biol Rep. doi:10.1007/s11105-011-0346-x (Online First)
McCouch SR, Cho YG, Yano M, Paul E, Blinstrub M, Morishima H,Kinoshita T (1997) Report on QTL nomenclature. Rice GenetNewsl 14:11–13
McCouch SR, Teytelman L, Xu Y, Lobos KB, Clare K, Walton M, Fu B,Maghirang R, Li Z et al (2002) Development and mapping of 2240new SSR markers for rice (Oryza sativa L). DNA Res 9:199–207
McCouch SR, Sweeney M, Li J, Jiang H, Thomson MJ, SeptiningsihEM, Edwards J, Moncada P, Xiao J, Garris A, Tai T, Martinez C,Tohme J, Sugiono M, Mcclung A, Yuan LP, Ahn SN (2007)Through the genetic bottleneck: O. rufipogon as a source oftrait-enhancing alleles for O. sativa. Euphytica 154:377–399
Moncada P, Martínez CP, Borrero J, Chatel M, Gauch H Jr, GuimaraesE, Tohme J, Mccouch SR (2001) Quantitative trait loci for yieldand yield components in an Oryza sativa × Oryza rufipogonBC2F2 population evaluated in an upland environment. TheorAppl Genet 102:41–52
Monna L, Kitazawa N, Yoshino R, Suzuki J, Masuda H,Maehara Y, TanjiM, Sato M, Nasu S, Minobe Y (2002) Positional cloning of ricesemidwarfing gene, sd-1: rice “green revolution gene” encodes amutant enzyme involved in gibberellin synthesis. DNARes 9:11–17
Murray M, Thompson MF (1980) Rapid isolation of high molecularweight plant DNA. Nucleic Acids Res 8:4321–4325
Ngu MS, Sabu KK, Lim LS, Abdullah MZ, Wickneswari R (2010)Genetic structure of Oryza rufipogon Griff. natural populations in
Malaysia: implications for conservation and genetic introgressionof cultivated rice. Tropical Plant Biol 3:227–239
Panaud O, Chen X, McCouch SR (1996) Development of microsatellitemarkers and characterisation of simple sequence length polymor-phism (SSLP) in rice (Oryza sativa L.). Mol Genet 252:597–607
Robertson DS (1985) A possible technique for isolating genic DNA forquantitative traits in plants. J Theor Biol 117:1–10
Sabu KK, Abdullah MZ, Lim LS, Wickneswari R (2006) Developmentand evaluation of advanced backcross families of rice for agro-nomically important traits. Commun Biom Crop Sci 1:111–123
SAS Institute Inc (2003) SAS procedures guide. Release 9.1.3. SASInstitute Inc, Cary
Sasaki A, Ashikari M, Ueguchi-tanaka M, Itoh H, Nishimura A,Swapan D et al (2002) A mutant gibberellin synthesis gene inrice. Nature 416:701–702
Septiningsih EM, Prasetiyono J, Lubis E, Tai TH, Tjubaryat T,Moeljopawiro S, Mccouch SR (2003) Identification of quantitativetrait loci for yield and yield components in an advanced backcrosspopulation derived from the Oryza sativa variety IR64 and the wildrelative O rufipogon. Theor Appl Genet 107:1419–1432
Shen L, Courtois B, Mcnally KL, Robin S, Li Z (2001) Evaluation ofnear-isogenic lines of rice introgressed with QTLs for root depththrough marker-aided selection. Theor Appl Genet 103:75–83
Stam P, Zeven AC (1981) The theoretical proportion of the donorgenome in near-isogenic lines of self-fertilisers bred by back-crossing. Euphytica 30:227–238
Swamy BPM, Sarla N (2011) Meta-analysis of yield QTLs derivedfrom inter-specific crosses of rice reveals consensus regions andcandidate genes. Plant Mol Biol Rep 29:663–680
Tanksley SD, McCouch SR (1997) Seed banks and molecular maps:unlocking genetic potential from the wild. Science 277:1063–1066
Tanksley SD, Nelson JC (1996) Advanced backcross QTL analysis: amethod for the simultaneous discovery and transfer of valuableQTLs from unadapted germplasm into elite breeding lines. TheorAppl Genet 92:191–203
Temnykh S, Park W, Ayres N, Cartinhour S, Hauck N, Lipovich L,Cho LG, Ishii T, McCouch SR (2000) Mapping and genomeorganisation of microsatellite sequences in rice (Oryza sativaL.). Theor Appl Genet 100:697–712
ThomsonMJ, Tai TH,McClung AM, Lai XH, HingaME, Lobos KB, XuY, Martinez CP, McCouch SR (2003)Mapping quantitative trait locifor yield, yield components and morphological traits in an advancedbackcross population betweenOryza rufipogon and theOryza sativacultivar Jefferson. Theor Appl Genet 107:479–493
Tian F, Li DJ, Fu Q, Zhu ZF, Fu YC, Wang XK, Sun CQ (2006)Construction of introgression lines carrying wild rice (Oryzarufipogon Griff.) segments in cultivated rice (Oryza sativa L.)background and characterization of introgressed segments associ-ated with yield-related traits. Theor Appl Genet 112:570–580
Venuprasad R, Shashidhar HE, Hittalmani S (2002) Tagging quantita-tive trait loci associated with grain yield and root morphologicaltraits in rice (Oryza sativa L.) under contrasting moisture regimes.Euphytica 128:293–300
Wang B, Changxiang Z, Xu L, Wenying W, Hanfeng et al (2011) FineMapping of qHD4-1, a QTL controlling the heading date, to a20.7-kb DNA fragment in rice (Oryza sativa L.). Plant Mol BiolRep 29:702–713
Xiao J, Li J, Grandillo S, Ahn SN, Yuan L, Tanksley SD, McCouch SR(1998) Identification of trait-improving quantitative trait loci allelesfrom a wild rice relative, Oryza rufipogon. Genetics 150:899–909
Zeng ZB (1994) Precision mapping of quantitative trait loci. Genetics136:1457–1468
Zhao F, Cai Z, Hu T, Yao H, Wang L, Dong N, Wang B, Ru Z, Zhai W(2010) Genetic analysis and molecular mapping of a novel geneconferring resistance to rice stripe virus. Plant Mol Biol Rep 28:512–518
Plant Mol Biol Rep (2012) 30:929–939 939
Author's personal copy