Catalog of Copyright Entries 1937 Engravings, Prints, Etc ...
Upload
independentCategory
view
2download
0
ICDAR 2003 Robust Reading Competitions:
Entries, Results and Future Directions
Simon M. Lucas, Alex Panaretos, Luis Sosa,
Anthony Tang, Shirley Wong and Robert Young1
Kazuki Ashida, Hiroki Nagai, Masayuki Okamoto, Hiroaki Yamamoto, Hidetoshi Miyao2
JunMin Zhu and WuWen Ou3
Christian Wolf and Jean-Michel Jolion4
Leon Todoran and Marcel Worring5
Xiaofan Lin6
1 Dept. of Computer Science
University of Essex, Colchester CO4 3SQ, UK
2 Department of Information Engineering,
Faculty of Engineering, Shinshu University
4-17-1 Wakasato Nagano 380-8553 JAPAN
3 Institute of Automation, Chinese Academy of Science
4 Lyon Research Center for Images and
Intelligent Information Systems (LIRIS)
INSA de Lyon, Bt. J. Verne 20, rue Albert Einstein
F-69621 Villeurbanne cedex, France
5 Informatics Institute, University of Amsterdam
Kruislaan 403, 1098 SJ Amsterdam, The Netherlands
6 Hewlett-Packard Laboratories
1501 Page Mill Road, MS 1203, Palo Alto, CA 94304, USA
Abstract
This paper describes the robust reading competitions for ICDAR 2003. With
the rapid growth in research over the last few years on recognizing text in natural
scenes, there is an urgent need to establish some common benchmark datasets, and
1
gain a clear understanding of the current state of the art. We use the term robust
reading to refer to text images that are beyond the capabilities of current commer-
cial OCR packages. We chose to break down the robust reading problem into three
sub-problems, and run competitions for each stage, and also a competition for the
best overall system. The sub-problems we chose weretext locating, character
recognitionandword recognition.
By breaking down the problem in this way, we hoped to gain a better under-
standing of the state of the art in each of the sub-problems. Furthermore, our
methodology involved storing detailed results of applying each algorithm to each
image in the data sets, allowing researchers to study in depth the strengths and
weaknesses of each algorithm. The text locating contest was the only one to have
any entries. We give a brief description of each entry, and present the results of
this contest, showing cases where the leading entries succeed and fail. We also de-
scribe an algorithm for combining the outputs of the individual text locaters, and
show how the combination scheme improves on any of the individual systems.
1 Introduction
Fifty years of research in machine reading systems has seen great progress, and com-
mercial OCR packages now operate with high speed and accuracy on good quality
documents. These systems are not robust, however, and do not work well on poor
quality documents, or on camera-captured text in everyday scenes. The goal of general
purpose reading systems with human-like speed and accuracy remains elusive. Appli-
cations include data archive conversion of noisy documents, textual search of image
and video databases, aids for the visually impaired and reading systems for mobile
robots.
In recent years there has been significant research into general reading systems
that are able to locate and/or read text in video or natural scene images [35, 8, 12, 14,
7, 34]. So far, however, there have not been any standard publicly available ground-
truthed datasets, which severely limits the conclusions which may be drawn regarding
the relative merits of each approach.
Hence, the aims of these competitions were as follows:
2

• To capture and ground-truth a significant size text-in-scene dataset. This should
have a shelf-life well beyond that of the competitions.
• To design or adopt standard formats for these datasets, and also for the results
produced by the recognizers.
• To design or adopt standard evaluation procedures according to current best prac-
tices.
• To run the competitions in order to get a snapshot of the current state of the art
in this area.
We aimed to broadly follow the principles and procedures used to run the Finger-
print Verification 2000 (and 2002) competitions [17]. Well in advance of the deadline
we published sample datasets for each problem, the evaluation software to be used, and
the criteria for deciding the winner of each contest. To enter the contests, researchers
had to submit their software to us in the form of a ready-to-run command-line exe-
cutable. This takes a test-data input file and produces a raw results file. The raw results
are then compared to the ground truth for that dataset by an evaluation algorithm, which
produces a set of detailed results and also a summary. The detailed results report how
well the algorithm worked on each image, while the summary results report the aggre-
gate over all the images in the dataset. All these files are based on simple XML formats
to allow maximum compatibility between different versions of evaluation systems, rec-
ognizers and file formats. In particular, new attributes and elements can be added to the
markup while retaining backward compatibility with older recognition systems. The
generic process is depicted in Figure 1.
2 Data Capture
Images were captured with a variety of digital cameras by each of the Essex authors.
Cameras were used with a range of resolution and other settings, with the particular
settings chosen at the discretion of the photographer.
To allow management of the ground-truthing or tagging of the images, and with a
3

Trained
Recognizer
Raw.xml TestData.xml
Evaluator
Summary.xml Details.xml
True.xml
Results DB
Figure 1: The multi-stage evaluation process.
view to possible future tagging jobs, we implemented a web based tagging system. This
operates along similar lines to the OpenMind[23] concept. People working as taggers
can log in to the system from anywhere on the Internet using a Java (1.4) enabled web-
browser. On logging in, a Java Applet window appears and presents a series of images.
The tagger tags each image by dragging rectangles over words, and then typing in the
associated text. The applet then suggests a possible segmentation of the word into
its individual characters, which the tagger can then adjust on a character-by-character
basis. The tagger can also adjust the slant and rotation of the region. When the tagger
has finished an image, they click submit, at which point all the tagged rectangles are
sent back to a server, where they are stored in a database. One of the parameters of
the system is how many taggers should tag each image. If we had a plentiful supply
of tagging effort, then we could send each image to several taggers, and simply accept
all the images where the tags from different taggers were in broad agreement. This
is somewhat wasteful of tagging effort, however, since it is much quicker to check an
image than it is to tag it. We therefore adopted a two-tier tagging system of taggers and
checkers, where the job of a checker was to approve a set of tags.
There are several ways of communicating between the applet and the server. We
4
chose to use Simple Object Access Protocol (SOAP) - partly to gain experience of
SOAP on a real project, and partly to allow good inter-operability with other systems.
Potentially, someone could now write a tagging application in some other language,
and still request images to tag, and upload tagged images to our server.
Figure 2 shows a fragment of XML used to markup the data we captured. This
sample corresponds to the wordDepartmentin Figure 3. The root element istagset
and consists of a sequence ofimageelements - one for each image in the dataset. The
imageNameelement gives the relative path to the image file, and theresolutionele-
ment gives the width and height of the image. ThetaggedRectangleselement contains
a taggedRectangleelement for each word in the image. Thex, y, width andheightat-
tributes specify the location (top left corner) and size of the word, while theoffsetand
rotation specify the slant (e.g. for italicised text) and rotation of the word. The text of
the word is given as the body of thetag element. Thesegmentationelement specifies
a sequence of offsets for each character segmentation point in the word. Note that this
model does not exactly fit all the possible variations in camera captured text, but was
an adequate model for the vast majority of images that we captured. This format was
used to markup the ground-truth for the images, and also as a general output format
for the robust reading and text-locating contests. Entries for the text locating contest
omitted thetagandsegmentationelements, and also theoffsetandrotationattributes.
3 The Competitions
Reading the text in an image is a complex problem that may be decomposed into several
simpler ones. The best way to do this decomposition is open to debate. We chose to
break down the robust reading problem into three stages, and run competitions for each
stage, and also a competition for the best overall system. The stages we chose were text
locating, character recognition and word recognition. Another possible stage would
have been segmentation of words into separate characters. This idea was rejected on
the grounds that we believed the images would be too difficult to segment in a way
that was independent of the OCR process, and we also wanted to place some limit
5

<tagset>
<image>
<imageName>scene/ComputerScienceSmall.jpg</imageName>
<resolution x="338" y="255" />
<taggedRectangles>
<taggedRectangle x="99" y="94" width="128" height="20"
offset="0" rotation="0">
<tag>Department</tag>
<segmentation>
<xOff>16</xOff>
<xOff>29</xOff>
<xOff>43</xOff>
<xOff>54</xOff>
<xOff>64</xOff>
<xOff>74</xOff>
<xOff>93</xOff>
<xOff>106</xOff>
<xOff>117</xOff>
</segmentation>
</taggedRectangle>
...
</image>
...
</tagset>
Figure 2: A sample of our XML format for marking up the words in images.
6

on the number of competitions to be run. However, the segmentation data exists for
all the words in the database, so it is still possible for researchers to evaluate their
segmentation algorithms on this data.
3.1 Pre-trained Systems
For all the competitions we debated whether to run them for trainable or non-trainable
systems. We decided that any system training or tuning was best left to the system
designers, and hence each of the contests dealt with evaluating pre-trained systems.
The contestants were advised to download the trial datasets well in advance of the
competition deadline, in order to tune their systems for optimal performance on this
type of data.
From a machine learning perspective it would be desirable to test the learning abil-
ity of each method. Our prime concern here, however, was to find the system that
performed best on each task, irrespective of the amount of hand-tuning that went into
its design. Hence we justify our decision to base the contests on pre-trained systems.
3.2 Text Locating
The aim of the text locating competition was to find the system that can most accurately
identify the word regions in an image.
For this contest, a text locating algorithm takes a JPEG file as input and produces
a set of rectangles as output. The preferred system interface is that both the input and
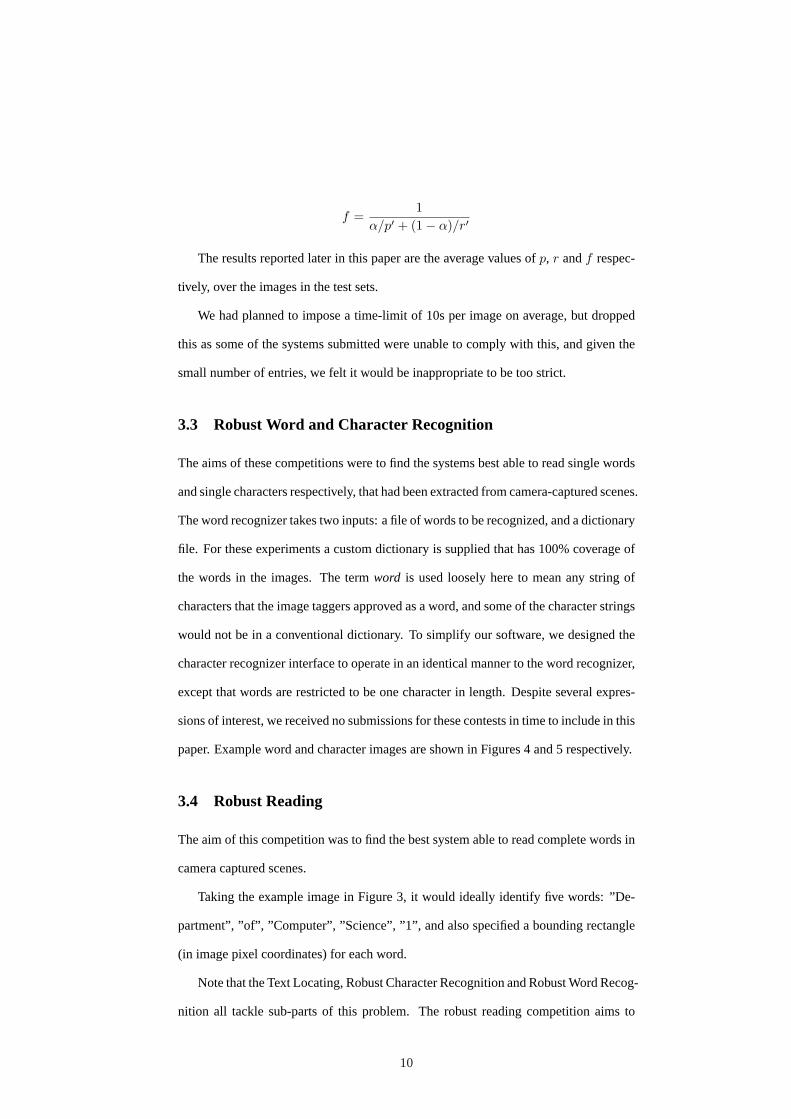
output files are in a simple XML format, described on the contest web page. Taking
the example image in Figure 3, a text locating algorithm would ideally identify five
rectangles in image pixel coordinates, surrounding the words: ”Department”, ”of”,
”Computer”, ”Science”, ”1”.
Note that several design options were possible here - such as specifying that the
system find complete text blocks, or individual words or characters. We chose words
since they were easier to tag and describe (it would be harder to fit rectangles to text
blocks, since they are more complex shapes).
We aimed to design an evaluation scheme that would be:
7

Figure 3: Example scene containing text.
• Easy to understand and to compute;
• Reward text locating algorithms that would be most useful as a component of a
text-in-scene word recognizer;
• Heavily punish any trivial solutions (e.g. such as returning a single rectangle
covering the entire image, or returning all the possible rectangles for a given size
of image).
The proposed evaluation system is based on the notions of precision and recall,
as used by the information retrieval community. An alternative form of evaluation
would be a goal-directed approach [25]. In this case, the text locating algorithms could
be judged by the word recognition rate they achieve when used in conjunction with
a word recognizer (or OCR package). A difficulty of this approach, however, is its
dependence on the particular recognizer used. A detailed description of various object
detection evaluation methods is given in [18].
In general, precision and recall are used to measure a retrieval system as follows.
For a given query (in this case, find all the word-region rectangles in an image), we have
a ground-truth set of targetsT and the set returned by the system under test, which we
call estimates,E. The number of estimates which are correct, we denotec.
Precision,p is defined as the number of correct estimates divided by the total num-
ber of estimates:
8
p =c
|E|
Systems that over-estimate the number of rectangles are punished with a low pre-
cision score.
Recall,r is defined as the number of correct estimates divided by the total number
of targets.
r =c
|T |
Systems that under-estimate the number of rectangles are punished with a low recall
score.
For text locating it is unrealistic to expect a system to agree exactly with the bound-
ing rectangle for a word identified by a human tagger. Hence, we need to adopt a flex-
ible notion of a match. We define the area matchma between two rectanglesr1 andr2
as twice the area of intersection divided by the sum of the areas of each rectangle i.e.:
ma(r1, r2) =2a(r1 ∩ r2)
a(r1) + a(r2)
wherea(r) is the area of rectangler. This figure has the valueone for identical
rectangles andzerofor rectangles that have no intersection. For each rectangle in the
set of estimates we find the closest match in the set of targets, and vice versa.
Hence, the best matchm(r,R) for a rectangler in a set of RectanglesR is defined
as:
m(r,R) = maxma(r, r′) | r′ ∈ R
Then, our new more forgiving definitions of precision and recall:
p′ =Σre∈E m(re, T )
|E|
r′ =Σrt∈T m(rt, E)
|T |
We adopt the standardf measure to combine the precision and recall figures into a
single measure of quality. The relative weights of these are controlled byα, which we
set to 0.5 to give equal weight to precision and recall:
9
f =1
α/p′ + (1− α)/r′
The results reported later in this paper are the average values ofp, r andf respec-
tively, over the images in the test sets.
We had planned to impose a time-limit of 10s per image on average, but dropped
this as some of the systems submitted were unable to comply with this, and given the
small number of entries, we felt it would be inappropriate to be too strict.
3.3 Robust Word and Character Recognition
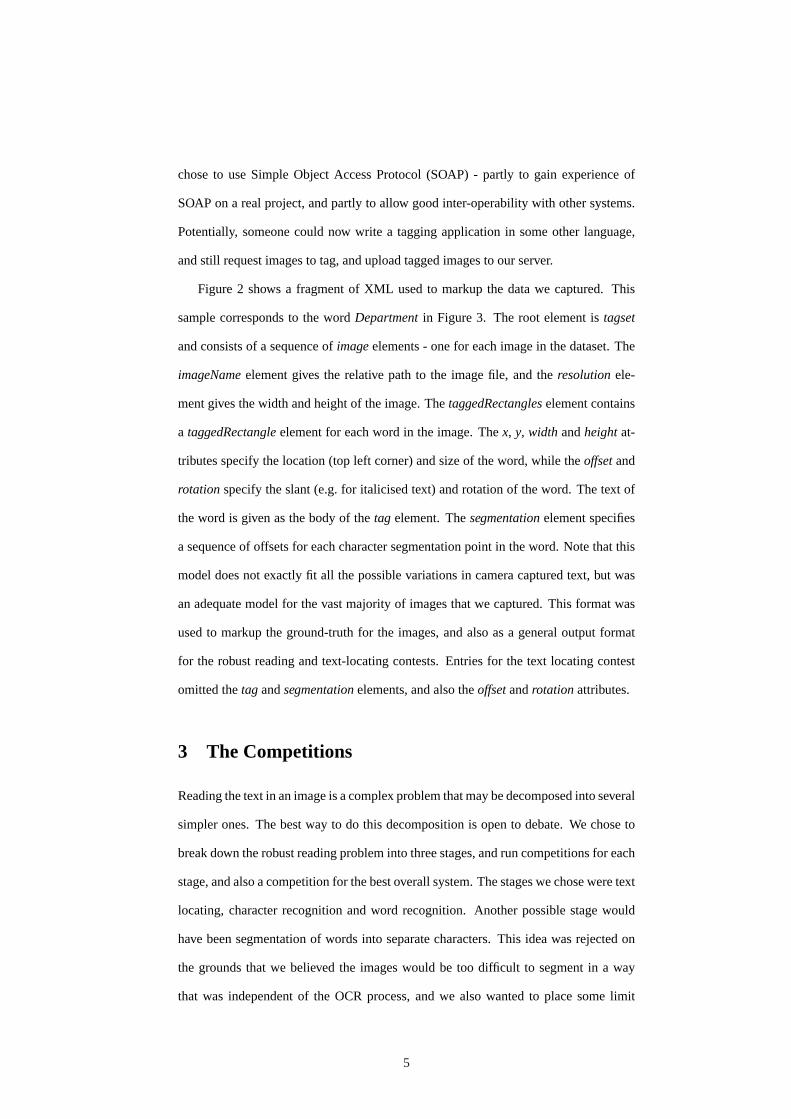
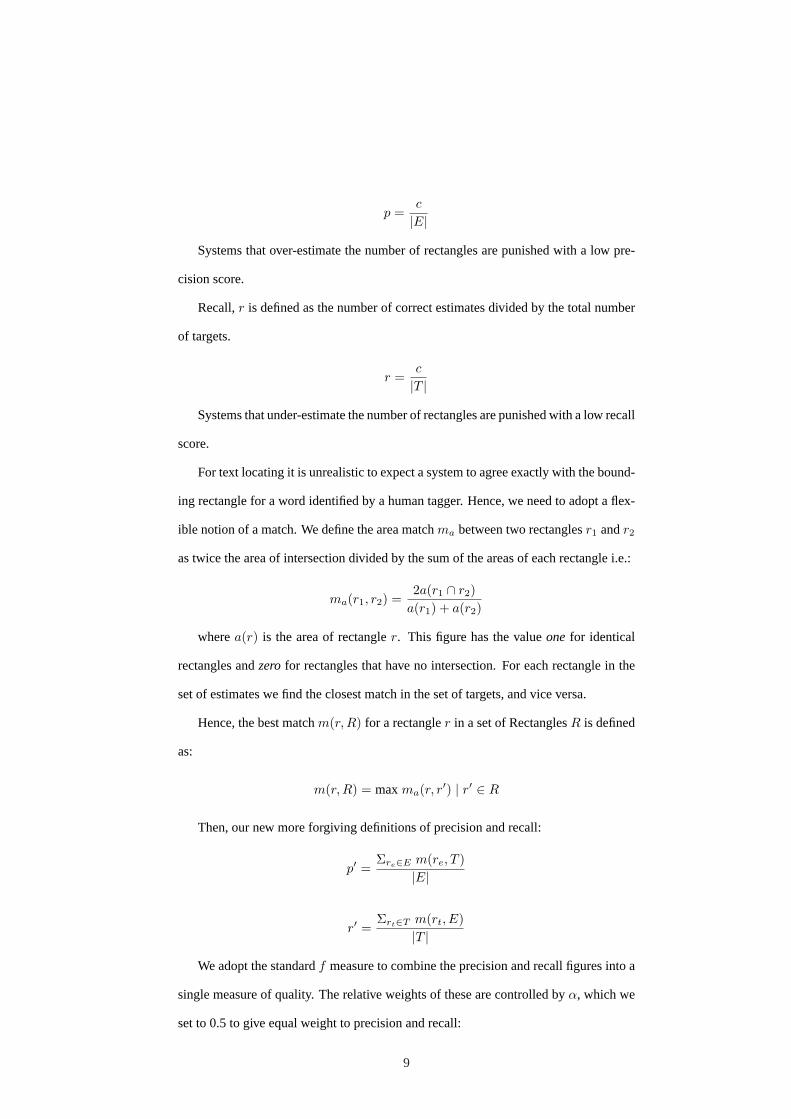
The aims of these competitions were to find the systems best able to read single words
and single characters respectively, that had been extracted from camera-captured scenes.
The word recognizer takes two inputs: a file of words to be recognized, and a dictionary
file. For these experiments a custom dictionary is supplied that has 100% coverage of
the words in the images. The termword is used loosely here to mean any string of
characters that the image taggers approved as a word, and some of the character strings
would not be in a conventional dictionary. To simplify our software, we designed the
character recognizer interface to operate in an identical manner to the word recognizer,
except that words are restricted to be one character in length. Despite several expres-
sions of interest, we received no submissions for these contests in time to include in this
paper. Example word and character images are shown in Figures 4 and 5 respectively.
3.4 Robust Reading
The aim of this competition was to find the best system able to read complete words in
camera captured scenes.
Taking the example image in Figure 3, it would ideally identify five words: ”De-
partment”, ”of”, ”Computer”, ”Science”, ”1”, and also specified a bounding rectangle
(in image pixel coordinates) for each word.
Note that the Text Locating, Robust Character Recognition and Robust Word Recog-
nition all tackle sub-parts of this problem. The robust reading competition aims to
10
identify the system that best does the complete job. The robust reader takes as input a
scene image, and produces a set of tagged rectangles as output, where each rectangle
is tagged with a single word hypothesis. The standard measures of precision and recall
are used to evaluate the performance of a Robust Reader. Unlike the text locating con-
test, where we rate the quality of match between a target and estimated rectangle, we
define a strict notion of match between the target and estimated words: the rectangles
must have an area match scorema (see above) of greater than 0.5, and the word text
must match exactly. The winning system would be the one with the bestf score.
Figure 4: Example extracted words.
Figure 5: Example extracted characters.
4 Experimental Setup
We organized the data for each competition into:Sample, Trial andCompetitiondatasets.
Sample datasets were provided to give a quick impression of the data, and also to allow
functional testing of software i.e. researchers could check that their software could read
and write the specified dataset formats, but not get any statistically meaningful results.
Trial datasets had two intended uses. They could be used to get results for ICDAR
2003 papers. For this purpose, they were partitioned into two sets:TrialTrain and
TrialTest. The instructions were to use TrialTrain to train or tune algorithms, then
11
Problem Downloads EOIs Entries
Text Locating 394 7 5
Word Recognition 228 4 0
Character Recognition 218 5 0
Robust Reading 394 0 0
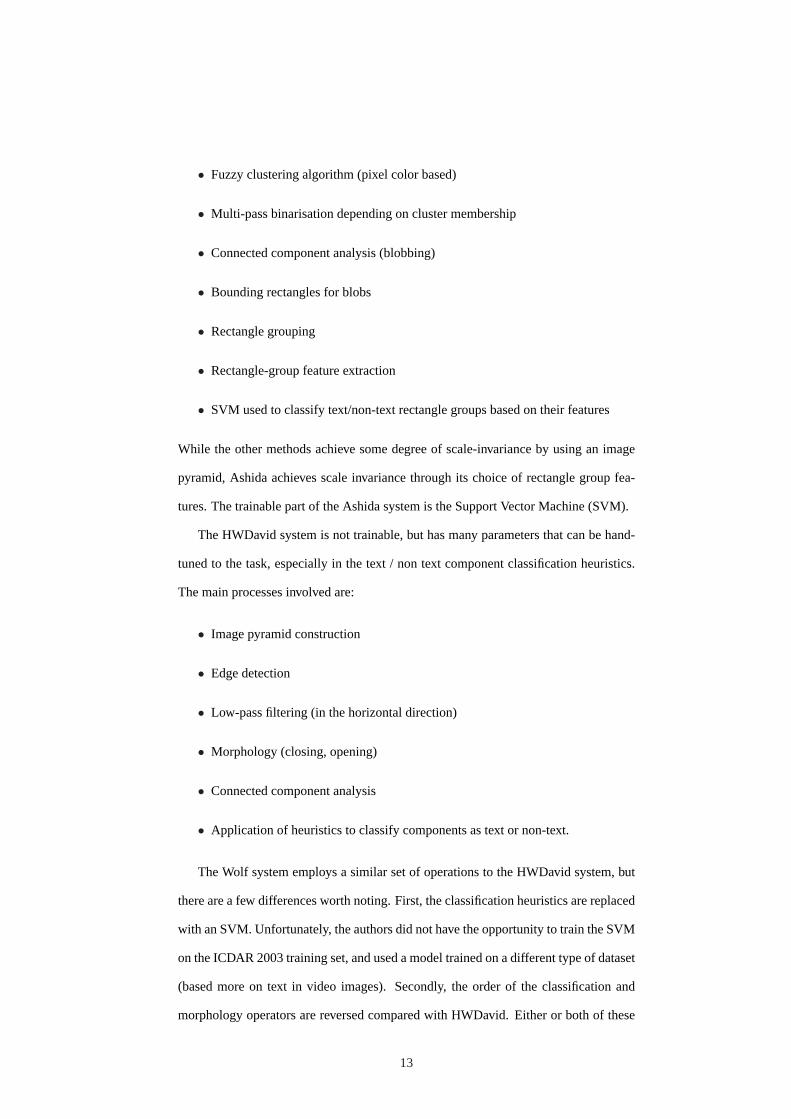
Table 1: Measures of interest in each problem. Note that the download files for the
Text Locating and Robust Reading contests were the same.
quote results on TrialTest. For the competitions, the instructions were that algorithms
should be trained or tuned on the entire trial set (i.e. TrialTest∪ TrialTrain).
Competitors were then invited to submit their tuned systems by the competition
deadline of April 30th, 2003. The submissions were then evaluated by running them
on the competition datasets.
Table 1 gives an idea of the level of interest in each problem. The downloads
column shows the number of downloads of the sample dataset for each problem; in
each case, the number of downloads of the trial datasets, which are much larger, was
approximately half this figure. Note that the text locating dataset (locating, in the table)
was the same as the robust reading dataset, but there were no expressions of interest in
the robust reading problem. Note that only in the case of the text locating problem did
the expressions of interest (EOIs) translate to actual entries.
5 Text Locating Entries
Text locating systems typically exploit standard image processing and computer vision
methods to transform the raw pixels into higher-level features and components. Before
describing each of the text locating systems in detail, we first list the main methods used
in each system. We refer to the systems by their submitted names: Ashida, HWDavid,
Wolf and Todoran.
The Ashida system is perhaps the system most distinct from the others. It is the
only system not to use an image pyramid, and is based on the following sequence of
processes:
12
• Fuzzy clustering algorithm (pixel color based)
• Multi-pass binarisation depending on cluster membership
• Connected component analysis (blobbing)
• Bounding rectangles for blobs
• Rectangle grouping
• Rectangle-group feature extraction
• SVM used to classify text/non-text rectangle groups based on their features
While the other methods achieve some degree of scale-invariance by using an image
pyramid, Ashida achieves scale invariance through its choice of rectangle group fea-
tures. The trainable part of the Ashida system is the Support Vector Machine (SVM).
The HWDavid system is not trainable, but has many parameters that can be hand-
tuned to the task, especially in the text / non text component classification heuristics.
The main processes involved are:
• Image pyramid construction
• Edge detection
• Low-pass filtering (in the horizontal direction)
• Morphology (closing, opening)
• Connected component analysis
• Application of heuristics to classify components as text or non-text.
The Wolf system employs a similar set of operations to the HWDavid system, but
there are a few differences worth noting. First, the classification heuristics are replaced
with an SVM. Unfortunately, the authors did not have the opportunity to train the SVM
on the ICDAR 2003 training set, and used a model trained on a different type of dataset
(based more on text in video images). Secondly, the order of the classification and
morphology operators are reversed compared with HWDavid. Either or both of these
13
factors could account for the significant difference in the performance of the algorithms
on this data. Note also that HWDavid was nearly 60 times faster than Wolf (see Ta-
ble 2), which is probably explained by the fact that Wolf used an SVM at an early and
therefore data-intensive processing stage.
The Todoran system operated with the following processes:
• Image pyramid construction
• Texture filtering
• K-Means clustering of filtered values
• Pixels corresponding to the lowest energy cluster are tagged as text pixels
• Edge detection
• Morphology
• Connected component analysis
• Application of heuristics to classify components as text or non-text
The fact that the heuristics used in Todoran were tuned to return text lines or blocks
rather than words put this system at a disadvantage. Having said that, we found cases
where Todoran greatly over-estimated the size of a text block.
The methods used in all of these systems give a reasonable but not entirely complete
picture of the state of the art in text-region locating. For example, trainable non-linear
filters (such as multi-layer perceptrons) are notably absent from the set of methods
used in this paper, though they have been applied successfully to closely related tasks
elsewhere e.g. [8].
5.1 Ashida (by Ashida, Nagai, Okamoto, Yamamoto and Miyao)
Methods for character extraction or text location can be broadly categorised into three
types: region-based, texture based and edge-based methods.
Region-based methods assume that pixels of each character have similar color
and can be segmented from the background by color clustering. As a result, several
14
monochrome images are generated by thresholding on a color space, then characters
are extracted under some simple heuristic constraints, such as the size and aspect ratio
of circumscribing rectangles for each image. In these methods, the clustering process
plays an important role, and may produce irrelevant monochrome images for complex
background in some cases. Texture-based methods depend on texture features which
need considerable time to compute, and are not robust for accurate localization. Edge-
based methods find vertical or horizontal edges to detect character location. However,
for images with a complex background, too many edges make it difficult to select only
adequate ones for character extraction.
We used a region-based method. The method makes no assumptions with regard to
the illumination conditions and the types of objects and textures present in the scene
images. This means that a clustering algorithm may yield a lot of regions which do not
correspond to character patterns. For this reason, we adopt a fuzzy clustering method
to select colors for thresholding on a color space. Additionally, in order to distinguish
character patterns from background ones, we use a Support Vector Machine (SVM)
[27, 5]. The SVM uses features of blobs (connected components) in the monochrome
images.
Our algorithm consists of three major steps. First, fuzzy clustering is applied to a
given image, resulting in a set of binary images called color separation images. Second,
some blobs in each color separation image are grouped under simple heuristic con-
straints to calculate the geometric features. Finally, an SVM trained on these features
selects the blobs corresponding to character patterns. The overall process is shown
in Figure 6. Each step will be described with the aid of examples in the following
subsections.
5.1.1 Clustering in color space
Our color clustering algorithm assumes that characters appear with the same color in
every character string or text line in a given image. In practice, this assumption is not
realistic, and even within a character, various colors are seen due to dithering of the
printing process and reflections etc. This fact makes the clustering process difficult, so
15

Fuzzy clustering
using membership valueBinarization of the image by thresholding
Extraction of character pattern
Grouping rectangles
A color scene image
Discrimination of character patterns by SVM
Figure 6: Overview of the algorithm
we apply an edge preserving smoothing process to the scene image.
A color image is usually given by three values: R(red), G(green) and B(blue).
However, it is important to select a suitable color coordinate system according to each
purpose. It is reported that the 1976 CIE LUV uniform color space works well for color
segmentation. In this color space, two colors that are equally distant are perceived as
equally distant by viewers.
Several image segmentation methods based on color clustering techniques have
been proposed [6][15][20]. With these methods, performance of the clustering tech-
nique could affect segmentation results drastically. Our aim of clustering is to obtain
the blobs of pixels corresponding to character patterns. In our clustering method, a
given image with 8 bits per R, G and B is translated into LUV color space and the color
histogram is created in reduced LUV color space with17× 45× 40 bins.
There are many possible choices of clustering algorithm. We use a fuzzy clustering
algorithm which decides the number of clusters automatically. This is based on the
16

well-known Fuzzy C-Means (FCM) algorithm)[3]. In FCM the number of clustersc is
fixed. But, the appropriate number of clusters is different for each image. Therefore,
we allow splitting, merging and discarding of clusters in our algorithm. If the standard
deviation within a cluster exceeds a threshold value, the cluster is divided into two. On
the other hand, if two clusters locate closely, they are merged. Also, clusters which
contain few elements are discarded. Apart from this, our fuzzy clustering algorithm is
the same as FCM.
For each color separation image, connected components for both of black (fore-
ground) and white (background) pixels are labelled, and their circumscribed rectangles
are generated. The reason for this process is to increase the performance of character
extraction.
Figure 7 shows an example image, and Figure 8 shows color separation images
generated by the clustering process, and the associated circumscribed rectangles.
Figure 7: Original image
17

Cluster Circumscribed rectangle of Circumscribed rectangle of
black pixels white pixels
Cluster 1
Cluster 2
Cluster 3
Cluster 4
Cluster 5
Cluster 6
Figure 8: Result of clustering and grouping
18

5.1.2 Grouping rectangles
It is more difficult to classify single character patterns from background ones compared
with the case of word or text line. For this reason, some blobs in color separation
images are grouped into some regions that may correspond to character strings. In this
paper, we assume horizontal or slightly skewed character strings in an image, and do
not consider vertical ones. The blobs in the color separation image are grouped by the
following conditions (Figure 9). Although many blobs are not grouped and remain as
single regions, we treat all the regions as character candidates from now on.
(a) Alignment condition (b) Adjacency condition
Figure 9: Grouping condition : The rectangles with bold line are circumscribed rectan-
gles and the shaded parts show the regions where the adjacency condition is checked.
θ1, θ2 andθ3 correspond to the angles between the upper-left corner and the centers
of the rectangles respectively.tn is the rectangle magnification factor in the horizontal
direction.
1. θ1, θ2 or θ3 (Figure 9(a)) is smaller thantθ.
2. The adjacent rectangles are overlapped in the magnified regions(Figure 9(b)).
3. The ratio of areas of the adjacent rectangles is smaller thanta.
We decidedtθ = 35◦, tn = 0.2 andta = 8 experimentally. Figure 10 shows all of
character candidate rectangles generated from the color separation image of the cluster
6 in Figure 8. Especially, shaded rectangles in Figure 10 show the grouped rectangles.
19
Figure 10: Result of grouping rectangles
5.1.3 Discrimination of character patterns
Our algorithm discriminates character patterns from background ones by using support
vector machine (SVM).
In this paper, the SVM was trained on 13289 samples labelled as character pattern
or background in 250 scene images. We used the software program called SVMTorch[9].
The following features are calculated for each character candidate and used as input to
the SVM.
Cross-correlation feature cross-correlations are calculated between a scan-line and
all succeeding scan-lines within the region ofth% height of a character candi-
date’s boundary box, and their variance is obtained. This calculation is repeated
by changing the scan-line at the distance ofth/2. We use the average of the vari-
ances as the cross-correlation feature. The above procedure is also performed in
the vertical direction, and a similar feature is obtained. These feature values tend
to be low for character patterns. We determinedth=10[%] experimentally.
Run length feature Variance of run length in each character candidate is used as the
run length feature. This feature for character patterns also tends to be low since
widths of character strokes are similar.
Smoothness of contour lineFor the outer contour lines of blobs in a character candi-
date rectangle, the number of concave and convex points are counted and used
20
as the feature of smoothness of contour line. These values are also lower for
character patterns compared with background patterns.
Changing point of black/white pixels The number of changing points from black to
white pixels and vice versa is counted. These values have the same characteristic
as the above.
LAG feature The number and the average length of path nodes in the LAG (Line
Adjacency Graph) [21] constructed for blobs are used. The former values in
character patterns are lower than background ones, and the latter ones tend to be
constant in character patterns.
Other features Percentage of foreground pixels within a character candidate, and as-
pect ratio of character bounding box.
5.1.4 Discrimination by SVM
The above features may not be useful for character pattern discrimination indepen-
dently, but work well when combining them using an SVM. We normalized all fea-
tures in [0,1]. As a kernel function, we adopted Radial Basic function (e−|a−b|2
σ2 ) with
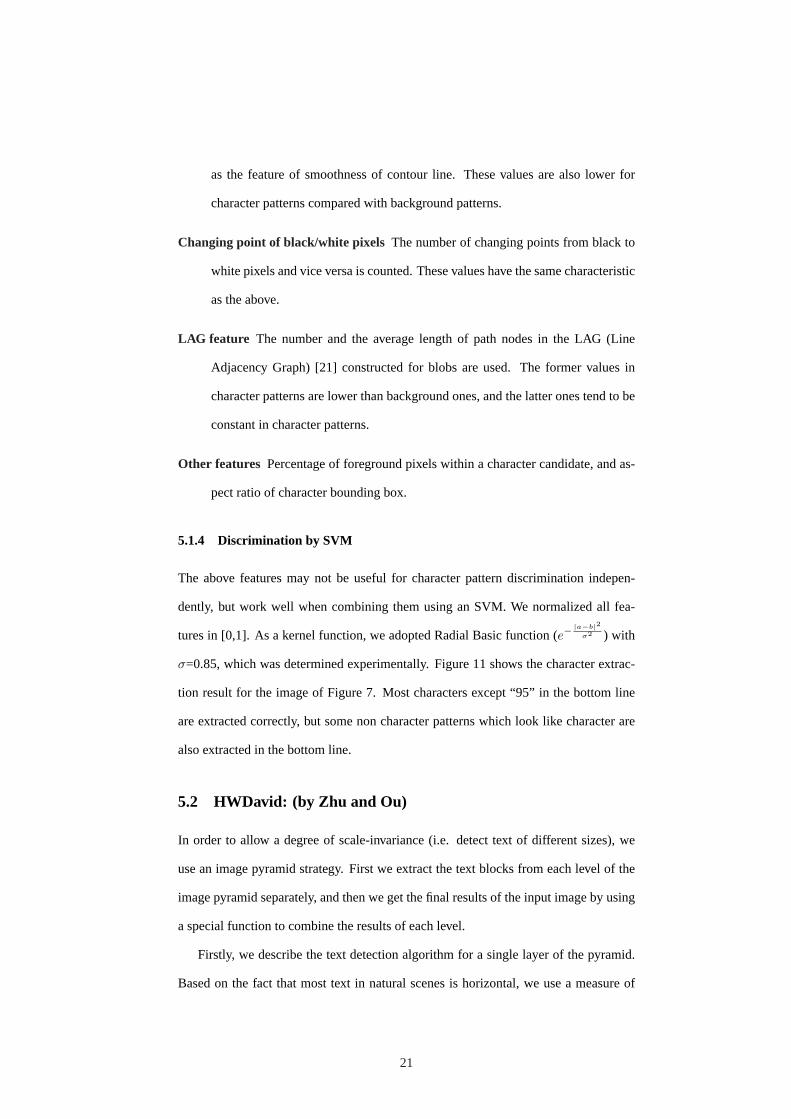
σ=0.85, which was determined experimentally. Figure 11 shows the character extrac-
tion result for the image of Figure 7. Most characters except “95” in the bottom line
are extracted correctly, but some non character patterns which look like character are
also extracted in the bottom line.
5.2 HWDavid: (by Zhu and Ou)
In order to allow a degree of scale-invariance (i.e. detect text of different sizes), we
use an image pyramid strategy. First we extract the text blocks from each level of the
image pyramid separately, and then we get the final results of the input image by using
a special function to combine the results of each level.
Firstly, we describe the text detection algorithm for a single layer of the pyramid.
Based on the fact that most text in natural scenes is horizontal, we use a measure of
21
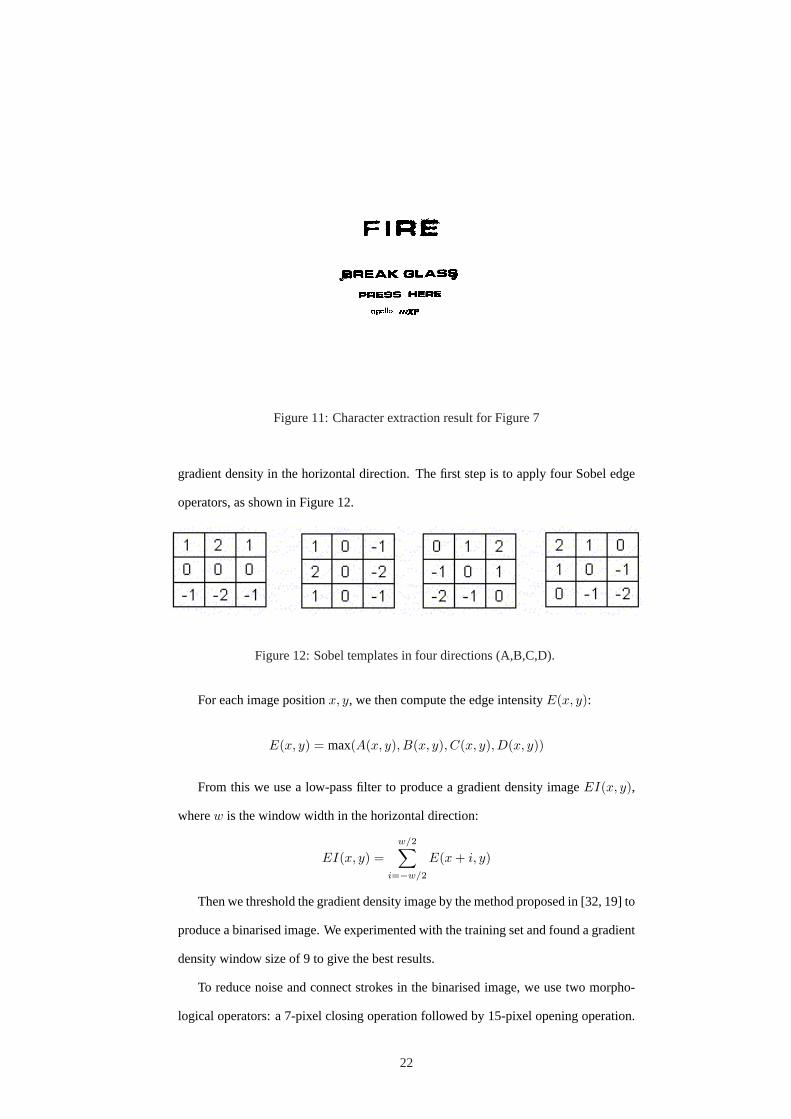
Figure 11: Character extraction result for Figure 7
gradient density in the horizontal direction. The first step is to apply four Sobel edge
operators, as shown in Figure 12.
Figure 12: Sobel templates in four directions (A,B,C,D).
For each image positionx, y, we then compute the edge intensityE(x, y):
E(x, y) = max(A(x, y), B(x, y), C(x, y), D(x, y))
From this we use a low-pass filter to produce a gradient density imageEI(x, y),
wherew is the window width in the horizontal direction:
EI(x, y) =w/2∑
i=−w/2
E(x + i, y)
Then we threshold the gradient density image by the method proposed in [32, 19] to
produce a binarised image. We experimented with the training set and found a gradient
density window size of 9 to give the best results.
To reduce noise and connect strokes in the binarised image, we use two morpho-
logical operators: a 7-pixel closing operation followed by 15-pixel opening operation.
22

The closing operation is to eliminate the connected strokes and the opening operation
is to remove the isolated regions. Additionally, we use a conditional morphological
operation on the connected components that is based on a CCA (connected component
analysis) algorithm [10].
Figure 13: (a) original image; (b) thresholded gradient density image; (c) after 7-
opening morphological filter; (d) after 15-closing morphological filter.
Figure 13 illustrates this: (a) is the original image, (b) is the binary (thresholded)
result of the gradient density image of (a), which contains some background noise, (c)
is the result of the first turn morphological operation (closing), in which noise has been
reduced greatly. (d) is the result of second turn morphological operation (opening),
where we see that the noise around the text blocks has been removed.
By applying geometrical constraints such as block height, width and ratio of white
to black dots in a block, we get the candidate text block. In our program, the white
dots correspond to character strokes and black dots to background. As shown in Fig-
ure 13 (d), some noise blocks should be candidate text blocks, so post processing is
essential.
In order to qualify as a text block, a candidate block must simultaneously satisfy
the following three constraints:
• The number of humps or valleys of candidate blocks’ color histogram should be
larger than a fixed constant. To be recognized, text can always be discriminated
from background, and the color of characters and background in the same text
string often form distinct clusters. In other words, the color histogram of text
should have at least one main valley.
23

• For the characters of a text string, the heighth, width w and ratior of white
to black dots of their corresponding connected components should satisfy some
constraints. We label the connected components which do not satisfy this con-
straint asNonCC. Scanning the candidate block (CB) from left to right, we count
the width of NonCCs, and if the width of a single NonCC or the sum of consec-
utive NonCC widths exceeds the height of the CB, we separate the CB in to 2
parts, namely the left CB and the right CB.
If the sum of the left CB’s NonCC widths is less than half the width of left CB,
the left CB is saved, otherwise it is discarded, and the right CB is treated as a
new CB. In our program, we used the following constraint to determine which
CBs can be connected:
r ∈ [0.1, 0.9] ∨
r > 0.8 ∧ hcc > 0.6hcb ∧ wcc < 0.5hcc ∨
r > 0.8 ∧ hcc < 0.3hcb ∧ wcc > 2hcb
Where the subscriptscc andcb refer to connected component and candidate block
respectively. The first line states that the stroke area should be medium in a con-
nected component. The second line handles the case of a single vertical stroke in
a character such as ’1’or ’I’, and the third line corresponds to a single horizontal
stroke as ’-’.
• For x-axis projection profiles, the number of humps should be in proportion to
the ratio of a candidate block’s width to height and the variance of hump width
should be small. In x-axis projection profile, humps often correspond to vertical
strong strokes, for example character ’H’ should have 2 humps in x profile. So
the number of humps correlates with the number of vertical strokes, and the
width of the humps corresponds to the width of the vertical strokes.
Secondly, the combination strategy of text blocks in each level of the image pyra-
mid is designed as follows. Because there are overlapping text blocks at different levels
24
in the image pyramid, to improve the detection precision, we must combine these over-
lapping blocks. Simple union or intersection does not work well. Union makes the text
blocks too fat and reduces the precision, while intersection makes the text blocks too
thin and also reduces the precision and recall rates. So we use a strategy of conditional
union: when two blocks from different levels of the image pyramid are similar enough
we join them i.e. return the rectangle that exactly bounds both of them. Otherwise, we
treat them as different text blocks of different resolution, and return the two rectangles
independently.
5.3 Wolf (by Wolf and Jolion)
We call our method:Learning Contrast and Geometrical Features with Support Vector
Machines.
The method we submitted is one of the text detection algorithms we have devel-
oped with different philosophies1. The first algorithm [33, 30] assumes that there is
text present in the image and tries to separate the text from the non-text pixels. The
second algorithm, which participated at the ICDAR competition, employs a support
vector machine (SVM) in order to learn a model consisting of contrast and geometrical
features from training data. It is described briefly in this section, for more details refer
to [31] or forthcoming publications. Among other differences, the choice between the
two methods controls a trade-off between detection recall and precision.
The existing text detection algorithms can be classified into two categories: the
ones based on character segmentation, which are less suited for low resolution text,
and the ones based on edge or texture features. Our system has been designed to
detect text in video sequences and therefore has been optimized for low resolution
images. Consequently, our text model contains contrast and texture features, completed
by geometrical features.
Existing methods for low resolution text enforce geometrical constraints in a post
processing step only, i.e. by using mathematical morphology after the detection step.
1Both algorithms have been developed in a collaboration between INSA Lyon and France Telecom in the
framework of the contracts ECAV 1 and ECAV 2 with respective numbers 001B575 and 0011BA66.
25

The disadvantage of this procedure is evident: a bad detection cannot be corrected
even by sophisticated post processing. We integrated the calculation of the geometrical
features directly into the detection phase. To overcome the chicken-egg problem (to
calculate geometrical features we need to detect the text first), we adopted a two step
approach:
1. Perform a coarse detection without taking into account geometrical features.
This is done using a filter accumulating the Sobel gradients [33], resulting in
a “text probability” image.
2. For each pixel, calculate geometrical features of its neighborhood based on the
detection results from step 1. Use these features together with the features cal-
culated in step 1 and perform a refined detection.
The features calculated in step 2 are, among others, the text height and its regularity in a
local neighborhood. We obtain the height from the “text probability image” calculated
in step 1, estimating the peak of the vertical profile centered at the pixel to classify, and
the borders of the mode containing the peak. The vertical profile may contain a single
peak in the case of a single text box, or several peaks in the case of several vertically
stacked text boxes, or no peak at all or a very flat peak if the box does not contain
text. We pose peak detection as an optimization problem over the space of possible
peak borders, maximizing a criterion which consists of the peak height (the contrast
between text and background), its mean (the text probability according to step 1) and
its width (the text height). The criterion favors high peaks with high contrast and low
width.
The properties of the estimated peak, together with the local regularity of its width
(i.e. of the text height) and the features from step 1, are learned from training data using
an SVM. Figure 14 shows the coarse detection result and the text height regularity
image for an example image.
In the detection phase, the classified pixels are post-processed, enforcing morpho-
logical and further geometrical constraints [33]. This is in order to reduce noise, to
correct classification errors and to connect loose characters to form complete words. In
26
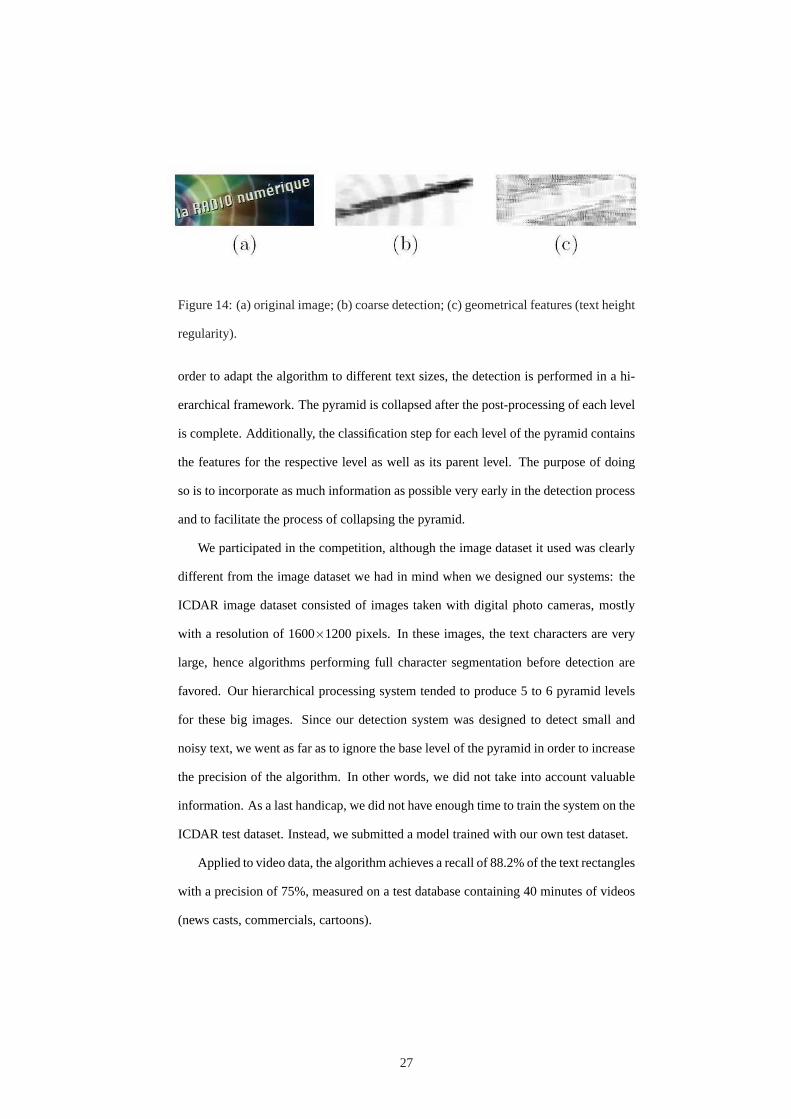
Figure 14: (a) original image; (b) coarse detection; (c) geometrical features (text height
regularity).
order to adapt the algorithm to different text sizes, the detection is performed in a hi-
erarchical framework. The pyramid is collapsed after the post-processing of each level
is complete. Additionally, the classification step for each level of the pyramid contains
the features for the respective level as well as its parent level. The purpose of doing
so is to incorporate as much information as possible very early in the detection process
and to facilitate the process of collapsing the pyramid.
We participated in the competition, although the image dataset it used was clearly
different from the image dataset we had in mind when we designed our systems: the
ICDAR image dataset consisted of images taken with digital photo cameras, mostly
with a resolution of 1600×1200 pixels. In these images, the text characters are very
large, hence algorithms performing full character segmentation before detection are
favored. Our hierarchical processing system tended to produce 5 to 6 pyramid levels
for these big images. Since our detection system was designed to detect small and
noisy text, we went as far as to ignore the base level of the pyramid in order to increase
the precision of the algorithm. In other words, we did not take into account valuable
information. As a last handicap, we did not have enough time to train the system on the
ICDAR test dataset. Instead, we submitted a model trained with our own test dataset.
Applied to video data, the algorithm achieves a recall of 88.2% of the text rectangles
with a precision of 75%, measured on a test database containing 40 minutes of videos
(news casts, commercials, cartoons).
27

5.4 Todoran (by Todoran and Worring )
Our text localization system uses multi-scale texture and edge analysis and was inspired
by the system described in Wu et al [28], but extended with more features, and an
improved grouping algorithm. First a texture filter is applied to extract the candidate
text regions. For texture filtering we compute a local energy estimate for each color
channel at three different scales using second order derivative filters. The filters used
in estimation are Gaussian kernels at scaleσ = (1,√
2, 2). The local energy values are
clustered in the 9 dimensional space using the K-means algorithm. We expect that the
cluster corresponding to the lowest energy comprises the text region. A morphological
closing fills-up holes in text regions.
Vertical edges are extracted from the original image masked with text regions pro-
vided by the texture filter step. The vertical edges representing small portions of can-
didate characters are merged by morphological closing in horizontal direction. From
the image of filtered vertical edges we extract the blobs (connected components).
These blobs represent characters and word-parts. Using geometric features we filter
the set of blobs and combine them into text lines. For filtering and grouping we use the
following features of the blobs: color, area, aspect ratio, height, horizontal distance to
the closest blob, amount of vertical overlapping between blobs.
To make the method scale invariant parameters are chosen proportional to the most
common value of the blob height H. The H is determined from the histogram of blob
heights over the image. We make the assumption that only one font size is present in
the candidate text region. Thus, candidate blobs are accepted if:
0.01 ∗ ImageArea < BlobArea < 0.50 ∗ ImageArea ∧
Width > Height ∧
Width > 2 ∗ H ∧
0.9H < Height < 1.1 ∗ H
Two blobs are merged in the horizontal direction if:
AverageColor1 = AverageColor2 ∧
HorizontalDistance < 1.2 ∗ H ∧
V erticalOverlap > 0.4 ∗ H ∧
28

|Height1−Height2| < 0.85 ∗ H
After the merging step one might get overlapping text regions due to blobs rep-
resenting holes inside characters. If two text regions overlap then the smaller one is
removed.
The above processing steps are applied at each scale of an image pyramid. Due to
good image quality and large image size, for ICDAR2003 competition we used only
two scales in the pyramid: 1/8th and 1/4th of the original image size.
In the task of detecting characters, words, or text blocks from an image, many errors
are generated by splitting the desired target objects into small parts, or merging two or
more target objects into one. Therefore, in evaluation of such systems, it is better to
detect these special situations of “split” and “merge” rather than to treat them as false
alarms or mis-detections.
Our system was designed for detection of text images, at a block level. Rather
than trying to locate isolated characters or words, we are looking for text lines and text
blocks. Therefore, the evaluation measure used at ICDAR 2003 competition did not
show our system in a favourable light. We have tested this implementation and other
systems from the literature on a large dataset, using different evaluation measures [24],
which are more appropriate for text blocks. There, the merge and split situations of
evaluated text regions relative to the ground truth can be detected and they are not
severely punished, and consequently the system achieved better results.
6 Results
The Text Locating competition had five entries by the April 30th 2003 deadline; the
other contests all had zero entries. Many of the originally supplied entries were missing
DLL or other library files - contestants were invited to supply any missing files, which
they all did. Some of the originally supplied systems were buggy, and would crash
after processing several images, perhaps due to memory leaks. Again, contestants
were invited to supply fixed versions, which they mostly did. In the case of one of
the submissions, the patched version still crashed frequently, and had such a low score
29

(f = 0.01) on a set of sample images that we did not run it on the full set, and hence
did not include it in the results table.
In future it would be much less effort if we could run these competitions by using
an alternative mode of entry, where each competitor exposes their system as a web
service [16, 4], which they are responsible for maintaining. The evaluation program
would then work by supplying images to the service, which would return its estimated
set of rectangles for each image in XML. We aim to foster this approach by supplying
some skeleton software and examples of how to do this.
The Text Locating results on the competition data are shown in Table 2. The entries
are identified by the user name of the person submitting each one, and each system is
described in Section 5.
The column labelledt(s) gives the average time in seconds to process each image
for each system under test. This is the elapsed time when running on a 2.4ghz Pentium
4 PC. Note that theFull system is the score obtained by returning a single rectangle
for each image that covers the entire image. This could have been computed from the
resolutioninformation in the XML input file, but to give a baseline measure of the time
we computed this by retrieving and decompressing each JPEG image, then measuring
the image size.
Note that poor performance under our evaluation scheme does not necessarily mean
that the algorithms are poor at finding text. For example, in some of the results of
Todoranthat we studied, the algorithm had tagged a large block of text consisting of
multiple words with a single rectangle. Our evaluator gives some credit for this, but not
nearly as much as a locater that identifies individual words, which was the performance
objective.
6.1 Results on Grey-Level Images
An interesting aspect of evaluating these text-locating systems is the extent to which
they exploit color information. In order to explore this further, we ran the best per-
forming algorithms, Ashida and HWDavid on grey-scale versions of the competition
images. We produced the grey-scale images by averaging the red, green and blue
30
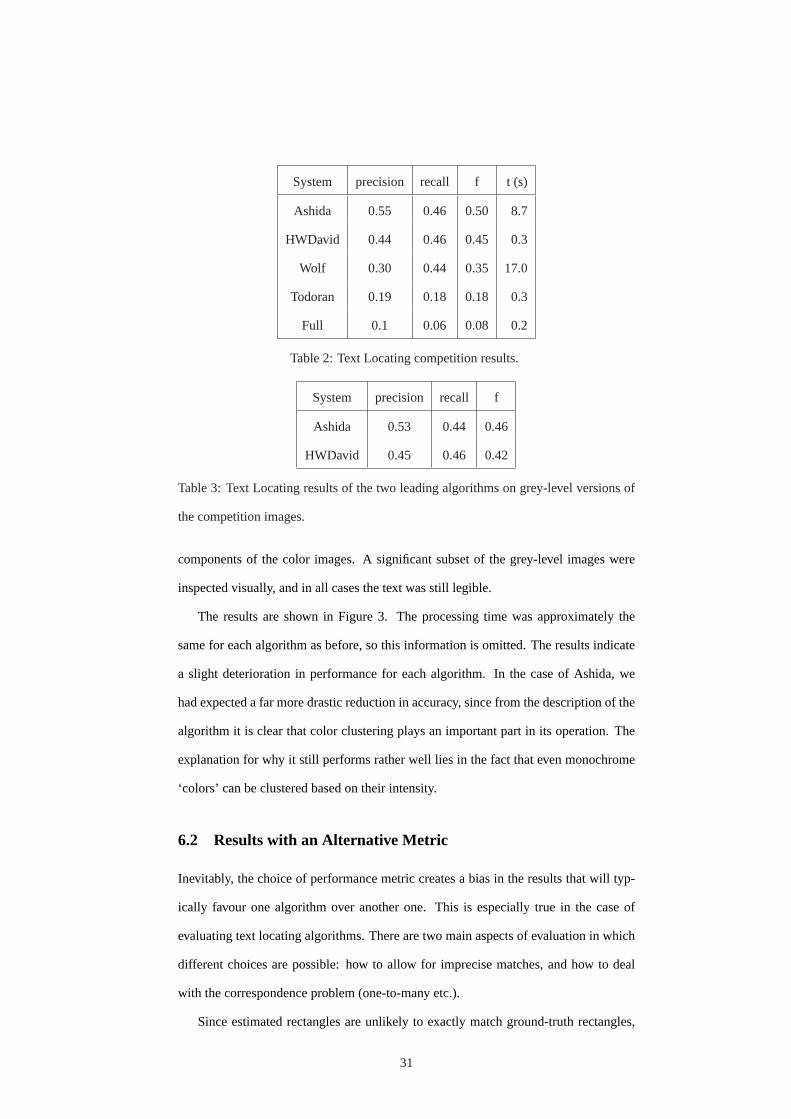
System precision recall f t (s)
Ashida 0.55 0.46 0.50 8.7
HWDavid 0.44 0.46 0.45 0.3
Wolf 0.30 0.44 0.35 17.0
Todoran 0.19 0.18 0.18 0.3
Full 0.1 0.06 0.08 0.2
Table 2: Text Locating competition results.
System precision recall f
Ashida 0.53 0.44 0.46
HWDavid 0.45 0.46 0.42
Table 3: Text Locating results of the two leading algorithms on grey-level versions of
the competition images.
components of the color images. A significant subset of the grey-level images were
inspected visually, and in all cases the text was still legible.
The results are shown in Figure 3. The processing time was approximately the
same for each algorithm as before, so this information is omitted. The results indicate
a slight deterioration in performance for each algorithm. In the case of Ashida, we
had expected a far more drastic reduction in accuracy, since from the description of the
algorithm it is clear that color clustering plays an important part in its operation. The
explanation for why it still performs rather well lies in the fact that even monochrome
‘colors’ can be clustered based on their intensity.
6.2 Results with an Alternative Metric
Inevitably, the choice of performance metric creates a bias in the results that will typ-
ically favour one algorithm over another one. This is especially true in the case of
evaluating text locating algorithms. There are two main aspects of evaluation in which
different choices are possible: how to allow for imprecise matches, and how to deal
with the correspondence problem (one-to-many etc.).
Since estimated rectangles are unlikely to exactly match ground-truth rectangles,
31

we need some way to cope with this. A continuous measure based on area of over-
lap was used for the competition metric. However, this means that the score is non-
intuitive, with no distinction between the number of rectangles imprecisely matched
and the number of rectangles completely missed. In other words, a recall score of 0.5
for a particular image could mean that one out of two rectangles in the image were
identified perfectly (and the other one missed completely), or that the only rectangle in
an image was identified with an overlap score of 0.5.
We used the evaluation method proposed by Wolf [29], which was inspired by
the rectangle matching algorithm presented in [13]. This takes into account one-to-
one as well as many-to-one and one-to-many matches. However, the algorithm aims
to determine, controlled by thresholds on the amount of overlap, whether a ground
truth rectangle has been detected or not. The performance of the detection method is
intuitively presented as a graph, which displays the precision and recall for different
overlap thresholds. The changed precision and recall measures are given by:
pw =
∑j MatchE(Ej)
|E| rw =∑
i MatchT (Ti)|T | (1)
whereMatchT andMatchE are functions which take into account the different
types of matches described above and which evaluate to the quality of the match:
MatchT (Ti) =
1 if Ti matches against a single detected rectangle
0 if Ti does not match against any detected rectangle
0.8 if Ti matches against several detected rectangles
The functionMatchE is defined accordingly.
The decision, whether a ground-truth rectangleTi is matched against a detected
rectangleEj is taken based on the overlap information stored in two matricesσ andτ ,
which corresponds intuitively to the “surface recall” and “surface precision”:
σij =a(Ti ∩ Ej)
a(Ti)and τij =
a(Ti ∩ Ej)a(Ej)
32

System precision recall f detected
HWDavid 0.43 0.52 0.47 1916
Ashida 0.53 0.41 0.46 1515
Wolf 0.21 0.52 0.30 3477
Todoran 0.14 0.18 0.16 1368
Full 0.02 0.02 0.02 501
Table 4: Alternative Text Locating results using theWolf performance metric.
A ground-truth rectangleTi is matched with a rectangleEj , if its surface recallσij
is above a thresholdtr and its surface precisionτij is above a given thresholdtp. In the
case of a one-to-many match, each single rectangle must satisfy this constraint, as well
as the combined (scattered) area.
We chose this evaluation technique because the precision and recall values share
their intuitive meaning with the original measures introduced in the domain of content
based image retrieval. The measures represent, respectively, the amount of items (text
rectangles) retrieved from the “database”, and the amount of items correctly detected
among all items detected.
Table 4 shows the results of running this alternative performance metric. We chose
the threshold values oftr = 0.8 andtp = 0.4; these were values that gave perceptually
reasonable results. This also highlights an advantage of the more simplistic metric used
for the competition results, in that the simplistic metric has no parameters to set.
Note that the precision, recall and combinedf measures are similar to before, de-
spite the fact that the performance measure is rather different. The order of the two
leading algorithms, which continue to return similarf scores has now changed, but
otherwise the ranking remains the same.
The ‘detected’ column shows the total number of rectangles that were detected
compared. To put these figures in perspective, the total number of ground-truth rectan-
gles in these images is 2261.
33

6.3 Results on Sample Images
We viewed many of the results of each program, especially the two leaders, to gain an
impression of the strengths and weaknesses of each system. In each of the following
images the ground truth rectangles are identified with red2 long-dashed lines, while the
estimated rectangles are shown with white dotted lines.
Figure 15 shows the output of HWDavid on an image where both HWDavid and
Ashida perform poorly. On this test HWDavid identifies lots of false text rectan-
gles, while Ashida returns just one rectangle that has no intersection with the ground
truth rectangle (“TAXI”). The reason for HWDavid’s false detections appears to be the
strong edge features present in the windows of the building. Note that the heuristics
have partially filtered out the vertical run of windows on the left of Figure 15, but not
the horizontal run of windows close to the center of the image.
All the algorithms under test are somewhat inconsistent in their ability to locate
text. In some cases they detect noisy, hard-to-read text, while in other cases they miss
text that to the human eye is very clear. For example, HWDavid detects some of the
text in Figure 16, while missing other parts such asSV that are in the same font and
appear equally clear. HWDavid has anf -score of 0.65 for this image, while Ashida
returns no rectangles and scores 0.0.
Figure 17 shows a case where Ashida correctly locates the text (“15”) in the image
and achieves anf -score of 0.88, but HWDavid returns no rectangles and scores 0.0.
Incidentally, we also tried running Ashida on a grey-scale version of this image, with
the result that it scored 0.0, having failed to identify any rectangles.
Figure 18 shows a case where HWDavid found a valid text character that the human
tagger had either missed, or considered not worthy of tagging. While HWDavid was
unfairly punished here, it still achieved anf score of 0.65 on this image, and the effect
this missing tag had on the overall performance score of HWDavid was miniscule.
Todoran returned a rectangle covering the entire image for this example, and scored
0.04. Ashida returned a only single rectangle, for the middle text line, and scored 0.28.
Wolf, on the other hand, returned a rectangle for each of the three main lines of text,
2Light grey, if you are reading a monochrome version of this paper.
34

Figure 15: An image on which both leading algorithms score poorly.
and scored 0.51. Unfortunately, each rectangle was slightly over-sized, a phenomenon
we observed in many cases with Wolf, which certainly had a detrimental effect on
its score. Also note that HWDavid cuts “Language” in half with the larger rectangle.
This behaviour is certainly undesirable for subsequent OCR, but it is not adequately
punished with our somewhat simplistic performance measure.
7 Combining the Individual Text Locaters (by Lin)
As shown in the testing results in Table 2, the best individual text locator only achieves
a precision rate of 0.55 and recall rate of 0.46. Obviously, it is still a very hard problem.
This fact prompts us to look into the combination of the text locators, since combination
proves to be very effective to push the envelope in character recognition [22]. However,
there is little existing research on the combination methods for text locating. Equipped
with four state-of-the-art systems, we are able to explore this area with initial success.
35

Figure 16: An image where HWDavid beats Ashida.
7.1 Problem definition
The combination of text locators can be formulated as follows: Each text locator out-
puts a set of detected rectanglesRi(i = 1, 2, . . . , m) wherem is the number of text
locators. The combination algorithm will generate a new set of rectanglesR, which is
a function ofR1, R2, . . . Rm:
R = f(R1, R2, . . . , Rm)
However, designing combination functions for text locating is a complex problem.
Many widely used combination methods such as voting cannot be directly used for text
locating because there can be various cases of two-dimensional relationships of two
rectangles, as illustrated in Figure 19:
36

Figure 17: A hard to read image that Ashida does well on, while HWDavid scores zero.
• Two rectangles are identical (Figure 19.a).
• Two rectangles are very similar (Figure 19.b).
• Two rectangles partly overlap (Figure 19.c).
• One rectangle falls into the other one (Figure 19d).
• Two rectangles do not overlap at all (Figure 19.e).
7.2 Solution
We have proposed a combination system specifically targeting the four submitted text-
locating systems. We divided the 500 testing images into two subsets: The first 250
images are for used for designing and tuning the combination algorithm (combination
training set), and the remaining 250 images are kept exclusively for testing (combina-
tion test set). The combination algorithm is designed to exploit the relative merits of
37
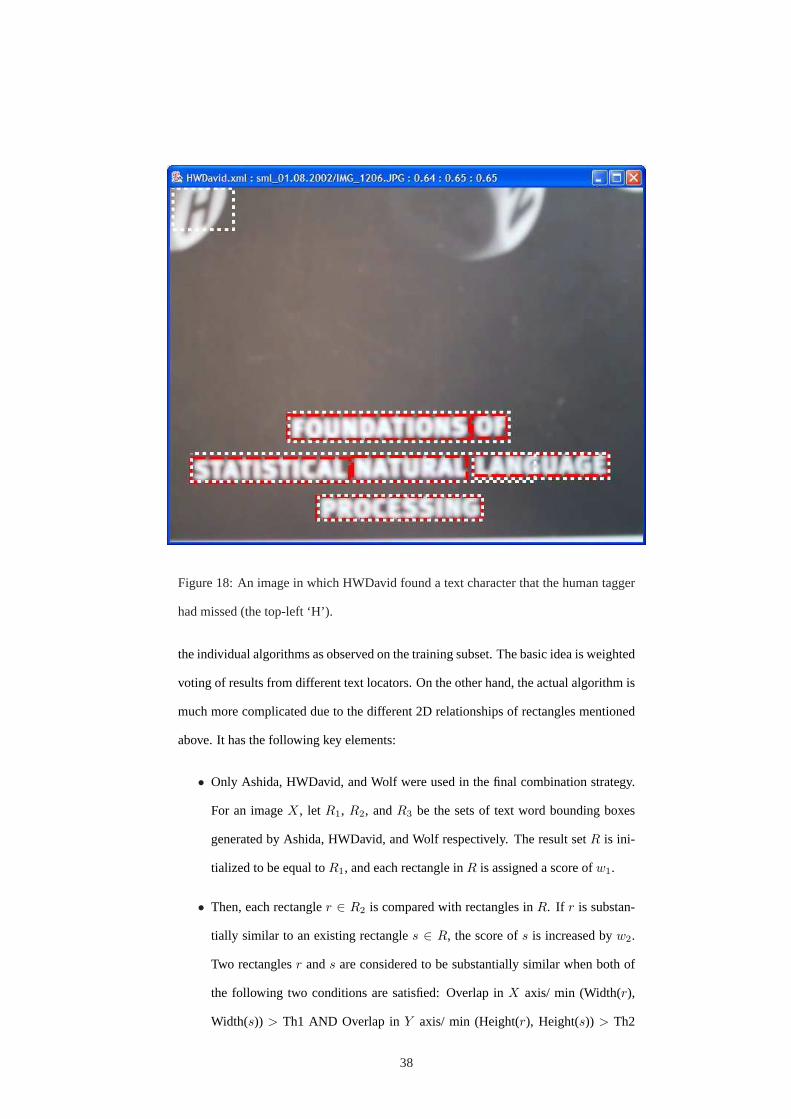
Figure 18: An image in which HWDavid found a text character that the human tagger
had missed (the top-left ‘H’).
the individual algorithms as observed on the training subset. The basic idea is weighted
voting of results from different text locators. On the other hand, the actual algorithm is
much more complicated due to the different 2D relationships of rectangles mentioned
above. It has the following key elements:
• Only Ashida, HWDavid, and Wolf were used in the final combination strategy.
For an imageX, let R1, R2, andR3 be the sets of text word bounding boxes
generated by Ashida, HWDavid, and Wolf respectively. The result setR is ini-
tialized to be equal toR1, and each rectangle inR is assigned a score ofw1.
• Then, each rectangler ∈ R2 is compared with rectangles inR. If r is substan-
tially similar to an existing rectangles ∈ R, the score ofs is increased byw2.
Two rectanglesr ands are considered to be substantially similar when both of
the following two conditions are satisfied: Overlap inX axis/ min (Width(r),
Width(s)) > Th1 AND Overlap inY axis/ min (Height(r), Height(s)) > Th2
38
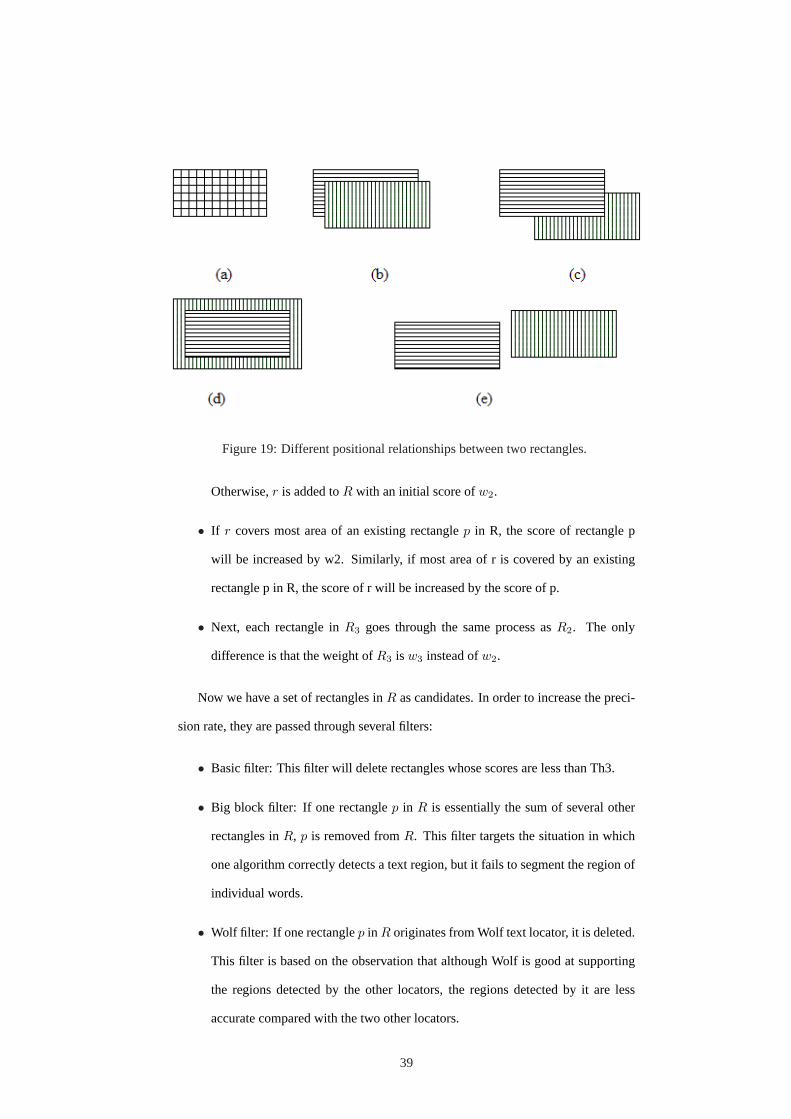
Figure 19: Different positional relationships between two rectangles.
Otherwise,r is added toR with an initial score ofw2.
• If r covers most area of an existing rectanglep in R, the score of rectangle p
will be increased by w2. Similarly, if most area of r is covered by an existing
rectangle p in R, the score of r will be increased by the score of p.
• Next, each rectangle inR3 goes through the same process asR2. The only
difference is that the weight ofR3 is w3 instead ofw2.
Now we have a set of rectangles inR as candidates. In order to increase the preci-
sion rate, they are passed through several filters:
• Basic filter: This filter will delete rectangles whose scores are less than Th3.
• Big block filter: If one rectanglep in R is essentially the sum of several other
rectangles inR, p is removed fromR. This filter targets the situation in which
one algorithm correctly detects a text region, but it fails to segment the region of
individual words.
• Wolf filter: If one rectanglep in R originates from Wolf text locator, it is deleted.
This filter is based on the observation that although Wolf is good at supporting
the regions detected by the other locators, the regions detected by it are less
accurate compared with the two other locators.
39

System precision recall f
Combined 0.53 0.53 0.50
Ashida 0.51 0.43 0.45
HWDavid 0.43 0.47 0.42
Wolf 0.27 0.49 0.30
Todoran 0.17 0.19 0.16
Table 5: Text locating results on the 250 image combination test set.
7.3 Combination Results
As shown in the above algorithm, there are a few parameters, weights, and thresholds
to be set. These parameters were tuned one by one to achieve best average f-value on
the combination training set. The final combination weights were 1, 0.8,0.7 for Ashida,
HWDavid, and Wolf respectively, roughly proportional to their individual f-values.
On the combination training set, the combination scheme scores 0.60, 0.57 and
0.57 for precision, recall andf respectively.
The more interesting result is how well the combination scheme performs on the
combination test set, shown in Table 5. Compared to Ashida, the best individual algo-
rithm, the combination scheme improves the precision by 0.02, the recall by 0.10 and
thef -measure by 0.05.
The computational cost of applying the combination rules is negligible, but the ex-
tra cost of running all the individual algorithms (as compared with just running the
single best one) could be significant - refer to Table 2 for timing information. If the al-
gorithms were run in parallel on different machines, however, then this objection would
be overcome. The web service model offers a straightforward and entirely platform and
language independent way of achieving this.
Figure 20 shows an example of how the combination scheme has improved the text
locating result on a particular image. In this case, the precision, recall andf scores
were as follows: Ashida: (0.0, 0.0, 0.0); HWDavid: (0.29, 0.68, 0.41) Wolf: (0.13,
0.45, 0.20); Combined: (0.49, 0.68, 0.57).
Although the proposed method has significantly improved the f-value over the best
40
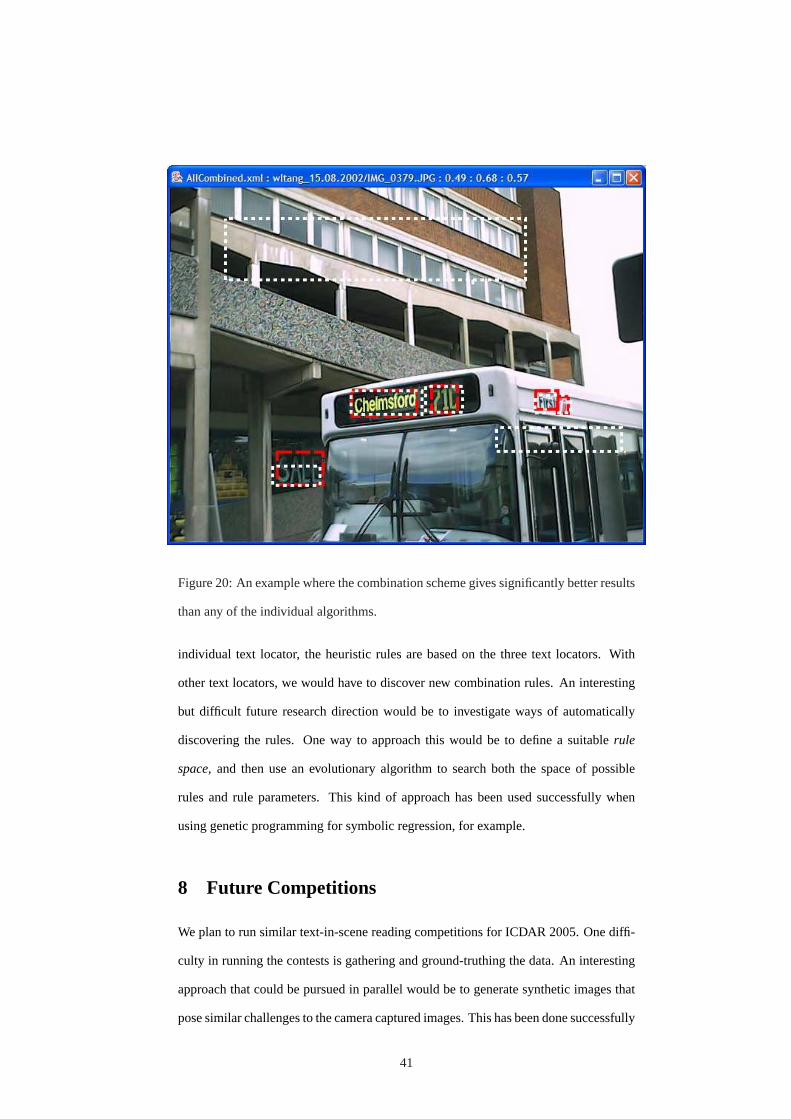
Figure 20: An example where the combination scheme gives significantly better results
than any of the individual algorithms.
individual text locator, the heuristic rules are based on the three text locators. With
other text locators, we would have to discover new combination rules. An interesting
but difficult future research direction would be to investigate ways of automatically
discovering the rules. One way to approach this would be to define a suitablerule
space, and then use an evolutionary algorithm to search both the space of possible
rules and rule parameters. This kind of approach has been used successfully when
using genetic programming for symbolic regression, for example.
8 Future Competitions
We plan to run similar text-in-scene reading competitions for ICDAR 2005. One diffi-
culty in running the contests is gathering and ground-truthing the data. An interesting
approach that could be pursued in parallel would be to generate synthetic images that
pose similar challenges to the camera captured images. This has been done successfully
41
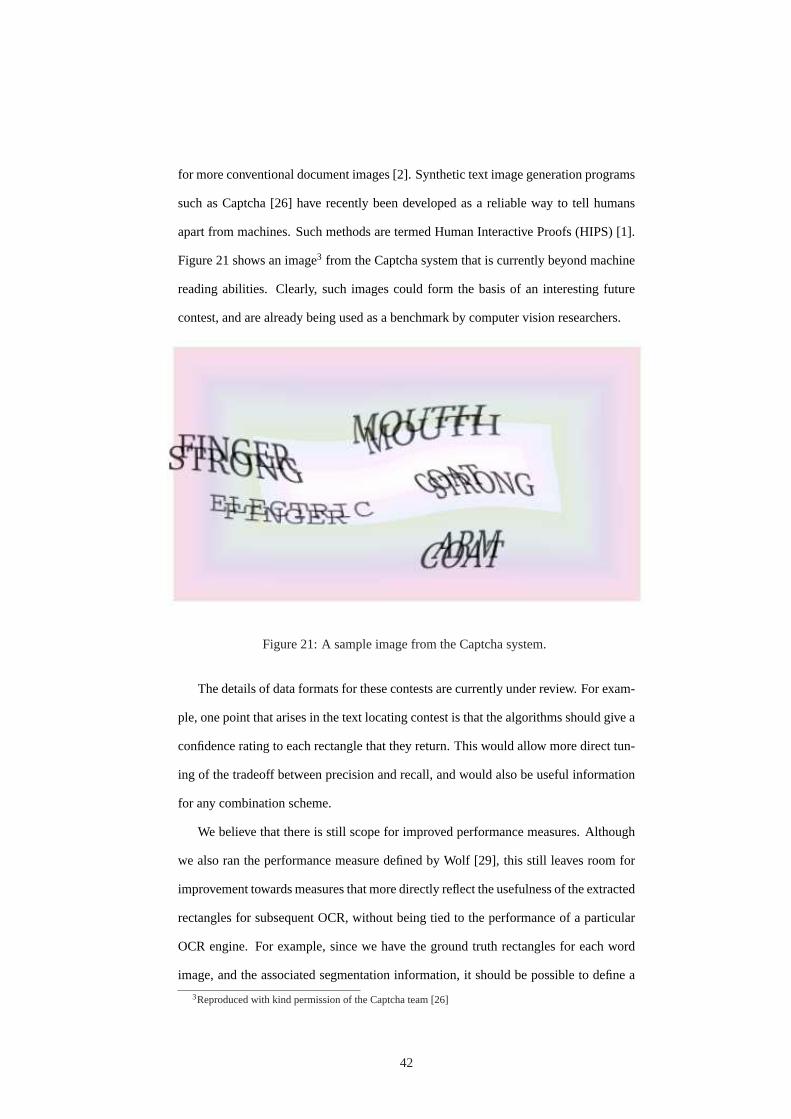
for more conventional document images [2]. Synthetic text image generation programs
such as Captcha [26] have recently been developed as a reliable way to tell humans
apart from machines. Such methods are termed Human Interactive Proofs (HIPS) [1].
Figure 21 shows an image3 from the Captcha system that is currently beyond machine
reading abilities. Clearly, such images could form the basis of an interesting future
contest, and are already being used as a benchmark by computer vision researchers.
Figure 21: A sample image from the Captcha system.
The details of data formats for these contests are currently under review. For exam-
ple, one point that arises in the text locating contest is that the algorithms should give a
confidence rating to each rectangle that they return. This would allow more direct tun-
ing of the tradeoff between precision and recall, and would also be useful information
for any combination scheme.
We believe that there is still scope for improved performance measures. Although
we also ran the performance measure defined by Wolf [29], this still leaves room for
improvement towards measures that more directly reflect the usefulness of the extracted
rectangles for subsequent OCR, without being tied to the performance of a particular
OCR engine. For example, since we have the ground truth rectangles for each word
image, and the associated segmentation information, it should be possible to define a
3Reproduced with kind permission of the Captcha team [26]
42

measure that strongly penalises cutting a word in half, while offering some leeway for
algorithms to return a small border around a word without any penalty.
A disappointing aspect of the competitions as a whole was the failure to convert the
expressions of interest in the character and word recognition contests into actual entries.
This may be explained partly by the difficulty of the data, and partly by the effort
involved in adapting one’s algorithms to the specific problems at hand. In response
to the latter point, we shall offer the character recognition data in a simple fixed-size
monochrome format (such as the one used for MNIST [11] ). While there is a risk of
discarding important information in the normalisation process, the advantage of using
a standard format perhaps out-weighs this, and doing this would not preclude also
offering the full image datasets.
9 Conclusions
Our main intention in running these competitions was to gain a clear picture of the state
of the art of reading text in scenes. This has so far been partially successful for the text
locating problem, but not for the other problems. The public datasets we captured and
tagged should make a useful contribution to research in this area.
Some of the text locating entries shared certain common characteristics, such as the
use of an image pyramid to achieve some degree of scale invariance. In fact, the only
system not to use an image pyramid was the winning method ofAshida. Even when the
methods are broadly similar, there are significant differences in the details, however,
such as the image processing operators used to extract candidate text blocks and the
features used to subsequently classify them. Some of the systems (such as Ashida
and Wolf) could be directly deployed as trainable object detectors (e.g. to detect faces
in an image), while others (such as HWDavid) have hard-coded features specifically
designed for text detection. Each system involves a significant degree of tuning to the
type of data it is likely to encounter. While it is a difficult notion to quantity, it appears
that the amount of tuning used was a significant factor in the success of each method,
with the leading two methods being better tuned than the trailing two. In particular, the
43

HWDavid and Wolf systems are very similar, and we believe the wide disparity in their
respective performances is largely due to the extent to which each system was tuned.
Note however, that all tuning was done on the training set, and the entrants were
not given the test data until after the competition had finished.
Where systems were tuned to the task at hand (in particular, the leading entries,
Ashida and HWDavid), all tuning was done by hand, based on human intuition and
empirical evidence of training set performance. This is a labour-intensive process,
and it would be interesting to investigate making these or indeed other text-locating
methods self-tuning.
Whether tuning is done by hand, or by an automated optimisation algorithm, the
number of evaluations of the objective function limits the extent to which a system can
be optimised. A good choice of objective function would be the overallf score on the
training set,f(T ). Since there are 500 images in the training set, each evaluation of
f(T ) takes a few minutes for HWDavid, versus a few hours for Wolf, making HW-
David much more amenable to tuning. All of the systems under test are complex and
have multiple stages. The extent to which the various stages in each system could be
independently (and therefore more quickly) tuned is unclear, and worth further inves-
tigation.
Running the text locating contest has given us some tentative insights into the gen-
eral strengths and weaknesses of the submitted systems. These can be summarized as
follows:
• Even the best performing systems are inconsistent, detecting some text while
missing apparently very similar text in the same image.
• There were major differences in the speed of the submitted systems. For ex-
ample, Ashida was nearly 30 times slower than HWDavid, though a little more
accurate.
• Variations in illumination, such as reflections from light sources cause significant
problems.
• Variations in scale cause significant problems, in that the same image presented
44

to a system at a different, but equally readable scale to the human eye, causes
different regions to be identified by the algorithms.
The combination scheme presented in Section 7 has significantly improved on the
best individual text locater, and raises the interesting possibility of developing trainable
combination schemes whose parameters can be directly estimated from the data.
Reading text in scenes, and other noisy images, is still very much a challenging
problem. We believe that the results of the ICDAR 2003 text locating contest give an
idea of the state of the art in this particular sub-problem. We would like to encourage
researchers to use our freely available datasets to test their systems.
Acknowledgements We are grateful to The Government Communications Head-
quarters (GCHQ), Cheltenham, UK for funding the software development and data
capture for these competitions.
We also thank the anonymous reviewers for their many helpful suggestions.
References
[1] H. Baird and K. Popat. Human interactive proofs and document image analysis. InPro-
ceedings of Fifth IAPR International Workshop on Document Analysis Systems, pages 507
– 518, Princeton NJ, USA, 2002.
[2] H. S. Baird. Document image defect models and their uses.Proceedings IAPR 2nd Inter-
national Conference on Document Analysis and Recognition, pages 62 – 67, 1993.
[3] J. Bezdek.Pattern Recognition with Fuzzy Objective Function Algorithms. Plenum, New
York, (1981).
[4] G. Bieber and J. Carpenter. Introduction to service-oriented pro-
gramming (rev 2.1). http://www.openwings.org/download/
specs/ServiceOrientedIntroduction.pdf .
[5] C. J. C. Burges. A tutorial on support vector machines for pattern recognition.Data Mining
and Knowledge Discovery, 2(2):121–167, 1998.
[6] M. Celenk. A color clustering technique for image segmentation.Computer Vision Graph-
ics Image Processing, 52:145–170, 1990.
45

[7] J. Chang, X. Chen, A. Hanneman, J. Yang, and A. Waibel. A robust approach for recog-
nition of text embedded in natural scenes.Proceedings of International Conference on
Pattern Recognition, pages 204 – 207, 2002.
[8] P. Clark and M. Mirmehdi. Combining statistical measures to find image text regions. In
Proceedings of the 15th International Conference on Pattern Recognition, pages 450–453.
IEEE Computer Society, 2000.
[9] R. Collobert and S. Bengio. SVMTorch: Support vector machines for large-scale regres-
sion problems.Journal of Machine Learning Research, 1:143–160, 2001.
[10] A. K. Jain and B. Yu. Automatic text location in images and video frame.Pattern Recog-
nition, 31(12):2055–2076.
[11] Y. LeCun. The MNIST database of handwritten digits.
http://yann.lecun.com/exdb/mnist/ .
[12] H. Li, D. Doermann, and O. Kia. Automatic text detection and tracking in digital videos.
IEEE Transactions on Image Processing, 9(1):147–156, 2000.
[13] J. Liang, I. Phillips, and R. Haralick. Performance evaluation of document layout analysis
algorithms on the UW data set. InDocument Recognition IV, Proceedings of the SPIE,
pages 149–160, 1997.
[14] R. Lienhart and A. Wernicke. Localizing and segmenting text in images and videos.IEEE
Transactions on Circuits and Systems for Video Technology, 12(4):256 – 268, 2002.
[15] J. Liu and Y. H. Yang. Multiresolution color image segmentation.IEEE Transactions on
Pattern Analysis and Machine Intelligence, 16:689–700, 1994.
[16] S. Lucas. Web-based evaluation and deployment of pattern recognizers.Proceedings of
International Conference on Pattern Recognition, pages 419 –422, 2002.
[17] D. Maio, D. Maltoni, R. Cappelli, J. Wayman, and A. Jain. Fvc2000: Fingerprint veri-
fication competition. IEEE Transactions on Pattern Analysis and Machine Intelligence,
24:402 – 412, (2002).
[18] V. Mariano, J. Min, J.-H. Park, R. Kasturi, D. Mihalcik, H. Li, D. Doermann, and T. Drayer.
Performance evaluation of object detection algorithms. InProceedings. 16th International
Conference on Pattern Recognition, Volume 3, pages 965 – 969. IEEE Computer Society,
2002.
[19] N.Otsu. A threshold selection method from gray-level histograms.IEEE Transactions on
Systems, Man and Cybernetics, 9(1):6266, 1979.
[20] S. H. Park, I. D. Yun, and S. U. Lee. Color image segmentation based on 3-d clustering: a
morphological approach.Pattern Recognition, 31(8):1061–1076, 1998.
46

[21] T. Pavlidis. Algorithms for Graphics and Image Processing. Computer Science Press,
Rockville, MD, 1982.
[22] A. Rahman and M. Fairhurst. Multiple classifier decision combination strategies for char-
acter recognition: A review.International Journal of Document Analysis and Recognition,
5(4):166 – 194, 2003.
[23] D. Stork. The open mind initiative.http://www.openmind.org .
[24] L. Todoran, M. Worring, and A. Smeulders. Data groundtruth, complexity and evalua-
tion measures for color document analysis. InProceedings of Fifth IAPR International
Workshop on Document Analysis Systems, pages 519–531, Princeton NJ, USA, 2002.
[25] O. Trier and A. Jain. Goal-directed evaluation of binarization methods.IEEE Transactions
on Pattern Analysis and Machine Intelligence, 17:1191–1201, 1995.
[26] L. von Ahn, M. Blum, N. Hopper, J. Langford, and U. Manber. The CAPTCHA project.
http://www.captcha.net .
[27] V.Vapnik. Statistical learning theory. John Wiley & Sons, 1998.
[28] V.Wu, R. Manmatha, and E. Riseman. Textfinder: An automatic system to detect and rec-
ognize text in images.IEEE Transactions on Pattern Analysis and Machine Intelligence,
21(11):1224–1229, 1999.
[29] C. Wolf. Text Detection in Images taken from Videos Sequences for Semantic Indexing.
PhD thesis, Institut National de Sciences Appliques de Lyon, 20, rue Albert Einstein,
69621 Villeurbanne Cedex, France, 2003.
[30] C. Wolf, J. Jolion, and F. Chassaing. Procede de detection de zones de texte dans une
image video. Patent France Telecom, Ref.No. FR 01 06776, June 2001.
[31] C. Wolf, J. Jolion, and C. Laurent. Extraction d’informations textuelles contenues dans
les images et les sequences audio-visuelles par une approche de type machinea vecteurs
supports. Patent France Telecom, Ref.No. FR 03 11918, Oct. 2003.
[32] C. Wolf and J.-M. Jolion. Extraction and recognition of artificial text in multimedia docu-
ments. Technical Report 2002.01, Technical Report, Recomnaissance de Formes et Vision
Lab, 2002.
[33] C. Wolf and J.-M. Jolion. Extraction and recognition of artificial text in multimedia docu-
ments.Pattern Analysis and Applications, 6(4):309–326, 2003.
[34] C. Wolf, J.-M. Jolion, and F. Chassaing. Text localization, enhancement and binariza-
tion in multimedia documents. InProceedings of the International Conference on Pattern
Recognition, volume 4, pages 1037–1040, 2002.
47

[35] V. Wu, R. Manmatha, and E. M. Riseman. Finding text in images. InProceedings of 2nd
ACM Conference on Digital Libraries, pages 3–12, 1997.
48
Copyright © 2022 FDOKUMEN