Double spin-echo sequence for rapid spectroscopic imaging of hyperpolarized< sup> 13 C
Upload
independentCategory
view
0download
0
I-kazTM-Based Analysis of Cutting Force Signals for Tool Condition Monitoring in Turning Process
Muhammad Rizal1,2,a, Jaharah A. Ghani1,b, Mohd Zaki Nuawi1,3,c,
and Che Hassan Che Haron1,d 1Department of Mechanical and Materials Engineering, Faculty of Engineering and Built
Environment, Universiti Kebangsaan Malaysia, 43600, Bangi, Malaysia
2Department of Mechanical Engineering, Faculty of Engineering, Syiah Kuala University (UNSYIAH), 23111, Darussalam, Banda Aceh, Indonesia
3Centre for Automotive Research, Faculty of Engineering and Built Environment, Universiti Kebangsaan Malaysia, 43600 UKM Bangi, Selangor, Malaysia
[email protected], [email protected], [email protected], [email protected]
Keywords: Cutting force, low-cost sensor, I-kazTM method, tool condition monitoring
Abstract. Cutting force is an important signal in machining process and has been widely used for
tool condition monitoring. Monitoring the condition of the cutting tool in the machining process is
very important to maintain the machined surface quality and consequently reduce inspection costs
and increase productivity. This paper utilizes I-kaz-based analysis of cutting force signal to monitor
the status of tool wear. The cutting force signals are measured by two channels of strain gauge that
were mounted on the surface of tool holder. Experiments were carried out by turning hardened
carbon steel and cutting force signals were analyzed using I-kazTM
technique by integrating two
component of signals (I-kaz 2D, Z2∞), I-kaz of cutting force (Z
∞ of Fy), and I-kaz of feed force (Z
∞ of
Fx). The results show that I-kaz of feed force can be effectively used to monitor tool wear
progression during turning operation.
Introduction
Tool wear is one of the primary factors affecting machining performance and machinability. It is
one of the important characteristics for tool condition monitoring. Progression of tool wear during
the cutting process causes the cutting forces to increase. Therefore, cutting force is very suitable to
be used as a reference for indirect measurement and monitoring of tool wear. Among the indirect
online tool wear monitoring methods, cutting force is one of the most commonly used variable as a
tool wear indicator [1].
Various methods for the interpretation of cutting force signals have been described in past
research. Jemielniak et al. [2] used the average and standard deviations values of cutting forces to
diagnose the tool wear. They reported that there is a conspicuous relation between tool wear and
standard deviation of feed force. Dimla and Lister [1] analyzed static and dynamic cutting force in
time and frequency domains. They concluded that the static force was the most sensitive indicator
to cutting condition changes such as depth of cut and feed rate. While in frequency domains, the
amplitude of the signal is found to increase monotonically with tool wear and falls sharply prior to
the point of entry into the tertiary wear zone. Das et al. [3] used cutting force average and analyzed
using force ratio for tool wear estimation. They reported that the increasing of force ratio (Fy/Fx)
with the progress of tool wear is evident. Chungchoo and Saini [4] applied skewness and kurtosis of
force distribution in fixed frequency band. It is reported that the frequency distribution pattern of
force signals is influenced by cutting conditions and tool wear. However, the cutting forces signals
have characteristics that can be extracted in both time and frequency domain.
Applied Mechanics and Materials Vol. 471 (2014) pp 203-207Online available since 2013/Dec/13 at www.scientific.net© (2014) Trans Tech Publications, Switzerlanddoi:10.4028/www.scientific.net/AMM.471.203
All rights reserved. No part of contents of this paper may be reproduced or transmitted in any form or by any means without the written permission of TTP,www.ttp.net. (ID: 202.185.32.3, University Kebangsaan Malaysia, Bangi, Malaysia-27/12/13,05:40:32)

This paper presents the I-kazTM
-based analysis of cutting force signals to detect tool wear
progression in turning process. However, the I-kaz method has been used in various study such as to
analyze strain signal for fatigue life evaluation [5], to analyze sound signals for sliding wear
monitoring of commercial bearing [6], to analyze ultrasound signals for tool life monitoring [7], and
also for tool wear monitoring by analyzing the cutting force signals in three channels using I-kaz
3D[8], and two channels using I-kaz 2D[9, 10]. The advantage of I-kazTM
method is the
characteristic of signals can be obtained in time and frequency domain and its sensitive to amplitude
and frequency changes [11]. The main objective of this research is to correlate the progression of
tool wear to the I-kaz coefficient (Z∞) of cutting and feed force, and I-kaz 2D coefficient (Z2
∞) then
compared the results of analysis.
I-KazTM
Method
The main idea of the I-kazTM
method is to decompose a dynamic signal into three frequency
ranges including a low-frequency (LF) range of 0 – 0.25fmax, a high-frequency (HF) range of
0.25fmax – 0.5fmax and a very high-frequency (VF) range of 0.5fmax. In order to measure the scattering
of the data distribution, the variance 2 for each frequency band is calculated, as shown in Eq. (1).
The variance determines the average magnitude deviation of instantaneous points with respect to
the mean value.
∑ ( )
∑ (
)
∑ (
)
(1)
where L2, H
2, V
2 and xi
L, xi
H, xi
V are the variances and data for the i-sample of time in the LF, HF
and VF range, respectively. Whereas µL, µH and µV are the means of each frequency bands, and N is
the number of data points. Since the I-kazTM
method was developed based on the concept of data
scattering about the data centroid and classified the display according to inferential statistics, the I-
kaz coefficient can be symbolized by Z∞ and written in terms of the variance, 2
, as shown in Eq.
(2) and Eq. (3).
√(
) ( ) (
) (2)
√∑ (
)
∑ (
)
∑ (
)
(3)
Eq. (3) can be simplified in terms of the kurtosis and standard deviation. The kurtosis, K, is the
signal’s 4th statistical moment, which is the global signal statistic and is highly sensitive to the
spikiness of the data. The Gaussian distribution of the kurtosis value is approximately 3.0. A higher
kurtosis value indicates the presence of more extreme values than should be normally found in a
Gaussian distribution. The kurtosis can be defined as:
∑( )
(4)
where N is the number of data, s is the standard deviation. Therefore, Eq. (2) can be written in terms
of the kurtosis, K, and the standard deviation, s, as:
√
(5)
where KL, KH, and KV are the kurtosis of the signal in the LF, HF and VF ranges, and sL, sH, sV are
the standard deviations of signal in the LF, HF and VF ranges, respectively.
I-kaz 2D emerged from I-kaz method, which analyzed signals from two channels or two
sensors. It differs from the I-kaz method, whereby the signal does not need to be decomposed to
204 Noise, Vibration and Comfort
three different frequency ranges. But, each signal is computed directly by using kurtosis and
standard deviation. Therefore, the I-kaz 2D coefficient can be symbolized by Z2∞ and written as
following:
√
(6)
where N is the number of data points, KI and KII are the kurtosis of signal in channel I and channel
II, and sI and sII are the standard deviation of signal in channel I and channel II respectively.
Experimental Test
The experiment conducted in this study was deployed by using low cost sensors which consist of
two strain gauges. The data acquisition system consists of a signal conditioner (OM2-163 and
OM2-8608-230AC), a data acquisition device (DT9836) and MATLAB software. A simple tool
holder (PDJNR2020-43) that has a sectional shape of 20 x 20 mm was used for mounting the strain
gauges on the top and the left side of the tool holder to measure the cutting forces due to the
deflection in both the tangential direction, Fc (cutting force) and feed direction, Ff (feed force). The
distance of strain gauge to the tip of tool insert was fixed at 45 mm. The sensor configuration used a
quarter-bridge strain gauge set in the signal conditioning device. The cutting force signals were
collected at sampling rate of 1 kHz, and then analyzed by the computer using signal analysis based
on the I-kaz and I-kaz 2D methods.
The machining tests were performed on a CNC Colchester Master Tornado T4 lathe machine
under dry cutting conditions. An orthogonal insert was used in the experiments for machining of a
hardened JIS S45C carbon steel bar. The dimensions of the material were 200 mm in length and 85
mm in diameter. The tool insert used was a coated carbide insert (Toolmex CNMG120404-MB)
with NC30P grade 5. The tool had a rhombic 80º shape, 4.76 mm thickness and a 0.4 mm nose
radius. During the turning operation, the insert was periodically removed from the tool holder, and
the flank wear on the flank face was measured using a Mitutoyo toolmaker’s microscope. The
measured parameter to represent the progress of wear was the average flank wear land, VB. The
flank wear data were recorded since the first cutting pass until the flank wear reached 0.3 mm. It is
a standard recommended value in defining a tool life end-point criterion based on ISO 3685-1993.
The experiment test was conducted on cutting speed equal to 200 m/min, feed rate equal to 0.20
mm/rev, and depth of cut equal to 1.2 mm.
Results and Discussion
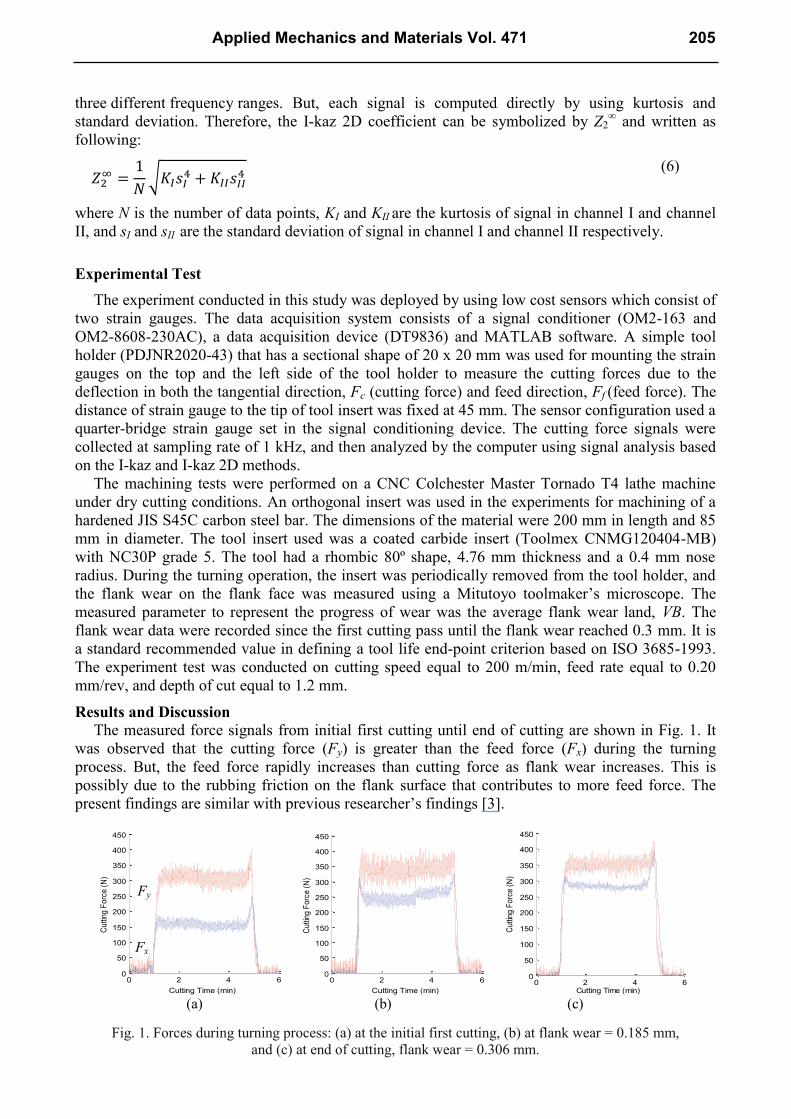
The measured force signals from initial first cutting until end of cutting are shown in Fig. 1. It
was observed that the cutting force (Fy) is greater than the feed force (Fx) during the turning
process. But, the feed force rapidly increases than cutting force as flank wear increases. This is
possibly due to the rubbing friction on the flank surface that contributes to more feed force. The
present findings are similar with previous researcher’s findings [3].
(a) (b) (c)
Fig. 1. Forces during turning process: (a) at the initial first cutting, (b) at flank wear = 0.185 mm,
and (c) at end of cutting, flank wear = 0.306 mm.
0 2 4 60
50
100
150
200
250
300
350
400
450
Cutting Time (min)
Cuttin
g F
orc
e (
N)
0 2 4 60
50
100
150
200
250
300
350
400
450
Cutting Time (min)
Cuttin
g F
orc
e (
N)
0 2 4 60
50
100
150
200
250
300
350
400
450
Cutting Time (min)
Cuttin
g F
orc
e (
N)
Fy
Fx
Applied Mechanics and Materials Vol. 471 205
From Fig. 1, with new and sharp tool insert, the average cutting force is 310 N. After cutting
about 17 minutes or flank wear = 0.306 mm, the average cutting force increases to 357 N or
13.16%. Meanwhile, the average feed force at the initial first cutting is only 158 N, and at the end
of cutting it increases to about 285 N or 44.56%.
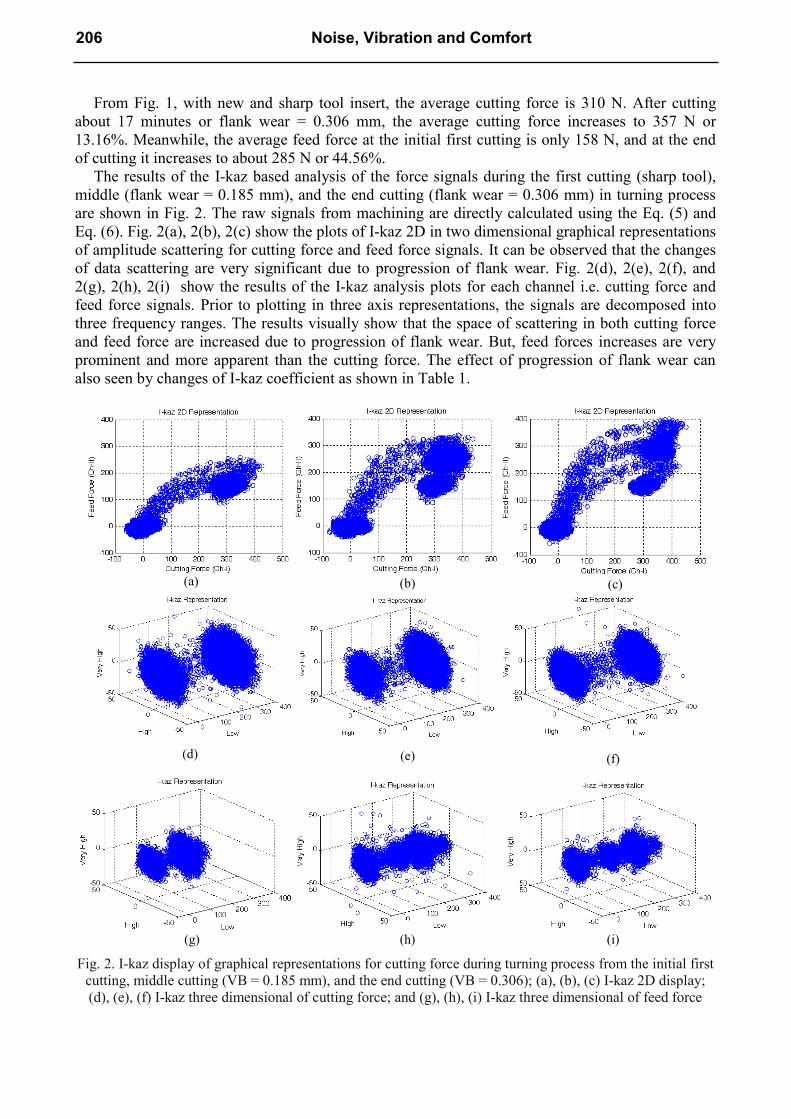
The results of the I-kaz based analysis of the force signals during the first cutting (sharp tool),
middle (flank wear = 0.185 mm), and the end cutting (flank wear = 0.306 mm) in turning process
are shown in Fig. 2. The raw signals from machining are directly calculated using the Eq. (5) and
Eq. (6). Fig. 2(a), 2(b), 2(c) show the plots of I-kaz 2D in two dimensional graphical representations
of amplitude scattering for cutting force and feed force signals. It can be observed that the changes
of data scattering are very significant due to progression of flank wear. Fig. 2(d), 2(e), 2(f), and
2(g), 2(h), 2(i) show the results of the I-kaz analysis plots for each channel i.e. cutting force and
feed force signals. Prior to plotting in three axis representations, the signals are decomposed into
three frequency ranges. The results visually show that the space of scattering in both cutting force
and feed force are increased due to progression of flank wear. But, feed forces increases are very
prominent and more apparent than the cutting force. The effect of progression of flank wear can
also seen by changes of I-kaz coefficient as shown in Table 1.
Fig. 2. I-kaz display of graphical representations for cutting force during turning process from the initial first
cutting, middle cutting (VB = 0.185 mm), and the end cutting (VB = 0.306); (a), (b), (c) I-kaz 2D display;
(d), (e), (f) I-kaz three dimensional of cutting force; and (g), (h), (i) I-kaz three dimensional of feed force
(a) (b) (c)
(d) (e) (f)
(g) (h) (i)
206 Noise, Vibration and Comfort
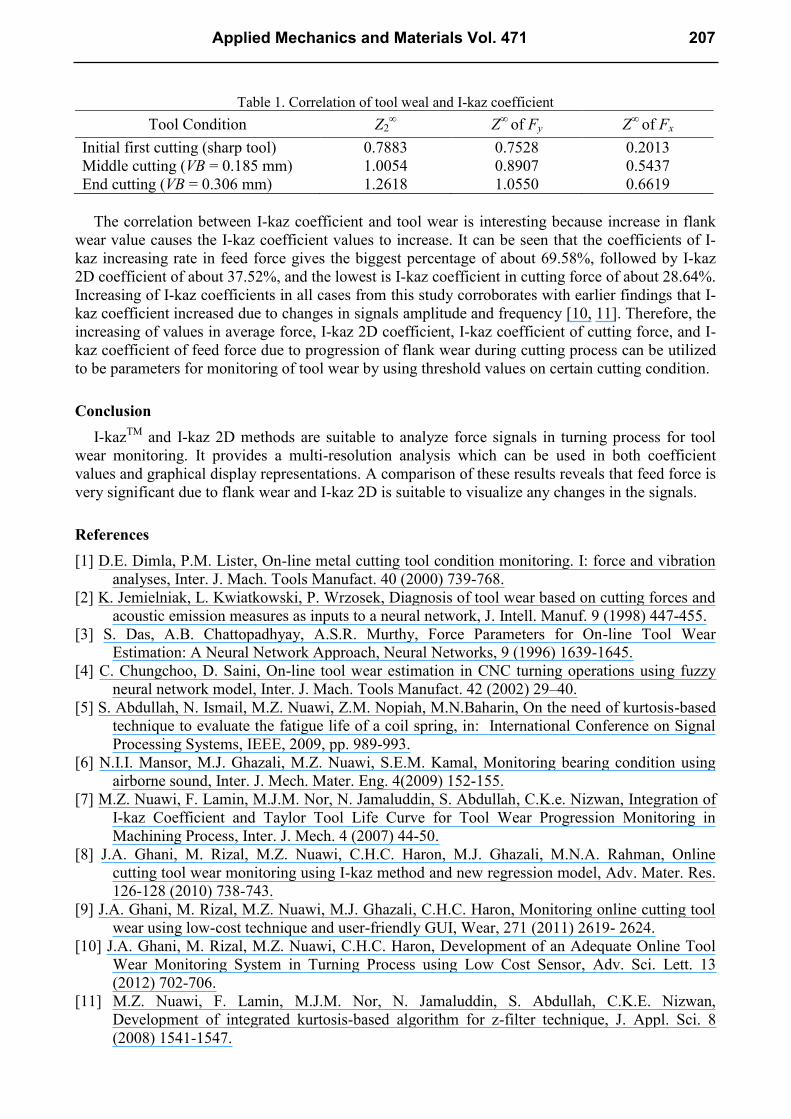
Table 1. Correlation of tool weal and I-kaz coefficient
Tool Condition Z2∞ Z
∞ of Fy Z
∞ of Fx
Initial first cutting (sharp tool) 0.7883 0.7528 0.2013
Middle cutting (VB = 0.185 mm) 1.0054 0.8907 0.5437
End cutting (VB = 0.306 mm) 1.2618 1.0550 0.6619
The correlation between I-kaz coefficient and tool wear is interesting because increase in flank
wear value causes the I-kaz coefficient values to increase. It can be seen that the coefficients of I-
kaz increasing rate in feed force gives the biggest percentage of about 69.58%, followed by I-kaz
2D coefficient of about 37.52%, and the lowest is I-kaz coefficient in cutting force of about 28.64%.
Increasing of I-kaz coefficients in all cases from this study corroborates with earlier findings that I-
kaz coefficient increased due to changes in signals amplitude and frequency [10, 11]. Therefore, the
increasing of values in average force, I-kaz 2D coefficient, I-kaz coefficient of cutting force, and I-
kaz coefficient of feed force due to progression of flank wear during cutting process can be utilized
to be parameters for monitoring of tool wear by using threshold values on certain cutting condition.
Conclusion
I-kazTM
and I-kaz 2D methods are suitable to analyze force signals in turning process for tool
wear monitoring. It provides a multi-resolution analysis which can be used in both coefficient
values and graphical display representations. A comparison of these results reveals that feed force is
very significant due to flank wear and I-kaz 2D is suitable to visualize any changes in the signals.
References
[1] D.E. Dimla, P.M. Lister, On-line metal cutting tool condition monitoring. I: force and vibration
analyses, Inter. J. Mach. Tools Manufact. 40 (2000) 739-768.
[2] K. Jemielniak, L. Kwiatkowski, P. Wrzosek, Diagnosis of tool wear based on cutting forces and
acoustic emission measures as inputs to a neural network, J. Intell. Manuf. 9 (1998) 447-455.
[3] S. Das, A.B. Chattopadhyay, A.S.R. Murthy, Force Parameters for On-line Tool Wear
Estimation: A Neural Network Approach, Neural Networks, 9 (1996) 1639-1645.
[4] C. Chungchoo, D. Saini, On-line tool wear estimation in CNC turning operations using fuzzy
neural network model, Inter. J. Mach. Tools Manufact. 42 (2002) 29–40.
[5] S. Abdullah, N. Ismail, M.Z. Nuawi, Z.M. Nopiah, M.N.Baharin, On the need of kurtosis-based
technique to evaluate the fatigue life of a coil spring, in: International Conference on Signal
Processing Systems, IEEE, 2009, pp. 989-993.
[6] N.I.I. Mansor, M.J. Ghazali, M.Z. Nuawi, S.E.M. Kamal, Monitoring bearing condition using
airborne sound, Inter. J. Mech. Mater. Eng. 4(2009) 152-155.
[7] M.Z. Nuawi, F. Lamin, M.J.M. Nor, N. Jamaluddin, S. Abdullah, C.K.e. Nizwan, Integration of
I-kaz Coefficient and Taylor Tool Life Curve for Tool Wear Progression Monitoring in
Machining Process, Inter. J. Mech. 4 (2007) 44-50.
[8] J.A. Ghani, M. Rizal, M.Z. Nuawi, C.H.C. Haron, M.J. Ghazali, M.N.A. Rahman, Online
cutting tool wear monitoring using I-kaz method and new regression model, Adv. Mater. Res.
126-128 (2010) 738-743.
[9] J.A. Ghani, M. Rizal, M.Z. Nuawi, M.J. Ghazali, C.H.C. Haron, Monitoring online cutting tool
wear using low-cost technique and user-friendly GUI, Wear, 271 (2011) 2619- 2624.
[10] J.A. Ghani, M. Rizal, M.Z. Nuawi, C.H.C. Haron, Development of an Adequate Online Tool
Wear Monitoring System in Turning Process using Low Cost Sensor, Adv. Sci. Lett. 13
(2012) 702-706.
[11] M.Z. Nuawi, F. Lamin, M.J.M. Nor, N. Jamaluddin, S. Abdullah, C.K.E. Nizwan,
Development of integrated kurtosis-based algorithm for z-filter technique, J. Appl. Sci. 8
(2008) 1541-1547.
Applied Mechanics and Materials Vol. 471 207

Noise, Vibration and Comfort 10.4028/www.scientific.net/AMM.471 I-KazTM-Based Analysis of Cutting Force Signals for Tool Condition Monitoring in Turning Process 10.4028/www.scientific.net/AMM.471.203
Copyright © 2022 FDOKUMEN