Hypotheses to explain patterns of population change among breeding bird species in England
14
Hypotheses to explain patterns of population change among breeding bird species in England Chris B. Thaxter a, * , Andrew C. Joys a , Richard D. Gregory b , Stephen R. Baillie a , David G. Noble a a British Trust for Ornithology, The Nunnery, Thetford, Norfolk IP24 2PU, UK b Royal Society for the Protection of Birds, The Lodge, Sandy, Bedfordshire SG19 2DL, UK article info Article history: Received 30 October 2009 Received in revised form 7 May 2010 Accepted 8 May 2010 Available online 11 June 2010 Keywords: Afro-Palaearctic Bioclimatic zone Breeding habitat Climatic niche Over-wintering Migration abstract Population declines are now evident across many taxa, but within each assemblage there is often consid- erable variation in constituent population trends. We used bird population trends produced from the BTO/JNCC Common Birds Census (CBC) and the RSPB/BTO/JNCC Breeding Bird Survey (BBS), to test five main hypotheses to explain population changes of 59 breeding species in England (1967–2006): (1) breeding habitat, (2) predation risk to nest sites, (3) species climatic niche, (4) migration strategy, and (5) over-wintering bioclimatic zones of migrants, accounting for additional demographic and ecological traits. In absence of phylogenetic inter-relatedness, farmland species declined more than woodland spe- cies, most pronounced prior to 1986, probably reflecting agricultural intensification (1). We found limited support that ground nesters have declined more than above-ground or cavity nesters (2), and there was some indication that species with more northerly European distributions showed larger declines than more southerly-distributed species (3). Larger population declines were recorded for Afro-tropical migrants than species wintering in Europe or in the UK, most notable prior to 1986 (4). However, declines were not uniform across all migrants (5) – species over-wintering in the arid savannah bioclimatic zone of Africa decreased in population between 1967 and 1976, whereas species wintering in humid West African forest and savannah declined more after 1987. These results suggest both breeding and over-win- tering factors influenced population trends. European countries signed to the Convention on the Conser- vation of Migratory Species of Wild Animals are required to protect and conserve populations of migrants. Understanding connectivity between breeding and over-wintering populations, and similar environmental pressures experienced within over-wintering areas may be a useful step towards mitigat- ing against further declines in migrants. Ó 2010 Elsevier Ltd. All rights reserved. 1. Introduction Assemblages of species across a wide-range of taxa have shown substantial population declines in recent years (IUCN, 2010). How- ever, patterns of population changes for constituent species are of- ten mixed within these assemblages; therefore, the potential risk of extinction is not evenly distributed (Owens and Bennett, 2000; Thomas et al., 2004). Thus, understanding shared ecological and life history characteristics of species showing similar population changes, including those declining species more vulnerable to extinction, can help direct conservation and management priorities (Amano and Yamaura, 2007). A number of widespread and common breeding bird species have experienced declines in both population size and breeding range in the United Kingdom (UK) and across Western Europe in recent dec- ades (Fuller et al., 1995; Gregory et al., 2007; Reif et al., 2008). The causes of these declines in the UK have been well documented for a number of farmland species (Fuller et al., 1995; Newton, 2004b), and have been attributed to intensification of agricultural practice within breeding habitats (O’Connor and Shrubb, 1986; Fuller et al., 1995; Robinson and Sutherland, 2002). Within the UK, larger de- clines have also been reported for farmland species than woodland species. However, patterns are generally mixed for woodland spe- cies across Europe (Hewson et al., 2007; Reif et al., 2008; Seoane and Carrascal, 2008), many of which have suffered declines in popu- lation (Fuller et al., 2005; Gregory et al., 2007; Hewson et al., 2007), and are placed as having unfavourable conservation status in the UK (Eaton et al., 2009) and at the European level (Birdlife International, 2004). Specialist species, reliant on specific habitat niches and diets have, showed larger declines than generalist species for both habi- tats (Siriwardena et al., 1998; Gregory et al., 2004, 2007; Hewson et al., 2007). Predation or lack of nesting sites may also limit popula- tions of species if for instance habitat change exposes them to great- er risk (Martin and Clobert, 1996; Chalfoun et al., 2002; Gregory et al., 2007). 0006-3207/$ - see front matter Ó 2010 Elsevier Ltd. All rights reserved. doi:10.1016/j.biocon.2010.05.004 * Corresponding author. Tel.: +44 1842 750050; fax: +44 1842 750030. E-mail address: [email protected] (C.B. Thaxter). Biological Conservation 143 (2010) 2006–2019 Contents lists available at ScienceDirect Biological Conservation journal homepage: www.elsevier.com/locate/biocon
-
Upload
independent -
Category
Documents
-
view
6 -
download
0
Transcript of Hypotheses to explain patterns of population change among breeding bird species in England

Biological Conservation 143 (2010) 2006–2019
Contents lists available at ScienceDirect
Biological Conservation
journal homepage: www.elsevier .com/locate /b iocon
Hypotheses to explain patterns of population change among breeding bird speciesin England
Chris B. Thaxter a,*, Andrew C. Joys a, Richard D. Gregory b, Stephen R. Baillie a, David G. Noble a
a British Trust for Ornithology, The Nunnery, Thetford, Norfolk IP24 2PU, UKb Royal Society for the Protection of Birds, The Lodge, Sandy, Bedfordshire SG19 2DL, UK
a r t i c l e i n f o
Article history:Received 30 October 2009Received in revised form 7 May 2010Accepted 8 May 2010Available online 11 June 2010
Keywords:Afro-PalaearcticBioclimatic zoneBreeding habitatClimatic nicheOver-winteringMigration
0006-3207/$ - see front matter � 2010 Elsevier Ltd. Adoi:10.1016/j.biocon.2010.05.004
* Corresponding author. Tel.: +44 1842 750050; faxE-mail address: [email protected] (C.B. Thaxte
a b s t r a c t
Population declines are now evident across many taxa, but within each assemblage there is often consid-erable variation in constituent population trends. We used bird population trends produced from theBTO/JNCC Common Birds Census (CBC) and the RSPB/BTO/JNCC Breeding Bird Survey (BBS), to test fivemain hypotheses to explain population changes of 59 breeding species in England (1967–2006): (1)breeding habitat, (2) predation risk to nest sites, (3) species climatic niche, (4) migration strategy, and(5) over-wintering bioclimatic zones of migrants, accounting for additional demographic and ecologicaltraits. In absence of phylogenetic inter-relatedness, farmland species declined more than woodland spe-cies, most pronounced prior to 1986, probably reflecting agricultural intensification (1). We found limitedsupport that ground nesters have declined more than above-ground or cavity nesters (2), and there wassome indication that species with more northerly European distributions showed larger declines thanmore southerly-distributed species (3). Larger population declines were recorded for Afro-tropicalmigrants than species wintering in Europe or in the UK, most notable prior to 1986 (4). However, declineswere not uniform across all migrants (5) – species over-wintering in the arid savannah bioclimatic zoneof Africa decreased in population between 1967 and 1976, whereas species wintering in humid WestAfrican forest and savannah declined more after 1987. These results suggest both breeding and over-win-tering factors influenced population trends. European countries signed to the Convention on the Conser-vation of Migratory Species of Wild Animals are required to protect and conserve populations ofmigrants. Understanding connectivity between breeding and over-wintering populations, and similarenvironmental pressures experienced within over-wintering areas may be a useful step towards mitigat-ing against further declines in migrants.
� 2010 Elsevier Ltd. All rights reserved.
1. Introduction
Assemblages of species across a wide-range of taxa have shownsubstantial population declines in recent years (IUCN, 2010). How-ever, patterns of population changes for constituent species are of-ten mixed within these assemblages; therefore, the potential riskof extinction is not evenly distributed (Owens and Bennett, 2000;Thomas et al., 2004). Thus, understanding shared ecological andlife history characteristics of species showing similar populationchanges, including those declining species more vulnerable toextinction, can help direct conservation and management priorities(Amano and Yamaura, 2007).
A number of widespread and common breeding bird species haveexperienced declines in both population size and breeding range inthe United Kingdom (UK) and across Western Europe in recent dec-ades (Fuller et al., 1995; Gregory et al., 2007; Reif et al., 2008). The
ll rights reserved.
: +44 1842 750030.r).
causes of these declines in the UK have been well documented fora number of farmland species (Fuller et al., 1995; Newton, 2004b),and have been attributed to intensification of agricultural practicewithin breeding habitats (O’Connor and Shrubb, 1986; Fuller et al.,1995; Robinson and Sutherland, 2002). Within the UK, larger de-clines have also been reported for farmland species than woodlandspecies. However, patterns are generally mixed for woodland spe-cies across Europe (Hewson et al., 2007; Reif et al., 2008; Seoaneand Carrascal, 2008), many of which have suffered declines in popu-lation (Fuller et al., 2005; Gregory et al., 2007; Hewson et al., 2007),and are placed as having unfavourable conservation status in the UK(Eaton et al., 2009) and at the European level (Birdlife International,2004). Specialist species, reliant on specific habitat niches and dietshave, showed larger declines than generalist species for both habi-tats (Siriwardena et al., 1998; Gregory et al., 2004, 2007; Hewsonet al., 2007). Predation or lack of nesting sites may also limit popula-tions of species if for instance habitat change exposes them to great-er risk (Martin and Clobert, 1996; Chalfoun et al., 2002; Gregoryet al., 2007).

Table 1Table of hypotheses proposed to explain changes in population of breeding birds inEngland, together with associated predictions expected under each; one variable wastested under each hypothesis.
Hypothesis Prediction References
1. Breeding habitat Farmland species will showsteeper declines thanwoodland species due tolarger scale agriculturalhabitat changes that havetaken place
Fuller et al.(1995),Gregory et al.(2007)
2. Predation riskof nest
Species that nest on theground will be more at riskto predation than speciesnesting above-ground or incavities, hence will showbigger population declines
Gregory et al.(2007)
3. Climatic niche Species with more northerlyEuropean distributions, orreduced tolerance tomaximum southerlytemperatures will showdeclines compared tosoutherly distributed ormore temperature tolerantspecies
Jiguet et al.(2007),Moller et al.(2008)
4. MigrationStrategy
Species that over-winter inAfrica (Afro-tropicalmigrants) will show greaterdeclines than specieswintering in Europe, orspecies wintering withinthe UK
Sanderson et al.(2006)
5. Winteringbioclimatic zone
African migrants will differin their population trendslinked to whether theywinter in arid or humidbioclimatic zones
Hewson andNoble (2009)
C.B. Thaxter et al. / Biological Conservation 143 (2010) 2006–2019 2007
Population change, however, is not restricted to processesoperating in breeding habitats. Species that breed in Europe butwinter in Africa have shown larger population declines than thosethat are more sedentary (Kanyamibwa et al., 1990; Baillie andPeach, 1992; Berthold et al., 1998; Berthold, 2001; Sandersonet al., 2006; Moller et al., 2008). Such declines may be drivenby environmental conditions (Peach et al., 1991; Kanyamibwaet al., 1993), food availability (Newton, 2004a), and linked to cli-mate change; migrants may be at a competitive disadvantagecompared to shorter distance migrants or sedentary residentsthat can return earlier to breeding grounds (Sanderson et al.,2006). Among migrants, those species showing plasticity in tim-ing of migration and arrival times with breeding food resourcesare more likely to avoid trophic mis-matches (Both et al., 2006;Moller et al., 2008). Population changes of long-distance migrantsmay also depend on where species over-winter in Africa (Newton,2004a). For instance, wintering zones of African migrants canbroadly be delineated into arid Savannah zones of the Sahel andhumid tropic regions (‘‘bioclimatic zones”, Hewson and Noble,2009). Differences have been recorded between these groupingsfor woodland species in the UK, therefore, common climatic orhabitat-related challenges, such as intensity of land use, may befaced by species wintering in similar bioclimatic zones (Hewsonand Noble, 2009).
Species may also show population changes in relation to theirclimate envelope (Jiguet et al., 2007). Within Europe, specieswith more northerly breeding ranges and lower tolerance ofmaximum temperatures at the southern edge of their range haveshown largest declines within Europe, representing responses toclimate change (Julliard et al., 2004; Jiguet et al., 2007; Lemoineet al., 2007). Population changes have also been found to vary inrelation to body mass of species (Bennett and Owens, 2002;Amano and Yamaura, 2007), breeding population size (Henleet al., 2004), brain size (Shultz et al., 2005; Moller, 2008), andthe distance species are willing to fly to escape predation (Mol-ler, 2008). Therefore, identifying ecological drivers of populationsrelated to species traits in a comparative manner (e.g. Amanoand Yamaura, 2007; Seoane and Carrascal, 2008; Moller, 2008;Hewson and Noble, 2009) may help identify vulnerable speciesthat are not routinely monitored. This approach is potentiallymore cost-effective than investing large amounts of time and re-sources on individual species-intensive studies (Siriwardenaet al., 1998).
Within England, bird population trends are routinely pro-duced from the BTO/JNCC Common Birds Census (CBC) and theRSPB/BTO/JNCC Breeding Bird Survey (BBS). However, to datethere has been no complete ecological comparison betweenkey hypotheses of population change for the whole census timeperiod available. A recent study (Hewson and Noble, 2009) ana-lysed population changes using CBC data to its final year (2000),however the study focused on woodland sites, and did not in-clude assessment of some other variables such as climatic nichethat species adopt, which could also influence populationchanges.
Here, we test five hypotheses to explain changes in breedingbird populations for 59 species in England for the full time per-iod available (1966–2007); predictions under each are presentedin Table 1. We hypothesise that populations will vary in relationto (1) main breeding habitat (farmland and woodland), (2) pre-dation risk of nests (Ground, above-ground, and cavity nesters),(3) climatic niche (latitudinal midpoint of European breedingrange), (4) migration strategy used (Afro-tropical, European, orover-wintering in the UK); finally, we considered a hypothesisfor African migrants, testing whether trends are related to (5)specific bioclimatic zones in Africa.
2. Materials and methods
2.1. Monitoring programmes
We used long-running monitoring schemes that routinely pro-duce annual population trends for a wide-range of species, mainlythe CBC and BBS. The CBC began in 1962 using a territory mappingmethod for farmland and woodland plots, however this schemeended in 2000 and has now been replaced by the BBS, which beganin 1994 (see Risely et al., 2009 for sampling distribution). The BBSuses line-transect methodology consisting of two roughly parallel1 km length transects that are surveyed twice per breeding season(April–June), within a randomly allocated 1 � 1 km square of theNational Grid. Squares are selected through stratified random sam-pling by observer density. Both CBC and BBS surveys were run inparallel for seven years to allow calibration (Freeman et al.,2003) and for most species, population trends were not signifi-cantly different between the two surveys, providing a completetime series between 1966 and 2007. Where a difference was ob-served, species were excluded from analysis. We focus here ontrends for England rather than the UK, due to superior correspon-dence between CBC and BBS, given that most CBC survey plotswere located in England. We investigated 59 species, from the suiteof 69 species for which trends are routinely produced (Baillie et al.,2010). We excluded three introduced species (Little Owl Athenenoctua, Red-legged Partridge Alectoris rufa, Pheasant Phasianus col-chicus), four waterbirds (Coot Fulica atra, Mallard Anas platyrhyn-chos, Moorhen Gallinula chloropus and Mute Swan Cygnus olor),and three species where there was disparity between BBS and

2008 C.B. Thaxter et al. / Biological Conservation 143 (2010) 2006–2019
CBC trends (house sparrow Passer domesticus, sparrowhawkAccipiter nisus, and collared dove Streptopelia decaocto), assessedthrough statistical comparisons of the fluctuations and turningpoints of trends between the two schemes. A potential caveat tothese datasets is that changing detectability of species may influ-ence the likelihood of observing species over time; however, webelieve such effects would be minimal, albeit not yet quantified.
2.2. Generation of population indices
Data collected under CBC and the BBS consist of annual countsover a period of years at a series of sites. Population trends cantherefore be represented as a generalised linear model (GLM),modelling count as a function of site and year, using a Poisson errordistribution and log-link function (ter Braak et al., 1994; Panne-koek and van Strien, 1996). Individual parameter estimates weregenerated for each year providing a relative index of populationsize. To prevent short-term fluctuations, arising from natural pop-ulation variability and statistical error, having an undue influenceon the overall long-term trend, real GLM trends were smoothedto extract the long-term pattern of population change. We used anon-parametric thin-plate smoothing spline with 11 degrees offreedom specified from 0.3 times the number of years 1966–2007 (Fewster et al., 2000). To avoid problems associated with se-rial correlation within the count data, we used 199 bootstraps,sampling with replacement from the original dataset, which werealso smoothed, thus generating standard errors around the trendestimates. Generation of all population indices was undertaken inSAS 9.1 (SAS Institute, Inc).
2.3. Data manipulation of population indices
We used population change measures for each species acrossthe time series of population indices, calculated from the smoothedpopulation indices as a ratio (last/first year) for the period of inter-est. These changes were calculated for the complete time period1967–2006, and sub-divided into four equal time periods: 1967–1976, 1977–1986, 1987–1996, and 1997–2006 (Hewson and No-ble, 2009). The total time series was not split for any a priori deci-sion linked to specific ecological drivers. Rather, sub-periods wereused to obtain greater temporal resolution allowing detection ofpopulation change at different temporal scales, important wheninvestigating different ecological factors that may operate at differ-ent temporal scales (Hewson and Noble, 2009). For smoothed timeseries we did not include first and last years of the series (in thiscase 1966 and 2007), as these years have a large influence on thedirection of trend in the series and may thus bias populationchanges (see Baillie et al., 2010 for more details). The 95% confi-dence intervals across smoothed bootstraps provided a measureof precision of the change for each species for each time period.Examples of smoothed trends are displayed in Appendix (Fig. A1).
2.4. Ecological variables
Ecological variables included in this study are presented inAppendix (Table A1 and species population changes are shown inAppendix (Table A2). Population trends were assessed in relationto breeding habitat by splitting species into farmland (n = 18)and woodland (n = 29) (Wernham et al., 2002; Baillie et al.,2010). Species belonging to three other categories of urban, upland,and wetland were also analysed in this study. However, we did nothave adequate power to reliably test these habitat categories,hence we grouped these species as ‘‘other” (n = 12). We assessedwhether species that nest on the ground were more vulnerableto predation than those species that do not, by dividing species intoground nesters (n = 10), above-ground nesters (n = 31), and cavity
or hole nesters (n = 18), based on information in Wernham et al.(2002).
To test whether species varied in population in relation to theclimatic niche adopted, we extracted the latitudinal midpoint ofthe European breeding distribution (Lemoine et al., 2007), calcu-lated as the mean of the northernmost and southernmost extentsof species’ distributions from EBCC Atlas data (Hagemeijer andBlair, 1997). We also tested a separate variable of ‘‘thermal maxi-mum” (Jiguet et al., 2007), relating to the thermal tolerance of spe-cies at the leading southern edge of the species range, available for47 species. We tested whether long-distance migrants have shownbigger population declines than other species, by separating Afro-tropical migrants (n = 15) from those species that over-winter inEurope (n = 13) or remain within the UK over-winter (n = 31) (afterWernham et al., 2002). In a separate analysis, we examinedwhether Afro-tropical migrants showed differences to both Euro-pean and UK species combined. We investigated whether Afro-tropical migrants showed similarities in breeding population bybioclimatic wintering zones (Hewson and Noble, 2009); specieswere separated into wintering in humid tropics and forest southof the Sahel (typified by Guinean forest and savannah of West Afri-ca) (n = 7), and those wintering just south of the Sahara in an aridsavannah habitat (n = 8) (Cramp, 1977–1994; Curry-Lindahl, 1981;Wernham et al., 2002). Following Hewson and Noble (2009), we in-cluded chiffchaff Phylloscopus collybita in the ‘‘arid” grouping, butexcluded blackcap Sylvia atricapilla from migrant groupings, dueto a lack of evidence that the species crosses the Sahara (Wernhamet al., 2002). The Barn Swallow Hirundo rustica winters in southernAfrica, however of those species assessed here, it is the only speciesto do so, thus preventing a formal assessment of the southern bio-climatic zone. We therefore included barn swallow in the ‘‘humid”grouping, because it is known from ringing recoveries to passthrough the humid tropics of West Africa on migration (Wernhamet al., 2002).
Previous studies have suggested that populations may vary inrelation to population size (Sæther and Engen, 2002; Henle et al.,2004), relative brain mass (Shultz et al., 2005), body mass (Bennettand Owens, 2002; Amano and Yamaura, 2007), flight distance(Moller, 2008), and annual fecundity (Sæther and Bakke, 2000),the latter representing a good proxy for other demographic rates(Sæther, 1988). Therefore, these variables were controlled for inthis study. Population size and body mass of birds was extractedfrom Wernham et al. (2002). Breeding range was inevitably corre-lated to population size (e.g. Holt et al., 2002), and hence was notincluded in this study. We included a measure of productivity as asurrogate for annual fecundity, here calculated as the clutch sizemultiplied by the number of broods. Information on brain masswas taken from Garamszegi et al. (2002) and Moller et al. (2008),and following Moller et al. (2008), we used phylogenetically inde-pendent contrasts to regress brain mass (g) with body mass (g),accounting for phylogeny, and used the residuals of the relation-ship for inclusion as relative brain size in analyses [PIC regressionequation: log(brain mass) = 0.617 [±0.033] � log(body mass). Toallow for the possibility of non-linear relationships we also testedquadratic terms for continuous variables (e.g. Fig. 1 in Amano andYamaura, 2007), but initial analysis suggested no significantimprovement in prediction of population change for these terms.Hence to avoid excessive reduction in residual degrees of freedom,we excluded quadratic terms from further analysis. Diet and de-gree of specialisation has been found to influence populationtrends in some studies (Gregory et al., 2007). We did not includediet in this study because it was confounded by breeding habitatwhere a higher proportion of seed-consumers were present forfarmland species. Population change, breeding population size,and body mass were log transformed, and latitudinal midpoint ofbreeding range was centralised, prior to analyses.

67−06 67−76 77−86 87−96 97−06−80
−60
−40
−20
0
20
40
60
80
Popu
latio
n ch
ange
% (0
= n
o ch
ange
)
Farmland (n = 18)Woodland (n = 29)Other (n = 12)
(a)
67−06 67−76 77−86 87−96 97−06−80
−60
−40
−20
0
20
40
60
80*
Above ground (n = 31)Ground (n = 10)Hole/cavity (n = 18)
(b)
67−06 67−76 77−86 87−96 97−06−80
−60
−40
−20
0
20
40
60
80
Popu
latio
n ch
ange
% (0
= n
o ch
ange
)
Observation periods (years)
African (n = 15)European (n = 13)UK (n = 31)
(c)
67−06 67−76 77−86 87−96 97−06−80
−60
−40
−20
0
20
40
60
80
Observation periods (years)
* * *
* * ** * *
Arid (n = 7)Humid (n = 8)(d)
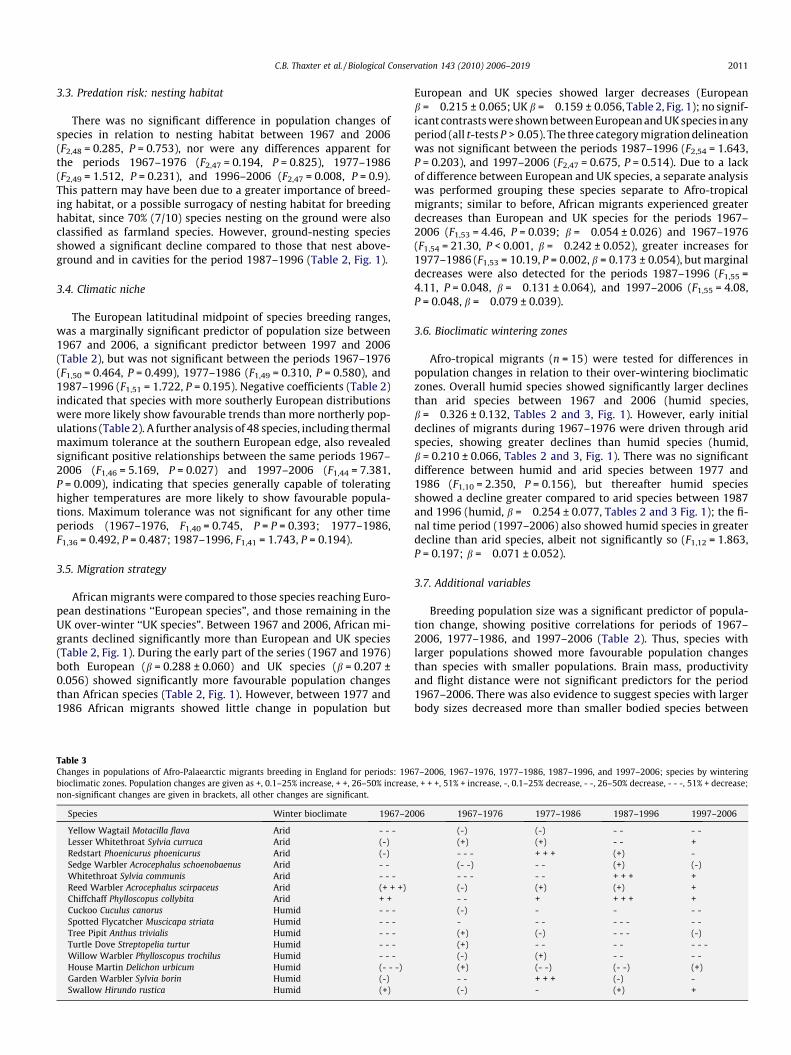
Fig. 1. Changes in breeding population of species (±1 SE) in England in relation to: (a) Breeding habitat: farmland, woodland, and ‘‘other” (see text for details); (b) Predationrisk to nest sites: ground nesters, above-ground nesters, and cavity nesters; (c) Migration strategy: species wintering in the UK, compared to species wintering in Europe, andspecies wintering in Africa; and (d) Afro-tropical migrants: bioclimatic zones of humid and arid zones; ‘‘�” denotes significant multivariate result; see Table 3 for significanceof coefficient levels.
C.B. Thaxter et al. / Biological Conservation 143 (2010) 2006–2019 2009
2.5. Statistical analyses
Univariate analyses were initially used to explore relation-ships and understand patterns between ecological variables anddependent variables; these are presented in Appendix(Table A3). We then performed complete multivariate analysestesting hypotheses relating to breeding habitat, predation risk,climatic niche, and migration strategy using the full suite of 59species; separate analyses were then conducted for Afro-tropicalmigrants (n = 15) only, to test the variable of bioclimatic winter-ing zones. We used phylogenetic generalised least squares(PGLS) regression to control for phylogenetic dependence inour data (Grafen, 1989; Martins and Hansen, 1997). We usedthe avian phylogeny of Thomas (2008) and obtained genetic dis-tances of branch lengths between species using the availableelectronic version of the maximum credibility tree. The treewas processed and incorporated into PGLS models using theAnalysis of Phylogenetics and Evolution (APE) package (Paradis,2004) in R V. 2.10.1. (The R Development Core Team, 2010)(Appendix (Fig. A2). Within PGLS models, the covariance matrixwas modified to accommodate the magnitude of deviation froma standard Brownian motion structure through specifying a mea-sure of phylogenetic correlation k Freckleton et al., 2002. The kvalues for each model were tested against a model assumingBrownian Motion (k = 1), and a model with no phylogenticdependence (k = 0, Freckleton et al., 2002). The k values weresignificantly different from an ordinary least squares model of
zero in the majority of cases (likelihood ratio tests, P < 0.05),therefore we retained a phylogenetic correlation structure inall models.
To account for the hierarchical nature of these analyses (i.e. ini-tial GLM population trends, used in further PGLS analyses), wespecified model weights in all PGLS models of as log(1/SE) ofchange from bootstrapped smoothed population trends, thus giv-ing greater weighting to more precise estimates. All models werespecified using residual maximum likelihood (REML). Best modelswere selected through a step-down term dropping procedure usingall variables, and then sequentially removing non-significant termsuntil a minimum adequate model containing final significant pre-dictors was obtained (Zuur et al., 2009). All population changesare presented as b-estimates (±SE) from multivariate regressionmodels.
3. Results
3.1. General population trends
During the period 1967–2006, 56% species (33/59) declined,nine of which experienced significant declines greater than75%, with a further ten species experiencing significant declinesgreater than 50%. The greatest number of species experiencingsignificant declines was between 1977 and 1986 (31 species).Between the periods 1987–1996 and 1997–2006, similar num-
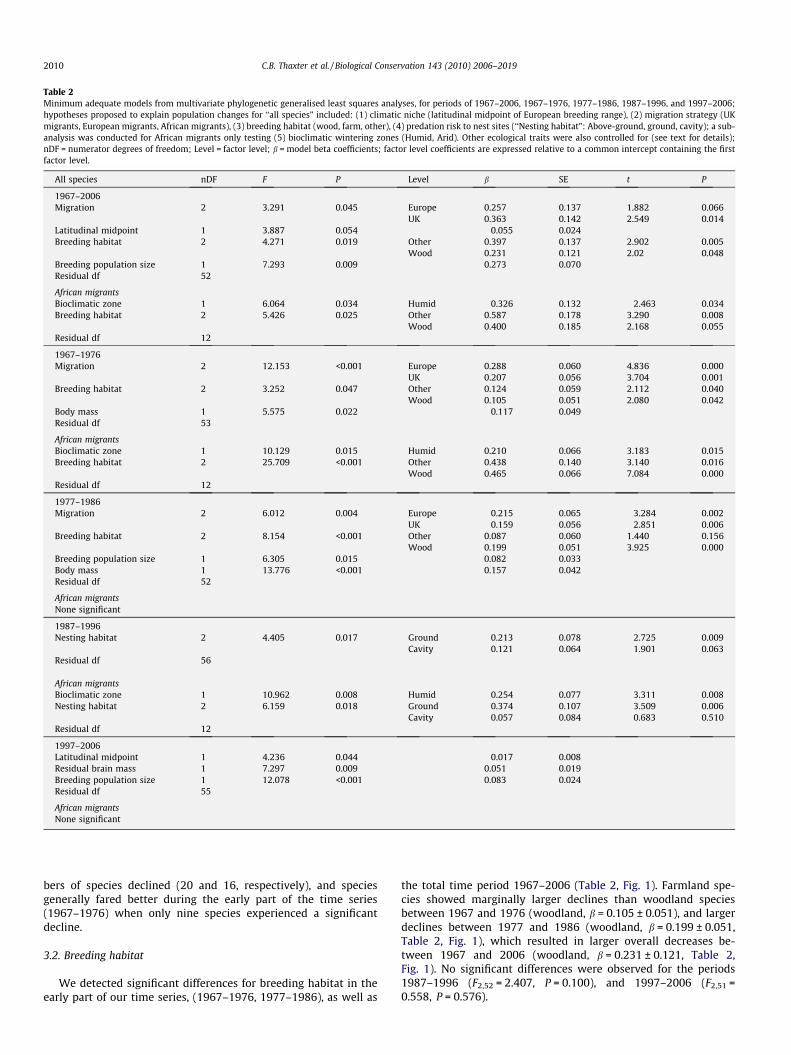
Table 2Minimum adequate models from multivariate phylogenetic generalised least squares analyses, for periods of 1967–2006, 1967–1976, 1977–1986, 1987–1996, and 1997–2006;hypotheses proposed to explain population changes for ‘‘all species” included: (1) climatic niche (latitudinal midpoint of European breeding range), (2) migration strategy (UKmigrants, European migrants, African migrants), (3) breeding habitat (wood, farm, other), (4) predation risk to nest sites (‘‘Nesting habitat”: Above-ground, ground, cavity); a sub-analysis was conducted for African migrants only testing (5) bioclimatic wintering zones (Humid, Arid). Other ecological traits were also controlled for (see text for details);nDF = numerator degrees of freedom; Level = factor level; b = model beta coefficients; factor level coefficients are expressed relative to a common intercept containing the firstfactor level.
All species nDF F P Level b SE t P
1967–2006Migration 2 3.291 0.045 Europe 0.257 0.137 1.882 0.066
UK 0.363 0.142 2.549 0.014Latitudinal midpoint 1 3.887 0.054 �0.055 0.024Breeding habitat 2 4.271 0.019 Other 0.397 0.137 2.902 0.005
Wood 0.231 0.121 2.02 0.048Breeding population size 1 7.293 0.009 0.273 0.070Residual df 52
African migrantsBioclimatic zone 1 6.064 0.034 Humid �0.326 0.132 �2.463 0.034Breeding habitat 2 5.426 0.025 Other 0.587 0.178 3.290 0.008
Wood 0.400 0.185 2.168 0.055Residual df 12
1967–1976Migration 2 12.153 <0.001 Europe 0.288 0.060 4.836 0.000
UK 0.207 0.056 3.704 0.001Breeding habitat 2 3.252 0.047 Other 0.124 0.059 2.112 0.040
Wood 0.105 0.051 2.080 0.042Body mass 1 5.575 0.022 �0.117 0.049Residual df 53
African migrantsBioclimatic zone 1 10.129 0.015 Humid 0.210 0.066 3.183 0.015Breeding habitat 2 25.709 <0.001 Other 0.438 0.140 3.140 0.016
Wood 0.465 0.066 7.084 0.000Residual df 12
1977–1986Migration 2 6.012 0.004 Europe �0.215 0.065 �3.284 0.002
UK �0.159 0.056 �2.851 0.006Breeding habitat 2 8.154 <0.001 Other 0.087 0.060 1.440 0.156
Wood 0.199 0.051 3.925 0.000Breeding population size 1 6.305 0.015 0.082 0.033Body mass 1 13.776 <0.001 0.157 0.042Residual df 52
African migrantsNone significant
1987–1996Nesting habitat 2 4.405 0.017 Ground �0.213 0.078 �2.725 0.009
Cavity �0.121 0.064 �1.901 0.063Residual df 56
African migrantsBioclimatic zone 1 10.962 0.008 Humid �0.254 0.077 �3.311 0.008Nesting habitat 2 6.159 0.018 Ground �0.374 0.107 �3.509 0.006
Cavity �0.057 0.084 �0.683 0.510Residual df 12
1997–2006Latitudinal midpoint 1 4.236 0.044 �0.017 0.008Residual brain mass 1 7.297 0.009 0.051 0.019Breeding population size 1 12.078 <0.001 0.083 0.024Residual df 55
African migrantsNone significant
2010 C.B. Thaxter et al. / Biological Conservation 143 (2010) 2006–2019
bers of species declined (20 and 16, respectively), and speciesgenerally fared better during the early part of the time series(1967–1976) when only nine species experienced a significantdecline.
3.2. Breeding habitat
We detected significant differences for breeding habitat in theearly part of our time series, (1967–1976, 1977–1986), as well as
the total time period 1967–2006 (Table 2, Fig. 1). Farmland spe-cies showed marginally larger declines than woodland speciesbetween 1967 and 1976 (woodland, b = 0.105 ± 0.051), and largerdeclines between 1977 and 1986 (woodland, b = 0.199 ± 0.051,Table 2, Fig. 1), which resulted in larger overall decreases be-tween 1967 and 2006 (woodland, b = 0.231 ± 0.121, Table 2,Fig. 1). No significant differences were observed for the periods1987–1996 (F2,52 = 2.407, P = 0.100), and 1997–2006 (F2,51 =0.558, P = 0.576).
C.B. Thaxter et al. / Biological Conservation 143 (2010) 2006–2019 2011
3.3. Predation risk: nesting habitat
There was no significant difference in population changes ofspecies in relation to nesting habitat between 1967 and 2006(F2,48 = 0.285, P = 0.753), nor were any differences apparent forthe periods 1967–1976 (F2,47 = 0.194, P = 0.825), 1977–1986(F2,49 = 1.512, P = 0.231), and 1996–2006 (F2,47 = 0.008, P = 0.9).This pattern may have been due to a greater importance of breed-ing habitat, or a possible surrogacy of nesting habitat for breedinghabitat, since 70% (7/10) species nesting on the ground were alsoclassified as farmland species. However, ground-nesting speciesshowed a significant decline compared to those that nest above-ground and in cavities for the period 1987–1996 (Table 2, Fig. 1).
3.4. Climatic niche
The European latitudinal midpoint of species breeding ranges,was a marginally significant predictor of population size between1967 and 2006, a significant predictor between 1997 and 2006(Table 2), but was not significant between the periods 1967–1976(F1,50 = 0.464, P = 0.499), 1977–1986 (F1,49 = 0.310, P = 0.580), and1987–1996 (F1,51 = 1.722, P = 0.195). Negative coefficients (Table 2)indicated that species with more southerly European distributionswere more likely show favourable trends than more northerly pop-ulations (Table 2). A further analysis of 48 species, including thermalmaximum tolerance at the southern European edge, also revealedsignificant positive relationships between the same periods 1967–2006 (F1,46 = 5.169, P = 0.027) and 1997–2006 (F1,44 = 7.381,P = 0.009), indicating that species generally capable of toleratinghigher temperatures are more likely to show favourable popula-tions. Maximum tolerance was not significant for any other timeperiods (1967–1976, F1,40 = 0.745, P = P = 0.393; 1977–1986,F1,36 = 0.492, P = 0.487; 1987–1996, F1,41 = 1.743, P = 0.194).
3.5. Migration strategy
African migrants were compared to those species reaching Euro-pean destinations ‘‘European species”, and those remaining in theUK over-winter ‘‘UK species”. Between 1967 and 2006, African mi-grants declined significantly more than European and UK species(Table 2, Fig. 1). During the early part of the series (1967 and 1976)both European (b = 0.288 ± 0.060) and UK species (b = 0.207 ±0.056) showed significantly more favourable population changesthan African species (Table 2, Fig. 1). However, between 1977 and1986 African migrants showed little change in population but
Table 3Changes in populations of Afro-Palaearctic migrants breeding in England for periods: 196bioclimatic zones. Population changes are given as +, 0.1–25% increase, + +, 26–50% increasnon-significant changes are given in brackets, all other changes are significant.
Species Winter bioclimate 1967–20
Yellow Wagtail Motacilla flava Arid - - -Lesser Whitethroat Sylvia curruca Arid (-)Redstart Phoenicurus phoenicurus Arid (-)Sedge Warbler Acrocephalus schoenobaenus Arid - -Whitethroat Sylvia communis Arid - - -Reed Warbler Acrocephalus scirpaceus Arid (+ + +)Chiffchaff Phylloscopus collybita Arid + +Cuckoo Cuculus canorus Humid - - -Spotted Flycatcher Muscicapa striata Humid - - -Tree Pipit Anthus trivialis Humid - - -Turtle Dove Streptopelia turtur Humid - - -Willow Warbler Phylloscopus trochilus Humid - - -House Martin Delichon urbicum Humid (- - -)Garden Warbler Sylvia borin Humid (-)Swallow Hirundo rustica Humid (+)
European and UK species showed larger decreases (Europeanb = �0.215 ± 0.065; UK b = �0.159 ± 0.056, Table 2, Fig. 1); no signif-icant contrasts were shown between European and UK species in anyperiod (all t-tests P > 0.05). The three category migration delineationwas not significant between the periods 1987–1996 (F2,54 = 1.643,P = 0.203), and 1997–2006 (F2,47 = 0.675, P = 0.514). Due to a lackof difference between European and UK species, a separate analysiswas performed grouping these species separate to Afro-tropicalmigrants; similar to before, African migrants experienced greaterdecreases than European and UK species for the periods 1967–2006 (F1,53 = 4.46, P = 0.039; b = �0.054 ± 0.026) and 1967–1976(F1,54 = 21.30, P < 0.001, b = �0.242 ± 0.052), greater increases for1977–1986 (F1,53 = 10.19, P = 0.002, b = 0.173 ± 0.054), but marginaldecreases were also detected for the periods 1987–1996 (F1,55 =4.11, P = 0.048, b = �0.131 ± 0.064), and 1997–2006 (F1,55 = 4.08,P = 0.048, b = �0.079 ± 0.039).
3.6. Bioclimatic wintering zones
Afro-tropical migrants (n = 15) were tested for differences inpopulation changes in relation to their over-wintering bioclimaticzones. Overall humid species showed significantly larger declinesthan arid species between 1967 and 2006 (humid species,b = �0.326 ± 0.132, Tables 2 and 3, Fig. 1). However, early initialdeclines of migrants during 1967–1976 were driven through aridspecies, showing greater declines than humid species (humid,b = 0.210 ± 0.066, Tables 2 and 3, Fig. 1). There was no significantdifference between humid and arid species between 1977 and1986 (F1,10 = 2.350, P = 0.156), but thereafter humid speciesshowed a decline greater compared to arid species between 1987and 1996 (humid, b = �0.254 ± 0.077, Tables 2 and 3 Fig. 1); the fi-nal time period (1997–2006) also showed humid species in greaterdecline than arid species, albeit not significantly so (F1,12 = 1.863,P = 0.197; b = �0.071 ± 0.052).
3.7. Additional variables
Breeding population size was a significant predictor of popula-tion change, showing positive correlations for periods of 1967–2006, 1977–1986, and 1997–2006 (Table 2). Thus, species withlarger populations showed more favourable population changesthan species with smaller populations. Brain mass, productivityand flight distance were not significant predictors for the period1967–2006. There was also evidence to suggest species with largerbody sizes decreased more than smaller bodied species between
7–2006, 1967–1976, 1977–1986, 1987–1996, and 1997–2006; species by winteringe, + + +, 51% + increase, -, 0.1–25% decrease, - -, 26–50% decrease, - - -, 51% + decrease;
06 1967–1976 1977–1986 1987–1996 1997–2006
(-) (-) - - - -(+) (+) - - +- - - + + + (+) -(- -) - - (+) (-)- - - - - + + + +(-) (+) (+) +- - + + + + +(-) - - - -- - - - - - - -(+) (-) - - - (-)(+) - - - - - - -(-) (+) - - - -(+) (- -) (- -) (+)- - + + + (-) -(-) - (+) +

2012 C.B. Thaxter et al. / Biological Conservation 143 (2010) 2006–2019
1967 and 1976, but increased more between 1977 and 1986(Table 2). During the period 1997–2006, species with largerrelative brain size showed more favourable population changesthan species with smaller relative brain sizes (b = 0.051 ± 0.019,Table 2).
4. Discussion
This study has shown that population changes of breeding birdspecies in England were mainly driven by breeding habitat andmigration strategy, whereby farmland species declined more thanwoodland species (hypothesis 1), and Afro-tropical migrants havedeclined more than species wintering in European or the UK(hypothesis 4). However a key further finding was that migratoryspecies reaching African destinations have shown similarity inchanges in population in relation to bioclimatic wintering zonesin Africa (hypothesis 5). These conclusions were offset against asignificant effect of climatic niche (hypothesis 3), and were inde-pendent of phylogenetic relatedness between species, and con-founding variables that are also known to influence populationtrends.
4.1. Breeding habitat and predation risk to nest sites
Greater declines for farmland species than woodland specieswere observed between 1967 and 2006, but were most pro-nounced between 1977 and 1986, thus matching the well-docu-mented pattern observed by other studies (Chamberlain et al.,2000; Vickery et al., 2001). During this period, intensification ofagricultural practice has taken place, and changes in farming prac-tice have led to changes in land use, such as reduced over-winterstubbles, reducing available food for species, thus influencing sur-vival (Chamberlain et al., 2000; Vickery et al., 2001; Robinson andSutherland, 2002; Benton et al., 2003; Gillings et al., 2005). Withinbreeding habitats, we detected only limited support for predationrisk to nest sites influencing their trend (hypothesis 3). However,there was some evidence to suggest that ground-nesting specieshave showed greater declines than cavity nesters or above-groundnesters between 1987 and 1996, in line with previous findings ofGregory et al. (2007) for European woodland species.
4.2. Migration strategy and bioclimatic zones
Migratory status was of equal importance to breeding habitat inexplaining changes in population. Afro-tropical migrants showedsteeper declines than species wintering in Europe or the UK be-tween 1967 and 2006, and fluctuated similarly across the time ser-ies. This finding agrees with many other studies across Europe(Berthold et al., 1998; Berthold, 2001; Flade and Schwarz, 2004;Sanderson et al., 2006; Gregory et al., 2007). Within the UK, popu-lation declines have been recorded in migrants, including key stud-ies on whitethroat Sylvia communis, sand martin Riparia riparia andhouse martin Delichon urbica (Winstanley et al., 1974; Baillie et al.,2010). However, ascribing causes to migrant population changes isoften difficult, given that they may vary in relation to processesoperating on their breeding grounds, wintering grounds, andmigration routes (Newton, 2004a). A key driver may be climatechange, and the influence on the timing of arrivals of migrantsand their breeding phenology (Both et al., 2006; Moller et al.,2008). Species failing to adjust breeding and migration strategiesmay face trophic mis-matches, rendering them at a competitivedisadvantage compared to resident species (Moller et al., 2008).The use of stop-over sites on migration routes may also have bear-ing on survival and population trends (Schaub et al., 2005). How-ever, declines in some species of migrants may be linked to
reduced food availability and habitat degradation in dry open hab-itats across Africa (Sanderson et al., 2006). In particular, a period ofaridity occurred on the Western Sahel in the late 1960’s until ca.1990 when rainfall levels increased, albeit still lower than the30 years prior to 1960 (Nicholson et al., 2000). Such changes mostlikely impact on open habitats, leading to desertification, habitatdegradation, and reductions in over-winter food availability for mi-grants, and hence decreases in population and survival (Kan-yamibwa et al., 1990, 1993; Peach et al., 1991; Baillie and Peach,1992; Schaub et al., 2005; Robinson et al., 2008).
Indeed, our most significant finding was that populationchanges of African migrants differed significantly depending onover-wintering bioclimatic zones that species are believed to use.Between 1967 and 1976 declines in African migrants were driventhrough arid zone species wintering just south of the Sahara inan arid savannah habitat, most pronounced for redstart Phoenicu-rus phoenicurus and whitethroat. (Table 3). Little differences wereapparent between 1977 and 1986, however, between 1987 and1996 species wintering in humid tropics, typified by Guinean for-est and savannah south of the Sahel, showed significantly steeperdeclines than arid zone species (Table 3). Declines in humid zonespecies also continued between 1997 and 2006, although not sig-nificantly more so than arid zone species. Results here support pre-vious findings of Hewson and Noble (2009), but for a wider rangeof migrant species, thus giving greater certainty in the relation-ships between wintering zones and population changes, across alonger time period than previously considered.
Patterns of rainfall for open Savannah habitats prior to 1990may therefore match the decrease in arid zone migrants priorto 1986. Significant declines in most humid species between1987 and 1996 (Table 3), also suggests a possible common factoroperating. However, the situation is likely to be more complexgiven that some species may use the Sahel as an important stag-ing (Jones et al., 1996), and species may also move around dur-ing winter encountering different habitats (Jones, 1985). Theexact wintering areas of most African migrants are still some-what uncertain (Wernham et al., 2002), therefore linking finer-scale habitat changes with specific population changes may notcurrently be achievable. However, the approach of identifyingbroad divisions in the environment and shared pressures experi-enced by species could assist conservation priorities and focusfuture research.
4.3. Climatic niche
Species with more northerly distributions within Europe exhib-ited larger population declines between 1967 and 2006 in Englandthan those with a more southerly European distributions. This re-sult agrees with findings in other studies (Jiguet et al., 2007; Molleret al., 2008), and probably reflects broader patterns of climatechange impacting on biological diversity in northern latitudes (Par-mesan and Yohe, 2003). Likewise, in accordance with Jiguet et al.(2007), we observed that species with a lower thermal maximum(temperature at the hot edge of the climate envelope) showed lar-ger population declines that species with a higher tolerance oftemperatures. These species may be considered most sensitive toclimate warming, with population declines in turn driven by asso-ciated changes to environments and communities (Jiguet et al.,2007; Moller et al., 2008).
4.4. Additional factors
Relationships between annual fecundity (or correlated lifehistory traits) and population change (or proxies for extinctionrisk) have previously been recorded in other studies (Owensand Bennett, 2000; Cardillo et al., 2005; Amano and Yamaura,

C.B. Thaxter et al. / Biological Conservation 143 (2010) 2006–2019 2013
2007; Jiguet et al., 2007). However, we found no significant rela-tionship between our measure of productivity and populationchange. Changes in populations may also occur in relation torange contractions or population sizes, regulated by densitydependence (Sæther and Engen, 2002); in this study, specieswith larger populations have shown more favourable populationchanges between 1967–2006, 1977–1986, and 1997–2006. Wealso recorded significant negative and positive relationships forbody mass during consecutive periods of 1967–1976 and1977–1986, respectively. The explanation behind these resultsis unclear, but similar to Moller et al. (2008), may have been dri-ven by a small number of larger species that showed consider-able population changes during these periods. Species withlarger relative brain size showed more favourable populationchanges than species with smaller relative brain sizes during1997–2006. One reason for this slight discrepancy could bedue to African migratory species having smaller brains on aver-age than resident species (Sanderson et al., 2006). The results,however, agree with a separate study (Shultz et al., 2005), sug-gesting species with larger relative brain mass may be more
20
40
60
80
100
120
140
1966 1972 1978 1984 1990 1996 2002 2008
Inde
x (1
966
= 1
00)
Cuckoo
40
60
80
100
120
140
1966 1972 1978 1984 1990 1996 2002 2008
Inde
x (1
966
= 1
00)
Garden Warbler
0
20
40
60
80
100
120
140
1966 1972 1978 1984 1990 1996 2002 2008
Inde
x (1
966
= 1
00)
Spotted Flycatcher
Fig. A1. Smoothed trend indices for England showing changes in abundance between 1flycatcher) and an arid species (garden warbler) showing an initial decrease prior to 197495% confidence intervals.
adaptable to changes in resource availability than species withsmaller relative brain mass. A previous study for Europeanbreeding birds also found that species with longer flight dis-tances, and thus greater risks they may take when approachedby a predator, showed steeper population declines (Moller,2008). However, we found no such pattern in this study, possiblydue to a reduced number of species (N = 47) where this informa-tion was available, or behavioural differences that may exist be-tween European and UK populations.
4.5. Conservation importance
This study has shown that breeding bird populations in Englandare related not only to processes operating on breeding grounds,but also whether species travel to African wintering destinations,and in turn the over-wintering zones that migrants may utilise.Within the UK, BTO and JNCC operate an alerts system to highlightrapid (>50%) and moderate (>25%, <50%) declines that may be ofconservation concern, as well as population recoveries where thestatus of a species has improved (Baillie et al., 2010). Currently,
50
100
150
200
250
300
350
1966 1972 1978 1984 1990 1996 2002 2008
Inde
x (1
966
= 1
00)
Nuthatch
50
100
150
200
250
300
350
400
1966 1972 1978 1984 1990 1996 2002 2008
Inde
x (1
966
= 1
00)
Green Woodpecker
80
100
120
140
160
1966 1972 1978 1984 1990 1996 2002 2008
Inde
x (1
966
= 1
00)
Blue Tit
966 and 2006 for: left-hand side, two declining humid species (cuckoo and spotted; right-hand side, increasing trends for three resident species; dashed lines show the

Perdix.perdixPasser.montanusEmberiza.calandraEmberiza.citrinellaEmberiza.schoeniclusCarduelis.cannabinaCarduelis.flammeaCarduelis.chlorisCarduelis.carduelisPyrrhula.pyrrhulaFringilla.coelebsMotacilla.flavaMotacilla.albaAnthus.trivialisAnthus.pratensisPrunella.modularisPeriparus.aterCyanistes.caeruleusParus.majorPoecile.montanusPoecile.palustrisCorvus.monedulaCorvus.coronePica.picaGarrulus.glandariusPhylloscopus.trochilusPhylloscopus.collybitaAcrocephalus.scirpaceusAcrocephalus.schoenobaenusDelichon.urbicumHirundo.rusticaAegithalos.caudatusSylvia.atricapillaSylvia.borinSylvia.currucaSylvia.communisAlauda.arvensisSitta.europaeaTroglodytes.troglodytesCerthia.familiarisPhoenicurus.phoenicurusErithacus.rubeculaMuscicapa.striataTurdus.viscivorusTurdus.merulaTurdus.philomelosSturnus.vulgarisRegulus.regulusDendrocopos.majorPicus.viridisNumenius.arquataVanellus.vanellusCuculus.canorusButeo.buteoStrix.alucoStreptopelia.turturColumba.oenasColumba.palumbusFalco.tinnunculus
Fig. A2. Phylogenetic tree of all species used in the study of population changes for breeding birds in England.
2014 C.B. Thaxter et al. / Biological Conservation 143 (2010) 2006–2019
between 1967 and 2007, 61% of farmland species and 31% ofwoodland species have declined more than 25%, and evidence heresuggests that this trend has continued within the last 25 years (56%and 24% of farmland and woodland species, respectively). Likewise,53% of those species migrating to Africa have declined more than25% between 1967 and 2006. These declines have been morepronounced for migrants using humid zones (63% and 43% humidand arid species, respectively), and within the last 25 years, mosthumid zone species have continued to decline, shown for spottedflycatcher Muscicapa striata, turtle dove Streptopelia turtur, treepipit Anthus trivialis, cuckoo Cuculus canorus, and willow warblerPhylloscopus trochilus (Table 3).
Most European countries are required to protect migratoryspecies under the Convention on the Conservation of MigratorySpecies of Wild Animals (CMS or Bonn Convention), including pro-tection from human activities such as hunting persecution, as wellas conserving their wintering, migratory, and breeding habitats. Tofully protect migrants, a knowledge is required of geographicallyseparated processes occurring at different periods of the year(Webster et al., 2002). Success of conservation strategies for migra-tory animals will depend upon knowledge of migratory connectiv-ity, and a correct identification of the conservation problem; thefailure to do so could lead to regional extinctions (Martin et al.,2007). Segregating migrants by broad wintering zones maytherefore represent an important first step in assessing where con-servation priorities are needed, for instance directing conservationfocus to processes occurring in the humid African bioclimatic zone.More work is therefore needed to relate specific environmental
conditions occurring in these areas to population changes, includ-ing use of Normalized Difference Vegetation Index (NDVI) to assesshabitat suitability, and understanding connectivity for breedingpopulations to wintering zones through telemetry. Pending moreprecise information of species’ wintering areas, the production ofan indicator specific to wintering zones for Afro-Palaearcticmigrant species could be a useful tool for assessing conservationstatus and management.
Acknowledgements
We would like to thank the many individual professional andvolunteer fieldworkers that collected and collated the data underthe Common Bird Census and the Breeding Bird Survey. We alsothank Chris Hewson, Phil Atkinson, Nancy Ockendon, Alison John-ston, and Richard Duncan for useful comments and statistical ad-vice. The CBC and BBS were funded by the Joint NatureConservation Committee (on behalf of the Countryside Councilfor Wales, Natural England, the Council for Nature Conservationand the Countryside and Scottish Natural Heritage) and by the Brit-ish Trust for Ornithology. The BBS was also funded by the RoyalSociety for the Protection of Birds.
Appendix A
See Figs. A1 and A2.See Tables A1–A3.

Table A1List of species and ecological variables included in the studya.
Species Latitudinalmidpoint
Thermalmaximum
Winter inAfrica
Migrationa Bio- climaticzone
Breedinghabitat
Nestinghabitat
Breedingpopulation size
Productivity Flightdistance
Bodymass
Brainmass
Blackbird Turdus merula 52.98 20.52 1 2 0 1 1 8,800,000 10.0 7.8 108.2 1.92Blackcap Sylvia atricapilla 53.44 20.49 1 2 0 1 1 1,160,000 7.5 6.0 18.5 0.67Blue Tit Cyanistes caeruleus 52.31 20.47 1 1 0 1 3 6,600,000 16.5 6.1 10.7 0.65Bullfinch Pyrrhula pyrrhula 55.25 18.87 1 1 0 1 1 380,000 6.8 5.9 25.8 0.89Buzzard Buteo buteo 51.86 1 1 0 3 1 29,000 3.0 51.1 1018.0 7.90Carrion Crow Corvus corone 52.98 20.46 1 1 0 3 1 1,940,000 4.0 29.3 517.0 8.14Chaffinch Fringilla coelebs 52.76 20.57 1 1 0 1 1 10,800,000 6.8 8.9 20.7 0.77Coal Tit Periparus ater 52.75 20.08 1 1 0 1 3 1,220,000 16.0 5.1 9.5 0.51Corn Bunting Emberiza calandra 46.93 20.50 1 1 0 2 2 39,000 6.4 12.6 43.9 1.17Curlew Numenius arquata 57.03 1 2 0 3 2 71,000 4.0 1001.0 3.68Dunnock Prunella modularis 54.79 19.05 1 1 0 1 1 4,000,000 10.0 5.5 21.7 0.71Goldcrest Regulus regulus 53.45 18.86 1 1 0 1 1 1,120,000 13.6 4.0 5.6 0.38Goldfinch Carduelis carduelis 49.84 20.59 1 2 0 2 1 440,000 10.0 7.7 15.5 0.59Great Spotted Woodpecker
Dendrocopos major53.21 20.08 1 1 0 1 3 55,000 5.3 11.7 89.6 2.51
Great Tit Parus major 52.98 20.57 1 1 0 1 3 3,200,000 11.9 5.6 19.2 0.85Green Woodpecker Picus viridis 51.64 20.11 1 1 0 1 3 30,000 4.9 17.1 198.0 4.35Greenfinch Carduelis chloris 52.54 20.51 1 1 0 2 1 1,060,000 12.5 7.1 28.3 0.89Grey Partridge Perdix perdix 52.54 19.51 1 1 0 2 2 290,000 15.0 390.0 1.89Jackdaw Corvus monedula 52.08 20.40 1 1 0 2 3 780,000 4.5 23.4 231.0 4.69Jay Garrulus glandarius 51.42 20.49 1 1 0 1 1 320,000 4.5 10.8 158.5 4.15Kestrel Falco tinnunculus 52.54 1 2 0 2 1 100,000 4.5 18.0 252.0 3.68Lapwing Vanellus vanellus 53.65 1 2 0 2 2 430,000 4.0 36.5 189.0 2.16Lesser Redpoll Carduelis flammea 55.49 1 2 0 1 1 320,000 6.7 11.2 0.59Linnet Sylvia curruca 50.52 20.54 1 2 0 2 1 1,040,000 12.5 13.9 17.3 0.67Long-tailed Tit Aegithalos caudatus 52.99 20.27 1 1 0 1 1 420,000 7.1 4.2 7.7 0.41Magpie Pica pica 53.65 20.44 1 1 0 3 1 1,180,000 6.0 15.6 206.5 5.34Marsh Tit Poecile palustris 51.42 19.33 1 1 0 1 3 120,000 11.7 7.1 10.5 0.58Meadow Pipit Anthus pratensis 57.04 16.97 1 2 0 3 2 3,800,000 9.0 13.3 17.7 0.68Mistle Thrush Turdus viscivorus 52.99 20.09 1 2 0 3 1 460,000 8.0 20.8 139.1 2.21Nuthatch Sitta europaea 51.19 19.97 1 1 0 1 3 260,000 7.0 7.6 23.4 1.11Pied Wagtail Motacilla alba 52.98 20.24 1 2 0 3 1 600,000 8.3 11.9 23.6 0.58
(continued on next page)
C.B.Thaxteret
al./BiologicalConservation
143(2010)
2006–2019
2015

Table A1 (continued)
Species Latitudinalmidpoint
Thermalmaximum
Winter inAfrica
Migrationa Bio- climaticzone
Breedinghabitat
Nestinghabitat
Breedingpopulation size
Productivity Flightdistance
Bodymass
Brainmass
Reed Bunting Emberiza schoeniclus 53.89 1 1 0 2 2 440,000 11.3 12.8 19.2 0.68Robin Erithacus rubecula 53.21 20.42 1 1 0 1 1 8,400,000 10.0 5.4 19.9 0.66Skylark Alauda arvensis 52.98 20.08 1 1 0 2 2 4,000,000 8.7 13.9 35.8 0.97Song Thrush Turdus philomelos 54.79 19.69 1 2 0 1 1 1,980,000 10.0 11.4 84.8 1.59Starling Sturnus vulgaris 53.89 19.96 1 1 0 2 3 2,200,000 6.8 14.7 79.9 1.70Stock Dove Columba oenas 51.64 19.24 1 2 0 2 3 480,000 5.0 299.0 2.27Tawny Owl Strix aluco 50.75 1 1 0 1 3 40,000 2.7 530.0 9.36Tree Sparrow Passer montanus 50.52 20.20 1 1 0 2 3 220,000 12.5 4.9 20.8 0.79Treecreeper Certhia familiaris 54.12 20.10 1 1 0 1 3 400,000 10.5 4.6 9.0 0.55Willow Tit Poecile montanus 55.25 17.84 1 1 0 1 3 50,000 7.1 4.9 10.0 0.79Woodpigeon Columba palumbus 52.54 20.26 1 1 0 2 1 4,700,000 6.0 11.0 480.0 2.38Wren Troglodytes troglodytes 52.31 20.40 1 1 0 1 1 14,200,000 5.7 5.8 9.2 0.50Yellowhammer Emberiza citrinella 54.11 19.35 1 1 0 2 2 2,400,000 8.8 12.5 27.4 0.82Chiffchaff Phylloscopus collybita 53.44 19.87 2 3 1 1 1 1,280,000 8.2 6.7 7.8 0.38Lesser Whitethroat Sylvia curruca 54.34 19.71 2 3 1 1 1 160,000 4.7 10.7 0.53Redstart Phoenicurus phoenicurus 53.65 19.70 2 3 1 1 3 180,000 12.5 9.0 13.4 0.54Reed Warbler Acrocephalus
scirpaceus50.01 2 3 1 3 1 120,000 3.9 10.8 0.58
Sedge Warbler Acrocephalusschoenobaenus
54.10 2 3 1 3 1 500,000 5.0 11.5 0.45
Whitethroat Sylvia communis 51.42 20.35 2 3 1 2 1 1,320,000 9.3 8.0 14.7 0.56Yellow Wagtail Motacilla flava 53.65 2 3 1 2 2 100,000 7.9 9.7 18.3 0.47Cuckoo Cuculus canorus 53.65 20.46 2 3 2 3 1 39,000 10.0 21.0 98.0 2.24Garden Warbler Sylvia borin 53.89 19.39 2 3 2 1 1 400,000 4.3 6.2 18.4 0.62House Martin Delichon urbicum 52.98 20.55 2 3 2 3 3 750,000 11.3 17.6 0.59Spotted Flycatcher Muscicapa striata 52.76 2 3 2 1 3 240,000 4.3 8.5 14.8 0.53Swallow Hirundo rustica 52.98 20.52 2 3 2 3 3 1,140,000 11.3 10.2 19.2 0.58Tree Pipit Anthus trivialis 53.66 19.55 2 3 2 1 2 240,000 7.3 13.3 21.3 0.68Turtle Dove Streptopelia turtur 51.42 20.53 2 3 2 2 1 150,000 3.9 152.0 1.39Willow Warbler Phylloscopus
trochilus55.92 17.70 2 3 2 1 1 4,600,000 8.9 8.5 9.2 0.31
a Latitudinal midpoint of EBCC distribution of species breeding range (Lemoine et al., 2007), thermal maximum (Jiguet et al., 2007), winter in Africa (1 = no, 2 = yes), migration destination (1 = UK, 2 = Europe, 3 = Africa, Wernhamet al., 2002), bioclimatic zone (1 = arid, 2 = humid, Hewson and Noble, 2009, 0 = European species not tested within this variable), breeding habitat (1 = woodland, 2 = farmland, 3 = other), Nesting habitat (1 = above-ground,2 = ground, 3 = cavity/hole), breeding population size (Wernham et al., 2002), productivity (Wernham et al., 2002), flight distance (Moller, 2008), body mass (Wernham et al., 2002), and brain mass (Garamszegi et al., 2002; Molleret al., 2008).
2016C.B.Thaxter
etal./Biological
Conservation143
(2010)2006–
2019

Table A2Changes in abundance, expressed as a proportion of 1.0 in the first year of the time period, for periods: 1967–2006, 1967–1976, 1977–1986, 1987–1996 and 1997–2006 (95%confidence intervals are in parentheses). Changes with an asterisk are significant (95% confidence intervals do not overlap 1). Proportional changes less than 1 imply a decreaseand values greater than 1 imply an increase i.e. 0.86 is a 24% decline between the two time periods, whereas 1.55 is a 55% increase.
Species Proportional changes in abundance (95% confidence interval)
1967–2006 1967–1976 1977–1986 1987–1996 1997–2006
Tree Sparrow 0.03(0.01–0.06)* 0.87(0.69–1.06) 0.14(0.10–0.19)* 0.25(0.12–0.39)* 1.22(1.05–1.55)*
Lesser Redpoll 0.10(0.04–0.22)* 3.36(1.89–5.57)* 0.44(0.30–0.59)* 0.13(0.05–0.19)* 0.70(0.50–1.16)Grey Partridge 0.12(0.09–0.18)* 1.05(0.91–1.28) 0.36(0.29–0.44)* 0.52(0.42–0.63)* 0.73(0.63–0.81)*
Spotted Flycatcher 0.13(0.08–0.18)* 0.80(0.64–1.00)* 0.69(0.55–0.86)* 0.35(0.27–0.46)* 0.70(0.59–0.85)*
Turtle Dove 0.15(0.09–0.24)* 1.04(0.84–1.22) 0.59(0.44–0.76)* 0.63(0.45–0.77)* 0.45(0.40–0.52)*
Corn Bunting 0.16(0.07–0.26)* 1.35(1.06–1.70)* 0.32(0.20–0.45)* 0.58(0.32–0.93)* 0.85(0.69–1.00)Starling 0.17(0.12–0.23)* 0.79(0.69–0.93)* 0.70(0.59–0.81)* 0.51(0.42–0.59)* 0.67(0.63–0.72)*
Tree Pipit 0.17(0.08–0.29)* 1.07(0.74–1.59) 1.00(0.73–1.39) 0.25(0.13–0.38)* 0.77(0.59–1.02)Willow Tit 0.17(0.08–0.30)* 1.32(0.99–1.83) 0.73(0.52–0.96)* 0.49(0.31–0.69)* 0.42(0.32–0.52)*
Linnet 0.25(0.19–0.34)* 0.74(0.63–0.85)* 0.45(0.38–0.54)* 1.18(0.97–1.45) 0.77(0.73–0.84)*
Yellow Wagtail 0.28(0.15–0.62)* 0.92(0.62–1.47) 0.81(0.54–1.25) 0.65(0.42–0.90)* 0.61(0.52–0.72)*
Marsh Tit 0.32(0.22–0.45)* 0.60(0.46–0.72)* 0.81(0.67–0.99)* 0.85(0.72–1.00) 0.88(0.74–1.03)Whitethroat 0.37(0.27–0.50)* 0.25(0.20–0.30)* 0.72(0.61–0.87)* 1.60(1.37–1.82)* 1.11(1.06–1.16)*
Cuckoo 0.39(0.29–0.52)* 0.98(0.80 –1.19) 0.95(0.82–1.08) 0.79(0.70–0.88)* 0.59(0.56–0.63)*
Skylark 0.41(0.34–0.49)* 1.05(0.94–1.17) 0.54(0.46–0.59)* 0.86(0.77–0.99)* 0.91(0.87–0.95)*
Willow Warbler 0.42(0.30–0.54)* 0.90(0.79–1.03) 1.13(0.99–1.24) 0.62(0.52–0.71)* 0.71(0.65–0.76)*
Yellowhammer 0.43(0.34–0.54)* 1.04(0.90–1.19) 0.91(0.82–1.00) 0.56(0.50–0.62)* 0.88(0.85–0.93)*
House Martin 0.44(0.14–1.42) 1.07(0.49–1.68) 0.73(0.49–1.17) 0.59(0.24–1.43) 1.08(1.00–1.17)Bullfinch 0.48(0.38–0.61)* 1.10(0.98–1.25) 0.64(0.56–0.74)* 0.85(0.74–0.96)* 0.96(0.87–1.03)Song Thrush 0.49(0.40–0.58)* 0.82(0.76–0.90)* 0.61(0.54–0.67)* 0.89(0.78–1.00) 1.25(1.20–1.31)*
Mistle Thrush 0.51(0.43–0.61)* 1.05(0.92–1.21) 0.74(0.67–0.83)* 0.84(0.76–0.94)* 0.83(0.79–0.88)*
Meadow Pipit 0.54(0.26–0.76)* 1.18(0.76–1.63) 0.62(0.44–0.76)** 0.80(0.62–1.02) 1.00(0.89–1.12)Sedge Warbler 0.61(0.31–0.87)* 0.74(0.41–1.05) 0.66(0.49––0.83)* 1.15(0.93–1.47) 0.89(0.78–1.00)Dunnock 0.63(0.54–0.74)* 0.95(0.9 –1.03) 0.63(0.57–0.70)* 0.93(0.84–1.03) 1.21(1.17–1.26)*
Curlew 0.71(0.32–1.25) 1.29(1.00–2.08) 0.68(0.38–1.07) 1.05(0.68–1.36) 0.83(0.77–0.90)*
Reed Bunting 0.78(0.59–0.99)* 1.43(1.21–1.75)* 0.51(0.37–0.62)* 0.90(0.77–1.07) 1.37(1.24–1.51)*
Garden Warbler 0.79(0.54–1.13) 0.62(0.46–0.82)* 1.57(1.31–1.95)* 0.93(0.80–1.07) 0.78(0.70–0.87)*
Blackbird 0.82(0.75–0.90)* 0.95(0.90–1.01) 0.85(0.79–0.90)* 0.90(0.86–0.94)* 1.17(1.15–1.20)*
Redstart 0.82(0.58–1.37) 0.36(0.27–0.66)* 1.87(1.11–2.64)* 1.17(1.00–1.43) 0.86(0.76–0.99)*
Lesser Whitethroat 0.86(0.60 –1.30) 1.10(0.82–1.49) 1.07(0.90–1.29) 0.68(0.59–0.82)* 1.19(1.03–1.28)*
Lapwing 0.89(0.41–1.29) 1.54(0.91–2.25) 0.80(0.57–0.96)* 0.71(0.55–0.96)* 1.12(1.02–1.22)*
Jay 0.94(0.74–1.20) 1.03(0.89–1.22) 1.09(0.98–1.21) 0.82(0.74–0.91)* 1.07(0.99–1.16)Tawny Owl 0.99(0.59–1.48) 1.17(0.86–1.61) 1.00(0.82–1.18) 0.95(0.79–1.13) 0.90(0.75–1.12)Treecreeper 1.04(0.78–1.44) 1.38(1.09–1.80)* 0.89(0.78–1.06) 1.02(0.91–1.15) 0.90(0.79–1.01)Kestrel 1.06(0.77–1.53) 1.52(1.13–1.91)* 0.63(0.53–0.73)* 1.09(0.92––1.28) 1.07(1.00–1.15)Goldfinch 1.18(0.89–1.53) 1.37(1.14–1.70)* 0.42(0.36–0.48)* 1.69(1.39–1.94)* 1.26(1.19–1.31)*
Swallow 1.23(0.88–1.75) 0.98(0.77––1.35) 0.80(0.66–0.92)* 1.08(0.91–1.26) 1.23(1.16–1.31)*
Chiffchaff 1.31(1.04–1.72)* 0.52(0.45–0.62)* 1.06(0.93–1.24) 1.55(1.36–1.70)* 1.21(1.17–1.29)*
Chaffinch 1.38(1.22–1.56)* 1.00(0.93––1.09) 1.16(1.10–1.22)* 0.99(0.94–1.04) 1.15(1.12–1.20)*
Greenfinch 1.38(1.06–1.67)* 1.08(0.93–1.22) 0.85(0.75–0.96)* 1.18(0.97–1.34) 1.25(1.21–1.31)*
Blue Tit 1.40(1.25–1.57)* 1.20(1.13–1.28)* 1.07(1.01–1.15)* 1.03(0.99––1.08) 1.05(1.02–1.07)*
Goldcrest 1.42(0.80 –2.97) 2.44(1.69–4.38)* 0.52(0.45–0.66)* 1.13(0.82–1.34) 1.18(1.06–1.32)*
Robin 1.49(1.32–1.65)* 1.04(0.98–1.11) 0.89(0.84–0.95)* 1.36(1.29–1.43)* 1.20(1.17–1.23)*
Coal Tit 1.50(0.83–2.88) 1.68(1.15–2.48)* 0.78(0.67–0.95)* 1.05(0.90–1.22) 1.09(0.94–1.30)Long-tailed Tit 1.77(1.28–2.68)* 1.47(1.25–1.93)* 0.84(0.70–0.96)* 1.57(1.39–1.75)* 1.05(0.97–1.12)Jackdaw 1.79(1.15–2.84)* 0.97(0.77–1.31) 1.42(1.18–1.76)* 1.04(0.85–1.23) 1.23(1.15–1.30)*
Reed Warbler 1.80(1.22–3.02)* 0.96(0.70–1.45) 1.21(0.92–1.46) 1.17(1.00–1.53) 1.16(1.02–1.34)*
Pied Wagtail 1.86(1.32–2.63)* 2.21(1.80–2.85)* 0.66(0.56–0.78)* 1.21(0.99–1.55) 1.05(0.99–1.10)Wren 1.90(1.65–2.18)* 1.76(1.63–1.92)* 0.83(0.78–0.90)* 1.11(1.03–1.16)* 1.24(1.19–1.25)*
Great Tit 2.04(1.76–2.30)* 1.20(1.09–1.32)* 1.20(1.12–1.29)* 1.04(0.99–1.09) 1.36(1.32–1.40)*
Magpie 2.05(1.61–2.56)* 1.28(1.09–1.52)* 1.54(1.42–1.69)* 1.00(0.93–1.09) 0.96(0.93–0.99)*
Carrion Crow 2.19(1.77–2.79)* 1.31(1.14–1.46)* 1.15(1.02–1.31)* 1.21(1.13–1.32)* 1.12(1.06–1.18)*
Blackcap 2.39(1.97–3.05)* 0.95(0.80–1.13) 1.39(1.24–1.54)* 1.24(1.18–1.32)* 1.33(1.26–1.38)*
Stock Dove 2.63(1.79–3.93)* 1.88(1.45–2.54)* 1.24(1.02–1.48)* 1.10(0.96–1.33) 0.95(0.84–1.09)Woodpigeon 2.68(1.36–6.81)* 0.96(0.52–2.30) 1.50(1.17–1.92)* 1.21(1.07–1.35)* 1.29(1.25–1.33)*
Nuthatch 2.82(1.97–4.10)* 1.11(0.90–1.44) 1.34(1.11–1.62)* 1.18(1.03–1.36)* 1.38(1.26–1.50)*
Green Woodpecker 3.05(2.33–4.27)* 1.60(1.24–2.09)* 0.90(0.81–1.02) 1.44(1.24–1.67)* 1.35(1.27–1.42)*
Great Spotted Woodpecker 4.32(3.11–6.56)* 1.90(1.36–2.81)* 0.99(0.89–1.13) 1.16(1.02–1.33)* 1.81(1.71–1.91)*
Buzzard 5.83(3.68–14.60)* 1.07(0.73–1.88) 0.93(0.70–1.31) 3.17(2.20–5.80)* 1.64(1.51–1.83)*
C.B. Thaxter et al. / Biological Conservation 143 (2010) 2006–2019 2017
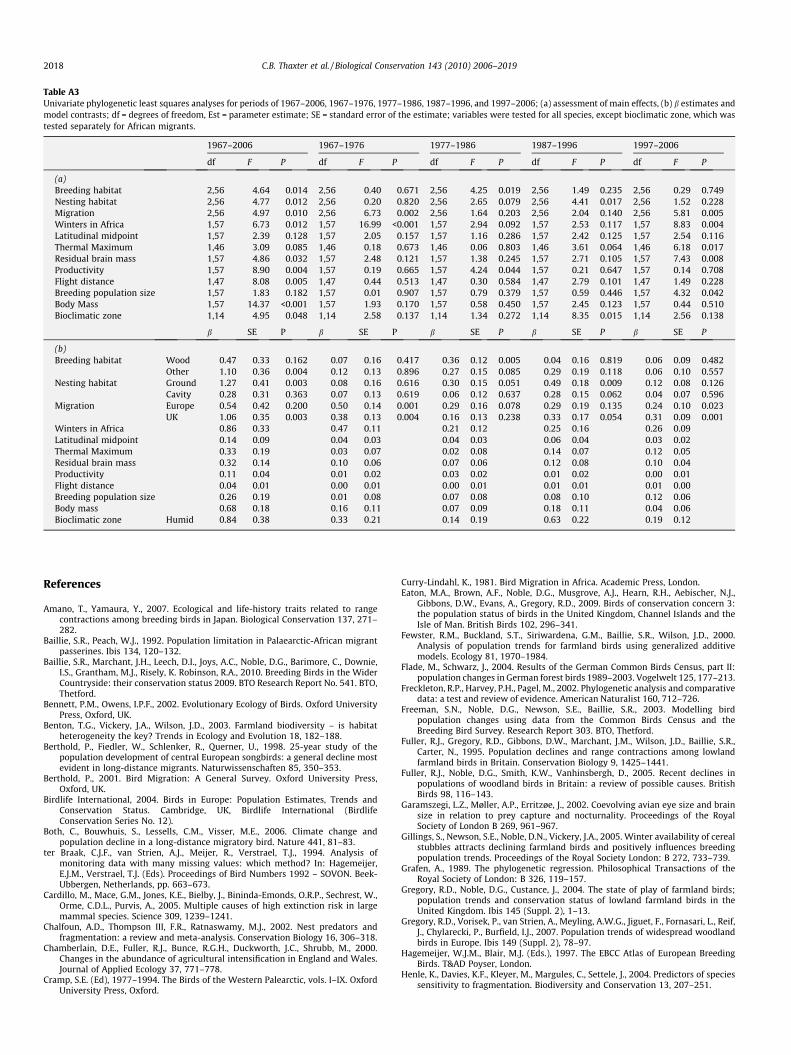
Table A3Univariate phylogenetic least squares analyses for periods of 1967–2006, 1967–1976, 1977–1986, 1987–1996, and 1997–2006; (a) assessment of main effects, (b) b estimates andmodel contrasts; df = degrees of freedom, Est = parameter estimate; SE = standard error of the estimate; variables were tested for all species, except bioclimatic zone, which wastested separately for African migrants.
1967–2006 1967–1976 1977–1986 1987–1996 1997–2006
df F P df F P df F P df F P df F P
(a)Breeding habitat 2,56 4.64 0.014 2,56 0.40 0.671 2,56 4.25 0.019 2,56 1.49 0.235 2,56 0.29 0.749Nesting habitat 2,56 4.77 0.012 2,56 0.20 0.820 2,56 2.65 0.079 2,56 4.41 0.017 2,56 1.52 0.228Migration 2,56 4.97 0.010 2,56 6.73 0.002 2,56 1.64 0.203 2,56 2.04 0.140 2,56 5.81 0.005Winters in Africa 1,57 6.73 0.012 1,57 16.99 <0.001 1,57 2.94 0.092 1,57 2.53 0.117 1,57 8.83 0.004Latitudinal midpoint 1,57 2.39 0.128 1,57 2.05 0.157 1,57 1.16 0.286 1,57 2.42 0.125 1,57 2.54 0.116Thermal Maximum 1,46 3.09 0.085 1,46 0.18 0.673 1,46 0.06 0.803 1,46 3.61 0.064 1,46 6.18 0.017Residual brain mass 1,57 4.86 0.032 1,57 2.48 0.121 1,57 1.38 0.245 1,57 2.71 0.105 1,57 7.43 0.008Productivity 1,57 8.90 0.004 1,57 0.19 0.665 1,57 4.24 0.044 1,57 0.21 0.647 1,57 0.14 0.708Flight distance 1,47 8.08 0.005 1,47 0.44 0.513 1,47 0.30 0.584 1,47 2.79 0.101 1,47 1.49 0.228Breeding population size 1,57 1.83 0.182 1,57 0.01 0.907 1,57 0.79 0.379 1,57 0.59 0.446 1,57 4.32 0.042Body Mass 1,57 14.37 <0.001 1,57 1.93 0.170 1,57 0.58 0.450 1,57 2.45 0.123 1,57 0.44 0.510Bioclimatic zone 1,14 4.95 0.048 1,14 2.58 0.137 1,14 1.34 0.272 1,14 8.35 0.015 1,14 2.56 0.138
b SE P b SE P b SE P b SE P b SE P
(b)Breeding habitat Wood 0.47 0.33 0.162 0.07 0.16 0.417 0.36 0.12 0.005 0.04 0.16 0.819 0.06 0.09 0.482
Other 1.10 0.36 0.004 0.12 0.13 0.896 0.27 0.15 0.085 0.29 0.19 0.118 0.06 0.10 0.557Nesting habitat Ground �1.27 0.41 0.003 �0.08 0.16 0.616 �0.30 0.15 0.051 �0.49 0.18 0.009 �0.12 0.08 0.126
Cavity �0.28 0.31 0.363 �0.07 0.13 0.619 0.06 0.12 0.637 �0.28 0.15 0.062 0.04 0.07 0.596Migration Europe 0.54 0.42 0.200 0.50 0.14 0.001 �0.29 0.16 0.078 0.29 0.19 0.135 0.24 0.10 0.023
UK 1.06 0.35 0.003 0.38 0.13 0.004 �0.16 0.13 0.238 0.33 0.17 0.054 0.31 0.09 0.001Winters in Africa �0.86 0.33 �0.47 0.11 0.21 0.12 �0.25 0.16 �0.26 0.09Latitudinal midpoint �0.14 0.09 0.04 0.03 0.04 0.03 �0.06 0.04 �0.03 0.02Thermal Maximum 0.33 0.19 �0.03 0.07 0.02 0.08 0.14 0.07 0.12 0.05Residual brain mass 0.32 0.14 0.10 0.06 0.07 0.06 0.12 0.08 0.10 0.04Productivity �0.11 0.04 �0.01 0.02 �0.03 0.02 �0.01 0.02 0.00 0.01Flight distance 0.04 0.01 0.00 0.01 0.00 0.01 0.01 0.01 0.01 0.00Breeding population size �0.26 0.19 0.01 0.08 0.07 0.08 0.08 0.10 0.12 0.06Body mass 0.68 0.18 �0.16 0.11 0.07 0.09 0.18 0.11 0.04 0.06Bioclimatic zone Humid �0.84 0.38 0.33 0.21 �0.14 0.19 �0.63 0.22 �0.19 0.12
2018 C.B. Thaxter et al. / Biological Conservation 143 (2010) 2006–2019
References
Amano, T., Yamaura, Y., 2007. Ecological and life-history traits related to rangecontractions among breeding birds in Japan. Biological Conservation 137, 271–282.
Baillie, S.R., Peach, W.J., 1992. Population limitation in Palaearctic-African migrantpasserines. Ibis 134, 120–132.
Baillie, S.R., Marchant, J.H., Leech, D.I., Joys, A.C., Noble, D.G., Barimore, C., Downie,I.S., Grantham, M.J., Risely, K. Robinson, R.A., 2010. Breeding Birds in the WiderCountryside: their conservation status 2009. BTO Research Report No. 541. BTO,Thetford.
Bennett, P.M., Owens, I.P.F., 2002. Evolutionary Ecology of Birds. Oxford UniversityPress, Oxford, UK.
Benton, T.G., Vickery, J.A., Wilson, J.D., 2003. Farmland biodiversity – is habitatheterogeneity the key? Trends in Ecology and Evolution 18, 182–188.
Berthold, P., Fiedler, W., Schlenker, R., Querner, U., 1998. 25-year study of thepopulation development of central European songbirds: a general decline mostevident in long-distance migrants. Naturwissenschaften 85, 350–353.
Berthold, P., 2001. Bird Migration: A General Survey. Oxford University Press,Oxford, UK.
Birdlife International, 2004. Birds in Europe: Population Estimates, Trends andConservation Status. Cambridge, UK, Birdlife International (BirdlifeConservation Series No. 12).
Both, C., Bouwhuis, S., Lessells, C.M., Visser, M.E., 2006. Climate change andpopulation decline in a long-distance migratory bird. Nature 441, 81–83.
ter Braak, C.J.F., van Strien, A.J., Meijer, R., Verstrael, T.J., 1994. Analysis ofmonitoring data with many missing values: which method? In: Hagemeijer,E.J.M., Verstrael, T.J. (Eds). Proceedings of Bird Numbers 1992 – SOVON. Beek-Ubbergen, Netherlands, pp. 663–673.
Cardillo, M., Mace, G.M., Jones, K.E., Bielby, J., Bininda-Emonds, O.R.P., Sechrest, W.,Orme, C.D.L., Purvis, A., 2005. Multiple causes of high extinction risk in largemammal species. Science 309, 1239–1241.
Chalfoun, A.D., Thompson III, F.R., Ratnaswamy, M.J., 2002. Nest predators andfragmentation: a review and meta-analysis. Conservation Biology 16, 306–318.
Chamberlain, D.E., Fuller, R.J., Bunce, R.G.H., Duckworth, J.C., Shrubb, M., 2000.Changes in the abundance of agricultural intensification in England and Wales.Journal of Applied Ecology 37, 771–778.
Cramp, S.E. (Ed), 1977–1994. The Birds of the Western Palearctic, vols. I–IX. OxfordUniversity Press, Oxford.
Curry-Lindahl, K., 1981. Bird Migration in Africa. Academic Press, London.Eaton, M.A., Brown, A.F., Noble, D.G., Musgrove, A.J., Hearn, R.H., Aebischer, N.J.,
Gibbons, D.W., Evans, A., Gregory, R.D., 2009. Birds of conservation concern 3:the population status of birds in the United Kingdom, Channel Islands and theIsle of Man. British Birds 102, 296–341.
Fewster, R.M., Buckland, S.T., Siriwardena, G.M., Baillie, S.R., Wilson, J.D., 2000.Analysis of population trends for farmland birds using generalized additivemodels. Ecology 81, 1970–1984.
Flade, M., Schwarz, J., 2004. Results of the German Common Birds Census, part II:population changes in German forest birds 1989–2003. Vogelwelt 125, 177–213.
Freckleton, R.P., Harvey, P.H., Pagel, M., 2002. Phylogenetic analysis and comparativedata: a test and review of evidence. American Naturalist 160, 712–726.
Freeman, S.N., Noble, D.G., Newson, S.E., Baillie, S.R., 2003. Modelling birdpopulation changes using data from the Common Birds Census and theBreeding Bird Survey. Research Report 303. BTO, Thetford.
Fuller, R.J., Gregory, R.D., Gibbons, D.W., Marchant, J.M., Wilson, J.D., Baillie, S.R.,Carter, N., 1995. Population declines and range contractions among lowlandfarmland birds in Britain. Conservation Biology 9, 1425–1441.
Fuller, R.J., Noble, D.G., Smith, K.W., Vanhinsbergh, D., 2005. Recent declines inpopulations of woodland birds in Britain: a review of possible causes. BritishBirds 98, 116–143.
Garamszegi, L.Z., Møller, A.P., Erritzøe, J., 2002. Coevolving avian eye size and brainsize in relation to prey capture and nocturnality. Proceedings of the RoyalSociety of London B 269, 961–967.
Gillings, S., Newson, S.E., Noble, D.N., Vickery, J.A., 2005. Winter availability of cerealstubbles attracts declining farmland birds and positively influences breedingpopulation trends. Proceedings of the Royal Society London: B 272, 733–739.
Grafen, A., 1989. The phylogenetic regression. Philosophical Transactions of theRoyal Society of London: B 326, 119–157.
Gregory, R.D., Noble, D.G., Custance, J., 2004. The state of play of farmland birds;population trends and conservation status of lowland farmland birds in theUnited Kingdom. Ibis 145 (Suppl. 2), 1–13.
Gregory, R.D., Vorisek, P., van Strien, A., Meyling, A.W.G., Jiguet, F., Fornasari, L., Reif,J., Chylarecki, P., Burfield, I.J., 2007. Population trends of widespread woodlandbirds in Europe. Ibis 149 (Suppl. 2), 78–97.
Hagemeijer, W.J.M., Blair, M.J. (Eds.), 1997. The EBCC Atlas of European BreedingBirds. T&AD Poyser, London.
Henle, K., Davies, K.F., Kleyer, M., Margules, C., Settele, J., 2004. Predictors of speciessensitivity to fragmentation. Biodiversity and Conservation 13, 207–251.

C.B. Thaxter et al. / Biological Conservation 143 (2010) 2006–2019 2019
Hewson, C.M., Amar, A., Lindsell, J.A., Thewlis, R.M., Butler, S., Smith, K., Fuller, R.J.,2007. Recent changes in bird populations in British broadleaved woodland. Ibis149 (Suppl. 2), 14–28.
Hewson, C.M., Noble, D.G., 2009. Population trends of breeding birds in Britishwoodlands over a 32-year period: relationships with food, habitat use andmigratory behaviour. Ibis 151, 464–486.
Holt, A.R., Gaston, K.J., He, F., 2002. Occupancy–abundance relationships and spatialdistribution. Basic and Applied Ecology 3, 1–13.
IUCN, 2010. IUCN Red List of Threatened Species. <www.iucnredlist.org>.Jiguet, F., Gadot, A.-S., Julliard, R., Newson, S.E., Couvet, D., 2007. Climate envelope,
life history traits and the resilience of birds facing global change. Global ChangeBiology 13, 1672–1684.
Julliard, R., Jiguet, F., Couvet, D., 2004. Common birds facing global changes: whatmakes a species at risk? Global Change Biology 10, 148–154.
Jones, P., 1985. The migration strategies of Palearctic passerines in West Africa. In:MacDonald, A., Goriup, P. (Eds.), Migratory Birds: Problems and Prospects inAfrica. ICBP, Cambridge, pp. 19–21.
Jones, P., Vickery, J., Holt, S., Cresswell, W., 1996. A preliminary assessment of somefactors influencing the density and distribution of Palaearctic passerinemigrants wintering in the Sahel zone of West Africa. Bird Study 43, 73–84.
Kanyamibwa, S., Schierer, A., Pradel, R., Lebreton, J.D., 1990. Changes in adult annualsurvival rates in a Western European Population of the White Stork Ciconiaciconia. Ibis 132, 27–35.
Kanyamibwa, S., Bairlein, F., Schierer, A., 1993. Comparison of survival ratesbetween populations of the white stork Ciconia ciconia in Central Europe. OrnisScandaniavica 24, 297–302.
Lemoine, N., Bauer, H.-G., Peintinger, M., Bohning-Gaese, K., 2007. Effects of climateand land-use change on species abundance in a central European birdcommunity. Conservation Biology 21, 495–503.
Martin, T.E., Clobert, J., 1996. Nest predation and avian life history evolution inrelation to nest sites, nest predation, and food. Ecological Monographs 65, 101–127.
Martins, E.P., Hansen, T.F., 1997. Phylogenies and the comparative method: ageneral approach to incorporating phylogenetic information into the analysis ofinterspecific data. American Naturalist 149, 646–667.
Martin, T.G., Chadès, I., Arcese, P., Marra, P.P., Possingham, H.P., Norris, D.R., 2007.Optimal conservation of migratory species. PLoS ONE 2, e751.
Moller, A.P., Rubolini, D., Lehikoinen, E., 2008. Populations of migratory bird speciesthat did not show a phenological response to climate change are declining.Proceedings of the National Academy of Sciences 105, 16195–16200.
Moller, A.P., 2008. Flight distance and population trends in European breeding birds.Behavioural Ecology 19, 1095–1102.
Newton, I., 2004a. Population limitation in migrants. Ibis 146, 197–226.Newton, I., 2004b. The recent declines of farmland bird populations in Britain: an
appraisal of causal factors and conservation actions. Ibis 146, 579–600.Nicholson, S.E., Somé, B., Kone, B., 2000. An analysis of recent rainfall conditions in
West Africa, including the rainy seasons of the 1997 El Niño and the 1998 LaNiña years. Journal of Climate 13, 2628–2640.
O’Connor, R.J., Shrubb, M., 1986. Farming and Birds. Cambridge University Press,Cambridge.
Owens, I.P.F., Bennett, P.M., 2000. Ecological basis of extinction risk in birds: Habitatloss versus human persecution and introduced predators. Proceedings of theNational Academy of Sciences 97, 12144–12148.
Pannekoek, J., van Strien, A., 1996. TRIM (TRends and Indices for Monitoring data).Research paper 9634. Statistics Netherlands, Voorburg.
Paradis, E., 2004. Use R! Analysis of Phylogenetics and Evolution with R. Springer,New York.
Parmesan, C., Yohe, G., 2003. A globally coherent fingerprint of climate changeimpacts across natural systems. Nature 421, 37–42.
Peach, W., Baillie, S., Underhill, L., 1991. Survival of British sedge warblersAcrocephalus schoenobaenus in relation to west African rainfall. Ibis 133, 300–305.
R Development Core Team, 2010. R: A Language and Environment for StatisticalComputing. R Foundation for Statistical Computing, Vienna.
Reif, J., Storch, D., Vor?šek, P., Štastny, K., Bejcek, V., 2008. Bird-habitat associationspredict population trends in central European forest and farmland birds.Biodiversity and Conservation 17, 3307–3319.
Risely, K., Noble, D.N., Baillie, S.R., 2009. The Breeding Bird Survey 2008. BTOResearch Report 537. British Trust for Ornithology, Thetford.
Robinson, R.A., Sutherland, W.J., 2002. Post-war changes in arable farming andbiodiversity in Great Britain. Journal of Applied Ecology 39, 157–176.
Robinson, R.A., Balmer, D.E., Marchant, J.M., 2008. Survival rates of hirundines inrelation to British and African rainfall. Ringing and Migration 24, 1–6.
Sæther, B.-E., 1988. Pattern of covariation between life history traits of Europeanbirds. Nature 331, 616–627.
Sæther, B.-E., Bakke, Ø., 2000. Avian life history variation and contribution ofdemographic traits to the population growth rate. Ecology 81, 642–653.
Sæther, B.-E., Engen, S., 2002. Patterns of variation in avian population growth rates.Philosophical Transactions of the Royalo Society of London B 357, 1185–1195.
Sanderson, F.J., Donald, P.F., Pain, D.J., Burfield, I.J., van Bommel, F.P.J., 2006. Long-term population declines in Afro-Palaearctic migrant birds. BiologicalConservation 131, 93–105.
Schaub, M., Kania, W., Koppen, U., 2005. Variation of primary production duringwinter induces synchrony in survival rates in migratory white storks Ciconiaciconia. Journal of Animal Ecology 74, 656–666.
Seoane, J., Carrascal, L.M., 2008. Interspecific differences in population trends ofSpanish birds are related to habitat and climatic preferences. Global Ecologyand Biogeography 17, 111–121.
Shultz, S., Bradbury, R.B., Evans, K.L., Gregory, R.D., Blackburn, T.M., 2005. Brain sizeand resource specialization predict long-term population trends in British birds.Proceedings of the Royal Society of London B 272, 2305–2311.
Siriwardena, G.M., Baillie, S.R., Buckland, S.T., Fewster, R.M., Marchant, J.M., Wilson,J.D., 1998. Trends in the abundance of farmland birds a quantitative comparisonof smoothed Common Birds Census indices. Journal of Applied Ecology 35, 24–43.
Thomas, J.A., Telfer, M.G., Roy, D.B., Preston, C.D., Greenwood, J.J.D., Asher, J., Fox, R.,Clarke, R.T., Lawton, J.H., 2004. Comparative losses of British butterflies, birds,and plants and the global extinction crisis. Science 303, 1879–1881.
Thomas, G., 2008. Phylogenetic distributions of British birds of conservationconcern. Proceedings of the Royal Society of London B 275, 2077–2083.
Vickery, J.A., Tallowin, J.R., Feber, R.E., Asteraki, E.J., Atkinson, P.W., Fuller, R.J.,Brown, V.K., 2001. The management of lowland neutral grasslands in Britain:effects of agricultural practices on birds and their food resources. Journal ofApplied Ecology 38, 647–664.
Webster, M.S., Marra, P.P., Haig, S.M., Bensch, S., Holmes, R.T., 2002. Links betweenworlds: traveling migratory connectivity. Trends in Ecology and Evolution 17,76–83.
Wernham, C.V., Toms, M.P., Marchant, J.H., Clark, J.A., Siriwardena, G.M., Baillie, S.R.(Eds.), 2002. The Migration Atlas: Movements of the Birds of Britain and Ireland.T&AD Poyser, London.
Winstanley, D., Spencer, R., Williamson, K., 1974. Where have all the Whitethroatsgone? Bird Study 21, 1–14.
Zuur, A.F., Ieno, E.N., Walker, N.J., Saveliev, A.A., Smith, G.M., 2009. Mixed EffectsModels and Extensions in Ecology with R. Springer, New York.