
Hydrolysis and Solvolysis of Methyltriethoxysilane Catalyzed with HCl or Trifluoroacetic Acid: IR...
15
Journal of Sol-Gel Science and Technology 34, 251–265, 2005 c 2005 Springer Science + Business Media, Inc. Manufactured in The Netherlands. Hydrolysis and Solvolysis of Methyltriethoxysilane Catalyzed with HCl or Trifluoroacetic Acid: IR Spectroscopic and Surface Energy Studies BORIS OREL ∗ , ROBI JE ˇ SE, ALJA ˇ Z VIL ˇ CNIK AND UR ˇ SKA LAVREN ˇ CI ˇ C ˇ STANGAR National Institute of Chemistry, Hajdrihova 19, 1000 Ljubljana, Slovenia [email protected] [email protected] [email protected] [email protected] Received April 21, 2004; Accepted November 2, 2004 Abstract. The aim of this study was, at first, to re-consider the IR spectra of methyltriethoxysilane (MTEOS) catalysed with HCl (hydrolysis) and to compare them with IR spectra of MTEOS catalysed with trifluoroacetic acid (TFAcOH). TFAcOH as a strong carboxylic acid performs non-hydrolytic sol-gel process based on the condensation between the alkoxide and the acid function, liberating ester molecules (solvolysis). We assessed from the time- dependent IR attenuated reflection spectroscopic (IR ATR) measurements the solvolysis and hydrolysis reactions, formation of the oligomeric species and final condensation products. Additional evidence for the formation of these species was obtained from the spectra of films dip-coated from sols aged to different extent. The results of the IR spectral analysis showed that the structure of both xerogels consisted of irregular T n (n = 8, 10, 12) cube-like species bridged via the ladder-like oligomers (in the case of MTEOS/TFAcOH) and open-chain trisiloxane species (for MTEOS/HCl). 29 Si NMR spectra of MTEOS/TFAcOH showed only signals of T 3 while MTEOS/HCl spectra showed beside T 3 also T 2 signals, in agreement with IR spectra results. From the XRD peaks at low Bragg angles (∼ 9–10 ◦ ) we inferred that both xerogels consisted of nanocrystalline CH 3 -SiO 3/2 species. In addition, the surface energy values of the films deposited from the corresponding sols were measured and the dispersive and polar portions correlated with the spectral features noted in the films. Keywords: precursor chemistry, hydrolysis, solvolysis, methyltriethoxysilane, IR spectroscopy 1. Introduction Methyltriethoxysilane (MTEOS) belongs to a large class of single-capped trialkoxysilanes characterized by hydrolysable reactive trialkoxy groups, while the re- maining Si C bonds do not undergo hydrolysis and re- main attached to the silicon during sol-gel processing. When the alkyl groups bear a certain organic function- ality (acrylic, isocyanato, epoxy, vinyl, etc) trialkoxy silanes could be cross-linked in three dimensional gels, which often exhibit multifunctional properties. Such ∗ To whom all correspondence should be addressed. organic-inorganic hybrids (ormosils) have been inves- tigated in detail in the past and their properties summa- rized in numerous review papers [1–3]. MTEOS and similar phenyltrialkoxysilanes (Ph- TEOS) attracted interest in the past as precursors for the synthesis of various silsesquioxanes [4–7], self- sustainable films suitable for gas selective membranes [8], low-dielectric materials for electronic MOS struc- tures [9] and recently, in the form of aerogels exhibiting superhydrophobic properties, showing contact angles for water of more than 150 degrees [10]. One of the particular features of MTEOS and related R-SiO 3/2 analogues [4] which contain
-
Upload
independent -
Category
Documents
-
view
4 -
download
0
Transcript of Hydrolysis and Solvolysis of Methyltriethoxysilane Catalyzed with HCl or Trifluoroacetic Acid: IR...
Journal of Sol-Gel Science and Technology 34, 251–265, 2005c© 2005 Springer Science + Business Media, Inc. Manufactured in The Netherlands.
Hydrolysis and Solvolysis of Methyltriethoxysilane Catalyzed with HClor Trifluoroacetic Acid: IR Spectroscopic and Surface Energy Studies
BORIS OREL∗, ROBI JESE, ALJAZ VILCNIK AND URSKA LAVRENCIC STANGARNational Institute of Chemistry, Hajdrihova 19, 1000 Ljubljana, Slovenia
Received April 21, 2004; Accepted November 2, 2004
Abstract. The aim of this study was, at first, to re-consider the IR spectra of methyltriethoxysilane (MTEOS)catalysed with HCl (hydrolysis) and to compare them with IR spectra of MTEOS catalysed with trifluoroacetic acid(TFAcOH). TFAcOH as a strong carboxylic acid performs non-hydrolytic sol-gel process based on the condensationbetween the alkoxide and the acid function, liberating ester molecules (solvolysis). We assessed from the time-dependent IR attenuated reflection spectroscopic (IR ATR) measurements the solvolysis and hydrolysis reactions,formation of the oligomeric species and final condensation products. Additional evidence for the formation of thesespecies was obtained from the spectra of films dip-coated from sols aged to different extent. The results of theIR spectral analysis showed that the structure of both xerogels consisted of irregular Tn (n = 8, 10, 12) cube-likespecies bridged via the ladder-like oligomers (in the case of MTEOS/TFAcOH) and open-chain trisiloxane species(for MTEOS/HCl). 29Si NMR spectra of MTEOS/TFAcOH showed only signals of T 3 while MTEOS/HCl spectrashowed beside T 3 also T 2 signals, in agreement with IR spectra results. From the XRD peaks at low Bragg angles(∼ 9–10◦) we inferred that both xerogels consisted of nanocrystalline CH3-SiO3/2 species. In addition, the surfaceenergy values of the films deposited from the corresponding sols were measured and the dispersive and polar portionscorrelated with the spectral features noted in the films.
Keywords: precursor chemistry, hydrolysis, solvolysis, methyltriethoxysilane, IR spectroscopy
1. Introduction
Methyltriethoxysilane (MTEOS) belongs to a largeclass of single-capped trialkoxysilanes characterizedby hydrolysable reactive trialkoxy groups, while the re-maining Si C bonds do not undergo hydrolysis and re-main attached to the silicon during sol-gel processing.When the alkyl groups bear a certain organic function-ality (acrylic, isocyanato, epoxy, vinyl, etc) trialkoxysilanes could be cross-linked in three dimensional gels,which often exhibit multifunctional properties. Such
∗To whom all correspondence should be addressed.
organic-inorganic hybrids (ormosils) have been inves-tigated in detail in the past and their properties summa-rized in numerous review papers [1–3].
MTEOS and similar phenyltrialkoxysilanes (Ph-TEOS) attracted interest in the past as precursors forthe synthesis of various silsesquioxanes [4–7], self-sustainable films suitable for gas selective membranes[8], low-dielectric materials for electronic MOS struc-tures [9] and recently, in the form of aerogels exhibitingsuperhydrophobic properties, showing contact anglesfor water of more than 150 degrees [10].
One of the particular features of MTEOS andrelated R-SiO3/2 analogues [4] which contain
252 Orel et al.
non-hydrolysable CH3 Si bonds is that acid hydrolysisinevitably leads to a polycondensation of trifunctionalmonomers into crystalline or amorphous silsesquiox-anes having complex (T cube-like) structures [4, 11–13]. Sakka et al. [14] avoided the formation of pre-cipitates of CH3SiO3/2 by decreasing the amount ofwater (MTEOS/H2O = 1:1). From rheological mea-surements it was deduced that linear oligomers wereformed. Zhang et al. [15] used MTEOS/H2O = 1:1.5but to obtain transparent gels the ethanol formed dur-ing hydrolysis was continuously removed from the sols.The removal of EtOH enabled Wada [16] to make trans-parent MTEOS gels and use them for Raman spec-troscopic analysis, while Haruvy [17] succeeded inmaking transparent gels by increasing the gelation tem-perature to 80◦C. To avoid precipitates and to increasethe transparency of gels Zhang et al. [18, 19] usedAl(acac)3 chelating agent to control the polymerisationof hydrolysed species in the sol. Thick self-sustainableMTEOS films were prepared by pouring MTEOS—with or without added Al(acac)3 [20, 21]—into water(containing NaCI to match the density of the MTEOSgels (ρ = 1.22 g/cm3) and the films were scoopedfrom the surface. In any case, to get transparent gelsit is appropriate to keep the amount of MTEOS/H2Onot higher than 1:1.5, EtOH should be removed and thetemperature of gelling elevated. Under such conditionssmaller oligomeric species, formed at the beginning ofthe gelation process, could be randomly polymerised.Water is added at a later stage and gels become trans-parent due to their irregular structure.
Most of the information about the structural prop-erties of MTEOS gels was gathered so far from thecorresponding XRD [15, 19], IR [4, 6, 7, 11–13, 15,16, 18–21] and NMR [22–24] spectra and rheologi-cal measurements [14, 15]. We focus in this work oninvestigations of the IR spectra of MTEOS sols andgels because the relatively simple structure of MTEOSand the extensive spectroscopic studies already madea few decades ago on T cube-like polysilsesquiox-anes make it possible to analyse such spectra in suf-ficient detail. Inspection of the reported infrared spec-troscopic results revealed some problems, which needclarification. For example, transparent gels [15, 19]prepared with added Al(acac)3 exhibit intensity ratiosof the most prominent Si O Si stretching bands at1120 and 1030 cm−1 (R = I(1120 cm−1/I(1030 cm−1))close to 1, while opaque gels [19] without Al(acac)3
show R smaller than 1. In the spectra of scooped films[20, 21] the 1120 cm−1 band appears as a shoulder
and the 1030 cm−1 band dominates the spectra. It isobvious that the processing parameters and the com-position of the sols influence the bands attributed tothe silsesquioxane skeleton. The optical transparencyof the gels was also correlated with the correspondingXRD spectra [15, 19]. Transparent gels show largercorrelation distances (estimated from the lowest Braggangle at ∼10◦) than opaque gels.
Another spectral range of interest is 500–600cm−1 where the siloxane ring modes appear. Kamiyaet al. [25] from his studies of acid catalysed MTEOSsols and gels and their transformations to SiO2 glasses(in N2 and NH3) concluded that gels consist of 4-foldsiloxane rings, in agreement with the work of Yoshinoet al. [26] who came independently to the same con-clusion. That led Wada et al. [16] to perform XRD ra-dial distribution analysis of acid catalysed (HCl/H2O)MTEOS gels, deducing from the spectral analysis thatthe structure consisted of ladder-like polymers. That issomewhat surprising because it is known that ladder-like polymers exist only in KOH catalysed phenyl-SiO3/2 gels [11–13]. Obviously, additional (or other)structural elements should be present as well contribut-ing to the irregular structure of gels.
Accordingly, we decided to perform IR spectral anal-ysis of MTEOS gels obtained from HCl catalysedsols and compare them to those catalysed with triflu-oroacetic acid (TFAcOH). The reason for using TFA-cOH lies in the ability of strong carboxylic acids (alsochlorodifluoroacetic acid, acrylic acid, formic acid,pyruvic acid) to promote the non-hydrolytic sol-gelprocess, first mentioned by Pope and Mackenzie [27]and later elaborated by Vioux and Leclerq [28], andused for making organic-inorganic hybrids by Sharp[29]. The non-hydrolytic route is based on condensa-tion between the alkoxide and the acid function, liber-ating ester molecules. Due to the differences betweenthe solvolysis and hydrolysis reactions we expectedthat IR spectra would give additional evidence aboutthe structural characteristics of the methylsilsesquiox-ane species formed in MTEOS sols and gels. For as-sessment of the solvolysis and hydrolysis reactions, theformation of oligomeric species and the final conden-sation product, i.e. gel, we used the time-dependent IRattenuated reflection spectroscopic (IR ATR) measure-ment technique. For recording the spectra of condensa-tion products formed in the course of gelling, thin filmswere deposited on silicon wafer substrates dipped con-secutively in sols aged to a different extent. Finally,XRD spectra of HCl and TFAcOH catalysed gels were
Hydrolysis and Solvolysis of Methyltriethoxysilane Catalyzed with HCl or Trifluoroacetic Acid 253
measured and the correlation distances correlated withthe characteristic features observed in the correspond-ing IR spectra. As supporting evidence for the differentstructures of the films prepared with TFAcOH and HClcatalysts, surface energy values of the films depositedfrom the corresponding sols were measured and the val-ues of the dispersive and polar portions of the surfaceenergies correlated with the spectral features noted inthe films.
2. Experimental
2.1. Preparation of Sols, Gelsand Heat-Treated Films
For making gels MTEOS was mixed with TFAcOH inequimolar ratio expressed as n(OEt)/n(TFAcOH) = 1.The mixture was homogenized for 10 min and then usedfor infrared spectroscopic analysis (t = 0 in IR spec-tra measurements). The mixture gelled when left in aclosed vessel at ambient temperature in a few hours.The gels showed an expelled syneresis liquid, iden-tified by IR spectroscopic measurements as the esterof TFAcOH. During drying at ambient conditions themonoliths cracked into smaller pieces (approx. 1 cm3
in size) and became transparent. Heat-treatment of thegels up to 300 ◦C did not cause further cracking, but at400 and 500 ◦C gels became white and scattered light,indicating the formation of pores due to the decompo-sition of CH3 groups [15]. Membranes were made bypouring the MTEOS sols on Teflon dishes and left to dryin air. When the layers were less than 1 mm thick, ho-mogeneous and transparent membranes formed. Theycould be removed from the substrate whereas thickerones folded but their visual appearance did not change.
MTEOS/HCl sols were prepared by mixing 0.1 MHCl with MTEOS in MTEOS:H2O = 1:3 molar ratio.In contrast to MTEOS/TFAcOH these sols did not gelwhen left in a closed vessel (few weeks) but becamemore viscous. Freshly made sols poured on a Teflondish gelled into membranes (∼3 days). After longerdrying (10 days) the membranes cracked and creasedfrom the Teflon substrate.
Xerogels of TFAcOH and HCl catalysed sols wereobtained after drying the gels at ambient conditions.Xerogels were crushed to powder, mixed with KBr andpressed into pellets, which were used for recording IRspectra. Thin films were deposited at ambient condi-tions by dip coating (withdrawing speed 10 cm/min)from freshly made sols until they gelled. No pro-
tective atmosphere was used for the deposition ofMTEOS/TFAcOH films. Ageing time for the latter solswas 2.5 h while MTEOS/HCl sols were aged 24 h.
2.2. Measurement Techniques
Sol-gel transitions have often been investigated with thehelp of ATR spectra measurements, mainly to followspectral changes during the hydrolysis of precursors[30, 31]. Horizontal (HATR, Spectra Tech) or circu-lar ATR [32] attachments equipped with a ZnSe ATRcrystal (n = 2.4) were used in most cases, but a Gecrystal (n = 4.0) or KRS-5 (n = 2.4) was sometimesapplied as well. Unpolarized light was used for collect-ing the spectra and the incidence angle was usually 45◦.When using a ZnSe ATR crystal (incidence angle 45◦)in our HATR attachment (SpectraTech) for recordingspectra we noticed that the frequencies of the bands dif-fered by up to 20 cm−1 with respect to those recordedwith the same ATR attachment equipped with Ge ATRcrystal (not shown here). Frequencies recorded withthe Ge ATR crystal were always higher, indicating thatthe intensity and the related dispersion of the bandswas greater than that required to obtain ATR spectrawhich would perfectly match the transmission spectra.Corrections due to frequency dependence of the pen-etration depths were not applied. All the spectra werenormalized to the CH3 deformation band at 1267 cm−1.IR spectra of thin films, ATR and xerogels (KBr pellets)were measured in the transmission mode (absorbancescale) with a resolution of 4 cm−1 on the Perkin-ElmerSystem 2000 spectrometer. Films were deposited ondouble-side polished silicon wafers (Silicon Quest In-ternational) that were applied also as a background forIR transmission measurements. 16 scans were used torecord the spectra. Smoothing and baseline correctionswere made for the spectra of thin films by using thePerkin Elmer standard instrumental software Spectrumv3.01.
XRD patterns were measured on a Philips PW1710automated X-ray diffractometer. 29Si CP MAS solid-state NMR spectra were recorded on a Varian Unityplus 300 MHz spectrometer. The frequency of samplerotation was 4 kHz. For each spectrum 800 scans wereaccumulated.
Contact angle measurements were made on a contactangle goniometer (Kruess). Each time 20 µL of the liq-uid with a known surface tension was dropped on thesurface of the film and the contact angle determined.Four different liquids were used: dimethylformamide
254 Orel et al.
(γlv = 37.1 N/m; γ dlv = 29.0 N/m, γ
plv = 8.1 N/m),
benzylalcohol (γlv = 39.0 N/m; γ dlv = 30.3 N/m,
γp
lv = 8.7 N/m), formamide (γlv = 58.2 N/m; γ dlv =
28.7 N/m, γ plv = 29.5 N/m) and water (γlv = 72.8 N/m;
γ dlv = 21.8 N/m, γ p
lv = 51.0 N/m). Contact angles weremeasured on at least 4 different spots on the film. Theerror in reading the contact angle values was estimatedto be +/−2◦. The contributions of polar (γ p
sv) and dis-persive (γ d
sv) values to the total surface energy (γsv)of the films were determined according to Owens andWendt [33] using the following relation:
(1 + cos θ )∗γlv
2∗√
γ dlv
=√
γ dsv +
√γ
psv ∗
√γlv − γ d
lv√γ d
lv
The polar and dispersive parts of the surface energywere obtained by solving this equation with a leastsquares regression technique taking into account theexperimental contact angle (θ ) data.
3. Results and Discussion
3.1. XRD Measurements
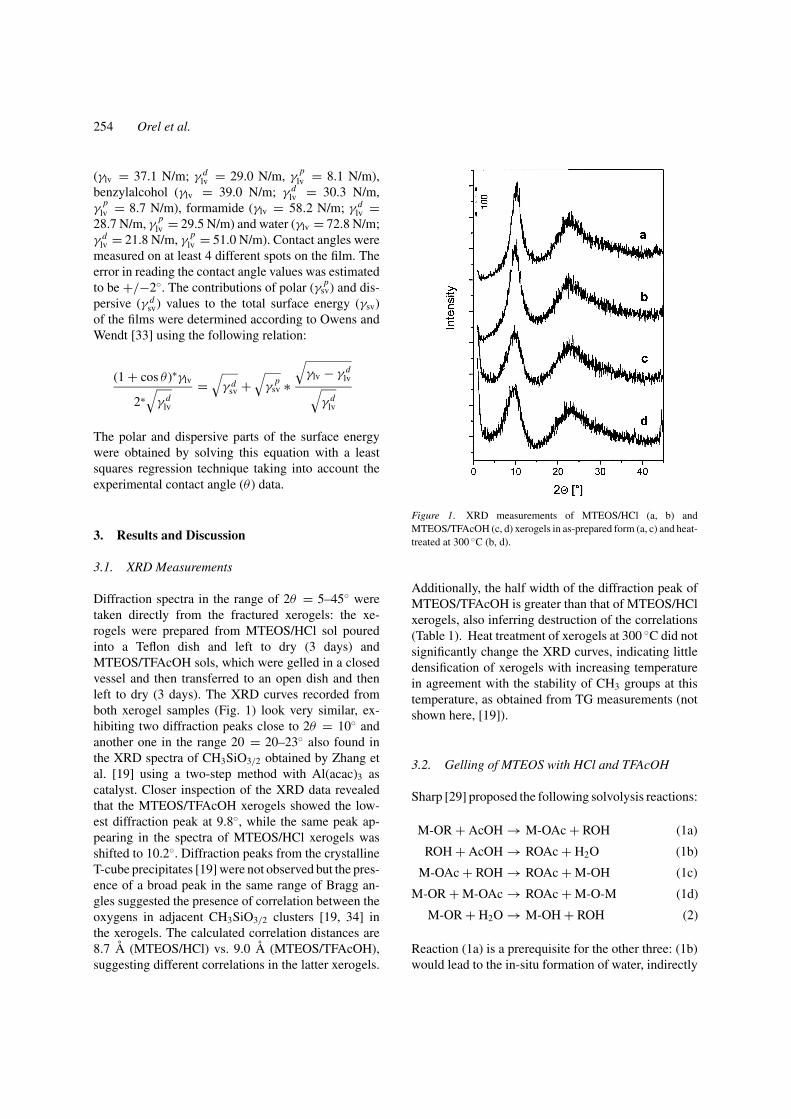
Diffraction spectra in the range of 2θ = 5–45◦ weretaken directly from the fractured xerogels: the xe-rogels were prepared from MTEOS/HCl sol pouredinto a Teflon dish and left to dry (3 days) andMTEOS/TFAcOH sols, which were gelled in a closedvessel and then transferred to an open dish and thenleft to dry (3 days). The XRD curves recorded fromboth xerogel samples (Fig. 1) look very similar, ex-hibiting two diffraction peaks close to 2θ = 10◦ andanother one in the range 20 = 20–23◦ also found inthe XRD spectra of CH3SiO3/2 obtained by Zhang etal. [19] using a two-step method with Al(acac)3 ascatalyst. Closer inspection of the XRD data revealedthat the MTEOS/TFAcOH xerogels showed the low-est diffraction peak at 9.8◦, while the same peak ap-pearing in the spectra of MTEOS/HCl xerogels wasshifted to 10.2◦. Diffraction peaks from the crystallineT-cube precipitates [19] were not observed but the pres-ence of a broad peak in the same range of Bragg an-gles suggested the presence of correlation between theoxygens in adjacent CH3SiO3/2 clusters [19, 34] inthe xerogels. The calculated correlation distances are8.7 A (MTEOS/HCl) vs. 9.0 A (MTEOS/TFAcOH),suggesting different correlations in the latter xerogels.
Figure 1. XRD measurements of MTEOS/HCl (a, b) andMTEOS/TFAcOH (c, d) xerogels in as-prepared form (a, c) and heat-treated at 300 ◦C (b, d).
Additionally, the half width of the diffraction peak ofMTEOS/TFAcOH is greater than that of MTEOS/HClxerogels, also inferring destruction of the correlations(Table 1). Heat treatment of xerogels at 300 ◦C did notsignificantly change the XRD curves, indicating littledensification of xerogels with increasing temperaturein agreement with the stability of CH3 groups at thistemperature, as obtained from TG measurements (notshown here, [19]).
3.2. Gelling of MTEOS with HCl and TFAcOH
Sharp [29] proposed the following solvolysis reactions:
M-OR + AcOH → M-OAc + ROH (1a)
ROH + AcOH → ROAc + H2O (1b)
M-OAc + ROH → ROAc + M-OH (1c)
M-OR + M-OAc → ROAc + M-O-M (1d)
M-OR + H2O → M-OH + ROH (2)
Reaction (1a) is a prerequisite for the other three: (1b)would lead to the in-situ formation of water, indirectly
Hydrolysis and Solvolysis of Methyltriethoxysilane Catalyzed with HCl or Trifluoroacetic Acid 255
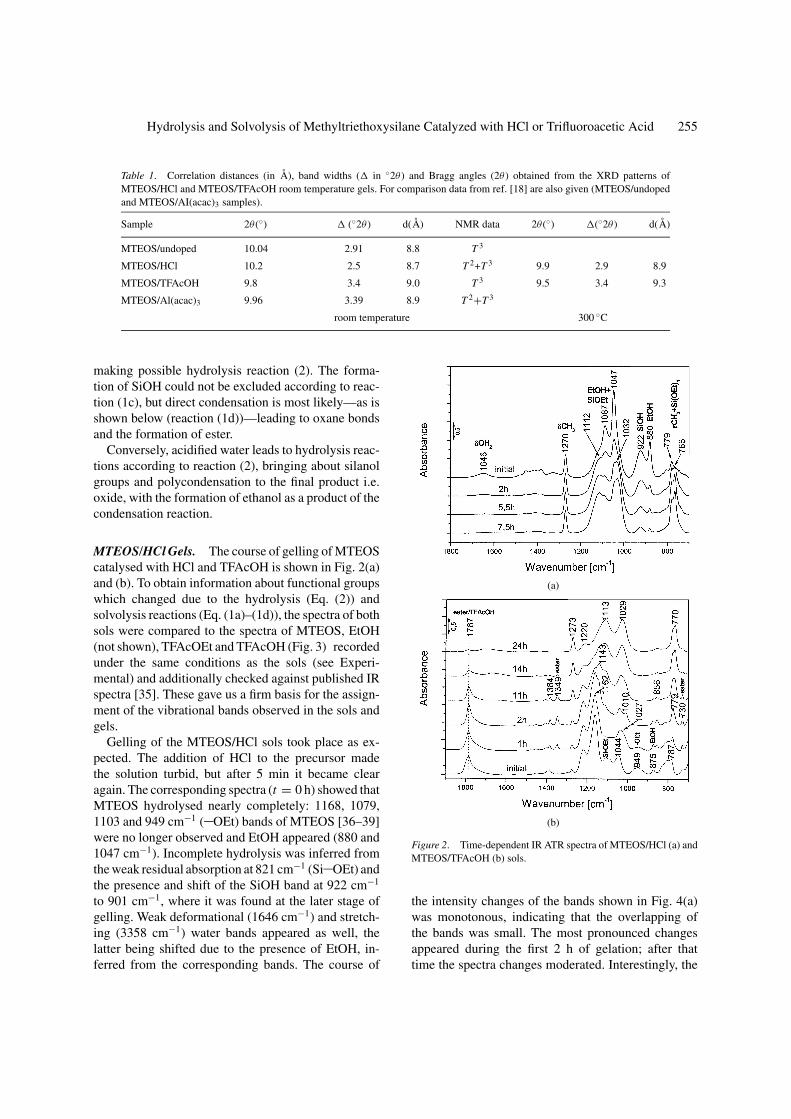
Table 1. Correlation distances (in A), band widths (� in ◦2θ ) and Bragg angles (2θ ) obtained from the XRD patterns ofMTEOS/HCl and MTEOS/TFAcOH room temperature gels. For comparison data from ref. [18] are also given (MTEOS/undopedand MTEOS/AI(acac)3 samples).
Sample 2θ (◦) � (◦2θ ) d(A) NMR data 2θ (◦) �(◦2θ ) d(A)
MTEOS/undoped 10.04 2.91 8.8 T 3
MTEOS/HCl 10.2 2.5 8.7 T 2+T 3 9.9 2.9 8.9
MTEOS/TFAcOH 9.8 3.4 9.0 T 3 9.5 3.4 9.3
MTEOS/Al(acac)3 9.96 3.39 8.9 T 2+T 3
room temperature 300 ◦C
making possible hydrolysis reaction (2). The forma-tion of SiOH could not be excluded according to reac-tion (1c), but direct condensation is most likely—as isshown below (reaction (1d))—leading to oxane bondsand the formation of ester.
Conversely, acidified water leads to hydrolysis reac-tions according to reaction (2), bringing about silanolgroups and polycondensation to the final product i.e.oxide, with the formation of ethanol as a product of thecondensation reaction.
MTEOS/HCl Gels. The course of gelling of MTEOScatalysed with HCl and TFAcOH is shown in Fig. 2(a)and (b). To obtain information about functional groupswhich changed due to the hydrolysis (Eq. (2)) andsolvolysis reactions (Eq. (1a)–(1d)), the spectra of bothsols were compared to the spectra of MTEOS, EtOH(not shown), TFAcOEt and TFAcOH (Fig. 3) recordedunder the same conditions as the sols (see Experi-mental) and additionally checked against published IRspectra [35]. These gave us a firm basis for the assign-ment of the vibrational bands observed in the sols andgels.
Gelling of the MTEOS/HCl sols took place as ex-pected. The addition of HCl to the precursor madethe solution turbid, but after 5 min it became clearagain. The corresponding spectra (t = 0 h) showed thatMTEOS hydrolysed nearly completely: 1168, 1079,1103 and 949 cm−1 ( OEt) bands of MTEOS [36–39]were no longer observed and EtOH appeared (880 and1047 cm−1). Incomplete hydrolysis was inferred fromthe weak residual absorption at 821 cm−1 (Si OEt) andthe presence and shift of the SiOH band at 922 cm−1
to 901 cm−1, where it was found at the later stage ofgelling. Weak deformational (1646 cm−1) and stretch-ing (3358 cm−1) water bands appeared as well, thelatter being shifted due to the presence of EtOH, in-ferred from the corresponding bands. The course of
(a)
(b)
Figure 2. Time-dependent IR ATR spectra of MTEOS/HCl (a) andMTEOS/TFAcOH (b) sols.
the intensity changes of the bands shown in Fig. 4(a)was monotonous, indicating that the overlapping ofthe bands was small. The most pronounced changesappeared during the first 2 h of gelation; after thattime the spectra changes moderated. Interestingly, the
256 Orel et al.
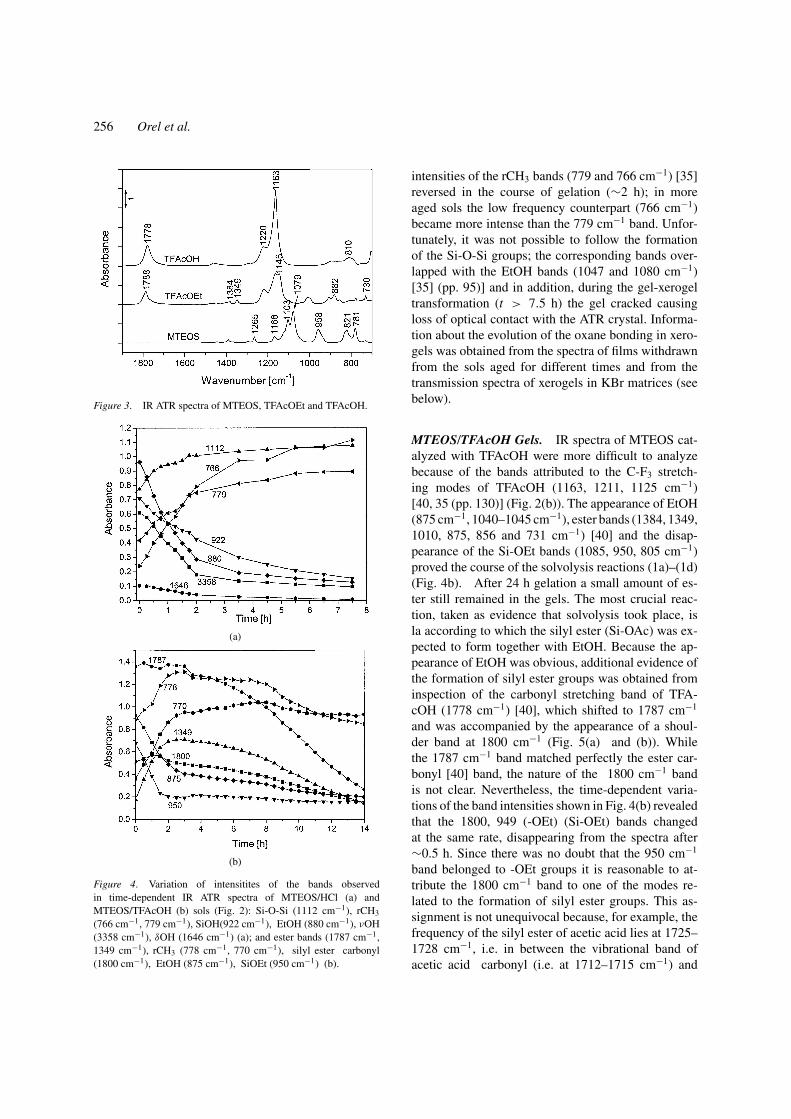
Figure 3. IR ATR spectra of MTEOS, TFAcOEt and TFAcOH.
(a)
(b)
Figure 4. Variation of intensitites of the bands observedin time-dependent IR ATR spectra of MTEOS/HCl (a) andMTEOS/TFAcOH (b) sols (Fig. 2): Si-O-Si (1112 cm−1), rCH3
(766 cm−1, 779 cm−1), SiOH(922 cm−1), EtOH (880 cm−1), νOH(3358 cm−1), δOH (1646 cm−1) (a); and ester bands (1787 cm−1,1349 cm−1), rCH3 (778 cm−1, 770 cm−1), silyl ester carbonyl(1800 cm−1), EtOH (875 cm−1), SiOEt (950 cm−1) (b).
intensities of the rCH3 bands (779 and 766 cm−1) [35]reversed in the course of gelation (∼2 h); in moreaged sols the low frequency counterpart (766 cm−1)became more intense than the 779 cm−1 band. Unfor-tunately, it was not possible to follow the formationof the Si-O-Si groups; the corresponding bands over-lapped with the EtOH bands (1047 and 1080 cm−1)[35] (pp. 95)] and in addition, during the gel-xerogeltransformation (t > 7.5 h) the gel cracked causingloss of optical contact with the ATR crystal. Informa-tion about the evolution of the oxane bonding in xero-gels was obtained from the spectra of films withdrawnfrom the sols aged for different times and from thetransmission spectra of xerogels in KBr matrices (seebelow).
MTEOS/TFAcOH Gels. IR spectra of MTEOS cat-alyzed with TFAcOH were more difficult to analyzebecause of the bands attributed to the C-F3 stretch-ing modes of TFAcOH (1163, 1211, 1125 cm−1)[40, 35 (pp. 130)] (Fig. 2(b)). The appearance of EtOH(875 cm−1, 1040–1045 cm−1), ester bands (1384, 1349,1010, 875, 856 and 731 cm−1) [40] and the disap-pearance of the Si-OEt bands (1085, 950, 805 cm−1)proved the course of the solvolysis reactions (1a)–(1d)(Fig. 4b). After 24 h gelation a small amount of es-ter still remained in the gels. The most crucial reac-tion, taken as evidence that solvolysis took place, isla according to which the silyl ester (Si-OAc) was ex-pected to form together with EtOH. Because the ap-pearance of EtOH was obvious, additional evidence ofthe formation of silyl ester groups was obtained frominspection of the carbonyl stretching band of TFA-cOH (1778 cm−1) [40], which shifted to 1787 cm−1
and was accompanied by the appearance of a shoul-der band at 1800 cm−1 (Fig. 5(a) and (b)). Whilethe 1787 cm−1 band matched perfectly the ester car-bonyl [40] band, the nature of the 1800 cm−1 bandis not clear. Nevertheless, the time-dependent varia-tions of the band intensities shown in Fig. 4(b) revealedthat the 1800, 949 (-OEt) (Si-OEt) bands changedat the same rate, disappearing from the spectra after∼0.5 h. Since there was no doubt that the 950 cm−1
band belonged to -OEt groups it is reasonable to at-tribute the 1800 cm−1 band to one of the modes re-lated to the formation of silyl ester groups. This as-signment is not unequivocal because, for example, thefrequency of the silyl ester of acetic acid lies at 1725–1728 cm−1, i.e. in between the vibrational band ofacetic acid carbonyl (i.e. at 1712–1715 cm−1) and
Hydrolysis and Solvolysis of Methyltriethoxysilane Catalyzed with HCl or Trifluoroacetic Acid 257
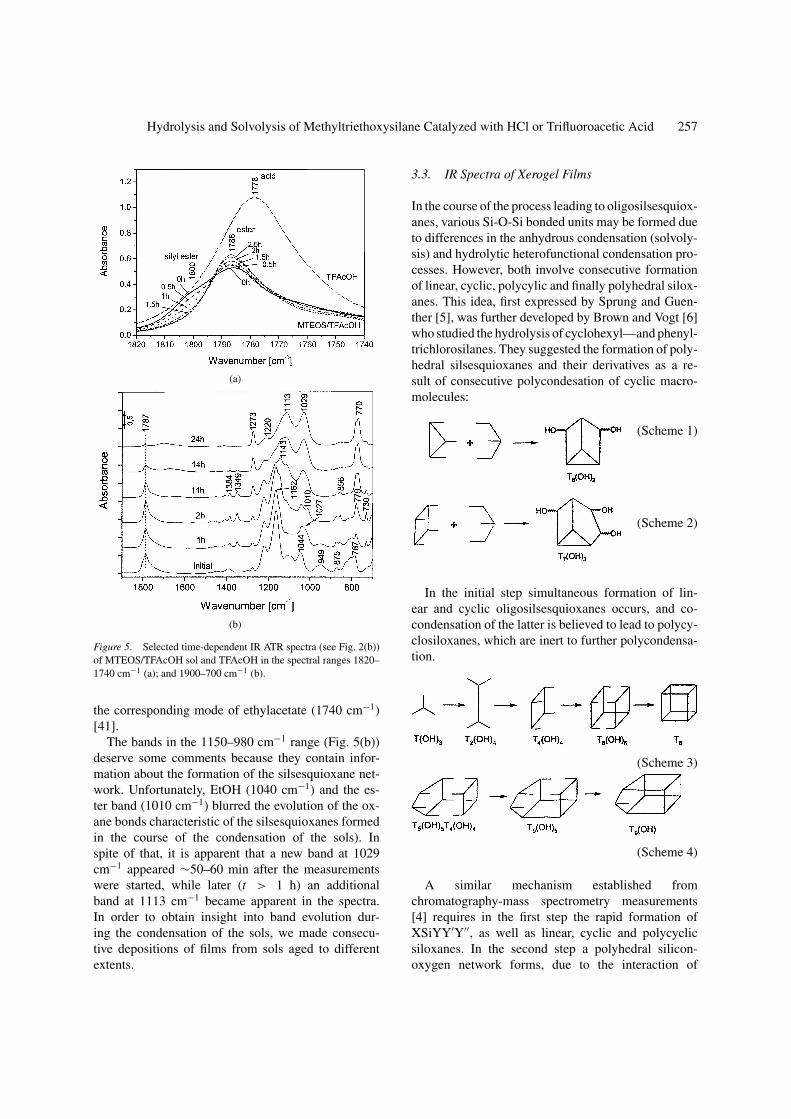
(a)
(b)
Figure 5. Selected time-dependent IR ATR spectra (see Fig. 2(b))of MTEOS/TFAcOH sol and TFAcOH in the spectral ranges 1820–1740 cm−1 (a); and 1900–700 cm−1 (b).
the corresponding mode of ethylacetate (1740 cm−1)[41].
The bands in the 1150–980 cm−1 range (Fig. 5(b))deserve some comments because they contain infor-mation about the formation of the silsesquioxane net-work. Unfortunately, EtOH (1040 cm−1) and the es-ter band (1010 cm−1) blurred the evolution of the ox-ane bonds characteristic of the silsesquioxanes formedin the course of the condensation of the sols). Inspite of that, it is apparent that a new band at 1029cm−1 appeared ∼50–60 min after the measurementswere started, while later (t > 1 h) an additionalband at 1113 cm−1 became apparent in the spectra.In order to obtain insight into band evolution dur-ing the condensation of the sols, we made consecu-tive depositions of films from sols aged to differentextents.
3.3. IR Spectra of Xerogel Films
In the course of the process leading to oligosilsesquiox-anes, various Si-O-Si bonded units may be formed dueto differences in the anhydrous condensation (solvoly-sis) and hydrolytic heterofunctional condensation pro-cesses. However, both involve consecutive formationof linear, cyclic, polycylic and finally polyhedral silox-anes. This idea, first expressed by Sprung and Guen-ther [5], was further developed by Brown and Vogt [6]who studied the hydrolysis of cyclohexyl—and phenyl-trichlorosilanes. They suggested the formation of poly-hedral silsesquioxanes and their derivatives as a re-sult of consecutive polycondesation of cyclic macro-molecules:
(Scheme 1)
(Scheme 2)
In the initial step simultaneous formation of lin-ear and cyclic oligosilsesquioxanes occurs, and co-condensation of the latter is believed to lead to polycy-closiloxanes, which are inert to further polycondensa-tion.
(Scheme 3)
(Scheme 4)
A similar mechanism established fromchromatography-mass spectrometry measurements[4] requires in the first step the rapid formation ofXSiYY′Y′′, as well as linear, cyclic and polycyclicsiloxanes. In the second step a polyhedral silicon-oxygen network forms, due to the interaction of
258 Orel et al.
condensed polycyclic siloxanes with monomers anddimers, which may contain substituents (Y′,Y′′,Y′′′) ofdifferent reactivity (Y = OH, -OEt, -OAc (solvolysis)).
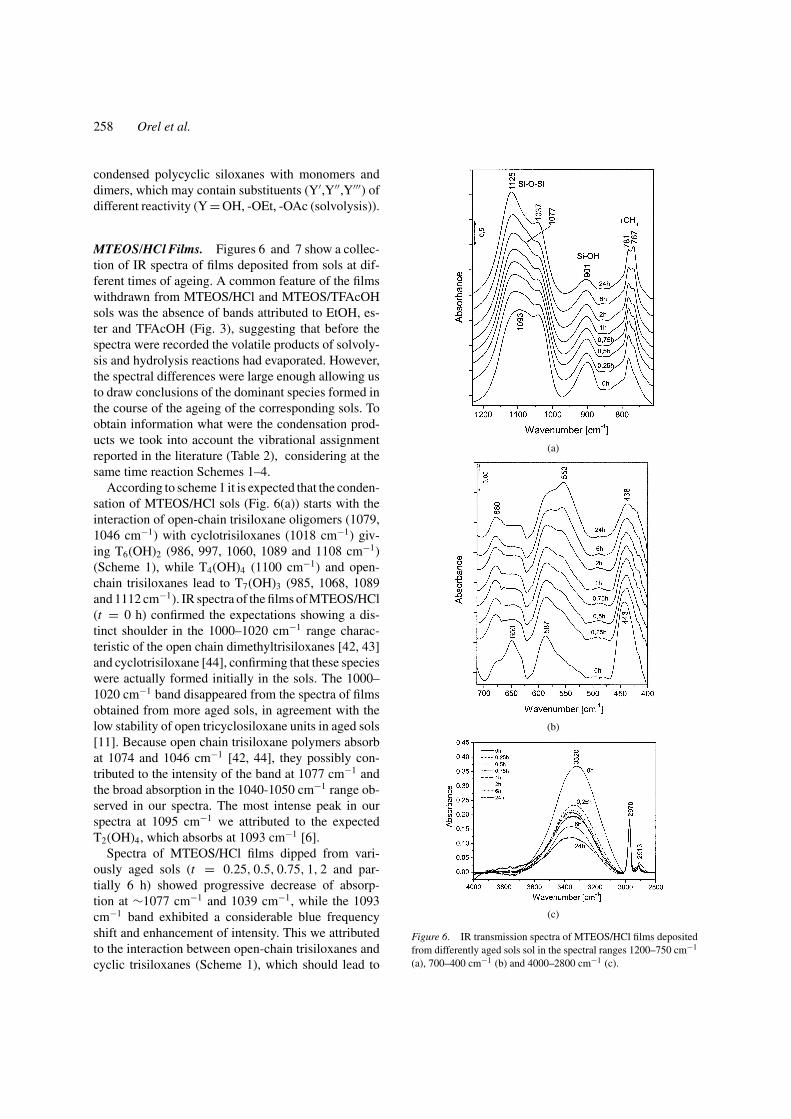
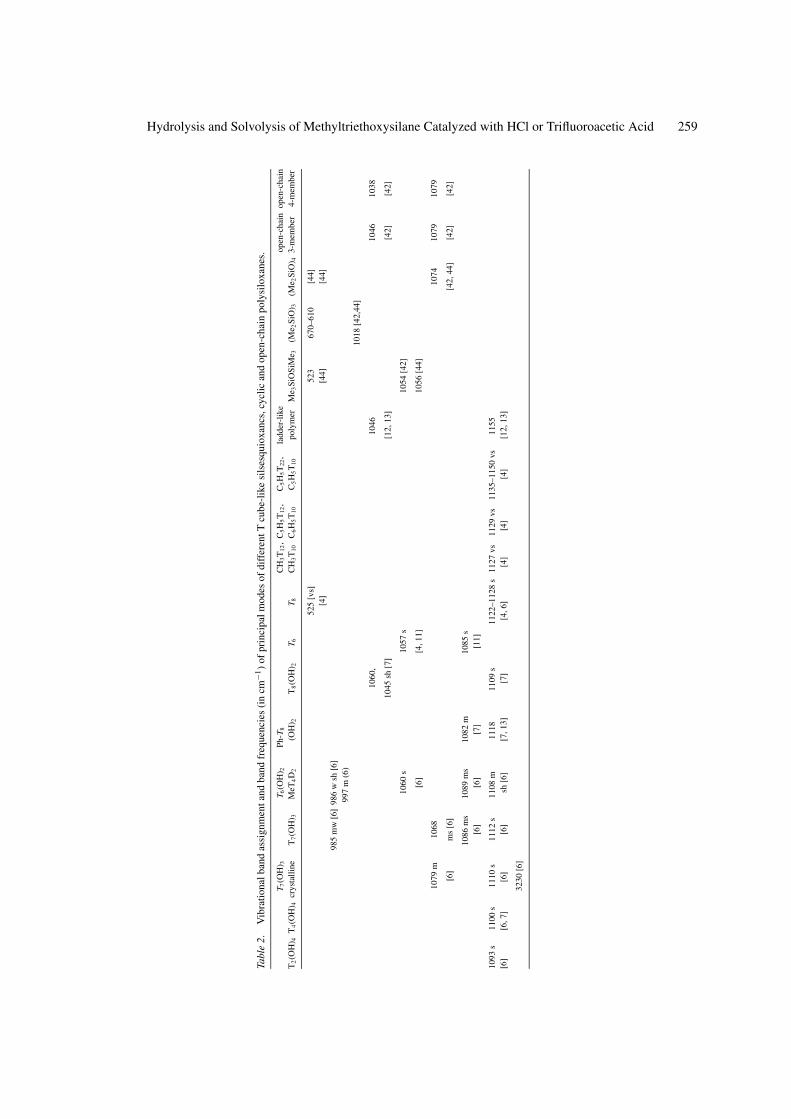
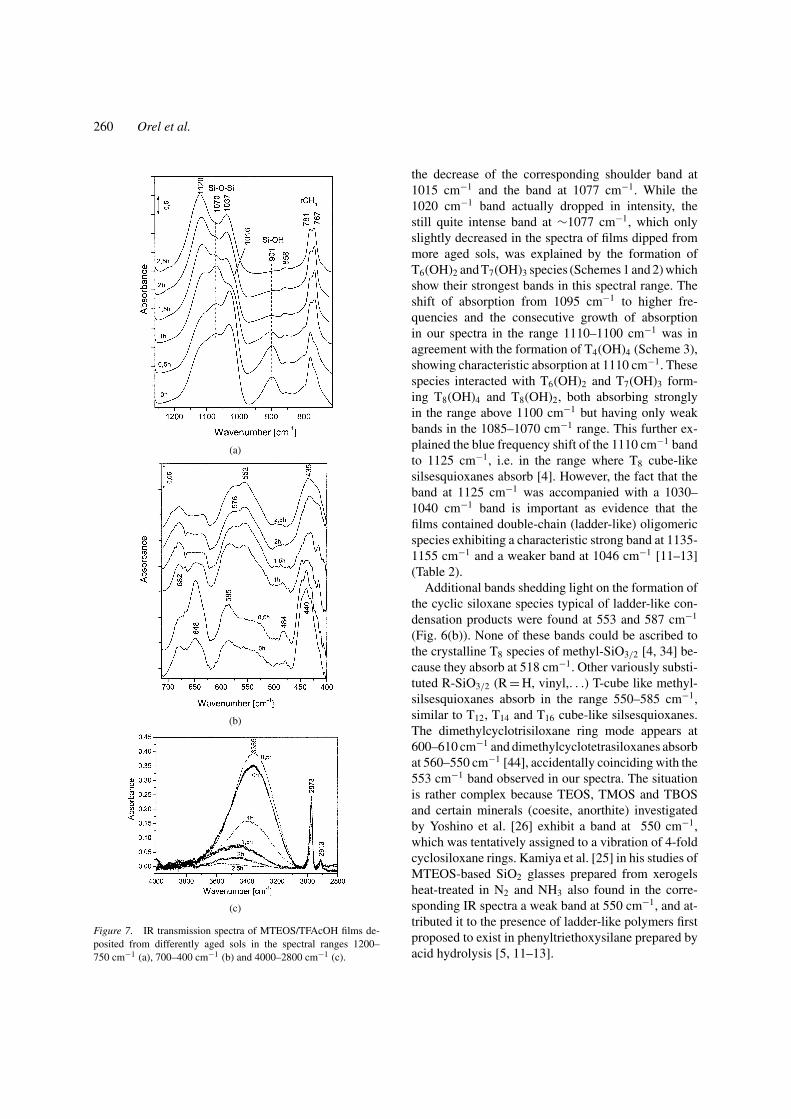
MTEOS/HCl Films. Figures 6 and 7 show a collec-tion of IR spectra of films deposited from sols at dif-ferent times of ageing. A common feature of the filmswithdrawn from MTEOS/HCl and MTEOS/TFAcOHsols was the absence of bands attributed to EtOH, es-ter and TFAcOH (Fig. 3), suggesting that before thespectra were recorded the volatile products of solvoly-sis and hydrolysis reactions had evaporated. However,the spectral differences were large enough allowing usto draw conclusions of the dominant species formed inthe course of the ageing of the corresponding sols. Toobtain information what were the condensation prod-ucts we took into account the vibrational assignmentreported in the literature (Table 2), considering at thesame time reaction Schemes 1–4.
According to scheme 1 it is expected that the conden-sation of MTEOS/HCl sols (Fig. 6(a)) starts with theinteraction of open-chain trisiloxane oligomers (1079,1046 cm−1) with cyclotrisiloxanes (1018 cm−1) giv-ing T6(OH)2 (986, 997, 1060, 1089 and 1108 cm−1)(Scheme 1), while T4(OH)4 (1100 cm−1) and open-chain trisiloxanes lead to T7(OH)3 (985, 1068, 1089and 1112 cm−1). IR spectra of the films of MTEOS/HCl(t = 0 h) confirmed the expectations showing a dis-tinct shoulder in the 1000–1020 cm−1 range charac-teristic of the open chain dimethyltrisiloxanes [42, 43]and cyclotrisiloxane [44], confirming that these specieswere actually formed initially in the sols. The 1000–1020 cm−1 band disappeared from the spectra of filmsobtained from more aged sols, in agreement with thelow stability of open tricyclosiloxane units in aged sols[11]. Because open chain trisiloxane polymers absorbat 1074 and 1046 cm−1 [42, 44], they possibly con-tributed to the intensity of the band at 1077 cm−1 andthe broad absorption in the 1040-1050 cm−1 range ob-served in our spectra. The most intense peak in ourspectra at 1095 cm−1 we attributed to the expectedT2(OH)4, which absorbs at 1093 cm−1 [6].
Spectra of MTEOS/HCl films dipped from vari-ously aged sols (t = 0.25, 0.5, 0.75, 1, 2 and par-tially 6 h) showed progressive decrease of absorp-tion at ∼1077 cm−1 and 1039 cm−1, while the 1093cm−1 band exhibited a considerable blue frequencyshift and enhancement of intensity. This we attributedto the interaction between open-chain trisiloxanes andcyclic trisiloxanes (Scheme 1), which should lead to
(a)
(b)
(c)
Figure 6. IR transmission spectra of MTEOS/HCl films depositedfrom differently aged sols sol in the spectral ranges 1200–750 cm−1
(a), 700–400 cm−1 (b) and 4000–2800 cm−1 (c).
Hydrolysis and Solvolysis of Methyltriethoxysilane Catalyzed with HCl or Trifluoroacetic Acid 259
Tabl
e2.
Vib
ratio
nalb
and
assi
gnm
enta
ndba
ndfr
eque
ncie
s(i
ncm
−1)
ofpr
inci
palm
odes
ofdi
ffer
entT
cube
-lik
esi
lses
quio
xanc
s,cy
clic
and
open
-cha
inpo
lysi
loxa
nes.
T 7(O
H) 3
T 6(O
H) 2
Ph-T
8C
H3T
12,
C5H
5T
12,
C5H
5T
22,
ladd
er-l
ike
open
-cha
inop
en-c
hain
T2(O
H) 4
T4(O
H) 4
crys
talli
neT
7(O
H) 3
MeT
4D
2(O
H) 2
T8(O
H) 2
T 6T 8
CH
3T
10C
6H
5T
10C
5H
5T
10po
lym
erM
e 3Si
OSi
Me 3
(Me 2
SiO
) 3(M
e 2Si
O) 4
3-m
embe
r4-
mem
ber
525
[vs]
523
670–
610
[44]
[4]
[44]
[44]
985
mw
[6]
986
wsh
[6]
997
m(6
)10
18[4
2,44
]
1060
,10
4610
4610
38
1045
sh[7
][1
2,13
][4
2][4
2]
1060
s10
57s
1054
[42]
[6]
[4,1
1]10
56[4
4]
1079
m10
6810
7410
7910
79
[6]
ms
[6]
[42,
44]
[42]
[42]
1086
ms
1089
ms
1082
m10
85s
[6]
[6]
[7]
[11]
1093
s11
00s
1110
s11
12s
1108
m11
1811
09s
1122
–112
8s
1127
vs11
29vs
1135
–115
0vs
1155
[6]
[6,7
][6
][6
]sh
[6]
[7,1
3][7
][4
,6]
[4]
[4]
[4]
[12,
13]
3230
[6]
260 Orel et al.
(a)
(b)
(c)
Figure 7. IR transmission spectra of MTEOS/TFAcOH films de-posited from differently aged sols in the spectral ranges 1200–750 cm−1 (a), 700–400 cm−1 (b) and 4000–2800 cm−1 (c).
the decrease of the corresponding shoulder band at1015 cm−1 and the band at 1077 cm−1. While the1020 cm−1 band actually dropped in intensity, thestill quite intense band at ∼1077 cm−1, which onlyslightly decreased in the spectra of films dipped frommore aged sols, was explained by the formation ofT6(OH)2 and T7(OH)3 species (Schemes 1 and 2) whichshow their strongest bands in this spectral range. Theshift of absorption from 1095 cm−1 to higher fre-quencies and the consecutive growth of absorptionin our spectra in the range 1110–1100 cm−1 was inagreement with the formation of T4(OH)4 (Scheme 3),showing characteristic absorption at 1110 cm−1. Thesespecies interacted with T6(OH)2 and T7(OH)3 form-ing T8(OH)4 and T8(OH)2, both absorbing stronglyin the range above 1100 cm−1 but having only weakbands in the 1085–1070 cm−1 range. This further ex-plained the blue frequency shift of the 1110 cm−1 bandto 1125 cm−1, i.e. in the range where T8 cube-likesilsesquioxanes absorb [4]. However, the fact that theband at 1125 cm−1 was accompanied with a 1030–1040 cm−1 band is important as evidence that thefilms contained double-chain (ladder-like) oligomericspecies exhibiting a characteristic strong band at 1135-1155 cm−1 and a weaker band at 1046 cm−1 [11–13](Table 2).
Additional bands shedding light on the formation ofthe cyclic siloxane species typical of ladder-like con-densation products were found at 553 and 587 cm−1
(Fig. 6(b)). None of these bands could be ascribed tothe crystalline T8 species of methyl-SiO3/2 [4, 34] be-cause they absorb at 518 cm−1. Other variously substi-tuted R-SiO3/2 (R = H, vinyl,. . .) T-cube like methyl-silsesquioxanes absorb in the range 550–585 cm−1,similar to T12, T14 and T16 cube-like silsesquioxanes.The dimethylcyclotrisiloxane ring mode appears at600–610 cm−1 and dimethylcyclotetrasiloxanes absorbat 560–550 cm−1 [44], accidentally coinciding with the553 cm−1 band observed in our spectra. The situationis rather complex because TEOS, TMOS and TBOSand certain minerals (coesite, anorthite) investigatedby Yoshino et al. [26] exhibit a band at 550 cm−1,which was tentatively assigned to a vibration of 4-foldcyclosiloxane rings. Kamiya et al. [25] in his studies ofMTEOS-based SiO2 glasses prepared from xerogelsheat-treated in N2 and NH3 also found in the corre-sponding IR spectra a weak band at 550 cm−1, and at-tributed it to the presence of ladder-like polymers firstproposed to exist in phenyltriethoxysilane prepared byacid hydrolysis [5, 11–13].
Hydrolysis and Solvolysis of Methyltriethoxysilane Catalyzed with HCl or Trifluoroacetic Acid 261
On the basis of this experimental evidence, Wada etal. [16] performed XRD radial distribution analysis ofSiO2 prepared from MTEOS catalysed with HCl, andthe best fit of the RDF was obtained for ladder-likepolymers. However, no data exist for bands belongingto ring modes of ladder-like polymers.
Of the two bands noted in our spectra only the band at553 cm−1 showed an increase of intensity in the courseof sol ageing, unambiguously proving that the bandis connected with the formation of four- and bridgedfour-member rings [9]. The unchanged intensity of the586 cm−1 band of the cyclotrisiloxane ring mode withtime of ageing of the sols could be explained by as-suming that other polysilsesquioxanes, which containtricyclic siloxane species like T7(OH) (see below forMTEOS/TFAcOH) (Scheme 1), contribute to the in-tensity of this band. Nevertheless, the results of our IRspectral analysis did not substantiate the formation ofpure ladder-like polymers characterized by sharp bandsat 1155 and 1045 cm−1 observed in the spectra of basecatalysed MTEOS [11–13].
MTEOS/TFAcOH Films. Films were consecutivelydeposited from MTEOS/TFAcOH sols over a shortertime interval (0–2.5 h) because after 2.5 h at ambientconditions the sols gelled. Spectra of films deposited inthe time interval 0–1.5 h (Fig. 7(a)–(c)) contained thesame bands (i.e. 1015, 1070 and 1090 cm−1) as thoseobtained from MTEOS/HCl sols but with different rel-ative intensities (Fig. 6(a)–(c)). This period of time co-incided with the time interval when MTEOS/TFAcOHsols still contained—OEt groups (Figs. 2(b) and 4(b)).As expected, the spectra showed the SiOH band at901 cm−1 and the νas OH. . .O stretching band at3355 cm−1 (Fig. 7(c)). They formed because of the fasthydrolysis of the—OEt groups when the films came incontact with ambient water from the air (Eq. (2)).
Distinct shoulder band at 1016 cm−1 indicated thatat the first 1h of ageing cyclotrisiloxanes condensa-tion products dominated and much smaller amount ofT2(OH)4 species (weaker shoulder band at 1095 cm−1)formed than in the MTEOS/HCl films (Fig. 6(a)).
The cyclotrisiloxane absorption bands (1015 and1031 cm−1) diminished at t = 1.5 h and the band at1070 cm−1 dominated the spectra. This indicated pro-gressive formation of the higher condensation products(T7(AcOH), T8 . . .) expected according to Schemes 3and 4.
In the films deposited from sols aged 1.5 h, i.e. afterall the SiOEt groups had been already substituted with
Si-OAc groups (Eq. 1(a)), the silanol groups no longerformed. However, the water stretching band was stillseen, indicating the presence of adsorbed water on thesurface of the film.
Films obtained from sols aged for t = 2.5 h showedspectra which resembled those of MTEOS/HCl films,revealing bands at 1120 and 1037 cm−1. However, theirrelative intensities differed; the corresponding inten-sity ratio I(1120 cm−1)/I(1035 cm−1) was higher forMTEOS/TFAcOH than for MTEOS/HCl derived films.This suggested differences in the amount of similarcondensation products in both types of films derivedfrom aged sols.
The band at 552 cm−1 (Fig. 7(b)) showed rapidformation of the characteristic band attributed to thering modes of tri—and cyclotetrasiloxanes contrastingmore gradual increase of this mode in the MTEOS/HClfilms. However, in the spectra of MTEOS/TFAcOHfilms (t = 2.5 h) a small decrease of the 552 cm−1 bandwas noted suggesting different condensation species inboth types of films (Fig. 6(a)).
Finally, we considered the CH3 rocking bands at 781and 767 cm−1. They attained equal intensities in thespectra dipped from sols aged 2.5 h suggesting thatthe CH3 groups are evenly placed at the corners of thesilsesquioxane units, making the structure well equi-librated and hydrophobic (not shown here). That hap-pened in MTEOS/HCl based films after sols were aged24 h (Fig. 6(a)). The intensity ratios of the latter bandswere further correlated with the surface energy valuesof films made from both types of sols.
3.4. Surface Energy
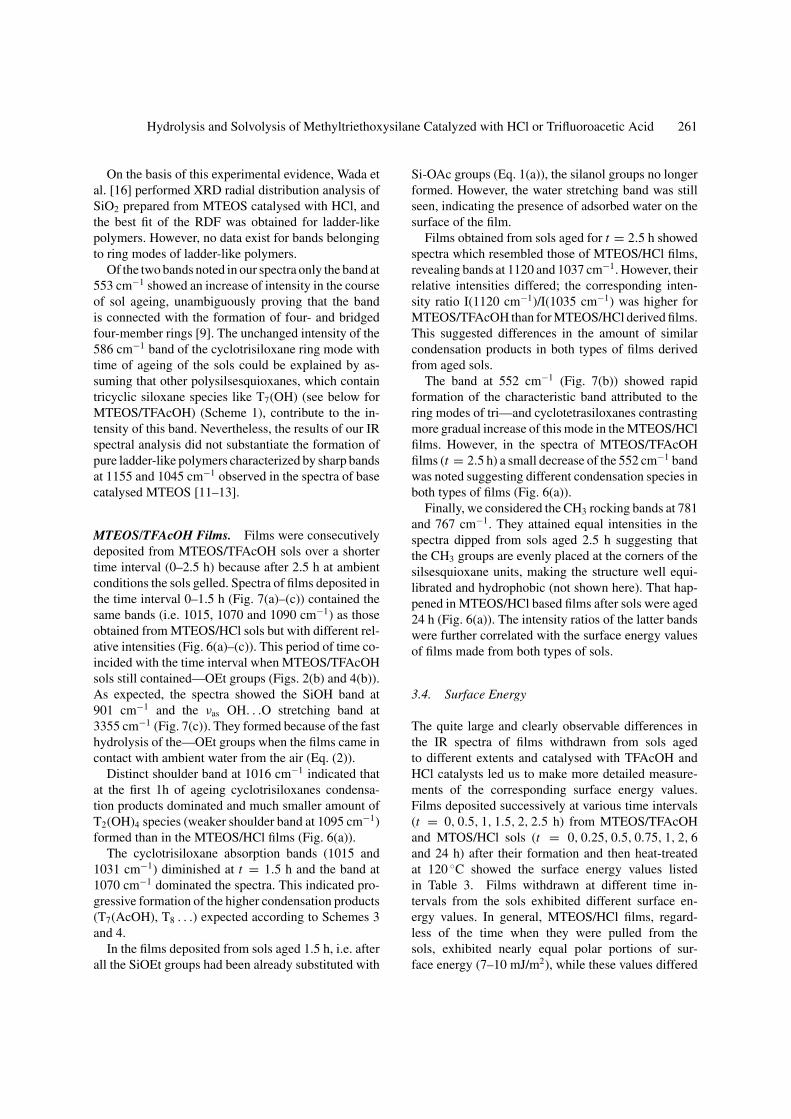
The quite large and clearly observable differences inthe IR spectra of films withdrawn from sols agedto different extents and catalysed with TFAcOH andHCl catalysts led us to make more detailed measure-ments of the corresponding surface energy values.Films deposited successively at various time intervals(t = 0, 0.5, 1, 1.5, 2, 2.5 h) from MTEOS/TFAcOHand MTOS/HCl sols (t = 0, 0.25, 0.5, 0.75, 1, 2, 6and 24 h) after their formation and then heat-treatedat 120 ◦C showed the surface energy values listedin Table 3. Films withdrawn at different time in-tervals from the sols exhibited different surface en-ergy values. In general, MTEOS/HCl films, regard-less of the time when they were pulled from thesols, exhibited nearly equal polar portions of sur-face energy (7–10 mJ/m2), while these values differed
262 Orel et al.
Table 3. Contact angles (of dimethylformamide (DMF), benzylal-cohol (BA), formamide (F) and water) and surface energy valuesfor MTEOS/HCl and MTEOS/TFAcOH films deposited from dif-ferently aged sols (0–24 h and 0–2.5 h, resp.) and heat treated at120 ◦C.
Ageing time [h] DMF BA F H2O γp
sv γ dsv γsv
MTEOS/HCl
0 30 36 72 80 7.01 23.86 30.87
0.25 26 41 63 80 7.92 24.12 32.04
0.5 26 42 63 78 9.51 22.31 31.83
0.75 27 41 64 77 10.16 21.60 31.76
1 27 41 63 77 10.24 21.68 31.92
2 27 41 63 79 8.72 23.16 31.88
6 26 42 63 78 9.51 22.31 31.83
24 24 41 62 80 7.84 24.59 32.42
MTEOS/TFAcOH
0 21 36 54 68 17.77 18.47 36.24
0.5 21 36 46 69 17.56 19.66 37.22
1 21 35 66 78 8.02 24.84 32.87
1.5 22 35 71 88 2.32 32.65 34.97
2 22 34 71 90 1.56 34.82 36.38
2.5 23 34 71 91 1.29 35.55 36.85
pronouncedly for MTEOS/TFAcOH films whichshowed higher (∼17 mJ/m2) polar portions for thosedipped in the course of the first 1.5 h of sol ageing;values then dropped to 1–2 mJ/m2 for films withdrawnfrom more aged sols (t > 1.5 h) (Table 3, Fig. 8). Highpolar portions of the surface energy were connectedwith the presence of –OH groups formed when filmswere withdrawn from the sols. Silanol groups formedimmediately when the film came into contact with airhumidity and instead of solvolysis, hydrolysis becamepredominant. The hydrophobicity of films derived fromMTEOS/HCl and MTEOS/TFAcOH sols was reflectedin the intensity variations of the split rCH3 modes at 781and 767 cm−1. It seemed that less hydrophobic filmsexhibited stronger band at 781 cm−1 while the enhance-ment in the hydrophobicity resulted in the equalizationof the intensities of both bands. More detailed studiesare needed to draw conclusion about the orientation ofthe CH3 groups relatively to the oxane linkages.
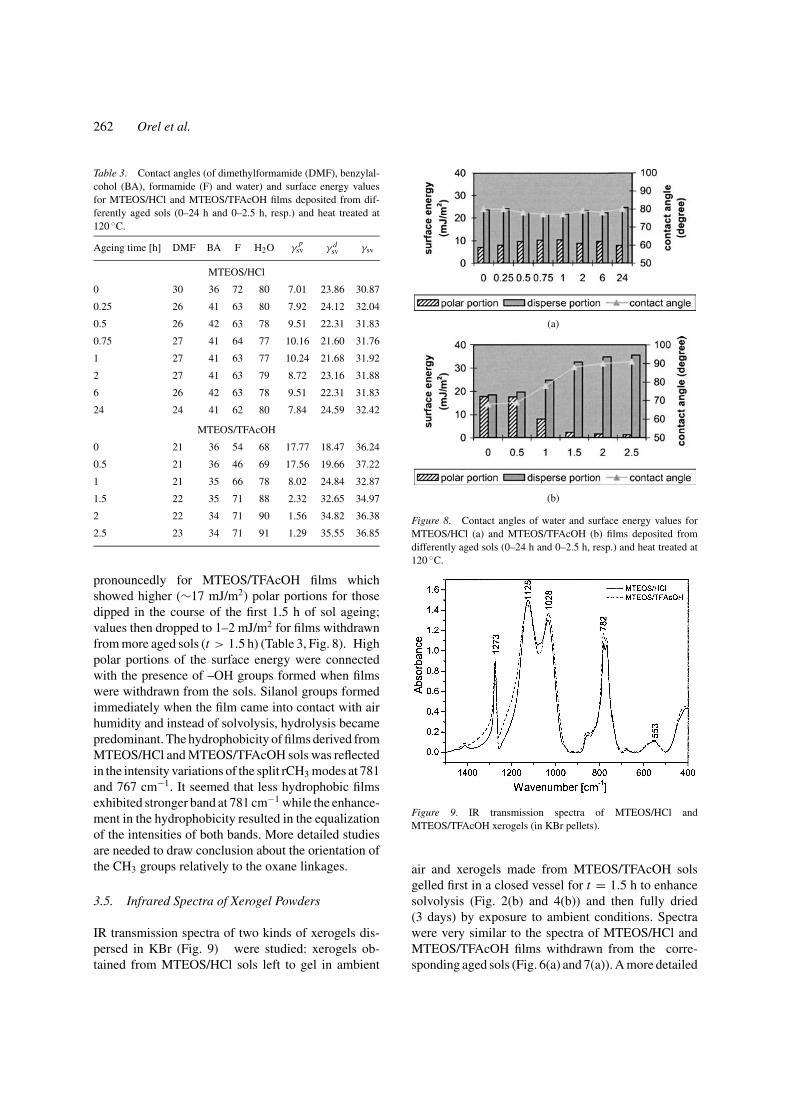
3.5. Infrared Spectra of Xerogel Powders
IR transmission spectra of two kinds of xerogels dis-persed in KBr (Fig. 9) were studied: xerogels ob-tained from MTEOS/HCl sols left to gel in ambient
(a)
(b)
Figure 8. Contact angles of water and surface energy values forMTEOS/HCl (a) and MTEOS/TFAcOH (b) films deposited fromdifferently aged sols (0–24 h and 0–2.5 h, resp.) and heat treated at120 ◦C.
Figure 9. IR transmission spectra of MTEOS/HCl andMTEOS/TFAcOH xerogels (in KBr pellets).
air and xerogels made from MTEOS/TFAcOH solsgelled first in a closed vessel for t = 1.5 h to enhancesolvolysis (Fig. 2(b) and 4(b)) and then fully dried(3 days) by exposure to ambient conditions. Spectrawere very similar to the spectra of MTEOS/HCl andMTEOS/TFAcOH films withdrawn from the corre-sponding aged sols (Fig. 6(a) and 7(a)). A more detailed
Hydrolysis and Solvolysis of Methyltriethoxysilane Catalyzed with HCl or Trifluoroacetic Acid 263
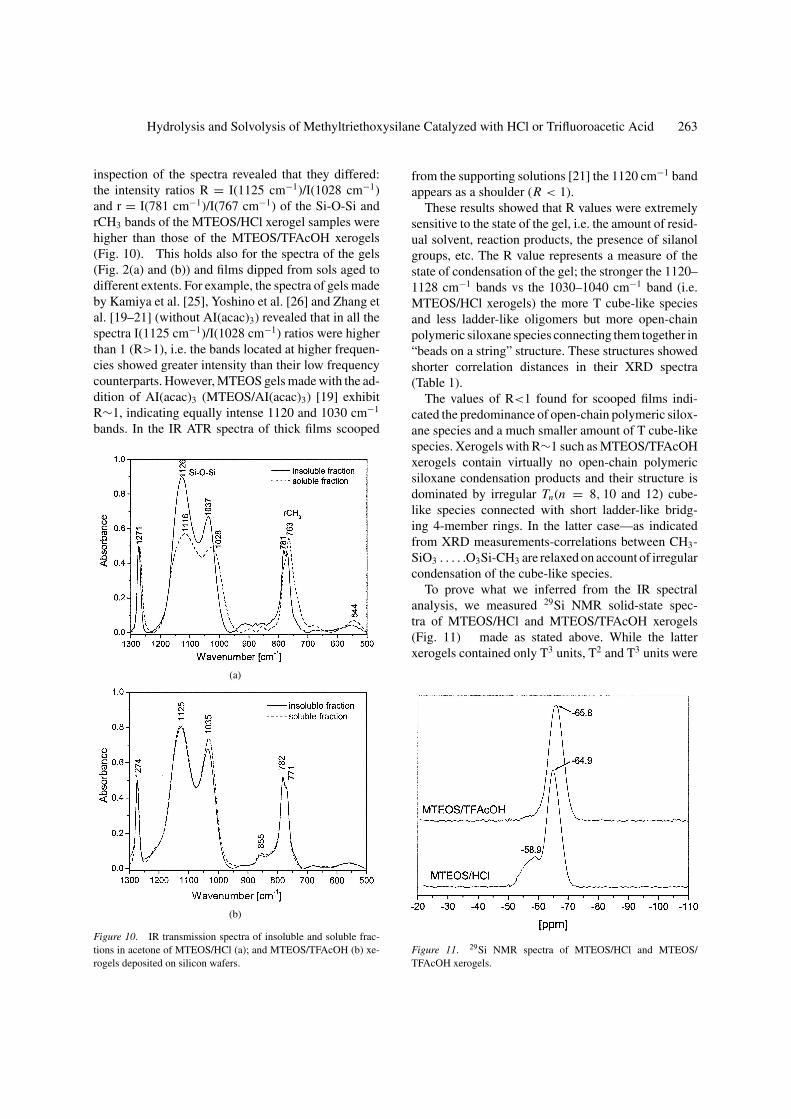
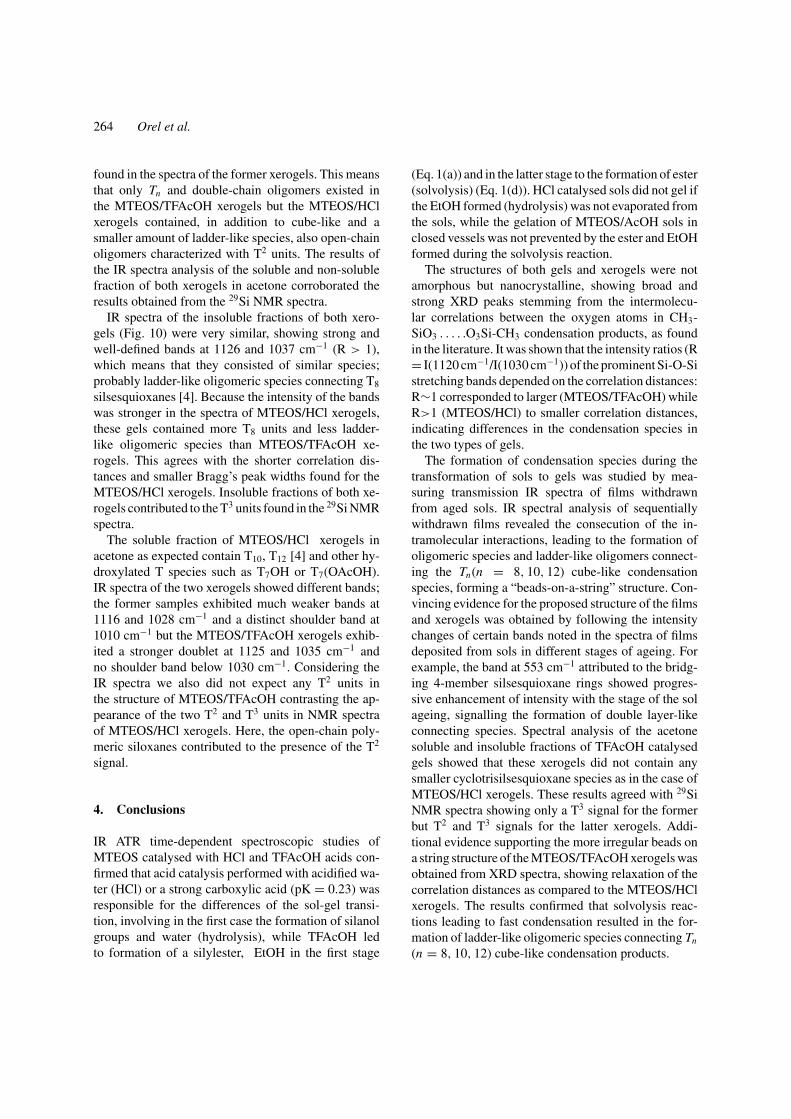
inspection of the spectra revealed that they differed:the intensity ratios R = I(1125 cm−1)/I(1028 cm−1)and r = I(781 cm−1)/I(767 cm−1) of the Si-O-Si andrCH3 bands of the MTEOS/HCl xerogel samples werehigher than those of the MTEOS/TFAcOH xerogels(Fig. 10). This holds also for the spectra of the gels(Fig. 2(a) and (b)) and films dipped from sols aged todifferent extents. For example, the spectra of gels madeby Kamiya et al. [25], Yoshino et al. [26] and Zhang etal. [19–21] (without AI(acac)3) revealed that in all thespectra I(1125 cm−1)/I(1028 cm−1) ratios were higherthan 1 (R>1), i.e. the bands located at higher frequen-cies showed greater intensity than their low frequencycounterparts. However, MTEOS gels made with the ad-dition of AI(acac)3 (MTEOS/AI(acac)3) [19] exhibitR∼1, indicating equally intense 1120 and 1030 cm−1
bands. In the IR ATR spectra of thick films scooped
(a)
(b)
Figure 10. IR transmission spectra of insoluble and soluble frac-tions in acetone of MTEOS/HCl (a); and MTEOS/TFAcOH (b) xe-rogels deposited on silicon wafers.
from the supporting solutions [21] the 1120 cm−1 bandappears as a shoulder (R < 1).
These results showed that R values were extremelysensitive to the state of the gel, i.e. the amount of resid-ual solvent, reaction products, the presence of silanolgroups, etc. The R value represents a measure of thestate of condensation of the gel; the stronger the 1120–1128 cm−1 bands vs the 1030–1040 cm−1 band (i.e.MTEOS/HCl xerogels) the more T cube-like speciesand less ladder-like oligomers but more open-chainpolymeric siloxane species connecting them together in“beads on a string” structure. These structures showedshorter correlation distances in their XRD spectra(Table 1).
The values of R<1 found for scooped films indi-cated the predominance of open-chain polymeric silox-ane species and a much smaller amount of T cube-likespecies. Xerogels with R∼1 such as MTEOS/TFAcOHxerogels contain virtually no open-chain polymericsiloxane condensation products and their structure isdominated by irregular Tn(n = 8, 10 and 12) cube-like species connected with short ladder-like bridg-ing 4-member rings. In the latter case—as indicatedfrom XRD measurements-correlations between CH3-SiO3 . . . . .O3Si-CH3 are relaxed on account of irregularcondensation of the cube-like species.
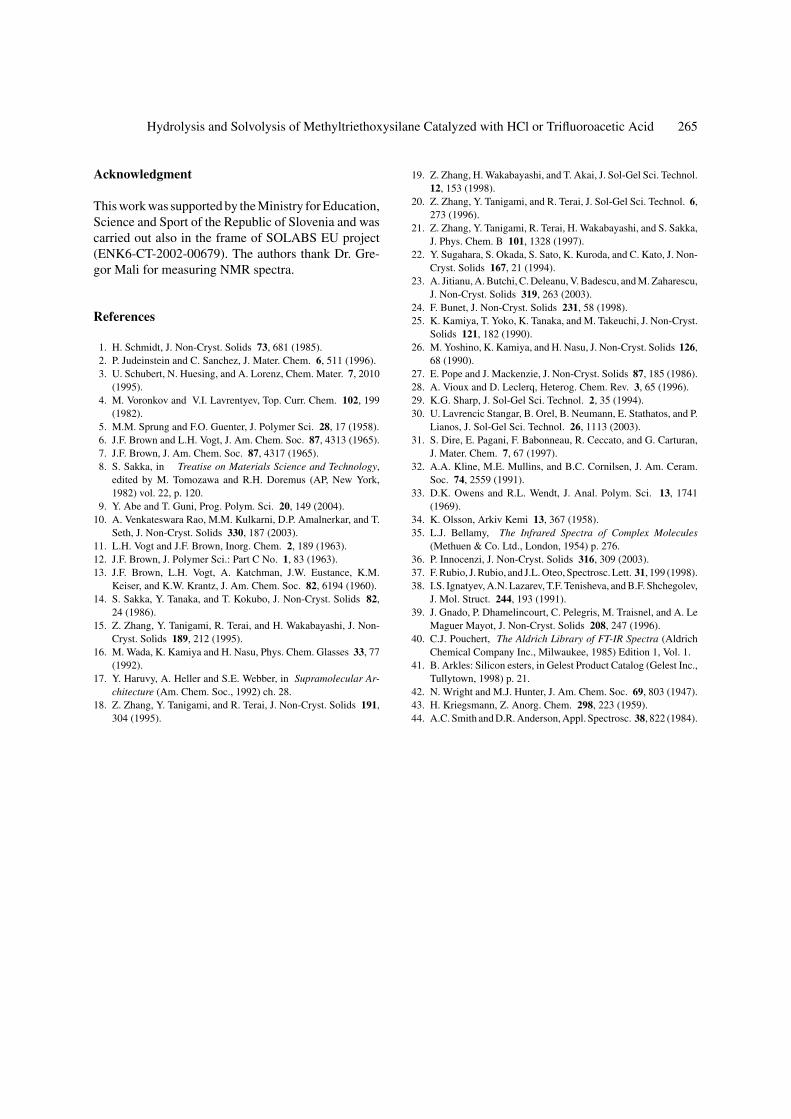
To prove what we inferred from the IR spectralanalysis, we measured 29Si NMR solid-state spec-tra of MTEOS/HCl and MTEOS/TFAcOH xerogels(Fig. 11) made as stated above. While the latterxerogels contained only T3 units, T2 and T3 units were
Figure 11. 29Si NMR spectra of MTEOS/HCl and MTEOS/TFAcOH xerogels.
264 Orel et al.
found in the spectra of the former xerogels. This meansthat only Tn and double-chain oligomers existed inthe MTEOS/TFAcOH xerogels but the MTEOS/HClxerogels contained, in addition to cube-like and asmaller amount of ladder-like species, also open-chainoligomers characterized with T2 units. The results ofthe IR spectra analysis of the soluble and non-solublefraction of both xerogels in acetone corroborated theresults obtained from the 29Si NMR spectra.
IR spectra of the insoluble fractions of both xero-gels (Fig. 10) were very similar, showing strong andwell-defined bands at 1126 and 1037 cm−1 (R > 1),which means that they consisted of similar species;probably ladder-like oligomeric species connecting T8
silsesquioxanes [4]. Because the intensity of the bandswas stronger in the spectra of MTEOS/HCl xerogels,these gels contained more T8 units and less ladder-like oligomeric species than MTEOS/TFAcOH xe-rogels. This agrees with the shorter correlation dis-tances and smaller Bragg’s peak widths found for theMTEOS/HCl xerogels. Insoluble fractions of both xe-rogels contributed to the T3 units found in the 29Si NMRspectra.
The soluble fraction of MTEOS/HCl xerogels inacetone as expected contain T10, T12 [4] and other hy-droxylated T species such as T7OH or T7(OAcOH).IR spectra of the two xerogels showed different bands;the former samples exhibited much weaker bands at1116 and 1028 cm−1 and a distinct shoulder band at1010 cm−1 but the MTEOS/TFAcOH xerogels exhib-ited a stronger doublet at 1125 and 1035 cm−1 andno shoulder band below 1030 cm−1. Considering theIR spectra we also did not expect any T2 units inthe structure of MTEOS/TFAcOH contrasting the ap-pearance of the two T2 and T3 units in NMR spectraof MTEOS/HCl xerogels. Here, the open-chain poly-meric siloxanes contributed to the presence of the T2
signal.
4. Conclusions
IR ATR time-dependent spectroscopic studies ofMTEOS catalysed with HCl and TFAcOH acids con-firmed that acid catalysis performed with acidified wa-ter (HCl) or a strong carboxylic acid (pK = 0.23) wasresponsible for the differences of the sol-gel transi-tion, involving in the first case the formation of silanolgroups and water (hydrolysis), while TFAcOH ledto formation of a silylester, EtOH in the first stage
(Eq. 1(a)) and in the latter stage to the formation of ester(solvolysis) (Eq. 1(d)). HCl catalysed sols did not gel ifthe EtOH formed (hydrolysis) was not evaporated fromthe sols, while the gelation of MTEOS/AcOH sols inclosed vessels was not prevented by the ester and EtOHformed during the solvolysis reaction.
The structures of both gels and xerogels were notamorphous but nanocrystalline, showing broad andstrong XRD peaks stemming from the intermolecu-lar correlations between the oxygen atoms in CH3-SiO3 . . . . .O3Si-CH3 condensation products, as foundin the literature. It was shown that the intensity ratios (R= I(1120 cm−1/I(1030 cm−1)) of the prominent Si-O-Sistretching bands depended on the correlation distances:R∼1 corresponded to larger (MTEOS/TFAcOH) whileR>1 (MTEOS/HCl) to smaller correlation distances,indicating differences in the condensation species inthe two types of gels.
The formation of condensation species during thetransformation of sols to gels was studied by mea-suring transmission IR spectra of films withdrawnfrom aged sols. IR spectral analysis of sequentiallywithdrawn films revealed the consecution of the in-tramolecular interactions, leading to the formation ofoligomeric species and ladder-like oligomers connect-ing the Tn(n = 8, 10, 12) cube-like condensationspecies, forming a “beads-on-a-string” structure. Con-vincing evidence for the proposed structure of the filmsand xerogels was obtained by following the intensitychanges of certain bands noted in the spectra of filmsdeposited from sols in different stages of ageing. Forexample, the band at 553 cm−1 attributed to the bridg-ing 4-member silsesquioxane rings showed progres-sive enhancement of intensity with the stage of the solageing, signalling the formation of double layer-likeconnecting species. Spectral analysis of the acetonesoluble and insoluble fractions of TFAcOH catalysedgels showed that these xerogels did not contain anysmaller cyclotrisilsesquioxane species as in the case ofMTEOS/HCl xerogels. These results agreed with 29SiNMR spectra showing only a T3 signal for the formerbut T2 and T3 signals for the latter xerogels. Addi-tional evidence supporting the more irregular beads ona string structure of the MTEOS/TFAcOH xerogels wasobtained from XRD spectra, showing relaxation of thecorrelation distances as compared to the MTEOS/HClxerogels. The results confirmed that solvolysis reac-tions leading to fast condensation resulted in the for-mation of ladder-like oligomeric species connecting Tn
(n = 8, 10, 12) cube-like condensation products.
Hydrolysis and Solvolysis of Methyltriethoxysilane Catalyzed with HCl or Trifluoroacetic Acid 265
Acknowledgment
This work was supported by the Ministry for Education,Science and Sport of the Republic of Slovenia and wascarried out also in the frame of SOLABS EU project(ENK6-CT-2002-00679). The authors thank Dr. Gre-gor Mali for measuring NMR spectra.
References
1. H. Schmidt, J. Non-Cryst. Solids 73, 681 (1985).2. P. Judeinstein and C. Sanchez, J. Mater. Chem. 6, 511 (1996).3. U. Schubert, N. Huesing, and A. Lorenz, Chem. Mater. 7, 2010
(1995).4. M. Voronkov and V.I. Lavrentyev, Top. Curr. Chem. 102, 199
(1982).5. M.M. Sprung and F.O. Guenter, J. Polymer Sci. 28, 17 (1958).6. J.F. Brown and L.H. Vogt, J. Am. Chem. Soc. 87, 4313 (1965).7. J.F. Brown, J. Am. Chem. Soc. 87, 4317 (1965).8. S. Sakka, in Treatise on Materials Science and Technology,
edited by M. Tomozawa and R.H. Doremus (AP, New York,1982) vol. 22, p. 120.
9. Y. Abe and T. Guni, Prog. Polym. Sci. 20, 149 (2004).10. A. Venkateswara Rao, M.M. Kulkarni, D.P. Amalnerkar, and T.
Seth, J. Non-Cryst. Solids 330, 187 (2003).11. L.H. Vogt and J.F. Brown, Inorg. Chem. 2, 189 (1963).12. J.F. Brown, J. Polymer Sci.: Part C No. 1, 83 (1963).13. J.F. Brown, L.H. Vogt, A. Katchman, J.W. Eustance, K.M.
Keiser, and K.W. Krantz, J. Am. Chem. Soc. 82, 6194 (1960).14. S. Sakka, Y. Tanaka, and T. Kokubo, J. Non-Cryst. Solids 82,
24 (1986).15. Z. Zhang, Y. Tanigami, R. Terai, and H. Wakabayashi, J. Non-
Cryst. Solids 189, 212 (1995).16. M. Wada, K. Kamiya and H. Nasu, Phys. Chem. Glasses 33, 77
(1992).17. Y. Haruvy, A. Heller and S.E. Webber, in Supramolecular Ar-
chitecture (Am. Chem. Soc., 1992) ch. 28.18. Z. Zhang, Y. Tanigami, and R. Terai, J. Non-Cryst. Solids 191,
304 (1995).
19. Z. Zhang, H. Wakabayashi, and T. Akai, J. Sol-Gel Sci. Technol.12, 153 (1998).
20. Z. Zhang, Y. Tanigami, and R. Terai, J. Sol-Gel Sci. Technol. 6,273 (1996).
21. Z. Zhang, Y. Tanigami, R. Terai, H. Wakabayashi, and S. Sakka,J. Phys. Chem. B 101, 1328 (1997).
22. Y. Sugahara, S. Okada, S. Sato, K. Kuroda, and C. Kato, J. Non-Cryst. Solids 167, 21 (1994).
23. A. Jitianu, A. Butchi, C. Deleanu, V. Badescu, and M. Zaharescu,J. Non-Cryst. Solids 319, 263 (2003).
24. F. Bunet, J. Non-Cryst. Solids 231, 58 (1998).25. K. Kamiya, T. Yoko, K. Tanaka, and M. Takeuchi, J. Non-Cryst.
Solids 121, 182 (1990).26. M. Yoshino, K. Kamiya, and H. Nasu, J. Non-Cryst. Solids 126,
68 (1990).27. E. Pope and J. Mackenzie, J. Non-Cryst. Solids 87, 185 (1986).28. A. Vioux and D. Leclerq, Heterog. Chem. Rev. 3, 65 (1996).29. K.G. Sharp, J. Sol-Gel Sci. Technol. 2, 35 (1994).30. U. Lavrencic Stangar, B. Orel, B. Neumann, E. Stathatos, and P.
Lianos, J. Sol-Gel Sci. Technol. 26, 1113 (2003).31. S. Dire, E. Pagani, F. Babonneau, R. Ceccato, and G. Carturan,
J. Mater. Chem. 7, 67 (1997).32. A.A. Kline, M.E. Mullins, and B.C. Cornilsen, J. Am. Ceram.
Soc. 74, 2559 (1991).33. D.K. Owens and R.L. Wendt, J. Anal. Polym. Sci. 13, 1741
(1969).34. K. Olsson, Arkiv Kemi 13, 367 (1958).35. L.J. Bellamy, The Infrared Spectra of Complex Molecules
(Methuen & Co. Ltd., London, 1954) p. 276.36. P. Innocenzi, J. Non-Cryst. Solids 316, 309 (2003).37. F. Rubio, J. Rubio, and J.L. Oteo, Spectrosc. Lett. 31, 199 (1998).38. I.S. Ignatyev, A.N. Lazarev, T.F. Tenisheva, and B.F. Shchegolev,
J. Mol. Struct. 244, 193 (1991).39. J. Gnado, P. Dhamelincourt, C. Pelegris, M. Traisnel, and A. Le
Maguer Mayot, J. Non-Cryst. Solids 208, 247 (1996).40. C.J. Pouchert, The Aldrich Library of FT-IR Spectra (Aldrich
Chemical Company Inc., Milwaukee, 1985) Edition 1, Vol. 1.41. B. Arkles: Silicon esters, in Gelest Product Catalog (Gelest Inc.,
Tullytown, 1998) p. 21.42. N. Wright and M.J. Hunter, J. Am. Chem. Soc. 69, 803 (1947).43. H. Kriegsmann, Z. Anorg. Chem. 298, 223 (1959).44. A.C. Smith and D.R. Anderson, Appl. Spectrosc. 38, 822 (1984).