Hydrobiology of a salt pan from the Peninsula of Baja California, Mexico
16
International Journal of Salt Lake Research 6: 233-248, 1997. (~) 1997 Kluwer Academic Publishers. Printed in the Netherlands. Hydrobiology of a salt pan from the Peninsula of Baja California, Mexico ERIKA DEL CASTILLO ARIAS and CLAUDIA FARFAN Centro de Investigaci6n Cientifica y de Educaci6n Superior de Ensenada (C.I.C.E.S.E.). Km 103. Carretera Tijunana-Ensenada, Ensenada, Baja California, M~xico E-mail: [email protected] Abstract. The study site, a salt pan in the northwest of Baja California, Mexico, has a surface area of 33.2 ha and water capacity of 216,072 m 3. It is intermittently isolated from the adjacent ocean by a sand bar, so that flooding via the coastal plain is a low frequency event associated with extreme storm conditions. Temporal changes in water volume were represented by a particular expression of the mass conservation equation having as variables the volumetric capacity of the system, water inputs by pluvial precipitation, runoff and infiltration, and water loss by evaporation; the numerical model explained over 80 per cent of observed fluctuations. The hydrobiological study covered a three-year period and two hydrological cycles; the first one was of mixed marine and pluvial origin, and the second, continental. Throughout the first cycle, phosphate and nitrate concentrations were up to one order of magnitude higher as were total particulate protein, chlorophyll a and phytoplankton abundance. In general, nannoplankton abundance was up to three orders of magnitude greater than the microphlanktonic fraction. In the former, 29 different cell forms were observed; two halophytic bacteria constituted 60- 80 per cent of that fraction. In the microplankton, there were 27 different forms; most were benthic diatoms. The zooplanktonic assemblages of the first cycle had marine and continental elements; at 141 per mille, Artemia sp. first appeared; at 240 per mille, it was the only faunistic element in the system. During the second cycle, Artemia was always present, co-existing with other continental species up to a salinity of 99 per mille. The morphology and morphometry of Artemia were similar to those of Artemia franciscana. Key words: hydrobiology, hypersaline environment, temporal changes Introduction The Baja California PeninsUla is mostly arid. Annual rainfall is about 200 mm and evaporation over 1,200 mm. The Peninsula has practically no perma- nent freshwater streams and its coastal lagoons are anti-estuaries. The larger lagunar complex, Ojo de Liebre, is hypersaline; it covers more than 36,000 ha. In addition to some 4,500 ha of other smaller hypersaline lagoons, there are more than 170,000 ha of drowned saline plains along the Pacific coast and about 150,000 ha in the northernmost Gulf of California (INEGI, 1984). Most studies of the hypersaline lagoons of Baja California are geolog- ical (Phleger, 1965, 1969; Phleger and Ewing, 1962; Postma, 1965), concern the biological characterization of Artemia populations (Bowen et al., 1980;
Transcript of Hydrobiology of a salt pan from the Peninsula of Baja California, Mexico

International Journal of Salt Lake Research 6: 233-248, 1997. (~) 1997 Kluwer Academic Publishers. Printed in the Netherlands.
Hydrobiology of a salt pan from the Peninsula of Baja California, Mexico
ERIKA DEL CASTILLO ARIAS and CLAUDIA FARFAN Centro de Investigaci6n Cientifica y de Educaci6n Superior de Ensenada (C.I.C.E.S.E.). Km 103. Carretera Tijunana-Ensenada, Ensenada, Baja California, M~xico E-mail: [email protected]
Abstract. The study site, a salt pan in the northwest of Baja California, Mexico, has a surface area of 33.2 ha and water capacity of 216,072 m 3. It is intermittently isolated from the adjacent ocean by a sand bar, so that flooding via the coastal plain is a low frequency event associated with extreme storm conditions. Temporal changes in water volume were represented by a particular expression of the mass conservation equation having as variables the volumetric capacity of the system, water inputs by pluvial precipitation, runoff and infiltration, and water loss by evaporation; the numerical model explained over 80 per cent of observed fluctuations. The hydrobiological study covered a three-year period and two hydrological cycles; the first one was of mixed marine and pluvial origin, and the second, continental. Throughout the first cycle, phosphate and nitrate concentrations were up to one order of magnitude higher as were total particulate protein, chlorophyll a and phytoplankton abundance. In general, nannoplankton abundance was up to three orders of magnitude greater than the microphlanktonic fraction. In the former, 29 different cell forms were observed; two halophytic bacteria constituted 60- 80 per cent of that fraction. In the microplankton, there were 27 different forms; most were benthic diatoms. The zooplanktonic assemblages of the first cycle had marine and continental elements; at 141 per mille, Artemia sp. first appeared; at 240 per mille, it was the only faunistic element in the system. During the second cycle, Artemia was always present, co-existing with other continental species up to a salinity of 99 per mille. The morphology and morphometry of Artemia were similar to those of Artemia franciscana.
Key words: hydrobiology, hypersaline environment, temporal changes
I n t r o d u c t i o n
The Baja California PeninsUla is mostly arid. Annual rainfall is about 200 mm and evaporation over 1,200 mm. The Peninsula has practically no perma- nent freshwater streams and its coastal lagoons are anti-estuaries. The larger lagunar complex, Ojo de Liebre, is hypersaline; it covers more than 36,000 ha. In addition to some 4,500 ha of other smaller hypersaline lagoons, there are more than 170,000 ha of drowned saline plains along the Pacific coast and about 150,000 ha in the northernmost Gulf of California (INEGI, 1984).
Most studies of the hypersaline lagoons of Baja California are geolog- ical (Phleger, 1965, 1969; Phleger and Ewing, 1962; Postma, 1965), concern the biological characterization o f A r t e m i a populations (Bowen et al., 1980;

234
Correa Sandoval and Btickle Ramlrez, 1993), or about the algal and cyano- bacterial mats of the Laguna Figueroa and thought to be analogous to Proterozoic stromatolites (Horodyski, 1977; Margulis et al., 1980; Brown et al., 1985). Hydrological studies have been carried out only in Laguna San Jos6 (Montafio Moctezuma and Btickle-Ramirez, 1996) and at the salt works of Guerrero Negro (Javor, 1986). There is no information on the hydrobiology of the temporary hypersaline environments of the Peninsula.
The objective of this work is to document the temporal changes in the hydrobiology of a salt pan (La Salina) located in the northwest of the Peninsula (32 ~ 05 ~ N, 118 ~ 40 ~ W). The study covers a 3-year period and two hydrological cycles, one of mixed marine and pluvial origin, and the other continental.
Materials and methods
At the beginning of each hydrological cycle, seven fixed stations were set (Figure 1), but as the flooded area decreased so did the number of sampling sites; by the end of each cycle, only the station located in the main channel contained water (station V). During the first cycle, 11 monthly samplings were made (July 1983-June 1984); the second cycle was much shorter, with only four monthly surveys carried out (March-July 1984).
Van Dora samples provided data on water salinity, pH, nutrient concen- trations (phosphate, nitrate, nitrite and ammonia), concentrations of chloro- phyll a, particulate protein and phytoplankton abundance. All samples were collected at the surface. Simultaneously, surface water temperature was read off bucket thermometers; water depth and turbidity (Secchi disk) were also recorded along with air temperature, relative humidity and wind velocity. Zooplankton samples were taken with a standard conical net (463 #m, 50 cm in diameter) in a single surface haul throughout the flooded area. Fishing net casts were also made when flooded conditions were appropriate.
After collection, pH measurements were performed with a digital pH meter, and salinity measurements with a refractometer. Samples for nutrient determinations were immediately frozen after the addition of the preserving solution prescribed by the analytical technique used. Phytoplankton and zoo- plankton samples were preserved in a 5 per cent neutral formalin solution. Water samples for particulate protein and chlorophyll a were stored in dark bottles, placed in ice boxes and transported to the laboratory were they were prepared and frozen for later analysis; this operation was completed no more than 3 hours after sample collection.
Phosphate and nitrate were analyzed by spectrophotometric methods as described by Strickland and Parsons (1977); depending on salinity and nutrient concentration, most samples were diluted by factors of 1 to 3 with
235
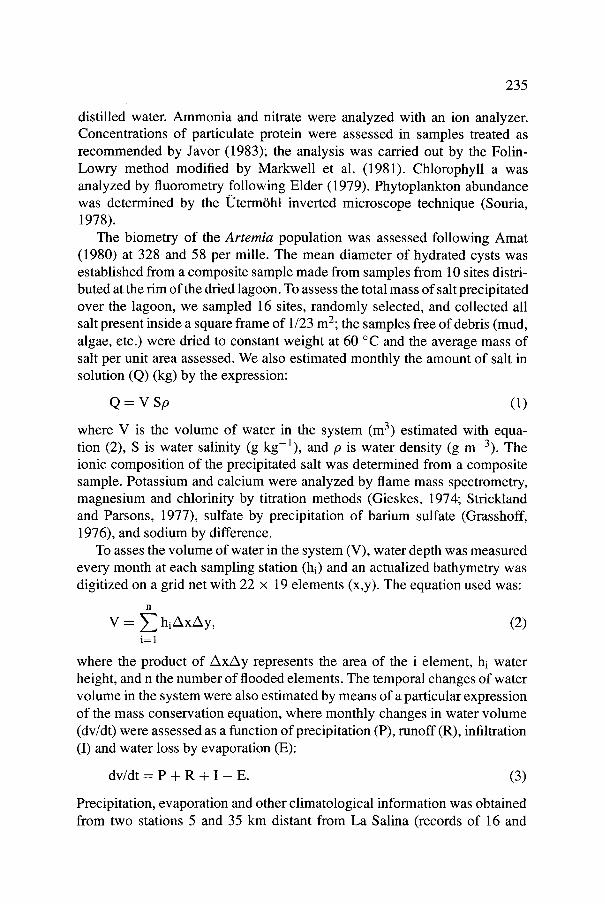
distilled water. Ammonia and nitrate were analyzed with an ion analyzer. Concentrations of particulate protein were assessed in samples treated as recommended by Javor (1983); the analysis was carried out by the Folin- Lowry method modified by Markwell et al. (1981). Chlorophyll a was analyzed by fluorometry following Elder (1979). Phytoplankton abundance was determined by the Uterm6hl inverted microscope technique (Souria, 1978).
The biometry of the Artemia population was assessed following Amat (1980) at 328 and 58 per mille. The mean diameter of hydrated cysts was established from a composite sample made from samples from 10 sites distri- buted at the rim of the dried lagoon. To assess the total mass of salt precipitated over the lagoon, we sampled 16 sites, randomly selected, and collected all salt present inside a square frame of 1/23 m2; the samples free of debris (mud, algae, etc.) were dried to constant weight at 60 ~ and the average mass of salt per unit area assessed. We also estimated monthly the amount of salt in solution (Q) (kg) by the expression:
Q = v Sp (1)
where V is the volume of water in the system (m 3) estimated with equa- tion (2), S is water salinity (g kg-1), and p is water density (g m-3). The ionic composition of the precipitated salt was determined from a composite sample. Potassium and calcium were analyzed by flame mass spectrometry, magnesium and chlorinity by titration methods (Gieskes, 1974; Strickland and Parsons, 1977), sulfate by precipitation of barium sulfate (Grasshoff, 1976), and sodium by difference.
To asses the volume of water in the system (V), water depth was measured every month at each sampling station (hi) and an actualized bathymetry was digitized on a grid net with 22 x 19 elements (x,y). The equation used was:
n
V ---- ~ hiAxAy, (2) i----1
where the product of AxAy represents the area of the i element, hi water height, and n the number of flooded elements. The temporal changes of water volume in the system were also estimated by means of a particular expression of the mass conservation equation, where monthly changes in water volume (dv/dt) were assessed as a function of precipitation (P), runoff (R), infiltration (I) and water loss by evaporation (E):
dv/dt --- P + R + I - E. (3)
Precipitation, evaporation and other climatological information was obtained from two stations 5 and 35 km distant from La Salina (records of 16 and
236
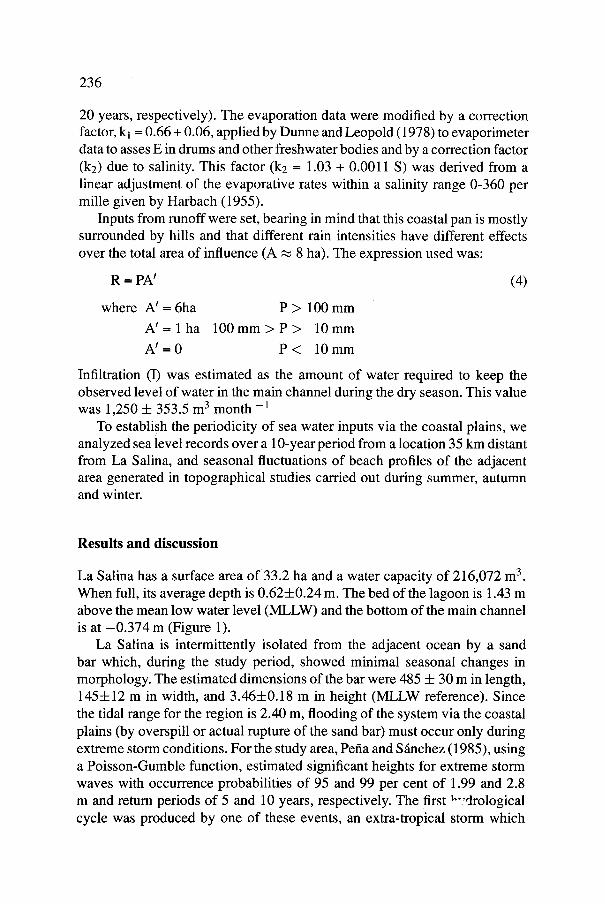
20 years, respectively). The evaporation data were modified by a correction factor, kl -- 0.66 + 0.06, applied by Dunne and Leopold (1978) to evaporimeter data to asses E in drums and other freshwater bodies and by a correction factor ( k j due to salinity. This factor (k2 = 1.03 + 0.0011 S) was derived from a linear adjustment of the evaporative rates within a salinity range 0-360 per mille given by Harbach (1955).
Inputs from runoff were set, bearing in mind that this coastal pan is mostly surrounded by hills and that different rain intensities have different effects over the total area of influence (A ~ 8 ha). The expression used was:
R = PA'
where A' = 6ha
A' = 1 ha
A' = 0
(4)
P > 100 mm
1 0 0 m m > P > 10mm
P < 10mm
Infiltration (I) was estimated as the amount of water required to keep the observed level of water in the main channel during the dry season. This value was 1,250 4- 353.5 m 3 month -1
To establish the periodicity of sea water inputs via the coastal plains, we analyzed sea ievel records over a 10-year period from a location 35 km distant from La Salina, and seasonal fluctuations of beach profiles of the adjacent area generated in topographical studies carried out during summer, autumn and winter.
R e s u l t s a n d d i s c u s s i o n
La Salina has a surface area of 33.2 ha and a water capacity of 216,072 m 3. When full, its average depth is 0.62• m. The bed of the lagoon is 1.43 m above the mean low water level (MLLW) and the bottom of the main channel is at - 0 .374 m (Figure 1).
La Salina is intermittently isolated from the adjacent ocean by a sand bar which, during the study period, showed minimal seasonal changes in morphology. The estimated dimensions of the bar were 485 -4- 30 m in length, 145+12 m in width, and 3.46• m in height (MLLW reference). Since the tidal range for the region is 2.40 m, flooding of the system via the coastal plains (by overspill or actual rupture of the sand bar) must occur only during extreme storm conditions. For the study area, Pefia and S~inchez (1985), using a Poisson-Gumble function, estimated significant heights for extreme storm waves with occurrence probabilities of 95 and 99 per cent of 1.99 and 2.8 m and return periods of 5 and 10 years, respectively. The first r~-.drological cycle was produced by one of these events, an extra-tropical storm which

0oN
IIT*W" "-. "-. "-.
~a SALIN~'---..
I II l~
_ s
M E X I C O
237
Po cif ic 1
Ocoon
0 I00 m. s;~
/ilt:;
�9 '0.4 ~
/ITa'W IIIOW I I
i
240 .
%1
Figure 1. La Salina Baja California, Mexico. Geographical location, bathymetry (in m) and sampling stations (I-VII).
generated waves of 3 m in height, some of the highest recorded in 8 years (Dayton and Teger, 1984). The extensive erosion that winter along the shores of Oregon and California, U.S.A., and northwest Baja California, Mexico, were the product of three factors: the energy of the winter storms, spring tidal conditions during the critical period, and sea level anomalies due to the on-going E1 Nifio event (Pefia and S4nchez, 1985; Komar, 1986).
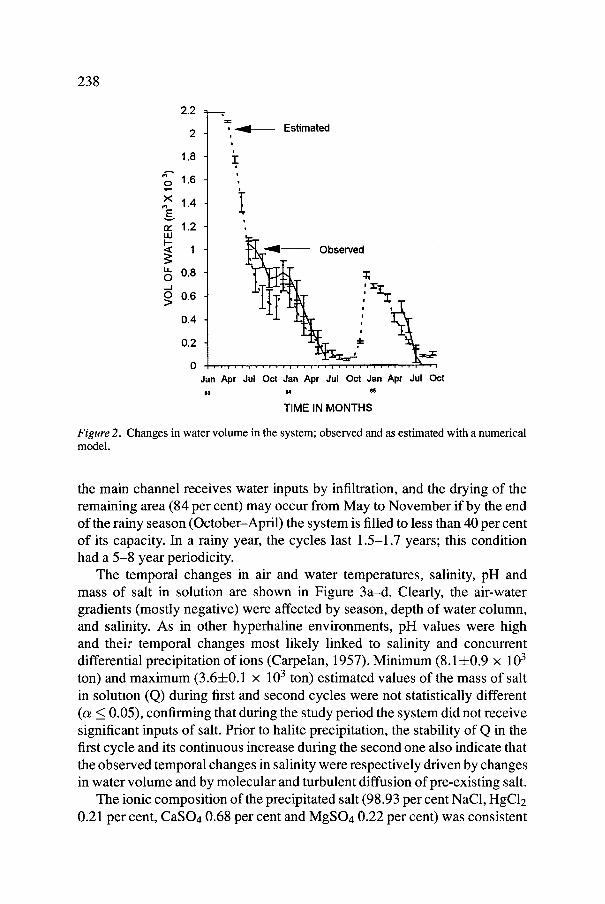
In contrast, the succeeding two winters were periods with no signifi- cant oceanic or atmospheric perturbations and with pluvial precipitation near average; this chain of events resulted in the first hydrological cycle lasting 18 months, and the second cycle, one third of that time. The observed temporal changes of water volume in La Salina are indicated in Figure 2 together with the estimated values with the mass conservation equation; their agreement was over 80 per cent. A run of the model with a 20 year climatological record showed that La Salina is a seasonally ephermeral habitat with a dry phase that is quite regular in each cycle. Although the system is never totally dry,
238
O
)<
rY uJ I -
._1
O >
2.2
2
1.8
1.6
1.4
1.2
1
0.8
0.6
0.4
0.2
0
I= r
, - ~ 1 - - - Estimated J
z =
i
[ i i
~---- Obsewed
Jan Apr Jul Oct Jan Apr Jul Oct Jan Apr Jul Oct 113 N (IS
TIME IN MONTHS
Figure 2. Changes in water volume in the system; observed and as estimated with a numerical model.
the main channel receives water inputs by infiltration, and the drying of the remaining area (84 per cent) may occur from May to November if by the end of the rainy season (October-April) the system is filled to less than 40 per cent of its capacity. In a rainy year, the cycles last 1.5-1.7 years; this condition had a 5-8 year periodicity.
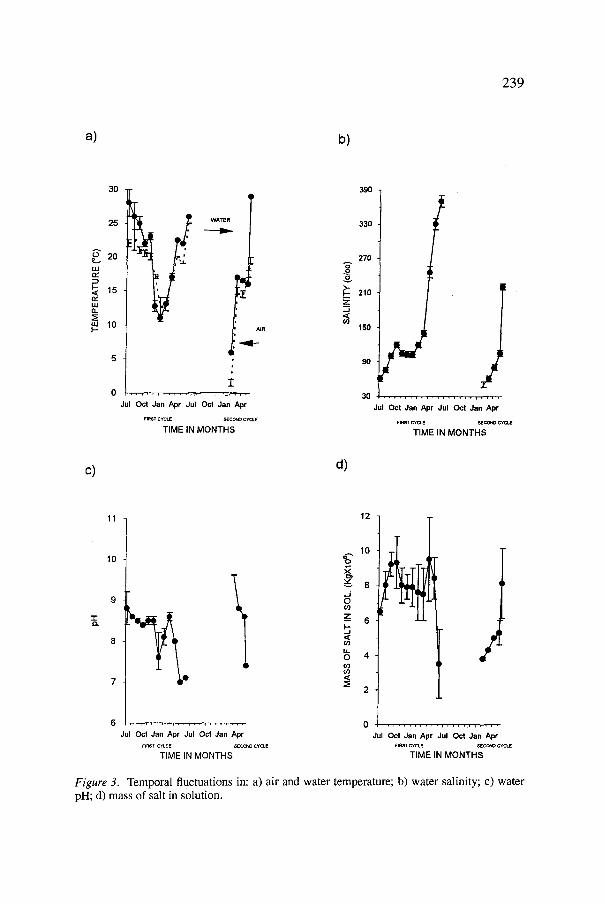
The temporal changes in air and water temperatures, salinity, pH and mass of salt in solution are shown in Figure 3a-d. Clearly, the air-water gradients (mostly negative) were affected by season, depth of water column, and salinity. As in other hyperhaline environments, pH values were high and their temporal changes most likely linked to salinity and concurrent differential precipitation of ions (Carpelan, 1957). Minimum (8.1 • • 103 ton) and maximum (3.6t0.1 • 103 ton) estimated values of the mass of salt in solution (Q) during first and second cycles were not statistically different (o~ < 0.05), confirming that during the study period the system did not receive significant inputs of salt. Prior to halite precipitation, the stability of Q in the first cycle and its continuous increase during the second one also indicate that the observed temporal changes in salinity were respectively driven by changes in water volume and by molecular and turbulent diffusion of pre-existing salt.
The ionic composition of the precipitated salt (98.93 per cent NaC1, HgC12 0.21 per cent, CaSO4 0.68 per cent and MgSO4 0.22 per cent) was consistent
239
a) b)
30
25
~ ' 20 uJ tY
rv.
n
"' 1o F-
c)
J WATER I
/JR
I . , . . . . . . . . . ; J . . . . , ,
Jul Oct Jan Apr Jul Oct Jan Apr
FIRST CyC1_ E SECOND CYCr TIME IN MONTHS
390
330
270
210
<
150
90
30
d)
I
t Jul Oct Jan Apr Jul Oct Jan Apr
FIRST CYCLe ~C0ND CVCU~ TIME IN MONTHS
11
10 A %
O3
cO <,9
Jul Oct Jan Apt Jul Oct Jan Apt e~Rsr c~ce SECOND cYa.e
TIME IN MONTHS
12
10
Jul Oct Jan Apr Jul Oct Jan Apr F~RST CYCLE ,~C Ot4D CYCLE
TIME IN MONTHS
Figure 3. Temporal fluctuations in: a) air and water temperature; b) water salinity; c) water pH; d) mass of salt in solution.

240
with a thalassic origin. As for its quantity, it would have required 18-20 years to accumulate solely by infiltration of seawater, but a single flooding with seawater following the rupture of the sand bar would have been sufficient to explain the existing mass of salt in the system.
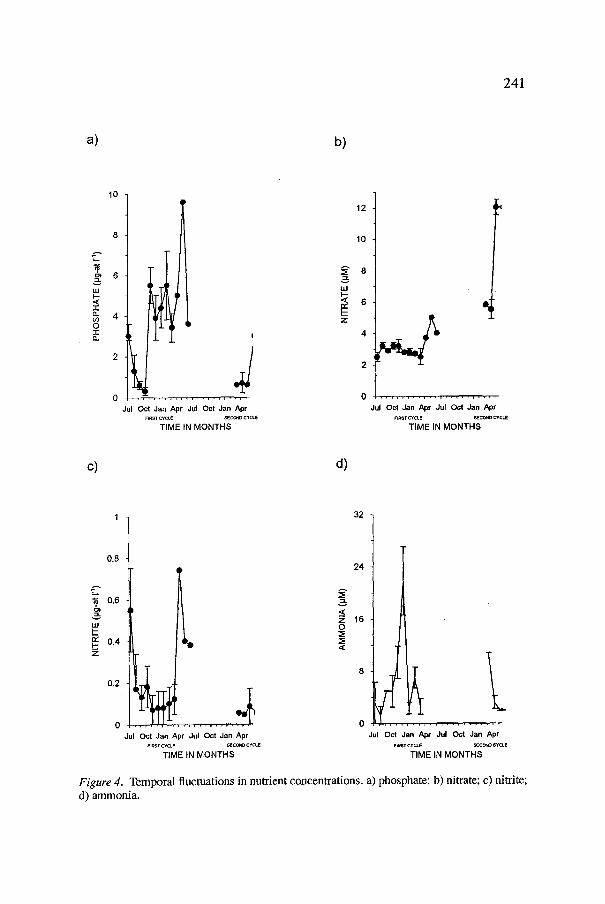
The nutrient conditions can be described as mostly eutrophic during the first cycle and oligotrophic throughout the second one (Figure 4a-d). Concen- tration ranges for the first cycle were: 0.3-9.6 #g-at PO41-1, 0.010-0.740 #g- at NO2 1-1,0.00-221.20 #M NH3, and 2.3-5.0 #M NO3. For the second cycle, these were: 0.17-3.08 #g-at PO41-1, 0.000-0.085 #g-at NO21-1, 1.97-10.82 #M NH3, and 5.12-12.23 #M NO3. This difference in nutrient concentrations was most probably due to differences in nutrient inputs from runoff. As in other coastal environments, hyperhaline habitats with large inputs from runoff or close to urban centers are eutrophic. Examples of this condition are the Alviso Ponds in San Francisco California, and the Western Salt Ponds in San Diego, California (Carpelan, 1957; Javor, 1984); the concentrations of PO4, NO3 and NO2 reported there are comparable to those found during the first cycle. As for the second cycle, comparable concentrations have been reported in the salt pans of Christmas Island, the salterns of Port Alma in Australia, and the hyperhaline areas of Care~i Brazil (Helfrich, 1973; Jones et al., 1981; Luna-Machado, 1984); here, the common characteristics are geographical isolation and poor water inputs from runoff.
Apart from the general trend of increase in PO4, NO2 and NO3 towards the end of both cycles, within each cycle nutrient fluctuations were different, most noticeably during the first cycle. Differences in rates of turnover, absorp- tion or adsorption in sediments, and other biogeochemical processes clearly played an important role in the observed nutrient behavior, but the relative stability of NO3 and depletion of NH3 by the end of the cycles suggests that differential assimilation of nutrients by the changing plant communities was also involved. In marine phytoplankton and bacteria, this phenomenon has been thoroughly investigated and proven in different field and laboratory conditions (Gilbert and Goldman, 1981; Syrret, 1981 ); in species from hyper- saline environments, the information is sparse but nonetheless in agreement (Stephens and Gillespie, 1976; Post, 1977; Onish and Gibbons, 1965; Oren, 1985).
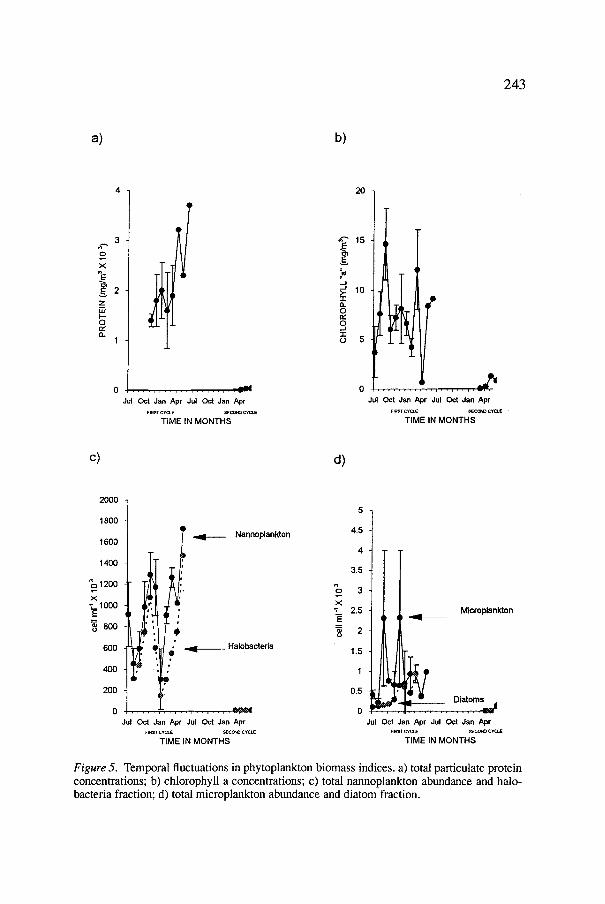
The eutrophic and oligotrophic conditions of the first and second cycle were also evident for all indices of primary productivity (Figure 5a-d), even for the most rudimentary ones such as turbidity and coloration. These were almost zero throughout the second cycle, while during the first one turbidity was 100 per cent, and La Salina experienced successive changes in colour, from greenish-yellow to brownish to pink and finally to red. During this period particulate protein ranged from 1.41 to 6.8 • 103 mg m -3, chlorophyll a
a)
LU I-" ,< "r" 0. u) O "T
b)
c)
10
241
!
Jul Oct Jan Apr Jul Oct Jan A-pr FI~r CYCLE ~ C ~ CY~E
TIME IN MONTHS
uJ
< r r " I---
12
10
8
6
4
l
Jul Oct Jan Apr Jul Oct Jan Ap t rest C'~ C1_ E S~ECOND C'~CU~
TIME IN MONTHS
0.8
d)
0,2
C _ 0,6
~. 0.4
Ju l Oct Jan Apr Jul Oct Jan Apr FIRSt CYCLE F, ECOND CYQJE
TIME IN MONTHS
32
24
0 . . . . . . , . . . . . . . . . . . . . . . .
Jul Oct Jan Apr Jul Oct Jan Apr
F~ST CVO.E SECOhO SYO.E
TIME IN MONTHS
Figure 4. Temporal fluctuations in nutrient concentrations, a) phosphate; b) nitrate; c) nitrite; d) ammonia.
242
from 0.65 to 14.61 mg m -3, and phytoplankton abundance from 304 to 1,290 x 103 cells m1-1 . Throughout the second cycle, the first two variables were lower than 1.3 mg m -3 and phytoplankton abundance less than 9.5 x 10³ cells m1-1. During both cycles, the nannoplanktonic abundances, of which 60 to 80 per cent comprised two halobacteria forms that were <2.7 #m, were invariably at least 3 orders of magnitude larger than the microplanktonic fractions; they did not vary concurrently but the temporal fluctuations of nannoplankton abundance and concentrations of particulate protein and microplankton and chlorophyll a were similar. These findings are in agreement with those reported in most hypersaline environments (Por, 1980; Javor, 1983, 1984).
In addition to the two halobacteria forms, we observed 27 nannoplank- tonic forms, but only seven were numerically important; four celled forms embedded in a mucilaginous sheet (aplanospores) with average sizes ranging from 8 • 5 to 15 • 12 #m, and three flagellates, namely Dunaliella salina (5 x 2 #m, comprising 5-6 per cent of the nannoplanktonic abundance in all samples), and the other two similar to Chilomona sp. (11 x 9 and 12 x 8 #m). In the microplanktonic fraction, there were 27 cell forms; four cilated Protozoa, three chain-like forms from Oscillatoriaceae, and 20 diatom taxa. The Protozoa were Condylostoma sp., Podophyra sp., Nassula sp., and Fabrea salina; the latter two were the most abundant and persistent in the system. At salinities lower than 110 per mille, Protozoa abundance was high (up to 55 per cent), but with increasing salinities diatom abundance steadily increased to represent more than 90 per cent of the microplankton by the end of both cycles. All numerically important diatoms were benthic, and their presence in the shallow water column must have been induced by wind mixing. The most abundant and persistent throughout both cycles were three Navicula and three Nitzchia forms (only N. punctata was identified). Also always present and relatively abundant were Amphora salina, Rhopalodia musculus var. constricta and Gyrosima sp.; abundant, but with a lower residence time, were Navicula brittanica, Stauroneis sp., Amphiprora alata (to less than 145 per mille), and Achantes heideni (up to 240 per mille) (Figure 6). Most of these diatoms have been reported in the algal and microbial mats of hyperhaline environments (Iltis et al., 1984; Brown et al., 1985).
Only two macrophytes were observed: the angiosperm Ruppia sp., present up to a salinity of 95 per mille during the first hydrological cycle, and to 56 per mille during the second one, and the filamentous chlorophyte Entero- morpha sp., present only during the second cycle but extremely abundant throughout the lagoon up to 68 per mille. The absence of Enteromorpha sp. during the first cycle was probably due to the shadow effect of the abundant phytoplankton community; its abundant development during the second cycle
243
a) b)
o
x
z
I-- O
1
Jul Oct Jan Apr Jul Oct Jan Apr F~SV CYCtE ~C~'O CYCtE
TIME IN MONTHS
20
15 E
~ 10 -i-
O
q 'T" O 5
Jul Oct Jan Apr Jul Oct Jan Apr FIRST CYCLE ~EC~ND CYCLE
TIME IN MONTHS
c) d)
2000
1800
1600
1400
7~ 1200
1000
8 0 0
6 0 0
4 0 0
2 0 0
0
Nannoplan~on
~ - , 9 1 ~ - Halobacteria
Jul Oct Jan Apr Jul O~t Jan Apt F~sl CYCLE S~CONO CYCLE
TIME IN MONTHS
% x
E
5
4.5
4
3.5
3
2.5
2
1.51
0.5 Diat~ 0 . . . . . . . , . . . . . . . . . . . . . . .
Jul Oct Jan Apr Jul Oct Jan Apr FIRST CYCLE .r162 C(~ND CycIJE
TIME IN MONTHS
Microplankton - . 9 - - -
Figure 5. Temporal fluctuations in phytoplankton biomass indices, a) total particulate protein concentrations; b) chlorophyll a concentrations; c) total nannoplankton abundance and halo- bacteria fraction; d) total microplankton abundance and diatom fraction.

244
rl
[1
0i I
El' < ~
r~
z e-,
0 ~
! - j o m
~1~1~
: ~ . ~ . ,~ ~ m ~ ~ F -
245
explains the differences in salinity between first and second cycles at which the cosmopolitan Ruppia sp. was found.
The first and second cycles were also different in terms of faunistic elements. During the first cycle, there were three successive assemblages (Figure 6). The first one (53-95 per mille) was characterized by the presence of a brachiuran crab which dominated the sparse zooplanktonic community and by a fish population ofMugil sp.; this was relatively abundant, as inferred from experimental captures and from local fishermen; growth was also good, averages length and weight of fish caught during a three-month period went from 10• to 23• cm and from 14• to 104• g (n-15). In the second phase (98-141 per mille), Mugil sp. was still present for a short time, but the main zooplanktonic element was an hemipteran insect of the Corixidae; for a brief period (two months), insect larva from Diptera and Coleoptera were also abundant; the Aretmia sp. first appeared after this period although in low abundance. In the last stage (240-357 per mille), the Artemia sp. became the only animal in the system.
In contrast, during the second cycle, Artemia sp. was always present, initially sharing the biotope with Diptera and Coleoptera larva, and later (up to 99 per mille) with Corixias and other two crustaceans of continental origin, the rotifer Brachionus sp., and the harpacticoid copepod Marshia sp (Figure 6). During this period, we found very few Artemia nauplii in the samples but up to 5 individuals of Marshia sp. attached to the phyllopods of adult Artemia, suggesting a selective predation of nauplii by this copepod.
As for the biometrical characteristics of Artemia (56 and 326 per mille; Table 1), individuals were generally larger at lower salinities, females were larger than males, and total lengths were 2.3 times greater than abdominal lengths. The maximum furcal length and the average ovisac width were inde- pendent of salinity. The furca was bilobed with 10-11 spines, and the ovisac was laterally pointed. The diameter of the hydrated cysts ranged from 197 to 235 #m, averaging 210• 13 #m. All these morphological and morpho- metrical observations are well within those reported for Artemiafranciscana Amat, 1980; Vanheackle and Sorgeloos, 1980; Correa-Sandoval and Biackle
- Ramfi'ez, 1993). Summarizing, the study site is a seasonally ephemeral habitat with a quite
regular dry phase. The hydrological cycles are continental or of mixed marine and pluvial origins. The former is a low frequency event associated with extreme storm conditions. During these cycles, the productivity of marine and continental communities is enhanced by nutrient inputs from runoff and the Artemia population (most probably Artemia franciscana) develops in the final phases of the cycle. In the non-marine hydrological cycles, Artemia is always present, and in early stages coexists with other faunistic elements of

246
Table 1. Biometry ofAr temia sp. from La Salina, B.C. M~xico.
a) 53 per mille Total Abdominal Furcal Ovisac Thrid somite length length length max. width width
Females
6.115 2.730 0.166 s 0.968 0.498 0.047 Min 3.514 1.513 0.066 Max 7.934 3.741 0.361 n 52 52 52
Males 5.534 2.366 0.169
s 0.187 0.421 0.034 Min 3.660 1.513 0.131 Max 7.224 3.225 0.244 n 48 48 48
b) 328 per mille
0.741 0.422 0.392 0.0899 0.230 0.247 1.673 0.722
52 52
0.422 0.079 0.295 0.689
48
Female 4.617 2.056 0.125
s 0.865 0.452 0.045 Min 3.367 1.366 0.065 Max 7.418 3.270 0.262 n 47 47 47
Males ,~ 3.864 1.587 0.119 s 0.712 0.355 0.070 Min 2.342 0.976 0.033 Max 6.051 2.928 0.361 n 55 55 55
0.832 0.234 0.164 1.181
47
0.247 0.066 0.131 0.394
47
0.199 0.045 0.131 0.295
55
c o n t i n e n t a l o r ig in . In r a iny yea rs , nu t r i en t inputs f rom r u n o f f m i g h t a l so b e
h igh , so i n c r e a s i n g the p r o d u c t i v i t y o f the sy s t e m. In a v e r a g e o r d ry yea r s ,
the r e l e a s e o f nu t r i en t f rom the s e d i m e n t s is insuf f i c ien t to sus ta in a h igh
p r o d u c t i v i t y in the w a t e r c o l u m n , bu t can suppo r t a r ich d e v e l o p m e n t o f a lga l
and m i c r o b i a l mats . O the r sa l t p a n s a l o n g the Pac i f i c coas t o f the P e n i n s u l a
m a y b e h a v e in a s im i l a r way.

247
Acknowledgements
This w o r k was part ial ly suppor ted by C O N A C T (Nat ional Counc i l o f Sc ience
o f Techno logy) . Special thanks are due to Fel ipe Plaza, C u a h u t e m o c N a v a
and Edua rdo Mora les for their ass is tance in the t opoba thyme t r i c surveys , to
Pedro R ipa and Gu ido M a r i n o n e for their help with the numer ica l model , and to Franc i sco Valenzuela and Norbe r to Flores for their ass is tance dur ing the
field work .
References
Amat E 1980. Differentiation in Artemia strains from Spain. In: G. Persoone, P. Sorgeloos, O. Roels and E. Jaspers (Eds) The Brine Shrimp Artemia. Vol. 1 Morphology, Genetics, Radiobiology, Toxicology, pp. 19-39. Universa Press, Wetteren, Belgium.
Bowen, S.T., Davis, M.L., Fenster, S.R. and Lindwall, G.A. 1980. Sibling species of Artemia. In: G. Persone, P. Sorgeloos, O. Roels and E. Jaspers (Eds) The Brine Shrimp Artemia. Vol. 1, pp. 155-167. Universa Press. Wetteren, Belgium.
Brown, S., Margulis, L., Ibarra, S. and Siqueiros, D. 1985. Desiccation resistance and conta- mination as mechanisms of GAIA. Biosystems 17: 337-360.
Carpelan, L.H. 1957. Hydrobiology of the Alviso Salt Ponds. Ecology 38(3): 375-390. Correa Sandoval, E and Btickle Ramr L.E 1993. Morfologfa y biometrla de cinco pobla-
ciones de Artemia franciscana (Anostraca: Artemiidae). Rev. Biol. Tropical 41(1): 103- 110.
Dayton, P.K. and Tegner, M.J. 1984. Catastrophic storms, E1 Nifio, and patch stability in a southern Califomia kelp community. Science 224: 283-285.
Dunne, T. and Leopold, L.B. 1978. Water in Environmental Planning, Part 4, pp. 95-125. W.H. Freeman and Co., San Francisco.
Edler, L. 1979. Recommendations for marine biological studies in the Baltic Sea: Phyto- plankton and chlorophyll. National Swedish Environmental Protection Board 38.
Gieskes, J.M. 1974. Interstitial water studies. In: E.S.W. Semspan and R. Schlech (Eds) Initial Reports of the Deep Sea Drilling Project, Vol. 25. U.S. Govt. Printing Office, Washington.
Gilbert, P.M. and Goldman, J.C. 1981. Rapid ammonium uptake by natural marine phyto- plankton. Mar. Biol. Lett. 2: 25-31.
Grasshoff, K. 1976. Methods of Sea Water Analysis. Verlag Chemic, New York. 317 pp. Harbeck, E. Jr. 1955. The effect of salinity on evaporation. Geological Survey Professional
Paper 2782(A): 1-6. Helfrich, P. 1973. The Feasibility of Brine Shrimp Production on Christmas Island. A Grant
Technical Report UNIHI-SEA GRANT TR-73-02 173 pp. Horodyski, R.J. 1977. Lyngbya mats at Laguna Mormona, Baja California, Mexico: comparison
with proterozoic stromatolites. Journal of Sedimentary Petrology 47(3): 1305-1320. INEGI. 1984. Sfntesis Geogr~ifica del Estado de Baja California. Anexo Cartogr~fico. Sria de
Programacibn y Presupuesto, 165 pp. Iltis, A., Risacher, F. and Servant-Vildary, S. 1984. Contribution ~i l'6tude hydrobiologique des
lacs sal6s du sud de I'Altiplano bolivien. Rev. Hydrobiol. Trop. 17(3): 259-273. Javor, B.J. 1983. Planktonic standing crop and nutrients in a saltern ecosystem. Limnol.
Oceanogr. 28(1): 153-159. Jones, A., Ewing, C.M. and Melvin, M.V. 1981. Biotechnology of solar saltfields. Hydrobi-
ologia 82: 391-406. Komar, P.D. 1986. The 1982-83 E1 Nifio and erosion on the coast of Oregon. Shore and
Beaches 54(2): 3-12.
248
Luna Machado, W. 1984. Avalic~o do potencial salineiro para cultivo de Artemia, no estado do Cear~i (Brasil). Boletin de Ciencias do Mar 39: 1-24.
Margulis, L., Barghoorn, E.S., Ashendorf, D., Banerjee, S., Chase, D., Francis, S., Giovannoni, S. and Stoltz, J.F. 1980. The microbial community in layered sediments at laguna Figueroa, Baja California, Mexico. Does it have Precambrian analogues. Precambrian Research 11: 92-123.
Markwell, M.A.K., Haas, S.M., Tolbert, N.E. and Beiber, L.L. 1981. Protein determination in membrane and lipoprotein samples: manual and automated procedure. Methods in Enzimology 72(16): 196-303.
Onishi, H. and Gibbons, N.E. 1965. Some observations on the stimulative effect of ammonium ion on the growth of Halobacterium cutirubrum. Canadian Journal of Microbiology 11: 1032-1034.
Oren, A. 1985. The rise and decline of a bloom of halobacteria in the Dead Sea. Limnol. Oceanogr. 30(4): 911-915.
Pefia, H.C. and S~inchez, A.J. 1985. Modelo estadistico de eventos extremos de olas para el Puerto de Ensenada, B.C. In: J. Urrutia, T. Fucugauchi and J.F. Vald6s-Galicia (Eds) Memorias de la Reuni6n Anual 1985 de la Uni6n Geoffsica Mexicana. Nov. 10-16, Oaxaca, Oax. Mexico.
Phleger, F.B. 1965. Sedimentology of Guerrero Negro Lagoon, Baja California, Mexico. Colston Papers 17: 205-237.
Phleger, EB. 1969. A modem evaporate deposit in Mexico, Bull. Am. Assoc. Petrol. Geol. 53: 824--829.
Phleger, EB. and Ewing, G.C. 1962. Sedimentology and oceanography of coastal lagoons in Baja California, Mexico. Geological Soc. of Am. Bull. 73: 145-182.
Post, EJ. 1977. The microbial ecology of the Great Salt Lake. Microbial Ecology 3: 143-165. Postma, H. 1965. Water circulation and suspended matter in Baja California Lagoons. Nether-
lands J. Sea Res. 2(4): 566-604. Sournia, A. 1978. Phytoplankton Manual. UNESCO, Paris, 337 pp. Stephens, D.W. and Gillespie, D.M. 1976. Phytoplankton production in the Great Salt Lake,
Utah, and a laboratory study of algal response to enrichment. Limnol. Oceanogr. 21: 74-87. Strickland, J.D.H. and Parsons, T.R. 1977. A practical handbook of seawater analysis. Bull.
Fish Res. Board Canada, 167 pp. Syrett, P.J. 1981. Nitrogen and metabolism and rnicroalgae. In: T. Platt (Ed) Physiological Bases
of Phytoplanton Ecology, pp. 182-210. Can. Bull. Fish and Aquatic Sci. 210, 346 pp. Vanheackle and Sorgeloos, P. 1980. International study on Artemia. IV. The biometrics of
Artemia strains from different origins. In: G. Persone, P. Sorgeloos, O. Roels and E. Jaspers (Eds) The Brine Shrimp Artemia. Vol. 1, pp. 393-405. Universa Press. Wetteren, Belgium.