Humic and fulvic acid characterization in sediments from a contaminated tropical river
17
ELSEVIER Chemical Geology 118 ( 1994 ) 271-287 CHEMICAL GEOLOGY ISOTOPE GEOSCIEN('E Humic and fulvic acid characterization in sediments from a contaminated tropical river B. Garciaa'% J.L. Mogoll6n a'a, L. L6pez a, A. Rojas b, C. Bifano a alnstituto de Ciencias de la Tierra, Universidad Central de Venezuela, Aptdo 3895, Caracas 1010 A, Venezuela bCentro de Resonancia Magnbtica, Facultad de Ciencias, Universidad Central de Venezuela, Caracas, Venezuela Received 20 August 1993; revision accepted 29 March 1994 Abstract Humic acids (HA) and fulvic acids (FA), isolated from sediments of a tropical river basin in Venezuela, have been studied in order to ascertain the influence of human activities as well as the influence of the type of vegetation. Differences and similarities of the tropical acids with temperate humic substances are established. Samples from non-contaminated and contaminated locations were collected in tropical rain-forest and savanna areas and characterized by IR, tH NMR and ~3C NMR spectroscopy. The organic carbon and nitrogen contents were determined in sediments, and in the HA and FA. The anthropogenic wastes have a strong effect on the chemical characteristics of humic substances. For example, polluted sediments contain a higher proportion of the residual fraction (humin) and a lower proportion of fulvic acids than the non-polluted sediments. The nitrogen content in polluted HA and FA is higher than in the non- polluted humic substances, and the organic carbon and nitrogen contents in polluted sediment are higher than in the non-polluted sediments. The IR and IH NMR spectra of the non-contaminated HA and FA of forest and savanna areas indicate the presence of oxygenated functional groups and aliphatic structures, whereas the tropical rain-forest HA and FA show a slightly higher aromatic character. Contamination increases the proportion of oxygenated functional groups and the aliphatic character of HA and FA, in particular the iH NMR HA methyl and methylene proton signals. Humic acid spectra of samples collected in areas with high domestic inputs show large-chain alkyl structure signals similar to that of detergents like alkylbenzenosulphonates. Signals in the aromatic regions were detected in FA 13C NMR spectra in samples of the same zone, and appear to be similar to those reported for the phthalic acids used in the preparation of alkyl resins such as plasticizer. The vegetation of the area plays a key role in the Corgand N content of fluvial sediments, with average values of both elements in areas of tropical rain forest 1.7 times higher than those in savanna and temperate forest areas. The climate seems to affect only the C content in the most reactive organic fraction, i.e. the FA. 1. Introduction The increases in population, agricultural ac- "Present address: Intevep S.A. Secci6n de Geoquimica, Los Teques, Edo. Miranda, Venezuela. *~To whom correspondence should be addressed. tivity and the development of new industrial areas, accompanied by the discharge, in some cases, of untreated solid and liquid wastes, have polluted severely the Tuy river, as well as other rivers located in north-central Venezuela. Pre- vious studies in this river focused on the phys- 0009-2541/94/$07.00 © 1994 Elsevier Science B.V. All rights reserved SSDI 0009-2541 ( 94 )00042-7
Transcript of Humic and fulvic acid characterization in sediments from a contaminated tropical river

E L S E V I E R Chemical Geology 118 ( 1994 ) 271-287
CHEMICAL GEOLOGY
ISOTOPE GEOSCIEN('E
Humic and fulvic acid characterization in sediments from a contaminated tropical river
B. G a r c i a a ' % J .L . M o g o l l 6 n a'a, L. L 6 p e z a, A. R o j a s b, C. B i f a n o a
alnstituto de Ciencias de la Tierra, Universidad Central de Venezuela, Aptdo 3895, Caracas 1010 A, Venezuela bCentro de Resonancia Magnbtica, Facultad de Ciencias, Universidad Central de Venezuela, Caracas, Venezuela
Received 20 August 1993; revision accepted 29 March 1994
Abstract
Humic acids (HA) and fulvic acids (FA), isolated from sediments of a tropical river basin in Venezuela, have been studied in order to ascertain the influence of human activities as well as the influence of the type of vegetation. Differences and similarities of the tropical acids with temperate humic substances are established.
Samples from non-contaminated and contaminated locations were collected in tropical rain-forest and savanna areas and characterized by IR, tH NMR and ~3C NMR spectroscopy. The organic carbon and nitrogen contents were determined in sediments, and in the HA and FA.
The anthropogenic wastes have a strong effect on the chemical characteristics of humic substances. For example, polluted sediments contain a higher proportion of the residual fraction (humin) and a lower proportion of fulvic acids than the non-polluted sediments. The nitrogen content in polluted HA and FA is higher than in the non- polluted humic substances, and the organic carbon and nitrogen contents in polluted sediment are higher than in the non-polluted sediments.
The IR and IH NMR spectra of the non-contaminated HA and FA of forest and savanna areas indicate the presence of oxygenated functional groups and aliphatic structures, whereas the tropical rain-forest HA and FA show a slightly higher aromatic character. Contamination increases the proportion of oxygenated functional groups and the aliphatic character of HA and FA, in particular the iH NMR HA methyl and methylene proton signals. Humic acid spectra of samples collected in areas with high domestic inputs show large-chain alkyl structure signals similar to that of detergents like alkylbenzenosulphonates. Signals in the aromatic regions were detected in FA 13C NMR spectra in samples of the same zone, and appear to be similar to those reported for the phthalic acids used in the preparation of alkyl resins such as plasticizer.
The vegetation of the area plays a key role in the Corg and N content of fluvial sediments, with average values of both elements in areas of tropical rain forest 1.7 times higher than those in savanna and temperate forest areas. The climate seems to affect only the C content in the most reactive organic fraction, i.e. the FA.
1. Introduction
The increases in popula t ion , agricultural ac-
"Present address: Intevep S.A. Secci6n de Geoquimica, Los Teques, Edo. Miranda, Venezuela. *~To whom correspondence should be addressed.
t ivi ty and the deve lopmen t of new industrial areas, a ccompan ied by the discharge, in some cases, o f unt rea ted solid and liquid wastes, have polluted severely the Tuy river, as well as other r ivers located in nor th-centra l Venezuela. Pre- vious studies in this r iver focused on the phys-
0009-2541/94/$07.00 © 1994 Elsevier Science B.V. All rights reserved SSDI 0009-2541 ( 94 )00042-7

272 B. Garcla et al. / Chemical Geology 118 (1994) 271-287
ico-chemical parameters of the water (Hum- phreys & Sons, 1975; Taboada and Garcia, 1978), the heavy-metal levels and geochemical behavior (Mogoll6n et al., 1990) and the trans- port of carbon, nitrogen and phosphorus (Ra- mirez et al., 1988). However, little attention has been paid to organic constituents (Melfndez et al., 1990) which constitute an important frac- tion of the sediments and often control chemical reactions, and which may be useful as pollution indexes.
Humic substances, the major organic constit- uents of soils and sediments, occur in almost all terrestrial and aquatic environments. It is be- lieved that humics are products of heteropoly- condensations of carbohydrates, proteins, fatty acids, lignin and tannin (Schnitzer and Khan, 1978 ). Based on their solubility, the humic sub- stances are separated into three fractions: the humic acid (HA) - - soluble in dilute alkali (NaOH) but insoluble in dilute acid; the fulvic acid (FA) - - soluble in both dilute alkali and di- lute acid; and the humin - - insoluble in dilute alkali and dilute acid.
Humic substances play an important role in the mobilization and accumulation of cations in the exogenous environment (Schnitzer and Khan, 1978 ), and in the cycles of nutrient elements such as N and P (Gjessing, 1976). The degradation ofhumic materials also leads to the formation of haloforms, a possible cause of serious health problems at quite low concentrations (Rook, 1977 ). Furthermore, humic substances can mo- bilize heavy metals by complexation (Saar and Weber, 1980; Peschel and Wildt, 1987 ), and pes- ticides by adsorption (Carter and Suffet, 1982). Another important characteristic of all humic substances is their interaction with minerals such as hydrous oxides, clays and hydrophobic or- ganic compounds (Schnitzer and Khan, 1978 ).
Despite being involved in many geochemical processes, and the fact that chemical research on humic substances started more than 200 years ago, much remains to be learned about them. In fact, very little is known about the influence of anthropogenic inputs (Wilson et al., 1988) and the tropical climate (Melfndez et al., 1990) on
the chemical composition and structure of the humic materials.
~H NMR (nuclear magnetic resonance) and 13C NMR spectroscopy have been used with varying degrees of success to study some struc- tural characteristics of humic substances and their source materials. Wehrli and Wirthlin ( 1976 ) found that aromaticity seems to be a spe- cific indicator of terrestrial vs. aquatic sources and that polysaccharides are among the main components in the structures of FA, as well as compounds derived from lignin (Hatcher et al., 1980; Sohn, 1985; Martin and Gonz~ilez-Vila, 1987; Filip et al., 1988). Therefore, it is to be expected that these techniques may elucidate different chemical structures as a function of the source vegetation, i.e. forest and savanna.
The purpose of this paper is to present the re- sults of the chemical and structural characteri- zation of humic and fulvic acids isolated from sediments of the contaminated tropical Tuy river basin. Our main interest is to compare spectro- scopic and chemical characteristics of these acids in regions known to be contaminated due to high demographic density and industrial activity, with humic and fulvic acids collected from non-con- taminated sediments. However, the influence of the kind of vegetation of the area is also ad- dressed. The results are compared with those of the better known temperate humic substances, in order to establish the differences and similarities.
2. Description of the study area
The Tuy river basin, located in north-central Venezuela (Fig. 1 ), drains an area of 6600 km 2 with a population density of 500 inhab, km -2 (Zambrano, 1970), which is the highest popu- lation density of any of the drainage basins of Venezuelan rivers draining directly into the Car- ibbean Sea.
The Tuy river basin can be divided into three subsections in terms of vegetation, lithology, hy- drology and population density. The forest zone has an area of 4030 km 2, an average annual pre- cipitation of 115 cm and a population density of > 800 inhab, km -2. The savanna and tropical

B. Garc& et aL / Chemical Geology 118 (1994) 2 71-28 7 273
~ ~ . ' ~ " ~ ~ 6 7 ° ° ° ' C A R ~ B E A N S E A --.. G6030 ' ~ 66"00 '
- , o 0 3 o ' . ~ . / ~ . ~ _ ~ ? ! ~ ,o-3o'-
(
.I
! "- ~"" ~ ~ "- All 6 /
\.~..,, . ~ • ~ , o ° o o '- " ~ - . ' - ~ . . . . . , . . . . - - ~ ..,,,... J ,-...- • " ~ .
• NONPOLLUTED SAMPLING POINTS
• POLLUTED SAMPLING POINTS
~.~-~ BASIN LIMITS o 5 ~o t,5 zo K m
Fig. 1. Map of the Tuy river catchment, Vennezuela.
rain-forest zones have smaller areas of 1270 and 1300 km 2, an annual precipitation of 135 and 224 cm, and a very low population density of ,-, 8 and ~ 2 persons k m - 2, respectively.
The climate is tropical and is characterized by dry and wet seasons. March and April are the driest months of the year with an average tem- perature of 30 °C and an average precipitation of 60 cm, while July and August are the wettest months with an average temperature of 21 °C and an average precipitation of 200 cm (Zambrano, 1970; Zinck, 1977). The annual average temper- ature and precipitation for the whole basin are 27°C and 140 cm, respectively (Zambrano, 1970).
The lithology of the forest area of the Tuy river basin consists mainly of low-grade metasedi- mentary rocks such as quartz-micaceous schists,
crystalline limestones and marbles. In the sa- vanna and tropical jungle areas, the lithology is a combination of metavolcanic (basaltic-andes- itic composition) and mafic-ultramafic rocks (Picard and Pimentel, 1968 ).
The river basin with 5- 106 inhabitants is host to > 600 factories adjacent to the Tuy river and much agricultural activity. Many factories pro- duce rum, chemical products, paints, plastics and food. Most of the domestic solid and liquid wastes are discharged into the rivers without treatment. All these human activities pollute most of the Tuy river and its main north margin tributaries (Mogoll6n et al., 1990), and are con- tributing to the high input of carbon and nitro- gen into the Caribbean Sea by the Tuy river (Ra- mirez et al., 1988 ).

274 B. Garcia et al. / Chemical Geology 118 (1994) 271-287
3. Materials and methods
3. I. Sampling
The sediments were collected along the mar- gins of the rivers. 10-15 collections of surface samples (0-5 cm) were taken, each separated 10 m from each other, and these were added to make a composite sample. All the sediments were stored in plastic bags and taken to the labora- tory, air-dried at room temperature for 7 days at 25 ° C, sieved through a 2-/~m stainless-steel sieve, and stored at 5 ° C, pending further analysis.
At each sampling site the water pH was mea- sured with an Orion ® 407 pH meter, tempera- ture (T) and dissolved oxygen (DO) with an equipment YSI-33 ®, and conductivity (L) with an equipment YSI-57A ®. Fig. 1 shows the sam- pling sites.
The sampling sites in tributaries discharging into the fight-hand margin of the Tuy river are A3, A7 and As. Sampling site A3 is located in a savanna area and samples A7 and A8 are in a tropical rain-forest area. All of these tributaries are considered non- contaminated (Mogoll6n et al., 1990). Sampling sites A~, A2 and A6, located in the headwater of the left-hand margin tribu- taries, are considered non-contaminated. In con- trast, the tributaries discharging into the left-hand margin are located in the forest area and are con- taminated (sampling sites A4, As). Further- more, eight sampling sites (T~, ..., T8) are lo- cated along the Tuy river main channel, and all of them have been classified as polluted.
3.2. Extraction and analysis ofhumic and fulvic acids
The stream surface sediment samples used for extraction of the humic materials were collected at sampling sites T~, Ts and A7 during the wet season of 1987, and at TI, T3, Ts, A~, A7 and A8 during the dry season of 1988.
Humic and fulvic acids were extracted at room temperature ( ~ 2 5 ° C ) from 3 kg of air-dried sediment. 25 1 of 0.5 NHC1 were used to decom- pose carbonates and to remove alkaline-earth metals. The supernatant was separated by cen-
trifugation ( l0 rain at 8500 rpm), and 251 of 0.5 N NaOH were added to the solid residue. The suspended material was shaken intermittently under a N2 atmosphere at room temperature for 24 hr. The FA in the supernatant were separated from the solid humic acids. Suspended clays were removed from the HA by flocculation using 0.1 N KOH under a N2 atmosphere. KC1 was then added to make the system 0.3 N with respect to potassium, and the suspended solid was re- moved by centrifugation after letting the solu- tion stand for 4 hr.
The clear HA solution was acidified with con- centrated HC1 to pH l, to induce the precipita- tion of the HA. The resultant solid was then sep- arated by centrifugation. The precipitated HA was purified by shaking for 24 hr at room tem- perature, with 1 1 of a dilute solution of HC1-HF (5 ml conc. HCI+5 ml 52% H F + 9 9 0 ml dis- tilled H20) . IR (infrared) and NMR monitor- ing showed no changes in size and shape of the signals monitored after the purification proce- dure was done three times.
The FA solution was first passed through a col- umn of XAD-8 ® resin and eluted with 0.1 N NaOH, and subsequently passed through a H +- interchanged column to remove the Na +. Fi- nally, the FA were freeze-dried.
The carbon content was determined by the Walkely and Black (1934) technique and nitro- gen was analyzed by the Kjeldahl method.
The % of humic and fulvic acids was calcu- lated dividing the mass of C in each fraction by the total mass of organic carbon in the sedi- ments. The % of humin fraction was estimated by difference.
3.3. Spectroscopic methods
The IR-FT (infrared Fourier transform) spectra were run with a double-beam spectro- photometer (Perkin-Elmer ®, model 1760×) operated in the Fourier Transform mode using KBr pellets (consisting of ~0.5 mg of humic substances in 200 mg KBr), in the range 4000 to 450 cm- 1.
1H and ~3C NMR spectra were recorded on a Bruker ® WP-80 at 80 and 20.1 MHz, respec-

B. Garcia et al. / Chemical Geology 118 (1994) 271-287 275
tively. The 1H NMR was operated in the Fourier Transform mode. A small amount of TSPA(CH3)3Si(SD2)2COONa was added to generate the reference and lock signals, and ~3C NMR chemical shifts were measured relative to dioxane - - 1000-2000 scans were accumulated.
low dissolved oxygen values indicate the present of organic contaminants in the water. The tem- perature and pH readings are similar in both areas, and do not show demographic alteration. The slight increase of temperature in the pol- luted sites may be attributed to their lower alti- tude in contrast to the non-polluted sites.
4. Results and discussion
4.1. Physico-chemical parameters of the waters
4.2. Organic carbon, nitrogen and humic substance content in sediments
In the Tuy river basin, the average natural (non-polluted) values, i.e. background values, of the conductivity, dissolved oxygen, temperature and pH of the water have been established based on a relatively large number of measurements taken between the years 1979 and 1990 (Mogol- 16n et al., 1993). Hence, the measurements of these parameters may be the simplest way to identify anthropogenic influences in the river course.
Table 1 shows the comparison of the reported background values with the values measured in the water during the sampling of the sediments used in this study. The conductivity (L) shows the expected high values at the polluted sites, and dissolved oxygen shows the expected low values. These corroborate our classification of polluted and non-polluted sites. The high conductivity values indicate that there is a high degree of in- organic contamination in this watershed, and the
Table 1 Average values of the physico-chemical parameters of the flu- vial water of the Tuy river basin
L DO T pH (/iS) (/tgml -~ ) (°C)
Polluted 804_+429 3.5_+ 1.8 28_+ 1 7.4_+0.3 sites ( n = l l ) (n= 10) ( n = l l ) ( n = l l )
Unpolluted 262_+ 103 8.1 _+0.7 25_+3 8.0_+0.5 sites (n=8) (n=7) (n=8) (n=8)
Background a 200_+93 8.4+0.8 25_+3 7.4_+0.5 (n=72) (n=42) (n=75) (n=60)
L=conductivity; DO=dissolved oxygen; n=number of samples. aReported by Mogoll6n et al. ( 1993 ).
High values of organic carbon (Cor~) and ni- trogen contents in sediments can be used as an index of anthropogenic inputs. Hence, the eval- uation of these parameters can be used to char- acterize the polluted or non-polluted nature of the sediments in which the humic and fulvic acid fractions are analyzed.
The average organic carbon content of the sed- iments collected in non-contaminated locations is 0.39% +_ 0.07% by weight. It can be seen in Ta- ble 2 that this average value, in spite of the low number of samples, is very similar to that previ- ously obtained (0.42%+0.10%) by Mogoll6n (1989) in sediments collected between the years 1981 and 1986. Therefore, 0.42% is used in the
Table 2 Average concentration and standard deviation of Co~ and N (expressed as percentage by weight) in different areas of the Tuy river basin
Co~8 (wt%) N (wt%)
reported a this study this study
Forest 0.33_+0.18 0.35_+0.02 0.09_+0.01 area (n=10) (n=3) (n=3)
Savanna 0.30_+0.19 0.32 0.08 area (n=9) (n= 1 ) (n= 1 )
Tropical rain 0.51_+0.27 0.45_+0.06 0.12_+0.01 forest area (n=20) (n=3) (n=3)
Non-polluted 0.42_+0.10 0.39_+0.07 0.10_+0.02 area (n=39) (n=7) (n=7)
Polluted 0 . 7 9 _ + 0 . 3 2 0.76_+0.12 0.18+_0.02 area (n=62) (n=8) (n=8)
n = number of samples. aMogoll6n (1989).

276 B. Garcia et al. / Chemical Geology 118 (1994) 271-287
1.2
0.9
;ARBON
0.6
0.3
;KGROUND
Tt T 2 T3 A4 T5 A5 T6 T7 T8
SITES LOCATION ON THE MAP
DOWNSTREAM >
0.30
0.20 ;EN
0.10
0.05
KGROUND
1"t T 2 T5 A3 T5 A 5 T6 T7 T8
SITES LOCATION ON THE MAP
Fig. 2. Distribution of organic carbon and nitrogen in sediments collected in the Tuy river basin during the dry season.
present study as a general background value for Corg.
Different vegetation densities produce differ- ent Corg concentrations in sediments, being high- est in the tropical rain-forest area (Table 2 ). The ratio of average Cow values in different areas sug-
gests that anthropogenic enrichments up to 1.7 would be neglected if background values as a function of the vegetation of the area were not used.
Fig. 2 shows the distribution of Cor8 and N in different sampling sites ordered in increasing

B. Garcla et al. / Chemical Geology 118 (I 994) 2 71-28 7 277
0./.,5
0.20 Corg = ~ 0.18
i ::
o.~ o;a o's o~7 o;o Corg (wt. %)
Fig. 3. Correlation between Corg and N contents in sediment.
distance from the headwater. The polluted sedi- ments from sites T~, T2, T3, T5 and As show a Corg enrichment of 2.3-3 times the general back- ground value. The general background value was used since the sediments from the Tuy river main course are a mixture of materials coming from source areas with different vegetation. The ob- served enrichments are due to the high domes- tic-industrial activity of the area. The site T5 en- richment could be caused by sedimentation of suspended solids with high organic content due to a change of hydrodynamic conditions in the river. The main source of suspended solids is Ca- racas' city wastes (Ramirez et al., 1988 ) and they are transported by the Guaire river (Fig. 1 ). A decrease in the Cots and N contents downstream was observed for the rest of the locations (T6, T7
and Ts), which may be due to the mixing of the polluted sediments with the non-polluted sedi- ment inputs of that area with relatively low hu- man activities.
The nitrogen content in sediments shows a distribution pattern similar to that shown by Corg (Fig. 2). Based on this feature the linear regres- sion equations shown in Fig. 3 were calculated. It could be appreciated in this figure that the lin- ear correlation coefficient between both ele- ments is relatively high, which allows the esti- mation of N contents based on the relatively more common Corg determination. This Corg-N correlation has been observed in other wa-
tersheds, and are due to the geochemical associ- ation of these elements (Bader, 1954; Kemp, 1970; Naidu, 1985 ). Deviation from linearity at Cow values lower than 0.25% may be due to the proximity to analytical detection limits. The Corg/N ratio found in this study ranges from 4 to 5, and is lower than the CorJN ratio for temper- ate soil humus and plants (Brady, 1984). This is indicative of a high degree of humification of the Tuy river sediment organic matter, proper of a tropical, relatively high-precipitation area.
It could also be seen in Table 2 that the nitro- gen content in the contaminated sediments is on average 1.8 times higher than in the non-con- taminated ones. Thus we consider the content in sediments of this element an efficient pollution indicator.
The weight percentages of humin, humic acid and fulvic acid fractions are shown in Table 3. The humic and fulvic acid fractions together ac- count for > 80% of the total organic matter. This means that, in spite the fact that the humin frac- tion was not analyzed, the bulk organic matter of the sediments was well characterized in this study.
Comparison between the polluted and non- polluted samples (Table 3) indicates that the % of fulvic acids decreases due to human influence from 40.1% to 32.4%. The weight percent of the humin fraction in contaminated samples (17.0%) is on average twice that of the non-con- taminated samples (9.0%) while the % humic acids is not anthropogenically affected. These facts suggest that human wastes are rich in resid- ual organic fractions. Not enough data are avail- able yet to address the vegetational influence in the relative proportions of these humic sub-
Table 3 Average weight percentage of the humic fractions extracted from Tuy river sediments
Fulvic acids Humic acids Humin
Unpolluted 40.1 50.9 9.0 sediments (n = 4)
Polluted 32.4 50.6 17.0 sediments (n = 5 )
n = number of samples.

278 B. Garcia et al. / Chemical Geology 118 (1994) 271-287
stances, but their assessment for this estimation would be expected.
4.3. Carbon and nitrogen content in humic and fulvic acids
A relatively simple method commonly used to characterize the humic substances is elemental analysis. Over the years a large number of these analyses have been carried out. Hence, reference values are available in the literature (e.g., Kern- dorff and Schnitzer, 1979; Rice and MacCarthy, 1991 ). The main difference found between HA and FA is that the former contain 3-10% more C. Nitrogen and sulphur contents have been pro- posed as an index of organic pollution (Kern- dorff and Schnitzer, 1979).
Table 4 shows the carbon and nitrogen content values for the polluted and unpolluted HA and FA analyzed in this study in comparison to val- ues found in the literature. The averages re- ported by Rice and MacCarthy (1991) were taken into consideration since they correspond to the most recent compilation of the elemental composition of freshwater humic substances.
Table 4 Elemental analyses of humic acids (HA) and fulvic acid (FA) (dry, ash-free )
c (wt%) N (wt%)
unpolluted polluted unpolluted polluted
H A [ l ] 54.7+3.5 56.3+2.3 3.4+1.2 5.5+0.5 (n=4) (n=4) (n=4) (n=4)
HA [2] 55.3+2.6 54.8+_ 1.3 4.0+0.7 8.3+0.6 (n=50) (n=6) (n=50) (n=6)
HA [3] 51.2+3.0 2.6+ 1.6 (n=56) (n=56)
FA[I ] 51.8+1.5 50.1_+3.9 3.0+1.4 4.9+0.7 (n=4) (n=4) (n=4) (n=4)
FA[2] 44.9+6.0 44.3_+1.1 2.5+-0.7 5.1 +0.7 (n=51) (n=6) (n=51) (n=6)
FA [3] 46.7+4.3 2.3+2.1 (n=63) (n=63)
References: [ 1 ] = this study; [ 2 ] = Kendorff and Schnitzer ( 1979); [3] =Rice and MacCarthy ( 1991 ). + is referred to standard deviation, n = number of samples.
Kerndorff and Schnitzer (1979) reported aver- age values for humic and fulvic acids extracted from polluted river sediments. It should be no- ticed that their values for unpolluted humic and fulvic acids consider both sediments and soils.
It can be appreciated that the polluted humic and fulvic acids contain more nitrogen than the non-polluted, while the carbon values are statis- tically identical as proved using the null hypoth- esis method described by Bird and May ( 1981 ). These features seem to confirm that the nitrogen content in HA and FA is a good index of organic pollution.
The carbon and nitrogen contents in fulvic acids are lower than in humic acids, regardless of the unpolluted or polluted character of the sam- pies and their provenance from temperate or tropical areas (Table 4). A possible explanation could be that the higher degree of polymeriza- tion of the humic acids makes these organic sub- stances more stable than the fulvic acids and consequently more resistant to breakdown pro- cesses, such as oxidation, hydrolysis and decarboxylation.
The C content obtained for both tropical un- polluted and polluted fulvic acids (50-51 wt%) are higher than the reported values (44-46 wt% ) for temperate fulvic acids (Table 4). There is, however, no difference in C wt% values for the humic acids. In addition, the reported values, which considered samples from a variety of lo- calities, show high variability in the C contents of the fulvic acids compared to the variability of our samples. A possible explanation for both the high variability in C content and the differences between our average fulvic acid C content and those reported elsewhere is that the C content in fulvic acids depends on the location, particularly on the climate of the area.
4.4. IR spectroscopy
In order to ascertain further dissimilarity be- tween the unpolluted and polluted humic mate- rials as well as the influence of the climate on their functional groups, we ran IR spectra of the samples. The IR spectra of the humic and fulvic acids isolated from non-polluted sediments are

B. Garcla et al. / Chemical Geology 118 (1994) 271-287 279
shown in Fig. 4. They have broad bands, which can be classified, according to the presence of heteroatoms in the functional groups in: ( 1 ) hy- drocarbon signals at the following frequencies:
HUMIC ACIDS
C=O
O H I C H 3 + C H 2
A7
1 I I I I I I 4000 3000 2000 t000 cm - I
FULVIC ACIDS
C:O C-O
I i I I I I I
4'000 3000 2000 4(300 cm- 4
Fig. 4. IR spectra of humic and fulvic acids extracted from non-contaminated sediments (Aj =sampling site located in savanna area; A7, As = sampling site located in tropical forest area).
2950-2850 cm -1 (aliphatic C-H stretch) and 1500 cm -I (CH2 and C H 3 bending); (2) oxy- genated functional groups signals at the follow- ing frequencies: 3400 cm -I (O-H stretch of phenols or alcohols), 1710-1650 cm -~ (C--O stretch of acids, aldehydes and ketones), 1210 cm-l (C-O stretch of ethers, esters and phen- ols) and 1040 cm-~ (C-O stretch of carbohydrates).
The spectra (Fig. 4) show the same positions of bands as those spectra reported for humic and fulvic acids in non-contaminated sediments of temperate climates (Schnitzer and Khan, 1978 ) as well as those spectra obtained by Paolini (1980) for soil humic and fulvic acids of tropi- cal climates. Our IR spectra are also comparable with the IR spectra for HA isolated from fresh plant material reported by Filip et al. ( 1988 ).
Comparing Figs. 4 and 5, it can be noticed that the IR spectra of the contaminated humic acids (Fig. 5 ) show a remarkable increase in the inten- sities of the 1650-cm -~ band (C=O stretch) and at 3400 cm-~ (O-H stretch of phenols or alco- hols), with respect to the non-contaminated humic acids (Fig. 4).
The variation in the IR spectra of humic and fulvic acids from the polluted site T, between dry and wet season merits attention. First, the spec- tra show that the positions of the IR bands do not change with season. However, during the dry season the relative intensities of the 1700-cm- (ketonic carbonyl) and 2850- and 2950-cm -1 (aliphatic C-H stretching) bands are higher than those found for the IR spectra during the wet season. Little published work has been carried out characterizing the wastes from different indus- trial sources, therefore at it is not possible at present to assess a specific source to the enrich- ment of ketones and aliphatic molecules found in sediments from site T~ in which multiple waste discharges are present.
In general, IR spectra show that contamina- tion increases the C=O and O-H proportion in the humic and fulvic acids. The increase of N, due to pollution, determined by elemental anal- ysis, was not detected. The increase in aliphatic character, reported by Kerndorff and Schnitzer (1979) as a general characteristic of polluted

280 B. Garcla et al. / Chemical Geology 118 (1994) 271-287
WET SEASONS
HUMIC ACIDS
Tt \
"r5
FULVIC ACIDS
CHz+ CH~ CI.12 4- CH 5 OH I c=oi
I I I I I I 30(30 2000 t000 c m- t
I I
4000 4000
CH CH
OH
i i 3000
CH2.1- CH s
\
i I I i
2000 1000 cm-1
DRY SEASONS
HUMIC ACIDS FULVIC ACIDS
I
OH ; = 0
CHz+ CHs C H 2~ C - O~
/
1"t
/ I I I I I J t I I I
4000 3000 2000 1000 cm -I 4000 5000 2000
C=O
l
J I I
t 000 cm -1
Fig. 5. IR spectra of humic and fulvic acids extracted from contaminated sediments (T~ = sampling site with industrial inputs; T 3 = sampling site with industrial and agricultural inputs; T5 = sampling site with industrial and domestic inputs).

B. Garcia et al. / Chemical Geology i 18 (1994) 2 71-287 281
humic substance, was detected only when dry- and wet-season samples, from a highly polluted area, were compared. However, IR spectroscopy can be considered useful for the first differentia- tion of contaminated and non-contaminated humic materials, and can be used to study the effects of different environmental factors such as the annual rainfall variations.
4.5. 'H NMR
To corroborate the features found in the IR spectra and obtain additional information about the humic and fulvic acid structures, NMR spec- tra were taken. Figs. 6 and 7 show the ~H NMR spectra of HA and FA extracted from contami- nated and non-contaminated sediments, respec- tively. The spectra contain broad absorption sig- nals rather than sharp peaks, which suggests the presence of complex molecular systems, as would be expected. These spectra may be divided into three main regions: ( 1 ) 0.5-2 ppm, signals due to methyl and methylene protons; (2) 2-5 ppm, signal due to H in structures containing methyl or methylene groups linked to heteroatoms, such as O and N, as well as H of OH groups in alco- hols, phenols and carboxyls; and ( 3 ) 6-8.0 ppm, signals due to aromatic structures.
The general features of the ~H NMR spectra of the non-contaminated humic and fulvic acids of forest and savanna sampling sites (Fig. 6) indi- cate the predominance of aliphatic structures, as inferred comparing the intensities of the signals in the region 0.5-4.0 ppm (aliphatic) with the signals in the region 6-8.9 ppm (aromatic). Those fulvic acids from the tropical rain-forest/ jungle area (sampling sites A7 and A8) show a slightly smaller aromatic character than the ful- vic acids from the savanna area (site A~), in agreement with the results ofRasyd et al. (1992). A higher input of woody materials in the forest area than in the savanna area may explain their relative aromatic character.
The ~H NMR spectra of non-contaminated humic and fulvic acids (Fig. 6) show weak but, broad signals between 1.0 and 1.3 ppm, attrib- uted to resonance from protons belonging to methylene groups of poorly-substituted aliphatic
chains or to methyl groups. The fine signal at 4.5 ppm, e.g. the FA, site A8 spectrum, is due to ex- changeable protons, which may be attributed partly to trace amounts of water present in the solvent or in the sample. This signal at 4.5 ppm becomes broad, e.g. FA, site A~, by superposition of signals of protons of OH groups in alcohols, phenols and carboxyls.
The signals located between 2 and 4 ppm at- tributed to H in CH3-O and CHa-N are more intense in the humic and fulvic acids from sam- pling sites A1 and A7 than in sample As. Partic- ularly, for the humic acid of site A 7 a broad ab- sorption signal extends from to 2 to 5 ppm, a feature that can be attributed to superposition of H of OH in alcohols, phenols and carboxyl groups with signals of H in CH3-O and CH3-N groups and signals due to exchangeable protons. All of these bring out the presence in samples A 1 and A7 which have a higher content of heteroatoms than sample A8.
Humic acids of the non-contaminated sites (A1, A 7 and As) appear to have similar fine structures in their spectra, with resonance at ~ 8.4 ppm. This signal has been assigned to for- mate by Wilson et al. ( 1988 ), based on addition of known compounds to the HA extracts. They proposed the formate may be a decomposition product formed when humic materials are dis- solved in NaOH.
The spectra of the polluted humic and fulvic acids (Fig. 7 ) show signals in the same region as the non-contaminated humic and fulvic acids (Fig. 6). However, the relative intensities of those signals are different, and shift of their po- sitions has been detected.
The contaminated humic acid spectra of sam- pling sites T~ and T5 (Fig. 7 ) show more intense signals than the non-contaminated spectra (Fig. 6 ) in the 2-3-ppm region, common to protons of CH3 and CH2 groups of large-chain, saturated, alkyl detergent structures. For comparison, the NMR spectra of a alkylbencenosulphonate de- tergent are shown in Fig. 6. The intense signals of the humic acids, sites T~ and Ts, in the 2-3- ppm region are evidence of the strong influence of the domestic activities of the area (Ramirez et al., 1988), where wastes are discharged into

282 B. Garcia et al. / Chemical Geology 118 (1994) 271-287
~-H
H A
I I
t0 8 6
FA
CH 3
|H'C'OH[ I
I ! L
4 2 0 ppm
At
~-H
& I I
I0 8 6
TMS
~C I-t 3
I I
4 2 0 ppm
A7
, I I I
10 8 6 I I I
4 2 0 ppm I I I
10 8 6 I I I
4 2 0 ppm
. . . . I I I I I I
t0 8 6 4 2 0 ppm
A8
t0 8 6 4 2 0 ppm
Fig. 6. ~H NMR spectra of humic and fulvic acids extracted from non-contaminated sediments (Al = sampling site located in savanna area; A7, As = sampling site located in tropical forest area ).

HA
~-H
B. Garcia et al. / Chemical Geology 118 (1994) 2 71-28 7
FA
CH 3
CH CH 2
i H2C-OH
T t
Y I I I i I I I I I I 8 7 6 5 4 3 2 1 ppm 8 6
TMS
e l l 3
CH CHz
HzC-OH H3C-OH
I t
4 Z
[
L |
0 ppm
283
T5
L I , I
4 3 2 I p p m
I I i I I
7 6 5 8 6 I I I
4 2 0 ppm
Detergent
I I I I I I
6 5 4 5 2 I p p m
Phtalic Acid
y ~ 6 0 0 H Z
I I I I I I I
8 7 8 6 4 2 0 ppm
Fig. 7. ]H NMR spectra ofhumic and fulvic acids extracted from contaminated sediments compared with alkylbenzenosulphon- ate detergent and phtalic acid (T~ = sampling site with industrial inputs; T5 = sampling site with industrial and domestic inputs).
the river stream, in most cases without treatment. The position and intensity of the signals of H
of the CH3 and CH2 groups in the polluted fulvic
acid spectra (Fig. 7) are similar to the position and intensity of those signals in non-polluted ful- vic acid spectra (Fig. 6). This suggests that the
284 B. Garcia et al. / Chemical Geology 118 (1994) 271-287
A
B
I t 350 /
/
/ /
/
I I I
250 150
/ /
I 7 I 0 150
67.4. 50 0
/
I I I
67.4. 50 0
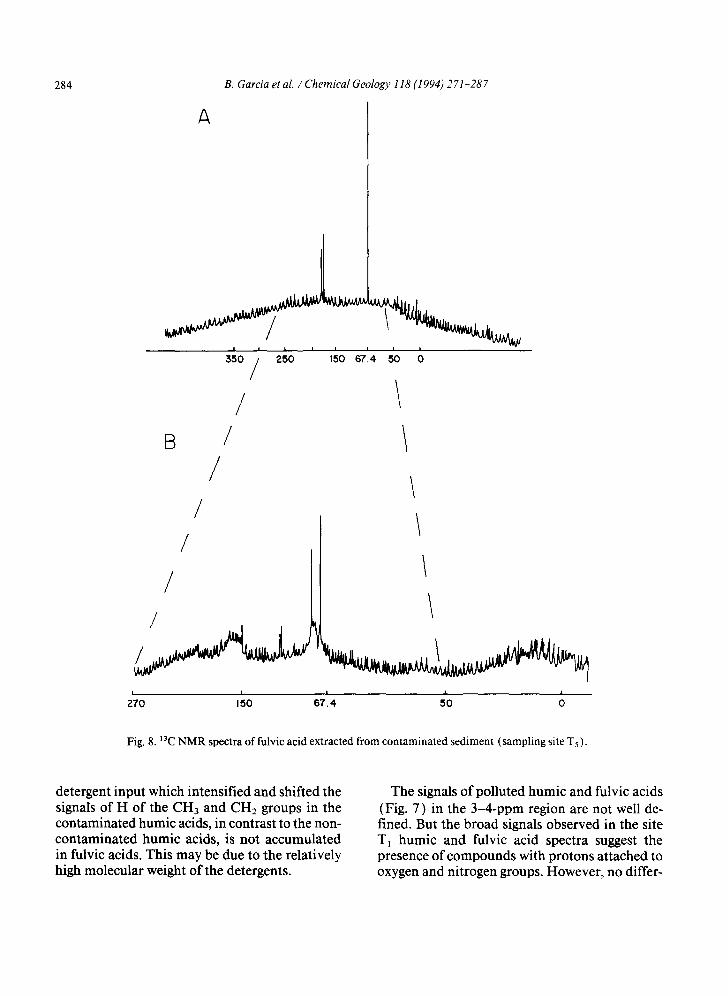
Fig. 8.13C NMR spectra of fulvic acid extracted from contaminated sediment (sampling site Ts).
detergent input which intensified and shifted the signals of H of the CH3 and CH2 groups in the contaminated humic acids, in contrast to the non- contaminated humic acids, is not accumulated in fulvic acids. This may be due to the relatively high molecular weight of the detergents.
The signals of polluted humic and fulvic acids (Fig. 7) in the 3-4-ppm region are not well de- fined. But the broad signals observed in the site T~ humic and fulvic acid spectra suggest the presence of compounds with protons attached to oxygen and nitrogen groups. However, no differ-

B. Garcia et al. / Chemical Geology 118 (1994) 271-287 285
ence can be stated in relation to non-polluted humic and fulvic acids (Fig. 6), as it was done based on the IR spectra.
Three major signals at 8.2, 7.4 and 7.2 ppm were detected in the polluted site T5 fulvic acid spectrum. These signals correspond to aromatic rings singly substituted by weak electron-donat- ing substituents. Alkylbenzene structures are typical of compounds yielding such signals. This spectrum is relatively similar to that reported one for phthalic acid used in the preparation of alkyl resin like plasticizers. Simoneit and Burlingame ( 1972 ) have suggested that these kinds of com- pounds may be derived from the sampling con- tainers. However, in our case the absence of these three signals in non-polluted samples suggests that, rather than being an artifact arising from the handling of the samples, the phthalic acids are derived from the large number of factories in the area, which process plastic materials. In the polluted fulvic acid T~ these three signals at 8.2, 7.4 and 7.2 are present, but their intensities are lower than in the polluted fulvic acid Ts. This suggests a smaller input of alkyl resin in T1 than in Ts, as expected based on the human activities of the areas.
Fig. 8 shows the fulvic acid 13C NMR spec- trum of the A5 sample. This sample was selected because it was the only one that shows three ma- jor peaks well defined in the ~H NMR spectra at 8.2, 7.4 and 7.2 ppm (Fig. 8 ), while the signals in the spectra of the rest of the samples were broad, as it is expected for humic substances (Hatcher et al., 1980).
In the spectrum of Fig. 8A, the signals of diox- ane (used as a solvent) show that it has a chem- ical shift of 67.4 ppm. Two signals at 160-180 ppm, in the aromatic zones, are probably due to the ortho-disubstituted carbons in the aromatic systems. In the aliphatic regions there are some very weak signals at 16.5, 21.1, 25.0, 27.0 and 27.1 caused by aliphatic carbons present in COOH groups.
The spectrum of Fig. 8B is for the 50-250-ppm range of the spectrum of Fig. 8A. Signals in the aromatic regions ( 160-180 ppm) were detected in the spectrum of Fig. 8B in agreement with the 1H NMR spectrum of the same sample. This
similarity allows us to propose a phthalic com- plex like that reported by Ogner and Schnitzer (1970) as a possible chemical structure.
5. Conclusions
The anthropogenic inputs have a remarkable effect on the elemental composition and chemi- cal structure of the humic substances. Factors such as the source vegetation and seasonal amounts of rainfall cause the chemical structure of humic and fulvic acids to vary, suggesting that the climate may has an influence on the chemical structure and to a lesser extent on the elemental composition of these acids. But, while a data base already exists for temperate regions, the infor- mation for the tropics is very scarce.
The results of this study are summarized as follows:
(1) The human activity inputs increase, on average, the sediment Corg and N content along the entire length of the Tuy main river channel by 1.8 times. These anthropogenic inputs are two times richer in the residual fraction (humin) than natural fluvial organic matter.
(2) Increases in N content in humic and fulvic acid fractions were detected. This feature seems to confirm that the N content in humic and ful- vic acid is an index of pollution.
(3) The wt% of C in humic and fulvic acid is not affected by pollution, suggesting that the pol- luted humic substances have similar C contents as those found in unpolluted sediments.
(4) The ~H, ~3C NMR and IR spectra ofhumic and fulvic acid extracted from polluted sedi- ments show structures with low aromaticity and high proportion of oxygenated functional groups, with elevated trace-metal absorption capacity. We have also detected a number of structures of potential toxicity. Large-chain, saturated, alkyl detergents are derived from domestic sources. Phthalic acids, used in the preparation of alkyl resins, are derived from industrial activities.
(5) The NMR techniques enable us to dem- onstrate how the vegetation of the area affects the structure of the humic substances found in the sediments. It shows that in the tropical rain-for-

286 B. Garcia et al. / Chemical Geology 118 (I 994) 271-287
est zone the humic and fulvic acids are more ar- omatic than in the savanna zone.
(6) The C content in tropical fulvic acid (the fraction less resistant to processes such as oxi- dation and hydrolysis) is higher than that in temperate fulvic acid. The other C and N values and structures found in this study seem to be similar to those found in temperate areas.
(7) The seasonal variation of rainfall affects the aliphacity and C=O content in humic and fulvic acid extracted from a highly polluted sed- iment. This may be due to variations in the pro- portion of anthropogenic and natural substances.
Acknowledgements
The authors would like to thank Consejo de Desarrollo Cientifico y Humanistico de la Univ- ersidad Central de Venezuela for the financial support of this research and to F. Garcia, A.C. Lasaga, J. Pasquali and K. Phillips who critically reviewed the manuscript and gave very valuable advises.
References
Bader, R., 1954. Carbon and nitrogen relations in surface and sub-surface marine sediments. Geochim. Cosmochim. Acta, 7:205-211.
Bird, J. and May, C., 1981. Statistics for technicians. Gen. Editor Math. Sci., 95-96 pp.
Brady, N.C., 1984. The Nature and Properties of Soils. Mac- millan, New York, N.Y., 9th ed., 750 pp.
Carter, W. and Suffet, I., 1982. Binding of DDT to dissolved humic materials. Environ. Sci. Technol., 16: 735-740.
Filip, Z., Alberts, J. and Cheshire, M., 1988. Comparison of salt marsh humic acids with formic like substances from the indigenous plant species. Sci. Total Environ., 71 : 154- 172.
Gjessing, E., 1976. Physical and Chemical Characteristics of Aquatic Humus. Ann Arbor Science, Ann Arbor, Mich., 564 pp.
Hatcher, P., Maciel, E., Gary, D. and Dennis, L., 1980. Ali- phatic structure ofhumic acids; a clue to their origin. Org. Geochem., 43: 43-55.
Humphreys, H. & Sons, 1975. Estudio de la contaminacion y tratamiento de los efluentes cloacales e industriales del rio Tuy. Rep. by Humphreys, H. & Sons, Caracas, to INOS (Inst. Nac. Obras Sanit. ), Caracas, Vols. 1-3.
Kemp, A., 1970. Organic carbon and nitrogen in the surface
sediments of lakes Ontario, Erie and Huron. J. Sediment. Petrol., 41: 537-548.
Kerndorff, H. and Schnitzer, M., 1979. Humic and fulvic acids as indicator of soil and water pollution. Water, Air Soil Pollut., 12: 319-329.
Martin, F. and Gonz~ilez-Vila, V., 1987. Fulvic acids from particulate matter of a water-logged peatland. Chem. Geol., 67: 359-360.
Melrndez, W., Lopez, L., Mogollon, J.L., Rojas, A. and Bi- fano, C., 1990. Estudio de las caracteristicas quimicas de los ~icidos htlmicos de la materia org~inica presente en se- dimentos fluviales de un rio tropical, Venezuela. Inter- ciencia, 15: 501-506.
Mogollon, J.L., 1989. Estudios de los factores que afectan el comportamiento en funci6n de distancia y tiempo de los par~imetros fisico-quimicos de las aguas, C org~inico y metales pesados en los sedimentos de la cuenca del rio Tuy. Trabajo de Ascenso, lnstituto de Ciencias de la Tierra, Facultad de Ciencias, Universidad Central de Venezuela, Caracas, 162 pp.
Mogollon, J.L., Ramirez, A.J., Guilldn, R. and Bifano, C., 1990. Heavy metals and organic carbon in sediments from the Tuy river basin, Venezuela. Environ. Geochem. Health, 12: 277-287.
Mogoll6n, J.L., Ramirez, A.J. and Bifano, C., 1993. Uso de los parfimetros fisico-quimicos de las aguas fluviales como indicadores de influencias naturales y antropicas. Inter- ciencia, 18: 249-254.
Naidu, S., 1985. Organic carbon, nitrogen and C/N ratios of deltaic sediments, north arctic Alaska. In: Transport of Carbon and Minerals in Major World Rivers, Lakes and Estuaries. Mitt. Geol. Pal~iontol. Inst., Univ. Hamburg. SCOPE/UNEP, Sonderband, 58:311-321.
Ogner, G. and Schnitzer, M., 1970. Humic substances: fulvic acids-diphthalate complexes and their role in pollution. Org. Geochem., 3:212-214.
Paolini, J., 1980. Caracterizacion de las sustancias htimicas extraidas de suelos tipicos de bosques hfimedo tropical dc San Carlos de Rio Negro, T.F. Amazonas. Acta Cient. Ve- nez., 31: 415-420.
Peschel, G. and Wildt, T., 1988. Humic substances of natural and anthropogeneous origin. Water Res., 22: 105-108.
Picard, C. and Pimentel, M., 1968. Geologia de la cuenca de Santa Lucia, Ocumare del Tuy. Bol. Geol., 19: 267-284.
Ramirez, A., Rose, A. and Bifano, C., 1988. Transport of car- bon and nutrients by the Tuy river, Venezuela. In: T. Dc- gens, S. Kempe and A.S. Naidu (Editors), Transport of Carbon and Minerals in Major World Rivers, Lakes and Estuaries, Part 5. Mitt. Geol. Pal~iontol. Inst., Univ. Hamburg. SCOPE/UNEP, Sonderband, 66: 137-146.
Rasyd, U., Johnson, W.D., Wilson, M.A. and Hanna, J.V.. 1992. Changes in organic struclural group composition of humic and fulvic acids with depth in sediments from sim- ilar geographical but different depositional environment. Org. Geochem., 18: 521-529.
Rice, J.A. and MacCarthy, P., 1991. Statistical evaluation of the elemental composition of humic substances. Org. Geochem., 17: 635-648.

B. Garcia et al. / Chemical Geology 118 (1994) 271-287 287
Rook, J., 1977. Chlorination reactions of fulvic acids in nat- ural waters. Environ. Sci. Technol., 11: 478-482.
Saar, R. and Weber, J., 1980. Lead(II) complexation by ful- vic acids: how it differs from fulvic acids complexation of copper(II) and cadmium(II). Geochim. Cosmochim. Acta, 44: 1381-1384.
Schnitzer, M. and Khan, S., 1978. Soil Organic Matter. Else- vier, Amsterdam, 319 pp.
Simoneit, B.R. and Burlingame, A.L., 1972. Preliminary or- ganic analysis of the DSDP (Joides) cores, Legs V-IX, Adv. Org. Geochem., Pergamon, Oxford, pp. 189-228.
Sohn, M., 1985. CPMAS13C NMR spectra of estuarine sedi- mentary humic acids. Org. Geochim. Acta, 3" 206-225.
Taboada, S.E. and Garcia, P., 1978. Estudio de los par~ime-
tros de poluci6n del rio Tuy. INOS (Inst. Nac. Obras Sanit.), Caracas.
Walkely, A. and Black, I., 1934. An examination of the Degtjareffmethod for determining soil organic matter and a proposed modification of the chromic acid titration method. Soil Sci., 37: 29-38.
Wehrli, F. and Wirthlin, T., 1976. Interpretation of carbon 13 NMR spectra. Heyde Series, 234-237 pp.
Wilson, A., Philip, C., Malcolm, R., Perdue, M. and Pearson, C., 1988. Low molecular weight species in humic and ful- vic fractions. Org. Geochem., 12 ( 1 ): 7-12.
Zambrano, S., 1970. Estudio fisiogr~tfico regional de la cuenca del rio Tuy. Bol. Geol. 21, 3-206.
Zinck, A., 1977. Rios de Venezuela. Cuadernos de Lagoven, Caracas, 63 pp.