Human Sign-Tracking: an Investigation into its Mechanisms ...
384
I Human Sign-Tracking: an Investigation into its Mechanisms, Measurements and Neuropsychological Correlates Thesis submitted in accordance with the requirements of the University of Liverpool for the degree of Doctor in Philosophy by Jay Joseph Duckworth. November 2017
-
Upload
khangminh22 -
Category
Documents
-
view
3 -
download
0
Transcript of Human Sign-Tracking: an Investigation into its Mechanisms ...
I
Human Sign-Tracking: an Investigation into
its Mechanisms, Measurements and
Neuropsychological Correlates
Thesis submitted in accordance with the requirements of the University of
Liverpool for the degree of Doctor in Philosophy by Jay Joseph Duckworth.
November 2017
II
Contents
Chapter One: General Introduction Page: 1
1.1 Drug and Alcohol Use: Estimates, Problems and Treatments 1
1.2 Conditioning 2
1.3 Sign-Tracking versus Goal-Tracking: Nonhuman Animals 4
1.3.1 Background 4
1.3.2 Autoshaping procedures 7
1.3.2.1 Background 7
1.3.2.2 Differential responding between tracker types 8
1.3.2.3 Influence of experimental setup on outcome 9
1.3.2.4 Autoshaping outcome measures 13
1.3.3 Correlates of Sign-Tracking and Goal-Tracking 15
1.3.3.1 Correlates of Sign-Tracking 15
1.3.3.2 Individual differences between tracking groups: Sign-Trackers vs.
Goal-Trackers
19
1.4 Sign-Tracking & Goal-Tracking: Humans 26
1.4.1 Autoshaping procedures: Cognitive Tasks 28
1.4.2 Influence of Task Setup on Outcomes 31
1.4.3 Tracking Responses in Humans 37
1.4.3.1 Correlates of Sign-Tracking & Goal-Tracking: Humans 38
1.4.3.1.1 Correlates of Sign-Tracking 38
1.4.3.1.2 Individual differences between human tracking groups: Sign-
Trackers vs. Goal-Trackers
43
1.5 Aetiology of Tracking Behaviours 45
1.5.1 Genetics 46
1.5.2 Neurobiology 48
1.5.3 Influence of Early Life Experiences 56
1.5.4 Influence of drugs 60

III
1.5.5 Sign-Tracking: What are the causes? 63
1.6 Summary and Aims 65
Chapter Two: General Methods 67
2.1 Cognitive Tasks 67
2.1.1 Hardware/Software for eye-tracking tasks 67
2.1.2 Additional Singleton Tracking Task (ASTT) 68
2.2 Questionnaires 71
2.3 Additional Research Aspects 78
2.3.1 Equipment Maintenance and Repair 79
2.3.2 ‘Study 7’ 79
Chapter Three: Human Sign-Tracking: A Large Scale Investigation in
Social Drinkers
81
3.1 Abstract 81
3.2 Introduction 82
3.3 Method 86
3.4 Data Reduction and Analysis 96
3.5 Results 97
3.6 Discussion 105
Chapter Four: Human Sign-Tracking is amplified by Acute Alcohol
Consumption for Lower, but not Higher, Doses
114
4.1 Abstract 114
4.2 Introduction 115
4.3 General Methods 120
4.4 Experiment 1 122
4.4.1 Method 122
4.4.2 Data Reduction and Analysis 125
4.4.3 Results 126
4.4.4 Discussion 134
4.5 Experiment 2 135
4.5.1 Method 136
IV
4.5.2 Results 137
4.5.3 Discussion 146
4.6 Results Synthesis 147
4.7 General Discussion 151
Chapter Five: Is Sign-Tracking maintained in a Singleton Task with more
than Two Distractors? A First Look
157
5.1 Abstract 157
5.2 Introduction 158
5.3 Method 161
5.4 Data Reduction and Analysis 163
5.5 Results 163
5.6 Discussion 171
Chapter Six: A Comparison of Methods for Measuring Human Sign-
Tracking
177
6.1 Abstract 177
6.2 Introduction 178
6.3 Method 181
6.4 Data Reduction and Analysis 189
6.5 Results 191
6.6 Discussion 202
Chapter Seven: Human Sign-Tracking Correlates with BOLD Activity in
the Dorsal Striatum
205
7.1 Abstract 205
7.2 Introduction 206
7.3 Method 210
7.4 Data Acquisition, Reduction and Analysis 215
7.4.1 Additional Singleton Tracking Task: Outcome Measures 215
7.4.2 Functional Magnetic Resonance Imaging: Data Acquisition and Analysis 215
7.5 Results 217
7.5.1 Behavioural Analysis 219
V
7.5.2 fMRI Analysis 222
7.6 Discussion 229
Chapter Eight: Supplementary Analyses 235
8.1 Background 235
8.2 Study 1 (Chapter Three) 235
8.3 Study 2 (Chapter Four) 236
8.4 Study 3 (Chapter Four) 237
8.5 Study 4 (Chapter Five) 239
8.6 Study 5 (Chapter Six) 239
8.7 Study 6 (Chapter Seven) 240
8.8 Conclusions 241
Chapter Nine: Examination of the ASTT 242
9.1 Background 242
9.2 Study 1 (Chapter Three) 243
9.3 Study 2 (Chapter Four) 245
9.4 Study 3 (Chapter Four) 248
9.5 Studies 2 & 3 251
9.6 Study 4 (Chapter Five) 253
9.7 Study 5 (Chapter Six) 257
9.8 Study 6 (Chapter Seven) 257
9.9 Conclusions 258
Chapter Ten: General Discussion 260
10.1 Background 260
10.2 Summary of Findings 261
10.2.1 Human Sign-Tracking: Evidence, Mechanisms, and Measurement 261
10.2.1.1 Evidence 261
10.2.1.2 Mechanisms 262
10.2.1.3 Measurement 265
10.2.2 Human Sign-Tracking: Influence of Acute Alcohol Administration 267
VI
10.2.3 Human Sign-Tracking: Longevity and Neural Correlates 269
10.2.4 Human Sign-Tracking: Individual Differences 271
10.3 Limitations 272
10.4 Future Research and Applications 277
10.5 Conclusions 280
References 282
Appendices 335
Appendix A 335
Appendix B 340
Appendix C 342
Appendix D 349
Appendix E 358
Appendix F 367
Appendix G 369

VII
List of Tables
Table 3.1 Alcohol use characteristics (Means ± SD) Page: 99
Table 3.2 Trait/State characteristics (Means ± SD) 99
Table 3.3 Correct and incorrect OT response frequencies and durations
(Means ± SD)
100
Table 3.4 CS response frequencies and durations (Means ± SD) 100
Table 3.5 Response frequencies (Means ± SD) 102
Table 4.1 Alcohol use characteristics (Means ± SD) 127
Table 4.2 Trait/State characteristics (Means ± SD) 127
Table 4.3 Response frequencies (Means ± SD) 128
Table 4.4 RTs (Means ± SD) 128
Table 4.5 Alcohol use characteristics (Means ± SD) 138
Table 4.6 Trait/State characteristics (Means ± SD) 138
Table 4.7 Response frequencies (Means ± SD) 139
Table 4.8 Reaction Times (Means ± SD) 138
Table 4.9 Differences in self-reports between samples (Studies 2 and 3)
(Means ± SD)
149
Table 5.1 Alcohol use characteristics (Means ± SD) 165
Table 5.2 Trait/State characteristics (Means ± SD) 165
Table 5.3 Response frequencies (Means ± SD) 166
Table 5.4 CS RT response ranges 167
Table 6.1 Alcohol use characteristics (Means ± SD) 192
Table 6.2 Trait/State characteristics (Means ± SD) 192
Table 6.3 Response frequencies (Means ± SD) 193
Table 6.4 Response frequencies (Means ± SD) 195
Table 6.5 Gaze dwell times within areas of interest (Mean ± SD) 296
Table 6.6 Fixation frequencies towards areas of interest (Mean ± SD) 296
Table 7.1 Alcohol use characteristics (Means ± SD) 218
VIII
Table 7.2 Trait/State characteristics (Means ± SD) 219
Table 7.3 Response frequencies (Means ± SD) 219
Table 7.4 Participant RT Bias scores and tracking rankings across studies 221
Table 7.5 Regions of activation after a whole brain analysis with age and
gender controlled for as fixed factors and RT Bias as a correlate
224
Table 8.1 Overview of Study 1 analyses 236
Table 8.2 Overview of Study 2 analyses 237
Table 8.3 Overview of Study 3 analyses 238
Table 8.4 Overview of Study 4 analyses 239
Table 8.5 Overview of Study 6 analyses 240
Table A1 MTTT outcome measures 336
Table A2 ASTT outcome measures 339
Table C1 Spearman (rs) correlations between MTTT and ASTT bias scores
and individual differences
343
Table C2 Participant characteristics: goal- versus sign-trackers (Means ± SD) 347
Table D1 Spearman (rs) correlations between ASTT bias scores and
individual differences
353
Table D2 Spearman (rs) correlations between DAQ change scores and sign-
tracking measures
355
Table D3 Spearman (rs) correlations between SIS change scores and sign-
tracking measures
356
Table D4 Pearson (r) correlations between BrAC and sign-tracking measures 357
Table E1 Spearman (rs) correlations between ASTT bias scores and
individual differences
362
Table E2 Spearman (rs) correlations between DAQ change scores and sign-
tracking measures
364
Table E3 Spearman correlations (rs) between SIS change scores and sign-
tracking measures
365
Table E4 Pearson (r) correlations between BrAC and sign-tracking measures 366
Table F1 Spearman (rs) correlations between ASTT+ bias scores and
individual differences
367
Table G1 Spearman (rs) correlations between ASTT (BB) bias scores and
individual differences
369
IX
List of Figures
Figure 2.1 Pictorial demonstration of two consecutive trials of the ASTT (one
low-value [blue], one high-value [red])
Page: 70
Figure 3.1 Examples of the reward stimuli used in the Conditioning Phase of
the MTTT
90
Figure 3.2 Pictorial demonstration of the Conditioning Phase of the MTTT 91
Figure 3.3 Pictorial demonstration of a single trial of the MTTT 93
Figure 3.4 Bar charts showing group differences in RT Bias (left) and
Omission Bias (right)
105
Figure 4.1 Bar charts showing comparisons of RT Bias (left) and Omission
Bias (right) between alcohol and control conditions
131
Figure 4.2 Interaction plot showing mean OT RTs on high- and low-value
trials across drink conditions and session orders
142
Figure 4.3 Bar chart comparing RT Bias across samples for alcohol and
control conditions
150
Figure 5.1 Error bar chart depicting mean OT RT differences between CSs
(entire sample)
169
Figure 5.2 Error bar chart depicting mean omission differences between CSs
(entire sample)
170
Figure 6.1 Schematic of the Instrumental stage of the PIT task 184
Figure 6.2 Schematic of the Pavlovian stage of the PIT task 186
Figure 6.3 Schematic of the Pavlovian-to-instrumental Transfer stage of the
PIT task
187
Figure 7.1 BOLD signal representations for the first contrast at a) the right
putamen (cluster 1) and b) the right lateral superior occipital cortex (cluster 2)
225
Figure 7.2 Montage showing axial scans (every two slices) revealing the
bilateral putamen activation found in the first contrast
226
Figure 7.3 BOLD signal representations for the second contrast at a) the right
putamen (cluster 1) and b) the right pallidum and amygdala (cluster 2)
227
Figure 7.4 Pearson correlations between RT Bias and neural activations
(BOLD signals)
228
Figure 9.1 Scatterplot showing a positive correlation between bias scores for
the ASTT
244
X
Figure 9.2 Scatterplot showing a positive correlation between bias scores in a
sample containing only sign-trackers and goal-trackers
245
Figure 9.3 Scatterplot showing a nonsignificant correlation between bias
scores (control condition)
247
Figure 9.4 Scatterplot showing a nonsignificant correlation between bias
scores (alcohol condition)
248
Figure 9.5 Scatterplot showing a nonsignificant correlation between bias
scores (control condition)
250
Figure 9.6 Scatterplot showing a nonsignificant correlation between bias
scores (alcohol condition)
251
Figure 9.7 Scatterplot showing a nonsignificant correlation between bias
scores (control condition)
252
Figure 9.8 Scatterplot showing a nonsignificant correlation between bias
scores (alcohol condition)
253
Figure 9.9 Scatterplot showing no association between RT Bias and Omission
Bias 1 for the ASTT+
255
Figure 9.10 Scatterplot showing no association between RT Bias and
Omission Bias 2 for the ASTT+
256
Figure 9.11 Scatterplot showing no association between Omission Bias 1 and
Omission Bias 2 for the ASTT+
257
XI
Human Sign-Tracking: an Investigation into its
Mechanisms, Measurements and Neuropsychological
Correlates
Jay Joseph Duckworth
Thesis Abstract
Sign-tracking describes the behaviour of individuals who attribute incentive salience to
irrelevant, reward-associated cues, whereas goal-tracking pertains to individuals who use
such cues only as predictive tools for upcoming rewards. The importance of the sign-
tracker/goal-tracker phenotypes has been noted in the preclinical literature, with researchers
suggesting that they are useful for the study of addiction. This thesis provides translational
data, examining sign-tracking and goal-tracking in human social drinkers across six separate
experiments.
Chapter One reviews the relevant literature on sign-tracking, covering the history of its
discovery, its mechanisms, correlates, effects and aetiologies. Chapter Two details the
general methods used across experiments (computer tasks and questionnaires). Chapter Three
is the first experimental chapter; it presents the largest study of human sign-tracking to date,
assessed via the additional singleton tracking task (ASTT). Results revealed a sign-tracking
effect in a sample of social drinkers; however, no association to individual differences (e.g.,
weekly alcohol consumption, impulsivity etc.) was found. This study suggests that human
sign-tracking is real, automatic, and driven by pavlovian conditioning.
Chapter Four contains two alcohol priming experiments, the first testing a 0.3 g/kg dose,
the second a 0.6 g/kg dose. The lower dose, but not higher, magnified sign-tracking compared
to a control drink. Chapter Five used a novel variant of the ASTT which contained three
XII
(rather than the usual two) reward-associated distractor cues. Results revealed that sign-
tracking pertained only to the high-value and medium-value cues, with the low-value cue
seemingly being ignored. This study provides unique insight into how sign-tracking changes
in more complex reward displays. Chapter Six attempted to compare three sign-tracking
tasks: two variants of the ASTT and a Pavlovian-to-Instrumental Transfer (PIT) task.
However, all tasks failed to observe sign-tracking, perhaps due to boredom and/or fatigue
effects. Chapter Seven recruited participants from previous studies to complete the ASTT
while undergoing functional magnetic resonance imaging (fMRI). Results revealed
subcortical activations (namely in the striatum and other ‘reward-motivation’ structures) and
correlations with sign-tracking, though sign-tracking was found to be unstable over time.
Chapter Eight assessed the potential influence of covariates and confounds on sign-
tracking; participants’ gender, whether they believed they would obtain extra rewards for
good task performance and cues’ physical salience (regardless of value) were all shown to
have no significant effect on sign-tracking as measured by the ASTT. Chapter Nine showed
that sign-tracking is automatic/reflexive (as shown by quicker responses towards distractor
cues compared to target cues), that distractor cues of different value attract attention with the
same ‘force’ (as shown by identical reaction times [RTs] to the differently valued cues), and
that the two measures of sign-tracking in the ASTT – RTs and omissions – do not
consistently correlate. Chapter Ten reviews the methods, results, limitations and potential
applications of this research. This thesis suggests that humans attribute incentive value to
irrelevant, reward-associated cues, that this attribution can be exacerbated by low levels of
alcohol consumption, is unstable over time, and is associated with activity in the subcortical
‘value-driven attention networks’.
XIII
Declaration
No part of this work had previously been submitted in support of another application for a
degree or qualification at this or any other university or institution of learning.

XIV
Acknowledgments
1
Chapter One
General Introduction
_____________________________________
1.1 Drug and Alcohol Use: Estimates, Problems and Treatments
An estimated 4.9% of the world’s adult population (~240 million people) experience an
alcohol use disorder, which causes an estimated 257 disability-adjusted life years lost per
100,000. Alcohol, and tobacco, use are the most prevalent addictive behaviours and cause the
majority of the harm (Gowing et al., 2015). In England, approximately 9 million adults drink
at unsafe levels (defined as the consumption of >14 alcohol units per week on a regular basis,
with consumption of >8 units per drinking episode considered a drinking binge) (Department
of Health, 2016; National Health Service, 2016). An estimated 1.6 million suffer with an
alcohol use disorder, 70% of Accident & Emergency admissions at the weekend (between
midnight and 5 a.m.) are thought to be alcohol related, and around 21,000 deaths per annum
are directly attributable to alcohol. In England and Wales, approximately 49% of violent
crimes involve alcohol. The NHS incurs £3.5 billion annually in alcohol-related costs, with
the total annual cost to society estimated at £21 billion (Public Health England, 2014). It is
clear that alcohol misuse, abuse and dependence cause considerable individual and societal
harm.
Attempts at treating alcohol use disorders (AUDs) range from established practices such
as 12-step programmes (Donovan & Wells, 2007), talking therapies (Lancaster, Stead, Silagy,
& Sowden, 2000), pharmacotherapy (Elkashef & Montoya, in Verster, Brady, Galanter &
Conrod, 2012) and, typically, some combination of these (Stead & Lancaster, 2012). More
2
controversial and/or relatively modern efforts include deep brain stimulation (Yadid, Gispan,
& Lax, 2013), cognitive bias modification and cognitive control training (Wiers, Gladwin,
Hofmann, Salemink, & Ridderinkhof, 2013). The latter two approaches attempt to treat
dependence by focussing on sufferers’ automatic and executive cognitive processes (for a
review, see Field & Wiers, 2012). In the past few decades research into such cognitive
approaches has become ubiquitous, with many sub-components garnering particular
consideration (e.g., attentional bias) (Field et al., 2016; Field & Cox, 2008). One of the core
mechanisms by which such cognitive changes occur during drug use is conditioning; a
fundamental learning process key to the present thesis.
1.2 Conditioning
Alcohol is thought to constrain behaviour by influencing numerous facets of cognition,
potentially driving future cravings and alcohol-seeking behaviours (Gould, 2010). One aspect
of cognitive function affected by alcohol and which seems central in the development of
harmful and dependent drinking is learning; with some referring to addiction as a disease of
learning and memory (Hyman, 2005). Broadly, learning allows organisms to draw
connections between events (or objects, or agents, or knowledge) and select an appropriate
response to a situation, with repeated learning opportunities allowing for faster detection of
relevant stimuli and, therefore, faster action. Two distinct – but interrelated – types of
fundamental learning are pavlovian (classical) and instrumental (operant) conditioning.
The environment consists of I) stimuli which are inherently rewarding (unconditioned
stimuli [US] e.g., food, sex, warmth) and which elicit unconditioned responses (URs) in the
organism (e.g., salivation in response to food), and II) stimuli that have no salience to the
3
individual (neutral stimuli) (discussion of negative stimuli are omitted here). Pavlovian
conditioning is the process whereby previously neutral stimuli are repeatedly paired with a US
– thus becoming predictive of US availability – and develop salience. Such stimuli are termed
conditioned stimuli (CSs) and they can elicit a range of physiological, psychological and
behavioural responses (conditioned responses [CRs]) which may be similar or different (e.g.,
opponent processes; T. E. Robinson & Berridge, 2003) to the UR. In the original
demonstration, after repeated pairings of a bell (the CS) and food (the US), dogs produced the
same physiological (e.g., saliva production) and behavioural (e.g., excitatory behaviours)
responses to the sound of the bell as they did to the sight of the food (Pavlov, 1927).
Instrumental conditioning describes a learning process which operates on a response-
outcome basis, whereby positive outcomes reinforce behaviour and negative outcomes
(typically) diminish it (Skinner, 1938; Thorndike, 1898). For example, rats will repeatedly
press a lever when they have been trained that this response increases the likelihood of
rewards (or prevents punishment); conversely, subsequent aversive stimulation (e.g., electric
shocks) will typically diminish lever pressing. Although both classical and instrumental
learning processes can be studied separately, they can also be observed interacting together in
what is called Pavlovian-to-Instrumental Transfer (PIT) (Hogarth, Balleine, Corbit, &
Killcross, 2013).
PIT paradigms typically induce a CS-US pairing via pavlovian conditioning, before then
presenting an individual with the opportunity to produce a behaviour (e.g., lever pressing) in
order to obtain a reward in the absence of the CS. Crucially, the pavlovian and instrumental
learning procedures occur separately, before a transfer test is conducted. During this transfer
phase, presentation of the CS typically increases the rate of reward-related instrumental
responding, indicating increased motivation to obtain the reward (known as conditioned
4
motivation, see section 1.3.2.2). Such results show the CS exerting influence over behavioural
responses, and this occurs despite no direct association between the pavlovian and
instrumental contingencies. Such results have also been found in humans, with studies
showing that CSs can increase behavioural and neural responding towards drugs of abuse
(including alcohol) (Cartoni, Balleine, & Baldassarre, 2016; Corbit & Janak, 2016; Garbusow
et al., 2014; Hogarth, Balleine, et al., 2013; Hogarth, Field, & Rose, 2013; Martinovic et al.,
2014; Talmi, Seymour, Dayan, & Dolan, 2008).
Conditioning is typically monitored in two ways: attention and behavioural response.
Essentially, over time organisms learn to attend to salient stimuli (e.g., CSs) so that they may
act accordingly to gain reward or avoid punishment (USs). Therefore attention and behaviour
are seen as dual processes in some models of learning, whereby attention becomes ‘biased’
towards relevant stimuli before an appropriate behavioural response is coordinated
(Mackintosh, 1975). However, for several decades researchers have noted unexpected
behaviours in animals whereby attention becomes so focused on the CS that some animals
will actually forego real rewards (USs, such as food and drugs) in favour of approaching and
obtaining CSs (lights and levers). These behaviours were first observed under naturalistic
settings, before autoshaping paradigms (section 1.3.2) were employed to experimentally
examine such behaviours.
1.3 Sign-Tracking versus Goal-Tracking: Nonhuman Animals
1.3.1 Background
The first descriptions of sign-tracking behaviour were reported as early as 1937 (Zener, 1937)
before a later paper recounted how such CS-focussed behaviour was preventing the authors’
5
training of performance animals (Breland & Breland, 1961). In one example, pigs
successfully conditioned to deposit wooden coins in a ‘piggy bank’ would instead play with
and root the coins, very rarely depositing them as taught. Breland and Breland (1961) thought
this might just be the “dilly-dallying of an animal on a low drive” (p. 683); however, when the
animal’s drive was increased – its daily caloric intake was severely reduced – the behaviour
not only persisted, it intensified. Additionally, approach behaviours towards the CSs
mimicked species-specific consummatory behaviours, suggesting that the CS had itself
become rewarding. The researchers reported such observations in numerous species including
racoons, chickens, cockatoos, reindeer, porpoises and whales.
Such behaviours were initially referred to as instinctive drift (Breland & Breland, 1961)
and autoshaping (Brown & Jenkins, 1968), before the term sign-tracking was finally settled
upon (Hearst & Jenkins, 1974). Sign-tracking seems to develop over time in humans and
animals (Le Pelley, Pearson, Griffiths, & Beesley, 2015; Morrow, Saunders, Maren, &
Robinson, 2014) although not all individuals develop tendencies to sign-track. Individuals
who consistently attribute incentive salience to irrelevant, discrete, reward-associated cues are
referred to as sign-trackers (STs), while individuals who use such CSs merely to predict the
availability of reward are referred to as goal-trackers (GTs). GTs have, however, been shown
to imbue incentive value to contextual, rather than discrete, CSs (e.g., to entire environments
such as cages) (T. E. Robinson, Yager, Cogan, & Saunders, 2014). Individuals who do not
display a particular preference for either type of tracking are typically referred to as member
of an intermediate group (IGs) (Lomanowska et al., 2011).
There is a growing literature surrounding tracking behaviours, which became interesting
to addiction researchers in the 1990’s when similarities between sign-tracking and drug use
disorders emerged. One researcher documents seven such similarities (Tomie, 1995, 1996):
6
• Excessive responding: Spatial and/or temporal contiguity of the reward (US) and
signal (CS, or response manipulandum e.g., a lever) induces excessive instrumental
responding towards the signal/manipulandum.
• Responses resemble appetitive-consummatory behaviours: Signal-directed behaviours
typically resemble species-specific appetitive-consummatory behaviours, as described
by Breland and Breland’s (1961) ‘instinctive drift’.
• Responding is refractory to instrumental contingency: Excessive responding towards
reward-independent stimuli persists even though unnecessary to obtaining reward.
• Maladaptive: Excessive responding can actually impair ability to obtain reward.
Additionally, such behaviour is known to intensify when the incentives to obtain
reward (e.g., to eat for survival) are higher. This and the previous point show that sign-
tracking is, to some extent at least, resistant to negative consequences.
• Uncontrollable: Given the previous two points, sign-tracking would appear to not be
consciously controlled.
• Compulsive: Given the above, such behaviour seems necessarily compulsive.
• Stimulus-bound: Compulsive, uncontrollable responding occurs only in the presence of
the reward-associated signal, never in its absence1.
1 Note that more recent work has shown that STs’ behaviour can differ from GTs’ even in the absence of the CS (Saunders & Robinson, 2011) (see section 1.3.3.2).
7
These initial observations were made in semi-naturalistic settings (predominantly in zoo and
circus animals etc.), but laboratory-based investigations also upheld the Brelands’ original
interpretation, that these behaviours could not be explained by simple instrumental
conditioning procedures. (However, it should be noted that definitive conclusions as to the
driving force of sign-tracking are still yet to be drawn, which will be discussed further,
below.) Several of these characteristics have clear similarities to diagnostic criteria for AUD,
such as “drinking more or for longer than intended… tried to cut down, but couldn’t”
(compulsive), “continued even though it was causing trouble” (maladaptive, uncontrollable)
etc. (DSM-V, 2013). Initially, the evidence linking tracking behaviours with substance misuse
came from the preclinical literature. The next section outlines the preclinical work which
initially associated tracking behaviour with substance misuse.
1.3.2 Autoshaping procedures
1.3.2.1 Background
One of the first experimental investigations into tracking behaviours, using an autoshaping
paradigm, found that Breland and Breland’s (1961) original naturalistic observations were
generally supported (Boakes, Poli, Lockwood, & Goodall, 1978). For example, they found
that in an autoshaping procedure in which rats had to deposit ball-bearings into a hole, some
of the rats became slow to relinquish the balls and would chew on them before they were
released, despite extensive training (instrumental conditioning) to the contrary. Other
observations were only partially supported; for example, the Brelands’ claim that food
deprivation caused their trained pigs to sign-track more intensely was not supported, but their
8
experiments did show that deprivation did not diminish sign-tracking behaviours2 (this was
also found in perhaps the first study to investigate the effect of omission contingencies on
sign-tracking, Williams & Williams, 1969). However, more recent evidence suggests that
both sign-tracking and goal-tracking can be increased by restricting food access, but that the
effect is moderated by other factors including age (adolescent versus adult) and social
environment (isolation versus no isolation). For example, paired adults sign-tracked more
than paired adolescents (no difference between isolated age groups), adolescents who were
food deprived and isolated increased sign-tracking, whereas adolescents who were food
deprived and paired increased goal-tracking (Anderson, Bush & Spear, 2013). It seems that
tracking behaviours may have more complex underpinnings than was initially thought.
1.3.2.2 Differential responding between tracker types
It is important to provide an overview of autoshaping procedures in nonhuman animals as it
will allow for a detailed comparison between the animal and human measures presented both
in this, and future, chapters. Traditional pavlovian autoshaping paradigms employed for
laboratory animals (typically rats, mice and pigeons) briefly run as follows: a US (food or
drug reward) is repeatedly paired with a noncontingent3 discrete CS (light, lever etc.). Via
contiguous presentation, and though the administration of the US is independent of any CS
response, some animals, some of the time display autoshaping – or sign-tracking – behaviours
2 Note that some of the outcome measures in Boakes et al’s (1978, p. 119) work were influenced by deprivation, such as “’lost ball’ times”; however such outcomes do not seem particularly robust measures of sign-tracking and have not stood the test of time in most of the recent literature. Crucially, the outcome measure of how long it took rats to deposit the ball (CS) was not affected by deprivation, and similar measures are still used in virtually every autoshaping procedure today. 3 ‘Reward-noncontingent’ or simply ‘noncontingent’ refers to a cue that does not require any action or attention for the US to be delivered. Conversely, ‘contingent’ cues require actions for the US to be delivered. CSs in autoshaping procedures are noncontingent and so ‘noncontingent’ shall be omitted for brevity; however, any situations in which they are contingent shall be stated explicitly.
9
(Meneses, 2003)4. However, there are variations in setup between studies which have been
found to alter the likelihood and/or strength of sign-tracking (as well as general perception,
attention and behaviour) (Pessoa, 2014a), some of which are reviewed below.
In terms of typical responding during autoshaping procedures, STs and GTs differ in a
number of ways. When exposed to the CS, STs show greater approach frequency towards the
CS (or US response manipulandum), with shorter latencies in their approach, while GTs show
the same pattern in frequency and latency, but towards the US (Flagel, Akil, & Robinson,
2009; Flagel, Watson, Robinson, & Akil, 2007). Additionally, STs are willing to work – via
consistent instrumental responding on a response manipulandum – to obtain exposure to a
reward-paired CS, while GTs are not (Lomanowska et al., 2011; Saunders & Robinson,
2010). Crucially, all of these differences in responding have been shown in autoshaping
procedures employing both food and various substances such as cocaine, amphetamines,
opioids and ethanol (Robinson et al., 2014; Tomie, Grimes, & Pohorecky, 2008).
1.3.2.3 Influence of experimental setup on outcome
The above overview of the differences in the sign-tracking and goal-tracking conditioned
responses (CRs) refer to responding under typical autoshaping procedures; however, there are
a wide range of experimental manipulations which can alter CRs. Some of these are detailed
below.
4 It should be noted that ‘autoshaping’ is actually a misnomer as sign-tracking responses are not ‘shaped’, they often arise in spite of training to the contrary, termed ‘negative automaintenance’ (Hearst & Jenkins, 1974). However, given the popularity of the term, autoshaping will be used synonymously when referring to the paradigmatic setup.
10
Stimulus presentation order: Brown and Jenkins (1968) showed that when presented in a
‘forward-pairing’ – CS before US – fashion, all pigeons sign-tracked toward the CS (a key-
light) to some extent. However, of 12 pigeons exposed to ‘reverse-paired’ stimuli – US before
CS – only 2 sign-tracked, and to a much lesser degree than those in the forward-pairing group.
Additionally, if the key-light was constantly on (CS always present) and food (the US) was
administered intermittently, sign-tracking took longer to emerge, developed to a lesser extent,
and in only a minority of animals. This highlights the importance of the CS’s predictive utility
(see below).
CS-US spatial proximity: When three pigeons were exposed to an autoshaping procedure
using a short (22 cm) CS-US distance, all showed consistent sign-tracking behaviours (e.g.,
close proximity to and behavioural action towards the CS), but when exposed to a longer CS-
US distance (60 cm), only goal-tracking was observed (e.g., close proximity to and
behavioural action towards the area of US administration) (Silva, Silva, & Pear, 1992).
Distances in between (e.g., 42 cm) produced intermediate responses. However, it has been
shown that sign-tracking behaviours are still observed even when the CS is located in the
opposite direction to the US (Brown & Jenkins, 1968), indicating that sign-tracking can still
emerge when the CS and US are in relatively distinct locations. It has also been shown that
vertical location is important – CSs located atop a cage are more likely to be sign-tracked than
CSs below it (Holland, 1977).
CS-US temporal proximity: Temporally distal serial CS elements – in this case, the first
of many levers successively inserted into a cage to predict the onset of a food US (in a
countdown-like fashion) – were more likely to be sign-tracked than temporally proximate CS
elements (Silva, Timberlake, & Gont, 1998). Conversely, temporally proximate CS elements
– the last lever inserted into the cage immediately before US administration – were more
11
likely to induce goal-tracking responses towards the food tray. These results show how
important stimulus timings can be when conditioning a CS-US contingency. Crucially, Silva
et al. (1998) show that both spatial and temporal features are important and can interact,
meaning that spatiotemporal characteristics of CS-US parings must be considered in
autoshaping paradigms.
CS-US predictive strength: CSs are not always reliably predictive of USs, a fact used to
investigate how reward uncertainty relates to sign-tracking. When CSs predict US onset only
50% of the time, sign-tracking increases (and at the expense of goal-tracking) relative to CSs
that are 100% predictive (Robinson, Anselme, Fischer, & Berridge, 2014; Robinson,
Anselme, Suchomel, & Berridge, 2015). This suggests that the incentive value of a CS during
autoshaping procedures may become dissociated from its predictive value (as the CS is still
incentivised even when lacking predictive validity), which is supported by neurological
evidence revealing that prediction and incentive salience are controlled by separate neural
circuits (Smith, Berridge, & Aldridge, 2011).
US/CS modality: Stimulus type is broader than the previous paradigm features; covering
whether the US is food or drugs, whether the CS can be classified as discrete, contextual or
interoceptive, and whether the CS is a visual or auditory cue. The influence of US specificity
will be discussed in sections 1.3.3.3 and 1.3.3.4, here I shall focus on general and specific cue
types.
The sensory features (i.e., physical or perceptual properties) of a cue have been found to
affect responses in autoshaping procedures (Singer, Bryan, et al., 2016). For example, Cleland
and Davey (1983) found that rats exposed to a visual CS (a white light) would, after repeated
CS-US pairings, consistently sign-track towards the CS. Conversely, when the CS was a
localizable auditory tone, virtually all sign-tracking disappeared. Crucially, rats did approach
12
the area of the auditory CS when this resulted in instrumental reinforcement (i.e., when they
were directly rewarded for doing so), indicating that they could locate and approach the cue.
More recent work shows that localizable auditory cues reinstate cocaine-seeking equally well
in STs and GTs, indicating that cue modality can determine whether and which individuals
may be influenced by that cue (Pitchers, Wood, Skrzynski, Robinson, & Sarter, 2017).
Finally, general cue modality has been recognised as one of the most important and influential
aspects of autoshaping procedures there is – the three types examined here are discrete,
contextual and interoceptive.
Discrete: As mentioned, discrete, localizable cues reliably induce incentivised approach
behaviour to CSs in some subset of animals. Recent research has shown that animals who
sign-track towards discrete, food-paired CSs (STs) also sign-track towards discrete drug
(cocaine and opioid) CSs, while GTs do not (Flagel, Akil, et al., 2009; Meyer, Ma, &
Robinson, 2012; Saunders & Robinson, 2010; Saunders, Yager, & Robinson, 2013; Yager,
Pitchers, Flagel, & Robinson, 2015; Yager & Robinson, 2013).
Contextual: In opposition to discrete cues, contextual cues (e.g., a particular cage) induce
greater renewed extinguished cocaine seeking and psychomotor sensitisation (see section
1.3.2.2) in GTs compared to STs (Saunders, Aurbach, & Robinson, 2012; Saunders,
O’Donnell, Aurbach, & Robinson, 2014), indicating that GTs do imbue cues with incentive
salience, but only contextual ones.
Interoceptive: Research has shown that interoceptive cues – the pharmacological and/or
psychological effects of substances – evoke greater instrumental responding in STs compared
to GTs during US (drug) extinction. In these particular setups, instrumental responding is an
indication of drug seeking. For example, a priming dose of cocaine induces increased cocaine

13
seeking, even when the cocaine is not available, in STs compared to GTs (Saunders &
Robinson, 2011).
1.3.2.4 Autoshaping Outcome Measures
There are three key measures when assessing a CS’s ability to elicit sign-tracking:
conditioned approach, conditioned reinforcement and conditioned motivation (Robinson,
Yager, Cogan, & Saunders, 2014):
• Conditioned approach: A noncontingent CS’s ability to elicit approach behaviour
towards it in much the same way as the US typically does.
• Conditioned reinforcement: A reward-paired CS’s (e.g., light) ability to prompt
instrumental responses (e.g., lever pressing) to obtain its presentation in the absence of
the US, but after repeated pairings with the US. For example, Anderson and Spear
(2011) showed that (some) rats will repeatedly nose poke in order to gain access to an
illuminated lever (noncontingent CS).
• Conditioned motivation: Typically studied via PIT paradigms in which a US is
contingent on an instrumental response (e.g., lever pressing) in one session, while in
another session a noncontingent CS is paired with the US. Conditioned motivation is
observed if the CS, presented alongside the lever for the first time, increases
instrumental responding towards the lever (response manipulandum) in order to obtain
the US, even though the two have never been directly paired.
14
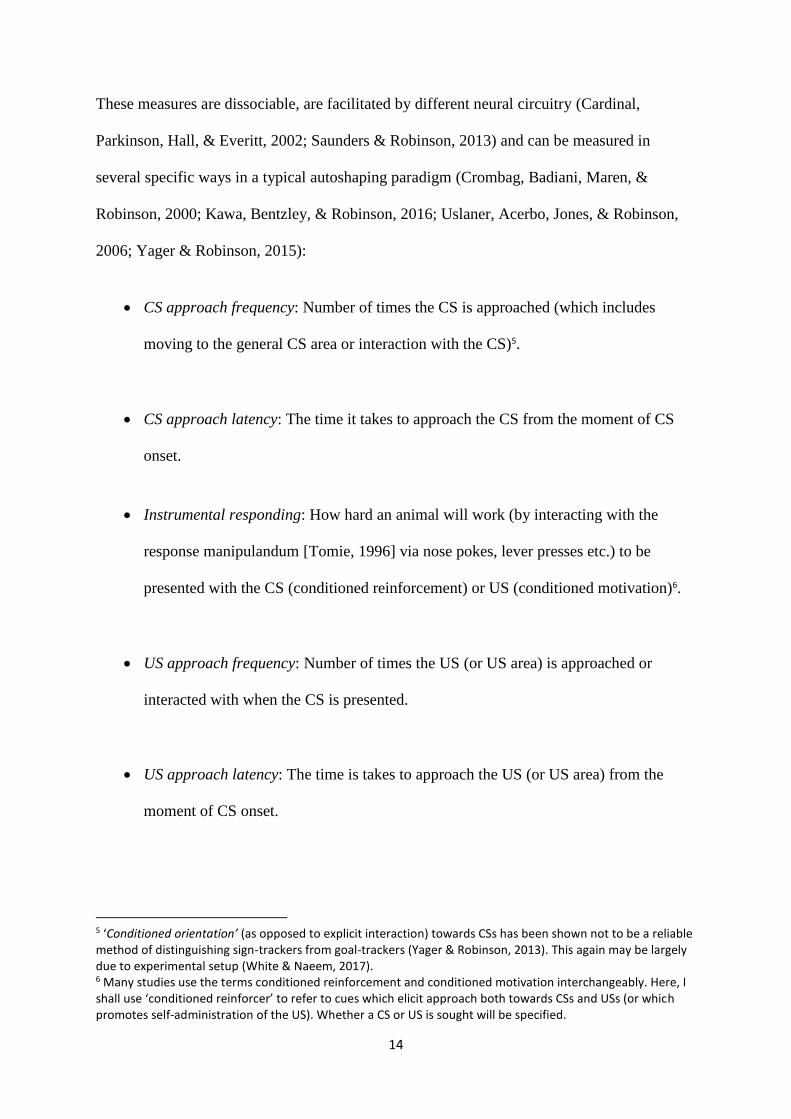
These measures are dissociable, are facilitated by different neural circuitry (Cardinal,
Parkinson, Hall, & Everitt, 2002; Saunders & Robinson, 2013) and can be measured in
several specific ways in a typical autoshaping paradigm (Crombag, Badiani, Maren, &
Robinson, 2000; Kawa, Bentzley, & Robinson, 2016; Uslaner, Acerbo, Jones, & Robinson,
2006; Yager & Robinson, 2015):
• CS approach frequency: Number of times the CS is approached (which includes
moving to the general CS area or interaction with the CS)5.
• CS approach latency: The time it takes to approach the CS from the moment of CS
onset.
• Instrumental responding: How hard an animal will work (by interacting with the
response manipulandum [Tomie, 1996] via nose pokes, lever presses etc.) to be
presented with the CS (conditioned reinforcement) or US (conditioned motivation)6.
• US approach frequency: Number of times the US (or US area) is approached or
interacted with when the CS is presented.
• US approach latency: The time is takes to approach the US (or US area) from the
moment of CS onset.
5 ‘Conditioned orientation’ (as opposed to explicit interaction) towards CSs has been shown not to be a reliable method of distinguishing sign-trackers from goal-trackers (Yager & Robinson, 2013). This again may be largely due to experimental setup (White & Naeem, 2017). 6 Many studies use the terms conditioned reinforcement and conditioned motivation interchangeably. Here, I shall use ‘conditioned reinforcer’ to refer to cues which elicit approach both towards CSs and USs (or which promotes self-administration of the US). Whether a CS or US is sought will be specified.
15
• Psychomotor activity/sensitisation: The ability of a psychostimulant to produce
locomotor activity or drug-paired CS to promote locomotor activity (termed ‘cross-
sensitisation’). This can be acute (activity) or prolonged and progressive after repeated
administration (sensitisation), the latter being suggested as a form of neurobiological
plasticity hypothesised to play a role in addiction.
• Incentive-sensitisation: The ability of a substance to elicit progressive demand from an
individual, even in the face of increased effort for diminishing returns or even aversive
consequences (e.g., an electrified floor must be crossed to obtain the drug or even the
drug-related cue).
1.3.3 Correlates of Sign-Tracking and Goal-Tracking
Much of the research on tracking behaviour – and especially the individual differences related
to tracking – has focussed on sign-tracking in a single sample, without any contrast with goal-
tracking in a comparative group. Thus, section 1.3.3.1 will outline findings from preclinical
studies which did not explicitly distinguish sign-trackers from goal-trackers before testing
them under autoshaping procedures, but rather is an overview of research which simply
correlated general sign-tracking with individual differences. Section 1.3.3.2 presents evidence
of individual differences between tracking groups.
1.3.3.1 Correlates of Sign-Tracking
Drugs
16
This section will review the evidence for the association between sign-tracking in a general
animal population and drug consumption, the propensity to drug seek and vulnerability for
substance sensitisation.
In perhaps the earliest experimental investigation into whether sign-tracking CRs are
related to drug consumption, researchers found that autoshaping procedures resulted in high
rates of alcohol consumption when ethanol was paired with a saccharine solution, though was
maintained when saccharine was faded out (Tomie, di Poce, Derenzo, & Pohorecky, 2002). In
a similar setup, Tomie’s group replicated these findings, with rats consuming both water and
(sweetened and unsweetened) ethanol during CS presentation, though the ethanol group
consumed significantly more overall (Tomie, Sparta, et al., 2002; Tomie, Wong, Apor,
Patterson-Buckendahl, & Pohorecky, 2003). Other studies have shown CS-induced
instrumental responding for sweetened and unsweetened ethanol when that CS was previously
paired with ethanol (Krank, 2003; Krank, O’Neill, Squarey, & Jacob, 2008), and others have
shown that the level of sweetened ethanol consumption is predictive of the extent of sign-
tracking (Tomie, Festa, Sparta, & Pohorecky, 2003). Further work has shown that cues paired
with unsweetened ethanol can rapidly become incentivised (Cunningham & Patel, 2007; Srey,
Maddux, & Chaudhri, 2015). Recent research has solidified the positive correlation between
sign-tracking and ethanol-seeking and/or intake (R. I. Anderson & Spear, 2011; Maddux &
Chaudhri, 2017). In addition, discrete ethanol-paired cues can invoke greater ethanol-seeking
in alcohol-paired contexts than in non-alcohol contexts (Sciascia, Reese, Janak, & Chaudhri,
2015).
An early study using cocaine as a reward in an autoshaping paradigm showed that, unlike
other paired rewards, a cocaine CS failed to elicit a sign-tracking response (Kearns & Weiss,
2004). However, more recent work has shown that discrete cues paired with intravenous
17
cocaine administration do elicit sign-tracking approach behaviours towards them, and with
increasing rapidity over time (Uslaner et al., 2006). Cocaine cues also act as effective
conditioned reinforcers, prompting an increase in cocaine seeking (Yager & Robinson, 2013).
Research has also shown a direct correlation between sign-tracking and cocaine self-
administration (Beckmann, Marusich, Gipson, & Bardo, 2011), with a recent study showing
that a cocaine-paired cue elicited sign-tracking and was able to promote cocaine-seeking in
Rhesus monkeys (Reilly, Berndt, & Woods, 2016). Amphetamine studies employing similar
procedures have shown that rats more vulnerable to amphetamine sensitisation are also more
likely to sign-track (M. J. F. Robinson, Anselme, et al., 2015).
Finally, though not a drug, it is worth noting that evidence suggests that the tendency to
sign-track is also correlated with increased effort to obtain food-paired cues (Tomie, Aguado,
Pohorecky, & Benjamin, 2000). Recent work has shown that rats susceptible to developing a
sign-tracking CR were also susceptible to developing obesity, and these same obese rats who
sign-tracked showed an increased willingness to work for the presentation of a sucrose-paired
cue (M. J. F. Robinson, Burghardt, et al., 2015). Overall, these studies suggest that sign-
tracking propensity in a general animal population is associated with increased substance
seeking, consumption and sensitisation (when exposed to a reward-associated cue).
Personality Characteristics
Several experiments have acquired data on how sign-tracking relates to non-drug-related
individual differences in ‘personality’ or behavioural proclivities in animals. These
associations cover traits and states such as impulsivity, inattention, and variability in stress
response.
18
In an early investigation, rats from two populations were compared on their sign-tracking
CRs. Rats from the ‘sensitive group’ were more impulsive and more flexible in their
behavioural responses than were members of the ‘insensitive group’. Results revealed that
members of the sensitive group were more likely to perform sign-tracking CRs, with more
impulsive individuals acquiring sign-tracking in fewer trials (Tomie, Aguado, Pohorecky, &
Benjamin, 1998). In a more recent study, selectively bred high-responder rats (bHRs) and
low-responder rats (bLRs) (rats which show either high locomotor activity or are inhibited in
response to a novel environment, respectively) were exposed to a typical sign-tracking
paradigm. The results revealed that bHRs, but not bLRs, attributed incentive value to a food-
or cocaine-related cue, with bHRs also showing less impulsivity on a measure of ‘impulsive
choice’, but were more impulsive on a measure of ‘impulsive action’ (i.e., they showed
difficulty withholding a response to receive a reward, an animal equivalent of behavioural
disinhibition) (Flagel, Robinson, et al., 2010). This result was replicated in animals strictly
classified as STs and GTs (Lovic, Saunders, Yager, & Robinson, 2012). Perhaps related to
such disinhibition, sign-tracking was found to be inversely correlated with attention as
measured on a sustained attention task (SAT). That is, the greater the sign-tracking, the lower
the attentional performance (Paolone, Angelakos, Meyer, Robinson, & Sarter, 2013).
In addition to sign-tracking studies on impulsivity, research has also measured sign-
tracking’s association to novelty preference. In one study researchers tested rats on novelty
place preference and inescapable novelty tasks (measure of novelty-seeking) as well as a
pavlovian approach task (autoshaping paradigm) for a food-paired cue. Results revealed that
the extent to which rats attributed incentive salience to the food-paired cue (i.e., sign-tracked)
was positively correlated with novelty-seeking (Beckmann et al., 2011). In a later study using
larger, highly diverse mouse populations, sign-tracking and novelty reactivity were found to
be genetically correlated (though only in males) (Dickson et al., 2015). Finally, in
19
autoshaping paradigms in which stress response was also measured, rats who more quickly
developed a sign-tracking CR showed higher stress-induced corticosterone release (Tomie et
al., 2000). A later study suggested that corticosterone release is a physiological endocrine
pavlovian CR induced by autoshaping procedures and may be indicative of general arousal
rather than fear or stress specifically. However, in this study corticosterone release was not
correlated with the extent of sign-tracking behaviours (Tomie, Silberman, Williams, &
Pohorecky, 2002). Similar results were also obtained by the same group a couple of years
later, with the additional finding that epinephrine (adrenaline) is also induced by the
autoshaping/sign-tracking paradigm (Tomie, Tirado, Yu, & Pohorecky, 2004); however, see
the authors’ discussion for issues with interpretation of these results. Overall, these results
suggest that sign-tracking in general animal populations is associated with impulsive action,
inattention, novelty-seeking and a heightened stress response; all of which have been
implicated in addiction-related tendencies.
1.3.3.2 Individual differences between tracking groups: Sign-Trackers vs. Goal-Trackers
This section will outline individual differences between STs and GTs.
Drugs
Studies which attempt to investigate how drugs affect the different tracking phenotypes
employ a range of procedures, though these can be briefly summarised. First, individuals are
characterised into STs or GTs based on a typical pavlovian autoshaping paradigm employing
food as a response-independent US and a typical discrete cue as the reward-paired CS (e.g.,
20
light). Second, an additional autoshaping procedure is completed, this time using a different
CS (e.g., lever) and a drug as the US (response dependent or independent, depending on the
particular procedure and measurements carried out). During this second round of pavlovian
conditioning, researchers measure some or all of the following: I) the ability of the drug-
paired CS to a) elicit approach, b) to maintain or promote drug seeking or self-administration
(i.e., to act as a conditioned reinforcer), c) to promote reinstatement of drug use after
extinction, or II) whether tracking phenotypes differ in their vulnerability to drug
sensitisation. Experimental studies employing sign-tracking drug paradigms have been
performed since at least 2009, mostly using cocaine as its relatively short half-life means that
repeated CS-US pairings can be conducted more efficiently (Meyer, Cogan, & Robinson,
2014). However, studies have also administered ethanol, nicotine, and opioids.
In perhaps the first study to distinguish between tracking phenotypes before assessing
drug responsivity, researchers found that GTs were more sensitive than STs to the acute
locomotor activating effects of cocaine, while STs showed a higher tendency for psychomotor
sensitisation upon repeated administration (Flagel, Watson, Akil, & Robinson, 2009). Another
study showed that, even though groups did not differ in the acquisition of cocaine self-
administration, removal of a cocaine-paired CS significantly reduced cocaine self-
administration in STs – by up to 50% – but not GTs (Saunders & Robinson, 2010).
Additionally, the extent of sign-tracking in STs was strongly positively correlated with the
influence of the CS over their cocaine consumption. A subsequent study showed that rats
classified as STs worked nearly twice as hard (via repeated nose pokes) as GTs to obtain a
cocaine reward, even in the absence of a discrete CS (Saunders & Robinson, 2011). This
indicates that STs may generally be more motivated to obtain rewards even in the absence of
an incentivised cue. The authors also found that STs primed with an injection of cocaine
showed more robust reinstatement of cocaine-seeking after extinction training than GTs, and
21
that this was strongly positively correlated with how hard STs worked to acquire cocaine in a
previous portion of the study. These results suggest that STs are not only more likely to be
motivated to obtain further cocaine rewards by discrete, exteroceptive cues, but also by
unconditioned, interoceptive cues (i.e., cocaine effects).
Research has also shown that localised cocaine-paired CSs elicit greater CS approach and
effectively act to reinstate drug-seeking during extinction procedures (i.e., act as conditioned
reinforcers) in STs but not GTs (or at least in STs to a much greater degree) (Yager &
Robinson, 2013). More recent data has shown that sign-tracking is the first known
behavioural predictor of increased cocaine choice (over food) in rats (Tunstall & Kearns,
2015), and STs are more motivated than GTs to take cocaine after limited drug exposure,
which may increase their vulnerability for incentive-sensitisation (Kawa et al., 2016).
In a slightly different experimental setup aiming to explain such findings, researchers
found that STs, but not GTs, showed a conditioned place preference for a floor type (grid
versus hole) previously paired with the administration of cocaine (Meyer, Ma, et al., 2012)7.
Importantly, STs produced more frequency-modulated ultrasonic vocalisations (USVs) than
GTs following a single injection of cocaine, as well as during the overall cocaine conditioning
period. These vocalisations indicate heightened euphoria, which means that the preferences of
STs for cocaine-paired CSs may be driven by greater levels of unconditioned reward (i.e.,
‘liking’), relative to GTs. More recent results have replicated this finding, with STs producing
5–24 times more cocaine-induced USVs than GTs, a response which became sensitised only
in STs with repeated cocaine injections (Tripi, Dent, & Meyer, 2016).
7 This may appear to be a contextual cue [place preference], but the salient feature of this CS was the tactile nature of the floor which is a specific feature of the environment, much like the colour or location of a light CS or the shape and size of a lever CS.
22
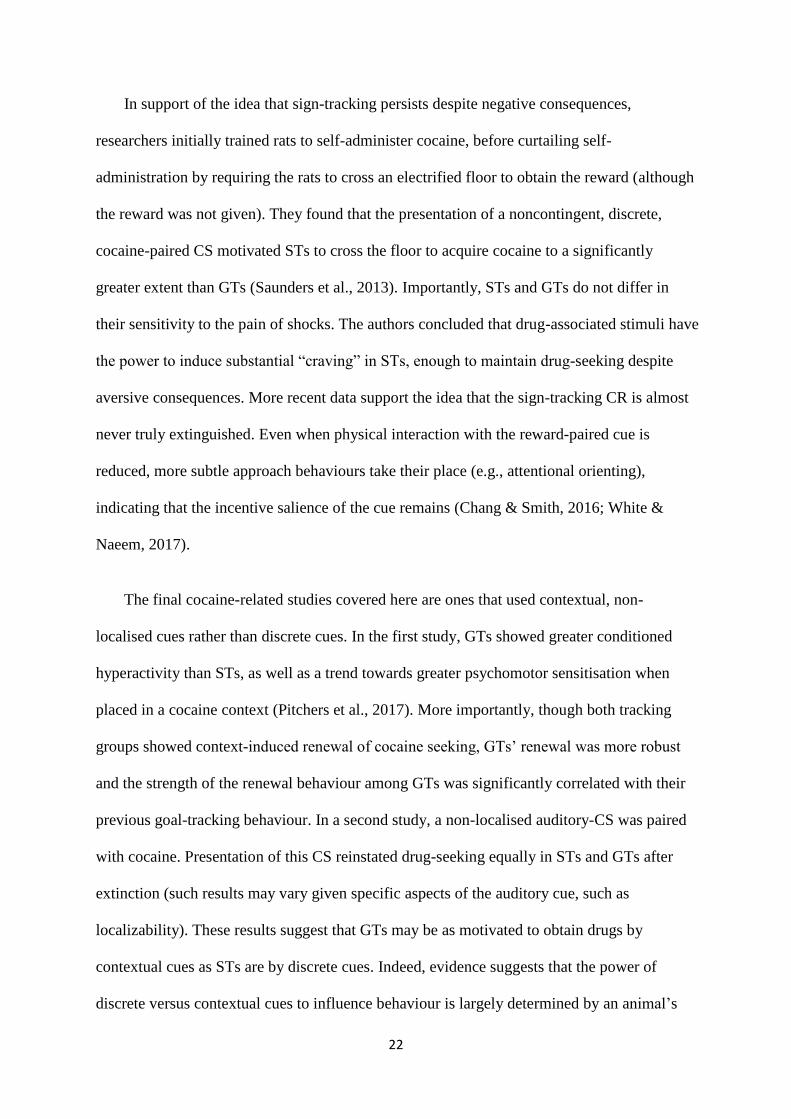
In support of the idea that sign-tracking persists despite negative consequences,
researchers initially trained rats to self-administer cocaine, before curtailing self-
administration by requiring the rats to cross an electrified floor to obtain the reward (although
the reward was not given). They found that the presentation of a noncontingent, discrete,
cocaine-paired CS motivated STs to cross the floor to acquire cocaine to a significantly
greater extent than GTs (Saunders et al., 2013). Importantly, STs and GTs do not differ in
their sensitivity to the pain of shocks. The authors concluded that drug-associated stimuli have
the power to induce substantial “craving” in STs, enough to maintain drug-seeking despite
aversive consequences. More recent data support the idea that the sign-tracking CR is almost
never truly extinguished. Even when physical interaction with the reward-paired cue is
reduced, more subtle approach behaviours take their place (e.g., attentional orienting),
indicating that the incentive salience of the cue remains (Chang & Smith, 2016; White &
Naeem, 2017).
The final cocaine-related studies covered here are ones that used contextual, non-
localised cues rather than discrete cues. In the first study, GTs showed greater conditioned
hyperactivity than STs, as well as a trend towards greater psychomotor sensitisation when
placed in a cocaine context (Pitchers et al., 2017). More importantly, though both tracking
groups showed context-induced renewal of cocaine seeking, GTs’ renewal was more robust
and the strength of the renewal behaviour among GTs was significantly correlated with their
previous goal-tracking behaviour. In a second study, a non-localised auditory-CS was paired
with cocaine. Presentation of this CS reinstated drug-seeking equally in STs and GTs after
extinction (such results may vary given specific aspects of the auditory cue, such as
localizability). These results suggest that GTs may be as motivated to obtain drugs by
contextual cues as STs are by discrete cues. Indeed, evidence suggests that the power of
discrete versus contextual cues to influence behaviour is largely determined by an animal’s
23
specific neural circuitry (Khoo, Gibson, & Prasad, 2017; T. E. Robinson et al., 2014;
Saunders et al., 2014).
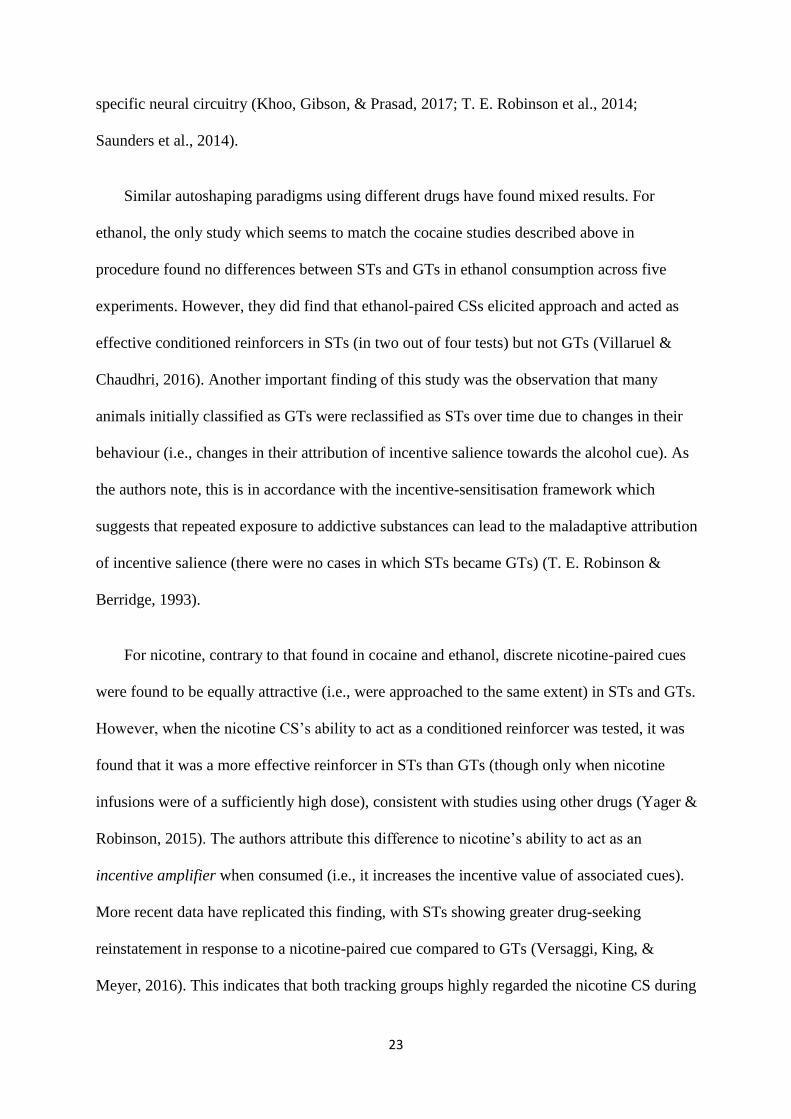
Similar autoshaping paradigms using different drugs have found mixed results. For
ethanol, the only study which seems to match the cocaine studies described above in
procedure found no differences between STs and GTs in ethanol consumption across five
experiments. However, they did find that ethanol-paired CSs elicited approach and acted as
effective conditioned reinforcers in STs (in two out of four tests) but not GTs (Villaruel &
Chaudhri, 2016). Another important finding of this study was the observation that many
animals initially classified as GTs were reclassified as STs over time due to changes in their
behaviour (i.e., changes in their attribution of incentive salience towards the alcohol cue). As
the authors note, this is in accordance with the incentive-sensitisation framework which
suggests that repeated exposure to addictive substances can lead to the maladaptive attribution
of incentive salience (there were no cases in which STs became GTs) (T. E. Robinson &
Berridge, 1993).
For nicotine, contrary to that found in cocaine and ethanol, discrete nicotine-paired cues
were found to be equally attractive (i.e., were approached to the same extent) in STs and GTs.
However, when the nicotine CS’s ability to act as a conditioned reinforcer was tested, it was
found that it was a more effective reinforcer in STs than GTs (though only when nicotine
infusions were of a sufficiently high dose), consistent with studies using other drugs (Yager &
Robinson, 2015). The authors attribute this difference to nicotine’s ability to act as an
incentive amplifier when consumed (i.e., it increases the incentive value of associated cues).
More recent data have replicated this finding, with STs showing greater drug-seeking
reinstatement in response to a nicotine-paired cue compared to GTs (Versaggi, King, &
Meyer, 2016). This indicates that both tracking groups highly regarded the nicotine CS during
24
nicotine infusion (and thus approached it), but in nicotine’s absence the associated CS was
more likely to act as a reinforcer in STs than GTs as, at baseline, STs incentivise discrete cues
more than GTs.
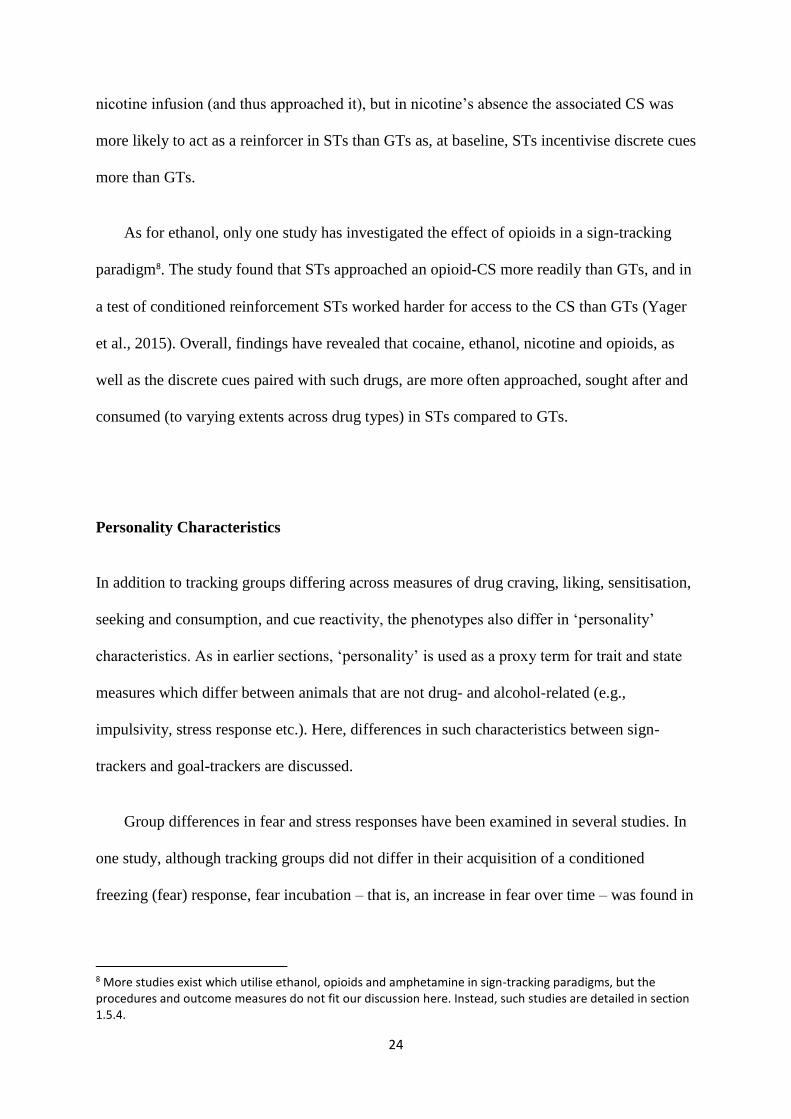
As for ethanol, only one study has investigated the effect of opioids in a sign-tracking
paradigm8. The study found that STs approached an opioid-CS more readily than GTs, and in
a test of conditioned reinforcement STs worked harder for access to the CS than GTs (Yager
et al., 2015). Overall, findings have revealed that cocaine, ethanol, nicotine and opioids, as
well as the discrete cues paired with such drugs, are more often approached, sought after and
consumed (to varying extents across drug types) in STs compared to GTs.
Personality Characteristics
In addition to tracking groups differing across measures of drug craving, liking, sensitisation,
seeking and consumption, and cue reactivity, the phenotypes also differ in ‘personality’
characteristics. As in earlier sections, ‘personality’ is used as a proxy term for trait and state
measures which differ between animals that are not drug- and alcohol-related (e.g.,
impulsivity, stress response etc.). Here, differences in such characteristics between sign-
trackers and goal-trackers are discussed.
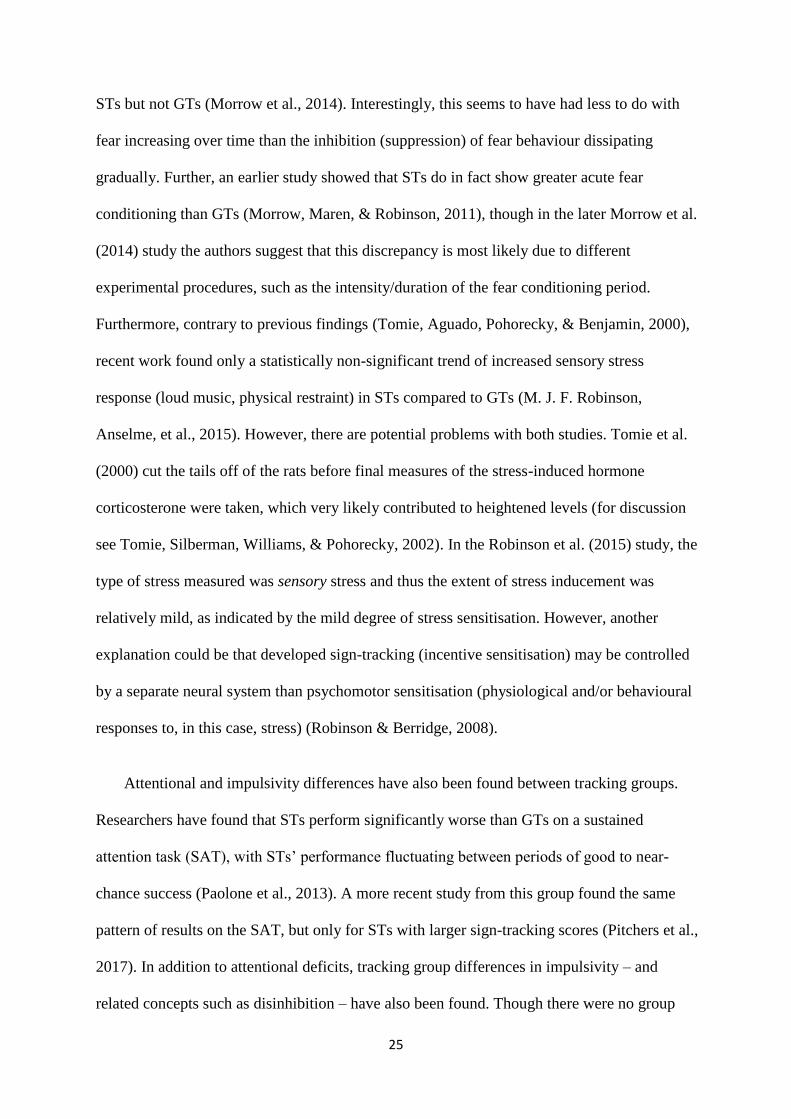
Group differences in fear and stress responses have been examined in several studies. In
one study, although tracking groups did not differ in their acquisition of a conditioned
freezing (fear) response, fear incubation – that is, an increase in fear over time – was found in
8 More studies exist which utilise ethanol, opioids and amphetamine in sign-tracking paradigms, but the procedures and outcome measures do not fit our discussion here. Instead, such studies are detailed in section 1.5.4.
25
STs but not GTs (Morrow et al., 2014). Interestingly, this seems to have had less to do with
fear increasing over time than the inhibition (suppression) of fear behaviour dissipating
gradually. Further, an earlier study showed that STs do in fact show greater acute fear
conditioning than GTs (Morrow, Maren, & Robinson, 2011), though in the later Morrow et al.
(2014) study the authors suggest that this discrepancy is most likely due to different
experimental procedures, such as the intensity/duration of the fear conditioning period.
Furthermore, contrary to previous findings (Tomie, Aguado, Pohorecky, & Benjamin, 2000),
recent work found only a statistically non-significant trend of increased sensory stress
response (loud music, physical restraint) in STs compared to GTs (M. J. F. Robinson,
Anselme, et al., 2015). However, there are potential problems with both studies. Tomie et al.
(2000) cut the tails off of the rats before final measures of the stress-induced hormone
corticosterone were taken, which very likely contributed to heightened levels (for discussion
see Tomie, Silberman, Williams, & Pohorecky, 2002). In the Robinson et al. (2015) study, the
type of stress measured was sensory stress and thus the extent of stress inducement was
relatively mild, as indicated by the mild degree of stress sensitisation. However, another
explanation could be that developed sign-tracking (incentive sensitisation) may be controlled
by a separate neural system than psychomotor sensitisation (physiological and/or behavioural
responses to, in this case, stress) (Robinson & Berridge, 2008).
Attentional and impulsivity differences have also been found between tracking groups.
Researchers have found that STs perform significantly worse than GTs on a sustained
attention task (SAT), with STs’ performance fluctuating between periods of good to near-
chance success (Paolone et al., 2013). A more recent study from this group found the same
pattern of results on the SAT, but only for STs with larger sign-tracking scores (Pitchers et al.,
2017). In addition to attentional deficits, tracking group differences in impulsivity – and
related concepts such as disinhibition – have also been found. Though there were no group
26
differences in reaction times, STs made more premature responses than GTs on a choice
reaction time (CRT) task, an indicator of response disinhibition (King et al., 2016). Further,
STs display smaller prepulse inhibition of an acoustic startle response than GTs, suggesting
they possess reduced inhibitory control (Lopez, Karlsson, & O’Donnell, 2015). Important
findings also suggest that STs suffer from behavioural inflexibility compared to GTs, which
may have important implications for how the attribution of incentive value to reward-
associated cues may underlie vulnerability for addiction (e.g., once salience is ascribed to a
reward-paired cue, such inflexibility may impair STs’ ability to ignore or disengage) (Ahrens,
Singer, Fitzpatrick, Morrow, & Robinson, 2015; Nasser, Chen, Fiscella, & Calu, 2015).
Overall, across the domains of drug and ‘personality’ characteristics, evidence suggests
that STs are more prone to cue-elicited drug-seeking and consumption, psychomotor
sensitisation, incentive-sensitisation, heightened stress responses, attentional deficiencies (or
perhaps aberrant attentional allocation), impulsivity (perhaps response disinhibition,
specifically) and behavioural inflexibility. However, all of this must be interpreted whilst
being mindful that the vast majority of studies have employed discrete, localised reward cues
(such as lights and levers), rather than global, non-localised cues (such as entire cages), and
the few studies that have employed the latter have found reverse outcomes (T. E. Robinson et
al., 2014).
1.4 Sign-Tracking & Goal-Tracking: Humans
This section covers the research to date focusing on tracking behaviour in humans. Given that
the second chapter of this thesis describes the tasks used throughout my PhD, only outlines
27
will be provided here where necessary. Please see Chapter 2 for a full description of the
Additional Singleton Task (AST).
Attentional Bias
Before detailing the tasks used to measure tracking behaviours in humans, it is first important
to explain the use and validity of attentional bias measures in obtaining results. Attentional
bias (AB) describes the process whereby reward-associated stimuli acquire incentive salience
and accrue greater attentional resources than neutral stimuli. Studies of AB typically use
methods such as the Stroop and Visual Probe tasks, using either direct (eye-tracking) or
indirect (button response) measures of attention, which are gathered via reaction time (RT)
and/or gaze dwell time (GDT). Such procedures have shown that users and/or abusers of
alcohol, cannabis, tobacco, opiates and cocaine generally show greater AB towards substance-
related cues than do non-users (Field et al., 2016; Field & Cox, 2008; van Hemel-Ruiter, de
Jong, Ostafin, & Oldehinkel, 2015).
Thus, much in the same way that animals’ consistent physical approach behaviours
towards the CS or US designate them as STs or GTs, respectively, whether humans show
consistent attentional approach behaviours towards CSs or USs also allows such
classification. In fact, some researchers have claimed that AB in humans and conditioned
motivation in animals is very likely linked (Saunders & Robinson, 2013; Saunders et al.,
2013). The measurement of human sign-tracking can take numerous forms, but always
involves discrete, reward-associated, response-irrelevant stimuli drawing attention (indicating
acquired salience), thus mirroring the preclinical literature relatively well (B. A. Anderson,
2013; Le Pelley, Mitchell, Beesley, George, & Wills, 2016). Regarding the validity of AB, the
28
studies detailed in this thesis predominantly employ direct, eye-tracking measures of AB,
which have been shown to be more internally reliable than indirect measures (Christiansen,
Mansfield, Duckworth, Field, & Jones, 2015).
1.4.1 Autoshaping procedures: Cognitive Tasks
Additional Singleton Task (AST)
Theeuwes's (1991, 1992) additional singleton task (AST, and subsequent variations of it; for
examples, see Anderson, Laurent, & Yantis, 2011; Anderson & Spear, 2011; Le Pelley,
Pearson, Griffiths, & Beesley, 2015) has widely been used to explore attentional capture in
humans, with results consistently demonstrating human sign-tracking behaviours. Typically
the task employs a training and test phase. In the training phase participants respond to a cue
of a certain colour or shape, while in the test phase this colour or shape is employed as a
distractor. A description of the task is given in the Chapter 2, General Methods. However,
there are a number of possible variations, a few of which will be described here to enhance
interpretation of this thesis’s results.
Variations in AST training phase: Slight variations in training phases can prevent the
development of sign-tracking (Sha & Jiang, 2015), and can moderate learning rates (as
measured by instrumental learning tasks) and thereby moderate sign-tracking (Jahfari &
Theeuwes, 2016). Sign-tracking emerges even when the test phase is undertaken one week
after the training phase (MacLean & Giesbrecht, 2015).
Variations in AST perceptual features: Using shape orientation rather than shape colour
weakens the effect of sign-tracking, suggesting perceptual features matter (Laurent, Hall,
29
Anderson, & Yantis, 2014), and the use of reward-associated auditory cues in conjunction
with visual cues can increase the magnitude of sign-tracking, providing evidence of cross-
modal stimulus interaction in human sign-tracking (B. A. Anderson, 2016d; Miranda &
Palmer, 2014).
Variations of AST reward: Sign-tracking is observed when AST reward is specific
currency (‘£’, ‘$’), displayed in either text or pictures (Camara, Manohar, & Husain, 2013;
Roper & Vecera, 2016), and when CSs are paired with cues of a negative valence (Wentura,
Müller, & Rothermund, 2014), including when CSs are paired with painful stimuli (electric
shock) (L. J. Schmidt, Belopolsky, & Theeuwes, 2015). Sign-tracking is seen when CSs are
paired with either positive or negative social information (happy or sad cartoon faces) (B. A.
Anderson, 2016a, 2016c), though sign-tracking is only ever observed when the CSs contain
unique predictive information about reward magnitude (Sali, Anderson, & Yantis, 2014).
Variations in detecting the importance of reward: Reward-associated CSs break through
the ‘inhibitory surround’ (region of attention where information processing is normally
supressed) (Wang, Duan, Theeuwes, & Zhou, 2014). Reward magnitude is also more
important than perceptual cue features (though the more salient the cue, the greater the
attentional capture) (Stankevich & Geng, 2015; Wang, Yu, & Zhou, 2013). Finally, reward
captures attention even when participants are made aware of which cue (high- or low-value) is
coming up and even where it is about to be presented (Becker, Hemsteger, & Peltier, 2015;
MacLean, Diaz, & Giesbrecht, 2016).
In the adaptation employed throughout this thesis – referred to as the Additional
Singleton Tracking Task (ASTT) – there is no training phase. Instead, participants are
explicitly instructed about, and implicitly learn, the reward contingencies in the ‘test phase’
(the only phase). On each trial participants are presented with several grey circles, one grey
30
diamond and one of two coloured CSs (red or blue), which indicate different reward types
given an outcome target (OT) response. One colour predicts high-value monetary rewards, the
other low-value (counterbalanced). Sign-tracking is indicated by slower responses towards the
OT and by more omissions on high-value compared to low-value trials. Goal-tracking is seen
in low levels of distraction across trial types. See Figure 2.1 for a pictorial demonstration of
the ASTT. There are now several comprehensive reviews which utilise variations of the AST
to explain various realms of cognition (B. A. Anderson, 2013, 2015a; Belopolsky, 2015; Le
Pelley et al., 2016; Sali, Anderson, & Courtney, 2016; Theeuwes, 2010).
Multi-Target Tracking Task (MTTT)
This novel task created for use in Study 1 (Chapter Three) also attempts to identify tracking
behaviours via a paradigm not seen before, thus potentially allowing for greater variability in
the way in which sign-tracking is measured. Briefly, three coloured circles (CSs: pink, green,
yellow) were paired with three different reward types (USs: alcohol, chocolate and a grey
rectangle), which were linked to a specific spatially distinct OT. Participants had to attend to
a specific OT dependant on the CS that appeared (e.g. if a pink CS appeared the participant
should respond to the left OT). Sign-tracking should be observable in slower disengagement
from the CSs. See Chapter Three and Figures 3.1, 3.2 and 3.3 for a pictorial demonstration.
Pavlovian-to-Instrumental Transfer task (PIT)
Pavlovian-to-Instrumental Transfer (PIT) tasks broadly assess the ability of distinct pavlovian
cues (CS+; paired with reward) to influence instrumental responding for rewards (e.g.,
31
alcohol), compared to cues paired with no reward (CS−). Therefore it provides a test of the
“discriminative control function of a stimulus” (Hogarth, Maynard, & Munafò, 2014). PIT
effects are found in both animals and humans, with human studies showing that a CS+ can
increase instrumental responding for drug and alcohol rewards, and it is suggested that PIT
effects may underlay a phasic transition from drug use to dependence (Hogarth, Balleine, et
al., 2013). PIT also correlates with neuroimaging (e.g., functional magnetic resonance
imaging: fMRI) and neurophysiological activity (e.g., Electroencephalography: EEG)
(Cartoni et al., 2016; Corbit & Janak, 2016; Garbusow et al., 2014; Martinovic et al., 2014;
Talmi et al., 2008).
It is worth noting that general PIT effects and sign-tracking reflect a transition from goal-
directed to model-free (or habitual) learning, and thus may in some cases be modelled as
similar effects (Garbusow et al., 2014; Hogarth, Field, et al., 2013). A recent PIT study
concluded that, like sign-tracking, PIT effects have a negative relation to model-based
learning, with both effects instead possessing the hallmarks of model-free learning (Sebold et
al., 2016). A recent study measured sign-tracking during a PIT task and assessed how
strongly PIT effects influenced STs as compared to GTs (Garofalo & di Pellegrino, 2015).
STs selected reward-associated stimuli more than GTs when in the presence of the CS+,
indicating that the mere presence of reward-paired cues increased responding for reward (i.e.,
conditioned reinforcement) in STs compared to GTs. See Figures 6.1, 6.2 and 6.3 were this
task is used.
1.4.2 Influence of Task Setup on Outcomes
32
Before briefly reviewing the tracking responses found in humans, it is necessary to explain
some of the fundamental psychological concepts underlying the variations of the additional
singleton task, the predominant measure of tracking.
Attention
In humans, attentional bias (AB) can be observed using a range of cognitive tasks (for reviews
of AB in relation to addiction and/or obesity, see Field et al., 2016; Field & Cox, 2008). This
thesis focuses on attentional aspects of conditioning, with traditional models of attentional
control suggesting that attention is driven by both endogenous (top-down processes regulated
by internal factors, e.g., goal-driven selection) and exogenous (bottom-up processes, driven
by external factors, e.g., stimulus salience) control factors (for reviews of these topics see
Awh, Beloposky, & Theeuwes, 2013; Chelazzi, Perlato, Santandrea, & Della Libera, 2013).
However, Awh et al. (2013) highlight that there are at least two forms of selection phenomena
not explained by such models (and which are important for our purposes, here): selection
history and reward history. These may have been overlooked in previous research, perhaps
being mistaken as part of generic top-down processing (Awh et al., 2013). In order to parse
such mechanisms, some important attentional features shall be described next.
Selection and Reward History
Selection history describes how behaviour may be biased by past choice. Wolfe, Butcher, Lee
and Hyle (2003) employed a target-finding task wherein participants had to find a target
possessing a specific perceptual feature (e.g., colour, orientation). During some blocks the
perceptual feature remained consistent (e.g., always respond to the blue target), while during
33
other blocks the perceptual feature varied (e.g., respond to the blue target on some trials and
the square target on others). They found slower RTs on the varied, compared to the consistent
blocks, and concluded that general endogenous processing (e.g., goal-driven selection) is
hindered when having to focus on more than one feature for selection. However, these
findings can alternatively be explained by selection history: a bias towards previously-
selected stimuli, regardless of one’s current goals. This suggests that pure, consistent trials
produce an invariable selection history which negates any potential conflict between
previously-selected target stimuli and current target stimuli, thereby reducing RT. Conversely,
varied trials (sometimes) produce conflict between selection-history and one’s current goal-
driven selection state, thus inflating RT. Data supporting a selection-history interpretation
have been found (Maljkovic & Nakayama, 1994; Theeuwes & Van der Burg, 2011).
Regarding reward history, Thorndike (1911) described in his Law of Effect that if
multiple responses are made in the same situation, those rewarded will be most likely to recur.
Though Thorndike applied this law exclusively to overt behavioural responses, recent
research shows it can also be applied to habitual selection biases, as demonstrated by both
behavioural (Hickey, Chelazzi, & Theeuwes, 2010 a; Kyllingsbaek, Schneider, & Bundesen,
2001; Kyllingsbæk, Van Lommel, Sørensen, & Bundesen, 2014; Libera & Chelazzi, 2009)
and neural responses (Hickey, Chelazzi, & Theeuwes, 2010 b; Kiss, Driver, & Eimer, 2009;
Small et al., 2005), as well as in the responses of animals (Ikeda & Hikosaka, 2003; Peck,
Jangraw, Suzuki, Efem, & Gottlieb, 2009). When a previously-rewarding target of high value
is shown in subsequent trials (when it is no longer rewarding), the now-irrelevant target
continues to slow RT to a greater extent than when an identical procedure is conducted with
low-value targets (Anderson, Laurent, & Yantis, 2011). Such results show that previous
stimuli reward associations are paramount to visual selective attention.

34
It is therefore imperative that sign-tracking as measured by the ASTT – the task
employed throughout this thesis – cannot be explained merely by response habituation
(selection history) or by stimulus-response (instrumental) reward history. The influence of
such effects can be avoided by presenting variable trials (selection history) and ensuring that
responses to CSs (or CS features) were never at any point rewarded (reward history), but
rather are always response-irrelevant.
Task Relevance
In the majority of human sign-tracking studies (in particular those using the AST) the
distractor (CS) contains a feature (e.g., colour) that was previously response-relevant (e.g.,
participants were previously rewarded for responding to said feature in a training phase),
therefore accommodating selection- and reward-history effects (B. A. Anderson et al., 2011a,
2011b; Chelazzi et al., 2013; Donohue et al., 2016; Failing & Theeuwes, 2014, 2015; Kiss et
al., 2009; Le Pelley et al., 2015; Theeuwes, 2010; Theeuwes & Belopolsky, 2012). There
have however been a handful of studies which have observed sign-tracking towards stimuli
which have always been response-irrelevant9 and have never been instrumentally paired with
reward but which are still associated with value (Failing, Nissens, Pearson, Le Pelley, &
Theeuwes, 2015; Le Pelley et al., 2015; Pearson, Donkin, Tran, Most, & Le Pelley, 2015).
This shows that attentional capture can be elicited by cues which have never been response-
relevant. This effect can likely be explained by CS value altering individuals’ endogenous,
top-down state, causing them to involuntarily attend to cues that cannot aid them in their task
9 ‘Response-irrelevant’ is used instead of “task-irrelevant”, used by others in the literature, as this is a misnomer in many versions of the task. The CSs are clearly task relevant as they signify how much participants can win on a given trial. However, in the versions of Le Pelley et al. (2015) and in the version used in this paper, the CSs are always ‘response-irrelevant’.
35
performance. Indeed, it has been shown that even automatic (involuntary) attentional shifts
are contingent on ‘attentional control settings’, or endogenous goal-driven states (Folk,
Remington, & Johnston, 1992). This was in contrast to contemporary theories which
suggested the primary, in some cases only, factors governing involuntary AB were the
properties of exogenous stimuli (e.g., the colour of the CS).
A final note on task relevance in addition to response-relevance must also be made, as
important findings in the literature show that higher order cognitions can also influence sign-
tracking. Specifically, evidence suggests that both context and semantic content are partial
determinants of value-modulated attentional capture (VMAC; here, unless specified, VMAC
is used interchangeably with sign-tracking). In one study, a discrete stimulus feature (e.g., the
colour red) either did or did not capture attention depending on whether it had been rewarded
within the context in which it was presented (where context refers to the background scene: a
forest versus a city landscape) (B. A. Anderson, 2014). The author noted that “the experience
of a particular context evokes its own unique set of value priors, which can be independently
updated with learning and automatically bias attention when activated.” (p. 754). In another
study, researchers conditioned participants to associate one context (e.g., forest scene) with
high reward and another (e.g., mountain scene) with low reward and found that such scenes
also capture (nonspatial) attention (Failing & Theeuwes, 2015). However, in a second
experiment these researchers went further and, after initially conditioning participants as
described above, tested the extent to which images which had never been presented before but
which shared a semantic category with conditioned images still captured nonspatial attention.
They found that the never-before-seen images which shared a semantic category with the
high-reward scenes captured attention at a higher rate than the images sharing a semantic
category with the low-reward scenes. Others have replicated this with other semantic
categories (e.g., cars, trees and people) (Hickey, Kaiser, & Peelen, 2015). This finding
36
suggests that VMAC may not be constrained by simple stimuli (or stimuli feature)
associations with reward, but that the value ascribed to a stimulus may be generalised to other
stimuli of the same semantic category. In human terms, this could plausibly extend to alcohol
consumers who have had positive experiences in a single pub generalising such positive
associations to other pubs.
Prediction-Driven versus Value-Modulated Attentional Capture
The distinction between a cue’s predictive value and its reward value is also important.
Through pavlovian conditioning, stimuli develop predictive power and provide information
concerning current and future environments (for reviews, see Le Pelley, 2004; Pearce &
Mackintosh, 2010 [in Mitchell & Le Pelley]). Not only do (accurately) predictive stimuli
become conditioned at a quicker rate than non-predictive stimuli, but evidence suggests that
predictive stimuli can also induce involuntary oculomotor capture (Le Pelley, Oakeshott,
Wills, & McLaren, 2005; Le Pelley, Vadillo, & Luque, 2013; Livesey, Harris, & Harris,
2009). On the other hand, value-driven attentional capture – described by Thorndike’s (1911)
Law of Effect – explains how highly-rewarded responses (such as responses to a particular
stimulus) are more likely to recur than responses which result in the acquisition of fewer
rewards, via instrumental conditioning. Both the value and the predictive utility of stimuli can
determine how much attention they capture (see Le Pelley et al., 2015).
Thus, it is important that the ASTT present CSs which possess neither predictive utility
nor instrumental value. Specifically, it is not that CSs should not be predictive of the US (it
appears they have to be to be imbued with salience), but rather CSs should not predict what
37
kind of response should be employed or what kind of stimuli should be responded to10, as this
would prevent us from distinguishing between sign-tracking towards a CS that was produced
because it has incentive value rather than because it has predictive value. Likewise, CSs
should not reward responses elicited towards them as this would bring into play the effects of
instrumental reinforcement. Controlling for these underlying mechanisms is important for
identifying the cause of persistent, maladaptive behaviour (sign-tracking) and when
developing procedures to alter it (e.g., treatment). Other potentially important factors shall be
discussed in the Introduction sections of relevant chapters.
1.4.3 Tracking Responses in Humans
Research employing the AST has shown that humans produce several sign-tracking
behaviours analogous to those seen in various animal species. Specifically, Le Pelley et al.
(2015) have shown that discrete, reward-paired CSs produce slower RTs towards the OT for
both direct (eye-tracking) and indirect (button response) measures, with high-value CSs
impeding RT to a greater extent than low-value CSs. Additionally, they showed that high-
value CSs produced significantly more overt attentional/oculomotor capture than low-value
CSs, with trials containing either type of CS producing more capture than trials with no CS.
Finally, Le Pelley et al. (2015) also found that, as in nonhuman animals, sign-tracking
responses were developed in the absence of any response contingency and were maintained
in the face of aversive consequences (negative automaintenance), a pattern which seems to be
explained by sign-tracking’s apparent automaticity (Pearson et al., 2015).
10 Predictive utility is, unfortunately, unavoidable in the Multi-Target Tracking Task. However, as the predictive value of all types of CSs is counterbalanced (i.e., the contingencies between reward types and response types is alternated between participants), predictive utility in this instance should not be problematic.
38
1.4.3.1 Correlates of Sign-Tracking & Goal-Tracking: Humans
Though dozens of studies have examined human responses in cognitive autoshaping
paradigms (with most exploring how subtle differences in task setup influence responses),
few have investigated how tracking performance relates to individual difference factors such
as impulsivity or drug use. First, as with nonhuman animal findings earlier, findings from
human studies shall first look at within-subject correlates of tracking behaviour (section
1.4.3.1.1), before looking at any differences between tracking groups (1.4.3.1.2).
1.4.3.1.1 Correlates of Sign-Tracking
Drugs
Only two studies at the time of writing have investigated the potential relationship between
human sign-tracking and substance use. The first discussed here compared 17 opioid-
dependent patients undergoing methadone-maintenance treatment to 17 healthy controls on a
variation of the AST (B. A. Anderson, Faulkner, Rilee, Yantis, & Marvel, 2013). The authors
observed that opioid-dependent patients showed greater levels of sign-tracking (via slowed
target responses on high-valued CS trials compared to CS-absent trials) compared to control
participants. Thus the authors showed, for the first time, that individuals with a history of
drug dependence show greater VMAC towards a nondrug (monetary) reward cues than those
without a history of addiction.
In a subsequent study from the same research group, researchers tested 24
immunodeficiency virus positive (HIV+) patients on the AST (B. A. Anderson, Kronemer,
39
Rilee, Sacktor, & Marvel, 2016). Crucially, patients were also asked to give a detailed history
of lifetime drug and alcohol exposure (drug testing ruled out current drug users, with the
exception of cigarette smokers). In addition to finding a general sign-tracking effect among
the sample (with greater attentional capture by the high-value CS compared to the low-value
and absent CSs), they also found that HIV+ patients with an additional history of substance
dependence showed greater sign-tracking than HIV+ patients with no prior substance
dependence. This suggests that there may potentially be a unique association between sign-
tracking and substance dependence, given that this link is observed even within populations
already known for their risk-taking and sensation-seeking behaviours.
A third study covered here did not measure sign-tracking or VMAC specifically, rather a
PIT task was used. However, PIT assesses model-free learning and sign-tracking is the
quintessential model-free (or habitual) learning process, therefore some argue that PIT has
key parallels with sign tracking (Garbusow et al., 2014). The authors investigated whether
any differences existed between Alcohol Use Disorder (AUD) patients and controls in their
propensity to succumb to PIT effects. Results showed that AUD patients were more likely
than controls to show general PIT effects. However, while AUD patients showed a stronger
negative PIT effect to aversive cues (conditioned suppression) than controls, there was no
group difference in appetitive PIT (conditioned approach). Overall, however, these results
tentatively indicate that AUD may be associated with model-free learning on a PIT task,
which has major parallels with sign-tracking.
Overall, this evidence suggests that substance use disorders may be associated with sign-
tracking in humans. Anderson and colleagues (2016) suggest that the combined results of the
first two studies is consistent with heightened susceptibility to VMAC being a trait-like
characteristic that is not contingent upon active drug use and its acute effects on the brain.
40
However, it is important to note that these studies cannot tell us whether substance users’ and
abusers’ greater sign-tracking preceded their drug use or whether it was a result of cognitive
changes brought on by prolonged use (or both). Future research employing longitudinal
follow-up designs may offer elucidation.
Personality Characteristics
Following the same pattern as the drug-related studies outlined above, relatively few studies
have examined whether potential links exist between human attentional tracking and
personality factors. Again, ‘personality’ here refers to trait and state measures which differ
between individuals that are not drug- and alcohol-related behaviours (e.g., impulsivity, risk-
taking, sensation-seeking, working memory etc.). As has been found in animals, human
studies have identified an association between sign-tracking (VMAC, more generally) and
impulsivity (all studies cited here measured impulsivity via the Barratt Impulsivity Scale–11
or Behavioural Inhibition System/Behavioural Activation System scale [BIS/BAS]). Several
studies have now found a positive association between sign-tracking (as measured via the
AST) and trait impulsivity (B. A. Anderson et al., 2011b; Hickey et al., 2010b; Pearson et al.,
2015), with a further study finding that the severity of non-planning impulsiveness (a BIS–11
subscale) leading up to a HIV+ diagnosis was correlated with sign-tracking, suggesting a
possible link between VMAC and HIV-associated risk (B. A. Anderson, Kronemer, et al.,
2016). However, at least one study has published results showing no link between sign-
tracking and impulsivity (both BIS–11 total and subscale scores) in a sample of opioid-
dependent patients (B. A. Anderson et al., 2013).
41
Several studies have now also found a link between sign-tracking and visual working
memory (VWM). Anderson and Yantis (2012) showed that individuals with relatively low
VWM were more susceptible to VMAC (i.e., sign-tracking) on the AST, compared to those
with comparatively high VWM. Similarly, Anderson et al (2011b) found a negative
relationship between sign-tracking and VWM capacity, a finding which has been replicated
in clinical samples of both HIV+ patients (link found in an initial lab visit, but not at follow-
up) and opioid-dependent patients (link found in patients but not the control group) (B. A.
Anderson et al., 2013; B. A. Anderson, Kronemer, et al., 2016). In a study which
simultaneously assessed working memory and visual selective attention, findings showed that
higher memory load resulted in greater distractor effects (though distractors were not reward-
paired in this study). This supports previously-cited results showing that working memory
(and perhaps VWM in particular) is negatively associated with visual selective attention (and
perhaps VMAC in particular) (de Fockert, Rees, Frith, & Lavie, 2000).
In a deeper investigation into how sign-tracking and VWM are related, a recent
electroencephalography (EEG) study has shown that individuals with high VWM capacity
are better able to suppress salient distractors on the AST (as opposed to better VWM enabling
superior target detection) (Gaspar, Christie, Prime, Jolicœur, & McDonald, 2016). In the
same vein, an fMRI study found that, while there was no relationship observed between
VMAC and VWM, Blood-Oxygen-Level-Dependent (BOLD) activity was correlated with
VMAC, but only under high working memory load (de Fockert & Theeuwes, 2012). Due to
such consistent and seemingly robust findings, some researchers suggest that working
memory provides goal-directed control over visual selective attention (Lavie & de Fockert,
2005). However, there is evidence to the contrary that VWM explains variance in VMAC.
One study in particular compared adolescents (aged 13–16) to adults (aged 20–35) on the
AST and found that while adolescents sign-tracked to a greater extent and for longer (VMAC
42
persisted into later blocks of the task) than adults, these differences were not accounted for by
developmental differences in VWM capacity (Roper, Vecera, & Vaidya, 2014).
Using the AST, one study found a strong positive correlation between attentional capture
by a high-value distractor and trait reward-seeking as measured by the Behavioural
Activation Systemdrive subscale (Hickey et al., 2010b). This may suggesting that, like animals,
some humans may possess a trait-like tendency to sign-track. Further, the authors suggest that
BASdrive reflects incentive sensitisation theory’s ‘wanting’ component, which is the aspect of
the theory describing how drug-seeking can be motivated by incentivised cues, regardless of
drug valuation (i.e., whether the drug is ‘liked’ or not) (Berridge, Robinson, & Aldridge,
2009). Future studies directly investigating any association between tracking behaviours and
‘wanting’ or ‘liking’ should treat these two components as dissociable.
Studies on patients have also revealed that clinical disorders (excluding substance use
disorders) correlate with sign-tracking. In a study of depression sufferers it was found that
while sign-tracking was found in a control group, depressed patients showed no VMAC. (B.
A. Anderson, Leal, Hall, & Yassa, 2014). Further, patients’ depression scores negatively
correlated with the magnitude of VMAC. These result may indicate either that depressed
patients don’t find such cues rewarding, or that depression is accompanied by differences in
how the attentional system processes reward information (or both).
The final studies covered here relate to human sign-tracking as measured across time.
For example, in one study which monitored brain activity via fMRI, participants completed a
passive viewing task which included exposure to stimulus-reward pairings, where the
‘reward’ was erotic pictures and ‘no reward’ was fractal images. The researchers found that
BOLD activation in the ventral striatum (which the authors used as a proxy for pavlovian
conditioning) predicted financially-costly approach behaviour on an active choice task 2–4
43
months later (Chumbley, Tobler, & Fehr, 2014). The authors concluded that they have
presented tentative evidence that variations in ventral striatal activity may partially cause
model-free learning (i.e., sign-tracking) and its consequences (financially risky behaviour in
this context) (Sebold et al., 2016). However, it should be noted that this study possesses many
components, and thus may not be a clear-cut measure of strict sign-tracking behaviour.
In the final study of this section, findings revealed that individuals tested on the AST for
only the second time after a 7–9 month interval had retained their attentional approach
behaviour towards noncontingent, response-irrelevant, but previously reward-associated CSs
(B. A. Anderson & Yantis, 2013). Crucially, even though no participants reported any
memory of which colour was associated with high value and which with low, the colours'
effects on performance were statistically significant, suggesting that conscious awareness of
reward contingencies is not necessary for incentivised CSs to influence behaviour. In terms of
how this relates to the individuals, the findings suggest that one session of autoshaping (via
the AST) is enough to subconsciously alter peoples’ attentional orienting towards differently
valued cues over a period of months. Crucially, this suggests that single events in which
individual, discrete cues become incentivised can cause such cues to subsequently attract
attention. This is potentially important given evidence that attention correlates with subjective
reports of craving and may even predict relapse in abstinent users and addicts (Field, Munafò,
& Franken, 2009; Marissen et al., 2006; Waters et al., 2003).
1.4.3.1.2 Individual differences between human tracking groups: Sign-Trackers vs.
Goal-Trackers
44
This section will outline individual differences between human participants classified as STs
and GTs. Only two studies at the time of writing have assessed individual differences in
humans classified into tracking groups. However, neither of these studies investigates STs’ or
GTs’ relationships with drugs, therefore, the section below is a general overview of individual
differences observed between human tracking groups.
STs vs. GTs: Individual Differences
The first study employed a PIT task similar to that of Garbusow et al. (2014), reviewed
above. Garofalo and di Pellegrino (2015) designed a PIT task which first presented an
instrumental conditioning task, then a pavlovian conditioning task, before a PIT task assessed
how much influence (if any) pavlovian cues exhibited over instrumental responding for
reward-associated stimuli. Participants were classified as STs or GTs based on their CRs
during the pavlovian conditioning phase. Individuals whose attention was biased towards the
CS+ were classified as STs, and those whose attention was consistently drawn to the region
of US (reward) delivery were classified as GTs. They found that STs, but not GTs, were more
likely to choose the reward-response option when the CS+ was displayed compared to the
CS– (even though rewards were no longer available). This indicates an influence of a
noncontingent, discrete cue on STs’ reward choices even in extinction. Furthermore, it seems
that in the last block of the PIT choice task, regardless of which CS was displayed, STs chose
more rewards than GTs. Finally, in a replication of animal studies, the authors found that STs
were significantly more impulsive than GTs, as reported on the BIS–11.
In another study, 64 lean and 88 obese adults viewed food-related, pleasant, neutral and
unpleasant images while EEG recordings were taken (Versace, Kypriotakis, Basen-Engquist,
45
& Schembre, 2015). Late positive potentials (LPP) were taken as a measure of cue-related
incentive salience for each category and were used to categorise participants into tracking
groups. Participants classified as STs were those whose LPP responses to food-related cues
were of the same magnitude as those towards other highly arousing stimuli, whereas
participants classified as GTs presented with LPP responses to food cues that were
indistinguishable from responses to neutral cues. The results showed that obese individuals
were significantly more likely than lean individuals to be classified as STs – 40% of the
obese sample versus 23% of lean participants. Further analysis revealed that obese
individuals designated as STs had a greater proclivity for maladaptive eating behaviours,
shown by higher self-reports of emotional eating and food cravings, coupled with greater
feelings of loss of control and positive outcome expectancies.
Taken together, the evidence of associations to different tracking phenotypes attained so
far in humans suggests that I) STs’ reward choices may be more influenced by discrete,
reward-associated cues, II) that STs may choose rewarded options more often even in the
absence of the influence of reward-associated cues, III) STs may be significantly more
impulsive than GTs, IV) obese individuals may be more likely to imbue food-related cues
with incentive salience (i.e., sign-track), and V) obese sign-trackers may have increased rates
of maladaptive eating patterns.
1.5 Aetiology of Tracking Behaviours
These final sections cover the evidence concerning the possible causes and/or factors which
may potentiate the development of tracking behaviours. (It should be noted that the sections
below cover broad aetiologies, and do not cover the large influence of experimental setup in
46
autoshaping, which is covered in sections 1.3.2.3 [nonhuman animals] and 1.4.2 [humans].)
The areas covered here are genetics (1.5.1), neurobiology (1.5.2), the influence of early life
experiences (1.5.3) and the influence of drugs (1.5.4).
1.5.1 Genetics
Animals
Several preclinical studies have investigated the role of genetics in influencing tendencies to
sign-track versus goal-track. These studies typically expose different rat strains to identical
autoshaping procedures and assess the emergent prevalence of tracking behaviours across the
different groups. In perhaps the earliest study to do this, Lewis (LEW) and Fischer (F344)
rats – the former of which are known to possess higher impulsivity and more readily self-
administer drugs – were exposed to a food-paired lever-CS in an autoshaping paradigm and
assessed for levels of sign-tracking (Kearns, Gomez-Serrano, Weiss, & Riley, 2006). The
results revealed that LEW rats acquired a sign-tracking CR more rapidly and sign-tracked to a
greater extent than the F344 rats. The authors concluded that this may be due to physiological
components such as hypothalamic–pituitary–adrenal axis activity, which influences
psychological traits such as impulsivity, drug consumption and (possibly) sign-tracking.
A study conducted a year later applied similar procedures using mouse strains and
ethanol and saline as the reward (US). Mice were injected with ethanol or saline before being
tested for sign-tracking via exposure to the appropriate reward-paired cue (Cunningham &
Patel, 2007). Results revealed that both NZB/B1NJ mice and DBA/2J sign-tracked to almost
identical degrees for the CS paired with saline, but only NZB/B1NJ showed a sign-tracking
CR for the ethanol-paired CS and an acquisition curve (i.e., a progressive increase in sign-
47
tracking over time). A more recent study using a food-paired CS and utilising Sprague-
Dawley (SD) rats and Heterogeneous Stock (HS) found that female SD rats acquired a sign-
tracking CR faster than male SD rats, but that there was no sex difference in HS rats (Pitchers
et al., 2015). In a study using a large sample, researchers found that rates of ST and GT
differed in rats obtained from different vendors and from different colonies within vendors.
(Christopher J. Fitzpatrick et al., 2013). Although environmental variables are impossible to
discount, this suggests that genetics are a determining factor.
Highly genetically and behaviourally diverse mouse populations show significant sign-
tracking differences, with such differences showing correlations with novelty-seeking
(Dickson et al., 2015). Further, rats bred for novelty-seeking are more likely to show
behavioural disinhibition and sign-tracking (Flagel, Robinson, et al., 2010), as are mice bred
for lower serotonin 5-HT function (Campus, Accoto, Maiolati, Latagliata, & Orsini, 2016).
Chemogenetic manipulations which cause disruption to ventral pallidum neurons have also
been found to impair sign-tracking, leaving goal-tracking unaffected (Chang, Todd, Bucci, &
Smith, 2015). Furthermore, one study has shown CS-induced c-fos (proto-oncogene) mRNA
(messenger ribonucleic acid) expression in corticostriatal regions only in those who imbue
said CSs with incentive salience (i.e., sign-trackers) (Flagel, Cameron, et al., 2011).
Crucially, Dickson et al. (2015) estimate that the heritability – the proportion of variance in a
given population that can be accounted for by genetic factors – of sign-tracking and goal-
tracking is between .32 and .41, suggesting moderate heritability in these populations.
Before ending this section, it is worth outlining the reason sign-tracking may have
evolved, given that it can be such a costly behaviour (i.e., is associated with cue-induced
drug-seeking, is persistently maladaptive in the face of aversive consequences etc.). It is
possible that these behaviours are a side-effect of heuristics which are evolutionarily
48
advantageous on average, with such quick, automatic and low-level pavlovian learning
having benefits for the organism, suggesting evolutionary origins are likely (Hickey et al.,
2015; Hickey & van Zoest, 2013). However, in certain situations (e.g., autoshaping
paradigms, specifically crafted choice tasks, exposure to addictive substances etc.), these
heuristics can be exploited and often result in unwanted and/or inappropriate behaviours.
These heuristics aid both bottom-up and top-down learning, but also appear to be automatic,
and so awareness does not offer protection from maladaptation (Awh et al., 2013).
Humans
There are no studies measuring the genetic influence on the sign-tracker and goal-tracker
phenotypes in humans. However, many of the traits that are related to tracking behaviours in
the preclinical literature (e.g., impulsivity, risk-taking, sensation-seeking etc.) and in some
human studies (e.g., self-reported impulsivity, loss of control and obesity) have been shown
to be highly heritable in humans (Anne & Paul, 2014; Locke et al., 2015; Polderman et al.,
2015). Thus, given that tracking-related traits are highly heritable in animals and that all
human behavioural traits are heritable (Turkheimer, 2000), it seems very likely that human
variance in sign-tracking will also be at least partly heritable.
1.5.2 Neurobiology
Animals
The preclinical literature on the neurobiological underpinnings and correlates of sign-tracking
is vast, with neurochemical features ranging from dopaminergic and GABAergic
49
involvement to the influence of designer drugs on designer receptors, and neuroanatomical
regions ranging from cortical structures (e.g., the frontal cortex) to the evolutionarily old
subcortical structures (e.g., the amygdalae and striatum).
The most implicated neurotransmitter in sign-tracking research is dopamine (DA).
Dozens of studies suggest that DA and specific dopaminergic receptors play a key role in the
attribution of incentive salience (Fraser, Haight, Gardner, & Flagel, 2016). In the first study
to examine this directly in subgroups of STs and GTs, researchers found that STs exhibited
higher levels of the D1 DA receptor (DRD1) mRNA relative to GTs on the first day of testing
(Flagel et al., 2007). Further, low and moderate doses of typical and atypical antipsychotics
(which work at D2 DA receptors, DRD2) attenuate sign-tracking, with goal-tracking only
being affected at a maximal dose (Danna & Elmer, 2010). Similarly, bred high-responder rats
(bHRs; bred for novelty) who also score highly on impulsivity and sign-tracking show DA
super-sensitivity and a greater proportion of DRD2high receptors compared to bred low-
responders (bLRs; who are more likely to goal-track) (Flagel, Robinson, et al., 2010).
A body of evidence using different techniques has shown that DA function is involved in
the acquisition (Chow, Nickell, Darna, & Beckmann, 2016; Darvas, Wunsch, Gibbs, &
Palmiter, 2014; Flagel, Clark, et al., 2011; Scülfort, Bartsch, & Enkel, 2016; Yau et al.,
2016), maintenance (DiFeliceantonio & Berridge, 2016; Christopher J. Fitzpatrick, Creeden,
Perrine, & Morrow, 2016; Lopez et al., 2015; Saunders & Robinson, 2012; Singer, Guptaroy,
et al., 2016; Soares, Cardoso, Malato, & Messias, 2017; Yager et al., 2015) and modulation
(Aitken, Greenfield, & Wassum, 2016; Peciña & Berridge, 2013; Saunders et al., 2013) of
sign-tracking. However, there are nuances to the research highlighting DA as a key
component in sign-tracking. For example, amphetamine (a DA agonist) can both magnify
sign-tracking and cause some STs to goal-track (DiFeliceantonio & Berridge, 2016).
50
Similarly, in an autoshaping procedure using contextual, rather than discrete cues (perhaps
best called a goal-tracking paradigm), DA antagonism blocked cocaine-context induced
hyperactivity, suggesting that DA might also modulate goal-tracking in environments
conducive to producing a goal-tracking (as opposed to a sign-tracking) CR (Saunders et al.,
2014). However, overall, researchers have concluded that “sign-tracking behaviour is more
heavily controlled by dopamine than goal-tracking” (Lopez et al., 2015, p. 2096).
Regarding other neurotransmitters, glutamatergic receptors in various forms have been
shown in several studies to be related to tracking behaviours; the ones covered here are all
ionotropic glutamate receptors (NMDA, AMPA, Kainate). First, photoinhibition of general
glutamatergic receptors has been shown to significantly impair goal-tracking CRs during CS
presentation (in a paradigm which only promoted goal-tracking) (Yau et al., 2016). For
NMDA (N-Methyl-D-Aspartate) receptors (NMDARs), the research is mixed. NMDAR
antagonists have been shown to both enhance (DeAngeli et al., 2015) and reduce (Milton et
al., 2012) sign-tracking towards ethanol-paired cues. A further study found a loss of
NMDARs in DA neurons did not affect the expression of sign-tracking at all (James,
Pennington, Tran, & Jentsch, 2015). For AMPA (α-amino-3-hydroxy-5-methyl-4-
isoxazolepropionic acid) and kainite receptors, one study found that an AMPAR antagonist in
the basolateral amygdala, but not the caudate putamen, diminished cue-evoked alcohol
seeking by a discrete CS (Sciascia et al., 2015). Another found that an AMPA/Kainate
antagonist in the nucleus accumbens core, but not the shell, reduced cue-induced cocaine-
seeking by a discrete CS even when an NMDA antagonist did not (Di Ciano & Everitt, 2001).
The authors concluded that NMDA and AMPA/Kainate effects are dissociable.
There is further evidence that serotonin, opioid, acetylcholine and DREADD (Designer
Receptor Exclusively Activated by Designer Drugs) receptors are also involved. For
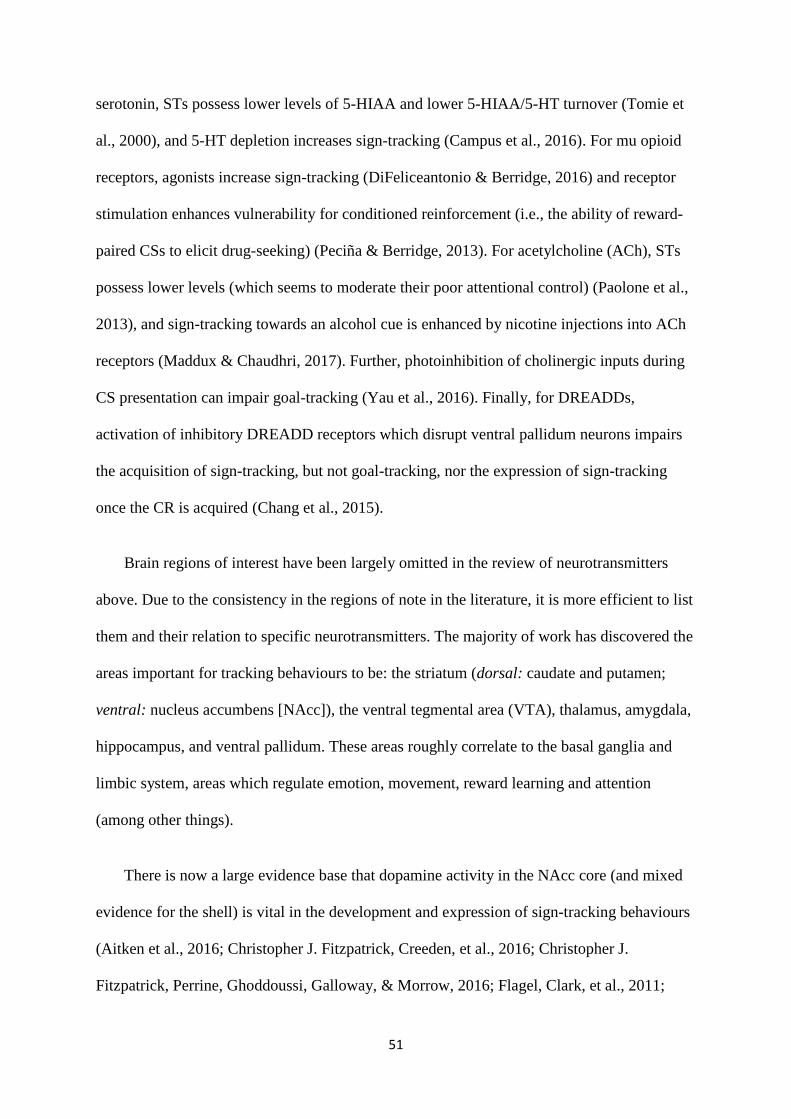
51
serotonin, STs possess lower levels of 5-HIAA and lower 5-HIAA/5-HT turnover (Tomie et
al., 2000), and 5-HT depletion increases sign-tracking (Campus et al., 2016). For mu opioid
receptors, agonists increase sign-tracking (DiFeliceantonio & Berridge, 2016) and receptor
stimulation enhances vulnerability for conditioned reinforcement (i.e., the ability of reward-
paired CSs to elicit drug-seeking) (Peciña & Berridge, 2013). For acetylcholine (ACh), STs
possess lower levels (which seems to moderate their poor attentional control) (Paolone et al.,
2013), and sign-tracking towards an alcohol cue is enhanced by nicotine injections into ACh
receptors (Maddux & Chaudhri, 2017). Further, photoinhibition of cholinergic inputs during
CS presentation can impair goal-tracking (Yau et al., 2016). Finally, for DREADDs,
activation of inhibitory DREADD receptors which disrupt ventral pallidum neurons impairs
the acquisition of sign-tracking, but not goal-tracking, nor the expression of sign-tracking
once the CR is acquired (Chang et al., 2015).
Brain regions of interest have been largely omitted in the review of neurotransmitters
above. Due to the consistency in the regions of note in the literature, it is more efficient to list
them and their relation to specific neurotransmitters. The majority of work has discovered the
areas important for tracking behaviours to be: the striatum (dorsal: caudate and putamen;
ventral: nucleus accumbens [NAcc]), the ventral tegmental area (VTA), thalamus, amygdala,
hippocampus, and ventral pallidum. These areas roughly correlate to the basal ganglia and
limbic system, areas which regulate emotion, movement, reward learning and attention
(among other things).
There is now a large evidence base that dopamine activity in the NAcc core (and mixed
evidence for the shell) is vital in the development and expression of sign-tracking behaviours
(Aitken et al., 2016; Christopher J. Fitzpatrick, Creeden, et al., 2016; Christopher J.
Fitzpatrick, Perrine, Ghoddoussi, Galloway, & Morrow, 2016; Flagel, Clark, et al., 2011;
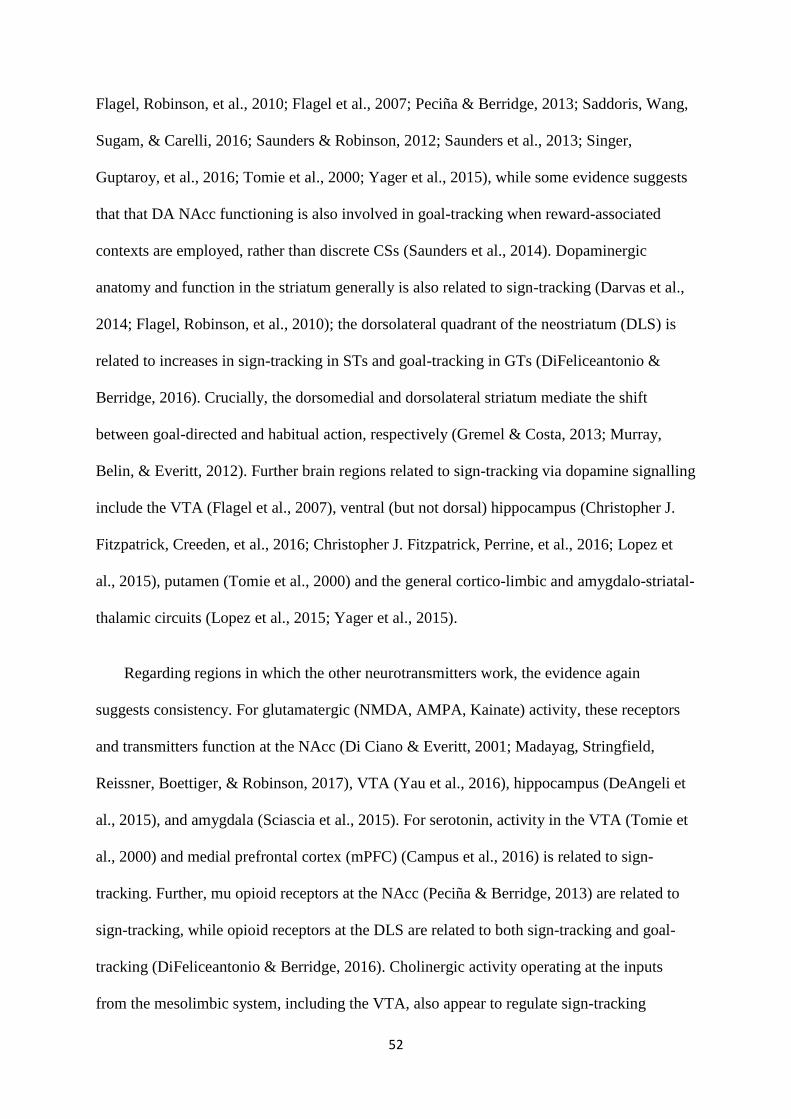
52
Flagel, Robinson, et al., 2010; Flagel et al., 2007; Peciña & Berridge, 2013; Saddoris, Wang,
Sugam, & Carelli, 2016; Saunders & Robinson, 2012; Saunders et al., 2013; Singer,
Guptaroy, et al., 2016; Tomie et al., 2000; Yager et al., 2015), while some evidence suggests
that that DA NAcc functioning is also involved in goal-tracking when reward-associated
contexts are employed, rather than discrete CSs (Saunders et al., 2014). Dopaminergic
anatomy and function in the striatum generally is also related to sign-tracking (Darvas et al.,
2014; Flagel, Robinson, et al., 2010); the dorsolateral quadrant of the neostriatum (DLS) is
related to increases in sign-tracking in STs and goal-tracking in GTs (DiFeliceantonio &
Berridge, 2016). Crucially, the dorsomedial and dorsolateral striatum mediate the shift
between goal-directed and habitual action, respectively (Gremel & Costa, 2013; Murray,
Belin, & Everitt, 2012). Further brain regions related to sign-tracking via dopamine signalling
include the VTA (Flagel et al., 2007), ventral (but not dorsal) hippocampus (Christopher J.
Fitzpatrick, Creeden, et al., 2016; Christopher J. Fitzpatrick, Perrine, et al., 2016; Lopez et
al., 2015), putamen (Tomie et al., 2000) and the general cortico-limbic and amygdalo-striatal-
thalamic circuits (Lopez et al., 2015; Yager et al., 2015).
Regarding regions in which the other neurotransmitters work, the evidence again
suggests consistency. For glutamatergic (NMDA, AMPA, Kainate) activity, these receptors
and transmitters function at the NAcc (Di Ciano & Everitt, 2001; Madayag, Stringfield,
Reissner, Boettiger, & Robinson, 2017), VTA (Yau et al., 2016), hippocampus (DeAngeli et
al., 2015), and amygdala (Sciascia et al., 2015). For serotonin, activity in the VTA (Tomie et
al., 2000) and medial prefrontal cortex (mPFC) (Campus et al., 2016) is related to sign-
tracking. Further, mu opioid receptors at the NAcc (Peciña & Berridge, 2013) are related to
sign-tracking, while opioid receptors at the DLS are related to both sign-tracking and goal-
tracking (DiFeliceantonio & Berridge, 2016). Cholinergic activity operating at the inputs
from the mesolimbic system, including the VTA, also appear to regulate sign-tracking
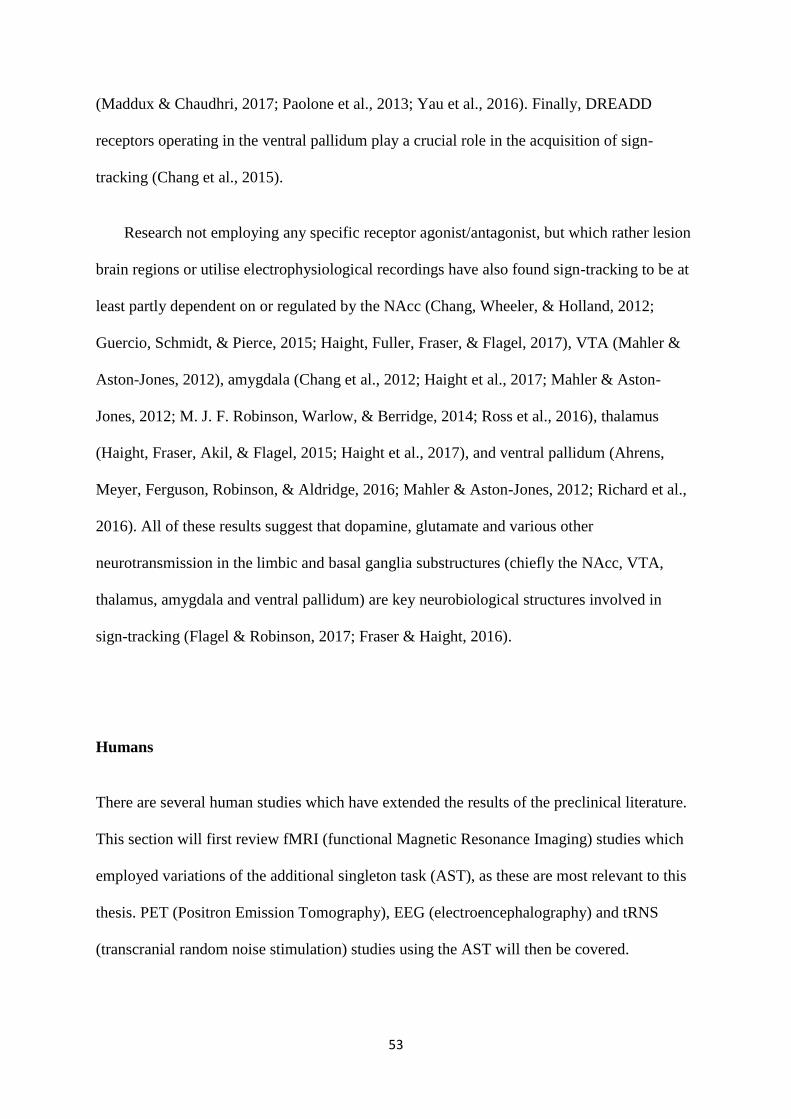
53
(Maddux & Chaudhri, 2017; Paolone et al., 2013; Yau et al., 2016). Finally, DREADD
receptors operating in the ventral pallidum play a crucial role in the acquisition of sign-
tracking (Chang et al., 2015).
Research not employing any specific receptor agonist/antagonist, but which rather lesion
brain regions or utilise electrophysiological recordings have also found sign-tracking to be at
least partly dependent on or regulated by the NAcc (Chang, Wheeler, & Holland, 2012;
Guercio, Schmidt, & Pierce, 2015; Haight, Fuller, Fraser, & Flagel, 2017), VTA (Mahler &
Aston-Jones, 2012), amygdala (Chang et al., 2012; Haight et al., 2017; Mahler & Aston-
Jones, 2012; M. J. F. Robinson, Warlow, & Berridge, 2014; Ross et al., 2016), thalamus
(Haight, Fraser, Akil, & Flagel, 2015; Haight et al., 2017), and ventral pallidum (Ahrens,
Meyer, Ferguson, Robinson, & Aldridge, 2016; Mahler & Aston-Jones, 2012; Richard et al.,
2016). All of these results suggest that dopamine, glutamate and various other
neurotransmission in the limbic and basal ganglia substructures (chiefly the NAcc, VTA,
thalamus, amygdala and ventral pallidum) are key neurobiological structures involved in
sign-tracking (Flagel & Robinson, 2017; Fraser & Haight, 2016).
Humans
There are several human studies which have extended the results of the preclinical literature.
This section will first review fMRI (functional Magnetic Resonance Imaging) studies which
employed variations of the additional singleton task (AST), as these are most relevant to this
thesis. PET (Positron Emission Tomography), EEG (electroencephalography) and tRNS
(transcranial random noise stimulation) studies using the AST will then be covered.
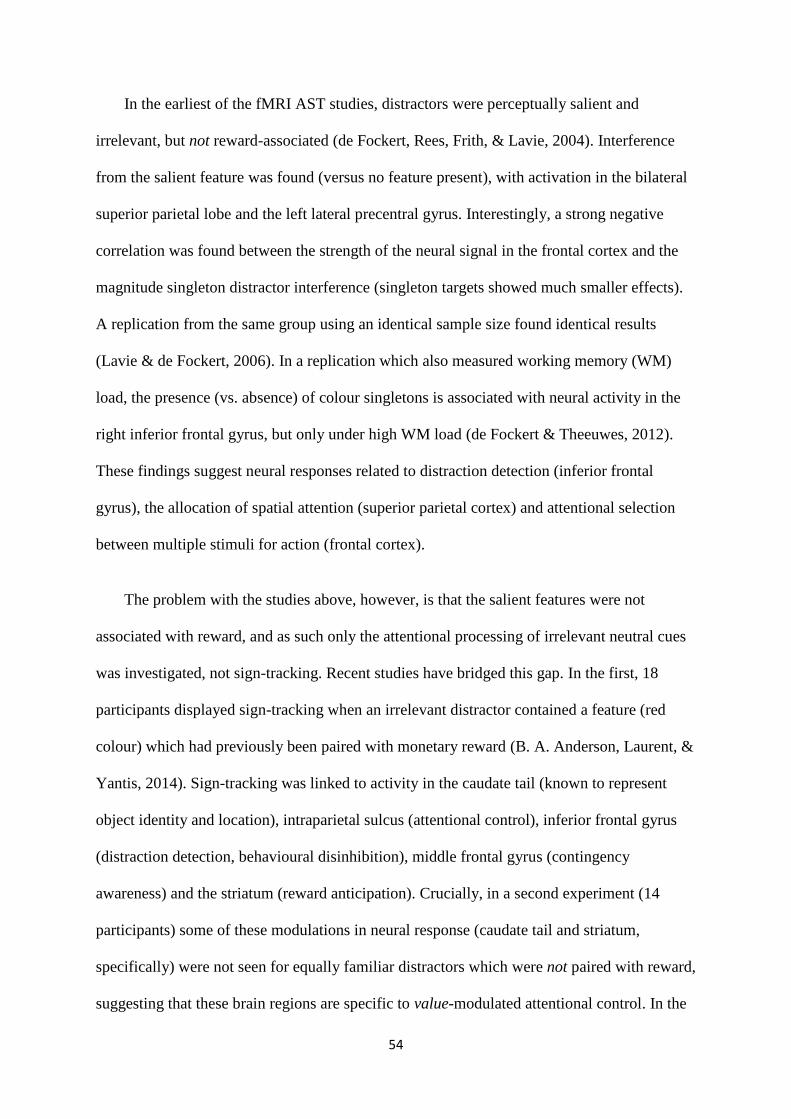
54
In the earliest of the fMRI AST studies, distractors were perceptually salient and
irrelevant, but not reward-associated (de Fockert, Rees, Frith, & Lavie, 2004). Interference
from the salient feature was found (versus no feature present), with activation in the bilateral
superior parietal lobe and the left lateral precentral gyrus. Interestingly, a strong negative
correlation was found between the strength of the neural signal in the frontal cortex and the
magnitude singleton distractor interference (singleton targets showed much smaller effects).
A replication from the same group using an identical sample size found identical results
(Lavie & de Fockert, 2006). In a replication which also measured working memory (WM)
load, the presence (vs. absence) of colour singletons is associated with neural activity in the
right inferior frontal gyrus, but only under high WM load (de Fockert & Theeuwes, 2012).
These findings suggest neural responses related to distraction detection (inferior frontal
gyrus), the allocation of spatial attention (superior parietal cortex) and attentional selection
between multiple stimuli for action (frontal cortex).
The problem with the studies above, however, is that the salient features were not
associated with reward, and as such only the attentional processing of irrelevant neutral cues
was investigated, not sign-tracking. Recent studies have bridged this gap. In the first, 18
participants displayed sign-tracking when an irrelevant distractor contained a feature (red
colour) which had previously been paired with monetary reward (B. A. Anderson, Laurent, &
Yantis, 2014). Sign-tracking was linked to activity in the caudate tail (known to represent
object identity and location), intraparietal sulcus (attentional control), inferior frontal gyrus
(distraction detection, behavioural disinhibition), middle frontal gyrus (contingency
awareness) and the striatum (reward anticipation). Crucially, in a second experiment (14
participants) some of these modulations in neural response (caudate tail and striatum,
specifically) were not seen for equally familiar distractors which were not paired with reward,
suggesting that these brain regions are specific to value-modulated attentional control. In the
55
most recent fMRI AST study, although no sign-tracking effect was observed, the value-
driven attention network – which includes the caudate tail, intraparietal sulcus, lateral
occipital complex and the early visual cortex – was activated by high-value distractors
compared to those of low-value or no value (B. A. Anderson, 2016b).
In addition to fMRI work, a recent PET AST study revealed that attentional capture by
reward-associated distractors positively correlated with dopamine (D2/D3) release in the right
caudate and posterior putamen (both substructures of the striatum), areas known to
underscore habit learning and the expression of habitual behaviours (B. A. Anderson,
Kuwabara, et al., 2016). These results comport with both the human fMRI and the preclinical
results. In the realm of EEG research, event-related potentials (ERPs) were evoked by
reward-associated distractors during an AST, but not by equally familiar, non-reward-
associated distractors (Qi, Zeng, Ding, & Li, 2013). Other work has shown that P1 ERPs –
reliable indicators of early visual selective attention – are evoked by reward-paired
distractors, even when participants are tested one week after reward contingency training
(Maclean & Giesbrecht, 2015). In an EEG study which classified obese and lean individuals
based on their neural responses to emotionally salient stimuli, obese individuals were
significantly more likely to be classified as sign-trackers (Versace et al., 2015). Importantly,
STs showed similar LPP (late positive potential) ERPs – indicators of attentional reactivity to
emotional stimuli – to food stimuli as they did towards emotionally salient stimuli (e.g.,
erotica), while GTs’ LPPs to food was similar to that produced towards neutral stimuli. Obese
individuals classified as STs based on their neural responses also showed the most
maladaptive eating patterns of all the groups. Finally, in a study which utilised tRNS during
the training phase of an AST, tRNS applied to the occipital cortex (which houses the visual
cortex) produced a sign-tracking effect while the tRNS frontal cortex and sham tRNS groups
56
did not (Van Koningsbruggen, Ficarella, Battelli, & Hickey, 2016). The authors concluded
that neural plasticity can contribute to value-modulated attentional capture.
The brain regions identified in the sign-tracking literature are also involved in general
reward processing and have been linked to differential functioning in hard drugs users and
addicts. For example, dysfunction of D2 receptors in the ventral striatum (where the NAcc is
located) may contribute to the attribution of incentive salience for alcohol-paired cues and
subsequent cue-evoked craving (Heinz et al., 2004). Further, D2 receptor activity in the
dorsal striatum (caudate and putamen) is reduced when exposed to cocaine cues, and this is
related to subjective craving (Volkow et al., 2006). Similarly, D2 receptor occupancy in the
putamen correlates with cue-elicited craving (Wong et al., 2006). Moreover,
methamphetamine addicts show reward-evoked activation in the striatum, with abstinent
addicts showing increased activation in the putamen and caudate compared to relapsed
addicts (Gowin, Ball, Wittmann, Tapert, & Paulus, 2015). Finally, a review of the data
suggests the ventral pallidum is a key structure in encoding incentive and hedonic stimuli, as
well as in the motivation to attain such stimuli (Smith, Tindell, Aldridge, & Berridge, 2009),
and a meta-analysis of 142 studies concluded that reward outcome significantly activates the
NAcc and amygdala (Liu, Hairston, Schrier, & Fan, 2011). All of these data taken together
suggest a link in the neurological underpinnings of sign-tracking in humans and nonhuman
animals, as well as a link to aberrant outcomes (such as drug dependence).
1.5.3 Influence of Early Life Experiences
Animals
57
In addition to biological factors, preclinical work has shown that environmental factors
influence sign-tracking development. The studies covered here span three areas of influence:
I) the impact of drugs during adolescence, II) the impact of food restriction and inadequate
social experience during childhood and adolescence, and III) the impact of exposure to
pavlovian autoshaping (sign-tracking) paradigms in adolescence. The first two factors in
particular are important as they have been associated with increased risk of substance use
disorders in humans (Dube, Anda, Felitti, Edwards, & Croft, 2002; Meier et al., 2016).
Beginning with exposure to autoshaping, adolescent rats exposed to an autoshaping
procedure demonstrated larger sign-tracking in adulthood compared to control rats tested
only in adulthood (R. I. Anderson & Spear, 2011). Further, adolescent autoshaping pre-
exposure increased ethanol consumption in adult sign-trackers. This is the only study to
assess the impact of mere exposure to autoshaping procedures in adolescence on behaviour in
adulthood.
Three studies have investigated the influence of inadequate early life socialisation on
adult sign-tracking. The first found that artificially reared (AR) rats – rats deprived of
maternal and sibling interaction – were more likely to develop sign-tracking behaviours than
maternally reared (MR) rats (Lomanowska et al., 2011). Rats who received some tactile
stimulation during their social deprivation (AR + STM) developed sign-tracking behaviours
intermediate to that of AR and MR rats. A second study revealed that food restriction
promoted sign-tracking among socially isolated adolescent rats, while promoting goal-
tracking in pair-housed (social) adolescent rats, revealing an interaction between social and
food deprivation (R. I. Anderson et al., 2013). Food restriction in adults increased both sign-
tracking and goal-tracking behaviours (in members of each respective phenotype) regardless
of their social housing situation. The third study found that rats reared in isolated
58
environments (small, hanging cages with no novel objects or social cohorts) predominantly
became STs, while rats reared in enriched environments (large cages, novel objects and social
cohorts) became GTs (Beckmann & Bardo, 2012). These findings suggest that social
environment during early life is maybe important in the development of sign-tracking.
Turning to how consumption of drugs in adolescence influences the development of
sign-tracking, the earliest study conducted found that, although amphetamine increased sign-
tracking, it did so with no observable differences between age groups (Doremus-Fitzwater &
Spear, 2011). Studies using alternative substances have found different results. Ethanol-
treated adolescents sign-track significantly more in adulthood than control-treated
adolescents (McClory & Spear, 2014). Crucially, these effects were not seen in rats exposed
to ethanol only in adulthood, suggesting that ethanol exposure during adolescence is key.
Additionally, intermittent ethanol exposure in adolescence increased sign-tracking and
blunted goal-tracking in adulthood (Madayag et al., 2017). Finally, adolescent cocaine
exposure increased goal-tracking in low-responder rats (‘addiction-resilient’), but caused no
change in high-responders (‘addiction-prone’), a surprising result given the findings of
cocaine influence on adult sign-tracking (see section 1.5.4) (García-Fuster, Parsegian,
Watson, Akil, & Flagel, 2017).
Overall, the literature on the influence of early life experience suggests that food
deprivation and social isolation in adolescence and childhood can (separately and in
conjunction) elevate sign-tracking in adulthood. Further, the evidence on the influence of
drug consumption during adolescence suggests that, depending on the substance and
population used, adolescent drug exposure can increase adult sign-tracking and perhaps goal-
tracking. However, these results should be interpreted with caution as most of the cited
studies did not include an appropriate adult control group. Finally, mere exposure to an
59
autoshaping paradigm has been shown in one study to elevate ethanol consumption in rats
prone to sign-tracking, perhaps indicating that stimulus-reward learning in adolescence may
enhance the effects of reward-seeking in later life, but only for those who sign-track.
Humans
Though there is evidence of a relationship between reward-related attentional bias in
adolescence and substance use years later, such studies have not measured sign-tracking (van
Hemel-Ruiter et al., 2015). However, one study has attempted to investigate the interaction of
age and sign-tracking in humans. In this study, 40 adolescents and 40 adults were tested on a
typical AST. Although both groups demonstrated sign-tracking, the effect was exacerbated
and persisted longer in the adolescents (Roper et al., 2014). Visual working memory (VWM)
was also measured in both groups, with results showing that – contrary to other studies in
adults (B. A. Anderson, Kronemer, et al., 2016; B. A. Anderson & Yantis, 2012) –
developmental differences in VWM capacity did not account for differences in sign-tracking.
These results provide evidence that younger people sign-track to a greater extent, but
provide no insight as to why this is the case. It is also of note that these results conflict with
work in animals showing that adult rats sign-track to a greater degree than adolescents (R. I.
Anderson et al., 2013; R. I. Anderson & Spear, 2011; Doremus-Fitzwater & Spear, 2011).
However, without knowing the mechanism of the human finding, the reasons for this conflict
are unknown. No study has investigated whether sign-tracking is linked to childhood trauma,
though the latter is a known precursor for later substance abuse (Dube et al., 2002). Future
work could explore the possible relationship between early trauma, enhanced attribution of
incentive salience to irrelevant reward cues (sign-tracking), and substance use.
60
1.5.4 Influence of drugs
Animals
In addition to the studies reviewed above showing how age and drug consumption interact,
studies have investigated how substances alter tracking behaviours more generally. These
studies can be likened to human priming studies which assess the influence of acute alcohol
consumption on various cognitive measures such as attentional bias (see ‘Humans’, below)
(Rose, 2013). The preclinical literature has explored the effects of the following:
amphetamine, cocaine, ethanol, flupenthixol, ketamine, nicotine and opioids.
Amphetamine’s influence on sign-tracking has the largest evidence base. Excluding an
early study (Holden & Peoples, 2010), research has shown that rats that have undergone
amphetamine sensitisation show enhanced sign-tracking relative to controls (M. J. F.
Robinson, Anselme, et al., 2015). Further, acute amphetamine injection into the dorsolateral
quadrant of the neostriatum (DLS) of STs selectively enhances their approach toward a
reward-paired lever-CS (DiFeliceantonio & Berridge, 2016). Acute amphetamine exposure
also increases sign-tracking towards a light-CS, with presentation of the CS inducing activity
in the nucleus accumbens (NAcc) (Wan & Peoples, 2008). Similarly, amphetamine injection
into the NAcc core enhances incentive motivation for a reward-paired lever-CS in STs, but
not GTs (Singer, Guptaroy, et al., 2016). In addition to the result that amphetamine injection
enhances sign-tracking in STs, DiFeliceantonio and Berridge (2016) found that the same
injection in GTs enhanced goal-tracking. It even enhanced goal-tracking in some STs (though
to a minor extent). Accordingly, amphetamine appears to promote the reinforcing effects both
of a lever-CS in STs and of a tone-CS in GTs (Meyer et al., 2014). Thus, there is consistent
61
evidence that amphetamine can enhance both sign-tracking and goal-tracking, though this
depends on experimental setup, the brain region targeted and maybe the rat strain tested.
In the first cocaine study, in addition to finding that cocaine-paired CSs (exteroceptive
cues) influenced STs more than GTs, it was also found that STs were primed to a greater
extent to approach cocaine paired-cues than were GTs after cocaine exposure (an
interoceptive cue) (Saunders & Robinson, 2011). Thus, certain interoceptive cues (e.g.,
cocaine) may have the ability to enhance the motivational value (incentive salience) of
exteroceptive cues (cocaine-paired CSs). A more recent study replicated these results
(Saddoris et al., 2016).
For ethanol studies, early research showed that all ethanol doses – daily pre-session
intraperitoneal injections – increased sign-tracking (rapid acquisition of a sign-tracking CR
towards a lever-CS) compared to saline, but only moderate (0.5–0.7 g/kg) and not low or high
(0.25 g/kg, 1 g/kg) doses enhanced sign-tracking statistically significantly towards a food-
related cue in an inverted-U shape dose effect curve (Tomie, Cunha, et al., 1998). Similar
results were obtained by the same group some years later (Tomie, Festa, et al., 2003). In a
more recent study using similar procedures, however, Tomie’s results were not replicated –
the data showed a 0.7 g/kg dose of ethanol reduced sign-tracking as opposed to increasing it
(Versaggi et al., 2016). This could be due to a variety of reasons including the Tomie et al.
(1998; 2003) results being spurious (while ethanol increased sign-tracking over saline, it did
not do so above a no injection control group), or plausibly due to different rat strains being
used (see section 1.5.1). Thus, the findings on alcohol priming are so far mixed. Further work
with adequate control groups and controlling for animal strain, administration procedure, and
dose is needed.
62
The antipsychotic drug and dopamine receptor antagonist flupenthixol has been shown to
markedly impair the expression of sign-tracking, but not goal-tracking CRs (Saunders &
Robinson, 2012). Flupenthixol has also been found to reduce conditioned approach
behaviour, but not conditioned orienting (Yager et al., 2015). The authors of both studies
conclude that flupenthixol may reduce sign-tracking by altering the core of the NAcc’s
dopaminergic system. The only study to assess the influence of ketamine on tracking
behaviours found that a subanesthetic dose decreased sign-tracking and increased goal-
tracking in STs, while leaving GTs unaffected (C. J. Fitzpatrick & Morrow, 2016). Ketamine
may therefore reduce attribution of incentive salience to reward-paired cues – and thereby
reduce the influence of such cues – via NMDA receptor antagonism (see section 1.5.2).
Regarding nicotine, one study found that nicotine pre-treated rats across multiple
experiments increased sign-tracking towards a light-CS, effects which lasted beyond the
pharmacological effects of the drug itself (Palmatier et al., 2013). Similarly, nicotine
enhances sign-tracking towards a food-paired lever-CS, but not goal-tracking (Versaggi et al.,
2016). Nicotine also enhanced the conditioned reinforcing properties of the food-paired cue.
Nicotine may therefore enhance sign-tracking by either facilitation of incentive attribution of
reward-paired cues, or via an acute effect of nicotine on incentive value (with evidence more
strongly in support of the latter).
Finally, research on opioid influence of tracking behaviours dictate that rather than
injecting opioids into the animal, mu opioid receptors are instead directly stimulated or
targeted via direct opioid agonists. Data have shown that DAMGO microinjections into the
central amygdala enhances sign-tracking in STs and goal-tracking in GTs (DiFeliceantonio &
Berridge, 2012; Mahler & Berridge, 2009). Additionally, DAMGO microinjections into the
DLS enhances sign-tracking in STs and goal-tracking in GTs, while also causing STs to work
63
harder to earn presentation of the reward-paired lever-CS (DiFeliceantonio & Berridge,
2016). Interestingly, when the lever-CS was moved to a new (further away) location, STs
tracked the CS following mu opioid receptor stimulation.
Humans
To date, there are no studies examining whether acute drug consumption affects tracking
behaviours in humans. Only two studies have looked at drug use and sign-tracking in
humans. These studies show that opioid-dependent patients display greater sign-tracking
compared to a control group and that substance abuse history correlates with current sign-
tracking behaviour (B. A. Anderson et al., 2013; B. A. Anderson, Kronemer, et al., 2016).
However, these studies don’t assess causality; addicted individuals may have always
possessed greater sign-tracking CRs which may have contributed to their addiction, chronic
substance use/abuse may have elevated sign-tracking, a third factor may exacerbate both, or
all of these causal pathways may be true. Future studies could follow the alcohol priming
literature in which varying doses of alcohol are consumed by participants before completing a
cognitive task (e.g., an attentional bias task). Such studies show that acute consumption of
varying alcohol doses can increase AB towards reward-paired cues (on an inverted-U curve)
in a non-sign-tracking paradigm (Rose, 2013). Given the link between AB, craving and
consummatory behaviour, as well as findings that AB is larger in drugs users versus non-
users (Field et al., 2016), studies investigating the acute effects of drugs (e.g., alcohol) on
sign-tracking and related craving and further ad libitum consumption may be useful.
1.5.5 Sign-Tracking: What are the Causes?
64
Overall, tracking behaviours possess both biological and environmental causes. Using
evidence from a variety of pathways (selective breeding, employing rats from different
colonies, chemogenetic manipulation etc.), it is now clear that tracking phenotypes are at
least moderately heritable and can be strongly genetically influenced (via specific
manipulations). Further, while there is no direct genetic evidence of sign-tracking in humans,
related traits (such as risk-taking and novelty-seeking) do possess a genetic basis, and thus it
seems very likely (especially given that all human behavioural traits are heritable) that human
tracking behaviours are influenced by genetics.
Regarding the neurobiology of tracking, the preclinical evidence for the role of dopamine
in acquisition, expression (maintenance) and the modulation of related behaviours is
overwhelming. Serotonin may help to regulate sign-tracking (with depletion increasing sign-
tracking), while stimulation of mu opioid receptors amplifies sign-tracking. The evidence for
the role of the other neurotransmitters is as yet too tentative to make firm conclusions. These
transmitters and their related receptors primarily act at the striatum (NAcc, caudate and
putamen), amygdalae, VTA, thalamus, hippocampus and ventral pallidum. Additionally,
human neuroscientific sign-tracking studies have shown that activity in the striatum,
amygdalae, inferior frontal gyrus, intraparietal sulcus and visual cortex are associated with
the presence of response-irrelevant high-reward CSs (compared to low-value or no CS), and
that this activity is likely linked to dopaminergic midbrain function.
The preclinical evidence base for the influence of early life experience is mixed.
Although there is relatively strong evidence that social isolation and food deprivation in
adolescence can increase sign-tracking behaviours, the evidence for the influence of
adolescent drug use and early life exposure to autoshaping paradigms on adult sign-tracking
is quite poor (studies investigating both questions lacked appropriate controls). For humans, a
65
single study has provided evidence that adolescents sign-tracking to a greater extent and for
longer than adults, though contrary to other studies in animals and human adults, this
difference was not accounted for by differences in working memory. Amphetamine, cocaine,
nicotine, and opioids appear to enhance sign-tracking in animals, while antipsychotics and
ketamine impairs the sign-tracking CR. The preclinical evidence for the influence of ethanol
is mixed. There are no studies to date assessing acute substance administration on sign-
tracking in humans, though there is some evidence that drug abuse/dependence is associated
with increased sign-tracking (though there is the problem of causal interpretation). Procedural
setup when assessing sign-tracking also plays a large role in the type of tracking CR
observed.
1.6 Summary & Aims
The preceding discussion has outlined sign- and goal-tracking within a learning theory
framework. Evidence from pre-clinical and human research has been presented to highlight
what is known about ST and GT, and also to identify existing questions. Understanding the
behavioural, cognitive and neural signature of sign-tracking may further our understanding of
the development of substance use disorders, identify risks for harmful substance use, and
inform future treatments. The general aim of this thesis is to build on previous work in human
sign-tracking (B. A. Anderson, 2016b; B. A. Anderson, Kronemer, et al., 2016; Garofalo & di
Pellegrino, 2015; Le Pelley et al., 2015) and extend findings to investigate I) whether sign-
tracking effects hold up using larger samples than have been used previously, II) whether
sign-tracking is driven by pavlovian conditioning, III) how variations of the AST may alter
sign-tracking, IV) how the AST compares to alternative methods of measuring sign-tracking,
V) whether acute alcohol exposure influences sign-tracking, VI) whether the neuroscientific
66
results obtained so far can be replicated and extended, and VII) whether sign-tracking is
associated with other individual difference measures (such as alcohol consumption and
impulsivity).
Chapter Three: Investigated human sign-tracking using a variation of the AST (ASTT)
on the largest sample to date. The mechanism via which sign-tracking develops (namely
pavlovian learning) was assessed. Further, individual difference measures (weekly alcohol
consumption, impulsivity, childhood trauma) were obtained and associations with sign-
tracking assessed – these potential associations were measured in every study.
Chapter Four: Investigated the influence of two different doses of alcohol administration
(0.3 g/kg vs. 0.6 g/kg) on sign-tracking expression across two experiments.
Chapter Five: Investigated the influence on sign-tracking of an ASTT which employed
three (rather than the usual two) noncontingent, reward-associated distractors.
Chapter Six: Compared sign-tracking responses across three different task setups: I)
ASTT (eye-tracking), II) ASTT (button-box), and III) a Pavlovian-to-Instrumental Transfer
(PIT) task.
Chapter Seven: Investigated sign-tracking on the ASTT (button-box) in an fMRI design.
Participants were recruited from previous studies and the stability of sign-tracking across
time was assessed.
Chapter Eight: Supplementary analyses investigating the influence of potential
covariates and confounds on sign-tracking.
Chapter Nine: An examination of ASTT outcome measures (e.g., a statistical assessment
of whether different outcome measures correlate).
67
Chapter Two
General Methods
This chapter will overview equipment hardware and task and analysis software. It will detail
the variation of the additional singleton task and questionnaires used throughout the thesis.
2.1 Cognitive Tasks
Multiple cognitive tasks were used across the six experiments; however, variations of the
same task – the additional singleton tracking task (ASTT) – were used across all experiments.
The basic version is detailed here and is referred to throughout the thesis.
2.1.1 Hardware/Software for Eye-Tracking Tasks
Inquisit 3.0.6.0: Inquisit (Millisecond Software, 2011) was used to program all tasks. Font
style and size for on-screen instructions (Arial, 14pt), feedback text (Arial, 4.79% of screen
size) and fixation crosses (Arial, 64pt) were kept consistent across trials, participants and
tasks. All other details (unless specified) were also maintained across tasks, including the
number of trials (300 per task; M. Le Pelley, personal communication, December 5th, 2013).
All trials were displayed against a black background.
68
Eye-Tracker: In order to accurately monitor participants’ eye movements, the Eye-Trac
D6 (Applied Science Laboratories, Bedford, MA) was used. The sampling rate was 120Hz.
Gaze direction was measured in degrees, once every 8.5ms, dwell times were defined as eye
movements stable to within 1° of the visual angle for at least 100ms, and all measures were
taken only in relation to areas of the screen housing the predictive CSs and OTs (i.e., the areas
of interest). The ASTT and Multi-Target Tracking Task (MTTT) utilised the feedback
capabilities of the eye-tracker; responses were made via eye movements, registered in real
time and used to supply participants with their performance feedback after each trial.
SPSS: Various versions (versions 19.0, 22.0 and 24.0) of the Statistical Package for the
Social Sciences (IBM Corp.) were used to analyse data.
Picture Editing: The creation, manipulation or customisation of the images and stimuli
used in the tasks throughout this thesis were done via Paint software (Microsoft Windows,
version 6.1).
2.1.2 Additional Singleton Tracking Task (ASTT)
The ASTT is an adaptation of the additional singleton task (AST) (Theeuwes, 1991, 1992,
2010). Each trial presents a fixation cross in the centre of the screen for the entire trial; after
800ms six shapes (all 240×240 pixels) appear in a circular formation around the screen’s
outer edge and remain for 2000ms or until a response is recorded. On each trial, participants
are instructed to look for the single grey diamond shape (outcome target; OT) while ignoring
the circles. No button-pressing is required during the task, responses are given solely via eye
gaze. Of the circles, four are grey and one is coloured (red or blue; conditioned stimuli, CSs).
The coloured circles are paired with either high or low reward. That is, they alert the
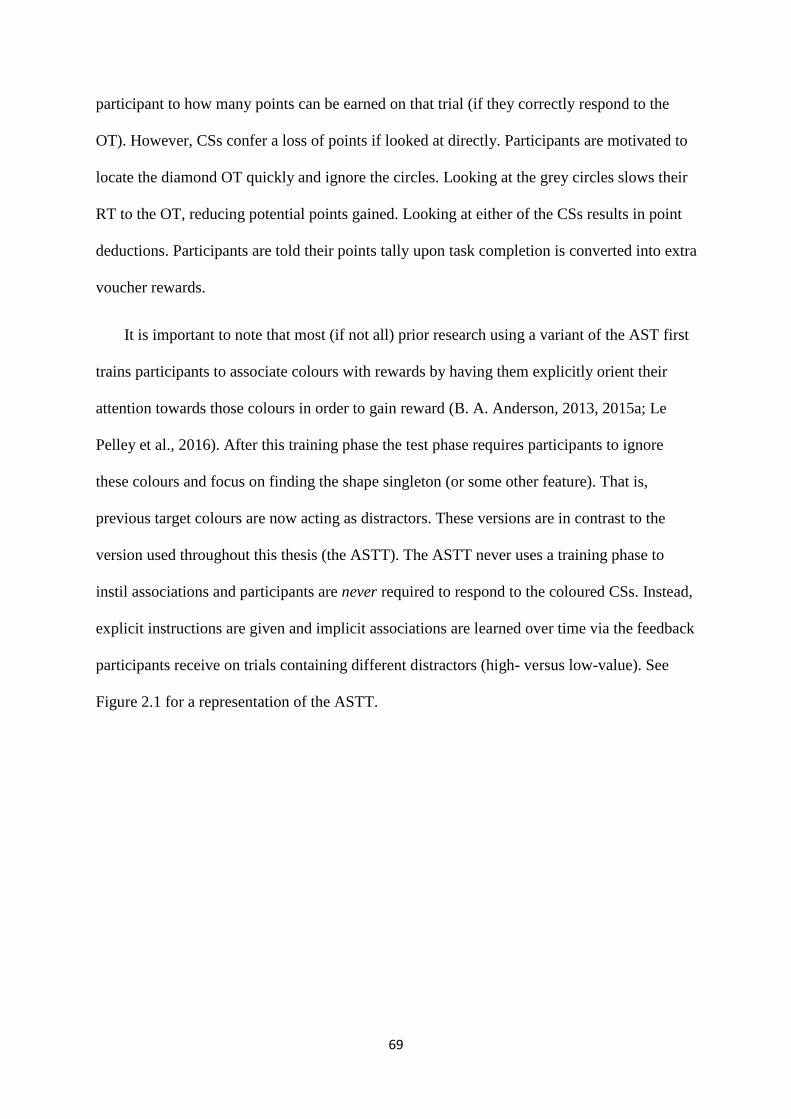
69
participant to how many points can be earned on that trial (if they correctly respond to the
OT). However, CSs confer a loss of points if looked at directly. Participants are motivated to
locate the diamond OT quickly and ignore the circles. Looking at the grey circles slows their
RT to the OT, reducing potential points gained. Looking at either of the CSs results in point
deductions. Participants are told their points tally upon task completion is converted into extra
voucher rewards.
It is important to note that most (if not all) prior research using a variant of the AST first
trains participants to associate colours with rewards by having them explicitly orient their
attention towards those colours in order to gain reward (B. A. Anderson, 2013, 2015a; Le
Pelley et al., 2016). After this training phase the test phase requires participants to ignore
these colours and focus on finding the shape singleton (or some other feature). That is,
previous target colours are now acting as distractors. These versions are in contrast to the
version used throughout this thesis (the ASTT). The ASTT never uses a training phase to
instil associations and participants are never required to respond to the coloured CSs. Instead,
explicit instructions are given and implicit associations are learned over time via the feedback
participants receive on trials containing different distractors (high- versus low-value). See
Figure 2.1 for a representation of the ASTT.
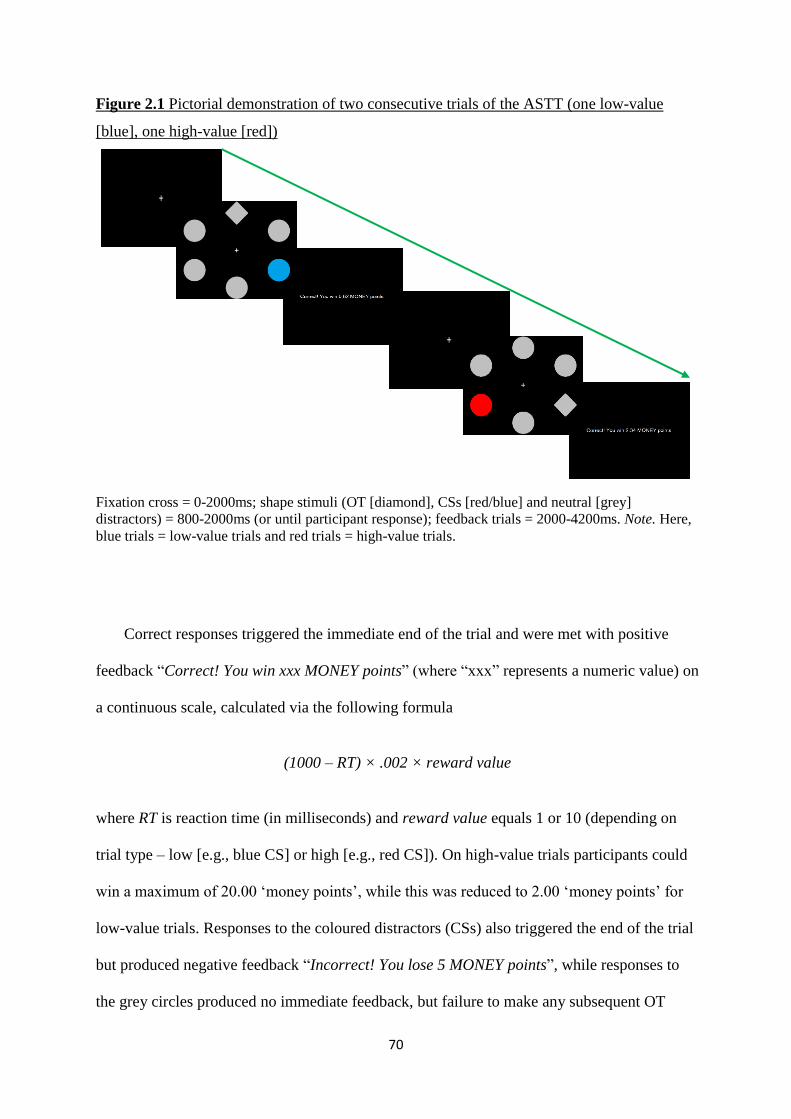
70
Figure 2.1 Pictorial demonstration of two consecutive trials of the ASTT (one low-value
[blue], one high-value [red])
Fixation cross = 0-2000ms; shape stimuli (OT [diamond], CSs [red/blue] and neutral [grey]
distractors) = 800-2000ms (or until participant response); feedback trials = 2000-4200ms. Note. Here,
blue trials = low-value trials and red trials = high-value trials.
Correct responses triggered the immediate end of the trial and were met with positive
feedback “Correct! You win xxx MONEY points” (where “xxx” represents a numeric value) on
a continuous scale, calculated via the following formula
(1000 – RT) × .002 × reward value
where RT is reaction time (in milliseconds) and reward value equals 1 or 10 (depending on
trial type – low [e.g., blue CS] or high [e.g., red CS]). On high-value trials participants could
win a maximum of 20.00 ‘money points’, while this was reduced to 2.00 ‘money points’ for
low-value trials. Responses to the coloured distractors (CSs) also triggered the end of the trial
but produced negative feedback “Incorrect! You lose 5 MONEY points”, while responses to
the grey circles produced no immediate feedback, but failure to make any subsequent OT
71
response again produced negative feedback. Feedback was presented for 1500ms11. CS
colour-reward contingencies were counterbalanced across participants and six practice trials
were completed prior to three-hundred experimental trials. The task lasts 21 minutes.
Sign-tracking is inferred from I) slower responses to the OT on high-value compared to
low-value trials, and II) greater omissions (CS responses) on high-value compared to low-
value trials. See Appendix A for calculations of outcome variables.
2.2 Questionnaires
The same questionnaire pack was used across all six experiments (with some alterations, see
footnotes). Therefore, each self-report questionnaire is described below. These questionnaires
were chosen based on previous research (animal and human) suggesting links between
tracking behaviours and various individual differences (e.g., substance use habits [including
risky substance use], impulsivity, early trauma etc.) (B. A. Anderson et al., 2013; B. A.
Anderson, Kronemer, et al., 2016; Belin, Belin-Rauscent, Everitt, & Dalley, 2016; Flagel,
Akil, et al., 2009; Garofalo & di Pellegrino, 2015; T. E. Robinson et al., 2014; Tomie et al.,
2008).
TimeLine FollowBack (TLFB; Sobell & Sobell, 1992)
Using a diary format, the TLFB measures daily alcohol consumption over the previous two
weeks. Daily estimation methods have been shown to offer a range of advantages over
11 The ASTT used in Study 1 (Chapter Three) differs from the rest with respect to the duration of feedback trials. The Study 1 ASTT presented feedback trials for 1500ms, however all subsequent ASTTs presented feedback for 2200ms (to ensure the participant had adequate time to process the information).
72
Quantity-Frequency estimates (Sobell & Sobell, 1995 [in Allen & Columbus]), and the TLFB
itself is a well-established measure of past consumption (Sobell, Maisto, Sobell & Cooper,
1979; Sobell, Sobell, Khajner, Pavon & Basian, 1986). Evidence suggests that the general
public has poor awareness of how many alcohol units their drinks contain (Das et al., 2014;
White et al., 2005; YouGov survey, 2008 [in House of Commons Health Committee, 2010, p.
59]). Participants were therefore asked to write down, as accurately as possible, every
alcoholic drink they had consumed over the previous fortnight, including the brand wherever
possible (to determine Alcohol By Volume, ABV). An online alcohol unit calculator
(Drinkaware, 2013) was used to compute mean weekly alcohol unit consumption (1 unit = 8 g
alcohol) and binge frequency (≥8 units for men and ≥6 units for women per drinking episode)
(Reinert & Allen, 2007)12. A ‘typical week’ measure was also taken when participants
struggled to remember the previous fortnight or when consumption during this time period
was atypical (i.e., unusually heavy or light).
Alcohol Use Questionnaire (AUQ; Mehrabian & Russell, 1978)
The AUQ is a quantity-frequency index of alcohol consumption. The version employed here
utilising only some aspects of the AUQ, including questions regarding units consumed per
hour, age at first drink, age at which regular drinking began, total number of times being
drunk in the previous six months (‘drunk frequency’), and the estimated percentage of
drinking occasions in which one gets drunk (‘drunk percentage’).
12 Note that in the United Kingdom these recommendations have recently been changed, with a binge now considered to be the consumption of >6 alcohol units in one occasion for both men and women (Department of Health, 2016). However, all studies have analysed binge scores based on the old criteria (≥8 units for men, ≥6 units for women).
73
The Alcohol Use Disorders Identification Test (AUDIT; Saunders, Aasland, Babor, De la
Fuente & Grant, 1993)
Originally developed as a clinical tool, the AUDIT is a ten-item scale. The first three
questions relate to quantity and frequency of alcohol use, and the remaining 7 assess
behaviours associated with drinking and its consequences. Scores range from 0 (minimum) to
40 (maximum). In men, a score of 8 or above is used to signify hazardous alcohol use, while a
score of 5 or above is used for women. The AUDIT has good internal consistency as a single
factor when used in university students (Cronbach’s α = .82, Shields, Guttmanova & Caruso,
2004), and in more broad populations a meta-analysis by Reinert and Allen (2007) showed
that it possesses good internal reliability (median reliability coefficient = .83), test-retest
reliability (mean interclass correlation coefficient, ICC = .860), as well as construct and
criterion validity.
Modified Drinking Motives Questionnaire – Revised (Modified DMQ-R; Grant,
Stewart, O’Connor, Blackwell, & Conrod, 2007)
A self-report questionnaire consisting of 28 items, this version is a compilation of Grant et al's
five-factor Modified Drinking Motives Questionnaire and Cooper's (1994) Drinking Motives
Questionnaire: Revised (M DMQ-R). Grant et al (2007) found that their social subscale
(Cooper, Russell, Skinner and Windle, 1992) is less reliable than Cooper’s revised version
(Cooper, 1994), thus recommend a combined version of the scale. The scale is divided into 5
factors: Social, Conformity, Coping-anxiety, Coping-depression and Enhancement motives for
alcohol use. Higher scores on a particular subscale indicate greater motivations to drink for
that particular reason. The questionnaire’s subscales perform well on measures of internal
74
consistency (ranging from α = .61 to α = .91) and test-retest reliability (ICC = .610 to .780;
Grant et al., 2007). Furthermore, various subscales have been shown to predict alcohol-related
behaviours (Grant et al., 2007; Mezquita et al., 2011). Each item is assessed on a five-point
frequency scale (Almost Never/Never, Some of the time, Half of the time, Most of the time,
Almost Always/Always)13.
The Brief Young Adult Alcohol Consequences Questionnaire (B-YAACQ; Kahler,
Strong, & Read, 2005)
A self-report questionnaire consisting of 24 items designed to assess a full range (from low
severity to high) of alcohol-related problems in the past year. For example, it assesses
significant alcohol consequences, including regretted experiences (impulsive acts, social
misbehaviour), highly risky experiences (significant blackouts, driving while impaired),
impaired functioning (missed classes, loss of energy), and difficulty limiting drinking. The
remaining seven items reflect increased social impairment (poor work/school performance,
neglected obligations, interpersonal problems), significant longer-term physical consequences
of drinking (being overweight from drinking, worse physical appearance), and finally
indications of significant physiological dependence (e.g., needing a drink upon wakening;
Kahler et al., 2005).
Higher scores indicate an increased tendency towards high risk situations regarding
alcohol use. Item-severity estimates ranged from -3.16 to 2.50, suggesting that items cover a
comprehensive spectrum of severity of alcohol problems. The B-YAACQ also highly
13 It should be noted that in Study 1 (Chapter Three) a four-point scale was used (Never/Almost Never, Sometimes, Often, Almost Always/Always). Some of the items were also worded slightly differently (e.g., item 7 in the Grant et al. (2007) paper reads “To be sociable”, while item 7 in Study 1 read “Because it makes social gatherings more fun”). These updates were made in subsequent studies.
75
correlates with its larger parent form, the YAACQ (r = 0.95), has similar internal consistency
(α = .83 vs α = .89) and is similarly associated with frequency of alcohol consumption (r =
.350 and r = .360; Kahler et al., 2005). The B-YAACQ is rated dichotomously (yes/no)14.
Alcohol Purchase Task (APT; Murphy & MacKillop, 2006)
A behavioural-economic questionnaire that assesses individuals’ demand for alcohol
consumption at the moment of the task. Participants are asked to imagine ‘one drink’ as a
typical pint of beer, glass of wine, shot of spirit (with/without mixer) before being instructed
to “Imagine that you and your friends are at a bar from 9 p.m. to 2 a.m. to see a band. The
following questions ask how many drinks you would purchase at various prices.” (Murphy &
MacKillop, 2006, p. 221).
The scale consists of 25 items (as opposed to the 14 items of the original) and price
ranges extend from £0 to £15 (Amlung, Acker, Stojek, Murphy & MacKillop, 2012). The
construct of relative reinforcing efficacy (RRE) is used to assess alcohol demand via 5
metrics: (a) Breakpoint: first price at which consumption is zero; (b) Intensity of demand –
Observed: consumption at minimum price (i.e., free); (c) Elasticity of demand:
sensitivity/change in demand as price increases; (d) Pmax – Observed: price of each drink at
Omax (i.e., price at which drink expenditure is maximised); (e) Omax – Observed: maximised
total expenditure on a single purchase.
14 The version of the B-YAACQ employed in Study 1 (Chapter Three) rated responses on a four-point scale (Never/Almost Never, Sometimes, Often, Almost Always/Always) rather than dichotomously. This rating scale has been shown to be less reliable (Kahler et al., 2005). Additionally, the B-YAACQ instructional set asks participants to respond only if they have experienced the situations in the past year; the version used in Study 1 did not include this instruction. These updates were made in subsequent studies.
76
For (c) Elasticity of Demand, values were calculated using the equations below (Hursh,
Raslear, Shurtleff, Bauman, & Simmons, 1988; Hursh & Silberberg, 2008)
1n Q = 1n L + b(1n P) – aP,
where 1n equates to a log transformation, Q is quantity consumed, L is consumption at
“unrestricted access” (i.e., free), b is the declining slope of the demand curve after a miniscule
increase in price (in this case, the difference in consumption between unrestricted access
[free] and the first increase in price [£0.01]), P is price, and a is the rate of decline of
consumption (b) as a function of P (for every unit increase). Elasticity (e) can then be derived
via:
e = b – aP
Thus, b and a are fixed parameters for each demand curve, meaning that e changes as a
linear function of P. Individual elasticity is derived for each price, and an overall measure of e
is calculated as the mean of these values for each participant, with greater negative values
indicative of greater price sensitivity/elasticity (Jacobs & Bickel, 1999).
Finally, APT indices seem to be reliably associated with actual alcohol use behaviours
and characteristics. In a study of nearly 5000 people, Intensity of Demand was found to be
correlated with alcohol use, alcohol use disorder (AUD) criteria, and number of
consequences. Omax was also correlated with alcohol use (Bertholet, Murphy, Daeppen, Gmel,
& Gaume, 2015). Additionally, a recent meta-analysis has shown APT measures are
correlated with alcohol-related problems and drinking behaviours, with the Intensity of

77
Demand index predictive of heavy alcohol use and predictive of alcohol use disorder
symptoms (Kiselica, Webber, & Bornovalova, 2016)15.
Barratt’s Impulsivity Scale (BIS–11; Patton, Stanford & Barratt, 1995)
A self-report questionnaire comprised of 30 items assessing trait-like impulsivity. Each item
is assessed on a four-point frequency scale (Never/Rarely, Occasionally, Often, Almost
Always) and scores range from 30 to 120, with higher scores indicating higher impulsivity.
Scores below 52 indicate overly-controlled individuals, while scores above 71 indicate highly
impulsive individuals. The BIS–11 contains 6 first-order factors (attention, motor, self-
control, cognitive complexity, cognitive instability, and perseverance) and 3 second-order
factors (motor, attentional, and non-planning impulsiveness). Throughout this thesis, only a
total score and second-order factors are used. A review of the literature in which the majority
of participants were university students revealed a robust internal consistency (α = .83) and
test-retest reliability (rs = .83) (Stanford et al., 2009).
Impulsive Sensation-Seeking Scale (ImpSS; Zuckerman, Kuhlman, Joireman, Teta, &
Kraft, 1993)
A subscale of the Zuckerman-Kuhlman Personality Questionnaire III (ZKPQ III) which
assesses sensation seeking and impulsivity traits. The version employed here utilises a four-
point rating scale (Very False for Me, Somewhat False for Me, Somewhat True for Me, Very
15 Alcohol Purchase Task measures were only included in Study 1 (Chapter Three) as all subsequent studies obtained questionnaire measures online before participants attended the laboratory. Given this, APT measures may not be validly associated with task (ASTT) measures as they are temporally distal.
78
True for Me) for each of the 19 items. The scale consists of 11 sensation-seeking items and 8
impulsivity items. The items on sensation seeking assess 4 components: Thrill and Adventure
Seeking (TAS: desire to engage in [physically] risky activities), Experience Seeking (ES:
tendency for novelty seeking), Disinhibition (Dis: propensity to seek sensation via activities
such as attending parties, social drinking and sex), and Boredom Susceptibility (BS:
intolerance for repetitive activities of any kind) (Zuckerman, 1994). Across multiple
experiments, the ImpSS scale acquired an average internal consistency of α = .80 (rounded
up; Zuckerman et al., 1993).
Child Abuse and Trauma Scale (CATS; Kent & Waller, 1998; Sanders & Becker-
Lausen, 1995)
A self-report questionnaire that assesses negative childhood experiences, especially in relation
to parental (and general familial) abuse. Each of the 38 items is measured on a five-point
frequency scale (Never, Rarely, Sometimes, Very Often, Always) ranging from 0-4. Sanders
and Becker-Lausen (1995) identified 3 subscales: negative home environment and/or neglect
(14 items), punishment (6 items) and sexual abuse (6 items). Subsequently, Kent and Waller
(1998) identified another subscale: emotional abuse (7 items). The internal reliability of the
subscales ranges from α = .61 to α = .88, with the overall scale producing α = .90. Finally, the
CATS correlates with ratings of depression (r = .36) and anxiety (r = .409; Kent & Waller,
1998).
2.3 Additional Research Aspects

79
There are aspects of work undertaken that will not be discussed in the remainder of the thesis.
However, they are briefly outlined here as they formed part of the PhD process and give
context to some aspects of the thesis.
2.3.1 Equipment Maintenance and Repair
The running of experiments throughout this thesis required familiarity with technologies to
the point of being able to setup and maintain the equipment, while also repairing any
hardware or software problems that arose. All experiments except one utilised eye-tracking
technology. The ASL Eye-Trac D6 (Applied Science Laboratories, Bedford, MA) was
employed in five of the six studies contained in this thesis. Six months in total (spread over
two years) was spent improving the performance of, maintaining and repairing the Eye-Trac
D6.
The only experiment which did not use eye-tracking technology was Study 6 (Chapter
Seven). Repair of the previously defunct ASL Eye-Trac 504 with Long Range Optics (R-
LRO6 – XG) (Applied Science Laboratories, Bedford, MA) for use inside an fMRI scanner
took three months. However, though the equipment now works, the spatial and temporal
resolution of the eye-tracker was still too poor for use on the ASTT. Thus, for Study 6 a
button-box was used to record responses. The Gazepoint GP3 Desktop eye-tracker
(Gazepoint Research Inc., Canada) was also set up, but not used for various reasons.
2.3.2 Study 7
80
Given the importance of determining whether ST and GT are differentially associated with
AUDs, a study was developed to compare ASTT performance between patients diagnosed
with an alcohol use disorder with an age- and gender-controlled sample of social drinkers.
The process of setting the study up (including obtaining NHS ethical approval and arranging
recruitment procedures with the Alcohol Service department of the Royal Liverpool
University Hospital) took approximately fourteen months. However, there was continued
difficulty in recruiting patients, and after several months only one patient had been tested.
Given that the study required a sample of 30 patients and 30 matched controls, a decision was
made to cancel the study. This provided the opportunity to run studies 4 and 5 (Chapters Five
and Six), which focus on testing predictions made based on earlier findings (Study 4) and to
replicate previous research and ensure the methodological rigor of the ASTT (Study 5).
81
Chapter Three
Human Sign-Tracking: A Large-Scale Investigation
in Social Drinkers
3.1 Abstract
Background: Research has noted similarities between sign-tracking – valuing conditioned
stimuli (CS) as if they were unconditioned stimuli (US) – and indicators of substance use in
animals. Goal-tracking – utilising CSs only for their predictive value – has also been linked to
excessive consumption. Aims: To identify associations between tracking outcomes (measured
via validated and novel eye-tracking tasks) and independent outcome measures (e.g., drinking
habits). Methods: Social drinkers (N = 98) completed the tasks, in which CSs predicted
whether high- or low-value USs were available, and were instructed to locate the US and
ignore CSs. Individual measures of drinking behaviours, outcomes, and risk factors for
hazardous consumption were measured via questionnaires. Results: Tracking behaviours
were identified only via the validated task. Sign-tracking was indicated by slower RTs to the
US and greater omissions on high-value compared to low-value trials. Tracking was not
associated with individual differences. Conclusions: Using translational methods, human
sign-tracking was distinguished from goal-tracking in the largest study to date. However,
predictions of an association between tracking and individual differences were unsupported.
This may highlight differences across preclinical and human research, and suggests a
complex relationship between value attribution and behaviour.
Keywords: Sign-tracking, Goal-tracking, Alcohol, Attentional bias, Eye-tracking
82
3.2 Introduction
Sign-tracking (the attribution of incentive salience towards noncontingent, discrete
conditioned stimuli [CSs]) and goal-tracking (using such CSs to predict the onset of reward,
attributing incentive value only to contextual cues) have been associated with substance-use
behaviour in animals. Although it is unclear how these learned behaviours may be associated
with alcohol consumption in humans, it has been suggested that the value attributed to a
stimulus is important (Field et al., 2016; Rose, Brown, Field, & Hogarth, 2013). It is also
known that stimuli which individuals value attract greater attention, which can be observed
via eye-tracking paradigms that measure attentional bias (AB) (Field & Cox, 2008). General
substance AB measures are associated with self-reported craving and impulsivity (Field et al.,
2009; Leung et al., 2017) and may be clinically relevant for certain groups (Luijten, Field, &
Franken, 2014; Marissen et al., 2006). In the wider, non-clinical population, substance users
also show enhanced AB towards substance-related stimuli compared to nonusers (Field et al.,
2016). Taken together, AB seems to provide a measure of current value. It is therefore
reasonable to assume that eye-tracking tasks can be utilised to determine whether the
incentive value (as measured by AB) of either irrelevant discrete CSs (sign-tracking) or
outcome targets (OTs) (goal-tracking) is associated with heavier drinking and/or risk factors
for hazardous use.
Preclinical studies using a range of paradigms have shown that a variety of species sign-
and goal-track and that this tracking behaviour is associated with various traits, states and
outcomes, including risk factors for substance misuse (Meyer, Lovic, et al., 2012; T. E.
Robinson et al., 2014; Saunders & Robinson, 2013; Tomie et al., 2008). In humans, various
cognitive tasks have been used to investigate sign-tracking, typically by measuring
participants’ propensity to attend to response-irrelevant, discrete cues which have been paired
83
with reward outcome. The assumption is that humans attend to stimuli that hold incentive
value, and the literature showing the effect of value on attention is now quite large (B. A.
Anderson, 2013, 2015a, B. A. Anderson et al., 2013, 2011a, 2011b; B. A. Anderson,
Kronemer, et al., 2016; B. A. Anderson & Yantis, 2012, 2013; Bucker, Silvis, Donk, &
Theeuwes, 2015; Bucker, Belopolsky, & Theeuwes, 2014; Bucker & Theeuwes, 2014;
Failing & Theeuwes, 2014, 2015; Hickey et al., 2010b; Hickey, Chelazzi, & Theeuwes, 2014;
Jahfari & Theeuwes, 2016; Le Pelley, Mitchell, & Johnson, 2013; Le Pelley et al., 2015;
Munneke, Hoppenbrouwers, & Theeuwes, 2015; Pearson et al., 2015; Roper et al., 2014; Sali
et al., 2014; Theeuwes, 2010; Theeuwes & Belopolsky, 2012; Wang et al., 2014).
Although several theoretical links have been made between sign-tracking and addiction
(Garofalo & di Pellegrino, 2015; Le Pelley et al., 2016, 2015; Tomie et al., 2008), only two
studies so far have explored this link in humans. The first administered the additional
singleton task (AST) to a group of opioid-dependent patients and a group of healthy controls
(B. A. Anderson et al., 2013). They found that, even though all participants actively sign-
tracked towards the discrete, response-irrelevant CSs, patients’ sign-tracking was
significantly greater than controls’. Furthermore, patients scored significantly higher on
impulsivity measures than controls, a characteristic believed to be a risk factor for harmful
drinking (Verdejo-García, Lawrence, & Clark, 2008) (though this was not significantly
correlated with sign-tracking). The second study again administered the AST, this time to a
sample of HIV+ individuals (B. A. Anderson, Kronemer, et al., 2016). The authors found that
sign-tracking was related to substance abuse history and non-planning impulsiveness in the
year leading up to patients’ HIV+ diagnosis.
Several preclinical studies have also investigated the link between sign-tracking and
alcohol. Some studies show a positive relationship between sign-tracking and consumption
(R. I. Anderson & Spear, 2011; Tomie, Sparta, et al., 2002; Tomie, Wong, et al., 2003),
84
others show that alcohol consumption reduces sign-tracking (Versaggi et al., 2016), and
others still that sign-trackers (STs) do not consume more alcohol than goal-trackers (GTs) but
that an alcohol CS acts as an effective conditioned reinforcer in STs but not GTs (Villaruel &
Chaudhri, 2016). No study has performed a similar experiment concerning alcohol use in
humans. The current study will investigate – for the first time – whether any link exists
between sign-tracking and alcohol use in humans. This study will therefore supply original
translational data, bridging the gap between the animal and human literatures.
The most prolific tasks used to measure sign-tracking in humans are variants of the AST
(Theeuwes, 1991, 1992). In a training phase, participants are instructed to attend to certain
colours, with different colours associated with different levels of reward. In a subsequent test
phase, these colours are used as distractors, impeding participants’ new goal of finding the
outcome target (typically a shape or colour which has not been paired with reward). Sign-
tracking is identified via slower responses to the OT and a greater number of omissions
(mistaken responses to the CSs) on trials containing a high-value CS as opposed to a low-
value CS (or compared to trials containing no CS). The ability of reward-associated cues of
different value to manipulate attention to different extents is referred to here as value-
modulated attentional capture (VMAC) (Le Pelley et al., 2016). In a series of three
experiments, Le Pelley et al. (2015) showed that high-value CSs elicit more omissions and
slower OT responses than low-value singletons, that these attentional responses are automatic
(as they are in direct conflict with goal-driven selection), and that these findings are most
plausibly explained by pavlovian conditioning (as omissions were never rewarded). However,
as the authors themselves acknowledge, alternative interpretations allow for an instrumental
conditioning aetiology.
The vast majority of studies employing the AST (B. A. Anderson et al., 2011a, 2011b;
Chelazzi et al., 2013; Donohue et al., 2016; Failing & Theeuwes, 2014, 2015; Kiss et al.,

85
2009; Le Pelley et al., 2015; Theeuwes, 2010; Theeuwes & Belopolsky, 2012) succumb to
the potentially confounding effects of selection and reward history effects, in that the CSs
were previously response-relevant (selection history) and CS responses directly resulted in a
rewarding outcome (reward history). Due to these factors, pure sign-tracking effects cannot
be obtained. Only three studies have removed these confounding factors using an altered
version of the AST with no training phase, and all studies still observed a sign-tracking effect
(Failing et al., 2015; Le Pelley et al., 2015; Pearson et al., 2015). However, all of these
studies contained the alternative problem of providing categorical – rather than continuous –
rewards. This is an issue because, as noted by Le Pelley et al. (2015), this allows for the
opportunity of ‘covert distractor shifts’ towards the CS, before an ‘overt’ shift towards the
OT is made, which still results in a rewarding outcome. This means that attentional shifts
towards the CS are indirectly rewarded via superstitious conditioning (Skinner, 1948)16. It is
also important to know that in the studies above, overt oculomotor capture by the CSs only
resulted in no rewards being gained – no rewards were ever rescinded.
In the current study (and throughout the thesis) a novel variant of the AST – henceforth
the additional singleton tracking task (ASTT) – is used. In the ASTT, participants only ever
respond to the OT, and on every trial one of two coloured CSs predict high or low reward
given an OT response. Both selection and reward history effects are prevented by using CSs
which participants are never instructed to respond to, and which are never rewarded. Further,
the use of continuous (rather than categorical) rewards which are tied to OT reaction times
(RTs) means that covert distractor shifts result in a loss of rewards, and are therefore deterred
(importantly, participants are told this explicitly in the instructions, as well as learning via
experience and feedback). Thus, this study is investigating automatic oculomotor capture
16 However, as Le Pelley et al. (2015) observe, such a ‘covert bias produces oculomotor bias’ argument’ is vulnerable to a negative feedback loop, whereby instrumentally-driven covert distractor-shifts would in turn be instrumentally extinguished when overt oculomotor capture by the CS inevitably occurred.
86
towards CSs which have always been response-irrelevant, which incur a direct loss of
rewards when attended to, and which can therefore only be plausibly produced by pavlovian
– not instrumental – conditioning.
In addition to the ASTT, a second, novel task, termed the multi-target tracking task
(MTTT) is used. This task also utilises eye-tracking and requires participants to first learn a
series of CS-US (colour-reward) contingencies for a range of rewards (chocolate, alcohol,
nothing [control]), before being instructed as to the CS-OT (colour-target) contingencies.
Participants are then presented with each CS in the presence of multiple OTs and are
instructed to disengage from the CS as quickly as possible and find the corresponding OT
(e.g., focus on the left OT when presented with the chocolate CS, the right OT when shown
the alcohol CS etc.). Sign-tracking should be observed via slower initial disengagement from
the reward CSs compared to the control CS as well as a greater number of CS reengagements.
We hypothesised that sign-tracking and goal-tracking tendencies would be measurable
via task performance. For the ASTT, we predicted that high-value CSs would capture more
attention (as shown by slowed OT RTs and increased CS omissions) than low-value CSs. For
the MTTT, we predicted that reward-associated cues would capture more attention (indicated
by slowed RT to disengage from the CS and increased reengagement with the CS) than
neutral cues. Given previous pre-clinical results showing links between risk factors for
harmful drinking (e.g., impulsivity, early trauma etc.) and sign-tracking, we also
hypothesised that sign-tracking would positively correlate with self-report measures of
drinking, impulsivity and childhood trauma. Finally, we hypothesised that individuals’ extent
of sign-tracking would correlate between tasks.
3.3 Method
87
Participants
One-hundred and three participants were recruited via opportunistic sampling, many via
university and social media (e.g., Facebook) advertisements. Of 103 participants, 3 were
excluded due to missing data and 2 were removed due to lack of ability to follow task
instructions; 98 (55 female) remained for analysis. All remaining participants were aged
between 18 and 35 years (M = 23.61, SD ± 4.22). The inclusion criteria were regular
consumption of alcohol (10 units or more per week) and chocolate (consumed at least once
per week), and normal or corrected-to-normal vision. Self-reported past or present alcohol or
drug use problems were exclusions. All participants provided written informed consent before
taking part in the study, and were debriefed upon completion. The study was approved by the
University of Liverpool Research Ethics Committee. All were debriefed upon completion.
Materials
Questionnaires
The questionnaires used in this study are described in detail in General Methods (Chapter
Two). The following questionnaires are used here to measure I) Drinking habits: TimeLine
FollowBack (TLFB), Alcohol Use Questionnaire (AUQ) and the Alcohol Use Disorders
Identification Test (AUDIT), II) Motivations to drink: Modified Drinking Motives
Questionnaire – Revised (M DMQ-R), III) Consequences of drinking: Brief Young Adult
Alcohol Consequences Questionnaire (B-YAACQ), IV) Baseline relative reinforcing effect of
alcohol (i.e., demand for alcohol): Alcohol Purchase Task (APT), V) Impulsivity: Barratt’s
Impulsivity Scale – 11 (BIS-11) and Zuckerman’s Impulsive/Sensation-seeking Scale
(ImpSS), VI) Childhood trauma: Childhood Abuse and Trauma Scale (CATS).
88
Cognitive Tasks
Additional Singleton Tracking Task (ASTT): The ASTT is described here only briefly, for
further details, see Chapter Two (General Methods). The 2 CSs (coloured circles; red and
blue) were chosen so as to not contaminate any previous, or subsequent, colour associations
formed in the MTTT. The task was developed by Theeuwes (1991, 1992), adapted for use in
previous experiments (Gaspar & McDonald, 2014; Le Pelley et al., 2015), and is adapted still
further here to produce the variant referred to as the ASTT. Six practice trials were completed
prior to 300 true trials. Each trial presented a fixation cross in the screen’s centre for the entire
trial. After 800ms, six shapes appear in a circular formation around the screen’s outer edge
and last for 2000ms or until a response is recorded. Feedback lasted 1500ms. Participants’
goal was to find the diamond shape and ignore the five circles (one of which was red or blue).
Engaging the coloured CSs resulted in a deduction of points. High-value trials rewarded
correct responses with up to 20 ‘money’ points, low-value trials with up to 2 ‘money’ points
(See Chapter Two for further details on feedback calculation and presentation). The task took
approximately 21 minutes to complete.
Sign-tracking was measured as I) RTs towards the OT being slower on high-value trials
relative to low-value trials and II) omissions (or overt oculomotor capture by the CS) being
higher on high-value trials relative to low-value trials. It was hypothesised that I) sign-
trackers and goal-trackers could be distinguished based on task performance, and II) sign-
tracking would positively correlate with self-report measures.
Multi-Target Tracking Task (MTTT)
89
Conditioning Phase: Three CSs (pink, yellow and green circles; visible size: 165×175,
given in pixels) were constructed. These colours were chosen so as not to conflict with the
colours used in the ASTT (red and blue). Twenty images from the internet were adjusted for
size, shape and other attributes – images presented in portrait were 235×300 (300×235 for
landscape) – and were split equally between reward types (i.e., 10 alcohol-related images, 10
chocolate-related). The final image was a grey rectangle (neutral stimulus, 400×224). It
should be noted that, though the pixel sizes of the reward/neutral and CS stimuli are different,
they appear perceptually identical on screen. The images were chosen due to their potential
for widespread appeal. That is, most images contained multiple kinds of each reward type
(e.g., alcohol: various beers, wines, and spirits; chocolate: white, dark, bars and cakes. See
Figure 3.1). This was done in an attempt to present participants with at least one reward they
desired in each category. Finally, reward images were divided into a 50:50 ratio of
‘unbranded’ – alcohol already poured into a glass, chocolate already unwrapped – and
‘branded’ – presented in branded wrappers and receptacles – rewards. The distance between
the centre points of paired images was 130mm.
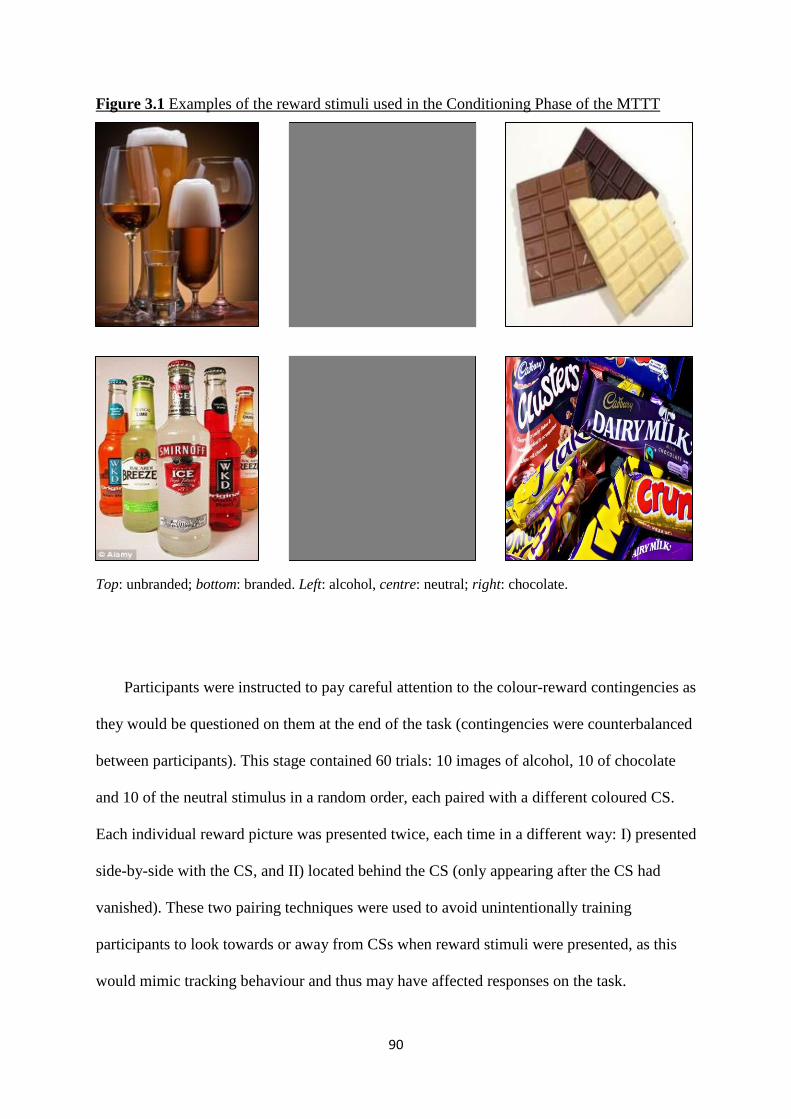
90
Figure 3.1 Examples of the reward stimuli used in the Conditioning Phase of the MTTT
Top: unbranded; bottom: branded. Left: alcohol, centre: neutral; right: chocolate.
Participants were instructed to pay careful attention to the colour-reward contingencies as
they would be questioned on them at the end of the task (contingencies were counterbalanced
between participants). This stage contained 60 trials: 10 images of alcohol, 10 of chocolate
and 10 of the neutral stimulus in a random order, each paired with a different coloured CS.
Each individual reward picture was presented twice, each time in a different way: I) presented
side-by-side with the CS, and II) located behind the CS (only appearing after the CS had
vanished). These two pairing techniques were used to avoid unintentionally training
participants to look towards or away from CSs when reward stimuli were presented, as this
would mimic tracking behaviour and thus may have affected responses on the task.
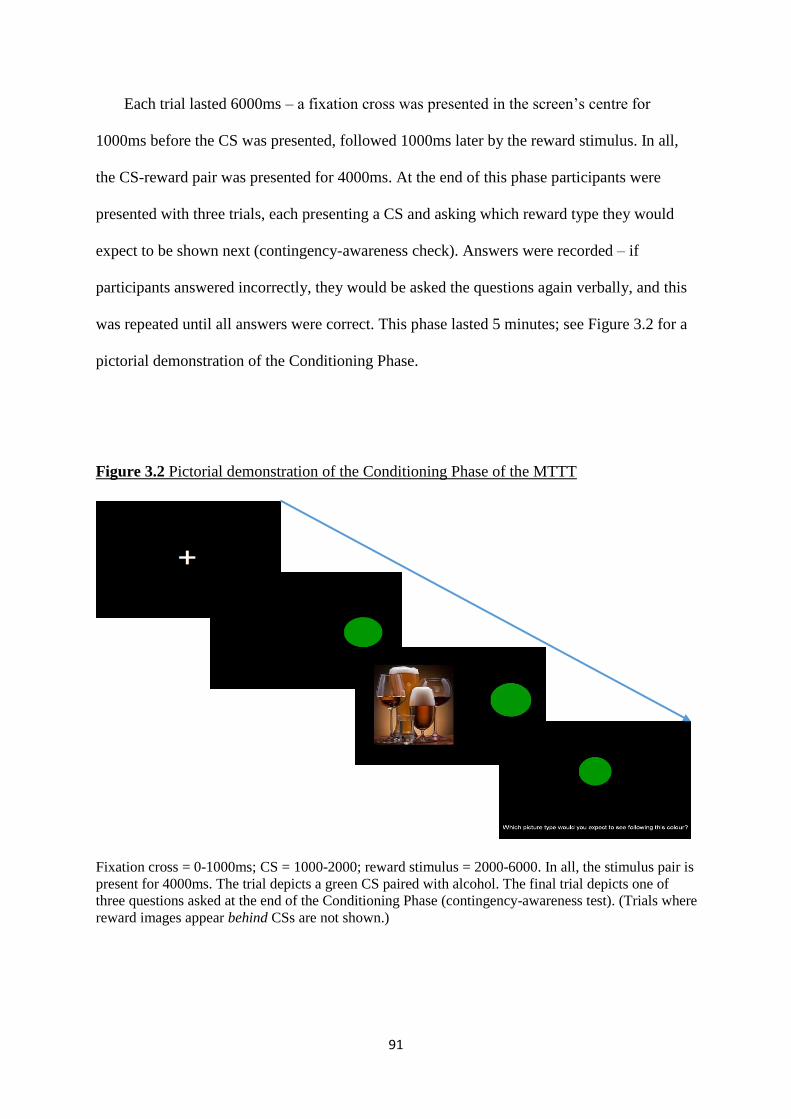
91
Each trial lasted 6000ms – a fixation cross was presented in the screen’s centre for
1000ms before the CS was presented, followed 1000ms later by the reward stimulus. In all,
the CS-reward pair was presented for 4000ms. At the end of this phase participants were
presented with three trials, each presenting a CS and asking which reward type they would
expect to be shown next (contingency-awareness check). Answers were recorded – if
participants answered incorrectly, they would be asked the questions again verbally, and this
was repeated until all answers were correct. This phase lasted 5 minutes; see Figure 3.2 for a
pictorial demonstration of the Conditioning Phase.
Figure 3.2 Pictorial demonstration of the Conditioning Phase of the MTTT
Fixation cross = 0-1000ms; CS = 1000-2000; reward stimulus = 2000-6000. In all, the stimulus pair is
present for 4000ms. The trial depicts a green CS paired with alcohol. The final trial depicts one of
three questions asked at the end of the Conditioning Phase (contingency-awareness test). (Trials where
reward images appear behind CSs are not shown.)
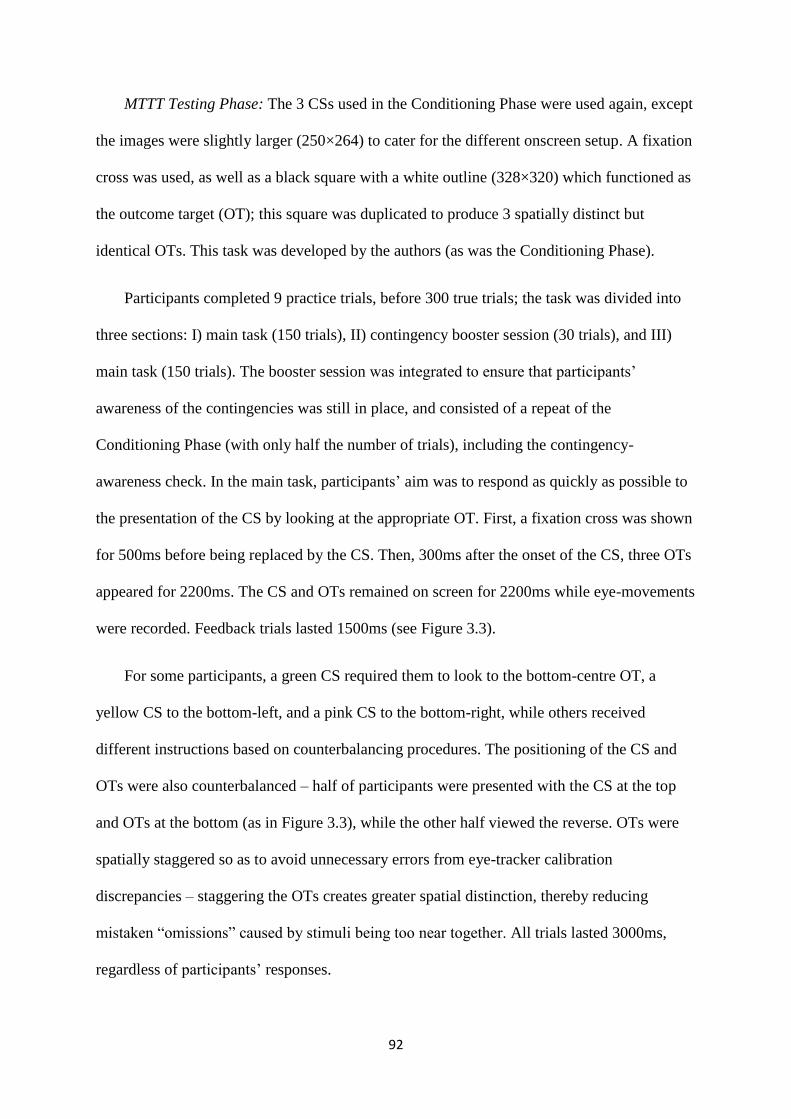
92
MTTT Testing Phase: The 3 CSs used in the Conditioning Phase were used again, except
the images were slightly larger (250×264) to cater for the different onscreen setup. A fixation
cross was used, as well as a black square with a white outline (328×320) which functioned as
the outcome target (OT); this square was duplicated to produce 3 spatially distinct but
identical OTs. This task was developed by the authors (as was the Conditioning Phase).
Participants completed 9 practice trials, before 300 true trials; the task was divided into
three sections: I) main task (150 trials), II) contingency booster session (30 trials), and III)
main task (150 trials). The booster session was integrated to ensure that participants’
awareness of the contingencies was still in place, and consisted of a repeat of the
Conditioning Phase (with only half the number of trials), including the contingency-
awareness check. In the main task, participants’ aim was to respond as quickly as possible to
the presentation of the CS by looking at the appropriate OT. First, a fixation cross was shown
for 500ms before being replaced by the CS. Then, 300ms after the onset of the CS, three OTs
appeared for 2200ms. The CS and OTs remained on screen for 2200ms while eye-movements
were recorded. Feedback trials lasted 1500ms (see Figure 3.3).
For some participants, a green CS required them to look to the bottom-centre OT, a
yellow CS to the bottom-left, and a pink CS to the bottom-right, while others received
different instructions based on counterbalancing procedures. The positioning of the CS and
OTs were also counterbalanced – half of participants were presented with the CS at the top
and OTs at the bottom (as in Figure 3.3), while the other half viewed the reverse. OTs were
spatially staggered so as to avoid unnecessary errors from eye-tracker calibration
discrepancies – staggering the OTs creates greater spatial distinction, thereby reducing
mistaken “omissions” caused by stimuli being too near together. All trials lasted 3000ms,
regardless of participants’ responses.
93
Figure 3.3 Pictorial demonstration of a single trial of the MTTT
Fixation cross = 0-500ms; CS = 500-800; OTs = 800-3000. In all, the CS-OT pair is present for
2200ms.
Participants were told that points earned could be exchanged for real alcohol and
chocolate which was on display in the lab. After each trial participants were given feedback –
correct responses elicited “Correct! You win xxx ALCOHOL/CHOCOLATE points” (where
“xxx” represents a numeric value from 0-2.00). Incorrect responses (i.e., looking at the wrong
OT, or at no OT) triggered “Incorrect! You lose 5 ALCOHOL/CHOCOLATE points” (reward
name was dependent on trial type). Feedback after neutral trials presented participants’ speed:
“Correct, Your Reaction Time was yyy” (where “yyy” represents speed in milliseconds), or
“Incorrect!” after incorrect responses. All feedback was presented in plain, white text and
feedback points were calculated as
(1000 – RT) × .002
where RT is reaction time on that particular trial (Le Pelley et al., 2015). Feedback was thus
continuous and dependent on participants’ response times. For this task, sign-tracking
94
behaviour was inferred from I) slower disengagement from the CS, II) greater fixation
duration (gaze dwell time [GDT]) on the CS and less on the OT, and III) greater numbers of
individual fixations on the CS (signifying return gazes after previously fixating on the OT or
elsewhere). Conversely, goal-tracking was inferred via faster CS disengagement, minimal CS
GDT and fewer fixations on the CS. The testing phase lasted approximately 26 minutes.
Regarding rewards specifically, it was expected that I) GDT bias would be greater for
reward-paired CSs compared to neutral-paired CSs, that II) RT bias would be greater for
reward CSs than neutral CSs (i.e., taking longer to disengage from reward CSs compared to
neutral CSs), that III) omission (error) bias (i.e., looking at the wrong target square) would be
greater towards reward OTs than the neutral OT. It was hypothesised that I) sign-trackers and
goal-trackers would be distinguishable via task performance, and that II) sign-tracking would
correlate with self-report measures of drinking behaviour, impulsivity and childhood trauma.
Task design features
As already noted, these tasks must be designed carefully and with the results of past
research in mind. Following advice from Awh et al. (2013), both tasks were designed to I)
vary stimuli presentation on a trial-by-trial basis to prevent selection history effects
(sequential priming), and II) keep target stimuli (OTs) perceptually distinct from CSs in both
shape and colour. Crucially, the perceptual features of the CSs are never directly implicated in
reward; responses towards the CSs (or delayed disengagement from them) cause, at best,
reduced reward earnings and, at worst, the subtraction of points from one’s tally. Finally,
regarding stimuli salience, although all CSs (distractors) are more perceptually salient than all
targets, all CSs are counterbalanced between participants and analyses will look to investigate
95
the influence of physical salience (regardless of value) on attentional capture (see Chapter
Eight).
Procedure
All testing took place between the times of 1 p.m. and 8 p.m. in the eye-tracking
laboratory of the School of Psychology, University of Liverpool. After reading the Participant
Information Sheet and signing the Consent Form, participants were informed that their
performance on the tasks determined how many extra payment vouchers (ASTT) or
alcohol/chocolate (MTTT) they would receive upon study completion. To make this
believable the lab contained alcohol (beers, wines and ciders) and chocolate (Dairy Milk,
Mars, Snickers etc.), which were visible to participants. Participants then sat at a chinrest in
front of a computer (approximately 23 inches from the monitor) ready to begin the first task.
Once eye movements were calibrated participants were given instructions, with further verbal
clarification from the researcher if needed. Participants then completed the tasks, taking
approximately five minutes in between for a break. Task order was counterbalanced between
participants.
Following completion of both tasks, participants completed 8 self-report questionnaires.
Given the sensitive and potentially upsetting nature of the Child Abuse and Trauma Scale
(CATS), this was administered last. Before participants were compensated – £15 in high street
shopping vouchers – and debriefed they were asked if they believed they would receive
alcohol, chocolate, and extra monetary rewards. Responses were recorded before participants
were informed they would not receive any alcohol or extra monetary rewards (but that they
may take some chocolate if they wished). Each session lasted approximately 1hr 30m.

96
3.4 Data Reduction and Analysis
The following are an extension of measures that have been used in previous research in
estimating attentional bias and stimulus value (Christiansen, Mansfield, et al., 2015; Field,
Mogg, & Bradley, 2005; Rose et al., 2013). For the MTTT, all fixations were defined as a
stable eye movement within one degree of the visual angle for 100ms or longer (Jones et al.,
2012). For the ASTT all RT responses <80ms and >999ms were recoded as missing data.
Latencies of less than 80ms are often regarded as anticipatory in visual perception research
(Walker, Walker, David, Husain, & Kennard, 2000), and is the cut-off used in previous
studies using an almost identical task (Le Pelley et al., 2015; Pearson et al., 2015). The 999ms
upper limit was chosen due to the distractions present during the task (i.e., the CSs), which by
design increase RT, and was thought of as less restrictive compared to the upper limit of
500ms used in comparative studies (Le Pelley et al., 2015; Pearson et al., 2015). This was not
done for the MTTT as participants may sometimes have, theoretically, been so distracted by
the CS that their RT was ≥1000ms. Likewise, some participants may have been so
disinterested in the CS that, upon OT onset, their eye movements began not on the opposite
side of the screen but very near the OT, making RTs of interest ≤100ms possible.
Task Outcome Measures
MTTT: Due to the novelty of this task, an exploratory approach was taken in its analysis
and measures were divided into response frequencies, RTs and gaze dwell times. This resulted
in a total of 42 potential outcome measures (see Table A1, Appendix A), 18 of which were
used in the final analysis. RTs and gaze dwell times are further divided into bias scores for
97
statistical analysis. For RT Bias, larger (negative) values indicate greater sign-tracking (for
example, slower RTs to the alcohol OT compared to the other OTs, suggests greater
distraction by the alcohol CS), while larger (positive) values indicate greater goal-tracking.
For GDT Bias, larger (positive) values indicate greater bias – greater OT bias reflects goal-
tracking, while greater CS bias indicates sign-tracking.
ASTT: Measures for the ASTT were those used by Le Pelley et al. (2015) and were
divided into omissions and RTs (no dwell time calculations were possible as participant
responses prompted the immediate end of trials). For both Omission Bias and RT Bias,
greater (positive) values indicate sign-tracking (as high-value distractors should induce more
errors and slower responses to the OT than low-value distractors; see Table A2, Appendix A
for calculations).
3.5 Results
Participant Characteristics
Table 3.1 summarises the sample’s average alcohol use characteristics, while Table 3.2
provides an overview of trait and state measures. Men were most likely to binge 2 times per
fortnight (30.2% of the sample), women 3 times per fortnight (29.1%). Most participants
(84.7%) scored ≥8 on the AUDIT, classing them as at-risk drinkers. Self-reports showed that,
overall, the participant population were hazardous drinkers, consuming over recommended
weekly guidelines (14 units per week for men and women). A recent meta-analysis on APT
indices shows Intensity of Demand (IoD) to be the measure with the largest relation to alcohol
consumption and the best predictor of alcohol use disorder symptoms (Kiselica et al., 2016).
The average (M = 5.36, SD ± 5.12) for the IoD measure is somewhat smaller than that of
98
previous work (M = 8.68; 7.12) (Bertholet et al., 2015; Murphy & MacKillop, 2006),
suggesting that alcohol has a lower reinforcing efficacy in current sample (i.e., the current
sample desires less alcohol when the alcohol is free).
A majority (64.3%) of participants scored <5 on the B-YAACQ: Total, with 86.7%
scoring <10. Participants with a score of 5 have a 79% chance of having done something
embarrassing while drinking, a 23% chance of having done something impulsive that they
regret, and a 6% chance that drinking harmed their work life, while the respective numbers
are 94%, 56% and 22% for participants with a score of 10 (Kahler et al., 2005). In terms of
personality variables, most participants scored within the normal ranges of the scales (e.g.,
57.4% scored within the BIS-11 range of normality [scores 52-71]; the ImpSS average was
almost identical [M = 9.00] to that found previously in undergraduates [M = 9.50] [Ball,
1995]). The CATS: Total average (M = 0.86) was also similar to that of earlier work in
nonclinical samples (M = 0.74; 0.77) (Kent & Waller, 1998; Sanders & Becker-Lausen,
1995), and suggests low levels of childhood trauma.
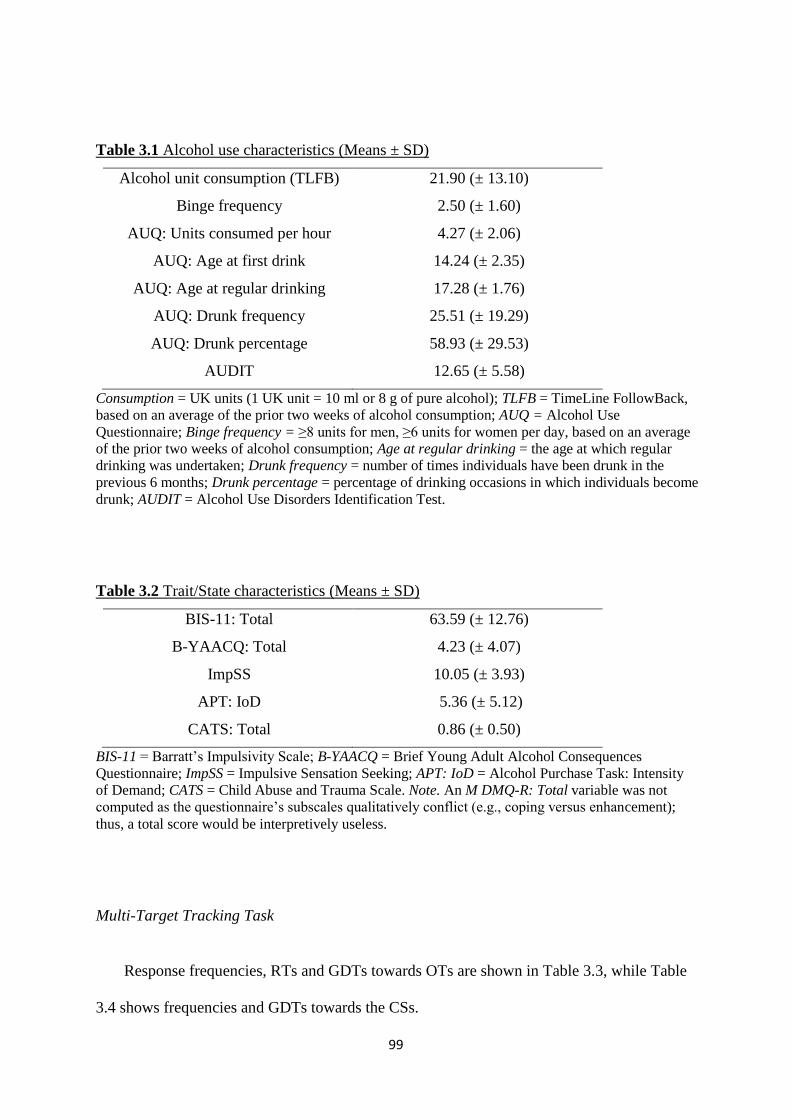
99
Table 3.1 Alcohol use characteristics (Means ± SD)
Alcohol unit consumption (TLFB) 21.90 (± 13.10)
Binge frequency 2.50 (± 1.60)
AUQ: Units consumed per hour 4.27 (± 2.06)
AUQ: Age at first drink 14.24 (± 2.35)
AUQ: Age at regular drinking 17.28 (± 1.76)
AUQ: Drunk frequency 25.51 (± 19.29)
AUQ: Drunk percentage 58.93 (± 29.53)
AUDIT 12.65 (± 5.58)
Consumption = UK units (1 UK unit = 10 ml or 8 g of pure alcohol); TLFB = TimeLine FollowBack,
based on an average of the prior two weeks of alcohol consumption; AUQ = Alcohol Use
Questionnaire; Binge frequency = ≥8 units for men, ≥6 units for women per day, based on an average
of the prior two weeks of alcohol consumption; Age at regular drinking = the age at which regular
drinking was undertaken; Drunk frequency = number of times individuals have been drunk in the
previous 6 months; Drunk percentage = percentage of drinking occasions in which individuals become
drunk; AUDIT = Alcohol Use Disorders Identification Test.
Table 3.2 Trait/State characteristics (Means ± SD)
BIS-11: Total 63.59 (± 12.76)
B-YAACQ: Total 4.23 (± 4.07)
ImpSS 10.05 (± 3.93)
APT: IoD 5.36 (± 5.12)
CATS: Total 0.86 (± 0.50)
BIS-11 = Barratt’s Impulsivity Scale; B-YAACQ = Brief Young Adult Alcohol Consequences
Questionnaire; ImpSS = Impulsive Sensation Seeking; APT: IoD = Alcohol Purchase Task: Intensity
of Demand; CATS = Child Abuse and Trauma Scale. Note. An M DMQ-R: Total variable was not
computed as the questionnaire’s subscales qualitatively conflict (e.g., coping versus enhancement);
thus, a total score would be interpretively useless.
Multi-Target Tracking Task
Response frequencies, RTs and GDTs towards OTs are shown in Table 3.3, while Table
3.4 shows frequencies and GDTs towards the CSs.
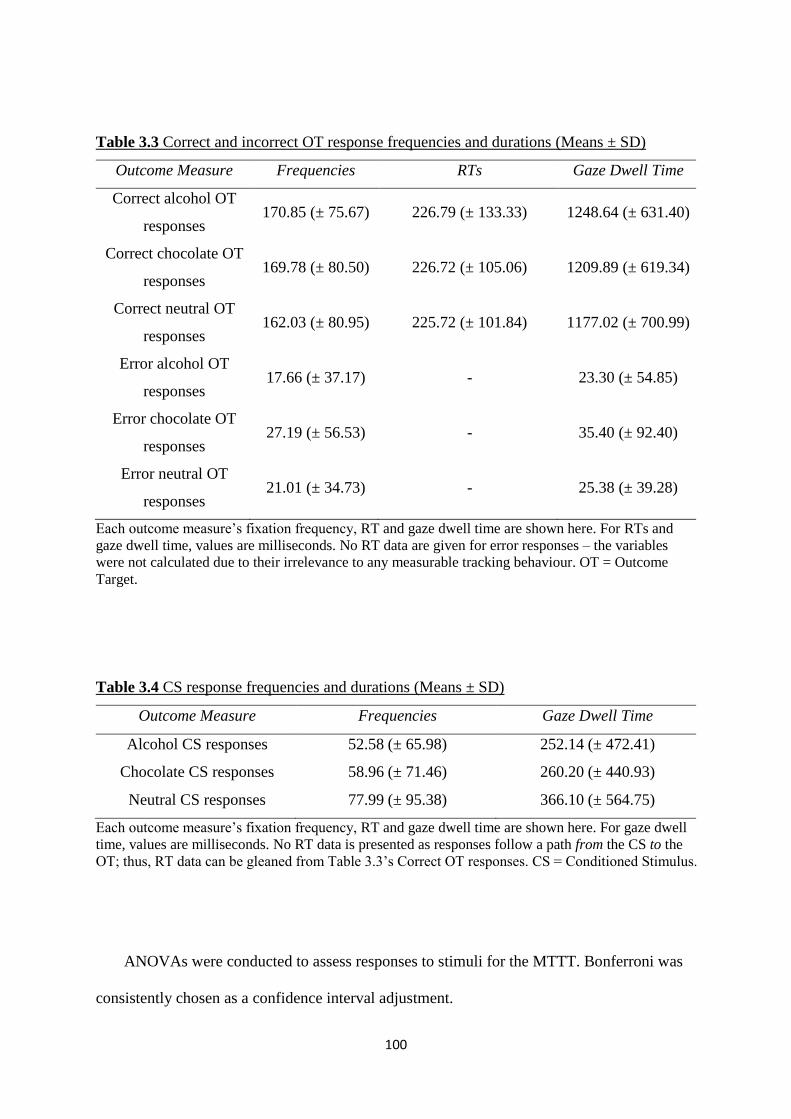
100
Table 3.3 Correct and incorrect OT response frequencies and durations (Means ± SD)
Outcome Measure Frequencies RTs Gaze Dwell Time
Correct alcohol OT
responses 170.85 (± 75.67) 226.79 (± 133.33) 1248.64 (± 631.40)
Correct chocolate OT
responses 169.78 (± 80.50) 226.72 (± 105.06) 1209.89 (± 619.34)
Correct neutral OT
responses 162.03 (± 80.95) 225.72 (± 101.84) 1177.02 (± 700.99)
Error alcohol OT
responses 17.66 (± 37.17) - 23.30 (± 54.85)
Error chocolate OT
responses 27.19 (± 56.53) - 35.40 (± 92.40)
Error neutral OT
responses 21.01 (± 34.73) - 25.38 (± 39.28)
Each outcome measure’s fixation frequency, RT and gaze dwell time are shown here. For RTs and
gaze dwell time, values are milliseconds. No RT data are given for error responses – the variables
were not calculated due to their irrelevance to any measurable tracking behaviour. OT = Outcome
Target.
Table 3.4 CS response frequencies and durations (Means ± SD)
Outcome Measure Frequencies Gaze Dwell Time
Alcohol CS responses 52.58 (± 65.98) 252.14 (± 472.41)
Chocolate CS responses 58.96 (± 71.46) 260.20 (± 440.93)
Neutral CS responses 77.99 (± 95.38) 366.10 (± 564.75)
Each outcome measure’s fixation frequency, RT and gaze dwell time are shown here. For gaze dwell
time, values are milliseconds. No RT data is presented as responses follow a path from the CS to the
OT; thus, RT data can be gleaned from Table 3.3’s Correct OT responses. CS = Conditioned Stimulus.
ANOVAs were conducted to assess responses to stimuli for the MTTT. Bonferroni was
consistently chosen as a confidence interval adjustment.
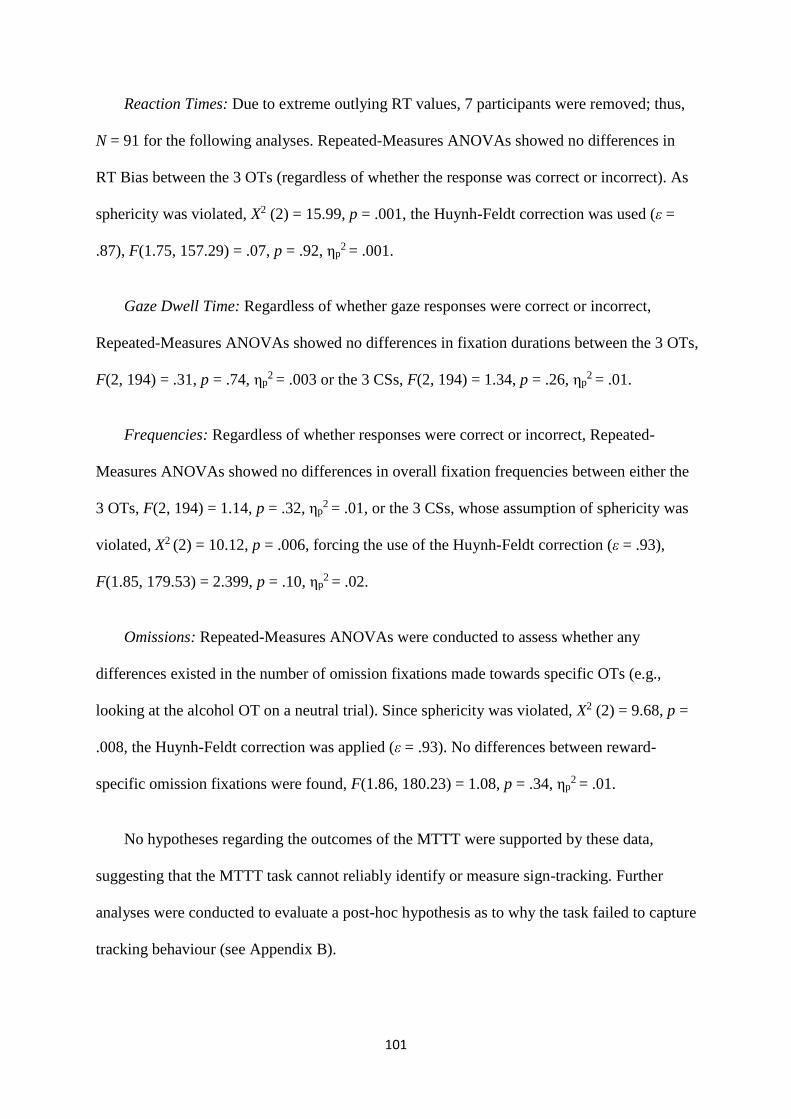
101
Reaction Times: Due to extreme outlying RT values, 7 participants were removed; thus,
N = 91 for the following analyses. Repeated-Measures ANOVAs showed no differences in
RT Bias between the 3 OTs (regardless of whether the response was correct or incorrect). As
sphericity was violated, X2 (2) = 15.99, p = .001, the Huynh-Feldt correction was used (ε =
.87), F(1.75, 157.29) = .07, p = .92, ηp2 = .001.
Gaze Dwell Time: Regardless of whether gaze responses were correct or incorrect,
Repeated-Measures ANOVAs showed no differences in fixation durations between the 3 OTs,
F(2, 194) = .31, p = .74, ηp2 = .003 or the 3 CSs, F(2, 194) = 1.34, p = .26, ηp
2 = .01.
Frequencies: Regardless of whether responses were correct or incorrect, Repeated-
Measures ANOVAs showed no differences in overall fixation frequencies between either the
3 OTs, F(2, 194) = 1.14, p = .32, ηp2 = .01, or the 3 CSs, whose assumption of sphericity was
violated, X2 (2) = 10.12, p = .006, forcing the use of the Huynh-Feldt correction (ε = .93),
F(1.85, 179.53) = 2.399, p = .10, ηp2 = .02.
Omissions: Repeated-Measures ANOVAs were conducted to assess whether any
differences existed in the number of omission fixations made towards specific OTs (e.g.,
looking at the alcohol OT on a neutral trial). Since sphericity was violated, X2 (2) = 9.68, p =
.008, the Huynh-Feldt correction was applied (ε = .93). No differences between reward-
specific omission fixations were found, F(1.86, 180.23) = 1.08, p = .34, ηp2 = .01.
No hypotheses regarding the outcomes of the MTTT were supported by these data,
suggesting that the MTTT task cannot reliably identify or measure sign-tracking. Further
analyses were conducted to evaluate a post-hoc hypothesis as to why the task failed to capture
tracking behaviour (see Appendix B).
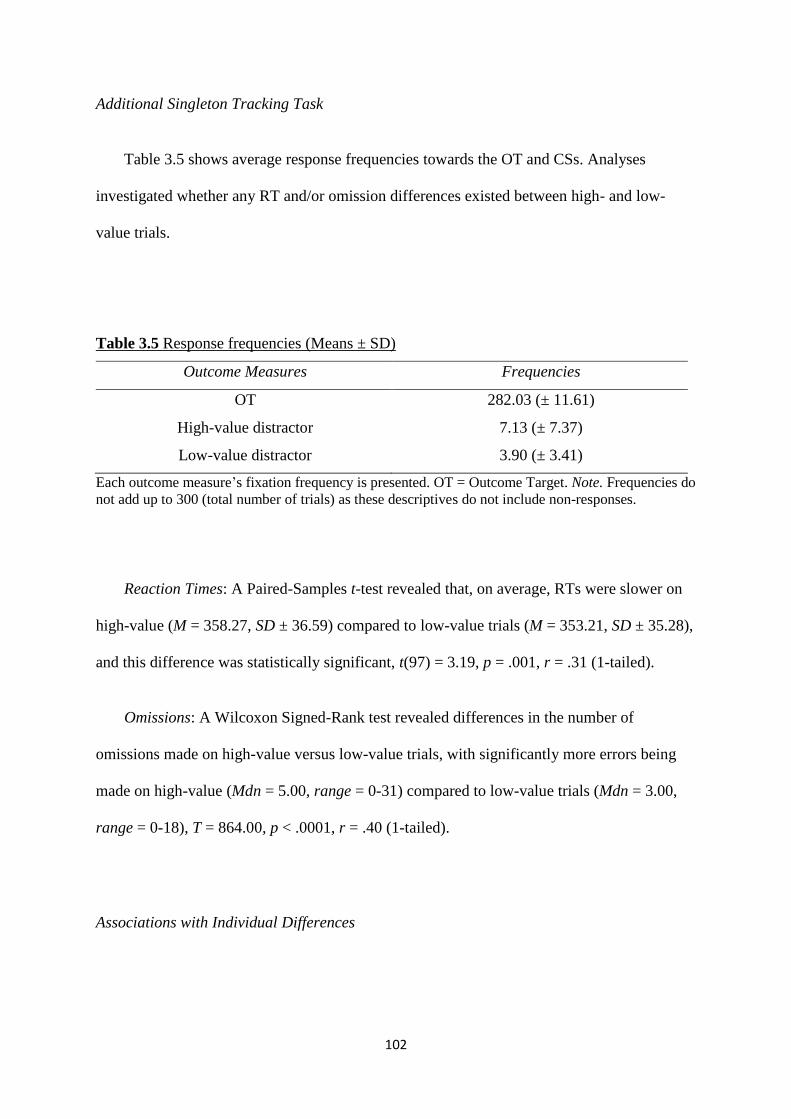
102
Additional Singleton Tracking Task
Table 3.5 shows average response frequencies towards the OT and CSs. Analyses
investigated whether any RT and/or omission differences existed between high- and low-
value trials.
Table 3.5 Response frequencies (Means ± SD)
Outcome Measures Frequencies
OT 282.03 (± 11.61)
High-value distractor 7.13 (± 7.37)
Low-value distractor 3.90 (± 3.41)
Each outcome measure’s fixation frequency is presented. OT = Outcome Target. Note. Frequencies do
not add up to 300 (total number of trials) as these descriptives do not include non-responses.
Reaction Times: A Paired-Samples t-test revealed that, on average, RTs were slower on
high-value (M = 358.27, SD ± 36.59) compared to low-value trials (M = 353.21, SD ± 35.28),
and this difference was statistically significant, t(97) = 3.19, p = .001, r = .31 (1-tailed).
Omissions: A Wilcoxon Signed-Rank test revealed differences in the number of
omissions made on high-value versus low-value trials, with significantly more errors being
made on high-value (Mdn = 5.00, range = 0-31) compared to low-value trials (Mdn = 3.00,
range = 0-18), T = 864.00, p < .0001, r = .40 (1-tailed).
Associations with Individual Differences
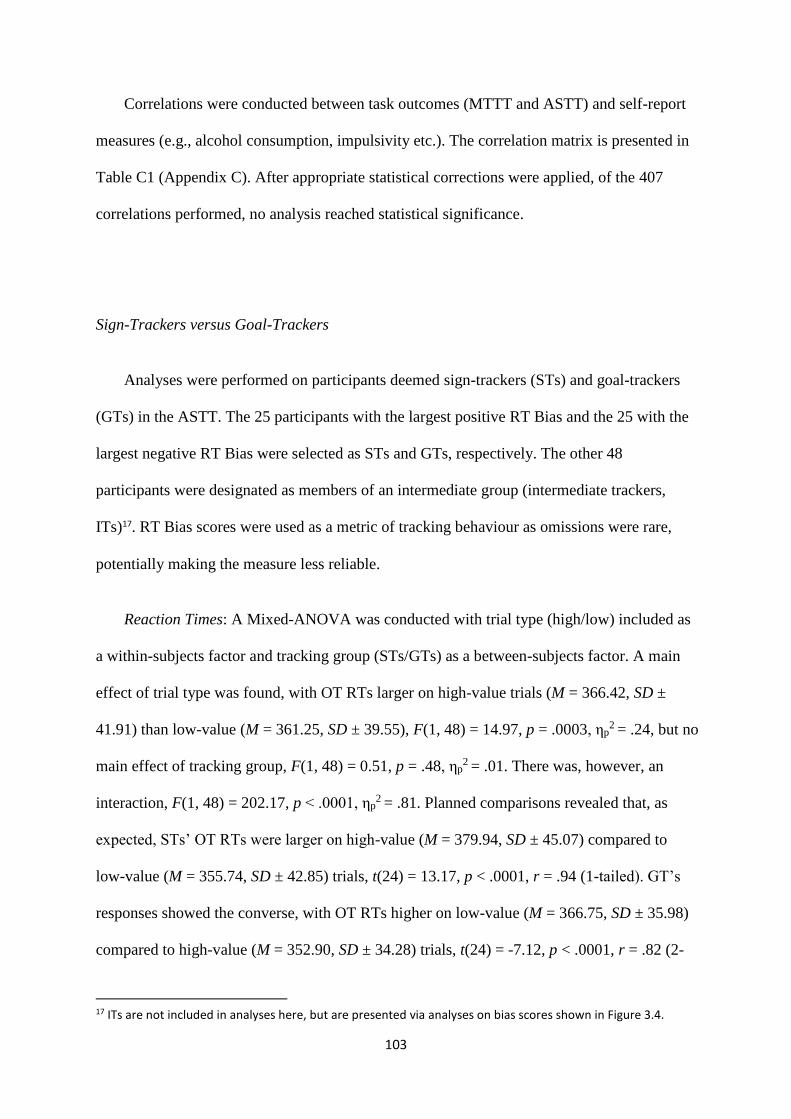
103
Correlations were conducted between task outcomes (MTTT and ASTT) and self-report
measures (e.g., alcohol consumption, impulsivity etc.). The correlation matrix is presented in
Table C1 (Appendix C). After appropriate statistical corrections were applied, of the 407
correlations performed, no analysis reached statistical significance.
Sign-Trackers versus Goal-Trackers
Analyses were performed on participants deemed sign-trackers (STs) and goal-trackers
(GTs) in the ASTT. The 25 participants with the largest positive RT Bias and the 25 with the
largest negative RT Bias were selected as STs and GTs, respectively. The other 48
participants were designated as members of an intermediate group (intermediate trackers,
ITs)17. RT Bias scores were used as a metric of tracking behaviour as omissions were rare,
potentially making the measure less reliable.
Reaction Times: A Mixed-ANOVA was conducted with trial type (high/low) included as
a within-subjects factor and tracking group (STs/GTs) as a between-subjects factor. A main
effect of trial type was found, with OT RTs larger on high-value trials (M = 366.42, SD ±
41.91) than low-value (M = 361.25, SD ± 39.55), F(1, 48) = 14.97, p = .0003, ηp2 = .24, but no
main effect of tracking group, F(1, 48) = 0.51, p = .48, ηp2 = .01. There was, however, an
interaction, F(1, 48) = 202.17, p < .0001, ηp2 = .81. Planned comparisons revealed that, as
expected, STs’ OT RTs were larger on high-value (M = 379.94, SD ± 45.07) compared to
low-value (M = 355.74, SD ± 42.85) trials, t(24) = 13.17, p < .0001, r = .94 (1-tailed). GT’s
responses showed the converse, with OT RTs higher on low-value (M = 366.75, SD ± 35.98)
compared to high-value (M = 352.90, SD ± 34.28) trials, t(24) = -7.12, p < .0001, r = .82 (2-
17 ITs are not included in analyses here, but are presented via analyses on bias scores shown in Figure 3.4.

104
tailed). Thus, STs showed a large sign-tracking RT effect in the expected direction (high >
low), and GTs showed an almost equally large effect in the opposite direction (low > high).
Omissions: Analyses were conducted as above. There was a main effect of trial type, with
more omissions on high-value (M = 8.92, SD ± 8.10) compared to low-value (M = 4.42, SD ±
3.47) trials, F(1, 48) = 22.69, p < .0001, ηp2 = .32, but no main effect of tracking group, F(1,
48) = 3.60, p = .06, ηp2 = .07. There was, however, an interaction, F(1, 48) = 22.29, p < .0001,
ηp2 = .32. Planned comparisons revealed that, as expected, STs produced more omissions on
high-value (M = 12.40, SD ± 8.58) compared to low-value (M = 3.44, SD ± 2.65) trials, t(24)
= 5.51, p < .0001, r = .75 (1-tailed). GTs’ omission did not differ between high-value (M =
5.44, SD ± 5.93) and low-value (M = 5.40, SD ± 3.94) trials, t(24) = 0.04, p = .97, r = .008 (2-
tailed). Thus, STs showed a large sign-tracking omission effect in the expected direction,
while GTs showed no effect. Results for both RTs and omissions are graphically summarised
via difference (bias) scores in Figure 3.4.
105
Figure 3.4 Bar charts showing group differences in RT Bias (left) and Omission Bias (right)
GT = Goal-trackers; IT = Intermediate-trackers; ST = Sign-trackers. ***p < .0001, ns = non-
significant. Medians (95% CI).
Whether STs and GTs differed in their trait and state characteristics was investigated with
a series of Welch’s t-tests18 and a Chi Square test for gender. After corrections, no differences
were found. All analyses are presented in Table C2 (Appendix C).
3.6 Discussion
This study explored whether sign-tracking and goal-tracking – cognitive reward-processing
types seen across a range of nonhuman animal species – could be identified in humans in the
largest sample to date by using two eye-tracking tasks (one validated, one novel). The study
18 As opposed to the more typical Independent-Samples t-test, Welch’s test is much more robust against violations of homogeneity of variance, gives the same results when variances are equal and can be used to investigate samples of different sizes (Ruxton, 2006). Effect size (Cohen’s ds) is calculated by square-rooting the F statistic, which gives identical results to calculations which use the commonly used t statistic (via an Independent-Samples t-test). As such, Welch’s t-tests shall be used where possible throughout this thesis.
***
***
*** ***
***
ns
106
also aimed to determine whether tracking behaviours correlate with alcohol use and risk
factors for misuse and dependence. It was hypothesised that the tasks would allow for the
identification of sign-tracking and goal-tracking behaviours, and that some individuals would
produce such consistent tracking behaviours that they could be categorised into specific
tracker types. It was further predicted that sign-tracking would correlate with risk factors for
alcohol abuse (e.g., high impulsivity, childhood trauma), as well as with generally higher
levels of alcohol consumption and other measures of alcohol use (e.g., AUDIT score, binge
frequency etc.)
Results were mixed. The novel Multi-Target Tracking Task (MTTT) was unable to
measure sign-tracking and thus will not be discussed further. Conversely, the Additional
Singleton Tracking Task (ASTT) allowed for the identification and statistically significant
separation of individuals based on their tracking behaviours. However, no task measure
significantly correlated with any self-report measure, and no group differences in such
measures were observed after post-hoc corrections were applied.
The ASTT is a variant of a validated task adapted from Le Pelley et al. (2015), who
showed how external reward structures can produce maladaptive behaviours (i.e., behaviours
which conflict with one’s goals) in student samples. The current study is a conceptual
replication of one of their studies (Le Pelley et al., 2015, Experiment 3) with slight alterations
to the task. Specifically, the ASTT contained no distractor-absent trials, presented participants
with continuous – not categorical – reward feedback, distractors were 100% – not 80% –
predictive of reward type, and omissions caused a deduction of points rather than simply
negating the winning of points. Despite these differences their results were replicated here.
The changes were implemented to narrow the theoretical interpretations of results;
specifically, these alterations prevent selection and reward history effects from confounding
107
interpretations of the sign-tracking effect. The possibility of sign-tracking resulting from
instrumental conditioning was also constricted by removing any potential rewarding outcome
for attentional capture by distractors (including covert distractor shifts). The current study
therefore provides additional support for pavlovian conditioning being responsible for the
development of sign-tracking, as opposed to response-driven, instrumental learning.
Specifically, this replicated previous results which show that the important aspect of a
stimulus in such paradigms is the extent to which it signals reward/value, not the extent to
which it allows one to acquire rewards (Failing et al., 2015; Le Pelley et al., 2015; Pearson et
al., 2015).
The findings that RTs were slower on high-value compared to low-value trials and that
omissions followed the same pattern – even though both CSs captured saccadic RTs with the
same ‘force’ (see Chapter Nine) – also replicated the work of Le Pelley et al (2015). This
suggests that CSs which predict higher available rewards can capture attention even when this
means the reward will not only be lost, but also when points previously earned are actively
deducted. Another result replicated here was that of RTs in relation to response type: omission
(CS) RTs were significantly quicker than correct (OT) RTs (see Chapter Nine). This indicates
that omissions are more likely the result of automatic, reflexive saccades, and that correct
responses are the result of top-down, conscious deliberation. This result may reveal a
distinction between endogenous and exogenous influences on attention (i.e., goal-driven
versus stimulus salience).
Effect sizes (ESs) between current results and that of Le Pelley et al. (2015) differed
slightly; they found mostly large effect sizes and the current study mostly medium-to-large.
Given the calculation of Cohen’s dz (Pearson’s r was used in the current study),
dz = t/√n
108
where t is the t value and n the sample size, if ESs are converted this study still produces a
much more modest effect size estimate (dz = .33). However, the generated effect size would
have been more comparable (dz = .65) if our sample size (N = 98) had been equal to Le Pelley
et al’s (N = 24). Using a common language effect size, the current data suggest that after
controlling for individual differences, the likelihood that a person will produce slower OT
RTs on high-value trials compared to low-value trials is 63%. It is also worth noting that,
while the average difference in OT RT between high- and low-value trials in this study was
5ms, a gap of 13ms was found in Le Pelley et al’s (2015).
Contrary to preclinical (Meyer, Lovic, et al., 2012) and previous human results (B. A.
Anderson, Kronemer, et al., 2016), sign-tracking did not correlate with self-reported measures
of alcohol use or any other trait/state variables associated with hazardous drinking behaviour.
This could be due to the high quantity of correlations which, after familywise corrections,
rendered the alpha levels too low to accommodate the effect sizes that would have been
expected. It could also be due to the likelihood that humans (compared to animals who have
been bred specifically for experimental purposes) are less likely to show robust phenotypes.
As there is theoretical rationale for testing these associations – and given future studies within
this body of research will test these associations in different samples – this series of studies
will retain the questionnaires used.
Tracking types were determined by selecting participants with the highest (STs) and
lowest (GTs) RT Bias scores. This method was chosen over using Omission Bias due to the
infrequency of omissions across the sample (Mdn = 4.00, range = 0-19.50, out of 300 trials).
Additionally, the moderate-large positive association found between both bias types (see
Figure 9.1, Chapter Nine) indicates that either type of bias may be a reasonable basis for
selecting STs and GTs. Notably, this bias correlation was larger for the tracking groups than

109
in the general sample (rs = .56 versus rs = .47, respectively), suggesting that increased sign-
tracking occurs via both slowed RTs and greater omissions towards high-value distractors.
Regarding the comparison of tracking groups, GTs (M = 2105.90) were more successful
(earned more points) than STs (M = 2015.40), as one would expect. While no differences
were found in overall RTs (ruling out any fundamental speed differences between them),
differences between groups in OT RTs were found on high-value trials, with STs being slower
than GTs, but not on low-value trials. This finding extends observations in the animal
literature showing STs to be significantly more distracted by reward-paired cues (Flagel,
Robinson, et al., 2010; Flagel et al., 2007; Tomie et al., 2008), as well as human studies
showing that the value of such cues is integral to their ability to distract (Le Pelley et al.,
2013; Le Pelley et al., 2015). Additionally, current results replicate those in the animal
literature showing that the presence of an irrelevant, discrete, reward-paired CS (in this case,
the high-value CS) can increase OT/US latency in some individuals (STs) while decreasing it
in others (GTs) (Meyer, Lovic, et al., 2012). Moreover, while tracking groups did not differ in
their omissions rates towards low-value CSs (or in the number of overall omissions), STs did
make significantly more high-value CS omissions than GTs. This finding also has support
from the animal literature: ST animals make more CS (lever/light) contacts than GT animals,
even when the actual reward (US/OT) is concurrently available (Meyer, Lovic, et al., 2012).
Interestingly, the pattern of omission results on low-value trials trends towards
significance in the opposing direction. That is, STs (Mdn = 3.00) actually produced only half
the number of omissions as GTs (Mdn = 6.00) on low-value trials. The most plausible
explanation for this finding appears to have nothing to do with GTs being any more distracted
on low-value trials than high value. Rather, it seems that STs are much less distracted on low
value compared to high-value trials (while GTs’ levels of distraction are maintained across
110
trials) that this difference becomes statistically significant. This is borne out by the data which
show that GTs’ omissions stay quite constant across trial types (high value: Mdn = 4.00; low
value: Mdn = 6.00), while ST’s omissions drastically inflate from low- (Mdn = 3.00) to high-
value trials (Mdn = 12.00). This pattern is also reflected in OT RTs given STs’ (Mdn =
344.95) inclination to be quicker than GTs (Mdn = 367.08) on low-value trials. This suggests
that STs’ attention is captured even less than GTs’ on low-value trials, effectively making
their behaviour appear goal-oriented – relative to GTs – in situations where the potential
outcome (US) is low and so the predictive cue (CS/distractor) is also considered to be of low
value.
Furthermore, STs (Mdn = 275.25) and GTs (Mdn = 290.29) did not significantly differ in
their RTs towards CSs in general. This is contrary to findings in the animal literature which
show that STs produce faster ‘omissions’ (i.e., approaches towards the CS) than GTs,
essentially reversing findings of RT responses towards the OT (Flagel et al., 2010, 2007).
However, it should be noted that these results are in line with human studies of sign-tracking
(Le Pelley et al., 2015). The null findings, however, could simply be a result of the lack of
possible CS RT variability, given that preclinical CS periods last a lot longer (typically around
8s) than human participants’ reactions in the ASTT allow (typically <1s). One way to test
whether STs produce faster omissions towards CSs of different value is by using a task which
employs more than two CSs of value. This would allow for greater potential variability in
responses (See Study 4 [Chapter Five] in which this hypothesis is tested).
The current study contains several potential limitations, as well as differences to
preclinical studies, which could explain the lack of associations between tracking and
individual differences. The reasons could lie either with the sample, or the questionnaires.
Regarding the sample, participants were mostly university students with weekly drinking
111
habits ranging between 1-7 drinking episodes per week, binges between 0-4 times per week
and weekly unit consumption ranging from 4-9219. Self-reports showed that, overall, the
participant population were hazardous drinkers, consuming over recommended weekly
guidelines (14 units per week for men and women). Though the majority of participants
displayed hazardous drinking, it is possible that an even more risky population (e.g., patients
with alcohol use disorders [AUDs]) would be needed to observe an association between
tracking and alcohol consumption (see below). Most participants fell within the normal ranges
of consequences of drinking, impulsivity and childhood trauma measures, which again may
display a lack of extreme traits necessary to observe the link between tracking and individual
differences.
One major difference between investigating these associations in human versus
nonhuman animals is that preclinical paradigms often breed specimens for study over several
generations. This selective breeding is used to magnify the traits of study and thus are likely
to amplify not only tracking behaviours, but also any related traits (such as impulsivity). This
is especially true given that tracking phenotypes are heritable, meaning that tracking and any
associated traits may be genetically linked (Campus et al., 2016; Flagel, Clark, et al., 2011;
Meyer, Lovic, et al., 2012; Pitchers et al., 2015). Analogous work in humans which recruited
individuals from populations which tend to show extreme traits (e.g., HIV+ patients) has
found links between value-modulated attentional capture (VMAC), non-planning
impulsiveness and visual working memory capacity (B. A. Anderson, Kronemer, et al., 2016).
Additionally, work has also shown that opioid-dependent patients show greater VMAC than
controls, and this VMAC was also negatively associated with visual working memory
19 Note that the lower end of this range (4) is lower than the study’s lower limit for alcohol consumption in the inclusion criteria (10). This criteria cannot apply to every single week since participants began drinking alcohol. Thus, some participants (9.8%) happened to have consumed fewer than 10 units in one or both of the weeks prior to testing, despite typically consuming ≥10.
112
capacity (though not with impulsivity) (B. A. Anderson et al., 2013). More work in this area
and with larger sample sizes is needed. Alternatively, other paradigms could be utilised to
assess consumption in the laboratory, allowing for the direct correlation between controlled
ad-lib consumption (e.g., Jones, Cole, Goudie, & Field, 2011) and tracking behaviours.
Regarding the questionnaires used, there were several oversights concerning the wording
of some questions and scales (e.g., for the M DMQ-R a four-point scale was used instead of
the five-point used in previous research). This was due to older versions being used, and all
subsequent studies use the most recent versions (details can be found in General Methods,
Chapter Two, section 2.2). However, it should be noted that analyses revealed that these
discrepancies did not significantly alter the internal consistency of the questionnaires, nor did
they significantly alter participant responses, both of which were comparable to outcomes
found in previous research. These results indicate that the differences in questionnaire
construction are unlikely to be the cause of the lack of association between self-report and
tracking measures. More likely, it is due to the sheer number of correlations (in addition to the
possibility that there are no real associations to find).
In summary, most previous research regarding human sign-tracking and goal-tracking has
focussed primarily on the cognitive and theoretical frameworks underpinning the
phenomenon of tracking. The current study aimed to help widen the scope of such research by
directly assessing whether tracking in humans is related to alcohol use and risk factors for
misuse. Our results replicate previous work showing attentional capture by response-
irrelevant stimuli (sign-tracking) in humans, as well as providing robust evidence that such
capture is automatic/reflexive, is in opposition to one’s goal-driven state, and is resistant to
aversive consequences. We also provide further support that sign-tracking is driven not by
instrumental conditioning, but by pavlovian processes. Our predictions that tracking would be
113
correlated with self-reported drinking behaviours and risk factors for harmful use (such as
impulsivity) were unsupported. However, this may be because the sample tested (mainly
university students) do not show extreme enough traits or behaviours (e.g., impulsivity and
alcohol use). Utilising more extreme populations (e.g., AUD patients) may be more useful in
examining any potential relationships there may be between tracking behaviours and alcohol
use in humans.
114
Chapter Four
Sign-Tracking is Amplified by Acute Alcohol
Consumption for Lower, but not Higher, Doses
4.1 Abstract
Background: Sign-tracking – the persistent attribution of incentive value to discrete reward-
related cues – has been demonstrated in animals and humans. Moreover, preclinical work has
revealed that acute drug doses can enhance the motivational value of reward-related cues
(which can be measured via attention and craving), perhaps contributing to drug-related
behaviour. Aims: Alcohol’s effect on sign-tracking was investigated in humans for the first
time. Methods: Two experiments employed a within-subjects alcohol priming paradigm to
assess if 0.3 g/kg (Exp. 1) and/or 0.6 g/kg (Exp. 2) doses of alcohol altered sign-tracking
behaviour, compared with a soft drink control. Social drinkers (n ≈ 30) were tested on two
separate days during which they completed an additional singleton task, while their eye
movements were monitored. Results: Sign-tracking was observed in all conditions across
both experiments. The magnitude of sign-tracking was increased after ingestion of 0.3 g/kg of
alcohol (relative to control), but was unaffected by the higher 0.6 g/kg dose. Conclusions:
Acute administration of 0.3 but not 0.6 g/kg doses of alcohol amplifies sign-tracking in social
drinkers. Sign-tracking priming paradigms may be a new avenue through which to investigate
the link between incentive salience and alcohol use.
Keywords: Sign-tracking, Alcohol priming, Incentive salience, Attentional bias, Eye-tracking

115
4.2 Introduction
Sign-tracking (ST) develops when discrete, response-irrelevant reward-related cues
(conditioned stimuli [CS]) are imbued with incentive value, while goal-tracking (GT) occurs
when the same CS is used solely to predict the onset of reward (unconditioned stimuli [US]).
Both ST and GT have been linked to substance-use behaviours and risk factors associated
with substance use (e.g., impulsivity and risk seeking) in preclinical studies, and it has been
suggested that both phenotypes confer vulnerability for compulsive behavioural disorders,
such as addiction (Flagel, Akil, & T. E. Robinson, 2009). However, sign-tracking in
particular has been given special attention due to the ability of discrete cues imbued with
value to subsequently influence behaviour. For example, compared with GTs, ST rats
exposed to a response-noncontingent cocaine-paired cue were more willing to cross an
electrified floor to gain access to the cue, even in the absence of the cocaine reward
(Saunders et al., 2013). Discrete, alcohol-paired cues have also been shown to act as
conditioned reinforcers in STs but not GTs, with STs motivated to work harder to be
presented with the alcohol-paired cue (Villaruel & Chaudhri, 2016). Further, alcohol
exposure has also been shown to amplify sign-tracking in rats (Madayag et al., 2017;
McClory & Spear, 2014), though results are mixed (Versaggi et al., 2016).
Sign-tracker and goal-tracker subgroups appear across a range of species (Breland &
Breland, 1961), with preclinical work revealing that STs are more impulsive, show greater
novelty- and sensation-seeking behaviours, poorer executive control and are more driven to
seek rewards by the presence of discrete reward-paired cues than are GTs (Meyer, Lovic, et
al., 2012; T. E. Robinson et al., 2014). On the other hand, GTs imbue contextual cues with
value (e.g., the use of different cages), with such cues better suited to motivating the
reinstatement of cocaine seeking in GTs compared to STs (Saunders et al., 2014). Recent
116
research has revealed that humans also sign-track, as measured by a variety of tasks gauging
value-modulated attentional capture (VMAC) (Anderson, Laurent, & Yantis, 2011; Anderson
& Yantis, 2012, 2013; Le Pelley, Mitchell, & Johnson, 2013; Le Pelley, Pearson, Griffiths, &
Beesley, 2015). Importantly, due to the differences in animal and human selection for
measuring tracking propensity, it is highly unlikely that tracking phenotypes of the type
found in animals will be found in human lab studies. Human tracking is likely better viewed
on a continuum alongside traits such as impulsivity. However, we may still be able to alter
human tracking responses through various manipulations, such as alcohol priming.
The most widely used tasks to date are typically variations of the additional singleton
task (AST) (Theeuwes, 1991, 1992, 2010), in which individuals respond to a target (e.g., a
diamond) whilst ignoring or avoiding responses to a stimulus that was previously associated
with reward (e.g., a coloured circle; CS). In a recent study similar to the one used here,
participants were trained to associate one coloured circle with high reward and another with
low reward. Subsequently, these circles were presented as distractors in successive trials in
which participants were instructed to locate a shape singleton (a diamond) (Le Pelley et al.,
2015). They found that oculomotor capture by the CS previously associated with the high-
value reward was greater than for the CS associated with low reward, and this persisted
despite distractor capture resulting in rewards being omitted. Such capture also occurred
under shorter durations – and thus via faster saccades – than did target (diamond) responses,
indicating that distractor capture was an automatic (bottom-up) process. Such sign-tracking
responses also persist despite punishment and are maintained over a period of months without
the need for continued reinforcement (Anderson & Yantis, 2013), which could be viewed as a
similar potential risk factor for the kind of cue-modulated reward seeking seen in Pavlovian-
to-Instrumental Transfer studies (Cartoni et al., 2016; Hogarth et al., 2014). Finally, human
participants designated as STs (via a median split) engage in greater CS-driven reward
117
seeking and have higher levels of self-reported impulsivity compared to GTs (Garofalo & di
Pellegrino, 2015).
In an important study, researchers compared opioid-dependent patients to healthy
controls on an AST and found that, while sign-tracking was evident across the entire sample,
the magnitude of sign-tracking was significantly larger in the patient group, indicating
amplification of sign-tracking in addiction (B. A. Anderson et al., 2013). Results from the
same group have further shown that substance abuse history is positively associated with
sign-tracking (Anderson, Kronemer, Rilee, Sacktor, & Marvel, 2016). However, in both of
these studies causality is impossible to ascertain; did the propensity to sign-tracking
contribute to the addiction, or do the drugs enhance sign-tracking (or both)?
It is well-established that social and dependent users of alcohol and other substances
show an attentional bias (AB) towards user-specific substance-related stimuli, compared to
nonusers/non-consumers (for a review, see Field & Cox, 2008). These biases appear to
develop over time as users learn to associate various cues (e.g., branding symbols) with
reward (e.g., alcohol consumption), giving cues incentive-motivational properties that are
evident in attentional processing. However, a recent critical review of AB theories suggests
that perhaps the most robust (albeit weak) association to AB is an individual’s current
motivational state (Field et al., 2016). For instance, craving is positively correlated with AB
(both of which fluctuate) for substances. Perhaps such within-subject fluctuations (e.g.,
before or after a priming dose) represent current incentive value and are more important than
between-group differences (e.g., individuals with and without an alcohol use disorder
[AUD]).
Interestingly, however, although AB and craving have been linked, alcohol priming
appears to affect the two measures differently, with alcohol preloads increasing craving dose-
118
dependently, while affecting AB via an inverted-U association (Field, Schoenmakers, &
Wiers, 2008). A recent field study – which observed a greater range of doses than had been
observed previously – also showed that AB and craving respond differently to an alcohol
prime. Craving was positively predicted and AB negatively predicted by alcohol dose in
participants who had been binge drinking (Schoenmakers & Wiers, 2010).
Some modern theories of conditioned responding to reward-related cues focus on the
attribution of incentive salience. For example, incentive sensitisation theory posits that
prolonged exposure to potentially addictive substances can cause the brain’s reward circuitry
to become hyper-sensitised, leading to substance-related stimuli gaining motivational value
and attracting attention (i.e., becoming ‘wanted’) (T. E. Robinson & Berridge, 2008). This
sensitisation may be related to aberrant cognitive processing such as poor attentional control
(as measured by visual working memory tasks) and high impulsivity, both of which are
associated with increased AB towards reward-related stimuli – an account which has support
in both pre-clinical and human studies (Anderson et al., 2013, 2015; Flagel et al., 2009;
Tomie, Aguado, Pohorecky, & Benjamin, 2000).
Substance priming (enhanced motivation following an initial dose) promotes attentional
orienting towards substance-specific (e.g., cocaine and nicotine) cues in rats (Frenk, Martin,
Vitouchanskaia, Dar, & Shalev, 2017; Kawa et al., 2016) and rhesus monkeys (Reilly et al.,
2016). However, preclinical studies also suggest that priming can increase incentive salience
for rewards (and reward-related stimuli) more generally, known as cross-priming. For
example, data reveal that ethanol (Tomie et al., 1998; Tomie, Festa, Sparta, & Pohorecky,
2003; however, for recent contrasting results, see Versaggi, King, & Meyer, 2016), nicotine
(Palmatier et al., 2013; Versaggi et al., 2016), opiates (DiFeliceantonio & Berridge, 2012,
2016; Mahler & Berridge, 2009) and amphetamine (DiFeliceantonio & Berridge, 2016; cf.
Holden & Peoples, 2010) can all prime rodents to increase sign-tracking behaviours towards
119
food-related CSs. Similar low-dose effects have also been reported for barbiturates and
benzodiazepines (Bordi & Matthews, 1990). Importantly, recent work has also shown that
nicotine injections in rats augments sign-tracking towards alcohol-related cues (i.e., it
increased alcohol-seeking behaviour), while a nicotinic acetylcholine receptor antagonist
blocked this effect (Maddux & Chaudhri, 2017).
In humans, Field, Mogg and Bradley (2005) found that a 0.4 g/kg dose of alcohol
increased AB towards smoking cues in smokers, which is suggestive of cross-priming.
Further, studies have also shown that alcohol primes can increase AB for cocaine cues in
cocaine users (Montgomery et al., 2010) and increase high-calorie food intake (Caton, Ball,
Ahern, & Hetherington, 2004; Christiansen, Rose, Randall-Smith, & Hardman, 2015;
Schrieks et al., 2015; Yeomans, 2010), though others give a more nuanced take (Rose,
Hardman, & Christiansen, 2015). Overall, these results suggest that alcohol (and other
substances) may prime individuals for reward in general, rather than in a substance-specific
way.
The current experiments combined the areas of attentional bias, sign-tracking and cross-
priming to assess the extent to which sign-tracking persists and potentially increases
following low (0.3 g/kg; Exp. 1) and moderate (0.6 g/kg; Exp. 2) doses of alcohol, compared
to control beverages. The two doses were chosen as they have previously shown some
contrasting results in the literature: low-moderate priming doses (e.g., 0.3-0.4 g/kg) have
been found to increase AB towards reward cues (typically alcohol), while moderate-high
doses (e.g., 0.6 g/kg+) do not (Adams, Ataya, Attwood, & Munafò, 2012; Christiansen, Rose,
Cole, & Field, 2013; Duka & Townshend, 2004; Fernie, Christiansen, Cole, Rose, & Field,
2012; Schoenmakers, Wiers, & Field, 2008; Weafer & Fillmore, 2013); however, see
(Schoenmakers & Wiers, 2010). Additionally, using low and moderate doses (with one twice
the ‘strength’ of the other) also allows for the observation of how craving is affected and,
120
finally, how craving and AB are linked (or not) after each priming dose. It is worth noting
that the studies which have shown no increase in AB after moderate-high doses typically
present stimuli which correspond to the prime itself (e.g., AB towards alcohol pictures is
measured after alcohol consumption), and none have yet (to our knowledge) investigated an
alcohol prime’s influence on AB for monetary reward.
Here we report two experiments wherein participants attended two separate laboratory
sessions, during which they consumed either lemonade (control) or vodka and lemonade
(alcohol). After consumption, participants completed an adaptation of the additional singleton
task – the additional singleton tracking task (ASTT) – in order to assess the extent of sign-
tracking. We also investigated the associations between sign-tracking (on control and priming
days) and individual differences (e.g., alcohol use, impulsivity etc.). We predicted that sign-
tracking would persist across all conditions (control and alcohol) in both experiments.
Specifically, given the dose-dependent effects found in both human and animal research, we
hypothesised that in Experiment 1 (0.3 g/kg) sign-tracking would be amplified after a priming
dose of alcohol, relative to a control drink. However, no directional hypothesis was made for
Experiment 2 (0.6 g/kg). Finally, exploratory analyses were conducted to further investigate
the association between sign-tracking and individual differences.
4.3 General Methods
Both studies received ethical approval from the University of Liverpool’s Research Ethics
Council and participants provided informed consent to all parts of each study (online and
laboratory).
121
Materials
Questionnaires
The same questionnaire pack used in study 1 was given to all participants to assess
drinking habits (TLFB, AUDIT), drinking motives (Modified DMQ-R), drinking
consequences (B-YAACQ), impulsivity (BIS-11, ImpSS) and childhood trauma (CATS) (see
Chapter Two [General Methods] for full descriptions). In addition, scales were also used to
assess subjective intoxication and desire for alcohol, before and after consuming all
beverages.
Subjective Intoxication Scales (SIS; Duka, Tasker & Stephens, 1998): The SIS consists
of 6 100mm VAS assessing subjective feelings of being ‘light headed’, ‘irritable’,
‘stimulated’, ‘alert’, ‘relaxed’ and ‘contented’.
Desire for Alcohol Questionnaire – brief version (DAQ; Love, James & Willner, 1998):
The DAQ consists of 14 items rated on a scale of 1 to 7, with higher scores indicating greater
craving. Based on a recent Principal Components Analysis three factors are evident: 1) strong
desires/intention to drink, 2) negative reinforcement, and 3) positive reinforcement + ability
to control drinking (Kramer et al., 2010). Total scores are also calculated.
Cognitive Task
Additional Singleton Tracking Task (ASTT): The task employed was identical to the task
used in study 1 (Chapter Three, see Chapter Two [General Methods] for full description), and
is an adaptation of the singleton task developed by Theeuwes (1991, 1992, 2010). Sign-
122
tracking is inferred from I) slower responses to the OT on high-value compared to low-value
trials, and II) greater omissions (CS responses) on high-value compared to low-value trials.
4.4 Experiment 1
Low-moderate priming doses of alcohol can increase attentional bias towards alcohol-related
cues (Adams et al., 2012; Duka & Townshend, 2004; Fernie, Christiansen, Cole, Rose, &
Field, 2012; Schoenmakers et al., 2008). The aim of the first experiment (Study 2) was to
extend these findings to assess, for the first time, whether a 0.3 g/kg dose of alcohol
magnifies attentional sign-tracking towards discrete, noncontingent CSs, compared to a
control beverage.
4.4.1 Method
Participants
Thirty-four social drinkers were recruited through opportunistic sampling, via internal
university and social media advertisements. Of these, one was excluded due to not
understanding the instructions of the task, one due to an adverse reaction to the priming dose
of alcohol, and three due to attrition. The remaining 29 participants (16 female) were aged
18-31 years (M = 21.66, SD ± 2.86). The inclusion criteria were I) regular consumption of
alcohol (≥10 units per week) to ensure that all participants were familiar with drinking
alcohol, would be unlikely to have an adverse reaction to the dose given, but also provided a
large pool of drinking habits from which to recruit, II) normal or corrected-to-normal vision
and III) the provision of a breath alcohol reading of 0.0 mg/l before study commencement.
123
Exclusion criteria I) were self-reported past or present alcohol or drug use problems, II)
colour-blindness, III) recent or current cold and flu symptoms, IV) currently taking
medications which may be affected by alcohol, V) aversion to lemonade or vodka, VI)
pregnancy or breastfeeding and VII) refusal to answer questions regarding childhood trauma
(due to the upsetting nature of some of the questionnaires given).
Design
This study used a within-subjects design, which took place over two sessions at least
three days apart. In one session participants were administered alcohol (0.3 g/kg), in the other
session they received lemonade. In both sessions participants were fully aware which
beverage they were receiving, and thus the experiment consisted of an alcoholic drink and a
control, not a placebo. This decision was made in order to create an ecologically valid test in
which participants knew what they were drinking. However, due to the design any
conclusions cannot separate out the pharmacological effects of alcohol from its anticipated
effects (Christiansen et al., 2013). Regarding the task, participants were also aware of the
colour-reward contingencies as, though research shows human sign-tracking persists
regardless of conscious awareness (see Le Pelley et al., 2015), no study has yet tested this
after a priming dose of alcohol. Both session order and colour contingency (red or blue/high
or low CS) were counterbalanced across participants.
Beverage Administration and Breath Alcohol Concentration
Before alcohol administration, participants were breathalysed (Lion 500 Alcometer, UK)
and only those with a 0.0 mg/l breath alcohol reading were permitted to continue. Participants
124
were then weighed and the researcher calculated the amount of alcohol to be given, based on
a 0.3 g/kg dose (equating to approximately 2.5 units for a 61 kg person). The alcohol used
was Smirnoff Red vodka (37.5% alcohol by volume [ABV]). The total dose was separated
equally via an enteral syringe into three glasses, before Schweppes lemonade was added at a
ratio of 3:1 (for a 61 kg person, this equates to approximately 62 ml of vodka and 186 ml of
lemonade [split over three glasses]). Participants were given each glass in turn and guided in
a semi-structured fashion; they consumed each drink within a 4 minute period, giving a total
consumption time of 12 minutes. This was followed by an absorption period lasting 20
minutes during which participants were simply asked to relax. Participants were breathalysed
for a second time before commencing with the task (which lasted approximately 21 minutes).
Participants provided a third, final breathalyser reading upon task completion. Control
sessions were conducted identically, except that a commensurate volume of lemonade was
administered in lieu of alcohol.
Procedure
The experiment consisted of three parts: I) online questionnaires, II) session 1, and III)
session 2 (three or more days after session 1). Potential participants who met the criteria to
participate completed the online questionnaire pack, providing measures of drinking habits
and motives, impulsivity and trauma (TLFB, AUDIT, M DMQ-R, B-YAACQ, BIS-11,
ImpSS, CATS) via Qualtrics (Provo, UT, 2015). Those who fulfilled the criteria were invited
to attend the laboratory sessions. Sessions took place between 1 p.m. and 6 p.m. in the eye-
tracking laboratory of the School of Psychology, University of Liverpool. During both
sessions, participants completed a baseline desire for alcohol questionnaire (DAQ) and the
subjective intoxication scale (SIS) before they were administered their beverages (alcohol or
125
control). After the consumption (12 min) and subsequent absorption (20 min) periods,
participants once again completed the SIS and DAQ (5 min), before completing the ASTT
(21 min). Participants were told that any earned points would be converted to additional
monetary rewards which would be provided at the end of session 2. Participants were always
asked to remain in the lab until their BrAC reached half that of the UK driving limit (0.17
mg/l or below). Upon conclusion of session 2, participants were asked if they knew the study
aims and believed whether they believed their task performance affected how many vouchers
they received.
Participants received either course credits or £20 in ‘Love2Shop’ vouchers as
compensation for their travel expenses and time. During the debriefing it was explained that
they would not receive any extra vouchers based on their task performance, and that this was
a necessary deception. Each session lasted approximately 1hr 15m. If participants refused to
remain in the lab while their BrAC levels fell to ≤0.17 mg/l, they were required to sign a
waiver.
4.4.2 Data Reduction and Analysis
The following are an extension of measures that have been used in previous research in
estimating attentional bias and stimulus value (Field & Cox, 2008; Rose, Brown, Field, &
Hogarth, 2013). As in Study 1, all RT responses on the ASTT <80ms and >999ms were
recoded as missing data.
Additional Singleton Tracking Task: Outcome Measures
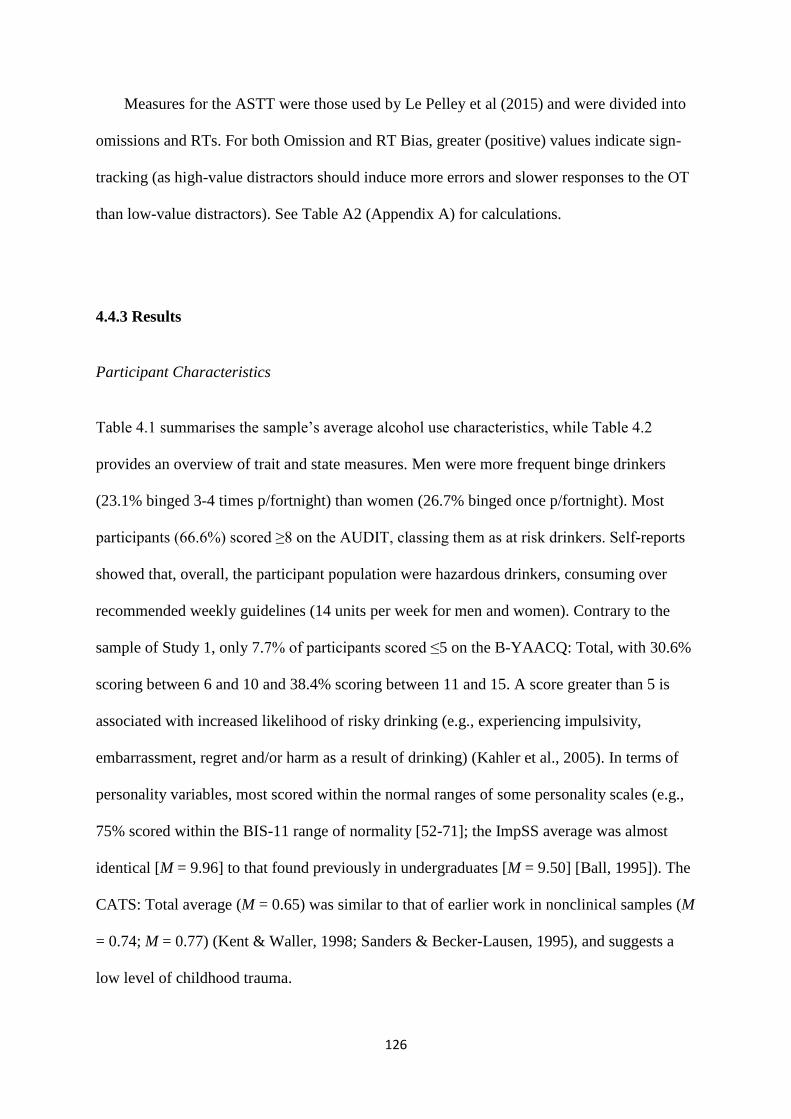
126
Measures for the ASTT were those used by Le Pelley et al (2015) and were divided into
omissions and RTs. For both Omission and RT Bias, greater (positive) values indicate sign-
tracking (as high-value distractors should induce more errors and slower responses to the OT
than low-value distractors). See Table A2 (Appendix A) for calculations.
4.4.3 Results
Participant Characteristics
Table 4.1 summarises the sample’s average alcohol use characteristics, while Table 4.2
provides an overview of trait and state measures. Men were more frequent binge drinkers
(23.1% binged 3-4 times p/fortnight) than women (26.7% binged once p/fortnight). Most
participants (66.6%) scored ≥8 on the AUDIT, classing them as at risk drinkers. Self-reports
showed that, overall, the participant population were hazardous drinkers, consuming over
recommended weekly guidelines (14 units per week for men and women). Contrary to the
sample of Study 1, only 7.7% of participants scored ≤5 on the B-YAACQ: Total, with 30.6%
scoring between 6 and 10 and 38.4% scoring between 11 and 15. A score greater than 5 is
associated with increased likelihood of risky drinking (e.g., experiencing impulsivity,
embarrassment, regret and/or harm as a result of drinking) (Kahler et al., 2005). In terms of
personality variables, most scored within the normal ranges of some personality scales (e.g.,
75% scored within the BIS-11 range of normality [52-71]; the ImpSS average was almost
identical [M = 9.96] to that found previously in undergraduates [M = 9.50] [Ball, 1995]). The
CATS: Total average (M = 0.65) was similar to that of earlier work in nonclinical samples (M
= 0.74; M = 0.77) (Kent & Waller, 1998; Sanders & Becker-Lausen, 1995), and suggests a
low level of childhood trauma.
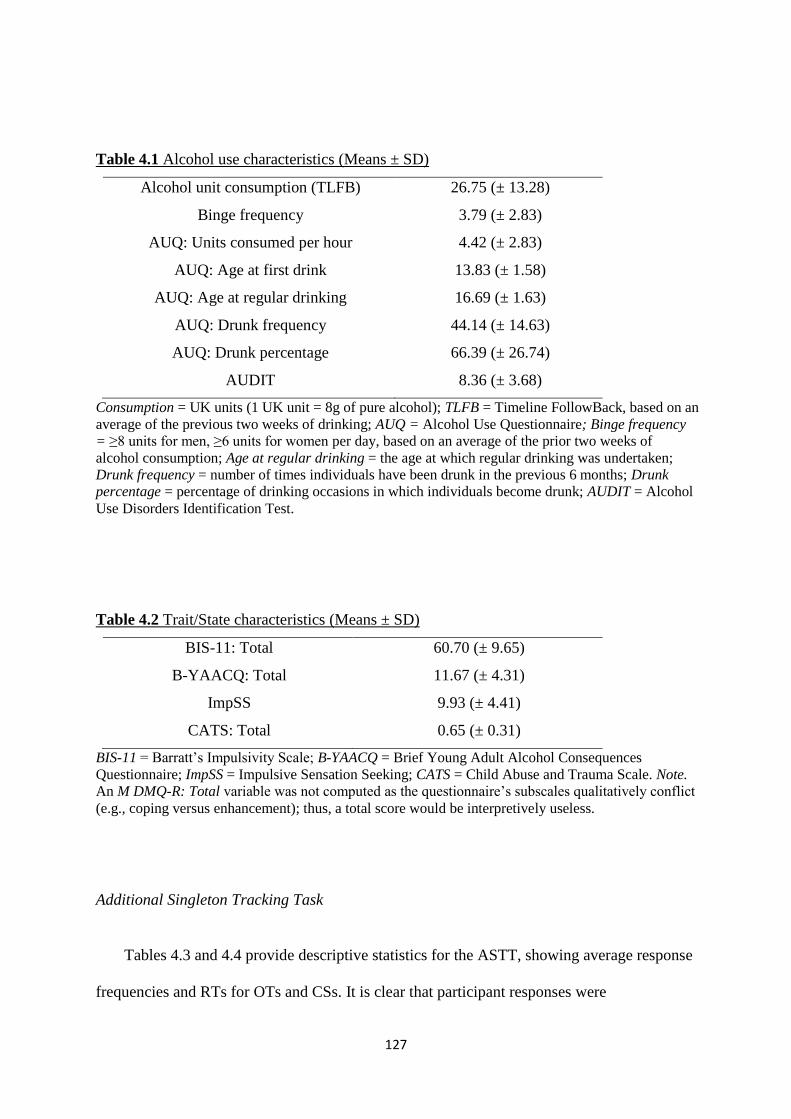
127
Table 4.1 Alcohol use characteristics (Means ± SD)
Alcohol unit consumption (TLFB) 26.75 (± 13.28)
Binge frequency 3.79 (± 2.83)
AUQ: Units consumed per hour 4.42 (± 2.83)
AUQ: Age at first drink 13.83 (± 1.58)
AUQ: Age at regular drinking 16.69 (± 1.63)
AUQ: Drunk frequency 44.14 (± 14.63)
AUQ: Drunk percentage 66.39 (± 26.74)
AUDIT 8.36 (± 3.68)
Consumption = UK units (1 UK unit = 8g of pure alcohol); TLFB = Timeline FollowBack, based on an
average of the previous two weeks of drinking; AUQ = Alcohol Use Questionnaire; Binge frequency
= ≥8 units for men, ≥6 units for women per day, based on an average of the prior two weeks of
alcohol consumption; Age at regular drinking = the age at which regular drinking was undertaken;
Drunk frequency = number of times individuals have been drunk in the previous 6 months; Drunk
percentage = percentage of drinking occasions in which individuals become drunk; AUDIT = Alcohol
Use Disorders Identification Test.
Table 4.2 Trait/State characteristics (Means ± SD)
BIS-11: Total 60.70 (± 9.65)
B-YAACQ: Total 11.67 (± 4.31)
ImpSS 9.93 (± 4.41)
CATS: Total 0.65 (± 0.31)
BIS-11 = Barratt’s Impulsivity Scale; B-YAACQ = Brief Young Adult Alcohol Consequences
Questionnaire; ImpSS = Impulsive Sensation Seeking; CATS = Child Abuse and Trauma Scale. Note.
An M DMQ-R: Total variable was not computed as the questionnaire’s subscales qualitatively conflict
(e.g., coping versus enhancement); thus, a total score would be interpretively useless.
Additional Singleton Tracking Task
Tables 4.3 and 4.4 provide descriptive statistics for the ASTT, showing average response
frequencies and RTs for OTs and CSs. It is clear that participant responses were
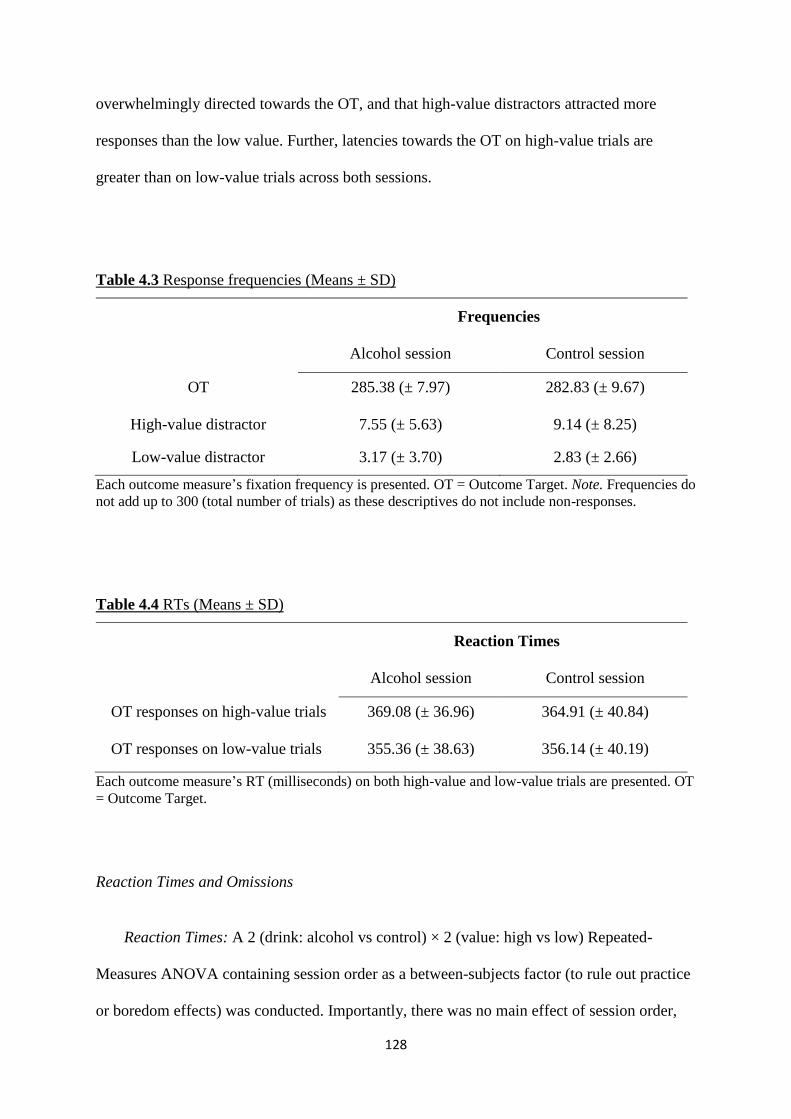
128
overwhelmingly directed towards the OT, and that high-value distractors attracted more
responses than the low value. Further, latencies towards the OT on high-value trials are
greater than on low-value trials across both sessions.
Table 4.3 Response frequencies (Means ± SD)
Frequencies
Alcohol session Control session
OT 285.38 (± 7.97) 282.83 (± 9.67)
High-value distractor 7.55 (± 5.63) 9.14 (± 8.25)
Low-value distractor 3.17 (± 3.70) 2.83 (± 2.66)
Each outcome measure’s fixation frequency is presented. OT = Outcome Target. Note. Frequencies do
not add up to 300 (total number of trials) as these descriptives do not include non-responses.
Table 4.4 RTs (Means ± SD)
Reaction Times
Alcohol session Control session
OT responses on high-value trials 369.08 (± 36.96) 364.91 (± 40.84)
OT responses on low-value trials 355.36 (± 38.63) 356.14 (± 40.19)
Each outcome measure’s RT (milliseconds) on both high-value and low-value trials are presented. OT
= Outcome Target.
Reaction Times and Omissions
Reaction Times: A 2 (drink: alcohol vs control) × 2 (value: high vs low) Repeated-
Measures ANOVA containing session order as a between-subjects factor (to rule out practice
or boredom effects) was conducted. Importantly, there was no main effect of session order,
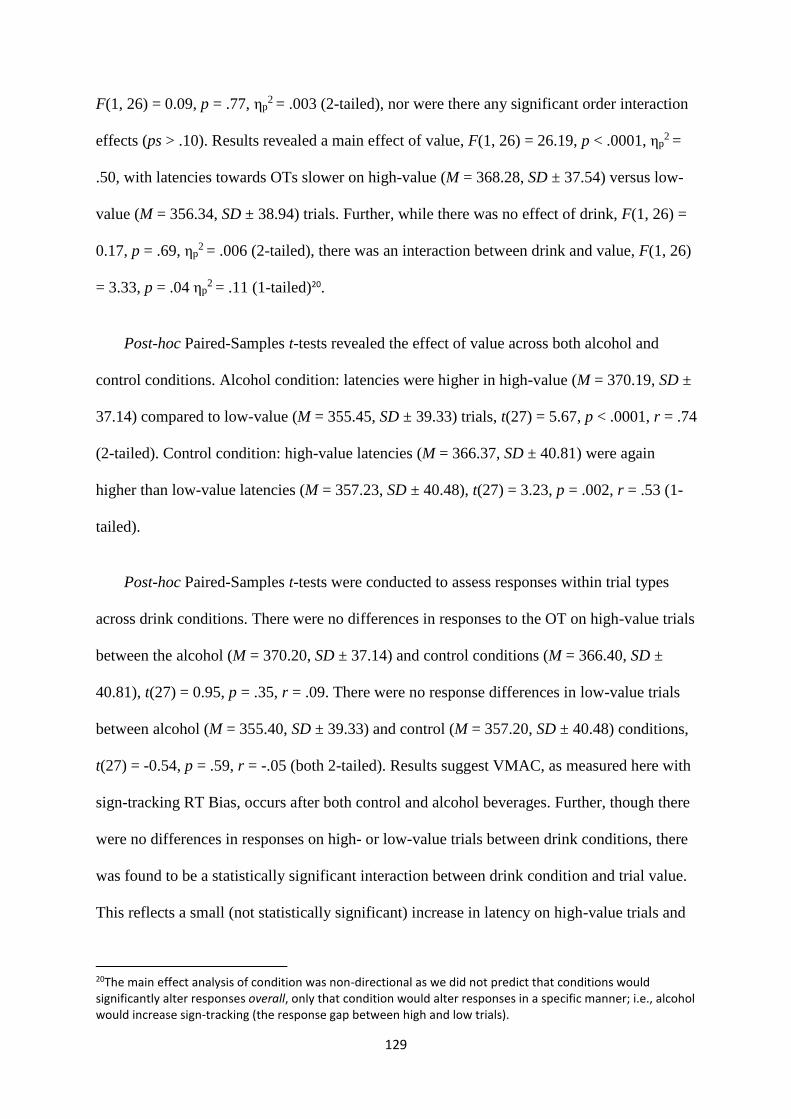
129
F(1, 26) = 0.09, p = .77, ηp2 = .003 (2-tailed), nor were there any significant order interaction
effects (ps > .10). Results revealed a main effect of value, F(1, 26) = 26.19, p < .0001, ηp2 =
.50, with latencies towards OTs slower on high-value (M = 368.28, SD ± 37.54) versus low-
value (M = 356.34, SD ± 38.94) trials. Further, while there was no effect of drink, F(1, 26) =
0.17, p = .69, ηp2 = .006 (2-tailed), there was an interaction between drink and value, F(1, 26)
= 3.33, p = .04 ηp2 = .11 (1-tailed)20.
Post-hoc Paired-Samples t-tests revealed the effect of value across both alcohol and
control conditions. Alcohol condition: latencies were higher in high-value (M = 370.19, SD ±
37.14) compared to low-value (M = 355.45, SD ± 39.33) trials, t(27) = 5.67, p < .0001, r = .74
(2-tailed). Control condition: high-value latencies (M = 366.37, SD ± 40.81) were again
higher than low-value latencies (M = 357.23, SD ± 40.48), t(27) = 3.23, p = .002, r = .53 (1-
tailed).
Post-hoc Paired-Samples t-tests were conducted to assess responses within trial types
across drink conditions. There were no differences in responses to the OT on high-value trials
between the alcohol (M = 370.20, SD ± 37.14) and control conditions (M = 366.40, SD ±
40.81), t(27) = 0.95, p = .35, r = .09. There were no response differences in low-value trials
between alcohol (M = 355.40, SD ± 39.33) and control (M = 357.20, SD ± 40.48) conditions,
t(27) = -0.54, p = .59, r = -.05 (both 2-tailed). Results suggest VMAC, as measured here with
sign-tracking RT Bias, occurs after both control and alcohol beverages. Further, though there
were no differences in responses on high- or low-value trials between drink conditions, there
was found to be a statistically significant interaction between drink condition and trial value.
This reflects a small (not statistically significant) increase in latency on high-value trials and
20The main effect analysis of condition was non-directional as we did not predict that conditions would significantly alter responses overall, only that condition would alter responses in a specific manner; i.e., alcohol would increase sign-tracking (the response gap between high and low trials).
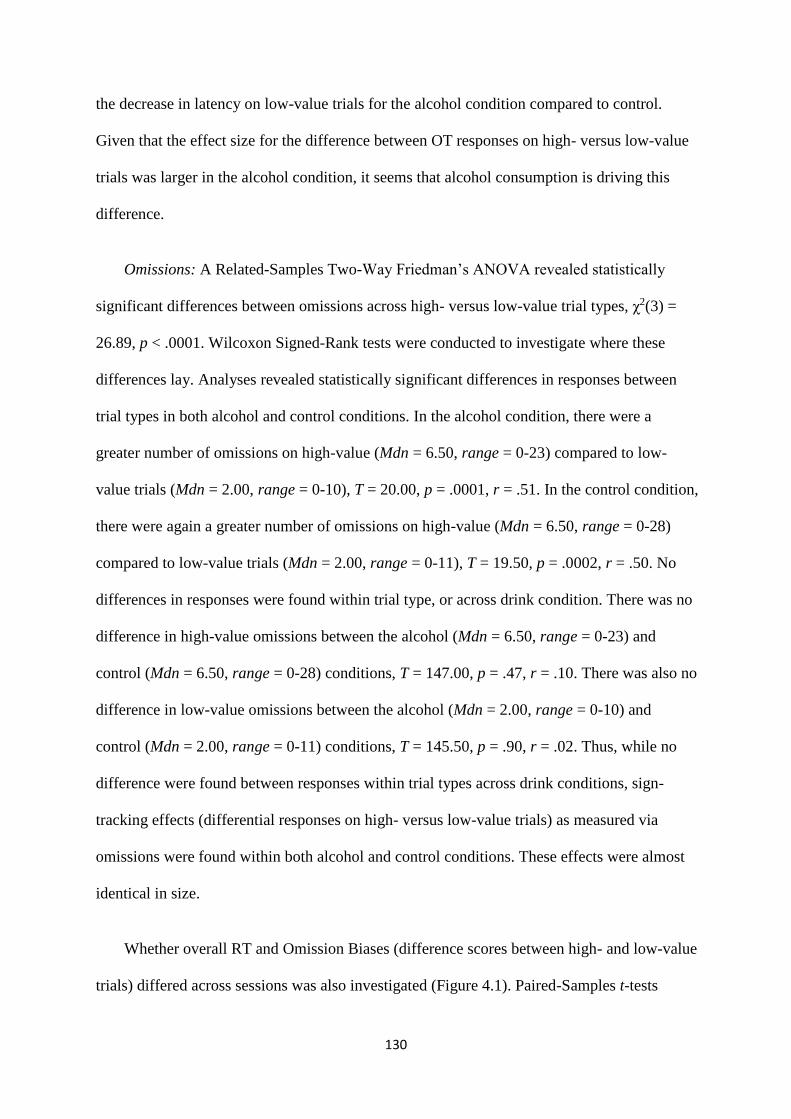
130
the decrease in latency on low-value trials for the alcohol condition compared to control.
Given that the effect size for the difference between OT responses on high- versus low-value
trials was larger in the alcohol condition, it seems that alcohol consumption is driving this
difference.
Omissions: A Related-Samples Two-Way Friedman’s ANOVA revealed statistically
significant differences between omissions across high- versus low-value trial types, χ2(3) =
26.89, p < .0001. Wilcoxon Signed-Rank tests were conducted to investigate where these
differences lay. Analyses revealed statistically significant differences in responses between
trial types in both alcohol and control conditions. In the alcohol condition, there were a
greater number of omissions on high-value (Mdn = 6.50, range = 0-23) compared to low-
value trials (Mdn = 2.00, range = 0-10), T = 20.00, p = .0001, r = .51. In the control condition,
there were again a greater number of omissions on high-value (Mdn = 6.50, range = 0-28)
compared to low-value trials (Mdn = 2.00, range = 0-11), T = 19.50, p = .0002, r = .50. No
differences in responses were found within trial type, or across drink condition. There was no
difference in high-value omissions between the alcohol (Mdn = 6.50, range = 0-23) and
control (Mdn = 6.50, range = 0-28) conditions, T = 147.00, p = .47, r = .10. There was also no
difference in low-value omissions between the alcohol (Mdn = 2.00, range = 0-10) and
control (Mdn = 2.00, range = 0-11) conditions, T = 145.50, p = .90, r = .02. Thus, while no
difference were found between responses within trial types across drink conditions, sign-
tracking effects (differential responses on high- versus low-value trials) as measured via
omissions were found within both alcohol and control conditions. These effects were almost
identical in size.
Whether overall RT and Omission Biases (difference scores between high- and low-value
trials) differed across sessions was also investigated (Figure 4.1). Paired-Samples t-tests
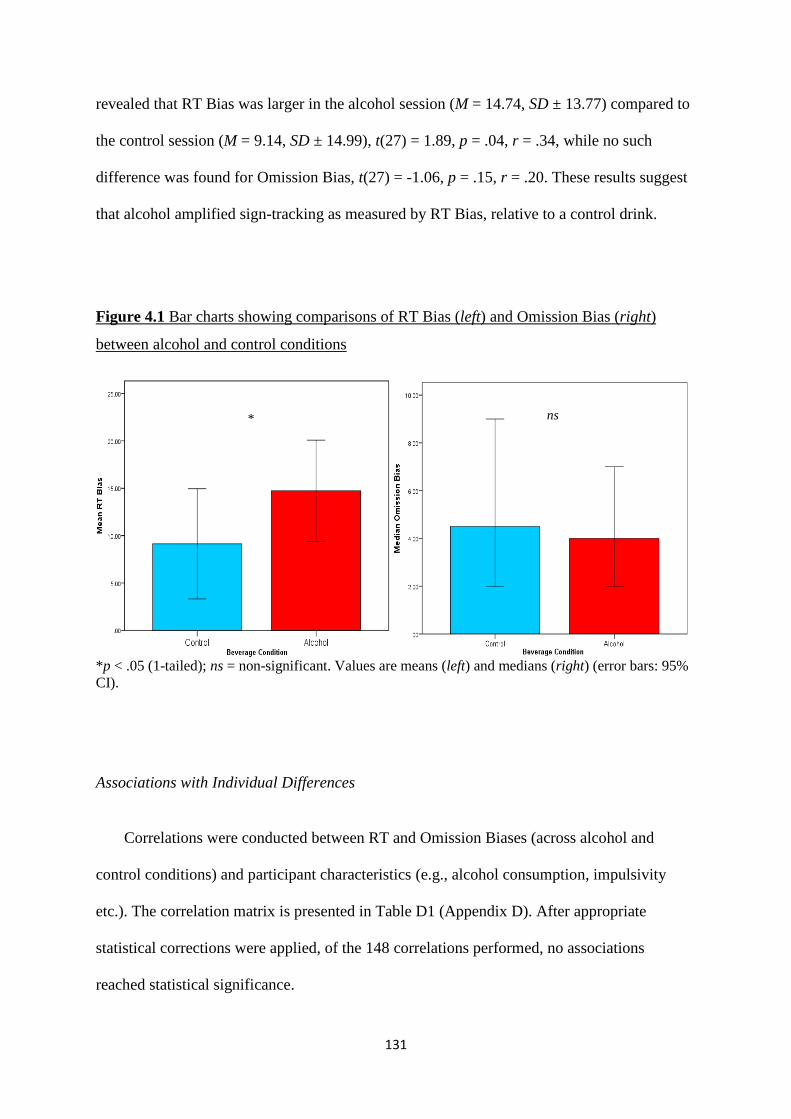
131
revealed that RT Bias was larger in the alcohol session (M = 14.74, SD ± 13.77) compared to
the control session (M = 9.14, SD ± 14.99), t(27) = 1.89, p = .04, r = .34, while no such
difference was found for Omission Bias, t(27) = -1.06, p = .15, r = .20. These results suggest
that alcohol amplified sign-tracking as measured by RT Bias, relative to a control drink.
Figure 4.1 Bar charts showing comparisons of RT Bias (left) and Omission Bias (right)
between alcohol and control conditions
*p < .05 (1-tailed); ns = non-significant. Values are means (left) and medians (right) (error bars: 95%
CI).
Associations with Individual Differences
Correlations were conducted between RT and Omission Biases (across alcohol and
control conditions) and participant characteristics (e.g., alcohol consumption, impulsivity
etc.). The correlation matrix is presented in Table D1 (Appendix D). After appropriate
statistical corrections were applied, of the 148 correlations performed, no associations
reached statistical significance.
ns *
132
Effects of alcohol
Desire for Alcohol Questionnaire (DAQ)
Two (drink) × two (time) Repeated-Measures ANOVA were conducted to assess changes
in desire for alcohol. Each of the four DAQ measures were assessed in turn. For ‘desire’, there
was a main effect of drink condition, with desire larger in the alcohol session (M = 18.11 SD
± 4.04) compared to the control session (M = 15.98, SD ± 4.65), F(1, 27) = 7.41, p = .01, ηp2 =
.22, but no effect of time (pre-post), F(1, 27) = 0.80, p = .38, ηp2 = .03, and no interaction,
F(1, 27) = 2.12, p = .16, ηp2 = .07. For ‘pos + control’ (positive reinforcement and ability to
control drinking), there was no main effect of drink condition, F(1, 26) = 2.08, p = .16, ηp2 =
.07, no main effect of time, F(1, 26) = 0.01, p = .91, ηp2 = .0005, and no interaction, F(1, 26) =
0.20, p = .66, ηp2 = .008. For ‘negative’ (negative reinforcement), again there were no main
effects of drink condition, F(1, 26) = 3.59, p = .07, ηp2 = .12 or time, F(1, 26) = 3.90, p = .06,
ηp2 = .13, and no interaction, F(1, 26) = 0.29, p = .59, ηp
2 = .01. Finally, for total DAQ scores,
there was a main effect of drink condition, with total scores higher in the alcohol session (M =
43.20, SD ± 8.88) than in the control session (M = 38.34, SD ± 10.27), F(1, 27) = 7.13, p =
.01, ηp2 = .21. There was no main effect of time, F(1, 27) = 0.03, p = .87, ηp
2 = .001, and no
interaction, F(1, 27) = 1.95, p = .17, ηp2 = .07.
Post-hoc Paired-Samples t-tests were conducted for ‘desire’, comparing before control
versus before alcohol (i.e., at baseline) and after control versus after alcohol (all 2-tailed).
Results showed no difference in total scores at baseline, t(27) = -1.82, p = .08, r = .33, though
revealed that ‘desire’ was significantly higher after alcohol (M = 18.64, SD ± 5.34) compared
to after control (M = 15.89, SD ± 5.15), t(27) = -2.88, p = .008, r = .48. The same analyses
133
were conducted for total DAQ scores. While the baseline comparison did not reach statistical
significance t(27) = -2.05, p = .051, r = .37, total scores after the alcohol drink were
significantly higher (M = 43.82, SD ± 10.86) than after control (M = 37.86, SD ± 11.33), t(27)
= -2.81, p = .009, r = .48.
Overall results reveal that two out of four DAQ measures (desire and total score) were
significantly higher post-alcohol compared to post-control, although pre-alcohol and pre-
control scores did not differ. However, there were no pre-post consumption differences in
either drink condition. Alcohol’s priming of craving cannot therefore be reasonably inferred.
Subjective Intoxication Scale (SIS)
Given that SIS measures were used in an exploratory fashion and were of secondary
import, these analyses are located in the appendices (Appendix D). Briefly, ‘light-
headedness’, ‘stimulation’, and ‘relaxation’ showed a pre-post alcohol (priming) increase,
with ‘alertness’ showing the converse (ps < .05). No changes were found for ‘irritable’ or
‘contented’ measures (ps > .05).
Sign-tracking and Craving and Intoxication measures
To investigate any associations between sign-tracking and experimental alcohol
measures, correlational analyses included change scores for any craving (DAQ: ‘desire’ and
‘total’) and intoxication (SIS: ‘alertness’, ‘stimulation’, ‘relaxation’ and ‘alertness’) measure
which showed either a drink condition or time effect. Breath alcohol concentration (BrAC)
was also included for analysis. After corrections were applied, no statistically significant
134
correlations were found between sign-tracking, DAQ and SIS change scores or BrAC
measures (see Tables D2, D3 and D4 in Appendix D, respectively).
4.4.4 Discussion
Study 2 replicated the findings of Study 1 (Chapter Three): sign-tracking – as indicated by
both RT and omission differences in responding between high- and low-value trials – was
found in social drinkers when sober. This experiment extended these findings to show, for the
first time, that sign-tracking (as indicated by both RTs and omissions) is also present after
social drinkers consume a low dose (0.3 g/kg) of alcohol. Importantly, a statistically
significant interaction was found between condition (drink type) and trial type (CS value).
However, post-hoc tests found no statistically significant differences between responses
across conditions within the same trial type (i.e., responses on high-value trials were not
statistically different after alcohol compared to control, as was also the case for low-value
trials). Rather, the descriptive statistics show that alcohol increased RT on high-value trials
while decreasing RT on low-value trials (both compared to control), though neither to a
statistically significant degree. This suggests that any amplification of sign-tracking by
alcohol may not occur solely through an increase in attentional capture by high-value CSs nor
through a decrease in perceived value (and thus reduced capture) of low-value CSs, but rather
via small changes in both pathways. This is supported by a statistically significant difference
in RT Bias between alcohol and control conditions. Although this finding must be interpreted
with caution, it is possible that sign-tracking in human social drinkers may be magnified by a
low dose of alcohol. However, due to the non-significant post-hoc tests, a larger sample size
may be required than this experiment possesses. Sign-tracking as measured by omissions did
not significantly alter after a low dose of alcohol.

135
Analyses of the visual analogue scales revealed that two of the four DAQ measures –
‘desire’ and total score – showed significant increases after alcohol compared to after control.
However, there was no pre-post differences for alcohol (nor control) consumption, which
indicates a lack of a priming effect. Indeed, previous work has shown that higher doses than
0.3 g/kg are needed to prime craving as measured by the DAQ (Rose & Duka, 2006). Visual
inspection of the current data revealed that this may have been due to an anticipatory priming
effect, with DAQ measures being higher before alcohol consumption than before control
consumption (though this difference did not reach statistical significance). This anticipation,
coupled with a possible ceiling effect of 0.3 g/kg dose’s maximum impact on subjective
desire, may have been responsible for the lack of a priming effect. For the SIS, ‘light-
headedness’, ‘stimulation’, and ‘relaxation’ increase post-alcohol, while an alcohol (priming)
‘alertness’ decreased. The ‘irritable’ and ‘contented’ measures were unaffected. These results
suggest that participants’ subjective feelings of intoxication were altered by alcohol, even
though their subjective craving was not. No DAQ, SIS or BrAC measures were significantly
correlated with any sign-tracking measure, suggesting that an individual’s tendency to attend
to cues of higher incentive value is unrelated to any other individual difference.
4.5 Experiment 2
Alcohol priming research shows that enhanced motivation to drink following initial
consumption may be dose dependent. For example, Rose and Duka (2006) found a priming
effect on self-reported craving after 0.6 g/kg of alcohol but not 0.3 g/kg, compared to
placebo. The higher 0.6 g/kg dose shows a robust priming effect of craving in the literature,
and several papers suggest that this priming effect may work via increasing the positive
reinforcing effects of alcohol (i.e., increasing its value) (Rose & Duka, 2006; Rose &
136
Grunsell, 2008). However, alcohol doses appear to affect attentional bias differently.
Previous research has shown that more extreme alcohol doses (both low and high; e.g., doses
≤0.13 g/kg and doses ≥0.6 g/kg) (Adams et al., 2012; Duka & Townshend, 2004; Weafer &
Fillmore, 2013) do not increase AB towards alcohol-related stimuli, unlike moderate doses
(~0.2-0.4 g/kg) (Adams et al., 2012; Fernie et al., 2012; Field & Duka, 2002; Schoenmakers
et al., 2008). Further, one recent pre-clinical study found that a 0.7 g/kg dose in rats – the
human dose equivalent of approximately a 1.04 g/kg dose for a 60 kg person (for dose
calculations, see Reagan-Shaw, Nihal, & Ahmad, 2007; Shin, Seol, & Son, 2010) – actually
reduced sign-tracking for food cues, while increasing goal-tracking (Versaggi et al., 2016; cf.
Tomie et al., 1998; Tomie et al., 2003). The aim of this experiment was to build on this
research (as well as the findings of Study 2) to explore whether a 0.6 g/kg alcohol prime
would significantly alter sign-tracking AB towards discrete, reward-independent CSs
(particularly those of high value, relative to low value).
4.5.1 Method
Participants
Thirty-three social drinkers were recruited through opportunistic sampling and recruited via
internal university and social media advertisements. Of these, one was excluded due to not
being able to remain still during the task after the alcohol prime, one due to not being able to
consume all of the drinks in the time set, and one due to too much missing data. The
remaining 30 participants (18 female) were aged 18-31 years (M = 22.47, SD ± 4.52).
Inclusion and exclusion criteria were identical to Study 2.
137
Design
The design and procedure were identical to those of Experiment 1. The only difference
was the dose, which was increased from 0.3 g/kg (Study 2) to 0.6 g/kg (Study 3).
4.5.2 Results
Participant Characteristics
Table 4.5 summarises the sample’s average alcohol use characteristics, while Table 4.6
provides an overview of trait and state measures. Men showed a narrower range of binge
drinking (25% binged once p/fortnight) than women (~16.7% binged 0 to 6 times p/fortnight).
Most participants (70%) scored ≥8 on the AUDIT, classing them as at risk drinkers. Self-
reports showed that, overall, the participant population were hazardous drinkers, consuming
over recommended weekly guidelines (14 units per week for men and women). Twenty-three
percent of participants scored ≤5 on the B-YAACQ: Total, with 53.3% scoring between 6 and
10 and 23.3% scoring between 15 and 20. A score greater than 5 is associated with increased
likelihood of risky drinking (e.g., experiencing impulsivity, embarrassment, regret and/or
harm as a result of drinking) (Kahler et al., 2005). In terms of personality variables, most
scored within the normal ranges of some personality scales (e.g., 63.2% scored within the
BIS-11 range of normality [52-71]; the ImpSS average was similar [M = 8.57] to that found
previously in undergraduates [M = 9.50] [Ball, 1995]). The CATS: Total average (M = 0.92)
was slightly higher than that of earlier work in nonclinical samples (M = 0.74; M = 0.77)
(Kent & Waller, 1998; Sanders & Becker-Lausen, 1995), though is still below the average
typically found in clinical samples.
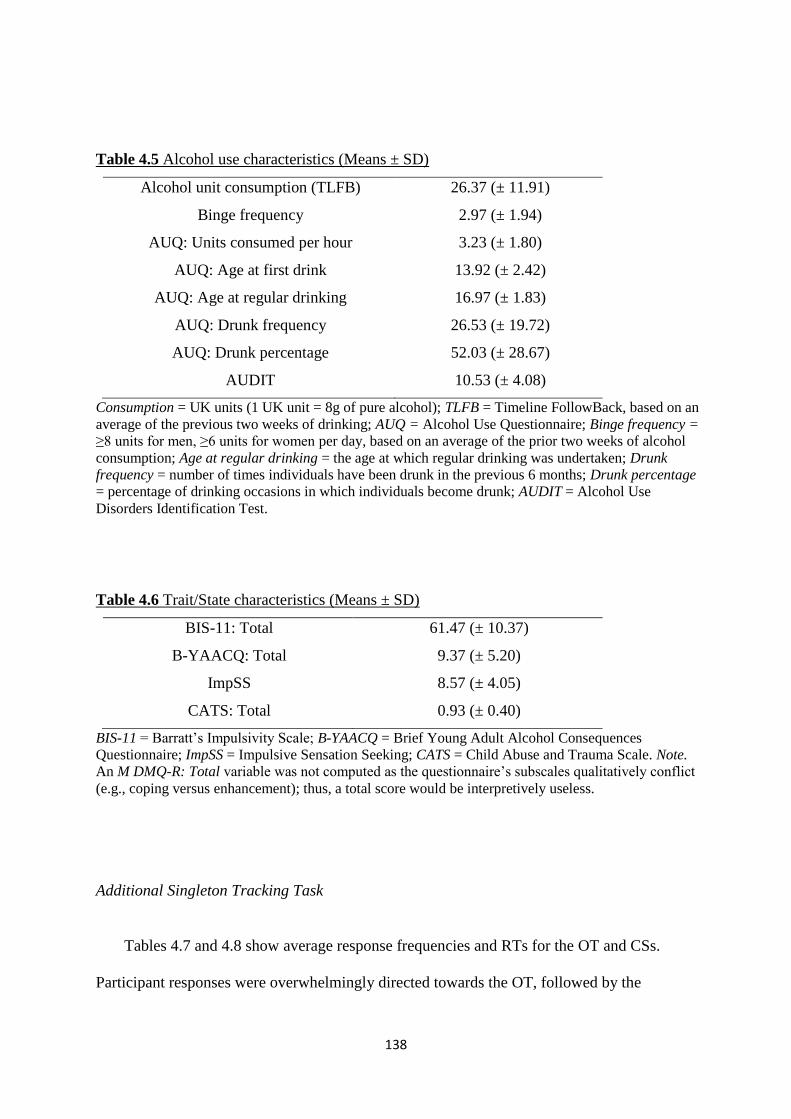
138
Table 4.5 Alcohol use characteristics (Means ± SD)
Alcohol unit consumption (TLFB) 26.37 (± 11.91)
Binge frequency 2.97 (± 1.94)
AUQ: Units consumed per hour 3.23 (± 1.80)
AUQ: Age at first drink 13.92 (± 2.42)
AUQ: Age at regular drinking 16.97 (± 1.83)
AUQ: Drunk frequency 26.53 (± 19.72)
AUQ: Drunk percentage 52.03 (± 28.67)
AUDIT 10.53 (± 4.08)
Consumption = UK units (1 UK unit = 8g of pure alcohol); TLFB = Timeline FollowBack, based on an
average of the previous two weeks of drinking; AUQ = Alcohol Use Questionnaire; Binge frequency =
≥8 units for men, ≥6 units for women per day, based on an average of the prior two weeks of alcohol
consumption; Age at regular drinking = the age at which regular drinking was undertaken; Drunk
frequency = number of times individuals have been drunk in the previous 6 months; Drunk percentage
= percentage of drinking occasions in which individuals become drunk; AUDIT = Alcohol Use
Disorders Identification Test.
Table 4.6 Trait/State characteristics (Means ± SD)
BIS-11: Total 61.47 (± 10.37)
B-YAACQ: Total 9.37 (± 5.20)
ImpSS 8.57 (± 4.05)
CATS: Total 0.93 (± 0.40)
BIS-11 = Barratt’s Impulsivity Scale; B-YAACQ = Brief Young Adult Alcohol Consequences
Questionnaire; ImpSS = Impulsive Sensation Seeking; CATS = Child Abuse and Trauma Scale. Note.
An M DMQ-R: Total variable was not computed as the questionnaire’s subscales qualitatively conflict
(e.g., coping versus enhancement); thus, a total score would be interpretively useless.
Additional Singleton Tracking Task
Tables 4.7 and 4.8 show average response frequencies and RTs for the OT and CSs.
Participant responses were overwhelmingly directed towards the OT, followed by the
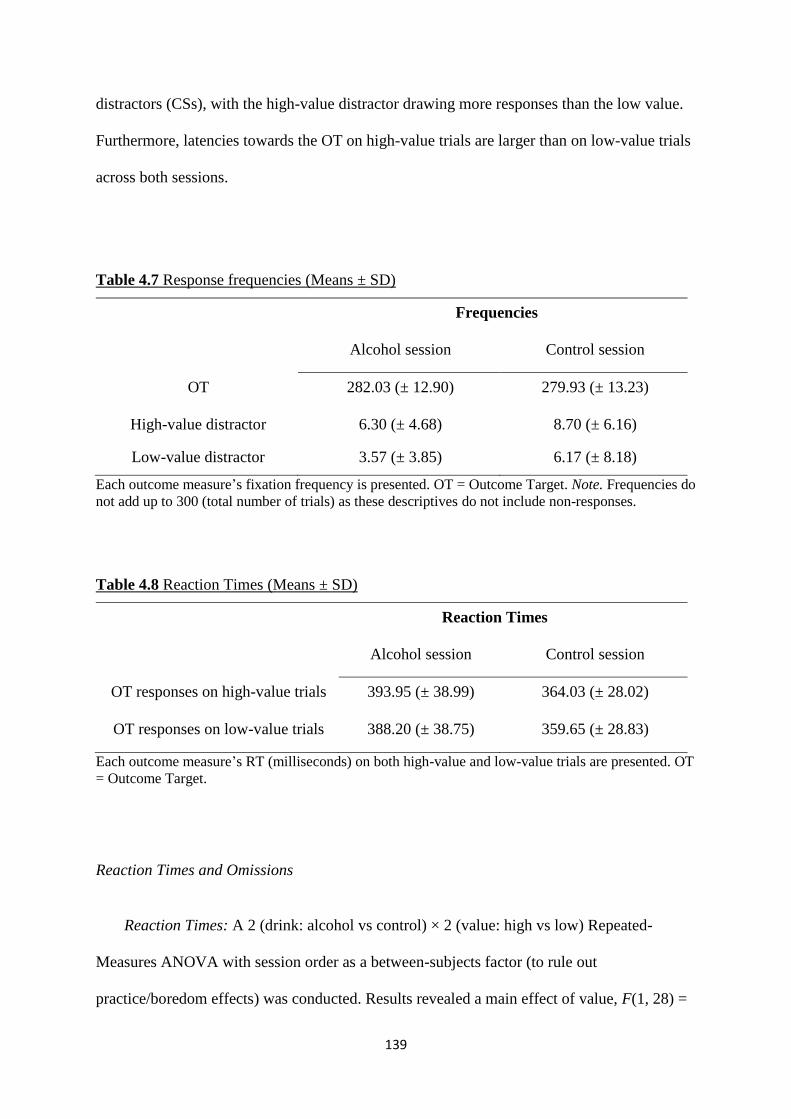
139
distractors (CSs), with the high-value distractor drawing more responses than the low value.
Furthermore, latencies towards the OT on high-value trials are larger than on low-value trials
across both sessions.
Table 4.7 Response frequencies (Means ± SD)
Frequencies
Alcohol session Control session
OT 282.03 (± 12.90) 279.93 (± 13.23)
High-value distractor 6.30 (± 4.68) 8.70 (± 6.16)
Low-value distractor 3.57 (± 3.85) 6.17 (± 8.18)
Each outcome measure’s fixation frequency is presented. OT = Outcome Target. Note. Frequencies do
not add up to 300 (total number of trials) as these descriptives do not include non-responses.
Table 4.8 Reaction Times (Means ± SD)
Reaction Times
Alcohol session Control session
OT responses on high-value trials 393.95 (± 38.99) 364.03 (± 28.02)
OT responses on low-value trials 388.20 (± 38.75) 359.65 (± 28.83)
Each outcome measure’s RT (milliseconds) on both high-value and low-value trials are presented. OT
= Outcome Target.
Reaction Times and Omissions
Reaction Times: A 2 (drink: alcohol vs control) × 2 (value: high vs low) Repeated-
Measures ANOVA with session order as a between-subjects factor (to rule out
practice/boredom effects) was conducted. Results revealed a main effect of value, F(1, 28) =

140
5.97, p = .02, ηp2 = .18 (2-tailed), with higher latencies towards OTs on high-value (M =
378.99, SD ± 36.89) compared to low-value (M = 373.92, SD ± 36.79) trials. Results also
revealed a main effect of drink, F(1, 28) = 33.74, p < .0001, ηp2 = .55 (2-tailed), with higher
latencies towards OTs in the alcohol condition (M = 391.07, SD ± 38.65) than the control
condition (M = 361.84, SD ± 28.27). There was no interaction observed between value and
drink, F(1, 28) = 0.11, p = .74, ηp2 = .004 (2-tailed). However, there was an interaction effect
between drink and session order, with higher RTs in the alcohol condition (M = 404.82, SD ±
25.84) compared to control (M = 352.64, SD ± 25.10) in the alcohol → control order, and
higher RTs in the alcohol (M = 379.04, SD ± 43.71) compared to control (M = 369.89, SD ±
27.74) condition in the control → alcohol order, F(1, 28) = 16.61, p = .0003, ηp2 = .37 (2-
tailed).
Post-hoc Paired-Samples t-tests revealed a sign-tracking effect between high- and low-
value trials within both drink conditions. In the alcohol condition, latencies were higher on
high-value (M = 393.95, SD ± 38.99) compared to low-value (M = 388.20, SD ± 38.75) trials,
t(29) = 2.18, p = .04, r = .37 (2-tailed), as they also were in the control condition (high value:
M = 364.03, SD ± 28.02; low value: M = 359.65, SD ± 28.83), t(29) = 1.67, p = .05, r = .30
(1-tailed).
Inspecting the main effect of drink, Paired-Samples t-tests revealed that OT latencies
were slower on high-value trials in the alcohol condition (M = 393.95, SD ± 38.99), compared
to the control condition (M = 364.03, SD ± 28.02), t(29) = 4.53, p < .0001, r = .64, with the
same pattern observed for low-value trials (alcohol: M = 388.20, SD ± 38.75; control: M =
359.65, SD ± 28.83), t(29) = 4.15, p = .0003, r = .61 (both 2-tailed). This means that
participants were slower to respond to the OT on alcohol versus control days (regardless of
trial type), and that the effect of trial type (CS value) was present on both alcohol and control
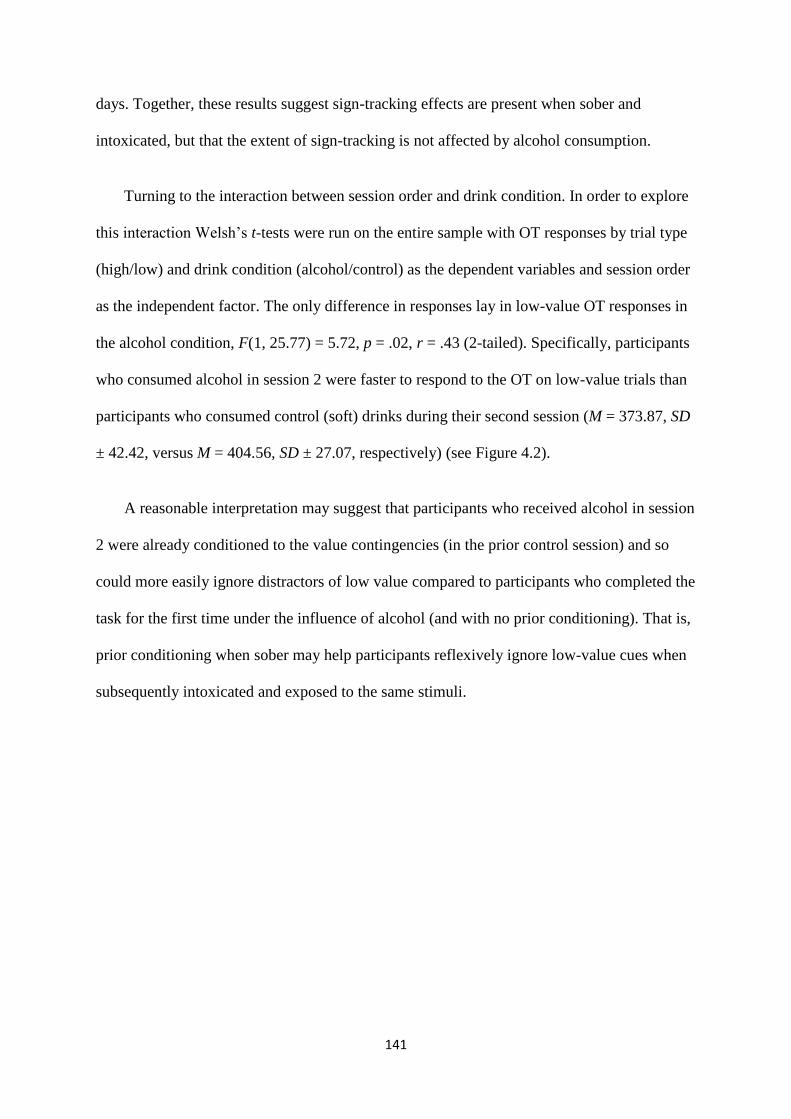
141
days. Together, these results suggest sign-tracking effects are present when sober and
intoxicated, but that the extent of sign-tracking is not affected by alcohol consumption.
Turning to the interaction between session order and drink condition. In order to explore
this interaction Welsh’s t-tests were run on the entire sample with OT responses by trial type
(high/low) and drink condition (alcohol/control) as the dependent variables and session order
as the independent factor. The only difference in responses lay in low-value OT responses in
the alcohol condition, F(1, 25.77) = 5.72, p = .02, r = .43 (2-tailed). Specifically, participants
who consumed alcohol in session 2 were faster to respond to the OT on low-value trials than
participants who consumed control (soft) drinks during their second session (M = 373.87, SD
± 42.42, versus M = 404.56, SD ± 27.07, respectively) (see Figure 4.2).
A reasonable interpretation may suggest that participants who received alcohol in session
2 were already conditioned to the value contingencies (in the prior control session) and so
could more easily ignore distractors of low value compared to participants who completed the
task for the first time under the influence of alcohol (and with no prior conditioning). That is,
prior conditioning when sober may help participants reflexively ignore low-value cues when
subsequently intoxicated and exposed to the same stimuli.
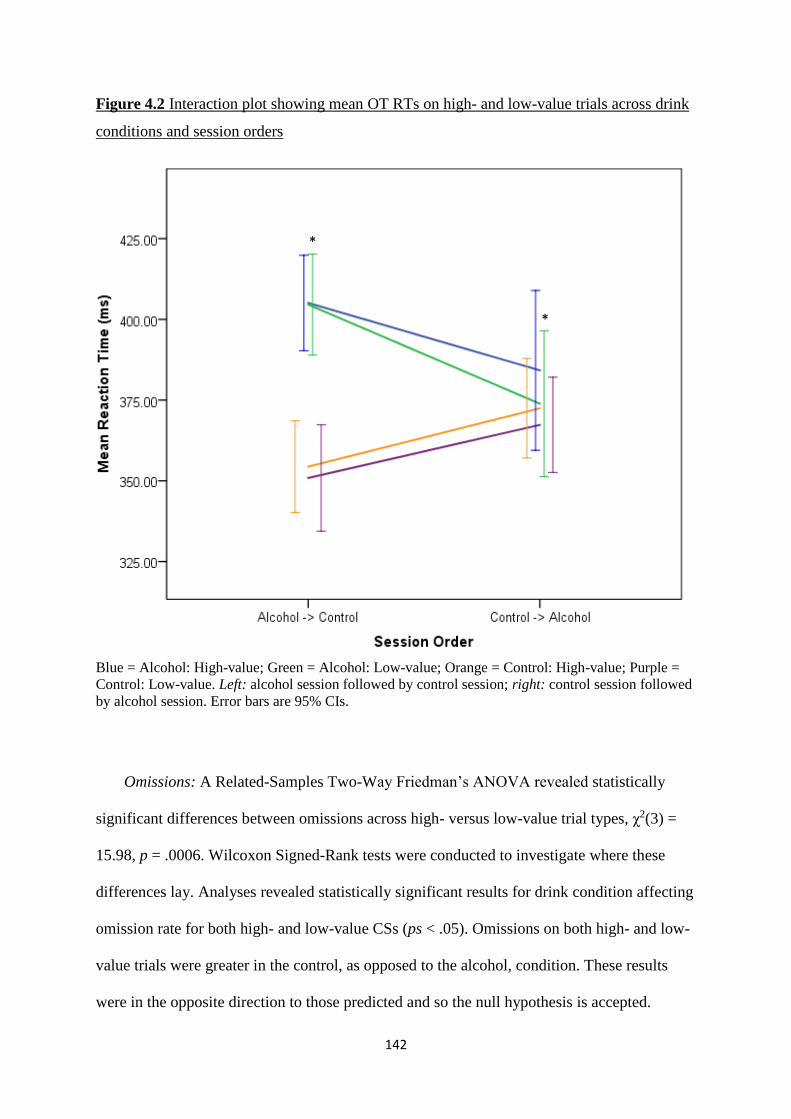
142
Figure 4.2 Interaction plot showing mean OT RTs on high- and low-value trials across drink
conditions and session orders
Blue = Alcohol: High-value; Green = Alcohol: Low-value; Orange = Control: High-value; Purple =
Control: Low-value. Left: alcohol session followed by control session; right: control session followed
by alcohol session. Error bars are 95% CIs.
Omissions: A Related-Samples Two-Way Friedman’s ANOVA revealed statistically
significant differences between omissions across high- versus low-value trial types, χ2(3) =
15.98, p = .0006. Wilcoxon Signed-Rank tests were conducted to investigate where these
differences lay. Analyses revealed statistically significant results for drink condition affecting
omission rate for both high- and low-value CSs (ps < .05). Omissions on both high- and low-
value trials were greater in the control, as opposed to the alcohol, condition. These results
were in the opposite direction to those predicted and so the null hypothesis is accepted.
*
*
143
Further, while an effect of CS value was found in the alcohol condition, with more omissions
in the high-value (M = 6.30, SD ± 4.68) compared to the low-value (M = 3.57, SD ± 3.85)
trials, t(29) = 2.56, p = .008, r = .43 (2-tailed), no such difference was found in the control
condition (high-value: M = 8.70, SD ± 6.16; low-value: M = 6.17, SD ± 8.18), t(29) = 1.59, p
= .06, r = .38 (1-tailed). This indicates that drink type did not significantly affect sign-tracking
omissions, though value-modulated omissions were only found in the alcohol condition.
Associations to individual differences
Correlations were conducted between RT Bias, Omission Bias (across alcohol and
control conditions) and self-report measures (e.g., alcohol consumption, impulsivity etc.).
The correlation matrix is presented in Table E1 (Appendix E). After appropriate statistical
corrections were applied, of the 148 correlations performed, no associations between task
outcomes and individual differences were found.
Effects of alcohol
Desire for Alcohol Questionnaire (DAQ)
Two (drink) × two (time) Repeated-Measures ANOVA were conducted to assess
changes in desire for alcohol. Each of the four DAQ measures were assessed in turn. For
‘desire’, there was a main effect of drink condition, with desire larger in the alcohol session
(M = 15.39 SD ± 4.84) compared to the control session (M = 13.36, SD ± 4.69), F(1, 28) =
8.23, p = .008, ηp2 = .23, but no effect of time, F(1, 28) = 3.38, p = .08, ηp
2 = .11. There was
an interaction between drink and time, F(1, 28) = 10.01, p = .004, ηp2 = .26. For ‘pos +
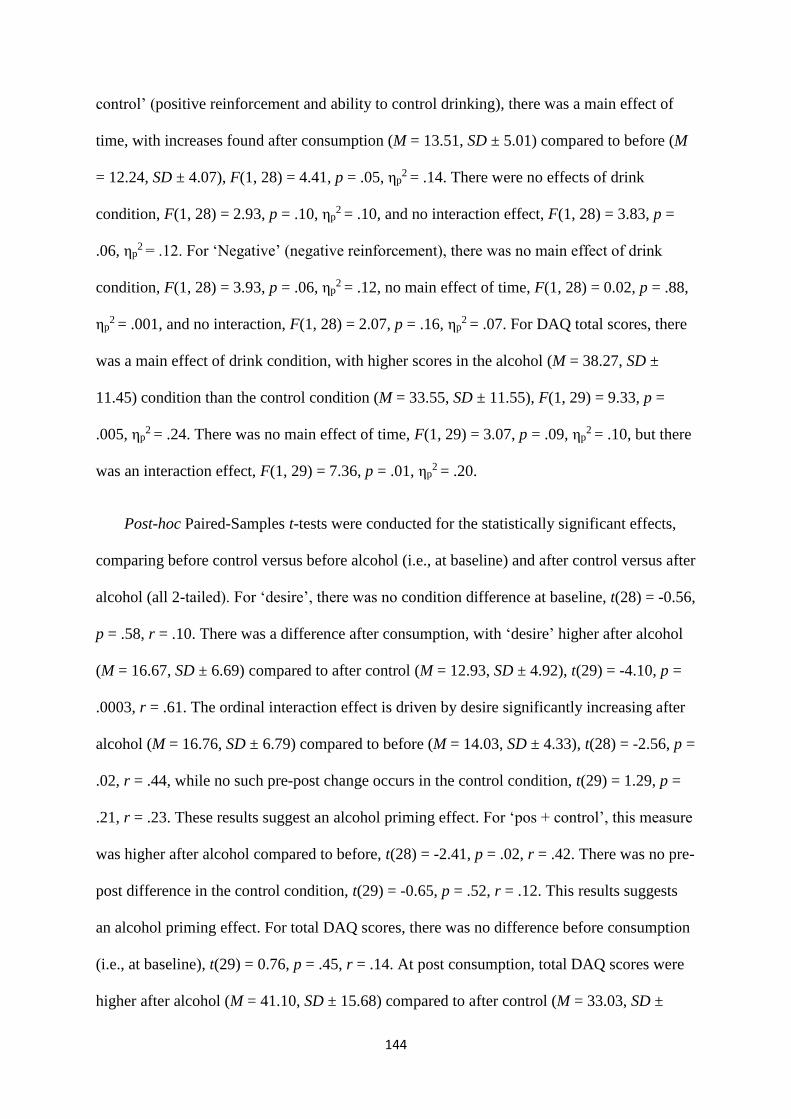
144
control’ (positive reinforcement and ability to control drinking), there was a main effect of
time, with increases found after consumption (M = 13.51, SD ± 5.01) compared to before (M
= 12.24, SD ± 4.07), F(1, 28) = 4.41, p = .05, ηp2 = .14. There were no effects of drink
condition, F(1, 28) = 2.93, p = .10, ηp2 = .10, and no interaction effect, F(1, 28) = 3.83, p =
.06, ηp2 = .12. For ‘Negative’ (negative reinforcement), there was no main effect of drink
condition, F(1, 28) = 3.93, p = .06, ηp2 = .12, no main effect of time, F(1, 28) = 0.02, p = .88,
ηp2 = .001, and no interaction, F(1, 28) = 2.07, p = .16, ηp
2 = .07. For DAQ total scores, there
was a main effect of drink condition, with higher scores in the alcohol (M = 38.27, SD ±
11.45) condition than the control condition (M = 33.55, SD ± 11.55), F(1, 29) = 9.33, p =
.005, ηp2 = .24. There was no main effect of time, F(1, 29) = 3.07, p = .09, ηp
2 = .10, but there
was an interaction effect, F(1, 29) = 7.36, p = .01, ηp2 = .20.
Post-hoc Paired-Samples t-tests were conducted for the statistically significant effects,
comparing before control versus before alcohol (i.e., at baseline) and after control versus after
alcohol (all 2-tailed). For ‘desire’, there was no condition difference at baseline, t(28) = -0.56,
p = .58, r = .10. There was a difference after consumption, with ‘desire’ higher after alcohol
(M = 16.67, SD ± 6.69) compared to after control (M = 12.93, SD ± 4.92), t(29) = -4.10, p =
.0003, r = .61. The ordinal interaction effect is driven by desire significantly increasing after
alcohol (M = 16.76, SD ± 6.79) compared to before (M = 14.03, SD ± 4.33), t(28) = -2.56, p =
.02, r = .44, while no such pre-post change occurs in the control condition, t(29) = 1.29, p =
.21, r = .23. These results suggest an alcohol priming effect. For ‘pos + control’, this measure
was higher after alcohol compared to before, t(28) = -2.41, p = .02, r = .42. There was no pre-
post difference in the control condition, t(29) = -0.65, p = .52, r = .12. This results suggests
an alcohol priming effect. For total DAQ scores, there was no difference before consumption
(i.e., at baseline), t(29) = 0.76, p = .45, r = .14. At post consumption, total DAQ scores were
higher after alcohol (M = 41.10, SD ± 15.68) compared to after control (M = 33.03, SD ±
145
12.05), t(29) = 3.77, p = .001, r = .57. The ordinal interaction effect is driven by total scores
significantly increasing after alcohol consumption (M = 41.10, SD ± 15.68) compared to
before (M = 35.43, SD ± 10.22), t(29) = -2.34, p = .03, r = .40. No such pre-post difference is
found in the control condition, t(29) = 1.25, p = .22, r = .23. These results suggest an alcohol
priming effect after consumption of 0.6 g/kg of alcohol with respect to total DAQ scores,
desire and positive reinforcement.
Subjective Intoxication Scale (SIS)
Given that SIS measures were used in an exploratory fashion and were of secondary
import, these analyses are located in the appendices (Appendix E). Briefly, ‘light-
headedness’, ‘stimulation’, ‘relaxation’ and ‘contentedness’ showed a pre-post alcohol
(priming) increase, with ‘alertness’ showing a decrease after consumption of the control drink
but not alcohol (ps < .05). No change in the ‘irritable’ measure was found (p > .05).
Sign-tracking and Craving and Intoxication measures
As in Study 2, correlational analyses were conducted on the change scores for craving
(DAQ: ‘desire’, ‘pos + control’ and ‘total’) and intoxication (SIS: ‘light-headedness’,
‘stimulation’, ‘relaxation’, ‘contentedness’ and ‘alertness’) measures which showed either
drink condition or time effects, to investigate if there was any association to sign-tracking.
Breath alcohol concentration (BrAC) was also included for analysis. Results showed that
DAQ: Desire (pre-post control consumption change) was significantly negatively correlated
with RT Bias (control condition) (rs = -.45). However, no other DAQ measure, and no SIS or
146
BrAC measure statistically significantly correlated with sign-tracking after corrections were
applied (see Tables E2, E3 and E4, Appendix E).
4.5.3 Discussion
Study 3 partially replicated the findings of study 1 (Chapter Three) and Study 2. Sign-
tracking was found in social drinkers, as indicated by RT differences across drink conditions
and omission differences in the alcohol condition between high- and low-value trials.
However, unlike Study 2, sign-tracking was not amplified by the alcohol dose compared to a
control drink. This is in line with a recent preclinical study showing that higher doses of
ethanol may actually reduce sign-tracking in rats (Versaggi et al., 2016), as well human
studies showing that higher and lower doses are less likely to affect AB than are moderate
doses (e.g., 0.2-0.4 g/kg) (Adams et al., 2012; Duka & Townshend, 2004; Fernie et al., 2012;
Field & Duka, 2002; Schoenmakers et al., 2008; Weafer & Fillmore, 2013).
There was an interaction of session order and drink condition. This suggested that
participants who undertook the alcohol session second found it easier to ignore low-value
distractors (perhaps as they had already been conditioned whilst sober), compared to
participants who underwent initial conditioning while intoxicated in session 1. The lack of
influence of session order in Study 2 likely reflects the much lower dose of this earlier study.
That is, in Study 2 participants who completed the ASTT after alcohol in session 1 may still
have found it relatively easy to ignore the low-value distractors given the low dose. The lack
of omissions differences between high- and low-value trials in the control condition is a first
across these three studies, and may again reflect the relative instability and insensitivity of the
omission measure.

147
Analyses revealed that three out of four DAQ measures were primed by alcohol
consumption. ‘Desire’ was increased post-alcohol compared to both pre-alcohol and post-
control consumption. ‘Pos + control’ (positive reinforcement) showed a pre-post alcohol
consumption increase. Total DAQ scores again showed an increase post-alcohol compared to
both pre-alcohol and post-control consumption. For the SIS, ‘light-headedness’, ‘stimulation’,
‘relaxation’ and ‘contentedness’ showed a pre-post alcohol (priming) increase, while
‘alertness’ showed a decrease after consumption of the control drink but not alcohol, and
‘irritable’ showed no change. These results suggest that most measures of subjective craving
and intoxication were altered (mostly increased) by consuming 0.6 g/kg of alcohol, supporting
previous findings (Rose & Duka, 2006; Rose & Grunsell, 2008).
Finally, after correcting for familywise error, no individual difference measure was
statistically significantly correlated with measures of sign-tracking. Only DAQ: Desire (pre-
post control consumption change) was significantly negatively correlated with RT Bias in the
control condition. However, it is unclear what could have prompted this increase in craving
and thus the association with sign-tracking is difficult to interpret. No other DAQ, SIS or
BrAC measures were significantly correlated with any sign-tracking measure, suggesting that
an individual’s tendency to attend to cues of higher incentive value is unrelated to any other
individual difference.
4.6 Results Synthesis
In order to assess whether the samples of experiments 1 and 2 (studies 2 and 3) differed in the
extent of their sign-tracking after alcohol, compared to their respective control conditions, the
two samples were pooled for statistical analysis (N = 58). Welch’s t-test analyses revealed
148
that the majority of measures (including age, gender and psychological questionnaire
measures) did not significantly differ between experimental groups (ps > .05). Craving
(DAQ) scores showed differences mainly before consumption, with ‘desire’ (before alcohol),
‘desire’ (before control) and DAQ total score (before alcohol) all higher in Study 2 than
Study 3. The only significant difference after consumption was ‘desire’ (after control), which
was again higher in Study 2. No post-alcohol differences were found. This seems to suggest
that the alcohol doses did not differentially affect craving between the two samples. All
measures which were found to be statistically different between experimental samples are
shown in Table 4.9.
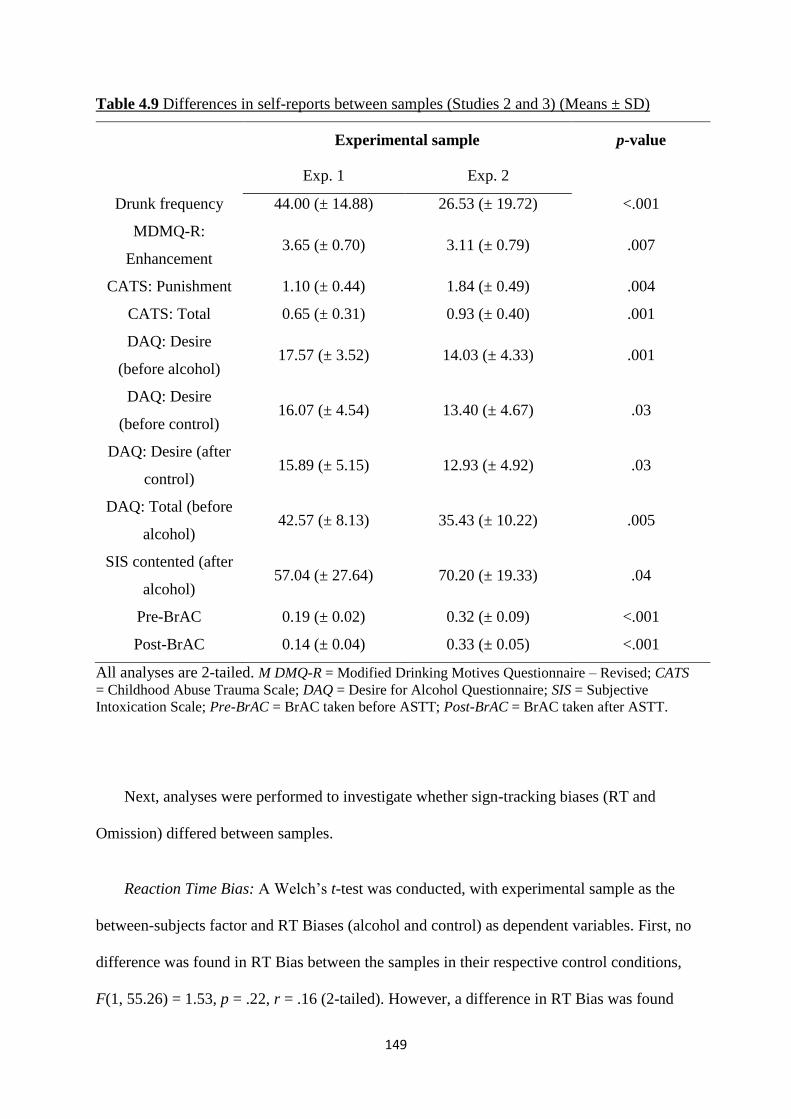
149
Table 4.9 Differences in self-reports between samples (Studies 2 and 3) (Means ± SD)
Experimental sample p-value
Exp. 1 Exp. 2
Drunk frequency 44.00 (± 14.88) 26.53 (± 19.72) <.001
MDMQ-R:
Enhancement 3.65 (± 0.70) 3.11 (± 0.79) .007
CATS: Punishment 1.10 (± 0.44) 1.84 (± 0.49) .004
CATS: Total 0.65 (± 0.31) 0.93 (± 0.40) .001
DAQ: Desire
(before alcohol) 17.57 (± 3.52) 14.03 (± 4.33) .001
DAQ: Desire
(before control) 16.07 (± 4.54) 13.40 (± 4.67) .03
DAQ: Desire (after
control) 15.89 (± 5.15) 12.93 (± 4.92) .03
DAQ: Total (before
alcohol) 42.57 (± 8.13) 35.43 (± 10.22) .005
SIS contented (after
alcohol) 57.04 (± 27.64) 70.20 (± 19.33) .04
Pre-BrAC 0.19 (± 0.02) 0.32 (± 0.09) <.001
Post-BrAC 0.14 (± 0.04) 0.33 (± 0.05) <.001
All analyses are 2-tailed. M DMQ-R = Modified Drinking Motives Questionnaire – Revised; CATS
= Childhood Abuse Trauma Scale; DAQ = Desire for Alcohol Questionnaire; SIS = Subjective
Intoxication Scale; Pre-BrAC = BrAC taken before ASTT; Post-BrAC = BrAC taken after ASTT.
Next, analyses were performed to investigate whether sign-tracking biases (RT and
Omission) differed between samples.
Reaction Time Bias: A Welch’s t-test was conducted, with experimental sample as the
between-subjects factor and RT Biases (alcohol and control) as dependent variables. First, no
difference was found in RT Bias between the samples in their respective control conditions,
F(1, 55.26) = 1.53, p = .22, r = .16 (2-tailed). However, a difference in RT Bias was found
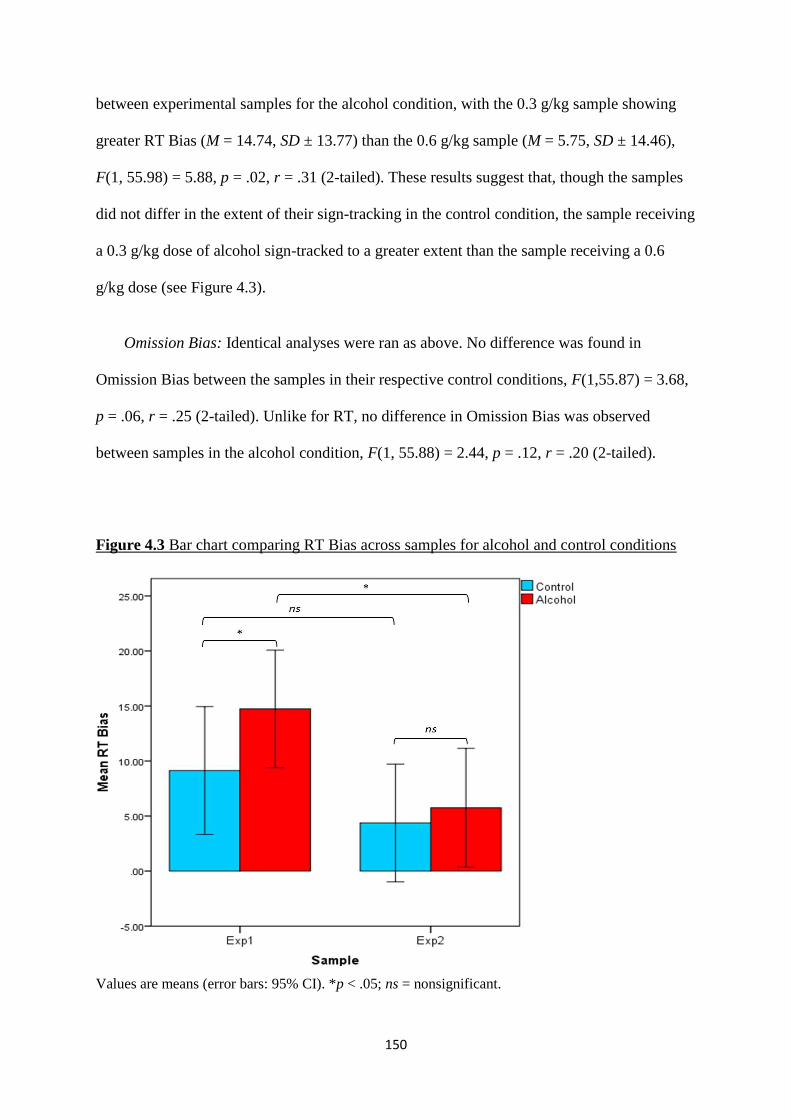
150
between experimental samples for the alcohol condition, with the 0.3 g/kg sample showing
greater RT Bias (M = 14.74, SD ± 13.77) than the 0.6 g/kg sample (M = 5.75, SD ± 14.46),
F(1, 55.98) = 5.88, p = .02, r = .31 (2-tailed). These results suggest that, though the samples
did not differ in the extent of their sign-tracking in the control condition, the sample receiving
a 0.3 g/kg dose of alcohol sign-tracked to a greater extent than the sample receiving a 0.6
g/kg dose (see Figure 4.3).
Omission Bias: Identical analyses were ran as above. No difference was found in
Omission Bias between the samples in their respective control conditions, F(1,55.87) = 3.68,
p = .06, r = .25 (2-tailed). Unlike for RT, no difference in Omission Bias was observed
between samples in the alcohol condition, F(1, 55.88) = 2.44, p = .12, r = .20 (2-tailed).
Figure 4.3 Bar chart comparing RT Bias across samples for alcohol and control conditions
Values are means (error bars: 95% CI). *p < .05; ns = nonsignificant.
151
4.7 General Discussion
Using the ASTT, two experiments were conducted to assess whether small and moderate
priming doses of alcohol (0.3 g/kg and 0.6 g/kg, respectively) increased sign-tracking
behaviours in social drinkers relative to a control drink. Questionnaires also gathered
information on drinking habits and other individual differences which have been associated
with sign-tracking behaviour in preclinical studies, such as impulsivity and trauma (Belin et
al., 2016; Flagel, Akil, et al., 2009; Tomie et al., 2008). Results from both experiments
replicated that of Study 1 (Chapter Three) and previous research (Le Pelley et al., 2015),
demonstrating that humans sign-track towards discrete, noncontingent reward-CSs (under
non-primed conditions). Specifically, value-modulated attentional capture (VMAC) is greater
towards high-value CSs than towards low-value CSs. Additionally, we showed for the first
time in humans that sign-tracking is maintained after both a 0.3 g/kg and 0.6 g.kg dose of
alcohol. Perhaps a more important finding was that the 0.3 g/kg dose of alcohol amplified
sign-tracking, compared to a control beverage, while the 0.6 g/kg dose did not. Furthermore,
the extent of the OT RT sign-tracking effect in experimental sample 1 (0.3 g/kg) was
significantly greater than in experimental sample 2 (0.6 g/kg), with a medium estimated
effect size. Analyses on change scores from both experiments showed mixed findings with
regard to alcohol priming. For craving (DAQ), while it cannot be said that there was any
strict priming in Study 2 (craving after alcohol was higher than after control, but there was no
pre-post alcohol difference), three out of four DAQ measures increased following alcohol
consumption, suggesting a priming effect in Study 3. Almost all SIS measures showed an
effect of drink across both studies (see Appendices D and E for more information). However,
the DAQ craving effects were not significantly dose-dependently affected by alcohol
152
consumption, as no difference was found in craving between the two samples after the
alcohol preload (for reviews, see Field et al., 2008; Rose, 2013).
In Experiment 1, no correlation with individual differences (TLFB, BIS-11 etc.), craving
(DAQ), intoxication (SIS) or BrAC was statistically significant after familywise error
corrections were applied. In Experiment 2, again no correlation with individual differences,
SIS or BrAC was statistically significant after familywise error corrections were applied. For
craving, DAQ: Desire (pre-post control consumption) was significantly negatively correlated
with RT Bias (control), indicating that decreased desire following control drink consumption
was associated with higher sign-tracking in the control condition (as measured by RT Bias).
The lack of a relationship between sign-tracking and individual difference measures across
both experiments contrasts with more stable findings in the preclinical literature (Flagel, Akil,
et al., 2009; Tomie et al., 2008), as well as the specific links between sign-tracking and
impulsivity previously found in humans (B. A. Anderson, Kronemer, et al., 2016; B. A.
Anderson et al., 2011a), though results are mixed (B. A. Anderson et al., 2013).
The data contained in this paper do not accord to meta-analytic results showing that AB
to reward cues is associated – albeit weakly – with craving measures (Field et al., 2009).
However, given the continued mixed results of this effect since the meta-analysis (Adams et
al., 2012; Schoenmakers & Wiers, 2010), the small effect that was found, and the evidence
suggesting AB and craving are differentially affected by alcohol preloads (Field et al., 2008),
it is perhaps unsurprising that no strong and/or consistent associations with craving were
found in this study. Another possible reason could be the existence of individual differences
in the way in which alcohol priming manifests differently when comparing explicit self-
report measures (such as craving and perceived intoxication) to implicit cognitive processing
(Schoenmakers et al., 2008). A final possibility relates to the recent theoretical synthesis
153
which suggests that AB and subjective craving may be discrete measures of value (Field et
al., 2016).
The amplification of sign-tracking found in Experiment 1 is supported by some
preclinical work with alcohol (Tomie et al., 1998, 2003), though findings are mixed
(Versaggi et al., 2016). Studies using other substances (e.g., amphetamine, nicotine etc.) have
been more consistent (Bordi & Matthews, 1990; DiFeliceantonio & Berridge, 2012, 2016;
Mahler & Berridge, 2009; Palmatier et al., 2013; Versaggi et al., 2016). The pooling of data
from experiments 1 and 2 revealed that sign-tracking was similar in the two control groups,
but was significantly greater following consumption of the 0.3 g/kg alcohol dose compared to
the 0.6 g/kg dose (0.6 g/kg did not differ from control). This finding of increased sign-
tracking suggests that low doses of alcohol can amplify VMAC, even when cues are
irrelevant and attention to them is not only not rewarded, but actively punished. Tomie et al.
(1998) suggest that alcohol may increase sign-tracking via effects on the dopaminergic
system. This hypothesis has gleaned support, with recent human data showing that magnitude
of sign-tracking across individuals is associated with changes in available D2/D3 dopamine
receptors in the right caudate and posterior putamen (substructures of the striatum) (B. A.
Anderson, Kuwabara, et al., 2016). Omission Bias was unaffected by the alcohol priming
dose, though this is perhaps unsurprising given that omissions occurred rarely (~2% across
trial types) in both beverage conditions, making it a relatively insensitive measure of sign-
tracking.
In humans, most of the priming literature has focussed on findings showing that
administration of specific substances (e.g., alcohol) increases incentive salience (as measured
by increased AB) for cues relating to that same substance (Adams et al., 2012; Duka &
Townshend, 2004; Schoenmakers & Wiers, 2010; Schoenmakers et al., 2008). However,
154
studies have also shown that acute alcohol consumption can increase AB for arbitrary
features of a cue (e.g., colour) previously paired with low doses of alcohol (Field & Duka,
2002), as well as for other rewards (e.g., smoking cues) (Field et al., 2005). Here, Experiment
1 showed that a 0.3 g/kg alcohol dose amplified AB towards discrete, response-irrelevant
cues associated with a monetary reward. This supports the hypothesis that alcohol can induce
a reward-general increase in incentive salience, rather than one that is reward-specific.
Moreover, the results suggest that this enhanced attribution of incentive salience is modulated
by reward cues’ relative value.
Experiment 2 aimed to explore the effects of a higher dose (0.6 g/kg) on sign-tracking.
Although sign-tracking was again found after alcohol consumption, sign-tracking biases
(both RT and Omission) were not statistically significantly different from biases found after
the control drink. That is, while there was no inflation of sign-tracking after the 0.6 g/kg dose,
the sign-tracking CR remained (at a magnitude no different to responses after the control
drink). (Note that an Omission Bias effect was absent after the control drink, likely due to the
general insensitivity of the measure.) Further, though there was found to be an effect of
condition (alcohol or control) on ASTT performance, this merely reflected a slowing down of
overall responses regardless of trial type. This may mirror results found previously showing
that ≥0.6 g/kg doses of alcohol can lead to transient impairments in executive cognitive
functioning (Christiansen et al., 2013). This may be particularly important given the link
between human sign-tracking and working memory (B. A. Anderson et al., 2013, 2011b; B.
A. Anderson & Yantis, 2012).
These results extend those of the priming literature showing that AB in social drinkers
can be manipulated by low-moderate doses of alcohol (e.g., 0.2-0.4 g/kg), but that such
manipulations are less susceptible to more extreme (low and high) doses (e.g., 0.1 g/kg or
155
>0.6 g/kg). For example, Duka and Townshend (2004) found that AB towards alcohol-related
stimuli in a dot-probe task increased after a 0.3 g/kg dose, but not after a 0.6 g/kg dose.
Similarly, Schoenmakers et al. (2008) found that a 0.3 g/kg dose increased AB on a visual
probe task compared to placebo, while Weafer and Fillmore (2013) found that heavy drinkers
showed a dose-dependent decrease in AB from placebo to 0.45 g/kg to 0.65 g/kg. Finally,
Adams et al. (2012) found that AB on a visual probe increased after a 0.4 g/kg dose, but not
after a 0.13 g/kg dose. The current data are thus in line with previous research showing an
inverse-U relationship between the amount of alcohol consumed and changes in AB, as
suggested by Duka and Townshend (2004) (cf. a recent naturalistic study by Schoenmakers &
Wiers, 2010, who report AB manipulations up to a much higher dose than seen in the lab).
Overall, given the preclinical findings that substances of various doses affect sign-
tracking, and that human studies show the alteration of attentional processing is also dose-
dependent, it would seem reasonable to tentatively conclude that human sign-tracking may
also be dose-dependently influenced by alcohol. Implications for addiction are apparent;
acute consumption of small amounts of alcohol can (implicitly) increase the value of reward-
associated cues, with cues that were already rewarding to begin with (e.g., alcohol, food and
other substances) becoming even more greatly valued relative to other, less valued rewards
(e.g., healthy food/drink options, fulfilling specific obligations etc.). It is possible that higher
doses may influence other cognitive processes and influence substance use through, for
example, decreased inhibitory control and increased risk taking (Christiansen, Rose, et al.,
2015; Rose, Jones, Clarke, & Christiansen, 2014).
Future work should aim to assess a wider variety of doses, preferably within the same
sample, to plot a dose response curve and better establish the relationship between acute
alcohol effects and sign-tracking. A placebo drink could also be utilised in order to assess the
156
anticipated effects of alcohol on sign-tracking, as has been done for various other cognitive
processes (Christiansen et al., 2013). Additionally, to directly investigate whether alcohol
increases incentive salience in a reward-general – rather than a reward-specific – way, the
ASTT could be adapted to present cue-contingent feedback which is reward specific (e.g.,
CS1 = alcohol, CS2 = food, etc.), the responses to which could then be compared. (Note:
such an adaptation would need to control for perceived reward value, so that the effects of
reward type and reward value can be disentangled.) Moreover, future work must be mindful
of the issue of adequate power. Though a statistically significant effect was found here in
Experiment 1, a power analysis (G*Power 3.1.9; (Erdfelder, Faul, & Buchner, 1996) based
on the OT RT effect size of Study 1 indicates that an N of 58 was necessary to achieve 80%
power, a criterion which should be met in any replication attempts. Finally, future research
should also consider directly investigating what cognitive mechanisms moderate this the
effect of alcohol on sign-tracking.
In summary, these studies are the first to explore the effects of alcohol on social drinkers’
propensity to sign-track towards discrete, noncontingent reward cues of differing value. We
showed that sign-tracking biases (both RT and Omission Bias) remained at both a 0.3 and 0.6
g/kg dose of alcohol, using an adapted version of the additional singleton paradigm. We also
found increased sign-tracking RT Bias – but not Omission Bias – at the 0.3 g/kg dose.
However, there was no increase in either type of sign-tracking at the 0.6 g/kg dose. The data
suggest that acute alcohol consumption at low-moderate doses may affect reward-based
processing of discrete cues, increasing the salience of already valuable rewards, as measured
by attentional bias. However, this alteration of cognitive bias seems largely unconnected to
changes in subjective craving and other self-report measures. Acute alcohol consumption
may affect processing of reward-associated cues, which in turn may contribute to excessive
substance use.
157
Chapter Five
Is Sign-Tracking maintained in a Singleton Task
with more than Two Distractors? A First Look
5.1 Abstract
Background: All versions of the additional singleton task in the literature use two or fewer
CSs. Aims: This study aimed to answer questions based on the results of Study 1 (Chapter
Three): when there are more than two distractors of value in the ASTT, I) do distractors of
differential value pull with differential force, and II) does sign-tracking remain? Methods: A
within-subjects design was employed. Thirty social drinkers completed an adaptation of the
ASTT containing three distractors instead of two. Participants also completed questionnaires
to provide individual difference measures (e.g., alcohol consumption, impulsivity etc.).
Results: RTs towards CSs were not affected by value. For the first time, no statistically
significant difference was found in target RTs between high- and low-value trials. However,
a difference was found between high- and medium-value trials. Omission differences were
found between high- and medium-value trials, and high- and low-value trials. Evidence of
associations between sign-tracking and individual differences was weak. Conclusions:
Research into human sign-tracking must expand its methods in order to investigate how sign-
tracking may change as individuals are exposed to more complex environments (e.g., when
the number of discrete, reward-associated distractors exceeds two).
Keywords: Sign-tracking, Goal-tracking, Attentional bias, ASTT
158
5.2 Introduction
Sign-tracking and goal-tracking are phenotypes found across a range of species (Flagel, Akil,
et al., 2009; Tomie et al., 2008). Sign-trackers (STs) attach salience to discrete, response-
irrelevant conditioned stimuli (CSs) which have been associated with reward, while goal-
trackers (GTs) use such CSs as indicators of reward availability. The difference between the
tracking groups is observed in both the attentional resources they devote to discrete CSs (STs
show an attentional bias [AB] while GTs do not), as well as in their associations with
impulsivity, distractibility, risk-taking, novelty-seeking, tendency to succumb to the influence
of reward-associated CSs, and higher consumption (or consumption risk via greater
acquisition, reinstatement, sensitization or resistance to extinction) of alcohol, drugs and/or
food (Ahrens et al., 2015; R. I. Anderson & Spear, 2011; King et al., 2016; Meyer, Lovic, et
al., 2012; Olshavsky et al., 2014; Saunders & Robinson, 2010, 2011; Versaggi et al., 2016;
Villaruel & Chaudhri, 2016; Yager et al., 2015; Yager & Robinson, 2015).
These associations to sign-tracking – many of which also correspond to goal-tracking in
different contexts (T. E. Robinson et al., 2014) – have made these phenotypes interesting to
the study of human issues such as drug addiction (Saunders & Robinson, 2013). In fact,
recent work has shown that human sign-trackers also show similar traits and associations.
Studies have shown that opioid-dependent patients (B. A. Anderson et al., 2013), obese
individuals (Versace et al., 2015) and adolescents (Roper et al., 2014) all sign-track to a
greater extent than nondrug, non-obese, adult controls. Additionally, in HIV+ patients sign-
tracking was positively correlated with premorbid non-planning impulsiveness, negatively
correlated with visual working memory capacity, and patients who also possessed a history of
drug abuse showed greater sign-tracking than patients who showed no history of abuse. Thus,
159
these phenotypes may hold great interest to researchers studying a variety of human disorders
and conditions.
The vast majority of studies investigating sign-tracking in humans have employed
variations of the additional singleton task (AST) (B. A. Anderson, 2015a; Le Pelley et al.,
2015; Theeuwes, 1991, 1992, 2010), though other cognitive measures have also been used
(Garofalo & di Pellegrino, 2015). Fundamentally, the AST presents participants with various
shapes and colours, and initially pairs certain colours with certain levels of reward (low, high
or none). Participants must then quickly locate the colours in order to win rewards21. After
this initial training phase participants are then instructed to find a shape (e.g., a diamond in an
array of circles) in order to win rewards. However, during this test phase some (or all) trials
contain circles of the colour previously associated with reward and the previous targets of
attention. These previously reward-associated stimuli now act as distractors to participants’
current goal of locating the diamond. Studies 1, 2 and 3 in this thesis all employed a variant
of the AST, called the additional singleton tracking task (ASTT). The ASTT uses no training
phase, and thus participants are never rewarded for responding to the colours. This setup
reduces any likelihood that instrumental factors drive sign-tracking, instead allowing for
narrower interpretations of a pavlovian cause (see Study 1, Chapter Three, for further
discussion of this topic).
One finding in the studies conducted so far shows that STs’ omission RTs are no quicker
than GTs’, which conflicts with the animal literature (Flagel, Robinson, et al., 2010; Flagel,
Watson, et al., 2009; Meyer, Lovic, et al., 2012). In Study 1 (Chapter Three) it was suggested
that this null finding might be symptomatic of a lack of RT variability, given that preclinical
21 Most variations of the AST do not instruct participants to respond to the colour specifically, but rather to a feature of the shape presented (e.g., the single horizontal bar presented amongst an array of vertical bars). Researchers simply pair this feature most often with a certain colour. Thus, an implicit association is drawn between the colour and the level of reward.
160
trial periods last a lot longer (typically around 8s) than human participants’ reactions in the
ASTT (typically <1s). It was proposed that one way to overcome this limitation is to use a
task which employs more than two CSs of differing value. This change would not alter the
timing structure of the ASTT (which is difficult to do given the task setup and has the added
shortcoming of introducing confounds which could make interpretation difficult); however,
by potentially increasing variability in CS (omission) RTs, it may be possible to determine
whether STs’ CS RTs are quicker than GTs’ (both in general and across CSs of different
value). Relatedly, previous human research has shown that while CSs of differing value
capture attention to different extents, the ‘pull’ or ‘force’ with which they do so is equal
across CS value (Le Pelley et al., 2015). That is, while high-value CSs slow down RTs to the
target more than low-value CSs (as well as causing more omissions), the speed with which
attention is drawn to each of the CSs during omission responses is equivalent. This finding
was replicated in Studies 1, 2 and 3 (see Chapter Nine).
Using an increasing number of reward-associated cues is also important in order to
assess how robust value-modulated attentional capture (VMAC) is when applied to more
complex environments (i.e., the presence of more stimuli and additional associations). The
consistent results in paradigms which use only two reward-associated cues may not be
applicable to paradigms whose cue quantity exceeds two. Indeed, as others have suggested,
“It would be informative for future studies to place differently valued distractors in direct
competition with one another.” (B. A. Anderson & Yantis, 2012, p. 1651). By presenting
participants with three reward-associated cues, rather than two, the current study aims to test
these outstanding questions: I) do STs show quicker CS RTs than GTs when CS RT
variability is increased, and II) do CS RTs (in the general sample) differ between CSs of
different value when the quantity of CSs exceeds two (i.e., when CS RT variability is
increased)? The primary hypotheses of the previous studies will also be tested in the context
161
of this new task variant. Given the robust result of this thesis so far (and of the literature in
general), it is hypothesised that the value-dependent effects observed with two CSs, will also
be observed with three CSs. That is, attentional capture will be greatest on high-value trials,
lowest on low-value trials, and somewhere in between on medium-value trials.
5.3 Method
Participants
Thirty participants (18 female) were recruited through opportunistic sampling. Participants
were aged between 18 and 26 years (M = 19.93, SD ± 1.95). The inclusion criteria were
regular consumption of alcohol (≥10 units per week) and normal or corrected-to-normal
vision. Self-reported past or present alcohol or drug use problems were exclusions. All
participants provided written informed consent before taking part in the study, which was
approved by the University of Liverpool Research Ethics Committee.
Materials
Questionnaires
The same questionnaire pack used in Study 1 was given to all participants to assess
drinking habits (TLFB, AUDIT), drinking motives (Modified DMQ-R), drinking
consequences (B-YAACQ), impulsivity (BIS-11, ImpSS) and childhood trauma (CATS) (see
Chapter Two [General Methods] for full descriptions).
Cognitive Task
162
Additional Singleton Tracking Task: Plus (ASTT+): The task used is almost identical to
the ASTT used in Studies 1, 2 and 3 (see Chapter Two [General Methods] for full
description), and is an adaptation of the additional singleton task developed by Theeuwes
(1991, 1992, 2010). This version employs three, rather than two, noncontingent discrete
reward-associated cues, corresponding to high, medium and low monetary reward (red, blue
and green singletons, counterbalanced). Sign-tracking is inferred from I) slower responses to
the OT on higher-value compared to lower-value trials, and II) greater omissions (CS
responses) on higher-value compared to lower-value trials. Note that this applied to all three
trial types (e.g., high-value trials should induce the slowest OT responses, followed by
medium-value trials, followed by low-value trials). The maximum feedback for low, medium
and high-value trials (following correct responses) was 2.00, 20.00 and 60.00 ‘MONEY’
points, respectively. Feedback was calculated via the following formula
(1000 – RT) × .002 × reward value
where RT is reaction time (in milliseconds) and reward value equals 1, 10 or 30 (depending
on trial type). Given the extra trial type, the ASTT+ contains 450 trials, compared to the
ASTT’s 300 trials (in order to retain power). The task lasted approximately 32 minutes.
Procedure
All testing took place between the times of 12 p.m. and 6 p.m. in the eye-tracking
laboratory of the School of Psychology, University of Liverpool. Before attending the lab,
every participant completed an online questionnaire pack (TLFB, AUDIT, DMQ-R, B-
YAACQ, BIS-11, ImpSS, CATS) via Qualtrics (Provo, UT, 2015). Those who fulfilled the
criteria were invited to attend the laboratory session. All participants provided informed
163
consent before both the online questionnaire and lab portions of the study. During the lab
session, participants completed the ASTT+ after being told that extra vouchers were available
based on their task performance. Participants received either course credits or £10 in
‘Love2Shop’ vouchers as compensation for their travel expenses and time. During the
debriefing it was explained that they would not receive any extra vouchers based on their task
performance, and that this was a necessary deception. Each session lasted approximately 30
minutes.
5.4 Data Reduction and Analysis
The following are an extension of measures that have been used in previous research in
estimating attentional bias and stimulus value (Field & Cox, 2008; Rose, Brown, Field, &
Hogarth, 2013). As in previous studies, all RT responses <80 ms and >999 ms were recoded
as missing data.
Additional Singleton Tracking Task: Outcome Measures
Measures for the ASTT were those used by Le Pelley et al (2015) and were divided into
omissions and RTs. For both RT and Omission Biases, greater (positive) values indicate sign-
tracking (as higher-value distractors should induce more errors and slower responses to the
OT than lower-value distractors). See Table A2 (Appendix A) for calculations.
5.5 Results
Participant Characteristics
164
Table 5.1 summarises the sample’s average alcohol use characteristics, while Table 5.2
provides an overview of trait and state measures. Men binged more (41.7% binged 4 times
p/fortnight) than women (27.8% binged 3 times p/fortnight). One-hundred percent of
participants scored ≥8 on the AUDIT, classing them as at risk drinkers. Self-reports showed
that, overall, the participant population were hazardous drinkers, consuming over
recommended weekly guidelines (14 units per week for men and women). On the B-YAACQ:
Total, 16.7% of participants scored ≤5, with 23.3% scoring between 6 and 10, 33.3% scoring
between 11 and 15 and 26.6% scoring between 16 and 24. A score greater than 5 is associated
with increased likelihood of risky drinking (e.g., experiencing impulsivity, embarrassment,
regret and/or harm as a result of drinking) (Kahler et al., 2005). In terms of personality
variables, most scored within the normal ranges of some scales (e.g., 63.3% scored within the
BIS-11 range of normality [52-71]; the ImpSS average was almost identical [M = 9.43] to that
found previously in undergraduates [M = 9.50] [Ball, 1995]). The CATS: Total average (M =
0.79) was comparable to earlier work in nonclinical samples (M = 0.74; M = 0.77) (Kent &
Waller, 1998; Sanders & Becker-Lausen, 1995), suggesting low levels of childhood trauma.
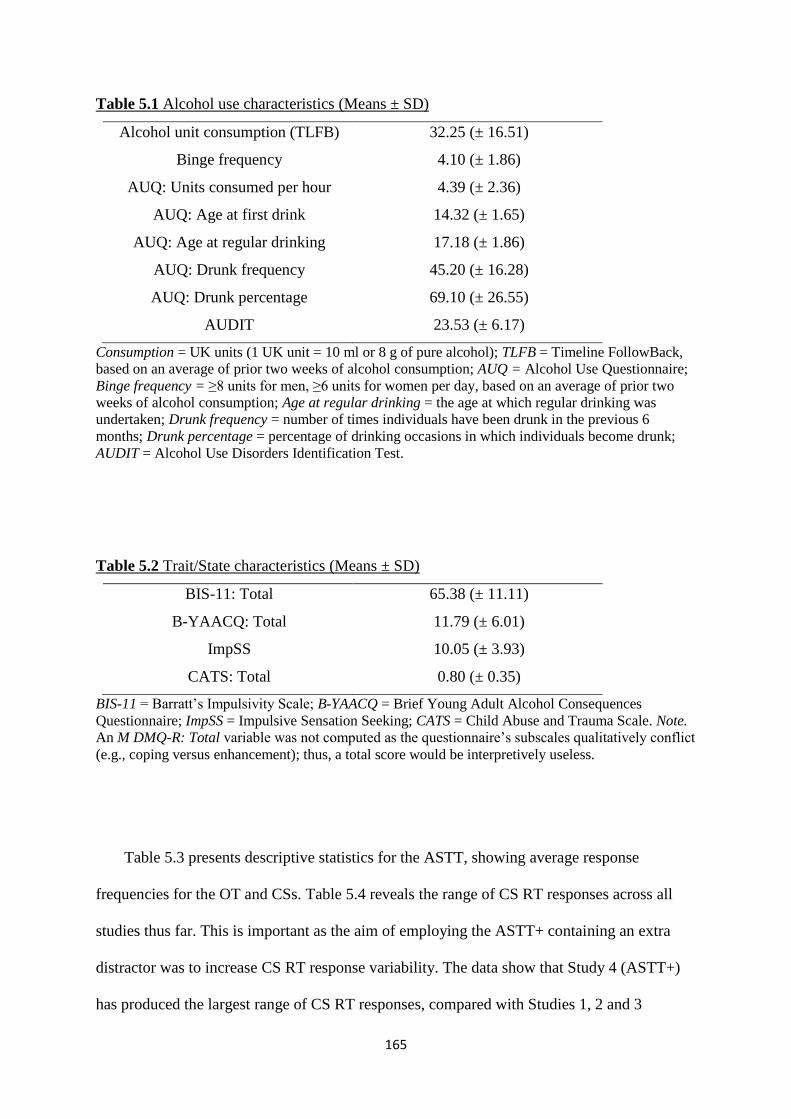
165
Table 5.1 Alcohol use characteristics (Means ± SD)
Alcohol unit consumption (TLFB) 32.25 (± 16.51)
Binge frequency 4.10 (± 1.86)
AUQ: Units consumed per hour 4.39 (± 2.36)
AUQ: Age at first drink 14.32 (± 1.65)
AUQ: Age at regular drinking 17.18 (± 1.86)
AUQ: Drunk frequency 45.20 (± 16.28)
AUQ: Drunk percentage 69.10 (± 26.55)
AUDIT 23.53 (± 6.17)
Consumption = UK units (1 UK unit = 10 ml or 8 g of pure alcohol); TLFB = Timeline FollowBack,
based on an average of prior two weeks of alcohol consumption; AUQ = Alcohol Use Questionnaire;
Binge frequency = ≥8 units for men, ≥6 units for women per day, based on an average of prior two
weeks of alcohol consumption; Age at regular drinking = the age at which regular drinking was
undertaken; Drunk frequency = number of times individuals have been drunk in the previous 6
months; Drunk percentage = percentage of drinking occasions in which individuals become drunk;
AUDIT = Alcohol Use Disorders Identification Test.
Table 5.2 Trait/State characteristics (Means ± SD)
BIS-11: Total 65.38 (± 11.11)
B-YAACQ: Total 11.79 (± 6.01)
ImpSS 10.05 (± 3.93)
CATS: Total 0.80 (± 0.35)
BIS-11 = Barratt’s Impulsivity Scale; B-YAACQ = Brief Young Adult Alcohol Consequences
Questionnaire; ImpSS = Impulsive Sensation Seeking; CATS = Child Abuse and Trauma Scale. Note.
An M DMQ-R: Total variable was not computed as the questionnaire’s subscales qualitatively conflict
(e.g., coping versus enhancement); thus, a total score would be interpretively useless.
Table 5.3 presents descriptive statistics for the ASTT, showing average response
frequencies for the OT and CSs. Table 5.4 reveals the range of CS RT responses across all
studies thus far. This is important as the aim of employing the ASTT+ containing an extra
distractor was to increase CS RT response variability. The data show that Study 4 (ASTT+)
has produced the largest range of CS RT responses, compared with Studies 1, 2 and 3
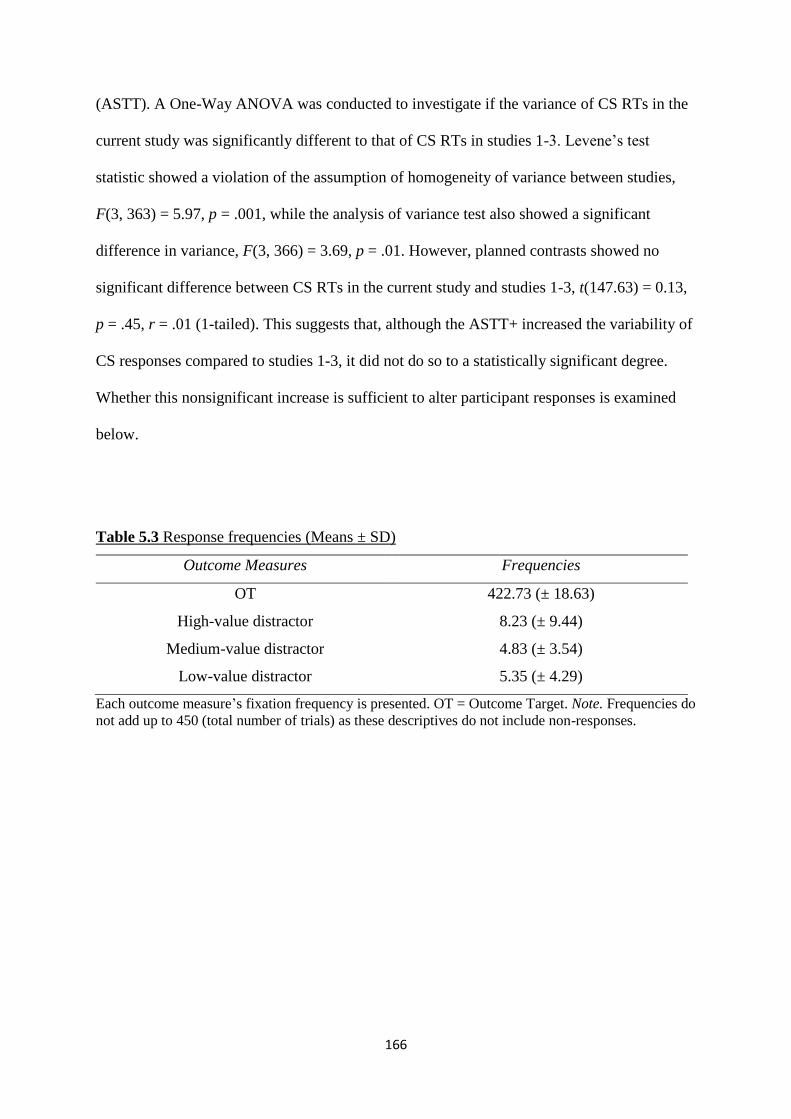
166
(ASTT). A One-Way ANOVA was conducted to investigate if the variance of CS RTs in the
current study was significantly different to that of CS RTs in studies 1-3. Levene’s test
statistic showed a violation of the assumption of homogeneity of variance between studies,
F(3, 363) = 5.97, p = .001, while the analysis of variance test also showed a significant
difference in variance, F(3, 366) = 3.69, p = .01. However, planned contrasts showed no
significant difference between CS RTs in the current study and studies 1-3, t(147.63) = 0.13,
p = .45, r = .01 (1-tailed). This suggests that, although the ASTT+ increased the variability of
CS responses compared to studies 1-3, it did not do so to a statistically significant degree.
Whether this nonsignificant increase is sufficient to alter participant responses is examined
below.
Table 5.3 Response frequencies (Means ± SD)
Outcome Measures Frequencies
OT 422.73 (± 18.63)
High-value distractor 8.23 (± 9.44)
Medium-value distractor 4.83 (± 3.54)
Low-value distractor 5.35 (± 4.29)
Each outcome measure’s fixation frequency is presented. OT = Outcome Target. Note. Frequencies do
not add up to 450 (total number of trials) as these descriptives do not include non-responses.
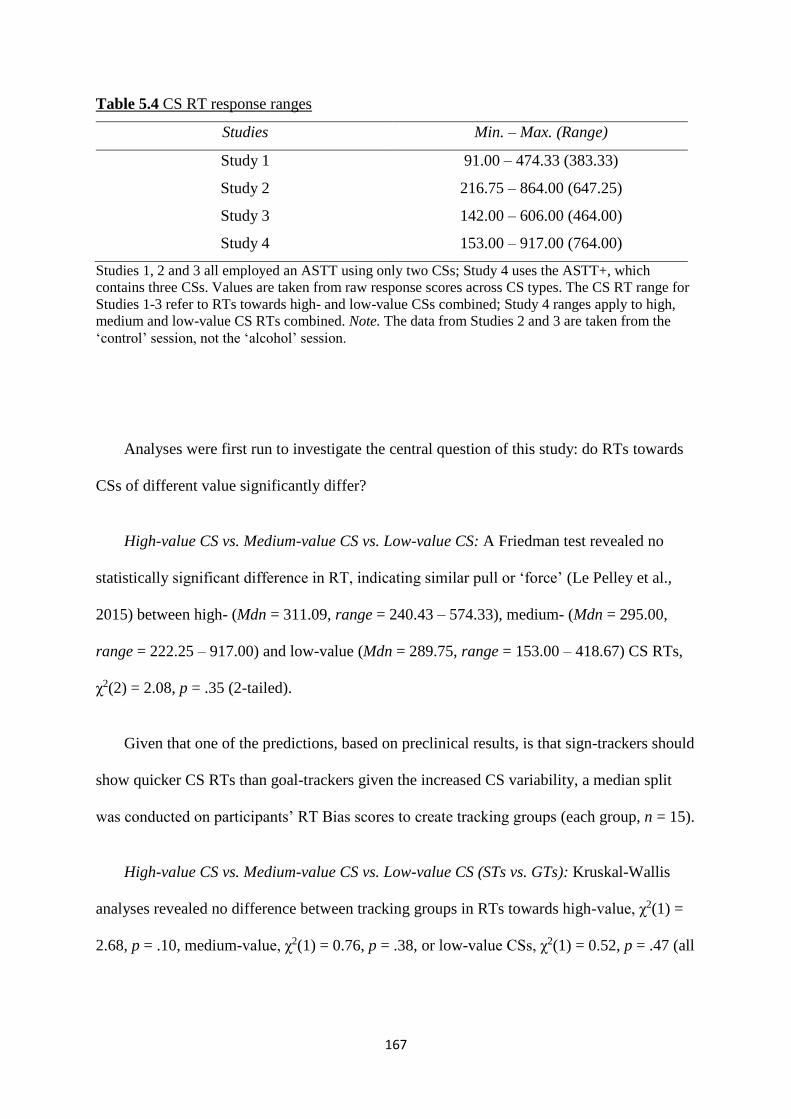
167
Table 5.4 CS RT response ranges
Studies Min. – Max. (Range)
Study 1 91.00 – 474.33 (383.33)
Study 2 216.75 – 864.00 (647.25)
Study 3 142.00 – 606.00 (464.00)
Study 4 153.00 – 917.00 (764.00)
Studies 1, 2 and 3 all employed an ASTT using only two CSs; Study 4 uses the ASTT+, which
contains three CSs. Values are taken from raw response scores across CS types. The CS RT range for
Studies 1-3 refer to RTs towards high- and low-value CSs combined; Study 4 ranges apply to high,
medium and low-value CS RTs combined. Note. The data from Studies 2 and 3 are taken from the
‘control’ session, not the ‘alcohol’ session.
Analyses were first run to investigate the central question of this study: do RTs towards
CSs of different value significantly differ?
High-value CS vs. Medium-value CS vs. Low-value CS: A Friedman test revealed no
statistically significant difference in RT, indicating similar pull or ‘force’ (Le Pelley et al.,
2015) between high- (Mdn = 311.09, range = 240.43 – 574.33), medium- (Mdn = 295.00,
range = 222.25 – 917.00) and low-value (Mdn = 289.75, range = 153.00 – 418.67) CS RTs,
χ2(2) = 2.08, p = .35 (2-tailed).
Given that one of the predictions, based on preclinical results, is that sign-trackers should
show quicker CS RTs than goal-trackers given the increased CS variability, a median split
was conducted on participants’ RT Bias scores to create tracking groups (each group, n = 15).
High-value CS vs. Medium-value CS vs. Low-value CS (STs vs. GTs): Kruskal-Wallis
analyses revealed no difference between tracking groups in RTs towards high-value, χ2(1) =
2.68, p = .10, medium-value, χ2(1) = 0.76, p = .38, or low-value CSs, χ2(1) = 0.52, p = .47 (all
168
2-tailed). This suggests that CSs of different value attract STs’ and GTs’ RT responses with
the same magnitude.
Overall CS RT differences in STs vs. GTs: A Mann-Whitney U test was used to
investigate whether group differences existed in RTs towards CSs overall, regardless of value.
No difference between STs (Mdn = 296.93, range = 250.08 – 341.42) and GTs (Mdn =
300.00, range = 225.69 – 565.17) were found, U = 112.00, p = .98 (2-tailed).
Next, whole-sample analyses were run to investigate whether OT RT and/or omission
differences existed between high, medium and low-value trials.
Reaction Times: A Repeated-Measures ANOVA revealed a main effect of distractor type
on RTs towards the target (OT), F(2, 58) = 3.99, p = .02, ηp2 = 0.12. Pairwise comparisons
show that, after a Bonferroni correction, the only statistically significant effect found was that
of higher latencies on high-value (M = 369.30, SD ± 31.32) compared to medium-value trials
(M = 362.03, SD ± 32.76), p = .02, r = .43. Contrary to previous results in ASTTs using only
two distractor types there was no significant difference found between high-value and low-
value (M = 364.76, SD ± 28.92) trials, p = .37. There was also no difference between
medium-value and low-value trials, p = .58 (see Figure 5.1).

169
Figure 5.1 Error bar chart depicting mean OT RT differences between CSs (entire sample)
Mean reaction times are in milliseconds. *p < .05. Error bars = 95% CI.
Omissions: Due to the omission data being highly skewed, the data were log-transformed
before analysis. A Repeated-Measures ANOVA was also conducted for omission frequencies
across trial types. There was a significant main effect of trial type on the number of
omissions, F(2, 50) = 6.72, p = .003, ηp2 = 0.21. Pairwise comparisons using a Bonferroni
correction revealed that there were significantly more omissions on high-value trials (M =
0.81, SD ± 0.34) compared to low-value trials (M = 0.63, SD ± 0.28), p = .01, r = .53.
Likewise, there were significantly more omissions on high-value trials relative to medium-
value (M = 0.59, SD ± 0.34) trials, p = .01, r = .47. No difference in omission frequency was
found between medium- and low-value trials, p = 1.00 (see Figure 5.2).
*
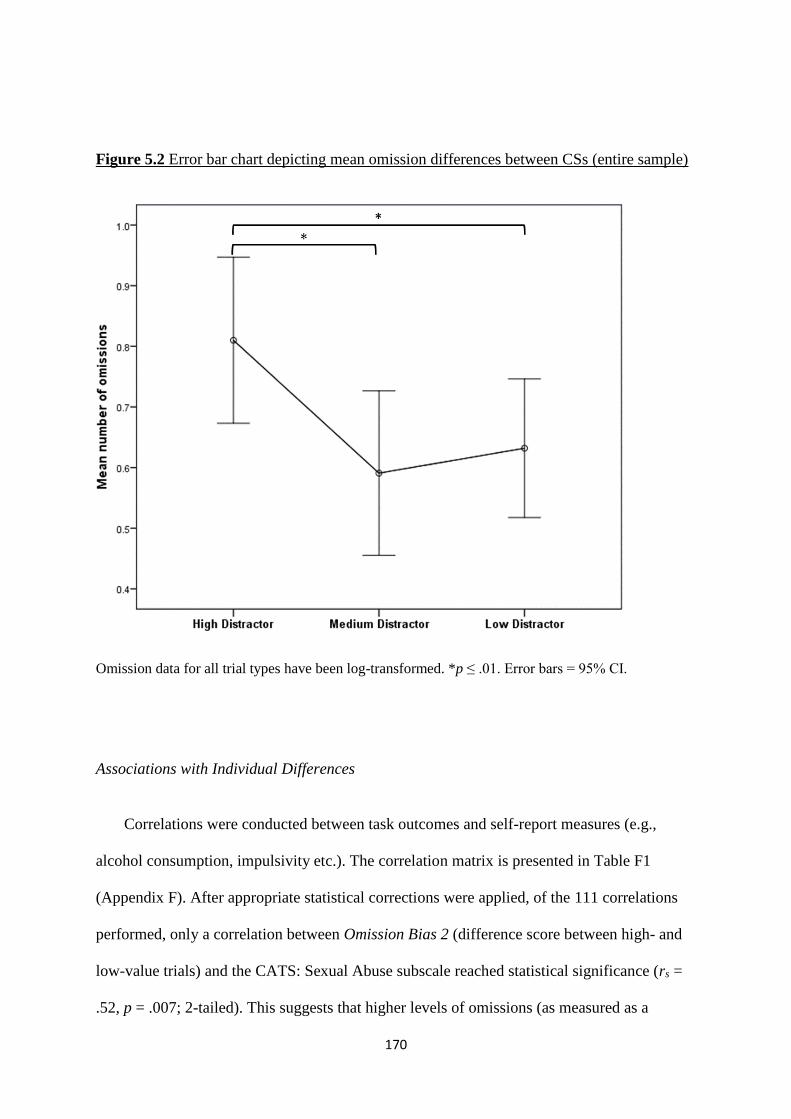
170
Figure 5.2 Error bar chart depicting mean omission differences between CSs (entire sample)
Omission data for all trial types have been log-transformed. *p ≤ .01. Error bars = 95% CI.
Associations with Individual Differences
Correlations were conducted between task outcomes and self-report measures (e.g.,
alcohol consumption, impulsivity etc.). The correlation matrix is presented in Table F1
(Appendix F). After appropriate statistical corrections were applied, of the 111 correlations
performed, only a correlation between Omission Bias 2 (difference score between high- and
low-value trials) and the CATS: Sexual Abuse subscale reached statistical significance (rs =
.52, p = .007; 2-tailed). This suggests that higher levels of omissions (as measured as a
171
difference in errors between high- and low-value trials) is associated with higher levels of
self-reported sexual abuse.
5.6 Discussion
Based on findings from studies 1-3 and research recommendations within this field (B. A.
Anderson & Yantis, 2012), the current study sought to investigate – for the first time – how
sign-tracking responses may be altered on the ASTT by including three response-irrelevant,
reward-associated distractors, rather than the usual two. Results revealed no statistically
significant difference in CS RT responses, either in the sample as a whole, or when tracking
groups were compared. These results applied to CSs of every value, as well as to CSs as a
whole, regardless of value. Analyses further showed that RTs towards the OT were higher on
high-value trials compared to medium-value trials; however, no differences were found
between high- and low- or medium- and low-value trials. Greater numbers of omissions were
also found on high-value compared to medium- and low-value trials, although no difference
between medium- and low-value trials was found. Finally, the only correlation between sign-
tracking measures and individual differences that reached statistical significance was between
‘Omission Bias 2’ (difference score between high- and low-value trials) and the Childhood
Abuse and Trauma Scale (CATS) Sexual Abuse subscale.
The question of how sign-tracking may be altered by an increased number of CSs was
posed after the results of Study 1 (Chapter Three), which showed that the entire sample (as
well as STs and GTs, individually) produced RTs of similar magnitude towards distractors
(CSs) of differing value (as well as towards distractors overall, regardless of value). This is in
accordance with previous human studies (Le Pelley et al., 2015) but contrasts with the
172
preclinical literature, which shows that STs produce faster omissions than GTs (Flagel,
Robinson, et al., 2010; Flagel, Watson, et al., 2009; Meyer, Lovic, et al., 2012). Thus, the
current study aimed to investigate this discrepancy further by employing an adapted version
of the ASTT – termed the ASTT+ – which utilised three distractors of value in order to
increase the variability in CS RT responses. This method was used as the ASTT paradigm
does not lend itself to the extended trial durations of the kind found in the animal literature,
and so increased CS number was introduced as an alternative way to study CS response
variability. It should be noted that although the ASTT+ did show greater CS RT variability
than all other studies using the ASTT (see Table 5.4), it did not do so to a statistically
significant degree. Further, we cannot be certain that this (nonsignificant increase) is
attributable to the increased number of CSs. It could instead be due to the increased number
of trials (450 vs. 300), or a combination of the two. This would need to be investigated in
future studies.
The results did not replicate those of the preclinical literature, but rather, they aligned
with those of Studies 1, 2 and 3, as well as with previous human studies. The sample as a
whole showed no difference in RTs towards CSs of different value, replicating Le Pelley et
al. (2015) who showed that high- and low-value CSs attract attention with the same ‘force’.
Increasing singleton response variability (though to a statistically nonsignificant degree) by
extending distractor number did nothing to alter this seemingly robust finding. STs and GTs
(groups created via a median split of RT Bias scores) also did not differ in their RT responses
towards CSs of different value22. It is important to note that this comparison – of tracking
groups’ CS RT responses towards CSs (regardless of value) – is the closest human analogue
to that of the animal literature, in which animal tracking groups (STs versus GTs) are
22 Median splits of RT data are not the best way of distinguishing groups (Rucker, McShane, & Preacher, 2015). Ideally, only individuals with more extreme responses would be categorised as STs and GTs (as in Study 1, Chapter Three). However, due to the relatively small sample size, a median split was the only recourse.
173
compared in how long it takes them to approach a CS. Once again, our findings were contrary
to those of the animal literature: human tracking groups did not differ in their overall CS RT
responses (as was also found in Study 1, Chapter Three).
Regarding analyses which were primary in previous studies but secondary in this study,
results revealed that OT RTs were higher on high-value trials compared to medium-value
trials, while no differences were found between high- and low-value or between medium- and
low-value trials. Omissions were greater on high-value compared to medium- and low-value
trials, with no discernible difference between medium- and low-value trials. The finding of
no OT RT difference between high- and low-value trials is the first null result of this kind in
the thesis so far. Importantly, as stated earlier, this is also the first study in the human
literature to employ more than two CSs of differing value, and these results suggest that sign-
tracking as measured by latency only manifests between the two most highly valued CSs.
Specifically, participants’ OT responses on low-value trials failed to be significantly
influenced by the CS’s value (as indicated by RT responses not being particularly fast or
slow, but falling in between that of high and medium trial OT responses). However, such an
interpretation may be hampered by study limitations (discussed below).
Finally, analyses were conducted to assess whether sign-tracking measures (both RT and
omissions) were associated with individual differences measures. After statistical corrections
were applied, only a correlation between Omission Bias 2 (difference score between high-
and low-value trials) and the CATS: Sexual Abuse subscale reached statistical significance.
This suggests a positive association between omissions and self-reported sexual abuse.
However, given the likelihood of false-positives with so many (one-hundred and eleven)
correlations and the lack of association with this particular measure in previous studies, it
seems likely that this statistical significance is merely an artefact of running so many
174
correlational analyses. The findings from the CS RT and OT RT analyses present some
predicted, and some unexpected, results. The rest of this discussion will aim to explore the
possible reasons for these findings, as well as describing possible methodological limitations
which impede some interpretations of the data.
The CS RT findings may be explained several ways. First, the difference in findings
between humans and nonhuman animals may simply be one of experimental setup. As stated
previously, for preclinical studies a typical trial duration during which the CS is present is
around 8 seconds (with animals taking several seconds to move toward the CS), while ASTT
trials last 2 seconds (with typical responses averaging several hundred milliseconds). This
difference in duration could be one reason for the disparity in CS RTs. A related explanation
entails that, although the introduction of an extra CS in the ASTT+ did increase CS RT
variability compared to all studies thus far, it is possible that there was still not enough
variability to allow for what may be a small effect to be found. This explanation is given
credence by the lack of a statistically significant difference in CS RT variance between
studies. Unfortunately, due to previous null results regarding CS RT difference by CS value,
a priori effect sizes could not be calculated in order to estimate the necessary sample size for
this study.
A further explanation concerns the fact that human and animal studies are using
fundamentally different measures of CS value. Although both use approach measures in a
broad sense, preclinical studies measure physical movement towards the CS, while human
studies measure attentional bias – preclinical studies suggest that this difference may matter
even at the level of the brain (Saunders & Robinson, 2013). A solution to all of these issues
may require the use of methods which allow for greater trial durations (mimicking durations
used in the preclinical literature and increasing response variability to an even greater extent),
175
as well as the measurement of physical movement towards the CS rather than attentional
shifting (e.g., ‘action tendencies’). Such methods are already commonplace in the human
cognitive and alcohol literature, with tasks such as the Implicit Association Task (IAT),
Alcohol Approach Task (AAT) and (Relevant-) Stimulus-Response Compatibility task (R-
SRC) (Wiers et al., 2013). In fact, a recent study employed a version of the additional
singleton task wherein participants physically reach for the OT and found that distractors
associated with high reward actually distracted less, which may indicate that different
methods of approach are measuring different constructs (Moher, Anderson, & Song, 2016).
Only if these explanations are ruled out could we reasonably speculate that there might be
qualitative behavioural differences between human and nonhuman animal STs, which cause
differential responding towards discrete, reward-associated stimuli. In essence, behavioural
measurements of value between humans and nonhuman animals must be sufficiently equated
in order to assess whether humans and animals are qualitatively different in this respect.
Regarding the OT RT results (the primary focus of Studies 1, 2 and 3), one explanation
for the lack of response differences between high- and low-value trials may be that the values
were not differentiated enough. However, this seems unlikely given that the ASTT uses a
points divide of 2.00 (low) vs. 20.00 (high), while the current ASTT+ uses 2.00 (low) vs.
20.00 (medium) vs. 60.00 (high). Mathematically, the medium reward is 10 times larger than
the low reward, while the high reward is 3 times larger than the medium reward and 30 times
larger than the low reward – since the biggest value differences lie between high-low and
medium-low trials, a lack of variability or differentiation of values cannot account for RT
differences between only high- and medium-value trials. Thus, for RT measures using AST
methods, it may be the case that attention is given primarily to the CSs possessing the two
highest values, with other, lower value CSs being largely ignored. Regarding sign-tracking as
measured via omissions, the predicted patterns of high > medium and high > low were found.
176
However, no difference between medium- and low-value trials was found. As with RT
measures, omission frequency on low-value trials fell in between frequencies on high- and
medium-value trials, which further supports the interpretation that participants ignored low-
value CSs.
To summarise, this is the first study which has employed a variant of the additional
singleton task (AST) that possess more than two singletons/CSs of value. The primary aims
were to investigate whether this increased complexity would alter RTs towards CSs of
different value, or whether individuals classified as sign-trackers (STs) and goal-trackers
(GTs) would respond differentially to CSs overall, regardless of value. We found that CS
value did not alter participants’ RT responses; that is, CSs, regardless of value, all attracted
attention with the same strength, as measured by latency. Similarly, STs and GTs showed no
difference in RT responses to CSs, regardless of value. These results support the previous
studies of this thesis, as well as the wider human literature, though are at odds with the
findings of the preclinical literature. The secondary aims were to investigate OT responses in
the context of three value-associated CSs. We found that OT RTs only showed a difference
between high-value and medium-value trials – this is the first study not to find a difference
between high- and low-value trials. The implication of this may be that, in more complex
AST designs, attentional priority is given to the two most highly valued CSs (with the second
highest value possibly treated as the de facto ‘low-value’ cue), with all other CSs being
ignored. Omissions were found in greatest frequency in high-value trials, with no difference
between medium- and low-value trials being found. No robust evidence of a link between
sign-tracking and individual differences was found. Future studies which aim to investigate
CS RT responses in a sign-tracking paradigm may wish to employ methods which measure
physical approach tendencies, rather than attentional bias.
177
Chapter Six
A Comparison of Methods for Measuring Human
Sign-Tracking
6.1 Abstract
Background: Versions of the additional singleton and alternative tasks measuring sign-
tracking have yet to be compared, so it is unclear whether they are measuring the same
construct with the same sensitivity. Aims: To compare methods of measuring sign-tracking.
Methods: Social drinkers (N = 25) completed three tasks in one lab session: the Additional
Singleton Tracking Task: Eye-Tracker (ASTT [EE]), the ASTT: Button-Box (ASTT [BB])
and a Pavlovian-to-Instrumental Transfer (PIT) task, which also measured sign-tracking. The
two ASTTs were virtually identical, except that the ASTT (EE) measured oculomotor
responses while the ASTT (BB) measured behavioural (key press) responses. The PIT used a
combination of both measures. Participants completed online questionnaires before the lab
session assessing alcohol consumption, impulsivity etc. Results: No sign-tracking effects
were observed in either the ASTT (EE) or ASTT (BB). Though a sign-tracking index was
made for the PIT task, no PIT effect was observed, nor were there any differences between
STs’ and GTs’ responses. No task comparisons or correlations to individual differences were
performed. Conclusions: Given the lack of tracking effects, it is not possible to make any
clear conclusions regarding the comparison of tasks. It is possible that completion of three
tasks in a single session resulted in cognitive fatigue which impaired performance.
Keywords: Sign-tracking, Pavlovian-to-Instrumental Transfer, Alcohol, Eye-tracking
178
6.2 Introduction
Sign-tracking and goal-tracking are behaviours found in a variety of species (including
humans) and conceptualise the individual differences in responses towards irrelevant, discrete
stimuli paired with reward (Tomie et al., 2008). Specifically, sign-trackers (STs) imbue such
stimuli (conditioned stimuli; CSs) with value, while goal-trackers (GTs) use CSs merely as
predictors of the US. Preclinical studies have shown that animals can reliably be classified
into STs or GTs based on their propensity to attribute incentive salience to noncontingent,
discrete reward-associated cues (Meyer, Lovic, et al., 2012). The tracking phenotypes have
shown links with impulsivity, distractibility, risk-taking, novelty-seeking and higher
consumption (or consumption risk) of alcohol, drugs and/or food (Ahrens et al., 2015; R. I.
Anderson & Spear, 2011; King et al., 2016; Meyer, Lovic, et al., 2012; Olshavsky et al.,
2014; Saunders & Robinson, 2010, 2011; Versaggi et al., 2016; Villaruel & Chaudhri, 2016;
Yager et al., 2015; Yager & Robinson, 2015). Human STs show similar traits and
associations (B. A. Anderson et al., 2013; Roper et al., 2014; Versace et al., 2015).
The vast majority of studies investigating sign-tracking in humans have employed
variations of the additional singleton task (AST), which measure responses via button
responses or eye-movements (B. A. Anderson, 2015a; Le Pelley et al., 2015; Theeuwes,
1991, 1992, 2010). Studies 1, 2, 3 and 4 in this thesis have all employed a variant of the AST,
called the additional singleton tracking task (ASTT). In every study thus far, the ASTT has
measured sign-tracking via oculomotor capture. The ASTT presents participants on every
trial with several grey circles and one diamond, and instructs participants to locate the
diamond as quickly as possible. On each trial one of the circles is coloured either red or blue,
with each colour associated with either high or low reward only when a correct response is
made. Sign-tracking is observed when the colour associated with high reward captures

179
attention and reduces the reaction times (RTs) of correct responses as well as prompting more
omissions (errors) compared to low-reward cues.
A recent study has, for the first time, measured sign-tracking during a Pavlovian-to-
Instrumental Transfer (PIT) task, which then assessed how strongly PIT effects influenced
STs as compared to GTs (Garofalo & di Pellegrino, 2015). PIT refers to the behavioural and
psychological phenomenon of increased instrumental (choice) responding for an outcome
(e.g., reward) when in the presence of a CS+ (a CS which was separately paired with the
same outcome). PIT effects have been found in both animals and humans, with human studies
showing that a CS+ can increase instrumental responding for drug and alcohol rewards. This
increase in responding (PIT effect) correlates with neuroimaging (e.g., Functional Magnetic
Resonance Imaging: fMRI) and neurophysiological activity (e.g., Electroencephalography:
EEG) (Cartoni et al., 2016; Corbit & Janak, 2016; Garbusow et al., 2014; Martinovic et al.,
2014; Talmi et al., 2008).
In the Garofalo and di Pellegrino (2015) study, participants completed three separate (but
related) tasks. The first (Instrumental Conditioning) measured participants’ top-down
selection of cues associated with reward or no reward (rewarded choice versus unrewarded
choice). The second (Pavlovian Conditioning) measured their bottom-up behavioural and
eye-movement responses towards a different set of cues associated with reward or no reward
CS+ versus CS−). Participants were also classified as STs or GTs during this stage based on
their attentional bias (AB) towards either the CS+ or the location of reward presentation,
respectively. The third task (Pavlovian-to-Instrumental Transfer) measured the influence of
each CS on participants’ un/rewarded choice. The results showed that the groups differed in
the extent to which their instrumental responding for un/rewarded choice was influenced by
the presence of the CS+, with STs responding more towards reward-associated stimuli than
180
GTs when in the presence of the CS+. That is, reward-paired cues more strongly influenced
STs’ behaviour than GTs’, which in the context of the task lends support to the theory that
sign-tracking reflects the attribution of incentive salience towards discrete, response-
irrelevant CSs. The authors also found that STs self-reported significantly lower impulse
control (as measured by Barratt’s Impulsivity Scale–11, Patton et al., 1995) than GTs.
The current study aims to extend the work of Garofalo and di Pellegrino (2015) by
producing the first replication of their study whilst also enabling a comparison between their
PIT task and the ASTT. Furthermore, to expand our knowledge on the relative merits of
various methods of sign-tracking measurement in humans, the current study will employ two
different versions of the ASTT – one utilising eye-tracking responses (as has been used in
studies 1-4) and one recording behavioural responses via button-box presses. This difference
between attentional orienting and motor response has been implicated as an important
consideration in animal paradigms (White & Naeem, 2017; Yager & Robinson, 2013), and
some data suggest that AB measures as measured via eye-movements are more reliable than
those measured via key presses (Christiansen, Mansfield, et al., 2015). Thus, the central
concern of this study is methodological: are there multiple ways in which to reliably measure
sign-tracking and do they produce similar outcomes? Specifically, I) do all tasks produce
sign-tracking effects? II) Does the magnitude of sign-tracking significantly differ between
tasks? III) Do the methods possess sufficient sensitivity and specificity to reliably classify the
same individuals as STs and GTs across tasks? IV) Do all task outcome measures correlate
with individual differences (e.g., alcohol consumption and impulsivity)? It is hypothesised
that I) sign-tracking effects (RTs and omissions) will be observed in all three tasks (ASTT
[EE], ASTT [BB], PIT task), and II) STs’ instrumental responding towards reward-associated
stimuli will be influenced by the presence of the CS+ to a greater extent than GTs’.
181
6.3 Method
Participants
Twenty-five participants (13 female) were recruited through opportunistic sampling.
Participants were aged between 20 and 35 years (M = 25.50, SD ± 4.27). The inclusion
criteria were regular consumption of alcohol (≥10 units per week) and normal or corrected-
to-normal vision. Self-reported past or present alcohol or drug use problems were exclusions.
All participants provided written informed consent before taking part in the study, which was
approved by the University of Liverpool Research Ethics Committee.
Materials
Questionnaires
The same questionnaire pack used in study 1 was given to all participants to assess
drinking habits (TLFB, AUDIT), drinking motives (Modified DMQ-R), drinking
consequences (B-YAACQ), impulsivity (BIS-11, ImpSS) and childhood trauma (CATS) (see
Chapter Two [General Methods] for full descriptions).
Cognitive Tasks
Additional Singleton Tracking Task: Eye-Tracker (ASTT [EE]): The task employed was
identical to the task used in study 1 (Chapter Three, see Chapter Two [General Methods] for
182
full description), and is an adaptation of the singleton task developed by Theeuwes (1991,
1992, 2010). Sign-tracking is inferred from I) slower responses to the OT on high-value
compared to low-value trials, and II) greater omissions (CS responses) on high-value
compared to low-value trials.
Additional Singleton Tracking Task: Button-Box (ASTT [BB]): This task was almost
identical to the ASTT (EE) task (above). The only difference was the number of stimuli
presented on each trial: in the ASTT (EE) there are 6 stimuli (1 diamond [OT], 1 coloured
circle [CS], 4 grey circles [valueless distractors]), in the ASTT (BB) there are 8 stimuli
presented on each trial (1 diamond [OT], 1 coloured circle [CS], 6 grey circles [valueless
distractors]). It should be noted that evidence suggests increased ‘display size’ (number of
stimuli) in additional singleton tasks presenting a coloured distractor increases average
response times (Theeuwes, 2010), and so increased stimulus number should not adversely
affect the production of sign-tracking. This adaptation was in an effort to mirror as closely as
possible the button-box used in Study 6 (Chapter Seven). This was done with the
considerable assistance of other researchers and technical support staff at the University of
Liverpool: Pawel Jedras and Martin Guest.
Pavlovian-to-Instrumental Transfer Task (PIT): This task was a direct replication of
Garofalo and di Pellegrino (2015), and was constructed with the advice of the original study’s
lead author (S. Garofalo, personal communication, 17th May – 21st July, 2016). As with many
of the stimuli used in the Multi-Target Tracking Task (Study 1, Chapter Three), many of the
PIT stimuli were acquired from internet searches and customised for use in the task (see
‘Fractal Ratings’ in Data Reduction and Analysis section).
The PIT consisted of three phases: I) Instrumental Conditioning Task, II) Pavlovian
Conditioning Task, and III) Pavlovian-to-Instrumental Transfer Task. Participants were again

183
instructed that they would earn points throughout this task which would later be exchanged
for vouchers. It should be noted that the majority of PIT tasks first promote pavlovian
conditioning before instrumental conditioning; however, Garofalo and di Pellegrino (2015)
opted for the opposite order. Given that the current study is a replication of their work, their
methodology is followed closely.
Instrumental Conditioning Task: The first phase of the PIT task requires participants to
first select the crosshair in the centre of the screen (Figure 6.1: column one); this ensures
participants centre the mouse arrow at the beginning of every trial, so as to prevent a side-
selection bias. Next, participants select one of the white boxes (column two). After selection,
there is a variable inter-trial interval (ITI) (column three) of between 4000ms and 12000ms
(randomised). Finally, participants are presented with feedback (column four), consisting of
either a one pound sterling coin (£1) or a plain yellow circle. In the counterbalanced
condition, the selection stage is reversed (i.e., left choice = unrewarded, right choice =
rewarded). Participants were told that the points they won during this portion would be added
to their points tally.
It was expected that participants would adequately learn the difference between the
rewarded and unrewarded options, and quickly begin consistently selecting the rewarded
stimulus (left white square in Figure 6.1). After the presentation of four practice trials, this
stage lasted approximately 6m 30s.
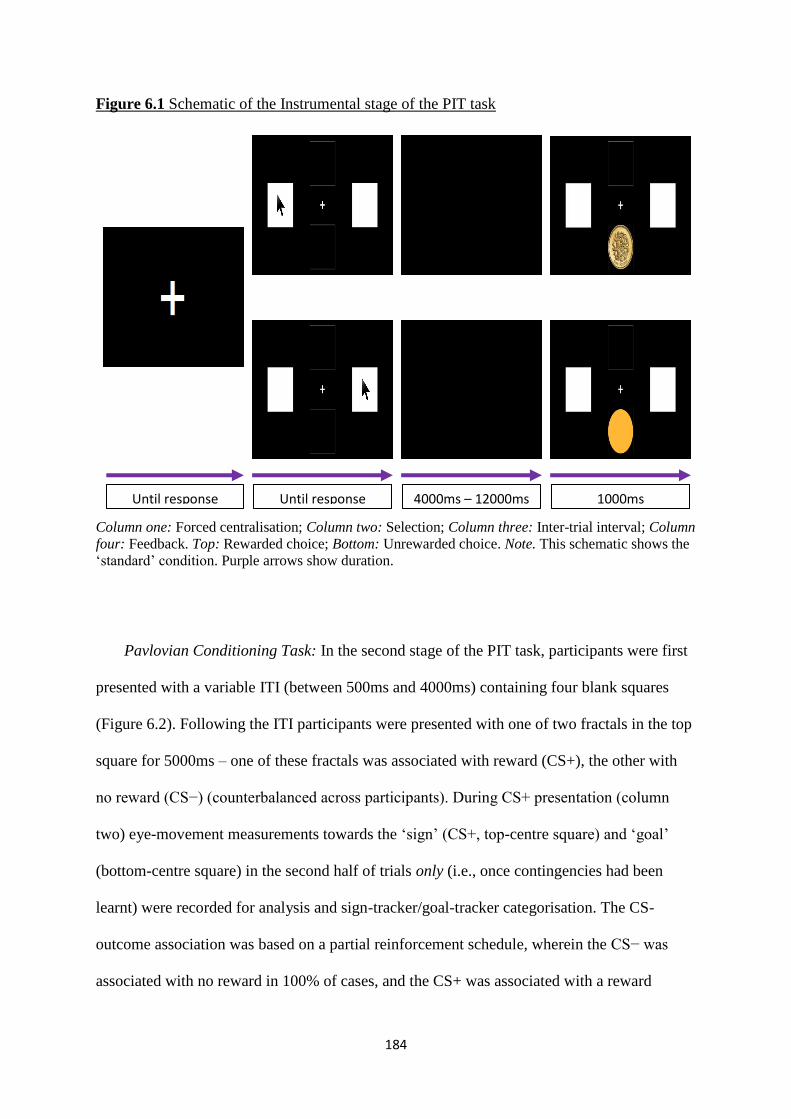
184
Figure 6.1 Schematic of the Instrumental stage of the PIT task
Column one: Forced centralisation; Column two: Selection; Column three: Inter-trial interval; Column
four: Feedback. Top: Rewarded choice; Bottom: Unrewarded choice. Note. This schematic shows the
‘standard’ condition. Purple arrows show duration.
Pavlovian Conditioning Task: In the second stage of the PIT task, participants were first
presented with a variable ITI (between 500ms and 4000ms) containing four blank squares
(Figure 6.2). Following the ITI participants were presented with one of two fractals in the top
square for 5000ms – one of these fractals was associated with reward (CS+), the other with
no reward (CS−) (counterbalanced across participants). During CS+ presentation (column
two) eye-movement measurements towards the ‘sign’ (CS+, top-centre square) and ‘goal’
(bottom-centre square) in the second half of trials only (i.e., once contingencies had been
learnt) were recorded for analysis and sign-tracker/goal-tracker categorisation. The CS-
outcome association was based on a partial reinforcement schedule, wherein the CS− was
associated with no reward in 100% of cases, and the CS+ was associated with a reward
Until response Until response 4000ms – 12000ms 1000ms
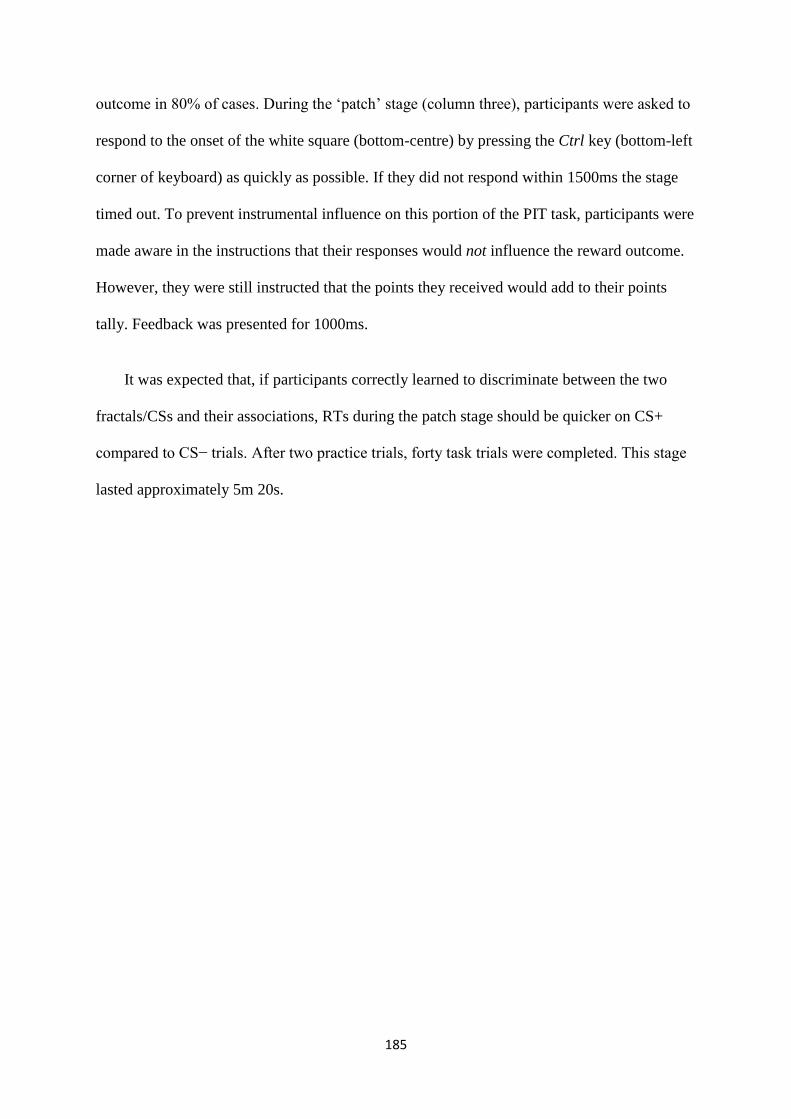
185
outcome in 80% of cases. During the ‘patch’ stage (column three), participants were asked to
respond to the onset of the white square (bottom-centre) by pressing the Ctrl key (bottom-left
corner of keyboard) as quickly as possible. If they did not respond within 1500ms the stage
timed out. To prevent instrumental influence on this portion of the PIT task, participants were
made aware in the instructions that their responses would not influence the reward outcome.
However, they were still instructed that the points they received would add to their points
tally. Feedback was presented for 1000ms.
It was expected that, if participants correctly learned to discriminate between the two
fractals/CSs and their associations, RTs during the patch stage should be quicker on CS+
compared to CS− trials. After two practice trials, forty task trials were completed. This stage
lasted approximately 5m 20s.
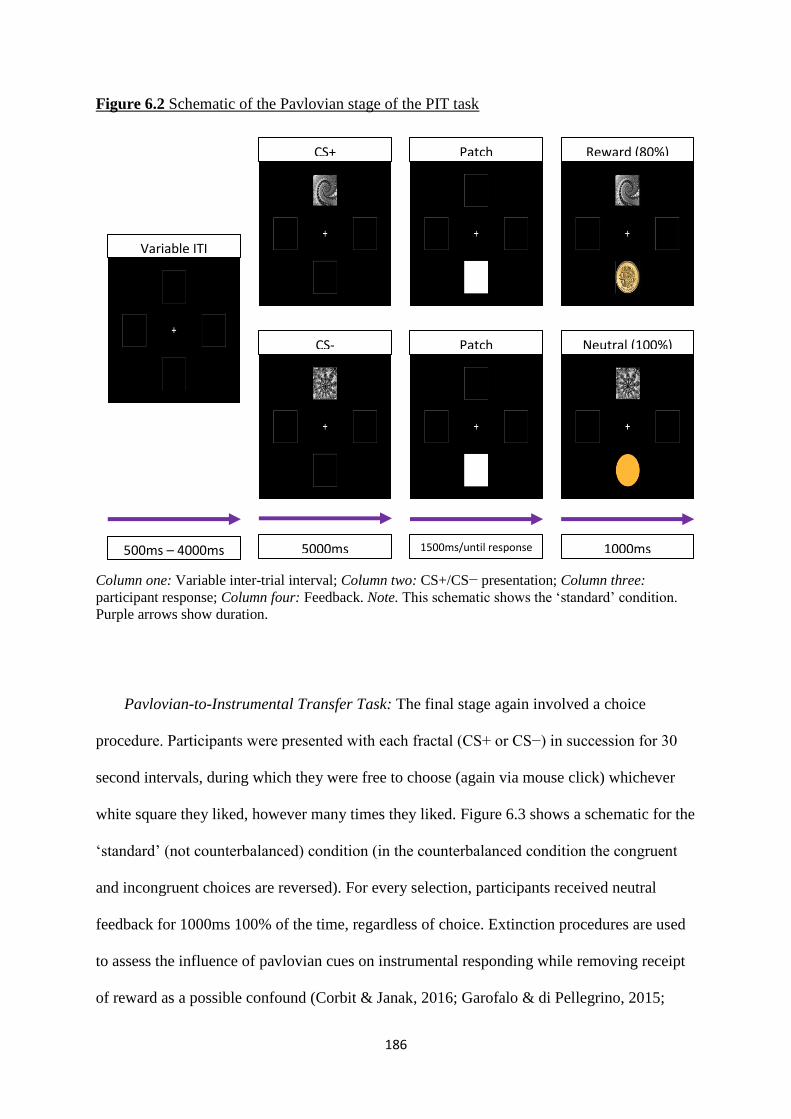
186
Figure 6.2 Schematic of the Pavlovian stage of the PIT task
Column one: Variable inter-trial interval; Column two: CS+/CS− presentation; Column three:
participant response; Column four: Feedback. Note. This schematic shows the ‘standard’ condition.
Purple arrows show duration.
Pavlovian-to-Instrumental Transfer Task: The final stage again involved a choice
procedure. Participants were presented with each fractal (CS+ or CS−) in succession for 30
second intervals, during which they were free to choose (again via mouse click) whichever
white square they liked, however many times they liked. Figure 6.3 shows a schematic for the
‘standard’ (not counterbalanced) condition (in the counterbalanced condition the congruent
and incongruent choices are reversed). For every selection, participants received neutral
feedback for 1000ms 100% of the time, regardless of choice. Extinction procedures are used
to assess the influence of pavlovian cues on instrumental responding while removing receipt
of reward as a possible confound (Corbit & Janak, 2016; Garofalo & di Pellegrino, 2015;
Variable ITI
CS+ Patch Reward (80%)
Patch
1500ms/until response 5000ms 500ms – 4000ms 1000ms
CS- Neutral (100%)
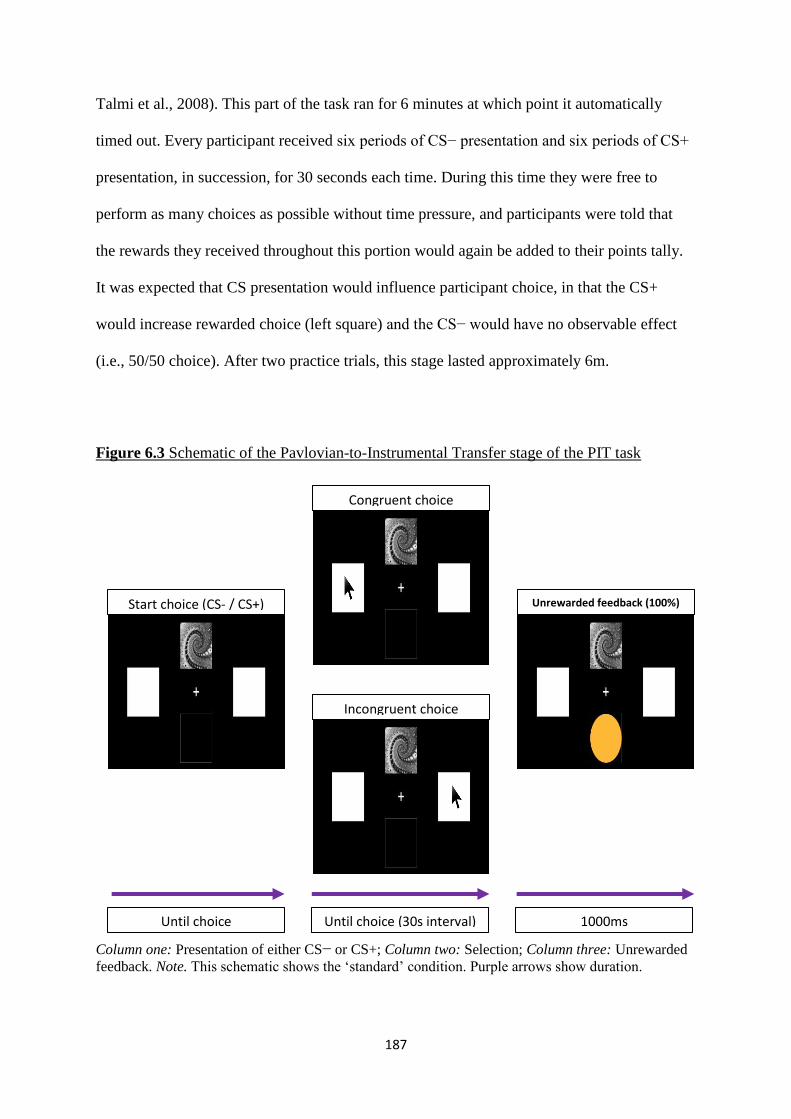
187
Talmi et al., 2008). This part of the task ran for 6 minutes at which point it automatically
timed out. Every participant received six periods of CS− presentation and six periods of CS+
presentation, in succession, for 30 seconds each time. During this time they were free to
perform as many choices as possible without time pressure, and participants were told that
the rewards they received throughout this portion would again be added to their points tally.
It was expected that CS presentation would influence participant choice, in that the CS+
would increase rewarded choice (left square) and the CS− would have no observable effect
(i.e., 50/50 choice). After two practice trials, this stage lasted approximately 6m.
Figure 6.3 Schematic of the Pavlovian-to-Instrumental Transfer stage of the PIT task
Column one: Presentation of either CS− or CS+; Column two: Selection; Column three: Unrewarded
feedback. Note. This schematic shows the ‘standard’ condition. Purple arrows show duration.
Start choice (CS- / CS+)
Congruent choice
Incongruent choice
Unrewarded feedback (100%)
Until choice Until choice (30s interval) 1000ms
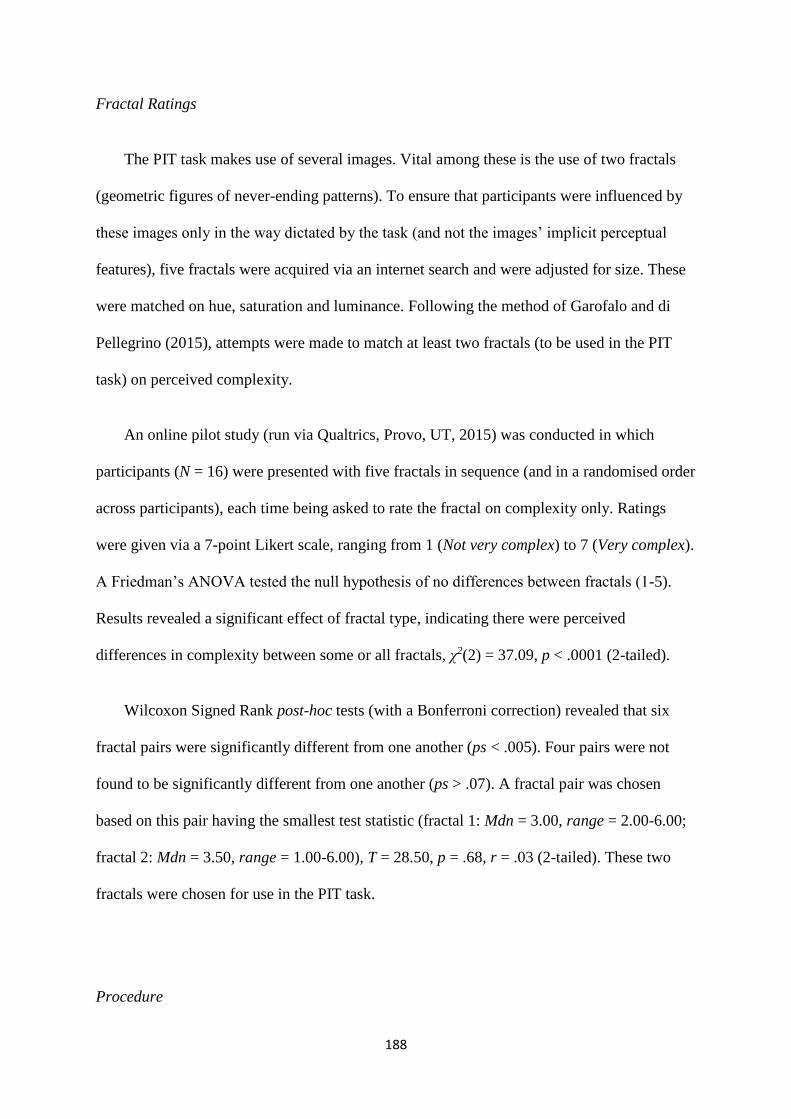
188
Fractal Ratings
The PIT task makes use of several images. Vital among these is the use of two fractals
(geometric figures of never-ending patterns). To ensure that participants were influenced by
these images only in the way dictated by the task (and not the images’ implicit perceptual
features), five fractals were acquired via an internet search and were adjusted for size. These
were matched on hue, saturation and luminance. Following the method of Garofalo and di
Pellegrino (2015), attempts were made to match at least two fractals (to be used in the PIT
task) on perceived complexity.
An online pilot study (run via Qualtrics, Provo, UT, 2015) was conducted in which
participants (N = 16) were presented with five fractals in sequence (and in a randomised order
across participants), each time being asked to rate the fractal on complexity only. Ratings
were given via a 7-point Likert scale, ranging from 1 (Not very complex) to 7 (Very complex).
A Friedman’s ANOVA tested the null hypothesis of no differences between fractals (1-5).
Results revealed a significant effect of fractal type, indicating there were perceived
differences in complexity between some or all fractals, χ2(2) = 37.09, p < .0001 (2-tailed).
Wilcoxon Signed Rank post-hoc tests (with a Bonferroni correction) revealed that six
fractal pairs were significantly different from one another (ps < .005). Four pairs were not
found to be significantly different from one another (ps > .07). A fractal pair was chosen
based on this pair having the smallest test statistic (fractal 1: Mdn = 3.00, range = 2.00-6.00;
fractal 2: Mdn = 3.50, range = 1.00-6.00), T = 28.50, p = .68, r = .03 (2-tailed). These two
fractals were chosen for use in the PIT task.
Procedure
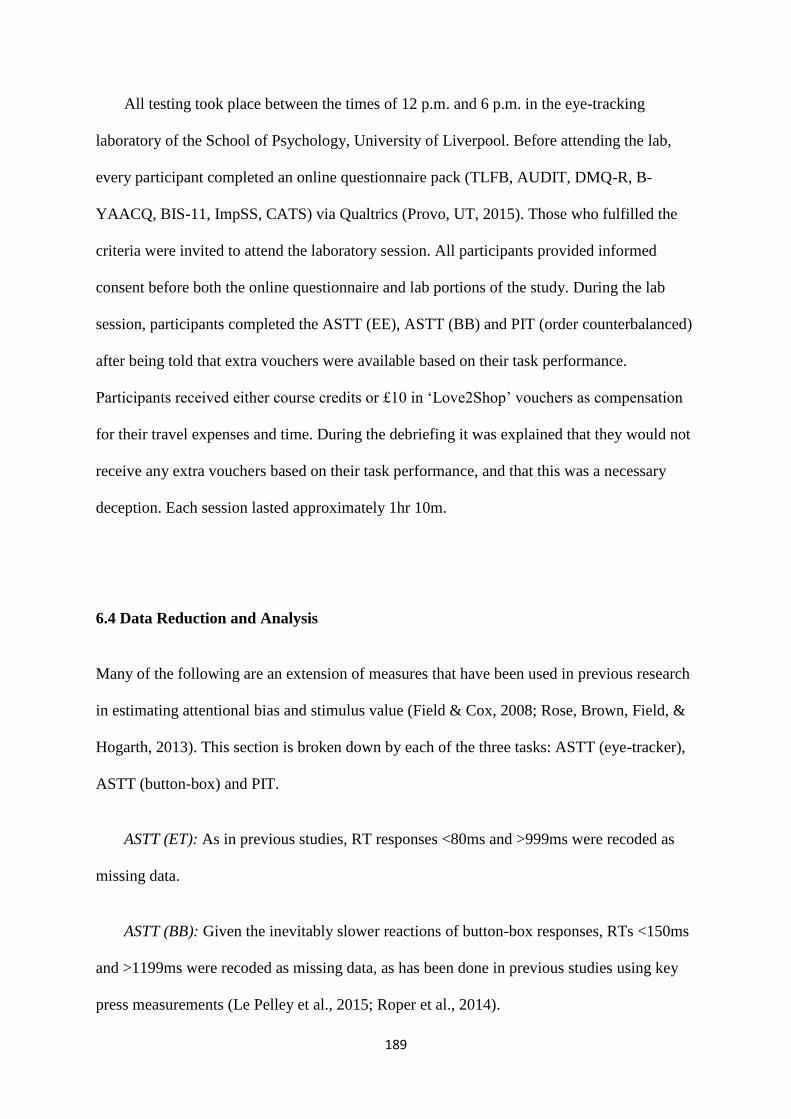
189
All testing took place between the times of 12 p.m. and 6 p.m. in the eye-tracking
laboratory of the School of Psychology, University of Liverpool. Before attending the lab,
every participant completed an online questionnaire pack (TLFB, AUDIT, DMQ-R, B-
YAACQ, BIS-11, ImpSS, CATS) via Qualtrics (Provo, UT, 2015). Those who fulfilled the
criteria were invited to attend the laboratory session. All participants provided informed
consent before both the online questionnaire and lab portions of the study. During the lab
session, participants completed the ASTT (EE), ASTT (BB) and PIT (order counterbalanced)
after being told that extra vouchers were available based on their task performance.
Participants received either course credits or £10 in ‘Love2Shop’ vouchers as compensation
for their travel expenses and time. During the debriefing it was explained that they would not
receive any extra vouchers based on their task performance, and that this was a necessary
deception. Each session lasted approximately 1hr 10m.
6.4 Data Reduction and Analysis
Many of the following are an extension of measures that have been used in previous research
in estimating attentional bias and stimulus value (Field & Cox, 2008; Rose, Brown, Field, &
Hogarth, 2013). This section is broken down by each of the three tasks: ASTT (eye-tracker),
ASTT (button-box) and PIT.
ASTT (ET): As in previous studies, RT responses <80ms and >999ms were recoded as
missing data.
ASTT (BB): Given the inevitably slower reactions of button-box responses, RTs <150ms
and >1199ms were recoded as missing data, as has been done in previous studies using key
press measurements (Le Pelley et al., 2015; Roper et al., 2014).
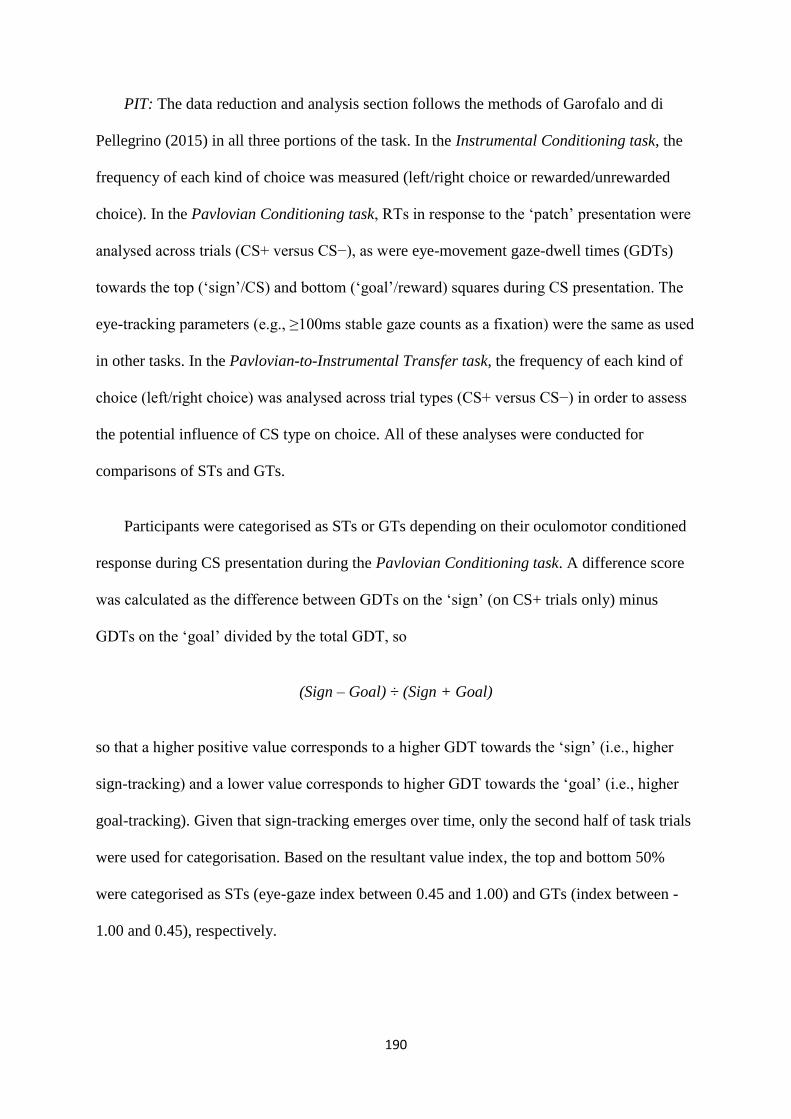
190
PIT: The data reduction and analysis section follows the methods of Garofalo and di
Pellegrino (2015) in all three portions of the task. In the Instrumental Conditioning task, the
frequency of each kind of choice was measured (left/right choice or rewarded/unrewarded
choice). In the Pavlovian Conditioning task, RTs in response to the ‘patch’ presentation were
analysed across trials (CS+ versus CS−), as were eye-movement gaze-dwell times (GDTs)
towards the top (‘sign’/CS) and bottom (‘goal’/reward) squares during CS presentation. The
eye-tracking parameters (e.g., ≥100ms stable gaze counts as a fixation) were the same as used
in other tasks. In the Pavlovian-to-Instrumental Transfer task, the frequency of each kind of
choice (left/right choice) was analysed across trial types (CS+ versus CS−) in order to assess
the potential influence of CS type on choice. All of these analyses were conducted for
comparisons of STs and GTs.
Participants were categorised as STs or GTs depending on their oculomotor conditioned
response during CS presentation during the Pavlovian Conditioning task. A difference score
was calculated as the difference between GDTs on the ‘sign’ (on CS+ trials only) minus
GDTs on the ‘goal’ divided by the total GDT, so
(Sign – Goal) ÷ (Sign + Goal)
so that a higher positive value corresponds to a higher GDT towards the ‘sign’ (i.e., higher
sign-tracking) and a lower value corresponds to higher GDT towards the ‘goal’ (i.e., higher
goal-tracking). Given that sign-tracking emerges over time, only the second half of task trials
were used for categorisation. Based on the resultant value index, the top and bottom 50%
were categorised as STs (eye-gaze index between 0.45 and 1.00) and GTs (index between -
1.00 and 0.45), respectively.
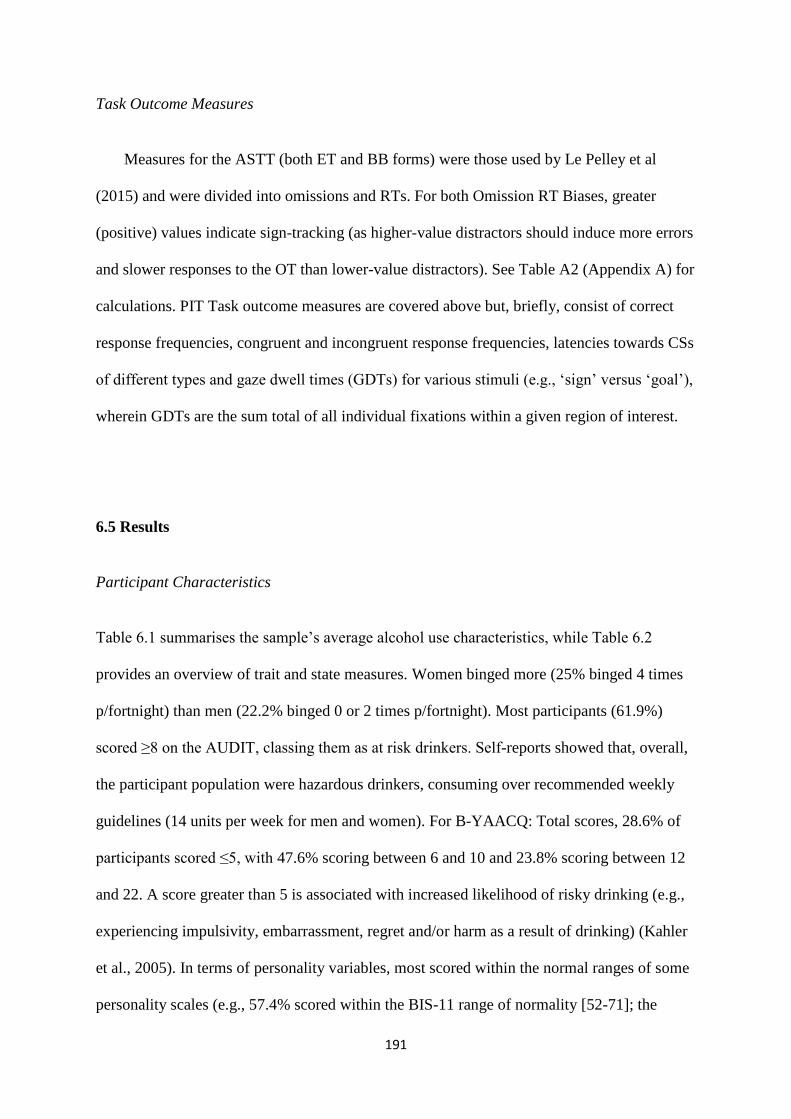
191
Task Outcome Measures
Measures for the ASTT (both ET and BB forms) were those used by Le Pelley et al
(2015) and were divided into omissions and RTs. For both Omission RT Biases, greater
(positive) values indicate sign-tracking (as higher-value distractors should induce more errors
and slower responses to the OT than lower-value distractors). See Table A2 (Appendix A) for
calculations. PIT Task outcome measures are covered above but, briefly, consist of correct
response frequencies, congruent and incongruent response frequencies, latencies towards CSs
of different types and gaze dwell times (GDTs) for various stimuli (e.g., ‘sign’ versus ‘goal’),
wherein GDTs are the sum total of all individual fixations within a given region of interest.
6.5 Results
Participant Characteristics
Table 6.1 summarises the sample’s average alcohol use characteristics, while Table 6.2
provides an overview of trait and state measures. Women binged more (25% binged 4 times
p/fortnight) than men (22.2% binged 0 or 2 times p/fortnight). Most participants (61.9%)
scored ≥8 on the AUDIT, classing them as at risk drinkers. Self-reports showed that, overall,
the participant population were hazardous drinkers, consuming over recommended weekly
guidelines (14 units per week for men and women). For B-YAACQ: Total scores, 28.6% of
participants scored ≤5, with 47.6% scoring between 6 and 10 and 23.8% scoring between 12
and 22. A score greater than 5 is associated with increased likelihood of risky drinking (e.g.,
experiencing impulsivity, embarrassment, regret and/or harm as a result of drinking) (Kahler
et al., 2005). In terms of personality variables, most scored within the normal ranges of some
personality scales (e.g., 57.4% scored within the BIS-11 range of normality [52-71]; the

192
ImpSS average was almost identical [M = 9.29] to that found previously in undergraduates [M
= 9.50] [Ball, 1995]). The CATS: Total average (M = 0.81) was similar to that of earlier work
in nonclinical samples (M = 0.74; M = 0.77) (Kent & Waller, 1998; Sanders & Becker-
Lausen, 1995), suggesting low levels of childhood trauma.
Table 6.1 Alcohol use characteristics (Means ± SD)
Alcohol unit consumption (TLFB) 23.57 (± 15.88)
Binge frequency 2.71 (± 1.95)
AUQ: Units consumed per hour 3.52 (± 1.49)
AUQ: Age at first drink 14.74 (± 2.14)
AUQ: Age at regular drinking 17.95 (± 2.32)
AUQ: Drunk frequency 18.33 (± 21.03)
AUQ: Drunk percentage 37.05 (± 32.28)
AUDIT 10.76 (± 6.24)
Consumption = UK units (1 UK unit = 10 ml or 8 g of pure alcohol); TLFB = Timeline FollowBack,
based on an average of prior two week’s alcohol consumption; AUQ = Alcohol Use Questionnaire;
Binge frequency = ≥8 units for men, ≥6 units for women per day based on an average of prior two
week’s alcohol consumption; Age at regular drinking = the age at which regular drinking was
undertaken; Drunk frequency = number of times individuals have been drunk in the previous 6
months; Drunk percentage = percentage of drinking occasions in which individuals become drunk;
AUDIT = Alcohol Use Disorders Identification Test.
Table 6.2 Trait/State characteristics (Means ± SD)
BIS-11: Total 59.00 (± 12.23)
B-YAACQ: Total 8.90 (± 6.02)
ImpSS 9.29 (± 3.18)
CATS: Total 0.81 (± 0.43)
BIS-11 = Barratt’s Impulsivity Scale; B-YAACQ = Brief Young Adult Alcohol Consequences
Questionnaire; ImpSS = Impulsive Sensation Seeking; CATS = Child Abuse and Trauma Scale. Note.
An M DMQ-R: Total variable was not computed as the questionnaire’s subscales qualitatively conflict
(e.g., coping versus enhancement); thus, a total score would be interpretively useless.
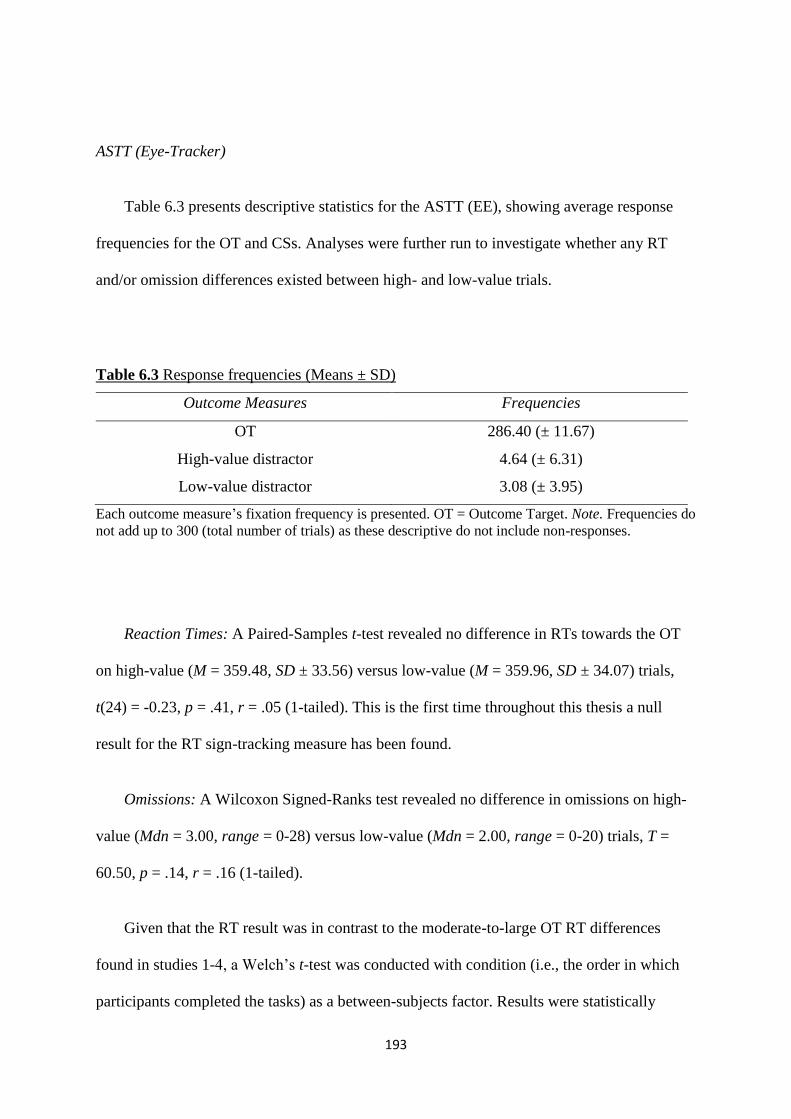
193
ASTT (Eye-Tracker)
Table 6.3 presents descriptive statistics for the ASTT (EE), showing average response
frequencies for the OT and CSs. Analyses were further run to investigate whether any RT
and/or omission differences existed between high- and low-value trials.
Table 6.3 Response frequencies (Means ± SD)
Outcome Measures Frequencies
OT 286.40 (± 11.67)
High-value distractor 4.64 (± 6.31)
Low-value distractor 3.08 (± 3.95)
Each outcome measure’s fixation frequency is presented. OT = Outcome Target. Note. Frequencies do
not add up to 300 (total number of trials) as these descriptive do not include non-responses.
Reaction Times: A Paired-Samples t-test revealed no difference in RTs towards the OT
on high-value (M = 359.48, SD ± 33.56) versus low-value (M = 359.96, SD ± 34.07) trials,
t(24) = -0.23, p = .41, r = .05 (1-tailed). This is the first time throughout this thesis a null
result for the RT sign-tracking measure has been found.
Omissions: A Wilcoxon Signed-Ranks test revealed no difference in omissions on high-
value (Mdn = 3.00, range = 0-28) versus low-value (Mdn = 2.00, range = 0-20) trials, T =
60.50, p = .14, r = .16 (1-tailed).
Given that the RT result was in contrast to the moderate-to-large OT RT differences
found in studies 1-4, a Welch’s t-test was conducted with condition (i.e., the order in which
participants completed the tasks) as a between-subjects factor. Results were statistically
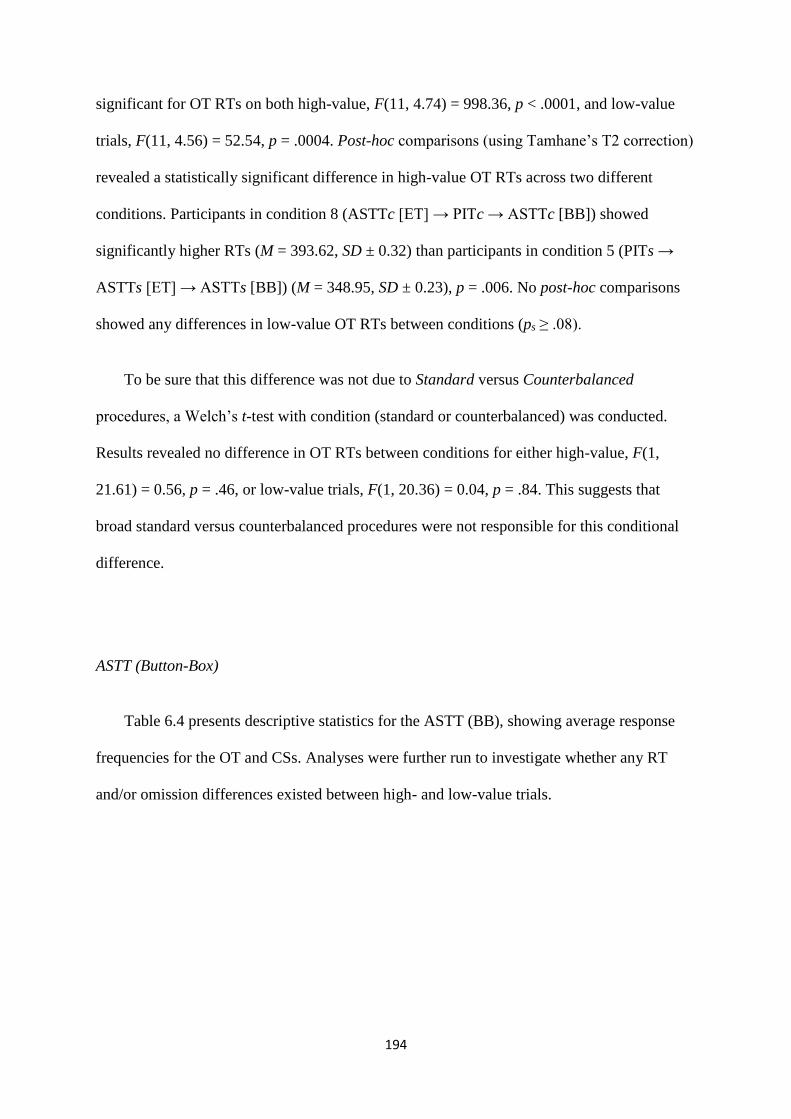
194
significant for OT RTs on both high-value, F(11, 4.74) = 998.36, p < .0001, and low-value
trials, F(11, 4.56) = 52.54, p = .0004. Post-hoc comparisons (using Tamhane’s T2 correction)
revealed a statistically significant difference in high-value OT RTs across two different
conditions. Participants in condition 8 (ASTTc [ET] → PITc → ASTTc [BB]) showed
significantly higher RTs (M = 393.62, SD ± 0.32) than participants in condition 5 (PITs →
ASTTs [ET] → ASTTs [BB]) (M = 348.95, SD ± 0.23), p = .006. No post-hoc comparisons
showed any differences in low-value OT RTs between conditions (ps ≥ .08).
To be sure that this difference was not due to Standard versus Counterbalanced
procedures, a Welch’s t-test with condition (standard or counterbalanced) was conducted.
Results revealed no difference in OT RTs between conditions for either high-value, F(1,
21.61) = 0.56, p = .46, or low-value trials, F(1, 20.36) = 0.04, p = .84. This suggests that
broad standard versus counterbalanced procedures were not responsible for this conditional
difference.
ASTT (Button-Box)
Table 6.4 presents descriptive statistics for the ASTT (BB), showing average response
frequencies for the OT and CSs. Analyses were further run to investigate whether any RT
and/or omission differences existed between high- and low-value trials.
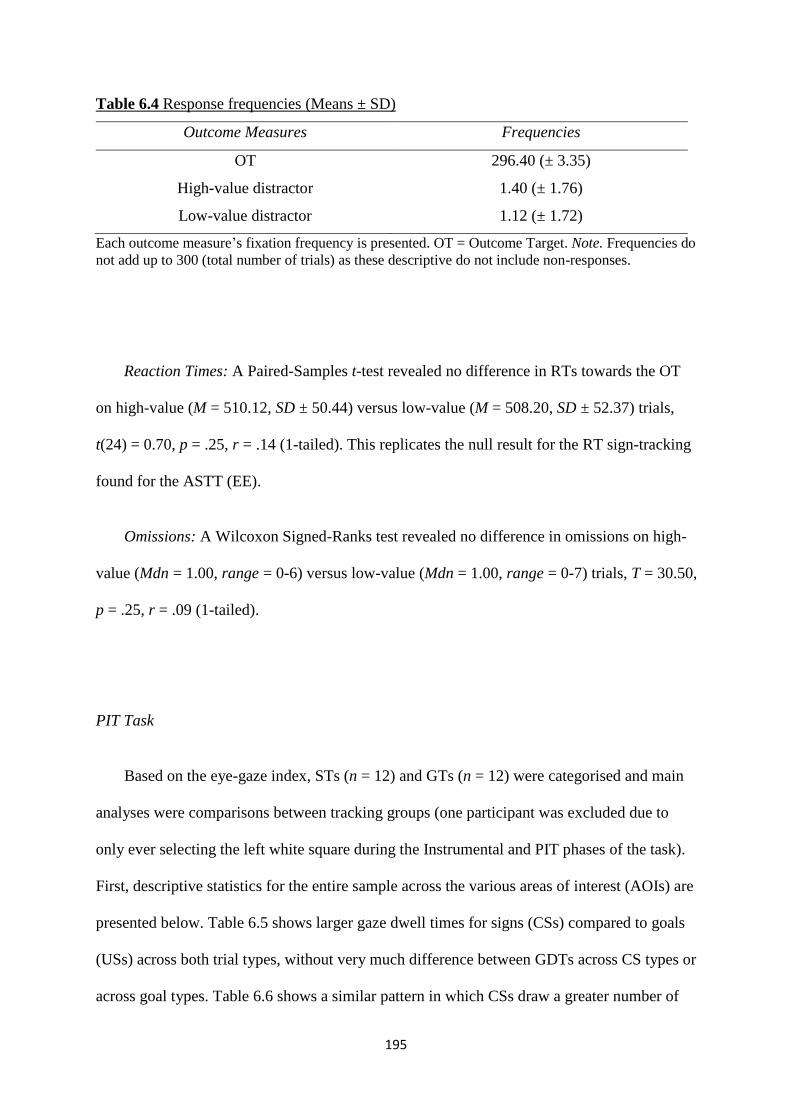
195
Table 6.4 Response frequencies (Means ± SD)
Outcome Measures Frequencies
OT 296.40 (± 3.35)
High-value distractor 1.40 (± 1.76)
Low-value distractor 1.12 (± 1.72)
Each outcome measure’s fixation frequency is presented. OT = Outcome Target. Note. Frequencies do
not add up to 300 (total number of trials) as these descriptive do not include non-responses.
Reaction Times: A Paired-Samples t-test revealed no difference in RTs towards the OT
on high-value (M = 510.12, SD ± 50.44) versus low-value (M = 508.20, SD ± 52.37) trials,
t(24) = 0.70, p = .25, r = .14 (1-tailed). This replicates the null result for the RT sign-tracking
found for the ASTT (EE).
Omissions: A Wilcoxon Signed-Ranks test revealed no difference in omissions on high-
value (Mdn = 1.00, range = 0-6) versus low-value (Mdn = 1.00, range = 0-7) trials, T = 30.50,
p = .25, r = .09 (1-tailed).
PIT Task
Based on the eye-gaze index, STs (n = 12) and GTs (n = 12) were categorised and main
analyses were comparisons between tracking groups (one participant was excluded due to
only ever selecting the left white square during the Instrumental and PIT phases of the task).
First, descriptive statistics for the entire sample across the various areas of interest (AOIs) are
presented below. Table 6.5 shows larger gaze dwell times for signs (CSs) compared to goals
(USs) across both trial types, without very much difference between GDTs across CS types or
across goal types. Table 6.6 shows a similar pattern in which CSs draw a greater number of
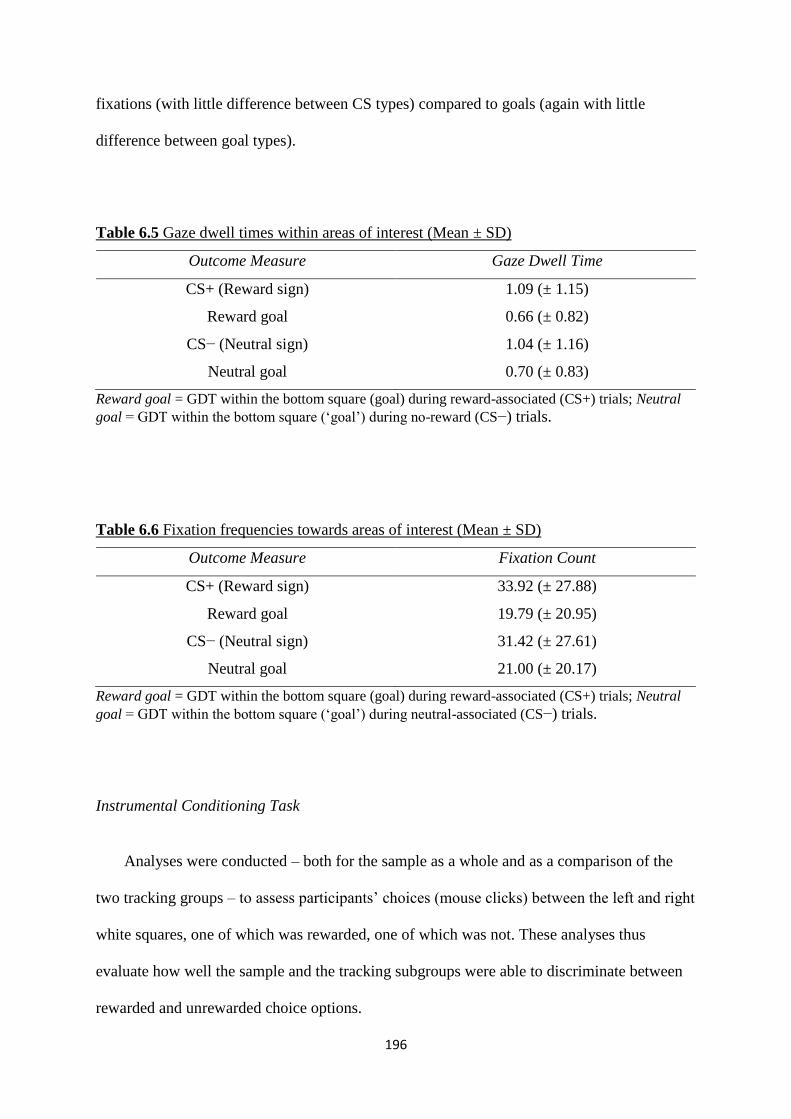
196
fixations (with little difference between CS types) compared to goals (again with little
difference between goal types).
Table 6.5 Gaze dwell times within areas of interest (Mean ± SD)
Outcome Measure Gaze Dwell Time
CS+ (Reward sign) 1.09 (± 1.15)
Reward goal 0.66 (± 0.82)
CS− (Neutral sign) 1.04 (± 1.16)
Neutral goal 0.70 (± 0.83)
Reward goal = GDT within the bottom square (goal) during reward-associated (CS+) trials; Neutral
goal = GDT within the bottom square (‘goal’) during no-reward (CS−) trials.
Table 6.6 Fixation frequencies towards areas of interest (Mean ± SD)
Outcome Measure Fixation Count
CS+ (Reward sign) 33.92 (± 27.88)
Reward goal 19.79 (± 20.95)
CS− (Neutral sign) 31.42 (± 27.61)
Neutral goal 21.00 (± 20.17)
Reward goal = GDT within the bottom square (goal) during reward-associated (CS+) trials; Neutral
goal = GDT within the bottom square (‘goal’) during neutral-associated (CS−) trials.
Instrumental Conditioning Task
Analyses were conducted – both for the sample as a whole and as a comparison of the
two tracking groups – to assess participants’ choices (mouse clicks) between the left and right
white squares, one of which was rewarded, one of which was not. These analyses thus
evaluate how well the sample and the tracking subgroups were able to discriminate between
rewarded and unrewarded choice options.
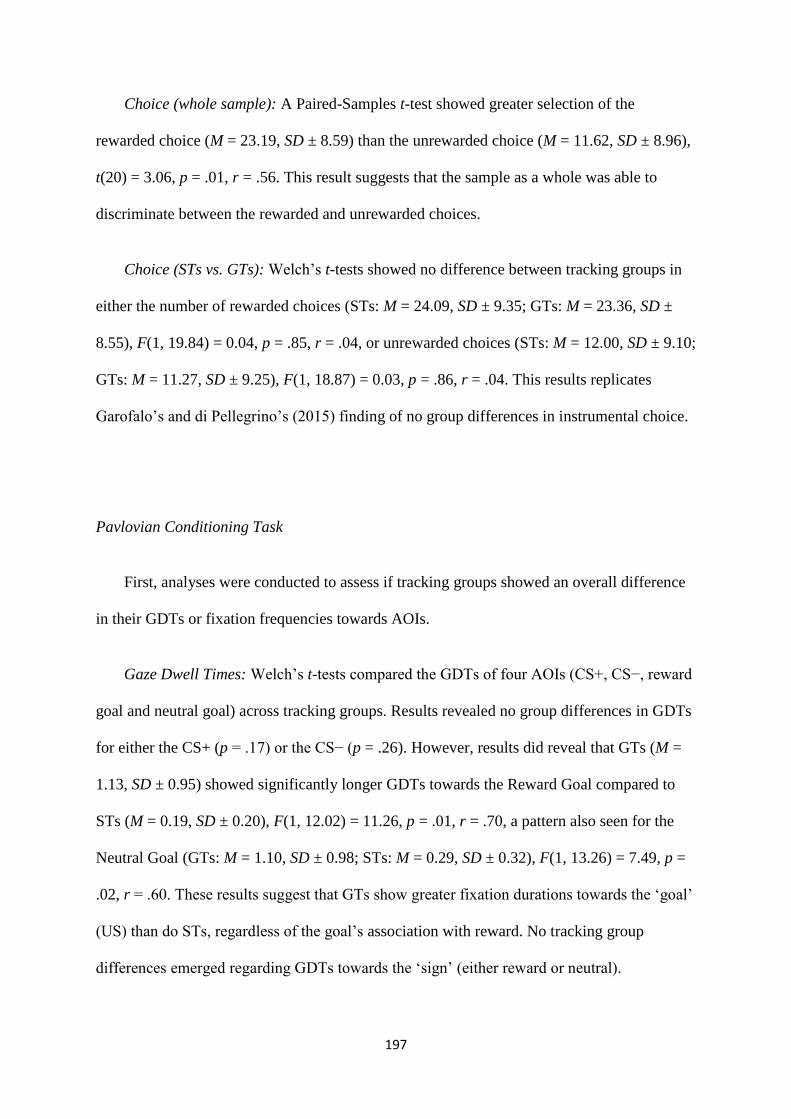
197
Choice (whole sample): A Paired-Samples t-test showed greater selection of the
rewarded choice (M = 23.19, SD ± 8.59) than the unrewarded choice (M = 11.62, SD ± 8.96),
t(20) = 3.06, p = .01, r = .56. This result suggests that the sample as a whole was able to
discriminate between the rewarded and unrewarded choices.
Choice (STs vs. GTs): Welch’s t-tests showed no difference between tracking groups in
either the number of rewarded choices (STs: M = 24.09, SD ± 9.35; GTs: M = 23.36, SD ±
8.55), F(1, 19.84) = 0.04, p = .85, r = .04, or unrewarded choices (STs: M = 12.00, SD ± 9.10;
GTs: M = 11.27, SD ± 9.25), F(1, 18.87) = 0.03, p = .86, r = .04. This results replicates
Garofalo’s and di Pellegrino’s (2015) finding of no group differences in instrumental choice.
Pavlovian Conditioning Task
First, analyses were conducted to assess if tracking groups showed an overall difference
in their GDTs or fixation frequencies towards AOIs.
Gaze Dwell Times: Welch’s t-tests compared the GDTs of four AOIs (CS+, CS−, reward
goal and neutral goal) across tracking groups. Results revealed no group differences in GDTs
for either the CS+ (p = .17) or the CS− (p = .26). However, results did reveal that GTs (M =
1.13, SD ± 0.95) showed significantly longer GDTs towards the Reward Goal compared to
STs (M = 0.19, SD ± 0.20), F(1, 12.02) = 11.26, p = .01, r = .70, a pattern also seen for the
Neutral Goal (GTs: M = 1.10, SD ± 0.98; STs: M = 0.29, SD ± 0.32), F(1, 13.26) = 7.49, p =
.02, r = .60. These results suggest that GTs show greater fixation durations towards the ‘goal’
(US) than do STs, regardless of the goal’s association with reward. No tracking group
differences emerged regarding GDTs towards the ‘sign’ (either reward or neutral).
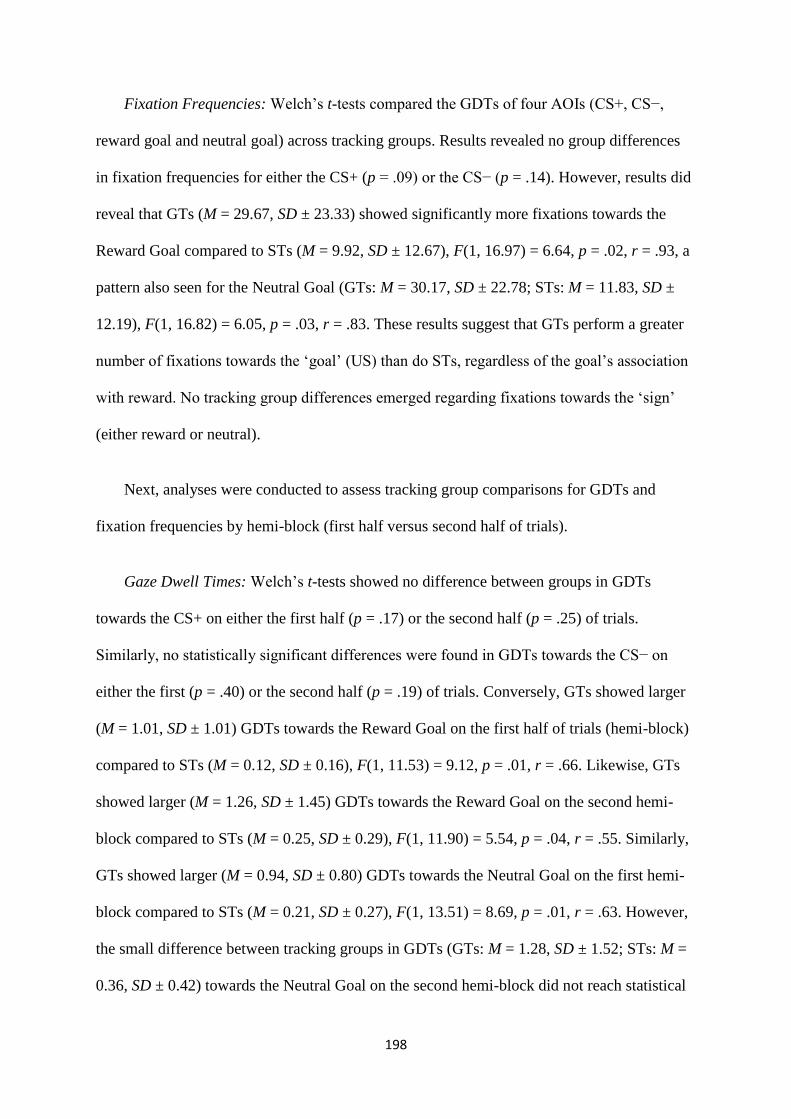
198
Fixation Frequencies: Welch’s t-tests compared the GDTs of four AOIs (CS+, CS−,
reward goal and neutral goal) across tracking groups. Results revealed no group differences
in fixation frequencies for either the CS+ (p = .09) or the CS− (p = .14). However, results did
reveal that GTs (M = 29.67, SD ± 23.33) showed significantly more fixations towards the
Reward Goal compared to STs (M = 9.92, SD ± 12.67), F(1, 16.97) = 6.64, p = .02, r = .93, a
pattern also seen for the Neutral Goal (GTs: M = 30.17, SD ± 22.78; STs: M = 11.83, SD ±
12.19), F(1, 16.82) = 6.05, p = .03, r = .83. These results suggest that GTs perform a greater
number of fixations towards the ‘goal’ (US) than do STs, regardless of the goal’s association
with reward. No tracking group differences emerged regarding fixations towards the ‘sign’
(either reward or neutral).
Next, analyses were conducted to assess tracking group comparisons for GDTs and
fixation frequencies by hemi-block (first half versus second half of trials).
Gaze Dwell Times: Welch’s t-tests showed no difference between groups in GDTs
towards the CS+ on either the first half (p = .17) or the second half (p = .25) of trials.
Similarly, no statistically significant differences were found in GDTs towards the CS− on
either the first (p = .40) or the second half (p = .19) of trials. Conversely, GTs showed larger
(M = 1.01, SD ± 1.01) GDTs towards the Reward Goal on the first half of trials (hemi-block)
compared to STs (M = 0.12, SD ± 0.16), F(1, 11.53) = 9.12, p = .01, r = .66. Likewise, GTs
showed larger (M = 1.26, SD ± 1.45) GDTs towards the Reward Goal on the second hemi-
block compared to STs (M = 0.25, SD ± 0.29), F(1, 11.90) = 5.54, p = .04, r = .55. Similarly,
GTs showed larger (M = 0.94, SD ± 0.80) GDTs towards the Neutral Goal on the first hemi-
block compared to STs (M = 0.21, SD ± 0.27), F(1, 13.51) = 8.69, p = .01, r = .63. However,
the small difference between tracking groups in GDTs (GTs: M = 1.28, SD ± 1.52; STs: M =
0.36, SD ± 0.42) towards the Neutral Goal on the second hemi-block did not reach statistical
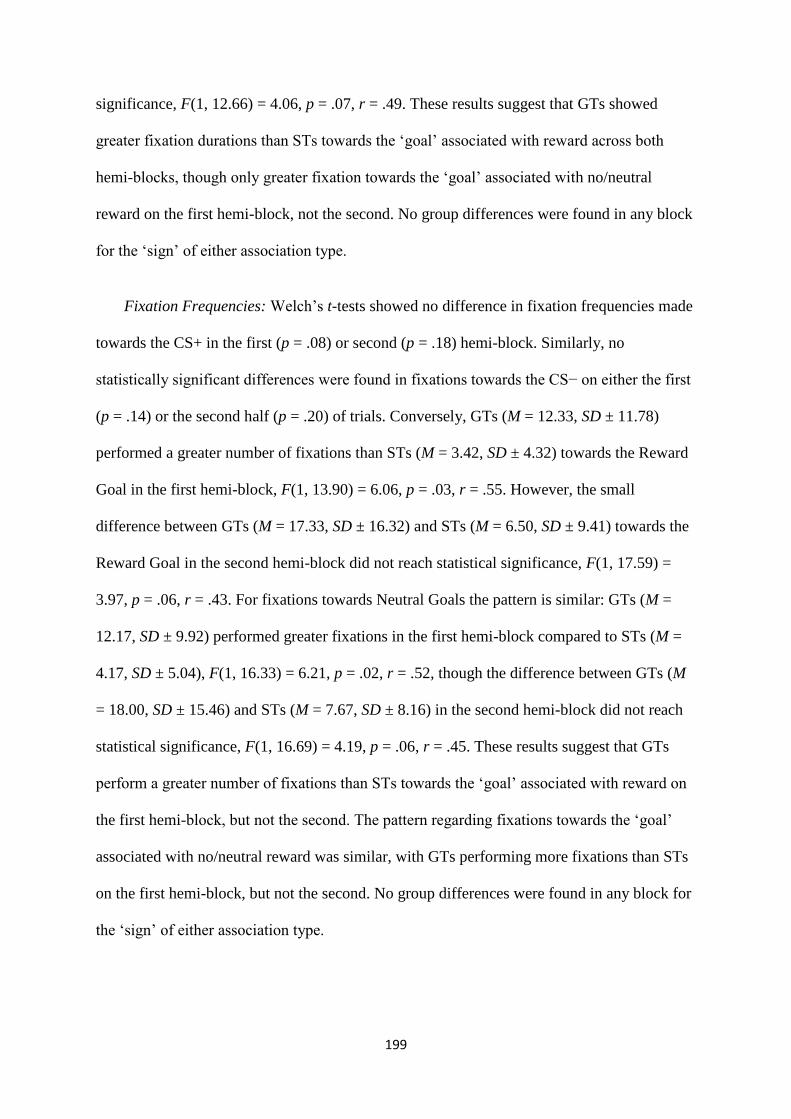
199
significance, F(1, 12.66) = 4.06, p = .07, r = .49. These results suggest that GTs showed
greater fixation durations than STs towards the ‘goal’ associated with reward across both
hemi-blocks, though only greater fixation towards the ‘goal’ associated with no/neutral
reward on the first hemi-block, not the second. No group differences were found in any block
for the ‘sign’ of either association type.
Fixation Frequencies: Welch’s t-tests showed no difference in fixation frequencies made
towards the CS+ in the first (p = .08) or second (p = .18) hemi-block. Similarly, no
statistically significant differences were found in fixations towards the CS− on either the first
(p = .14) or the second half (p = .20) of trials. Conversely, GTs (M = 12.33, SD ± 11.78)
performed a greater number of fixations than STs (M = 3.42, SD ± 4.32) towards the Reward
Goal in the first hemi-block, F(1, 13.90) = 6.06, p = .03, r = .55. However, the small
difference between GTs (M = 17.33, SD ± 16.32) and STs (M = 6.50, SD ± 9.41) towards the
Reward Goal in the second hemi-block did not reach statistical significance, F(1, 17.59) =
3.97, p = .06, r = .43. For fixations towards Neutral Goals the pattern is similar: GTs (M =
12.17, SD ± 9.92) performed greater fixations in the first hemi-block compared to STs (M =
4.17, SD ± 5.04), F(1, 16.33) = 6.21, p = .02, r = .52, though the difference between GTs (M
= 18.00, SD ± 15.46) and STs (M = 7.67, SD ± 8.16) in the second hemi-block did not reach
statistical significance, F(1, 16.69) = 4.19, p = .06, r = .45. These results suggest that GTs
perform a greater number of fixations than STs towards the ‘goal’ associated with reward on
the first hemi-block, but not the second. The pattern regarding fixations towards the ‘goal’
associated with no/neutral reward was similar, with GTs performing more fixations than STs
on the first hemi-block, but not the second. No group differences were found in any block for
the ‘sign’ of either association type.
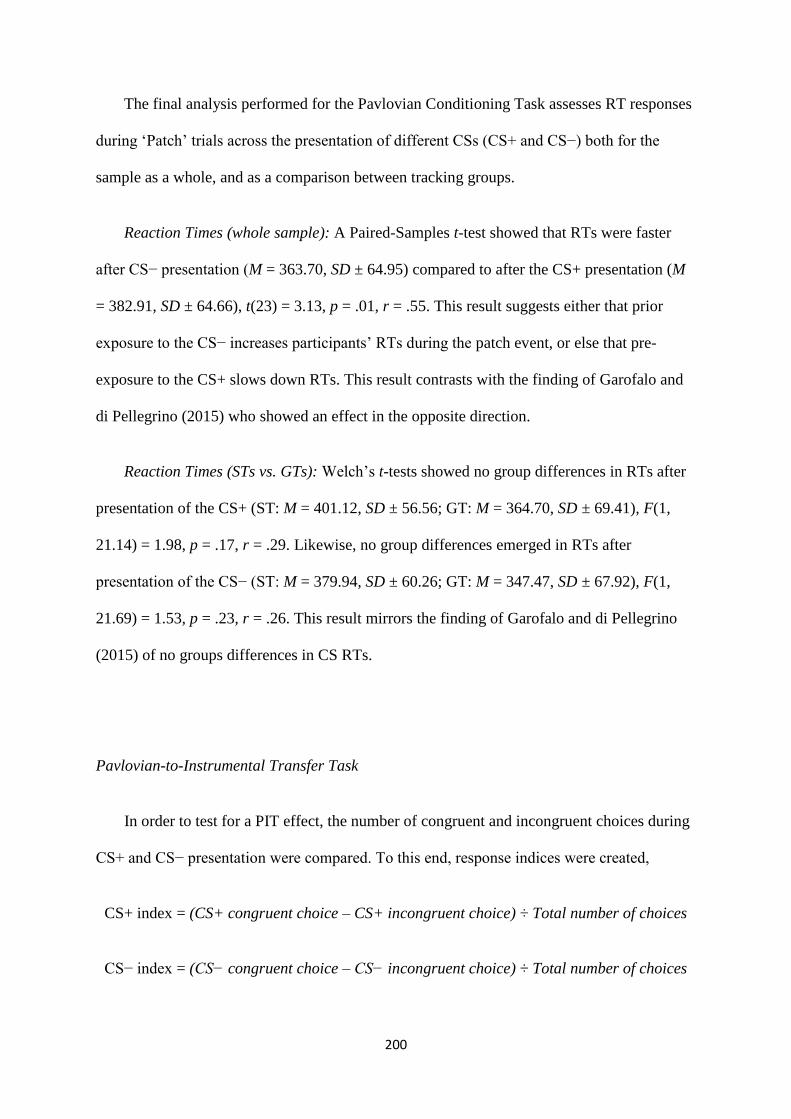
200
The final analysis performed for the Pavlovian Conditioning Task assesses RT responses
during ‘Patch’ trials across the presentation of different CSs (CS+ and CS−) both for the
sample as a whole, and as a comparison between tracking groups.
Reaction Times (whole sample): A Paired-Samples t-test showed that RTs were faster
after CS− presentation (M = 363.70, SD ± 64.95) compared to after the CS+ presentation (M
= 382.91, SD ± 64.66), t(23) = 3.13, p = .01, r = .55. This result suggests either that prior
exposure to the CS− increases participants’ RTs during the patch event, or else that pre-
exposure to the CS+ slows down RTs. This result contrasts with the finding of Garofalo and
di Pellegrino (2015) who showed an effect in the opposite direction.
Reaction Times (STs vs. GTs): Welch’s t-tests showed no group differences in RTs after
presentation of the CS+ (ST: M = 401.12, SD ± 56.56; GT: M = 364.70, SD ± 69.41), F(1,
21.14) = 1.98, p = .17, r = .29. Likewise, no group differences emerged in RTs after
presentation of the CS− (ST: M = 379.94, SD ± 60.26; GT: M = 347.47, SD ± 67.92), F(1,
21.69) = 1.53, p = .23, r = .26. This result mirrors the finding of Garofalo and di Pellegrino
(2015) of no groups differences in CS RTs.
Pavlovian-to-Instrumental Transfer Task
In order to test for a PIT effect, the number of congruent and incongruent choices during
CS+ and CS− presentation were compared. To this end, response indices were created,
CS+ index = (CS+ congruent choice – CS+ incongruent choice) ÷ Total number of choices
CS− index = (CS− congruent choice – CS− incongruent choice) ÷ Total number of choices
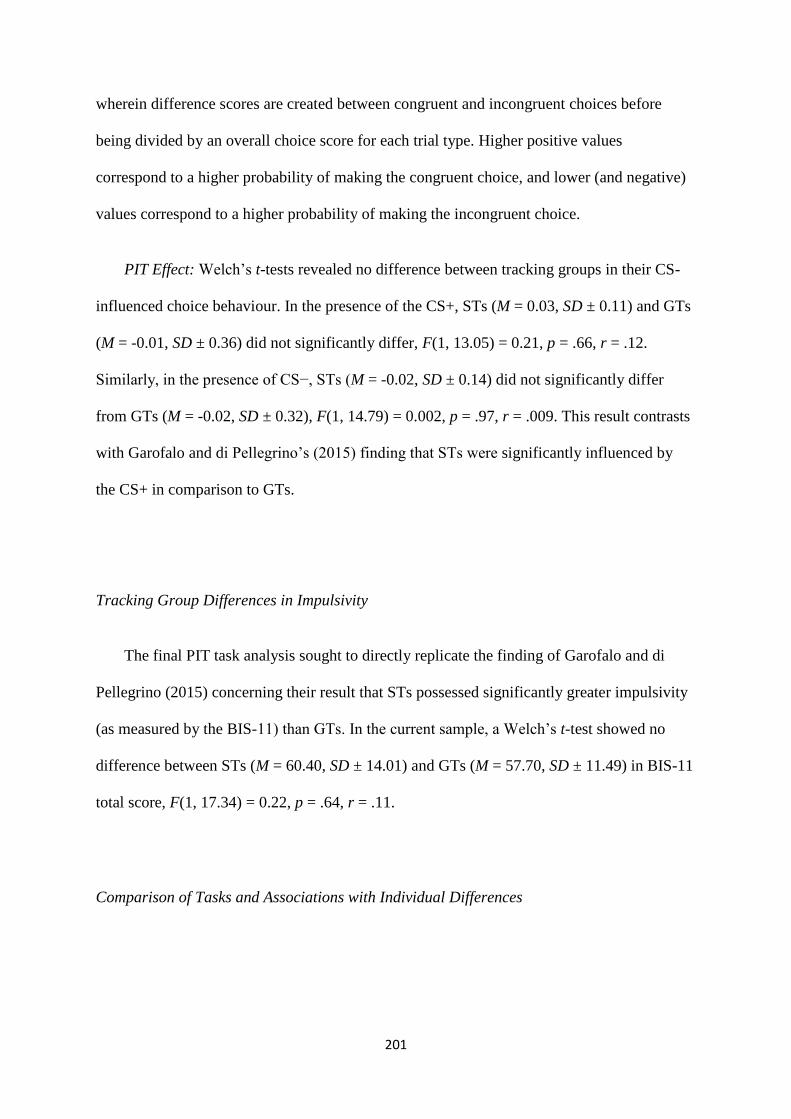
201
wherein difference scores are created between congruent and incongruent choices before
being divided by an overall choice score for each trial type. Higher positive values
correspond to a higher probability of making the congruent choice, and lower (and negative)
values correspond to a higher probability of making the incongruent choice.
PIT Effect: Welch’s t-tests revealed no difference between tracking groups in their CS-
influenced choice behaviour. In the presence of the CS+, STs (M = 0.03, SD ± 0.11) and GTs
(M = -0.01, SD ± 0.36) did not significantly differ, F(1, 13.05) = 0.21, p = .66, r = .12.
Similarly, in the presence of CS−, STs (M = -0.02, SD ± 0.14) did not significantly differ
from GTs (M = -0.02, SD ± 0.32), F(1, 14.79) = 0.002, p = .97, r = .009. This result contrasts
with Garofalo and di Pellegrino’s (2015) finding that STs were significantly influenced by
the CS+ in comparison to GTs.
Tracking Group Differences in Impulsivity
The final PIT task analysis sought to directly replicate the finding of Garofalo and di
Pellegrino (2015) concerning their result that STs possessed significantly greater impulsivity
(as measured by the BIS-11) than GTs. In the current sample, a Welch’s t-test showed no
difference between STs (M = 60.40, SD ± 14.01) and GTs (M = 57.70, SD ± 11.49) in BIS-11
total score, F(1, 17.34) = 0.22, p = .64, r = .11.
Comparison of Tasks and Associations with Individual Differences
202
Given that none of the tasks produced the predicted effects, no comparisons were made
and no correlations between task outcomes and self-report measures (e.g., alcohol
consumption, impulsivity etc.) were conducted.
6.6 Discussion
This study tested social drinkers on three different tasks – two versions of the ASTT and a
PIT task – with the aim of comparing participants’ levels of sign-tracking. Specifically, the
aim was to assess whether the tasks differed in their ability to elicit sign-tracking, as well as
testing whether participants who were categorised as STs or GTs on one task, would also be
classified as such on the other two tasks. It was also thought that an increased number of
sign-tracking outcome measures from a variety of methods may proffer more utility to the
tested associations with self-report measures (alcohol consumption, impulsivity etc.).
Unfortunately, this study cannot give any viable information on the questions explored as all
of the tasks failed to stimulate the desired effects. Specifically, neither ASTT task produced
reliable sign-tracking effects, while the PIT task did not induce any measurable Pavlovian-to-
Instrumental Transfer effect. Given these results, there could be no reasonable comparison of
the different tasks, nor any correlational analyses between task outcomes and self-reports.
As a result of these widespread failures, and in particular the failure of the ASTT (EE)
which has produced robust and reliable effects in the past, the results are uninterpretable. If
there was no sign-tracking effect in the ASTT (EE), there would be no reason to suspect
measurable effects in the other, lesser used tasks. Thus, this discussion shall be kept brief and
will only attempt to address the possible explanations as to why the predicted effects were
absent.
203
Perhaps the most likely cause of the lack of effects was that too many effects were
sought. In practical terms, participants were in the laboratory for over an hour, during which
time they learned several reward-outcome associations (six in total) during the completion of
three cognitive tests which lasted 21m (ASTT [EE]), 21m (ASTT [BB]) and 18m (PIT)
(excluding practice trials and instruction pages). This hour-long cognitive battery – which,
importantly, many participants reported was fatiguing – may have driven participants to
inattention. Ideally, this explanation would be easily verified by an analysis of effects by task
order, with participants showing the largest effects in the task they performed first. However,
counterbalancing procedures both within (‘Standard’/‘Counterbalanced’) and between (task
order) tasks resulted in a total of twelve conditions, leaving only two participants in each
condition. Thus, statistical analysis is not possible. Although, it should be noted that this
analysis by task order was carried out for the ASTT (EE) and there did appear to be larger
effects in participants who performed the task first, but there are too few participants to make
a firm conclusion.)
The current study was too ambitious in trying to replicate and extend the findings of
Garofalo and di Pellegrino (2015). Each participant was in the lab 2.5 times longer than in the
Garofalo and di Pellegrino (2015) study, which had the knock-on effect of inducing time
constraints that reduced recruitment to just 56% that of the original study (N = 25 versus N =
45). Regarding statistical power, the effect sizes of the main effects (OT RTs) found so far in
this thesis offer a broad range of recommendations with regard to sample size (Study 1
suggests an N of 58, Study 2 an N of 19 and Study 3 an N of 69, all for attaining 80% power;
G*Power 3.1). This suggests that an average N of around 49 may be the aim in order to
reliably detect an effect. However, most of the studies in this thesis so far contained sample
sizes smaller than this and still found consistent effects, while the majority of studies using
additional singleton (or similar) tasks typically attain robust results with sample sizes in the
204
mid-teens or twenties (B. A. Anderson, 2015b; B. A. Anderson, Kuwabara, et al., 2016; B. A.
Anderson et al., 2013, 2011a; B. A. Anderson, Laurent, & Yantis, 2012; B. A. Anderson,
Kronemer, et al., 2016; B. A. Anderson, Laurent, et al., 2014; B. A. Anderson, Leal, et al.,
2014; B. A. Anderson & Yantis, 2012, 2013; Bourgeois, Neveu, Bayle, & Vuilleumier, 2017;
Bucker et al., 2014; Donohue et al., 2016; Lavie & de Fockert, 2005, 2006; Le Pelley et al.,
2015; Theeuwes & Belopolsky, 2012).
The current study may have benefited from changes to its goals. For example, being
more selective in which methods were being measured and compared (i.e., comparing
participants on just two tasks rather than three) would have reduced testing duration by one
third and perhaps prevented cognitive fatigue, boredom effects or any other problems that
may have resulted from extended computer testing. The study may have also benefited from
changes to its structure. For example, testing participants on one task per day over the course
of three days may have also prevented such problems. However, such a change would also
come with its own problems such as increased time pressure, participant attrition and so on.
Although this study does not offer much in the way of new information regarding ST and GT,
it does highlight several methodological factors which should inform future research.
205
Chapter Seven
Human Sign-Tracking Correlates with BOLD
Activity in the Dorsal Striatum
7.1 Abstract
Background: Neurobiological links to sign-tracking have been shown in both animals and
humans. Aims: Neural links to sign-tracking were explored using functional magnetic
resonance imaging (fMRI). Methods: Participants previously classified as sign-trackers
(STs), goal-trackers (GTs) or in an intermediate group (ITs) in Studies 1, 2, 3 and 5 were
recruited. STs (n = 6), ITs (n = 4) and GTs (n = 10) completed the ASTT (BB) while neural
activity was recorded. Participants completed the usual questionnaires online. Results:
Behavioural data showed the predicted reaction time sign-tracking effect (RT Bias), though
the test-retest reliability (from previous to current study) was poor. A general linear model
revealed neural activation as a contrast between high-value and low-value trials in regions
associated with implicit and reinforcement learning (bilateral putamen), object recognition
and object information encoding (right lateral superior occipital cortex). A second high-value
> low-value contrast with RT Bias included as a moderator showed activity related to
appetitive pavlovian conditioning and physical responses to emotive stimuli (amygdala), the
processing of rewards of different value (right putamen and pallidum), and attention shifting
in tasks involving relative value coding (right superior temporal gyrus). Conclusions: Sign-
tracking is associated with subcortical functioning, replicating previous results.
Keywords: Sign-tracking, fMRI, Pavlovian conditioning, Visual selective attention
206
7.2 Introduction
Sign-trackers (STs) attribute incentive value to noncontingent, discrete, reward-paired cues.
Goal-trackers (GTs) use such cues to predict the onset of reward. Preclinical studies suggest
that STs imbue such cues with the power to drug reinstatement; GTs follow the same pattern
for contextual cues (e.g., one cage versus another; entire environments) (T. E. Robinson et
al., 2014). Addiction researchers are interested in these phenotypes as they express many of
the same maladaptive behaviours as substance-dependent people (compulsiveness,
persistence despite negative consequences etc.) and because there is now a large literature
showing that sign-tracking in particular seems to be related to typical risk factors for
dependence (e.g., impulsivity, risk-taking, sensation-seeking, incentive-sensitisation, cue-
induced reward seeking etc.) (Belin et al., 2016; Berridge & Robinson, 2016; Flagel, Akil, et
al., 2009; Flagel, Akil, & Robinson, 2010; T. E. Robinson et al., 2014; Saunders & Robinson,
2013; Tomie et al., 2008).
Recent research has provided growing evidence for similar patterns in humans, with
sign-tracking found to be associated with self-reported impulsivity, reward-seeking, low
working memory capacity, opioid dependence, substance abuse history and self-reported
premorbid impulsivity before HIV+ diagnosis (B. A. Anderson et al., 2013, 2011b; B. A.
Anderson, Kronemer, et al., 2016; B. A. Anderson & Yantis, 2012; Hickey et al., 2010b;
Pearson et al., 2015). Studies have also shown that people classified as STs are more
vulnerable to CS-influenced reward behaviours, while obese individuals classified as STs
(compared to GTs) have a greater propensity for maladaptive eating behaviour and feelings
of a loss of control (Garofalo & di Pellegrino, 2015; Versace et al., 2015).
Much attention in the preclinical literature has been paid to the neurobiological
underpinnings of these phenotypes, with evidence indicating that sign-tacking and goal-
207
tracking may be rooted in different neural circuitry (Flagel & Robinson, 2017; Saunders &
Robinson, 2013; Saunders et al., 2013). Preclinical literature suggests that individual
variation in CRs to reward-paired cues is largely governed by a ‘motive circuit’ which
includes cortico-striato-pallido-thalamic loops with cortical and subcortical networks
converging on the nucleus accumbens (NAcc) (Flagel & Robinson, 2017). In one study,
researchers found food-cue induced mRNA expression in STs in the NAcc, dorsal striatum,
lateral habenula, lateral septum, orbitofrontal cortex (OFC) and several nuclei of the thalamus
(the motive circuit). GTs, by contrast, showed mRNA expression no different to that of
unpaired control rats (Flagel, Cameron, et al., 2011). Further, the connectivity in these
regions differed between STs and GTs.
The neurotransmitter dopamine (DA) has been found to be important in the acquisition
(Scülfort et al., 2016), maintenance (Saunders & Robinson, 2012), and modulation (Peciña &
Berridge, 2013) of sign-tracking. In one particular study, rats who eventually developed a
sign-tracking CR (STs) (but not a goal-tracking CR; GTs) showed a phasic DA signal transfer
in the NAcc from the US to the CS, indicating that reward signalling had shifted from the
reward to the reward-paired cue (Flagel, Clark, et al., 2011). The literature on the
neurobiology of sign-tracking and goal-tracking is extensive and is outlined in more detail in
the Introduction chapter (Chapter One, section 1.5.2); see also the following references for
reviews (Flagel & Robinson, 2017; Fraser & Haight, 2016; Huys, Tobler, Hasler, & Flagel,
2014; Pessoa, 2014b; Saunders & Robinson, 2013; Tomie et al., 2008).
Investigations into the underlying neurology of human sign-tracking are also underway.
However, the majority of human studies only overlap with the sign-tracking literature, rather
than actively exploring it. Nevertheless, such research still has core implications. For
example, work using a variety of imaging techniques has shown that the human subthalamic
208
nucleus encodes the subjective value of reward, the ventral striatum encodes reward
preference, and dopaminergic dysfunction in the ventral striatum of alcoholics is associated
with greater alcohol cue-induced craving and neural activation (Heinz et al., 2004;
O’Doherty, Buchanan, Seymour, & Dolan, 2006; Zénon et al., 2016). One study has also
shown that methamphetamine-dependent individuals show differential brain activity in the
putamen, caudate and anterior insula to different levels of reward depending on whether they
have remained abstinent or not (Gowin et al., 2015). Additionally, in a meta-analysis of 142
neuroimaging studies several brain areas were found to be consistently associated with
reward-related decision making, including the NAcc, caudate, putamen, thalamus, OFC,
bilateral anterior insula, anterior cingulate cortex (ACC) and posterior cingulate cortex
(PCC), with the inferior parietal lobule and prefrontal cortex (PFC) the cognitive control
regions (Liu et al., 2011). Crucially, contrast analyses between cues with a positive or
negative valence revealed that bilateral NAcc, anterior insula, medial OFC, hippocampus, left
putamen and thalamus were more active in response to positive cues than negative; no areas
showed more activation by negative cues than positive.
Regarding studies which have directly measured human sign-tracking while
simultaneously measuring brain activity, several have employed additional singleton tasks
(AST). There are variations in what type of AST is employed in each study, but the salient
aspect here is that they have shown clear neural activations in response to high-value cues
compared to low-value (or reward-associated cues compared to the absence of such cues).
Functional magnetic resonance imaging (fMRI) studies which have employed the AST have
shown activation following such a high > low pattern in the extrastriate visual cortex, tail of
the caudate nucleus, superior parietal cortex, frontal cortex, inferior frontal gyrus, lateral
occipital complex, and intraparietal sulcus (B. A. Anderson, 2016b; B. A. Anderson, Laurent,
et al., 2014; de Fockert et al., 2004; de Fockert & Theeuwes, 2012). In a further study
209
utilising the AST and positron emission tomography (PET), findings revealed that sign-
tracking was associated with changes in available D2/D3 DA receptors within the right
caudate and posterior putamen (B. A. Anderson, Kuwabara, et al., 2016). Further, DA
signalling in the dorsal striatum predicted sign-tracking CRs.
In addition to fMRI and PET, AST studies have also employed electroencephalography
(EEG) to monitor neural responses during the task. Such studies have shown that reward-
associated distractors can spark brain responses (i.e., capture neural ‘attention’) before targets
do even when they are presented at the same time (Qi et al., 2013). This is supported by
evidence suggesting that reward-associated CSs elicit the P1 event-related potential, one of
the earliest reliable indicators of visual selective attention (Maclean & Giesbrecht, 2015).
They have also found evidence of activation (broadly defined as electrophysiological
responses of various kinds) in the anterior cingulate cortex (ACC), matching the work of
other scanning techniques (though EEG has far lower spatial resolution) (Hickey, Chelazzi, &
Theeuwes, 2010a). In a recent study employing transcranial random noise stimulation (tRNS)
prior to the AST, researchers found that stimulation of the occipital cortex (but not the frontal
cortex) increased value-modulated attentional capture (VMAC) for a high-value reward-
associated cue, suggesting that plasticity in the visual cortex can modulate sign-tracking (Van
Koningsbruggen et al., 2016). Finally, in the only study to investigate the neurological
responses in human STs versus GTs, researchers recorded EEG responses while lean and
obese individuals viewed food-related, pleasant, neutral and unpleasant images (Versace et
al., 2015). Results revealed that STs showed late positive potential (LPP) responses to food-
related images that were of the same magnitude to LPPs towards other highly emotionally
arousing stimuli (e.g., erotica, mutilations), whereas GTs’ LPP responses to the food-related
images were comparable to those evoked by neutral images. Thus, STs’ neurophysiological
210
responses suggest that such individuals imbue food-related cues with incentive salience to
match that of other emotionally salient cues, while this pattern is not seen in GTs.
The present study aims to build on the preclinical and, in particular, the human literature
of exploring the neural correlates of sign-tracking. This study is similar in design to Anderson
(2016); we employ an event-related fMRI paradigm wherein participants’ brain activity is
recorded while they complete the additional singleton tracking task (ASTT), a variant of the
AST. A secondary aim was to test whether participants who were classified as STs and GTs
in a previous study of this thesis (decided by RT Bias in Study 1, Chapter Three) would show
similarly robust RT Bias scores in the present study. Specifically, we hypothesised that I) a
sign-tracking effect would be found using the ASTT (BB), II) neural activations would
replicate areas found in previous work, specifically the striatum and amygdala caudate, and
III) such activations would correlate with sign-tracking.
7.3 Method
Participants
Twenty participants (10 female) – all of whom had taken part in a previous study of this
thesis – were recruited via a strict selection process based on their RT Bias scores (see
Selective Recruitment, below). Participants were aged between 19 and 34 years (M = 25.85,
SD ± 4.58). The inclusion criteria were regular consumption of alcohol (≥10 units per week),
normal or corrected-to-normal vision and righthandedness. Self-reported past or present
alcohol- or drug-use problems, brain surgery, crushing head injury, or pregnancy, diagnosis
of a neurological disease, psychiatric illness, or anxiety disorder (e.g., claustrophobia, PTSD
etc.), and surgery meaning they could not be exposed to the scanner’s magnetic field (e.g.
211
pacemaker, metal implants, body piercings which cannot be removed etc.) were all
exclusions. All participants provided written informed consent before taking part in the study,
which was approved by the University of Liverpool Research Ethics Committee.
Selective Recruitment
Based on Study 1 (Chapter Three), which possessed the largest sample size and thus was
most adequately powered to detect a sign-tracking effect, cut-offs for RT Bias scores were
created (GTs: −3.60; STs: 16.58; ITs: everything in between). These bias score cut-offs were
applied to participant samples for Studies 1, 2, 3 and 5 (Chapters Three, Four and Six); Study
4 (Chapter Five) was not included due to a different task being used (the ASTT+). Bias
scores taken from Studies 2 and 3 were from the control conditions only (not alcohol).
Participants within these category bounds who also met the other inclusion/exclusion criteria
were recruited. Initial aims were to compare STs to GTs only, so as to compare individuals
with only the most extreme scores. However, due to this study taking place up to two years
after some participants’ previous participation (in the case of Study 1) and with several
participants not meeting some of the other inclusion/exclusion criteria, many participants who
were contacted could not be recruited. The result of these difficulties was that some
participants of previous studies had to be recruited who met the criteria for neither
classification as an ST nor GT (i.e., ITs). Based on these factors 10 GTs, 6 STs and 4 IGs
were recruited23.
23 It should be noted that two participants (one ST, one GT) were recruited from Study 5 (Chapter Six). This is of note as no overall sign-tracking effect was gleaned from this study. However, these two participants’ scores did still meet the RT Bias cut-offs described in this section.
212
Materials
Questionnaires
The same questionnaire pack used in Study 1 was given to all participants to assess
drinking habits (TLFB, AUDIT), drinking motives (Modified DMQ-R), drinking
consequences (B-YAACQ), impulsivity (BIS-11, ImpSS) and childhood trauma (CATS) (see
Chapter Two [General Methods] for full descriptions). An additional scale – the Single Ease
Question (SEQ) – was completed after the ASTT. This single question asked participants:
‘Overall, how easy or difficult did you find this task? Circle a number below:’ with a 7-point
Likert scale from ‘very easy’ to ‘very difficult’ (Sauro & Dumas, 2009).
Button-Box
The button-box used was constructed by technicians at the Liverpool Magnetic
Resonance Imaging Centre (LiMRIC), and it closely mirrored the button-box used in Study 5
(Chapter Six) with a raised button in each corner of the box.
Cognitive Task
Additional Singleton Tracking Task: Button-Box (ASTT [BB]): This task is almost
identical to the ASTT (BB) used in Study 5 (Chapter Six). There are 8 stimuli presented on
each trial: 1 diamond (OT), 1 coloured circle (CS) and 6 grey circles (valueless distractors).
This adaptation was decided upon in order to match it to the task used in Study 5 (Chapter

213
Six). Given the two extra stimuli presented in each trial (compared to the ASTT [EE]), the
stimuli were made slightly smaller (200 × 200 pixels versus 240 × 240 pixels) but were
nonetheless perceptually larger due to the larger screen. As noted previously, evidence
suggests increased ‘display size’ (number of stimuli) in ASTs using a coloured distractor
increases average response times (Theeuwes, 2010), and so increased stimulus number
should not adversely affect the production of sign-tracking. The task was presented on a
projector screen parallel to the top of the participant’s head (approximately two feet away),
which they were able to see via a mirror attached to the scanner’s head coil. The task was
presented in landscape at a resolution of 1024 × 768.
One of the major differences in the current task was that participants used their right
hand (all participants’ dominant hand) to make responses, whereas in Study 5 participants
used both hands. The other differences concern timings, durations, trial number and trial
sequence, all of which were altered compared to previous studies due to the event-related
design of the study. In addition to 6 practice trials, there were 160 true trials (80 high value,
80 low value) in a fixed sequence (i.e., the same for all participants), the order of which was
determined by a random sequence generator (containing no duplicates) (Haahr, n.d.). Given
the time constraints borne of consideration for fMRI scanning (see ‘Data Acquisition,
Reduction and Analysis’, below), all trials were longer than previously seen in the ASTT and
a variable inter-trial interval (ITI) was employed.
Avoiding the technical aspects here (see sections below), the components of task trials
ran as follows: fixation trials (null events presenting a fixation cross) lasted 4000ms
(randomly staggered, +/− 200ms) before one of the two trials (high/low) was shown for
1000ms, or until a response was registered. Following this, a 2000ms pre-trial pause (black
screen) preceded a feedback trial (detailing how many points, if any, were won on the
214
previous trial) for 6000ms, before a post-trial pause (black screen) was shown for 2000ms.
This details a full run-through of one trial (15 seconds in total) and is similar in design to
previous fMRI studies employing an AST (de Fockert, Rees, Frith & Lavie, 2004; Lavie & de
Fockert, 2006). Task duration was approximately 40 minutes.
Procedure
All testing took place between the times of 9 a.m. and 6 p.m. in the Liverpool Magnetic
Resonance Imaging Centre (LiMRIC) at the University of Liverpool. Before attending the
lab, participants completed an online questionnaire pack (TLFB, AUDIT, M DMQ-R, B-
YAACQ, BIS-11, ImpSS, CATS) via Qualtrics (Provo, UT, 2015). Those who fulfilled the
criteria were invited to attend the laboratory session. All participants underwent safety
screening, performed by a senior radiographer to confirm their suitability for the session. All
participants provided informed consent before both the online questionnaire and lab portions
of the study and a standard risk assessment was conducted by the departmental safety
coordinator. During the lab session, participants first underwent diagnostic T1 (10 minutes)
and T2 (2 minutes) weighted images, before completing the ASTT (BB) whilst undergoing
functional scanning (40 minutes). Upon completion of the task, participants completed the
SEQ so that their perception of task difficulty could be obtained. Participants received £50 as
compensation for their travel expenses and time. It is worth noting that there was no
deception in this study regarding the attainment of extra rewards based on task performance
as all participants had already undergone such deception in a previous study. Each session
lasted approximately 60 minutes.
215
7.4 Data Acquisition, Reduction and Analysis
7.4.1 Additional Singleton Tracking Task: Outcome Measures
Measures for the ASTT (BB) were those used by Le Pelley et al (2015) and were divided into
omissions and RTs. For both Omission Bias and RT Bias, greater (positive) values indicate
sign-tracking (as higher-value distractors should induce more errors and slower responses to
the OT than lower-value distractors). See Table A2 (Appendix A) for calculations. Given the
inevitably slower reactions of button-box responses (compared to eye-movement responses),
RTs <150ms were recoded as missing data, as was done in Study 5 (Chapter Six) and as has
been done in previous studies using key press measurements (Le Pelley et al., 2015; Roper et
al., 2014). Given that stimuli were only presented for 1000ms, no upper cut-off was applied.
7.4.2 Functional Magnetic Resonance Imaging: Data Acquisition and Analysis
Acquisition
Magnetic resonance images were acquired using a whole-body 3 Tesla Siemens Trio MRI
imaging system (Siemens, Magnetom, Erlangen, Germany) and an 8-channel head coil. As
required by LiMRIC safety protocol, a localiser scan (14s) followed by clinical T1- and T2-
weighted anatomical scans were acquired. The first, a high-resolution 3-dimensional T1-
weighted image was acquired using a Modified Driven Equilibrium Fourier Transform
(MDEFT) sequence (time to repeat [TR] = 7.92ms; time to echo [TE] = 2.48ms; flip angle =
16°; 176 sagittal slices; slice thickness = 1mm; matrix 256 × 240 × 176; in-plane voxel size
1mm × 1mm × 1mm; total acquisition time: 12:50m). The second, T2-weighted image was
then acquired (24 axial slices; slice thickness = 5mm; 1.5mm spacing; field of view = 220mm;
216
TR = 4000ms; TE = 102ms; voxel size = 0.9mm × 0.9mm × 5mm; flip angle = 150°; total
acquisition time: 1:50m). These scans were not used for research purposes, but were evaluated
by a qualified clinician for medical anomalies or incidental findings that would require further
investigation.
Finally, fMRI was conducted whilst participants completed the ASTT (BB) (37 axial
slices; 7.4mm spacing; field of view = 192mm; TR = 2200ms; TE = 30ms; voxel size = 3mm
× 3mm × 3mm; total acquisition time: 40m). The BOLD (Blood-Oxygen-Level Dependent)
signal is acquired here. Briefly, deoxyhaemoglobin in deoxygenated blood possesses
paramagnetic properties and attenuates MR signal more than oxyhaemoglobin which is
diamagnetic. This difference reflects differential susceptibility to homogenous magnetic fields
that subsequently cause the T2-signal intensity changes which can be recorded. BOLD signal
intensity reflects the surplus of oxygenated blood in a region and thus regional activation
(Kim & Ogawa, 2012).
Analysis
Pre-processing: DICOM (Digital Imaging and Communications in Medicine) data were
converted to the NIfTI (Neuroimaging Informatics Technology Initiative) image format and
stored and organised in Total Commander 64 bit (Ghisler, 2016), before image conversion
and spatial pre-processing of functional resting-state data was performed in SPM12
(Statistical Parametric Mapping, Welcome Trust Centre for Neuroimaging, University
College London, United Kingdom) running in MATLAB R2016a (MathWorks Inc., Natick,
USA, 2016). Functional volumes underwent slice-timing correction, realignment and
unwarping, normalisation to MNI (Montreal Neurological Institute) space using the
217
normalised EPI (Echo Planar Imaging) template image in SPM, and spatial smoothing (5mm
full-width at half maximum Gaussian kernel filter).
First-Level Design: A standard event-related design was employed, therefore trials were
modelled as events rather than epochs (i.e., delta functions, zero duration). The onset times for
high-value trials were input as the first condition, and onset times for low-value trials input as
the second condition. A temporal high-pass filter was applied to the time series with a 128
second cut-off to remove slow signal drifts (confounds) > 128s. A Paired-Samples t-test was
conducted within a general linear model (GLM) to generate a statistical parametric map of the
contrast between high-value versus low-value trials for each participant.
Second-Level Design: Two factorial design specifications were created. The first
contained age and gender as fixed factors, the second contained the same factors but also
included RT Bias as a correlate in a regression. Both GLMs conducted a Paired-Samples t-test
across all participants to elucidate the group-level differences between high-value and low-
value trials based on individual maps. This approach accounts for within- and between-subject
variability (Holmes & Friston, 1998; Penny, Friston, Ashburner, Kiebel, & Nichols, 2006).
7.5 Results
Participant Characteristics
Table 7.1 summarises the sample’s average alcohol use characteristics, while Table 7.2
provides an overview of trait and state measures. Women (30%) binged 4 times p/fortnight,
men either 4 or 14 times p/fortnight (both 20%). Most participants (68.4%) scored ≥8 on the
AUDIT, classing them as at risk drinkers. Self-reports showed that, overall, the participant
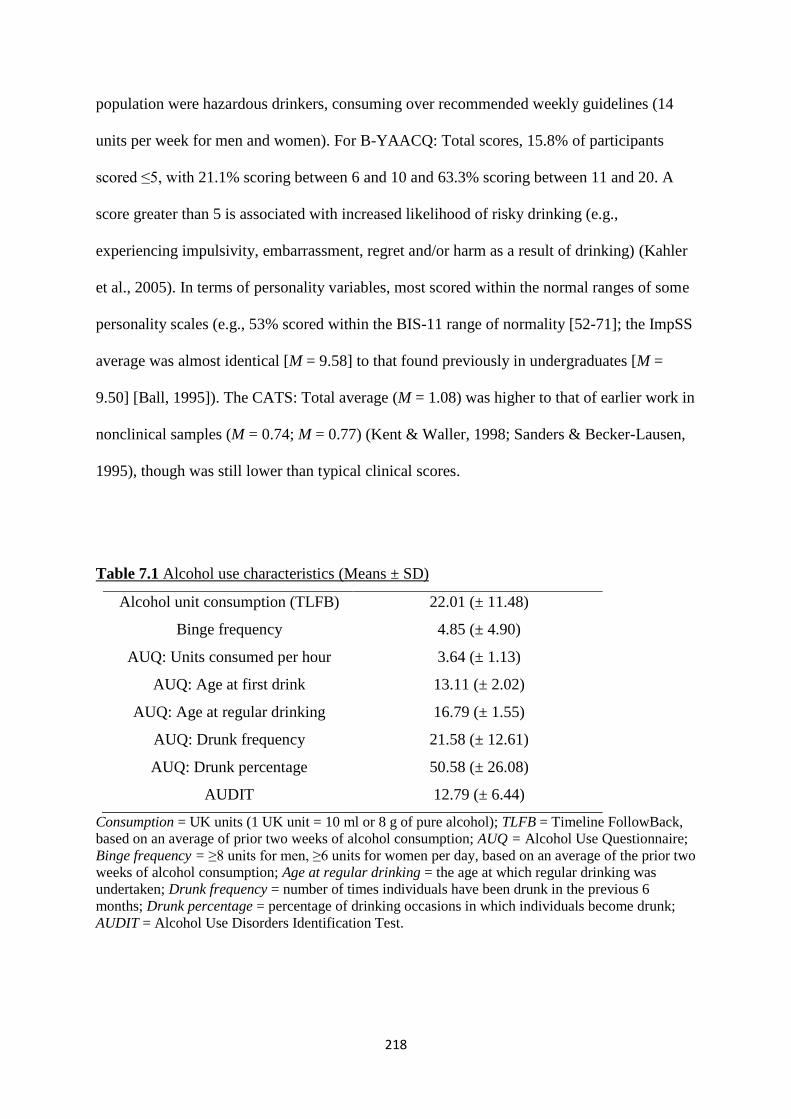
218
population were hazardous drinkers, consuming over recommended weekly guidelines (14
units per week for men and women). For B-YAACQ: Total scores, 15.8% of participants
scored ≤5, with 21.1% scoring between 6 and 10 and 63.3% scoring between 11 and 20. A
score greater than 5 is associated with increased likelihood of risky drinking (e.g.,
experiencing impulsivity, embarrassment, regret and/or harm as a result of drinking) (Kahler
et al., 2005). In terms of personality variables, most scored within the normal ranges of some
personality scales (e.g., 53% scored within the BIS-11 range of normality [52-71]; the ImpSS
average was almost identical [M = 9.58] to that found previously in undergraduates [M =
9.50] [Ball, 1995]). The CATS: Total average (M = 1.08) was higher to that of earlier work in
nonclinical samples (M = 0.74; M = 0.77) (Kent & Waller, 1998; Sanders & Becker-Lausen,
1995), though was still lower than typical clinical scores.
Table 7.1 Alcohol use characteristics (Means ± SD)
Alcohol unit consumption (TLFB) 22.01 (± 11.48)
Binge frequency 4.85 (± 4.90)
AUQ: Units consumed per hour 3.64 (± 1.13)
AUQ: Age at first drink 13.11 (± 2.02)
AUQ: Age at regular drinking 16.79 (± 1.55)
AUQ: Drunk frequency 21.58 (± 12.61)
AUQ: Drunk percentage 50.58 (± 26.08)
AUDIT 12.79 (± 6.44)
Consumption = UK units (1 UK unit = 10 ml or 8 g of pure alcohol); TLFB = Timeline FollowBack,
based on an average of prior two weeks of alcohol consumption; AUQ = Alcohol Use Questionnaire;
Binge frequency = ≥8 units for men, ≥6 units for women per day, based on an average of the prior two
weeks of alcohol consumption; Age at regular drinking = the age at which regular drinking was
undertaken; Drunk frequency = number of times individuals have been drunk in the previous 6
months; Drunk percentage = percentage of drinking occasions in which individuals become drunk;
AUDIT = Alcohol Use Disorders Identification Test.
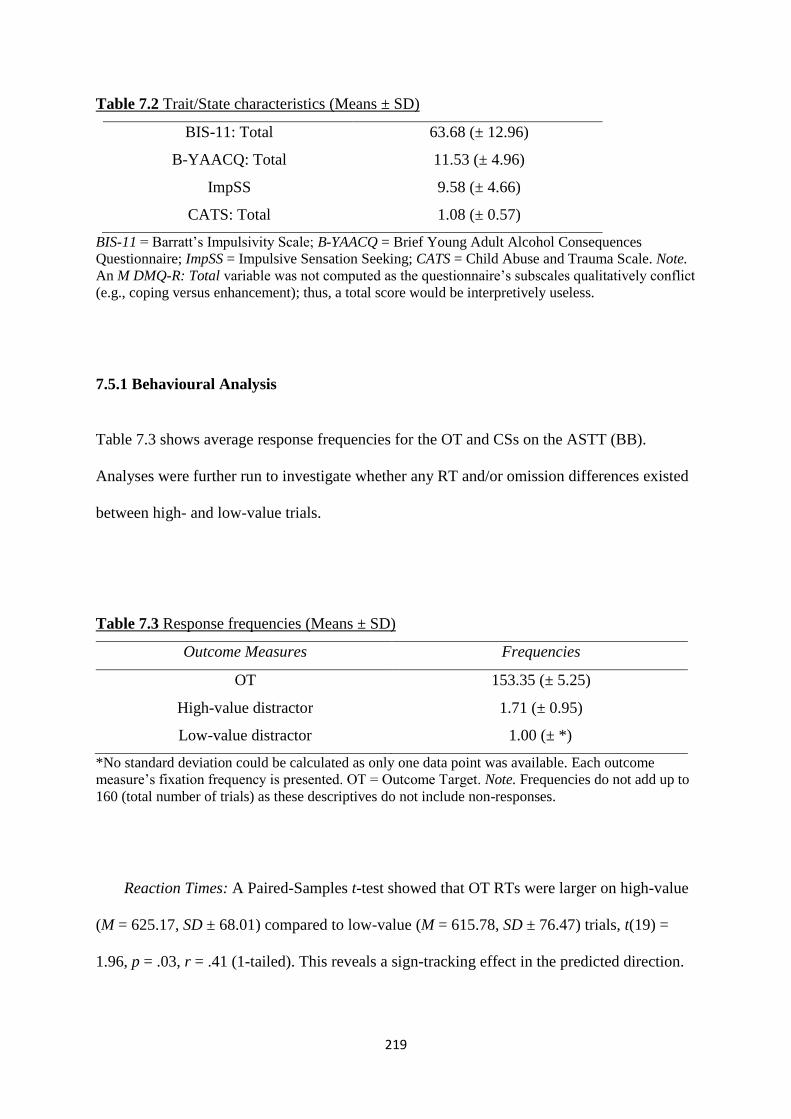
219
Table 7.2 Trait/State characteristics (Means ± SD)
BIS-11: Total 63.68 (± 12.96)
B-YAACQ: Total 11.53 (± 4.96)
ImpSS 9.58 (± 4.66)
CATS: Total 1.08 (± 0.57)
BIS-11 = Barratt’s Impulsivity Scale; B-YAACQ = Brief Young Adult Alcohol Consequences
Questionnaire; ImpSS = Impulsive Sensation Seeking; CATS = Child Abuse and Trauma Scale. Note.
An M DMQ-R: Total variable was not computed as the questionnaire’s subscales qualitatively conflict
(e.g., coping versus enhancement); thus, a total score would be interpretively useless.
7.5.1 Behavioural Analysis
Table 7.3 shows average response frequencies for the OT and CSs on the ASTT (BB).
Analyses were further run to investigate whether any RT and/or omission differences existed
between high- and low-value trials.
Table 7.3 Response frequencies (Means ± SD)
Outcome Measures Frequencies
OT 153.35 (± 5.25)
High-value distractor 1.71 (± 0.95)
Low-value distractor 1.00 (± *)
*No standard deviation could be calculated as only one data point was available. Each outcome
measure’s fixation frequency is presented. OT = Outcome Target. Note. Frequencies do not add up to
160 (total number of trials) as these descriptives do not include non-responses.
Reaction Times: A Paired-Samples t-test showed that OT RTs were larger on high-value
(M = 625.17, SD ± 68.01) compared to low-value (M = 615.78, SD ± 76.47) trials, t(19) =
1.96, p = .03, r = .41 (1-tailed). This reveals a sign-tracking effect in the predicted direction.
220
Omissions: There were not enough valid cases for this analysis to be conducted. This
may have been due to the extended duration of the trials (due to catering for scanning), which
seems likely given that the average reaction time was higher in this study compared to ASTT
(BB) RTs in Study 5 (Chapter Six). This indicates that participants were taking their time,
perhaps due to the novel situation and increased trial times, and thus were less liable to make
mistakes (RT-accuracy trade-off). Therefore, omissions will not be analysed further.
Next, participants’ RT Bias scores as calculated for both their previous (ASTT [EE]) task
completion and their current (fMRI, ASTT [BB]) task completion. Table 7.4 presents both
RT Bias scores and tracking group classifications across both time points. Eight out of twenty
individuals maintained their tracking group status across time points (3 GTs, 3 STs, 2 ITs).
Given the difference in the number of initial GTs (n = 10), STs (n = 6) and ITs (n = 4), this is
more accurately viewed as 30% of GTs remained GTs across time, compared to 50% of STs
and 50% of ITs (though it should also be noted that the scope of the IT classification is much
larger and so maintained classification is de facto more likely).
The test-retest reliability of the RT Bias scores was also statistically investigated. An
intraclass correlation (ICC) estimate was attained using an average measure (k = 2),
consistency type, Two-Way Mixed-Effects model, ICC = .50, p = .07, 95% CI [-0.26, 0.80].
Results indicate poor-to-moderate reliability (Koo & Li, 2016), suggesting that sign-tracking
and goal-tracking were not reliably maintained or reliably measured across studies.
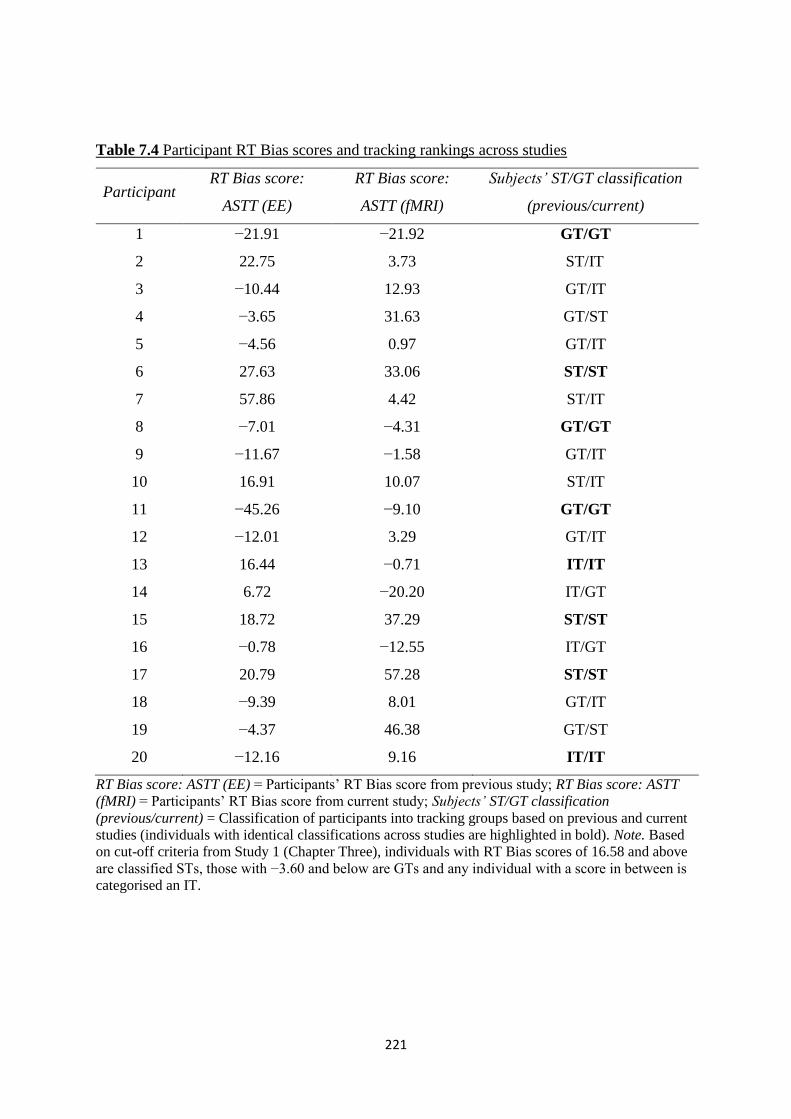
221
Table 7.4 Participant RT Bias scores and tracking rankings across studies
Participant RT Bias score:
ASTT (EE)
RT Bias score:
ASTT (fMRI)
Subjects’ ST/GT classification
(previous/current)
1 −21.91 −21.92 GT/GT
2 22.75 3.73 ST/IT
3 −10.44 12.93 GT/IT
4 −3.65 31.63 GT/ST
5 −4.56 0.97 GT/IT
6 27.63 33.06 ST/ST
7 57.86 4.42 ST/IT
8 −7.01 −4.31 GT/GT
9 −11.67 −1.58 GT/IT
10 16.91 10.07 ST/IT
11 −45.26 −9.10 GT/GT
12 −12.01 3.29 GT/IT
13 16.44 −0.71 IT/IT
14 6.72 −20.20 IT/GT
15 18.72 37.29 ST/ST
16 −0.78 −12.55 IT/GT
17 20.79 57.28 ST/ST
18 −9.39 8.01 GT/IT
19 −4.37 46.38 GT/ST
20 −12.16 9.16 IT/IT
RT Bias score: ASTT (EE) = Participants’ RT Bias score from previous study; RT Bias score: ASTT
(fMRI) = Participants’ RT Bias score from current study; Subjects’ ST/GT classification
(previous/current) = Classification of participants into tracking groups based on previous and current
studies (individuals with identical classifications across studies are highlighted in bold). Note. Based
on cut-off criteria from Study 1 (Chapter Three), individuals with RT Bias scores of 16.58 and above
are classified STs, those with −3.60 and below are GTs and any individual with a score in between is
categorised an IT.
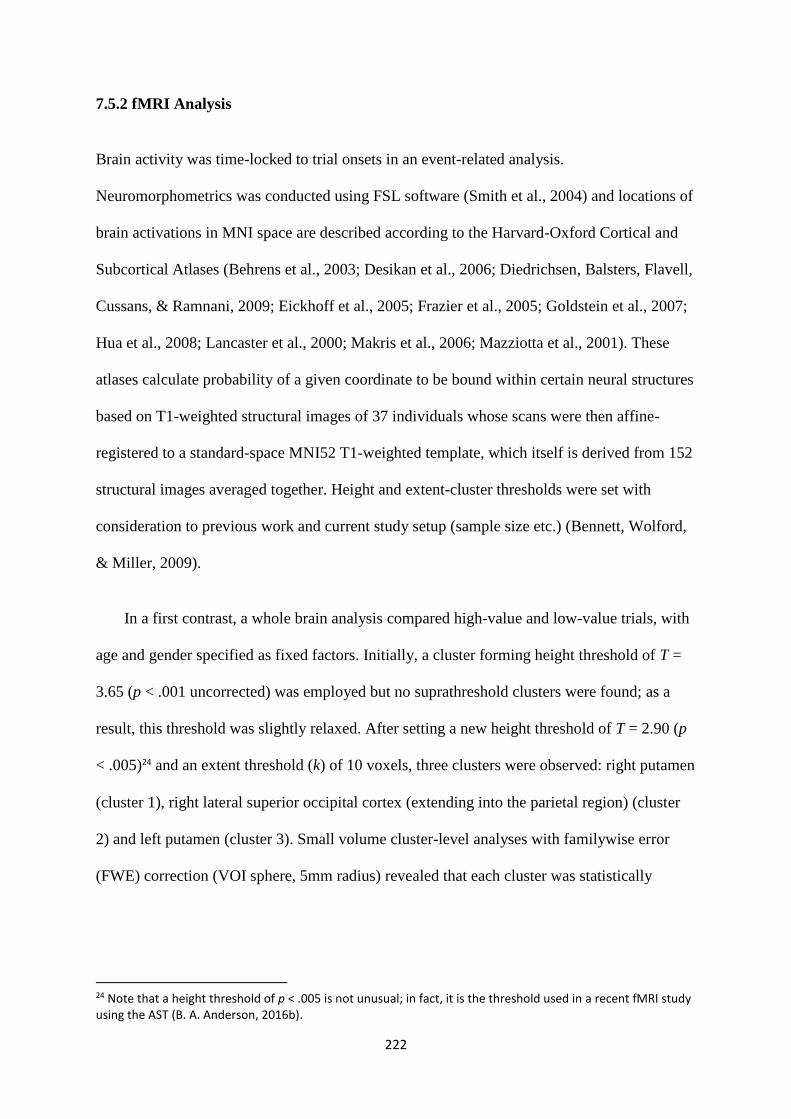
222
7.5.2 fMRI Analysis
Brain activity was time-locked to trial onsets in an event-related analysis.
Neuromorphometrics was conducted using FSL software (Smith et al., 2004) and locations of
brain activations in MNI space are described according to the Harvard-Oxford Cortical and
Subcortical Atlases (Behrens et al., 2003; Desikan et al., 2006; Diedrichsen, Balsters, Flavell,
Cussans, & Ramnani, 2009; Eickhoff et al., 2005; Frazier et al., 2005; Goldstein et al., 2007;
Hua et al., 2008; Lancaster et al., 2000; Makris et al., 2006; Mazziotta et al., 2001). These
atlases calculate probability of a given coordinate to be bound within certain neural structures
based on T1-weighted structural images of 37 individuals whose scans were then affine-
registered to a standard-space MNI52 T1-weighted template, which itself is derived from 152
structural images averaged together. Height and extent-cluster thresholds were set with
consideration to previous work and current study setup (sample size etc.) (Bennett, Wolford,
& Miller, 2009).
In a first contrast, a whole brain analysis compared high-value and low-value trials, with
age and gender specified as fixed factors. Initially, a cluster forming height threshold of T =
3.65 (p < .001 uncorrected) was employed but no suprathreshold clusters were found; as a
result, this threshold was slightly relaxed. After setting a new height threshold of T = 2.90 (p
< .005)24 and an extent threshold (k) of 10 voxels, three clusters were observed: right putamen
(cluster 1), right lateral superior occipital cortex (extending into the parietal region) (cluster
2) and left putamen (cluster 3). Small volume cluster-level analyses with familywise error
(FWE) correction (VOI sphere, 5mm radius) revealed that each cluster was statistically
24 Note that a height threshold of p < .005 is not unusual; in fact, it is the threshold used in a recent fMRI study using the AST (B. A. Anderson, 2016b).

223
significant at a cluster-FWE corrected level of p < .05 (see Table 7.5 and Figures 7.1 and
7.3).
For the second contrast, the difference between high-value and low-value trials was
investigated with age and gender as fixed factors. However, this time ASTT (BB) RT Bias
was also entered into a regression model as a correlate. At a height threshold of T = 3.69 (p <
.001) and an extent threshold (k) of 10 voxels, three clusters were observed: right putamen
(cluster 1), right pallidum and amygdala (cluster 2), and the right superior anterior temporal
gyrus and superior posterior temporal gyrus (cluster 3). Small volume cluster-level analyses
with FWE-error correction (VOI sphere, 5mm radius) revealed that each cluster was
statistically significant at a cluster-FWE corrected level of p < .05 (see Table 7.5 and Figure
7.2).
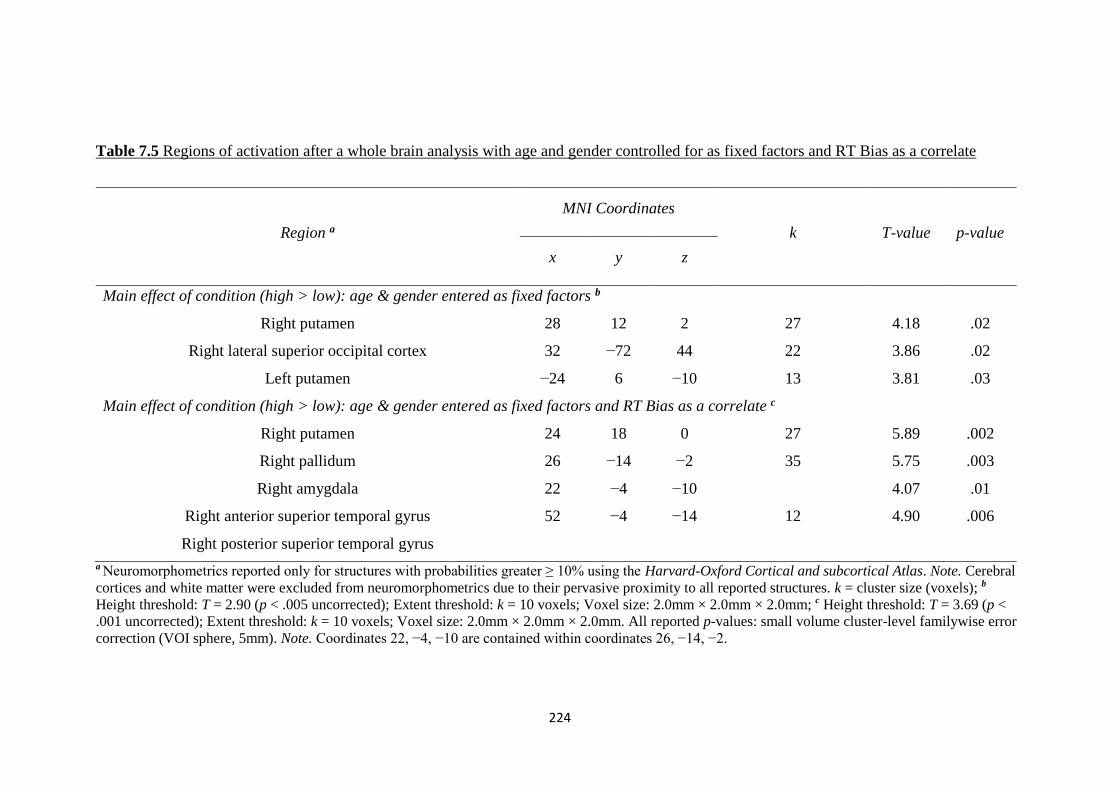
224
Table 7.5 Regions of activation after a whole brain analysis with age and gender controlled for as fixed factors and RT Bias as a correlate
Region a
MNI Coordinates
k T-value p-value
x y z
Main effect of condition (high > low): age & gender entered as fixed factors b
Right putamen 28 12 2 27 4.18 .02
Right lateral superior occipital cortex 32 −72 44 22 3.86 .02
Left putamen −24 6 −10 13 3.81 .03
Main effect of condition (high > low): age & gender entered as fixed factors and RT Bias as a correlate c
Right putamen 24 18 0 27 5.89 .002
Right pallidum 26 −14 −2 35 5.75 .003
Right amygdala 22 −4 −10 4.07 .01
Right anterior superior temporal gyrus 52 −4 −14 12 4.90 .006
Right posterior superior temporal gyrus
a Neuromorphometrics reported only for structures with probabilities greater ≥ 10% using the Harvard-Oxford Cortical and subcortical Atlas. Note. Cerebral
cortices and white matter were excluded from neuromorphometrics due to their pervasive proximity to all reported structures. k = cluster size (voxels); b
Height threshold: T = 2.90 (p < .005 uncorrected); Extent threshold: k = 10 voxels; Voxel size: 2.0mm × 2.0mm × 2.0mm; c Height threshold: T = 3.69 (p <
.001 uncorrected); Extent threshold: k = 10 voxels; Voxel size: 2.0mm × 2.0mm × 2.0mm. All reported p-values: small volume cluster-level familywise error
correction (VOI sphere, 5mm). Note. Coordinates 22, −4, −10 are contained within coordinates 26, −14, −2.
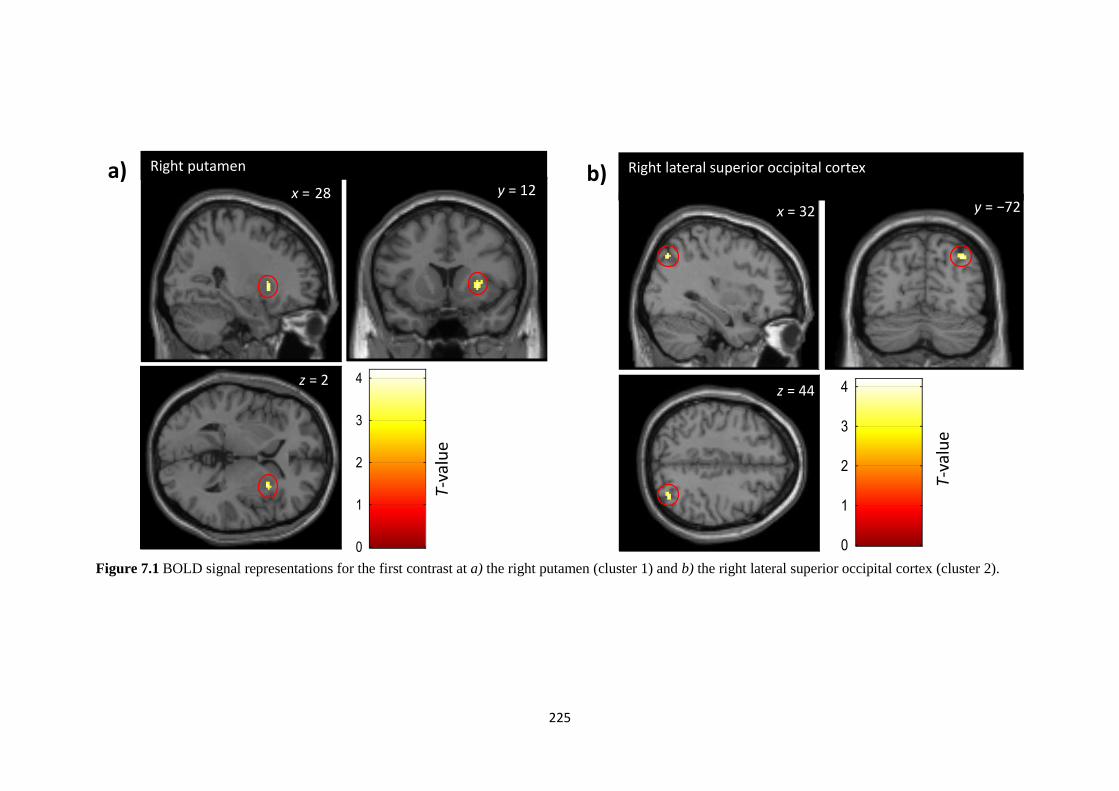
225
Figure 7.1 BOLD signal representations for the first contrast at a) the right putamen (cluster 1) and b) the right lateral superior occipital cortex (cluster 2).
x = 28 y = 12
z = 2
T-va
lue
Right putamen
T-va
lue
x = 32 y = −72
z = 44
Right lateral superior occipital cortex a) b)
226
Figure 7.3 Montage showing axial scans (every two slices) revealing the bilateral putamen activation found in the first contrast.
T-va
lue
Bilateral putamen activation
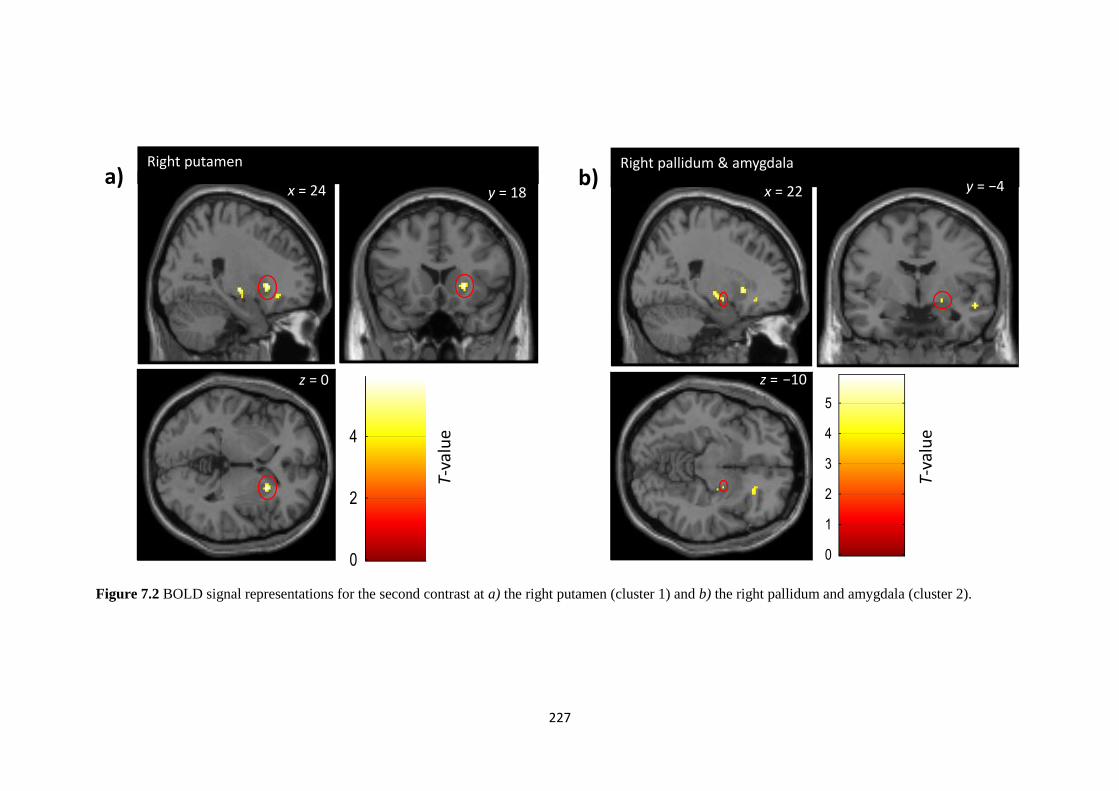
227
Figure 7.2 BOLD signal representations for the second contrast at a) the right putamen (cluster 1) and b) the right pallidum and amygdala (cluster 2).
T-va
lue
x = 24 y = 18
z = 0
Right putamen
T-va
lue
Right pallidum & amygdala
x = 22 y = −4
z = −10
a) b)
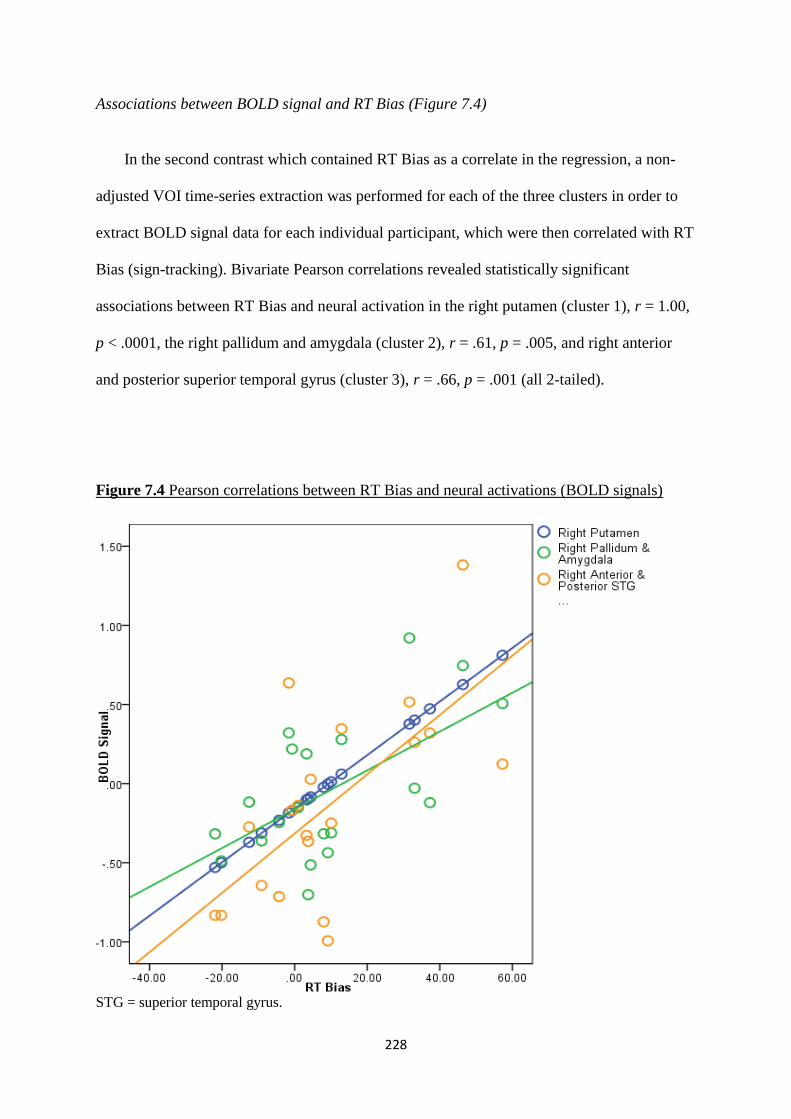
228
Associations between BOLD signal and RT Bias (Figure 7.4)
In the second contrast which contained RT Bias as a correlate in the regression, a non-
adjusted VOI time-series extraction was performed for each of the three clusters in order to
extract BOLD signal data for each individual participant, which were then correlated with RT
Bias (sign-tracking). Bivariate Pearson correlations revealed statistically significant
associations between RT Bias and neural activation in the right putamen (cluster 1), r = 1.00,
p < .0001, the right pallidum and amygdala (cluster 2), r = .61, p = .005, and right anterior
and posterior superior temporal gyrus (cluster 3), r = .66, p = .001 (all 2-tailed).
Figure 7.4 Pearson correlations between RT Bias and neural activations (BOLD signals)
STG = superior temporal gyrus.
229
7.6 Discussion
This study employed an event-related fMRI design in which participants – recruited from
previous studies and classified as either sign-trackers (STs), goal-trackers (GTs) or else were
classed as intermediate trackers (ITs) – completed the ASTT (BB) to measure individual
differences in the attribution of incentive salience to discrete, noncontingent reward cues. The
study aimed to build on previous work showing that value-modulated attentional capture
(VMAC) towards discrete, response-irrelevant cues (sign-tracking) is associated with neural
activation in various brain structures and networks. A secondary aim was to assess the test-
retest reliability of RT Bias scores on the ASTT. Behavioural results revealed a sign-tracking
effect (with slower target responses on high-value versus low-value trials). fMRI analyses
from two separate whole-brain GLMs showed significant BOLD signal activation across a
variety of cortical and subcortical areas, some of which replicate regions identified by
previous research.
This study is only the second in the thesis to use a button-box version of the ASTT.
Unlike the previous one (Study 5, Chapter Six), the current button-box ASTT produced an
observable sign-tracking effect. (Note: The failure of the previous ASTT [BB] was unlikely
due to the task itself; the problem was the general procedure of that particular study.)
However, even though the current ASTT (BB) produced the predicted effect, the effect size it
produced was smaller than has been observed in previous studies25. However, this study’s
effect size is in line with the effect size of the most similar prior study to date with a sample
size of 18 (r = .41 versus r = .56, respectively) (B. A. Anderson, Laurent, et al., 2014). The
25 Even though the effect size is numerically in line with previous effect sizes, this is only because the small sample size in the current study has inflated the estimation (within-subject effect size calculations rely on degrees of freedom, which produce reliably smaller effect size estimates when larger than when smaller). For further discussion of these topics, see (Lakens, 2013; Sellke, Bayarri, & Berger, 2001).
230
lack of omissions in the present study was likely due to the prolonged trial durations
unfortunately no analyses could be conducted with so few data points.
A secondary aim of the current study was to explore, for the first time, whether
individuals’ RT Bias score on the ASTT was robust over a period of time ranging from 1
month to 2 years and, as a result, whether STs and GTs remained in the same classification
over time. Results revealed poor test-retest reliability of RT Bias from the previous to the
current study, with only 30% of GTs remaining GTs, and 50% of STs and IGs remaining STs
ITs, respectively. In terms of which classification individuals transitioned into, of the 12 that
shifted, 50% were GTs who transitioned to ITs, 25% were STs into ITs, 16.66% (two people)
transitioned from GTs to STs and 8.3% (one person) from IT to GT. This can be summarised
as follows: most individuals converted to different tracking groups; of those that maintained
their classification, STs were the most robust (as IT is a much larger and more variable
group). Of those that transitioned, half were GTs shifting into ITs and a quarter STs into the
ITs. Finally, while two individuals transitioned from GTs to STs, the reverse pattern was not
observed. Although any interpretations must be treated with extreme caution due to the small
sample size, this final result (GT → ST) has precedence in the preclinical literature (Srey et
al., 2015). It must also be considered that the poor reliability of sign-tracking may have been
due to different tasks being used (ASTT [EE] vs ASTT [BB]). This reliability was
investigated in the same sample in the same session in Study 5 (Chapter Six); however, as
discussed, no conclusions can be made on the basis of those data.
Moving onto the neuroimaging results, the first GLM contrasting activations across the
whole brain for high-value compared to low-value trials, and controlling for age and gender,
showed bilateral putamen activation and activation of the right lateral superior occipital
cortex. The putamen is associated with implicit and reinforcement learning, behavioural
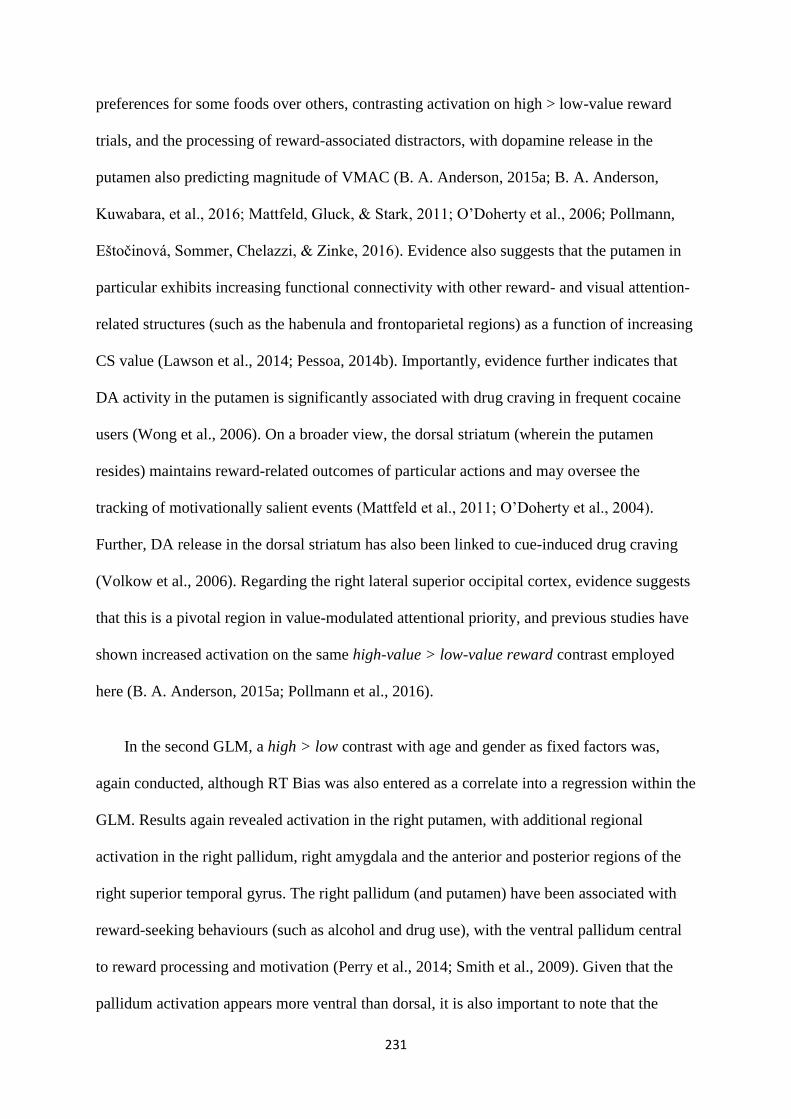
231
preferences for some foods over others, contrasting activation on high > low-value reward
trials, and the processing of reward-associated distractors, with dopamine release in the
putamen also predicting magnitude of VMAC (B. A. Anderson, 2015a; B. A. Anderson,
Kuwabara, et al., 2016; Mattfeld, Gluck, & Stark, 2011; O’Doherty et al., 2006; Pollmann,
Eštočinová, Sommer, Chelazzi, & Zinke, 2016). Evidence also suggests that the putamen in
particular exhibits increasing functional connectivity with other reward- and visual attention-
related structures (such as the habenula and frontoparietal regions) as a function of increasing
CS value (Lawson et al., 2014; Pessoa, 2014b). Importantly, evidence further indicates that
DA activity in the putamen is significantly associated with drug craving in frequent cocaine
users (Wong et al., 2006). On a broader view, the dorsal striatum (wherein the putamen
resides) maintains reward-related outcomes of particular actions and may oversee the
tracking of motivationally salient events (Mattfeld et al., 2011; O’Doherty et al., 2004).
Further, DA release in the dorsal striatum has also been linked to cue-induced drug craving
(Volkow et al., 2006). Regarding the right lateral superior occipital cortex, evidence suggests
that this is a pivotal region in value-modulated attentional priority, and previous studies have
shown increased activation on the same high-value > low-value reward contrast employed
here (B. A. Anderson, 2015a; Pollmann et al., 2016).
In the second GLM, a high > low contrast with age and gender as fixed factors was,
again conducted, although RT Bias was also entered as a correlate into a regression within the
GLM. Results again revealed activation in the right putamen, with additional regional
activation in the right pallidum, right amygdala and the anterior and posterior regions of the
right superior temporal gyrus. The right pallidum (and putamen) have been associated with
reward-seeking behaviours (such as alcohol and drug use), with the ventral pallidum central
to reward processing and motivation (Perry et al., 2014; Smith et al., 2009). Given that the
pallidum activation appears more ventral than dorsal, it is also important to note that the
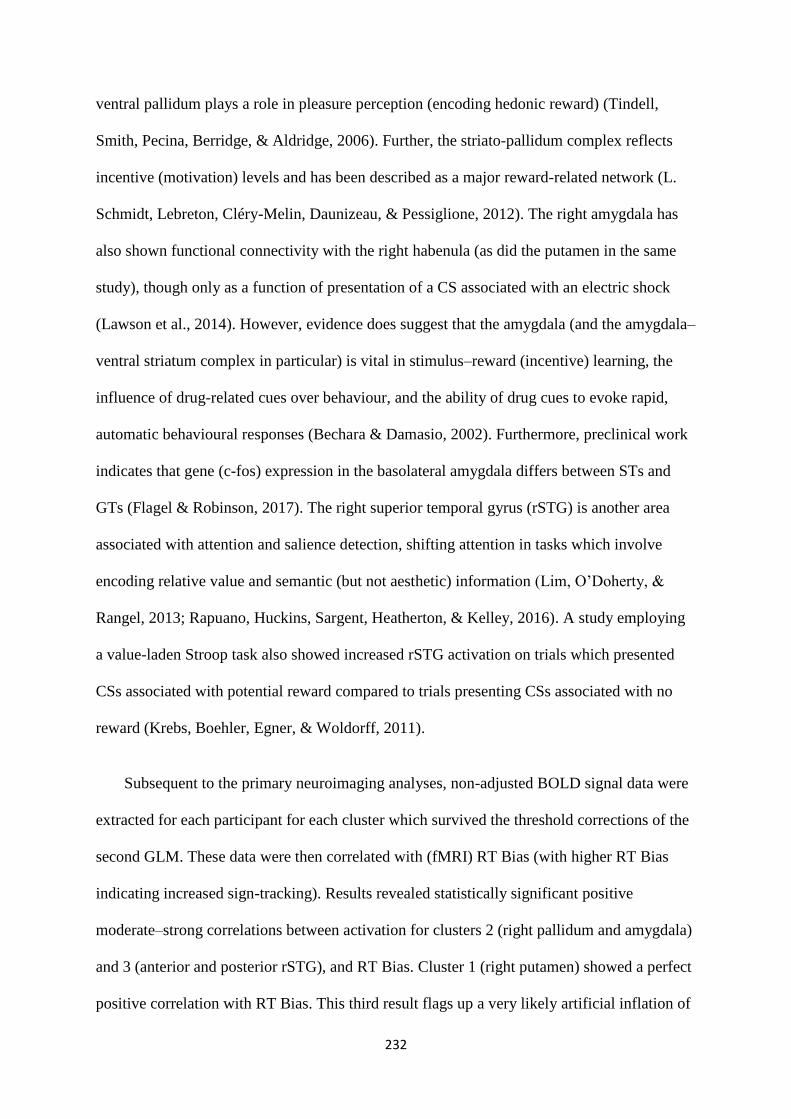
232
ventral pallidum plays a role in pleasure perception (encoding hedonic reward) (Tindell,
Smith, Pecina, Berridge, & Aldridge, 2006). Further, the striato-pallidum complex reflects
incentive (motivation) levels and has been described as a major reward-related network (L.
Schmidt, Lebreton, Cléry-Melin, Daunizeau, & Pessiglione, 2012). The right amygdala has
also shown functional connectivity with the right habenula (as did the putamen in the same
study), though only as a function of presentation of a CS associated with an electric shock
(Lawson et al., 2014). However, evidence does suggest that the amygdala (and the amygdala–
ventral striatum complex in particular) is vital in stimulus–reward (incentive) learning, the
influence of drug-related cues over behaviour, and the ability of drug cues to evoke rapid,
automatic behavioural responses (Bechara & Damasio, 2002). Furthermore, preclinical work
indicates that gene (c-fos) expression in the basolateral amygdala differs between STs and
GTs (Flagel & Robinson, 2017). The right superior temporal gyrus (rSTG) is another area
associated with attention and salience detection, shifting attention in tasks which involve
encoding relative value and semantic (but not aesthetic) information (Lim, O’Doherty, &
Rangel, 2013; Rapuano, Huckins, Sargent, Heatherton, & Kelley, 2016). A study employing
a value-laden Stroop task also showed increased rSTG activation on trials which presented
CSs associated with potential reward compared to trials presenting CSs associated with no
reward (Krebs, Boehler, Egner, & Woldorff, 2011).
Subsequent to the primary neuroimaging analyses, non-adjusted BOLD signal data were
extracted for each participant for each cluster which survived the threshold corrections of the
second GLM. These data were then correlated with (fMRI) RT Bias (with higher RT Bias
indicating increased sign-tracking). Results revealed statistically significant positive
moderate–strong correlations between activation for clusters 2 (right pallidum and amygdala)
and 3 (anterior and posterior rSTG), and RT Bias. Cluster 1 (right putamen) showed a perfect
positive correlation with RT Bias. This third result flags up a very likely artificial inflation of
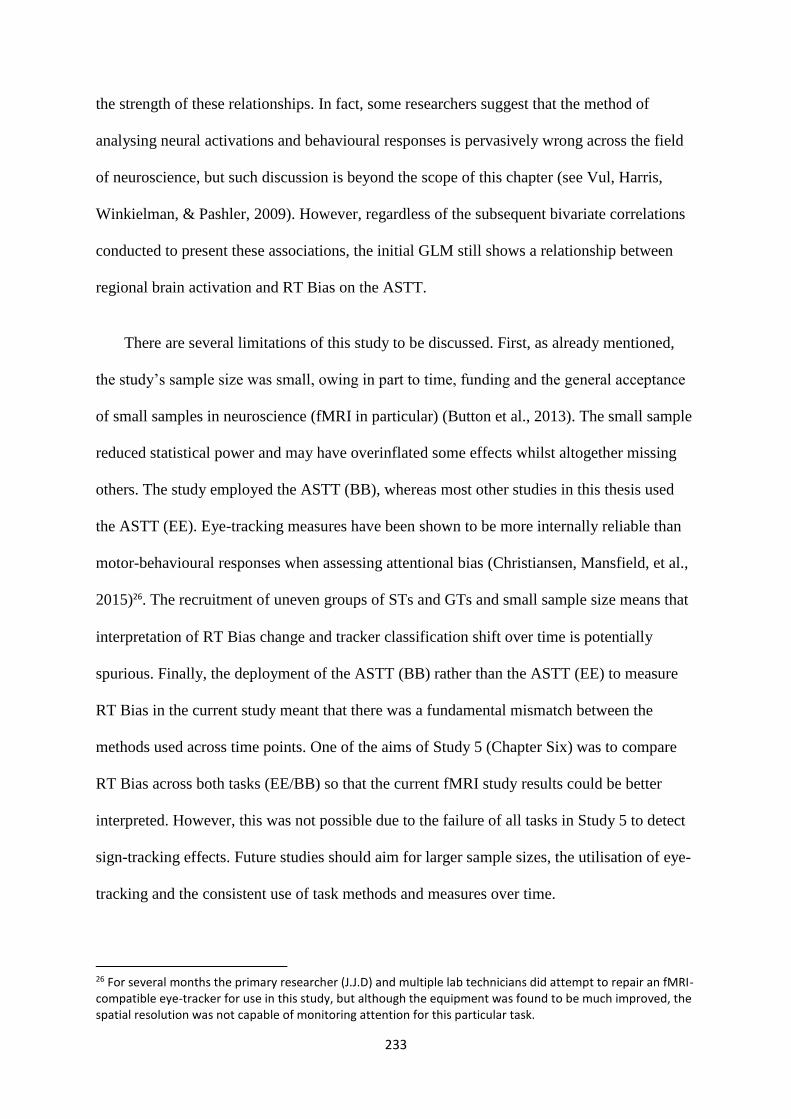
233
the strength of these relationships. In fact, some researchers suggest that the method of
analysing neural activations and behavioural responses is pervasively wrong across the field
of neuroscience, but such discussion is beyond the scope of this chapter (see Vul, Harris,
Winkielman, & Pashler, 2009). However, regardless of the subsequent bivariate correlations
conducted to present these associations, the initial GLM still shows a relationship between
regional brain activation and RT Bias on the ASTT.
There are several limitations of this study to be discussed. First, as already mentioned,
the study’s sample size was small, owing in part to time, funding and the general acceptance
of small samples in neuroscience (fMRI in particular) (Button et al., 2013). The small sample
reduced statistical power and may have overinflated some effects whilst altogether missing
others. The study employed the ASTT (BB), whereas most other studies in this thesis used
the ASTT (EE). Eye-tracking measures have been shown to be more internally reliable than
motor-behavioural responses when assessing attentional bias (Christiansen, Mansfield, et al.,
2015)26. The recruitment of uneven groups of STs and GTs and small sample size means that
interpretation of RT Bias change and tracker classification shift over time is potentially
spurious. Finally, the deployment of the ASTT (BB) rather than the ASTT (EE) to measure
RT Bias in the current study meant that there was a fundamental mismatch between the
methods used across time points. One of the aims of Study 5 (Chapter Six) was to compare
RT Bias across both tasks (EE/BB) so that the current fMRI study results could be better
interpreted. However, this was not possible due to the failure of all tasks in Study 5 to detect
sign-tracking effects. Future studies should aim for larger sample sizes, the utilisation of eye-
tracking and the consistent use of task methods and measures over time.
26 For several months the primary researcher (J.J.D) and multiple lab technicians did attempt to repair an fMRI-compatible eye-tracker for use in this study, but although the equipment was found to be much improved, the spatial resolution was not capable of monitoring attention for this particular task.
234
In conclusion, this study has replicated previous preclinical and human work showing
neural activation in motivation, reward and visual selective attention networks during
completion of a variant of the additional singleton task. Participants’ brain activations in
various regions (such as the putamen and pallidum) was associated with sign-tracking.
Overall, these data add to the growing literature on the neural correlates of human sign-
tracking. However, the study was likely underpowered and possessed core issues in
methodology which makes interpretation of sign-tracking’s longevity difficult.
235
Chapter Eight
Supplementary Analyses
_____________________________________
8.1 Background
This chapter is concerned with assessing and ruling out the effects of obvious confounds in
all of the analyses previously conducted regarding the ASTT. This chapter investigates
whether there are any differences in major outcome variables between I) participants who
believed that they would gain additional rewards and those who did not (deception), II)
gender, and III) attentional bias towards the red versus blue stimuli (CSs), regardless of value
(red vs. blue). All analyses are 2-tailed.
8.2 Study 1 (Chapter Three)
The following analyses concern Study 1, in which a large sample of participants (N = 98)
completed the ASTT (the Multi-Target Tracking Task is not included due to null results). No
differences were found between believers vs. nonbelievers or males vs. females. However,
there were more omissions on blue trials compared to red, regardless of value (Table 8.1).
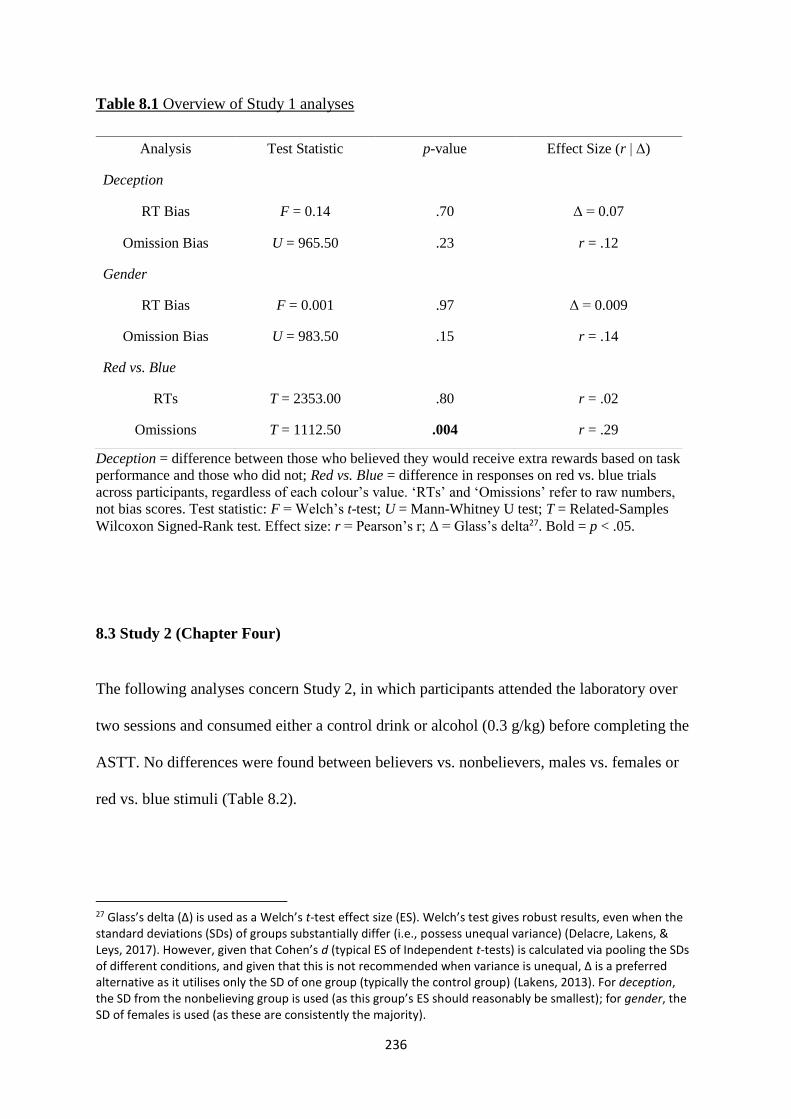
236
Table 8.1 Overview of Study 1 analyses
Deception = difference between those who believed they would receive extra rewards based on task
performance and those who did not; Red vs. Blue = difference in responses on red vs. blue trials
across participants, regardless of each colour’s value. ‘RTs’ and ‘Omissions’ refer to raw numbers,
not bias scores. Test statistic: F = Welch’s t-test; U = Mann-Whitney U test; T = Related-Samples
Wilcoxon Signed-Rank test. Effect size: r = Pearson’s r; Δ = Glass’s delta27. Bold = p < .05.
8.3 Study 2 (Chapter Four)
The following analyses concern Study 2, in which participants attended the laboratory over
two sessions and consumed either a control drink or alcohol (0.3 g/kg) before completing the
ASTT. No differences were found between believers vs. nonbelievers, males vs. females or
red vs. blue stimuli (Table 8.2).
27 Glass’s delta (Δ) is used as a Welch’s t-test effect size (ES). Welch’s test gives robust results, even when the standard deviations (SDs) of groups substantially differ (i.e., possess unequal variance) (Delacre, Lakens, & Leys, 2017). However, given that Cohen’s d (typical ES of Independent t-tests) is calculated via pooling the SDs of different conditions, and given that this is not recommended when variance is unequal, Δ is a preferred alternative as it utilises only the SD of one group (typically the control group) (Lakens, 2013). For deception, the SD from the nonbelieving group is used (as this group’s ES should reasonably be smallest); for gender, the SD of females is used (as these are consistently the majority).
Analysis Test Statistic p-value Effect Size (r | Δ)
Deception
RT Bias F = 0.14 .70 Δ = 0.07
Omission Bias U = 965.50 .23 r = .12
Gender
RT Bias F = 0.001 .97 Δ = 0.009
Omission Bias U = 983.50 .15 r = .14
Red vs. Blue
RTs T = 2353.00 .80 r = .02
Omissions T = 1112.50 .004 r = .29
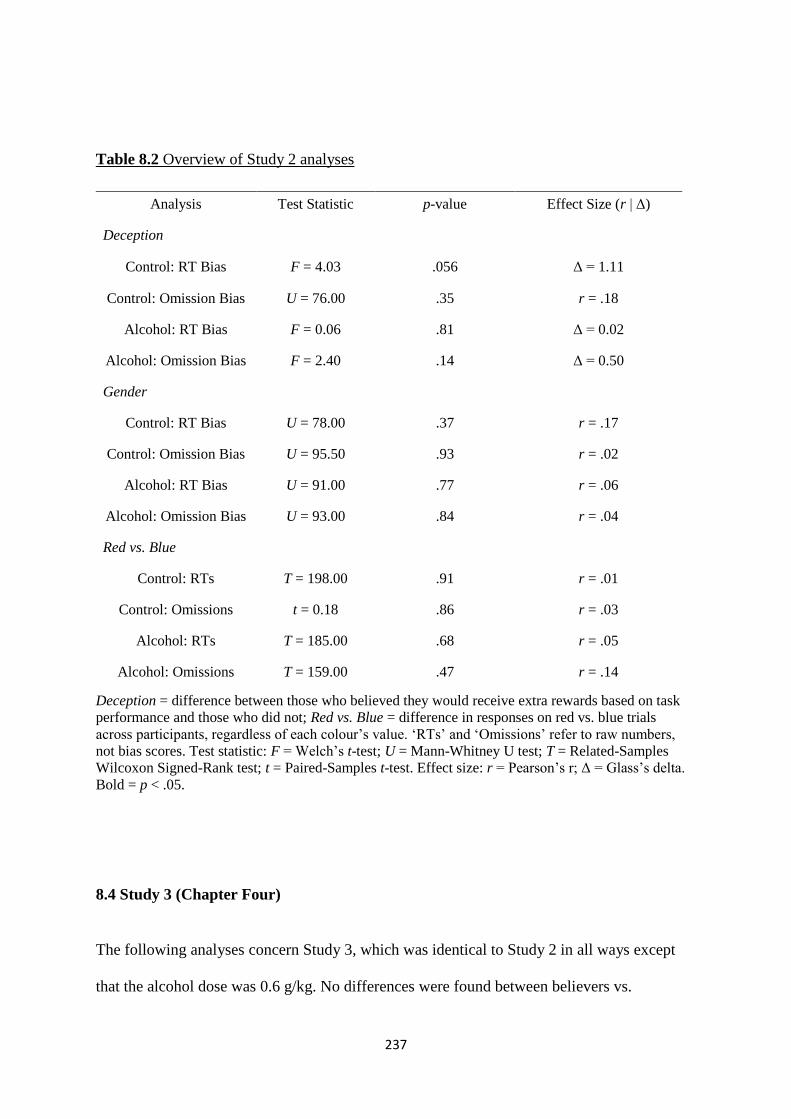
237
Table 8.2 Overview of Study 2 analyses
Deception = difference between those who believed they would receive extra rewards based on task
performance and those who did not; Red vs. Blue = difference in responses on red vs. blue trials
across participants, regardless of each colour’s value. ‘RTs’ and ‘Omissions’ refer to raw numbers,
not bias scores. Test statistic: F = Welch’s t-test; U = Mann-Whitney U test; T = Related-Samples
Wilcoxon Signed-Rank test; t = Paired-Samples t-test. Effect size: r = Pearson’s r; Δ = Glass’s delta.
Bold = p < .05.
8.4 Study 3 (Chapter Four)
The following analyses concern Study 3, which was identical to Study 2 in all ways except
that the alcohol dose was 0.6 g/kg. No differences were found between believers vs.
Analysis Test Statistic p-value Effect Size (r | Δ)
Deception
Control: RT Bias F = 4.03 .056 Δ = 1.11
Control: Omission Bias U = 76.00 .35 r = .18
Alcohol: RT Bias F = 0.06 .81 Δ = 0.02
Alcohol: Omission Bias F = 2.40 .14 Δ = 0.50
Gender
Control: RT Bias U = 78.00 .37 r = .17
Control: Omission Bias U = 95.50 .93 r = .02
Alcohol: RT Bias U = 91.00 .77 r = .06
Alcohol: Omission Bias U = 93.00 .84 r = .04
Red vs. Blue
Control: RTs T = 198.00 .91 r = .01
Control: Omissions t = 0.18 .86 r = .03
Alcohol: RTs T = 185.00 .68 r = .05
Alcohol: Omissions T = 159.00 .47 r = .14

238
nonbelievers. However, females showed higher RT Bias in the alcohol condition compared to
males, and there were more omissions on blue trials compared to red in the alcohol condition
(Table 8.3).
Table 8.3 Overview of Study 3 analyses
Deception = difference between those who believed they would receive extra rewards based on task
performance and those who did not; Red vs. Blue = difference in responses on red vs. blue trials
across participants, regardless of each colour’s value. ‘RTs’ and ‘Omissions’ refer to raw numbers,
not bias scores. Test statistic: F = Welch’s t-test; U = Mann-Whitney U test; T = Related-Samples
Wilcoxon Signed-Rank test; t = Paired-Samples t-test. Effect size: r = Pearson’s r; Δ = Glass’s delta.
Bold = p < .05.
Analysis Test Statistic p-value Effect Size (r | Δ)
Deception
Control: RT Bias U = 109.00 .89 r = .03
Control: Omission Bias U = 89.50 .34 r = .18
Alcohol: RT Bias U = 97.00 .52 r = .12
Alcohol: Omission Bias F = 0.46 .502 Δ = 0.25
Gender
Control: RT Bias U = 99.00 .70 r = .10
Control: Omission Bias U = 94.50 .57 r = .10
Alcohol: RT Bias U = 59.00 .04 r = .38
Alcohol: Omission Bias U = 85.00 .33 r = .18
Red vs. Blue
Control: RTs T = 231.00 .98 r = .004
Control: Omissions t = .0.04 .97 r = .008
Alcohol: RTs T = 212.00 .67 r = .05
Alcohol: Omissions t = .2.31 .03 r = .39
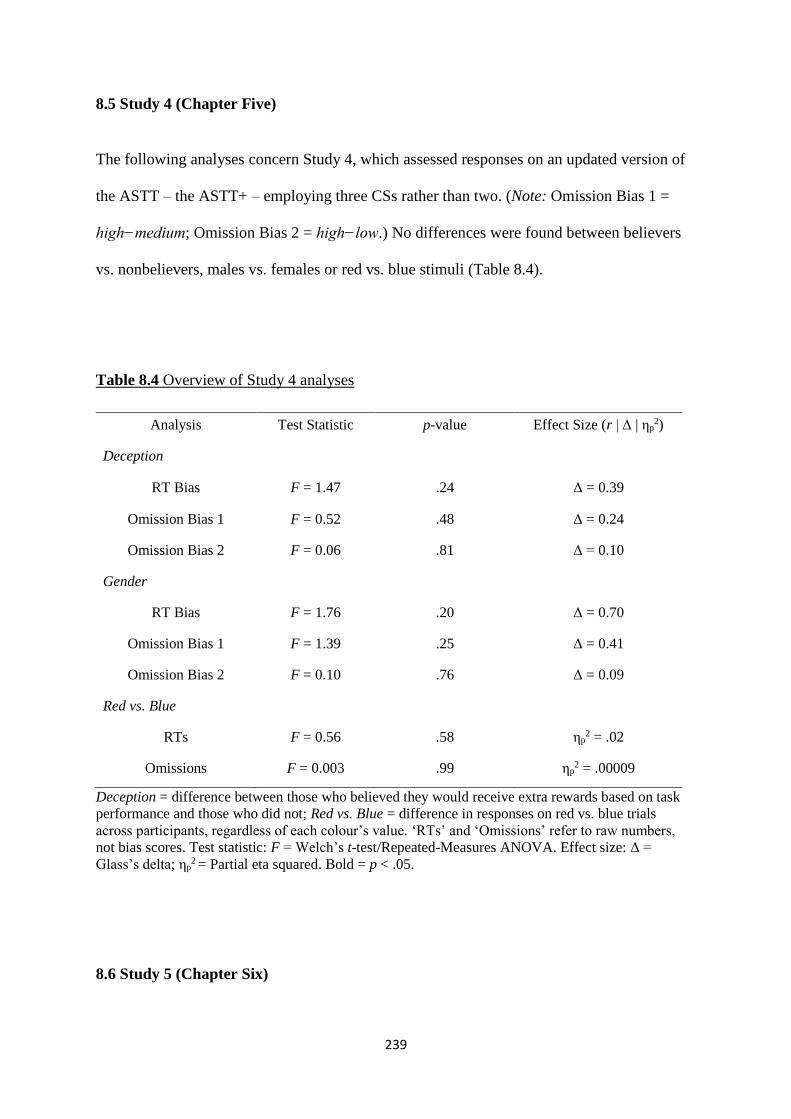
239
8.5 Study 4 (Chapter Five)
The following analyses concern Study 4, which assessed responses on an updated version of
the ASTT – the ASTT+ – employing three CSs rather than two. (Note: Omission Bias 1 =
high−medium; Omission Bias 2 = high−low.) No differences were found between believers
vs. nonbelievers, males vs. females or red vs. blue stimuli (Table 8.4).
Table 8.4 Overview of Study 4 analyses
Deception = difference between those who believed they would receive extra rewards based on task
performance and those who did not; Red vs. Blue = difference in responses on red vs. blue trials
across participants, regardless of each colour’s value. ‘RTs’ and ‘Omissions’ refer to raw numbers,
not bias scores. Test statistic: F = Welch’s t-test/Repeated-Measures ANOVA. Effect size: Δ =
Glass’s delta; ηp2 = Partial eta squared. Bold = p < .05.
8.6 Study 5 (Chapter Six)
Analysis Test Statistic p-value Effect Size (r | Δ | ηp2)
Deception
RT Bias F = 1.47 .24 Δ = 0.39
Omission Bias 1 F = 0.52 .48 Δ = 0.24
Omission Bias 2 F = 0.06 .81 Δ = 0.10
Gender
RT Bias F = 1.76 .20 Δ = 0.70
Omission Bias 1 F = 1.39 .25 Δ = 0.41
Omission Bias 2 F = 0.10 .76 Δ = 0.09
Red vs. Blue
RTs F = 0.56 .58 ηp2 = .02
Omissions F = 0.003 .99 ηp2 = .00009
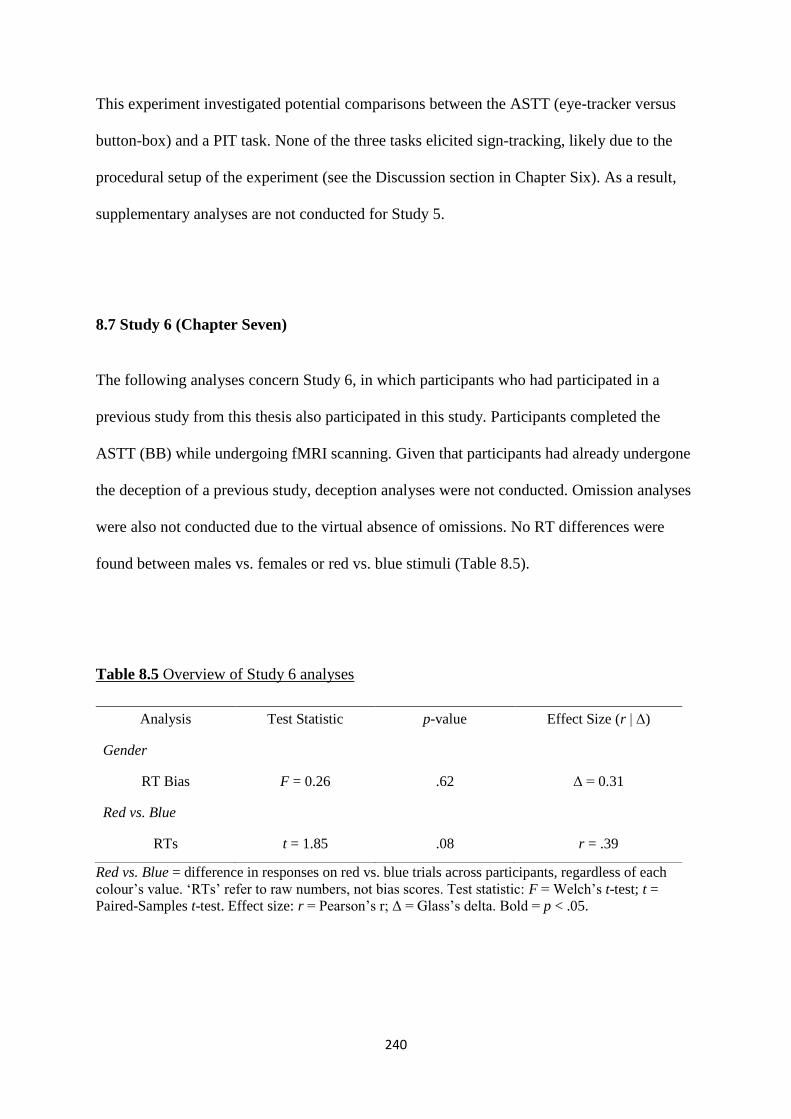
240
This experiment investigated potential comparisons between the ASTT (eye-tracker versus
button-box) and a PIT task. None of the three tasks elicited sign-tracking, likely due to the
procedural setup of the experiment (see the Discussion section in Chapter Six). As a result,
supplementary analyses are not conducted for Study 5.
8.7 Study 6 (Chapter Seven)
The following analyses concern Study 6, in which participants who had participated in a
previous study from this thesis also participated in this study. Participants completed the
ASTT (BB) while undergoing fMRI scanning. Given that participants had already undergone
the deception of a previous study, deception analyses were not conducted. Omission analyses
were also not conducted due to the virtual absence of omissions. No RT differences were
found between males vs. females or red vs. blue stimuli (Table 8.5).
Table 8.5 Overview of Study 6 analyses
Red vs. Blue = difference in responses on red vs. blue trials across participants, regardless of each
colour’s value. ‘RTs’ refer to raw numbers, not bias scores. Test statistic: F = Welch’s t-test; t =
Paired-Samples t-test. Effect size: r = Pearson’s r; Δ = Glass’s delta. Bold = p < .05.
Analysis Test Statistic p-value Effect Size (r | Δ)
Gender
RT Bias F = 0.26 .62 Δ = 0.31
Red vs. Blue
RTs t = 1.85 .08 r = .39
241
8.8 Conclusions
Overall conclusions for each analysis type are given below.
Deception: No study showed differences in either RT Bias or Omission Bias between
those who believed they would receive extra rewards and those who did not. This suggests
that belief in reward does not influence sign-tracking. This result is supported by a previous
AST study which showed that participants displayed VMAC towards money that they knew
they would not receive (i.e., they knew that their performance would not grant them extra
rewards) (Roper & Vecera, 2016). This evidence is the first, however, to explicitly investigate
this potential confound in the sign-tracking literature.
Gender: Studies 1, 2, 4 and 6 showed no gender differences in either RT Bias or
Omission Bias. Study 3 revealed higher RT Bias among women in the alcohol session
compared to men, which supports a preclinical study showing that female rats exhibit elevated
sign-tracking in an alcohol autoshaping paradigm (Madayag et al., 2017). However, overall
there appears to be little evidence of a gender effect on sign-tracking.
Red vs. Blue: Across studies 1, 2, 3, 4 and 6, there was no difference in OT RTs between
trials containing red or blue (or green) distractors, regardless of value. However, studies 1 and
3 did show greater omissions on blue trials compared to red (only in the alcohol condition in
Study 3). The results suggests that sign-tracking RT effects were not significantly impacted
by distractors’ physical salience, although sign-tracking as measured by omissions may be
more vulnerable to the impact of a stimulus’s perceptual properties.
242
Chapter Nine
Examination of the ASTT
_____________________________________
9.1 Background
This chapter is concerned with assessing the validity of the ASTT’s measures, as well as
replicating specific sign-tracking results found in the human literature. Regarding the
replications, two predictions were made: I) reaction times (RTs) towards conditioned stimuli
(CSs) will be faster than RTs towards outcome targets (OTs), indicating that CS RTs are
produced by automatic, exogenous saccades (Failing et al., 2015), and OT RTs by conscious,
endogenous attentional orienting (Theeuwes, 2010), and II) that differently valued CSs will
pull with the same ‘force’, as indicated by no statistical difference between CS RTs (Le Pelley
et al., 2015). To assess the validity of ASTT measures, – specifically, whether RT and
Omission Biases are broadly measuring sign-tracking – correlations between the two
measures were conducted28. Note: analyses for CS RTs vs. OT RTs are 1-tailed, while high-
value CS RTs vs. low-value CS RTs (directionless prediction) and RT Bias-Omission Bias
correlations (exploratory) are 2-tailed.
28 Ideally, Bland-Altman plots would be performed to assess agreement between the two measures (Bland & Altman, 1986). However, bias scores are already difference scores of measures of completely different scales (RTs vs error frequency), the data of which would further need to be transformed before analysis. Multiple levels of difference score creation and data transformation may result in even less interpretable results than standard correlation coefficients.
243
9.2 Study 1 (Chapter Three)
This experiment used a large sample (N = 98) to assess responses on the ASTT.
CS vs. OT: A Wilcoxon Signed-Rank test revealed that RTs to CSs (Mdn = 290.23, range
= 91.00-471.00) were quicker than RTs to the OT (Mdn = 351.25, range = 293.20-518.39), T
= 253.00, p < .0001, r = 0.78. This suggests CS RTs are automatic.
High-value CS vs. Low-value CS: When omissions occurred, there was no difference in
RTs towards different CSs – indicating similar pull of ‘force’ (Le Pelley et al., 2015). That is,
both low- (Mdn = 288.20, range = 140.00-469.00) and high-value (Mdn = 285.00, range =
91.00-474.33) CSs produced omissions of similar speeds, T = 1493.00, p = .97.
Reaction Time & Omission Biases: Bias scores showed a moderate positive correlation, rs
= .47, p < .0001 (see Figure 9.1). When only sign-trackers and goal-trackers were taken into
account (i.e., individuals in the top and bottom 25% of RT Bias scores), bias scores showed
an even stronger positive correlation than was found in the general sample, rs = .56, p < .0001
(see Figure 9.2). These data lend support to the hypothesis that these scores broadly reflect
sign-tracking measurements.

244
Figure 9.1 Scatterplot showing a positive correlation between bias scores for the ASTT
Blue lines depict mean confidence intervals (95%).

245
Figure 9.2 Scatterplot showing a positive correlation between bias scores in a sample
containing only sign-trackers and goal-trackers
Blue lines depict mean confidence intervals (95%).
9.3 Study 2 (Chapter Four)
This experiment contained two testing sessions with the ASTT, once after the participant had
been given a low dose of alcohol (0.3 g/kg) and once after they had been given lemonade
(control).
CS vs. OT: A Friedman’s ANOVA revealed statistically significant differences in
latencies between correct and incorrect responses (OT vs. CS responses, respectively), χ2(3) =
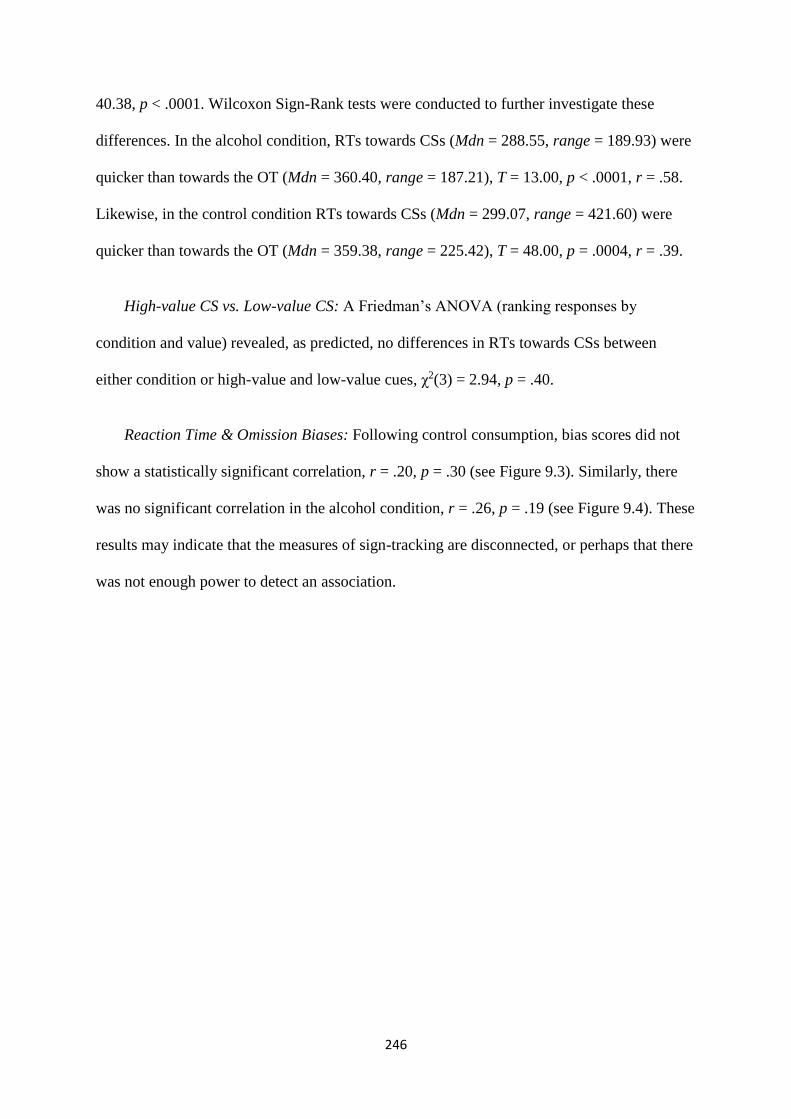
246
40.38, p < .0001. Wilcoxon Sign-Rank tests were conducted to further investigate these
differences. In the alcohol condition, RTs towards CSs (Mdn = 288.55, range = 189.93) were
quicker than towards the OT (Mdn = 360.40, range = 187.21), T = 13.00, p < .0001, r = .58.
Likewise, in the control condition RTs towards CSs (Mdn = 299.07, range = 421.60) were
quicker than towards the OT (Mdn = 359.38, range = 225.42), T = 48.00, p = .0004, r = .39.
High-value CS vs. Low-value CS: A Friedman’s ANOVA (ranking responses by
condition and value) revealed, as predicted, no differences in RTs towards CSs between
either condition or high-value and low-value cues, χ2(3) = 2.94, p = .40.
Reaction Time & Omission Biases: Following control consumption, bias scores did not
show a statistically significant correlation, r = .20, p = .30 (see Figure 9.3). Similarly, there
was no significant correlation in the alcohol condition, r = .26, p = .19 (see Figure 9.4). These
results may indicate that the measures of sign-tracking are disconnected, or perhaps that there
was not enough power to detect an association.

247
Figure 9.3 Scatterplot showing a nonsignificant correlation between bias scores (control
condition)
Blue lines depict mean confidence intervals (95%).
248
Figure 9.4 Scatterplot showing a nonsignificant correlation between bias scores (alcohol
condition)
Blue lines depict mean confidence intervals (95%).
9.4 Study 3 (Chapter Four)
This experiment was identical to Study 2 (above), except that the alcohol dose given to
participants was 0.6 g/kg.
CS vs. OT: A 2 (alcohol vs control) × 2 (OT RT vs CS RT) Repeated-Measures ANOVA
revealed a main effect of condition, F(1, 29) = 7.98, p = .008, ηp2 = .22, with RTs in the
alcohol condition (M = 351.57, SD ± 66.70) slower than in the control condition (M = 329.66,
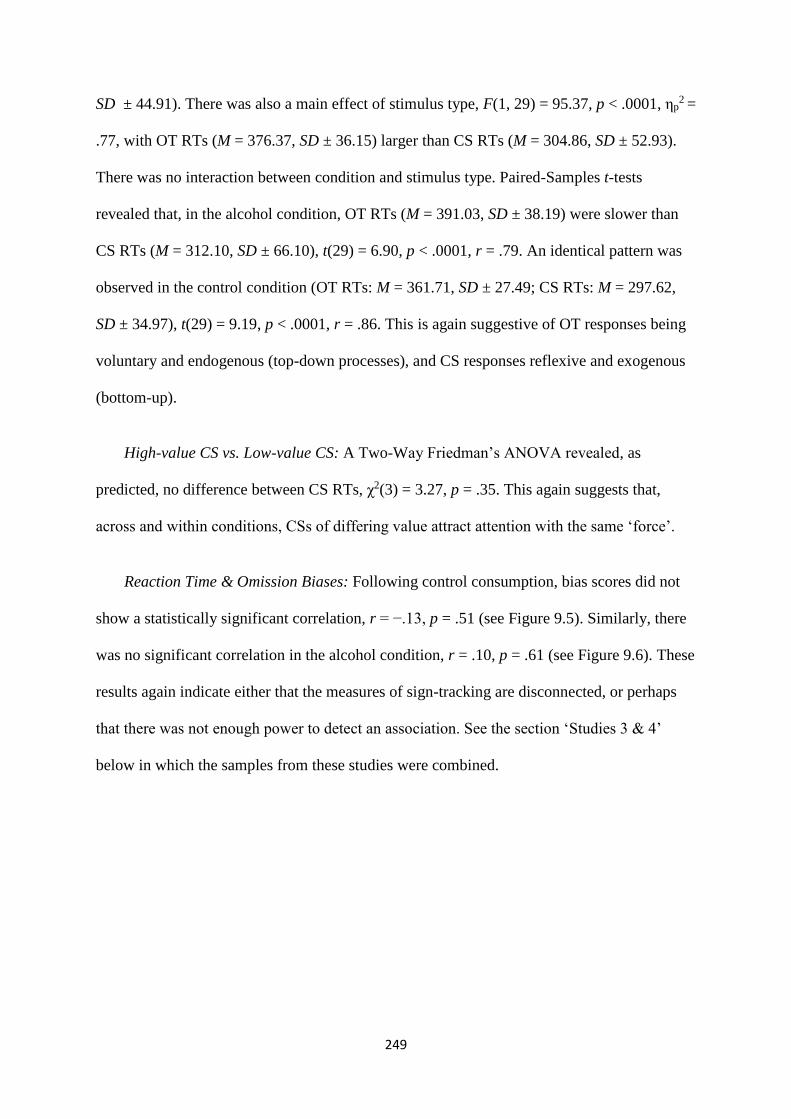
249
SD ± 44.91). There was also a main effect of stimulus type, F(1, 29) = 95.37, p < .0001, ηp2 =
.77, with OT RTs (M = 376.37, SD ± 36.15) larger than CS RTs (M = 304.86, SD ± 52.93).
There was no interaction between condition and stimulus type. Paired-Samples t-tests
revealed that, in the alcohol condition, OT RTs (M = 391.03, SD ± 38.19) were slower than
CS RTs (M = 312.10, SD ± 66.10), t(29) = 6.90, p < .0001, r = .79. An identical pattern was
observed in the control condition (OT RTs: M = 361.71, SD ± 27.49; CS RTs: M = 297.62,
SD ± 34.97), t(29) = 9.19, p < .0001, r = .86. This is again suggestive of OT responses being
voluntary and endogenous (top-down processes), and CS responses reflexive and exogenous
(bottom-up).
High-value CS vs. Low-value CS: A Two-Way Friedman’s ANOVA revealed, as
predicted, no difference between CS RTs, χ2(3) = 3.27, p = .35. This again suggests that,
across and within conditions, CSs of differing value attract attention with the same ‘force’.
Reaction Time & Omission Biases: Following control consumption, bias scores did not
show a statistically significant correlation, r = −.13, p = .51 (see Figure 9.5). Similarly, there
was no significant correlation in the alcohol condition, r = .10, p = .61 (see Figure 9.6). These
results again indicate either that the measures of sign-tracking are disconnected, or perhaps
that there was not enough power to detect an association. See the section ‘Studies 3 & 4’
below in which the samples from these studies were combined.
250
Figure 9.5 Scatterplot showing a nonsignificant correlation between bias scores (control
condition)
Blue lines depict mean confidence intervals (95%).
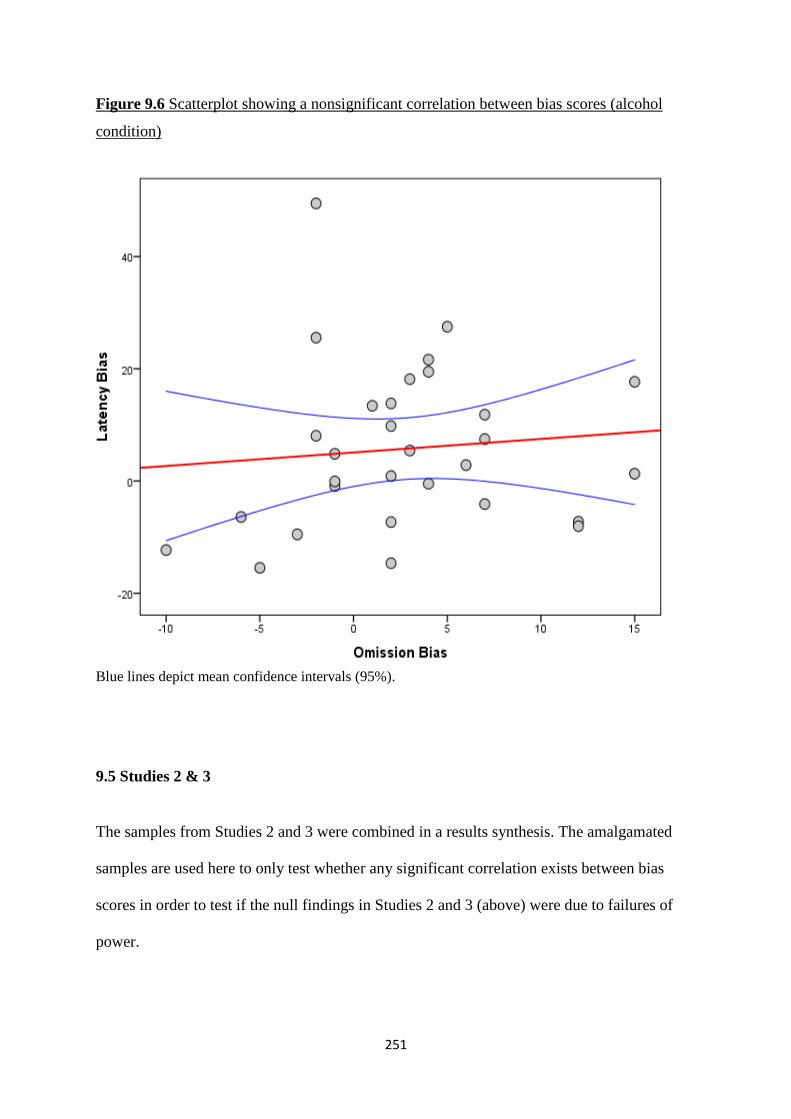
251
Figure 9.6 Scatterplot showing a nonsignificant correlation between bias scores (alcohol
condition)
Blue lines depict mean confidence intervals (95%).
9.5 Studies 2 & 3
The samples from Studies 2 and 3 were combined in a results synthesis. The amalgamated
samples are used here to only test whether any significant correlation exists between bias
scores in order to test if the null findings in Studies 2 and 3 (above) were due to failures of
power.
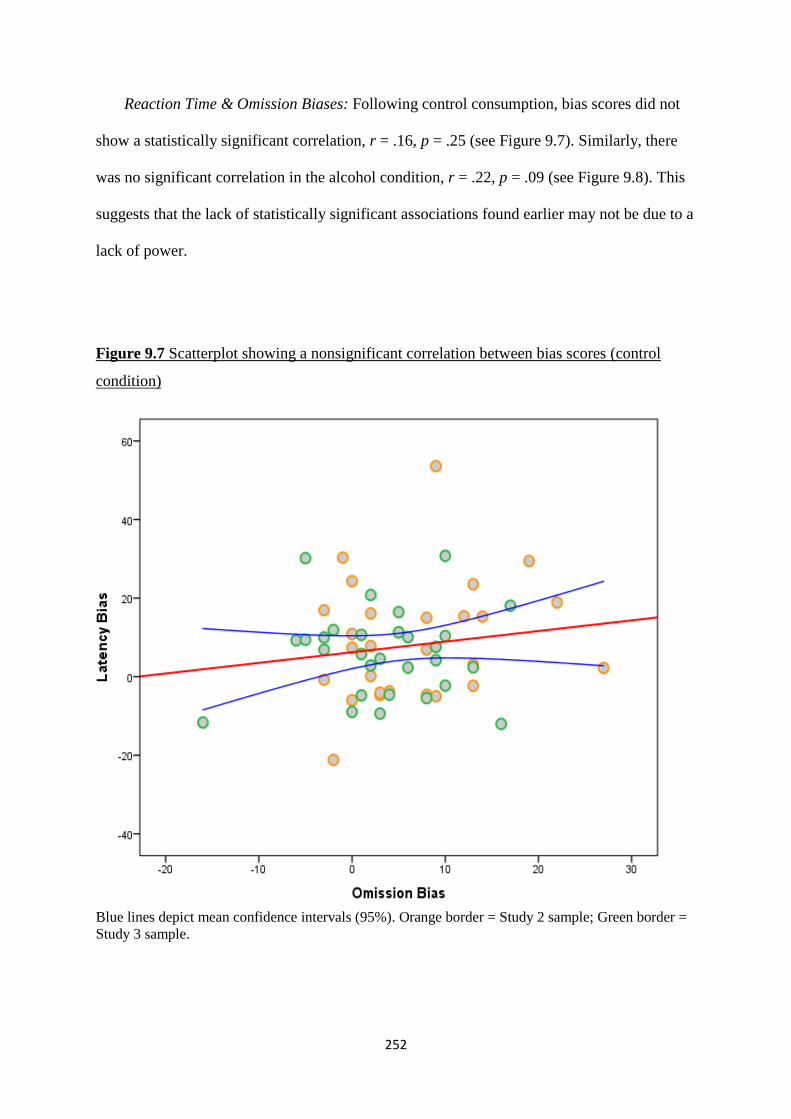
252
Reaction Time & Omission Biases: Following control consumption, bias scores did not
show a statistically significant correlation, r = .16, p = .25 (see Figure 9.7). Similarly, there
was no significant correlation in the alcohol condition, r = .22, p = .09 (see Figure 9.8). This
suggests that the lack of statistically significant associations found earlier may not be due to a
lack of power.
Figure 9.7 Scatterplot showing a nonsignificant correlation between bias scores (control
condition)
Blue lines depict mean confidence intervals (95%). Orange border = Study 2 sample; Green border =
Study 3 sample.
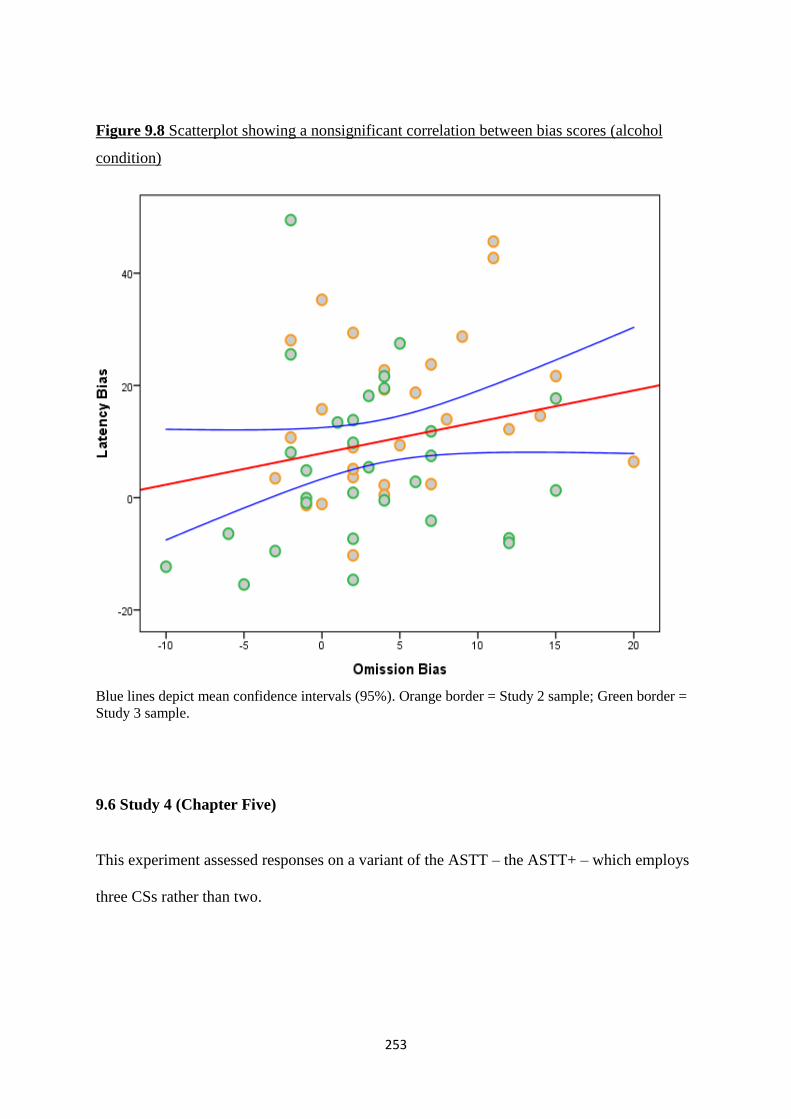
253
Figure 9.8 Scatterplot showing a nonsignificant correlation between bias scores (alcohol
condition)
Blue lines depict mean confidence intervals (95%). Orange border = Study 2 sample; Green border =
Study 3 sample.
9.6 Study 4 (Chapter Five)
This experiment assessed responses on a variant of the ASTT – the ASTT+ – which employs
three CSs rather than two.
254
CS vs. OT: A Wilcoxon Signed-Rank test revealed that RTs to CSs (Mdn = 298.65, range
= 225.69 – 565.17) were quicker than RTs to the OT (Mdn = 366.93, range = 311.55 –
413.18), T = 32.00, p < .0001, r = 0.53.
High-value CS vs. Medium-value CS vs. Low-value CS: Given that these analyses were
the primary investigation of Study 4 (Chapter Five), these analyses are contained in Chapter
Five (p. 11).
Reaction Time & Omission Biases: RT Bias was analysed with two kinds of Omission
Bias, one calculated as the difference score between high and medium omissions (‘Omission
Bias 1’), the other as the difference between high and low omissions (‘Omission Bias 2’) (see
Appendix F). RT Bias showed no correlation with Omission Bias 1, r = .27, p = .15 (see
Figure 9.9). Likewise, RT Bias showed no correlation with Omission Bias 2, r = .33, p = .09
(see Figure 9.10). These data suggest that RT and omissions are disparate measures of sign-
tracking. Finally, the association between Omission Bias 1 and Omission Bias 2 was
investigated. A medium-large positive correlation was found between omission biases, r =
.43, p = .03 (see Figure 9.11). This shows that Omission Biases, though calculated differently,
were linked.
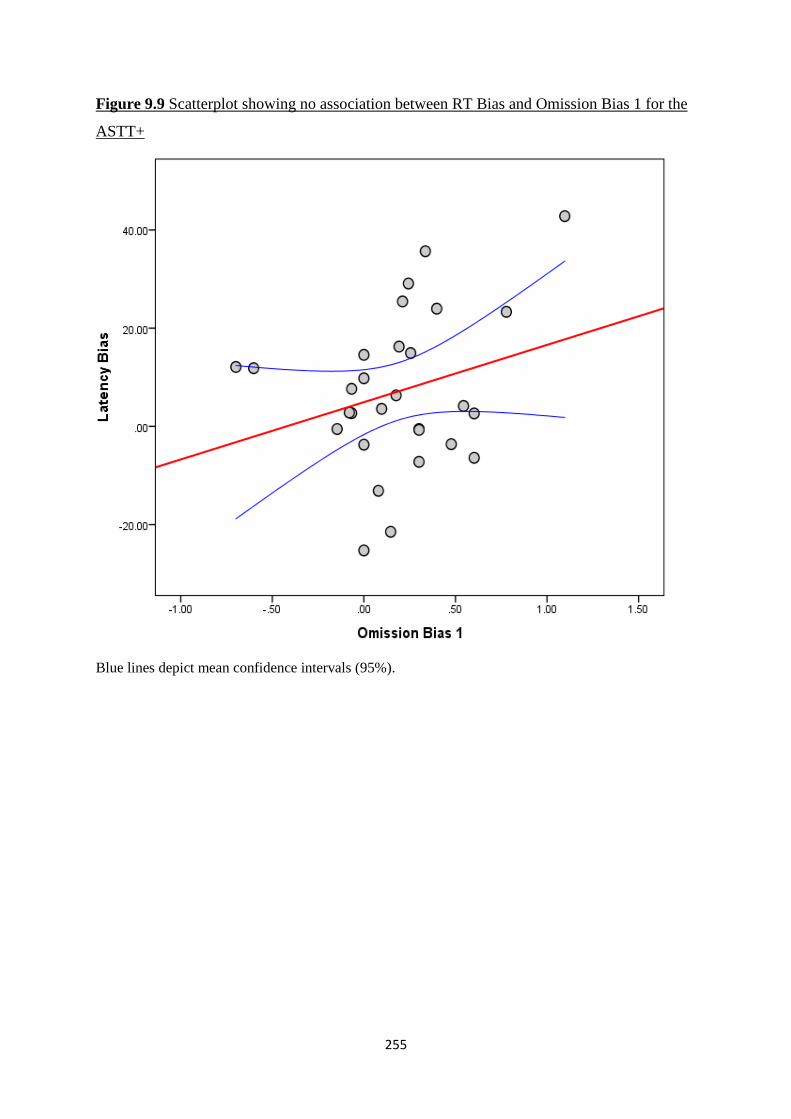
255
Figure 9.9 Scatterplot showing no association between RT Bias and Omission Bias 1 for the
ASTT+
Blue lines depict mean confidence intervals (95%).
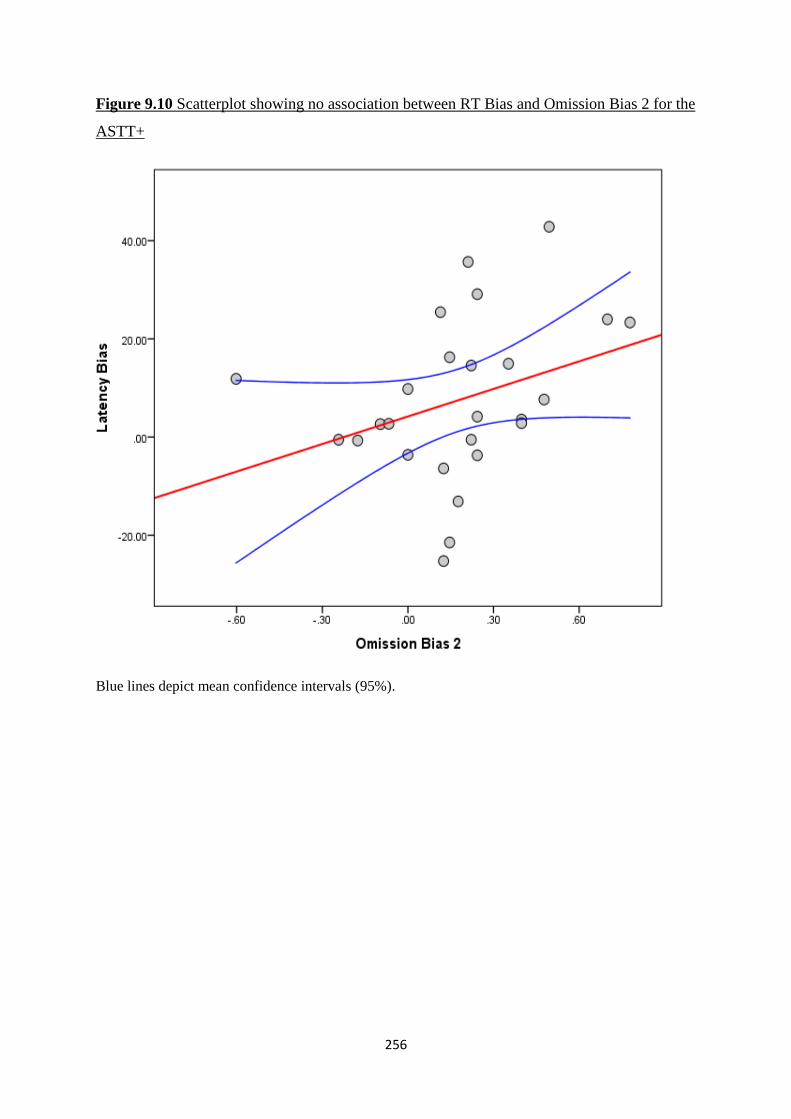
256
Figure 9.10 Scatterplot showing no association between RT Bias and Omission Bias 2 for the
ASTT+
Blue lines depict mean confidence intervals (95%).
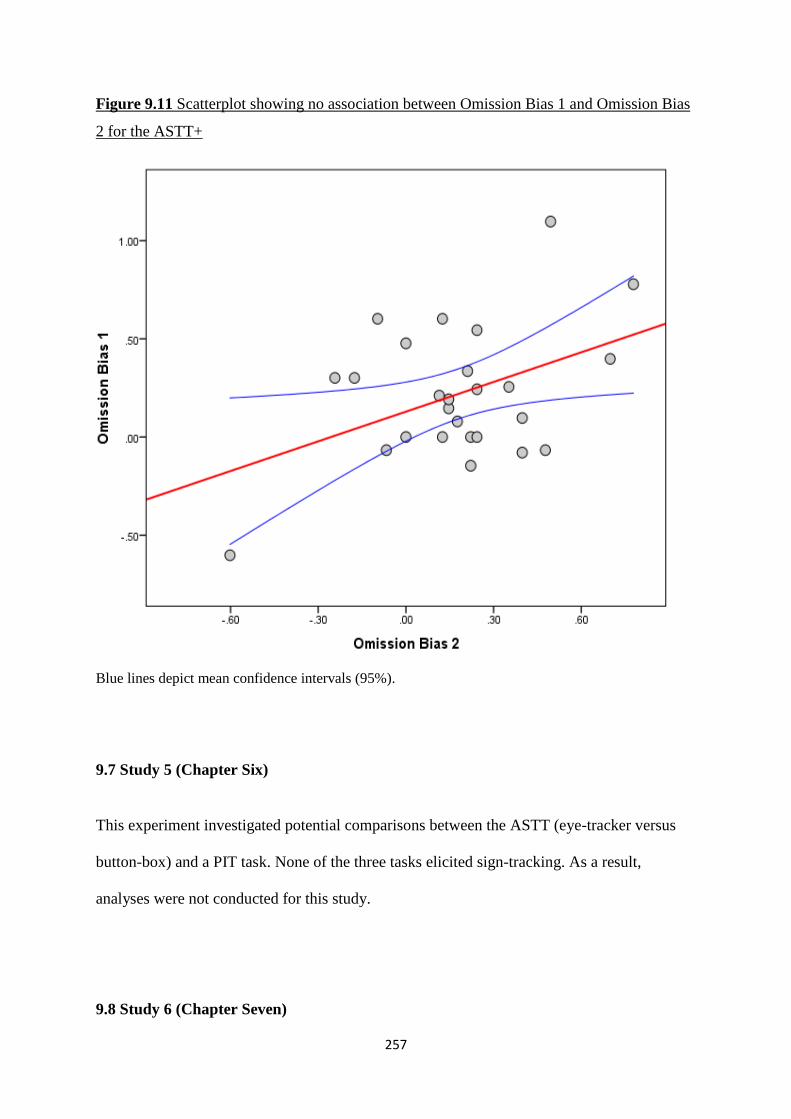
257
Figure 9.11 Scatterplot showing no association between Omission Bias 1 and Omission Bias
2 for the ASTT+
Blue lines depict mean confidence intervals (95%).
9.7 Study 5 (Chapter Six)
This experiment investigated potential comparisons between the ASTT (eye-tracker versus
button-box) and a PIT task. None of the three tasks elicited sign-tracking. As a result,
analyses were not conducted for this study.
9.8 Study 6 (Chapter Seven)
258
This experiment retested participants who had participated in one of this thesis’s previous
studies (Studies 1, 2, 3 or 5), this time on the ASTT (BB) whilst undergoing an fMRI scan.
There were exceptionally few omissions in this study and thus no high-value CS vs. low-
value CS analyses or correlations were performed.
CS vs. OT: A Paired-Samples t-test revealed that RTs to CSs (M = 493.83, SD ± 90.06)
were quicker than RTs to the OT (M = 578.43, SD ± 73.71), t(7) = 4.05, p = .003, r = .84.
This result replicates the findings of the ASTT (EE) attained in studies 1-4.
9.9 Conclusions
Overall conclusions for each analysis type are given below.
CS vs. OT: Analyses from Studies 1, 2, 3, 4, and 6 from every individual ASTT
completed (including alcohol/control and ASTT [EE]/ASTT [BB]: nine in total) gave the
same result: RTs towards CSs were significantly quicker than RTs towards the OT. This
replicates previous research (Failing et al., 2015; Le Pelley et al., 2015; Pearson et al., 2015)
and suggests that reward affects early selection processes. Specifically, saccades to the target
are wilful/controlled, while saccades towards distractors are involuntary/automatic.
High-value CS vs. Low-value CS: Across most completions of the ASTT (seven in total)
CSs of different value (including the ASTT+ which included a medium-value distractor)
attracted attention with the same ‘force’. That is, RTs for omission responses did not differ,
regardless of the value of the distractor on display. Overall, these data replicate previous
results (Le Pelley et al., 2015) and suggest that, while CSs of different value slow target RTs
at different rates, they do not pull attention towards them at different rates.
259
Reaction Time & Omission Biases: The largest single study conducted (Study 1) showed
a moderately strong correlation between bias scores, and a subsample analysis containing only
sign-trackers and goal-trackers showed a stronger association. However, all other completions
of the ASTT (including a results synthesis combining samples from Studies 2 and 3) (six in
total) showed no statistically significant correlation between RT Bias and Omission Bias.
Overall, the evidence that the biases are related is weak. It should be noted that standard
correlation coefficients are not an ideal way to investigate this question; studies specifically
exploring this problem are necessary.
260
Chapter Ten
General Discussion
_____________________________________
10.1 Abstract
Background: Preclinical findings show that sign-tracking (ST; and goal-tracking [GT] in
some experimental setups) is associated with cue-evoked drug-seeking, drug consumption,
risk-taking, novelty-seeking, and impulsivity. Human research shows a link between ST,
impulsivity, deficits in working memory, and substance abuse history. Aims: The primary
aim of this thesis was to explore human ST using a variation of the additional singleton task
(AST), the additional singleton tracking task (ASTT). Specifically, the research investigated
whether any link between ST and individual differences (such as alcohol consumption,
impulsivity, and childhood trauma) existed, whether ST is influenced by acute alcohol
consumption, and whether ST is influenced by the number of response-irrelevant, reward-
associated cues present. The neural correlates of ST were also investigated. Methods: Across
six experiments, sign-tracking was measured in samples of social drinkers and potential links
to individual differences were assessed. Methods also included the use of typical alcohol
priming paradigms and functional magnetic resonance imaging (fMRI) techniques. Results:
ST effects were found consistently across all but one study. ST was influenced by a 0.3 g/kg,
but not a 0.6 g/kg, dose of alcohol, as well as by the number of reward-associated stimuli
present. Neural correlates of ST were those identified in previous research. Conclusions: ST
may aid our understanding of motivational processing in substance use.

261
10.2 Summary of Findings
10.2.1 Human Sign-Tracking: Evidence, Mechanisms, and Measurement
10.2.1.1 Evidence
Study 1 (Chapter Three) tested 98 social drinkers on the ASTT29 and found sign-tracking
effects as measured by both reaction time (RT) and omissions (errors). Estimated effect sizes
revealed medium effect sizes (RTs: r = .31; omissions: r = .40); these compare to estimated
effect sizes of dz = .82, dz = .20 (RTs) and dz = .58 (omissions) in the most closely related
experimental setups (Le Pelley et al., 2015; Pearson et al., 2015). Focussing on the more
robust RT measure, even after conversion Study 1 produced a much more modest effect size
(dz = .33) than Le Pelley et al. (2015), though larger than Pearson et al. (2015). Given that the
calculation of Cohen’s dz rests partially on sample size (with smaller samples inflating
effects), it is unsurprising that the effect is smaller than in Le Pelley et al., although
interesting that it is larger than Pearson et al., who used a similarly small sample. Gathering
evidence from all other relevant AST studies which have reported effect size information,
effect sizes range from dz = .20 to dz = 1.12 (B. A. Anderson, 2016d; B. A. Anderson &
Yantis, 2013; Laurent et al., 2014; Le Pelley et al., 2015). All of these studies employed
samples ~4 times smaller than the sample size of Study 1, with Study 1’s estimate falling
within this range though smaller than the average effect size estimate across this body of
work (dz = .52)30. Thus, Study 1’s effect size estimate may arguably be the most realistic
estimate of the human sign-tracking effect. Using a common language effect size, this
29 Participants were also tested on the Multi-Target Tracking Task (MTTT); however, since it was a novel task and no aspect of it worked, it will not be discussed until section 10.3 (Limitations). See Appendix B for an analysis of the failures of the MTTT. 30 It is also worth noting that the majority of AST studies calculate sign-tracking scores as OT RTs on high-value trials minus OT RTs on distractor-absent trials (rather than low-value trials). This difference may also contribute to the smaller effects found across the studies of this thesis.
262
suggests that the likelihood a person will produce slower OT RTs on high-value trials
compared to low-value trials is 63%.
10.2.1.2 Mechanisms
Maladaptation and Pavlovian vs. Instrumental Conditioning
The ASTT used in Study 1 and throughout this thesis is just one variant of the AST (B. A.
Anderson, 2015a; Le Pelley et al., 2016; Theeuwes, 1991, 1992, 2010). The AST variant used
by Le Pelley et al. (2015) (Experiment 3) and Pearson et al. (2015) is almost identical to the
ASTT, and this variant was used in order to better investigate the mechanisms which lead to a
sign-tracking response. In Le Pelley et al. (2015), there was no contingency training phase
and, as a result, reward-associated distractors had never been response-relevant; however, a
sign-tracking effect was still observed. Pearson et al. (2015) followed this up and investigated
whether the same AST variant produced sign-tracking even when participants were aware of
the omission contingency (participants in the Le Pelley study were not given explicit
instructions and they reported no awareness that looking at the distractor caused an omission
of reward). Across two experiments Pearson et al. (2015) found sign-tracking effects
regardless of whether participants were aware of omission contingencies31.
Though both of the above studies made significant progress in investigating the
conditions under which sign-tracking may be extinguished (total response-irrelevance and
participants’ omission contingency awareness), both failed to fully control for which learning
31 Note that sign-tracking as measured by OT RT on high- versus low-value trials was not statistically significant (p = .07) in Experiment 1, though this may have been due to power. In fact, evidence presented in Experiment 2 suggests that while omission contingency awareness may attenuate sign-tracking, it does not extinguish it.
263
mechanism (pavlovian or instrumental) was driving the effect. Study 1 therefore altered the
procedure slightly to better identify which learning mechanism may underlie tracking
behaviour. In contrast to Le Pelley et al. (2015) and Pearson et al. (2015), Study 1’s ASTT
actively punished omissions (rather than simply omitting reward), and rewarded correct
responses on a continuous scale based on RT (rather than categorically). These changes in the
ASTT had two effects: I) omissions were more costly and thus even more maladaptive, and
II) ‘covert distractor shifts’ (Le Pelley et al., 2015) – wherein initial attentional orienting
towards the distractor is followed by overt attention to the OT (which is rewarded) – are, in
the ASTT, punished via a loss of points (due to reduced OT RT). Both of these effects serve
to reduce both overt and covert attentional capture by the response-irrelevant, reward-
associated distractors (i.e., to reduce sign-tracking). However, despite there being no positive
effect of attributing salience to distractors (especially not to attribute more salience to
distractors of higher value), sign-tracking effects were still observed. This study therefore
provided the most convincing evidence yet that human sign-tracking is automatic, persistent
in the face of negative consequences, and is driven by pavlovian (and not instrumental)
conditioning.
Automaticity, Force, Perceptual Salience, and Outcome Measures
Several other important (within-subject) findings were investigated via the ASTT (I, II,
and IV, Chapter Nine; III, Chapter Eight): I) Automaticity: Investigating the claim that sign-
tracking is automatic, II) Force: Investigating whether distractors of differing value attract
attention with the same ‘force’, III) Perceptual Salience: Investigating whether physical
salience, rather than value, was the driver of the sign-tracking effect, and IV) Outcome
Measures: Investigating whether the two primary ASTT measures – RT Bias and Omission
264
Bias – correlate. (Note: supplementary analyses for Study 5 were not conducted due to null
results.)
Across five studies, analyses revealed that RTs towards CSs were quicker than RTs
towards the OT, suggesting that sign-tracking omissions are reflexive. Regarding whether
CSs of different value pull with similar force, Studies 1-4 found no evidence of high-value
CSs eliciting quicker attentional capture than CSs of low value (CS RTs for Study 6 could not
be calculated). Regarding perceptual salience, across five studies regardless of the specific
task used, there were no differences in OT RTs on trials hosting either a red or a blue (or
green) distractor, regardless of value. However, more omissions were made towards blue
stimuli compared to red in Studies 1 and 3 (alcohol condition). This may suggest that sign-
tracking as measured by omissions may be influenced by a stimulus’s perceptual properties.
Finally, the link between RT and Omission Biases was found only in Study 1, showing a
moderate-large correlation. All other studies showed no significant relationship.
Overall, there is robust evidence – with the same pattern of results spanning all studies –
that sign-tracking is automatic, a finding already well-established in the literature (B. A.
Anderson, 2014, 2015a, 2016a; Le Pelley et al., 2016). Further, the perceptual salience of
cues in the absence of value did not influence sign-tracking as measured by RTs, although it
did influence omissions in two conditions. The latter result has precedence in the literature,
with some evidence indicating that perceptual salience interacts with value-modulated
attentional capture (VMAC) (Wang et al., 2013). Evidence for CSs of differing value
attracting attention with the same vigour was found across all analyses, which replicates the
results of previous research (Le Pelley et al., 2015) and suggests that reward-associated cues
attract attention with the same ‘force’. Finally, there was weak evidence of a link between
sign-tracking measures, a finding which has not been previously explored in the literature.
265
Gender and Belief in Reward
Finally, two (between-subject) mechanisms related to categories of different people were
explored: I) Belief in Reward: Investigating whether sign-tracking differed between those
who believed they would win extra rewards based on their performance and those who did
not, and II) Gender: Investigating whether men and women differed in their propensity to
sign-track.
No differences in either RT or Omission Biases were found between participants who
believed the deception and those who did not believe. This is, to my knowledge, the first time
explicit belief in the availability of reward has been investigated in the sign-tracking
literature. However, the result is in line with a previous AST study which showed that
participants who knew that they would not receive monetary rewards based on their
performance, still showed VMAC towards images of money (Roper & Vecera, 2016). For
gender, Studies 1, 2, 4 and 6 showed no gender differences in either RT Bias or Omission
Bias. However, Study 3 found that women showed higher RT Bias in the alcohol session
compared to men, fitting with one preclinical study that female rats exhibited elevated sign-
tracking in an alcohol autoshaping procedure (Madayag et al., 2017). Overall, there appears
to be no difference in sign-tracking between people who believed they would receive extra
rewards based on performance and those who did not, and the majority of studies showed no
gender differences.
10.2.1.3 Measurement
266
ASTT+
In the fourth study of this thesis (Chapter Five), the ASTT was adapted to include not two,
but three discrete, response-irrelevant, reward-associated distractors of differing value (high,
medium and low). The ASTT+ was designed in response to Study 1’s finding that STs’ and
GTs’ CS RTs did not differ, a finding contradictory to the preclinical literature which
consistently finds that STs approach the CS quicker than GTs (on the relatively rare
occasions that GTs approach the CS) (Flagel, Robinson, et al., 2010; Flagel et al., 2007;
Meyer, Lovic, et al., 2012). The ASTT+ aimed to increase CS RT response variability in
order to provide a broader measure on which to better gauge STs’ and GTs’ CS RT
responses. Employing a task with more than two CSs of value was also suggested by others
as a promising area of investigation (B. A. Anderson & Yantis, 2012).
Results revealed that the ASTT+ did not elicit any RT response differences towards CSs
of differing value, either between STs and GTs or in the sample as a whole. This contrasts
with the aforementioned preclinical results, though it replicates previous human studies (Le
Pelley et al., 2015). In secondary analyses, typical OT RTs across different trial types were
explored. Contrary to all other studies, an RT sign-tracking effect was found as a differential
response between high- and medium-value trials, in contrast to the typical sign-tracking
effect between high- and low-value trials. An omission sign-tracking effect was found
between high- and medium-value trials, as well as between high- and low-value trials (no
effect was found between medium- and low-value trials).
The OT RT result – the first ever with >2 CSs – suggests that in more complex stimulus
displays incentive value is attributed only to the two CSs of highest value, with other CSs
being effectively ignored (as indicated by low-value responses falling in between high- and
medium-value responses for both RTs and omissions). This may indicate that some rewards
267
could be relegated down the chain of attentional priority if more attractive rewards become
available, and/or the original reward is devalued, a finding which has basis in the alcohol
priming and AB literatures (Field et al., 2016; Rose et al., 2013).
Comparison of Measures
Study 5 (Chapter Six) aimed to compare three different sign-tracking tasks within the
same sample to assess how consistent effects were, as well as to replicate the findings of a
novel sign-tracking task designed by another research group (Garofalo & di Pellegrino,
2015). The tasks being compared were: I) the ASTT (EE), II) the ASTT (BB), and III) a
novel Pavlovian-to-Instrumental Transfer (PIT) task. None of the tasks captured the predicted
sign-tracking effects, and so the results of this study are not discussed. The limitations of
Study 5 will be detailed in section 10.3.
10.2.2 Human Sign-Tracking: Influence of Acute Alcohol Administration
There is now a large literature detailing the effects of various drugs on sign-tracking
behaviours, including the effects of amphetamine, cocaine, ethanol, nicotine, ketamine,
antipsychotics and opioids. Typically, amphetamine (M. J. F. Robinson, Anselme, et al.,
2015; Wan & Peoples, 2008), cocaine (Saddoris et al., 2016; Saunders & Robinson, 2011),
and nicotine (Versaggi et al., 2016) enhance sign-tracking, ketamine (C. J. Fitzpatrick &
Morrow, 2016) and antipsychotics (Saunders & Robinson, 2012; Yager et al., 2015) impair it,
and opioids appear to enhance both sign-tracking and goal-tracking (DiFeliceantonio &
Berridge, 2012; Mahler & Berridge, 2009). For alcohol the results are mixed, with some
268
suggesting alcohol magnifies sign-tracking (Tomie, Cunha, et al., 1998; Tomie, Festa, et al.,
2003), while more recent evidence suggests alcohol may reduce sign-tracking (Versaggi et
al., 2016).
No human study to date has investigated the acute effects of drugs on human sign-
tracking. The only relevant human studies have so far shown that I) sign-tracking is
magnified in opioid-dependent patients (B. A. Anderson et al., 2013), and II) sign-tracking is
related to a history of drug abuse (B. A. Anderson, Kronemer, et al., 2016). However, neither
of these answer the question of causality in the long-term, nor do they assess how acute
consumption of drugs affects sign-tracking.
Studies 2 and 3 (Chapter Four) investigated, for the first time, the influence of acute
alcohol administration on human sign-tracking in a group of social drinkers. Following
typical alcohol priming attentional bias studies (Rose, 2013; Rose & Duka, 2006, 2007),
Study 2 administered a low (0.3 g/kg) dose of alcohol, while Study 3 administered a
moderate (0.6 g/kg) dose, and both were compared to a control (lemonade) drink. Sign-
tracking was observed in all conditions (alcohol and control) across both studies, suggesting
that alcohol consumption at either dose did not attenuate sign-tracking. In Study 2, the
magnitude of sign-tracking was enhanced by the low dose (relative to control), though no
effect of the moderate dose was found in Study 3. Further, in a results synthesis wherein
datasets from both studies were combined, sign-tracking was found to be significantly higher
in the 0.3 g/kg alcohol group compared to the 0.6 g/kg alcohol group, even though no
difference was found between samples in their respective control sessions. Furthermore, RT
Bias after alcohol consumption of the 0.3 g/kg dose was positively correlated with negative
reinforcement as measured by the desire for alcohol questionnaire (DAQ). In the second
study (0.6 g/kg dose), desire after control consumption was negatively correlated with RT
269
Bias in the control session. These results suggest that the 0.3 g/kg dose increased alcohol
craving (via negative reinforcement, e.g., “drinking would make me feel less tense”) and
sign-tracking, while the 0.6 g/kg dose did not.
The evidence suggests that low, but not moderate, doses of acute alcohol consumption
magnify sign-tracking in social drinkers. This indicates that small amounts of alcohol may
cause people to increase the extent to which they attribute motivational salience to reward-
associated cues. Results may also suggest that the propensity to make such attributions after
small amounts of alcohol may be associated with increased desire to drink to remove negative
feelings. These results also support non-sign-tracking studies showing that small doses of
alcohol consumption can bias attention towards reward cues (Adams et al., 2012; Duka &
Townshend, 2004; Fernie et al., 2012; Schoenmakers & Wiers, 2010; Schoenmakers et al.,
2008) and/or arbitrary features of a cue previously associated with alcohol (Field & Duka,
2002).
10.2.3 Human Sign-Tracking: Longevity and Neural Correlates
The primary aim of Study 6 was to assess whether the brain regions identified in previous
human AST studies could be identified again in a sample of participants who had previously
been classified as STs or GTs, and to investigate whether the activation in these regions was
significantly different between tracking groups. A secondary aim was to simultaneously
assess the longevity of human sign-tracking; thus, participants who had been classified as STs
or GTs in a previous study of this thesis were recruited and retested on the ASTT (albeit the
ASTT [BB] rather than the ASTT [EE]).
270
There is now a vast preclinical literature on the neurobiology of tracking phenotypes.
The research has shown that the neurotransmitters and receptors of dopamine (Chow et al.,
2016), glutamate (Yau et al., 2016), serotonin (Campus et al., 2016), mu opioid (Peciña &
Berridge, 2013), cholinergic (Maddux & Chaudhri, 2017), and DREADDs (Chang et al.,
2015) are all involved in sign-tracking, goal-tracking, or both. Further, the brain regions of
interest have been consistently identified as the striatum (caudate, putamen and NAcc)
(Aitken et al., 2016; Tomie et al., 2000), VTA (Flagel et al., 2007), thalamus (Haight et al.,
2017), amygdala (Sciascia et al., 2015), hippocampus (Christopher J. Fitzpatrick, Creeden, et
al., 2016) and ventral pallidum (Chang et al., 2015). Work in humans has also revealed that
the caudate tail, intraparietal sulcus, inferior and middle frontal gyri, lateral occipital
complex, visual cortex, putamen and striatum are activated during fMRI AST procedures (B.
A. Anderson, 2016b; B. A. Anderson, Laurent, et al., 2014). A recent PET study also found
that dopamine activity in the putamen and striatum generally positively correlated with
VMAC on the AST (B. A. Anderson, Kuwabara, et al., 2016). Finally, to my knowledge
there is no preclinical or human studies which have directly tested sign-tracking and goal-
tracking on separate occasions over time and compared changes in propensity (without direct
manipulation or other changes being introduced).
First, it should be noted that a 50/50 split of STs/GTs could not be obtained, and so STs,
GTs and members of an intermediate group (ITs) were recruited to Study 6 (see section 10.3).
Regarding the behavioural results, a typical sign-tracking effect was observed; however, a
very poor test-retest reliability score was found. Most participants originally categorised as
GTs would have been reclassified, based on their new ASTT score, and the same was true for
half of STs and ITs. These data are the first of their kind obtained, and they suggest that sign-
tracking behaviours may have little stability across time. This result indicates that sign-
tracking likely fluctuates over time and could therefore be viewed similarly to other
271
(potential) measures of subjective value and appetitive motivational processes such as
attentional bias and craving (Field et al., 2016). This is contrary to the findings of the
preclinical literature in which sign-tracking is found to be a stable phenotype (see Meyer et
al., 2012 for a meta-analysis and discussion of the findings).
The neuroimaging results revealed a variety of activations across two contrasts in the
general linear model (GLM), both contrasting high-value and low-value trials. The first
revealed activations in the right lateral superior occipital cortex and bilateral putamen. The
second (with RT Bias entered as a correlate in the regression) revealed activation in the right
putamen, pallidum, amygdala and superior temporal gyrus. The putamen, amygdala, and
lateral occipital cortex have all been implicated in sign-tracking in both the preclinical and
human literatures (as reviewed above), with dopamine activity in the putamen and general
striatum being directly correlated with sign-tracking on the AST (B. A. Anderson, Kuwabara,
et al., 2016). Further, in non-sign-tracking paradigms the pallidum has been associated with
reward-seeking, reward processing, pleasure perception, and motivation (Perry et al., 2014;
Smith et al., 2009; Tindell et al., 2006), and the right superior temporal gyrus has been
associated with salience detection and shifting attention in tasks which involve encoding
relative value (Lim et al., 2013; Rapuano et al., 2016). Overall, Study 6 replicated the
neurological findings of both human and animal studies, though little to no evidence of the
stability of human sign-tracking was found.
10.2.4 Human Sign-Tracking: Individual Differences
Preclinical research shows that sign-tracking is associated with high impulsivity,
disinhibition, early life stress and vulnerability to cue-induced stress responses and drug
272
seeking (King et al., 2016; Lomanowska et al., 2011; Lovic et al., 2012; Morrow et al., 2014;
Saunders & Robinson, 2010), and human studies show an association to high impulsivity,
poor working memory and a history of drug abuse (B. A. Anderson et al., 2013; B. A.
Anderson, Kronemer, et al., 2016). Therefore, this thesis explored these associations in social
drinkers via a questionnaire battery measuring alcohol consumption, alcohol-related
harm/consequences, subjective alcohol value, impulsivity, and early life stress (e.g.,
childhood trauma).
Across all studies and hundreds of correlations, only one correlation remained
statistically significant after corrections: Omission Bias 2 (high−low) on the ASTT+ strongly
positively correlated with CATS: Sexual Abuse in Study 4. This link is likely spurious. It
should be noted that when further correlations were conducted using only key variables and
scale total scores (and thus no familywise error correction), RT Bias in Study 1 was
correlated with TLFB (average alcohol unit consumption; rs = .20), and RT Bias in Study 4
was associated with both B-YAACQ: Total (alcohol consequences; rs = .31) and ImpSS
(impulsivity; rs = .33). Although these results do not show consistency (RT Bias did not
correlate with the same measure across studies), they might indicate which measures should
be included in future studies using larger and/or clinical samples. Furthermore, the
inconsistency in associations may simply be due to the fluctuating nature of sign-tracking in
humans. See section 10.3 below for a discussion of the problems with the current use of
individual difference measures.
10.3 Limitations
Sample Size
273
Excluding Study 1 (Chapter Three), all studies possessed relatively small sample sizes (N ≈
20-30). Studies 2 and 3 possessed greater power than Studies 4-6, given both raw numbers
and their within-subject, multi-testing procedures. The sample sizes used within the thesis
were based on typical sample sizes within this field of research (e.g., Ns = 15-25) and ST was
observed in five of the six studies. However it is still possible that power was insufficient.
Study 6, in particular (fMRI; N = 20), possessed a very small sample, especially given the
initial aim of comparing tracking groups (group comparisons were made even worse by the
compelled recruitment of three groups rather than two). This appears to be a widespread
problem in both psychology and neuroscience, in particular (Button et al., 2013). Given the
interest in sign-tracking as a potentially useful phenotype in the study of addiction and other
disorders (Belin et al., 2016), if future research wishes to tease out related effects (such as
sign-tracking’s potential relation to impulsivity, risk-taking, alcohol consumption etc.) then
larger samples – determined via power calculations – are needed.
Procedure and Task Failures
There were a number of aspects of this thesis which did not work; primarily, such
failures can be attributed to specific tasks or procedural setups. Regarding task failures, the
multi-target tracking task (MTTT) employed in Study 1 (Chapter Three) and solely created
for use in this study, simply failed to detect a sign-tracking effect, or any general attentional
effect. Even when post-hoc analyses were conducted to ascertain why null results were
obtained (see Appendix B), few answers were forthcoming. Therefore, this task was not used
again.
274
An additional (partial) task issue was observed in Study 4 (Chapter Five). Although sign-
tracking effects were found, the ASTT+ was constructed to increase variability in CS RT
responses which, while technically obtained, CS RT responses on the ASTT+ were not
statistically significantly different from CS RTs on the ASTT. Thus, failure to find any
difference in STs’ and GTs’ RT responses towards the CS may still be a product of
constrained variability in the possible range of speeded responses.
Regarding procedural concerns, none of the tasks employed in Study 5 (Chapter Six)
detected sign-tracking effects. However, unlike the MTTT in Study 1, all three tasks in Study
5 had been previously validated and the ASTT (EE) had detected sign-tracking effects in
every other study of this thesis. Thus, the problem here was likely procedural, rather than
task-specific. In particular, the use of three tasks which all ran for approximately 20 minutes
each (60 minutes in total), and which require constant attention likely induced boredom
and/or fatigue. Compounding this problem was a small sample size (N = 25) and a large
number (k = 12) of conditions, meaning that post-hoc analyses could not be reliably
conducted to ascertain if sign-tracking effects were found in the first task participants
completed (in order to rule out boredom/fatigue).
A final procedural limitation is noted in Study 6 (Chapter Seven). Participants were
recruited from previous studies and their sign-tracking scores were again assessed to establish
whether sign-tracking was stable over time. However, participants were initially tested on the
ASTT (EE) and later tested in Study 6 on the ASTT (BB). Given the different method of
response – as well as the crucial timing differences on the fMRI ASTT (BB) – these scores
cannot be interpreted as being obtained from strictly the same task. Unfortunately, no study
has compared scores on eye-tracking versus button-box responding on an AST variant within
275
the same sample, and my attempt to do so in Study 5 failed to work. Thus, we do not know
how reliably we can translate the scores from each task.
Alcohol Priming
In Studies 2 and 3, there were two primary limitations: I) limited doses, and II) lack of a
placebo. Given limited time and funds, only two doses (0.3 g/kg and 0.6 g/kg) were tested. A
much more detailed and insightful study could employ a range of doses in order to assess
how sign-tracking is affected at each dosing level, and explore if the effects match those
found in general attentional bias priming research (Rose, 2013). In both studies a control
drink rather than a placebo was used and, as such, the pharmacological effects of alcohol
cannot be disentangled from its anticipated effects. Although this design was chosen tom
maximise application to real-world situations, an ideal experimental setup would contrast
alcohol dose, placebo and control drinks (Christiansen et al., 2013).
Limitations of the ASTT
As expressed throughout this thesis, although robust sign-tracking effects have been
found (RT effects consistently, omission effects less so), the two measures of sign-tracking
do not correlate. Only in Study 1 (Chapter Three) was a statistically significant association
between RTs and omissions found (ignoring the results of the ASTT [BB] in Study 5), which
may suggest that omissions are a less reliable measure and should be given less evidential
weight in AST paradigms. The use of correlations to test the agreement between these two
measures is also unsuitable, but was the only tool at hand (see Chapter Nine). Another
276
potential limitation of the ASTT as employed throughout this thesis is that rewards were
always monetary. Given social drinking populations were always tested, alcohol rewards
could have been tested to assess if they too elicited sign-tracking CRs, as has been done with
a variety of other rewards on the AST (B. A. Anderson, 2016c; Camara et al., 2013; Roper &
Vecera, 2016).
Limitations of Individual Difference Measures
Throughout the six studies of this thesis only one association between sign-tracking and
an individual difference measure was found between Omission Bias 2 (high−low) on the
ASTT+ and the CATS: Sexual Abuse subscale measure. There are several problems with this
specific correlation: I) as stated earlier (Limitations of the ASTT), omission measures are
inherently less reliable than RT measures, II) the ASTT+ has been used only once, and thus
requires further validation with larger samples, and III) CATS questions received very few
responses which indicated moderate or high levels of abuse of any kind, with the vast
majority of responses indicating little to no childhood trauma or abuse. Thus, given the
unreliability and infrequency of both omissions and CATS measures (in terms of producing
reliable and/or consistent responses) and the novelty of the ASTT+, this link is likely
specious.
Regarding the lack of association between sign-tracking and individual differences more
generally, perhaps the biggest issue of this thesis was its overly exploratory and ambitious
attempt to find important links between human traits, behaviours and sign-tracking.
Excluding the Alcohol Purchase Task (which was only used in Study 1; see footnote 15 in
General Methods, Chapter Two) and the craving and intoxication measures used in Studies 2
277
and 3, every study employed eight questionnaires – this adds up to thirty-two individual
measures of individual differences in each sample. Even employing the less restrictive
sequentially-rejective Bonferroni correction (Holm, 1979), the statistical restraints were
likely too great to overcome. However, it should be noted that using only scale total scores
(thus reducing the number of tests and excluding the need for error correction) produced only
three statistically significant correlations across five studies (excluding Study 5). This
perhaps suggests that statistical constraints made by error correction was not the primary
cause of a lack of association between sign-tracking and individual differences.
Another aspect to take into consideration is the method through which other human AST
studies have calculated sign-tracking. Most AST studies create bias scores by subtracting RTs
on distractor absent trials from RTs on high-value distractor trials, whereas all studies in this
thesis calculate bias as high-value RTs−low-value RTs. This likely reduces the size of the
effect, and may possibly have implications for studying sign-tracking’s potentially related
traits and behaviours.
10.4 Future Research and Applications
How future research can build on the work in this thesis will be described across each
chapter, so that simple additions and/or alterations may be made. Potential applications will
be discussed last.
Chapter Three: The ASTT could be employed across abstinent, social, heavy and
dependent drug and alcohol samples to assess if sign-tracking differs between samples, as has
been found in previous sign-tracking studies (B. A. Anderson et al., 2013) and is partially
supported (users vs non-users) by general drug-related AB research (Field et al., 2016).
278
Further, future research could investigate how quickly the sign-tracking effect can be
obtained using the ASTT; such research may produce methodical advantages, such as
enabling a reduction in task time.
Chapter Four: Future alcohol priming studies as employed in a sign-tracking procedure
could be improved in several ways: I) increase sample size, II) increase the range of doses
tested, III) investigate whether acute alcohol administration not only enhances sign-tracking,
but also whether it increases (possibly cue-evoked) ad lib alcohol consumption.
Chapter Five: The ASTT+ needs to be validated with a larger sample and, once
validated, future work could employ more than 3 CSs of value to assess the effect of
increased contingencies and, possibly, increased complexity on sign-tracking (e.g., do only
the two highest value CSs attract attention?). Working memory could be assessed to
investigate if those with better WM perform better with ever-increasing reward
contingencies.
Chapter Six: In addition to again using a larger sample, a study comparing several
different sign-tracking tasks could be improved either by I) if possible, using shorter tasks to
reduce fatigue/boredom effects (see ‘Chapter Three’, above), II) only comparing two tasks in
a single session, or III) testing participants on each task across multiple, consecutive days.
Chapter Seven: Perhaps more than any other, future fMRI studies would benefit from the
use of larger samples. Additionally, if a similar method of testing sign-tracking longevity is to
be used, it would be beneficial to keep the methods of measurement identical across time
(e.g., if participants were previously tested on the ASTT [EE], they should be tested on the
ASTT [EE] again). Even in situations such as Study 6 where the ASTT (EE) could not be
279
used in the fMRI scanner, ideally participants would have first been tested in the eye-tracking
lab on the ASTT (EE), before their fMRI session on the ASTT (BB).
Discrete vs. Contextual cues: Given that goal-tracking has also been linked to similar
maladaptive associations as sign-tracking (T. E. Robinson et al., 2014), that ‘goal-tracking
paradigms’ can induce goal-tracking CRs almost exclusively (Saunders et al., 2014), and that
it can be argued that contexts are more important to humans than discrete cues, future work
on human sign-tracking may build on previous work (B. A. Anderson, 2014): assessing
discrete versus contextual cues on human sign-tracking, and how each relates to individual
differences and ad lib consumption.
Associations to individual differences: Future studies may benefit from the use of fewer
outcome measures. Specifically, using only total scores (rather than second- or even third-
order factors) would reduce the need for such extensive Type I error correction.
Applications: There is now a wealth of preclinical studies showing that both tracking
phenotypes can be motivated to seek and consume drugs by reward-associated cues or
contexts (Tomie et al., 2008), human studies showing elevated sign-tracking in opioid-
dependent patients and associations with a history of drug abuse (B. A. Anderson et al., 2013;
B. A. Anderson, Kronemer, et al., 2016), and reviews suggesting that these phenotypes are
important in the study and understanding of addiction and other disorders (Belin et al., 2016;
Flagel, Akil, et al., 2009, 2010; T. E. Robinson et al., 2014). Though human sign-tracking
research is still in its early stages, it is possible that in the future it may be added to the roster
of dependence-related and drug abuse predictors such as impulsivity, disinhibition, cue
reactivity, inattention, sensation-seeking, and conduct disorder/oppositional behaviours, each
of which accounts for a relatively small amount of the variance explained in the development
of substance dependence (Dalsgaard, Bo, Frydenberg, & Hove, 2014; Ersche et al., 2012;
280
Fleury, Grenier, Bamvita, Perreault, & Caron, 2014; Meier et al., 2016; Pingault et al., 2014).
This may be especially true as sign-tracking is related to a reward’s subjective value, which is
thought to underlie drug-related behaviours (Field et al., 2016). Thus, if the two are
connected and it can be determined that the two fluctuate (somewhat) in sync, then we could
have an important measure of value which may potentially contribute to the phenotypical
profile of substance dependence and perhaps aid cognitive and behavioural treatments.
10.5 Conclusions
This thesis set out to contribute to and extend the literature on human sign-tracking. More
specifically, it sought to investigate I) the possible role of instrumental learning, II) the effect
of acute alcohol administration, III) the influence of employing more than two CSs of value,
IV) comparisons between three different sign-tracking tasks, V) the neural correlates of sign-
tracking on the ASTT, and VI) sign-tracking’s relation to individual differences. The studies
of this thesis have shown I) that instrumental learning likely plays no role in the development
of sign-tracking, II) that low (0.3 g/kg), but not moderate (0.6 g/kg), doses of alcohol enhance
sign-tracking, III) that employing a medium-value distractor causes the low-value distractor
to be virtually ignored, with sign-tracking effects being shown only between high- and
medium-value CSs, IV) that comparison of tasks could not be effectively evaluated due to
boredom and fatigue effects, V) that the striatum, ventral pallidum and lateral occipital cortex
are activated during the ASTT, replicating previous human and animal findings, and VI) that
there is no evidence sign-tracking relates to individual risks factors for harmful drinking
(although note limitations discussed above). Overall, the results of this thesis suggest that
human sign-tracking can be reliably measured via the ASTT, that sign-tracking possesses
neural correlates in the so-called ‘reward circuits’ of the brain, and that acute, low-level
281
consumption of alcohol can exacerbate people’s propensity to attribute incentive salience to
discrete, response-irrelevant, reward-associated stimuli. Finally, if tracking behaviour is a
continuous variable associated with substance value, future research should identify the
factors that influence tracking across different drinking populations. This could contribute to
our understanding of the motivational processes involved in substance use and may help
inform treatment for hazardous drinking.
282
References
Adams, S., Ataya, A. F., Attwood, A. S., & Munafò, M. R. (2012). Effects of acute alcohol
consumption on alcohol-related cognitive biases in light and heavy drinkers are task-
dependent. Journal of Psychopharmacology, 26(2), 245–253.
http://doi.org/10.1177/0269881111405355
Ahrens, A. M., Meyer, P. J., Ferguson, L. M., Robinson, T. E., & Aldridge, J. W. (2016).
Neural Activity in the Ventral Pallidum Encodes Variation in the Incentive Value of a
Reward Cue. The Journal of Neuroscience, 36(30), 7957–7970.
http://doi.org/10.1523/JNEUROSCI.0736-16.2016
Ahrens, A. M., Singer, B. F., Fitzpatrick, C. J., Morrow, J. D., & Robinson, T. E. (2015).
Rats that sign-track are resistant to Pavlovian but not instrumental extinction.
Behavioural Brain Research, 296, 418–430. http://doi.org/10.1016/j.bbr.2015.07.055
Aitken, T. J., Greenfield, V. Y., & Wassum, K. M. (2016). Nucleus accumbens core
dopamine signaling tracks the need-based motivational value of food-paired cues.
Journal of Neurochemistry, 136(5), 1026–1036. http://doi.org/10.1111/jnc.13494
Anderson, B. A. (2013). A value-driven mechanism of attentional selection. Journal of
Vision, 13(3), 1–16. http://doi.org/10.1167/13.3.7.doi
Anderson, B. A. (2014). Value-driven attentional priority is context specific. Psychonomic
Bulletin & Review, 22(3), 750–756. http://doi.org/10.3758/s13423-014-0724-0
Anderson, B. A. (2015a). The attention habit: How reward learning shapes attentional
selection. Annals of the New York Academy of Sciences, 1369(1), 24–39.
http://doi.org/10.1111/nyas.12957
Anderson, B. A. (2015b). Value-Driven Attentional Capture is Modulated by Spatial Context.
283
Visual Cognition, 1–2(23), 67–81. http://doi.org/10.1001/jama.2014.15298.Metformin
Anderson, B. A. (2016a). Counterintuitive effects of negative social feedback on attention.
Cognition & Emotion, 9931(January), 590–597.
http://doi.org/10.1080/02699931.2015.1122576
Anderson, B. A. (2016b). Reward Processing in the Value-Driven Attention Network:
Reward Signals Tracking Cue Identity and Location. Social Cognitive and Affective
Neuroscience, 11(11), 1–7. http://doi.org/10.1093/scan/nsw141
Anderson, B. A. (2016c). Social reward shapes attentional biases Social reward shapes
attentional biases. Cognitive Neuroscience, 7(1–4), 30–36.
http://doi.org/10.1080/17588928.2015.1047823
Anderson, B. A. (2016d). Value-driven attentional capture in the auditory domain. Attention,
Perception, & Psychophysics, 78(1), 242–250. http://doi.org/10.3758/s13414-015-1001-
7
Anderson, B. A., Faulkner, M. L., Rilee, J. J., Yantis, S., & Marvel, C. L. (2013). Attentional
bias for nondrug reward is magnified in addiction. Experimental and Clinical
Psychopharmacology, 21(6), 499–506. http://doi.org/10.1037/a0034575
Anderson, B. A., Kronemer, S. I., Rilee, J. J., Sacktor, N., & Marvel, C. L. (2016). Reward,
attention, and HIV-related risk in HIV+ individuals. Neurobiology of Disease, 92(Pt B),
157–165. http://doi.org/10.1016/j.nbd.2015.10.018
Anderson, B. A., Kuwabara, H., Wong, D. F., Gean, E. G., Rahmim, A., Brašić, J. R., …
Yantis, S. (2016). The role of dopamine in value-based attentional orienting. Current
Biology, 26(4), 550–555. http://doi.org/10.1016/j.cub.2015.12.062
Anderson, B. A., Laurent, P. a., & Yantis, S. (2011a). Learned value magnifies salience-
284
based attentional capture. PLoS ONE, 6(11), e27926.
http://doi.org/10.1371/journal.pone.0027926
Anderson, B. A., Laurent, P. A., & Yantis, S. (2012). Generalization of value-based
attentional priority. Visual Cognition, 20(6), 161–169.
http://doi.org/10.3851/IMP2701.Changes
Anderson, B. A., Laurent, P. A., & Yantis, S. (2014). Value-driven attentional priority signals
in human basal ganglia and visual cortex. Brain Research, 1587(1), 88–96.
http://doi.org/10.1016/j.brainres.2014.08.062
Anderson, B. A., Laurent, P. a, & Yantis, S. (2011b). Value-driven attentional capture.
Proceedings of the National Academy of Sciences of the United States of America,
108(25), 10367–10371. http://doi.org/10.1073/pnas.1104047108
Anderson, B. A., Leal, S. L., Hall, M. G., & Yassa, M. A. (2014). The Attribution of Value-
Based Attentional Priority in Individuals with Depressive Symptoms. Cognitive,
Affective, & Behavioral Neuroscience, 14(4), 1221–1227.
http://doi.org/10.1080/13506285.2014.960.The
Anderson, B. A., & Yantis, S. (2012). Value-driven attentional and oculomotor capture
during goal-directed, unconstrained viewing. Attention, Perception, & Psychophysics,
74(July), 1644–1653. http://doi.org/10.3758/s13414-012-0348-2
Anderson, B. A., & Yantis, S. (2013). Persistence of value-driven attentional capture. Journal
of Experimental Psychology: Human Perception and Performance, 39(1), 6–9.
http://doi.org/10.1037/a0030860
Anderson, R. I., Bush, P. C., & Spear, L. P. (2013). Environmental manipulations alter age
differences in attribution of incentive salience to reward-paired cues. Behavioural Brain
285
Research, 257(September), 83–89. http://doi.org/10.1016/j.bbr.2013.09.021
Anderson, R. I., & Spear, L. P. (2011). Autoshaping in adolescence enhances sign-tracking
behavior in adulthood: impact on ethanol consumption. Pharmacology, Biochemistry,
and Behavior, 98(2), 250–260. http://doi.org/10.1016/j.pbb.2011.01.004
Anne, M., & Paul, J. (2014). The stability of self-control across childhood. Personality and
Individual Differences, 69, 144–149. http://doi.org/10.1016/j.paid.2014.05.026
Awh, E., Belopolsky, A. V., & Theeuwes, J. (2013). Top-down versus bottom-up attentional
control: a failed theoretical dichotomy. Trends in Cognitive Sciences, 16(8), 437–443.
http://doi.org/10.1016/j.tics.2012.06.010.Top-down
Ball, S. (1995). The validity of an alternate five-factor measure of personality in cocaine
abusers. Psychological Assessment, 7, 148-154.
Bechara, A., & Damasio, H. (2002). Decision-making and addiction (part II): Myopia for the
future or hypersensitivity to reward? Neuropsychologia, 40(10), 1690–1705.
http://doi.org/10.1016/S0028-3932(02)00016-7
Becker, M. W., Hemsteger, S., & Peltier, C. (2015). No templates for rejection: a failure to
configure attention to ignore task-irrelevant features. Visual Cognition, 23(9–10), 1150–
1167. http://doi.org/10.1080/13506285.2016.1149532
Beckmann, J. S., & Bardo, M. T. (2012). Environmental enrichment reduces attribution of
incentive salience to a food-associated stimulus. Behavioural Brain Research, 226(1),
331–334. http://doi.org/10.1016/j.biotechadv.2011.08.021.Secreted
Beckmann, J. S., Marusich, J. a, Gipson, C. D., & Bardo, M. T. (2011). Novelty seeking,
incentive salience and acquisition of cocaine self-administration in the rat. Behavioural
Brain Research, 216(1), 159–65. http://doi.org/10.1016/j.bbr.2010.07.022

286
Behrens, T. E. J., Johansen-Berg, H., Woolrich, M. W., Smith, S. M., Wheeler-Kingshott, C.
A. M., Boulby, P. A., Barker, G. J., Sillery, E. L., Sheehan, K., Ciccarelli, O.,
Thompson, A. J., Brady, J. M., & Matthews, P. M. (2003). Non-invasive mapping of
connections between human thalamus and cortex using diffusion imaging. Nature
Neuroscience, 6, 750–757.
Belin, D., Belin-Rauscent, A., Everitt, B. J., & Dalley, J. W. (2016). In search of predictive
endophenotypes in addiction: Insights from preclinical research. Genes, Brain and
Behavior, 15(1), 74–88. http://doi.org/10.1111/gbb.12265
Belopolsky, A. V. (2015). Common Priority Map for Selection History, Reward and Emotion
in the Oculomotor System. Perception, 44(8–9), 920–933.
http://doi.org/10.1177/0301006615596866
Bennett, C. M., Wolford, G. L., & Miller, M. B. (2009). Tools of the Trade: The principled
control of false positives in neuroimaging. Social Cognitive and Affective Neuroscience,
4(4), 417–422. http://doi.org/10.1093/scan/nsp053
Berridge, K. C., & Robinson, T. E. (2016). Liking, Wanting, and the Incentive-Sensitization
Theory of Addiction. American Psychologist, 71(8), 670–679.
Berridge, K. C., Robinson, T. E., & Aldridge, J. W. (2009). Dissecting components of
reward: “liking”, “wanting”, and learning. Current Opinion in Pharmacology, 9(1), 65–
73. http://doi.org/10.1016/j.coph.2008.12.014
Bertholet, N., Murphy, J. G., Daeppen, J. B., Gmel, G., & Gaume, J. (2015). The alcohol
purchase task in young men from the general population. Drug and Alcohol
Dependence, 146(1), 39–44. http://doi.org/10.1016/j.drugalcdep.2014.10.024
Bland, J. M., & Altman, D. G. (1999). Statistical Methods for assessing agreement between
287
two methods of clinical measurement. Lancet, 327 (8476): 307-310.
Boakes, R. A. (1977). Performance on learning to associate a stimulus with positive
reinforcement. In H. Davis & H. M. B. Hurwitz (Eds.), Operant-Pavlovian
interactions (pp. 67-101). Hillsdale, NJ: Erlbaum.
Boakes, R. a, Poli, M., Lockwood, M. J., & Goodall, G. (1978). A study of misbehavior:
token reinforcement in the rat. Journal of the Experimental Analysis of Behavior, 29(1),
115–134. http://doi.org/10.1901/jeab.1978.29-115
Bordi, F., & Matthews, T. J. (1990). The effects of psychoactive drugs on schedule-controlled
behavior in the pigeon. Journal of the Experimental Analysis of Behavior, 53, 87-102.
Bourgeois, A., Neveu, R., Bayle, D. J., & Vuilleumier, P. (2017). How does reward compete
with goal-directed and stimulus-driven shifts of attention? Cognition and Emotion,
31(1), 109–118. http://doi.org/10.1080/02699931.2015.1085366
Breland, K., & Breland, M. (1961). The misbehavior of organisms. American Psychologist,
16, 681–684. http://doi.org/10.1037/h0040090
Brown, P. L., & Jenkins, H. M. (1968). Auto-shaping of the pigeon’s key-peck. Journal of
the Experimental Analysis of Behavior, 11(January), 1–8.
http://doi.org/10.1901/jeab.1968.11-1
Bucker, B., Belopolsky, A. V., & Theeuwes, J. (2014). Distractors that signal reward attract
the eyes. Visual Cognition, 23(November 2015), 1–24.
http://doi.org/10.1080/13506285.2014.980483
Bucker, B., Silvis, J. D., Donk, M., & Theeuwes, J. (2015). Reward modulates oculomotor
competition between differently valued stimuli. Vision Research, 108, 103–112.
http://doi.org/10.1016/j.visres.2015.01.020
288
Bucker, B., & Theeuwes, J. (2014). The effect of reward on orienting and reorienting in
exogenous cuing. Cognitive, Affective & Behavioral Neuroscience, 14(2), 635–46.
http://doi.org/10.3758/s13415-014-0278-7
Button, K. S., Ioannidis, J. P. A., Mokrysz, C., Nosek, B. A., Flint, J., Robinson, E. S. J., &
Munafò, M. R. (2013). Power failure: why small sample size undermines the reliability
of neuroscience. Nature Reviews: Neuroscience, 14(May), 365–376.
http://doi.org/10.1038/nrn3475
Camara, E., Manohar, S., & Husain, M. (2013). Past rewards capture spatial attention and
action choices. Experimental Brain Research, 230(3), 291–300.
http://doi.org/10.1007/s00221-013-3654-6
Campus, P., Accoto, A., Maiolati, M., Latagliata, C., & Orsini, C. (2016). Role of prefrontal
5-HT in the strain-dependent variation in sign-tracking behavior of C57BL/6 and DBA/2
mice. Psychopharmacology, 233(7), 1157–1169. http://doi.org/10.1007/s00213-015-
4192-7
Cardinal, R. N., Parkinson, J. a, Hall, J., & Everitt, B. J. (2002). Emotion and motivation: the
role of the amygdala, ventral striatum, and prefrontal cortex. Neuroscience and
Biobehavioral Reviews, 26(February), 321–352.
Cartoni, E., Balleine, B., & Baldassarre, G. (2016). Appetitive Pavlovian-instrumental
Transfer: A review. Neuroscience and Biobehavioral Reviews, 71, 829–848.
http://doi.org/10.1016/j.neubiorev.2016.09.020
Caton, S. J., Ball, M., Ahern, A., & Hetherington, M. M. (2004). Dose-dependent effects of
alcohol on appetite and food intake. Physiology and Behavior, 81(1), 51–58.
http://doi.org/10.1016/j.physbeh.2003.12.017
289
Chang, S. E., & Smith, K. S. (2016). An omission procedure reorganizes the microstructure
of sign-tracking while preserving incentive salience. Learning & Memory, 23(4), 151–
156.
Chang, S. E., Todd, T. P., Bucci, D. J., & Smith, K. S. (2015). Chemogenetic manipulation of
ventral pallidal neurons impairs acquisition of sign-tracking in rats. European Journal of
Neuroscience, 42, 3105–3116. http://doi.org/10.1111/ejn.13103
Chang, S. E., Wheeler, D. S., & Holland, P. C. (2012). Roles of nucleus accumbens and
basolateral amygdala in autoshaped lever pressing. Neurobiology of Learning and
Memory, 97(4), 441–451. http://doi.org/10.1016/j.nlm.2012.03.008
Chelazzi, L., Perlato, A., Santandrea, E., & Della Libera, C. (2013). Rewards teach visual
selective attention. Vision Research, 85, 58–62.
http://doi.org/10.1016/j.visres.2012.12.005
Chow, J. J., Nickell, J. R., Darna, M., & Beckmann, J. S. (2016). Neuropharmacology
Toward isolating the role of dopamine in the acquisition of incentive salience
attribution. Neuropharmacology, 109, 320–331.
http://doi.org/10.1016/j.neuropharm.2016.06.028
Christiansen, P., Mansfield, R., Duckworth, J. J., Field, M., & Jones, A. (2015). Internal
reliability of the alcohol-related visual probe task is increased by utilising personalised
stimuli and eye-tracking. Drug and Alcohol Dependence, 155, 170–174.
http://doi.org/10.1016/j.drugalcdep.2015.07.672
Christiansen, P., Rose, A. K., Cole, J. C., & Field, M. (2013). A comparison of the
anticipated and pharmacological effects of alcohol on cognitive bias, executive function,
craving and ad-lib drinking. Journal of Psychopharmacology (Oxford, England), 27(1),
84–92. http://doi.org/10.1177/0269881112450787
290
Christiansen, P., Rose, A. K., Randall-Smith, L., & Hardman, C. A. (2015). Alcohol’s Acute
Effect on Food Intake Is Mediated by Inhibitory Control Impairments. Health
Psychology, 35(5), 518–522. http://doi.org/10.1037/hea0000320
Chumbley, J. R., Tobler, P. N., & Fehr, E. (2014). Fatal attraction: Ventral striatum predicts
costly choice errors in humans. NeuroImage, 89(April), 1–9.
http://doi.org/10.1016/j.neuroimage.2013.11.039
Cleland, G. G., & Davey, G. C. (1983). Autoshaping in the rat: The effects of localizable
visual and auditory signals for food. Journal of the Experimental Analysis of Behavior,
40(1), 47–56. http://doi.org/10.1901/jeab.1983.40-47
Cooper, M. L. (1994). Motivations for Alcohol Use Among Adolescents : Development and
Validation of a Four-Factor Model. Psychological Assessment, 6(2).
Cooper, M. L., Russell, M., Skinner, J. B., & Windle, M. (1992). Development and validation
of a three-dimensional measure of drinking motives. Psychological Assessment, 4(2),
123–132. http://doi.org/10.1037//1040-3590.4.2.123
Corbit, L. H., & Janak, P. H. (2016). Habitual Alcohol Seeking: Neural Bases and Possible
Relations to Alcohol Use Disorders. Alcoholism: Clinical and Experimental Research,
40(7), 1380–1389. http://doi.org/10.1111/acer.13094
Crombag, H. S., Badiani, A., Maren, S., & Robinson, T. E. (2000). The role of contextual
versus discrete drug-associated cues in promoting the induction of psychomotor
sensitization to intravenous amphetamine. Behavioural Brain Research, 116(1), 1–22.
http://doi.org/10.1016/S0166-4328(00)00243-6
Cunningham, C. L., & Patel, P. (2007). Rapid induction of Pavlovian approach to an ethanol-
paired visual cue in mice. Psychopharmacology, 192(2), 231–241.
291
http://doi.org/10.1007/s00213-007-0704-4
Dalsgaard, S., Bo, P., Frydenberg, M., & Hove, P. (2014). Addictive Behaviors Short
Communication ADHD, stimulant treatment in childhood and subsequent substance
abuse in adulthood — A naturalistic long-term follow-up study. Addictive Behaviors,
39(1), 325–328. http://doi.org/10.1016/j.addbeh.2013.09.002
Danna, C. L., & Elmer, G. I. (2010). Disruption of conditioned reward association by typical
and atypical antipsychotics. Pharmacology Biochemistry and Behavior, 96(1), 40–47.
http://doi.org/10.1016/j.pbb.2010.04.004
Darvas, M., Wunsch, A. M., Gibbs, J. T., & Palmiter, R. D. (2014). Dopamine dependency
for acquisition and performance of Pavlovian conditioned response. Proceedings of the
National Academy of Sciences of the United States of America, 111(7), 2764–2769.
http://doi.org/10.1073/pnas.1400332111
de Fockert, J. W., Rees, G., Frith, C. D., & Lavie, N. (2000). The Role of Working Memory
in Visual Selective Attention. Science, 291(2), 1803–1806.
de Fockert, J. W., Rees, G., Frith, C., & Lavie, N. (2004). Neural correlates of attentional
capture in visual search. Journal of Cognitive Neuroscience, 16(5), 751–759.
http://doi.org/10.1162/089892904970762
de Fockert, J. W., & Theeuwes, J. (2012). Role of frontal cortex in attentional capture by
singleton distractors. Brain and Cognition, 80(3), 367–373.
http://doi.org/10.1016/j.bandc.2012.07.006
DeAngeli, N. E., Todd, T. P., Chang, S. E., Yeh, H. H., Yeh, P. W., & Bucci, D. J. (2015).
Exposure to Kynurenic Acid during Adolescence Increases Sign-Tracking and Impairs
Long-Term Potentiation in Adulthood. Frontiers in Behavioral Neuroscience,
292
8(January), 1–9. http://doi.org/10.3389/fnbeh.2014.00451
Delacre, M., Lakens, D., & Leys, C. (2017). Why Psychologists Should by Default Use
Welch’s t-test Instead of Student’s t-test. International Review of Social Psychology,
30(1), 92–101. DOI: http://doi.org/10.5334/irsp.82
Department of Health (2016). Retrieved from
https://www.gov.uk/government/consultations/health-risks-from-alcohol-new-
guidelines
Desikan, R. S., Segonne, F., Fischl, B., Quinn, B. T., Dickerson, B. C., Blacker, D., Buckner,
R. L., Dale, A. M., Maguire, R. P., Hyman, B. T., Albert, M. S., & Killiany, R. J.
(2006). An automated labeling system for subdividing the human cerebral cortex on
MRI scans into gyral based regions of interest. Neuroimage, 31, 968–980.
Di Ciano, P., & Everitt, B. J. (2001). Dissociable Effects of Antagonism of NMDA and
AMPA / KA Receptors in the Nucleus Accumbens Core and Shell on Cocaine-seeking
Behaviour. Neuropsychopharmacology, 25(3), 341–360.
Dickson, P. E., McNaughton, K. A., Hou, L., Anderson, L. C., Long, K. H., & Chesler, E. J.
(2015). Sex and strain influence attribution of incentive salience to reward cues in mice.
Behavioural Brain Research, 292, 305–315. http://doi.org/10.1016/j.bbr.2015.05.039
Diedrichsen, J., Balsters, J. H., Flavell, J., Cussans, E., & Ramnani, N. (2009). A probabilistic
MR atlas of the human cerebellum. Neuroimage, 46, 39-46.
DiFeliceantonio, A. G., & Berridge, K. C. (2012). Which cue to “want”? Opioid stimulation
of central amygdala makes goal-trackers show stronger goal-tracking, just as sign-
trackers show stronger sign-tracking. Behavioural Brain Research, 230(2), 399–408.
http://doi.org/10.1016/j.bbr.2012.02.032
293
DiFeliceantonio, A. G., & Berridge, K. C. (2016). Dorsolateral neostriatum contribution to
incentive salience: Opioid or dopamine stimulation makes one reward cue more
motivationally attractive than another. European Journal of Neuroscience, 33(9), 1203–
1218. http://doi.org/10.1111/ejn.13220
Donohue, S. E., Hopf, J.-M., Bartsch, M. V., Schoenfeld, M. A., Heinze, H.-J., & Woldorff,
M. G. (2016). The Rapid Capture of Attention by Rewarded Objects. Journal of
Cognitive Neuroscience, 28(4), 529–541. http://doi.org/10.1162/jocn
Donovan, D. M., & Wells, E. a. (2007). “Tweaking 12-Step”: The potential role of 12-Step
self-help group involvement in methamphetamine recovery. Addiction, 102(SUPPL. 1),
121–129. http://doi.org/10.1111/j.1360-0443.2007.01773.x
Doremus-Fitzwater, T. L., & Spear, L. P. (2011). Amphetamine-induced incentive
sensitization of sign-tracking behavior in adolescent and adult female rats. Behavioural
Neuroscience, 125(4), 661–667. http://doi.org/10.1016/j.surg.2006.10.010.Use
Dube, S. R., Anda, R. F., Felitti, V. J., Edwards, V. J., & Croft, J. B. (2002). Adverse
childhood experiences and personal alcohol abuse as an adult. Addictive Behaviors,
27(5), 713–25. Retrieved from http://www.ncbi.nlm.nih.gov/pubmed/12201379
Duka, T., Tasker, R., & Stephens, D. N. (1998). Alcohol choice and outcome expectancies in
social drinkers. Behavioural Pharmacology, 9(7), 643-653.
Duka, T., & Townshend, J. M. (2004). The priming effect of alcohol pre-load on attentional
bias to alcohol-related stimuli. Psychopharmacology, 176(3–4), 353–61.
http://doi.org/10.1007/s00213-004-1906-7
294
Eickhoff, S. B., Stephan, K. E., Mohlberg, H., Grefkes, C., Fink, G. R., Amunts, K., & Zilles,
K. (2005). A new SPM toolbox for combining probabilistic cytoarchitectonic maps
and functional imaging data. Neuroimage, 25, 1325–1335.
Erdfelder, E., Faul, F., & Buchner, A. (1996). GPOWER: A general power analysis program.
Behavior Research Methods, Instruments, & Computers, 28, 1–11.
Ersche, K. D., Jones, P. S., Williams, G. B., Smith, D. G., Bullmore, E. T., & Robbins, T. W.
(2012). Distinctive Personality Traits and Neural Correlates Associated with Stimulant
Drug Use Versus Familial Risk of Stimulant Dependence. Biological Psychiatry, 74(2),
137–144. http://doi.org/10.1016/j.biopsych.2012.11.016
Elkashef, A., & Montoya, I. (2012). Pharmacotherapy of Addiction. In J. C. Verster, K.
Brady, M. Galanter, & P. Conrod (Eds.), Drug Abuse and Addiction in Medical
Illness: Causes, Consequences and Treatment (pp. 107-118). Retrieved from Spinger
Link.
Failing, M. F., Nissens, T., Pearson, D., Le Pelley, M. E., & Theeuwes, J. (2015).
Oculomotor capture by stimuli that signal the availability of reward. Journal of
Neurophysiology, 114(4), 2316–2327. http://doi.org/10.1152/jn.00441.2015
Failing, M. F., & Theeuwes, J. (2014). Exogenous visual orienting by reward. Journal of
Vision, 14(2014), 1–9. http://doi.org/10.1167/14.5.6.doi
Failing, M. F., & Theeuwes, J. (2015). Nonspatial attentional capture by previously rewarded
scene semantics. Visual Cognition, 23(1–2), 82–104.
http://doi.org/10.1080/13506285.2014.990546
Fernie, G., Christiansen, P., Cole, J. C., Rose, A. K., & Field, M. (2012). Effects of 0.4g/kg
alcohol on attentional bias and alcohol-seeking behaviour in heavy and moderate social
295
drinkers. Journal of Psychopharmacology, 26(7), 1017–1025.
http://doi.org/10.1177/0269881111434621
Field, M., & Cox, W. M. (2008). Attentional bias in addictive behaviors: a review of its
development, causes, and consequences. Drug and Alcohol Dependence, 97(1–2), 1–20.
http://doi.org/10.1016/j.drugalcdep.2008.03.030
Field, M., & Duka, T. (2002). Cues paired with a low dose of alcohol acquire conditioned
incentive properties in social drinkers. Psychopharmacology, 159(3), 325–34.
http://doi.org/10.1007/s00213-001-0923-z
Field, M., Mogg, K., & Bradley, B. P. (2005). Alcohol increases cognitive biases for smoking
cues in smokers. Psychopharmacology, 180(1), 63–72. http://doi.org/10.1007/s00213-
005-2251-1
Field, M., Munafò, M., & Franken, I. (2009). A meta-analytic investigation of the
relationship between attentional bias and subjective craving in substance abuse.
Psychological Bulletin, 135(4), 589–607. http://doi.org/10.1037/a0015843.A
Field, M., Schoenmakers, T., & Wiers, R. W. (2008). Cognitive processes in alcohol binges:
a review and research agenda. Current Drug Abuse Reviews, 1(3), 263–79. Retrieved
from
http://www.pubmedcentral.nih.gov/articlerender.fcgi?artid=3066447&tool=pmcentrez&
rendertype=abstract
Field, M., & Wiers, R. (2012). Automatic and Controlled Processes in the Pathway from
Drug Abuse to Addiction. In J. C. Verster, K. Brady, M. Galanter, & P. Conrod
(Eds.), Drug Abuse and Addiction in Medical Illness: Causes, Consequences and
Treatment (pp. 35-45). Retrieved from Spinger Link.
296
Field, M., Werthmann, J., Franken, I. H. A., Hofmann, W., Hogarth, L., & Roefs, A. (2016).
The Role of Attentional Bias in Obesity and Addiction. Health Psychology, 35(8), 767–
780. http://doi.org/10.1017/CBO9781107415324.004
Fitzpatrick, C. J., Creeden, J. F., Perrine, S. A., & Morrow, J. D. (2016). Lesions of the
Ventral Hippocampus Attenuate the Acquisition but Not Expression of Sign-Tracking
Behavior in Rats. Hippocampus, 26, 1424–1434. http://doi.org/10.1002/hipo.22619
Fitzpatrick, C. J., Gopalakrishnan, S., Cogan, E. S., Yager, L. M., Meyer, P. J., Lovic, V., …
Morrow, J. D. (2013). Variation in the form of Pavlovian conditioned approach behavior
among outbred male Sprague-Dawley rats from different vendors and colonies: sign-
tracking vs. goal-tracking. PloS One, 8(10), e75042.
http://doi.org/10.1371/journal.pone.0075042
Fitzpatrick, C. J., & Morrow, J. D. (2016). Subanesthetic ketamine decreases the incentive-
motivational value of reward-related cues. Journal of Psychopharmacology, 31(1), 67–
74. http://doi.org/10.1177/0269881116667709
Fitzpatrick, C. J., Perrine, S. A., Ghoddoussi, F., Galloway, M. P., & Morrow, J. D. (2016).
Sign-trackers have elevated myo-inositol in the nucleus accumbens and ventral
hippocampus following Pavlovian conditioned approach. Journal of Neurochemistry,
136, 1196–1203. http://doi.org/10.1111/jnc.13524
Flagel, S. B., Akil, H., & Robinson, T. E. (2009). Individual differences in the attribution of
incentive salience to reward-related cues: Implications for addiction.
Neuropharmacology, 56(Suppl 1), 139–148.
http://doi.org/10.1016/j.neuropharm.2008.06.027
Flagel, S. B., Akil, H., & Robinson, T. E. (2010). Salience To Reward-Related Cues :
Implications for Addiction. Neuropharmacology, 56(January), 139–148.
297
http://doi.org/10.1016/j.neuropharm.2008.06.027.INDIVIDUAL
Flagel, S. B., Cameron, C. M., Pickup, K. N., Watson, S. J., Akil, H., & Robinson, T. E.
(2011). A food predictive cue must be attributed with incentive salience for it to induce
c-fos mRNA expression in cortico-striatal-thalamic brain regions. Neuroscience, 196,
80–96. http://doi.org/10.1016/j.neuroscience.2011.09.004.A
Flagel, S. B., Clark, J. J., Robinson, T. E., Mayo, L., Czuj, A., Willuhn, I., … Akil, H.
(2011). A selective role for dopamine in stimulus-reward learning. Nature, 469(7328),
53–57. http://doi.org/10.1038/nature09588
Flagel, S. B., & Robinson, T. E. (2017). Neurobiological basis of individual variation in
stimulus-reward learning. Current Opinion in Behavioral Sciences, 13, 178–185.
http://doi.org/10.1016/j.cobeha.2016.12.004
Flagel, S. B., Robinson, T. E., Clark, J. J., Clinton, S. M., Watson, S. J., Seeman, P., … Akil,
H. (2010). An animal model of genetic vulnerability to behavioral disinhibition and
responsiveness to reward-related cues: implications for addiction.
Neuropsychopharmacology, 35(2), 388–400. http://doi.org/10.1038/npp.2009.142
Flagel, S. B., Watson, S. J., Akil, H., & Robinson, T. E. (2009). Reward-Related Cue:
Influence on Cocaine Sensitization. Behavioural Brain Research, 186(1), 48–56.
Flagel, S. B., Watson, S. J., Robinson, T. E., & Akil, H. (2007). Individual differences in the
propensity to approach signals vs goals promote different adaptations in the dopamine
system of rats. Psychopharmacology, 191(July), 599–607.
http://doi.org/10.1007/s00213-006-0535-8
Fleury, M., Grenier, G., Bamvita, J., Perreault, M., & Caron, J. (2014). Predictors of Alcohol
and Drug Dependence. The Canadian Journal of Psychiatry, 59(4), 203–212.
298
Folk, C. L., Remington, R. W., & Johnston, J. C. (1992). Involuntary covert orienting is
contingent on attentional control settings. Journal of Experimental Psychology. Human
Perception and Performance, 18, 1030–1044. http://doi.org/10.1037/0096-
1523.18.4.1030
Fraser, K. M., & Haight, J. L. (2016). Diminished Dopamine: Timing, Neuroanatomy, or
Drug History? Journal of Neuroscience, 36(18), 4907–4909.
http://doi.org/10.1523/JNEUROSCI.0731-16.2016
Fraser, K. M., Haight, J. L., Gardner, E. L., & Flagel, S. B. (2016). Examining the role of
dopamine D2 and D3 receptors in Pavlovian conditioned approach behaviors.
Behavioural Brain Research. http://doi.org/10.1016/j.bbr.2016.02.022
Frazier, J. A,, Chiu, S., Breeze, J. L., Makris, N., Lange, N., Kennedy, D. N., Herbert, M. R.,
Bent, E. K., Koneru, V. K., Dieterich, M. E., Hodge, S. M., Rauch, S. L., Grant, P. E.,
Cohen, B. M., Seidman, L. J., Caviness, V. S., & Biederman, J. (2005). Structural
brain magnetic resonance imaging of limbic and thalamic volumes in pediatric bipolar
disorder. American Journal of Psychiatry, 162(7): 1256-1265.
Frenk, H., Martin, J., Vitouchanskaia, C., Dar, R., & Shalev, U. (2017). Effects of contingent
and noncontingent nicotine on lever pressing for liquids and consumption in water-
deprived rats. European Journal of Pharmacology, 794(November 2016), 224–233.
http://doi.org/10.1016/j.ejphar.2016.11.035
Garbusow, M., Schad, D. J., Sommer, C., Jünger, E., Sebold, M., & Friedel, E. (2014).
Pavlovian-to-Instrumental-Transfer in Alcohol Dependence – a pilot study.
Neuropsychobiology, 70(2), 111–121.
García-Fuster, M. J., Parsegian, A., Watson, S. J., Akil, H., & Flagel, S. B. (2017).
Adolescent cocaine exposure enhances goal-tracking behavior and impairs hippocampal
299
cell genesis selectively in adult bred low-responder rats. Psychopharmacology, 234(8),
1293–1305. http://doi.org/10.1007/s00213-017-4566-0
Garofalo, S., & di Pellegrino, G. (2015). Individual differences in the influence of task-
irrelevant Pavlovian cues on human behavior. Frontiers in Behavioral Neuroscience,
9(June), 1–11. http://doi.org/10.3389/fnbeh.2015.00163
Gaspar, J. M., Christie, G. J., Prime, D. J., Jolicœur, P., & McDonald, J. J. (2016). Inability to
suppress salient distractors predicts low visual working memory capacity. Proceedings
of the National Academy of Sciences, 113(13), 3696–3698.
http://doi.org/10.1073/pnas.1523471113
Gaspar, J. M., & McDonald, J. J. (2014). Suppression of Salient Objects Prevents Distraction
in Visual Search. Journal of Neuroscience, 34(16), 5658–5666.
http://doi.org/10.1523/JNEUROSCI.4161-13.2014
Goldstein, J. M., Seidman, L. J., Makris, N., Ahern, T., O'Brien, L. M., Caviness, V. S. Jr.,
Kennedy, D. N., Faraone, S. V., & Tsuang, M. T. (2007). Hypothalamic abnormalities
in schizophrenia: sex effects and genetic vulnerability. Biological Psychiatry, 61(8):
935-945.
Gould, T. J. (2010). Addiction and Cognition, 5, 4–14.
Gowin, J. L., Ball, T. M., Wittmann, M., Tapert, S. F., & Paulus, M. P. (2015). Individualized
relapse prediction : Personality measures and striatal and insular activity during reward-
processing robustly predict relapse. Drug and Alcohol Dependence, 152, 93–101.
http://doi.org/10.1016/j.drugalcdep.2015.04.018
Gowing, L. R., Ali, R. L., Allsop, S., Marsden, J., Turf, E. E., West, R., & Witton, J. (2015).
Global statistics on addictive behaviours: 2014 status report. Addiction, 110(6), 904–
300
919. http://doi.org/10.1111/add.12899
Grant, V. V, Stewart, S. H., O’Connor, R. M., Blackwell, E., & Conrod, P. J. (2007).
Psychometric evaluation of the five-factor Modified Drinking Motives Questionnaire--
Revised in undergraduates. Addictive Behaviors, 32(11), 2611–32.
http://doi.org/10.1016/j.addbeh.2007.07.004
Gremel, C. M., & Costa, R. M. (2013). Orbitofrontal and striatal circuits dynamically encode
the shift between goal-directed and habitual actions. Nature Communications, 4(May),
2264. http://doi.org/10.1038/ncomms3264
Guercio, L. a., Schmidt, H. D., & Pierce, R. C. (2015). Deep brain stimulation of the nucleus
accumbens shell attenuates cue-induced reinstatement of both cocaine and sucrose
seeking in rats. Behavioural Brain Research, 281, 125–130.
http://doi.org/10.1016/j.bbr.2014.12.025
Haahr, M. (n.d.). True Random Number Service. Retrieved October 20, 2015, from
https://www.random.org/
Haight, J. L., Fraser, K. M., Akil, H., & Flagel, S. B. (2015). Lesions of the paraventricular
nucleus of the thalamus differentially affect sign- and goal-tracking conditioned
responses. European Journal of Neuroscience, 42(7), 2478–2488.
http://doi.org/10.1111/ejn.13031
Haight, J. L., Fuller, Z. L., Fraser, K. M., & Flagel, S. B. (2017). A food-predictive cue
attributed with incentive salience engages subcortical afferents and efferents of the
paraventricular nucleus of the thalamus. Neuroscience, 340, 135–152.
http://doi.org/10.1016/j.neuroscience.2016.10.043
301
Hearst, E., & Jenkins, H. M. (1974). Sign tracking: The stimulus-reinforcer relation and
directed action. Austin, TX: Psychonomic Society.
Heinz, A., Siessmeier, T., Wrase, J., Hermann, D., Klein, S., Grüsser-Sinopoli, S. M., …
Bartenstein, P. (2004). Correlation between dopamine D2 receptors in the ventral
striatum and central processing of alcohol cues and craving. American Journal of
Psychiatry, 161(10), 1783–1789. http://doi.org/10.1176/appi.ajp.161.10.1783
Hickey, C., Chelazzi, L., & Theeuwes, J. (2010a). Reward changes salience in human vision
via the anterior cingulate. The Journal of Neuroscience : The Official Journal of the
Society for Neuroscience, 30(33), 11096–11103.
http://doi.org/10.1523/JNEUROSCI.1026-10.2010
Hickey, C., Chelazzi, L., & Theeuwes, J. (2010b). Reward guides vision when it’s your thing:
Trait reward-seeking in reward-mediated visual priming. PLoS ONE, 5(11), 1–5.
http://doi.org/10.1371/journal.pone.0014087
Hickey, C., Chelazzi, L., & Theeuwes, J. (2014). Reward-priming of location in visual
search. PLoS ONE, 9(7). http://doi.org/10.1371/journal.pone.0103372
Hickey, C., Kaiser, D., & Peelen, M. V. (2015). Reward Guides Attention to Object
Categories in Real-World Scenes. Journal of Experimental Psychology: General,
144(2), 264–273. http://doi.org/10.1037/a0038627
Hickey, C., & van Zoest, W. (2013). Reward-associated stimuli capture the eyes in spite of
strategic attentional set. Vision Research, 92, 67–74.
http://doi.org/10.1016/j.visres.2013.09.008
Hogarth, L., Balleine, B. W., Corbit, L. H., & Killcross, S. (2013). Associative learning
mechanisms underpinning the transition from recreational drug use to addiction. Annals

302
of the New York Academy of Sciences, 1282, 12–24. http://doi.org/10.1111/j.1749-
6632.2012.06768.x
Hogarth, L., Field, M., & Rose, A. K. (2013). Phasic transition from goal-directed to habitual
control over drug-seeking produced by conflicting reinforcer expectancy. Addiction
Biology, 18(1), 88–97. http://doi.org/10.1111/adb.12009
Hogarth, L., Maynard, O. M., & Munafò, M. R. (2014). Plain cigarette packs do not exert
Pavlovian to instrumental transfer of control over tobacco-seeking. Addiction, 110, 174–
182. http://doi.org/10.1111/add.12756
Holden, J. M., & Peoples, L. L. (2010). Effects of acute amphetamine exposure on two kinds
of Pavlovian approach behavior. Behavioural Brain Research, 208(1), 270–273.
http://doi.org/10.1016/j.bbr.2009.11.014
Holm, S. (1979). A simple sequential rejective multiple test procedure. Scandinavian Journal
of Statistics, 6: 65-70.
Holmes, A. P., & Friston, K. J. (1998). Generalisability, Random Effects & Population
Inference. NeuroImage, 7: S754.
Holland, P. C. (1977). Conditioned stimulus as a determinant of the form of the Pavlovian
conditioned response. Journal of Experimental Psychology. Animal Behavior Processes,
3(1), 77–104. http://doi.org/10.1037/0097-7403.3.1.77
Hua, K., Zhang, J., Wakana, S., Jiang, H., Li, X., Reich, D. S., Calabresi, P. A., Pekar, J. J.,
van Zijl, P. C. M., & Mori, S. (2008). Tract probability maps in stereotaxic spaces:
analyses of white matter anatomy and tract-specific quantification. Neuroimage, 39,
336–347.
Hursh, S. R., Raslear, T. G., Shurtleff, D., Bauman, R., & Simmons, L. (1988). O \, 3(3),
303
419–440.
Hursh, S. R., & Silberberg, A. (2008). Economic demand and essential value. Psychological
Review, 115(1), 186–98. http://doi.org/10.1037/0033-295X.115.1.186
Huys, Q. J. M., Tobler, P. N., Hasler, G., & Flagel, S. B. (2014). The role of learning-related
dopamine signals in addiction vulnerability. Progress in Brain Research (1st ed., Vol.
211). Elsevier B.V. http://doi.org/10.1016/B978-0-444-63425-2.00003-9
Hyman, S. E. (2005). Addiction: A disease of learning and memory. American Journal of
Psychiatry, 162(August), 1414–1422. http://doi.org/10.1176/appi.ajp.162.8.1414
IBM Corp. Released 2016. IBM SPSS Statistics for Windows, Version 24.0. Armonk, NY:
IBM Corp.
Ikeda, T., & Hikosaka, O. (2003). Reward-dependent gain and bias of visual responses in
primate superior colliculus. Neuron, 39, 693–700. http://doi.org/10.1016/S0896-
6273(03)00464-1
Inquisit 3 [Computer software]. (2011). Retrieved from http://www.millisecond.com.
Jahfari, S., & Theeuwes, J. (2016). Sensitivity to value-driven attention is predicted by how
we learn from value. Psychonomic Bulletin & Review. http://doi.org/10.3758/s13423-
016-1106-6
James, A. S., Pennington, Z. T., Tran, P., & Jentsch, J. D. (2015). Compromised
NMDA/glutamate receptor expression in dopaminergic neurons impairs instrumental
learning, but not Pavlovian goal-tracking or sign-tracking. eNeuro, 2(3).
http://doi.org/10.1523/ENEURO.0040-14.2015
Jones, A., Cole, J., Goudie, A., & Field, M. (2011). Priming a restrained mental set reduces
alcohol-seeking independently of mood. Psychopharmacology, 218, 557–565.
304
http://doi.org/10.1007/s00213-011-2338-9
Jones, A., Hogarth, L., Christiansen, P., Rose, A. K., Martinovic, J., & Field, M. (2012). The
Quarterly Journal of Experimental Reward expectancy promotes generalized increases
in attentional bias for rewarding stimuli Reward expectancy promotes generalized
increases in attentional bias for rewarding stimuli. The Quarterly Journal of
Experimental Psychology, (February 2013), 37–41.
Kahler, C. W., Strong, D. R., & Read, J. P. (2005). Toward Efficient and Comprehensive
Measurement of the Alcohol Problems Continuum in College Students: The Brief
Young Adult Alcohol Consequences Questionnaire. Alcoholism: Clinical &
Experimental Research, 29(7), 1180–1189.
http://doi.org/10.1097/01.ALC.0000171940.95813.A5
Kawa, A. B., Bentzley, B. S., & Robinson, T. E. (2016). Less is more: prolonged intermittent
access cocaine self-administration produces incentive-sensitization and addiction-like
behavior. Psychopharmacology, 233(19), 3587–3602. http://doi.org/10.1007/s00213-
016-4393-8
Kearns, D. N., Gomez-Serrano, M. a., Weiss, S. J., & Riley, A. L. (2006). A comparison of
Lewis and Fischer rat strains on autoshaping (sign-tracking), discrimination reversal
learning and negative automaintenance. Behavioural Brain Research, 169(2), 193–200.
http://doi.org/10.1016/j.bbr.2006.01.005
Kearns, D. N., & Weiss, S. J. (2004). Sign-tracking (autoshaping) in rats: a comparison of
cocaine and food as unconditioned stimuli. Learning & Behavior : A Psychonomic
Society Publication, 32(4), 463–476. http://doi.org/10.3758/BF03196042
Kent, a, & Waller, G. (1998). The impact of childhood emotional abuse: an extension of the
Child Abuse and Trauma Scale. Child Abuse & Neglect, 22(5), 393–9. Retrieved from
305
http://www.ncbi.nlm.nih.gov/pubmed/9631251
Khoo, S. Y., Gibson, G. D., & Prasad, A. A. (2017). How contexts promote and prevent
relapse to drug seeking. Genes, Brain and Behavior, 16, 185–204.
http://doi.org/10.1111/gbb.12328
Kim, S., & Ogawa, S. (2012). Biophysical and physiological origins of blood oxygenation
level-dependent fMRI signals. Journal of Cerebral Blood Flow & Metabolism, 32(7),
1188–1206. http://doi.org/10.1038/jcbfm.2012.23
King, C. P., Palmer, A. A., Woods, L. C. S., Hawk, L. W., Richards, J. B., & Meyer, P. J.
(2016). Premature responding is associated with approach to a food cue in male and
female heterogeneous stock rats. Psychopharmacology, 233(13), 2593–2605.
http://doi.org/10.1007/s00213-016-4306-x
Kiselica, A. M., Webber, T. A., & Bornovalova, M. A. (2016). Validity of the alcohol
purchase task: A meta-analysis. Addiction, 111(5), 806–816.
http://doi.org/10.1111/add.13254
Kiss, M., Driver, J., & Eimer, M. (2009). Reward priority of visual target singletons
modulates ERP signatures of attentional selection. Psychological Science, 20(2), 245–
251. http://doi.org/10.1111/j.1467-9280.2009.02281.x.Reward
Koo, T. K., & Li, M. Y. (2016). A Guideline of Selecting and Reporting Intraclass
Correlation Coefficients for Reliability Research. Journal of Chiropractic Medicine,
15(2), 155–163. http://doi.org/10.1016/j.jcm.2016.02.012
Kramer, J. R., Chan, G., Hesselbrock, V. M., Kuperman, S., Bucholz, K. K., Edenberg, H. J.,
… Porjesz, B. (2010). A principal components analysis of the abbreviated Desires for
Alcohol Questionnaire (DAQ). Journal of Studies on Alcohol and Drugs, 71(January),

306
150–155. http://doi.org/10.15288/jsad.2010.71.150
Krank, M. D. (2003). Pavlovian conditioning with ethanol: sign-tracking (autoshaping),
conditioned incentive, and ethanol self-administration. Alcoholism, Clinical and
Experimental Research, 27(10), 1592–1598.
http://doi.org/10.1097/01.ALC.0000092060.09228.DE
Krank, M. D., O’Neill, S., Squarey, K., & Jacob, J. (2008). Goal- and signal-directed
incentive: conditioned approach, seeking, and consumption established with
unsweetened alcohol in rats. Psychopharmacology, 196(3), 397–405.
http://doi.org/10.1007/s00213-007-0971-0
Krebs, R. M., Boehler, C. N., Egner, T., & Woldorff, M. G. (2011). The Neural
Underpinnings of How Reward Associations Can Both Guide and Misguide Attention.
Journal of Neuroscience, 31(26), 9752–9759. http://doi.org/10.1523/JNEUROSCI.0732-
11.2011
Kyllingsbæk, S., Van Lommel, S., Sørensen, T. a., & Bundesen, C. (2014). Automatic
attraction of visual attention by supraletter features of former target strings. Frontiers in
Psychology, 5(November), 1–7. http://doi.org/10.3389/fpsyg.2014.01383
Kyllingsbaek, S., Schneider, W. X., & Bundesen, C. (2001). Automatic attraction of attention
to former targets in visual displays of letters. Perception & Psychophysics, 63(1), 85–98.
http://doi.org/10.3758/BF03200505
Lakens, D. (2013). Calculating and Reporting Effect Sizes to Facilitate Cumulative Science:
A Practical Primer for t-tests and ANOVAs. Frontiers in Psychology, 4(863).
http://doi.org/10.3389/fpsyg.2013.00863
Lancaster, T., Stead, L., Silagy, C., & Sowden, A. (2000). Effectiveness of interventions to
307
help people stop smoking: findings from the Cochrane Library. BMJ Clinical Review,
321(August), 355–358. http://doi.org/10.1016/j.mcna.2011.08.003
Lancaster, J. L., Woldorff, M. G., Parson, L. M., Liotti, M., Freitas, C. S., Rainey, L.,
Kochunov, P. V., Nickerson, D., Mikiten, S. A., & Fox, P. T. (2000). Automated
Talairach atlas labels for functional brain mapping. Human Brain Mapping, 10, 120–
131.
Laurent, P. A., Hall, M. G., Anderson, B. A., & Yantis, S. (2014). Valuable orientations
capture attention. Visual Cognition, 6285(January), 1–14.
http://doi.org/10.1080/13506285.2014.965242
Lavie, N., & de Fockert, J. W. (2005). The role of working memory in attentional capture.
Psychonomic Bulletin and Review, 12(4), 669–674. http://doi.org/10.3758/BF03196756
Lavie, N., & de Fockert, J. W. (2006). Frontal control of attentional capture in visual search.
Visual Cognition, 14, 863–876. http://doi.org/10.1080/13506280500195953
Lawson, R. P., Seymour, B., Loh, E., Lutti, A., Dolan, R. J., Dayan, P., … Roiser, J. P.
(2014). The habenula encodes negative motivational value associated with primary
punishment in humans. Proceedings of the National Academy of Sciences, 111(June),
11858–11863. http://doi.org/10.1073/pnas.1323586111
Le Pelley, M. E. (2004). The role of associative history in models of associative learning: a
selective review and a hybrid model. The Quarterly Journal of Experimental
Psychology. B, Comparative and Physiological Psychology, 57(March 2015), 193–243.
http://doi.org/10.1080/02724990344000141
Le Pelley, M. E., Mitchell, C. J., Beesley, T., George, D. N., & Wills, A. J. (2016). Attention
and Associative Learning in Humans: An Integrative Review. Psychological Bulletin,
308
142(10), 1–31. http://doi.org/10.1037/bul0000064
Le Pelley, M. E., Mitchell, C. J., & Johnson, A. M. (2013). Outcome value influences
attentional biases in human associative learning: dissociable effects of training and
instruction. Journal of Experimental Psychology. Animal Behavior Processes, 39(1),
39–55. http://doi.org/10.1037/a0031230
Le Pelley, M. E., Oakeshott, S. M., Wills, a J., & McLaren, I. P. L. (2005). The outcome
specificity of learned predictiveness effects: parallels between human causal learning
and animal conditioning. Journal of Experimental Psychology. Animal Behavior
Processes, 31(2), 226–236. http://doi.org/10.1037/0097-7403.31.2.226
Le Pelley, M. E., Pearson, D., Griffiths, O., & Beesley, T. (2015). When Goals Conflict With
Values: Counterproductive Attentional and Oculomotor Capture by Reward-Related
Stimuli. Journal of Experimental Psychology: General, 144(1), 158–171.
Le Pelley, M. E., Vadillo, M., & Luque, D. (2013). Learned predictiveness influences rapid
attentional capture: evidence from the dot probe task. Journal of Experimental
Psychology. Learning, Memory, and Cognition, 39(6), 1888–900.
http://doi.org/10.1037/a0033700
Leung, D., Staiger, P. K., Hayden, M., Lum, J. A. G., Hall, K., Manning, V., & Verdejo-
Garcia, A. (2017). Meta-analysis of the relationship between impulsivity and substance-
related cognitive biases. Drug and Alcohol Dependence, 172, 21–33.
http://doi.org/10.1016/j.drugalcdep.2016.11.034
Libera, C. Della, & Chelazzi, L. (2009). Learning to attend and to ignore is a matter of gains
and losses. Psychological Science, 20(6), 778–784. http://doi.org/10.1111/j.1467-
9280.2009.02360.x
309
Lim, S., O’Doherty, J. P., & Rangel, A. (2013). Stimulus Value Signals in Ventromedial PFC
Reflect the Integration of Attribute Value Signals Computed in Fusiform Gyrus and
Posterior Superior Temporal Gyrus. The Journal of Neuroscience, 33(20), 8729–8741.
http://doi.org/10.1523/JNEUROSCI.4809-12.2013
Liu, X., Hairston, J., Schrier, M., & Fan, J. (2011). Common and distinct networks
underlying reward valence and processing stages : A meta-analysis of functional
neuroimaging studies. Neuroscience and Biobehavioral Reviews, 35(5), 1219–1236.
http://doi.org/10.1016/j.neubiorev.2010.12.012
Livesey, E. J., Harris, I. M., & Harris, J. a. (2009). Attentional changes during implicit
learning: signal validity protects a target stimulus from the attentional blink. Journal of
Experimental Psychology. Learning, Memory, and Cognition, 35(2), 408–422.
http://doi.org/10.1037/a0014525
Locke, A. E., Kahali, B., Berndt, S. I., Justice, A. E., Pers, T. H., Day, F. R., … Speliotes.
(2015). Genetic studies of body mass index yield new insights for obesity biology.
Nature, 518(7538), 197–206. http://doi.org/10.1038/nature14177.
Lomanowska, A. M., Lovic, V., Rankine, M. J., Mooney, S. J., Robinson, T. E., & Kraemer,
G. W. (2011). Inadequate early social experience increases the incentive salience of
reward-related cues in adulthood. Behavioural Brain Research, 220(1), 91–99.
http://doi.org/10.1016/j.bbr.2011.01.033
Lopez, J. C., Karlsson, R.-M., & O’Donnell, P. (2015). Dopamine D2 Modulation of Sign
and Goal Tracking in Rats. Neuropsychopharmacology, 40(9), 2096–2102.
http://doi.org/10.1038/npp.2015.68
Love, A., James, D., & Willner, P. (1998). A comparison of two alcohol craving
questionnaires. Addiction, 93(7), 1091-2102.
310
Lovic, V., Saunders, B. T., Yager, L. M., & Robinson, T. E. (2012). Rats prone to attribute
incentive salience to reward cues are also prone to impulsive action, 223(2), 255–261.
http://doi.org/10.1016/j.bbr.2011.04.006.Rats
Luijten, M., Field, M., & Franken, I. H. a. (2014). Pharmacological interventions to modulate
attentional bias in addiction. CNS Spectrums, 19(3), 239–46.
http://doi.org/10.1017/S1092852913000485
Mackintosh, N. J. (1975). A theory of attention: Variations in the associability of stimuli with
reinforcement. Psychological Review, 82(4), 276–298. http://doi.org/10.1037/h0076778
MacLean, M. H., Diaz, G., & Giesbrecht, B. (2016). Irrelevant learned reward associations
disrupt voluntary spatial attention. Attention, Perception, & Psychophysics, (Special
Issue in Memory of Steven Yantis), PP-SI-15-032.R1. http://doi.org/10.3758/s13414-
016-1103-x
Maclean, M. H., & Giesbrecht, B. (2015). Neural evidence reveals the rapid effects of reward
history on selective attention. Brain Research, 1606, 86–94.
http://doi.org/10.1016/j.brainres.2015.02.016
MacLean, M. H., & Giesbrecht, B. (2015). Irrelevant reward and selection histories have
different influences on task-relevant attentional selection. Attention, Perception &
Psychophysics, 77(5), 1515–28. http://doi.org/10.3758/s13414-015-0851-3
Madayag, A. C., Stringfield, S. J., Reissner, K. J., Boettiger, C. A., & Robinson, D. L.
(2017). Sex and Adolescent Ethanol Exposure Influence Pavlovian Conditioned
Approach. Alcoholism: Clinical & Experimental Research, 41(4), 846–856.
http://doi.org/10.1111/acer.13354
Maddux, J.-M. N., & Chaudhri, N. (2017). Nicotine-induced enhancement of Pavlovian
311
alcohol-seeking behavior in rats. Psychopharmacology, 234(4), 727–738.
http://doi.org/10.1007/s00213-016-4508-2
Mahler, S. V., & Aston-Jones, G. S. (2012). Fos Activation of Selective Afferents to Ventral
Tegmental Area during Cue-Induced Reinstatement of Cocaine Seeking in Rats. Journal
of Neuroscience, 32(38), 13309–13325. http://doi.org/10.1523/JNEUROSCI.2277-
12.2012
Mahler, S. V., & Berridge, K. C. (2009). Which cue to “want?” Central amygdala opioid
activation enhances and focuses incentive salience on a prepotent reward cue. The
Journal of Neuroscience, 29(20), 6500–13. http://doi.org/10.1523/JNEUROSCI.3875-
08.2009
Makris N., Goldstein, J. M., Kennedy, D., Hodge, S. M., Caviness, V. S., Faraone, S. V.,
Tsuang, M. T., & Seidman, L. J. (2006). Decreased volume of left and total anterior
insular lobule in schizophrenia. Schizophrenia Research, 83(2-3):155-171.
Maljkovic, V., & Nakayama, K. (1994). Priming of pop-out: I. Role of features. Memory &
Cognition, 22(6): 657-672.
Marissen, M. a E., Franken, I. H. a, Waters, A. J., Blanken, P., Van Den Brink, W., &
Hendriks, V. M. (2006). Attentional bias predicts heroin relapse following treatment.
Addiction, 101(9), 1306–1312. http://doi.org/10.1111/j.1360-0443.2006.01498.x
Martinovic, J., Jones, A., Christiansen, P., Rose, A. K., Hogarth, L., & Field, M. (2014).
Electrophysiological Responses to Alcohol Cues Are Not Associated with Pavlovian-to-
Instrumental Transfer in Social Drinkers. PLoS ONE, 9(4), e94605.
http://doi.org/10.1371/journal.pone.0094605
Mattfeld, A. T., Gluck, M. A., & Stark, C. E. L. (2011). Functional specialization within the
312
striatum along both the dorsal / ventral and anterior / posterior axes during associative
learning via reward and punishment. Learning & Memory, 18, 703–711.
Mazziotta, J., Toga, A., Evans, A., Fox, P., Lancaster, J., Zilles, K., Woods, R., Paus, T.,
Simpson, G., Pike, B., Holmes, C., Collins, L., Thompson, P., MacDonald, D.,
Lacoboni, M., Schormann, T., Amunts, K., Palomero-Gallagher, N., Geyer, S.,
Parsons, L., Narr, K., Kabani, N., Le Goualher, G., Boomsma, D., Cannon, T.,
Kawashima, R., & Mazoyer, B. (2001). A probabilistic atlas and reference system for
the human brain: International Consortium for Brain Mapping (ICBM). The Royal
Society Philosophical Transactions B, 356, 1293–1322.
McClory, A. J., & Spear, L. P. (2014). Effects of ethanol exposure during adolescence or in
adulthood on Pavlovian conditioned approach in Sprague-Dawley rats. Alcohol, 48(8),
755–763. http://doi.org/10.1016/j.alcohol.2014.05.006
Mehrabian A. & Russell, J. A. (1978). A questionnaire measure of habitual alcohol use.
Psychological Reports, 43(3 Pt 1), 803-806.
Meier, M. H., Hall, W., Caspi, A., Belsky, D. W., Cerdá, M., Harrington, H. L., & Houts, R.
(2016). Which adolescents develop persistent substance dependence in adulthood ?
Using population- representative longitudinal data to inform universal risk assessment.
Psychological Medicine, 46, 877–889. http://doi.org/10.1017/S0033291715002482
Meneses, A. (2003). A Pharmacological Analysis of an Associative Learning Task : 5-HT 1
to 5-HT 7 Receptor Subtypes Function on a Pavlovian / Instrumental Autoshaped
Memory. Learning & Memory, 10(5), 363–372. http://doi.org/10.1101/lm.60503.10
Meyer, P. J., Cogan, E. S., & Robinson, T. E. (2014). The form of a conditioned stimulus can
influence the degree to which it acquires incentive motivational properties. PLoS ONE,
9(6), 1–11. http://doi.org/10.1371/journal.pone.0098163
313
Meyer, P. J., Lovic, V., Saunders, B. T., Yager, L. M., Flagel, S. B., Morrow, J. D., &
Robinson, T. E. (2012). Quantifying individual variation in the propensity to attribute
incentive salience to reward cues. PLoS ONE, 7(6), 1–15.
http://doi.org/10.1371/journal.pone.0038987
Meyer, P. J., Ma, S. T., & Robinson, T. E. (2012). A cocaine cue is more preferred and
evokes more frequency- modulated 50-kHz ultrasonic vocalizations in rats prone to
attribute incentive salience to a food cue. Psychopharmacology, 219(4), 999–1009.
http://doi.org/10.1007/s00213-011-2429-7.A
Mezquita, L., Stewart, Sherry, H., Ibanez, Manuel, I., Ruiperez, Maria, A., Villa, H., Moya,
J., & Ortet, G. (2011). Drinking motives in clinical and general populations. European
Addiction Research.
Milton, A. L., Schramm, M. J. W., Wawrzynski, J. R., Gore, F., Oikonomou-Mpegeti, F.,
Wang, N. Q., … Everitt, B. J. (2012). Antagonism at NMDA receptors, but not β-
adrenergic receptors, disrupts the reconsolidation of pavlovian conditioned approach and
instrumental transfer for ethanol-associated conditioned stimuli. Psychopharmacology,
219(3), 751–761. http://doi.org/10.1007/s00213-011-2399-9
Miranda, A. T., & Palmer, E. M. (2014). Intrinsic motivation and attentional capture from
gamelike features in a visual search task. Behavior Research Methods, 46(1), 159–72.
http://doi.org/10.3758/s13428-013-0357-7
Moher, J., Anderson, B. A., & Song, J. (2016). Dissociable effects of salience on attention
and goal-directed action. Current Biology, 25(15), 2040–2046.
http://doi.org/10.1016/j.cub.2015.06.029.Dissociable
Montgomery, C., Field, M., Atkinson, A. M., Cole, J. C., Goudie, A. J., & Sumnall, H. R.
(2010). Effects of alcohol preload on attentional bias towards cocaine-related cues.
314
Psychopharmacology, 210, 365–375. http://doi.org/10.1007/s00213-010-1830-y
Morrow, J. D., Maren, S., & Robinson, T. E. (2011). Individual variation in the propensity to
attribute incentive salience to an appetitive cue predicts the propensity to attribute
motivational salience to an aversive cue. Behavioural Brain Research, 220(1), 238–243.
http://doi.org/10.1016/j.bbr.2011.02.013
Morrow, J. D., Saunders, B. T., Maren, S., & Robinson, T. E. (2014). Sign-tracking to an
appetitive cue predicts incubation of conditioned fear in rats. Behavioural Brain
Research, 276(April), 59–66. http://doi.org/10.1016/j.bbr.2014.04.002
Munneke, J., Hoppenbrouwers, S. S., & Theeuwes, J. (2015). Reward can modulate
attentional capture, independent of top-down set. Attention, Perception &
Psychophysics, 77, 2540–2548. http://doi.org/10.3758/s13414-015-0958-6
Murphy, J. G., & MacKillop, J. (2006). Relative reinforcing efficacy of alcohol among
college student drinkers. Experimental and Clinical Psychopharmacology, 14(2), 219–
27. http://doi.org/10.1037/1064-1297.14.2.219
Murray, J. E., Belin, D., & Everitt, B. J. (2012). Double dissociation of the dorsomedial and
dorsolateral striatal control over the acquisition and performance of cocaine seeking.
Neuropsychopharmacology, 37(11), 2456–66. http://doi.org/10.1038/npp.2012.104
Nasser, H. M., Chen, Y., Fiscella, K., & Calu, D. J. (2015). Individual variability in
behavioral flexibility predicts sign-tracking tendency. Frontiers in Behavioral
Neuroscience. http://doi.org/10.3389/fnbeh.2015.00289
National Health Service (2016). Retrieved from https://digital.nhs.uk/catalogue/PUB20999
O’Doherty, J. P., Buchanan, T. W., Seymour, B., & Dolan, R. J. (2006). Predictive neural
coding of reward preference involves dissociable responses in human ventral midbrain
315
and ventral striatum. Neuron, 49(1), 157–66.
http://doi.org/10.1016/j.neuron.2005.11.014
O’Doherty, J. P., Dayan, P., Schultz, J., Deichmann, R., Friston, K., & Dolan, R. J. (2004).
Dissociable Roles of Ventral and Dorsal Striatum in Instrumental Conditioning. Science,
304(April), 452–455.
Odum, A. L. (2011). Delay Discounting: I’m a k, You’re a k. Journal of the Experimental
Analysis of Behavior, 96(3), 427-439.
Olshavsky, M. E., Shumake, J., Rosenthal, A. a., Kaddour-Djebbar, A., Gonzalez-Lima, F.,
Setlow, B., & Lee, H. J. (2014). Impulsivity, risk-taking, and distractibility in rats
exhibiting robust conditioned orienting behaviors. Journal of the Experimental Analysis
of Behavior, 102(2), 162–178. http://doi.org/10.1002/jeab.104
Palmatier, M. I., Marks, K. R., Jones, S. A., Freeman, K. S., Wissman, K. M., & Sheppard,
A. B. (2013). The effect of nicotine on sign-tracking and goal-tracking in a Pavlovian
conditioned approach paradigm in rats. Psychopharmacology, 226(2), 247–259.
http://doi.org/10.1007/s00213-012-2892-9
Paolone, G., Angelakos, C. C., Meyer, P. J., Robinson, T. E., & Sarter, M. (2013).
Cholinergic control over attention in rats prone to attribute incentive salience to reward
cues. The Journal of Neuroscience, 33(19), 8321–35.
http://doi.org/10.1523/JNEUROSCI.0709-13.2013
Patton, J. H., Stanford, M. S., & Barratt, E. S. (1995). Journal of Clinical Psychology, 51(6),
768-774.
Pavlov, I. P. (1927). Conditioned reflexes: an investigation of the physiological activity of the
cerebral cortex. Oxford, England: Oxford University Press.
316
Pearson, D., Donkin, C., Tran, S. C., Most, S. B., & Le Pelley, M. E. (2015). Cognitive
control and counterproductive oculomotor capture by reward-related stimuli. Visual
Cognition, 23(1–2), 41–66. http://doi.org/10.1080/13506285.2014.994252
Peciña, S., & Berridge, K. C. (2013). Dopamine or opioid stimulation of nucleus accumbens
similarly amplify cue-triggered “wanting” for reward: Entire core and medial shell
mapped as substrates for PIT enhancement. European Journal of Neuroscience, 37(9),
1529–1540. http://doi.org/10.1111/ejn.12174
Peck, C. J., Jangraw, D. C., Suzuki, M., Efem, R., & Gottlieb, J. (2009). Reward modulates
attention independently of action value in posterior parietal cortex. The Journal of
Neuroscience, 29(36), 11182–11191. http://doi.org/10.1523/JNEUROSCI.1929-09.2009
Perry, D. C., Sturm, V. E., Seeley, W. W., Miller, B. L., Kramer, J. H., Rosen, J., …
Francisco, S. (2014). Anatomical correlates of reward-seeking behaviours in behavioural
variant frontotemporal dementia. Brain : A Journal of Neurology, 137, 1621–1626.
http://doi.org/10.1093/brain/awu075
Pessoa, L. (2014a). Multiple influences of reward on perception and attention. Visual
Cognition, 23(1–2), 272–290. http://doi.org/10.1080/13506285.2014.974729
Pessoa, L. (2014b). Multiple influences of reward on perception and attention. Visual
Cognition, 23(1–2), 272–290. http://doi.org/10.1080/13506285.2014.974729
Pingault, J.-B., Cote, S. M., Galera, C., Genolini, C., Falissard, B., Vitaro, F., & Tremblay, R.
E. (2014). Childhood Trajectories of Inattention, Hyperactivity and Oppositional
Behaviors and Prediction of Substance Abuse/ Dependence: A 15-Year Longitudinal
Population-Based Study. Molecular Psychiatry, 18(7), 806–812.
http://doi.org/10.1038/mp.2012.87.Childhood
317
Pitchers, K. K., Flagel, S. B., O’Donnell, E. G., Solberg Woods, L. C., Sarter, M., &
Robinson, T. E. (2015). Individual variation in the propensity to attribute incentive
salience to a food cue: Influence of sex. Behavioural Brain Research, 278, 462–469.
http://doi.org/10.1016/j.bbr.2014.10.036
Pitchers, K. K., Wood, T. R., Skrzynski, C. J., Robinson, T. E., & Sarter, M. (2017). The
ability for cocaine and cocaine-associated cues to compete for attention. Behavioural
Brain Research, 320, 302–315. http://doi.org/10.1016/j.bbr.2016.11.024
Polderman, T. J. C., Benyamin, B., Leeuw, C. A. De, Sullivan, P. F., Bochoven, A. Van,
Visscher, P. M., & Posthuma, D. (2015). Meta-analysis of the heritability of human
traits based on fifty years of twin studies. Nature Publishing Group, 47(7), 702–709.
http://doi.org/10.1038/ng.3285
Pollmann, S., Eštočinová, J., Sommer, S., Chelazzi, L., & Zinke, W. (2016). Neural structures
involved in visual search guidance by reward-enhanced contextual cueing of the target
location. NeuroImage, 124, 887–897. http://doi.org/10.1016/j.neuroimage.2015.09.040
Public Health England. (2014). Alcohol treatment in England 2012-13, (October).
Qi, S., Zeng, Q., Ding, C., & Li, H. (2013). Neural correlates of reward-driven attentional
capture in visual search. Brain Research, 1532, 32–43.
http://doi.org/10.1016/j.brainres.2013.07.044
Rapuano, K. M., Huckins, J. F., Sargent, J. D., Heatherton, T. F., & Kelley, W. M. (2016).
Individual Differences in Reward and Somatosensory-Motor Brain Regions Correlate
with Adiposity in Adolescents. Cerebral Cortex, 26(June), 2602–2611.
http://doi.org/10.1093/cercor/bhv097
Reagan-Shaw, S., Nihal, M., & Ahmad, N. (2007). Dose translation from animal to human
318
studies revisited. FASEB Journal, 22(3), 659-661.
Reilly, M. P., Berndt, S. I., & Woods, J. H. (2016). On the Nature of Directed Behavior to
Drug-Associated Light Cues in Rhesus Monkeys (Macaca mulatta). Behavior Analysis:
Research and Practice, 16(4), 200–209.
Reinert, D. F., & Allen, J. P. (2007). The alcohol use disorders identification test: an update
of research findings. Alcoholism, Clinical and Experimental Research, 31(2), 185–99.
http://doi.org/10.1111/j.1530-0277.2006.00295.x
Richard, J. M., Ambroggi, F., Janak, P. H., Fields, H. L., Richard, J. M., Ambroggi, F., …
Fields, H. L. (2016). Ventral Pallidum Neurons Encode Incentive Value and Promote
Cue-Elicited Instrumental Actions. Neuron, 90(6), 1165–1173.
http://doi.org/10.1016/j.neuron.2016.04.037
Robinson, M. J. F., Anselme, P., Fischer, A. M., & Berridge, K. C. (2014). Initial uncertainty
in Pavlovian reward prediction persistently elevates incentive salience and extends sign-
tracking to normally unattractive cues. Behavioural Brain Research, 266(June), 119–
130. http://doi.org/10.1016/j.bbr.2014.03.004
Robinson, M. J. F., Anselme, P., Suchomel, K., & Berridge, K. C. (2015). Amphetamine-
Induced Sensitization and Reward Uncertainty Similarly Enhance Incentive Salience for
Conditioned Cues. Behavioral Neuroscience, 129(4), 502–511.
Robinson, M. J. F., Burghardt, P. R., Patterson, C. M., Nobile, C. W., Akil, H., Watson, S. J.,
… Ferrario, C. R. (2015). Individual Differences in Cue-Induced Motivation and Striatal
Systems in Rats Susceptible to Diet-Induced Obesity. Neuropsychopharmacology,
40(9), 2113–2123. http://doi.org/10.1038/npp.2015.71
Robinson, M. J. F., Warlow, S. M., & Berridge, K. C. (2014). Optogenetic Excitation of
319
Central Amygdala Amplifies and Narrows Incentive Motivation to Pursue One Reward
Above Another. Journal of Neuroscience, 34(50), 16567–16580.
http://doi.org/10.1523/JNEUROSCI.2013-14.2014
Robinson, T. E., & Berridge, K. C. (1993). The neural basis of drug craving: An incentive-
sensitization theory of addiction. Brain Research Reviews, 18(3), 247–291.
http://doi.org/10.1016/0165-0173(93)90013-P
Robinson, T. E., & Berridge, K. C. (2003). Addiction. Annual Review of Psychology, 54(1),
25–53. http://doi.org/10.1146/annurev.psych.54.101601.145237
Robinson, T. E., & Berridge, K. C. (2008). Review. The incentive sensitization theory of
addiction: some current issues. Philosophical Transactions of the Royal Society of
London. Series B, Biological Sciences, 363(1507), 3137–46.
http://doi.org/10.1098/rstb.2008.0093
Robinson, T. E., Yager, L. M., Cogan, E. S., & Saunders, B. T. (2014). On the motivational
properties of reward cues: individual differences. Neuropharmacology, 76(1), 450–359.
http://doi.org/10.1016/j.neuropharm.2013.05.040
Roper, Z. J. J., & Vecera, S. P. (2016). Funny money: the attentional role of monetary
feedback detached from expected value. Attention, Perception, & Psychophysics, 78,
2199–2212. http://doi.org/10.3758/s13414-016-1147-y
Roper, Z. J. J., Vecera, S. P., & Vaidya, J. G. (2014). Value-Driven Attentional Capture in
Adolescence. Psychological Science, 25(11), 1987–1993.
http://doi.org/10.1177/0956797614545654
Rose, A. K. (2013). Substance Priming. In J. MacKillop & H. de Wit (Eds.), The Wiley-
Blackwell Handbook of Addiction Psychopharmacology (First, pp. 435–458). Wiley &
320
Sons Ltd.
Rose, A. K., Brown, K., Field, M., & Hogarth, L. (2013). The contributions of value-based
decision-making and attentional bias to alcohol-seeking following devaluation.
Addiction (Abingdon, England), 108(7), 1241–9. http://doi.org/10.1111/add.12152
Rose, A. K., & Duka, T. (2006). Effects of dose and time on the ability of alcohol to prime
social drinkers. Behavioural Pharmacology, 17(1983), 61–70.
Rose, A. K., & Duka, T. (2007). The influence of alcohol on basic motoric and cognitive
disinhibition. Alcohol and Alcoholism, 42(6), 544–551.
http://doi.org/10.1093/alcalc/agm073
Rose, A. K., & Grunsell, L. (2008). The subjective, rather than the disinhibiting, effects of
alcohol are related to binge drinking. Alcoholism: Clinical and Experimental Research,
32(6), 1096–1104. http://doi.org/10.1111/j.1530-0277.2008.00672.x
Rose, A. K., Hardman, C. A., & Christiansen, P. (2015). The effects of a priming dose of
alcohol and drinking environment on snack food intake. Appetite, 95, 341–348.
http://doi.org/10.1016/j.appet.2015.07.016
Rose, A. K., Jones, A., Clarke, N., & Christiansen, P. (2014). Alcohol-induced risk taking on
the BART mediates alcohol priming. Psychopharmacology, 231(11), 2273–80.
http://doi.org/10.1007/s00213-013-3377-1
Ross, S. E., Levin, E. L., Itoga, C. A., Schoen, C. B., Selmane, R., & Aldridge, J. W. (2016).
Deep brain stimulation in the central nucleus of the amygdala decreases “wanting” and
“liking” of food rewards. European Journal of Neuroscience, 44, 2431–2445.
http://doi.org/10.1111/ejn.13342
Rucker, D. D., McShane, B. B., & Preacher, K. J. (2015). A researcher's guide to regression,
321
discretization, and median splits of continuous variables. Journal of Consumer
Psychology, 24(4), 666–678.
Ruxton, G. D. (2006). The unequal variance t-test is an underused alternative to Student’s t-
test and the Mann-Whitney U test. Behavioral Ecology, 17(4), 688–690.
http://doi.org/10.1093/beheco/ark016
Saddoris, M. P., Wang, X., Sugam, J. A., & Carelli, R. M. (2016). Cocaine Self-
Administration Experience Induces Pathological Phasic Accumbens Dopamine Signals
and Abnormal Incentive Behaviors in Drug-Abstinent Rats. Journal of Neuroscience,
36(1), 235–250. http://doi.org/10.1523/JNEUROSCI.3468-15.2016
Sali, A. W., Anderson, B. A., & Courtney, S. M. (2016). Information Processing Biases in the
Brain: Implications for Decision-Making and Self-Governance. Neuroethics, 1–13.
http://doi.org/10.1007/s12152-016-9251-1
Sali, A. W., Anderson, B. A., & Yantis, S. (2014). The role of reward prediction in the
control of attention. Journal of Experimental Psychology. Human Perception and
Performance, 40(4), 1654–64. http://doi.org/10.1037/a0037267
Sanders, B., & Becker-Lausen, E. (1995). The measurement of psychological maltreatment:
early data on the Child Abuse and Trauma Scale. Child Abuse & Neglect, 19(3), 315–
323. Retrieved from http://www.ncbi.nlm.nih.gov/pubmed/9278731
Sankoh, a J., Huque, M. F., & Dubey, S. D. (1997). Some comments on frequently used
multiple endpoint adjustments methods in clinical trials. Stat Med, 16(February), 2529–
2542.
322
Saunders, B. T., Aurbach, E. L., & Robinson, T. E. (Eds.). (2012). Proceedings from the
Neuroscience Meeting Planner ‘12: Individual variation in the influence of a cocaine-
associated context on behavior. New Orleans, LA: Society for Neuroscience.
Saunders, B. T., O’Donnell, E. G., Aurbach, E. L., & Robinson, T. E. (2014). A Cocaine
Context Renews Drug Seeking Preferentially in a Subset of Individuals.
Neuropsychopharmacology: Official Publication of the American College of
Neuropsychopharmacology, 39(June), 2816–2823. http://doi.org/10.1038/npp.2014.131
Saunders, B. T., & Robinson, T. E. (2010). A cocaine cue acts as an incentive stimulus in
some but not others: implications for addiction. Biological Psychiatry, 67(8), 730–736.
http://doi.org/10.1016/j.biopsych.2009.11.015
Saunders, B. T., & Robinson, T. E. (2011). Individual variation in the motivational properties
of cocaine. Neuropsychopharmacology: Official Publication of the American College of
Neuropsychopharmacology, 36(8), 1668–1676. http://doi.org/10.1038/npp.2011.48
Saunders, B. T., & Robinson, T. E. (2012). The role of dopamine in the accumbens core in
the expression of pavlovian-conditioned responses. European Journal of Neuroscience,
36(4), 2521–2532. http://doi.org/10.1111/j.1460-9568.2012.08217.x
Saunders, B. T., & Robinson, T. E. (2013). Individual variation in resisting temptation:
Implications for addiction. Neuroscience and Biobehavioral Reviews, 37(9), 1955–1975.
http://doi.org/10.1016/j.neubiorev.2013.02.008
Saunders, B. T., Yager, L. M., & Robinson, T. E. (2013). Cue-evoked cocaine “craving”: role
of dopamine in the accumbens core. The Journal of Neuroscience, 33(35), 13989–4000.
http://doi.org/10.1523/JNEUROSCI.0450-13.2013
Saunders, J. B., Aasland, O. G., Babor, T. F., de la Fuente, J. R., & Grant, M. (1993).
323
Development of the Alcohol Use Disorders Identification Test (AUDIT): WHO
Collaborative Project on Early Detection of Persons with Harmful Alcohol
Consumption--II. Addiction, 88(6), 791-804.
Sauro, J., & Dumas, J. (2009). Comparison of Three One-Question, Post-Task Usability
Questionnaires. Proceedings of the SIGCHI Conference on Human Factors in
Computing Systems, 1599–1608. http://doi.org/10.1145/1518701.1518946
Schmidt, L. J., Belopolsky, A. V., & Theeuwes, J. (2015). Attentional capture by signals of
threat. Cognition & Emotion, 29(4), 687–694.
http://doi.org/10.1080/02699931.2014.924484
Schmidt, L., Lebreton, M., Cléry-Melin, M.-L., Daunizeau, J., & Pessiglione, M. (2012).
Neural mechanisms underlying motivation of mental versus physical effort. PLoS
Biology, 10(2), e1001266. http://doi.org/10.1371/journal.pbio.1001266
Schoenmakers, T., & Wiers, R. W. (2010). Craving and attentional bias respond differently to
alcohol priming: A field study in the pub. European Addiction Research, 16(1), 9–16.
http://doi.org/10.1159/000253859
Schoenmakers, T., Wiers, R. W., & Field, M. (2008). Group Effects of a low dose of alcohol
on cognitive biases and craving in heavy drinkers. Psychopharmacology (Berlin),
197(1), 169–178. http://doi.org/10.1007/s00213-007-1023-5.Effects
Schrieks, I. C., Stafleu, A., Griffioen-Roose, S., de Graaf, C., Witkamp, R. F., Boerrigter-
Rijneveld, R., & Hendriks, H. F. J. (2015). Moderate alcohol consumption stimulates
food intake and food reward of savoury foods. Appetite, 89, 77–83.
http://doi.org/10.1016/j.appet.2015.01.021
Sciascia, J. M., Reese, R. M., Janak, P. H., & Chaudhri, N. (2015). Alcohol-Seeking
324
Triggered by Discrete Pavlovian Cues is Invigorated by Alcohol Contexts and Mediated
by Glutamate Signaling in the Basolateral Amygdala. Neuropsychopharmacology,
40(12), 2801–2812. http://doi.org/10.1038/npp.2015.130
Scülfort, S. A., Bartsch, D., & Enkel, T. (2016). Dopamine antagonism does not impair
learning of Pavlovian conditioned approach to manipulable or non-manipulable cues but
biases responding towards goal tracking. Behavioural Brain Research, 314, 1–5.
http://doi.org/10.1016/j.bbr.2016.07.044
Sebold, M., Schad, D. J., Nebe, S., Garbusow, M., Junger, E., Kroemer, N. B., … Huys, Q. J.
M. (2016). Don’t Think, Just Feel the Music: Individuals with Strong Pavlovian-to-
instrumental Transfer Effects Rely Less on Model-based Reinforcement Learning.
Journal of Cognitive Neuroscience, 26(3), 194–198. http://doi.org/10.1162/jocn
Sellke, T., Bayarri, M. J., & Berger, J. O. (2001). Calibration of p Values for Testing Precise
Null Hypotheses. The American Statistician, 55(1), 62–71.
Sha, L. Z., & Jiang, Y. V. (2015). Components of reward-driven attentional capture.
Attention, Perception, & Psychophysics, 78(2), 403–414. http://doi.org/10.3758/s13414-
015-1038-7
Shields, A. L., Guttmanova, K., & Caruso, J. C. (2004). An examination of the factor
structure of the alcohol use disorders identification test in two high-risk samples.
Substance Use & Misuse, 39: 1161–1182.
Shin, J-W., Seol, I-C., & Son, C-G. (2010). Interpretation of Animal Dose and Human
Equivalent Dose for Drug Development. The Journal of Korean Oriental Medicine,
31(3), 1-7.
Silva, F. J., Silva, K. M., & Pear, J. J. (1992). Conditioned-stimulus- to-unconditioned-
325
stimulus distance. Journal of the Experimental Analysis of Behavior, 57(January), 17–
31.
Silva, F. J., Timberlake, W., & Gont, R. S. (1998). Spatiotemporal characteristics of serial
CSs and their relation to search modes and response form. Animal Learning & Behavior,
26(3), 299–312. http://doi.org/10.3758/BF03199223
Singer, B. F., Bryan, M., Popov, P., Scarff, R., Carter, C., Wright, E., … Robinson, T. E.
(2016). The sensory features of a food cue influence its ability to act as an incentive
stimulus and evoke dopamine release in the nucleus accumbens core. Learning &
Memory, 23, 595–606.
Singer, B. F., Guptaroy, B., Austin, C. J., Wohl, I., Lovic, V., Seiler, J. L., … Aragona, B. J.
(2016). Individual Variation in Incentive Salience Attribution and Accumbens
Dopamine Transporter Expression and Function. European Journal of Neuroscience,
43(5), 662–670. http://doi.org/10.1111/ejn.13134.Individual
Skinner, B. F. (1938). The Behavior of organisms: An experimental analysis. New York:
Appleton-Century.
Small, D. M., Gitelman, D., Simmons, K., Bloise, S. M., Parrish, T., & Mesulam, M. M.
(2005). Monetary incentives enhance processing in brain regions mediating top-down
control of attention. Cerebral Cortex, 15(December), 1855–1865.
http://doi.org/10.1093/cercor/bhi063
Smith, K. S., Berridge, K. C., & Aldridge, J. W. (2011). Disentangling pleasure from
incentive salience and learning signals in brain reward circuitry. Proceedings of the
National Academy of Sciences of the United States of America, 108(27), E255–E264.
http://doi.org/10.1073/pnas.1101920108
326
Smith, S. M., Jenkinson, M., Woolrich, M. W., Beckmann, C. F., Behrens, T. E. J.,
Johansen-Berg, H., Bannister, P. R., De Luca, M., Drobnjak, I., Flitney, D. E., Niazy,
R., Saunders, J., Vickers, J., Zhang, Y., De Stefano, N., Brady, J. M., & Matthews, P.
M. (2004). Advances in functional and structural MR image analysis and
implementation as FSL. NeuroImage, 23(S1): 208-219.
Smith, K. S., Tindell, A. J., Aldridge, J. W., & Berridge, K. C. (2009). Ventral Pallidum
Roles in Reward and Motivation. Behavioural Brain Research, 196(2), 155–167.
http://doi.org/10.1016/j.bbr.2008.09.038.Ventral
Soares, M. C., Cardoso, S. C., Malato, J. T., & Messias, J. P. M. (2017). Can cleaner fish
overcome temptation? A selective role for dopamine influence on cooperative-based
decision making. Physiology & Behavior, 169, 124–129.
http://doi.org/10.1016/j.physbeh.2016.11.028
Srey, C. S., Maddux, J.-M. N., & Chaudhri, N. (2015). The attribution of incentive salience to
Pavlovian alcohol cues: a shift from goal-tracking to sign-tracking. Frontiers in
Behavioral Neuroscience, 9(March), 1–13. http://doi.org/10.3389/fnbeh.2015.00054
Stanford, M. S., Mathias, C. W., Dougherty, D. M., Lake, S. L., Anderson, N. E., & Patton, J.
H. (2009). Fifty years of the Barratt Impulsiveness Scale: An update and review.
Personality and Individual Differences, 47(5), 385–395.
http://doi.org/10.1016/j.paid.2009.04.008
Stankevich, B. A., & Geng, J. J. (2015). The modulation of reward priority by top-down
knowledge. Visual Cognition, 23(1–2), 206–228.
http://doi.org/10.1080/13506285.2014.981626
Statistical Parametric Mapping: The Analysis of Functional Brain Images. Elsevier, 2007.
327
Stead, L., & Lancaster, T. (2012). Combined pharmacotherapy and behavioural interventions
for smoking cessation ( Review ) SUMMARY OF FINDINGS FOR THE MAIN
COMPARISON. Cochrane Database of Systematic Reviews, (10), 1–68.
Talmi, D., Seymour, B., Dayan, P., & Dolan, R. J. (2008). Human pavlovian-instrumental
transfer. The Journal of Neuroscience: The Official Journal of the Society for
Neuroscience, 28(2), 360–8. http://doi.org/10.1523/JNEUROSCI.4028-07.2008
Theeuwes, J. (1989). Effects of location and form cuing on the allocation of attention in the
visual field. Acta Psychologica, 72, 177–192. http://doi.org/10.1016/0001-
6918(89)90043-7
Theeuwes, J. (1991). Cross-dimensional perceptual selectivity. Perception & Psychophysics,
50(2), 184–193. http://doi.org/10.3758/BF03212219
Theeuwes, J. (1992). Perceptual selectivity for color and form. Perception & Psychophysics,
51(6), 599–606. http://doi.org/10.3758/BF03211656
Theeuwes, J. (2010). Top-down and bottom-up control of visual selection. Acta
Psychologica, 135(2), 77–99. http://doi.org/10.1016/j.actpsy.2010.02.006
Theeuwes, J., & Belopolsky, A. V. (2012). Reward grabs the eye: Oculomotor capture by
rewarding stimuli. Vision Research, 74(August), 80–85.
http://doi.org/10.1016/j.visres.2012.07.024
Theeuwes, J., & Van der Burg, E. (2011). On the limits of top-down control of visual
selection. Attention, Perception, & Psychophysics, 73(7), 2092: 10.3758/s13414-011-
0176-9
Thorndike, E. L. (1898). Animal intelligence: An experimental study of the associative
processes in animals. Psychological Monographs: General and Applied, 2(4), i-109.
328
Tindell, A. J., Smith, K. S., Pecina, S., Berridge, K. C., & Aldridge, J. W. (2006). Ventral
Pallidum Firing Codes Hedonic Reward : When a Bad Taste Turns Good. Journal of
Neurophysiology, 96, 2399–2409. http://doi.org/10.1152/jn.00576.2006.The
Tomie, A. (1995). Cam - an Animal Learning-Model of Excessive and Compulsive
Implement-Assisted Drug-Taking in Humans. Clinical Psychology Review, 15(3), 145–
167.
Tomie, A. (1996). Locating Reward Cue at Response Manipulandum (CAM) Induces
Symptoms of Drug Abuse. Neuroscience & Biobehavioral Reviews, 20(3), 505–535.
http://doi.org/10.1016/0149-7634(95)00023-2
Tomie, A., Aguado, A. S., Pohorecky, L. a., & Benjamin, D. (2000). Individual differences in
pavlovian autoshaping of lever pressing in rats predict stress-induced corticosterone
release and mesolimbic levels of monoamines. Pharmacology Biochemistry and
Behavior, 65(3), 509–517. http://doi.org/10.1016/S0091-3057(99)00241-5
Tomie, A., Aguado, a S., Pohorecky, L. a, & Benjamin, D. (1998). Ethanol induces
impulsive-like responding in a delay-of-reward operant choice procedure: Impulsivity
predicts autoshaping. Psychopharmacology, 139(4), 376–382.
http://doi.org/10.1007/s002130050728
Tomie, A., Cunha, C., Mosakowski, E. M., Quartarolo, N. M., Pohorecky, L. a., & Benjamin,
D. (1998). Effects of ethanol on Pavlovian autoshaping in rats. Psychopharmacology,
139(1–2), 154–159. http://doi.org/10.1007/s002130050700
Tomie, A., di Poce, J., Derenzo, C. C., & Pohorecky, L. a. (2002). Autoshaping of ethanol
drinking: an animal model of binge drinking. Alcohol and Alcoholism, 37(2), 138–146.
http://doi.org/10.1093/alcalc/37.2.138
329
Tomie, A., Festa, E. D., Sparta, D. R., & Pohorecky, L. a. (2003). Lever conditioned
stimulus-directed autoshaping induced by saccharin-ethanol unconditioned stimulus
solution: Effects of ethanol concentration and trial spacing. Alcohol, 30(1), 35–44.
http://doi.org/10.1016/S0741-8329(03)00069-7
Tomie, A., Grimes, K. L., & Pohorecky, L. a. (2008). Behavioral characteristics and
neurobiological substrates shared by Pavlovian sign-tracking and drug abuse. Brain
Research Reviews, 58(1), 121–35. http://doi.org/10.1016/j.brainresrev.2007.12.003
Tomie, A., Silberman, Y., Williams, K., & Pohorecky, L. a. (2002). Pavlovian autoshaping
procedures increase plasma corticosterone levels in rats. Pharmacology Biochemistry
and Behavior, 72(3), 507–513.
Tomie, A., Sparta, D. R., Silberman, Y., Interlandi, J., Mynko, A., Patterson-Buckendahl, P.,
& Pohorecky, L. a. (2002). Pairings of ethanol sipper with food induces Pavlovian
autoshaping of ethanol drinking in rats: evidence of long-term retention and effects of
sipper duration. Alcohol and Alcoholism, 37(6), 547–554.
Tomie, A., Tirado, A. D., Yu, L., & Pohorecky, L. a. (2004). Pavlovian autoshaping
procedures increase plasma corticosterone and levels of norepinephrine and serotonin in
prefrontal cortex in rats. Behavioural Brain Research, 153(1), 97–105.
http://doi.org/10.1016/j.bbr.2003.11.006
Tomie, A., Wong, K., Apor, K., Patterson-Buckendahl, P., & Pohorecky, L. a. (2003).
Autoshaping of ethanol drinking in rats: Effects of ethanol concentration and trial
spacing. Alcohol, 31, 125–135. http://doi.org/10.1016/j.alcohol.2003.08.003
Tripi, J. A., Dent, M. L., & Meyer, P. J. (2016). Individual differences in food cue
responsivity are associated with acute and repeated cocaine-induced vocalizations, but
not cue-induced vocalizations. Psychopharmacology, 234(3), 437–446.
330
http://doi.org/10.1007/s00213-016-4476-6
Tunstall, B. J., & Kearns, D. N. (2015). Sign-tracking predicts increased choice of cocaine
over food in rats. Behavioural Brain Research, 281, 222–228.
http://doi.org/10.1016/j.bbr.2014.12.034
Turkheimer, E. (2000). Three Laws of Behavior Genetics and What They Mean. Current
Directions in Psychological Science, 9(5), 160–164.
Uslaner, J. M., Acerbo, M. J., Jones, S. A., & Robinson, T. E. (2006). The attribution of
incentive salience to a stimulus that signals an intravenous injection of cocaine.
Behavioural Brain Research, 169(2), 320–324. http://doi.org/10.1016/j.bbr.2006.02.001
van Hemel-Ruiter, M. E., de Jong, P. J., Ostafin, B. D., & Oldehinkel, A. J. (2015). Reward-
related attentional bias and adolescent substance use: a prognostic relationship? PloS
One, 10(3), e0121058. http://doi.org/10.1371/journal.pone.0121058
Van Koningsbruggen, M. G., Ficarella, S. C., Battelli, L., & Hickey, C. (2016). Transcranial
random-noise stimulation of visual cortex potentiates value-driven attentional capture.
Social Cognitive and Affective Neuroscience, 11(9), 1481–1488.
http://doi.org/10.1093/scan/nsw056
Verdejo-García, A., Lawrence, A. J., & Clark, L. (2008). Impulsivity as a vulnerability
marker for substance-use disorders: review of findings from high-risk research, problem
gamblers and genetic association studies. Neuroscience and Biobehavioral Reviews,
32(4), 777–810. http://doi.org/10.1016/j.neubiorev.2007.11.003
Versace, F., Kypriotakis, G., Basen-Engquist, K., & Schembre, S. M. (2015). Heterogeneity
in brain reactivity to pleasant and food cues: evidence of sign-tracking in humans. Social
Cognitive and Affective Neuroscience, 11(4), 604–611.
331
http://doi.org/10.1017/CBO9781107415324.004
Versaggi, C. L., King, C. P., & Meyer, P. J. (2016). The tendency to sign-track predicts cue-
induced reinstatement during nicotine self-administration, and is enhanced by nicotine
but not ethanol. Psychopharmacology, 233(15–16), 2985–2987.
http://doi.org/10.1007/s00213-016-4341-7
Villaruel, F. R., & Chaudhri, N. (2016). Individual Differences in the Attribution of Incentive
Salience to a Pavlovian Alcohol Cue. Frontiers in Behavioral Neuroscience, 10(238).
http://doi.org/10.3389/fnbeh.2016.00238
Volkow, N. D., Wang, G., Telang, F., Fowler, J. S., Logan, J., Childress, A., … Wong, C.
(2006). Cocaine Cues and Dopamine in Dorsal Striatum : Mechanism of Craving in
Cocaine Addiction. The Journal of Neuroscience, 26(24), 6583–6588.
http://doi.org/10.1523/JNEUROSCI.1544-06.2006
Vul, E., Harris, C., Winkielman, P., & Pashler, H. (2009). Puzzlingly High Correlations in
fMRI Studies of Emotion , Personality , and Social Cognition. Perspectives on
Psychological Science, 4(3), 274–290.
Walker, R., Walker, David, G., Husain, M., & Kennard, C. (2000). Control of voluntary and
reflexive saccades. Experimental Brain Research, 130(1), 540–544.
http://doi.org/10.1007/s002210050934
Wan, X., & Peoples, L. L. (2008). Amphetamine Exposure Enhances Accumbal Responses to
Reward-Predictive Stimuli in a Pavlovian Conditioned Approach Task. The Journal of
Neuroscience, 28(30), 7501–7512. http://doi.org/10.1523/JNEUROSCI.1071-08.2008
Wang, L., Duan, Y., Theeuwes, J., & Zhou, X. (2014). Reward breaks through the inhibitory
region around attentional focus. Journal of Vision, 14(12), 2.
332
http://doi.org/10.1167/14.12.2
Wang, L., Yu, H., & Zhou, X. (2013). Interaction between value and perceptual salience in
value-driven attentional capture. Journal of Vision, 13(3), 1–13.
http://doi.org/10.1167/13.3.5.doi
Waters, A. J., Shiffman, S., Sayette, M. a., Paty, J. a., Gwaltney, C. J., & Balabanis, M. H.
(2003). Attentional bias predicts outcome in smoking cessation. Health Psychology,
22(4), 378–387. http://doi.org/10.1037/0278-6133.22.4.378
Weafer, J., & Fillmore, M. T. (2013). Acute Alcohol Effects on Attentional Bias in Heavy
and Moderate Drinkers. Psychology of Addictive Behaviors, 27(1), 32–41.
http://doi.org/10.1016/j.str.2010.08.012.Structure
Wentura, D., Müller, P., & Rothermund, K. (2014). Attentional capture by evaluative stimuli:
Gain- and loss-connoting colors boost the additional-singleton effect. Psychonomic
Bulletin & Review, 21(3), 701–707. http://doi.org/10.3758/s13423-013-0531-z
White, N. M., & Naeem, M. (2017). Learning not to respond: Role of the hippocampus in
withholding responses during omission training. Behavioural Brain Research, 318, 61–
70. http://doi.org/10.1016/j.bbr.2016.11.011
Wiers, R. W., Gladwin, T. E., Hofmann, W., Salemink, E., & Ridderinkhof, K. R. (2013).
Cognitive Bias Modification and Cognitive Control Training in Addiction and Related
Psychopathology: Mechanisms, Clinical Perspectives, and Ways Forward. Clinical
Psychological Science, 1(2), 192–212. http://doi.org/10.1177/2167702612466547
Williams, D. R., & Williams, H. (1969). Auto-maintenance in the pigeon: sustained pecking
despite contingent non-reinforcement. Journal of the Experimental Analysis of Behavior,
12(4), 511–520. http://doi.org/10.1901/jeab.1969.12-511
333
Wolfe, J. M., Butcher, S. J., Lee, C., & Hyle, M. (2003). Changing your mind: on the
contributions of top-down and bottom-up guidance in visual search for feature
singletons. Journal of Experimental Psychology. Human Perception and Performance,
29(2), 483–502. http://doi.org/10.1037/0096-1523.29.2.483
Wong, D. F., Kuwabara, H., Schretlen, D. J., Bonson, K. R., Zhou, Y., Nandi, A., … Rohde,
C. (2006). Increased Occupancy of Dopamine Receptors in Human Striatum during
Cue-Elicited Cocaine Craving. Neuropsychopharmacology, 31, 2716–2727.
http://doi.org/10.1038/sj.npp.1301194
Yadid, G., Gispan, I., & Lax, E. (2013). Lateral habenula deep brain stimulation for
personalized treatment of drug addiction. Frontiers in Human Neuroscience,
7(December), 806. http://doi.org/10.3389/fnhum.2013.00806
Yager, L. M., Pitchers, K. K., Flagel, S. B., & Robinson, T. E. (2015). Individual Variation in
the Motivational and Neurobiological Effects of an Opioid Cue.
Neuropsychopharmacology, 40(5), 1269–1277. http://doi.org/10.1038/npp.2014.314
Yager, L. M., & Robinson, T. E. (2013). A classically conditioned cocaine cue acquires
greater control over motivated behavior in rats prone to attribute incentive salience to a
food cue. Psychopharmacology, 226(2), 217–228. http://doi.org/10.1007/s00213-012-
2890-y
Yager, L. M., & Robinson, T. E. (2015). Individual variation in the motivational properties of
a nicotine cue: sign-trackers vs. goal-trackers. Psychopharmacology, 232(May), 3149–
3160. http://doi.org/10.1007/s00213-015-3962-6
Yau, H.-J., Wang, D. V., Tsou, J.-H., Chuang, Y.-F., Chen, B. T., Deisseroth, K., … Bonci,
A. (2016). Pontomesencephalic Tegmental Afferents to VTA Non-dopamine Neurons
Are Necessary for Appetitive Pavlovian Learning. Cell Reports, 16(10), 2699–2710.
334
http://doi.org/10.1016/j.celrep.2016.08.007
Yeomans, M. R. (2010). Short term effects of alcohol on appetite in humans. Effects of
context and restrained eating. Appetite, 55(3), 565–573.
http://doi.org/10.1016/j.appet.2010.09.005
Yi, R., Mitchell, S. H., & Bickel, W. K. (2010). Delay discounting and substance abuse-
dependence. In: G. J. Madden & W. K. Bickel (Eds.), Impulsivity: The behavioral and
neurological science of discounting (pp. 191-211). Washington, DC: American
Psychological Association.
Zener, K. (1937). The Significance of Behavior Accompanying Conditioned Salivary
Secretion for Theories of the Conditioned Response. The American Journal of
Pyschology, 50(1), 384–403.
Zénon, A., Duclos, Y., Carron, R., Witjas, T., Baunez, C., Régis, J., … Eusebio, A. (2016).
The human subthalamic nucleus encodes the subjective value of reward and the cost of
effort during decision-making. Brain, 139(Pt 6), 1830–1843.
http://doi.org/10.1093/brain/aww075
Zuckerman, M., Kuhlman, D. M., Joireman, J., Teta, P., & Kraft, M. (1993). A Comparison
of Three Structural Models for Personality : The Big Three , the Big Five , and the
Alternative Five. Journal of Personality and Social Psychology, 65(4), 757–768.
335
Appendices
The following appendices contain information (descriptive and analytic) which was deemed
too cumbersome for inclusion in the experimental chapters, but which are presented here for
clarity and completeness.
Appendix A
This appendix presents information from Study 1 (Chapter Three) regarding the calculation
of task outcome variables for the MTTT32 (Table A1) and ASTT (Table A2).
32 It should be noted that there were originally 52 outcomes measures in Table 1, with the now-absent variables all consisting of “Reward” variables – the mean of chocolate and alcohol responses. The reason these were dropped is because many of them were simply the inverse of the “Neutral” variables, due to the way they are calculated. For example, Reward dwell time bias was calculated as (Alcohol OT GDT bias + Chocolate
OT GDT bias) ÷ 2 – Neutral OT GDT bias, while Neutral bias was calculated as Neutral OT GDT bias – (Alcohol
OT GDT bias + Chocolate OT GDT bias) ÷ 2. It was also decided that the remaining Reward variables should be removed as such variables would be unlikely to add any substance to the analyses if neither reward variables (chocolate or alcohol) produced significant results; likewise, if one (alcohol) did and the other (chocolate) didn’t, a generic reward variable – an average of the two – would not provide any new information (i.e., alcohol may have been “pulled down” by chocolate, or chocolate “pulled up” to significance by alcohol – either way, nothing new is learned).
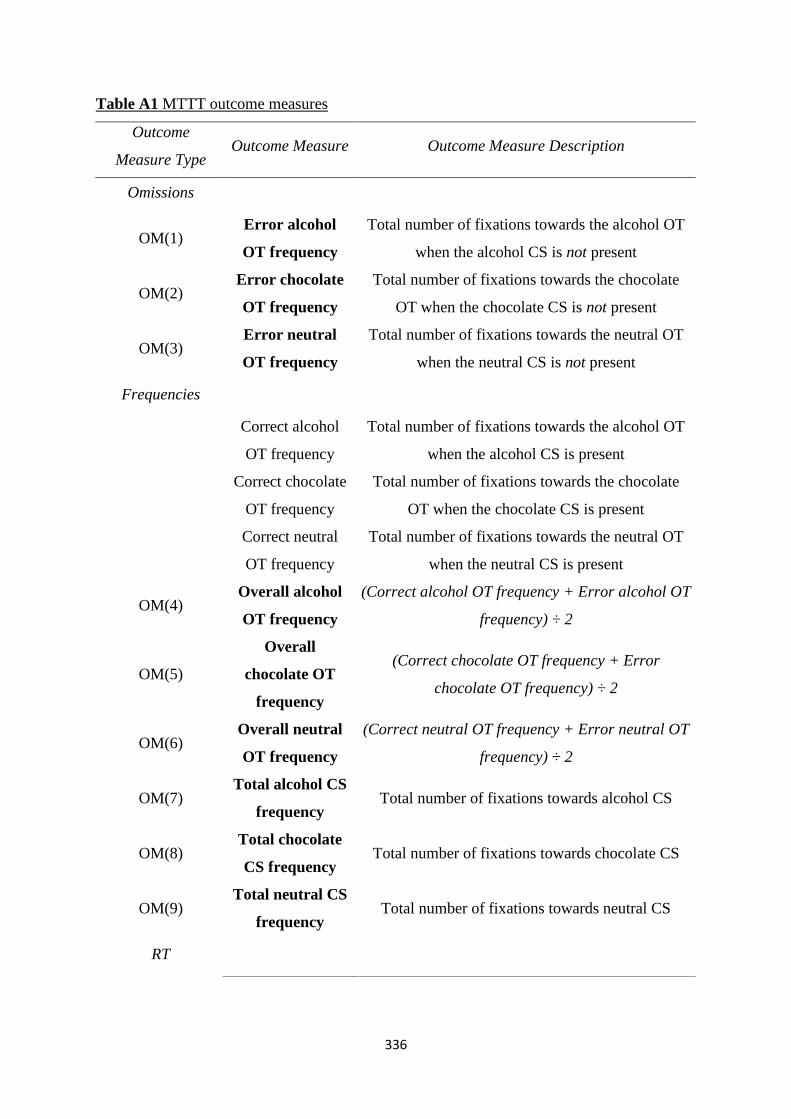
336
Table A1 MTTT outcome measures
Outcome
Measure Type Outcome Measure Outcome Measure Description
Omissions
OM(1) Error alcohol
OT frequency
Total number of fixations towards the alcohol OT
when the alcohol CS is not present
OM(2) Error chocolate
OT frequency
Total number of fixations towards the chocolate
OT when the chocolate CS is not present
OM(3) Error neutral
OT frequency
Total number of fixations towards the neutral OT
when the neutral CS is not present
Frequencies
Correct alcohol
OT frequency
Total number of fixations towards the alcohol OT
when the alcohol CS is present
Correct chocolate
OT frequency
Total number of fixations towards the chocolate
OT when the chocolate CS is present
Correct neutral
OT frequency
Total number of fixations towards the neutral OT
when the neutral CS is present
OM(4) Overall alcohol
OT frequency
(Correct alcohol OT frequency + Error alcohol OT
frequency) ÷ 2
OM(5)
Overall
chocolate OT
frequency
(Correct chocolate OT frequency + Error
chocolate OT frequency) ÷ 2
OM(6) Overall neutral
OT frequency
(Correct neutral OT frequency + Error neutral OT
frequency) ÷ 2
OM(7) Total alcohol CS
frequency Total number of fixations towards alcohol CS
OM(8) Total chocolate
CS frequency Total number of fixations towards chocolate CS
OM(9) Total neutral CS
frequency Total number of fixations towards neutral CS
RT

337
Mean alcohol OT
RT
Mean RT towards alcohol OT when the alcohol CS
is present
Mean chocolate
OT RT
Mean RT towards chocolate OT when the
chocolate CS is present
Mean neutral OT
RT
Mean RT towards neutral OT when the neutral CS
is present
RT: Bias
OM(10) Alcohol RT bias (Mean chocolate OT RT + Mean neutral OT RT) –
Mean alcohol OT RT
OM(11) Chocolate RT
bias
(Mean alcohol OT RT + Mean neutral OT RT) –
Mean chocolate OT RT
OM(12) Neutral RT bias (Mean alcohol OT RT + Mean chocolate OT RT) –
Mean neutral OT RT
Gaze Dwell Time
Correct alcohol
OT GDT
Fixation duration within the alcohol OT when the
alcohol CS is present
Correct chocolate
OT GDT
Fixation duration within the chocolate OT when
the chocolate CS is present
Correct neutral
OT GDT
Fixation duration within the neutral OT when the
neutral CS is present
Error alcohol OT
GDT
Fixation duration within the alcohol OT when the
alcohol CS is not present
Error chocolate
OT GDT
Fixation duration within the chocolate OT when
the chocolate CS is not present
Error neutral OT
GDT
Fixation duration within the neutral OT when the
neutral CS is not present
Overall alcohol
OT GDT
(Correct alcohol OT GDT + Error alcohol OT
GDT) ÷ 2
Overall chocolate
OT GDT
(Correct chocolate OT GDT + Error chocolate OT
GDT) ÷ 2
Overall neutral
OT GDT
(Correct neutral OT GDT + Error neutral OT
GDT) ÷ 2
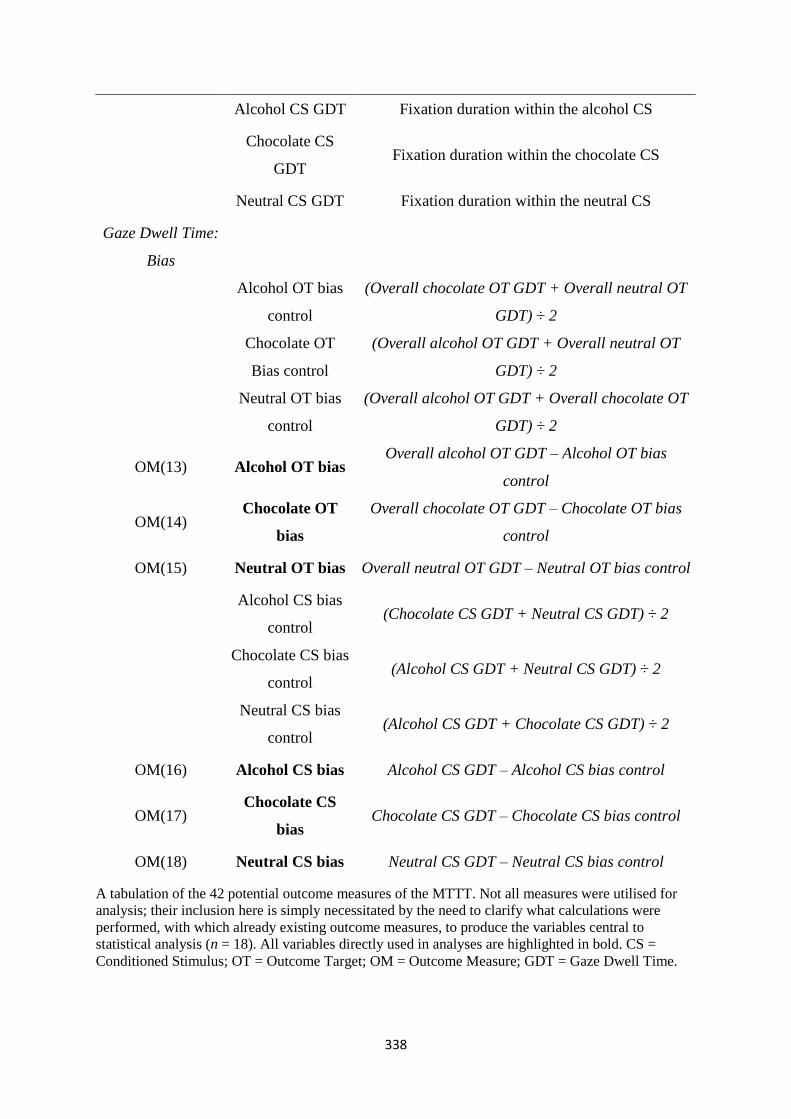
338
A tabulation of the 42 potential outcome measures of the MTTT. Not all measures were utilised for
analysis; their inclusion here is simply necessitated by the need to clarify what calculations were
performed, with which already existing outcome measures, to produce the variables central to
statistical analysis (n = 18). All variables directly used in analyses are highlighted in bold. CS =
Conditioned Stimulus; OT = Outcome Target; OM = Outcome Measure; GDT = Gaze Dwell Time.
Alcohol CS GDT Fixation duration within the alcohol CS
Chocolate CS
GDT Fixation duration within the chocolate CS
Neutral CS GDT Fixation duration within the neutral CS
Gaze Dwell Time:
Bias
Alcohol OT bias
control
(Overall chocolate OT GDT + Overall neutral OT
GDT) ÷ 2
Chocolate OT
Bias control
(Overall alcohol OT GDT + Overall neutral OT
GDT) ÷ 2
Neutral OT bias
control
(Overall alcohol OT GDT + Overall chocolate OT
GDT) ÷ 2
OM(13) Alcohol OT bias Overall alcohol OT GDT – Alcohol OT bias
control
OM(14) Chocolate OT
bias
Overall chocolate OT GDT – Chocolate OT bias
control
OM(15) Neutral OT bias Overall neutral OT GDT – Neutral OT bias control
Alcohol CS bias
control (Chocolate CS GDT + Neutral CS GDT) ÷ 2
Chocolate CS bias
control (Alcohol CS GDT + Neutral CS GDT) ÷ 2
Neutral CS bias
control (Alcohol CS GDT + Chocolate CS GDT) ÷ 2
OM(16) Alcohol CS bias Alcohol CS GDT – Alcohol CS bias control
OM(17) Chocolate CS
bias Chocolate CS GDT – Chocolate CS bias control
OM(18) Neutral CS bias Neutral CS GDT – Neutral CS bias control
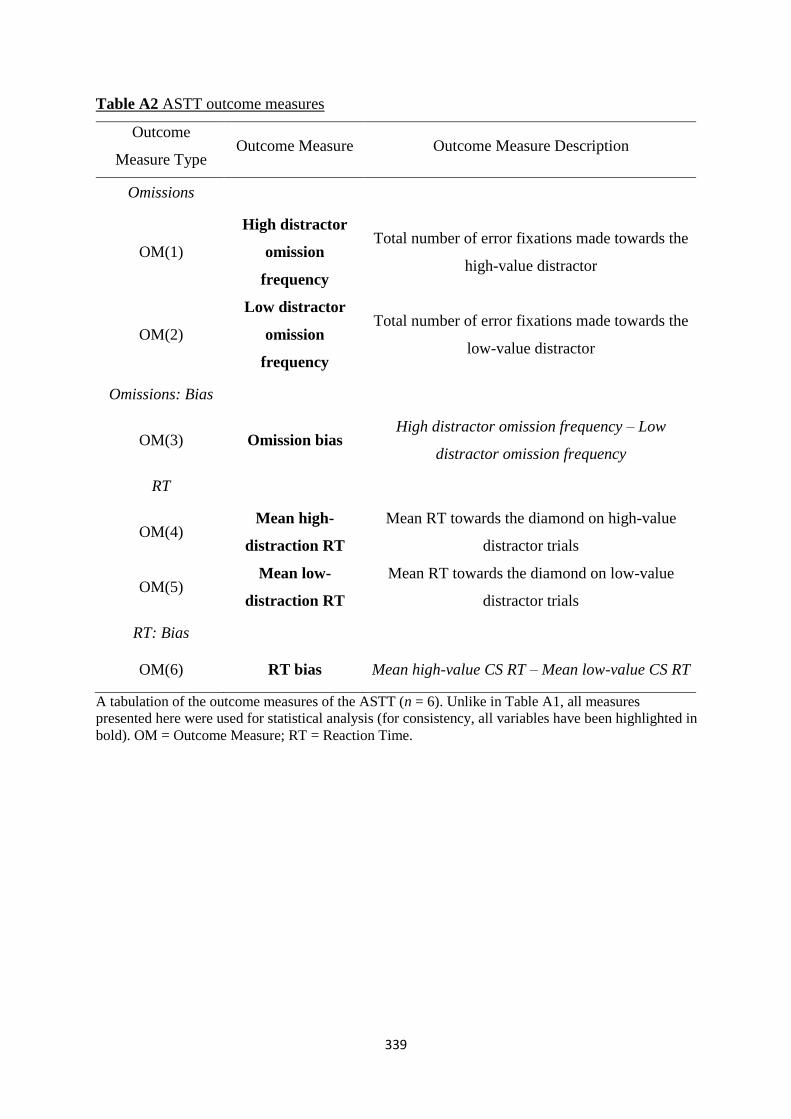
339
Table A2 ASTT outcome measures
Outcome
Measure Type Outcome Measure Outcome Measure Description
Omissions
OM(1)
High distractor
omission
frequency
Total number of error fixations made towards the
high-value distractor
OM(2)
Low distractor
omission
frequency
Total number of error fixations made towards the
low-value distractor
Omissions: Bias
OM(3) Omission bias High distractor omission frequency – Low
distractor omission frequency
RT
OM(4) Mean high-
distraction RT
Mean RT towards the diamond on high-value
distractor trials
OM(5) Mean low-
distraction RT
Mean RT towards the diamond on low-value
distractor trials
RT: Bias
OM(6) RT bias Mean high-value CS RT – Mean low-value CS RT
A tabulation of the outcome measures of the ASTT (n = 6). Unlike in Table A1, all measures
presented here were used for statistical analysis (for consistency, all variables have been highlighted in
bold). OM = Outcome Measure; RT = Reaction Time.
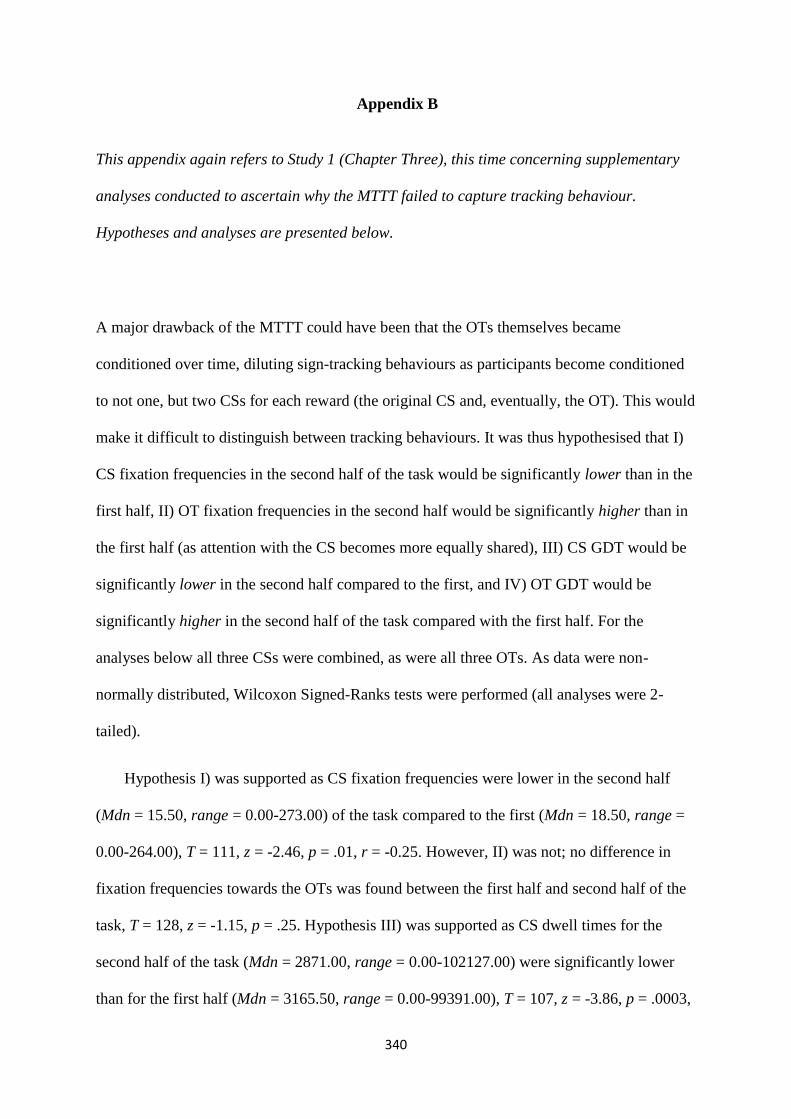
340
Appendix B
This appendix again refers to Study 1 (Chapter Three), this time concerning supplementary
analyses conducted to ascertain why the MTTT failed to capture tracking behaviour.
Hypotheses and analyses are presented below.
A major drawback of the MTTT could have been that the OTs themselves became
conditioned over time, diluting sign-tracking behaviours as participants become conditioned
to not one, but two CSs for each reward (the original CS and, eventually, the OT). This would
make it difficult to distinguish between tracking behaviours. It was thus hypothesised that I)
CS fixation frequencies in the second half of the task would be significantly lower than in the
first half, II) OT fixation frequencies in the second half would be significantly higher than in
the first half (as attention with the CS becomes more equally shared), III) CS GDT would be
significantly lower in the second half compared to the first, and IV) OT GDT would be
significantly higher in the second half of the task compared with the first half. For the
analyses below all three CSs were combined, as were all three OTs. As data were non-
normally distributed, Wilcoxon Signed-Ranks tests were performed (all analyses were 2-
tailed).
Hypothesis I) was supported as CS fixation frequencies were lower in the second half
(Mdn = 15.50, range = 0.00-273.00) of the task compared to the first (Mdn = 18.50, range =
0.00-264.00), T = 111, z = -2.46, p = .01, r = -0.25. However, II) was not; no difference in
fixation frequencies towards the OTs was found between the first half and second half of the
task, T = 128, z = -1.15, p = .25. Hypothesis III) was supported as CS dwell times for the
second half of the task (Mdn = 2871.00, range = 0.00-102127.00) were significantly lower
than for the first half (Mdn = 3165.50, range = 0.00-99391.00), T = 107, z = -3.86, p = .0003,
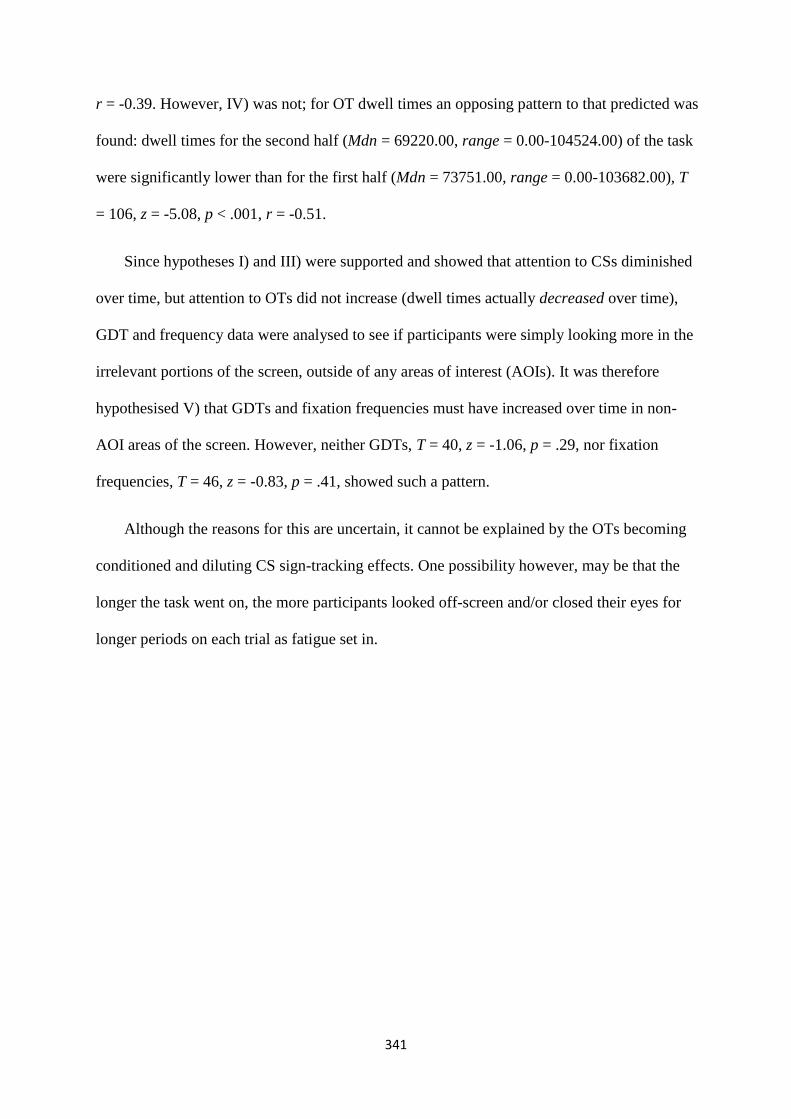
341
r = -0.39. However, IV) was not; for OT dwell times an opposing pattern to that predicted was
found: dwell times for the second half (Mdn = 69220.00, range = 0.00-104524.00) of the task
were significantly lower than for the first half (Mdn = 73751.00, range = 0.00-103682.00), T
= 106, z = -5.08, p < .001, r = -0.51.
Since hypotheses I) and III) were supported and showed that attention to CSs diminished
over time, but attention to OTs did not increase (dwell times actually decreased over time),
GDT and frequency data were analysed to see if participants were simply looking more in the
irrelevant portions of the screen, outside of any areas of interest (AOIs). It was therefore
hypothesised V) that GDTs and fixation frequencies must have increased over time in non-
AOI areas of the screen. However, neither GDTs, T = 40, z = -1.06, p = .29, nor fixation
frequencies, T = 46, z = -0.83, p = .41, showed such a pattern.
Although the reasons for this are uncertain, it cannot be explained by the OTs becoming
conditioned and diluting CS sign-tracking effects. One possibility however, may be that the
longer the task went on, the more participants looked off-screen and/or closed their eyes for
longer periods on each trial as fatigue set in.

342
Appendix C
This appendix concerns the correlation matrix for Study 1 (Chapter Three) between task and
self-report measures (Table C1) as well as Welch’s t-test contrasts for trait and state
measures between sign-trackers and goal-trackers (Table C2).
Whether task performance was associated with alcohol use and personality factors was
investigated. In the correlations shown below (Table C1), Holm’s (1979) sequentially-
rejective Bonferroni correction has been applied to control the familywise Type 1 error rate
(but not the experimentwise error rate), with each ‘family’ being chosen due to the measures’
relation to each other. For example, all measures of impulsivity constitute a family, as we
predict that sign-tracking will be broadly related to impulsivity (without any specific
predictions regarding impulsivity subcomponents). This method of correction can be shown
as
α
n – number of corrections already applied
where n is the number of ‘family’ components. The first correction (the most stringent) is
applied to the correlation possessing the highest level of significance; thus, the familywise
corrected alphas for impulsivity measures are .05/4 = .01, .05/3 = .02, .05/2 = .02 and .05/1 =
.05. Testing ceases when the first non-significant interaction is encountered in each family,
after which all remaining (untested) null hypotheses are accepted (Sankoh, Huque, & Dubey,
1997). All correlations are 2-tailed.
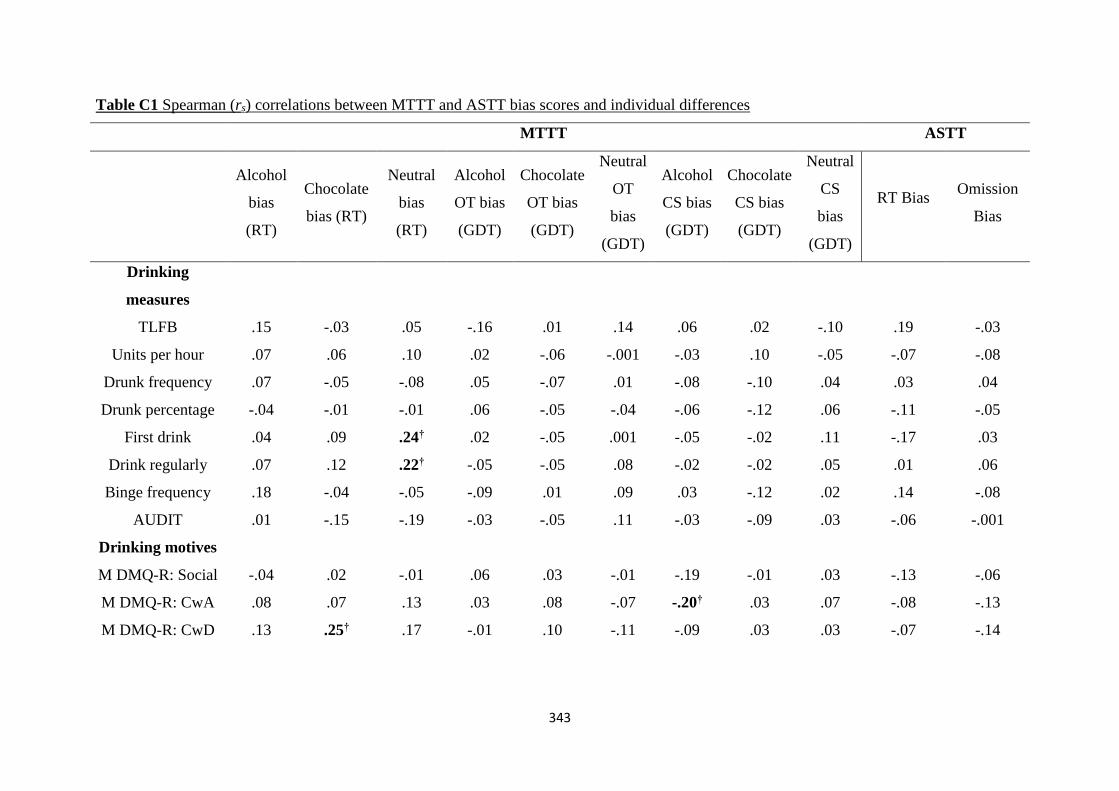
343
Table C1 Spearman (rs) correlations between MTTT and ASTT bias scores and individual differences
MTTT ASTT
Alcohol
bias
(RT)
Chocolate
bias (RT)
Neutral
bias
(RT)
Alcohol
OT bias
(GDT)
Chocolate
OT bias
(GDT)
Neutral
OT
bias
(GDT)
Alcohol
CS bias
(GDT)
Chocolate
CS bias
(GDT)
Neutral
CS
bias
(GDT)
RT Bias
Omission
Bias
Drinking
measures
TLFB .15 -.03 .05 -.16 .01 .14 .06 .02 -.10 .19 -.03
Units per hour .07 .06 .10 .02 -.06 -.001 -.03 .10 -.05 -.07 -.08
Drunk frequency .07 -.05 -.08 .05 -.07 .01 -.08 -.10 .04 .03 .04
Drunk percentage -.04 -.01 -.01 .06 -.05 -.04 -.06 -.12 .06 -.11 -.05
First drink .04 .09 .24† .02 -.05 .001 -.05 -.02 .11 -.17 .03
Drink regularly .07 .12 .22† -.05 -.05 .08 -.02 -.02 .05 .01 .06
Binge frequency .18 -.04 -.05 -.09 .01 .09 .03 -.12 .02 .14 -.08
AUDIT .01 -.15 -.19 -.03 -.05 .11 -.03 -.09 .03 -.06 -.001
Drinking motives
M DMQ-R: Social -.04 .02 -.01 .06 .03 -.01 -.19 -.01 .03 -.13 -.06
M DMQ-R: CwA .08 .07 .13 .03 .08 -.07 -.20† .03 .07 -.08 -.13
M DMQ-R: CwD .13 .25† .17 -.01 .10 -.11 -.09 .03 .03 -.07 -.14
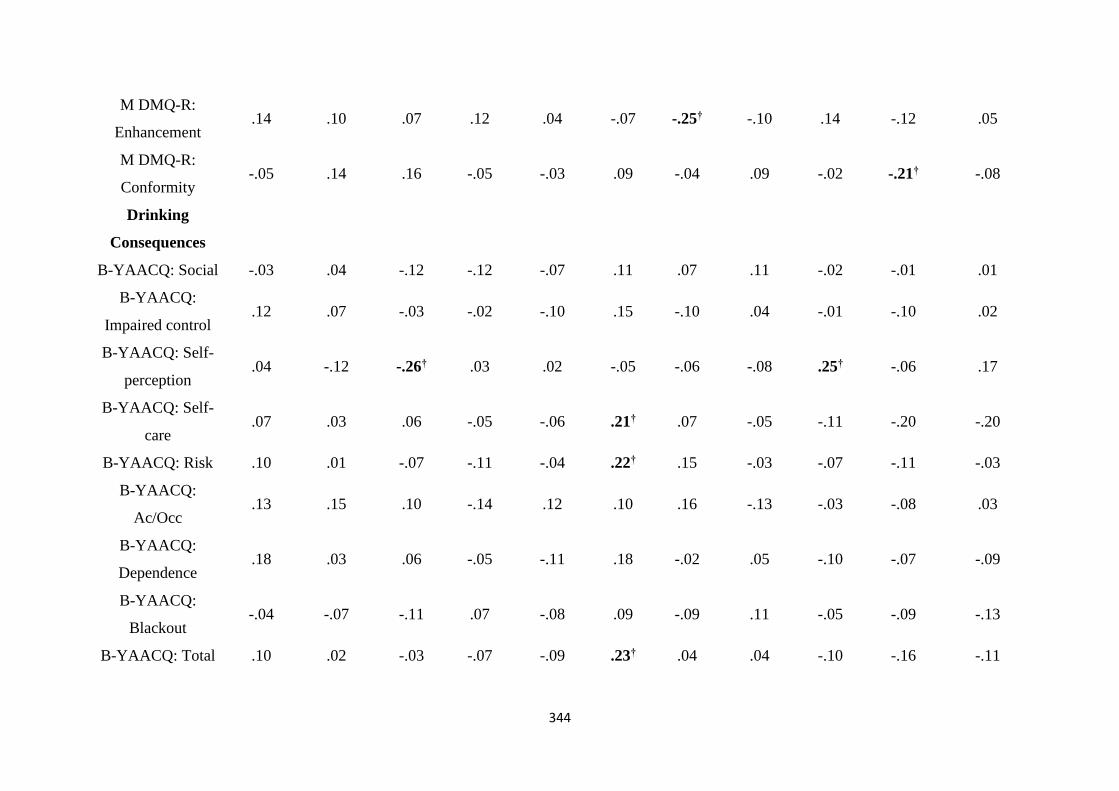
344
M DMQ-R:
Enhancement .14 .10 .07 .12 .04 -.07 -.25† -.10 .14 -.12 .05
M DMQ-R:
Conformity -.05 .14 .16 -.05 -.03 .09 -.04 .09 -.02 -.21† -.08
Drinking
Consequences
B-YAACQ: Social -.03 .04 -.12 -.12 -.07 .11 .07 .11 -.02 -.01 .01
B-YAACQ:
Impaired control .12 .07 -.03 -.02 -.10 .15 -.10 .04 -.01 -.10 .02
B-YAACQ: Self-
perception .04 -.12 -.26† .03 .02 -.05 -.06 -.08 .25† -.06 .17
B-YAACQ: Self-
care .07 .03 .06 -.05 -.06 .21† .07 -.05 -.11 -.20 -.20
B-YAACQ: Risk .10 .01 -.07 -.11 -.04 .22† .15 -.03 -.07 -.11 -.03
B-YAACQ:
Ac/Occ .13 .15 .10 -.14 .12 .10 .16 -.13 -.03 -.08 .03
B-YAACQ:
Dependence .18 .03 .06 -.05 -.11 .18 -.02 .05 -.10 -.07 -.09
B-YAACQ:
Blackout -.04 -.07 -.11 .07 -.08 .09 -.09 .11 -.05 -.09 -.13
B-YAACQ: Total .10 .02 -.03 -.07 -.09 .23† .04 .04 -.10 -.16 -.11
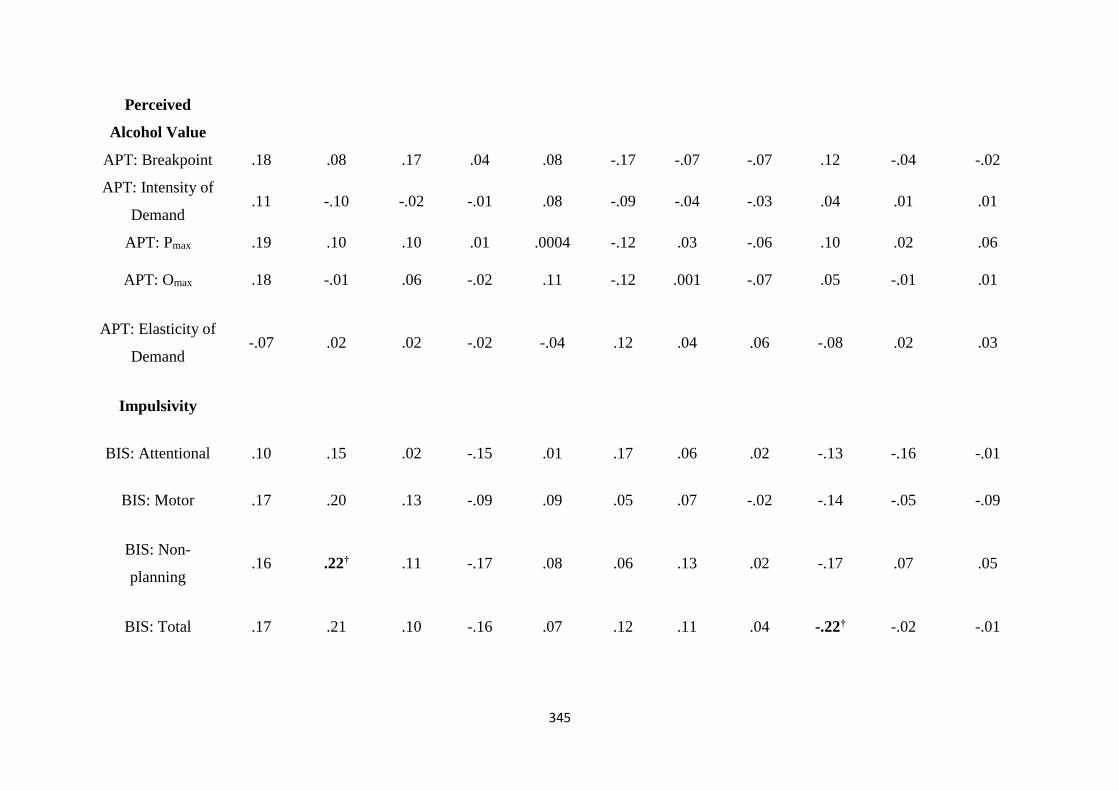
345
Perceived
Alcohol Value
APT: Breakpoint .18 .08 .17 .04 .08 -.17 -.07 -.07 .12 -.04 -.02
APT: Intensity of
Demand .11 -.10 -.02 -.01 .08 -.09 -.04 -.03 .04 .01 .01
APT: Pmax .19 .10 .10 .01 .0004 -.12 .03 -.06 .10 .02 .06
APT: Omax .18 -.01 .06 -.02 .11 -.12 .001 -.07 .05 -.01 .01
APT: Elasticity of
Demand -.07 .02 .02 -.02 -.04 .12 .04 .06 -.08 .02 .03
Impulsivity
BIS: Attentional .10 .15 .02 -.15 .01 .17 .06 .02 -.13 -.16 -.01
BIS: Motor .17 .20 .13 -.09 .09 .05 .07 -.02 -.14 -.05 -.09
BIS: Non-
planning .16 .22† .11 -.17 .08 .06 .13 .02 -.17 .07 .05
BIS: Total .17 .21 .10 -.16 .07 .12 .11 .04 -.22† -.02 -.01

346
ImpSS: Total .23† .16 .04 -.13 .01 .20 .07 -.04 -.13 .07 .08
Trauma and
Abuse
CATS: Sexual
abuse .09 -.04 -.06 -.05 -.001 -.01 .07 .08 .03 -.02 -.06
CATS:
Punishment .01 .11 .02 -.01 -.01 .01 -.02 .05 -.02 -.03 .14
CATS:
Neglect/Negativity .10 -.03 -.19 -.09 .01 .12 .13 -.04 -.03 -.01 .12
CATS: Emotional
abuse -.03 -.08 -.21 -.10 .05 .11 .17 -.08 -.03 -.06 -.02
CATS: Total .04 -.04 -.14 -.12 .07 .09 .14 -.07 -.01 -.04 .06
†Significant only without corrected alpha (p < 0.05), *Significant at the level of the corrected alpha. All 2-tailed. OT = Outcome Target; CS = Conditioned
Stimulus; TLFB = Timeline FollowBack; AUDIT = Alcohol Use Disorders Identification Test; M DMQ-R = Modified Drinking Motives Questionnaire –
Revised; CwA = Coping with Anxiety; CwD = Coping with Depression; B-YAACQ = Brief Young Adult Alcohol Consequences Questionnaire; Ac/Occ =
Academic/Occupational; APT = Alcohol Purchase Task; BIS = Barratt’s Impulsivity Scale; ImpSS = Impulsive Sensation Seeking; CATS = Child Abuse and
Trauma Scale
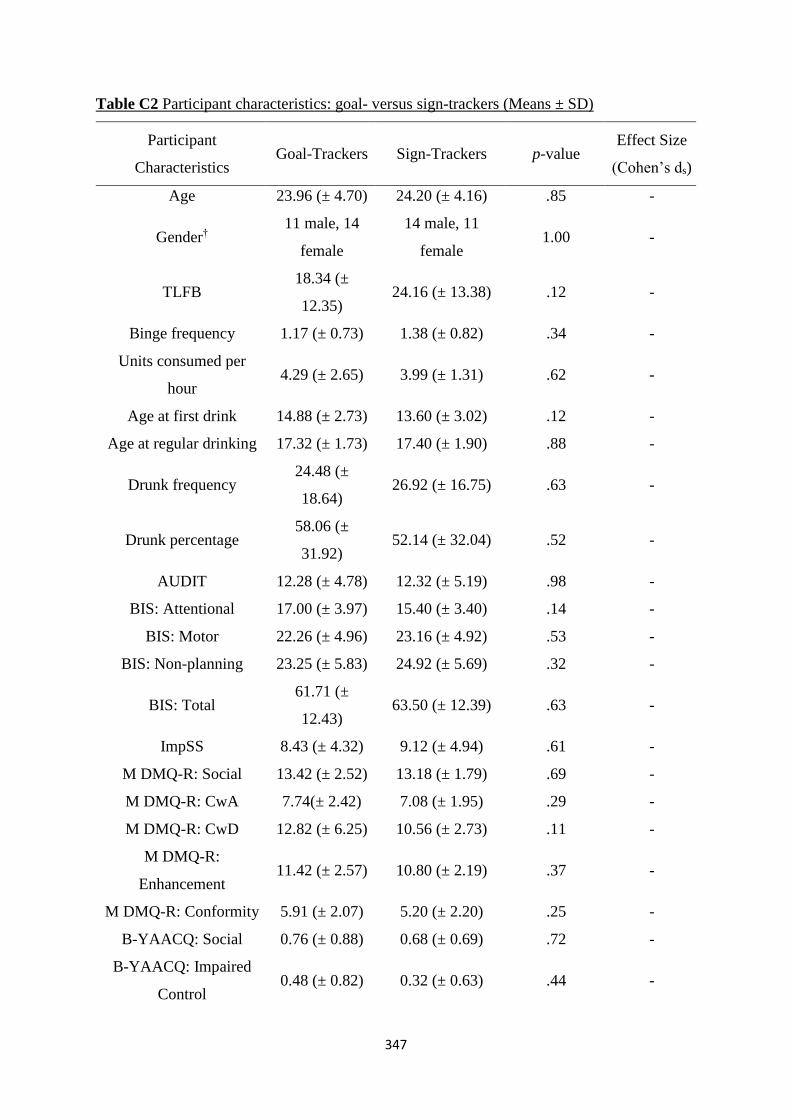
347
Table C2 Participant characteristics: goal- versus sign-trackers (Means ± SD)
Participant
Characteristics Goal-Trackers Sign-Trackers p-value
Effect Size
(Cohen’s ds)
Age 23.96 (± 4.70) 24.20 (± 4.16) .85 -
Gender† 11 male, 14
female
14 male, 11
female 1.00 -
TLFB 18.34 (±
12.35) 24.16 (± 13.38) .12 -
Binge frequency 1.17 (± 0.73) 1.38 (± 0.82) .34 -
Units consumed per
hour 4.29 (± 2.65) 3.99 (± 1.31) .62 -
Age at first drink 14.88 (± 2.73) 13.60 (± 3.02) .12 -
Age at regular drinking 17.32 (± 1.73) 17.40 (± 1.90) .88 -
Drunk frequency 24.48 (±
18.64) 26.92 (± 16.75) .63 -
Drunk percentage 58.06 (±
31.92) 52.14 (± 32.04) .52 -
AUDIT 12.28 (± 4.78) 12.32 (± 5.19) .98 -
BIS: Attentional 17.00 (± 3.97) 15.40 (± 3.40) .14 -
BIS: Motor 22.26 (± 4.96) 23.16 (± 4.92) .53 -
BIS: Non-planning 23.25 (± 5.83) 24.92 (± 5.69) .32 -
BIS: Total 61.71 (±
12.43) 63.50 (± 12.39) .63 -
ImpSS 8.43 (± 4.32) 9.12 (± 4.94) .61 -
M DMQ-R: Social 13.42 (± 2.52) 13.18 (± 1.79) .69 -
M DMQ-R: CwA 7.74(± 2.42) 7.08 (± 1.95) .29 -
M DMQ-R: CwD 12.82 (± 6.25) 10.56 (± 2.73) .11 -
M DMQ-R:
Enhancement 11.42 (± 2.57) 10.80 (± 2.19) .37 -
M DMQ-R: Conformity 5.91 (± 2.07) 5.20 (± 2.20) .25 -
B-YAACQ: Social 0.76 (± 0.88) 0.68 (± 0.69) .72 -
B-YAACQ: Impaired
Control 0.48 (± 0.82) 0.32 (± 0.63) .44 -
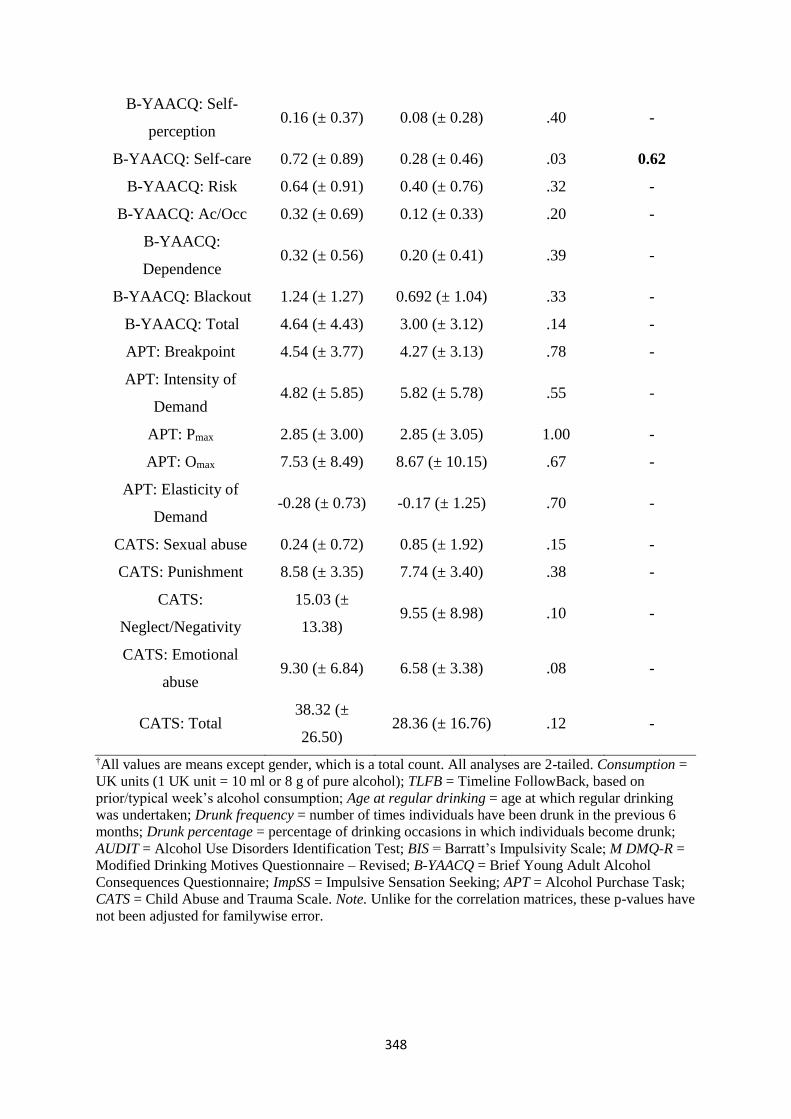
348
B-YAACQ: Self-
perception 0.16 (± 0.37) 0.08 (± 0.28) .40 -
B-YAACQ: Self-care 0.72 (± 0.89) 0.28 (± 0.46) .03 0.62
B-YAACQ: Risk 0.64 (± 0.91) 0.40 (± 0.76) .32 -
B-YAACQ: Ac/Occ 0.32 (± 0.69) 0.12 (± 0.33) .20 -
B-YAACQ:
Dependence 0.32 (± 0.56) 0.20 (± 0.41) .39 -
B-YAACQ: Blackout 1.24 (± 1.27) 0.692 (± 1.04) .33 -
B-YAACQ: Total 4.64 (± 4.43) 3.00 (± 3.12) .14 -
APT: Breakpoint 4.54 (± 3.77) 4.27 (± 3.13) .78 -
APT: Intensity of
Demand 4.82 (± 5.85) 5.82 (± 5.78) .55 -
APT: Pmax 2.85 (± 3.00) 2.85 (± 3.05) 1.00 -
APT: Omax 7.53 (± 8.49) 8.67 (± 10.15) .67 -
APT: Elasticity of
Demand -0.28 (± 0.73) -0.17 (± 1.25) .70 -
CATS: Sexual abuse 0.24 (± 0.72) 0.85 (± 1.92) .15 -
CATS: Punishment 8.58 (± 3.35) 7.74 (± 3.40) .38 -
CATS:
Neglect/Negativity
15.03 (±
13.38) 9.55 (± 8.98) .10 -
CATS: Emotional
abuse 9.30 (± 6.84) 6.58 (± 3.38) .08 -
CATS: Total 38.32 (±
26.50) 28.36 (± 16.76) .12 -
†All values are means except gender, which is a total count. All analyses are 2-tailed. Consumption =
UK units (1 UK unit = 10 ml or 8 g of pure alcohol); TLFB = Timeline FollowBack, based on
prior/typical week’s alcohol consumption; Age at regular drinking = age at which regular drinking
was undertaken; Drunk frequency = number of times individuals have been drunk in the previous 6
months; Drunk percentage = percentage of drinking occasions in which individuals become drunk;
AUDIT = Alcohol Use Disorders Identification Test; BIS = Barratt’s Impulsivity Scale; M DMQ-R =
Modified Drinking Motives Questionnaire – Revised; B-YAACQ = Brief Young Adult Alcohol
Consequences Questionnaire; ImpSS = Impulsive Sensation Seeking; APT = Alcohol Purchase Task;
CATS = Child Abuse and Trauma Scale. Note. Unlike for the correlation matrices, these p-values have
not been adjusted for familywise error.
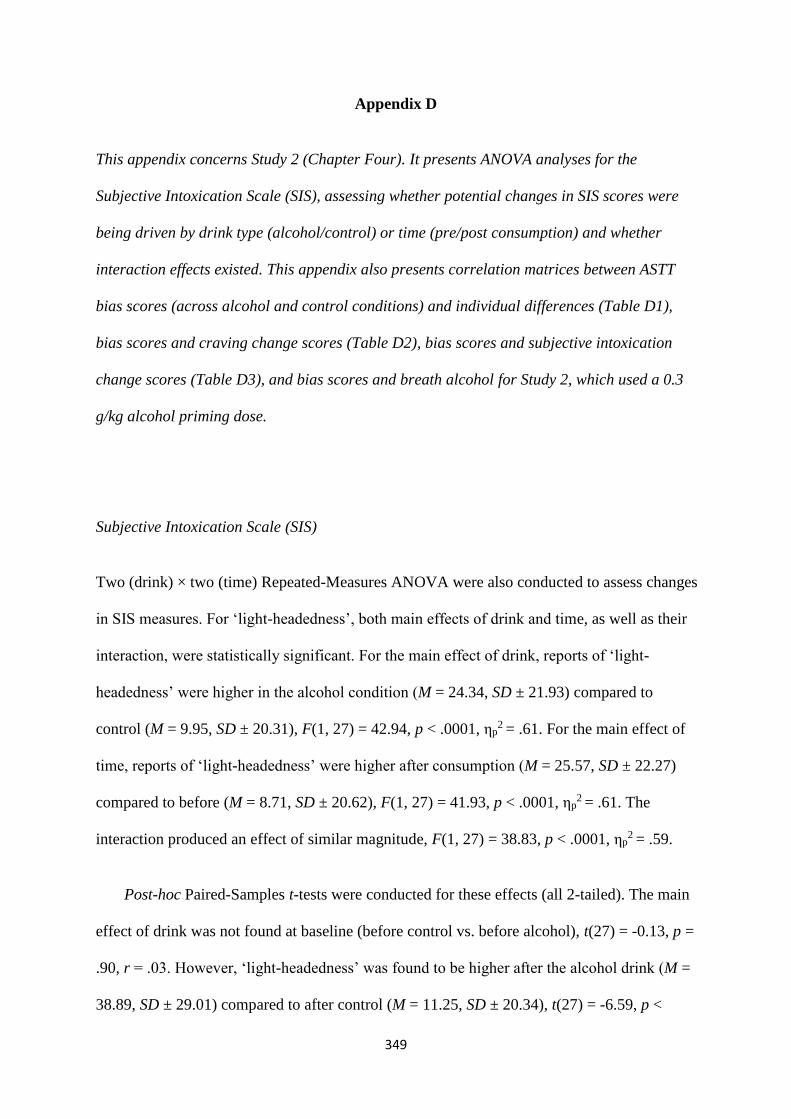
349
Appendix D
This appendix concerns Study 2 (Chapter Four). It presents ANOVA analyses for the
Subjective Intoxication Scale (SIS), assessing whether potential changes in SIS scores were
being driven by drink type (alcohol/control) or time (pre/post consumption) and whether
interaction effects existed. This appendix also presents correlation matrices between ASTT
bias scores (across alcohol and control conditions) and individual differences (Table D1),
bias scores and craving change scores (Table D2), bias scores and subjective intoxication
change scores (Table D3), and bias scores and breath alcohol for Study 2, which used a 0.3
g/kg alcohol priming dose.
Subjective Intoxication Scale (SIS)
Two (drink) × two (time) Repeated-Measures ANOVA were also conducted to assess changes
in SIS measures. For ‘light-headedness’, both main effects of drink and time, as well as their
interaction, were statistically significant. For the main effect of drink, reports of ‘light-
headedness’ were higher in the alcohol condition (M = 24.34, SD ± 21.93) compared to
control (M = 9.95, SD ± 20.31), F(1, 27) = 42.94, p < .0001, ηp2 = .61. For the main effect of
time, reports of ‘light-headedness’ were higher after consumption (M = 25.57, SD ± 22.27)
compared to before (M = 8.71, SD ± 20.62), F(1, 27) = 41.93, p < .0001, ηp2 = .61. The
interaction produced an effect of similar magnitude, F(1, 27) = 38.83, p < .0001, ηp2 = .59.
Post-hoc Paired-Samples t-tests were conducted for these effects (all 2-tailed). The main
effect of drink was not found at baseline (before control vs. before alcohol), t(27) = -0.13, p =
.90, r = .03. However, ‘light-headedness’ was found to be higher after the alcohol drink (M =
38.89, SD ± 29.01) compared to after control (M = 11.25, SD ± 20.34), t(27) = -6.59, p <
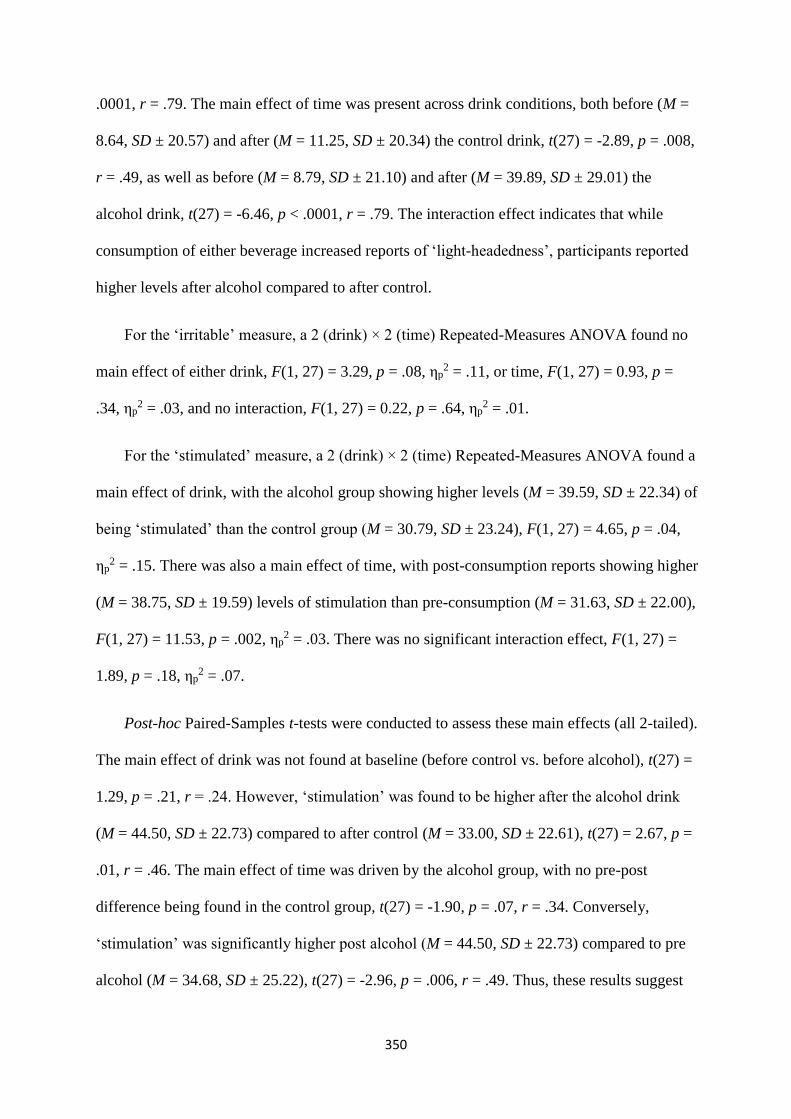
350
.0001, r = .79. The main effect of time was present across drink conditions, both before (M =
8.64, SD ± 20.57) and after (M = 11.25, SD ± 20.34) the control drink, t(27) = -2.89, p = .008,
r = .49, as well as before (M = 8.79, SD ± 21.10) and after (M = 39.89, SD ± 29.01) the
alcohol drink, t(27) = -6.46, p < .0001, r = .79. The interaction effect indicates that while
consumption of either beverage increased reports of ‘light-headedness’, participants reported
higher levels after alcohol compared to after control.
For the ‘irritable’ measure, a 2 (drink) × 2 (time) Repeated-Measures ANOVA found no
main effect of either drink, F(1, 27) = 3.29, p = .08, ηp2 = .11, or time, F(1, 27) = 0.93, p =
.34, ηp2 = .03, and no interaction, F(1, 27) = 0.22, p = .64, ηp
2 = .01.
For the ‘stimulated’ measure, a 2 (drink) × 2 (time) Repeated-Measures ANOVA found a
main effect of drink, with the alcohol group showing higher levels (M = 39.59, SD ± 22.34) of
being ‘stimulated’ than the control group (M = 30.79, SD ± 23.24), F(1, 27) = 4.65, p = .04,
ηp2 = .15. There was also a main effect of time, with post-consumption reports showing higher
(M = 38.75, SD ± 19.59) levels of stimulation than pre-consumption (M = 31.63, SD ± 22.00),
F(1, 27) = 11.53, p = .002, ηp2 = .03. There was no significant interaction effect, F(1, 27) =
1.89, p = .18, ηp2 = .07.
Post-hoc Paired-Samples t-tests were conducted to assess these main effects (all 2-tailed).
The main effect of drink was not found at baseline (before control vs. before alcohol), t(27) =
1.29, p = .21, r = .24. However, ‘stimulation’ was found to be higher after the alcohol drink
(M = 44.50, SD ± 22.73) compared to after control (M = 33.00, SD ± 22.61), t(27) = 2.67, p =
.01, r = .46. The main effect of time was driven by the alcohol group, with no pre-post
difference being found in the control group, t(27) = -1.90, p = .07, r = .34. Conversely,
‘stimulation’ was significantly higher post alcohol (M = 44.50, SD ± 22.73) compared to pre
alcohol (M = 34.68, SD ± 25.22), t(27) = -2.96, p = .006, r = .49. Thus, these results suggest
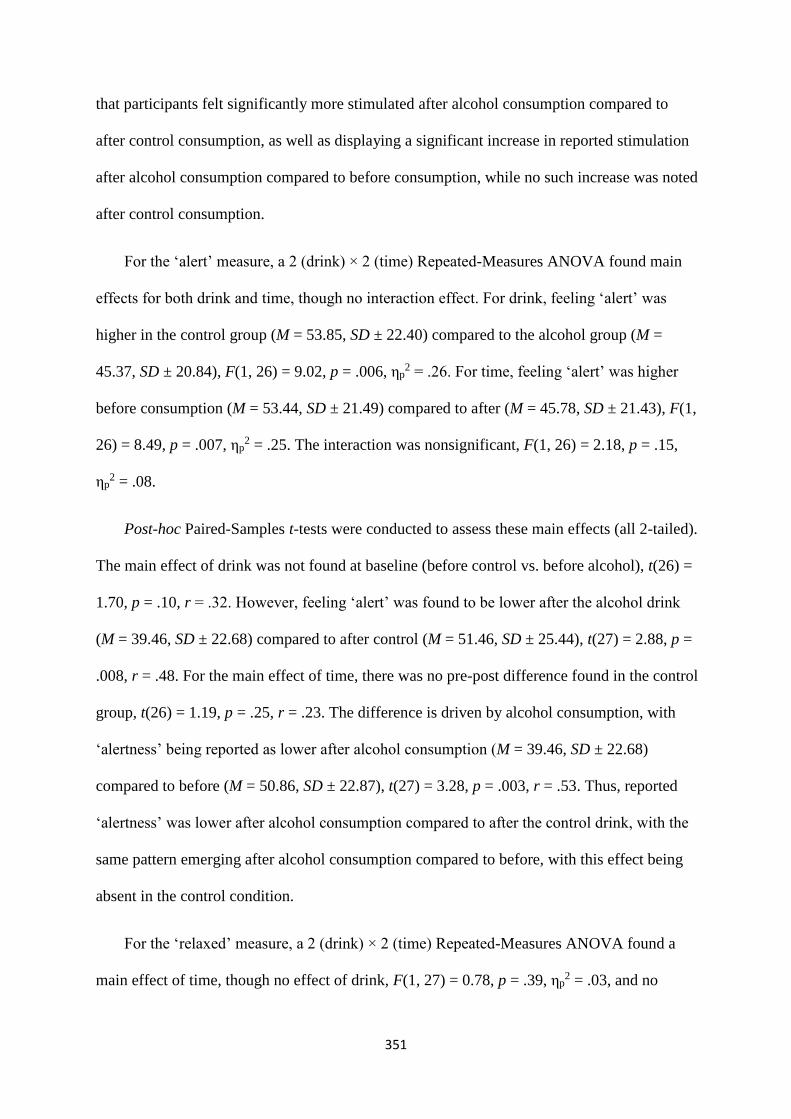
351
that participants felt significantly more stimulated after alcohol consumption compared to
after control consumption, as well as displaying a significant increase in reported stimulation
after alcohol consumption compared to before consumption, while no such increase was noted
after control consumption.
For the ‘alert’ measure, a 2 (drink) × 2 (time) Repeated-Measures ANOVA found main
effects for both drink and time, though no interaction effect. For drink, feeling ‘alert’ was
higher in the control group (M = 53.85, SD ± 22.40) compared to the alcohol group (M =
45.37, SD ± 20.84), F(1, 26) = 9.02, p = .006, ηp2 = .26. For time, feeling ‘alert’ was higher
before consumption (M = 53.44, SD ± 21.49) compared to after (M = 45.78, SD ± 21.43), F(1,
26) = 8.49, p = .007, ηp2 = .25. The interaction was nonsignificant, F(1, 26) = 2.18, p = .15,
ηp2 = .08.
Post-hoc Paired-Samples t-tests were conducted to assess these main effects (all 2-tailed).
The main effect of drink was not found at baseline (before control vs. before alcohol), t(26) =
1.70, p = .10, r = .32. However, feeling ‘alert’ was found to be lower after the alcohol drink
(M = 39.46, SD ± 22.68) compared to after control (M = 51.46, SD ± 25.44), t(27) = 2.88, p =
.008, r = .48. For the main effect of time, there was no pre-post difference found in the control
group, t(26) = 1.19, p = .25, r = .23. The difference is driven by alcohol consumption, with
‘alertness’ being reported as lower after alcohol consumption (M = 39.46, SD ± 22.68)
compared to before (M = 50.86, SD ± 22.87), t(27) = 3.28, p = .003, r = .53. Thus, reported
‘alertness’ was lower after alcohol consumption compared to after the control drink, with the
same pattern emerging after alcohol consumption compared to before, with this effect being
absent in the control condition.
For the ‘relaxed’ measure, a 2 (drink) × 2 (time) Repeated-Measures ANOVA found a
main effect of time, though no effect of drink, F(1, 27) = 0.78, p = .39, ηp2 = .03, and no

352
interaction effect, F(1, 27) = 3.88, p = .06, ηp2 = .13. For the main effect of time, feeling
‘relaxed’ was higher after consumption (M = 67.23, SD ± 16.09) compared to before (M =
61.50, SD ± 15.01), F(1, 27) = 5.17, p = .03, ηp2 = .16.
Post-hoc Paired-Samples t-tests were conducted to assess the main effect of time (2-
tailed). There was no significant difference in reported ‘relaxation’ scores between pre and
post consumption of the control drink, t(27) = 0.15, p = .88, r = .03. In the alcohol condition,
‘relaxation’ was higher after consumption (M = 68.79, SD ± 20.39) compared to before (M =
56.89, SD ± 24.39), t(27) = -2.44, p = .02, r = .41. Thus, self-reported ‘relaxation’ is driven by
alcohol consumption, with ‘relaxation’ reported as being higher after alcohol than before.
For the ‘contented’ measure, a 2 (drink) × 2 (time) Repeated-Measures ANOVA found
no main effect of drink, F(1, 27) = 0.31, p = .58, ηp2 = .01, no main effect of time, F(1, 27) =
0.33, p = .57, ηp2 = .01, and no interaction effect, F(1, 27) = 0.20, p = .66, ηp
2 = .007. No post-
hoc tests were conducted.
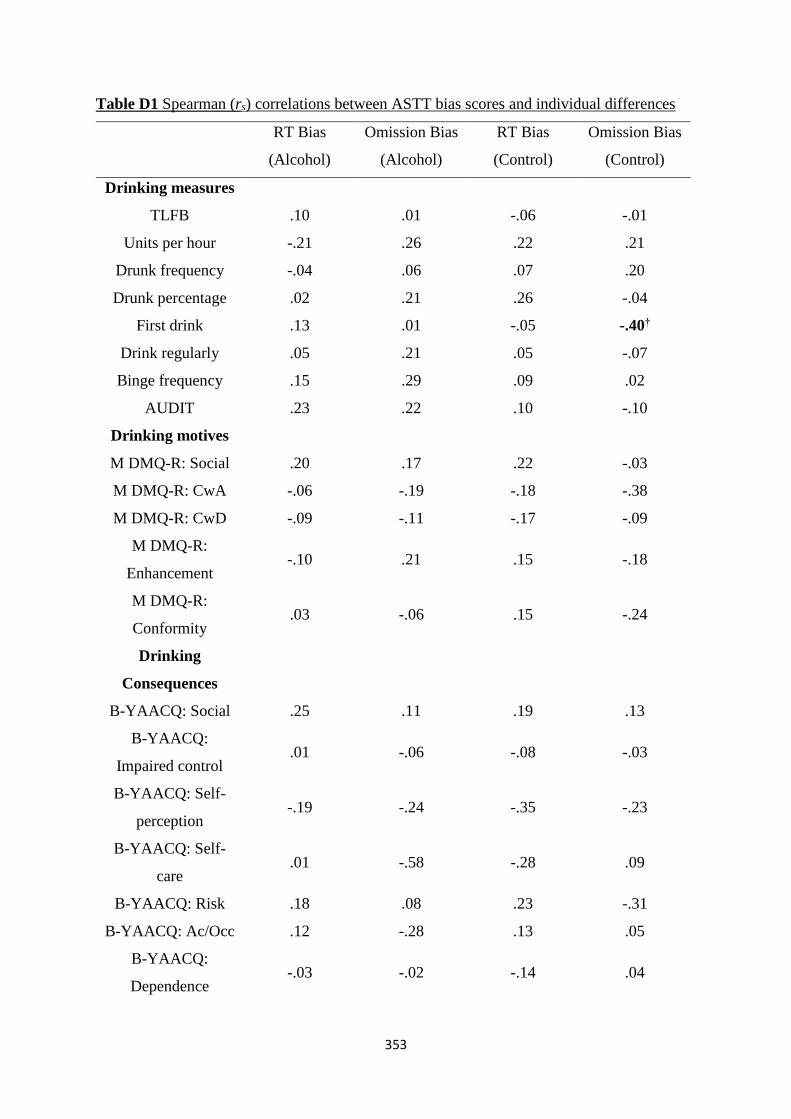
353
Table D1 Spearman (rs) correlations between ASTT bias scores and individual differences
RT Bias
(Alcohol)
Omission Bias
(Alcohol)
RT Bias
(Control)
Omission Bias
(Control)
Drinking measures
TLFB .10 .01 -.06 -.01
Units per hour -.21 .26 .22 .21
Drunk frequency -.04 .06 .07 .20
Drunk percentage .02 .21 .26 -.04
First drink .13 .01 -.05 -.40†
Drink regularly .05 .21 .05 -.07
Binge frequency .15 .29 .09 .02
AUDIT .23 .22 .10 -.10
Drinking motives
M DMQ-R: Social .20 .17 .22 -.03
M DMQ-R: CwA -.06 -.19 -.18 -.38
M DMQ-R: CwD -.09 -.11 -.17 -.09
M DMQ-R:
Enhancement -.10 .21 .15 -.18
M DMQ-R:
Conformity .03 -.06 .15 -.24
Drinking
Consequences
B-YAACQ: Social .25 .11 .19 .13
B-YAACQ:
Impaired control .01 -.06 -.08 -.03
B-YAACQ: Self-
perception -.19 -.24 -.35 -.23
B-YAACQ: Self-
care .01 -.58 -.28 .09
B-YAACQ: Risk .18 .08 .23 -.31
B-YAACQ: Ac/Occ .12 -.28 .13 .05
B-YAACQ:
Dependence -.03 -.02 -.14 .04
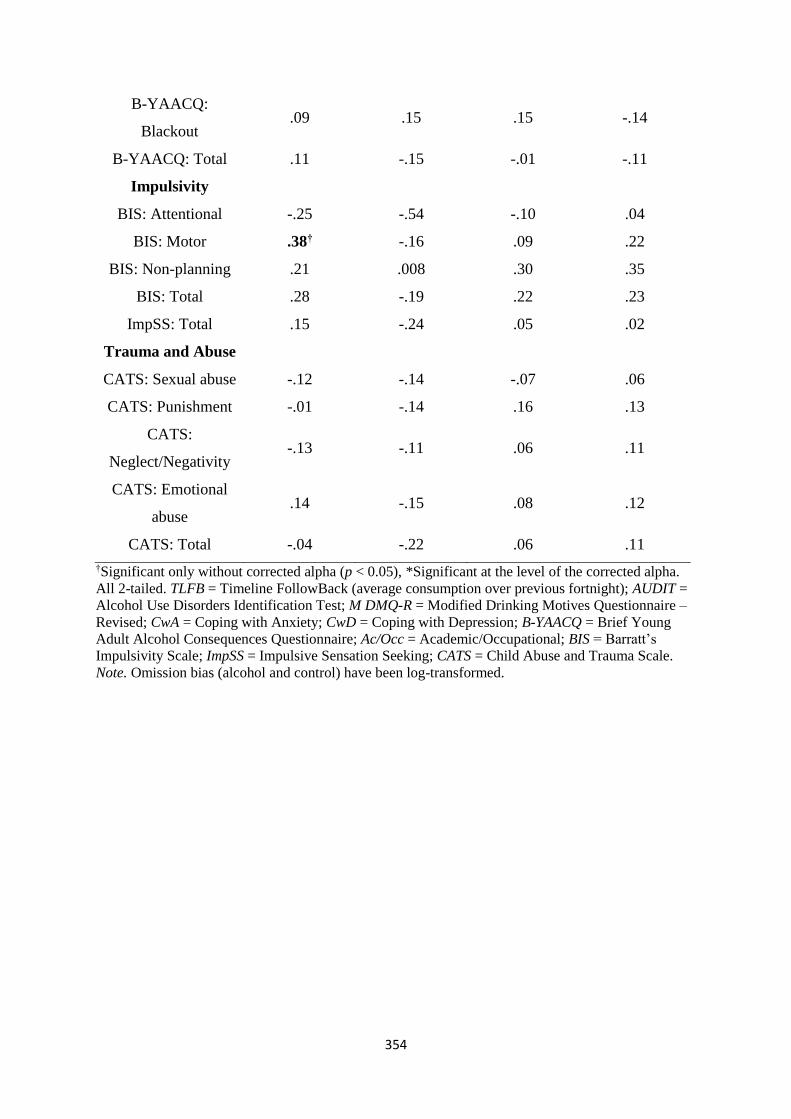
354
B-YAACQ:
Blackout .09 .15 .15 -.14
B-YAACQ: Total .11 -.15 -.01 -.11
Impulsivity
BIS: Attentional -.25 -.54 -.10 .04
BIS: Motor .38† -.16 .09 .22
BIS: Non-planning .21 .008 .30 .35
BIS: Total .28 -.19 .22 .23
ImpSS: Total .15 -.24 .05 .02
Trauma and Abuse
CATS: Sexual abuse -.12 -.14 -.07 .06
CATS: Punishment -.01 -.14 .16 .13
CATS:
Neglect/Negativity -.13 -.11 .06 .11
CATS: Emotional
abuse .14 -.15 .08 .12
CATS: Total -.04 -.22 .06 .11
†Significant only without corrected alpha (p < 0.05), *Significant at the level of the corrected alpha.
All 2-tailed. TLFB = Timeline FollowBack (average consumption over previous fortnight); AUDIT =
Alcohol Use Disorders Identification Test; M DMQ-R = Modified Drinking Motives Questionnaire –
Revised; CwA = Coping with Anxiety; CwD = Coping with Depression; B-YAACQ = Brief Young
Adult Alcohol Consequences Questionnaire; Ac/Occ = Academic/Occupational; BIS = Barratt’s
Impulsivity Scale; ImpSS = Impulsive Sensation Seeking; CATS = Child Abuse and Trauma Scale.
Note. Omission bias (alcohol and control) have been log-transformed.
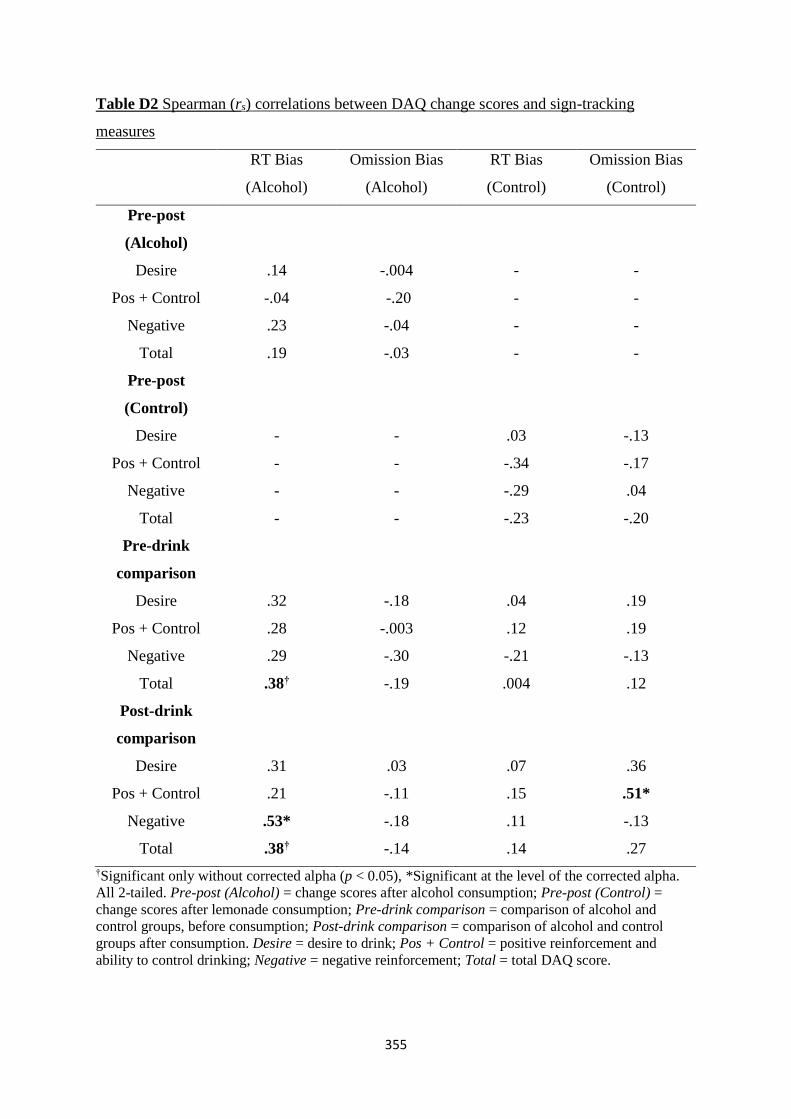
355
Table D2 Spearman (rs) correlations between DAQ change scores and sign-tracking
measures
RT Bias
(Alcohol)
Omission Bias
(Alcohol)
RT Bias
(Control)
Omission Bias
(Control)
Pre-post
(Alcohol)
Desire .14 -.004 - -
Pos + Control -.04 -.20 - -
Negative .23 -.04 - -
Total .19 -.03 - -
Pre-post
(Control)
Desire - - .03 -.13
Pos + Control - - -.34 -.17
Negative - - -.29 .04
Total - - -.23 -.20
Pre-drink
comparison
Desire .32 -.18 .04 .19
Pos + Control .28 -.003 .12 .19
Negative .29 -.30 -.21 -.13
Total .38† -.19 .004 .12
Post-drink
comparison
Desire .31 .03 .07 .36
Pos + Control .21 -.11 .15 .51*
Negative .53* -.18 .11 -.13
Total .38† -.14 .14 .27
†Significant only without corrected alpha (p < 0.05), *Significant at the level of the corrected alpha.
All 2-tailed. Pre-post (Alcohol) = change scores after alcohol consumption; Pre-post (Control) =
change scores after lemonade consumption; Pre-drink comparison = comparison of alcohol and
control groups, before consumption; Post-drink comparison = comparison of alcohol and control
groups after consumption. Desire = desire to drink; Pos + Control = positive reinforcement and
ability to control drinking; Negative = negative reinforcement; Total = total DAQ score.
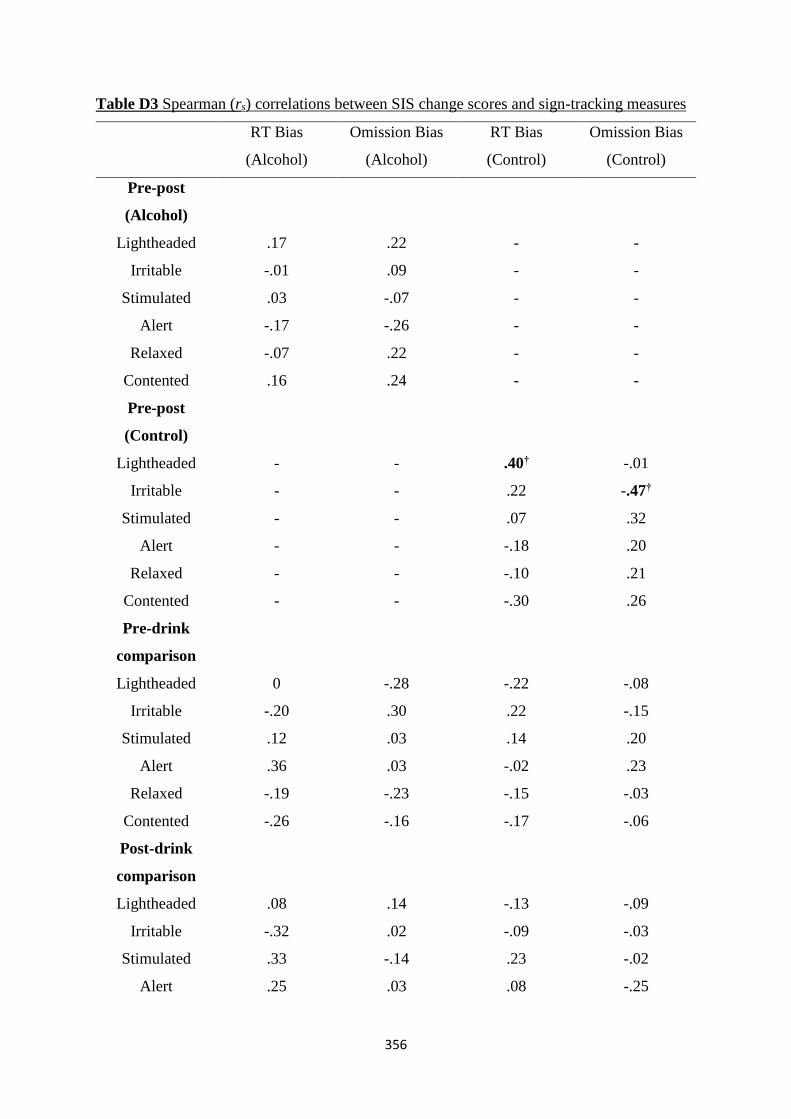
356
Table D3 Spearman (rs) correlations between SIS change scores and sign-tracking measures
RT Bias
(Alcohol)
Omission Bias
(Alcohol)
RT Bias
(Control)
Omission Bias
(Control)
Pre-post
(Alcohol)
Lightheaded .17 .22 - -
Irritable -.01 .09 - -
Stimulated .03 -.07 - -
Alert -.17 -.26 - -
Relaxed -.07 .22 - -
Contented .16 .24 - -
Pre-post
(Control)
Lightheaded - - .40† -.01
Irritable - - .22 -.47†
Stimulated - - .07 .32
Alert - - -.18 .20
Relaxed - - -.10 .21
Contented - - -.30 .26
Pre-drink
comparison
Lightheaded 0 -.28 -.22 -.08
Irritable -.20 .30 .22 -.15
Stimulated .12 .03 .14 .20
Alert .36 .03 -.02 .23
Relaxed -.19 -.23 -.15 -.03
Contented -.26 -.16 -.17 -.06
Post-drink
comparison
Lightheaded .08 .14 -.13 -.09
Irritable -.32 .02 -.09 -.03
Stimulated .33 -.14 .23 -.02
Alert .25 .03 .08 -.25
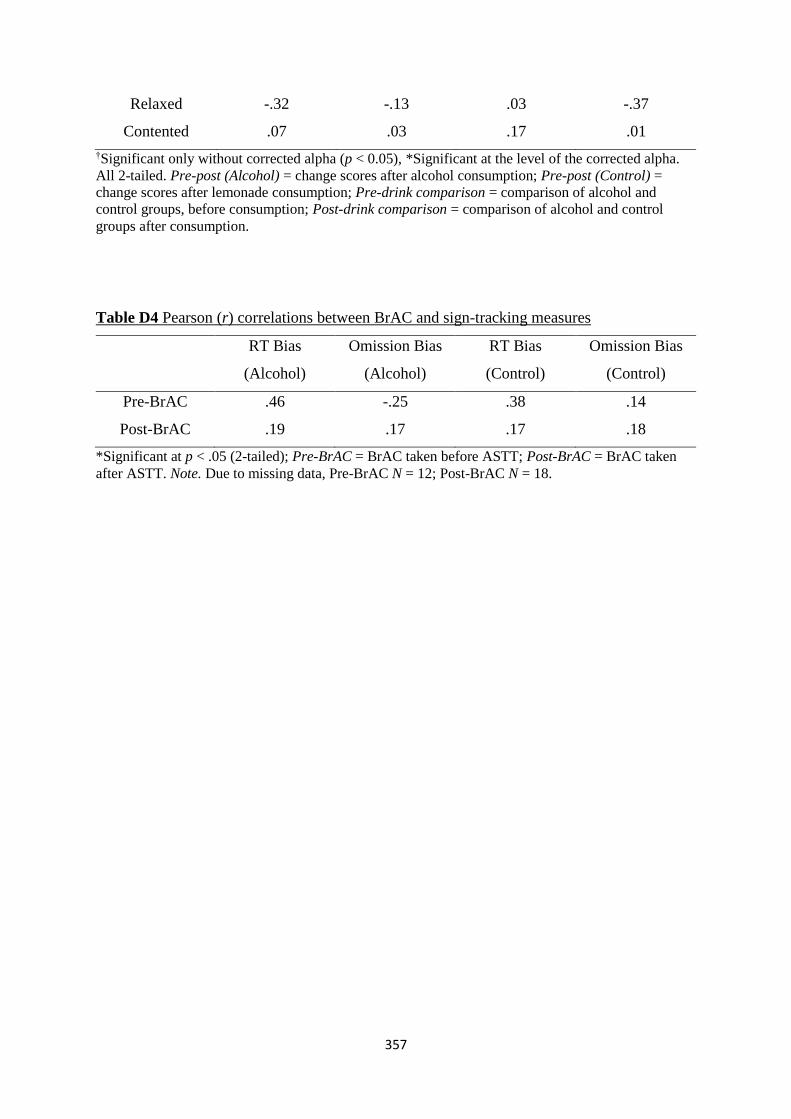
357
Relaxed -.32 -.13 .03 -.37
Contented .07 .03 .17 .01
†Significant only without corrected alpha (p < 0.05), *Significant at the level of the corrected alpha.
All 2-tailed. Pre-post (Alcohol) = change scores after alcohol consumption; Pre-post (Control) =
change scores after lemonade consumption; Pre-drink comparison = comparison of alcohol and
control groups, before consumption; Post-drink comparison = comparison of alcohol and control
groups after consumption.
Table D4 Pearson (r) correlations between BrAC and sign-tracking measures
RT Bias
(Alcohol)
Omission Bias
(Alcohol)
RT Bias
(Control)
Omission Bias
(Control)
Pre-BrAC .46 -.25 .38 .14
Post-BrAC .19 .17 .17 .18
*Significant at p < .05 (2-tailed); Pre-BrAC = BrAC taken before ASTT; Post-BrAC = BrAC taken
after ASTT. Note. Due to missing data, Pre-BrAC N = 12; Post-BrAC N = 18.
358
Appendix E
This appendix concerns Study 3 (Chapter Four). It presents ANOVA analyses for the
Subjective Intoxication Scale (SIS), assessing whether potential changes in SIS scores were
being driven by drink type (alcohol/control) or time (pre/post consumption) and whether
interaction effects existed. This appendix also presents correlation matrices between ASTT
bias scores (across alcohol and control conditions) and individual differences (Table E1),
bias scores and craving change scores (Table E2), bias score and subjective intoxication
change scores (Table E3), and bias scores and breath alcohol (Table E4) for Study 3, which
used a 0.6 g/kg alcohol priming dose.
Subjective Intoxication Scale (SIS)
Two (drink) × two (time) Repeated-Measures ANOVA were also conducted to assess changes
in SIS measures. For ‘light-headedness’, both main effects of drink and time, as well as their
interaction, were statistically significant. For the main effect of drink, reports of ‘light-
headedness’ were higher in the alcohol condition (M = 23.13, SD ± 14.01) compared to
control (M = 3.82, SD ± 10.73), F(1, 29) = 43.89, p < .0001, ηp2 = .60. For the main effect of
time, reports of ‘light-headedness’ were higher after consumption (M = 23.70, SD ± 15.56)
compared to before (M = 3.25, SD ± 7.67), F(1, 29) = 53.58, p < .0001, ηp2 = .65. The
interaction produced an effect of similar magnitude, F(1, 29) = 33.57, p < .0001, ηp2 = .54.
Post-hoc Paired-Samples t-tests were conducted for these effects (all 2-tailed). The main
effect of drink was not found at baseline (before control vs. before alcohol), t(29) = 1.11, p =
.28, r = 20. However, ‘light-headedness’ was found to be higher after the alcohol drink (M =
42.07, SD ± 27.13) compared to after control (M = 5.33, SD ± 15.17), t(29) = 6.48, p < .0001,
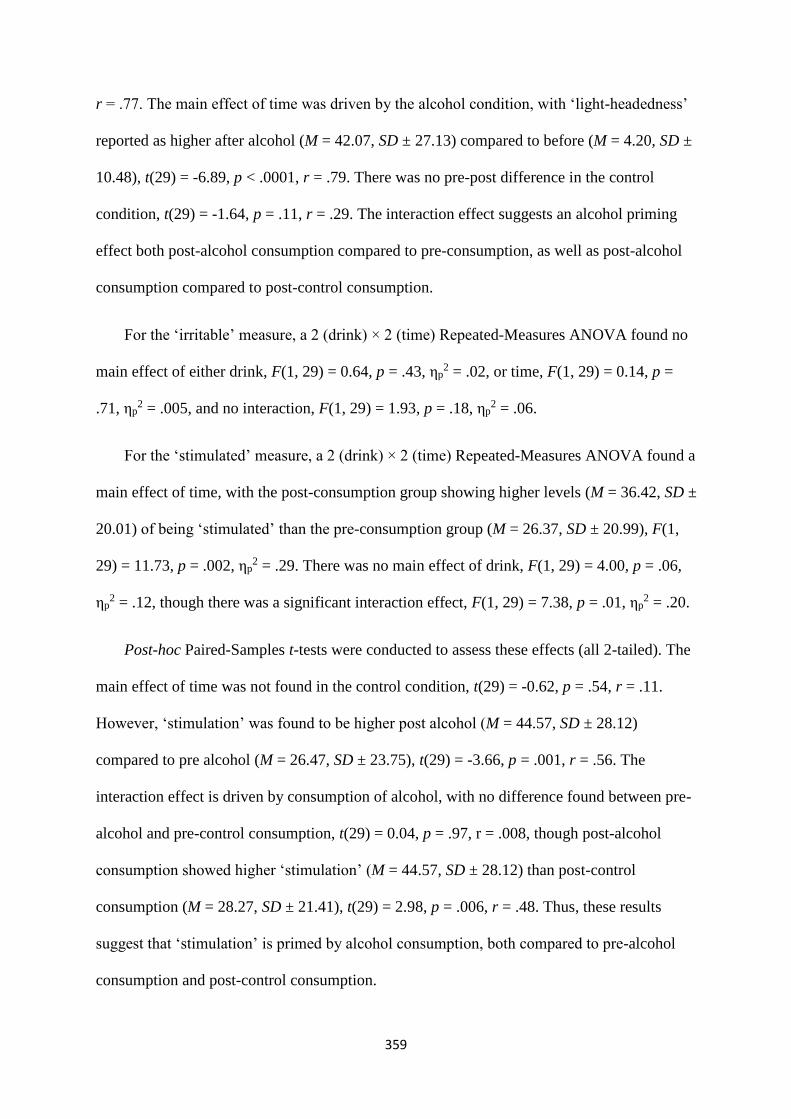
359
r = .77. The main effect of time was driven by the alcohol condition, with ‘light-headedness’
reported as higher after alcohol (M = 42.07, SD ± 27.13) compared to before (M = 4.20, SD ±
10.48), t(29) = -6.89, p < .0001, r = .79. There was no pre-post difference in the control
condition, t(29) = -1.64, p = .11, r = .29. The interaction effect suggests an alcohol priming
effect both post-alcohol consumption compared to pre-consumption, as well as post-alcohol
consumption compared to post-control consumption.
For the ‘irritable’ measure, a 2 (drink) × 2 (time) Repeated-Measures ANOVA found no
main effect of either drink, F(1, 29) = 0.64, p = .43, ηp2 = .02, or time, F(1, 29) = 0.14, p =
.71, ηp2 = .005, and no interaction, F(1, 29) = 1.93, p = .18, ηp
2 = .06.
For the ‘stimulated’ measure, a 2 (drink) × 2 (time) Repeated-Measures ANOVA found a
main effect of time, with the post-consumption group showing higher levels (M = 36.42, SD ±
20.01) of being ‘stimulated’ than the pre-consumption group (M = 26.37, SD ± 20.99), F(1,
29) = 11.73, p = .002, ηp2 = .29. There was no main effect of drink, F(1, 29) = 4.00, p = .06,
ηp2 = .12, though there was a significant interaction effect, F(1, 29) = 7.38, p = .01, ηp
2 = .20.
Post-hoc Paired-Samples t-tests were conducted to assess these effects (all 2-tailed). The
main effect of time was not found in the control condition, t(29) = -0.62, p = .54, r = .11.
However, ‘stimulation’ was found to be higher post alcohol (M = 44.57, SD ± 28.12)
compared to pre alcohol (M = 26.47, SD ± 23.75), t(29) = -3.66, p = .001, r = .56. The
interaction effect is driven by consumption of alcohol, with no difference found between pre-
alcohol and pre-control consumption, t(29) = 0.04, p = .97, r = .008, though post-alcohol
consumption showed higher ‘stimulation’ (M = 44.57, SD ± 28.12) than post-control
consumption (M = 28.27, SD ± 21.41), t(29) = 2.98, p = .006, r = .48. Thus, these results
suggest that ‘stimulation’ is primed by alcohol consumption, both compared to pre-alcohol
consumption and post-control consumption.

360
For the ‘alert’ measure, a 2 (drink) × 2 (time) Repeated-Measures ANOVA found main
effects for both drink and time, though no interaction effect, F(1, 29) = 0.25, p = .62, ηp2 =
.008. For drink, feeling ‘alert’ was higher in the control group (M = 56.63, SD ± 19.55)
compared to the alcohol group (M = 48.80, SD ± 21.09), F(1, 29) = 5.50, p = .03, ηp2 = .16.
For time, feeling ‘alert’ was higher before consumption (M = 56.57, SD ± 20.27) compared to
after (M = 48.87, SD ± 20.14), F(1, 29) = 5.66, p = .02, ηp2 = .16.
Post-hoc Paired-Samples t-tests were conducted to assess these main effects (all 2-tailed).
The main effect of drink was not found at baseline (before control vs. before alcohol), t(26) =
-1.90, p = .07, r = .33, nor post consumption, t(29) = -1.81, p = .08, r = .32. For the main
effect of time, there was no pre-post difference found in the alcohol group, t(29) = 1.75, p =
.09, r = .31. The difference is driven by control drink consumption, with ‘alertness’ being
reported as lower after control consumption (M = 53.47, SD ± 20.70) compared to before (M
= 59.80, SD ± 21.77), t(29) = 2.09, p = .05, r = .36. The finding of no effect of drink in post-
hoc analyses is surprising given the main effect found in the ANOVA – this may be due to
small simultaneous increases and decreases in opposing drink conditions, which don’t reach
statistical significance. The results also suggest a decrease in ‘alertness’ after control
consumption compared to before, though no such effect in the alcohol condition. Both results
are contrary to expectation.
For the ‘relaxed’ measure, a 2 (drink) × 2 (time) Repeated-Measures ANOVA found a
main effect of drink, though no effect of time, F(1, 29) = 1.64, p = .21, ηp2 = .05. For the main
effect of drink, feeling ‘relaxed’ was higher in the alcohol condition (M = 64.93, SD ± 14.81)
compared to control (M = 58.58, SD ± 15.20), F(1, 29) = 4.30, p = .05, ηp2 = .13. There was
also an interaction effect, F(1, 29) = 5.53, p = .03, ηp2 = .16.
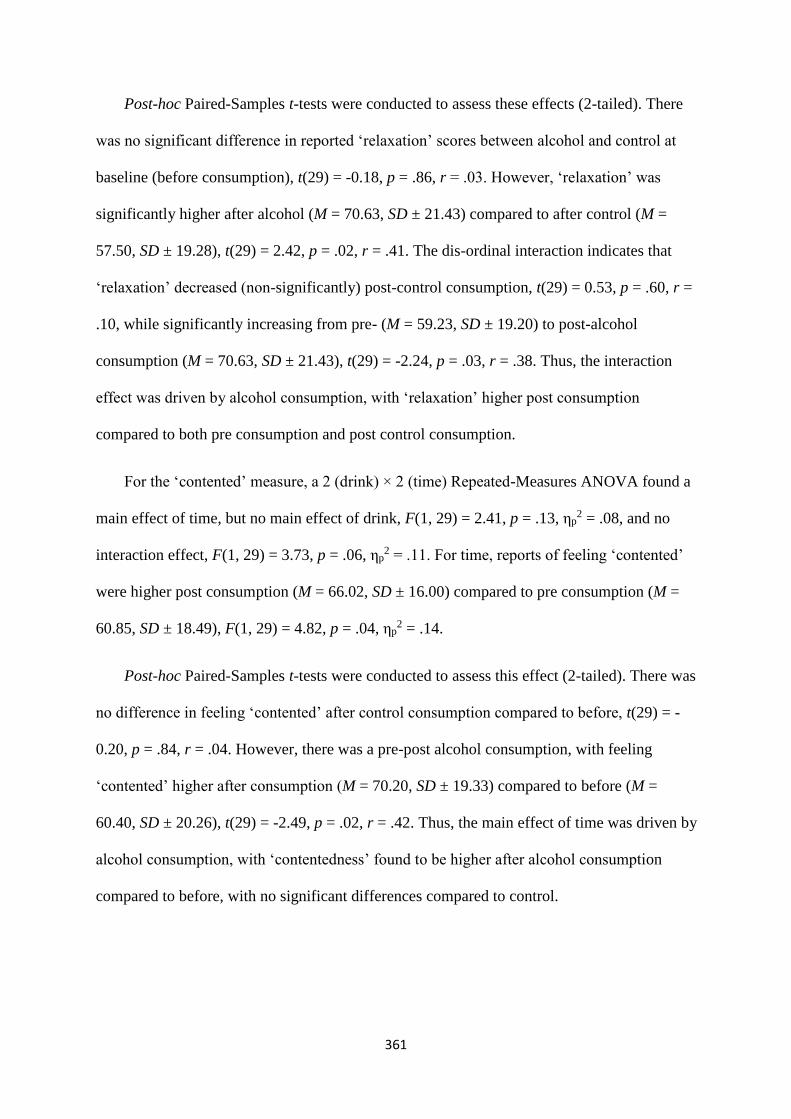
361
Post-hoc Paired-Samples t-tests were conducted to assess these effects (2-tailed). There
was no significant difference in reported ‘relaxation’ scores between alcohol and control at
baseline (before consumption), t(29) = -0.18, p = .86, r = .03. However, ‘relaxation’ was
significantly higher after alcohol (M = 70.63, SD ± 21.43) compared to after control (M =
57.50, SD ± 19.28), t(29) = 2.42, p = .02, r = .41. The dis-ordinal interaction indicates that
‘relaxation’ decreased (non-significantly) post-control consumption, t(29) = 0.53, p = .60, r =
.10, while significantly increasing from pre- (M = 59.23, SD ± 19.20) to post-alcohol
consumption (M = 70.63, SD ± 21.43), t(29) = -2.24, p = .03, r = .38. Thus, the interaction
effect was driven by alcohol consumption, with ‘relaxation’ higher post consumption
compared to both pre consumption and post control consumption.
For the ‘contented’ measure, a 2 (drink) × 2 (time) Repeated-Measures ANOVA found a
main effect of time, but no main effect of drink, F(1, 29) = 2.41, p = .13, ηp2 = .08, and no
interaction effect, F(1, 29) = 3.73, p = .06, ηp2 = .11. For time, reports of feeling ‘contented’
were higher post consumption (M = 66.02, SD ± 16.00) compared to pre consumption (M =
60.85, SD ± 18.49), F(1, 29) = 4.82, p = .04, ηp2 = .14.
Post-hoc Paired-Samples t-tests were conducted to assess this effect (2-tailed). There was
no difference in feeling ‘contented’ after control consumption compared to before, t(29) = -
0.20, p = .84, r = .04. However, there was a pre-post alcohol consumption, with feeling
‘contented’ higher after consumption (M = 70.20, SD ± 19.33) compared to before (M =
60.40, SD ± 20.26), t(29) = -2.49, p = .02, r = .42. Thus, the main effect of time was driven by
alcohol consumption, with ‘contentedness’ found to be higher after alcohol consumption
compared to before, with no significant differences compared to control.
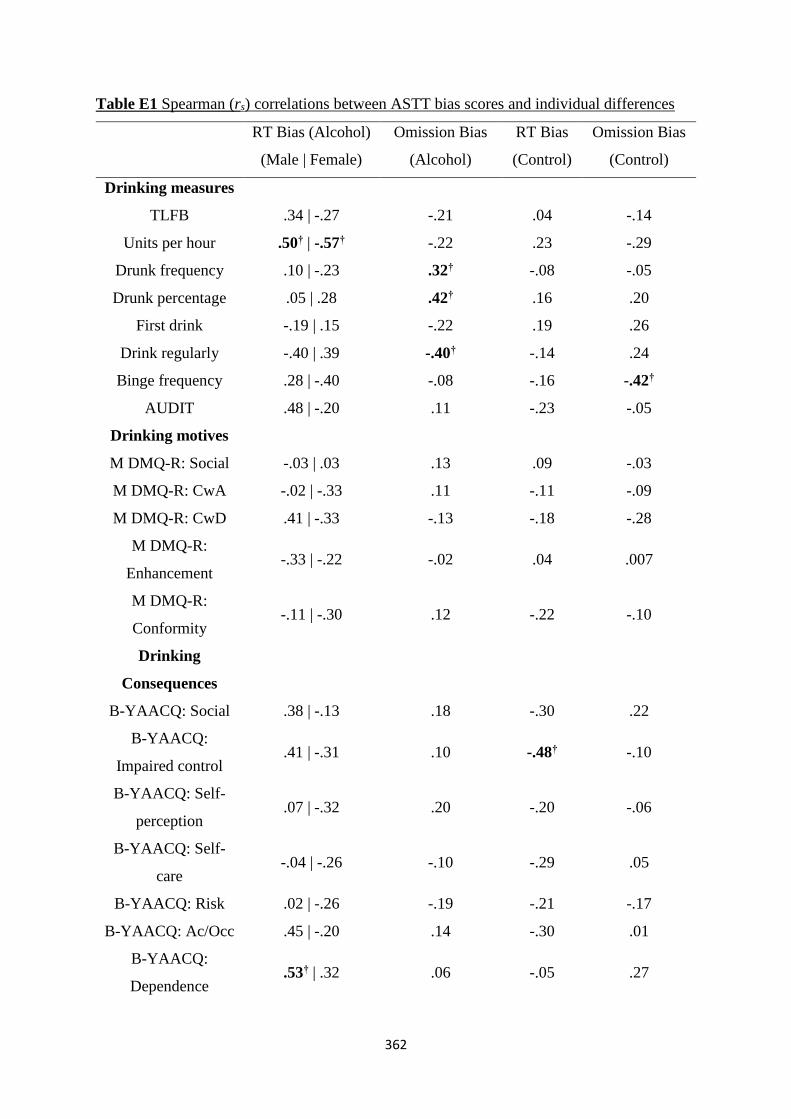
362
Table E1 Spearman (rs) correlations between ASTT bias scores and individual differences
RT Bias (Alcohol)
(Male | Female)
Omission Bias
(Alcohol)
RT Bias
(Control)
Omission Bias
(Control)
Drinking measures
TLFB .34 | -.27 -.21 .04 -.14
Units per hour .50† | -.57† -.22 .23 -.29
Drunk frequency .10 | -.23 .32† -.08 -.05
Drunk percentage .05 | .28 .42† .16 .20
First drink -.19 | .15 -.22 .19 .26
Drink regularly -.40 | .39 -.40† -.14 .24
Binge frequency .28 | -.40 -.08 -.16 -.42†
AUDIT .48 | -.20 .11 -.23 -.05
Drinking motives
M DMQ-R: Social -.03 | .03 .13 .09 -.03
M DMQ-R: CwA -.02 | -.33 .11 -.11 -.09
M DMQ-R: CwD .41 | -.33 -.13 -.18 -.28
M DMQ-R:
Enhancement -.33 | -.22 -.02 .04 .007
M DMQ-R:
Conformity -.11 | -.30 .12 -.22 -.10
Drinking
Consequences
B-YAACQ: Social .38 | -.13 .18 -.30 .22
B-YAACQ:
Impaired control .41 | -.31 .10 -.48† -.10
B-YAACQ: Self-
perception .07 | -.32 .20 -.20 -.06
B-YAACQ: Self-
care -.04 | -.26 -.10 -.29 .05
B-YAACQ: Risk .02 | -.26 -.19 -.21 -.17
B-YAACQ: Ac/Occ .45 | -.20 .14 -.30 .01
B-YAACQ:
Dependence .53† | .32 .06 -.05 .27
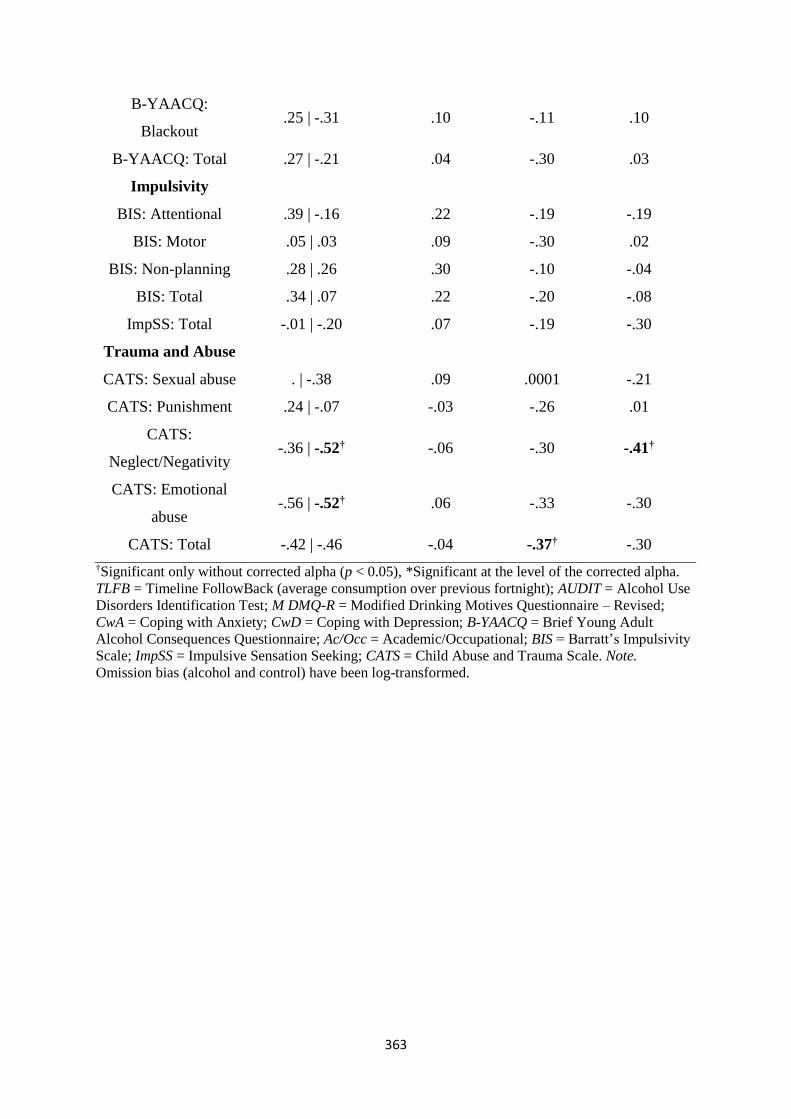
363
B-YAACQ:
Blackout .25 | -.31 .10 -.11 .10
B-YAACQ: Total .27 | -.21 .04 -.30 .03
Impulsivity
BIS: Attentional .39 | -.16 .22 -.19 -.19
BIS: Motor .05 | .03 .09 -.30 .02
BIS: Non-planning .28 | .26 .30 -.10 -.04
BIS: Total .34 | .07 .22 -.20 -.08
ImpSS: Total -.01 | -.20 .07 -.19 -.30
Trauma and Abuse
CATS: Sexual abuse . | -.38 .09 .0001 -.21
CATS: Punishment .24 | -.07 -.03 -.26 .01
CATS:
Neglect/Negativity -.36 | -.52† -.06 -.30 -.41†
CATS: Emotional
abuse -.56 | -.52† .06 -.33 -.30
CATS: Total -.42 | -.46 -.04 -.37† -.30
†Significant only without corrected alpha (p < 0.05), *Significant at the level of the corrected alpha.
TLFB = Timeline FollowBack (average consumption over previous fortnight); AUDIT = Alcohol Use
Disorders Identification Test; M DMQ-R = Modified Drinking Motives Questionnaire – Revised;
CwA = Coping with Anxiety; CwD = Coping with Depression; B-YAACQ = Brief Young Adult
Alcohol Consequences Questionnaire; Ac/Occ = Academic/Occupational; BIS = Barratt’s Impulsivity
Scale; ImpSS = Impulsive Sensation Seeking; CATS = Child Abuse and Trauma Scale. Note.
Omission bias (alcohol and control) have been log-transformed.
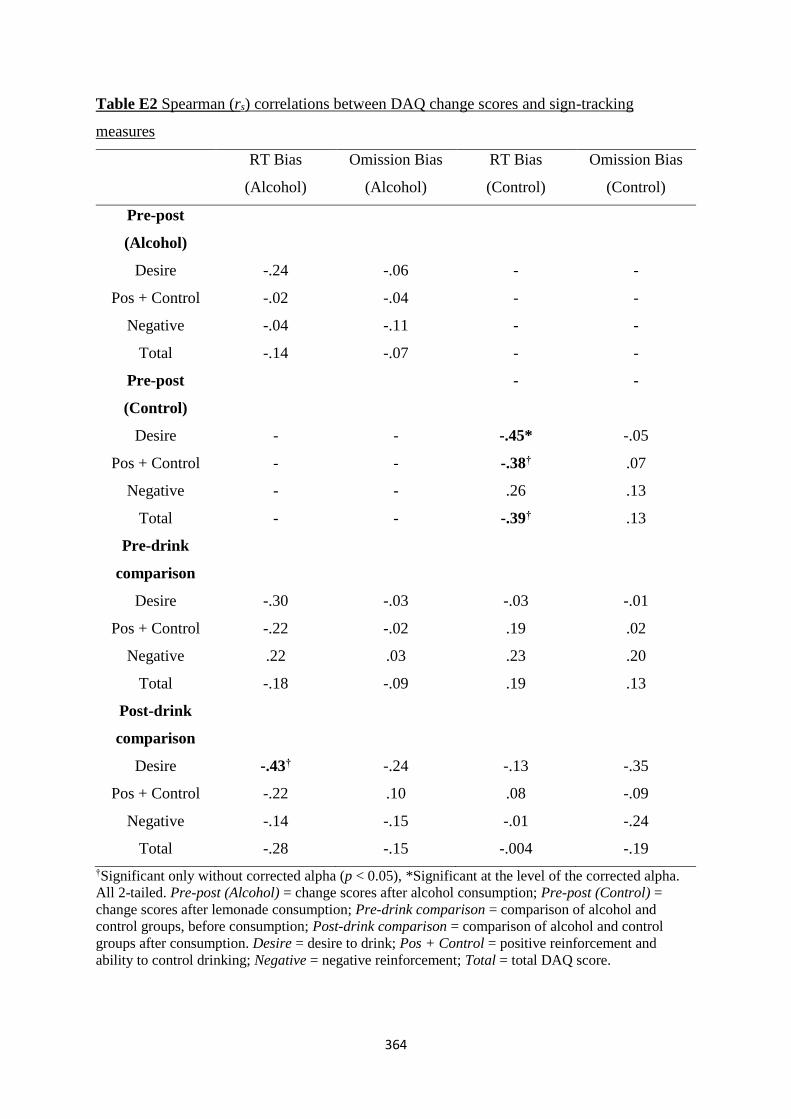
364
Table E2 Spearman (rs) correlations between DAQ change scores and sign-tracking
measures
RT Bias
(Alcohol)
Omission Bias
(Alcohol)
RT Bias
(Control)
Omission Bias
(Control)
Pre-post
(Alcohol)
Desire -.24 -.06 - -
Pos + Control -.02 -.04 - -
Negative -.04 -.11 - -
Total -.14 -.07 - -
Pre-post
(Control)
- -
Desire - - -.45* -.05
Pos + Control - - -.38† .07
Negative - - .26 .13
Total - - -.39† .13
Pre-drink
comparison
Desire -.30 -.03 -.03 -.01
Pos + Control -.22 -.02 .19 .02
Negative .22 .03 .23 .20
Total -.18 -.09 .19 .13
Post-drink
comparison
Desire -.43† -.24 -.13 -.35
Pos + Control -.22 .10 .08 -.09
Negative -.14 -.15 -.01 -.24
Total -.28 -.15 -.004 -.19
†Significant only without corrected alpha (p < 0.05), *Significant at the level of the corrected alpha.
All 2-tailed. Pre-post (Alcohol) = change scores after alcohol consumption; Pre-post (Control) =
change scores after lemonade consumption; Pre-drink comparison = comparison of alcohol and
control groups, before consumption; Post-drink comparison = comparison of alcohol and control
groups after consumption. Desire = desire to drink; Pos + Control = positive reinforcement and
ability to control drinking; Negative = negative reinforcement; Total = total DAQ score.
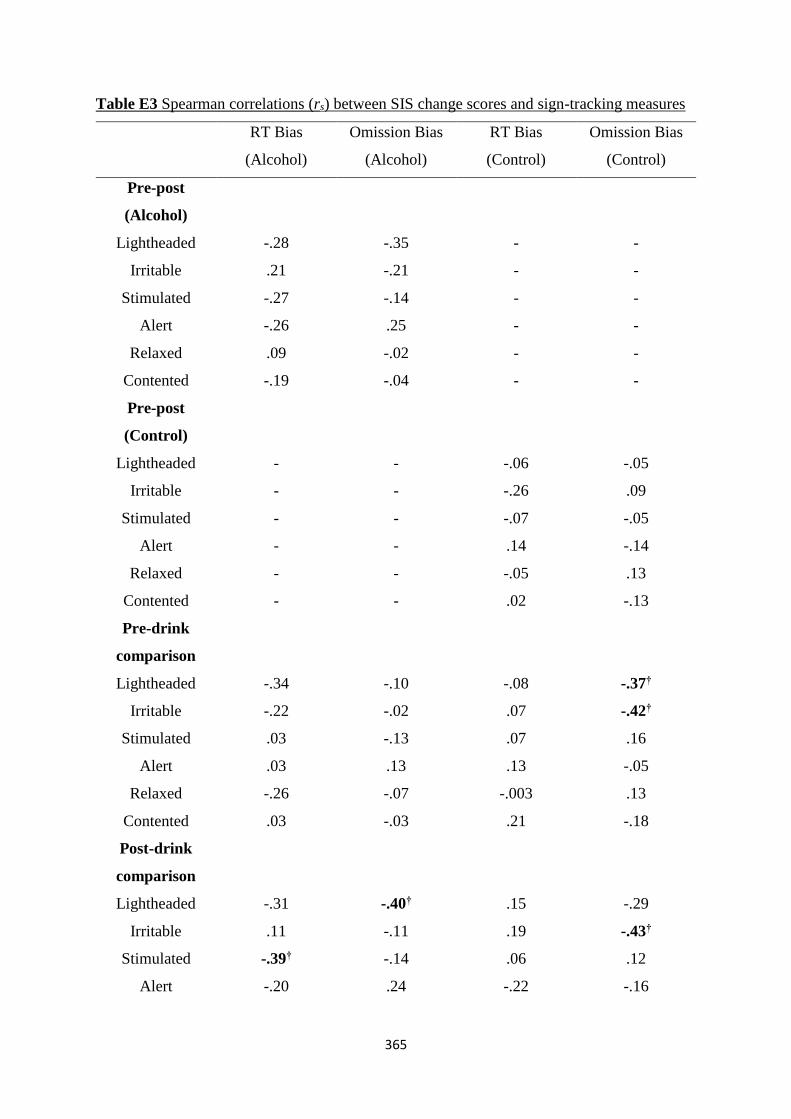
365
Table E3 Spearman correlations (rs) between SIS change scores and sign-tracking measures
RT Bias
(Alcohol)
Omission Bias
(Alcohol)
RT Bias
(Control)
Omission Bias
(Control)
Pre-post
(Alcohol)
Lightheaded -.28 -.35 - -
Irritable .21 -.21 - -
Stimulated -.27 -.14 - -
Alert -.26 .25 - -
Relaxed .09 -.02 - -
Contented -.19 -.04 - -
Pre-post
(Control)
Lightheaded - - -.06 -.05
Irritable - - -.26 .09
Stimulated - - -.07 -.05
Alert - - .14 -.14
Relaxed - - -.05 .13
Contented - - .02 -.13
Pre-drink
comparison
Lightheaded -.34 -.10 -.08 -.37†
Irritable -.22 -.02 .07 -.42†
Stimulated .03 -.13 .07 .16
Alert .03 .13 .13 -.05
Relaxed -.26 -.07 -.003 .13
Contented .03 -.03 .21 -.18
Post-drink
comparison
Lightheaded -.31 -.40† .15 -.29
Irritable .11 -.11 .19 -.43†
Stimulated -.39† -.14 .06 .12
Alert -.20 .24 -.22 -.16

366
Relaxed -.12 -.29 -.26 -.15
Contented -.36 -.08 -.28 .05
†Significant only without corrected alpha (p < 0.05), *Significant at the level of the corrected alpha.
All 2-tailed. Pre-post (Alcohol) = change scores after alcohol consumption; Pre-post (Control) =
change scores after lemonade consumption; Pre-drink comparison = comparison of alcohol and
control groups, before consumption; Post-drink comparison = comparison of alcohol and control
groups after consumption.
Table E4 Pearson (r) correlations between BrAC and sign-tracking measures
RT Bias
(Alcohol)
Omission Bias
(Alcohol)
RT Bias
(Control)
Omission Bias
(Control)
Pre-BrAC -.18 .25 .03 -.07
Post-BrAC -.24 -.21 -.34 -.23
*Significant at p < .05 (2-tailed); Pre-BrAC = BrAC taken before ASTT; Post-BrAC = BrAC taken
after ASTT. Note. Due to missing data, Pre-BrAC N = 12; Post-BrAC N = 18.
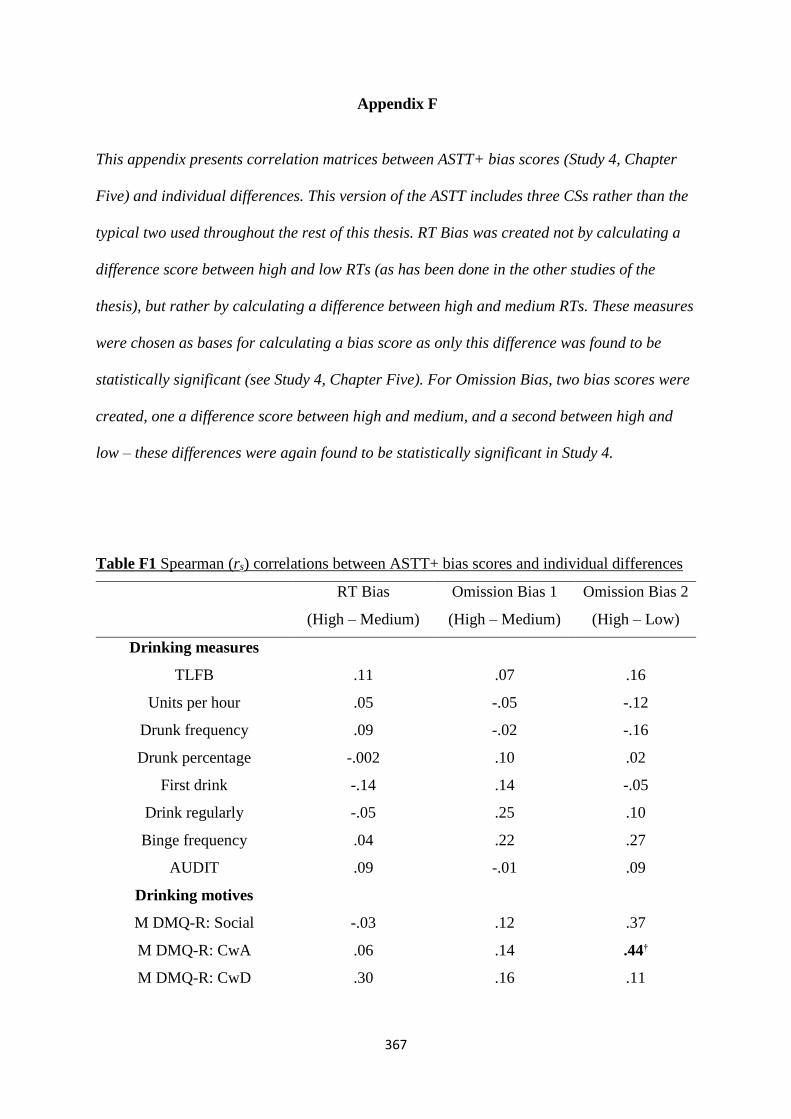
367
Appendix F
This appendix presents correlation matrices between ASTT+ bias scores (Study 4, Chapter
Five) and individual differences. This version of the ASTT includes three CSs rather than the
typical two used throughout the rest of this thesis. RT Bias was created not by calculating a
difference score between high and low RTs (as has been done in the other studies of the
thesis), but rather by calculating a difference between high and medium RTs. These measures
were chosen as bases for calculating a bias score as only this difference was found to be
statistically significant (see Study 4, Chapter Five). For Omission Bias, two bias scores were
created, one a difference score between high and medium, and a second between high and
low – these differences were again found to be statistically significant in Study 4.
Table F1 Spearman (rs) correlations between ASTT+ bias scores and individual differences
RT Bias
(High – Medium)
Omission Bias 1
(High – Medium)
Omission Bias 2
(High – Low)
Drinking measures
TLFB .11 .07 .16
Units per hour .05 -.05 -.12
Drunk frequency .09 -.02 -.16
Drunk percentage -.002 .10 .02
First drink -.14 .14 -.05
Drink regularly -.05 .25 .10
Binge frequency .04 .22 .27
AUDIT .09 -.01 .09
Drinking motives
M DMQ-R: Social -.03 .12 .37
M DMQ-R: CwA .06 .14 .44†
M DMQ-R: CwD .30 .16 .11
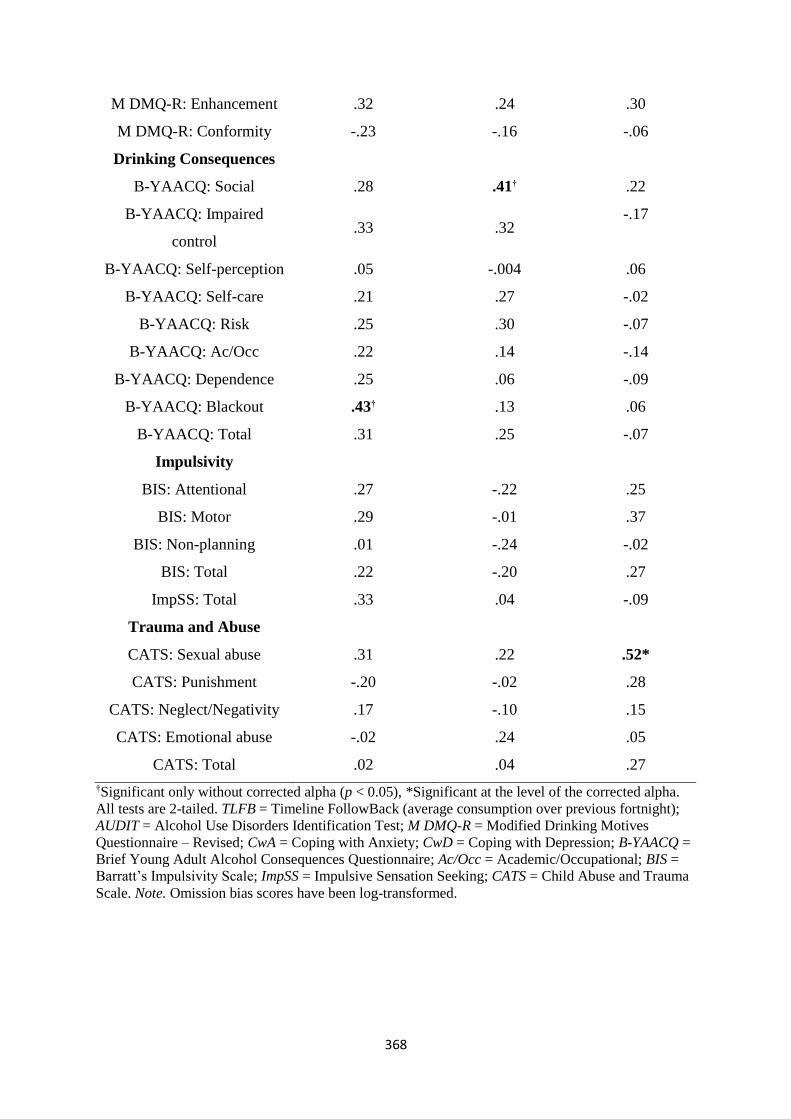
368
M DMQ-R: Enhancement .32 .24 .30
M DMQ-R: Conformity -.23 -.16 -.06
Drinking Consequences
B-YAACQ: Social .28 .41† .22
B-YAACQ: Impaired
control .33 .32
-.17
B-YAACQ: Self-perception .05 -.004 .06
B-YAACQ: Self-care .21 .27 -.02
B-YAACQ: Risk .25 .30 -.07
B-YAACQ: Ac/Occ .22 .14 -.14
B-YAACQ: Dependence .25 .06 -.09
B-YAACQ: Blackout .43† .13 .06
B-YAACQ: Total .31 .25 -.07
Impulsivity
BIS: Attentional .27 -.22 .25
BIS: Motor .29 -.01 .37
BIS: Non-planning .01 -.24 -.02
BIS: Total .22 -.20 .27
ImpSS: Total .33 .04 -.09
Trauma and Abuse
CATS: Sexual abuse .31 .22 .52*
CATS: Punishment -.20 -.02 .28
CATS: Neglect/Negativity .17 -.10 .15
CATS: Emotional abuse -.02 .24 .05
CATS: Total .02 .04 .27
†Significant only without corrected alpha (p < 0.05), *Significant at the level of the corrected alpha.
All tests are 2-tailed. TLFB = Timeline FollowBack (average consumption over previous fortnight);
AUDIT = Alcohol Use Disorders Identification Test; M DMQ-R = Modified Drinking Motives
Questionnaire – Revised; CwA = Coping with Anxiety; CwD = Coping with Depression; B-YAACQ =
Brief Young Adult Alcohol Consequences Questionnaire; Ac/Occ = Academic/Occupational; BIS =
Barratt’s Impulsivity Scale; ImpSS = Impulsive Sensation Seeking; CATS = Child Abuse and Trauma
Scale. Note. Omission bias scores have been log-transformed.
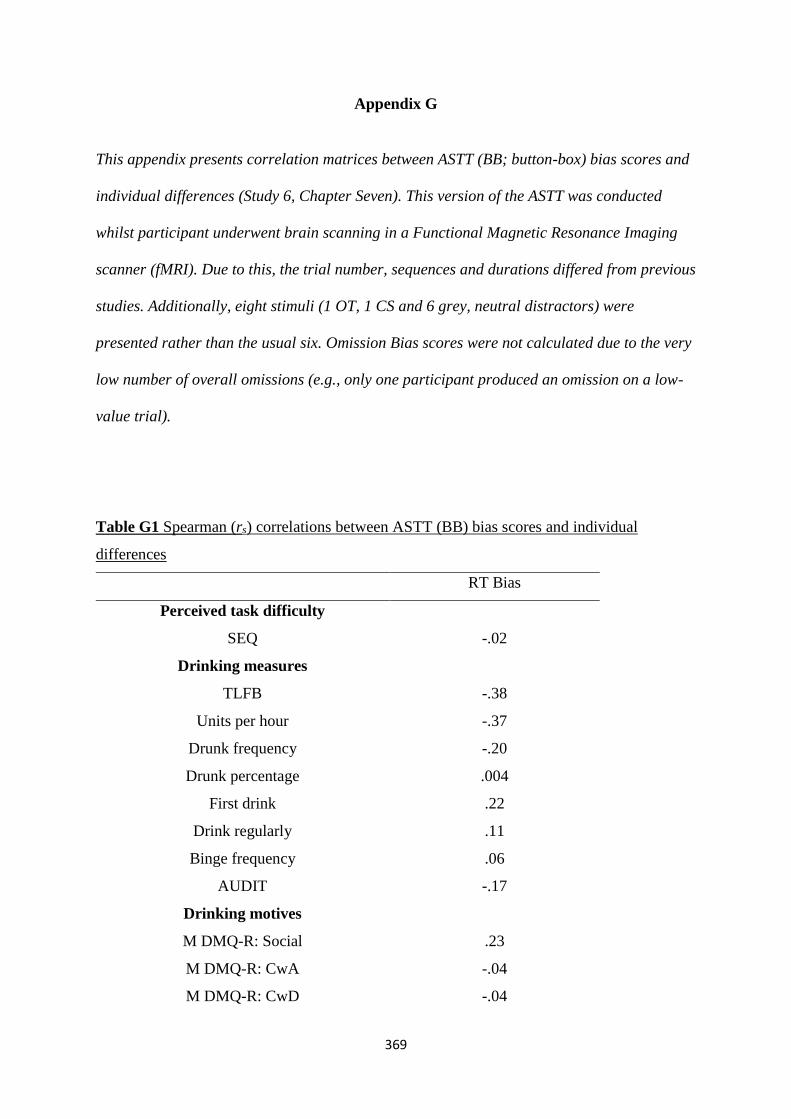
369
Appendix G
This appendix presents correlation matrices between ASTT (BB; button-box) bias scores and
individual differences (Study 6, Chapter Seven). This version of the ASTT was conducted
whilst participant underwent brain scanning in a Functional Magnetic Resonance Imaging
scanner (fMRI). Due to this, the trial number, sequences and durations differed from previous
studies. Additionally, eight stimuli (1 OT, 1 CS and 6 grey, neutral distractors) were
presented rather than the usual six. Omission Bias scores were not calculated due to the very
low number of overall omissions (e.g., only one participant produced an omission on a low-
value trial).
Table G1 Spearman (rs) correlations between ASTT (BB) bias scores and individual
differences
RT Bias
Perceived task difficulty
SEQ -.02
Drinking measures
TLFB -.38
Units per hour -.37
Drunk frequency -.20
Drunk percentage .004
First drink .22
Drink regularly .11
Binge frequency .06
AUDIT -.17
Drinking motives
M DMQ-R: Social .23
M DMQ-R: CwA -.04
M DMQ-R: CwD -.04
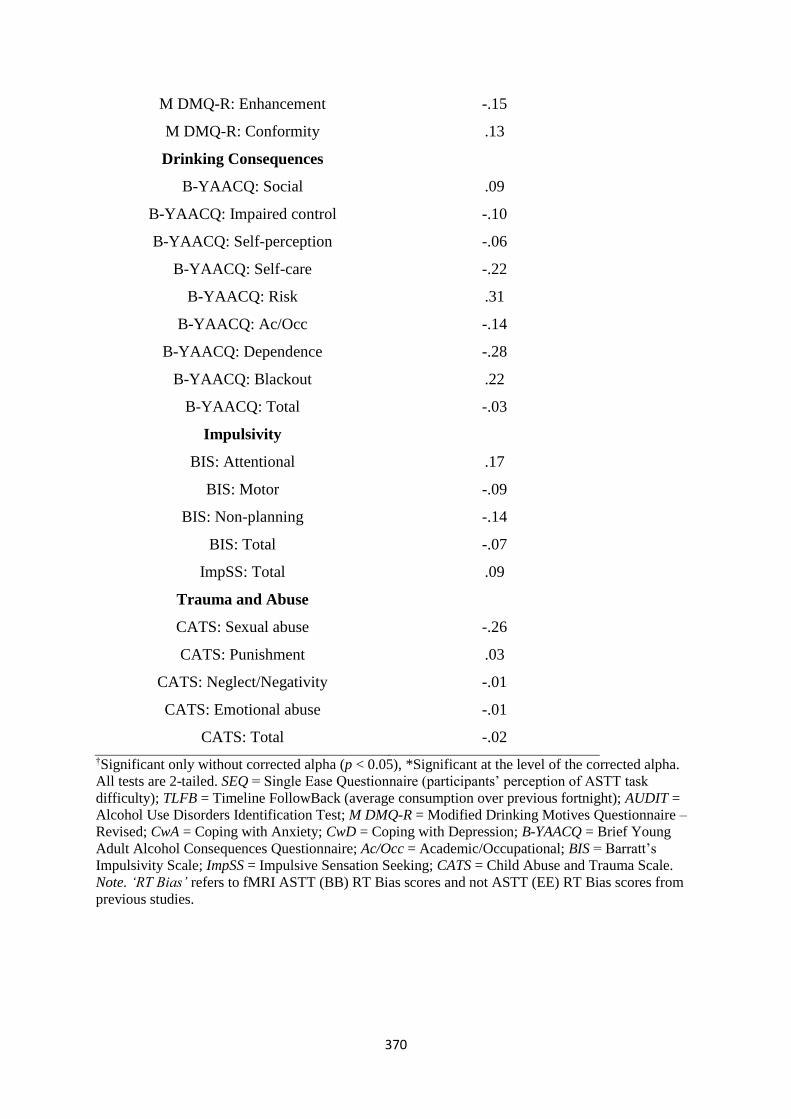
370
M DMQ-R: Enhancement -.15
M DMQ-R: Conformity .13
Drinking Consequences
B-YAACQ: Social .09
B-YAACQ: Impaired control -.10
B-YAACQ: Self-perception -.06
B-YAACQ: Self-care -.22
B-YAACQ: Risk .31
B-YAACQ: Ac/Occ -.14
B-YAACQ: Dependence -.28
B-YAACQ: Blackout .22
B-YAACQ: Total -.03
Impulsivity
BIS: Attentional .17
BIS: Motor -.09
BIS: Non-planning -.14
BIS: Total -.07
ImpSS: Total .09
Trauma and Abuse
CATS: Sexual abuse -.26
CATS: Punishment .03
CATS: Neglect/Negativity -.01
CATS: Emotional abuse -.01
CATS: Total -.02
†Significant only without corrected alpha (p < 0.05), *Significant at the level of the corrected alpha.
All tests are 2-tailed. SEQ = Single Ease Questionnaire (participants’ perception of ASTT task
difficulty); TLFB = Timeline FollowBack (average consumption over previous fortnight); AUDIT =
Alcohol Use Disorders Identification Test; M DMQ-R = Modified Drinking Motives Questionnaire –
Revised; CwA = Coping with Anxiety; CwD = Coping with Depression; B-YAACQ = Brief Young
Adult Alcohol Consequences Questionnaire; Ac/Occ = Academic/Occupational; BIS = Barratt’s
Impulsivity Scale; ImpSS = Impulsive Sensation Seeking; CATS = Child Abuse and Trauma Scale.
Note. ‘RT Bias’ refers to fMRI ASTT (BB) RT Bias scores and not ASTT (EE) RT Bias scores from
previous studies.