Chilling Affects Phytohormone and Post-Embryonic ... - Nature

18 B I O L O G I C A L C O N S E R V A T I O N 1 3 6 ( 2 0 0 7 ) 1 7 – 3 2
1. Introduction
Natural and anthropogenic disturbances strongly influence
the composition of plant communities and the chemical
properties of soils. For example, the recurrence and severity
of fires can shape forest species distribution and abundance
for centuries (Grimm, 1984; Romme and Despain, 1989). Forest
clearing can cause long-lasting changes to vegetation struc-
ture, such as increasing the abundance of weedy or distur-
bance-adapted tree species and reducing the abundance of
woodland shrubs and forbs that have limited ability to recol-
onize second-growth forests (Motzkin et al., 1996; Bellemere
et al., 2002; Dupouey et al., 2002; Eberhardt et al., 2003). Previ-
ous land use can also have long-lasting effects on soil charac-
teristics, which include the development of persistent plow
(Ap) soil horizons (Motzkin et al., 1996; Foster and Motzkin,
2003) and altered stocks and turnover rates of soil organic
matter (Glatzel, 1991; Cambardella and Elliot, 1994; Compton
et al., 1998; Compton and Boone, 2000; Jassy et al., 2002).
There is also evidence that previous land use can affect soil
biogeochemical functions by changing species composition
because patterns of nutrient cycling can develop in response
to the presence of dominant canopy trees (Finzi et al., 1998;
Lovett and Reuth, 1999) or understory plants (Ehrenfeld
et al., 2001; Gilliam et al., 2001).
A change in the susceptibility of land to colonization by
nonnative plant species may be another important legacy of
previous land use. Former land clearing for agriculture has
been associated with increases in weedy, disturbance-depen-
dent anthrophilous species (Dupouey et al., 2002) and recently
abandoned agricultural lands are frequently dominated by
nonnative species (Pickett, 1982; Rejmanek, 1989). One mech-
anism for this pattern appears to be an increase in the avail-
ability of limiting resources, such as nutrients, that shift
competitive balance toward faster growing nonnative species
(Tilman, 1993; Vitousek et al., 1996).
Understanding how previous land use, disturbances, cur-
rent vegetation and soils are related has important implica-
tions for conservation and restoration of plant communities
that are valued for their contributions to regional biological
diversity. This information could be used, for example, when
selecting sites for the restoration or intensive management of
rare or geographically-restricted plant communities, to
choose locations where soils are most similar to target com-
munities, or where the probability of invasion by nonnative
plants will be low.
The area of disturbance-dependent or early successional
habitats in the Northeastern US is declining and these habi-
tats have been identified as a regional conservation concern
(Askins, 2001; Litvaitis, 2003). The grasslands, shrublands
and heathlands that occupy the coastal sandplain of the
northeastern United States are a priority for conservation.
Sandplain grasslands are conservation priorities because they
contain a large number of regionally rare plants (Barbour
et al., 1998; MNHESP, 2001). Shrublands, particularly scrub
oak (Quercus ilicifolia) shrublands are conservation priorities
because they support a large number of rare Lepidoptera
(Goldstein, 1997; Wagner et al., 2003). Although the pre-colo-
nial configuration of communities that supported most of
the sandplain plants of concern for conservation today are
not known precisely, the abundance of many of these plants
apparently expanded during the period of land clearing, agri-
cultural expansion and grazing that followed colonial settle-
ment (Marks, 1983; Foster et al., 2002; Foster and Motzkin,
2003). After the abandonment of tilled and pasture lands that
began across the sandplain region beginning as early as the
1830s and continuing into the 20th century, the area of grass-
lands and shrublands began a prolonged decline that contin-
ues to the present, leading to a reduction in habitat suitable
for many sandplain herbaceous plant species (Motzkin and
Foster, 2002; Clarke and Patterson, 2006). Today, the last
remaining grassland and shrubland habitats are threatened
by increases in residential development and the regrowth of
woody vegetation caused in large part by improved fire detec-
tion and fire suppression since the middle of the 20th century
(Patterson et al., 1983; Dunwiddie, 1994; Dunwiddie and
Adams, 1995; Motzkin and Foster, 2002). Similar trends of loss
of grasslands and heathlands caused by woodland expansion
are occurring in many locations around the world (Sutherland
and Hill, 1995; Brown and Archer, 1999; Briggs et al., 2002).
In the coastal Northeastern US, the continued presence of
sandplain grasslands and shrublands will likely depend on:
(1) management of the disturbances of mowing, fire and graz-
ing to maintain existing grasslands and shrublands, and (2)
restoration or expansion of these habitats from land now in
other land covers. In most locations, existing woodlands or
current agricultural grasslands are the most feasible starting
points for restoration or expansion of grasslands or shrub-
lands. The desirability of each of these options may be influ-
enced by characteristics of soils, vegetation history and
presence of non-native species. Improving methods for
expanding or restoring disturbance-dependent sandplain
plant communities based on an improved understanding of
these factors is a priority for many land conservation organi-
zations, particularly because some options to manage or re-
store land are increasingly constrained by the rapid
suburbanization in the coastal plain region (Barbour et al.,
1998; TTOR, 1999).
The Northeastern US coastal sandplain is characterized by
a common geological and glacial history that resulted in rela-
tively uniform, coarse-textured soils that have low water-
holding capacity and low nutrient status (Fletcher and Roffo-
lini, 1986). Most sandplain plant species that are targets for
conservation reach their greatest abundance in sites with
nutrient-poor soils that were disturbed by historic fire, graz-
ing or clearing (Tiffney, 1997; Dunwiddie et al., 1997; Dunwid-
die and Sferra, 1991; Foster and Motzkin, 1999; Motzkin and
Foster, 2002). Soil fertility may be an important, but still rela-
tively poorly-understood factor that influences the persis-
tence and quality of remaining early-successional habitat
on the sandplain. This role for soil fertility is recognized in
the current management of culturally-valued European
heathlands, for example, which emphasizes fire, grazing, har-
vesting and litter removal to perpetuate low nutrient condi-
tions that favor native species and to inhibit colonization by
introduced species and faster-growing native species (Gim-
mingham, 1972; Sutherland and Hill, 1995; Mitchell et al.,
2000).
In this paper, we evaluate how previous land use and soils
are related to the current vegetation of the Martha’s Vineyard
B I O L O G I C A L C O N S E R V A T I O N 1 3 6 ( 2 0 0 7 ) 1 7 – 3 2 19
coastal sandplain. We asked the following questions: (1) how
do the proportions of nonnative species and key soil charac-
teristics differ across sites that vary in dominant overstory
vegetation, previous land use and recent prescribed fire?
and (2) how can these differences be used to guide efforts to
conserve, manage or restore sandplain disturbance-depen-
dent, early successional habitats?
2. Methods
2.1. Site selection
We selected 35 sites on Martha’s Vineyard, MA that included
five replicate sites in seven land cover categories. These cate-
gories represented the most widespread land covers, those
that are most important for plant species conservation, as
well as those that encompassed historically-relevant differ-
ences in overstory vegetation, past human use and recent fire.
The categories were: (1) red pine (Pinus resinosa) and white
pine (Pinus strobus) plantations on untilled soils, (2) similar
pine plantations on formerly tilled agricultural fields, (3) scrub
oak (Q. ilicifolia) shrublands on untilled soils, (4) tree oak (black
Table 1 – Description of land cover categories on the coastal s
Number Current vegetation
1 Pine plantation Not tilled, planted to pine 1
2 Pine plantation Tilled before 1934, planted t
2 Scrub oak shrubland Not tilled
4 Tree oak woodland Not tilled
5 Burned tree oak woodland Not tilled
6 Sandplain grassland Not tilleda, grasslands main
7 Agricultural grassland Strong evidence of tillage in
a One current sandplain grassland site (Katama) showed evidence of his
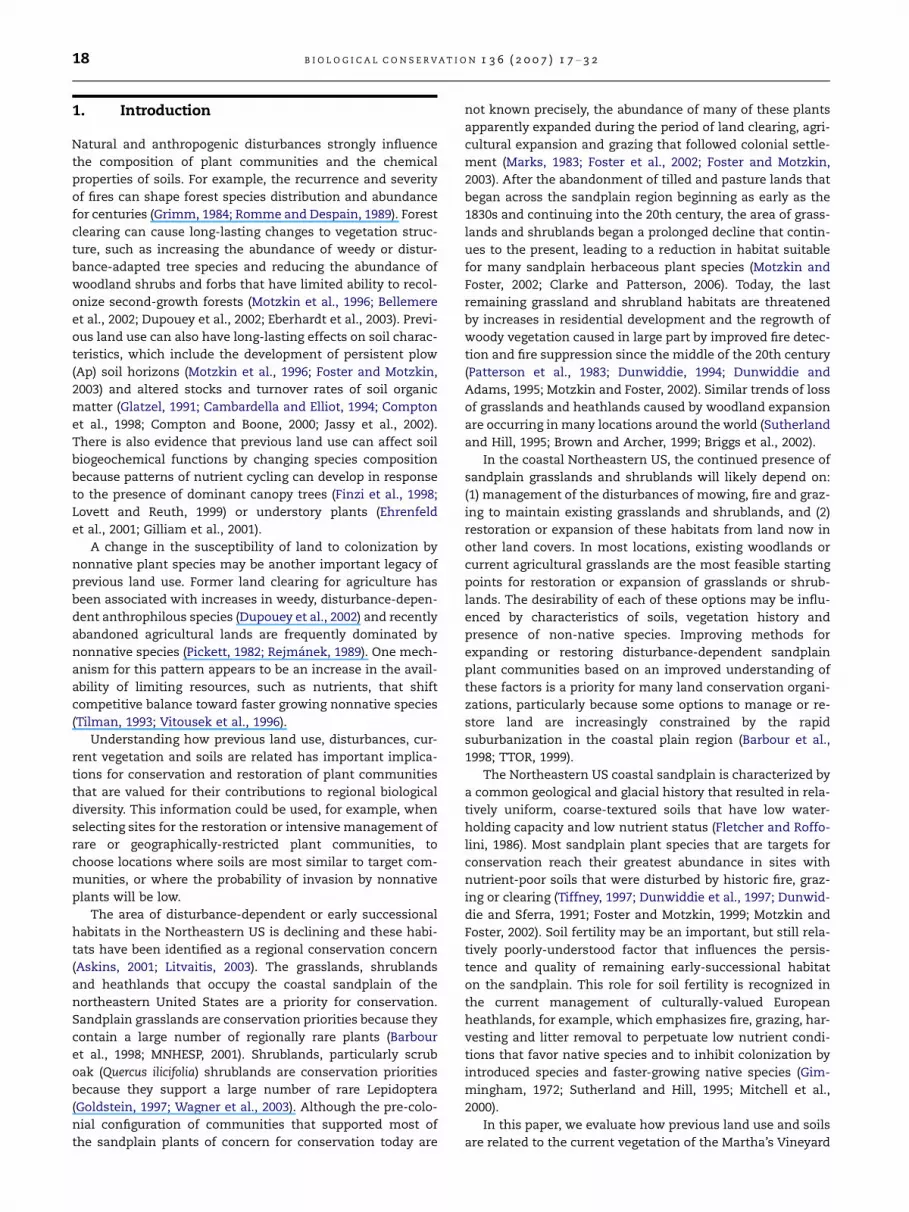
Fig. 1 – Location of sampling sites on the coastal outwash sandp
(1) pine plantations, not tilled, (2) pine plantations, tilled, (3) scr
woodland, (6) sandplain grassland and (7) agricultural grasslan
oak, Q. velutina, white oak, Q. alba) woodlands on untilled
soils, (5) burned tree oak woodlands on untilled soils where
prescribed fire was applied during the previous five years, (6)
species-rich sandplain grasslands on untilled soils, and (7)
agricultural grasslands on tilled soils now managed as hay-
fields (Table 1). All sites were located on the glacial outwash
plain on the southern part of the island (Fig. 1) and were
placed in representative areas of vegetation away from paths
and other obvious recent disturbances. All sites were on coar-
sely textured well-drained, mesic soils with 0–2% slopes of the
Carver, Riverhead and Katama series (Fletcher and Roffolini,
1986). Restricting sites to the outwash plain on similar soils
permitted interpretation of the effects of dominant overstory
vegetation, land use history and fire on overall plant species
composition and soil biogeochemistry while minimizing the
effects of the heterogeneity of underlying soils.
Pine plantations on untilled soils were planted between
1929 and 1934 and were typical of plantation forests in the
Manuel F. Correllus State Forest (MFCSF) (Foster and Motzkin,
1999). Red pine and white pine are not native to Martha’s
Vineyard (Sorrie and Somers, 1999). Pine plantations on for-
merly tilled soils were planted between 1929 and 1961 and
andplain of Martha’s Vineyard
Land use history Abbreviation
929–1934 PP
o pine 1935–1961 TP
SO
TO
BO
tained by mowing SG
last 10 years, currently maintained as hay fields AG
toric tillage.
lain of central Martha’s Vineyard. Land cover categories are:
ub oak shrubland, (4) tree oak woodland, (5) burned tree oak
d.
20 B I O L O G I C A L C O N S E R V A T I O N 1 3 6 ( 2 0 0 7 ) 1 7 – 3 2
had Ap horizons. We presume that these areas were part of
the approximately 29–36 ha planted to corn, clover, buck-
wheat, millet and sunflowers with the aim of sustaining
heath hens (Gross, 1928; Foster and Motzkin, 1999). The loca-
tions of these sites were identified previously by Foster and
Motzkin (1999), but there is no record of the crops planted
in each location. Scrub oak shrublands occupied shallow, lin-
ear depressions that represent the shrublands that have a
high and relatively stable composition of Q. ilicifolia over time.
This dominance of scrub oak shrublands in shallow depres-
sions in other sand plains has been attributed to low or ex-
treme temperatures that restrict growth of tree oaks
(Motzkin et al., 2002). Tree oak woodlands were second
growth stands approximately 80–170 years old that had
roughly equal proportions of Q. velutina and Q. alba. These tree
oak woodlands were mapped as ‘‘wooded’’ in 1848 (US Coast
and Geodetic Survey, 1848) and have likely been woodlands
subjected to wood repeated wood harvest since European set-
tlement (Foster and Motzkin, 1999). Burned tree oak wood-
lands of similar age and history were identified from fire
management records of The Nature Conservancy and The
Trustees of Reservations, both of which conduct prescribed
burning on their lands. Neither the scrub oak shrublands, tree
oak woodlands nor burned oak woodlands were previously
tilled based on the absence of Ap horizons. Sandplain grass-
lands were areas that contained early-successional native
grass and forb species typical of sandplain grasslands charac-
terized as high quality by Dunwiddie et al. (1996). The sand-
plain grassland sites were maintained by mowing or a
combination of mowing and burning. One sandplain grass-
land (Katama) had an apparent old but diffuse Ap horizon,
indicating likely past tillage, although use of this area in re-
cent decades has been for conservation. Agricultural grass-
lands were areas where land use records and the presence
of a well-defined Ap horizon indicated recent tillage within
the previous 10 years. Agricultural grasslands were seeded
to pasture grasses, are currently maintained by cutting for
hay, and have received light or occasional grazing from sheep
and cattle during the last 10 years. Details of the location and
history of individual plots are provided in Table S1.
2.2. Vegetation sampling and analysis
Prior to sampling, each site was checked to determine the ex-
tent of current anthropogenic disturbance. Percentage cover
of all vascular plant species was estimated in eight cover-
abundance classes: (<1%, 1–3%, 3–5%, 6–15%, 16–25%, 26–
50%, 51–75%, >75%) in one 20 m-diameter plot in each site.
For analyses, these cover classes were converted to the mid-
point of the range of each cover class for each species. Tree
density and basal area were determined from diameter at
breast height (dbh) of all living (>2.5 cm dbh) and dead
(>10 cm dbh) trees within the plot. We estimated stand age
by taking increment cores from one to three of the largest
sound trees (>5 cm dbh) per stand. Nomenclature followed
Sorrie and Somers (1999). All species were classified as native
or non native. A species was considered nonnative if its his-
torical origin was outside of Martha’s Vineyard (Dukes
County), as determined by the flora of Massachusetts (Sorrie
and Somers, 1999). To reduce human-influenced bias, we re-
moved white and red pine that had been planted in two of
our site types (pine plantations, and pine plantations on for-
merly tilled agricultural fields) from tests of differences of na-
tive and nonnative richness and cover with soil parameters
and site types.
We performed Kruskal–Wallis tests for differences in the
native and nonnative richness and plant cover among land
cover categories. All percentage data were arc-sin square root
transformed and count data were square root transformed for
normality (Zar, 1999). If a categorical variable was found to be
statistically significant in the full model, a posteriori tests
were conducted to determine differences between categories.
We conducted G-tests of independence (Zar, 1999), or the like-
lihood ratio of v2 analysis, for each species that occurred in
four or more study plots of the sandplain grasslands and
the agricultural grasslands to determine association of indi-
vidual species with these two habitat types, using sequential
Bonferonni adjustments.
Multivariate analyses were conducted to understand the
influence of land use history, prescribed burning and domi-
nant overstory vegetation on plant species composition. Non-
metric multiple dimensional scaling (NMDS) was performed
on the surveyed species abundance values for each plot. Be-
cause model instability occurred with low abundance values,
only those plots that had greater than 1% cover of nonnative
species were included. Each analysis was initiated with six
axes, 40 runs of real data and 50 runs of randomized data,
with an instability criterion of 0.00001 using PC-ORD, version
4 (McCune and Mefford, 1999). Because of the large differ-
ences between agricultural grasslands and other land cover
categories, we performed one additional NMDS analysis with
agricultural grasslands removed.
We conducted stepwise backwards regression analyses to
understand the influence of soil characteristics on native
and nonnative species richness. We wanted to understand
which soil characteristics were associated with maximum na-
tive species diversity and minimum nonnative species diver-
sity. We used Akaike’s criterion (Burnham and Anderson,
2002) to select a priori those variables predicted to have the
greatest impact on species richness. We chose the following
soil characteristics as independent variables: density (dry g
soil cm�3), pH, percent carbon (C) and nitrogen (N), soil respi-
ration (mg C g�1 dry soil d�1), extractable NHþ4 (lg N g�1 dry
soil), extractable NO�3 (lg N g�1 dry soil), net N-mineralization
and net nitrification rates (lg N g�1 dry soil d�1), and extract-
able Ca, K, Mg and Na (cmol (+) 100 g�1 dry soil).
2.3. Soil sample collection and analyses
Soil characteristics were determined by collecting five cores to
a depth of approximately 15 cm using a 5 cm-diameter stain-
less steel corer. Samples were collected at 5 m distances along
a transect placed randomly in a representative area within
each site. The soil organic (Oea) horizon was separated, and
the top 10 cm of the mineral horizon were measured and col-
lected. Soil samples were homogenized and roots and gravel
were removed by hand (Oea horizon) or by passing through
a 2 mm sieve (mineral horizon). Replicate cores were com-
bined into one composite soil sample per site. Separate volu-
metric cores of the Oea and mineral horizons were collected
B I O L O G I C A L C O N S E R V A T I O N 1 3 6 ( 2 0 0 7 ) 1 7 – 3 2 21
to measure soil bulk density. The depth of the Oea horizon
was recorded from intact soil adjacent to each core hole and
averaged for the site. At sites without an organic layer, the
top 2 cm to of the soil was collected and used to characterize
the surface soil horizon. Samples were refrigerated until
analysis.
Bulk density of dry soil was calculated after drying sam-
ples of known soil volume for 48 h at 60 �C. Soil pH was mea-
sured in water (1:1 soil to water for surface soil, 2:1 for
mineral soil). Base extractable cation concentrations were
measured after extraction with 1 M NH4Cl followed by analy-
sis of the extracts by atomic absorption spectrophotometry
(Robarge and Fernandez, 1986). Soil C and N concentrations
were measured on a Perkin–Elmer 2400 elemental analyzer
after grinding with a mortar and pestle. Soil NHþ4 and NO�3concentrations were measured by extraction with 1 N KCl
and analysis of the extracts by colorimetry for NHþ4 (alkaline
phenol hypochlorite method) and NO�3 (Cd reduction on La-
chat autoanalyzer). We incubated soils in the laboratory for
14 d at 30 �C and reextracted them with KCl to obtain an index
of net N mineralization and net nitrification. Potential nitrifi-
cation was measured on soils from a subset of sites using a
modification of the method of Schmidt and Belser (1982).
We combined wet soil equivalent to 5 g of dry weight with
30 mL of ammonium phosphate solution in 60 mL centrifuge
tubes. We shook the tubes at 150 rpm at room temperature
and analyzed NO�3 concentrations at 2, 6, 12, and 24 h. We
a b
c d
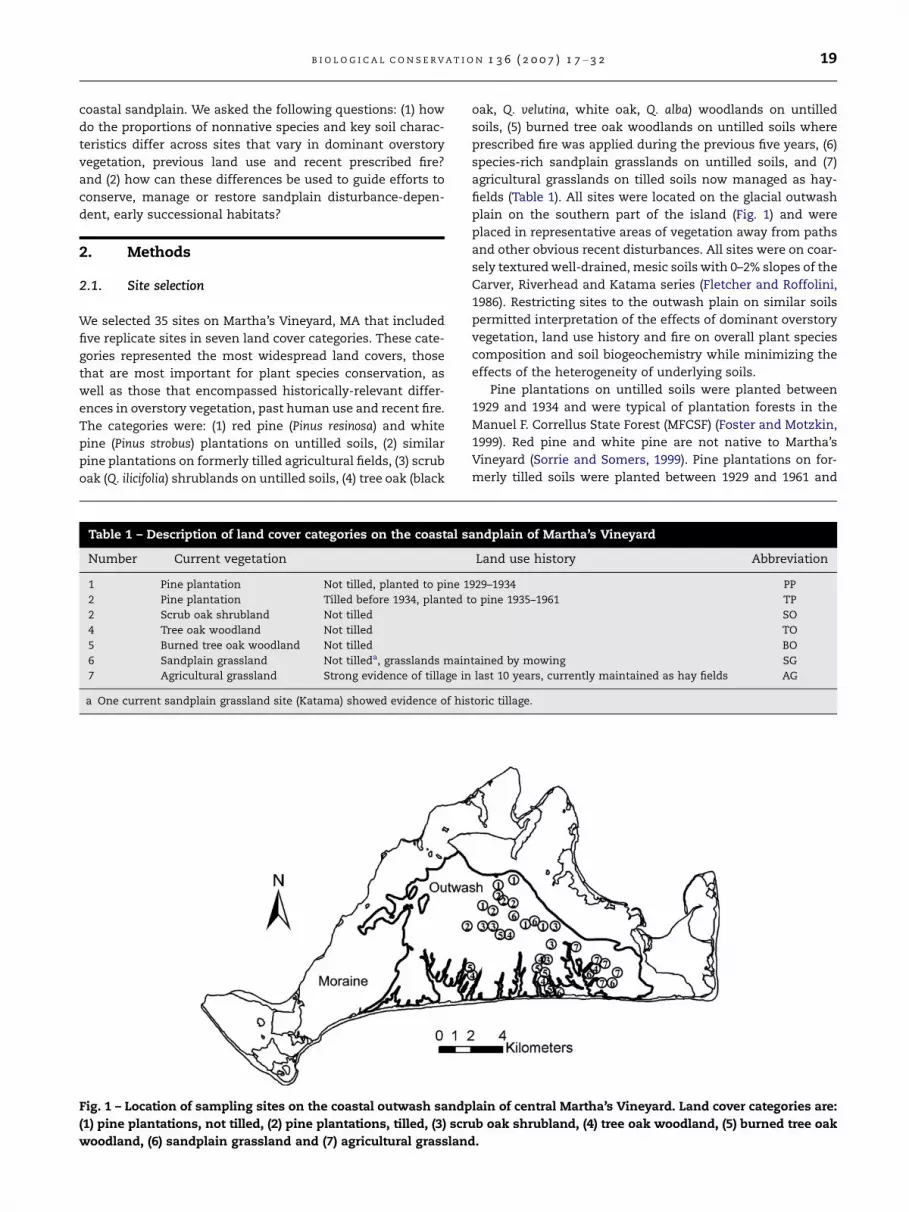
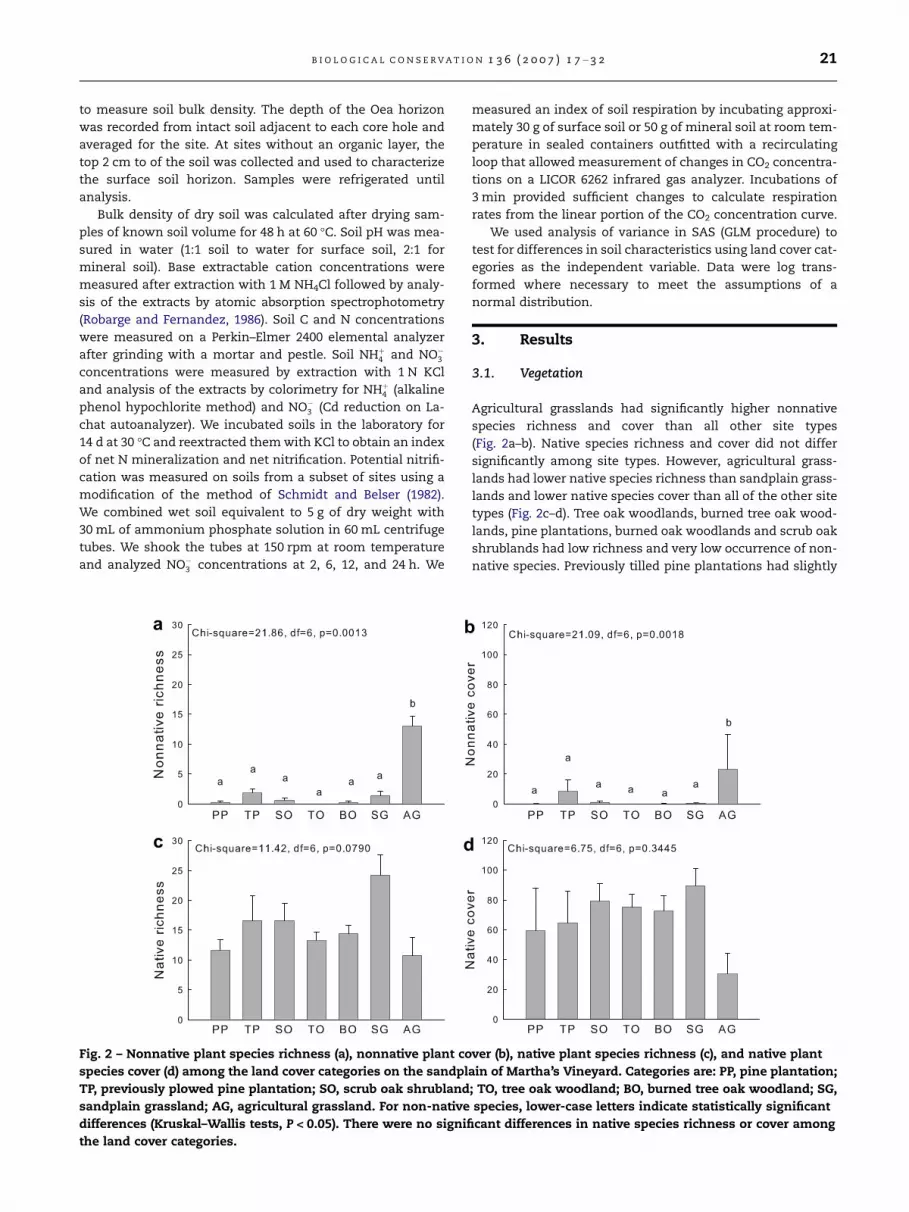
Fig. 2 – Nonnative plant species richness (a), nonnative plant co
species cover (d) among the land cover categories on the sandpl
TP, previously plowed pine plantation; SO, scrub oak shrubland
sandplain grassland; AG, agricultural grassland. For non-native
differences (Kruskal–Wallis tests, P < 0.05). There were no signifi
the land cover categories.
measured an index of soil respiration by incubating approxi-
mately 30 g of surface soil or 50 g of mineral soil at room tem-
perature in sealed containers outfitted with a recirculating
loop that allowed measurement of changes in CO2 concentra-
tions on a LICOR 6262 infrared gas analyzer. Incubations of
3 min provided sufficient changes to calculate respiration
rates from the linear portion of the CO2 concentration curve.
We used analysis of variance in SAS (GLM procedure) to
test for differences in soil characteristics using land cover cat-
egories as the independent variable. Data were log trans-
formed where necessary to meet the assumptions of a
normal distribution.
3. Results
3.1. Vegetation
Agricultural grasslands had significantly higher nonnative
species richness and cover than all other site types
(Fig. 2a–b). Native species richness and cover did not differ
significantly among site types. However, agricultural grass-
lands had lower native species richness than sandplain grass-
lands and lower native species cover than all of the other site
types (Fig. 2c–d). Tree oak woodlands, burned tree oak wood-
lands, pine plantations, burned oak woodlands and scrub oak
shrublands had low richness and very low occurrence of non-
native species. Previously tilled pine plantations had slightly
ver (b), native plant species richness (c), and native plant
ain of Martha’s Vineyard. Categories are: PP, pine plantation;
; TO, tree oak woodland; BO, burned tree oak woodland; SG,
species, lower-case letters indicate statistically significant
cant differences in native species richness or cover among
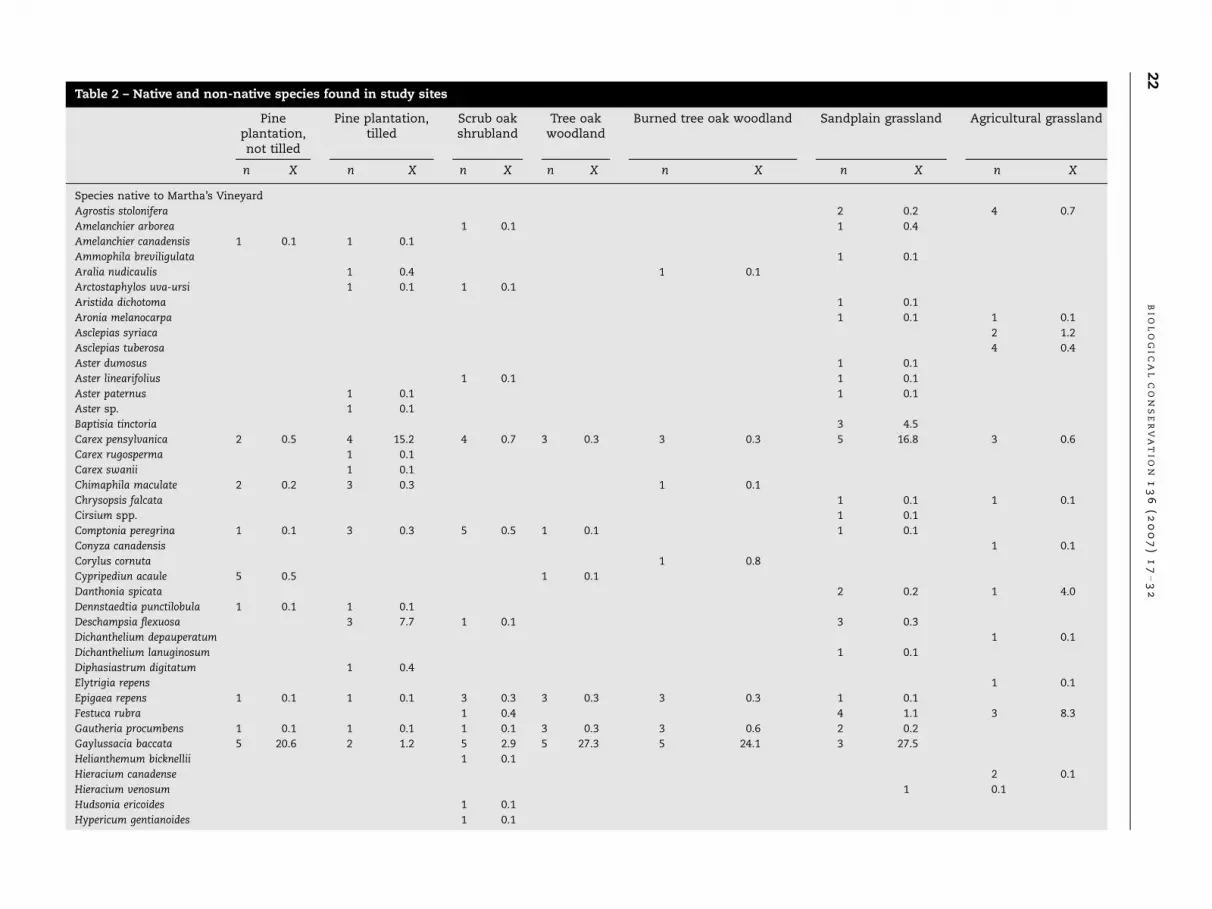
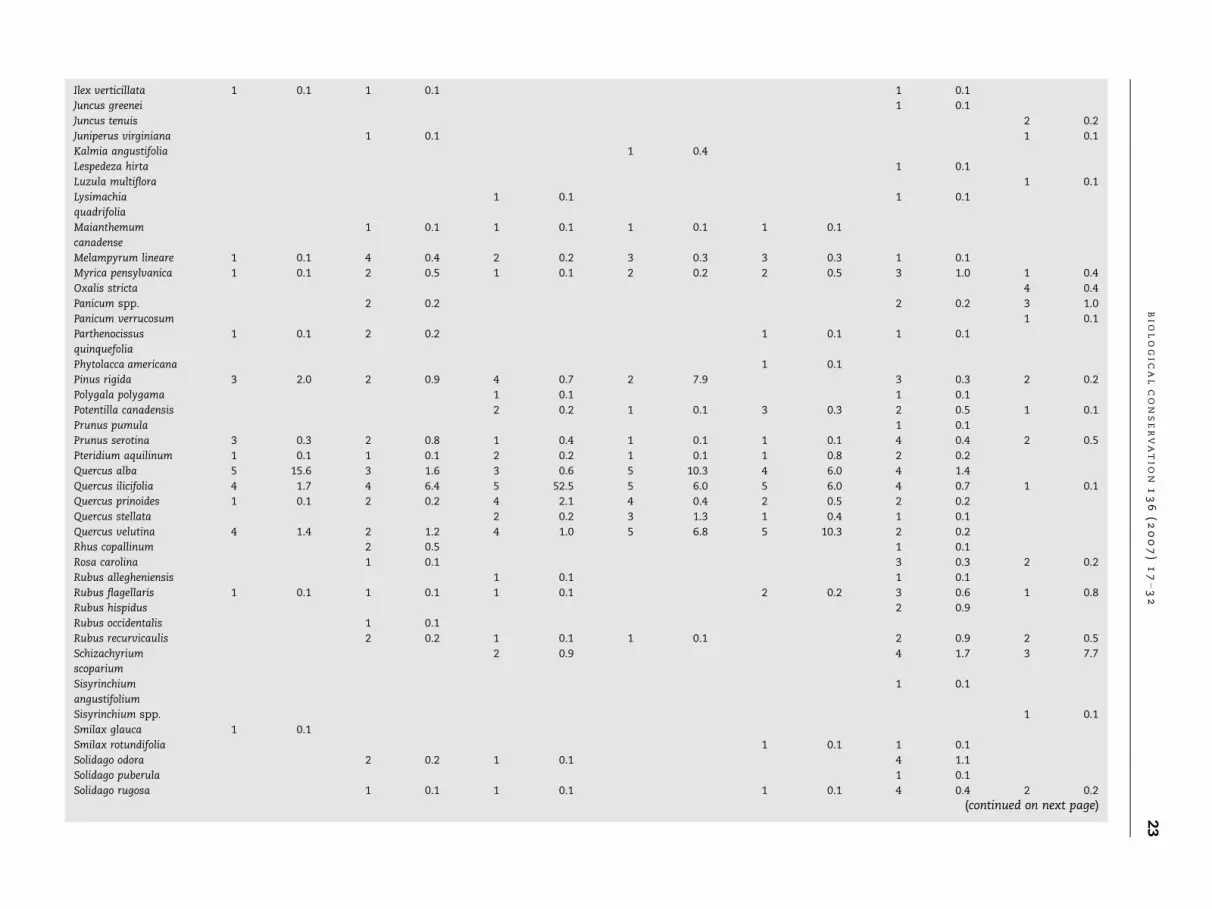
Table 2 – Native and non-native species found in study sites
Pineplantation,not tilled
Pine plantation,tilled
Scrub oakshrubland
Tree oakwoodland
Burned tree oak woodland Sandplain grassland Agricultural grassland
n X n X n X n X n X n X n X
Species native to Martha’s Vineyard
Agrostis stolonifera 2 0.2 4 0.7
Amelanchier arborea 1 0.1 1 0.4
Amelanchier canadensis 1 0.1 1 0.1
Ammophila breviligulata 1 0.1
Aralia nudicaulis 1 0.4 1 0.1
Arctostaphylos uva-ursi 1 0.1 1 0.1
Aristida dichotoma 1 0.1
Aronia melanocarpa 1 0.1 1 0.1
Asclepias syriaca 2 1.2
Asclepias tuberosa 4 0.4
Aster dumosus 1 0.1
Aster linearifolius 1 0.1 1 0.1
Aster paternus 1 0.1 1 0.1
Aster sp. 1 0.1
Baptisia tinctoria 3 4.5
Carex pensylvanica 2 0.5 4 15.2 4 0.7 3 0.3 3 0.3 5 16.8 3 0.6
Carex rugosperma 1 0.1
Carex swanii 1 0.1
Chimaphila maculate 2 0.2 3 0.3 1 0.1
Chrysopsis falcata 1 0.1 1 0.1
Cirsium spp. 1 0.1
Comptonia peregrina 1 0.1 3 0.3 5 0.5 1 0.1 1 0.1
Conyza canadensis 1 0.1
Corylus cornuta 1 0.8
Cypripediun acaule 5 0.5 1 0.1
Danthonia spicata 2 0.2 1 4.0
Dennstaedtia punctilobula 1 0.1 1 0.1
Deschampsia flexuosa 3 7.7 1 0.1 3 0.3
Dichanthelium depauperatum 1 0.1
Dichanthelium lanuginosum 1 0.1
Diphasiastrum digitatum 1 0.4
Elytrigia repens 1 0.1
Epigaea repens 1 0.1 1 0.1 3 0.3 3 0.3 3 0.3 1 0.1
Festuca rubra 1 0.4 4 1.1 3 8.3
Gautheria procumbens 1 0.1 1 0.1 1 0.1 3 0.3 3 0.6 2 0.2
Gaylussacia baccata 5 20.6 2 1.2 5 2.9 5 27.3 5 24.1 3 27.5
Helianthemum bicknellii 1 0.1
Hieracium canadense 2 0.1
Hieracium venosum 1 0.1
Hudsonia ericoides 1 0.1
Hypericum gentianoides 1 0.1
22
BI
OL
OG
IC
AL
CO
NS
ER
VA
TI
ON
13
6(2
00
7)
17
–3
2
Ilex verticillata 1 0.1 1 0.1 1 0.1
Juncus greenei 1 0.1
Juncus tenuis 2 0.2
Juniperus virginiana 1 0.1 1 0.1
Kalmia angustifolia 1 0.4
Lespedeza hirta 1 0.1
Luzula multiflora 1 0.1
Lysimachia
quadrifolia
1 0.1 1 0.1
Maianthemum
canadense
1 0.1 1 0.1 1 0.1 1 0.1
Melampyrum lineare 1 0.1 4 0.4 2 0.2 3 0.3 3 0.3 1 0.1
Myrica pensylvanica 1 0.1 2 0.5 1 0.1 2 0.2 2 0.5 3 1.0 1 0.4
Oxalis stricta 4 0.4
Panicum spp. 2 0.2 2 0.2 3 1.0
Panicum verrucosum 1 0.1
Parthenocissus
quinquefolia
1 0.1 2 0.2 1 0.1 1 0.1
Phytolacca americana 1 0.1
Pinus rigida 3 2.0 2 0.9 4 0.7 2 7.9 3 0.3 2 0.2
Polygala polygama 1 0.1 1 0.1
Potentilla canadensis 2 0.2 1 0.1 3 0.3 2 0.5 1 0.1
Prunus pumula 1 0.1
Prunus serotina 3 0.3 2 0.8 1 0.4 1 0.1 1 0.1 4 0.4 2 0.5
Pteridium aquilinum 1 0.1 1 0.1 2 0.2 1 0.1 1 0.8 2 0.2
Quercus alba 5 15.6 3 1.6 3 0.6 5 10.3 4 6.0 4 1.4
Quercus ilicifolia 4 1.7 4 6.4 5 52.5 5 6.0 5 6.0 4 0.7 1 0.1
Quercus prinoides 1 0.1 2 0.2 4 2.1 4 0.4 2 0.5 2 0.2
Quercus stellata 2 0.2 3 1.3 1 0.4 1 0.1
Quercus velutina 4 1.4 2 1.2 4 1.0 5 6.8 5 10.3 2 0.2
Rhus copallinum 2 0.5 1 0.1
Rosa carolina 1 0.1 3 0.3 2 0.2
Rubus allegheniensis 1 0.1 1 0.1
Rubus flagellaris 1 0.1 1 0.1 1 0.1 2 0.2 3 0.6 1 0.8
Rubus hispidus 2 0.9
Rubus occidentalis 1 0.1
Rubus recurvicaulis 2 0.2 1 0.1 1 0.1 2 0.9 2 0.5
Schizachyrium
scoparium
2 0.9 4 1.7 3 7.7
Sisyrinchium
angustifolium
1 0.1
Sisyrinchium spp. 1 0.1
Smilax glauca 1 0.1
Smilax rotundifolia 1 0.1 1 0.1
Solidago odora 2 0.2 1 0.1 4 1.1
Solidago puberula 1 0.1
Solidago rugosa 1 0.1 1 0.1 1 0.1 4 0.4 2 0.2
(continued on next page)
BI
OL
OG
IC
AL
CO
NS
ER
VA
TI
ON
13
6(2
00
7)
17
–3
22
3
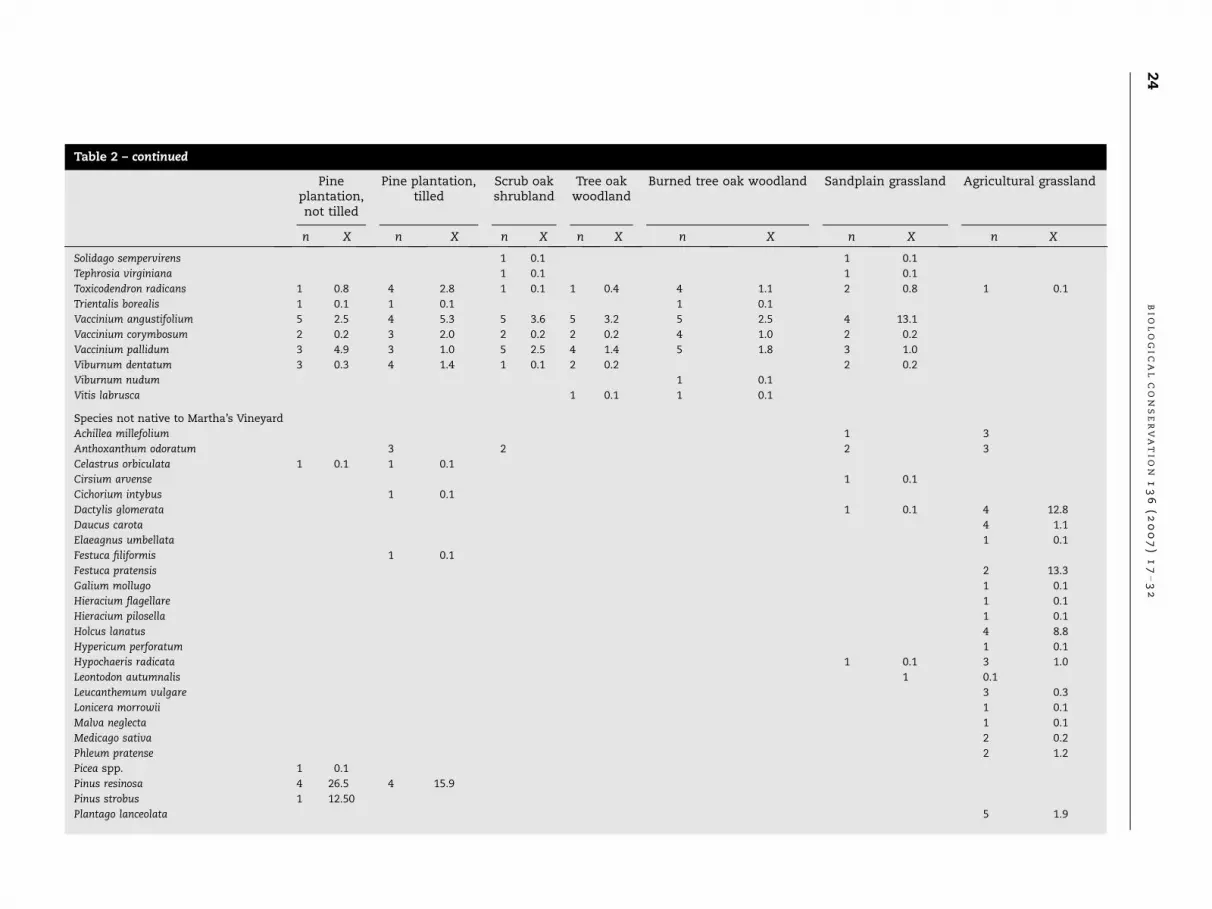
Table 2 – continued
Pineplantation,not tilled
Pine plantation,tilled
Scrub oakshrubland
Tree oakwoodland
Burned tree oak woodland Sandplain grassland Agricultural grassland
n X n X n X n X n X n X n X
Solidago sempervirens 1 0.1 1 0.1
Tephrosia virginiana 1 0.1 1 0.1
Toxicodendron radicans 1 0.8 4 2.8 1 0.1 1 0.4 4 1.1 2 0.8 1 0.1
Trientalis borealis 1 0.1 1 0.1 1 0.1
Vaccinium angustifolium 5 2.5 4 5.3 5 3.6 5 3.2 5 2.5 4 13.1
Vaccinium corymbosum 2 0.2 3 2.0 2 0.2 2 0.2 4 1.0 2 0.2
Vaccinium pallidum 3 4.9 3 1.0 5 2.5 4 1.4 5 1.8 3 1.0
Viburnum dentatum 3 0.3 4 1.4 1 0.1 2 0.2 2 0.2
Viburnum nudum 1 0.1
Vitis labrusca 1 0.1 1 0.1
Species not native to Martha’s Vineyard
Achillea millefolium 1 3
Anthoxanthum odoratum 3 2 2 3
Celastrus orbiculata 1 0.1 1 0.1
Cirsium arvense 1 0.1
Cichorium intybus 1 0.1
Dactylis glomerata 1 0.1 4 12.8
Daucus carota 4 1.1
Elaeagnus umbellata 1 0.1
Festuca filiformis 1 0.1
Festuca pratensis 2 13.3
Galium mollugo 1 0.1
Hieracium flagellare 1 0.1
Hieracium pilosella 1 0.1
Holcus lanatus 4 8.8
Hypericum perforatum 1 0.1
Hypochaeris radicata 1 0.1 3 1.0
Leontodon autumnalis 1 0.1
Leucanthemum vulgare 3 0.3
Lonicera morrowii 1 0.1
Malva neglecta 1 0.1
Medicago sativa 2 0.2
Phleum pratense 2 1.2
Picea spp. 1 0.1
Pinus resinosa 4 26.5 4 15.9
Pinus strobus 1 12.50
Plantago lanceolata 5 1.9
24
BI
OL
OG
IC
AL
CO
NS
ER
VA
TI
ON
13
6(2
00
7)
17
–3
2
Poa
an
nu
a1
0.8
Pote
nti
lla
rect
a2
0.2
Qu
ercu
sro
bu
r1
7.5
Ros
am
ult
iflor
a1
0.1
Ru
mex
ace
tose
lla
10.1
10.1
10.1
30.3
Ru
mex
cris
pu
s1
0.1
Set
ari
agl
au
ca1
0.1
Sil
ene
vu
lgari
s1
Tara
xacu
mof
fici
nale
10.1
31.0
Trif
oliu
marv
ense
31.0
Trif
oliu
mpra
ten
se2
0.2
Trif
oliu
mre
pen
s2
0.2
Ver
basc
um
thapsu
s1
0.1
Vic
iacr
acc
a1
0.1
Vic
iate
trasp
erm
a1
0.1
No
men
cla
ture
an
dsp
eci
es
ori
gin
sfo
llo
wS
orr
iea
nd
So
mers
(1999).
For
ea
chsp
eci
es
n=
nu
mb
er
of
plo
tsin
ea
chla
nd
cov
er
cate
go
ry(o
ut
of
5)
inw
hic
hsp
eci
es
wa
sfo
un
d,
X=
mea
np
erc
en
tco
ver,
wh
en
pre
sen
t.
a
b
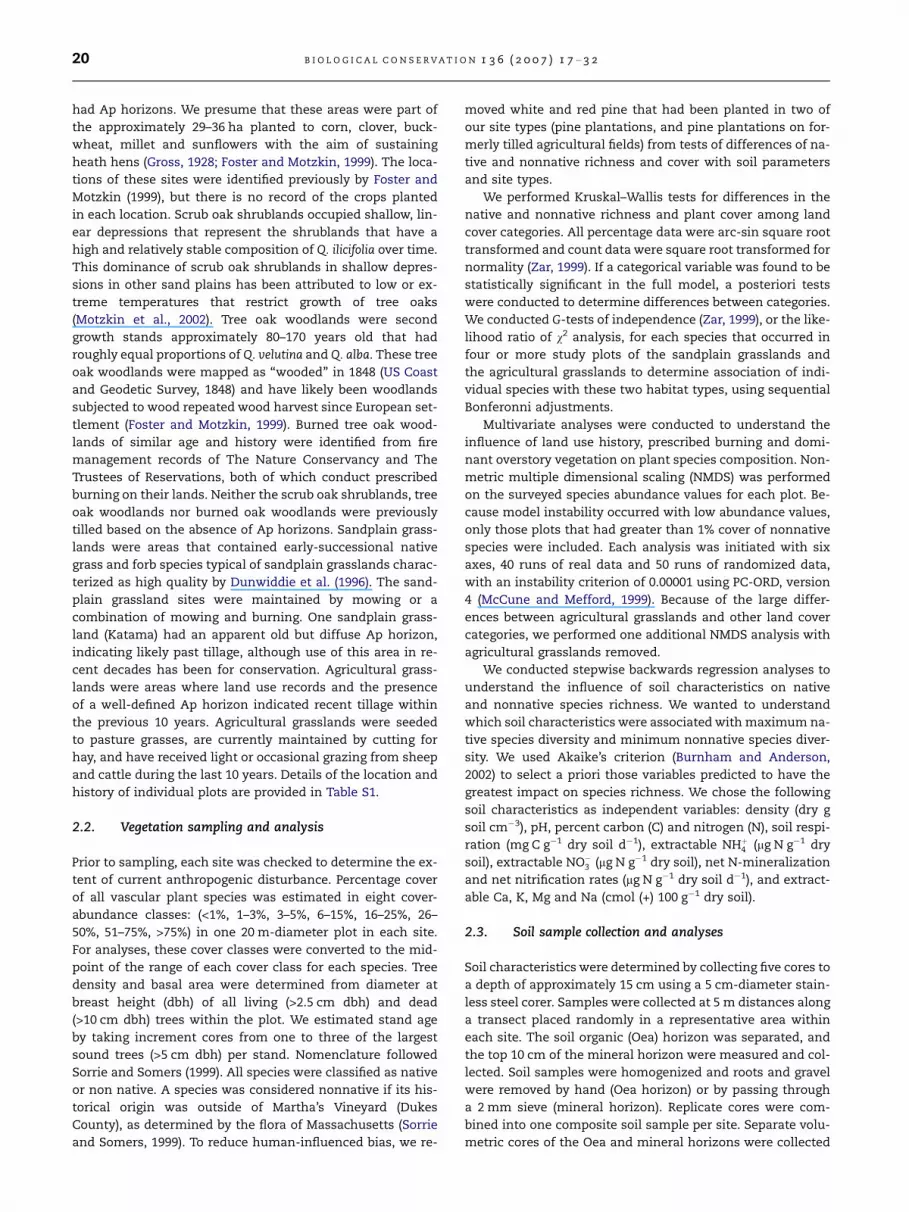
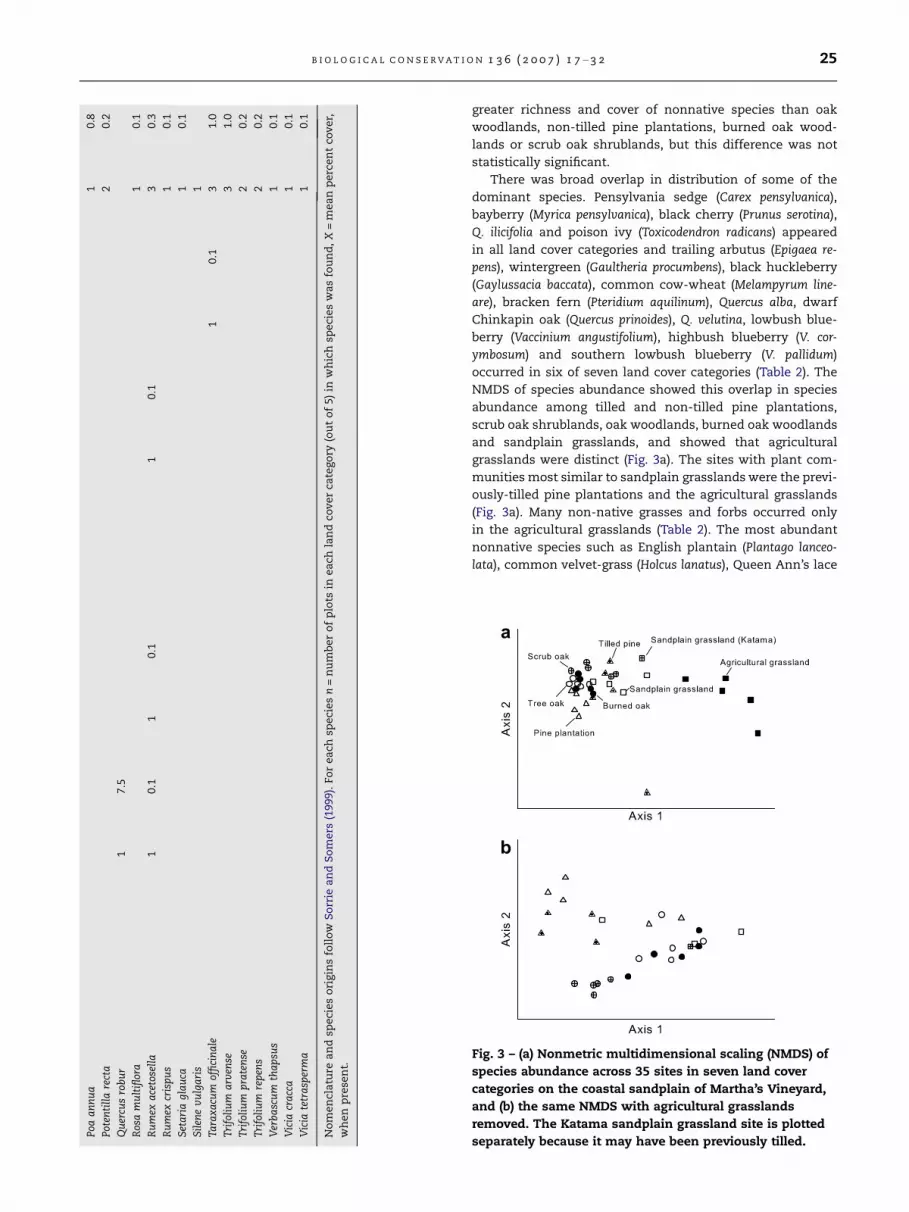
Fig. 3 – (a) Nonmetric multidimensional scaling (NMDS) of
species abundance across 35 sites in seven land cover
categories on the coastal sandplain of Martha’s Vineyard,
and (b) the same NMDS with agricultural grasslands
removed. The Katama sandplain grassland site is plotted
B I O L O G I C A L C O N S E R V A T I O N 1 3 6 ( 2 0 0 7 ) 1 7 – 3 2 25
separately because it may have been previously tilled.
greater richness and cover of nonnative species than oak
woodlands, non-tilled pine plantations, burned oak wood-
lands or scrub oak shrublands, but this difference was not
statistically significant.
There was broad overlap in distribution of some of the
dominant species. Pensylvania sedge (Carex pensylvanica),
bayberry (Myrica pensylvanica), black cherry (Prunus serotina),
Q. ilicifolia and poison ivy (Toxicodendron radicans) appeared
in all land cover categories and trailing arbutus (Epigaea re-
pens), wintergreen (Gaultheria procumbens), black huckleberry
(Gaylussacia baccata), common cow-wheat (Melampyrum line-
are), bracken fern (Pteridium aquilinum), Quercus alba, dwarf
Chinkapin oak (Quercus prinoides), Q. velutina, lowbush blue-
berry (Vaccinium angustifolium), highbush blueberry (V. cor-
ymbosum) and southern lowbush blueberry (V. pallidum)
occurred in six of seven land cover categories (Table 2). The
NMDS of species abundance showed this overlap in species
abundance among tilled and non-tilled pine plantations,
scrub oak shrublands, oak woodlands, burned oak woodlands
and sandplain grasslands, and showed that agricultural
grasslands were distinct (Fig. 3a). The sites with plant com-
munities most similar to sandplain grasslands were the previ-
ously-tilled pine plantations and the agricultural grasslands
(Fig. 3a). Many non-native grasses and forbs occurred only
in the agricultural grasslands (Table 2). The most abundant
nonnative species such as English plantain (Plantago lanceo-
lata), common velvet-grass (Holcus lanatus), Queen Ann’s lace
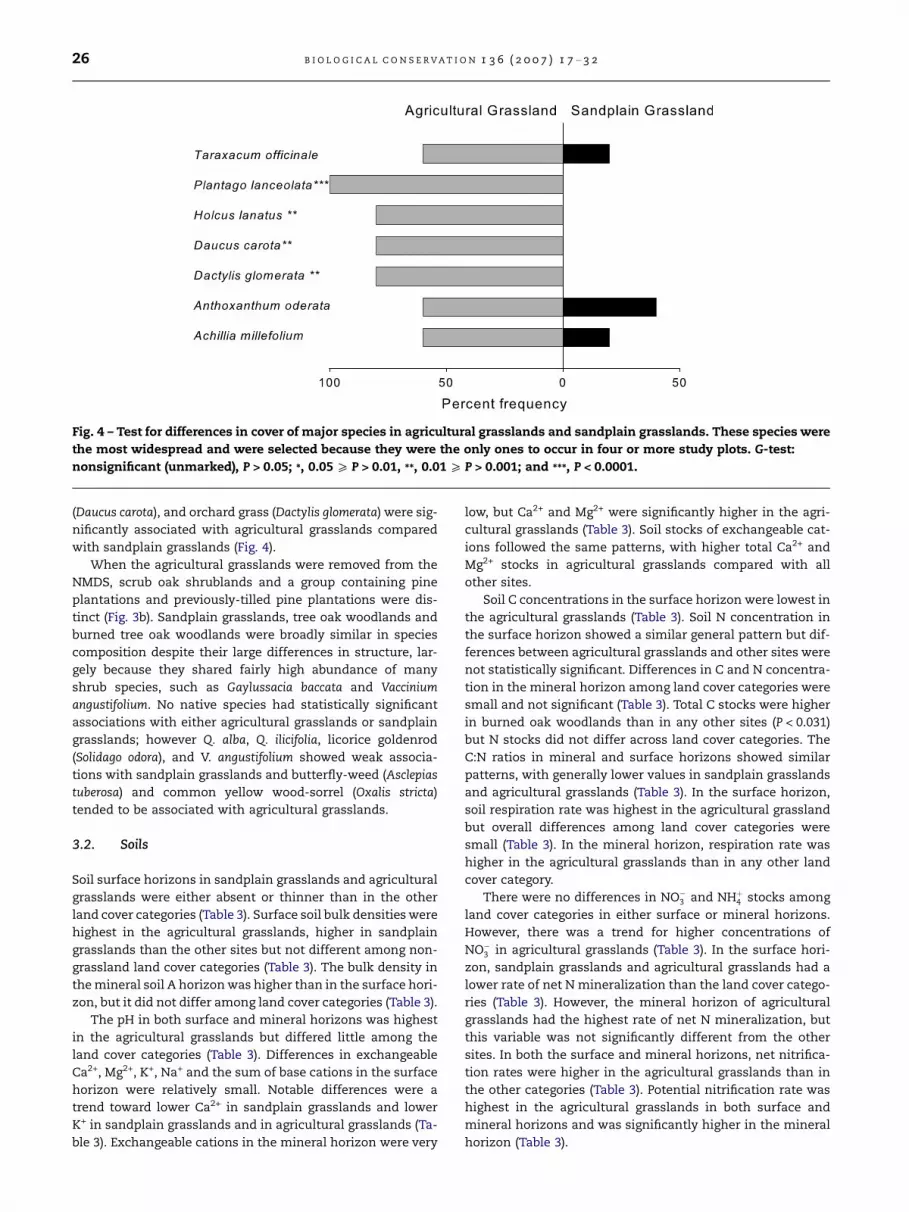
Fig. 4 – Test for differences in cover of major species in agricultural grasslands and sandplain grasslands. These species were
the most widespread and were selected because they were the only ones to occur in four or more study plots. G-test:
nonsignificant (unmarked), P > 0.05; *, 0.05 P P > 0.01, **, 0.01 P P > 0.001; and ***, P < 0.0001.
26 B I O L O G I C A L C O N S E R V A T I O N 1 3 6 ( 2 0 0 7 ) 1 7 – 3 2
(Daucus carota), and orchard grass (Dactylis glomerata) were sig-
nificantly associated with agricultural grasslands compared
with sandplain grasslands (Fig. 4).
When the agricultural grasslands were removed from the
NMDS, scrub oak shrublands and a group containing pine
plantations and previously-tilled pine plantations were dis-
tinct (Fig. 3b). Sandplain grasslands, tree oak woodlands and
burned tree oak woodlands were broadly similar in species
composition despite their large differences in structure, lar-
gely because they shared fairly high abundance of many
shrub species, such as Gaylussacia baccata and Vaccinium
angustifolium. No native species had statistically significant
associations with either agricultural grasslands or sandplain
grasslands; however Q. alba, Q. ilicifolia, licorice goldenrod
(Solidago odora), and V. angustifolium showed weak associa-
tions with sandplain grasslands and butterfly-weed (Asclepias
tuberosa) and common yellow wood-sorrel (Oxalis stricta)
tended to be associated with agricultural grasslands.
3.2. Soils
Soil surface horizons in sandplain grasslands and agricultural
grasslands were either absent or thinner than in the other
land cover categories (Table 3). Surface soil bulk densities were
highest in the agricultural grasslands, higher in sandplain
grasslands than the other sites but not different among non-
grassland land cover categories (Table 3). The bulk density in
the mineral soil A horizon was higher than in the surface hori-
zon, but it did not differ among land cover categories (Table 3).
The pH in both surface and mineral horizons was highest
in the agricultural grasslands but differed little among the
land cover categories (Table 3). Differences in exchangeable
Ca2+, Mg2+, K+, Na+ and the sum of base cations in the surface
horizon were relatively small. Notable differences were a
trend toward lower Ca2+ in sandplain grasslands and lower
K+ in sandplain grasslands and in agricultural grasslands (Ta-
ble 3). Exchangeable cations in the mineral horizon were very
low, but Ca2+ and Mg2+ were significantly higher in the agri-
cultural grasslands (Table 3). Soil stocks of exchangeable cat-
ions followed the same patterns, with higher total Ca2+ and
Mg2+ stocks in agricultural grasslands compared with all
other sites.
Soil C concentrations in the surface horizon were lowest in
the agricultural grasslands (Table 3). Soil N concentration in
the surface horizon showed a similar general pattern but dif-
ferences between agricultural grasslands and other sites were
not statistically significant. Differences in C and N concentra-
tion in the mineral horizon among land cover categories were
small and not significant (Table 3). Total C stocks were higher
in burned oak woodlands than in any other sites (P < 0.031)
but N stocks did not differ across land cover categories. The
C:N ratios in mineral and surface horizons showed similar
patterns, with generally lower values in sandplain grasslands
and agricultural grasslands (Table 3). In the surface horizon,
soil respiration rate was highest in the agricultural grassland
but overall differences among land cover categories were
small (Table 3). In the mineral horizon, respiration rate was
higher in the agricultural grasslands than in any other land
cover category.
There were no differences in NO�3 and NHþ4 stocks among
land cover categories in either surface or mineral horizons.
However, there was a trend for higher concentrations of
NO�3 in agricultural grasslands (Table 3). In the surface hori-
zon, sandplain grasslands and agricultural grasslands had a
lower rate of net N mineralization than the land cover catego-
ries (Table 3). However, the mineral horizon of agricultural
grasslands had the highest rate of net N mineralization, but
this variable was not significantly different from the other
sites. In both the surface and mineral horizons, net nitrifica-
tion rates were higher in the agricultural grasslands than in
the other categories (Table 3). Potential nitrification rate was
highest in the agricultural grasslands in both surface and
mineral horizons and was significantly higher in the mineral
horizon (Table 3).
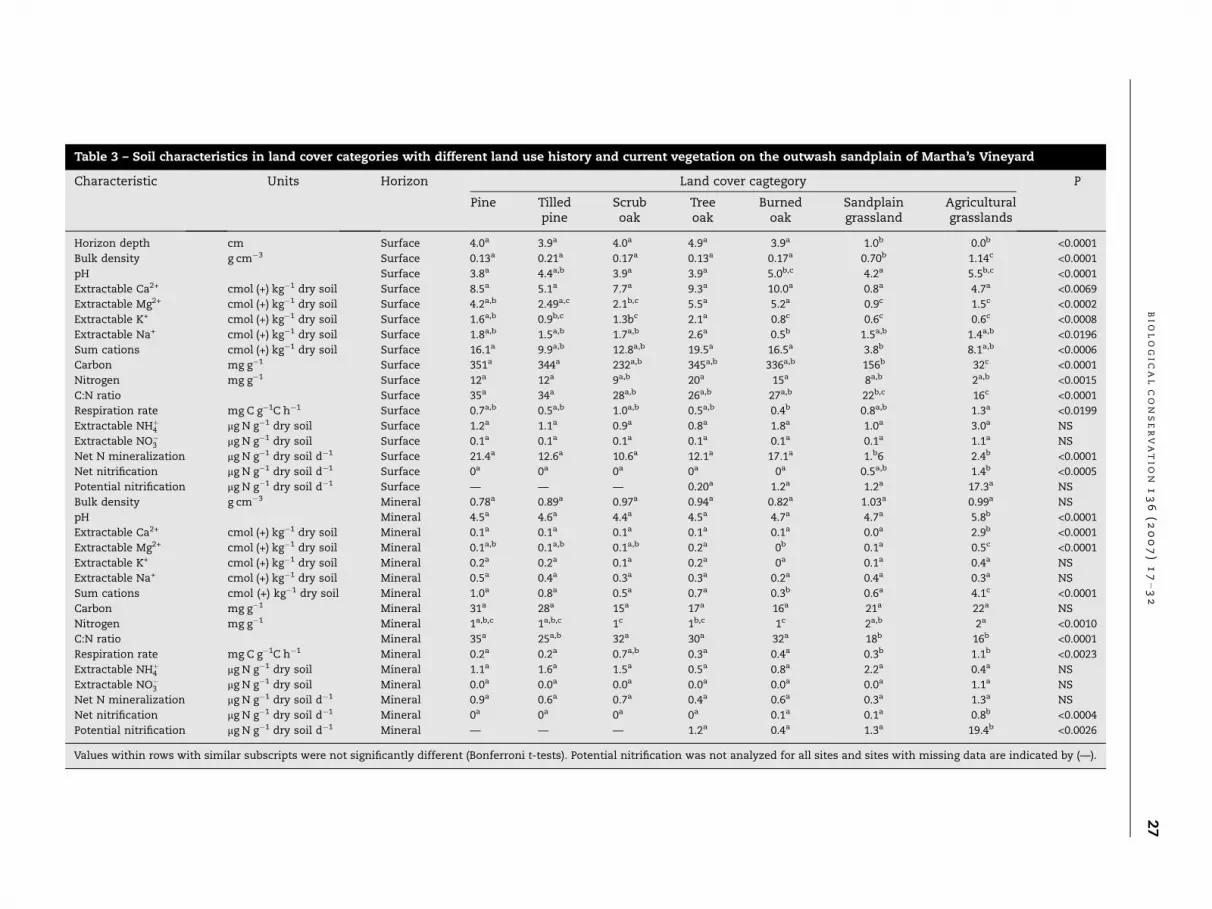
Table 3 – Soil characteristics in land cover categories with different land use history and current vegetation on the outwash sandplain of Martha’s Vineyard
Characteristic Units Horizon Land cover cagtegory P
Pine Tilledpine
Scruboak
Treeoak
Burnedoak
Sandplaingrassland
Agriculturalgrasslands
Horizon depth cm Surface 4.0a 3.9a 4.0a 4.9a 3.9a 1.0b 0.0b <0.0001
Bulk density g cm�3 Surface 0.13a 0.21a 0.17a 0.13a 0.17a 0.70b 1.14c <0.0001
pH Surface 3.8a 4.4a,b 3.9a 3.9a 5.0b,c 4.2a 5.5b,c <0.0001
Extractable Ca2+ cmol (+) kg�1 dry soil Surface 8.5a 5.1a 7.7a 9.3a 10.0a 0.8a 4.7a <0.0069
Extractable Mg2+ cmol (+) kg�1 dry soil Surface 4.2a,b 2.49a,c 2.1b,c 5.5a 5.2a 0.9c 1.5c <0.0002
Extractable K+ cmol (+) kg�1 dry soil Surface 1.6a,b 0.9b,c 1.3bc 2.1a 0.8c 0.6c 0.6c <0.0008
Extractable Na+ cmol (+) kg�1 dry soil Surface 1.8a,b 1.5a,b 1.7a,b 2.6a 0.5b 1.5a,b 1.4a,b <0.0196
Sum cations cmol (+) kg�1 dry soil Surface 16.1a 9.9a,b 12.8a,b 19.5a 16.5a 3.8b 8.1a,b <0.0006
Carbon mg g�1 Surface 351a 344a 232a,b 345a,b 336a,b 156b 32c <0.0001
Nitrogen mg g�1 Surface 12a 12a 9a,b 20a 15a 8a,b 2a,b <0.0015
C:N ratio Surface 35a 34a 28a,b 26a,b 27a,b 22b,c 16c <0.0001
Respiration rate mg C g�1C h�1 Surface 0.7a,b 0.5a,b 1.0a,b 0.5a,b 0.4b 0.8a,b 1.3a <0.0199
Extractable NHþ4 lg N g�1 dry soil Surface 1.2a 1.1a 0.9a 0.8a 1.8a 1.0a 3.0a NS
Extractable NO�3 lg N g�1 dry soil Surface 0.1a 0.1a 0.1a 0.1a 0.1a 0.1a 1.1a NS
Net N mineralization lg N g�1 dry soil d�1 Surface 21.4a 12.6a 10.6a 12.1a 17.1a 1.b6 2.4b <0.0001
Net nitrification lg N g�1 dry soil d�1 Surface 0a 0a 0a 0a 0a 0.5a,b 1.4b <0.0005
Potential nitrification lg N g�1 dry soil d�1 Surface — — — 0.20a 1.2a 1.2a 17.3a NS
Bulk density g cm�3 Mineral 0.78a 0.89a 0.97a 0.94a 0.82a 1.03a 0.99a NS
pH Mineral 4.5a 4.6a 4.4a 4.5a 4.7a 4.7a 5.8b <0.0001
Extractable Ca2+ cmol (+) kg�1 dry soil Mineral 0.1a 0.1a 0.1a 0.1a 0.1a 0.0a 2.9b <0.0001
Extractable Mg2+ cmol (+) kg�1 dry soil Mineral 0.1a,b 0.1a,b 0.1a,b 0.2a 0b 0.1a 0.5c <0.0001
Extractable K+ cmol (+) kg�1 dry soil Mineral 0.2a 0.2a 0.1a 0.2a 0a 0.1a 0.4a NS
Extractable Na+ cmol (+) kg�1 dry soil Mineral 0.5a 0.4a 0.3a 0.3a 0.2a 0.4a 0.3a NS
Sum cations cmol (+) kg�1 dry soil Mineral 1.0a 0.8a 0.5a 0.7a 0.3b 0.6a 4.1c <0.0001
Carbon mg g�1 Mineral 31a 28a 15a 17a 16a 21a 22a NS
Nitrogen mg g�1 Mineral 1a,b,c 1a,b,c 1c 1b,c 1c 2a,b 2a <0.0010
C:N ratio Mineral 35a 25a,b 32a 30a 32a 18b 16b <0.0001
Respiration rate mg C g�1C h�1 Mineral 0.2a 0.2a 0.7a,b 0.3a 0.4a 0.3b 1.1b <0.0023
Extractable NHþ4 lg N g�1 dry soil Mineral 1.1a 1.6a 1.5a 0.5a 0.8a 2.2a 0.4a NS
Extractable NO�3 lg N g�1 dry soil Mineral 0.0a 0.0a 0.0a 0.0a 0.0a 0.0a 1.1a NS
Net N mineralization lg N g�1 dry soil d�1 Mineral 0.9a 0.6a 0.7a 0.4a 0.6a 0.3a 1.3a NS
Net nitrification lg N g�1 dry soil d�1 Mineral 0a 0a 0a 0a 0.1a 0.1a 0.8b <0.0004
Potential nitrification lg N g�1 dry soil d�1 Mineral — — — 1.2a 0.4a 1.3a 19.4b <0.0026
Values within rows with similar subscripts were not significantly different (Bonferroni t-tests). Potential nitrification was not analyzed for all sites and sites with missing data are indicated by (—).
BI
OL
OG
IC
AL
CO
NS
ER
VA
TI
ON
13
6(2
00
7)
17
–3
22
7
28 B I O L O G I C A L C O N S E R V A T I O N 1 3 6 ( 2 0 0 7 ) 1 7 – 3 2
3.3. Soils and vegetation relationships
Species richness of native and nonnative species was signifi-
cantly related to different suites of soil characteristics. Non-
native species richness was positively related to soil density
(P < 0.01), pH (P < 0.05), and sodium (P < 0.05) but negatively re-
lated to soil potassium. Native species richness was signifi-
cantly lower in soils with higher rates of net nitrification
(P < 0.001), rates, extractable soil Ca2+ (P < 0.05) and extract-
able soil Mg2+ (P < 0.05).
4. Discussion
4.1. Vegetation patterns
On the Martha’s Vineyard sandplain, there was broad overlap
in species composition of pine plantations, scrub oak shrub-
lands, tree oak and burned tree oak woodlands and sandplain
grassland that differed in their historical tillage, dominant
overstory vegetation and occurrence of recent fire. The similar-
ity of species composition was caused primarily by the wide
distribution of dominant plant species. The occurrence of sim-
ilar dominant tree and shrub species across a variety of habi-
tats ranging from wooded to shrubby to predominantly open
has been noted for Martha’s Vineyard, Nantucket, and Cape
Cod sandplains (Dunwiddie et al., 1996, 1997). In addition, re-
cent prescribed burning of the understory resulted in no dra-
matic shifts in the species composition of the vegetation.
Sandplain grasslands had more species primarily because of
additions of grasses and forbs not present in the more wooded
land cover categories. All of these land cover categories had rel-
atively low numbers and cover of nonnative species, although
there was a weak trend toward more nonnative species in pre-
viously-tilled pine plantations and in sandplain grasslands.
Our results contrasted somewhat with previous studies in
which previous tillage was strongly correlated with lower
abundances of some native plant species (Motzkin et al.,
1996, 2002; Eberhardt et al., 2003). Several factors may have
caused this result. We sampled a relatively small number of
sites (5) for each land cover category (total n = 35), compared
with the 89–344 plots surveyed in these earlier studies. This
could have limited our ability to discriminate some statistical
differences among land cover classes, especially for under-
story species that were patchily distributed and typically oc-
curred on both tilled and untilled woodland sites even there
was a significant probability they occurred more frequently
in one land use or the other. Similar to these earlier studies,
we found some native species such as Q. alba, Q. ilicifolia, S.
odora, and V. angustifolia, were less common in tilled sites
but these differences were not statistically significant when
included in multiple Bonferroni comparisons among the se-
ven land use categories.
We could not discount the possibility that the effect of till-
ing had a smaller effect on Martha’s Vineyard than elsewhere,
either because tilling occurred in relatively small patches
compared with other coastal locations (Foster and Motzkin,
1999), because the history of agricultural disturbance may
have been shorter or less intense. Our results were consistent
with Dunwiddie et al. (1996) who found that sandplain grass-
lands shared both native and nonnative species with agricul-
tural grasslands. Also on the Martha’s Vineyard sandplain,
Lezberg et al. (2006) showed that mechanical land clearing
to promote early-successional grassland and shrubland in-
creased the richness of grasses and forbs but did not result
in the elimination of any woody species present before the
manipulation, and produced patterns of species cover and
frequency similar to that we observed in the sandplain
grasslands.
In contrast to the broad overlap in species composition
among pine plantations, scrub oak shrublands, oak wood-
lands, burned oak woodlands and sandplain grasslands, the
agricultural grasslands had very different vegetation that con-
tained a high richness and cover of nonnative species and low
richness and cover of the native species that predominated in
the other land cover categories. The combination of the ab-
sence of native shrubs and the presence of European agricul-
tural weeds such as P. lanceolata, H. lanatus, D. carota, and D.
glomerata helped to distinguish agricultural grasslands from
all of the other land cover categories (Fig. 3). This result was
broadly consistent with other studies that found that recent
agricultural fields are frequently dominated by nonnative spe-
cies (Pickett, 1982; Ogden and Rejmanek, 2005).
4.2. Soil characteristics
Soil physical properties, cation concentrations and carbon
and nitrogen concentrations and turnover rates showed the
same broad similarity among pine plantations, tilled pine
plantations, scrub oak shrublands, oak woodlands, burned
oak woodlands and sandplain grasslands and the same large
differences between agricultural grasslands and the other
land cover categories. On the sandplain, the similarity of
these soil characteristics across different woodland types
and sandplain grasslands with different land-use histories
and current vegetation suggested that the influence of these
factors on soil chemistry and biogeochemical function in
the sandplain landscape was relatively small. Several factors
may account for this pattern. Vegetation in the range of pine
plantations, oak woodlands and sandplain grasslands may
not have differed substantially enough in the presence of
the major species or species groups, such as oaks (Quercus
spp.), sugar maple (Acer saccharum) or Ericaceous shrubs, that
have been linked to differences in soil nutrient status and
nitrogen cycling in other forest locations in the Northeastern
US (Finzi et al., 1998; Gilliam et al., 2001). Our soil results were
generally similar to the findings of Compton et al. (1998) who
found that previous tillage had a relatively minor effect on
soil C and N stocks and rates of soil nitrogen cycling in a
New England sandplain. The turnover time of soil organic
matter in the very sandy soils of Martha’s Vineyard sandplain
of about 50 years (Peterson and Neill, 2002) is shorter than the
turnover time of organic matter turnover in soils from similar
latitudes with even slightly greater clay content (Arrouays
et al., 1995; Hooker et al., 2005) and less than the approxi-
mately 70 years since the tillage of our formerly tilled pine
plantations. This likely reduced or eliminated any ability to
detect differences in soil properties between old tilled and
non-tilled sites. The absence of a major effect of burning on
any soil properties was consistent with other studies that
have measured few long-term changes to C or N stocks or N
B I O L O G I C A L C O N S E R V A T I O N 1 3 6 ( 2 0 0 7 ) 1 7 – 3 2 29
cycling rates following prescribed burns in oak woodlands
(Boerner et al., 2000; Phillips et al., 2000; Hubbard et al., 2004).
The largest differences in soil characteristics occurred be-
tween the various woodlands and the agricultural grasslands,
with sandplain grasslands showing intermediate characteris-
tics. Several features of the agricultural and sandplain grass-
land soils stood out. The absence of a true organic Oea
horizon was correlated with the higher bulk densities in the
grasslands. The common practice of liming plowed land and
hayfields was likely responsible for elevated pH in the agricul-
tural grasslands. Soil pH on former agricultural soils is com-
monly elevated compared with non-tilled forest soils
(Compton and Boone, 2000). Higher pH in our agricultural
grasslands compared with the formerly tilled pine plantations
probably reflected the much shorter time since cultivation.
Higher concentrations of Ca++ and Mg++ in the mineral soil
of the agricultural grasslands also probably reflected recent
history of lime additions in these sites. The close proximity
to the ocean was also likely the cause of similar and relatively
high Na+ concentrations in all land cover categories.
Differences in soil N concentrations and cycling rates also
stood out in the agricultural grasslands. Rates of net nitrifica-
tion in all the wooded land cover categories and of sandplain
grasslands were low and generally resembled patterns typical
in the relatively acid soils of oak and pine woodlands (Comp-
ton et al., 1998; Finzi et al., 1998). High rates of net nitrification
and potential nitrification suggested a fundamental shift to-
ward greater inorganic nitrogen availability and greater pro-
duction of soil NO�3 in the agricultural grassland soils.
Higher rates of net nitrification in cultivated compared with
grassland soils has been reported from both North America
(Schimel, 1986) and Europe (Jassy et al., 2002).
By comparing hardwood forests with previous tillage and
similar forest on soils never tilled, Compton et al. (1998) found
higher rates of net nitrification in formerly tilled soils that mir-
rored the increases in net nitrification from native to plowed
grasslands that we found in this study. However, they found
that plant species composition, specifically the difference be-
tween pine and oak forests, affected N dynamics. We found no
differences in N dynamics between formerly tilled pine plan-
tations and never tilled pine plantations, which could reflect
the relatively short legacy of former tillage in these sandy soils
that have high organic matter turnover rates and relative sim-
ilarity of acid-loving oak and Ericaceous vegetation.
4.3. Implications for conservation and management
Restoration or expansion of the open, disturbance-dependent
grasslands and shrublands that support most rare and region-
ally-restricted plants and insects are conservation land man-
agement priorities on the New England coastal sandplain. Our
results suggest that the history of land use, current vegetation
and soil characteristics do not pose major barriers to manage-
ment strategies that would involve conversion among any of
these vegetation types with the specific objective of maintain-
ing some habitat for particular rare plants or insects (Wagner
et al., 2003; Clarke and Patterson, 2006). Such management
might involve maintaining a mosaic of vegetation types or
promoting specific species-rich shrubland or grassland com-
munities within larger largely forested mosaics. For example,
based on the low richness of nonnative plants and the simi-
larity of soils, removal of all or a portion of the approximately
259 ha of nonnative red and white pines that now exist in the
MFCSF in the central portion of Martha’s Vineyard to promote
native plants or Lepidoptera (Foster and Motzkin, 1999; Dun-
lop, 2004) would be unlikely to cause significant increases in
nonnative plants. Plantations that were never tilled would ap-
pear to be somewhat better candidates for this management
compared with formerly-tilled plantations based on their
slightly lower (but not statistically significant) richness and
cover of nonnative species in non-tilled sites. Across the
wider sandplain region, several smaller-scale experiments
that examined mechanical tree clearing in oak woodlands
(Lezberg et al., 2006), oak, pitch pine and scrub oak woodlands
on Martha’s Vineyard (Patterson and Clark, 2006) and scrub
oak shrublands on Nantucket (K. Beattie, pers. comm.) all
found that manipulations were not followed by significant in-
creases in nonnative species, suggesting that sites that have
similar soils and no previous history of nonnative species
can promote grasslands or shrublands without significant risk
of invasion by nonnative species. Expansion of sandplain
grassland habitat to promote native sandplain plants must
be balanced against the relatively greater value of oak wood-
lands and oak shrublands for many rare Lepidoptera (Gold-
stein, 1997; Wagner et al., 2003).
Because they are already cleared and because of their vi-
sual resemblance, agricultural grasslands are potential candi-
dates for management to reestablish cover of native-species
rich sandplain grasslands. Attempts to promote sandplain
grasslands or native species-rich shrublands on recently-
tilled agricultural grasslands, however, may face other hur-
dles. Although vegetation structure (predominance of grasses
and forbs) in agricultural grasslands and sandplain grass-
lands is superficially similar, agricultural grasslands: (1) lack
many of the native shrubs, forbs and grasses that are present
in all of the woodland land cover categories, and (2) contain a
high richness and cover of nonnative forbs and grasses. Based
on studies from other locations that suggest restoration of na-
tive grassland vegetation on recently-abandoned agricultural
lands can be jeopardized by the persistence of nonnative
grasses (Bakker and Wilson, 2004), promotion of native spe-
cies-rich plant communities on Northeastern US sandplain
agricultural grasslands may require measures to eliminate
nonnative grasses, seeding or planting with native plants, or
both. Because many typical and rare Northeastern US sand-
plain forbs and grasses reach greatest abundance on soils
with low pH, low moisture, and low nutrient status (Farns-
worth, 2006), and because low soil nutrient status may be re-
quired to favor native or desired plants at the expense of
nonnative or less desired species (Marrs et al., 1991; Ehrenfeld
and Toth, 1997; Owen and Marrs, 2000), the higher soil pH and
Ca and Mg concentrations in the agricultural grasslands may
also represent a barrier to the reestablishment of native
plants. Further experiments to test the relative performance
of target native sandplain plants in competition with nonna-
tive species and tests of the effects of pH-lowering soil
amendments or nutrient removal strategies would provide
valuable information that could enhance future promotion
of native vegetation on these anthropogenically-enriched
areas.
30 B I O L O G I C A L C O N S E R V A T I O N 1 3 6 ( 2 0 0 7 ) 1 7 – 3 2
Acknowledgments
This research was supported by the Semester in Environmen-
tal Science at MBL, an REU site grant at the Harvard Forest and
a grant from the A.W. Mellon Foundation to the MBL. B.V.H.
was supported by National Parks Ecological Research Fellow-
ship program, a partnership between the National Park Ser-
vice, the Ecological Society of America, and the National
Park Foundation and funded through a grant from the An-
drew W. Mellon Foundation. Pat Micks provided guidance
and assistance with laboratory methods. Ann Lezberg helped
with establishment of the sampling sites. Thanks also to the
following SES staff: Kenneth Foreman, Becky Karasack, Leslie
Graham and Kris Tholke. Thanks to Tom Chase and Kendra
Buresch of The Nature Conservancy’s Islands Program for
providing housing and assistance on Martha’s Vineyard. We
thank Joel Carlson of TNC and Chris Eagan from The Trustees
of Reservations for information on fire history. We thank John
Varkonda of the MA Department of Conservation and Recrea-
tion for permission to work in the MFCSF and the Kohlberg
and Mazar families for their generosity in allowing us to work
on their properties. Peter Dunwiddie, Glenn Motzkin, Ann
Lezberg, and Tom Chase kindly reviewed earlier drafts of
the manuscript.
Appendix A. Supplementary data
Supplementary data associated with this article can be found,
in the online version, at doi:10.1016/j.biocon.2006.10.046.
R E F E R E N C E S
Arrouays, D., Balesdent, J., Mariotti, A., Girardina, C., 1995.Modeling organic carbon turnover in cleared temperateforest soils converted to maize cropping by using 13Cnatural abundance measurements. Plant and Soil 173, 191–196.
Askins, R.A., 2001. Sustaining biological diversity in earlysuccessional communities: The challenge of managingunpopular habitats. Wildlife Society Bulletin 29, 409–4224.
Bakker, J.D., Wilson, S.D., 2004. Using ecological restoration toconstrain biological invasion. Journal of Applied Ecology 41,1058–1064.
Barbour, H., Simmons, T., Swain P., Woolsley, H., 1998. OurIrreplaceable Heritage. Massachusetts Natural Heritage andEndangered Species Program and The Massachusetts Chapterof the Nature Conservancy. Westborough, MA.
Bellemere, J., Motzkin, G., Foster, D.R., 2002. Legacies of theagricultural past in the forested present: an assessment ofhistorical land-use effects on rich mesic forests. Journal ofBiogeography 29, 1401–1420.
Boerner, R.E.J., Morris, S.J., Sutherland, E.K., Hutchinson, T.F., 2000.Spatial variability in soil nitrogen dynamics after prescribedburning in Ohio mixed-oak forests. Landscape Ecology 15, 425–439.
Briggs, J.M., Hoch, G.A., Johnson, L.C., 2002. Assessing the rate,mechanisms and consequences of the conversion of tallgrassprairie to Juniperus virginiana forest. Ecosystems 5, 578–586.
Brown, J.R., Archer, S., 1999. Shrub invasion of grassland:recruitment is continuous and not regulated by herbaceousbiomass or density. Ecology 80, 2385–2396.
Burnham, K.P., Anderson, D.R., 2002. Model Selection andMultimodel Inference: A Practical Information–TheoreticApproach. Springer, New York.
Cambardella, C., Elliot, E., 1994. Carbon and nitrogen dynamics ofsoil organic matter fractions from cultivated grassland soils.Soil Science Society of America Journal 58, 122–130.
Clarke, G.L., Patterson III, W.A., 2006. The distribution of rareplants in a coastal Massachusetts sandplain: implications forconservation and management. Biological Conservation, thisissue, doi:10.1016/j.biocon.2006.10.043.
Compton, J.E., Boone, R.D., 2000. Long-term impacts of agricultureon soil carbon and nitrogen in New England forests. Ecology81, 2314–2330.
Compton, J.E., Boone, R.D., Motzkin, G., Foster, D.R., 1998. Soilcarbon and nitrogen in a pine-oak sand plain in centralMassachusetts: role of vegetation and land-use history.Oecologia 116, 536–542.
Dunlop, T., 2004. State forest tapped for massive clearing. TheVineyard Gazette. September 24.
Dunwiddie, P.W., 1994. Martha’s Vineyard Landscapes: The Natureof Change. Vineyard Conservation Society, Tisbury, MA.
Dunwiddie, P.W., Adams, M.B., 1995. Fire Suppression andLandscape Change on Outer Cape Cod, 1600–1994. NationalPark Service, New England System Support Office, Boston, MA.
Dunwiddie, P.W., Zaremba, R.E., Harper, K.A., 1996. Aclassification of coastal heathlands and sandplain grasslandsin Massachusetts. Rhodora 98, 117–145.
Dunwiddie, P.W., Patterson III, W.A., Rudnicky, J.L., Zaremba,R.E., 1997. Vegetation management in coastal grasslands onNantucket Island, Massachusetts: effects of burning andmowing from 1982 to 1993. In: Vickery, P.D., Dunwiddie,P.W. (Eds.), Grasslands of Northeastern North America:Ecology and Conservation of Native and AgriculturalLandscapes. Massachusetts Audubon Society, Lincoln, MA,pp. 85–97.
Dunwiddie, P.W., Sferra, N., 1991. Loss of rare butterfly and plantspecies in coastal grasslands. Natural Areas Journal 11,119–120.
Dupouey, J.L., Dambrine, E., Laffite, J.D., Moares, C., 2002.Irreversible impact of past land use on forest soils andbiodiversity. Ecology 83, 2978–2984.
Eberhardt, R.W., Foster, D.R., Motzkin, G., Hall, B., 2003.Conservation of changing landscapes: vegetation andland-use history of Cape Cod National Seashore. EcologicalApplications 13, 68–84.
Ehrenfeld, J.G., Toth, L.A., 1997. Restoration ecology and theecosystem perspective. Restoration Ecology 5, 307–317.
Ehrenfeld, J.G., Kourtev, P., Huang, W., 2001. Changes in soilfunctions following invasion of exotic understory plants indeciduous forests. Ecological Applications 11, 1287–1300.
Farnsworth, E., 2006. Sandplain plant life history traits as a guideto multi-species management strategies for rare taxa.Biological Conservation, this issue.
Finzi, A.C., van Breemen, N., Canham, C.D., 1998. Canopy tree–soilinteractions within temperate forests: species effects on soilcarbon and nitrogen. Ecological Applications 8, 440–446.
Fletcher, P.C., Roffolini, R.J., 1986. Soil Survey of Dukes County,Massachusetts. US Department of Agriculture, SoilConservation Service, Washington, DC.
Foster, D.R., Motzkin, G. 1999., Historical influences on thelandscape of Martha’s Vineyard. Harvard Forest Paper No. 23.Harvard Forest, Petersham, MA.
Foster, D.R., Motzkin, G., 2003. Interpreting and conserving theopenland habitats of coastal New England: insights from landuse history. Forest Ecology and Management 185, 127–150.
Foster, D.R., Hall, B., Barry, S., Clayden, S., Parshall, T., 2002.Cultural, environmental and historical controls of vegetationpattern and the modern conservation setting on the island of
B I O L O G I C A L C O N S E R V A T I O N 1 3 6 ( 2 0 0 7 ) 1 7 – 3 2 31
Martha’s Vineyard, USA. Journal of Biogeography 29, 1381–1400.
Gilliam, F.S., Yurish, B.M., Adams, M.B., 2001. Temporal andspatial variation of nitrogen transformations in nitrogen-saturated soils of a central Appalachian hardwood forest.Canadian Journal of Forest Research 31, 1768–1785.
Gimmingham, C.H., 1972. Ecology of Heathlands. Chapman andHall, London.
Glatzel, G., 1991. The impact of historical land-use and modernforestry on nutrient relations of Central European forestecosystems. Fertilizer Research 27, 1–8.
Goldstein, P.Z., 1997. Lepidopteran assemblages and themanagement of sandplain communities on Martha’sVineyard, Massachusetts. In: Vickery, P.D., Dunwiddie,P.W. (Eds.), Grasslands of Northeastern North America:Ecology and Conservation of Native and AgriculturalLandscapes. Massachusetts Audubon Society, Lincoln, MA,pp. 217–236.
Grimm, E.C., 1984. Fire and other factors controlling the BigWoods vegetation of Minnesota in the mid-nineteenthcentury. Ecological Monographs 54, 291–311.
Gross, A.O., 1928The Heath Hen, vol. 6. Memoirs of the BostonSociety of Natural History, Boston, MA.
Hooker, B.A., Morris, T.F., Peters, R., Cardon, Z.G., 2005. Long-termeffects of tillage and corn stalk return on soil carbondynamics. Soil Science Society of America Journal 69, 188–196.
Hubbard, R.M., Vose, J.M., Clinton, B.D., Elliot, K.J., Knoepp, J.D.,2004. Stand restoration burning in oak-pine forests in thesouthern Appalachians: effects on aboveground biomass andcarbon and nitrogen cycling. Forest Ecology and Management190, 311–321.
Jassy, J.H., Koerner, W., Dambrine, E., Dupouey, J.L., Benoit, M.,2002. Influence of former agricultural land use on net nitrateproduction in forest soils. European Journal of Soil Science 53,367–374.
Lezberg, A.L., Buresch, K., Neill, C., Chase, T., 2006. Mechanicalland clearing to promote establishment of coastal sandplaingrassland and shrubland communities. Restoration Ecology14, 220–232.
Litvaitis, J.A., 2003. Shrubland and early-successional forests:critical habitats dependent on disturbance in the northeasternUnited States. Forest Ecology and Management 185, 1–4.
Lovett, G.M., Reuth, H., 1999. Soil nitrogen transformations inbeech and maple stands along a nitrogen deposition gradient.Ecological Applications 9, 1330–1344.
Marks, P.L., 1983. On the origin of the field plants of theNortheastern United States. American Naturalist 122, 210–228.
Marrs, R.H., Gough, M.W., Griffiths, M., 1991. Soil chemistry andleaching losses of nutrients from semi-natural grasslands andarable soils on three contrasting parent materials. BiologicalConservation 57, 257–271.
McCune, B., Mefford, M.J., 1999. PC-ORD. Multivariate analysis ofecological data, fourth ed. MjM Software Design, GlenedonBeach, Oregon.
MNHESP, (Massachusetts Natural Heritage and EndangeredSpecies Program), 2001. Biomap—guiding land conservationfor biodiversity in Massachusetts. Massachusetts ExecutiveOffice of Environmental Affairs, Boston.
Mitchell, R.J., Auld, M.H.D., Hughes, J.M., Marrs, R.H., 2000.Estimates of nutrient removal during heathland restoration onsuccessional sites in Dorset, southern England. BiologicalConservation 95, 233–246.
Motzkin, G., Foster, D.R., Allen, A., Harrod, J., Boone, R., 1996.Controlling site to evaluate history: vegetation patterns of aNew England sand plain. Ecological Monographs 66, 345–365.
Motzkin, G., Ciccarello, S.C., Foster, D.R., 2002a. Frost pockets on alevel sand plain: does variation in microclimate help maintain
persistent vegetation patterns? Journal of the Torrey BotanicalSociety 129, 154–163.
Motzkin, G., Eberhardt, R., Hall, B., Foster, D.R., Harrod, J.,MacDonald, D., 2002b. Vegetation variation across CapeCod, Massachusetts: environmental and historicaldeterminants. Journal of Biogeography 29, 1439–1454.
Motzkin, G., Foster, D.R., 2002. Grasslands, heathlands andshrublands in coastal New England: historical interpretationsand approaches to conservation. Journal of Biogeography 29,1569–1590.
Ogden, J.A.E., Rejmanek, M., 2005. Recovery of native plantcommunities after the control of a dominant invasive plantspecies, Foeniculum vulgare: implications for management.Biological Conservation 125, 427–439.
Owen, K.M., Marrs, R.H., 2000. Creation of heathland on formerarable land at Minsmere, Suffolk, UK: the effects of soilacidification on the establishment of Calluna and ruderalspecies. Biological Conservation 93, 9–18.
Patterson III, W.A., Clark, G.L., 2006. Restoring barrens shrublands:decreasing fire hazard and improving rare plant habitat. In:Masters, R.E., Galley, K.E.M. (Eds.), Proceedings of the 23rd TallTimbers Fire Ecology Conference: Fire in Grassland andShrubland Ecosystems. Tall Timbers Research Station,Tallahassee, FL.
Patterson III, W.A., Saunders, K.E., Horton, L.J., 1983. Fire regimes ofCape Cod National Seashore. Office of Scientific Studies 83-1.National Park Service, Washington, DC.
Peterson, G.G., Neill, C., 2002. Using soil d 13C to detect the historicpresence of little bluestem (Schizachyrium scoparium) grasslandson Martha’s Vineyard. Restoration Ecology 11, 116–122.
Pickett, S.T.A., 1982. Population patterns through twenty years ofold field succession. Vegetation 49, 45–59.
Phillips, D.H., Foss, J.E., Buckner, E.R., Evans, R.M., FitzPatrick, E.A.,2000. Response of surface horizons in an oak forest toprescribed burning. Soil Science Society of America Journal 64,754–760.
Rejmanek, M., 1989. Invasibility of plant communities. In: Drake,J.A., Mooney, H.A., Castri, F.d., Groves, R.H., Kruger, F.J.,Rejmanek, M., Williamson, M. (Eds.), Biological Invasions: AGlobal Perspective. Wiley, Chichester, UK, pp. 369–388.
Robarge, W.P., Fernandez, I., 1986. Quality assurance methodsmanual for laboratory analytical techniques, LaboratoryAnalytical Techniques Manual, US Environmental ProtectionAgency and US Forest Service, Corvallis, OR.
Romme, W.H., Despain, D.G., 1989. Historical perspective on theYellowstone fires of 1988. BioScience 39, 695–699.
Schimel, D.S., 1986. Carbon and nitrogen turnover in adjacentgrassland and cropland ecosystems. Biogeochemistry 2, 345–357.
Schmidt, E.L., Belser, L.W., 1982. Nitrifying bacteria. In: Page, A.L.,Miller, R.H., Keeney, D.R. (Eds.), second ed., Methods of SoilAnalysis, Part 2: Chemical and Microbiological PropertiesAmerican Society of Agronomy, Soil Science Society ofAmerica, Madison, WI, pp. 1027–1042.
Sorrie, B.A., Somers, P., 1999. The vascular plants ofMassachusetts: A county checklist. Massachusetts Division ofFisheries and Wildlife Natural Heritage and EndangeredSpecies Program, Westborough, MA.
Sutherland, W.J., Hill, D.A., 1995. Managing Habitats forConservation. Cambridge University Press, Cambridge.
Tiffney, W.N., 1997. The role of nutrient-level control inmaintaining and restoring lowland heaths: British andNorthern European techniques of potential application inNortheastern North America. In: Vickery, P.D., Dunwiddie, P.W.(Eds.), Grasslands of Northeastern North America, Ecology andConservation of Native and Agricultural Landscapes. Centerfor Biological Conservation, Massachusetts Audubon Society,Lincoln, MA, pp. 69–78.

32 B I O L O G I C A L C O N S E R V A T I O N 1 3 6 ( 2 0 0 7 ) 1 7 – 3 2
Tilman, D., 1993. Species richness of experimental productivitygradients: how important is colonization limitation. Ecology74, 2179–2191.
TTOR (The Trustees of Reservations), 1999. Conserving ourCommon Wealth—A Vision for the Massachusetts Landscape.The Trustees of Reservations, Beverly, MA.
United States Coast and Geodetic Survey. 1848. Maps of Martha’sVineyard, Massachusetts. Marine Biological LaboratoryArchives, Woods Hole, MA.
Vitousek, P.M., D’Antonio, C.M., Loope, L.L., Westbrooks, R., 1996.Biological invasions as global environmental change.American Scientist 84, 468–478.
Wagner, D.L., Nelson, M.W., Schweitzer, D.F., 2003. ShrublandLepidoptera of southern New England and southeastern NewYork: ecology, conservation and management. Forest Ecologyand Management 185, 95–112.
Zar, J.H., 1999. Biostatistical Analysis, fourth ed. Prentice-Hall,Englewood Cliffs, NJ.
Copyright © 2022 FDOKUMEN