human health risk assessment - Government of Newfoundland ...
189
Worldwide Engineering, Environmental, Construction, and IT Services HUMAN HEALTH RISK ASSESSMENT TOWN OF BUCHANS BUCHANS, NEWFOUNDLAND AND LABRADOR MARCH 2010 REF. NO. 058704 (44) Prepared by: Conestoga-Rovers & Associates 651 Colby Drive Waterloo, Ontario Canada N2V 1C2 Office: (519) 884-0510 Fax: (519) 884-0525 web: http://www.CRAworld.com
-
Upload
khangminh22 -
Category
Documents
-
view
0 -
download
0
Transcript of human health risk assessment - Government of Newfoundland ...

W o r l d w i d e E n g i n e e r i n g , E n v i r o n m e n t a l , C o n s t r u c t i o n , a n d I T S e r v i c e s
HUMAN HEALTH RISK ASSESSMENT TOWN OF BUCHANS BUCHANS, NEWFOUNDLAND AND LABRADOR
MARCH 2010 REF. NO. 058704 (44)
Prepared by: Conestoga-Rovers & Associates 651 Colby Drive Waterloo, Ontario Canada N2V 1C2
Office: (519) 884-0510 Fax: (519) 884-0525
web: http://www.CRAworld.com

058704 (44) CONESTOGA-ROVERS & ASSOCIATES
TABLE OF CONTENTS Page
1.0 INTRODUCTION ...................................................................................................................1
2.0 SITE DESCRIPTION AND HISTORY..................................................................................3 2.1 RECENT INVESTIGATIONS ............................................................................4 2.2 FOCUSED RESIDENTIAL SOIL INVESTIGATION ......................................7
3.0 HUMAN HEALTH RISK ASSESSMENT (HHRA)..........................................................12 3.1 SPECIFIC GOALS OF THE HHRA.................................................................12 3.2 CHARACTERIZATION OF EXPOSURE SETTING.....................................12 3.3 IDENTIFICATION OF METALS OF INTEREST (MOI) ..............................13 3.4 DEVELOPMENT OF SITE-SPECIFIC
RISK-BASED CONCENTRATIONS ...............................................................16 3.4.1 CONCEPTUAL SITE MODEL (CSM) ............................................................16 3.4.2 EXPOSURE ASSESSMENT ..............................................................................18 3.4.3 TOXICITY ASSESSMENT ................................................................................19 3.4.3.1 NON-CANCER REFERENCE DOSES ...........................................................20 3.4.3.2 CANCER SLOPE FACTORS............................................................................21 3.4.3.3 SELECTION OF TOXICITY REFERENCE VALUES....................................22 3.4.3.3.1 ANTIMONY.......................................................................................................23 3.4.3.3.2 ARSENIC ............................................................................................................24 3.4.3.3.3 BARIUM .............................................................................................................25 3.4.3.3.4 CADMIUM.........................................................................................................27 3.4.3.3.5 IRON ...................................................................................................................28 3.4.3.3.6 LEAD...................................................................................................................29 3.4.3.3.7 MANGANESE ...................................................................................................29 3.4.3.3.8 THALLIUM........................................................................................................30 3.4.3.3.9 URANIUM .........................................................................................................31 3.4.4 DERMAL TOXICITY ........................................................................................32 3.4.5 SITE-SPECIFIC RISK-BASED CONCENTRATION EQUATIONS............33 3.4.6 ESTIMATED DAILY INTAKES ......................................................................36 3.4.7 BACKGROUND SOIL CONCENTRATIONS...............................................37 3.4.8 SITE-SPECIFIC EXPOSURE FREQUENCY ...................................................39 3.4.9 BIOAVAILABILITY ..........................................................................................40 3.4.10 SITE-SPECIFIC RISK-BASED CONCENTRATIONS...................................41 3.5 IDENTIFICATION OF METALS CONCENTRATIONS
GREATER THAN SITE-SPECIFIC RBCS.......................................................42 3.6 IDENTIFICATION OF SAMPLE LOCATIONS WITH METALS
CONCENTRATIONS GREATER THAN SITE-SPECIFIC RBCS ...............43 3.7 DEVELOPMENT OF SITE-SPECIFIC
RISK-BASED CONCENTRATIONS FOR ADULTS.....................................46

058704 (44) CONESTOGA-ROVERS & ASSOCIATES
TABLE OF CONTENTS Page
3.7.1 ADULT LEAD RISK-BASED CONCENTRATION......................................46 3.7.2 ADULT ARSENIC RISK-BASED CONCENTRATION ...............................48
4.0 UNCERTAINTY ANALYSIS...............................................................................................49 4.1 EXPOSURE SCENARIO FACTORS................................................................49 4.2 TOXICITY REFERENCE VALUES..................................................................49 4.3 BACKGROUND EXPOSURES ........................................................................50 4.4 BIOAVAILABILITY ..........................................................................................50
5.0 SUMMARY AND CONCLUSIONS ...................................................................................51
6.0 RECOMMENDED ACTION ...............................................................................................52
7.0 REFERENCES........................................................................................................................54

058704 (44) CONESTOGA-ROVERS & ASSOCIATES
LIST OF FIGURES (Following Text)
FIGURE 1 SITE LOCATION PLAN FIGURE 2 AUGUST 2009 SAMPLING LOCATIONS: PAOC32 RESIDENTIAL
SURFACE SOIL FIGURE 3 AUGUST 2009 SAMPLING LOCATIONS: PAOC32 BACKGROUND
SURFACE SOIL FIGURE 4 OCTOBER 2009 SAMPLING LOCATIONS: COMPOSITE RESIDENTIAL
SURFACE SOIL FIGURE 5 EXCEEDANCES OF SITE-SPECIFIC RISK-BASED CONCENTRATIONS

058704 (44) CONESTOGA-ROVERS & ASSOCIATES
LIST OF TABLES (In Text)
TABLE A SUMMARY OF ANALYTICAL TEST RESULTS FROM AUGUST 2009
SAMPLING TABLE B COMPARATIVE SUMMARY OF ANALYTICAL TEST RESULTS FROM
AUGUST 2009 SAMPLING FOR RESIDENTIAL, BACKGROUND AND TSA TABLE C SUMMARY OF ANALYTICAL TEST RESULTS FROM OCTOBER 2009
SAMPLING TABLE D SUMMARY OF BIOAVAILABLITY TEST RESULTS TABLE E SUMMARY OF EXCEEDANCES OF GENERIC RESIDENTIAL SCREENING
CRITERIA TABLE F SUMMARY OF ANALYTICLA TEST RESULTS FOR BISMUTH AND
RUBIDIUM TABLE G POTENTIAL RECEPTORS AND COMPLETED EXPOSURE PATHWAYS TABLE H RECEPTOR CHARACTERISTICS TABLE I EXPOSURE FACTORS TABLE J NONCANCER TOXICITY REFERENCE VALUES TABLE K TOXICITY REFERENCE VALUES FOR CARCINOGENIC METALS TABLE L TRVS FOR ANTIMONY TABLE M TRVS FOR ARSENIC TABLE N TRVS FOR BARIUM TABLE O TRVS FOR CADMIUM TABLE P TRVS FOR IRON TABLE Q TRVS FOR LEAD TABLE R TRVS FOR MANGANESE

058704 (44) CONESTOGA-ROVERS & ASSOCIATES
LIST OF TABLES (In Text)
TABLE S TRVS FOR THALLIUM TABLE T TRVS FOR URANIUM TABLE U SOIL INGESTION RATES FOR VARIOUS RESIDENTIAL RECEPTORS TABLE V CCME EDIS TABLE W BACKGROUND SOIL CONCENTRATIONS USED TO DERIVE SITE-
SPECIFIC RBCS TABLE X CLIMATE DATA FOR BUCHANS TABLE Y SITE-SPECIFIC RBCS AND COMPARISON TO MAXIMUM DETECTED
CONCENTRATION IN SURFICIAL SOIL IN BUCHANS TABLE Z SAMPLE LOCATIONS WITH AT LEAST ONE METAL CONCENTRATION
GREATER THAN SITE-SPECIFIC RBCS TABLE AA SUMMARY OF RISK ASSESSMENT RESULTS FOR ARSENIC TABLE AB SUMMARY OF CANCER RISK ESTIMATES BY AREA TABLE AC SUMMARY OF RISK ASSESSMENT RESULTS FOR LEAD TABLE AD SUMMARY OF HQS BY AREA TABLE AE USEPA ALM INPUTS AND RESULTS

058704 (44) CONESTOGA-ROVERS & ASSOCIATES
LIST OF TABLES (Following Text)
TABLE 1 SOIL ANALYTICAL RESULTS FROM AUGUST 2009: PAOC 32 -
RESIDENTIAL SURFICIAL SOIL TABLE 2 SOIL ANALYTICAL RESULTS FROM AUGUST 2009: PAOC 32 -
BACKGROUND SURFICIAL SOIL TABLE 3 SOIL ANALYTICAL RESULTS FROM OCTOBER 2009: COMPOSITE
SURFICIAL SOIL SAMPLES TABLE 4 IDENTIFICATION OF METALS OF INTEREST (MOI) IN RESIDENTIAL
SURFICIAL SOIL TABLE 5 DERIVATION OF RISK-BASED CONCENTRATIONS (RBCs) FOR METALS
OF INTEREST (MOI) IN SOIL - RESIDENTIAL ORAL, DERMAL, AND INHALATION EXPOSURE
TABLE 6 IDENTIFICATION OF METALS OF INTEREST (MOI) IN RESIDENTIAL
SURFICIAL SOIL THAT EXCEED SITE-SPECIFIC RBCs TABLE 7 IDENTIFICATION OF SAMPLING LOCATIONS WITH CONCENTRATION
OF METALS OF INTEREST (MOI) IN RESIDENTIAL SURFICIAL SOIL THAT EXCEED SITE-SPECIFIC RBCs
TABLE 8 CANCER RISK ESTIMATES AND NON-CANCER HAZARD QUOTIENTS
BY SAMPLE LOCATION FOR METALS OF INTEREST (MOI) IN RESIDENTIAL SURFICIAL SOIL THAT EXCEED SITE-SPECIFIC RBCs
TABLE 9 DERIVATION OF ADULT RISK-BASED CONCENTRATIONS (RBCs) FOR
ARSENIC AND LEAD IN SOIL - RESIDENTIAL ADULT ORAL, DERMAL, AND INHALATION EXPOSURE

058704 (44) CONESTOGA-ROVERS & ASSOCIATES
LIST OF APPENDICES APPENDIX A USEPA'S STANDARD OPERATING PROCEDURE FOR AN IN VITRO
BIOACCESSIBILITY ASSAY FOR LEAD IN SOIL APPENDIX B UNIVERSITY OF COLORADO'S RELATIVE BIOAVAILABILITY
LEACHING PROCEDURE: RBALP AND TEST RESULTS APPENDIX C PROVISIONAL PEER-REVIEWED TOXICITY VALUE FOR IRON AND
COMPOUNDS

058704 (44) i CONESTOGA-ROVERS & ASSOCIATES
EXECUTIVE SUMMARY This report presents a Human Health Risk Assessment (HHRA) related to surface soil in the Town of Buchans (Town). The surface soil in the Town has been impacted by deposition of metals from historic mining operations and waste management. Conestoga-Rovers & Associates (CRA) completed a Phase II Environmental Site Assessment (ESA) for the Province of Newfoundland and Labrador (Province) in 2009. To develop the Scope of Work for its ESA, CRA reviewed previous environmental reports, completed a site inspection, interviewed former mine employees and town representatives, and completed a review of additional documents provided by the Province's lawyers. A total of 33 Potential Areas of Concern (PAOCs), were identified as part of the Phase II ESA. Impacts above generic environmental criteria were identified in 30 of the 33 PAOCs investigated. The Phase II ESA concluded that there were 30 PAOCs where remediation was required. This report presents the results of a HHRA conducted at one of the PAOCs identified, namely residential surface soils in Buchans. The HHRA does not affect the conclusions and recommendations of the Phase II ESA for the remaining PAOCs. Additional studies at these remaining 29 PAOCs with impacted media (soil, groundwater, surface water sediments) have yet to be completed. The additional studies for those 29 PAOCs are intended to determine the extent of the remediation required, and not whether remediation is required. CRA collected over 70 surface soil samples from residential and recreational locations in and around the Town in August and October 2009. CRA's independent subcontracted laboratories analyzed the samples for total metals as well as for metal bioavailability, i.e., the fraction of total metals that can be absorbed from the gastrointestinal tract. CRA compared the analytical results to screening criteria developed by federal and provincial agencies to identify metals of interest (MOI), i.e., metals with maximum concentrations that were greater than these generic criteria. CRA developed site-specific residential risk-based concentrations (site-specific RBCs) for these MOI in Town surface soil that account for bioavailability and local climatic conditions. CRA then compared the concentration of MOI in each sample to the site-specific RBCs to identify locations where the MOI concentrations were greater than the site-specific RBC.
058704 (44) ii CONESTOGA-ROVERS & ASSOCIATES
The HHRA concluded the following: 1. Site-specific RBCs, which were developed consistent with applicable regulatory
guidance (Health Canada (2009a), CCME [2206]) represent the appropriate basis to evaluate the need for remedial measures.
2. The concentration of lead in surficial soil was greater than the site-specific RBC of 622 milligrams per kilogram (mg/kg) in the soil samples from 20 locations in the Town. These locations reflect three former mining operational areas, five public areas and 12 residential locations. Also, the concentration of arsenic was greater than its site-specific RBC of 43 mg/kg in the soil sample from one location, near the Tailings Spill Area (TSA) southwest of the Town.
CRA recommends the development of a Risk Management Plan to mitigate potential exposure to these metals (primarily for small children). The report should assess and recommend remedial options or controls measures that reduce the exposures and the potential health risks associated with lead in surface soil in the Town.

058704 (44) 1 CONESTOGA-ROVERS & ASSOCIATES
1.0 INTRODUCTION
This report presents a Human Health Risk Assessment (HHRA) related to surface soil in the Town of Buchans (Town). Conestoga-Rovers & Associates (CRA) completed this HHRA at the request of the Province of Newfoundland and Labrador. The HHRA evaluates potential human health impacts due to the deposition of dusts containing metals from historic mining and waste disposal around the Town (see Figure 1). CRA completed a Phase II Environmental Site Assessment (ESA) for the Province of Newfoundland and Labrador (Province) in 2009. To develop the Scope of Work for its ESA, CRA reviewed previous environmental reports, completed a site inspection, interviewed former mine employees and town representatives, and completed a review of additional documents provided by the Province's lawyers. A total of 33 Potential Areas of Concern (PAOCs), were identified as part of the Phase II ESA. Impacts above generic environmental criteria were identified in 30 of the 33 PAOCs investigated. The Phase II ESA concluded that there were 30 PAOCs where remediation was required. This report presents the results of a HHRA conducted at one of the PAOCs identified, namely residential surface soils in Buchans. The HHRA does not affect the conclusions and recommendations of the Phase II ESA for the remaining PAOCs. Additional studies at these remaining 29 PAOCs with impacted media (soil, groundwater, surface water sediments) have yet to be completed. The additional studies for those 29 PAOCs are intended to determine the extent of the remediation is required, and not whether remediation is required. CRA collected discrete surface soil samples from 12 residential and recreational areas of the Town on August 31, 2009 along with 12 background surface soil samples. CRA subsequently collected 41 residential surface soil samples and nine garden soil samples from 42 residential properties in the Town from October 12 to 15, 2009. Twenty–six of these samples were from residential properties in the vicinity of the Tailings Spill Area (TSA) while the remaining 15 samples were from residential properties that are located some distance southeast of the TSA. All of the soil sample locations are shown on Figures 2 to 4. CRA also collected surface soil samples from nine public recreation areas in the Town to assess potential risk in these areas. One background surface soil sample was collected to help establish a baseline. CRA analyzed soil samples for total metals. In addition, CRA sent split samples to a second laboratory so that the metals bioavailability could be determined. Bioavailability refers to the fraction of metals in soil that can be absorbed by the gastrointestinal tract (GI tract). CRA used both the total metals and the bioavailability data for August 2009 and October 2009 to prepare this HHRA.

058704 (44) 2 CONESTOGA-ROVERS & ASSOCIATES
The objectives of the HHRA were to: • Identify metals of interest (MOI), which are those metals with maximum detected
concentrations that are greater than generic residential screening criteria, e.g., Canadian Council of Ministers of the Environment (CCME) residential/parkland concentrations
• Develop site-specific risk based concentrations (site-specific RBCs) for MOI
• Identify MOI and locations where detected concentrations were greater than site-specific RBCs
• Develop cancer risk estimates and non-cancer hazard quotients for these locations
• Provide recommended actions where necessary
CRA has used this approach to identify areas of the Town that would likely require further consideration or remedial actions, and areas where no further action is likely needed. The remainder of this report is organized as follows: • Section 2.0 - Site Description and History
• Section 3.0 - Human Health Risk Assessment
• Section 4.0 - Uncertainty Analysis
• Section 5.0 - Summary and Conclusions
• Section 6.0 - Recommendations
• Section 7.0 - References

058704 (44) 3 CONESTOGA-ROVERS & ASSOCIATES
2.0 SITE DESCRIPTION AND HISTORY
The Town is located 72 kilometres from the Trans-Canada Highway at the terminus of Route 370. Figure 1 depicts the Town and surrounding environment. In 2001 (the most recent date for which population data are available), the Town included approximately 900 residents and 443 private dwellings. The Buchans Mining Company, a subsidiary of American Smelting and Refining Company (ASARCO), began constructing the Town in 1927. ASARCO and its partner, Anglo-Newfoundland Development Company Limited (ANDCL) owned and operated the Town. Company operations included ownership of all residences, administration of the company-owned Town and municipal services, along with operation of the railroad to Millertown Junction, the hydroelectric plant, and storage and ship loading facilities in Botwood, NL. The company owned railroad controlled access to the Town. During construction of the Town, the company lined and surfaced the streets with waste rock from the mine. In 1963, ANDCL provided property to establish a privately-owned portion of the Town, which was designated as the "Townsite", and located south of the Town. The area was incorporated as a Local Improvement District (LID) of the Town and became a municipality in 1973. The company-owned portions of the Town including the hospital, school buildings, library, and recreational buildings were incorporated as a LID in 1977, along with the sale and transfer of ownership of residential properties to their occupants. The company transferred municipal services to the LID in 1978. The Town resulted from the merger of both LIDs in 1979. The environment surrounding the Town are rural, and are dominated by former and current mining operations, which are the primary industrial operations for the Town. Areas surrounding the Town are undeveloped and used predominately for recreational purposes including sport fishing, winter sports, hunting, etc. Buchans Lake is north of the Town and Red Indian Lake is south of the Town. Buchans River connects both lakes and flows from Buchans Lake to Red Indian Lake. With respect to mining operations, base metal sulphides were first discovered in 1905 within an ore deposit outcropping along the cliffs lining the Buchans River. Following the discovery, five mines operated in the area from 1906 until 1984. These were the Old Buchans Mine, Lucky Strike Mine and the Oriental Mine, which were open pit mining operations due to the presence of the ore bodies at relatively shallow depths, along with the Rothermere Mine and MacLean Mine, which were shaft mines due to the depth of the ore bodies.

058704 (44) 4 CONESTOGA-ROVERS & ASSOCIATES
Major mining operations included ore extraction and milling operations. The five mining operations extracted base metal ores, predominantly copper, lead, and zinc, and transported the ore to a production facility located near the Lucky Strike Mine, west of the Town, and processed the ore. The processing facility discharged mine tailings to a wooden sluice located south of the production building. The sluice discharged via Mucky Ditch to the Buchans River to the east. Overflows from this sluice box and emergency shut downs of processing facility resulted in releases of tailings and ore concentrate material to an area south of the production building, known as the Tailings Spill Area. The processing plant and the mine discharged wastewater to the Buchans River via a drainage pipe that lies beneath the Town. The company constructed tailings ponds southwest of Lucky Strike Mine after 1965. The processing operation subsequently discharged tailings materials and wastewater to these ponds. From 1928 to 1984, the mining operations resulted in the extraction and milling of 16.25 million tonnes of ore, and the generation of approximately 10.5 million tonnes of mine tailings and waste rock, of which approximately 4.6 million tonnes were waste rock. Mine tailings consisted of approximately 10 percent solids, and contained metals such as copper, lead, and zinc. 2.1 RECENT INVESTIGATIONS
AMEC Earth and Environmental Limited (AMEC) completed a Phase I Environmental Site Assessment (ESA) for the former ASARCO mine site (AMEC, 2009) for Abitibi-Bowater Inc. (Abitibi). AMEC identified 18 Recognized Environmental Conditions (RECs), as well as five other areas of environmental concern. The ESA included a review of historical and current records, interviews with knowledgeable interested parties and site visits. AMEC did not collect and analyze any soil or other samples to characterize environmental conditions. AMEC defined a REC as "…the presence or likely presence of any hazardous substance or petroleum products on a property under conditions that indicate an existing release, a past release, or a material threat of a release of any hazardous substances or petroleum products into structures on the property or into the ground, groundwater, or surface water of the property" (American Society for Testing and Materials (ASTM) Standard E-1527-05). CRA completed a Phase II ESA for the Province in 2009. To develop the Scope of Work (SOW) for its ESA, CRA reviewed AMEC's report, completed a site inspection,

058704 (44) 5 CONESTOGA-ROVERS & ASSOCIATES
interviewed former mine employees and town representatives, and completed a review of additional documents provided by the Province's lawyers. CRA identified the same RECs as AMEC, however CRA identified each as a potential area of concern (PAOC). In addition, CRA identified additional areas as PAOCs, which were not included as RECs in AMEC's Phase I ESA. CRA also investigated the soil and groundwater quality in and around the former mining operation. Between July 23 and September 2, 2009, CRA advanced 76 boreholes, installed 45 monitoring wells, excavated 88 test pits and sampled 65 surface locations. CRA collected a total of 251 soil samples, 81 groundwater samples, 53 sediment samples, 33 surface water samples, and two concrete chip samples for analysis from the PAOC. Maxxam Analytics, Inc. (Maxxam), an independent contracted laboratory, completed the chemical analyses. One of the additional PAOC CRA identified was PAOC 32 - Residential Surficial Soil: PAOC 32 – Residential Surficial Soil Dust complaints dating back to the mid 1960s have been documented in the reports that CRA reviewed. In addition, the AMEC Phase I ESA report identifies dust complaints from the Town residents dating back to the 1970s. Particulate monitoring conducted in the Town area indicates that, at times, particulate has been present at concentrations greater than 400 micrograms per cubic metre during the monitoring events. Particulate sources have been identified as the tailings ponds, the TSA, and the outdoor ore concentrate storage pad. Abitibi has reported that the dust was comprised of up to 1.23 percent zinc, 0.36 percent lead, and 0.26 percent copper. Residential surficial soil in the Town have been a current and historic receptor of the atmospheric discharge of metal-impacted particulate from tailings, the TSA, and the outdoor ore concentrate storage pad. CRA identified this area as PAOC-32 (CRA, 2009). CRA collected and Maxxam analyzed 24 discrete surface soil samples from this PAOC, comprised of 12 residential surface soil samples (RSS-01 to RSS-12) and 12 background surface soil samples (BRSS-13 to BRSS-24). Maxxam analyzed the samples for metals and cyanide. Figures 2 and 3 present the residential and background residential surface soil sample locations, and Tables 1 and 2 present the analytical test results, which are discussed below. Of the 27 metals included in the analytical test program, ten were detected in all residential and background soil samples. These were aluminum, barium, chromium, copper, iron, lead, manganese, uranium, vanadium, and zinc. Seven metals were either

058704 (44) 6 CONESTOGA-ROVERS & ASSOCIATES
non-detect in any sample, or detected infrequently in both residential and background samples, i.e., in 3 or fewer samples. These were antimony, beryllium, bismuth, boron, molybdenum, selenium and tin. The following table presents a summary of the parameters most frequently detected.
Table A: Summary of Analytical Test Results from August 2009 Sampling
Parameters CCME Criteria Residential Samples September 2009
Background Residential Samples
September 2009 Residential Number Min. Max. Number Min. Max. /Parkland of Detected Detected of Detected Detected (mg/kg) Detects Conc. Conc. Detects Conc. Conc. (mg/kg) (mg/kg) (mg/kg) (mg/kg)
Aluminum NC 12 2800 12000 12 2100 19000 Arsenic 12 9 3 160 6 2 4 Barium 500 12 180 2200 12 19 1100 Cadmium 10 11 0.4 8.8 11 0.4 5.3 Chromium 64 12 3 26 12 3 9 Cobalt 50 9 1 5 8 2 7 Copper 63 12 8 510 12 10 90 Iron NC 12 1800 31000 12 3300 28000 Lead 140 12 27 4800 12 22 660 Lithium NC 7 3 4 3 4 5 Manganese NC 12 30 220 12 26 2100 Mercury Elemental NC 4 0.2 1.4 6 0.1 0.5 Nickel 50 9 2 5 3 2 3 Silver 20 7 0.6 20 4 0.6 1.8 Strontium NC 12 5 28 6 8 24 Thallium 1 8 0.1 1.4 2 0.1 0.2 Uranium 23 12 0.2 70 12 0.1 4.5 Vanadium 130 12 12 67 12 7 82 Zinc 200 12 65 2000 12 51 880
Notes: CRA collected 12 residential and 12 background residential surface soil samples. mg/kg = milligrams per kilogram conc. = concentration NC = No CCME Criterion As noted above, CRA collected samples from a number of other PAOC, some of which either border or run through the Town. These PAOC included: • PAOC 3 Tailings Spill Area
• PAOC 10 Production Area Disposal Pit
• PAOC 19 Railroad Y

058704 (44) 7 CONESTOGA-ROVERS & ASSOCIATES
• PAOC 28 Entire Length of Mucky Ditch The concentrations of metals in the soil samples collected from these areas were generally greater than those present in the soil samples from PAOC 32. For example, concentrations for a number of metals in the soil samples collected from the TSA (PAOC 3) were greater than the CCME industrial site criteria (CCME, 2007a). A comparison of the maximum detected concentrations in soil samples collected from these PAOCs are presented below:
Table B: Comparative Summary of Analytical Test Results from August 2009 Sampling for Residential, Background and TSA
Parameter Maximum Concentration (mg/kg)
PAOC3 PAOC-32 RSS PAOC-32 BRSS Antimony 75 22 2 Arsenic 2,000 160 4 Cadmium 370 8.8 5.3 Copper 5,100 510 90 Lead 28,000 4,800 660 Silver 91 20 1.8 Thallium 65 1.4 0.2 Zinc 87,000 2,000 880
Notes: RSS = residential surficial soil and BRSS = background residential surficial soil mg/kg = milligrams per kilogram 2.2 FOCUSED RESIDENTIAL SOIL INVESTIGATION
CRA completed a subsequent residential surficial soil sampling program to more fully assess the soil quality in residential and recreational areas of the Town. CRA collected these soil samples from residential lots, gardens, and recreational locations between October 12 and 15, 2009. CRA collected 41 residential surface soil samples and nine garden soil samples from 42 residential properties in the Town. In addition CRA collected nine surface soil samples from public areas in Town and one background soil sample approximately three kilometres west of Town. Soil sampling locations are shown on Figure 4. CRA collected a statistically valid number of samples from two areas of the Town; 26 of the samples from residential properties located in the vicinity of the TSA, and 15 samples from residential properties that are located some distance southeast of the TSA.

058704 (44) 8 CONESTOGA-ROVERS & ASSOCIATES
The nine surface soil samples collected from public areas in the Town were as follows: • Tennis court ( SS-01)
• Parks ( SS-02 and SS-03)
• Baseball diamond (SS-04)
• Public swimming pool ( SS-05)
• Public library (SS-06)
• Children's playground ( SS-07)
• Mini-putt course ( SS-08)
• Hospital yard (SS-19)
CRA interviewed the residents/occupants to obtain a brief history of their property and to determine the exterior areas of the property that are used most frequently by residents. CRA also attempted to identify historical events and property developments, which may have potentially impacted the nature of the properties’ surficial soil (i.e., fires, import of fill or soil, spills/disposal of fireplace/wood burning stove ash etc). CRA collected the soil samples from areas most frequently used by the residents but away from structures (house, garage, shed), and noted historical impacts. CRA's protocol for the soil sample collection was as follows: • Screen the soil for evidence of impact by visual and olfactory examination as well as
with a photoionization detector (PID)
• Collect nine discrete samples at each location in a W-pattern to provide a reasonable representation of areal impacts, using pre-cleaned tools
• Thoroughly mix these samples in a stainless steel bowl to prepare a composite sample
• Place the composite sample in laboratory-supplied containers and deliver the samples under chain-of-custody protocols to Maxxam for chemical analyses
• Decontaminate sampling equipment between soil sampling locations
The analytical data for the 27 metals analyzed are presented in Table 3 and discussed below. Twenty-five of the 27 metals included in the test program were detected in at least one sample. Only beryllium and boron were non-detect in all samples. In addition,
058704 (44) 9 CONESTOGA-ROVERS & ASSOCIATES
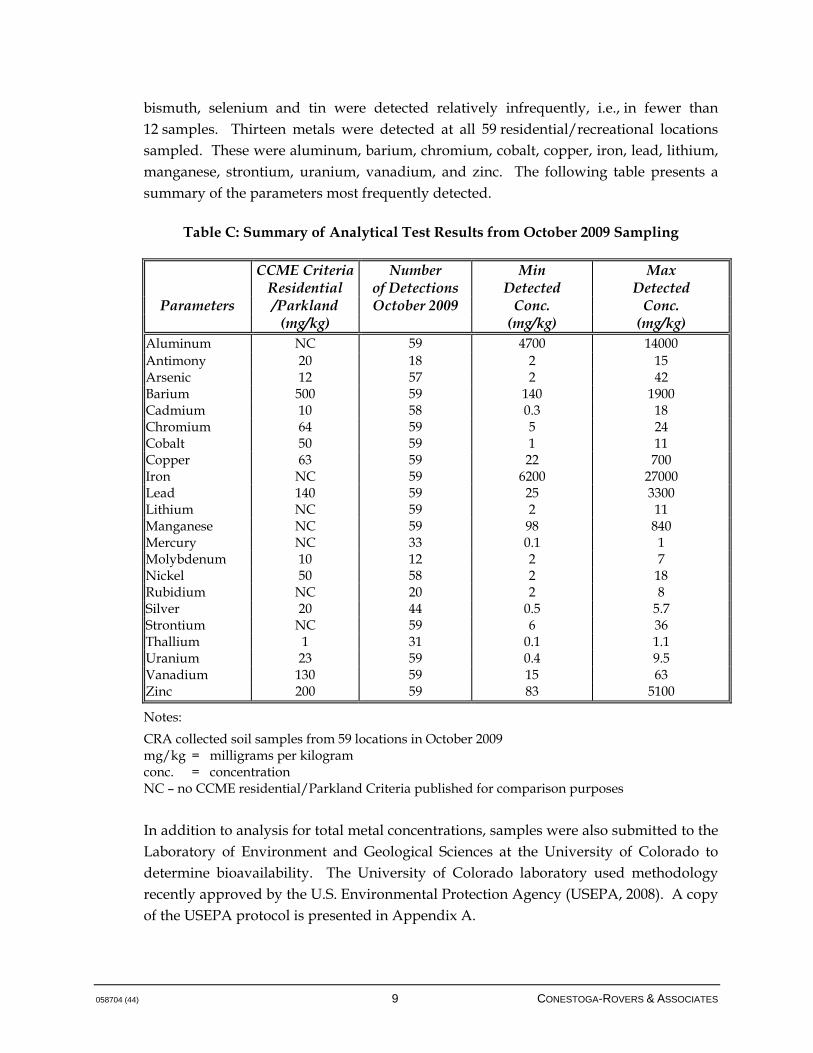
bismuth, selenium and tin were detected relatively infrequently, i.e., in fewer than 12 samples. Thirteen metals were detected at all 59 residential/recreational locations sampled. These were aluminum, barium, chromium, cobalt, copper, iron, lead, lithium, manganese, strontium, uranium, vanadium, and zinc. The following table presents a summary of the parameters most frequently detected.
Table C: Summary of Analytical Test Results from October 2009 Sampling
CCME Criteria Number Min Max Residential of Detections Detected Detected
Parameters /Parkland October 2009 Conc. Conc. (mg/kg) (mg/kg) (mg/kg)
Aluminum NC 59 4700 14000 Antimony 20 18 2 15 Arsenic 12 57 2 42 Barium 500 59 140 1900 Cadmium 10 58 0.3 18 Chromium 64 59 5 24 Cobalt 50 59 1 11 Copper 63 59 22 700 Iron NC 59 6200 27000 Lead 140 59 25 3300 Lithium NC 59 2 11 Manganese NC 59 98 840 Mercury NC 33 0.1 1 Molybdenum 10 12 2 7 Nickel 50 58 2 18 Rubidium NC 20 2 8 Silver 20 44 0.5 5.7 Strontium NC 59 6 36 Thallium 1 31 0.1 1.1 Uranium 23 59 0.4 9.5 Vanadium 130 59 15 63 Zinc 200 59 83 5100
Notes: CRA collected soil samples from 59 locations in October 2009 mg/kg = milligrams per kilogram conc. = concentration NC – no CCME residential/Parkland Criteria published for comparison purposes In addition to analysis for total metal concentrations, samples were also submitted to the Laboratory of Environment and Geological Sciences at the University of Colorado to determine bioavailability. The University of Colorado laboratory used methodology recently approved by the U.S. Environmental Protection Agency (USEPA, 2008). A copy of the USEPA protocol is presented in Appendix A.

058704 (44) 10 CONESTOGA-ROVERS & ASSOCIATES
The methodology involves determining total metal concentrations using standard USEPA test methods as follows: 1. SW-846 method 3050B for extraction of metals from the soil sample
2. Method 6010B for analysis of extracts
In separate studies, the laboratory extracts the metals from the soil sample using a simulated gastric solution and this solution is then analyzed. The laboratory then calculates the ratio of the amount extracted by the gastric solution to that extracted by the standard method. This ratio reflects the bioaccessibility of the metal, which is the fraction that is released from the sample into the GI tract. Since the methodology does not include the use of laboratory animals, test results are referred to as in vitro bioaccessibility (IVBA). As described in the USEPA methodology, bioavailability, i.e., the fraction absorbed from the GI tract is then calculated using these results. The correlation equation presented in the USEPA guidance to determine bioavailability is as follows:
RBA = 0.7878 × IVBA – 0.028 Where: RBA = relative bioavailability (unitless)
IVBA = in vitro bioaccessibility (unitless)
The USEPA has approved the correlation algorithm to calculate bioavailability for lead only. However, the University of Colorado has demonstrated a correlation between IVBA test results and bioavailability of arsenic in laboratory animals. As a result, the University of Colorado developed IVBA results for arsenic. CRA regarded the data for both lead and arsenic as appropriate for use in this HHRA. IVBA results for other metals are also likely to be correlated with bioavailability studies in laboratory animals, but to date, reports have focused primarily on arsenic and lead. Appendix B presents the University of Colorado methodology and data tables. In addition to the 59 residential/public and one background composite samples collected in October, CRA selected the six August 2009 soil samples with the greatest arsenic and lead concentrations for IVBA testing. These six samples were RSS-01-SO, RSS-03-SO, RSS-06-SO, RSS-07-SO, RSS-08-SO, and RSS-09-SO. Arsenic concentrations in these samples ranged from 6 mg/kg to 160 mg/kg, while lead concentrations in these

058704 (44) 11 CONESTOGA-ROVERS & ASSOCIATES
samples ranged from 220 mg/kg to 4,800 mg/kg. The net result is that CRA submitted 66 samples (59 + 1 + 6 = 66) for IVBA analysis. The following table presents a summary of the bioavailability test results.
Table D: Summary of Bioavailablity Test Results
Parameters In Vitro Bioaccessibility Relative Bioavailability Number Min Max 95th UCL(1) Number Min Max 95th UCL(1)
of Value Value Value of Value Value Value Detections (%) (%) (%) Detections (%) (%) (%)
Arsenic 61(2) 7 59 26(3) NA NA NA NA Lead 66 49 121(4) 85 66 43 106(4) 74
Notes: NA = not applicable 95th UCL = 95th percentile upper confidence limit(UCL) of the mean (1) 95th UCLs calculated based on detected concentrations using USEPA's ProUCL 4.00.04
(USEPA, 2009a) (2) Arsenic was not detected in five gastric extraction solutions (3) 95th UCL value includes 61 samples (4) Bioaccessibility and bioavailability results greater than 100 percent are likely attributable
to variability in the test methods employed. Although values greater than 100 percent are improbable test results, they were used as reported to calculate the 95th UCL.

058704 (44) 12 CONESTOGA-ROVERS & ASSOCIATES
3.0 HUMAN HEALTH RISK ASSESSMENT (HHRA)
A HHRA estimates potential cancer and non-cancer health impacts from exposure to chemicals of potential concern. The estimates are based on methods, calculations, and input assumptions developed by regulatory agencies. This HHRA was conducted to evaluate potential human health impacts associated with the presence of metals identified in surface soil at the Site. This HHRA is comprised of the following: an exposure assessment, a toxicity assessment, a risk characterization, and an uncertainty analysis. Generally a HHRA initially involves developing a human health conceptual site model to identify potential exposure pathways and the receptors that may be exposed to the chemical of concern in site-related environmental media. The conceptual site model for this HHRA focused on human exposure to the MOI present in the surface soil considering the characterization of the Site presented in Section 2.0. 3.1 SPECIFIC GOALS OF THE HHRA
As noted previously, the specific goals of this HHRA are as follows: • Identify MOI, which are those metals with maximum detected concentrations that
exceeded generic residential screening criteria, e.g., CCME residential/parkland concentrations
• Develop site-specific RBCs for MOI
• Identify MOI and locations where detected concentrations exceeded site-specific RBCs
• Develop cancer risk estimates and non-cancer hazard quotients at these locations
• Provide recommendations as necessary
3.2 CHARACTERIZATION OF EXPOSURE SETTING
This HHRA assesses exposure to residential surface soils in the Town that have been impacted by atmospheric deposition of metal-containing mine tailings. In addition, there is evidence that streets of the Town were lined and surfaced with waste rock from the mine (AMEC, 2009), which presumably contained elevated concentrations of metals.

058704 (44) 13 CONESTOGA-ROVERS & ASSOCIATES
Section 2.2 describes the soil samples collected and analyzed, as well as the techniques used, to characterize the surface soil in the Town. 3.3 IDENTIFICATION OF METALS OF INTEREST (MOI)
CRA compared the maximum concentrations of metals in the August and October surface soil samples to generic residential soil screening criteria. CRA selected these criteria from the following: • CCME Canadian Environmental Quality Guidelines (CCME, 2007a)1
• Rationale for the Development and Application of Generic Soil, Groundwater and Sediment Criteria for use at Contaminated Site in Ontario, December 1996 and updates, Ministry of the Environment (MOE, 1996)2
• USEPA Regional Screening Levels (RSLs) Table (USEPA, 2009b)
CRA adjusted the MOE (1996) and USEPA (2009b) criteria to be consistent with the CCME methodology. The exposure criteria were adjusted for carcinogens to an excess cancer risk of 1 x 10⁻⁵ (1 in 100,000) and for non-carcinogens to a hazard quotient (HQ) of 0.2. Table 4 presents the minimum and maximum concentrations, detection frequencies, and the location of the maximum concentrations for the detected metals in surface soil. For metals that were non-detect (ND), ND was indicated in the minimum and maximum columns. The higher of either the maximum detected concentration or the maximum detection limit was used for screening purposes. There were nine MOI with maximum concentrations that were greater than the generic residential screening criteria. These are presented in the following table:
1 Canadian Soil Quality Guidelines for the Protection of Environmental and Human Health
(CCME, 2007a) are the lower of the human health risk based values and ecological endpoints. Therefore CRA used only the human health risk based values for residential/parkland use. However, since CCME (2007a) does not indicate if the basis of the standard is ecological or human health, CRA consulted CCME (1997).
2 Ontario Ministry of Environment (MOE), 2004. Soil, Ground Water and Sediment Standards for Use Under Part XV.1 of the Environmental Protection Act dated March 9, 2004 standards are the lower of the human health risk based values and ecological endpoints, therefore CRA used only the human health risk based values presented in MOE (1996) for the selection of the MOI. MOE (2004) does not indicate if the basis of the standard is ecological or human health. As a result CRA consulted MOE (1996), which does indicate the basis of the standard to select the human health values.

058704 (44) 14 CONESTOGA-ROVERS & ASSOCIATES
Table E: Summary of Exceedances of Generic Residential Screening Criteria
CAS Location of
MOI Number Max. Concentration
Antimony 7440-36-0 RSS-08; 0-0.3 mbgs (08/31/09) Arsenic 7440-38-2 RSS-08; 0-0.3 mbgs (08/31/09) Barium 7440-39-3 RSS-08; 0-0.3 mbgs (08/31/09)
Cadmium 7440-43-9 SS-40; 0-0.1 mbgs (10/14/09) Iron 7439-89-6 RSS-08; 0-0.3 mbgs (08/31/09) Lead 7439-92-1 RSS-08; 0-0.3 mbgs (08/31/09)
Manganese 7439-96-5 SS-02; 0-0.1 mbgs (10/12/09) Thallium 7440-28-0 RSS-08; 0-0.3 mbgs (08/31/09) Uranium 7440-61-1 RSS-01; 0-0.3 mbgs (08/31/09)
Note: CAS = Chemical Abstract Service Currently no screening criteria were available for bismuth or rubidium in any of the sources consulted. As such, concentrations of these metals detected in surface soils in the Town were compared with background soil concentrations to determine if surface soils in the Town have been impacted by releases from mining operations. While 12 discrete background soil samples were collected in August and a composite background sample was collected in October, elevated levels of lead and other metals were observed in these samples. Potential impacts from mining operations on these samples could not be ruled out. Therefore, CRA obtained site-specific background soil concentrations from the Canadian Database of Geochemical Surveys (CDGS, 2010). The CDGS database includes concentrations of metals in till for central Newfoundland based on 1991-1992 samples. Soil concentrations were available in CDGS (2010) for different particle sizes and analytical methods. For the purposes of this HHRA as discussed below in Section 3.4.7, CRA selected detected background soil concentrations from 841 silt and clay-sized fraction (<0.063 mm) samples tested by Inductively Coupled Plasma - Atomic Emission Spectrometry (ICP-AES). CRA selected this data set as this analytical test method is typically used to determine metal concentrations in soil, and the soil sample particle size is more representative of material which would easily adhere to children's hands (Health Canada, 2009a).

058704 (44) 15 CONESTOGA-ROVERS & ASSOCIATES
Background soil data were available for bismuth using ICP-AES. However, no analytical test results were available for rubidium using ICP-AES, and therefore sample results for the sample particle size using Instrumental Neutron Activation Analysis (INAA) were selected. A comparison of analytical test results of surface soils in the Town and background soil concentrations of bismuth and rubidium are presented in the following table.
Table F: Summary of Analytical Test Results for Bismuth and Rubidium Statistic Bismuth Rubidium
Town(1) Background(2) Town(1) Background(3)
Number of Samples 71 841 71 839 Number of Detections 4 92 23 755 Detection Frequency (%) 6% 11% 32% 90%
Maximum Conc. (mg/kg) 11 12 8 120 Minimum Conc. (mg/kg) ND (2) ND (2) ND (2) ND (5) Average Conc. (mg/kg) 1.2 1.2 1.5 38.2 Notes: ND = not detected at the associated detection limit (1) Town samples include surface soil samples collected in the Town in August and October 2009. (2) Background sample data obtained from the Canadian Database of Geochemical Surveys (CDGS, 2010). Values reflect silt and clay-sized fraction (<0.063 mm) samples tested by Inductively Coupled Plasma - Atomic Emission Spectrometry (ICP-AES). See Section 3.4.7 for details.
(3) Background sample data obtained from the Canadian Database of Geochemical Surveys (CDGS, 2010). Values reflect silt and clay-sized fraction (<0.063 mm) samples tested by Instrumental Neutron Activation Analysis (INAA). CDGS, (2010) did not include analytical test results for rubidium using ICP-AES.
These results show that the average and maximum detected concentration of bismuth in Town surface soils are comparable to background soils. For rubidium, both the average and maximum detected concentration in Town surface soils are considerably lower than background soils. In part, this could reflect the use of different analytical test methods. However, even accounting for the differences noted between INIAA and ICP-AES test results, concentrations of rubidium in Town surface soils appear to be lower than background concentrations. Taken together, the analytical test results indicate that surface soils in the Town have likely not been impacted by mining operations with respect to bismuth or rubidium. Therefore, these metals were not identified as MOIs.

058704 (44) 16 CONESTOGA-ROVERS & ASSOCIATES
3.4 DEVELOPMENT OF SITE-SPECIFIC
RISK-BASED CONCENTRATIONS
In order to develop site-specific RBCs and subsequently to evaluate the significance of the impacted media, the potential pathways by which individuals may come in contact with these media must be determined. The combination of factors (chemical source, media of concern, release mechanisms, and potential receptors) that could produce a complete exposure pathway and lead to human uptake of chemicals at the Town are identified in what is defined as a Conceptual Site Model (CSM). 3.4.1 CONCEPTUAL SITE MODEL (CSM)
A CSM identifies potentially complete exposure pathways given the conditions in and around the site under investigation. A CSM for the Town was developed based on the potential routes of exposure with respect to the presence of metals in surface soil. Case-specific current and foreseeable future land use in the Town is residential or recreational. Thus the identified receptors that may be present in the Town and come into contact with impacted surficial soil include child and adult residents. These receptors along with exposure pathways are described further below. An exposure pathway describes the means by which an individual may be exposed to contaminants present in impacted media. An exposure pathway is complete (i.e., it could result in a receptor contacting a contaminant in impacted media) if the following elements are present: 1. A source or a release from a source (e.g., metals present in crushed rock used for
road construction or eroded from tailings area or mining operations and carried by wind to locations in the Town)
2. A probable environmental migration route (e.g., deposition of a metal in airborne particulate eroded from tailings onto soil)
3. An exposure point where a receptor may come in contact with a contaminant (e.g., surface soil)
4. A route by which a contaminant may enter a potential receptor's body (e.g., ingestion, dermal contact, or inhalation)
5. A receptor population which is potentially exposed
058704 (44) 17 CONESTOGA-ROVERS & ASSOCIATES
If any of these elements is not present, the exposure pathway is considered incomplete and does not contribute to the total exposure to contaminants from the site under investigation. Given historic information provided in AMEC (2009) and CRA (2009) as well as analytical testing results from samples collected by CRA in August 2009 and October 2009, the first three elements are regarded as satisfied for the Town of Buchans. Contaminants have been identified in mine tailings and mine operation site locations. Historical information indicates that crushed rock from mining operations was used for road construction and metals have been present in airborne particulate. Finally, analytical test results indicate that metals are present in surficial soil at residential and recreational locations in the Town at levels that exceed CCME residential/parkland use criteria. With respect to potential exposure routes, those associated with contaminants in surficial soil include incidental ingestion, direct dermal contact, and inhalation. Based on an understanding of the components of an exposure pathway and the current/future conditions in and around the Town, potential human populations considered relevant to the assessment include child and adult residents. Adult Resident The exposure scenario for the adult resident is developed to reflect frequent exposure to metals in surficial soil over a lifetime. The adult resident could be exposed to surface soil through combined incidental ingestion, dermal contact, and inhalation of soil particulates. Child Resident The exposure scenario for the child resident is developed to reflect frequent exposure to metals in surficial soil during childhood. The child resident could be exposed to surface soil through combined incidental ingestion, dermal contact, and inhalation of soil particulates. During activities outdoors, these receptors could potential contact metals in surface soil by incidental ingestion, dermal contact and inhalation of particulate. These pathways, which are considered to be complete, are listed in the following table.

058704 (44) 18 CONESTOGA-ROVERS & ASSOCIATES
Table G: Potential Receptors and Completed Exposure Pathways
Scenario Exposure Exposure Receptor Exposure Rationale for Selection Timeframe Medium Point Population Route of Exposure Pathway
Current/ Future: Surface Soil Direct Contact
Adult/ Child
Resident
Ingestion Dermal
Inhalation of particulates
Potential exposure to contaminated surface soil during outdoor activities at home.
3.4.2 EXPOSURE ASSESSMENT
Following identification of receptors and pathways, receptor characteristics and exposure factors are identified in order to develop a quantitative estimate of the magnitude of potential exposure. These inputs are specific for a receptor and pathway of exposure. For the purposes of this HHRA, receptor characteristics and exposure factors presented in Health Canada (2009b) were selected. The following tables present the inputs used in this HHRA.
Table H: Receptor Characteristics Receptor Infant Toddler Child Teen Adult Age 0 - 6 mo. 7 mo. - 4 y 5 - 11 y 12 - 19 y >= 20 y Body weight (kg) 8.2 16.5 32.9 59.7 70.7 Soil ingestion rate (mg/d) 20 80 20 20 20 Inhalation rate (m3/d) 2.1 9.3 14.5 15.8 15.8 Water ingestion rate (L/d) 0.3 0.6 0.8 1 1.5 Skin surface area (cm2) - hands, forearms, and lower legs. 1050 1720 2865 4400 5000 Soil adherence factor (mg/cm2/event) - hands 0.1 0.1 0.1 0.1 0.1
Note: The soil adherence factor of 0.1 mg/cm2/event for hands was used for forearms and lower legs also. This approach is conservative, i.e., overestimates potential dermal exposures compared to Health Canada (2009b), which recommends a value of 0.01 mg/cm2/event for surfaces other than hands.

058704 (44) 19 CONESTOGA-ROVERS & ASSOCIATES
Table I: Exposure Factors Factor Infant Toddler Child Teen Adult Hours per day (indoors) 22.5 22.5 22.5 22.5 22.5 Hours per day (outdoors) 1.5 1.5 1.5 1.5 1.5 Exposure Frequency (days/year)(1) 244 244 244 244 244 Dermal exposure events per day 1 1 1 1 1 Exposure Duration (years) 0.5 4.5 7 8 60 Notes: Risk estimates for carcinogens reflect lifetime exposure so exposure factors for all age-groups were used. The averaging time (days) therefore equals life expectancy or 365 d/yr × 80 years or 29,200 days. Hazard quotients for non-carcinogens were developed using receptor and exposure factors for the toddler consistent with Health Canada (2009a,b) because the soil ingestion rate per bodyweight is highest for this age-group.
(1) Reflects a site-specific value. See Section 3.4.8. 3.4.3 TOXICITY ASSESSMENT
A toxicity assessment evaluates the available evidence regarding the potential for a chemical to potentially cause adverse effects in exposed individuals. Numerical toxicity reference values are developed by regulatory agencies using a two-step approach: hazard identification and dose-response assessment. Hazard identification determines the potential adverse effects associated with exposure to a chemical based on available scientific and medical studies. Two broad categories of health effects are defined: cancer and non-cancer health effects. Following hazard identification, dose-response assessment is undertaken by regulatory authorities to develop numerical toxicity values for use in HHRA. To evaluate the potential for non-cancer health effects from exposure to a chemical, toxicity reference values referred to as Reference Doses (RfDs) (oral and dermal exposures) [in units of mg/(kg-day)] and Reference Concentrations (RfCs) (inhalation exposures) [in units of mg/m3], are used. An RfD or RfC is an estimate (with uncertainty spanning approximately an order of magnitude or greater) of a daily exposure level for the human population, including sensitive sub-populations, that is not likely to cause an appreciable risk of deleterious effects during a lifetime. Chronic RfDs or RfCs are specifically developed to be protective for long-term exposure to a compound. To evaluate the potential for carcinogenic health effects from exposure to a chemical, toxicity reference values referred to as Cancer Slope Factors (CSF) (oral and dermal exposures) and Unit Risk Factors (URF) (inhalation exposures) are used. A CSF or URF is a plausible upper-bound estimate of the probability of a carcinogenic response per unit intake of a chemical over a lifetime. CSFs and URFs are used to estimate the

058704 (44) 20 CONESTOGA-ROVERS & ASSOCIATES
upper-bound probability of an individual potentially developing cancer as a result of a lifetime exposure to a particular level of a potential carcinogen. 3.4.3.1 NON-CANCER REFERENCE DOSES
For substances suspected to cause non-carcinogenic chronic effects, the health criteria are usually expressed as chronic intake levels or RfDs or RfCs below which, no adverse effects are expected. As such, there is a threshold level of exposure to a chemical below which no toxic effects are expected. In contrast to non-cancer toxicity reference criteria, the toxicological model used to assess carcinogenic risk assumes that there is no concentration threshold. To develop RFDs and RfCs, regulatory agencies review the available scientific and medical literature to identify potential health effects associated with exposure and doses at which these occur. From this effort, a regulatory agency selects a “critical study” from which to develop an RfD or RfC. Such studies are typically long-term investigations in humans or laboratory animals. From the “critical study”, a No-Observed Adverse Effect Level (NOAEL) or Lowest-Observed Adverse Effect Level (LOAEL) is typically identified as the starting point to develop a RfD or RfC. A NOAEL is the highest dose/concentration level administered at which there are no biologically significant increases in the frequency or severity of adverse effect between the exposed population and its appropriate control. A LOAEL is the lowest exposure level at which there are biologically significant increases in frequency or severity of adverse effects between the exposed population and its appropriate control group. To derive RfDs or RfCs, uncertainty factors (UFs) along with a NOAEL or LOAEL are used. An UF of 10 is used to extrapolate (a) from a LOAEL to LOAEL, (b) from a shorter than lifetime study to a lifetime study, (c) from animal toxicity data to humans, and (d) to protect sensitive sub-populations. A modifying factor (MF) can also be included to account for deficiencies in the database. Typically, a MF of 3 is used for this purpose. These factors are used to calculate a RfD or RfC as follows:
...UFUFUFLOAELorNOAELRfD
321 ××=
The non-cancer toxicity reference values used to develop site-specific RBCs are presented in Table 5 and discussed in report Section 3.4.3.3.

058704 (44) 21 CONESTOGA-ROVERS & ASSOCIATES
3.4.3.2 CANCER SLOPE FACTORS
Cancer Slope Factors (CSFs) and inhalation unit risk factors (URFs) are quantitative risk estimates of carcinogenic potency. These factors are used to estimate the potential upper-bound lifetime probability of excess cancers based on a lifetime average daily exposure dose (intake)/concentration of a substance. CSFs and URFs are estimated using mathematical extrapolation models, most commonly the linearized multistage (LMS) model, and are presented as the risk per mg/(kg-bw/day) (i.e., mg carcinogen per kg body weight per day) for oral CSF and risk per mg/m3 for inhalation URF. A number of regulatory agencies have reviewed and classified chemicals with respect to their potential to cause cancer n humans. For example, known or suspect human carcinogens have been evaluated and identified by the USEPA Carcinogen Assessment Group using the Agency’s Weight-of-Evidence approach for carcinogenicity classification (USEPA, 1997). The USEPA classification is based on an evaluation of the likelihood that the agent is a human carcinogen. The evidence is characterized separately for human and animal studies as follows: Group A - Known Human Carcinogen (sufficient evidence of carcinogenicity in
humans)
Group B - Probable Human Carcinogen (B1 - limited evidence of carcinogenicity in humans; B2 - sufficient evidence of carcinogenicity in animals with inadequate or lack of evidence in humans)
Group C - Possible Human Carcinogen (limited evidence of carcinogenicity in animals and inadequate or lack of human data)
Group D - Not Classifiable as to Human Carcinogenicity (inadequate or no evidence)
Group E - Evidence of Non-carcinogenicity for Humans (no evidence of carcinogenicity in animal studies)
Constituents that have been classified as Group A known human carcinogens include metals such as arsenic. Toxicity reference values for carcinogens are presented in Table 5 and discussed in report Section 3.4.3.3.

058704 (44) 22 CONESTOGA-ROVERS & ASSOCIATES
3.4.3.3 SELECTION OF TOXICITY REFERENCE VALUES
For the purpose of this HHRA, toxicity values were obtained from Health Canada (2009b) except where values were not available. In these cases, sources of toxicity reference values (TRVs) include the following: • USEPA
- Integrated Risk Information System (IRIS) - Provisional Peer-reviewed Toxicity Values (PPRTVs) - Heath Effects Assessment Summary Tables (HEAST)
• Alberta Environment (AE, 2009) • Ontario Ministry of the Environment (MOEE, 2009) • U.S. Agency for Toxic Substances and Disease Registry • California Environmental Protection Agency • Netherlands RIVM (RIVM, 2009) In cases where TRVs were not available from these sources for the inhalation pathway, ambient air quality criteria were selected from the following sources: • Ontario MOE Ambient Air Quality Criteria (AAQC) (MOEE, 2008) • USEPA • World Health Organization (WHO, 2000) The toxicity reference values used in this HHRA are presented in the following table and in Table 5. A summary of Toxicity Reference Values (TRVs) obtained from sources other than Health Canada is provided in the following sections.

058704 (44) 23 CONESTOGA-ROVERS & ASSOCIATES
Table J: Non-cancer Toxicity Reference Values
Metals Of Interest
oral RfD inhalation RfC
(mg/kg-d) Source '(mg/m3) Source
Antimony 4.00E-04 USEPA, 1991 2.50E-02 MOEE, 2008 Arsenic 3.00E-04 USEPA, 1993a 1.50E-05 CalEPA, 2008 Barium 2.00E-01 AE, 2009 5.00E-04 USEPA, 1997 Cadmium 8.00E-04 HC, 2009b 1.00E-05 ATSDR, 2008 Iron 7.00E-01 USEPA, 2006 4.00E-03 MOEE, 2008 Lead 3.60E-03 HC, 2009b 2.00E-04 MOEE, 2008 Manganese 1.36E-01 HC, 2009b 5.00E-05 USEPA, 1993b Thallium 1.35E-05 MOEE, 2009 2.40E-05 Calculated(1)
Uranium 6.00E-04 HC, 2009b 3.00E-04 ATSDR, 1999
Note: (1)There was no inhalation TRV available for thallium in any of the sources consulted. As such, an RfC was calculated for thallium based on route-to-route extrapolation of the oral TRV as follows: RfC = RfD x BWToddler/InhToddler or 1.35E-05 (mg/kg/d) × 16.5 (kg)/9.3 (m³/d) = 2.40E-05 µg/m³.
Table K: Toxicity Reference Values for Carcinogenic Metals Metals Of Interest
oral CSF inhalation URF
1/(mg/kg-d) Source 1/(mg/m3) Source
Antimony -- -- -- -- Arsenic 1.80E+00 HC, 2009b 6.40E+00 HC, 2009b Barium -- -- -- -- Cadmium -- -- 9.80E+00 HC, 2009b Iron -- -- -- -- Lead -- -- -- -- Manganese -- -- -- -- Thallium -- -- -- -- Uranium -- -- -- --
3.4.3.3.1 ANTIMONY
Because no TRVs were available for antimony in Health Canada (2009b), CRA used TRVs from the USEPA Integrated Risk Information System (IRIS) (USEPA, 1991). The USEPA developed an oral RfD of 0.0004 mg/kg/d based on a lifetime drinking water study in rats. This study noted a decrease in longevity, and alteration in glucose and cholesterol levels. The USEPA derived its RfD based on the results of this study in

058704 (44) 24 CONESTOGA-ROVERS & ASSOCIATES
which a LOAEL of 0.35 mg/kg/d was identified and a combined uncertainty factor of 1,000 was applied. The combined uncertainty factor reflects values of 10 each to extrapolate the LOAEL to a NOAEL, to protect sensitive individuals and for interspecies conversion. Health Canada or others have not developed an inhalation RfC for antimony. As such, CRA selected the Ontario AAQC of 25 µg/m³ for antimony (MOEE, 2008). The averaging time for this AAQC is 24 hours. No longer-term AAQC was available. Since antimony has not been classified as carcinogenic by Health Canada, the USEPA or the International Agency for Research on Cancer (IARC), no cancer TRVs are available. The following table presents the TRVs for antimony. Table L: TRVs for Antimony
Selected Toxicity Reference Values for Antimony Route of Exposure TRV TRV Type Source Agency
Non-Cancer Effects Ingestion 4.0 × 10⁻⁴ mg/kg-day oral RfD USEPA, 1991 Inhalation 2.5 × 10⁻² mg/m³ inhalation RfC MOEE, 2008
3.4.3.3.2 ARSENIC
While TRVs for carcinogenic effects have been developed by Health Canada (2009b) for arsenic, no TRVs were available in Health Canada (2009b) for non-cancer effects. Therefore, CRA used TRVs from the USEPA Integrated Risk Information System (IRIS) (USEPA, 1993a). The USEPA developed an oral RfD of 0.0003 mg/kg/d based on chronic drinking water study results in humans. This study noted skin lesions, i.e., increased incidences of hyperpigmentation and keratosis. The USEPA derived its RfD based on the results of this study in which a NOAEL of 0.009 mg/L was identified that was converted to daily dose of 0.0008 mg/kg-day and a combined uncertainty factor of 3 was applied. The combined uncertainty factor reflects the lack of reproductive toxicity data and protection of sensitive individuals. Health Canada or other agencies have not developed an inhalation RfC for arsenic with the exception of California EPA. As such, CRA selected the California EPA chronic Reference Exposure Level (REL) of 0.015 µg/m³ for arsenic (CalEPA, 2008).

058704 (44) 25 CONESTOGA-ROVERS & ASSOCIATES
California EPA developed its chronic REL based on a drinking water study involving children in which an estimated LOAEL of 2.27 µg/L was derived. This study noted adverse effects on neurobehavioral development. California EPA converted the drinking water LOAEL to an inhalation LOAEL of 0.46 µg/m³ based on children exposure factors. These exposure factors were a drinking water intake of 1 L/day, and an inhalation rate of 9.9 m³/d. A relative absorption factor of 50% for inhalation was also used. To derive its chronic REL, California EPA used this inhalation LOAEL of 0.46 µg/m³ and applied a combined uncertainty factor of 30. The combined uncertainty factor reflects a value of 3 to extrapolate the LOAEL to a NOAEL, and a factor of 10 to account for inter-individual variation. The following table presents the non-cancer TRVs for arsenic. Table M: TRVs for Arsenic
Selected Toxicity Reference Values for Arsenic Route of Exposure TRV TRV Type Source Agency
Non-Cancer Effects Ingestion 3.0 × 10⁻⁴ mg/kg-day oral RfD USEPA, 1993a Inhalation 1.5 × 10⁻⁵ mg/m³ inhalation RfC CalEPA, 2008
3.4.3.3.3 BARIUM
The predominate form of barium in tailings in the Town is barite (Dumont, 2004, Duffy, 2006). CRA's derivation of site-specific RBCs for barium, therefore, followed the development of soil screening criteria for barite (Alberta Environment, 2009). In their derivation, Alberta Environment (2009) obtained TRVs for barium from USEPA IRIS (USEPA, 2005). The Agency noted that Health Canada developed a Canadian Drinking Water Quality Guideline (CDWQG) of 1.0 mg/L (Health Canada 1990), based on an epidemiological study of barium in drinking water by Brenniman and Levy (1984). Health Canada (2004) calculated a tolerable daily intake (TDI) of 0.016 mg/kg-bw/day based on the CDWQG developed in Health Canada (1990). After review of both the Health Canada TDI and the more recent USEPA RfD, Alberta Environment (2009) selected the USEPA RfD to develop a soil quality guideline for barite for the following reasons: • The USEPA (2005a) conducted a careful review of all the available literature

058704 (44) 26 CONESTOGA-ROVERS & ASSOCIATES
• The USEPA (2005a) based their reference dose on a study (NTP, 1994) that was not available at the time of the Health Canada (1990) derivation
• The USEPA (2005a) determined that the National Toxicology Program (NTP) (1994) study was a better basis for developing a reference dose than the Brenniman and Levy (1984) study used by Health Canada (1990)
Moreover, the USEPA noted that neither the drinking water study in humans by Brenniman and Levy (1984) nor a later study by Wones et al. (1990) reported any effect on hypertension in humans at the highest level examined, and that neither study provided sufficient data to support or refute the hypothesis that chronic barium exposure causes hypertension (USEPA, 2005b). Based on the highest concentration examined in these two studies, USEPA identified a NOAEL of 0.21 mg/kg/d for each study. Besides the recognition that available human studies did not provide a sufficient basis to support or refute the hypothesis that chronic barium exposure causes hypertension, USEPA further reported that studies of hypertension in laboratory animals produced conflicting results. The Agency suggested that low dietary calcium may have been a contributing factor in studies reporting a positive effect. Given the lack of a confirmed causal relationship between barium exposure and hypertension in either humans or laboratory animals, USEPA (2005b) reported that the 2-year drinking water study in mice conducted by the US NTP (NTP, 1994) provided the best evidence of a dose-response relationship. The USEPA (2005a,b) developed an oral RfD of 0.2 mg/kg/d for barium based on the NTP (1994) 2-year drinking water study in mice. This study identified the kidney as the most sensitive target from repeated ingestion of soluble barium salts. USEPA developed the oral RfD via mathematical dose-response modelling using the benchmark dose approach based on renal lesions in mice using a total uncertainty factor of 300 (10 for extrapolation from animals to humans; 10 for consideration of intraspecies variation; and 3 for deficiencies in the database). Health Canada or other agencies have not developed an inhalation RfC for barium with the exception of USEPA. As such, CRA selected the USEPA RfC of 0.0005 mg/m³ for barium (USEPA, 1997). The USEPA developed its RfC based on a 4-month subchronic inhalation study in rats in which males were exposed daily for four hours. The USEPA derived its RfC based on the results of this study in which a NOEL of 0.8 mg/m³ was identified. While USEPA

058704 (44) 27 CONESTOGA-ROVERS & ASSOCIATES
(1997) did not present details for derivation of the presented RfC, the derivation was presented in USEPA’s Health Effects Assessment for Barium (USEPA, 1984). To derive its RfC, USEPA converted the animal NOEL to a continuous exposure level human NOEL as follows:
MVhBWh
BWaMVa
hrhrmmgNOELmmgNOEL AnimalHuman ×××=
244³)/(³)/(
Where, BWa = rat bodyweight (0.246 kg) BWh = human bodyweight (70kg) MVa = rat minute volume (0.26 m³/d) MVh = human minute volume (20 m³/d) USEPA (1984, 1997) used this human inhalation NOEL of 0.49 mg/m³ and applied a combined uncertainty factor of 1000. The combined uncertainty factor reflects values of 10 each to extrapolate subchronic to chronic study results, to extrapolate study results in animals to humans, and to protect sensitive individuals. Since barium has not been classified as carcinogenic by Health Canada, the USEPA or IARC, no cancer TRVs are available. The following table presents the TRVs for barium. Table N: TRVs for Barium
Selected Toxicity Reference Values for Barium Route of Exposure TRV TRV Type Source Agency
Non-Cancer Effects Ingestion 0.2 mg/kg-day oral RfD USEPA, 2005a,b Inhalation 5.0 × 10⁻⁴ mg/m³ inhalation RfC USEPA, 1984, 1997
3.4.3.3.4 CADMIUM
While TRVs have been developed by Health Canada (2009b) for cadmium, there is no TRV available in Health Canada (2009b) for non-cancer inhalation effects. Therefore, CRA selected the chronic inhalation Minimal Risk Level (MRL) developed by the US Agency for Toxic Substances and Disease Registry (ATSDR, 2008). The ATSDR

058704 (44) 28 CONESTOGA-ROVERS & ASSOCIATES
developed its chronic inhalation MRL of 0.01 µg/m³ based on inhalation studies in humans. These studies noted renal effects related to inhaled cadmium. The ATSDR derived its MRL based on exposure simulations using the International Commission on Radiation Protection (ICRP) Human Respiratory Tract Model. Both airborne and dietary sources of cadmium were included. ASTDR (2008) found that exposure to an airborne cadmium concentration of 0.1 μg/m3 and a dietary intake of 0.3 μg/kg/day yielded a urinary cadmium level of 0.5 μg/g creatinine, which was the selected biomarker concentration. ATSDR (2008) selected this air concentration of 0.1 µg/m³ and applied a combined uncertainty factor of 9. The combined uncertainty factor reflects values of 3 each to protect sensitive individuals especially diabetics and to account for the lack of adequate human data to compare the relative sensitivities of the respiratory tract and kidneys. The following table presents the non-cancer inhalation TRV for cadmium. Table O: TRVs for Cadmium
Selected Toxicity Reference Values for Cadmium Route of Exposure TRV TRV Type Source Agency
Non-Cancer Effects Inhalation 1.0 × 10⁻⁵ mg/m³ inhalation RfC ATSDR, 2008
3.4.3.3.5 IRON
Because no TRVs were available for iron in Health Canada (2009b), CRA obtained TRVs from the USEPA Provisional Peer-Reviewed Toxicity Values (PPRTVs) (USEPA, 2006). A copy of the USEPA PPRTV for iron is attached as Appendix C. The USEPA developed an oral RfD of 0.7 mg/kg/d. This TRV was based on a LOAEL for total daily iron intake that reflected (a) daily supplementation with ferrous fumarate of 60 mg elemental iron/day combined with (b) estimated mean dietary intake for six European countries of 11 mg elemental iron/day for a total daily iron intake of 71 mg elemental iron/day. Based on a reference body weight of 70 kg, the LOAEL for gastrointestinal effects for total daily iron intake is 1 mg elemental iron/kg-day. The USEPA considered this LOAEL to be a minimal LOAEL because gastrointestinal effects were characterized by most study participants as minor in severity. USEPA used an uncertainty factor of 1.5 (to account for extrapolation from a minimal LOAEL to a NOAEL for a non-serious effect). The resultant oral RfD was 0.7 mg/kg/d.

058704 (44) 29 CONESTOGA-ROVERS & ASSOCIATES
Health Canada or other agencies have not developed an inhalation RfC for iron. As such, CRA selected the Ontario AAQC of 4 µg/m³ for iron (MOEE, 2008). The averaging time for this AAQC is 24 hours. No longer-term AAQC was available. Since iron has not been classified as carcinogenic by Health Canada, the USEPA or IARC, no cancer TRVs are available. The following table presents the TRVs for iron. Table P: TRVs for Iron
Selected Toxicity Reference Values for Iron Route of Exposure TRV TRV Type Source Agency
Non-Cancer Effects Ingestion 0.7 mg/kg-day oral RfD USEPA, 2006 Inhalation 4.0 × 10⁻³ mg/m³ inhalation RfC MOEE, 2008 3.4.3.3.6 LEAD
While Health Canada (2009b) presents a TRV for lead of 0.0036 mg/kg/d, Health Canada or other agencies have not developed an inhalation RfC for lead. As such, CRA selected the Ontario AAQC of 0.2 µg/m³ for lead (MOEE, 2008). The averaging time for this AAQC is 3 months. No longer-term AAQC was available. The following table presents the inhalation TRV for lead. Table Q: TRVs for Lead
Selected Toxicity Reference Values for Lead Route of Exposure TRV TRV Type Source Agency
Non-Cancer Effects Inhalation 2.0 × 10⁻⁴ mg/m³ inhalation RfC MOEE, 2008
3.4.3.3.7 MANGANESE
For manganese, Health Canada (2009b) presents an oral TDI for a toddler of 0.136 mg/kg/d. However, Health Canada has not developed an inhalation RfC for

058704 (44) 30 CONESTOGA-ROVERS & ASSOCIATES
manganese. As such, CRA selected the USEPA RfC of 0.00005 mg/m³ for manganese (USEPA, 1993b). USEPA developed its RfC based on inhalation studies involving occupational populations in which impairment of neurobehavioral functions was noted. From these studies, USEPA (1993b) identified an 8-hour time-weighted average LOAEL of 0.15 mg/m³. To derive its RfC, USEPA converted the occupational LOAEL to a continuous exposure level LOAEL as follows:
MVcMVo
ddmmgLOAELmmgLOAEL lOcuppationContinuous ××=
75³)/(³)/(
Where, MVo = occupational minute volume (10 m³/d) MVc = daily minute volume (20 m³/d) USEPA (1993b) used this continuous inhalation LOAEL of 0.05 mg/m³ and applied a combined uncertainty factor of 1,000. The combined uncertainty factor reflects values of 10 each (a) to convert a LOAEL to a NOAEL, (b) to protect sensitive individuals, and (c) to account for database limitations reflecting both the less-than-chronic periods of exposure and the lack of developmental data, and to account for potential but unquantified differences in the toxicity of different forms of Mn. Since manganese has not been classified as carcinogenic by Health Canada, the USEPA or IARC, no cancer TRVs are available. The following table presents the inhalation TRV for manganese. Table R: TRVs for Manganese
Selected Toxicity Reference Values for Manganese Route of Exposure TRV TRV Type Source Agency
Non-Cancer Effects Inhalation 5.0 × 10⁻⁵ mg/m³ inhalation RfC USEPA, 1993b

058704 (44) 31 CONESTOGA-ROVERS & ASSOCIATES
3.4.3.3.8 THALLIUM
Because no TRVs were available for thallium in Health Canada (2009b), CRA obtained TRVs from the Ontario MOE’s Rationale for the Development of Soil, and Ground Water Standards for Use at Contaminated Sites in Ontario, (MOE, 2009). MOE (2009) presented an oral RfD for thallium that was derived from the California EPA (CalEPA) Public Health Goal for Thallium In Drinking Water (CalEPA, 1999). CalEPA developed its public health goal for thallium based on a 90-day subchronic drinking water study in rats. This study identified alopecia (hair loss) as the critical effect from repeated ingestion of soluble thallium. CalEPA identified a NOAEL of 0.0405 mg/kg/d and applied a combined uncertainty factor of 3,000 to account for (a) use of a subchronic study (10), (b) interspecies extrapolation (10), (c) intraspecies variation (10), and (d) a modifying factor for the steep dose-response curve (3). While CalEPA (1999) did not present an oral RfD, the resultant oral RfD would be 1.35 × 10⁻⁵ mg/kg/d, i.e., 0.405 mg/kg/d ÷ 3,000, which is presented in MOE (2009). Health Canada or other agencies have not developed an inhalation RfC for thallium. As such, CRA used route-to-route extrapolation to calculate an inhalation RfC based on the available oral RfD according to the following equation:
tod
tod
IRBWRfD
RfC×
=
Where:
RfC = reference concentration (mg/m³)
RfD = reference dose (1.35 x 10⁻⁵ mg/kg/d)
BWtod = toddler bodyweight (16.5 kg)3
IRtod = toddler inhalation rate (9.3 m³/day)4 The resultant RfC was 2.4 x 10⁻⁵ mg/m³. The following table presents the TRVs for thallium.
3 Kilograms 4 Cubic metres per day

058704 (44) 32 CONESTOGA-ROVERS & ASSOCIATES
Table S: TRVs for Thallium
Selected Toxicity Reference Values for Thallium Route of Exposure TRV TRV Type Source Agency
Non-Cancer Effects Ingestion 1.35 x 10⁻⁵ mg/kg-day oral RfD MOE, 2009 Inhalation 2.4 x 10⁻⁵ mg/m³ Inhalation RfC Calculated
3.4.3.3.9 URANIUM
Health Canada (2009b) presents an oral TDI of 6.0 x 10⁻⁴ mg/kg/d for uranium. However, Health Canada has not developed an inhalation RfC for uranium. As such, CRA selected the ATSDR chronic inhalation MRL of 3.0 x 10⁻⁴ mg/m³ for uranium (ATSDR, 1999). ATSDR (1999) developed its chronic inhalation MRL based on a one-year inhalation study in dogs, in which test animals were exposed 6 hrs/day Monday through Friday and 3 hr/d on Saturday. Minimal microscopic lesions in the renal tubules were noted. From this study, ATSDR (1999) identified a NOAEL of 0.05 mg/m³. To derive its MRL, ATSDR (1999) converted the experimental NOAEL to a continuous exposure NOAEL of 0.01 mg/m³ as follows:
dd
hrhrmmgNOAELmmgNOAEL alExperimentContinuous 7
5.5246³)/(³)/( ××=
ASTDR (1999) used this continuous inhalation NOAEL of 0.01 mg/m³ and applied a combined uncertainty factor of 30. The combined uncertainty factor reflects a value of 3 to convert a laboratory study animal data to humans and a factor of 10 to protect sensitive individuals. The following table presents the inhalation TRV for uranium. Table T: TRVs for Uranium
Selected Toxicity Reference Values for Uranium Route of Exposure TRV TRV Type Source Agency
Non-Cancer Effects Inhalation 3.0 × 10⁻⁴ mg/m³ inhalation RfC ATSDR, 1999

058704 (44) 33 CONESTOGA-ROVERS & ASSOCIATES
3.4.4 DERMAL TOXICITY
There are few reference doses or slope factors developed by regulatory agencies to address the dermal route of exposure. Therefore, oral toxicity reference values are typically used in HHRAs to evaluate the dermal route of exposure. However, oral toxicity values (RfDs and CSFs) are based on administered dose and absorption from the GI tract is quite different, i.e., higher than absorption through the skin. For this reason, assessment of potential health impacts associated with dermal exposure is based on absorbed dose, i.e., the amount of chemical that is absorbed into the blood stream rather than administered dose. In order to conduct this extrapolation, both absorption from the GI tract and absorption through the skin need to be determined. For this HHRA, relative absorption factors (RAFs) for the oral and dermal routes of exposure were obtained from Health Canada (2009b), with the exception of oral relative absorption factors for arsenic and lead. These RAFs were based on the results of bioavailability testing, which are discussed in report Sections 2.2 and 3.4.9. 3.4.5 SITE-SPECIFIC RISK-BASED CONCENTRATION EQUATIONS
Toxicity reference values, receptor characteristics, exposure factors and absorption factors were used to calculate site-specific RBCs. Algorithms to calculate site-specific RBCs are consistent with Health Canada (2009a,b) and CCME (2006). For potential exposure to contaminants in surface soil, development of residential site-specific RBCs for non-carcinogens is based on receptor characteristics and exposure factors for the most sensitive receptor in order to address current as well as potential future exposures. The most sensitive receptor is a toddler due to increased hand-to-mouth activity patterns and increased absorption from the gastrointestinal tract compared to adults. For example, the soil ingestion rate and bodyweight specified in Health Canada (2009b) for toddlers are 80 mg/d and 16.5 kg, respectively. Therefore, soil intake on a bodyweight basis for toddlers is 80 (mg/d) / 16.5 kg or 4.85 mg soil/kg -bw/d. In contrast, the soil intake rate for adults is 20 (mg/d)/ 70.7 kg or 0.28 mg soil/kg-bw/d, which is nearly 20 fold less than that for toddlers. The following table presents the soil ingestion rates (mg/kg/d) for the various residential receptors specified in Health Canada (2009b).

058704 (44) 34 CONESTOGA-ROVERS & ASSOCIATES
Table U: Soil Ingestion Rates for Various Residential Receptors
Receptor Soil Intake
Bodyweight
Soil Ingestion Rate
(mg/day) (kg) (mg/kg/d) Infant 20 8.2 2.4
Toddler 80 16.5 4.8 Child 20 32.9 0.6 Teen 20 59.7 0.3 Adult 20 70.7 0.3
This approach of focusing on the most sensitive receptor is used for non-carcinogens by regulatory agencies because deriving site-specific RBCs for the most sensitive receptor is protective of the remaining, less exposed receptors. The algorithm used to develop site-specific RBCs is as follows:
BSC
PEFETRfCBWRAFCFAFSAEDIRfD
BWRAFCFIREDIRfDEDEFATTHQ
RBC
d
o
ncnc +
××+××××−+
×××−×××
=
)])/1(/))/(1({
/))/(1[((
Where: RBCnc = Site-specific risk-based concentration for non-carcinogen (mg/kg) THQ = Target Hazard Level (unitless) RfD = Reference Dose (mg/kg-day) RfC = Reference Concentration (mg/m3) IR = Ingestion Rate (mg/day) - Toddler RAFo = Relative Absorption Factor - Oral SA = Surface Area Exposed (cm2/day) - Toddler AF = Adherence Factor (mg/cm2) RAFd = Relative Absorption Factor - Dermal ET = Exposure Time (hrs/day) EF = Exposure Frequency (days/year) ED = Exposure Duration (years) - Toddler BW = Body Weight (kg) - Toddler CF = Conversion Factor (kg/mg) ATnc = Averaging Time - noncarc. (days) PEF = Particulate Emission Factor (kg/m3) EDI = Estimated Daily Intake (mg/kg-d) BSC = Background Soil Concentration (mg/kg)

058704 (44) 35 CONESTOGA-ROVERS & ASSOCIATES
Input parameter values are presented in Section 3.4.2 and in Table 5.
should be noted that, consistent with regulatory guidance, the THQ was set at 1.0 if an
contrast to the approach for non-carcinogens, exposure to carcinogenic chemicals by
Itestimated daily intake (EDI) from background sources based on CCME derivations was available and 0.2 if no EDI was available. In addition, EDI and background soil concentration (BSC) are discussed in report Sections 3.46 and 3.47. Inthe adult resident includes all age groups (infant, toddler, child, teen and adult), based on a lifetime (80-year) exposure, consistent with Health Canada recommendations (Health Canada, 2009a,b). The algorithm used to develop site-specific RBCs is as follows:
BSC
PEFETURFBWRAFCFAFSACSF
BWRAFCFIRCSFEDEFATTR
RBC
idi
ioii
cc +
××+××××+
××××××
=
]/
/[
here:
Site-specific risk-based concentration for carcinogen (mg/kg)
/kg-day)
e-Group i o
or Age-Group i
d ermal (%/100)
/year) -Group I
) /m3)
kg)
put parameter values are presented in Section 3.4.2 and in Table 5.
WRBCc = TR = Target Risk Level (unitless) CSF = Cancer Slope Factor (per mgURF = Unit Risk Factor (1/(mg/m3)) IRi = Ingestion Rate (mg/day) for AgRAF = Relative Absorption Factor - Oral SAi = Surface Area Exposed (cm2/day) fAF = Adherence Factor (mg/cm2) RAF = Relative Absorption Factor - DET = Exposure Time (hrs/day) EF = Exposure Frequency (daysEDi = Exposure Duration (years) for AgeBWi = Body Weight (kg) for Age-Group I CF = Conversion Factor (kg/mg) ATc = Averaging Time - carc. (daysPEF = Particulate Emission Factor (kgBSC = Background Soil Concentration (mg/ In

058704 (44) 36 CONESTOGA-ROVERS & ASSOCIATES
It should be noted that, consistent with CCME (2006) and Health Canada (2009a,b), the target risk (TR) was set at 1.0×10⁻⁵. The previous equations require a number of input parameter values. Besides exposure factors presented previously in Section 3.4.2 (Tables H and I) and TRVs presented in Tables J and K, derivation of site-specific RBCs also requires development of certain site-specific input values. Included are (a) estimated daily intakes, (b) background soil concentrations, (c) site-specific exposure frequency and (d) site-specific bioavailability. Development of these inputs is discussed in the following sections. 3.4.6 ESTIMATED DAILY INTAKES
Inputs for development of site-specific RBCs for non-carcinogenic chemicals include EDIs. These values are subtracted from RfDs to obtain the allowable intake rate of a constituent from soil. In deriving their soil quality guidelines, the CCME has developed EDIs for cadmium, lead, and uranium. These EDIs reflect intakes from drinking water, food, air, and background soil. For the purposes of this HHRA, CRA used EDIs developed by CCME because there was insufficient information relative to airborne concentration data and deposition onto homegrown produce available in mining communities to derive site-specific EDIs. While there are the dietary intake values available for metals in the Canadian Total Diet Study (Health Canada, 1999), these data reflect intakes from produce purchased in supermarkets. It is unclear how these intakes compare to those from homegrown produce especially in mining communities like the Town with documented air quality impacts from metals in particulate (CRA, 2009). Moreover, derivation of EDIs also requires estimation of intakes from ambient air sources. Without air monitoring data for Buchans, derivation of site-specific intakes from air sources was not considered feasible. For these reasons, EDIs developed by CCME were selected for derivation of site-specific RBCs. However, it should be noted that CCME EDIs, which reflect older exposure data and receptor characteristics, are likely to be higher than would be currently derived. For example, the CCME EDI for lead is 2.19 μg/kg/d5 for toddlers, while a recent estimate for sites in New Brunswick is 0.8471 μg/kg/d. For constituents without CCME EDIs, CRA derived site-specific RBCs using a target hazard quotient or soil allocation factor of 0.2, consistent with regulatory guidance.
5 Micrograms per kilogram per day

058704 (44) 37 CONESTOGA-ROVERS & ASSOCIATES
EDIs developed by CCME and used to derive site-specific RBCs are summarized in the following table: Table V: CCME EDIs Metal of EDI (1)
Interest (mg/kg-d)
Cadmium 5.90E-04 Lead 2.19E-03 Uranium 7.80E-05
Note: (1)
EDIs were obtained from CCME (1995), CCME (1996a,b), and CCME (2007b).
3.4.7 BACKGROUND SOIL CONCENTRATIONS
Derivation of soil quality guidelines according to CCME (2007a) and Health Canada (2009a) includes incorporation of background soil concentrations. While 12 discrete background soil samples were collected in August and a composite background sample was collected in October, elevated levels of lead and other metals were observed in these samples. Potential impacts from mining operations could not be ruled out. Therefore, CRA obtained site-specific background soil concentrations from the Canadian Database of Geochemical Surveys (CDGS, 2010). The CDGS database includes concentrations of metals in till for central Newfoundland based on 1991-1992 samples. Soil concentrations were available for different particle sizes and analytical methods. For the purposes of this HHRA, CRA selected detected background soil concentrations from 841 silt and clay-sized fraction (<0.063 mm) samples tested by Inductively Coupled Plasma - Atomic Emission Spectrometry (ICP-AES). CRA selected this data set because this analytical test method is typically used to analyze metals in soil, and the particle size is more representative of that which adheres to children's hands than the particle size of other available data sets (Health Canada, 2009a). In this regard, ICP-AES analytical test results were also available for a much finer particle size, i.e., < 0.002 mm. For arsenic, cadmium, lead and thallium, CCME used the 98th percentile background concentration to develop soil quality guidelines (SQGs) (CCME, 1995, 1996a, 1996b, 1999). However, for uranium, CCME used the mean background concentration to derive its SQG (CCME, 2007a). For the purposes of this HHRA, an approach similar to CCME’s was used.

058704 (44) 38 CONESTOGA-ROVERS & ASSOCIATES
Background soil concentrations for arsenic, cadmium, and lead used in this HHRA reflect 98th percentile site-specific background concentrations if these levels were lower than CCME background concentrations. Otherwise, the average site-specific background concentration was used instead. While this approach may be conservative, it would ensure that background concentrations used to derive site-specific RBCs are not overestimated. For example, it is unclear whether upper percentile site-specific background soil concentrations might reflect, at least in part, impacts from anthropogenic sources such as mining operations. In this regard, the ratio of the 98th percentile-to-average concentration for all metals presented in Table P was roughly three except for arsenic, which was approximately five. The background concentrations for the remaining metals reflect average background concentrations consistent with the CCME approach for uranium because no CCME derivations were available. For thallium and uranium, the background concentrations used in this HHRA were 0.81 mg/kg and 2 mg/kg, respectively. These were obtained from CCME because the samples collected by CDGS, 2010 did not contain detected concentrations of either thallium or uranium (detection limit 10 mg/kg each). Background soil concentrations used in this HHRA are presented in the following table. Table W: Background Soil Concentrations Used to Derive Site-Specific RBCs CDGS, 2010 Background Soil Concentrations (mg/kg)
Silt and Clay-sized Fraction (<0.063 mm) Method: ICP-AES
Metal CCME (1,2) #Detects (3) Mean (4) 98th Percentile Final Background
Conc. (5)
(mg/kg) (mg/kg) (mg/kg) (mg/kg) Antimony -- 132 1.6 4 1.6 Arsenic 10 660 21.4 100 21.4 Barium -- 837 55.4 160 55.4 Cadmium 0.8 63 0.28 1.0 0.28 Iron -- 841 31,700 57,890 31,700 Lead 98 826 14.2 47.2 47.2 Manganese -- 841 691 2,003 691 Thallium 0.81 -- ND (10) ND (10) 0.81 Uranium 2 -- ND (10) ND (10) 2
Notes: NA = not available ICP-AES = Inductively Coupled Plasma - Atomic Emission Spectrometry ND = not detected at the associated detection limit (1) CCME background concentrations for arsenic, cadmium, lead, and uranium were
obtained from CCME derivations (CCME, 1995, 1996a, 1996b, 2007b).

058704 (44) 39 CONESTOGA-ROVERS & ASSOCIATES
(2) CCME background concentrations for arsenic, lead, cadmium and thallium represent 98th percentile soil concentrations. CCME used the average background concentration for uranium.
(3) There were 841 analyses available. (4) Mean concentration is the average of detected concentrations and non-detects at 1/2 the
detection limit. (5) Final background concentrations for arsenic, cadmium and lead reflect site-specific
98th percentile concentrations if these levels were below CCME background concentrations; otherwise average background concentrations were selected. The average site-specific background concentration was selected for the remaining metals because no CCME derivations were available. For thallium and uranium, the CCME background concentration was used because site-specific concentrates were all below the detection limit of 10 mg/kg.
3.4.8 SITE-SPECIFIC EXPOSURE FREQUENCY
CRA generally obtained inputs used to derive site-specific RBCs from Health Canada (2009a,b). However, many of these inputs reflect generic defaults used to derive screening criteria. Generic residential screening criteria are developed in a conservative manner, based on an assumed exposure frequency of 365 days/year. In reality, the exposure frequency to surface soil in residential settings is influenced by weather conditions. This fact was recently recognised by the Ontario Ministry of the Environment. In its Rationale for the Development of Generic Soil and Groundwater Standards for Use at Contaminated Sites in Ontario (MOE, 2009), the MOE developed a site-specific exposure frequency of 273 days/year based on snow cover and ambient temperature. The MOE stated that "using Canadian Climate Normals 1971-2000 data (Environment Canada, 2004) from Ottawa, Toronto, and Windsor (representing the region of Ontario where most Ontarians live), the average number of months with daily temperatures ≤0°C6 is 3 months, and the average number of months with at least 7 days of snow depth ≥5 cm7 is 3 months. Its assumed that exposure to soil is limited for 3 months/yr (9 months/yr = 39 weeks/year)." For this HHRA, CRA used an approach analogous to that used by MOE to develop a site-specific exposure frequency for the Town. CRA obtained climate data for the period 1971-2000 from Environment Canada (EC, 2009). These data are summarised with respect to the daily average temperature and number of days/month with snow depth ≥5 cm in the following table.
6 Celsius 7 Centimetres

058704 (44) 40 CONESTOGA-ROVERS & ASSOCIATES
Table X: Climate Data for Buchans
Parameter Jan. Feb. Mar. Apr. May Jun. Jul. Aug. Sep. Oct. Nov. Dec. Daily Average Temperature (°C) -8.5 -9.1 -4.8 0.9 6.8 12.3 16.2 15.9 11.4 5.5 0.3 -5.3 Days with Snow Depth ≥ 5 cm 29.5 27.4 28.9 17.8 1.6 0 0 0 0 0.6 6.6 22.9
= Months with daily average temperature <0°C, or more than 7 days with snow depth ≥5 cm. The table shows that there are 4 months where the average daily temperature in the Town is <0°C (December, January, February, and March) and 5 months with at least 7 days of snow depth ≥5 cm (December, January, February, March, and April). As such, an exposure frequency of 8 months/year appears to be appropriate for this HHRA. Since the 4 months of December, January, February, and March total 121 days, CRA selected a site-specific exposure frequency of 244 days/year (365 days/year – 121 days/year), consistent with the approach used by MOE. The estimation of the potential number of exposure days does not incorporate inclement weather during the months of April through November. For example, Heideman and Fritsch (1988) reported that 80 percent of 24-hour rainfall events of 12.7 mm8 or more were associated with thunderstorm activity. Moreover, Raddatz and Hanesiak (2008) reported that nearly 80 percent of 24-hour rainfall totals of 10 mm or more were associated with lightning activity. Long-term climate data for the Town indicates that there are 24 days on average with rainfall totals of 10 mm or more during the months of April through November. Outdoor activities by toddlers are likely to be curtailed on days with thunderstorm or lightning activity. As such, accounting for inclement weather during the months of April to November would yield a lower number of potential exposure days per year than CRA used in this HHRA. However, there is no specific regulatory guidance that supports or mandates adjusting exposure frequency to account for rainfall activity, and therefore, CRA did not include these considerations in this HHRA. The potential exposure frequency used in this HHRA is therefore likely to overestimate the actual frequency. 3.4.9 BIOAVAILABILITY
As noted in Section 2.2, CRA's independent contract laboratory completed bioavailability analyses for arsenic and lead according to the recently-approved USEPA methodology in addition to metals analyses completed on the surface soil samples. A copy of the USEPA protocol is presented in Appendix A.
8 Millimetres

058704 (44) 41 CONESTOGA-ROVERS & ASSOCIATES
For each soil sample as noted previously, the USEPA methodology involves determining (a) the total metal concentration using standard USEPA test methods and (b) the metal concentration in a simulated gastric solution. The ratio of these amounts reflects the bioaccessability of the metal, which is the fraction that is released from the sample into the GI tract. Since the methodology does not include the use of laboratory animals, test results are referred to as IVBA. As described in the USEPA methodology, bioavailability, i.e., the fraction absorbed from the GI tract is then calculated using IVBA results. However, USEPA has only approved the correlation algorithm to calculate bioavailability for lead. Therefore, CRA used the bioavailability results for lead and IVBA results for arsenic in this HHRA. For the purposes of the HHRA, CRA used the 95th percentile upper confidence limit on the mean (95th UCL). The following table, which is also included in Section 2.2 as Table D, presents a summary of the bioavailability test results. Table D (Repeat): Summary of Bioavailablity Test Results In Vitro Bioaccessability Relative Bioavailability
Number of Min Max
95th UCL(1)
Number of Min Max 95th UCL(1)
Parameters Detections Value Value Value Detections Value Value Value (%) (%) (%) (%) (%) (%)
Arsenic 61(2) 7 59 26(3) NA NA NA NA Lead 66 49 121(4) 85 66 43 106(4) 74
Notes: NA = not applicable 95th UCL = 95th percentile upper confidence limit on the mean (1) 95th UCLs calculated based on detected concentrations using USEPA's ProUCL 4.00.04
(USEPA, 2009a) (2) Arsenic was not detected in five gastric extraction solutions (3) 95th UCL value includes 61 samples (4) Bioaccessibility and bioavailability results greater than 100 percent are likely attributable
to variability in the test methods employed. Although values greater than 100 percent are improbable test results, they were used as reported to calculate the 95th UCL.

058704 (44) 42 CONESTOGA-ROVERS & ASSOCIATES
3.4.10 SITE-SPECIFIC RISK-BASED CONCENTRATIONS
As noted previously, CRA developed site-specific RBCs for the nine MOI using technical approaches consistent with those specified by the CCME (2007a) and Health Canada (2009a). For example, site-specific RBCs for carcinogens were developed using a target cancer risk of 1 x 10⁻⁵, and site-specific RBCs for non-carcingens were developed using a target hazard quotient of 1.0 if background exposure information was available and 0.2 if such information was not available. Therefore, site-specific RBCs are specific concentrations for each metal that will not result in an excess cancer risk or hazard index greater than regulatory guidelines. The development of the residential site-specific RBCs is discussed in previous report sections. Table 5 presents the site-specific RBCs for the metals of interest in the residential soil in the Town. These site-specific RBCs are for residential locations. For simplicity, CRA used these RBCs for recreational, public, and garden soil locations because the potential frequency of exposure could be similar to that in a residential setting. CRA also used these site-specific RBCs to evaluate surface soil data associated with former mining operations. 3.5 IDENTIFICATION OF METALS CONCENTRATIONS
GREATER THAN SITE-SPECIFIC RBCs
Table 6 shows a comparison of site-specific RBCs with the maximum detected concentrations of MOI in surface soils. The following table also summarizes the site-specific RBCs along with a comparison to the maximum detected concentration from the August and October 2009 sampling rounds.

058704 (44) 43 CONESTOGA-ROVERS & ASSOCIATES
Table Y: Site-specific RBCs and Comparison to Maximum Detected Concentration in Surficial Soil in Buchans
Risk-Based Maximum Metals of Concentrations Soil Interest RBCsoil (1,2) Concentration(3) (µg/g) (µg/g) Antimony 22 22 Arsenic 43 160 Barium 10,180 2,200 Cadmium 64 18 Iron 73,914 31,000 Lead 622 4,800 Manganese 8,698 840 Thallium 1.6 1.4 Uranium 135 70
Notes: (1) Refer to Table 5 for site-specific RBCs. (2) RBCs were derived based on toddler (NC) and
composite receptor (C) (3) Refer to Table 4 for maximum detected concentration.
= Maximum soil concentration exceeds the calculated RBCsoil.
Results show that the maximum detected concentration of antimony, barium, cadmium, iron, manganese, thallium, and uranium were equal to, or less than, the site-specific RBCs. Therefore, CRA did not evaluate the particular metals further. The maximum detected concentrations of two metals were greater than the site-specific RBCs; namely arsenic and lead. CRA compared the analytical data for these metals to site-specific RBCs to identify sample locations where the concentrations of one or both metals were greater than the site-specific RBCs. The results of this comparison are presented in the following section. 3.6 IDENTIFICATION OF SAMPLE LOCATIONS WITH METALS
CONCENTRATIONS GREATER THAN SITE-SPECIFIC RBCs
Table 7 presents a comparison of site-specific RBCs with the analytical data for antimony, arsenic, barium, cadmium, iron, lead, manganese, thallium and uranium.

058704 (44) 44 CONESTOGA-ROVERS & ASSOCIATES
Table 7 shows that the concentration of lead was greater than the site-specific RBCs in 20 of 71 soil samples. The concentration of arsenic at one location also exceeded its site-specific RBC. The table below lists the samples with concentrations of at least one metal that was greater than site-specific RBCs. Locations are identified as either operational (potential former mining operation locations), recreational (recreational and public locations), or residential.
Table Z: Sample Locations with at Least One Metal Concentration Greater Than Site-Specific RBCs(1)
Operational Recreational(2) Residential
RSS-01 RSS-03 SS-16 SS-40 RSS-08 SS-01 SS-20 SS-41 SS-23 SS-03 SS-24 SS-46
SS-04 SS-34 SS-47 SS-19 SS-38 SS-48 SS-39 SS-52
Notes: (1) The lead concentration at all locations listed exceeds the site-specific RBC of 622 mg/kg.
The arsenic concentration exceeds the site-specific RBC of 43 mg/kg only at RSS-08. (2) Includes recreational and other non-residential locations, i.e., hospital Figure 5 presents these locations along with the concentrations of the metal(s) that were greater than the site-specific RBCs. Three of these locations were associated with areas of former mining operations. Five of these locations are public areas around town. The remaining twelve locations were distributed throughout residential areas of the Town with the exception of the extreme southeastern portion of the Town. Table 8 presents a listing of cancer risk (for arsenic) and non-cancer hazard quotient estimates (for lead). To simplify these calculations, CRA used site-specific RBCs. CRA derived these cancer risk estimates using the following formula:
Cancer Risk = (mg/kg)RBCspecificSite(mg/kg)ionConcentratSoil
− × 10-5
CRA then compared the calculated cancer risk estimates to the target cancer risk level typically used by regulatory agencies including CCME, which is 1.0 × 10⁻⁵. The cancer

058704 (44) 45 CONESTOGA-ROVERS & ASSOCIATES
risk estimate for one sample, i.e., RSS-08 was greater than this target due to the concentration of arsenic. The location of this discrete sample collected in August was southwest of the Town in a non-residential location. The following table presents a summary of cancer risk calculations.
Table AA: Summary of Risk Assessment Results for Arsenic
Minimum Maximum Number of Risk Est. MOI Cancer Risk Estimate Cancer Risk Estimate Greater Than 1.0×10⁻⁵ Arsenic 9.2×10⁻⁷ 3.7×10⁻⁵ 1
The following table presents a summary of cancer risk calculations for sampling locations related to former operational areas, recreational areas and residential areas.
Table AB: Summary of Cancer Risk Estimates by Area
Area(1) Minimum Maximum Number of Risk Est. Cancer Risk Estimate Cancer Risk Estimate Greater Than 1.0×10⁻⁵
Operational 2.5×10⁻⁶ 3.7×10⁻⁵ 1 Recreational 2.8×10⁻⁶ 8.5×10⁻⁶ 0 Residential 1.4×10⁻⁶ 9.1×10⁻⁶ 0
Note: (1) Sample locations identified for each area are presented in Table Z. CRA calculated non-cancer hazard quotients (HQs) using an analogous approach based on the following formula.
Hazard Quotient = (mg/kg)RBCspecificSite(mg/kg)ionConcentratSoil
−
Regulatory agencies (including CCME) typically use a 0.2 hazard quotient unless the background exposure has been considered in which case the HQ is 1.0. CRA calculated HQs for lead, and the HQ was greater than 1.0 in 20 samples. The following table presents a summary of HQ calculations.

058704 (44) 46 CONESTOGA-ROVERS & ASSOCIATES
Table AC: Summary of Risk Assessment Results for Lead
Minimum Maximum Number of HQs MOI HQ HQ Greater Than 1.0 Lead 0.26 7.72 20
The maximum HQ of 7.7 was based on the lead concentration of 4,800 mg/kg detected in the soil sample collected from location RSS-08. This was the same location where the cancer risk estimate for arsenic was greater than the target level. CRA collected this discrete sample in August, from southwest of the Town in a non-residential location. The following table presents a summary of HQ calculations for sampling locations related to former operational areas, recreational areas and residential areas.
Table AD: Summary of HQs by Area Area(1) Minimum Maximum Number of HQs
HQ HQ Greater Than 1.0 Operational 1.77 7.72 3 Recreational 1.25 2.41 5 Residential 1.06 5.30 12
Note: (1) Sample locations identified for each area are presented in Table Z. 3.7 DEVELOPMENT OF SITE-SPECIFIC
RISK-BASED CONCENTRATIONS FOR ADULTS
As noted previously, site-specific RBCs for non-carcinogens are developed based on the most sensitive receptor, i.e., a toddler and that site-specific RBCs for carcinogens are based on an assumed lifetime exposure from infancy through adulthood. Therefore, in order to provide additional information regarding the potential risks to adults in the Town, CRA developed site-specific RBCs for lead and arsenic based on potential adult only exposures. 3.7.1 ADULT LEAD RISK-BASED CONCENTRATION
The most sensitive adult receptors regarding potential exposure to lead are women of child-bearing age or more specifically, the developing fetus in pregnant women. While no specific methodology to evaluate potential exposures to pregnant women is available

058704 (44) 47 CONESTOGA-ROVERS & ASSOCIATES
through Health Canada or CCME, the USEPA has developed an Adult Lead Model (ALM) for use in evaluating exposures at lead impacted sites. The USEPA ALM (USEPA, 2009c, d) was recently updated to incorporate more current input information. The USEPA ALM model is designed to estimate potential lead concentration in fetal blood based on maternal exposures. The model can either estimate the probability of fetal blood lead exceeding 0.48 micromoles per litre (µmol/L) which is equivalent to 10 micrograms per decilitre (10 µg/dL) given a specific soil concentration or develop a soil Preliminary Remediation Goal (PRG) based on a target blood lead level. For this evaluation, a PRG was developed. The USEPA ALM (USEPA, 2009a,b) includes background blood lead information used as a baseline to develop PRGs. Included are the geometric mean blood lead and geometric standard deviation blood lead derived from over 4,000 measurements from women between 17 and 45 years of age. The baseline blood lead level represents the geometric mean blood lead concentration in women of child-bearing age in the absence of lead exposures from impacted sites. The geometric mean is 0.048 µmol/L (1.0 µg/dL) and the geometric standard deviation is 1.8. In addition to baseline blood lead data, USEPA ALM includes other default inputs. These were changed to reflect Health Canada (2009a,b) or site-specific values. For the purpose of deriving an adult RBC for lead, the USEPA ALM soil ingestion rate of 50 mg/day was changed to 20 mg/g consistent with Health Canada (2009a,b). The number of exposure days was changed from 219 d/yr to 244 d/yr to reflect Site-specific considerations. Finally, the absorption fraction (AFo) included in USEPA ALM was revised to reflect site-specific considerations. The USEPA AFo reflects an absorption factor for soluble lead of 0.20 in adults and a relative bioavailability of 0.6 (soil/soluble lead). The site-specific relative bioavailability of lead was 0.74. Therefore a Site-specific AFo of 0.148 was used, i.e., 0.2 × 0.74. The inputs and output results from the USEPA ALM are presented in the following table.

058704 (44) 48 CONESTOGA-ROVERS & ASSOCIATES
Table AE: USEPA ALM Inputs and Results
Variable Description of Variable Units ALM Inputs and Results
PbBfetal, 0.95 95th percentile PbB in fetus μg/dL 10
Rfetal/maternal Fetal/maternal PbB ratio -- 0.9
BKSF Biokinetic Slope Factor μg/dL per μg/day
0.4
GSDi Geometric standard deviation PbB -- 1.8
PbB0 Baseline PbB μg/dL 1.00
IRS Soil ingestion rate (including soil-derived indoor dust)
g/day 0.020
AFS, D Absorption fraction (same for soil and dust) -- 0.148
EFS, D Exposure frequency (same for soil and dust) days/yr 244
ATS, D Averaging time (same for soil and dust) days/yr 365
PRG ppm 4,075
The PRG developed by the USEPA ALM model with site-specific inputs was 4,075 mg/kg. This is the adult site-specific RBC for lead. Lead was greater than the adult RBC in one soil sample (RSS-08) collected from an area immediately southwest of Town. By way of comparison and for completeness, a risk-based concentration for adults other than women of child-bearing age was also calculated. Table 9 presents the results based on standard inputs from Health Canada (2009a,b) for adults. The resultant concentration was 8,389 mg/kg. Because the PRG calculated using the USEPA ALM model was lower, it was selected as the adult site-specific RBC for lead. 3.7.2 ADULT ARSENIC RISK-BASED CONCENTRATION
As noted previously, the site-specific RBC for arsenic was developed based on an assumed lifetime exposure from infancy through adulthood. Therefore, an adult site-specific RBC for arsenic was developed based on adult only exposure parameters from Health Canada (2009a,b). Table 9 presents the derivation of the adult site-specific RBC for arsenic. The concentration was 60 mg/kg. Arsenic was greater than the adult RBC in one soil sample (RSS-08) collected from an area immediately southwest of Town.

058704 (44) 49 CONESTOGA-ROVERS & ASSOCIATES
4.0 UNCERTAINTY ANALYSIS
The purpose of this section is to provide a summary and discussion regarding the uncertainties associated with the HHRA evaluation. The various uncertainties are discussed below. 4.1 EXPOSURE SCENARIO FACTORS
As noted previously, HHRAs rely on a number of exposure assumptions that are needed to derive soil quality guidelines or evaluate potential impacts on human health. Many are derived by regulatory agencies based on studies available in the scientific literature. For this HHRA, such factors would include the amount of soil ingested each day and the number of exposure days. While certain site-specific information was included in the HHRA, it is unclear whether the exposure factors defined by regulatory agencies overestimate or underestimate potential exposures of residents of the Town. 4.2 TOXICITY REFERENCE VALUES
Toxicity reference values are derived by regulatory agencies for estimating potential impacts on human health. However, there are a number of uncertainties associated with toxicity criteria, including the following: 1. Applicability of animal toxicity data - chemicals are assumed to cause similar
effects in humans
2. Use of maximum tolerated dose - cancer-slope factors are often derived from animal studies using dose levels that are known to elicit toxicity and may overwhelm metabolic pathways, thereby inducing a response that does not occur at lower doses
3. Dose-response modelling - cancer-slope factors are developed in a conservative manner often using default mathematical models based on low-dose linearity that are likely to overestimate potency
4. Uncertainty factors - reference doses (RfDs) are established using conservative uncertainty factors, the combination of which, likely overestimates the adjustments needed to extrapolate results to exposed populations

058704 (44) 50 CONESTOGA-ROVERS & ASSOCIATES
4.3 BACKGROUND EXPOSURES
Derivation of soil quality criteria according to CCME and Health Canada methodologies for non-carcinogens requires either a RfD or tolerable daily intake (TDI), and an estimated daily intake (EDI) from background sources. The allowable intake from soil reflects the difference between these values, i.e., RfD – EDI. CCME has developed EDIs for use in deriving soil quality guidelines for cadmium, lead, and uranium. CRA used these values although it is unclear whether the CCME EDIs overestimate or underestimate potential background exposures for Town residents. For other constituents included in this HHRA, no CCME EDI values are available (antimony, barium, iron, manganese, and thallium). In addition, while CCME developed an EDI for arsenic of 0.662 µg/kg/d for children 7 mon-4 yrs old (CCME, 1995), this EDI exceeds the oral RfD for arsenic used in this HHRA. In cases where no EDI is available or the EDI exceeds the oral RfD, regulatory guidance sets the allowable intake from soil at 20 percent of the RfD. It is unclear whether daily intake of these metals from background sources such as diet and drinking water comprises 80 percent of the oral RfD. As such, it is unclear the degree to which risk estimates presented in this HHRA may have overestimated or underestimated daily exposure to arsenic, antimony, barium, iron, manganese, and thallium. 4.4 BIOAVAILABILITY
While site-specific bioavailability data are available for lead and arsenic, no such information was available for the remaining metals. By default, 100 percent of the potentially ingested amount is assumed to be absorbed from the GI tract into the bloodstream. Therefore, risk estimates in this HHRA are likely to overestimate potential impacts from exposure to metals other than arsenic and lead in surface soil.

058704 (44) 51 CONESTOGA-ROVERS & ASSOCIATES
5.0 SUMMARY AND CONCLUSIONS
CRA has drawn the following conclusions in the HHRA: 1. Site-specific RBCs, which were developed consistent with applicable guidance
(Health Canada (2009a,b) and CCME (2206)), represent the appropriate basis to evaluate the need for remedial measures.
2. The concentration of lead in surface soil was greater than the site-specific residential risk based concentrations at 20 locations in the Town. These locations reflect three former mining operational areas, five public areas and 12 residential locations. Also, the concentration of arsenic was greater than its site-specific residential risk based concentration at one location (near the TSA southwest of the Town).

058704 (44) 52 CONESTOGA-ROVERS & ASSOCIATES
6.0 RECOMMENDED ACTION
CRA recommends the development of a Risk Management Plan to mitigate potential exposure to these metals (primarily for small children). The report should assess and recommend remedial options or controls measures that reduce the exposures and the potential health risks associated with lead in surface soil in the Town.


058704 (44) 54 CONESTOGA-ROVERS & ASSOCIATES
7.0 REFERENCES
AE, 2009. Soil Remediation Guidelines for Barite: Environmental Health and Human Health. Alberta Environment. February 2009.
AMEC, 2009. Former ASARCO Mine Site. Phase 1 Environmental Site Assessment. Buchans, Newfoundland and Labrador. Submitted to Abitibi-Consolidated, Inc. March 2009.
ATSDR, 1999. Toxicological Profile for Uranium. Appendix A. Agency for Toxic Substances and Disease Registry. September 1999.
http://www.atsdr.cdc.gov/toxprofiles/tp150.html
ATSDR, 2008. Toxicological Profile for Cadmium. Appendix A. Agency for Toxic Substances and Disease Registry. September 2008.
http://www.atsdr.cdc.gov/toxprofiles/tp5.html
Brenniman, G.R., and P.S. Levy, (1984). Epidemiological study of barium in Illinois drinking water supplies. In: Advances in modern toxicology. Calabrese, EJ, ed. Princeton, NJ: Princeton Scientific Publications, pp. 231-249.
CalEPA, 1999. Public Health Goal for Thallium In Drinking Water. Office of Environmental Health Hazard Assessment. California Environmental Protection Agency. February 1999. http://oehha.ca.gov/water/phg/pdf/thal_f.pdf
CalEPA, 2008. Inorganic Arsenic Reference Exposure Levels. Appendix D. Individual Acute, 8-Hour, and Chronic Reference Exposure Level Summaries. California Environmental Protection Agency. December 2008
http://www.oehha.org/air/hot_spots/2008/AppendixD1_final.pdf#page=68
CCME, 1995. Canadian Soil Quality Guidelines For Contaminated Sites Human Health Effects: Inorganic Arsenic Final Report The National Contaminated Sites Remediation Program, February
CCME, 1996a. Canadian Soil Quality Guidelines For Contaminated Sites Human Health Effects: Inorganic Cadmium Final Report The National Contaminated Sites Remediation Program, February
CCME, 1996b. Canadian Soil Quality Guidelines For Contaminated Sites Human Health Effects: Inorganic Lead Final Report The National Contaminated Sites Remediation Program, March
CCME, 1997. Recommended Canadian Soil Quality Guidelines. March 1997.
CCME, 1999. Canadian Soil Quality Guidelines For The Protection of Envrionmental and Human Health: Thallium. 1999.

058704 (44) 55 CONESTOGA-ROVERS & ASSOCIATES
CCME, 2006. Canadian A Protocol for the Derivation of Environmental and Human Health Soil Quality Guidelines, Canadian Council of Ministers of the Environment, 2006.
CCME, 2007a. Canadian Council of Ministers of the Environment, Soil Quality Guidelines for the Protection of Environmental and Human Health, September 2007. .
CDGS, 2010. Till sampling and ice flow survey, NTS 12A/10, 15, 16, 12H/1), central Newfoundland, 1991 and 1992. Canadian Database of Geochemical Surveys. http://gdr.nrcan.gc.ca/geochem/metadata_pub_e.php?id=00557. (Diskette to accompany GSC Open File 2823). Accessed January 2010.
CRA, 2009. Environmental Site Assessment. Abitibi-Consolidated, Inc. – Buchans Site. Buchans, Newfoundland. Prepared for WeirFoulds, LLP. November 2009.
Duffy, 2006. Atlantic Barite Limited – Certificate of Approval AA06-65483. Letter dated June 5, 2006 from Mr. Troy Duffy, Environmental Engineer, Department of Environment and Conservation, Government of Newfoundland and Labrador to Mr. Malcolm Swallow, Atlantic Barite Limited, St. John's Newfoundland.
Dumont, 2004. Barite and Witherite. Canadian Minerals Yearbook, 2004. Natural Resources Canada.
Environment Canada, 2009. Canadian Climate Normals 1971-2000 - Buchans, Newfoundland. National Climate Data and Information Archive. http://www.climate.weatheroffice.ec.gc.ca/climate_normals/results_e.html?Province=NFLD&StationName=&SearchType=&LocateBy=Province&Proximity=25&ProximityFrom=City&StationNumber=&IDType=MSC&CityName=&ParkName=&LatitudeDegrees=&LatitudeMinutes=&LongitudeDegrees=&LongitudeMinutes=&NormalsClass=A&SelNormals=&StnId=6579&. Website last modified April 30, 2009.
Health Canada, 1990. Canadian Drinking Water Guideline for Barium. January 1990. Edited September 1990.
Health Canada (1999) Dietary Intakes of Contaminants & Other Chemicals for Different Age-Sex Groups of Canadians (1993 - 1999). Health Canada. http://www.hc-sc.gc.ca/fn-an/surveill/total-diet/index-eng.php
Health Canada, 2004. Federal Contaminated Site Risk Assessment in Canada. Part II: Health Canada Toxicological Reference Values (TRVs). Prepared by: Environmental Health Assessment Services Safe Environments Programme, September 2004.

058704 (44) 56 CONESTOGA-ROVERS & ASSOCIATES
Health Canada, 2009a. Federal Contaminated Site Risk Assessment in Canada, Part V: Guidance on Complex Human Health Detailed Quantitative Risk Assessment for Chemicals (DQRAchem), Version 1.0, February 2009.
Health Canada, 2009b. Federal Contaminated Site Risk Assessment in Canada: Spreadsheet Tool for Human Health Detailed Quantitative Risk Assessment (DQRA), May 1, 2009.
Health Canada, 2009c. Lead Information Package - Some Commonly Asked Questions About Lead and Human Health. http://www.hc-sc.gc.ca/ewh-semt/contaminants/lead-plomb/asked_questions-questions_posees-eng.php
Heideman and Fritsch, 1988. Forcing Mechanisms and Other Characteristics of Significant Summertime Precipitation. Weather and Forecasting. 3(2): 115–130. http://ams.allenpress.com/perlserv/?request=get-abstract&doi=10.1175%2F1520-0434(1988)003%3C0115%3AFMAOCO%3E2.0.CO%3B2
MOEE, 2008. Ontario’s Ambient Air Quality Criteria. Standards Development Branch, Ontario Ministry of Environment & Energy, PIBS # 6570e. February 2008. http://www.ene.gov.on.ca/publications/6570e-chem.pdf
MOEE, 2009. Rationale for the Development of Soil, and Ground Water Standards for Use at Contaminated Sites in Ontario, Standards Development Branch, Ontario Ministry of Environment & Energy, December 22, 2009.
NTP, 1994. Toxicology and Carcinogenesis Studies of Barium Chloride Dihydrate (CAS No. 10326-27-9) in F344/N Rats and B6C3F1 Mice (Drinking Water Studies). TR-432. NTP TR 432. National Toxicology Program. Research Triangle Park, NC. NIH pub. no. 94-3163.
Raddatz and Hanesiak, 2008. Significant summer rainfall in the Canadian Prairie Provinces: modes and mechanisms 2000-2004. International Journal of Climatology 28(12): 1607 – 1613. http://www.drinetwork.ca/07annualreport/linked_pubs/raddatz_hanesiak_final.pdf
RIVM, 2009. Re-evaluation of some human toxicological Maximum Permissible Risk levels earlier evaluated in the period 1991-2001. National Institute for Public Health and the Environment. Report 711701092. 2009.
http://www.rivm.nl/bibliotheek/rapporten/711701092.pdf
USEPA, 1984. Health Effects Assessment for Barium. Office of Research and Development. EPA/540/1-86-021. September 1984.
USEPA, 1991. Antimony (CASRN 7440-36-0). Integrated Risk Information System (IRIS). Oral RfD last updated February 1, 1991, (www.epa.gov/iris)
USEPA, 1993a. Arsenic (CASRN 7440-38-2). Integrated Risk Information System (IRIS). Oral RfD last updated February 1, 1993, (www.epa.gov/iris)

058704 (44) 57 CONESTOGA-ROVERS & ASSOCIATES
USEPA, 1993b. Manganese (CASRN 7439-96-5). Integrated Risk Information System (IRIS). Inhalation RfC last updated December 1, 1993, (www.epa.gov/iris)
USEPA, 1997. Health Effects Assessment Summary Tables. EPA-540-R-97-036. July 1997.
USEPA, 2005a. Barium and Compounds (CASRN 7440-39-3). Integrated Risk Information System (IRIS). Oral RfD last updated July 5, 2005, (www.epa.gov/iris)
USEPA, 2005b. Toxicological Review of Barium and Compounds (CASRN 7440-39-3). Oral RfD revised June 2005. EPA/635/R-05/001. (www.epa.gov/iris)
USEPA, 2006. Provisional Peer-Reviewed Toxicity Value for Iron and Compounds: Derivation of Subchronic and Chronic Oral RfDs. Superfund Health Risk Technical Support Center. National Center for Environmental Assessment. USEPA, September 11, 2006.
USEPA, 2008. Standard Operating Procedure for an In Vitro Bioaccessibility Assay for Lead in Soil. EPA 9200.1-86. November 2008. http://www.epa.gov/superfund/health/contaminants/bioavailability/pb_ivba_sop_final.pdf
USEPA, 2009a. ProUCL 4.00.04. Software for Calculating Upper Confidence Limits (UCLs). http://www.epa.gov/esd/tsc/TSC_form.htm.
USEPA, 2009b Risk-Based Concentration Table, April 2009.
http://www.epa.gov/reg3hwmd/risk/human/rb-concentration_table/Generic_Tables/index.htm.
USEPA, 2009c. Transmittal of Update of the Adult Lead Methodology's Default Baseline Blood Lead Concentration and Geometric Standard Deviation Parameters. OSWER 9200.2-82.
http://www.epa.gov/superfund/lead/products/almupdate.pdf
USEPA, 2009d. ALM spreadsheet (MS Excel).
http://www.epa.gov/superfund/lead/products.htm
WHO, 2000 Guidelines for Air Quality. World Health Organization, Geneva. 2000. http://www.airimpacts.org/documents/local/AQGUIDE.pdf
http://www.epa.gov/superfund/lead/products/almupdate.pdf
Wones, RG; Stadler, BL; Frohman, LA. (1990) Lack of effect of drinking water barium on cardiovascular risk factor. Environ Health Perspect 85:355-359.

Town of Buchans, 2007. 2008 Datum: NAD 83 Projection: WGS84 (Latitude/Longitude)
58704-00(REP044)GIS-WA001 January 29, 2010
Figure 1
SITE LOCATION PLANHUMAN HEALTH RISK ASSESSMENT
TOWN OF BUCHANSBuchans, Newfoundland
1:24,000
0 500250
Metres
SITE
Hig
hway1
H ighway 1

58704-00(REP044)GIS-WA002 January 29, 2010
figure 2
AUGUST 2009 SAMPLING LOCATIONS: PAOC32 RESIDENTIAL SURFACE SOILSHUMAN HEALTH RISK ASSESSMENT
TOWN OF BUCHANSBuchans, Newfoundland
RSS-12
RSS-11
RSS-10
RSS-09
RSS-08
RSS-07
RSS-06
RSS-05
RSS-04
RSS-03
RSS-02
RSS-01
1:4,000
0 12562.5
Metres
Town of Buchans, 2007.
Legend
Surficial Soil Sample

58704-00(REP044)GIS-WA003 January 29, 2010
figure 3
AUGUST 2009 SAMPLING LOCATIONS: PAOC32 BACKGROUND SURFACE SOILSHUMAN HEALTH RISK ASSESSMENT
TOWN OF BUCHANSBuchans, Newfoundland
Buchans Lake
BRSS-24
BRSS-23
BRSS-22
BRSS-21
BRSS-20
BRSS-19
BRSS-18
BRSS-17
BRSS-16
BRSS-15
BRSS-14
BRSS-13
1:11,000
0 250125
Metres
Town of Buchans, 2007.
Legend
Surficial Soil Sample

58704-00(REP044)GIS-WA004 January 29, 2010
figure 4
OCTOBER 2009 SAMPLING LOCATIONS: COMPOSITE RESIDENTIAL SURFACE SOILSHUMAN HEALTH RISK ASSESSMENT
TOWN OF BUCHANSBuchans, Newfoundland
SS-55
SS-36
SS-34
SS-53
SS-52
SS-51
SS-50
SS-49SS-48
SS-47
SS-46
SS-44
SS-43
SS-42
SS-41
SS-40
SS-39
SS-38
SS-37
SS-35
SS-33
SS-32
SS-31
SS-30
SS-28
SS-27
SS-26
SS-24
SS-23
SS-21
SS-20
SS-17
SS-16
SS-14SS-10
SS-09
SS-54G
SS-13G
SS-22
SS-15
SS-12
SS-55G
SS-45G
SS-36G
SS-34GSS-29G
SS-12G
SS-11G
SS-25
SS-19
SS-18
SS-08
SS-07
SS-06
SS-05
SS-04
SS-03
SS-02
SS-01
1:6,000
0 200100
Metres
2007 Aerial provided by the Town of Buchans.
Legend
Public Recreation Areas Surficial Soil Samples
Residential Surficial Soil Samples
Garden Soil Samples

58704-00(REP044)GIS-WA005 March 3, 2010
figure 5
EXCEEDANCES OF SITE - SPECIFIC RISK BASED CONCENTRATIONSHUMAN HEALTH RISK ASSESSMENT
TOWN OF BUCHANSBuchans, Newfoundland
")
")
")
")
")
")
")
")
")
#*
#*
#*
!(
!(
!(
!(
!(
!(
!(
!(
!(
!(
!(
!(
!(!(
!(
!(
!(
!(
!(
!(
!(
!(
!(
!(
!(
!(
!(
!(
!(
!(
!(
!(
!(
!(
!(
!(
!(
!(
!(
!(
!(!(
!(
!(
!(
!(
!(
!(
!(
!(
!(
SS-47Lead: 670 (mg/kg)
SS-41Lead: 990 (mg/kg)
SS-39Lead: 750 (mg/kg)
SS-20Lead: 850 (mg/kg)
SS-16Lead: 660 (mg/kg)
SS-04Lead: 780 (mg/kg)
SS-38Lead: 3300 (mg/kg)
SS-24Lead: 1400 (mg/kg)
SS-23Lead: 1600 (mg/kg)
SS-19Lead: 1200 (mg/kg)
SS-01Lead: 1500 (mg/kg)
RSS-03Lead: 1400 (mg/kg)
SS-40Lead: 2900/3200 (mg/kg)
RSS-08Lead: 4800 (mg/kg)Arsenic: 160 (mg/kg)
SS-52Lead: 910 (mg/kg)
SS-48Lead: 1300 (mg/kg)
SS-46Lead: 1000 (mg/kg)
SS-34Lead: 3100 (mg/kg)
SS-03Lead: 1200 (mg/kg)
RSS-01Lead: 1100 (mg/kg)
SS-55
SS-36
SS-12
SS-53
SS-51
SS-50
SS-49
SS-44
SS-43
SS-42
SS-37
SS-35
SS-32
SS-31
SS-30
SS-28
SS-26
SS-22
SS-21
SS-17
SS-14SS-10
SS-09
SS-25
SS-18
SS-08
SS-07
SS-06
SS-05
SS-02
SS-54G
SS-29G
SS-13G
SS-33
SS-27
SS-15
SS-55G
SS-45G
SS-36G SS-34G
SS-12G
SS-11G
1:6,000
0 200100
Metres
2007 Aerial provided by the Town of Buchans.
Legend
#* Surficial Soil Sample
!( Public Recreation Areas Surficial Soil Samples
!( Residential Surficial Soil Samples
") Garden Soil Sample
Sample LocationLead Exceedance Concentration (mg/kg)Arsenic Exceedance Concentration (mg/kg)
Risk-Based ConcentrationLead - 622 mg/kgArsenic - 43 mg/kg

TABLE 1
SOIL ANALYTICAL RESULTS FROM AUGUST 2009PAOC 32 - RESIDENTIAL SURFICIAL SOILS
BUCHANS, NL
Sample Location: RSS-01 RSS-02 RSS-03 RSS-04 RSS-05 RSS-06 RSS-07 RSS-08 RSS-09 RSS-10 RSS-10 RSS-11 RSS-12Sample Name: RSS-01-SO RSS-02-SO RSS-03-SO RSS-04-SO RSS-05-SO RSS-06-SO RSS-07-SO RSS-08-SO RSS-09-SO RSS-10-SO DUP-06-SO RSS-11-SO RSS-12-SOSample Date: 8/31/2009 8/31/2009 8/31/2009 8/31/2009 8/31/2009 8/31/2009 8/31/2009 8/31/2009 8/31/2009 8/31/2009 8/31/2009 8/31/2009 8/31/2009Depth: (0-0.3) m BGS (0-0.3) m BGS (0-0.3) m BGS (0-0.3) m BGS (0-0.3) m BGS (0-0.3) m BGS (0-0.3) m BGS (0-0.3) m BGS (0-0.3) m BGS (0-0.3) m BGS (0-0.3) m BGS (0-0.3) m BGS (0-0.3) m BGS
DuplicateParameters Units
Aluminum mg/kg 12000 7300 8900 9600 5700 9800 12000 6700 3900 9000 9200 2800 12000Antimony mg/kg 6 ND (2) 3 ND (2) ND (2) ND (2) ND (2) 22 ND (2) ND (2) ND (2) ND (2) ND (2)Arsenic mg/kg 11 ND (2) 12 4 ND (2) 9 6 160 6 6 6 ND (2) 3Barium mg/kg 760 190 1100 510 270 1200 670 2200 980 810 700 180 310Beryllium mg/kg ND (2) ND (2) ND (2) ND (2) ND (2) ND (2) ND (2) ND (2) ND (2) ND (2) ND (2) ND (2) ND (2)Bismuth mg/kg ND (2) ND (2) ND (2) ND (2) ND (2) ND (2) ND (2) 11 ND (2) ND (2) ND (2) ND (2) ND (2)Boron mg/kg ND (5) ND (5) ND (5) ND (5) ND (5) ND (5) ND (5) ND (5) ND (5) ND (5) ND (5) ND (5) ND (5)Cadmium mg/kg 7.9 0.5 8.8 1 ND (0.3) 3.8 0.6 2.8 0.4 0.7 0.7 0.9 0.5Chromium mg/kg 26 6 7 10 6 16 6 16 3 6 7 3 9Cobalt mg/kg 3 3 1 4 2 2 ND (1) 2 ND (1) 3 3 ND (1) 5Copper mg/kg 240 27 340 58 14 85 160 510 99 53 57 8 30Iron mg/kg 13000 12000 11000 14000 7500 13000 19000 31000 6100 13000 14000 1800 13000Lead mg/kg 1100 97 1400 220 40 470 220 4800 590 200 210 27 110Lithium mg/kg 3 3 ND (2) 4 3 3 ND (2) ND (2) ND (2) 4 3 ND (2) 4Manganese mg/kg 150 140 67 210 96 190 45 65 30 170 220 32 200Mercury Elemental mg/kg 0.3 ND (0.1) 0.2 ND (0.1) ND (0.1) 1.4 ND (0.1) 0.9 ND (0.1) ND (0.1) ND (0.1) ND (0.1) ND (0.1)Molybdenum mg/kg 3 ND (2) ND (2) ND (2) ND (2) ND (2) ND (2) 15 ND (2) ND (2) ND (2) ND (2) ND (2)Nickel mg/kg 3 3 2 5 3 5 ND (2) 4 ND (2) 3 3 ND (2) 5Rubidium mg/kg ND (2) ND (2) ND (2) ND (2) ND (2) ND (2) ND (2) ND (2) 3 2 2 2 ND (2)Selenium mg/kg 4 ND (2) ND (2) ND (2) ND (2) 2 ND (2) ND (2) ND (2) ND (2) ND (2) ND (2) ND (2)Silver mg/kg 2.8 ND (0.5) 5.9 0.6 ND (0.5) 1.1 ND (0.5) 20 0.9 0.7 0.6 ND (0.5) ND (0.5)Strontium mg/kg 22 6 17 9 5 22 10 28 13 11 11 5 6Thallium mg/kg 0.2 ND (0.1) 0.2 ND (0.1) ND (0.1) 0.2 0.3 1.4 0.3 0.1 0.1 0.1 ND (0.1)Tin mg/kg 2 ND (2) 3 ND (2) ND (2) ND (2) ND (2) 2 ND (2) ND (2) ND (2) ND (2) ND (2)Uranium mg/kg 70 0.5 0.4 0.6 0.5 19 0.4 0.6 0.3 0.5 0.5 0.2 0.6Vanadium mg/kg 41 27 29 35 24 49 40 67 19 30 33 12 34Zinc mg/kg 2000 120 1500 190 65 780 89 570 68 150 160 200 120General ChemistryCyanide (total) mg/kg ND (0.5) ND (0.5) 0.7 ND (0.5) ND (0.5) ND (0.5) ND (0.5) 0.6 ND (0.5) ND (0.5) ND (0.5) ND (0.5) ND (0.5)pH (lab) s.u. 5.87 5.24 4.65 5.39 5.16 5.57 4.54 4.24 4.44 5.47 5.4 4.91 5.48
Note:
ND - Not detected at associated value.
CRA 058704 (44)

TABLE 2
SOIL ANALYTICAL RESULTS FROM AUGUST 2009PAOC 32 - BACKGROUND SURFICIAL SOILS
BUCHANS, NL
Sample Location: BRSS-13 BRSS-14 BRSS-15 BRSS-16 BRSS-17 BRSS-18 BRSS-19 BRSS-20 BRSS-21 BRSS-21 BRSS-22 BRSS-23 BRSS-24Sample Name: BRSS-13-SO BRSS-14-SO BRSS-15-SO BRSS-16-SO BRSS-17-SO BRSS-18-SO BRSS-19-SO BRSS-20-SO BRSS-21-SO DUP-07-SO BRSS-22-SO BRSS-23-SO BRSS-24-SOSample Date: 9/1/2009 9/1/2009 9/1/2009 9/1/2009 9/1/2009 9/1/2009 9/1/2009 9/1/2009 9/1/2009 9/1/2009 9/1/2009 9/1/2009 9/1/2009Depth: (0-0.3) m BGS (0-0.3) m BGS (0-0.3) m BGS (0-0.3) m BGS (0-0.3) m BGS (0-0.3) m BGS (0-0.3) m BGS (0-0.3) m BGS (0-0.3) m BGS (0-0.3) m BGS (0-0.3) m BGS (0-0.3) m BGS (0-0.3) m BGS
DuplicateParameters Units
Aluminum mg/kg 7100 2900 2600 2900 4700 3600 2100 6000 7100 6600 19000 3200 10000Antimony mg/kg ND (2) ND (2) ND (2) ND (2) ND (2) ND (2) ND (2) 2 ND (2) ND (2) ND (2) ND (2) ND (2)Arsenic mg/kg ND (2) 2 ND (2) ND (2) ND (2) 4 4 4 ND (2) ND (2) ND (2) 2 2Barium mg/kg 170 110 19 20 55 200 200 1100 100 100 53 240 37Beryllium mg/kg ND (2) ND (2) ND (2) ND (2) ND (2) ND (2) ND (2) ND (2) ND (2) ND (2) ND (2) ND (2) ND (2)Bismuth mg/kg ND (2) ND (2) ND (2) ND (2) ND (2) ND (2) ND (2) ND (2) ND (2) ND (2) ND (2) ND (2) ND (2)Boron mg/kg ND (5) ND (5) ND (5) ND (5) ND (5) ND (5) ND (5) ND (5) ND (5) ND (5) ND (5) ND (5) ND (5)Cadmium mg/kg 1.4 2.1 0.8 0.6 0.9 1.9 2.1 5.3 0.6 0.6 0.4 1.4 ND (0.3)Chromium mg/kg 4 3 3 5 5 7 3 9 6 6 9 8 9Cobalt mg/kg ND (1) 2 ND (1) ND (1) ND (1) 5 2 7 3 3 3 3 2Copper mg/kg 62 52 10 15 34 67 79 90 15 15 22 29 13Iron mg/kg 10000 6400 3300 3800 14000 28000 13000 14000 12000 13000 20000 16000 21000Lead mg/kg 310 290 52 54 170 300 330 660 22 25 74 55 41Lithium mg/kg ND (2) ND (2) ND (2) ND (2) ND (2) ND (2) ND (2) ND (2) 5 4 4 ND (2) 5Manganese mg/kg 35 39 30 26 82 2100 31 850 240 220 210 160 120Mercury Elemental mg/kg ND (0.2) 0.1 ND (0.1) 0.1 0.2 0.2 0.5 ND (0.1) ND (0.1) ND (0.1) 0.3 ND (0.1)Molybdenum mg/kg ND (2) ND (2) ND (2) ND (2) ND (2) 2 ND (2) ND (2) ND (2) ND (2) ND (2) ND (2) ND (2)Nickel mg/kg ND (2) ND (2) ND (2) ND (2) ND (2) ND (2) ND (2) ND (2) 3 2 3 ND (2) 3Rubidium mg/kg 2 ND (2) ND (2) ND (2) 2 ND (2) ND (2) 4 ND (2) ND (2) 3 ND (2) 4Selenium mg/kg ND (2) ND (2) ND (2) ND (2) ND (2) ND (2) ND (2) ND (2) ND (2) ND (2) ND (2) ND (2) ND (2)Silver mg/kg ND (0.5) 0.8 ND (0.5) ND (0.5) ND (0.5) 0.8 0.6 1.8 ND (0.5) ND (0.5) ND (0.5) ND (0.5) ND (0.5)Strontium mg/kg ND (5) 13 ND (5) ND (5) ND (5) 16 8 24 9 9 ND (5) 15 ND (5)Thallium mg/kg ND (0.1) ND (0.1) ND (0.1) ND (0.1) ND (0.1) 0.1 ND (0.1) 0.2 ND (0.1) ND (0.1) ND (0.1) ND (0.1) ND (0.1)Tin mg/kg ND (2) ND (2) ND (2) ND (2) ND (2) ND (2) ND (2) ND (2) ND (2) ND (2) ND (2) ND (2) ND (2)Uranium mg/kg 0.3 0.1 0.2 0.2 0.7 4.5 0.4 0.8 0.3 0.3 0.3 1.3 0.4Vanadium mg/kg 26 8 23 15 15 21 7 26 48 52 41 23 82Zinc mg/kg 200 450 51 81 110 490 290 880 240 220 90 530 59General ChemistryCyanide (total) mg/kg ND (0.5) 0.5 ND (0.5) ND (0.5) ND (0.5) 1.7 0.7 0.7 ND (0.5) ND (0.5) ND (0.5) ND (0.5) ND (0.5)pH (lab) s.u. 4.26 3.74 4.27 4.42 4.4 5.33 4.46 4.49 5.68 5.63 5.04 5.25 4.6
Note:
ND - Not detected at associated value.
CRA 058704 (44)

TABLE 3
SOIL ANALYTICAL RESULTS FROM OCTOBER 2009COMPOSITE SURFICIAL SOIL SAMPLES
BUCHANS, NL
Page 1 of 6
Sample Location: SS-01 SS-02 SS-03 SS-04 SS-05 SS-06 SS-06 SS-07 SS-08 SS-09Sample Description: Tennis Court Buchans Miners' Museum Memorial Park Baseball Diamond Public Swimming Pool Public School/Library Public School/Library Children's (Public) Playground Mini-putt Rothermere StreetSample ID: S-58704-101209-CH-01 S-58704-101209-CH-02 S-58704-101209-CH-03 S-58704-101209-CH-04 S-58704-101209-ZZ-05 S-58704-101209-ZZ-06 S-58704-101209-ZZ-06 S-58704-101209-ZZ-07 S-58704-101209-ZZ-08 S-58704-101309-CH-09Sample Date: 10/12/2009 10/12/2009 10/12/2009 10/12/2009 10/12/2009 10/12/2009 10/12/2009 10/12/2009 10/12/2009 10/13/2009Sample Depth: 0 - 0.1 mbgs 0 - 0.1 mbgs 0 - 0.1 mbgs 0 - 0.1 mbgs 0 - 0.1 mbgs 0 - 0.1 mbgs 0 - 0.1 mbgs 0 - 0.1 mbgs 0 - 0.1 mbgs 0 - 0.1 mbgs
Laboratory DuplicateParameters Units
MetalsAluminum mg/kg 8500 14000 10000 8700 12000 11000 11000 5500 9400 10000Antimony mg/kg 7 ND (2) 4 4 ND (2) ND (2) ND (2) ND (2) ND (2) ND (2)Arsenic mg/kg 37 12 15 12 5 10 11 ND (2) 7 11Barium mg/kg 1000 480 910 670 580 310 370 200 380 1400Beryllium mg/kg ND (2) ND (2) ND (2) ND (2) ND (2) ND (2) ND (2) ND (2) ND (2) ND (2)Bismuth mg/kg 2 ND (2) ND (2) ND (2) ND (2) ND (2) ND (2) ND (2) ND (2) ND (2)Boron mg/kg ND (5) ND (5) ND (5) ND (5) ND (5) ND (5) ND (5) ND (5) ND (5) ND (5)Cadmium mg/kg 3.3 1.9 3.6 5.2 1.4 1.0 1.2 0.4 1.5 2.0Chromium mg/kg 13 24 14 9 8 20 19 7 14 10Cobalt mg/kg 4 11 5 4 3 8 8 4 6 4Copper mg/kg 300 59 270 100 71 41 50 24 57 71Iron mg/kg 20000 27000 17000 13000 16000 18000 18000 11000 16000 13000Lead mg/kg 1500 210 1200 780 350 220 250 84 270 350Lithium mg/kg 7 11 6 4 3 8 9 3 7 4Manganese mg/kg 260 840 280 200 160 390 420 210 380 320Mercury mg/kg 0.3 ND (0.1) 0.2 0.2 0.1 ND (0.1) ND (0.1) ND (0.1) ND (0.1) 0.2Molybdenum mg/kg 5 ND (2) 2 ND (2) ND (2) ND (2) ND (2) ND (2) ND (2) ND (2)Nickel mg/kg 6 18 8 4 4 16 15 4 9 5Rubidium mg/kg ND (2) 3 ND (2) ND (2) ND (2) 2 3 ND (2) 2 2Selenium mg/kg ND (2) ND (2) ND (2) ND (2) ND (2) ND (2) ND (2) ND (2) ND (2) ND (2)Silver mg/kg 5.3 0.6 2.7 3.3 0.8 ND (0.5) ND (0.5) ND (0.5) 0.7 1.0Strontium mg/kg 19 13 16 11 10 12 13 6 11 20Thallium mg/kg 0.5 ND (0.1) 0.2 0.3 0.1 ND (0.1) ND (0.1) ND (0.1) ND (0.1) 0.4Tin mg/kg ND (2) ND (2) ND (2) ND (2) ND (2) ND (2) ND (2) ND (2) ND (2) ND (2)Uranium mg/kg 0.8 0.7 0.7 0.9 0.5 0.6 0.6 0.5 0.6 2.2Vanadium mg/kg 51 46 41 30 30 39 37 26 33 33Zinc mg/kg 930 390 780 1400 310 240 270 120 490 460
Notes:
- - Not applicable/Not analyzed.ND - Not detected at associated value.mbgs - metres below ground surface.
CRA 058704 (44)

TABLE 3
SOIL ANALYTICAL RESULTS FROM OCTOBER 2009COMPOSITE SURFICIAL SOIL SAMPLES
BUCHANS, NL
Page 2 of 6
Sample Location:Sample Description:Sample ID:Sample Date:Sample Depth:
Parameters Units
MetalsAluminum mg/kgAntimony mg/kgArsenic mg/kgBarium mg/kgBeryllium mg/kgBismuth mg/kgBoron mg/kgCadmium mg/kgChromium mg/kgCobalt mg/kgCopper mg/kgIron mg/kgLead mg/kgLithium mg/kgManganese mg/kgMercury mg/kgMolybdenum mg/kgNickel mg/kgRubidium mg/kgSelenium mg/kgSilver mg/kgStrontium mg/kgThallium mg/kgTin mg/kgUranium mg/kgVanadium mg/kgZinc mg/kg
Notes:
- - Not applicable/Not anND - Not detected at associambgs - metres below ground su
SS-10 SS-11G SS-12 SS-12G SS-13G SS-14 SS-15 SS-16 SS-17 SS-18Scott Street Rothermere Street Canning Street Canning Street Rothermere Street Scott Street Rothermere Street Lakeview Street McCuish Street Fire Pit on South Street
S-58704-101309-ZZ-10 S-58704-101309-CH-11G S-58704-101309-ZZ-12 S-58704-101309-ZZ-12G S-58704-101309-CH-13G S-58704-101309-ZZ-14 S-58704-101309-CH-15 S-58704-101309-ZZ-16 S-58704-101309-CH-17 S-58704-101309-ZZ-1810/13/2009 10/13/2009 10/13/2009 10/13/2009 10/13/2009 10/13/2009 10/13/2009 10/13/2009 10/13/2009 10/13/2009
0 - 0.1 mbgs 0 - 0.1 mbgs 0 - 0.1 mbgs 0 - 0.1 mbgs 0 - 0.1 mbgs 0 - 0.1 mbgs 0 - 0.1 mbgs 0 - 0.1 mbgs 0 - 0.1 mbgs 0 - 0.1 mbgs
9400 11000 8200 4700 11000 8500 12000 9700 13000 90002 ND (2) ND (2) ND (2) ND (2) ND (2) ND (2) ND (2) ND (2) 26 9 5 ND (2) 7 3 11 7 10 12
700 910 640 290 430 710 1500 750 1200 1100ND (2) ND (2) ND (2) ND (2) ND (2) ND (2) ND (2) ND (2) ND (2) ND (2)ND (2) ND (2) ND (2) ND (2) ND (2) ND (2) ND (2) ND (2) ND (2) ND (2)ND (5) ND (5) ND (5) ND (5) ND (5) ND (5) ND (5) ND (5) ND (5) ND (5)
2.7 0.8 1.3 1.2 0.7 1.5 2.3 4.0 2.7 0.99 10 12 6 8 12 11 10 11 92 4 4 1 4 3 3 4 3 3
71 76 61 45 24 69 99 120 90 11012000 16000 12000 6200 17000 11000 15000 13000 16000 12000
480 320 320 120 78 450 510 660 480 4403 4 4 2 5 3 4 3 4 4
98 170 260 240 640 760 260 250 310 1400.1 ND (0.1) 0.1 0.1 0.1 ND (0.1) 0.2 0.2 0.1 ND (0.1)
ND (2) ND (2) ND (2) ND (2) 2 ND (2) ND (2) ND (2) ND (2) ND (2)3 5 6 ND (2) 4 5 4 5 5 53 2 ND (2) ND (2) 2 ND (2) 2 ND (2) ND (2) ND (2)
ND (2) ND (2) ND (2) ND (2) ND (2) ND (2) ND (2) 3 ND (2) ND (2)1.9 0.9 0.6 0.7 ND (0.5) 0.6 1.4 1.1 1.0 1.311 13 11 17 9 18 24 15 19 15
ND (0.1) 0.3 0.1 ND (0.1) ND (0.1) ND (0.1) 0.2 0.1 0.2 0.3ND (2) ND (2) ND (2) ND (2) ND (2) ND (2) ND (2) ND (2) ND (2) ND (2)
0.5 0.7 0.9 1.7 2.7 0.9 1.2 0.8 1.3 0.536 43 29 15 35 30 38 33 36 35
660 230 200 210 160 410 510 800 630 200
CRA 058704 (44)

TABLE 3
SOIL ANALYTICAL RESULTS FROM OCTOBER 2009COMPOSITE SURFICIAL SOIL SAMPLES
BUCHANS, NL
Page 3 of 6
Sample Location:Sample Description:Sample ID:Sample Date:Sample Depth:
Parameters Units
MetalsAluminum mg/kgAntimony mg/kgArsenic mg/kgBarium mg/kgBeryllium mg/kgBismuth mg/kgBoron mg/kgCadmium mg/kgChromium mg/kgCobalt mg/kgCopper mg/kgIron mg/kgLead mg/kgLithium mg/kgManganese mg/kgMercury mg/kgMolybdenum mg/kgNickel mg/kgRubidium mg/kgSelenium mg/kgSilver mg/kgStrontium mg/kgThallium mg/kgTin mg/kgUranium mg/kgVanadium mg/kgZinc mg/kg
Notes:
- - Not applicable/Not anND - Not detected at associambgs - metres below ground su
SS-19 SS-20 SS-21 SS-22 SS-23 SS-24 SS-25 SS-26 SS-27 SS-28 SS-29GHospital Yard Jackson Street Rothermere Street Jackson Street Gilchrist Street Church Street Gilchrist Street Pine Avenue Jackson Street Scott Street Jackson Street
S-58704-101309-CH-19 S-58704-101309-ZZ-20 S-58704-101309-CH-21 S-58704-101309-ZZ-22 S-58704-101309-CH-23 S-58704-101309-ZZ-24 S-58704-101309-CH-25 S-58704-101309-ZZ-26 S-58704-101309-CH-27 S-58704-101409-ZZ-28 S-58704-101309-CH-29G10/13/2009 10/13/2009 10/13/2009 10/13/2009 10/13/2009 10/13/2009 10/13/2009 10/13/2009 10/13/2009 10/14/2009 10/13/2009
0 - 0.1 mbgs 0 - 0.1 mbgs 0 - 0.1 mbgs 0 - 0.1 mbgs 0 - 0.1 mbgs 0 - 0.1 mbgs 0 - 0.1 mbgs 0 - 0.1 mbgs 0 - 0.1 mbgs 0 - 0.1 mbgs 0 - 0.1 mbgs
10000 8700 8700 8600 9300 11000 7100 9600 10000 5400 78004 3 ND (2) ND (2) 6 4 ND (2) 2 ND (2) ND (2) ND (2)
23 14 9 6 17 21 7 10 7 2 51900 1400 910 290 690 1700 500 770 660 170 380
ND (2) ND (2) ND (2) ND (2) ND (2) ND (2) ND (2) ND (2) ND (2) ND (2) ND (2)ND (2) ND (2) ND (2) ND (2) ND (2) ND (2) ND (2) ND (2) ND (2) ND (2) ND (2)ND (5) ND (5) ND (5) ND (5) ND (5) ND (5) ND (5) ND (5) ND (5) ND (5) ND (5)
8.3 3.5 1.4 0.7 5.8 4.9 2.2 2.8 2.0 ND (0.3) 0.521 18 9 15 10 16 14 9 9 7 55 3 3 7 3 4 4 3 4 3 4
290 150 58 58 290 220 89 100 66 22 2614000 12000 12000 16000 15000 16000 12000 11000 14000 10000 140001200 850 290 270 1600 1400 410 580 420 54 100
5 3 4 7 4 4 5 4 4 3 4300 180 240 340 210 420 250 340 240 200 7200.4 0.3 ND (0.1) ND (0.1) 0.2 0.3 ND (0.1) 0.2 ND (0.1) ND (0.1) ND (0.1)2 ND (2) ND (2) ND (2) 3 3 ND (2) ND (2) ND (2) ND (2) ND (2)
13 5 5 11 4 6 6 4 4 3 22 ND (2) 2 ND (2) ND (2) ND (2) ND (2) ND (2) ND (2) ND (2) ND (2)
ND (2) ND (2) ND (2) ND (2) ND (2) ND (2) ND (2) ND (2) ND (2) ND (2) ND (2)3.5 1.9 0.8 0.5 4.2 2.6 0.8 1.1 0.9 ND (0.5) ND (0.5)27 20 14 9 16 22 10 16 12 6 70.5 0.3 0.2 ND (0.1) 0.2 0.3 ND (0.1) 0.3 ND (0.1) ND (0.1) 0.1
ND (2) 4 ND (2) ND (2) ND (2) 4 ND (2) ND (2) ND (2) ND (2) ND (2)7.9 1.5 0.6 0.6 0.6 9.5 0.9 1.1 1.2 1.5 1.863 39 23 37 30 45 33 31 29 27 25
1300 550 300 200 1400 910 420 510 460 83 110
CRA 058704 (44)

TABLE 3
SOIL ANALYTICAL RESULTS FROM OCTOBER 2009COMPOSITE SURFICIAL SOIL SAMPLES
BUCHANS, NL
Page 4 of 6
Sample Location:Sample Description:Sample ID:Sample Date:Sample Depth:
Parameters Units
MetalsAluminum mg/kgAntimony mg/kgArsenic mg/kgBarium mg/kgBeryllium mg/kgBismuth mg/kgBoron mg/kgCadmium mg/kgChromium mg/kgCobalt mg/kgCopper mg/kgIron mg/kgLead mg/kgLithium mg/kgManganese mg/kgMercury mg/kgMolybdenum mg/kgNickel mg/kgRubidium mg/kgSelenium mg/kgSilver mg/kgStrontium mg/kgThallium mg/kgTin mg/kgUranium mg/kgVanadium mg/kgZinc mg/kg
Notes:
- - Not applicable/Not anND - Not detected at associambgs - metres below ground su
SS-29G SS-30 SS-31 SS-32 SS-33 SS-34 SS-34G SS-35 SS-36 SS-36GJackson Street Scott Street Amulree Street Church Street Prospect Street Williams Turn Pike Williams Turn Pike Prospect Street East Street East Street
S-58704-101309-CH-29G S-58704-101409-ZZ-30 S-58704-101409-CH-31 S-58704-101409-ZZ-32 S-58704-101409-CH-33 S-58704-101409-ZZ-34 S-58704-101409-ZZ-34G S-58704-101409-CH-35 S-58704-101409-ZZ-36 S-58704-101409-ZZ-36G10/13/2009 10/14/2009 10/14/2009 10/14/2009 10/14/2009 10/14/2009 10/14/2009 10/14/2009 10/14/2009 10/14/2009
0 - 0.1 mbgs 0 - 0.1 mbgs 0 - 0.1 mbgs 0 - 0.1 mbgs 0 - 0.1 mbgs 0 - 0.1 mbgs 0 - 0.1 mbgs 0 - 0.1 mbgs 0 - 0.1 mbgs 0 - 0.1 mbgsLaboratory Duplicate
7600 9500 8600 7400 7900 7300 8600 9000 9200 8200ND (2) ND (2) ND (2) ND (2) ND (2) 5 ND (2) ND (2) ND (2) ND (2)
5 3 6 2 4 19 4 9 5 2340 300 870 280 610 1100 330 960 380 200
ND (2) ND (2) ND (2) ND (2) ND (2) ND (2) ND (2) ND (2) ND (2) ND (2)ND (2) ND (2) ND (2) ND (2) ND (2) 2 ND (2) ND (2) ND (2) ND (2)ND (5) ND (5) ND (5) ND (5) ND (5) ND (5) ND (5) ND (5) ND (5) ND (5)
0.6 0.7 1.5 0.4 0.7 10 0.6 2.5 1.0 0.56 9 13 7 9 15 12 10 9 83 3 4 3 4 4 5 3 3 3
26 33 57 28 37 480 45 88 41 2214000 14000 12000 11000 12000 18000 13000 14000 14000 10000
110 98 340 100 240 3100 87 540 230 584 4 4 3 4 5 8 4 4 5
550 230 280 170 190 250 570 460 300 310ND (0.1) ND (0.1) 0.1 ND (0.1) ND (0.1) 0.3 ND (0.1) 1.0 ND (0.1) ND (0.1)ND (2) ND (2) ND (2) ND (2) ND (2) 3 ND (2) ND (2) ND (2) ND (2)
3 4 6 3 4 8 9 4 4 5ND (2) ND (2) ND (2) ND (2) ND (2) 2 4 ND (2) ND (2) 4ND (2) ND (2) ND (2) ND (2) ND (2) ND (2) ND (2) ND (2) ND (2) 2
ND (0.5) ND (0.5) 0.6 ND (0.5) 0.5 5.0 ND (0.5) 1.1 ND (0.5) ND (0.5)12 6 14 7 11 29 35 15 8 20
ND (0.1) ND (0.1) 0.1 ND (0.1) ND (0.1) 0.3 ND (0.1) 0.2 ND (0.1) ND (0.1)ND (2) ND (2) ND (2) ND (2) ND (2) 26 ND (2) ND (2) 8 ND (2)
1.9 0.8 0.8 0.6 1.8 1.2 0.9 5.9 1.2 1.127 34 35 23 34 43 21 38 28 20
110 180 380 110 160 2100 140 520 230 110
CRA 058704 (44)

TABLE 3
SOIL ANALYTICAL RESULTS FROM OCTOBER 2009COMPOSITE SURFICIAL SOIL SAMPLES
BUCHANS, NL
Page 5 of 6
Sample Location:Sample Description:Sample ID:Sample Date:Sample Depth:
Parameters Units
MetalsAluminum mg/kgAntimony mg/kgArsenic mg/kgBarium mg/kgBeryllium mg/kgBismuth mg/kgBoron mg/kgCadmium mg/kgChromium mg/kgCobalt mg/kgCopper mg/kgIron mg/kgLead mg/kgLithium mg/kgManganese mg/kgMercury mg/kgMolybdenum mg/kgNickel mg/kgRubidium mg/kgSelenium mg/kgSilver mg/kgStrontium mg/kgThallium mg/kgTin mg/kgUranium mg/kgVanadium mg/kgZinc mg/kg
Notes:
- - Not applicable/Not anND - Not detected at associambgs - metres below ground su
SS-37 SS-38 SS-39 SS-40 SS-40 SS-41 SS-42 SS-43 SS-44 SS-45G SS-46Scott Street Church Street Court Road Pine Avenue Pine Avenue Center Street Williams Turn Pike Prospect Street Wolwyn Street Prospect Street Williams Turn Pike
S-58704-101409-CH-37 S-58704-101409-ZZ-38 S-58704-101409-CH-39 S-58704-101409-ZZ-40 S-58704-101409-ZZ-40 S-58704-101409-CH-41 S-58704-101409-ZZ-42 S-58704-101409-CH-43 S-58704-101509-ZZ-44 S-58704-101409-CH-45G S-58704-101509-ZZ-4610/14/2009 10/14/2009 10/14/2009 10/14/2009 10/14/2009 10/14/2009 10/14/2009 10/14/2009 10/14/2009 10/14/2009 10/15/2009
0 - 0.1 mbgs 0 - 0.1 mbgs 0 - 0.1 mbgs 0 - 0.1 mbgs 0 - 0.1 mbgs 0 - 0.1 mbgs 0 - 0.1 mbgs 0 - 0.1 mbgs 0 - 0.1 mbgs 0 - 0.1 mbgs 0 - 0.1 mbgsLaboratory Duplicate
8100 12000 5700 7800 8500 9000 9600 6600 9500 10000 9200ND (2) 15 ND (2) 10 8 4 ND (2) ND (2) ND (2) ND (2) 3
5 23 7 37 42 9 6 4 6 5 12680 1500 850 280 320 720 790 840 1300 710 1200
ND (2) ND (2) ND (2) ND (2) ND (2) ND (2) ND (2) ND (2) ND (2) ND (2) ND (2)ND (2) ND (2) ND (2) 3 4 ND (2) ND (2) ND (2) ND (2) ND (2) ND (2)ND (5) ND (5) ND (5) ND (5) ND (5) ND (5) ND (5) ND (5) ND (5) ND (5) ND (5)
0.8 5.0 2.9 14 18 2.3 2.4 1.7 1.5 2.3 2.77 15 7 11 13 9 11 9 9 11 133 5 3 4 5 3 3 2 3 3 4
35 500 160 530 700 200 77 58 61 120 14012000 22000 10000 17000 19000 13000 12000 9300 12000 11000 15000
170 3300 750 2900 3200 990 530 310 450 540 10004 5 3 6 6 3 3 3 5 4 4
180 240 160 380 370 200 230 210 290 190 240ND (0.1) 0.5 0.1 0.3 0.3 0.2 0.2 ND (0.1) ND (0.1) ND (0.1) 0.2ND (2) 4 ND (2) 6 7 2 ND (2) ND (2) ND (2) ND (2) ND (2)
3 8 4 6 6 4 3 3 5 4 5ND (2) 2 ND (2) ND (2) ND (2) ND (2) ND (2) ND (2) 3 ND (2) ND (2)ND (2) ND (2) ND (2) ND (2) 2 2 ND (2) 3 ND (2) 2 ND (2)
ND (0.5) 4.6 1.4 5.0 5.7 1.3 0.7 0.6 0.9 1.0 1.911 29 14 11 12 11 19 18 28 30 180.1 0.3 ND (0.1) 1.1 0.9 0.1 ND (0.1) ND (0.1) ND (0.1) ND (0.1) 0.1
ND (2) 7 ND (2) ND (2) ND (2) 3 ND (2) 2 ND (2) ND (2) 31.0 0.7 0.6 1.6 1.5 1.0 7.1 1.2 0.7 2.9 1.830 44 33 25 27 30 35 21 26 28 36
260 840 560 4000 5100 500 560 320 270 480 560
CRA 058704 (44)

TABLE 3
SOIL ANALYTICAL RESULTS FROM OCTOBER 2009COMPOSITE SURFICIAL SOIL SAMPLES
BUCHANS, NL
Page 6 of 6
Sample Location:Sample Description:Sample ID:Sample Date:Sample Depth:
Parameters Units
MetalsAluminum mg/kgAntimony mg/kgArsenic mg/kgBarium mg/kgBeryllium mg/kgBismuth mg/kgBoron mg/kgCadmium mg/kgChromium mg/kgCobalt mg/kgCopper mg/kgIron mg/kgLead mg/kgLithium mg/kgManganese mg/kgMercury mg/kgMolybdenum mg/kgNickel mg/kgRubidium mg/kgSelenium mg/kgSilver mg/kgStrontium mg/kgThallium mg/kgTin mg/kgUranium mg/kgVanadium mg/kgZinc mg/kg
Notes:
- - Not applicable/Not anND - Not detected at associambgs - metres below ground su
SS-47 SS-48 SS-49 SS-50 SS-51 SS-52 SS-53 SS-54G SS-55 SS-55GChurch Street Williams Turn Pike Jackson Street Mitchell Street Glavine Street Jackson Street West Street Rothermere Street Scott Street Scott Street
S-58704-101409-CH-47 S-58704-101509-ZZ-48 S-58704-101409-CH-49 S-58704-101509-CH-50 S-58704-101509-CH-51 S-58704-101509-CH-52 S-58704-101509-CH-53 S-58704-101509-CH-54G S-58704-101509-ZZ-55 S-58704-101509-55G10/14/2009 10/15/2009 10/14/2009 10/15/2009 10/15/2009 10/15/2009 10/15/2009 10/15/2009 10/15/2009 10/15/2009
0 - 0.1 mbgs 0 - 0.1 mbgs 0 - 0.1 mbgs 0 - 0.1 mbgs 0 - 0.1 mbgs 0 - 0.1 mbgs 0 - 0.1 mbgs 0 - 0.1 mbgs 0 - 0.1 mbgs 0 - 0.1 mbgs
7600 5800 8400 7800 11000 7800 9500 8700 8200 6100ND (2) 5 ND (2) 3 ND (2) 3 ND (2) ND (2) ND (2) ND (2)
6 8 5 14 8 12 7 5 3 21100 1200 820 1600 880 1400 590 280 270 140
ND (2) ND (2) ND (2) ND (2) ND (2) ND (2) ND (2) ND (2) ND (2) ND (2)ND (2) ND (2) ND (2) ND (2) ND (2) ND (2) ND (2) ND (2) ND (2) ND (2)ND (5) ND (5) ND (5) ND (5) ND (5) ND (5) ND (5) ND (5) ND (5) ND (5)
3.2 2.0 3.6 2.8 0.9 5.6 1.5 0.3 0.6 0.69 11 17 12 14 13 13 11 6 163 3 3 4 5 4 5 5 3 4
120 130 130 76 35 130 75 22 53 4111000 13000 10000 16000 17000 15000 14000 15000 12000 8000
670 1300 560 510 160 910 410 42 130 254 4 3 4 6 4 6 6 3 5
320 190 220 360 450 430 240 290 430 4200.2 0.2 0.3 0.1 ND (0.1) 0.2 0.1 ND (0.1) ND (0.1) 0.1
ND (2) ND (2) ND (2) ND (2) ND (2) 2 ND (2) ND (2) ND (2) 24 4 5 6 8 6 8 7 3 9
ND (2) ND (2) ND (2) 2 3 ND (2) ND (2) 2 2 8ND (2) ND (2) ND (2) ND (2) 3 ND (2) ND (2) ND (2) ND (2) ND (2)
1.4 1.5 1.1 1.2 ND (0.5) 1.7 0.8 ND (0.5) ND (0.5) ND (0.5)24 18 21 30 14 22 11 16 6 36
ND (0.1) 0.1 0.1 0.3 0.1 0.2 ND (0.1) ND (0.1) ND (0.1) ND (0.1)ND (2) 3 ND (2) 4 ND (2) 3 ND (2) ND (2) ND (2) ND (2)
1.9 0.4 7.9 0.6 2.0 2.8 1.0 1.0 0.7 1.522 25 26 29 34 34 33 32 30 16
750 400 810 620 200 1200 350 97 140 95
CRA 058704 (44)
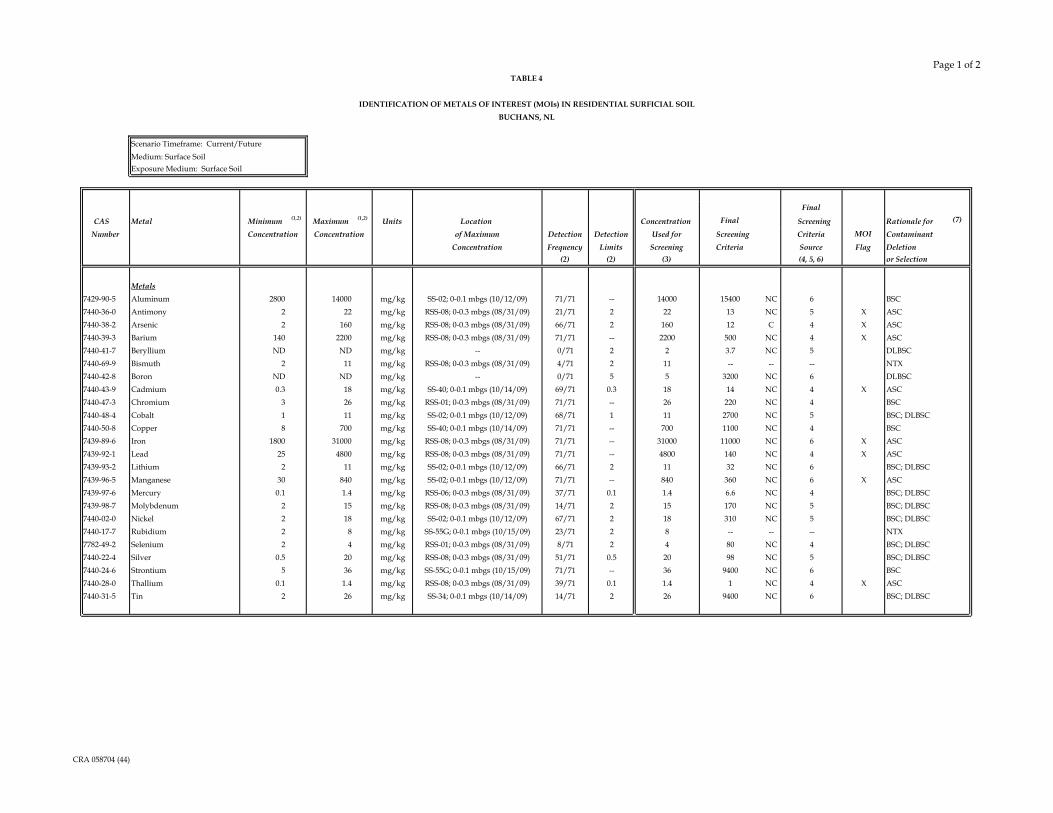
Page 1 of 2TABLE 4
IDENTIFICATION OF METALS OF INTEREST (MOIs) IN RESIDENTIAL SURFICIAL SOILBUCHANS, NL
Scenario Timeframe: Current/FutureMedium: Surface SoilExposure Medium: Surface Soil
Final
CAS Metal Minimum (1,2) Maximum (1,2) Units Location Concentration Final Screening Rationale for (7)
Number Concentration Concentration of Maximum Detection Detection Used for Screening Criteria MOI Contaminant Concentration Frequency Limits Screening Criteria Source Flag Deletion
(2) (2) (3) (4, 5, 6) or Selection
Metals7429-90-5 Aluminum 2800 14000 mg/kg SS-02; 0-0.1 mbgs (10/12/09) 71/71 -- 14000 15400 NC 6 BSC7440-36-0 Antimony 2 22 mg/kg RSS-08; 0-0.3 mbgs (08/31/09) 21/71 2 22 13 NC 5 X ASC7440-38-2 Arsenic 2 160 mg/kg RSS-08; 0-0.3 mbgs (08/31/09) 66/71 2 160 12 C 4 X ASC7440-39-3 Barium 140 2200 mg/kg RSS-08; 0-0.3 mbgs (08/31/09) 71/71 -- 2200 500 NC 4 X ASC7440-41-7 Beryllium ND ND mg/kg -- 0/71 2 2 3.7 NC 5 DLBSC7440-69-9 Bismuth 2 11 mg/kg RSS-08; 0-0.3 mbgs (08/31/09) 4/71 2 11 -- -- -- NTX7440-42-8 Boron ND ND mg/kg -- 0/71 5 5 3200 NC 6 DLBSC7440-43-9 Cadmium 0.3 18 mg/kg SS-40; 0-0.1 mbgs (10/14/09) 69/71 0.3 18 14 NC 4 X ASC7440-47-3 Chromium 3 26 mg/kg RSS-01; 0-0.3 mbgs (08/31/09) 71/71 -- 26 220 NC 4 BSC7440-48-4 Cobalt 1 11 mg/kg SS-02; 0-0.1 mbgs (10/12/09) 68/71 1 11 2700 NC 5 BSC; DLBSC7440-50-8 Copper 8 700 mg/kg SS-40; 0-0.1 mbgs (10/14/09) 71/71 -- 700 1100 NC 4 BSC7439-89-6 Iron 1800 31000 mg/kg RSS-08; 0-0.3 mbgs (08/31/09) 71/71 -- 31000 11000 NC 6 X ASC7439-92-1 Lead 25 4800 mg/kg RSS-08; 0-0.3 mbgs (08/31/09) 71/71 -- 4800 140 NC 4 X ASC7439-93-2 Lithium 2 11 mg/kg SS-02; 0-0.1 mbgs (10/12/09) 66/71 2 11 32 NC 6 BSC; DLBSC7439-96-5 Manganese 30 840 mg/kg SS-02; 0-0.1 mbgs (10/12/09) 71/71 -- 840 360 NC 6 X ASC7439-97-6 Mercury 0.1 1.4 mg/kg RSS-06; 0-0.3 mbgs (08/31/09) 37/71 0.1 1.4 6.6 NC 4 BSC; DLBSC
Molybdenum 2 15 mg/kg RSS-08; 0-0.3 mbgs (08/31/09) 14/71 2 15 170 NC 5 BSC; DLBSC7440-02-0 Nickel 2 18 mg/kg SS-02; 0-0.1 mbgs (10/12/09) 67/71 2 18 310 NC 5 BSC; DLBSC7440-17-7 Rubidium 2 8 mg/kg SS-55G; 0-0.1 mbgs (10/15/09) 23/71 2 8 -- -- -- NTX7782-49-2 Selenium 2 4 mg/kg RSS-01; 0-0.3 mbgs (08/31/09) 8/71 2 4 80 NC 4 BSC; DLBSC7440-22-4 Silver 0.5 20 mg/kg RSS-08; 0-0.3 mbgs (08/31/09) 51/71 0.5 20 98 NC 5 BSC; DLBSC7440-24-6 Strontium 5 36 mg/kg SS-55G; 0-0.1 mbgs (10/15/09) 71/71 -- 36 9400 NC 6 BSC7440-28-0 Thallium 0.1 1.4 mg/kg RSS-08; 0-0.3 mbgs (08/31/09) 39/71 0.1 1.4 1 NC 4 X ASC7440-31-5 Tin 2 26 mg/kg SS-34; 0-0.1 mbgs (10/14/09) 14/71 2 26 9400 NC 6 BSC; DLBSC
7439-98-7
CRA 058704 (44)

Page 2 of 2TABLE 4
IDENTIFICATION OF METALS OF INTEREST (MOIs) IN RESIDENTIAL SURFICIAL SOILBUCHANS, NL
Scenario Timeframe: Current/FutureMedium: Surface SoilExposure Medium: Surface Soil
Final
CAS Metal Minimum (1,2) Maximum (1,2) Units Location Concentration Final Screening Rationale for (7)
Number Concentration Concentration of Maximum Detection Detection Used for Screening Criteria MOI Contaminant Concentration Frequency Limits Screening Criteria Source Flag Deletion
(2) (2) (3) (4, 5, 6) or Selection
Metals (cont.'d)7440-61-1 Uranium 0.2 70 mg/kg RSS-01; 0-0.3 mbgs (08/31/09) 71/71 -- 70 23 NC 4 X ASC7440-62-2 Vanadium 12 67 mg/kg RSS-08; 0-0.3 mbgs (08/31/09) 71/71 -- 67 470 NC 5 BSC7440-66-6 Zinc 65 5100 mg/kg SS-40; 0-0.1 mbgs (10/14/09) 71/71 -- 5100 16000 NC 5 BSC
Notes:C = Carcinogenic; based on USEPA classification systemNC = Non-Carcinogenic; based on USEPA classification system-- = Not Available(1) Minimum/maximum detected concentration.(2) Based on data collected from sampling locations: SS-01, SS-02, SS-03, SS-04, SS-05, SS-06, SS-07, SS-08, SS-09, SS-10, SS-11G, SS-12, SS-12G, SS-13G,
SS-14, SS-15, SS-16, SS1-7, SS-18, SS-19, SS-20, SS-21, SS-22, SS-23, SS-24, SS-25, SS-26, SS-27, SS-28, SS-29G, SS-30, SS-31, SS-32, SS-33, SS-34, SS-34G,SS-35, SS-36, SS-36G, SS-37, SS-38, SS-39, SS-40, SS-41, SS-42, SS-43, SS-44, SS-45G, SS-46, SS-47, SS-48, SS-49, SS-50, SS-51, SS-52, SS-53, SS-54G,SS-55, SS-55G, RSS-01, RSS-02, RSS-03, RSS-04, RSS-05, RSS-06, RSS-07, RSS-08, RSS-09, RSS-10, RSS-11, RSS-12.Detection limits for metals detected in all samples were not listed.
(3) The higher of the maximum detected concentration or the maximum detection limit used for metals of interest (MOIs) selection.(4) Soil Quality Guidelines for the protection of human health (SQGHH). Canadian Council of Ministers of the Environment, Soil Quality Guidelines (SQG), Coarse Grained Soil, Residential/Parkland Soil Direct Contact, September 2007a.(5) Ontario MOEE Rationale for the Development and Application of Generic Soil, Groundwater and Sediment Criteria for use at Contaminated Site in Ontario, December 1996 and updates.
Table B - Components for MOEE Soil Remediation Criteria (Surface/Full Depth) - Non-potable Groundwater Situation - Coarse Textured Soils, Residential/ Parkland, Soil Contact S1 Risk.The MOE criteria are based on a 10-6 risk level for carcinogens and a hazard index of 0.2 for non-carcinogens. To be consistent with thetarget risk and hazard levels of 10-5 and 0.2, the MOE criteria for carcinogens were multiplied by a factor of 10.
(6) Due to lack of screening criterion available, screening level taken from Regional Screening Levels (RSLs) table, Residential, May 19, 2009b.The RSLs criteria are based on a 10-6 risk level for carcinogens and a hazard index of 1 for non-carcinogens. To be consistent with thetarget risk and hazard levels of 10-5 and 0.2, the RSLs criteria for carcinogens were multiplied by a factor of 10 and non-carcinogens were divided by a factor of 5.
(7) Rationale Codes Selection Reason : Maximum detected above Screening Criterion (ASC)Maximum Detection Limit above Screening Criterion (DLASC)
Deletion Reason : Maximum detected below Screening Criterion (BSC)Maximum Detection Limit below Screening Criterion (DLBSC)No Toxicity Data available (NTX)
CRA 058704 (44)

Page 1 of 2
TABLE 5
DERIVATION OF RISK-BASED CONCENTRATIONS (RBCs) FOR METALS OF INTEREST (MOIs) IN SOIL - RESIDENTIAL ORAL, DERMAL, AND INHALATION EXPOSUREBUCHANS, NEWFOUNDLAND
RelativeAbsorption Risk-Based
CSF URF RfD RfC Factor Residential Concentrations
Metals oral dermal inhalation oral dermal inhalation oral (1) dermal EDI (2) BSC (2,3) Cancer (4) Non-Cancer (5) RBC soil (6)
Of Interest 1/(mg/kg-d) 1/(mg/kg-d) 1/(mg/m 3 ) (mg/kg-d) (mg/kg-d) (mg/m 3 ) (%/100) (%/100) (mg/kg-d) (mg/kg) ( μ g/g) ( μ g/g) ( μ g/g)
MetalsAntimony -- -- -- 4.00E-04 4.00E-04 2.50E-02 1 0.1 -- 1.6 NV 2.19E+01 22Arsenic 1.80E+00 1.80E+00 6.40E+00 3.00E-04 3.00E-04 1.50E-05 0.26 0.03 -- 21.4 4.35E+01 7.84E+01 43Barium -- -- -- 2.00E-01 2.00E-01 5.00E-04 1 0.1 -- 55.4 NV 1.02E+04 10,180Cadmium -- -- 9.80E+00 8.00E-04 8.00E-04 1.00E-05 1 0.01 5.90E-04 0.3 4.82E+04 6.37E+01 64Iron -- -- -- 7.00E-01 7.00E-01 4.00E-03 1 0.01 -- 31700 NV 7.39E+04 73,914Lead -- -- -- 3.60E-03 3.60E-03 2.00E-04 0.74 0.006 2.19E-03 47.2 NV 6.22E+02 622Manganese -- -- -- 1.36E-01 1.36E-01 5.00E-05 1 0.01 -- 691 NV 8.70E+03 8,698Thallium -- -- -- 1.35E-05 1.35E-05 2.40E-05 1 0.01 -- 0.81 NV 1.63E+00 1.6Uranium -- -- -- 6.00E-04 6.00E-04 3.00E-04 1 0.1 7.80E-05 2 NV 1.35E+02 135
Notes:-- = Not AvailableNV = No Value(1) Oral Relative Absorption Factors for arsenic and lead are based on University of Colorado bioavailability testing. (See text)
Values are the 95th percentile upper confidence on the arithmetic mean calculated using USEPA's ProUCL 4.00.04(2) Estimated Daily Intake for arsenic, cadmium, lead, and uranium obtained from the following sources:
CCME, 1995 Canadian Soil Quality Guidelines For Contaminated Sites Human Health Effects: Inorganic Arsenic Final Report The National Contaminated Sites Remediation Program, FebruaryCCME, 1996a Canadian Soil Quality Guidelines For Contaminated Sites Human Health Effects: Inorganic Cadmium Final Report The National Contaminated Sites Remediation Program, FebruaryCCME, 1996b Canadian Soil Quality Guidelines For Contaminated Sites Human Health Effects: Inorganic Lead Final Report The National Contaminated Sites Remediation Program, MarchCCME, 2007b: Canadian Soil Quality Guidelines for Uranium: Environmental and Human Health Scientific Supporting Document PN 1371 ISBN 978-1-896997-64-3 PDF
(3) Background concentrations for arsenic, cadmium and lead are 98th percentile site-specific concentrations if these levels are lower than CCME background concentrations. Otherwise, average site-specific concentrations were used.For the remaining metals, the average concentration consistent with the CCME approach for uranium because no CCME comparative value was available. For thallium and uranium, the CCME background concentration was used because site-specific concentrations were all below the detection limit of 10 mg/kg.Site-specific background concentrations were obtained from Till sampling and ice flow survey, NTS 12A/10, 15, 16, 12H/1), central Newfoundland, 1991 and 1992. Canadian Database of Geochemical Surveys. (Diskette to accompany GSC Open File 2823). Accessed January 2010. Values are for clay-sized fraction (<0.063 mm) soils analyzed by ICP. (See Text)
(4) Carcinogenic risk includes infant, toddler, child, teen and adult over a 80 year lifetime.(5) Non-carcinogenic hazard is based on a toddler receptor (most conservative). A THQ of 1.0 was used if an EDI was available, and a THQ of 0.2 was used if no EDI was available. (6) The selected site-specific RBC is the lower of the carcinogenic-based concentration and the non-carcinogenic-based concentration.(7) No criteria available from Health Canada (2009) for antimony. Oral RfD value taken from USEPA IRIS (USEPA, 1991).
Since barium is predominately in the form of barite, the oral TRV for barium was obtained from Alberta Environment (2009). There was no inhalation criteria available from Health Canada for barium. The inhalation RfC for barium was obtained from USEPA Health Effects Assessment Sumary Table (HEAST) (USEPA, 1997)No criteria available from Health Canada for iron. Oral RfD for iron obtained from USEPA Provisional Peer-Reviewed Toxicity Value (PPRTV) for iron (USEPA, 2006)Oral RfD for manganese is the TRV for a toddler specified in Health Canada (2009b) There was no inhalation criteria available from Health Canada for managese. The inhalation RfC for manganese was obtained from USEPA IRIS (USEPA, 1993b)The oral RfD for thallium compounds has been withdrawn from IRIS by USEPA. The TRV was obtained from MOE (2009). There was no inhalation criteria available from Health Canada for thallium. As such, an RfC was calculated as follows based on route-to-route extrapolation of the oral TRV: RfD x BW Toddler/InhToddler.
No noncancer inhalation criteria available from Health Canada for antimony, iron or lead. The inhlation RfCs for these metals were obtained from the Ontario Ambient Air Quality Criteria. (MOE, 2008)No noncancer criteria available from Health Canada for arsenic. The oral RfD for arsenic was obtained from USEPA IRIS (USEPA, 1993a)No inhalation criteria available from Health Canada for arsenic The inhalation RfC for arsenic was obtained from California EPA (CalEPA, 2008)No inhalation criteria available from Health Canada for cadmium. The inhalation RfC for cadmium was obtained from ATSDR chronic inhalation Mimimum Risk Levels. (ATSDR, 2008)No inhalation criteria available from Health Canada for uranium The inhalation RfC for uranium was obtained from ATSDR chronic inhalation Mimimum Risk Levels. (ATSDR, 1999)
(8) Surface area includes hands, forearms, and lower legs.(9) Based on weather data for Buchans, 4 months with average daily temp less than 0 degrees and 5 months with at least 7 days with snow depth greater than 5 cm.
The four months with average daily temp less than 0 degrees were January, February, March, and December; therefore there are potentially 244 days remaining in the year for direct contact exposure.
Residential Exposure Assumptions
Risk-Based Concentration in Soil (mg/kg) RBCsoil calculatedTarget Risk Level (unitless) TR 1.0E-05 Health Canada, 2009aTarget Hazard Level (unitless) THQ 0.2 Health Canada, 2009aTarget Hazard Level (unitless) THQ 1 Health Canada, 2009aCancer Slope Factor (per mg/kg-day) CSF chemical-specific Health Canada, 2009b (7)Reference Dose Factor (mg/kg-day) RfD chemical-specific Health Canada, 2009b (7)Unit Risk Factor (1/(mg/m3)) URF chemical-specific Health Canada, 2009b (7)Reference Concentration (mg/m3) RfC chemical-specific Health Canada, 2009b (7)Ingestion Rate (mg/day) - Infant IR 20 Health Canada, 2009aIngestion Rate (mg/day) - Toddler IR 80 Health Canada, 2009aIngestion Rate (mg/day) - Child IR 20 Health Canada, 2009aIngestion Rate (mg/day) - Teen IR 20 Health Canada, 2009aIngestion Rate (mg/day) - Adult IR 20 Health Canada, 2009aInhalation Rate (m³/day) - Toddler Inh 9.3 Health Canada, 2009aRelative Absorption Factor - Oral (%/100) RAFo chemical-specific Health Canada, 2009aSurface Area Exposed (cm2/day) - Infant SA 1,050 Health Canada, 2009a (8)Surface Area Exposed (cm2/day) - Toddler SA 1,720 Health Canada, 2009a (8)Surface Area Exposed (cm2/day) - Child SA 2,865 Health Canada, 2009a (8)
CRA 058704 (44)

Page 2 of 2
TABLE 5
DERIVATION OF RISK-BASED CONCENTRATIONS (RBCs) FOR METALS OF INTEREST (MOIs) IN SOIL - RESIDENTIAL ORAL, DERMAL, AND INHALATION EXPOSUREBUCHANS, NEWFOUNDLAND
Surface Area Exposed (cm2/day) - Teen SA 4,400 Health Canada, 2009a (8)Surface Area Exposed (cm2/day) - Adult SA 5,000 Health Canada, 2009a (8)Adherence Factor (mg/cm2) AF 0.1 Health Canada, 2009aRelative Absorption Factor - Dermal (%/100) RAFd chemical-specific Health Canada, 2009aExposure Time (hrs/day) ET 1.5/24 Health Canada, 2009aExposure Frequency (days/year) EF 244 Professional Judgement (9)Exposure Duration (years) - Infant ED 0.5 Health Canada, 2009aExposure Duration (years) - Toddler ED 4.5 Health Canada, 2009aExposure Duration (years) - Child ED 7 Health Canada, 2009aExposure Duration (years) - Teen ED 8 Health Canada, 2009aExposure Duration (years) - Adult ED 60 Health Canada, 2009aBody Weight (kg) - Infant BW 8.2 Health Canada, 2009aBody Weight (kg) - Toddler BW 16.5 Health Canada, 2009aBody Weight (kg) - Child BW 32.9 Health Canada, 2009aBody Weight (kg) - Teen BW 59.7 Health Canada, 2009aBody Weight (kg) - Adult BW 70.7 Health Canada, 2009aConversion Factor (kg/mg) CF 1.0E-06Averaging Time - carc. (days) ATc 29,200 Health Canada, 2009aAveraging Time - noncarc. (days) ATnc 1,643 Health Canada, 2009aParticulate Emission Factor (kg/m3) PEF 7.60E-10 Health Canada, 2009aEstimated Daily Intake (mg/kg-d) EDI chemical-specific See Footnote (2)Background Soil Concentration (mg/kg) BSC chemical-specific See Footnote (2,3)
Exposure Equations
Carcinogenic Endpoints: RBCsoil = TR x ATcEF x ED x [(CSF x IR x CF x RAFo)/BW + (CSF x SA x AF x CF x RAFd)/BW + (URF x ET x PEF)]
Non-Carcinogenic Endpoints: RBCsoil = THQ x ATnc EF x ED x [((1/(RfD-EDI)) x IR x CF x RAFo)/BW + ((1/(RfD-EDI)) x SA x AF x CF x RAFd)/BW + ((1/RfC) x ET x PEF)]
References:ATSDR, 1999. Toxicological Profile for Uranium. (http://www.atsdr.cdc.gov/toxprofiles/tp150.html). September 1999.�ATSDR, 2008. Toxicological Profile for Cadmium. (http://www.atsdr.cdc.gov/toxprofiles/tp5.html). September 2008.�CalEPA, 2008. Inorganic Arsenic Reference Exposure Levels. (http://www.oehha.org/air/hot_spots/2008/AppendixD1_final.pdf#page=68). December 2008.Health Canada, 2009a: Federal Contaminated Site Risk Assessment in Canada, Part V: Guidance on Complex Human Health Detailed Quantitative
Risk Assessment for Chemicals (DQRAchem), Version 1.0, February 2009.Health Canada, 2009b: Federal Contaminated Site Risk Assessment in Canada: Spreadsheet Tool for Human Health Detailed Quantitative
Risk Assessment (DQRA), May 1 2009.MOE, 2008. Ontario's Ambient Air Quality Criteria. Standards Development Branch. Ontario Ministry of the Environment. PIBS # 6570e. February 2008.USEPA, 1991: Antimony (CASRN 7440-36-0). Integrated Risk Information System (IRIS) Database (http://cfpub.epa.gov/ncea/iris/index.cfm), February 1991.USEPA, 1993a: Arsenic, inorganic (CASRN 7440-38-2) .Integrated Risk Information System (IRIS) Database (http://www.epa.gov/ncea/iris/subst/0278.htm), February 1993.USEPA, 1993b: Manganese (CASRN 7439-96-5) .Integrated Risk Information System (IRIS) Database (http://www.epa.gov/ncea/iris/subst/0373.htm), December 1993.USEPA, 1997. Health Effects Assessment Summary Tables. EPA-540-R-97-036. July 1997.USEPA, 2006: Provisional Peer-Reviewed Toxicity Values for Iron and Compounds: Derivation of Subchronic and Chronic Oral RfDs
National Center for Environmental Assessment, Superfund Technical Support Center, USEPA, , September 2006.
+ BSC
+ BSC
CRA 058704 (44)

TABLE 6
BUCHANS, NEWFOUNDLAND
Risk-Based MaximumMetals of Concentrations SoilInterest RBC soil (1) Concentration (2)
(µg/g) (µg/g)
MetalsAntimony 22 22Arsenic 43 160Barium 10,180 2,200Cadmium 64 18Iron 73,914 31,000Lead 622 4,800Manganese 8,698 840Thallium 1.6 1.4Uranium 135 70
Notes:
(1) Refer to Table 5 for site-specific RBCs.(2) Refer to Table 4 for maximum detected concentration.
= Maximum soil concentration exceeds the calculated RBCsoil.
IDENTIFICATION OF METALS OF INTEREST (MOIs) IN RESIDENTIAL SURFICIAL SOIL THAT EXCEED SITE-SPECIFIC RBCS
CRA 058704 (44)

TABLE 7
IDENTIFICATION OF SAMPLING LOCATIONS WITH CONCENTRATION OF METALS OF INTEREST (MOIs) IN RESIDENTIAL SURFICIAL SOIL THAT EXCEED SITE-SPECIFIC RBCsBUCHANS, NEWFOUNDLAND
Page 1 of 8
Sample Location SS-01 SS-02 SS-03 SS-04 SS-05 SS-06 SS-07 SS-08 SS-09Sample ID: Risk-Based S-58704-101209-CH-01 S-58704-101209-CH-02 S-58704-101209-CH-03 S-58704-101209-CH-04 S-58704-101209-ZZ-05 S-58704-101209-ZZ-06 S-58704-101209-ZZ-07 S-58704-101209-ZZ-08 S-58704-101309-CH-09Sample Date: Concentrations 10/12/2009 10/12/2009 10/12/2009 10/12/2009 10/12/2009 10/12/2009 10/12/2009 10/12/2009 10/13/2009Sample Depth: RBCsoil (1) 0 - 0.1 mbgs 0 - 0.1 mbgs 0 - 0.1 mbgs 0 - 0.1 mbgs 0 - 0.1 mbgs 0 - 0.1 mbgs 0 - 0.1 mbgs 0 - 0.1 mbgs 0 - 0.1 mbgs
Parameters Units
MetalsAntimony mg/kg 22 7 ND (2) 4 4 ND (2) ND (2)/ND (2) ND (2) ND (2) ND (2)Arsenic mg/kg 43 37 12 15 12 5 10.0/11.0 ND (2) 7 11Barium mg/kg 10,180 1000 480 910 670 580 310/370 200 380 1400Cadmium mg/kg 64 3.3 1.9 3.6 5.2 1.4 1.0/1.2 0.4 1.5 2.0Iron mg/kg 73,914 20000 27000 17000 13000 16000 18000/18000 11000 16000 13000Lead mg/kg 622 1500 210 1200 780 350 220/250 84 270 350Manganese mg/kg 8,698 260 840 280 200 160 390/420 210 380 320Thallium mg/kg 1.6 0.5 ND (0.1) 0.2 0.3 0.1 ND (0.1)/ND (0.1) ND (0.1) ND (0.1) 0.4Uranium mg/kg 135 0.8 0.7 0.7 0.9 0.5 0.6/0.6 0.5 0.6 2.2
Notes:
(1) Risk-Based Concentrations derivation presented in Table 5.ND Not detected at associated value.
= Maximum soil concentration exceeds the calculated RBCsoil.
CRA 058704 (44)

TABLE 7
IDENTIFICATION OF SAMPLING LOCATIONS WITH CONCENTRATION OF METALS OF INTEREST (MOIs) IN RESIDENTIAL SURFICIAL SOIL THAT EXCEED SITE-SPECIFIC RBCsBUCHANS, NEWFOUNDLAND
Page 2 of 8
Sample LocationSample ID: Risk-BasedSample Date: ConcentrationsSample Depth: RBCsoil (1)
Parameters Units
MetalsAntimony mg/kg 22Arsenic mg/kg 43Barium mg/kg 10,180Cadmium mg/kg 64Iron mg/kg 73,914Lead mg/kg 622Manganese mg/kg 8,698Thallium mg/kg 1.6Uranium mg/kg 135
Notes:
(1) Risk-Based Concentrations derivation presented in Table 5.ND Not detected at associated value.
= Maximum soil concentration exceeds the calculated RBCsoil.
SS-10 SS-11G SS-12 SS-12G SS-13G SS-14 SS-15 SS-16 SS-17S-58704-101309-ZZ-10 S-58704-101309-CH-11G S-58704-101309-ZZ-12 S-58704-101309-ZZ-12G S-58704-101309-CH-13G S-58704-101309-ZZ-14 S-58704-101309-CH-15 S-58704-101309-ZZ-16 S-58704-101309-CH-17
10/13/2009 10/13/2009 10/13/2009 10/13/2009 10/13/2009 10/13/2009 10/13/2009 10/13/2009 10/13/20090 - 0.1 mbgs 0 - 0.1 mbgs 0 - 0.1 mbgs 0 - 0.1 mbgs 0 - 0.1 mbgs 0 - 0.1 mbgs 0 - 0.1 mbgs 0 - 0.1 mbgs 0 - 0.1 mbgs
2 ND (2) ND (2) ND (2) ND (2) ND (2) ND (2) ND (2) ND (2)6 9 5 ND (2) 7 3 11 7 10
700 910 640 290 430 710 1500 750 12002.7 0.8 1.3 1.2 0.7 1.5 2.3 4.0 2.7
12000 16000 12000 6200 17000 11000 15000 13000 16000480 320 320 120 78 450 510 660 48098 170 260 240 640 760 260 250 310
ND (0.1) 0.3 0.1 ND (0.1) ND (0.1) ND (0.1) 0.2 0.1 0.20.5 0.7 0.9 1.7 2.7 0.9 1.2 0.8 1.3
CRA 058704 (44)

TABLE 7
IDENTIFICATION OF SAMPLING LOCATIONS WITH CONCENTRATION OF METALS OF INTEREST (MOIs) IN RESIDENTIAL SURFICIAL SOIL THAT EXCEED SITE-SPECIFIC RBCsBUCHANS, NEWFOUNDLAND
Page 3 of 8
Sample LocationSample ID: Risk-BasedSample Date: ConcentrationsSample Depth: RBCsoil (1)
Parameters Units
MetalsAntimony mg/kg 22Arsenic mg/kg 43Barium mg/kg 10,180Cadmium mg/kg 64Iron mg/kg 73,914Lead mg/kg 622Manganese mg/kg 8,698Thallium mg/kg 1.6Uranium mg/kg 135
Notes:
(1) Risk-Based Concentrations derivation presented in Table 5.ND Not detected at associated value.
= Maximum soil concentration exceeds the calculated RBCsoil.
SS-18 SS-19 SS-20 SS-21 SS-22 SS-23 SS-24 SS-25 SS-26S-58704-101309-ZZ-18 S-58704-101309-CH-19 S-58704-101309-ZZ-20 S-58704-101309-CH-21 S-58704-101309-ZZ-22 S-58704-101309-CH-23 S-58704-101309-ZZ-24 S-58704-101309-CH-25 S-58704-101309-ZZ-26
10/13/2009 10/13/2009 10/13/2009 10/13/2009 10/13/2009 10/13/2009 10/13/2009 10/13/2009 10/13/20090 - 0.1 mbgs 0 - 0.1 mbgs 0 - 0.1 mbgs 0 - 0.1 mbgs 0 - 0.1 mbgs 0 - 0.1 mbgs 0 - 0.1 mbgs 0 - 0.1 mbgs 0 - 0.1 mbgs
2 4 3 ND (2) ND (2) 6 4 ND (2) 212 23 14 9 6 17 21 7 10
1100 1900 1400 910 290 690 1700 500 7700.9 8.3 3.5 1.4 0.7 5.8 4.9 2.2 2.8
12000 14000 12000 12000 16000 15000 16000 12000 11000440 1200 850 290 270 1600 1400 410 580140 300 180 240 340 210 420 250 3400.3 0.5 0.3 0.2 ND (0.1) 0.2 0.3 ND (0.1) 0.30.5 7.9 1.5 0.6 0.6 0.6 9.5 0.9 1.1
CRA 058704 (44)

TABLE 7
IDENTIFICATION OF SAMPLING LOCATIONS WITH CONCENTRATION OF METALS OF INTEREST (MOIs) IN RESIDENTIAL SURFICIAL SOIL THAT EXCEED SITE-SPECIFIC RBCsBUCHANS, NEWFOUNDLAND
Page 4 of 8
Sample LocationSample ID: Risk-BasedSample Date: ConcentrationsSample Depth: RBCsoil (1)
Parameters Units
MetalsAntimony mg/kg 22Arsenic mg/kg 43Barium mg/kg 10,180Cadmium mg/kg 64Iron mg/kg 73,914Lead mg/kg 622Manganese mg/kg 8,698Thallium mg/kg 1.6Uranium mg/kg 135
Notes:
(1) Risk-Based Concentrations derivation presented in Table 5.ND Not detected at associated value.
= Maximum soil concentration exceeds the calculated RBCsoil.
SS-27 SS-28 SS-29G SS-30 SS-31 SS-32 SS-33 SS-34 SS-34GS-58704-101309-CH-27 S-58704-101409-ZZ-28 S-58704-101309-CH-29G S-58704-101409-ZZ-30 S-58704-101409-CH-31 S-58704-101409-ZZ-32 S-58704-101409-CH-33 S-58704-101409-ZZ-34 S-58704-101409-ZZ-34G
10/13/2009 10/14/2009 10/13/2009 10/14/2009 10/14/2009 10/14/2009 10/14/2009 10/14/2009 10/14/20090 - 0.1 mbgs 0 - 0.1 mbgs 0 - 0.1 mbgs 0 - 0.1 mbgs 0 - 0.1 mbgs 0 - 0.1 mbgs 0 - 0.1 mbgs 0 - 0.1 mbgs 0 - 0.1 mbgs
ND (2) ND (2) ND (2)/ND (2) ND (2) ND (2) ND (2) ND (2) 5 ND (2)7 2 5.0/5.0 3 6 2 4 19 4
660 170 380/340 300 870 280 610 1100 3302.0 ND (0.3) 0.5/0.6 0.7 1.5 0.4 0.7 10 0.6
14000 10000 14000/14000 14000 12000 11000 12000 18000 13000420 54 100/110 98 340 100 240 3100 87240 200 720/550 230 280 170 190 250 570
ND (0.1) ND (0.1) 0.1/ND (0.1) ND (0.1) 0.1 ND (0.1) ND (0.1) 0.3 ND (0.1)1.2 1.5 1.8/1.9 0.8 0.8 0.6 1.8 1.2 0.9
CRA 058704 (44)

TABLE 7
IDENTIFICATION OF SAMPLING LOCATIONS WITH CONCENTRATION OF METALS OF INTEREST (MOIs) IN RESIDENTIAL SURFICIAL SOIL THAT EXCEED SITE-SPECIFIC RBCsBUCHANS, NEWFOUNDLAND
Page 5 of 8
Sample LocationSample ID: Risk-BasedSample Date: ConcentrationsSample Depth: RBCsoil (1)
Parameters Units
MetalsAntimony mg/kg 22Arsenic mg/kg 43Barium mg/kg 10,180Cadmium mg/kg 64Iron mg/kg 73,914Lead mg/kg 622Manganese mg/kg 8,698Thallium mg/kg 1.6Uranium mg/kg 135
Notes:
(1) Risk-Based Concentrations derivation presented in Table 5.ND Not detected at associated value.
= Maximum soil concentration exceeds the calculated RBCsoil.
SS-35 SS-36 SS-36G SS-37 SS-38 SS-39 SS-40 SS-41 SS-42S-58704-101409-CH-35 S-58704-101409-ZZ-36 S-58704-101409-ZZ-36G S-58704-101409-CH-37 S-58704-101409-ZZ-38 S-58704-101409-CH-39 S-58704-101409-ZZ-40 S-58704-101409-CH-41 S-58704-101409-ZZ-42
10/14/2009 10/14/2009 10/14/2009 10/14/2009 10/14/2009 10/14/2009 10/14/2009 10/14/2009 10/14/20090 - 0.1 mbgs 0 - 0.1 mbgs 0 - 0.1 mbgs 0 - 0.1 mbgs 0 - 0.1 mbgs 0 - 0.1 mbgs 0 - 0.1 mbgs 0 - 0.1 mbgs 0 - 0.1 mbgs
ND (2) ND (2) ND (2) ND (2) 15 ND (2) 10.0/8.0 4 ND (2)9 5 2 5 23 7 37/42 9 6
960 380 200 680 1500 850 280/320 720 7902.5 1.0 0.5 0.8 5.0 2.9 14/18 2.3 2.4
14000 14000 10000 12000 22000 10000 17000/19000 13000 12000540 230 58 170 3300 750 2900/3200 990 530460 300 310 180 240 160 380/370 200 2300.2 ND (0.1) ND (0.1) 0.1 0.3 ND (0.1) 1.1/0.9 0.1 ND (0.1)5.9 1.2 1.1 1.0 0.7 0.6 1.6/1.5 1.0 7.1
CRA 058704 (44)

TABLE 7
IDENTIFICATION OF SAMPLING LOCATIONS WITH CONCENTRATION OF METALS OF INTEREST (MOIs) IN RESIDENTIAL SURFICIAL SOIL THAT EXCEED SITE-SPECIFIC RBCsBUCHANS, NEWFOUNDLAND
Page 6 of 8
Sample LocationSample ID: Risk-BasedSample Date: ConcentrationsSample Depth: RBCsoil (1)
Parameters Units
MetalsAntimony mg/kg 22Arsenic mg/kg 43Barium mg/kg 10,180Cadmium mg/kg 64Iron mg/kg 73,914Lead mg/kg 622Manganese mg/kg 8,698Thallium mg/kg 1.6Uranium mg/kg 135
Notes:
(1) Risk-Based Concentrations derivation presented in Table 5.ND Not detected at associated value.
= Maximum soil concentration exceeds the calculated RBCsoil.
SS-43 SS-44 SS-45G SS-46 SS-47 SS-48 SS-49 SS-50 SS-51S-58704-101409-CH-43 S-58704-101509-ZZ-44 S-58704-101409-CH-45G S-58704-101509-ZZ-46 S-58704-101409-CH-47 S-58704-101509-ZZ-48 S-58704-101409-CH-49 S-58704-101509-CH-50 S-58704-101509-CH-51
10/14/2009 10/14/2009 10/14/2009 10/15/2009 10/14/2009 10/15/2009 10/14/2009 10/15/2009 10/15/20090 - 0.1 mbgs 0 - 0.1 mbgs 0 - 0.1 mbgs 0 - 0.1 mbgs 0 - 0.1 mbgs 0 - 0.1 mbgs 0 - 0.1 mbgs 0 - 0.1 mbgs 0 - 0.1 mbgs
ND (2) ND (2) ND (2) 3 ND (2) 5 ND (2) 3 ND (2)4 6 5 12 6 8 5 14 8
840 1300 710 1200 1100 1200 820 1600 8801.7 1.5 2.3 2.7 3.2 2.0 3.6 2.8 0.9
9300 12000 11000 15000 11000 13000 10000 16000 17000310 450 540 1000 670 1300 560 510 160210 290 190 240 320 190 220 360 450
ND (0.1) ND (0.1) ND (0.1) 0.1 ND (0.1) 0.1 0.1 0.3 0.11.2 0.7 2.9 1.8 1.9 0.4 7.9 0.6 2.0
CRA 058704 (44)

TABLE 7
IDENTIFICATION OF SAMPLING LOCATIONS WITH CONCENTRATION OF METALS OF INTEREST (MOIs) IN RESIDENTIAL SURFICIAL SOIL THAT EXCEED SITE-SPECIFIC RBCsBUCHANS, NEWFOUNDLAND
Page 7 of 8
Sample LocationSample ID: Risk-BasedSample Date: ConcentrationsSample Depth: RBCsoil (1)
Parameters Units
MetalsAntimony mg/kg 22Arsenic mg/kg 43Barium mg/kg 10,180Cadmium mg/kg 64Iron mg/kg 73,914Lead mg/kg 622Manganese mg/kg 8,698Thallium mg/kg 1.6Uranium mg/kg 135
Notes:
(1) Risk-Based Concentrations derivation presented in Table 5.ND Not detected at associated value.
= Maximum soil concentration exceeds the calculated RBCsoil.
SS-52 SS-53 SS-54G SS-55 SS-55G RSS-01 RSS-02 RSS-03 RSS-04S-58704-101509-CH-52 S-58704-101509-CH-53 S-58704-101509-CH-54G S-58704-101509-ZZ-55 S-58704-101509-55G RSS-01-SO RSS-02-SO RSS-03-SO RSS-04-SO
10/15/2009 10/15/2009 10/15/2009 10/15/2009 10/15/2009 8/31/2009 8/31/2009 8/31/2009 8/31/20090 - 0.1 mbgs 0 - 0.1 mbgs 0 - 0.1 mbgs 0 - 0.1 mbgs 0 - 0.1 mbgs (0-0.3) m BGS (0-0.3) m BGS (0-0.3) m BGS (0-0.3) m BGS
3 ND (2) ND (2) ND (2) ND (2) 6 ND (2) 3 ND (2)12 7 5 3 2 11 ND (2) 12 4
1400 590 280 270 140 760 190 1100 5105.6 1.5 0.3 0.6 0.6 7.9 0.5 8.8 1.0
15000 14000 15000 12000 8000 13000 12000 11000 14000910 410 42 130 25 1100 97 1400 220430 240 290 430 420 150 140 67 2100.2 ND (0.1) ND (0.1) ND (0.1) ND (0.1) 0.2 ND (0.1) 0.2 ND (0.1)2.8 1.0 1.0 0.7 1.5 70 0.5 0.4 0.6
CRA 058704 (44)

TABLE 7
IDENTIFICATION OF SAMPLING LOCATIONS WITH CONCENTRATION OF METALS OF INTEREST (MOIs) IN RESIDENTIAL SURFICIAL SOIL THAT EXCEED SITE-SPECIFIC RBCsBUCHANS, NEWFOUNDLAND
Page 8 of 8
Sample LocationSample ID: Risk-BasedSample Date: ConcentrationsSample Depth: RBCsoil (1)
Parameters Units
MetalsAntimony mg/kg 22Arsenic mg/kg 43Barium mg/kg 10,180Cadmium mg/kg 64Iron mg/kg 73,914Lead mg/kg 622Manganese mg/kg 8,698Thallium mg/kg 1.6Uranium mg/kg 135
Notes:
(1) Risk-Based Concentrations derivation presented in Table 5.ND Not detected at associated value.
= Maximum soil concentration exceeds the calculated RBCsoil.
RSS-05 RSS-06 RSS-07 RSS-08 RSS-09 RSS-10 RSS-11 RSS-12RSS-05-SO RSS-06-SO RSS-07-SO RSS-08-SO RSS-09-SO RSS-10-SO RSS-11-SO RSS-12-SO8/31/2009 8/31/2009 8/31/2009 8/31/2009 8/31/2009 8/31/2009 8/31/2009 8/31/2009
(0-0.3) m BGS (0-0.3) m BGS (0-0.3) m BGS (0-0.3) m BGS (0-0.3) m BGS (0-0.3) m BGS (0-0.3) m BGS (0-0.3) m BGS
ND (2) ND (2) ND (2) 22 ND (2) ND (2)/ND (2) ND (2) ND (2)ND (2) 9 6 160 6 6.0/6.0 ND (2) 3
270 1200 670 2200 980 810/700 180 310ND (0.3) 3.8 0.6 2.8 0.4 0.7/0.7 0.9 0.5
7500 13000 19000 31000 6100 13000/14000 1800 1300040 470 220 4800 590 200/210 27 11096 190 45 65 30 170/220 32 200
ND (0.1) 0.2 0.3 1.4 0.3 0.1/0.1 0.1 ND (0.1)0.5 19 0.4 0.6 0.3 0.5/0.5 0.2 0.6
CRA 058704 (44)

Page 1 of 9
TABLE 8
CANCER RISK ESTIMATES AND NON-CANCER HAZARD QUOTIENTS BY SAMPLE LOCATION FOR METALS OF INTEREST (MOIs) IN RESIDENTIAL SURFICIAL SOIL THAT EXCEED SITE-SPECIFIC RBCs
BUCHANS, NEWFOUNDLAND
Sample Location SS-01 SS-03 SS-04 SS-09Sample ID: Risk-Based S-58704-101209-CH-01 Non-Cancer Cancer S-58704-101209-CH-03 Non-Cancer Cancer S-58704-101209-CH-04 Non-Cancer Cancer S-58704-101309-CH-09 Non-Cancer Cancer Sample Date: Concentrations 10/12/2009 Risk Risk 10/12/2009 Risk Risk 10/12/2009 Risk Risk 10/13/2009 Risk RiskSample Depth: RBC soil (1) 0 - 0.1 mbgs (2) (3) 0 - 0.1 mbgs (2) (3) 0 - 0.1 mbgs (2) (3) 0 - 0.1 mbgs (2) (3)
Parameters Units
MetalsArsenic mg/kg 43 C 37 -- 8.5E-06 15 -- 3.5E-06 12 -- 2.8E-06 11 -- 2.5E-06Lead mg/kg 622 NC 1500 2.4 -- 1200 1.9 -- 780 1.3 -- 350 0.6 --
Notes:
ND - Not detected at associated value.NC - Non carcinogenicC - CarcinogenicBOLD - Concentration is greater than risk-based concentration
- Cancer risk estimate exceeds 1.0 × 10⁻⁵ or non-cancer HQ exceeds 1.0.
-- - not calculated as there is no carcinogenic and/or non-carcinogenic toxicity to calculate a carcinogenic and/or non-carcinogenic risk-based concentration.(1) Risk-Based Concentrations derivation presented in Table 5.(2) Non-Cancer Risk calculated by dividing the soil concentrations by the non-carcinogenic Risk-Based Concentration.(3) Cancer Risk calculated by dividing the soil concentrations by the carcinogenic Risk-Based Concentration and multiplying by 1.0E-05.
CRA 058704 (44)

Page 2 of 9
TABLE 8
CANCER RISK ESTIMATES AND NON-CANCER HAZARD QUOTIENTS BY SAMPLE LOCATION FOR METALS OF INTEREST (MOIs) IN RESIDENTIAL SURFICIAL SOIL THAT EXCEED SITE-SPECIFIC RBCs
BUCHANS, NEWFOUNDLAND
Sample Location SS-11G SS-15 SS-16 SS-17Sample ID: Risk-Based S-58704-101309-CH-11G Non-Cancer Cancer S-58704-101309-CH-15 Non-Cancer Cancer S-58704-101309-ZZ-16 Non-Cancer Cancer S-58704-101309-CH-17 Non-Cancer Cancer Sample Date: Concentrations 10/13/2009 Risk Risk 10/13/2009 Risk Risk 10/13/2009 Risk Risk 10/13/2009 Risk RiskSample Depth: RBC soil (1) 0 - 0.1 mbgs (2) (3) 0 - 0.1 mbgs (2) (3) 0 - 0.1 mbgs (2) (3) 0 - 0.1 mbgs (2) (3)
Parameters Units
MetalsArsenic mg/kg 43 C 9 -- 2.1E-06 11 -- 2.5E-06 7 -- 1.6E-06 10 -- 2.3E-06Lead mg/kg 622 NC 320 0.5 -- 510 0.8 -- 660 1.1 -- 480 0.8 --
Notes:
ND - Not detected at associated value.NC - Non carcinogenicC - CarcinogenicBOLD - Concentration is greater than risk-based concentration
- Cancer risk estimate exceeds 1.0 × 10⁻⁵ or non-cancer HQ exceeds 1.0.
-- - not calculated as there is no carcinogenic and/or non-carcinogenic toxicity to calculate a carcinogenic and/or non-carcinogenic risk-based concentration.(1) Risk-Based Concentrations derivation presented in Table 5.(2) Non-Cancer Risk calculated by dividing the soil concentrations by the non-carcinogenic Risk-Based Concentration.(3) Cancer Risk calculated by dividing the soil concentrations by the carcinogenic Risk-Based Concentration and multiplying by 1.0E-05.
CRA 058704 (44)

Page 3 of 9
TABLE 8
CANCER RISK ESTIMATES AND NON-CANCER HAZARD QUOTIENTS BY SAMPLE LOCATION FOR METALS OF INTEREST (MOIs) IN RESIDENTIAL SURFICIAL SOIL THAT EXCEED SITE-SPECIFIC RBCs
BUCHANS, NEWFOUNDLAND
Sample Location SS-18 SS-19 SS-20 SS-21Sample ID: Risk-Based S-58704-101309-ZZ-18 Non-Cancer Cancer S-58704-101309-CH-19 Non-Cancer Cancer S-58704-101309-ZZ-20 Non-Cancer Cancer S-58704-101309-CH-21 Non-Cancer Cancer Sample Date: Concentrations 10/13/2009 Risk Risk 10/13/2009 Risk Risk 10/13/2009 Risk Risk 10/13/2009 Risk RiskSample Depth: RBC soil (1) 0 - 0.1 mbgs (2) (3) 0 - 0.1 mbgs (2) (3) 0 - 0.1 mbgs (2) (3) 0 - 0.1 mbgs (2) (3)
Parameters Units
MetalsArsenic mg/kg 43 C 12 -- 2.8E-06 23 -- 5.3E-06 14 -- 3.2E-06 9 -- 2.1E-06Lead mg/kg 622 NC 440 0.7 -- 1200 1.9 -- 850 1.4 -- 290 0.5 --
Notes:
ND - Not detected at associated value.NC - Non carcinogenicC - CarcinogenicBOLD - Concentration is greater than risk-based concentration
- Cancer risk estimate exceeds 1.0 × 10⁻⁵ or non-cancer HQ exceeds 1.0.
-- - not calculated as there is no carcinogenic and/or non-carcinogenic toxicity to calculate a carcinogenic and/or non-carcinogenic risk-based concentration.(1) Risk-Based Concentrations derivation presented in Table 5.(2) Non-Cancer Risk calculated by dividing the soil concentrations by the non-carcinogenic Risk-Based Concentration.(3) Cancer Risk calculated by dividing the soil concentrations by the carcinogenic Risk-Based Concentration and multiplying by 1.0E-05.
CRA 058704 (44)

Page 4 of 9
TABLE 8
CANCER RISK ESTIMATES AND NON-CANCER HAZARD QUOTIENTS BY SAMPLE LOCATION FOR METALS OF INTEREST (MOIs) IN RESIDENTIAL SURFICIAL SOIL THAT EXCEED SITE-SPECIFIC RBCs
BUCHANS, NEWFOUNDLAND
Sample Location SS-23 SS-24 SS-31 SS-34Sample ID: Risk-Based S-58704-101309-CH-23 Non-Cancer Cancer S-58704-101309-ZZ-24 Non-Cancer Cancer S-58704-101409-CH-31 Non-Cancer Cancer S-58704-101409-ZZ-34 Non-Cancer Cancer Sample Date: Concentrations 10/13/2009 Risk Risk 10/13/2009 Risk Risk 10/14/2009 Risk Risk 10/14/2009 Risk RiskSample Depth: RBC soil (1) 0 - 0.1 mbgs (2) (3) 0 - 0.1 mbgs (2) (3) 0 - 0.1 mbgs (2) (3) 0 - 0.1 mbgs (2) (3)
Parameters Units
MetalsArsenic mg/kg 43 C 17 -- 3.9E-06 21 -- 4.8E-06 6 -- 1.4E-06 19 -- 4.4E-06Lead mg/kg 622 NC 1600 2.6 -- 1400 2.3 -- 340 0.5 -- 3100 5.0 --
Notes:
ND - Not detected at associated value.NC - Non carcinogenicC - CarcinogenicBOLD - Concentration is greater than risk-based concentration
- Cancer risk estimate exceeds 1.0 × 10⁻⁵ or non-cancer HQ exceeds 1.0.
-- - not calculated as there is no carcinogenic and/or non-carcinogenic toxicity to calculate a carcinogenic and/or non-carcinogenic risk-based concentration.(1) Risk-Based Concentrations derivation presented in Table 5.(2) Non-Cancer Risk calculated by dividing the soil concentrations by the non-carcinogenic Risk-Based Concentration.(3) Cancer Risk calculated by dividing the soil concentrations by the carcinogenic Risk-Based Concentration and multiplying by 1.0E-05.
CRA 058704 (44)

Page 5 of 9
TABLE 8
CANCER RISK ESTIMATES AND NON-CANCER HAZARD QUOTIENTS BY SAMPLE LOCATION FOR METALS OF INTEREST (MOIs) IN RESIDENTIAL SURFICIAL SOIL THAT EXCEED SITE-SPECIFIC RBCs
BUCHANS, NEWFOUNDLAND
Sample Location SS-35 SS-38 SS-39 SS-40Sample ID: Risk-Based S-58704-101409-CH-35 Non-Cancer Cancer S-58704-101409-ZZ-38 Non-Cancer Cancer S-58704-101409-CH-39 Non-Cancer Cancer S-58704-101409-ZZ-40 Non-Cancer Cancer Sample Date: Concentrations 10/14/2009 Risk Risk 10/14/2009 Risk Risk 10/14/2009 Risk Risk 10/14/2009 Risk RiskSample Depth: RBC soil (1) 0 - 0.1 mbgs (2) (3) 0 - 0.1 mbgs (2) (3) 0 - 0.1 mbgs (2) (3) 0 - 0.1 mbgs (2) (3)
Parameters Units
MetalsArsenic mg/kg 43 C 9 -- 2.1E-06 23 -- 5.3E-06 7 -- 1.6E-06 37/42 -- 9.1E-06Lead mg/kg 622 NC 540 0.9 -- 3300 5.3 -- 750 1.2 -- 2900/3200 4.9 --
Notes:
ND - Not detected at associated value.NC - Non carcinogenicC - CarcinogenicBOLD - Concentration is greater than risk-based concentration
- Cancer risk estimate exceeds 1.0 × 10⁻⁵ or non-cancer HQ exceeds 1.0.
-- - not calculated as there is no carcinogenic and/or non-carcinogenic toxicity to calculate a carcinogenic and/or non-carcinogenic risk-based concentration.(1) Risk-Based Concentrations derivation presented in Table 5.(2) Non-Cancer Risk calculated by dividing the soil concentrations by the non-carcinogenic Risk-Based Concentration.(3) Cancer Risk calculated by dividing the soil concentrations by the carcinogenic Risk-Based Concentration and multiplying by 1.0E-05.
CRA 058704 (44)

Page 6 of 9
TABLE 8
CANCER RISK ESTIMATES AND NON-CANCER HAZARD QUOTIENTS BY SAMPLE LOCATION FOR METALS OF INTEREST (MOIs) IN RESIDENTIAL SURFICIAL SOIL THAT EXCEED SITE-SPECIFIC RBCs
BUCHANS, NEWFOUNDLAND
Sample Location SS-41 SS-43 SS-44 SS-46Sample ID: Risk-Based S-58704-101409-CH-41 Non-Cancer Cancer S-58704-101409-CH-43 Non-Cancer Cancer S-58704-101509-ZZ-44 Non-Cancer Cancer S-58704-101509-ZZ-46 Non-Cancer Cancer Sample Date: Concentrations 10/14/2009 Risk Risk 10/14/2009 Risk Risk 10/14/2009 Risk Risk 10/15/2009 Risk RiskSample Depth: RBC soil (1) 0 - 0.1 mbgs (2) (3) 0 - 0.1 mbgs (2) (3) 0 - 0.1 mbgs (2) (3) 0 - 0.1 mbgs (2) (3)
Parameters Units
MetalsArsenic mg/kg 43 C 9 -- 2.1E-06 4 -- 9.2E-07 6 -- 1.4E-06 12 -- 2.8E-06Lead mg/kg 622 NC 990 1.6 -- 310 0.5 -- 450 0.7 -- 1000 1.6 --
Notes:
ND - Not detected at associated value.NC - Non carcinogenicC - CarcinogenicBOLD - Concentration is greater than risk-based concentration
- Cancer risk estimate exceeds 1.0 × 10⁻⁵ or non-cancer HQ exceeds 1.0.
-- - not calculated as there is no carcinogenic and/or non-carcinogenic toxicity to calculate a carcinogenic and/or non-carcinogenic risk-based concentration.(1) Risk-Based Concentrations derivation presented in Table 5.(2) Non-Cancer Risk calculated by dividing the soil concentrations by the non-carcinogenic Risk-Based Concentration.(3) Cancer Risk calculated by dividing the soil concentrations by the carcinogenic Risk-Based Concentration and multiplying by 1.0E-05.
CRA 058704 (44)

Page 7 of 9
TABLE 8
CANCER RISK ESTIMATES AND NON-CANCER HAZARD QUOTIENTS BY SAMPLE LOCATION FOR METALS OF INTEREST (MOIs) IN RESIDENTIAL SURFICIAL SOIL THAT EXCEED SITE-SPECIFIC RBCs
BUCHANS, NEWFOUNDLAND
Sample Location SS-47 SS-48 SS-49 SS-50Sample ID: Risk-Based S-58704-101409-CH-47 Non-Cancer Cancer S-58704-101509-ZZ-48 Non-Cancer Cancer S-58704-101409-CH-49 Non-Cancer Cancer S-58704-101509-CH-50 Non-Cancer Cancer Sample Date: Concentrations 10/14/2009 Risk Risk 10/15/2009 Risk Risk 10/14/2009 Risk Risk 10/15/2009 Risk RiskSample Depth: RBC soil (1) 0 - 0.1 mbgs (2) (3) 0 - 0.1 mbgs (2) (3) 0 - 0.1 mbgs (2) (3) 0 - 0.1 mbgs (2) (3)
Parameters Units
MetalsArsenic mg/kg 43 C 6 -- 1.4E-06 8 -- 1.8E-06 5 -- 1.2E-06 14 -- 3.2E-06Lead mg/kg 622 NC 670 1.1 -- 1300 2.1 -- 560 0.9 -- 510 0.8 --
Notes:
ND - Not detected at associated value.NC - Non carcinogenicC - CarcinogenicBOLD - Concentration is greater than risk-based concentration
- Cancer risk estimate exceeds 1.0 × 10⁻⁵ or non-cancer HQ exceeds 1.0.
-- - not calculated as there is no carcinogenic and/or non-carcinogenic toxicity to calculate a carcinogenic and/or non-carcinogenic risk-based concentration.(1) Risk-Based Concentrations derivation presented in Table 5.(2) Non-Cancer Risk calculated by dividing the soil concentrations by the non-carcinogenic Risk-Based Concentration.(3) Cancer Risk calculated by dividing the soil concentrations by the carcinogenic Risk-Based Concentration and multiplying by 1.0E-05.
CRA 058704 (44)

Page 8 of 9
TABLE 8
CANCER RISK ESTIMATES AND NON-CANCER HAZARD QUOTIENTS BY SAMPLE LOCATION FOR METALS OF INTEREST (MOIs) IN RESIDENTIAL SURFICIAL SOIL THAT EXCEED SITE-SPECIFIC RBCs
BUCHANS, NEWFOUNDLAND
Sample Location SS-51 SS-52 RSS-01 RSS-03Sample ID: Risk-Based S-58704-101509-CH-51 Non-Cancer Cancer S-58704-101509-CH-52 Non-Cancer Cancer RSS-01-SO Non-Cancer Cancer RSS-03-SO Non-Cancer Cancer Sample Date: Concentrations 10/15/2009 Risk Risk 10/15/2009 Risk Risk 8/31/2009 Risk Risk 8/31/2009 Risk RiskSample Depth: RBC soil (1) 0 - 0.1 mbgs (2) (3) 0 - 0.1 mbgs (2) (3) (0-0.3) m BGS (2) (3) (0-0.3) m BGS (2) (3)
Parameters Units
MetalsArsenic mg/kg 43 C 8 -- 1.8E-06 12 -- 2.8E-06 11 -- 2.5E-06 12 -- 2.8E-06Lead mg/kg 622 NC 160 0.3 -- 910 1.5 -- 1100 1.8 -- 1400 2.3 --
Notes:
ND - Not detected at associated value.NC - Non carcinogenicC - CarcinogenicBOLD - Concentration is greater than risk-based concentration
- Cancer risk estimate exceeds 1.0 × 10⁻⁵ or non-cancer HQ exceeds 1.0.
-- - not calculated as there is no carcinogenic and/or non-carcinogenic toxicity to calculate a carcinogenic and/or non-carcinogenic risk-based concentration.(1) Risk-Based Concentrations derivation presented in Table 5.(2) Non-Cancer Risk calculated by dividing the soil concentrations by the non-carcinogenic Risk-Based Concentration.(3) Cancer Risk calculated by dividing the soil concentrations by the carcinogenic Risk-Based Concentration and multiplying by 1.0E-05.
CRA 058704 (44)

Page 9 of 9
TABLE 8
CANCER RISK ESTIMATES AND NON-CANCER HAZARD QUOTIENTS BY SAMPLE LOCATION FOR METALS OF INTEREST (MOIs) IN RESIDENTIAL SURFICIAL SOIL THAT EXCEED SITE-SPECIFIC RBCs
BUCHANS, NEWFOUNDLAND
Sample Location RSS-06 RSS-08 RSS-09Sample ID: Risk-Based RSS-06-SO Non-Cancer Cancer RSS-08-SO Non-Cancer Cancer RSS-09-SO Non-Cancer Cancer Sample Date: Concentrations 8/31/2009 Risk Risk 8/31/2009 Risk Risk 8/31/2009 Risk RiskSample Depth: RBC soil (1) (0-0.3) m BGS (2) (3) (0-0.3) m BGS (2) (3) (0-0.3) m BGS (2) (3)
Parameters Units
MetalsArsenic mg/kg 43 C 9 -- 2.1E-06 160 -- 3.7E-05 6 -- 1.4E-06Lead mg/kg 622 NC 470 0.8 -- 4800 7.7 -- 590 0.9 --
Notes:
ND - Not detected at associated value.NC - Non carcinogenicC - CarcinogenicBOLD - Concentration is greater than risk-based concentration
- Cancer risk estimate exceeds 1.0 × 10⁻⁵ or non-cancer HQ exceeds 1.0.
-- - not calculated as there is no carcinogenic and/or non-carcinogenic toxicity to calculate a carcinogenic and/or non-carcinogenic risk-based concentration.(1) Risk-Based Concentrations derivation presented in Table 5.(2) Non-Cancer Risk calculated by dividing the soil concentrations by the non-carcinogenic Risk-Based Concentration.(3) Cancer Risk calculated by dividing the soil concentrations by the carcinogenic Risk-Based Concentration and multiplying by 1.0E-05.
CRA 058704 (44)

Page 1 of 2
TABLE 9
DERIVATION OF ADULT RISK-BASED CONCENTRATIONS (RBCs) FOR ARSENIC AND LEAD IN SOIL - RESIDENTIAL ADULT ORAL, DERMAL, AND INHALATION EXPOSUREBUCHANS, NEWFOUNDLAND
RelativeAbsorption Risk-Based
CSF URF RfD RfC Factor Residential Concentrations
Metals oral dermal inhalation oral dermal inhalation oral (1) dermal EDI (2) BSC (2,3) Cancer (4) Non-Cancer (5) RBC soil (6)
Of Interest 1/(mg/kg-d) 1/(mg/kg-d) 1/(mg/m 3 ) (mg/kg-d) (mg/kg-d) (mg/m 3 ) (%/100) (%/100) (mg/kg-d) (mg/kg) ( μ g/g) ( μ g/g) ( μ g/g)
MetalsArsenic 1.80E+00 1.80E+00 6.40E+00 -- -- -- 0.26 0.03 -- 21.4 6.02E+01 NV 60Lead -- -- -- 3.60E-03 3.60E-03 6.31E-03 0.74 0.006 2.19E-03 47.2 NV 8.39E+03 8,389
Notes:-- = Not AvailableNV = No Value(1) Oral Relative Absorption Factors for arsenic and lead are based on University of Colorado bioavailability testing. (See text)
Values are the 95th percentile upper confidence on the arithmetic mean calculated using USEPA's ProUCL 4.00.04(2) Estimated Daily Intake for lead obtained from the following source:
CCME, 1996b Canadian Soil Quality Guidelines For Contaminated Sites Human Health Effects: Inorganic Lead Final Report The National Contaminated Sites Remediation Program, March(3) Background concentrations for arsenic and lead are the average and 98th percentile site-specific concentrations, respectively. See text Section 3.4.7.
Site-specific background concentrations were obtained from Till sampling and ice flow survey, NTS 12A/10, 15, 16, 12H/1), central Newfoundland, 1991 and 1992. Canadian Database of Geochemical Surveys. (Diskette to accompany GSC Open File 2823). Accessed January 2010. Values are for clay-sized fraction (<0.063 mm) soils analyzed by ICP. (See Text)
(4) Carcinogenic risk-based concentration calculated for adult only exposure.(5) Non-carcinogenic risk-based concentration calculated for adult only exposure.(6) The selected site-specific RBC is the lower of the carcinogenic-based concentration and the non-carcinogenic-based concentration.(7) Surface area includes hands, forearms, and lower legs.(8) Based on weather data for Buchans, 4 months with average daily temp less than 0 degrees and 5 months with at least 7 days with snow depth greater than 5 cm.
The four months with average daily temp less than 0 degrees were January, February, March, and December; therefore there are potentially 244 days remaining in the year for direct contact exposure.
Residential Exposure Assumptions
Risk-Based Concentration in Soil (mg/kg) RBC soil calculatedTarget Risk Level (unitless) TR 1.0E-05 Health Canada, 2009aTarget Hazard Level (unitless) THQ 1 Health Canada, 2009aCancer Slope Factor (per mg/kg-day) CSF chemical-specific Health Canada, 2009bReference Dose Factor (mg/kg-day) RfD chemical-specific Health Canada, 2009bUnit Risk Factor (1/(mg/m3)) URF chemical-specific Health Canada, 2009bReference Concentration (mg/m3) RfC chemical-specific Health Canada, 2009bIngestion Rate (mg/day) - Adult IR 20 Health Canada, 2009aInhalation Rate (m³/day) - Adult Inh 15.8 Health Canada, 2009aRelative Absorption Factor - Oral (%/100) RAFo chemical-specific Health Canada, 2009aSurface Area Exposed (cm2/day) - Adult SA 5,000 Health Canada, 2009a (7)Adherence Factor (mg/cm2) AF 0.1 Health Canada, 2009aRelative Absorption Factor - Dermal (%/100) RAFd chemical-specific Health Canada, 2009aExposure Frequency (days/year) EF 244 Professional Judgement (8)Exposure Duration (years) - Adult ED 60 Health Canada, 2009aBody Weight (kg) - Adult BW 70.7 Health Canada, 2009aConversion Factor (kg/mg) CF 1.0E-06Averaging Time - carc. (days) ATc 29,200 Health Canada, 2009aAveraging Time - noncarc. (days) ATnca 21,900Particulate Emission Factor (kg/m3) PEF 7.60E-10 Health Canada, 2009aEstimated Daily Intake (mg/kg-d) EDI chemical-specific See Footnote (2)Background Soil Concentration (mg/kg) BSC chemical-specific See Footnote (2,3)
CRA 058704 (44)
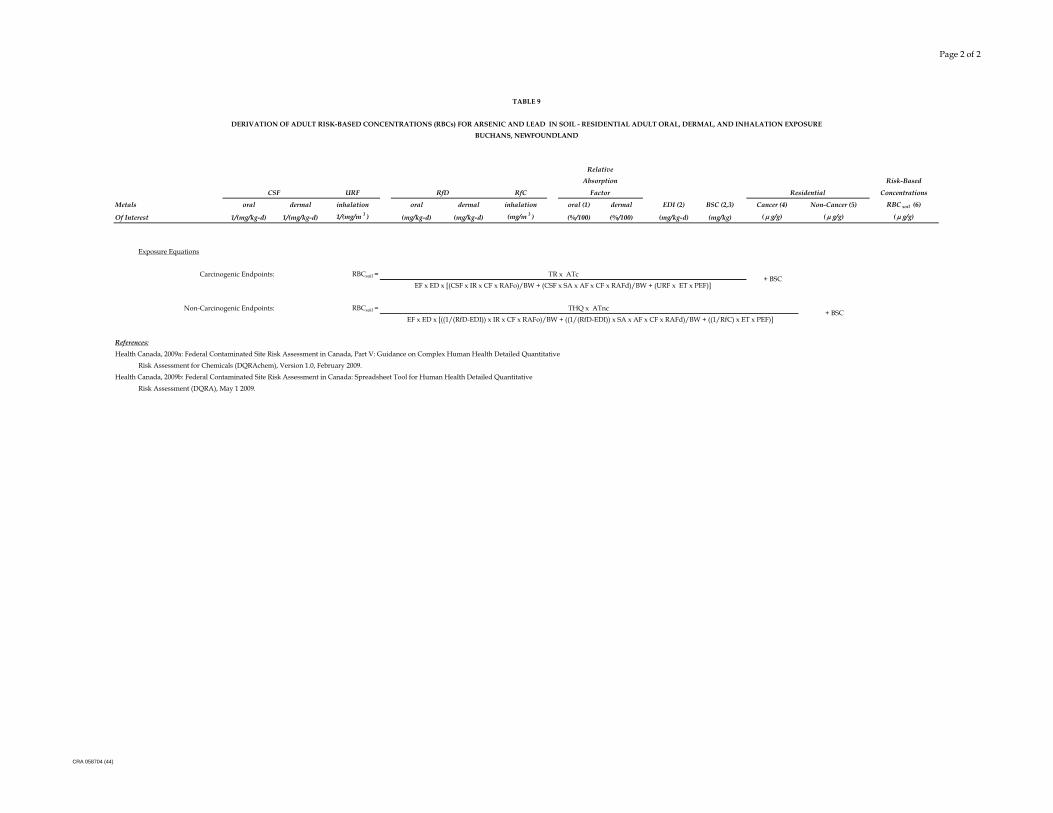
Page 2 of 2
TABLE 9
DERIVATION OF ADULT RISK-BASED CONCENTRATIONS (RBCs) FOR ARSENIC AND LEAD IN SOIL - RESIDENTIAL ADULT ORAL, DERMAL, AND INHALATION EXPOSUREBUCHANS, NEWFOUNDLAND
RelativeAbsorption Risk-Based
CSF URF RfD RfC Factor Residential Concentrations
Metals oral dermal inhalation oral dermal inhalation oral (1) dermal EDI (2) BSC (2,3) Cancer (4) Non-Cancer (5) RBC soil (6)
Of Interest 1/(mg/kg-d) 1/(mg/kg-d) 1/(mg/m 3 ) (mg/kg-d) (mg/kg-d) (mg/m 3 ) (%/100) (%/100) (mg/kg-d) (mg/kg) ( μ g/g) ( μ g/g) ( μ g/g)
Exposure Equations
Carcinogenic Endpoints: RBCsoil = TR x ATcEF x ED x [(CSF x IR x CF x RAFo)/BW + (CSF x SA x AF x CF x RAFd)/BW + (URF x ET x PEF)]
Non-Carcinogenic Endpoints: RBCsoil = THQ x ATnc EF x ED x [((1/(RfD-EDI)) x IR x CF x RAFo)/BW + ((1/(RfD-EDI)) x SA x AF x CF x RAFd)/BW + ((1/RfC) x ET x PEF)]
References:Health Canada, 2009a: Federal Contaminated Site Risk Assessment in Canada, Part V: Guidance on Complex Human Health Detailed Quantitative
Risk Assessment for Chemicals (DQRAchem), Version 1.0, February 2009.Health Canada, 2009b: Federal Contaminated Site Risk Assessment in Canada: Spreadsheet Tool for Human Health Detailed Quantitative
Risk Assessment (DQRA), May 1 2009.
+ BSC
+ BSC
CRA 058704 (44)

058704 (44)
APPENDIX A
USEPA'S STANDARD OPERATING PROCEDURE FOR AN IN VITRO BIOACCESSIBILITY ASSAY FOR LEAD IN SOIL

EPA 9200.1-86 November 2008
Standard Operating Procedure for an In Vitro Bioaccessibility Assay for Lead in Soil
1.0 Scope and Application
The purpose of this standard operating procedure (SOP) is to define the proper analytical procedure for the validated in vitro bioaccessibility assay for lead in soil (U.S. EPA, 2007b), to describe the typical working range and limits of the assay, and to indicate potential interferences. At this time, the method described herein has only been validated for lead in soil (U.S. EPA, 2007b).
The SOP described herein is typically applicable for the characterization of lead bioaccessibility in soil. The assay may be varied or changed as required and dependent upon site conditions, equipment limitations, or limitations imposed by the procedure. Users are cautioned that deviations in the method from the assay described herein may impact the results (and the validity of the method). Users are strongly encouraged to document any deviations as well as the comparison and associated Quality Assurance (QA) in any report.
This document is intended to be used as reference for developing site-specific Quality Assurance Project Plans (QAPPs) and Sampling and Analysis Plans (SAPs), but not intended to be used as a substitute for a site-specific QAPP or a detailed SAP.
Mention of trade names or commercial products does not constitute endorsement or recommended use by U.S. EPA.
2.0 Method Summary
Reliable analysis of the potential hazard to children from ingestion of lead in the environment depends on accurate information on a number of key parameters, including (1) lead concentration in environmental media (soil, dust, water, food, air, paint, etc.), (2) childhood intake rates of each medium, and (3) the rate and extent of lead absorption from each medium (“bioavailability”). Knowledge of lead bioavailability is important because the amount of lead that actually enters the body from an ingested medium depends on the physical-chemical properties of the lead and of the medium. For example, lead in soil may exist, at least in part, as poorly water-soluble minerals, and may also exist inside particles of inert matrix such as rock or slag of variable size, shape, and association. These chemical and physical properties may tend to influence (usually decrease) the absorption (bioavailability) of lead when ingested. Thus, equal ingested doses of different forms of lead in different media may not be of equal health concern.
The bioavailability of lead in a particular medium may be expressed either in absolute terms (absolute bioavailability) or in relative terms (relative bioavailability).
1

• Absolute Bioavailability (ABA) is the ratio of the amount of lead absorbed compared to the amount ingested:
ABA = (Absorbed Dose) / (Ingested Dose)
This ratio is also referred to as the oral absorption fraction (AFo).
• Relative Bioavailability (RBA) is the ratio of the absolute bioavailability of lead present in some test material compared to the absolute bioavailability of lead in some appropriate reference material:
RBA = ABA(test) / ABA(reference)
For example, if 100 µg of lead contained in soil were ingested and 30 µg entered the body, the ABA for soil would be:
30 (Absorbed Dose) /100 (Ingested Dose), or 0.30 (30%).
Likewise, if 100 micrograms (µg) of lead dissolved in drinking water were ingested and a total of 50 µg entered the body, the ABA would be:
50 (Absorbed Dose) /100 (Ingested Dose), or 0.50 (50%).
If the lead dissolved in water was used as the frame of reference for describing the relative amount of lead absorbed from soil, the RBA would be:
0.30 (test) / 0.50 (reference), or 0.60 (60%).
Usually the form of lead used as reference material is a soluble compound such as lead acetate that is expected to completely dissolve when ingested.
The in vitro bioaccessibility assay described in this SOP provides a rapid and relatively inexpensive alternative to in vivo assays for predicting RBA of lead in soils and soil-like materials. The method is based on the concept that lead solubilization in gastrointestinal fluid is likely to be an important determinant of lead bioavailability in vivo. The method measures the extent of lead solubilization in an extraction solvent that resembles gastric fluid. The fraction of lead which solubilizes in an in vitro system is referred to as in vitro bioaccessibility (IVBA), which may then be used as an indicator of in vivo RBA. Measurements of IVBA using this assay have been shown to be a reliable predictor of in vivo RBA of lead in a wide range of soil types and lead phases from a variety of different sites (U.S. EPA, 2007b).
2

3.0 Sample Preparation, Preservation, Containers, Handling, and Storage
All test soils should be prepared by drying (<40°C) and sieving to <250 µm. The <250 µm size fraction was used because this particle size is representative of that which adheres to children’s hands (U.S. EPA, 2000). Stainless steel sieves are recommended. Samples should be thoroughly mixed prior to use to ensure homogenization. Mixing and aliquoting of samples using a riffle splitter is recommended. Clean plastic bags or storage bottles are recommended. All samples should be archived after analysis and retained for further analysis for a period of six (6) months. No preservatives or special storage conditions are required.
4.0 Interferences and Potential Problems
At present, it appears that the relationship between IVBA and RBA is widely applicable, having been found to hold true for a wide range of different soil types and lead phases from a variety of different sites. However, the majority of the samples tested have been collected from mining and milling sites, and it is plausible that some forms of lead that do not occur at this type of site might not follow the observed correlation. Thus, whenever a sample containing an unusual and/or untested lead phase is evaluated by the IVBA protocol, this sample should be identified as a potential source of uncertainty. In the future, as additional samples with a variety of new and different lead forms are tested by both in vivo and in vitro methods, the applicability of the method will be more clearly defined. In addition, excess phosphate in the sample medium may result in interference (i.e., the assay is not suited to phosphate-amended soils). Interferences and potential problems are discussed under Procedures (Section 7).
5.0 Apparatus
The main piece of equipment used for this procedure is the extraction device shown in Figure 1. An electric motor (the same motor as is used in the Toxicity Characteristic Leaching Procedure, or TCLP) drives a flywheel, which in turn drives a Plexiglass block situated inside a temperature-controlled water bath. The Plexiglass block contains ten 5-centimeter holes with stainless steel screw clamps, each of which is designed to hold a 125-mL wide-mouth high density polyethylene (HDPE) bottle. The water bath should be filled such that the extraction bottles are completely immersed. Temperature in the water bath should be maintained at 37±2 °C using an immersion circulator heater. The 125-mL HDPE bottles should have air-tight screw-cap seals, and care should be taken to ensure that the bottles do not leak during the extraction procedure. All equipment should be properly cleaned, acid washed, and rinsed with deionized water prior to use.
3

Figure 1. In Vitro Bioaccessibility Extraction Apparatus.
4

6.0 Reagents
All reagents should be free of lead and the final fluid should be tested to confirm that lead concentrations are <¼ (<one-fourth) the project required detection limit (PRDL) of 10 µg/L (i.e., <2 µg/L lead in the final fluid). Cleanliness of all materials used to prepare and/or store the extraction fluid and buffer is essential; all glassware and equipment used to prepare standards and reagents should be properly cleaned, acid washed, and triple-rinsed with deionized water prior to use.
7.0 Procedures
The dissolution of lead from a test material into the extraction fluid depends on a number of variables including extraction fluid composition, temperature, time, agitation, solid/fluid ratio, and pH. Any alterations in these parameters should be evaluated to determine the optimum values for maximizing sensitivity, stability, and the correlation between in vitro and in vivo values. Additional discussion of these procedures is available in U.S. EPA (2007b) and Drexler and Brattin (2007).
7.1 Extraction Fluid
The extraction fluid for this procedure is 0.4 M glycine (free base, reagent grade glycine in deionized water), adjusted to a pH of 1.50±0.05 at 37°C using trace metal grade concentrated hydrochloric acid (HCl).1
7.2 Temperature
A temperature of 37°C should be used because this is approximately the temperature of gastric fluid in vivo.
7.3 Extraction Time
The time that ingested material is present in the stomach (i.e., stomach-emptying time) is about 1 hour for a child, particularly when a fasted state is assumed (see U.S. EPA 2007a, Appendix A). Thus, an extraction time of 1 hour should be used. It was found that allowing the bottles to stand at room temperature for up to 4 hours after rotation at 37°C caused no significant variation (<10%) in lead concentration.
7.4 pH
Human gastric pH values tend to range from about 1 to 4 during fasting (see U.S. EPA 2007b, Appendix A). For the IVBA, a pH of 1.5 should be used.
1 Most previous in vitro test systems have employed a more complex fluid intended to simulate gastric fluid. For example, Medlin (1997) used a fluid that contained pepsin and a mixture of citric, malic, lactic, acetic, and hydrochloric acids. When the bioaccessibility of a series of test substances were compared using 0.4 M glycine buffer (pH 1.5) with and without the inclusion of these enzymes and metabolic acids, no significant difference was observed (p=0.196). This indicates that the simplified buffer employed in the procedure is appropriate, even though it lacks some constituents known to be present in gastric fluid.
Page 5

7.5 Agitation
If the test material is allowed to accumulate at the bottom of the extraction apparatus, the effective surface area of contact between the extraction fluid and the test material may be reduced, and this may influence the extent of lead solubilization. Depending on which theory of dissolution is relevant (Nernst and Brunner, 1904, or Dankwerts, 1951), agitation will greatly affect either the diffusion layer thickness or the rate of production of fresh surface. Previous workers have noted problems associated with both stirring and argon bubbling methods (Medlin and Drexler, 1995; Drexler, 1997). Although no systematic comparison of agitation methods was performed, an end-over-end method of agitation is recommended.
7.6 Solid/Fluid Ratio and Mass of Test Material
A solid-to-fluid ratio of 1/100 (mass per unit volume) should be used to reduce the effects of metal dissolution as noted by Sorenson et al. (1971) when lower ratios (1/5 and 1/25) were used. Tests using Standard Reference Materials (SRM 2710a) showed no significant variation (within ±1% of control means) in the fraction of lead extracted with soil masses as low as 0.2 gram (g) per 100 mL. However, use of low masses of test material could introduce variability due to small scale heterogeneity in the sample and/or to weighing errors. Therefore, the final method employs 1.0 g of test material in 100 mL of extraction fluid.
In special cases, the mass of test material may need to be <1.0 g to avoid the potential for saturation of the extraction solution. Tests performed using lead acetate, lead oxide, and lead carbonate indicate that if the bulk concentration of a test material containing these relatively soluble forms of lead exceed approximately 50,000 ppm, the extraction fluid becomes saturated at 37°C and, upon cooling to room temperature and below, lead chloride crystals will precipitate. To prevent this from occurring, the concentration of lead in the test material should not exceed 50,000 ppm, or the mass of the test material should be reduced to 0.50±0.01 g.
7.7 Summary of Final Leaching Protocol
The extraction procedure is begun by placing 1.00±0.05 g of sieved test material (<250 µm) and 100±0.5 mL of the buffered extraction fluid (0.4 M glycine, pH 1.5) into a 125mL wide-mouth HDPE bottle. Care should be taken to ensure that static electricity does not cause soil particles to adhere to the lip or outside threads of the bottle; if necessary, an antistatic brush can be used to eliminate static electricity prior to adding the test substrate. The bottle should be tightly sealed and then shaken or inverted to ensure that there is no leakage and that no soil is caked on the bottom of the bottle.
Each bottle should be placed into the modified TCLP extractor (water temperature 37±2°C). Samples are extracted by rotating the samples end-over-end at 30±2 rpm for 1 hour. After 1 hour, the bottles should be removed, dried, and placed upright on the bench top to allow the soil to settle to the bottom. A 15-mL sample of supernatant fluid is removed directly from the extraction bottle into a disposable 20-cc syringe. After withdrawal of the sample into the syringe, a Luer-Lok attachment fitted with a 0.45-µm cellulose acetate disk filter (25 mm diameter) is attached, and the 15 mL aliquot of fluid is filtered through the attachment to remove any particulate matter. This filtered sample of extraction fluid is then analyzed for lead, as
Page 6

described below. If the total time elapsed for the extraction process exceeds 90 minutes, the test must be repeated.
As noted above, in some cases (mainly slag soils), the test material can increase the pH of the extraction buffer, and this could influence the results of the bioaccessibility measurement. To guard against this, the pH of the fluid should be measured at the end of the extraction step (just after a sample was withdrawn for filtration and analysis). If the pH is not within 0.5 pH units of the starting pH (1.5), the sample should be re-analyzed. If the second test also resulted in an increase in pH of >0.5 units, it is reasonable to conclude that the test material is buffering the solution. In these cases, the test should be repeated using manual pH adjustment during the extraction process, stopping the extraction at 5, 10, 15, and 30 minutes and manually adjusting the pH down to pH 1.5 at each interval by drop-wise addition of HCl.
7.8 Analysis of Extraction Fluid for Lead
The filtered samples of extraction fluid should be stored in a refrigerator at 4°C until they are analyzed (within 1 week of extraction). Once received by the laboratory, all media should be maintained under standard chain-of-custody. The samples should be analyzed for lead by ICPAES or ICP-MS (U.S. EPA Method 6010 or 6020, U.S. EPA, 1986). The method detection limit (MDL) in extraction fluid should be approximately 20 µg/L for Method 6010 and 0.1-0.3 µg/L for Method 6020.
8.0 Calculations
In order for an in vitro bioaccessibility test system to be useful in predicting the in vivo RBA of a test material, it is necessary to establish empirically that a strong correlation exists between the in vivo and the in vitro results across many different samples. Because there is measurement error not only in RBA but also in IVBA, linear fitting was also performed taking the error in both RBA and IVBA into account. There was nearly no difference in fit, so the results of the weighted linear regression were selected for simplicity (U.S. EPA, 2007b). This decision may be revisited as more data become available. Based on this decision, the currently preferred model is:
RBA = 0.878•IVBA – 0.028
It is important to recognize that use of this equation to calculate RBA from a given IVBA measurement will yield the “typical” RBA value expected for a test material with that IVBA, and the true RBA may be somewhat different (either higher or lower).
9.0 Quality Control/Quality Assurance
Recommended quality assurance for the extraction procedure are as follows:
• Reagent Blank — extraction fluid analyzed once per batch.
• Bottle Blank — extraction fluid only (no test soil) run through the complete procedure at a frequency of 1 in 20 samples (minimum of 1 per batch).
Page 7

• Blank Spike — extraction fluid spiked at 10 mg/L lead, and run through the complete procedure at a frequency of 1 in 20 samples (minimum of 1 per batch).
• Matrix Spikes — subsample of each material used for duplicate analyses used as a matrix spike. The matrix spike should be prepared at 10 mg/L lead and run through the extraction procedure at a frequency of 1 in 10 samples (minimum of 1 per batch).
• Duplicate Sample — duplicate sample extractions performed on 1 in 10 samples (minimum of 1 per batch).
• Control Soil — National Institute of Standards and Testing (NIST) Standard Reference Material (SRM) 2710 or 2711 (Montana Soil) used as a control soil. The SRM should be analyzed at a frequency of 1 in 20 samples (minimum 1 per batch).
Recommended control limits for these quality control samples:
Analysis Frequency Control Limits
Reagent blank once per batch <25 µg/L lead
Bottle blank 5%* <50 µg/L lead
Blank spike (10 mg/L) 5%* 85-115% recovery
Matrix spike (10 mg/L) 10%* 75-125% recovery
Duplicate sample 10%* ±20% RPD Control soil (NIST 2710 or 2711) 5%* ±10% RPD
RPD = Relative percent difference *Minimum of once per batch
10.0 Data Validation
NIST SRM 2710 or 2711 should be used as a control soil. To evaluate the precision of the in vitro bioaccessibility extraction protocol, replicate analyses of standard reference materials (NIST SRM 2710 or 2711) should be used. The SRM will be analyzed at a frequency of 1 in 20 samples (minimum 1 per batch).
The NIST SRM 2710 standard should yield a result of 75.5% for in vitro RBA (see Figure 3.3 of EPA, 2007b).
The NIST SRM 2711 standard should yield a result of 84.4% for in vitro RBA (see Figure 3.3 of EPA, 2007b).
11.0 Health and Safety
Page 8

When working with potentially hazardous materials, follow U.S. EPA, OSHA, or corporate health and safety procedures.
Page 9

12.0 References
Casteel, S.W., R.P. Cowart, C.P. Weis, G.M. Henningsen, E.Hoffman and J.W. Drexler. 1997. Bioavailability of lead in soil from the Smuggler Mountain site of Aspen Colorado. Fund. Appl. Toxicol. 36: 177-187.
Dankwerts, P.V. 1951. Significance of liquid-film coefficients in gas absorption. Ind. Eng. Chem. 43:1460.
Drexler, J.W. 1998. An in vitro method that works! A simple, rapid and accurate method for determination of lead bioavailability. EPA Workshop, Durham, NC.
Drexler JW and Brattin WJ. 2007. An In Vitro Procedure for Estimation of Lead Relative Bioavailability: With Validation. Human and Ecological Risk Assessment. 13: 383-401.
Medlin, E., and Drexler, J.W. 1995. Development of an in vitro technique for the determination of bioavailability from metal-bearing solids., International Conference on the Biogeochemistry of Trace Elements, Paris, France.
Medlin, E.A. 1997. An In Vitro method for estimating the relative bioavailability of lead in humans. Masters thesis. Department of Geological Sciences, University of Colorado, Boulder.
Nernst, W., and E. Brunner. 1904. Theorie der reaktionsgeschwindigkeit in heterogenen systemen. Z. Phys. Chem. 47:52.
Ruby, M.W., A. Davis, T.E. Link, R. Schoof, R.L. Chaney, G.B. Freeman, and P. Bergstrom. 1993. Development of an in vitro screening test to evaluate the in vivo bioaccessibility of ingested mine-waste lead. Environ. Sci. Technol. 27(13): 2870-2877.
Ruby, M.W., A. Davis, R. Schoof, S. Eberle. And C.M. Sellstone. 1996. Estimation of lead and arsenic bioavailability using a physiologically based extraction test. Environ. Sci. Technol. 30(2): 422-430.
U.S. EPA. 2000. Short Sheet: TRW Recommendations for Sampling and Analysis of Soil at Lead (Pb) Sites. OSWER 9285.7-38.
U.S. EPA. 2007a. Guidance for Evaluating the Oral Bioavailability of Metals in Soils for Use in Human Health Risk Assessment. OSWER 9285.7-80.
U.S. EPA. 2007b. Estimation of Relative Bioavailability of Lead in Soil and Soil-like Materials Using in Vivo and in Vitro Methods. OSWER 9285.7-77.
Weis, C.P., and J.M. LaVelle. 1991. Characteristics to consider when choosing an animal model for the study of lead bioavailability. In: Proceedings of the International Symposium on the Bioavailability and Dietary Uptake of Lead. Sci. Technol. Let. 3:113-119.
Weis, C.P., R.H., Poppenga, B.J. Thacker, and G.M. Henningsen. 1994. Design of pharmacokinetic and bioavailability studies of lead in an immature swine model. In: Lead in paint, soil, and dust: health risks, exposure studies, control measures, measurement methods, and quality assurance, ASTM STP 1226, M.E. Beard and S.A. Iske (Eds.). American Society for Testing and Materials, Philadelphia, PA, 19103-1187.
Page 10

058704 (44)
APPENDIX B
UNIVERSITY OF COLORADO'S RELATIVE BIOAVAILABILITY LEACHING PROCEDURE: RBALP AND TEST RESULTS

058704 (44) CONESTOGA-ROVERS & ASSOCIATES
TABLE OF CONTENTS Page
1.0 PURPOSE............................................................................................................................... B-1
2.0 SCOPE .................................................................................................................................... B-3
3.0 RELEVANT LITERATURE................................................................................................. B-4
4.0 SAMPLE PREPARATION .................................................................................................. B-5
5.0 APPARATUS AND MATERIALS..................................................................................... B-6 5.1 EQUIPMENT..................................................................................................... B-6 5.2 STANDARDS AND REAGENTS .................................................................. B-7
6.0 LEACHING PROCEDURE................................................................................................. B-8 6.1 QUALITY CONTROL/QUALITY ASSURANCE ...................................... B-9
7.0 CHAIN-OF-CUSTODY PROCEDURES........................................................................... B-11
8.0 DATA HANDLING AND VERIFICATION.................................................................... B-12
9.0 REFERENCES ....................................................................................................................... B-13
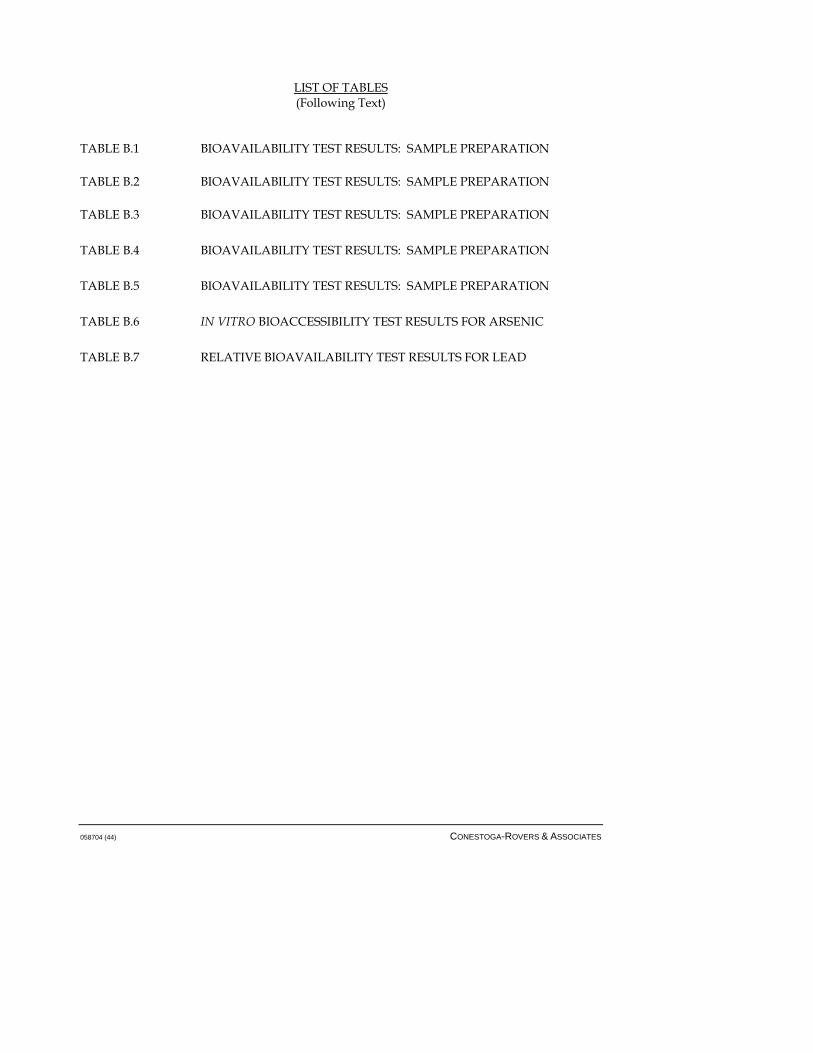
058704 (44) CONESTOGA-ROVERS & ASSOCIATES
LIST OF TABLES (Following Text)
TABLE B.1 BIOAVAILABILITY TEST RESULTS: SAMPLE PREPARATION TABLE B.2 BIOAVAILABILITY TEST RESULTS: SAMPLE PREPARATION TABLE B.3 BIOAVAILABILITY TEST RESULTS: SAMPLE PREPARATION TABLE B.4 BIOAVAILABILITY TEST RESULTS: SAMPLE PREPARATION TABLE B.5 BIOAVAILABILITY TEST RESULTS: SAMPLE PREPARATION TABLE B.6 IN VITRO BIOACCESSIBILITY TEST RESULTS FOR ARSENIC TABLE B.7 RELATIVE BIOAVAILABILITY TEST RESULTS FOR LEAD

058704 (44) B-1 CONESTOGA-ROVERS & ASSOCIATES
APPENDIX B THE IN-VITRO METHOD
http://www.colorado.edu/geolsci/legs/invitro1.html University of Colorado
Relative Bioavailability Leaching Procedure: RBALP Standard Operating Procedure
1.0 PURPOSE
An increasingly important property of contaminated media found at environmental sites is the bioavailabilty of individual contaminants. Bioavailability is the fraction of a contaminant that is absorbed by an organism via a specific exposure route. Many animal studies have been conducted to experimentally determine oral bioavailability of individual metals, particularly lead and arsenic. During the period 1989-1997, a juvenile swine model developed by USEPA Region VIII was used to measure the relative bioavailability of lead and arsenic in approximately 20 substrates (Weis and LaVelle 1991; Weis et al., 1994). The bioavailability determined was relative (RBA) to that of a soluble salt (i.e., lead acetate trihydrate or sodium arsenate). The tested media had a wide range of mineralogy, and produced a range of lead and arsenic RBA values. In addition to the swine studies, other animal models (e.g., rats and monkeys) have been used for measuring the RBA of lead and arsenic from soils. However, to-date the swine model is still considered the most appropriate for measuring child exposure. Several researchers have developed in vitro tests to measure the fraction of a chemical solubilized from a soil sample under simulated gastrointestinal conditions. The in vitro tests consist of an aqueous fluid, into which the contaminant is introduced. The solution than solubilizes the media under simulated gastric conditions. Once this procedure is complete, the solution is analyzed for lead and/or arsenic. The mass of the lead and/or

058704 (44) B-2 CONESTOGA-ROVERS & ASSOCIATES
arsenic found in the filtered extract is compared to the mass introduced into the test. The fraction liberated into the aqueous phase is defined as the bioaccessible fraction of lead or arsenic in that media (IVBA). To date, for lead-bearing materials tested in the USEPA swine studies, this in vitro assay has correlated well (R2 = 0.83, p = .0001) with relative bioavailability. Arsenic has yet to be fully validated but shows a promising correlation with in vivo results. It has been postulated that a simplified in vitro method could be used to estimate bioavailability of lead and arsenic. The method described in this SOP represents a simplified in vitro method, which has been formally validated by USEPA (2004) for lead.

058704 (44) B-3 CONESTOGA-ROVERS & ASSOCIATES
2.0 SCOPE
This procedure has been validated based on contaminated media from animal studies, to determine the correlation between in vitro and in vivo (IVIVC). Only samples from which mineralogy has been fully characterized by EMPA techniques and for which bioavailability results from acceptable animal models are available have been used for this study. A total of 19 substrates have been tested in validating the relative bioavailability leaching procedure (RBALP) for lead.

058704 (44) B-4 CONESTOGA-ROVERS & ASSOCIATES
3.0 RELEVANT LITERATURE
Background on the development of in vitro test systems for estimating lead and arsenic bioaccessability can be found in; Ruby et al. (1993, 1996); Medlin (1972); Medlin and Drexler, 1997; Drexler, 1998; and Drexler and Brattin, 2007. Background information for the USEPA swine studies may be found in (Weis and LaVelle, 1991; Weis et al., 1994; and Casteel et al., 1997) and in the USEPA Region VIII Center in Denver, Colorado.

058704 (44) B-5 CONESTOGA-ROVERS & ASSOCIATES
4.0 SAMPLE PREPARATION
All media are prepared for the in vitro assay by first drying (<40°C) all samples and then sieving to <250 μm. The <250 μm size fraction was used because this is the particle size representative of that which adheres to children's hands. Samples were thoroughly mixed prior to use to ensure homogenization. Samples are archived after the study completion and retained for further analysis for a period of six months unless otherwise requested. Prior to obtaining a subsample for testing in this procedure, each sample must be homogenized in its sample container by end-over-end mixing.
Deleted: is

058704 (44) B-6 CONESTOGA-ROVERS & ASSOCIATES
5.0 APPARATUS AND MATERIALS
5.1 EQUIPMENT
The main piece of equipment required for this procedure is the extraction device illustrated on Figure 1. The device can be purchased from the Department of Geological Sciences, University of Colorado. For further information contact Dr. John W. Drexler, at (303) 492-5251 or [email protected]. The device holds ten 125 mL, wide-mouth high-density polyethylene (HDPE) bottles. These are rotated within a Plexiglas tank by a TCLP extractor motor with a modified flywheel. The water bath must be filled such that the extraction bottles remained immersed. Temperature in the water bath is maintained at 37 +/- 2°C using an immersion circulatory heater (Fisher Scientific Model 730).
The 125-mL HDPE bottles must have an airtight screw-cap seal (Fisher Scientific #02-893-5C), and care must be taken to ensure that the bottles do not leak during the extraction procedure.

058704 (44) B-7 CONESTOGA-ROVERS & ASSOCIATES
5.2 STANDARDS AND REAGENTS
The leaching procedure for this method uses an aqueous extraction fluid at a pH value of 1.5. The pH 1.5 fluid is prepared as follows: Prepare 2 L of aqueous extraction fluid using ASTM Type II deionized (DI) water. The buffer is made up in the following manner. To 1.9 L of DI water, add 60.06 g glycine (free base, reagent grade), and bring the solution volume to 2 L (0.4M glycine). Place the mixture in the water bath at 37°C until the extraction fluid reaches 37°C. Standardize the pH meter ( one should use both a 2.0 and a 4.0 pH buffer for standardization) using temperature compensation at 37°C or buffers maintained at 37°C in the water bath. Add trace metal grade, concentrated hydrochloric acid (12.1N) until the solution pH reaches a value of 1.50 +/- 0.05 (approximately 60 mL). All reagents must be free of lead and arsenic, and the final fluid must be tested to confirm that lead and arsenic concentrations are less than one-fourth the project required detection limits (PRDLs) of 10 and 20 μg/L, respectively (e.g., less than 2 μg/L lead and 5 μg/L arsenic in the final fluid. Cleanliness of all materials used to prepare and/or store the extraction fluid and buffer is essential. All glassware and equipment used to prepare standards and reagents must be properly cleaned, acid washed, and finally, triple-rinsed with deionized water prior to use.

058704 (44) B-8 CONESTOGA-ROVERS & ASSOCIATES
6.0 LEACHING PROCEDURE
Add 1.00 +/- 0.5 g of test substrate (<250 μm) to the bottle, ensuring that static electricity does not cause soil particles to adhere to the lip or outside threads of the bottle. If necessary, use an anti-static brush to eliminate static electricity prior to adding the media. Record the mass of substrate. When ready to begin the test-- measure 100 +/- 0.5 mL of the extraction fluid, using a graduated cylinder or auto pipette and transfer to the 125 mL wide-mouth HPDE bottles. Hand-tighten each bottle top and shake/invert to ensure that no leakage occurs, and that no media is caked on the bottom of the bottle. Place the bottle into the modified TCLP extractor, making sure each bottle is secure and the lid(s) are tightly fastened. Fill the extractor with 125 mL bottles containing test materials or QA samples. The temperature of the water bath must be 37 +/- 2°C. Turn on the extractor and rotate end-over-end at 30 +/- 2 rpm for 1 hour. Record the start time of rotation. When extraction (rotation) is complete, immediately stop the extractor rotation and remove the bottles. Wipe them dry and place upright on the bench top. Draw extract directly from the reaction vessel into a disposable 20-cc syringe with a Luer-Lok attachment. Attach a 0.45 μm cellulose acetate disk filter (25-mm diameter) to the syringe, and filter the extract into a clean 15-mL polypropylene centrifuge tube (labelled with sample ID) or other appropriate sample vial for analysis. Record the time that the extract is filtered (i.e., extraction is stopped). If the total time elapsed is greater than 1 hour 30 minutes, the test must be repeated. Measure the pH of the remaining fluid in the extraction bottle. If the fluid pH is not within +/- 0.5 pH units of the starting pH, the test must be discarded and the sample reanalyzed as follows: If the pH has changed more than 0.5 units, the test will be re-run in an identical fashion. If the second test also results in a decrease in pH of greater than 0.5 s.u. this will be recorded, and the extract filtered for analysis. If the pH has increased by 0.5 s.u. or more, the test must be repeated, but the extractor must be stopped at specific intervals and the pH manually adjusted down to pH of 1.5 with drop-wise addition of HCl

058704 (44) B-9 CONESTOGA-ROVERS & ASSOCIATES
(adjustments at 5, 10, 15, and 30 minutes into the extraction, and upon final removal from the water bath [60 min]). Samples with rising pH values might better be run following the method of Medlin, 1997. Store filtered samples in a refrigerator at 4°C until they are analyzed. Analysis for lead and arsenic concentrations must occur within 1 week of extraction for each sample. Extracts are to be analyzed for lead and arsenic, as specified in EPA methods 6010B, 6020, or 7061A. 6.1 QUALITY CONTROL/QUALITY ASSURANCE
Quality Assurance for the extraction procedure will consist of the following quality control samples. Bottle Blank-extraction fluid only run through the complete procedure at a frequency of 1 in 20 samples. Blank Spike- extraction fluid will be spiked at concentrations of 2.5 mg/L lead and arsenic and run through the complete procedure at a frequency of 1 in 10 samples. Matrix Spike-a subsample of each material used will be spiked at concentrations of 2.5 mg/L lead and arsenic and run through the extraction procedure (frequency of 1 in 10 samples). Duplicate sample-duplicate sample extractions to be performed on 1 in 10 samples. National Institute of Standards and Testing (NIST) Standard Reference Material (SRM) 2710 or 2711 will be used as a control soil. The SRM will be analyzed at a frequency of 1 in 20 samples. Control limits for lead are listed below.
Analysis Frequency Control Limits
Bottle blank 5% - 1:20 < 25 μg/L lead Blank spike * 5% - 1:20 85-115% recovery Matrix spike * 10% - 1:10 75-125% recovery Duplicate sample 10% - 1:10 +/- 20% RPD** Control soil *** 5% - 1:20 +/- 10% RPD

058704 (44) B-10 CONESTOGA-ROVERS & ASSOCIATES
Spikes contained 2.5 mg/L lead and arsenic.
RPD = relative percent difference.
The National Institute of Standards and Technology (NIST) Standard Reference Material (SRM) 2710 or 2711.

058704 (44) B-11 CONESTOGA-ROVERS & ASSOCIATES
7.0 CHAIN-OF-CUSTODY PROCEDURES
All media once received by the Laboratory must be maintained under standard chain-of-custody.

058704 (44) B-12 CONESTOGA-ROVERS & ASSOCIATES
8.0 DATA HANDLING AND VERIFICATION
All sample weights, fluid concentrations, and calculations must be recorded on data sheets. Finally all key data will be entered into the attached EXCEL spreadsheet for final delivery and calculation of IVBA.

058704 (44) B-13 CONESTOGA-ROVERS & ASSOCIATES
9.0 REFERENCES
Casteel, S.W., R.P. Cowart, C.P. Weis, G.M. Henningsen, E.Hoffman and J.W. Drexler, 1997. Bioavailability of lead in soil from the Smuggler Mountain site of Aspen Colorado. Fund. Appl. Toxicol. 36: 177-187.
Drexler, J.W., 1998. An in vitro method that works! A simple, rapid and accurate method for determination of lead bioavailability. EPA Workshop, Durham, NC.
Drexler, J.W., and Brattin, W., 2007. An In Vitro Procedure for Estimation of Lead Relative Bioavailability: With Validation. Human and Ecological Risk Assessment. 13(2), pp. 383-401.
Medlin, E., and Drexler, J.W., 1995. Development of an in vitro technique for the determination of bioavailability from metal-bearing solids., International Conference on the Biogeochemistry of Trace Elements, Paris, France.
Medlin, E.A., 1997. An In Vitro method for estimating the relative bioavailability of lead in humans. Masters thesis. Department of Geological Sciences, University of Colorado, Boulder.
Ruby, M.W., A. Davis, T.E. Link, R. Schoof, R.L. Chaney, G.B. Freeman, and P. Bergstrom, 1993. Development of an in vitro screening test to evaluate the in vivo bioaccessability of ingested mine-waste lead. Environ. Sci. Technol. 27(13): 2870-2877.
Ruby, M.W., A. Davis, R. Schoof, S. Eberle, and C.M. Sellstone, 1996. Estimation of lead and arsenic bioavailbilty using a physiologically based extraction test. Environ. Sci. Technol. 30(2): 422-430.
USEPA, 2004. Estimation of relative Bioavailability of lead in Soil and Soil-Like Materials Using In Vivo and In Vitro Methods. OSWER-9285.7-77, June 2004, Washington, DC.
Weis, C.P., and J.M. LaVelle, 1991. Characteristics to consider when choosing an animal model for the study of lead bioavailability. In: Proceedings of the International Symposium on the Bioavailability and Dietary Uptake of Lead. Sci. Technol. Let. 3:113-119.
Weis, C.P., R.H., Poppenga, B.J. Thacker, and G.M. Henningsen, 1994. Design of parmacokinetic and bioavailability studies of lead in an immature swine model. In: Lead in paint, soil, and dust: health risks, exposure studies, control measures, measurement methods, and quality assurance, ASTM STP 1226, M.E. Beard and S.A. Iske (Eds.). American Society for Testing and Materials, Philadelphia, PA, 19103-1187.

Page 1 of 11
TABLE B.1
BIOAVAILABILITY TEST RESULTS: SAMPLE PREPARATIONBUCHANS, NEWFOUNDLAND
Laboratory of Environment and Geological Sciences, University of Colorado, Boulder
Project Name: Maxxam
Run #: 1 Date: 11/11/2009 Operator: drexler
Position in Rack
Sample Name Lab# Wt. Grams pH Start
Starting Time
Stopping Time pH Stop
1 EB8855-01R MAX-16 1.00737 1.552 12:30 1:30 1.6352 EB8953-02R MAX-17 0.99995 1.552 12:30 1:30 1.6473 EB8910-02R MAX-18 0.99968 1.552 12:30 1:30 1.6064 EB8908-02R MAX-11 1.00244 1.552 12:30 1:30 1.6455 EB8959-02R MAX-12 1.00258 1.552 12:30 1:30 1.656 EB8911-02R MAX-09 1.00575 1.552 12:30 1:30 1.6187 EB8975-02R MAX-13 0.99733 1.552 12:30 1:30 1.6838 EB8927-02R MAX-28 1.00187 1.552 12:30 1:30 1.6229 EB8928-02R MAX-29 1.00719 1.552 12:30 1:30 1.645
10 EB8916-02R MAX-30 1.00483 1.552 12:30 1:30 1.647
Run #: 2 Date: 11/12/2009 Operator: drexler
Position in Rack
Sample Name Lab# Wt. Grams pH Start
Starting Time
Stopping Time pH Stop
1 BLANK BLANK 1.561 1:50 2:50 1.6012 BLANK SPIK BLK SPK 1.561 1:50 2:50 1.5943 EB8844-01R MAX-23 0.9999 1.561 1:50 2:50 1.6634 EB8844-01R MAX-23 DUP 1.00548 1.561 1:50 2:50 1.6615 EB8844-01R MAX-23 SPK 1.00064 1.561 1:50 2:50 1.6596 EB8858-01R MAX-24 0.99841 1.561 1:50 2:50 1.6137 EB8856-01R MAX-25 0.99932 1.561 1:50 2:50 1.6258 EB8966-02R MAX-22 1.00116 1.561 1:50 2:50 1.6229 EB8965-02R MAX-27 1.00484 1.561 1:50 2:50 1.636
10 EB8969-O2R MAX-26 1.00773 1.561 1:50 2:50 1.624
CRA 058704 (44)

Page 2 of 11
TABLE B.2
BIOAVAILABILITY TEST RESULTS: SAMPLE PREPARATIONBUCHANS, NEWFOUNDLAND
Laboratory of Environment and Geological Sciences, University of Colorado, Boulder
Project Name: Maxxam
Run #: 3 Date: 11/17/2009 Operator: drexler
Position in Rack Sample Name Lab# Wt. Grams pH Start
Starting Time
Stopping Time pH Stop
1 EB8976-02R MAX-21 1.00494 1.536 1:15 2:15 1.6032 EB8929-02R MAX-40 0.99578 1.536 1:15 2:15 1.5993 EB8914-02R MAX-39 1.00287 1.536 1:15 2:15 1.5774 EB8906-02R MAX-38 0.9995 1.536 1:15 2:15 1.585 BLANK BLANK 1.536 1:15 2:15 1.5566 BLANK SPIKE BLANK SPK 1.536 1:15 2:15 1.5577 NIST 2711 NIST 2711 1.00007 1.536 1:15 2:15 1.6158 EB8920-02R MAX-37 1.00499 1.536 1:15 2:15 1.5959 EB8920-02R MAX-37 DUP 1.00589 1.536 1:15 2:15 1.601
10 EB8920-02R MAX-37 SPK 0.99808 1.536 1:15 2:15 1.603
Run #: 4 Date: 11/17/2009 Operator: drexler
Position in Rack Sample Name Lab# Wt. Grams pH Start
Starting Time
Stopping Time pH Stop
1 EB8925-02R MAX-36 0.99978 1.536 1:25 2:25 1.6002 EB8954-02R MAX-35 0.99487 1.536 1:25 2:25 1.613 EB8974-02R MAX-34 1.0006 1.536 1:25 2:25 1.6224 EB8932-02R MAX-19 0.99974 1.536 1:25 2:25 1.5885 EB8957-02R MAX-14 1.00727 1.536 1:25 2:25 1.586 EB8971-02R MAX-04 1.00035 1.536 1:25 2:25 1.5957 EB8907-02R MAX-31 0.99958 1.536 1:25 2:25 1.5868 EB8942-02R MAX-33 1.00055 1.536 1:25 2:25 1.5929 EB8915-02R MAX-32 1.00249 1.536 1:25 2:25 1.584
10 EB8973-02R MAX-05 1.00559 1.536 1:25 2:25 1.602
CRA 058704 (44)

Page 3 of 11
TABLE B.3
BIOAVAILABILITY TEST RESULTS: SAMPLE PREPARATIONBUCHANS, NEWFOUNDLAND
Laboratory of Environment and Geological Sciences, University of Colorado, Boulder
Project Name: Maxxam
Run #: 5 Date: 11/17/2009 Operator: drexler
Position in Rack Sample Name Lab# Wt. Grams pH Start
Starting Time
Stopping Time pH Stop
1 BLANK BLANK 1.541 2:20 3:20 1.5702 BLANK SPIKE BLANK SPK 1.541 2:20 3:20 1.563 EB8909-02R MAX-10 1.00133 1.541 2:20 3:20 1.5714 EB8909-02R MAX-10 DU 1.00171 1.541 2:20 3:20 1.5745 EB8909-02R MAX-10 SP 1.00643 1.541 2:20 3:20 1.5716 EB8972-02R MAX-03 0.99959 1.541 2:20 3:20 1.5727 EB8967-02R MAX-08 1.00591 1.541 2:20 3:20 1.5838 EB8951-02R MAX-07 1.00023 1.541 2:20 3:20 1.5839 EB8854-01R MAX-06 0.99986 1.541 2:20 3:20 1.591
10 EB8956-02R MAX-02 1.00277 1.541 2:20 3:20 1.597
Run #: 6 Date: 11/17/2009 Operator: drexler
Position in Rack Sample Name Lab# Wt. Grams pH Start
Starting Time
Stopping Time pH Stop
1 EB8958-02R MAX-15 1.00055 1.541 2:45 3:45 1.6022 EB8970-02R MAX-01 0.99655 1.541 2:45 3:45 1.613 EB8857-01R MAX-20 0.99863 1.541 2:45 3:45 1.5974 EB8964-02R MAX-41 1.00828 1.541 2:45 3:45 1.6165 EB8961-02R MAX-42 1.00339 1.541 2:45 3:45 1.66 BLANK BLANK 1.541 2:45 3:45 1.5727 BLANK SPIKE BLANK SPK 1.541 2:45 3:45 1.5698 NIST 2711 NIST 2711 1.00496 1.541 2:45 3:45 1.6299 EB8936-02R MAX-54 1.00749 1.541 2:45 3:45 1.637
10 EB8936-02R MAX-54 DU 0.99633 1.541 2:45 3:45 1.635
CRA 058704 (44)

Page 4 of 11
TABLE B.4
BIOAVAILABILITY TEST RESULTS: SAMPLE PREPARATIONBUCHANS, NEWFOUNDLAND
Laboratory of Environment and Geological Sciences, University of Colorado, Boulder
Project Name: Maxxam
Run #: 7 Date: 11/18/2009 Operator: drexler
Position in Rack Sample Name Lab# Wt. Grams pH Start
Starting Time
Stopping Time pH Stop
1 EB8936-02R MAX-54 SPK 1.00423 1.54 10:06 11:06 1.6442 EB8913-02R MAX-66 1.00025 1.54 10:06 11:06 1.6233 EB8955-02R MAX-65 0.99523 1.54 10:06 11:06 1.6324 EB8935-02R MAX-64 0.99847 1.54 10:06 11:06 1.6225 EB8952-02R MAX-63 1.00184 1.54 10:06 11:06 1.6196 EB8912-02R MAX-62 1.00756 1.54 10:06 11:06 1.6257 EB8962-02R MAX-61 1.00463 1.54 10:06 11:06 1.6338 EB8950-02R MAX-60 1.00131 1.54 10:06 11:06 1.6199 EB8917-02R MAX-59 1.00136 1.54 10:06 11:06 1.639
10 EB8969-02R MAX-58 0.99975 1.54 10:06 11:06 1.62
Run #: 8 Date: 11/18/2009 Operator: drexler
Position in Rack Sample Name Lab# Wt. Grams pH Start
Starting Time
Stopping Time pH Stop
1 EB8918-02R MAX-57 1.00028 1.54 10:14 11:14 1.6072 BLANK BLANK 1.54 10:14 11:14 1.583 BLANK SPIKE BLANK SPK 1.54 10:14 11:14 1.584 EB8905-02R MAX-56 1.00622 1.54 10:14 11:14 1.6045 EB8905-02R MAX-56 DUP 1.00167 1.54 10:14 11:14 1.6046 EB8905-02R MAX-56 SPK 1.00176 1.54 10:14 11:14 1.6087 EB8897-02R MAX-55 1.00285 1.54 10:14 11:14 1.5968 EB8934-02R MAX-53 1.00486 1.54 10:14 11:14 1.5979 EB8931-02R MAX-52 1.00041 1.54 10:14 11:14 1.616
10 EB8939-02R MAX-51 1.00001 1.54 10:14 11:14 1.609
CRA 058704 (44)

Page 5 of 11
TABLE B.5
BIOAVAILABILITY TEST RESULTS: SAMPLE PREPARATIONBUCHANS, NEWFOUNDLAND
Laboratory of Environment and Geological Sciences, University of Colorado, Boulder
Project Name: Maxxam
Run #: 9 Date: 11/18/2009 Operator: drexler
Position in Rack Sample Name Lab# Wt. Grams pH Start
Starting Time
Stopping Time pH Stop
1 EB8960-02R MAX-50 0.99766 1.543 11:50 12:50 1.6342 EB8963-02R MAX-49 1.0037 1.543 11:50 12:50 1.6153 EB8937-02R MAX-48 1.00708 1.543 11:50 12:50 1.5954 EB8930-02R MAX-47 1.00128 1.543 11:50 12:50 1.625 EB8919-02R MAX-46 1.00583 1.543 11:50 12:50 1.6066 EB8921-02R MAX-45 1.00441 1.543 11:50 12:50 1.6087 BLANK BLANK 1.543 11:50 12:50 1.5798 BLANK SPIKE BLANK SPK 1.543 11:50 12:50 1.589 NIST 2711 NIST 2711 1.00079 1.543 11:50 12:50 1.635
10 EB8926-02R MAX-44 1.00511 1.543 11:50 12:50 1.604
Run #: 10 Date: 11/18/2009 Operator: drexler
Position in Rack Sample Name Lab# Wt. Grams pH Start
Starting Time
Stopping Time pH Stop
1 EB8926-02R MAX-44 DUP 1.00172 1.543 11:50 12:50 1.6032 EB8926-02R MAX-44 SPK 0.9991 1.543 11:50 12:50 1.6073 EB8938-02R MAX-43 1.00313 1.543 11:50 12:50 1.596456789
10
CRA 058704 (44)

Page 6 of 11
TABLE B.6
IN VITRO BIOACCESSIBILITY TEST RESULTS FOR ARSENIC
BUCHANS, NEWFOUNDLAND
Sample ID As
in <
250u
bul
k so
il pp
b (u
g/kg
)(1)
mas
s so
il (g
)(2)
calc
As
#1 (µ
g A
s)(3
)
Bio
As
ppb
(ug/
l)(4)
solu
tion
am
t (l)(5
)
% R
elat
ive
As
Bioa
cces
sabi
lity(6
)
EB8855-01R MAX-16 9149.26439 1.00737 9.22 11.513525 0.1 12EB8953-02R MAX-17 5620.278138 0.99995 5.62 17.43122594 0.1 31EB8910-02R MAX-18 5190.178571 0.99968 5.19 21.69895 0.1 42EB8908-02R MAX-11 8338.9999 1.00244 8.36 16.89005 0.1 20EB8959-02R MAX-12 6300.454936 1.00258 6.32 14.486075 0.1 23EB8911-02R MAX-09 9801.10296 1.00575 9.86 20.924225 0.1 21EB8975-02R MAX-13 25440.03844 0.99733 25.37 44.701775 0.1 18EB8927-02R MAX-28 7607.785939 1.00187 7.62 32.7484 0.1 43EB8928-02R MAX-29 5186.709365 1.00719 5.22 17.391175 0.1 33EB8916-02R MAX-30 13055.54608 1.00483 13.12 38.34820638 0.1 29EB8844-01R MAX-23 18675.59515 0.9999 18.67 42.12775 0.1 23EB8858-01R MAX-24 16351.78937 0.99841 16.33 29.6913 0.1 18EB8856-01R MAX-25 11895.36544 0.99932 11.89 38.948575 0.1 33EB8966-02R MAX-22 17119.85209 1.00116 17.14 46.961825 0.1 27EB8965-02R MAX-27 10468.11603 1.00484 10.52 23.92310581 0.1 23EB8969-O2R MAX-26 11849.99441 1.00773 11.94 30.80565 0.1 26EB8976-02R MAX-21 9110.359666 1.00494 9.16 23.643125 0.1 26EB8929-02R MAX-40 7362.367073 0.99578 7.33 33.0923 0.1 45EB8914-02R MAX-39 17053.4046 1.00287 17.10 24.49765 0.1 14EB8906-02R MAX-38 26304.54286 0.9995 26.29 49.9472 0.1 19EB8920-02R MAX-37 28326.86562 1.00499 28.47 61.29495 0.1 22EB8925-02R MAX-36 9258.181126 0.99978 9.26 20.6131 0.1 22EB8954-02R MAX-35 7796.896673 0.99487 7.76 20.4687 0.1 26EB8974-02R MAX-34 3877.807893 1.0006 3.88 23.027525 0.1 59EB8932-02R MAX-19 25242.31184 0.99974 25.24 49.9491 0.1 20EB8957-02R MAX-14 5152.19647 1.00727 5.19 DL 0.1 EB8971-02R MAX-04 26074 1.00035 26.08 63.341725 0.1 24EB8907-02R MAX-31 27343.75081 0.99958 27.33 42.129175 0.1 15EB8942-02R MAX-33 12988.74879 1.00055 13.00 22.173475 0.1 17EB8915-02R MAX-32 12191.35006 1.00249 12.22 15.046575 0.1 12EB8973-02R MAX-05 5125.389451 1.00559 5.15 19.58425 0.1 38EB8909-02R MAX-10 12390.25808 1.00133 12.41 26.179625 0.1 21EB8972-02R MAX-03 17930.92912 0.99959 17.92 53.065575 0.1 30EB8967-02R MAX-08 7816.530369 1.00591 7.86 17.07815 0.1 22EB8951-02R MAX-07 18566.15637 1.00023 18.57 67.0757 0.1 36EB8854-01R MAX-06 18270.91418 0.99986 18.27 26.82135 0.1 15EB8956-02R MAX-02 4701.098611 1.00277 4.71 DL 0.1 EB8958-02R MAX-15 33484.83323 1.00055 33.50 91.834125 0.1 27
Laboratory of Environment and Geological Sciences, University of Colorado, Boulder
CRA 058704 (44)

Page 7 of 11
TABLE B.6
IN VITRO BIOACCESSIBILITY TEST RESULTS FOR ARSENIC
BUCHANS, NEWFOUNDLAND
Sample ID As
in <
250u
bul
k so
il pp
b (u
g/kg
)(1)
mas
s so
il (g
)(2)
calc
As
#1 (µ
g A
s)(3
)
Bio
As
ppb
(ug/
l)(4)
solu
tion
am
t (l)(5
)
% R
elat
ive
As
Bioa
cces
sabi
lity(6
)
Laboratory of Environment and Geological Sciences, University of Colorado, Boulder
EB8970-02R MAX-01 7483.074047 0.99655 7.46 19.975175 0.1 27EB8857-01R MAX-20 196412.7424 0.99863 196.14 286.17325 0.1 15EB8964-02R MAX-41 9124.443522 1.00828 9.20 11.77905 0.1 13EB8961-02R MAX-42 3621.346311 1.00339 3.63 16.808825 0.1 46EB8936-02R MAX-54 14673.01279 1.00749 14.78 34.420875 0.1 23EB8913-02R MAX-66 5593.322159 1.00025 5.59 10.42625 0.1 19EB8955-02R MAX-65 9814.718361 0.99523 9.77 10.871325 0.1 11EB8935-02R MAX-64 25016.50755 0.99847 24.98 71.601025 0.1 29EB8952-02R MAX-63 16131.33537 1.00184 16.16 49.4399 0.1 31EB8912-02R MAX-62 14510.17771 1.00756 14.62 29.327925 0.1 20EB8962-02R MAX-61 48144.77942 1.00463 48.37 105.0434 0.1 22EB8950-02R MAX-60 9519.124639 1.00131 9.53 14.554475 0.1 15EB8917-02R MAX-59 19149.15711 1.00136 19.18 39.3718 0.1 21EB8969-02R MAX-58 14182.44088 0.99975 14.18 28.001725 0.1 20EB8918-02R MAX-57 27140.15112 1.00028 27.15 60.593375 0.1 22EB8905-02R MAX-56 16038.7341 1.00622 16.14 16.19845 0.1 10EB8897-02R MAX-55 65753.20511 1.00285 65.94 48.6894 0.1 7EB8934-02R MAX-53 10418.26686 1.00486 10.47 17.739825 0.1 17EB8931-02R MAX-52 24238.75586 1.00041 24.25 40.114225 0.1 17EB8939-02R MAX-51 7725.599517 1.00001 7.73 DL 0.1 EB8960-02R MAX-50 7934.459808 0.99766 7.92 21.795375 0.1 28EB8963-02R MAX-49 51501.53605 1.0037 51.69 126.1068 0.1 24EB8937-02R MAX-48 4430.934016 1.00708 4.46 DL 0.1 EB8930-02R MAX-47 15058.16831 1.00128 15.08 36.51325 0.1 24EB8919-02R MAX-46 12770.95805 1.00583 12.85 12.3158 0.1 10EB8921-02R MAX-45 13985.62727 1.00441 14.05 27.248375 0.1 19EB8926-02R MAX-44 9767.917111 1.00511 9.82 DL 0.1 EB8938-02R MAX-43 7831.15513 1.00313 7.86 24.34755 0.1 31
Notes:
(2)imass soil (g) = mass of soil used to determine total arsenic concentration.(3)calc As #1 (µg As) = As in <250 u bulk soil ppb (µg/kg) × mass soil (g)/1000.(4)Bio As ppb (µg/L) = concentration of arsenic in the gastric simulation fluid.(5)solution amt (l) = amount of gastic simulation fluid used in the extraction.(6)% Relative As Bioaccessability = calc As #1 (µg As) ÷ (Bio As ppb (µg/L) × solution amt (l)) × 100
(1)As in <250 u bulk soil ppb (µg/kg) = concentration of arsenic in soil sample determined by USEPA SW846 sample preparation method 3050.
CRA 058704 (44)

Page 8 of 11
TABLE B.6
IN VITRO BIOACCESSIBILITY TEST RESULTS FOR ARSENIC
BUCHANS, NEWFOUNDLAND
Sample ID As
in <
250u
bul
k so
il pp
b (u
g/kg
)(1)
mas
s so
il (g
)(2)
calc
As
#1 (µ
g A
s)(3
)
Bio
As
ppb
(ug/
l)(4)
solu
tion
am
t (l)(5
)
% R
elat
ive
As
Bioa
cces
sabi
lity(6
)
Laboratory of Environment and Geological Sciences, University of Colorado, Boulder
QA/QC
BLANK BLANK 0.076551 0.1 BLANK SPIKE 2500 ppb BLK SPK 2658.42585 0.1 EB8844-01R MAX-23 DUP 18401.13065 1.00548 18.50 59.36075 0.1 32EB8844-01R Spike 2500 ppb MAX-23 SPK 2711.705175 0.1 BLANK BLANK 0.239989 BLANK SPIKE 2500 ppb BLANK SPK 2744.3429 NIST 2711 NIST 2711 105000 1.00007 105.01 611.114575 0.1 58EB8920-02R MAX-37 DUP 24442.86668 1.00589 24.59 65.45595 0.1 27EB8920-02R Spike 2500 ppb MAX-37 SPK 2610.92965 BLANK BLANK -0.042465 BLANK SPIKE 2500 ppb BLANK SPK 2614.85315 EB8909-02R MAX-10 DUP 13253.4681 1.00171 13.28 22.173 0.1 17EB8909-02R Spike 2500 ppb MAX-10 SPK 2564.646125 BLANK BLANK 0.1073975 BLANK SPIKE 2500 ppb BLANK SPK 2737.29865 NIST 2711 NIST 2711 105000 1.00496 105.52 566.73675 0.1 54EB8936-02R MAX-54 DUP 15059.8906 0.99633 15.00 38.830775 0.1 26EB8936-02R Spike 2500 ppb MAX-54 SPK 2550.891075 BLANK BLANK -0.161272 BLANK SPIKE 2500 ppb BLANK SPK 2590.018725 EB8905-02R MAX-56 DUP 15785.51659 1.00167 15.81 16.812625 0.1 11EB8905-02R Spike 2500 ppb MAX-56 SPK 2356.0057 BLANK BLANK 0.0839515 BLANK SPIKE 2500 ppb BLANK SPK 2666.663775 NIST 2711 NIST 2711 105000 1.00079 105.08 591.272875 0.1 56EB8926-02R MAX-44 DUP 9537.839502 1.00172 9.55 DL 0.1 EB8926-02R Spike 2500 ppb MAX-44 SPK 2332.778675
Note: Certified NIST value for bulk 2711, 2710 or 2710A are used to be consistent with historical traceability calculations.
CRA 058704 (44)

Page 9 of 11
TABLE B.7
RELATIVE BIOAVAILABILITY TEST RESULTS FOR LEADBUCHANS, NEWFOUNDLAND
Sample ID Pb in
<25
0u b
ulk
soil
ppb
(ug/
kg)(1
)
mas
s so
il (g
)(2)
calc
Pb
#1 (µ
g Pb
)(3)
Bio
Pb p
pb (u
g/l)(4
)
solu
tion
am
t (l)(5
)
% R
elat
ive
Pb
Bioa
cces
sabi
lity(6
)
%R
BA P
redi
cted
bas
ed o
n D
rexl
er a
nd B
ratt
in, 2
007(7
)
EB8855-01R MAX-16 277040 1.00737 279.08 1947 0.1 70 61EB8953-02R MAX-17 296945 0.99995 296.93 3108 0.1 105 92EB8910-02R MAX-18 159644 0.99968 159.59 1224 0.1 77 67EB8908-02R MAX-11 545532 1.00244 546.86 4632 0.1 85 74EB8959-02R MAX-12 126142 1.00258 126.47 1025 0.1 81 71EB8911-02R MAX-09 319909 1.00575 321.75 2886 0.1 90 79EB8975-02R MAX-13 8307325 0.99733 8285.14 40302 0.1 49 43EB8927-02R MAX-28 390979 1.00187 391.71 3444 0.1 88 77EB8928-02R MAX-29 165984 1.00719 167.18 1232 0.1 74 65EB8916-02R MAX-30 445569 1.00483 447.72 4549 0.1 102 89EB8844-01R MAX-23 1552071 0.9999 1551.92 13747 0.1 89 78EB8858-01R MAX-24 865680 0.99841 864.30 6992 0.1 81 71EB8856-01R MAX-25 432792 0.99932 432.50 3733 0.1 86 76EB8966-02R MAX-22 554794 1.00116 555.44 3888 0.1 70 61EB8965-02R MAX-27 612878 1.00484 615.84 5203 0.1 84 74EB8969-O2R MAX-26 683195 1.00773 688.48 5836 0.1 85 74EB8976-02R MAX-21 752825 1.00494 756.54 7042 0.1 93 82EB8929-02R MAX-40 738150 0.99578 735.04 8905 0.1 121 106EB8914-02R MAX-39 414367 1.00287 415.56 3489 0.1 84 74EB8906-02R MAX-38 1750596 0.9995 1749.72 15182 0.1 87 76EB8920-02R MAX-37 2010974 1.00499 2021.01 17404 0.1 86 76EB8925-02R MAX-36 587897 0.99978 587.77 5065 0.1 86 76EB8954-02R MAX-35 511954 0.99487 509.33 4682 0.1 92 81EB8974-02R MAX-34 36554 1.0006 36.58 294 0.1 80 71EB8932-02R MAX-19 1065723 0.99974 1065.45 8420 0.1 79 69EB8957-02R MAX-14 182439 1.00727 183.76 1599 0.1 87 76EB8971-02R MAX-04 1840307 1.00035 1840.95 14947 0.1 81 71EB8907-02R MAX-31 1508898 0.99958 1508.26 12090 0.1 80 70EB8942-02R MAX-33 673757 1.00055 674.13 5517 0.1 82 72EB8915-02R MAX-32 79911 1.00249 80.11 534 0.1 67 58EB8973-02R MAX-05 212135 1.00559 213.32 1591 0.1 75 65EB8909-02R MAX-10 220627 1.00133 220.92 1931 0.1 87 77EB8972-02R MAX-03 2100656 0.99959 2099.79 19010 0.1 91 79EB8967-02R MAX-08 160339 1.00591 161.29 1307 0.1 81 71EB8951-02R MAX-07 1742736 1.00023 1743.14 13320 0.1 76 67EB8854-01R MAX-06 1396664 0.99986 1396.47 12030 0.1 86 76EB8956-02R MAX-02 141844 1.00277 142.24 1285 0.1 90 79EB8958-02R MAX-15 4598918 1.00055 4601.45 22469 0.1 49 43EB8970-02R MAX-01 59856 0.99655 59.65 590 0.1 99 87
Laboratory of Environment and Geological Sciences, University of Colorado, Boulder
CRA 058704 (44)

Page 10 of 11
TABLE B.7
RELATIVE BIOAVAILABILITY TEST RESULTS FOR LEADBUCHANS, NEWFOUNDLAND
Sample ID Pb in
<25
0u b
ulk
soil
ppb
(ug/
kg)(1
)
mas
s so
il (g
)(2)
calc
Pb
#1 (µ
g Pb
)(3)
Bio
Pb p
pb (u
g/l)(4
)
solu
tion
am
t (l)(5
)
% R
elat
ive
Pb
Bioa
cces
sabi
lity(6
)
%R
BA P
redi
cted
bas
ed o
n D
rexl
er a
nd B
ratt
in, 2
007(7
)
Laboratory of Environment and Geological Sciences, University of Colorado, Boulder
EB8857-01R MAX-20 4717721 0.99863 4711.26 28976 0.1 62 54EB8964-02R MAX-41 660911 1.00828 666.38 5902 0.1 89 78EB8961-02R MAX-42 82533 1.00339 82.81 716 0.1 86 76EB8936-02R MAX-54 866561 1.00749 873.05 7552 0.1 86 76EB8913-02R MAX-66 358853 1.00025 358.94 3147 0.1 88 77EB8955-02R MAX-65 700176 0.99523 696.84 5349 0.1 77 67EB8935-02R MAX-64 1768452 0.99847 1765.75 15700 0.1 89 78EB8952-02R MAX-63 1431863 1.00184 1434.50 12410 0.1 87 76EB8912-02R MAX-62 402310 1.00756 405.35 2508 0.1 62 54EB8962-02R MAX-61 5031675 1.00463 5054.97 42635 0.1 84 74EB8950-02R MAX-60 302295 1.00131 302.69 2219 0.1 73 64EB8917-02R MAX-59 692641 1.00136 693.58 6414 0.1 92 81EB8969-02R MAX-58 969696 0.99975 969.45 7755 0.1 80 70EB8918-02R MAX-57 1215100 1.00028 1215.44 10469 0.1 86 76EB8905-02R MAX-56 276016 1.00622 277.73 2383 0.1 86 75EB8897-02R MAX-55 2430632 1.00285 2437.56 11871 0.1 49 43EB8934-02R MAX-53 509298 1.00486 511.77 4194 0.1 82 72EB8931-02R MAX-52 694099 1.00041 694.38 5182 0.1 75 65EB8939-02R MAX-51 322557 1.00001 322.56 2625 0.1 81 71EB8960-02R MAX-50 286628 0.99766 285.96 2448 0.1 86 75EB8963-02R MAX-49 3383336 1.0037 3395.85 26329 0.1 78 68EB8937-02R MAX-48 77087 1.00708 77.63 598 0.1 77 68EB8930-02R MAX-47 1134479 1.00128 1135.93 10807 0.1 95 84EB8919-02R MAX-46 323968 1.00583 325.86 2692 0.1 83 73EB8921-02R MAX-45 938288 1.00441 942.43 7473 0.1 79 70EB8926-02R MAX-44 92004 1.00511 92.47 830 0.1 90 79EB8938-02R MAX-43 348521 1.00313 349.61 2769 0.1 79 70
Notes:
(2)imass soil (g) = mass of soil used to determine total lead concentration.(3)calc Pb #1 (µg Pb) = Pb in <250u bulk soil ppb (µg/kg) × mass soil (g)/1000.(4)Bio Pb ppb (µg/L) = concentration of lead in the gastric simulation fluid.(5)solution amt (l) = amount of gastic simulation fluid used in the extraction.(6)% Relative Pb Bioaccessability = calc Pb #1 (µg Pb) ÷ (Bio Pb ppb (µg/L) × solution amt (l)) × 100
(1)Pb in <250 u bulk soil ppb (µg/kg) = concentration of lead in soil sample determined by USEPA SW846 sample preparation method 3050.
(7)%RBA Predicted based on Drexler and Brattin, 2007 = 0.7878 × IVBA – 0.028, where IVBA is % Relative Pb Bioaccessability. Correlation equation is the same as that presented in USEPA guidance (USEPA, 2008).
CRA 058704 (44)

Page 11 of 11
TABLE B.7
RELATIVE BIOAVAILABILITY TEST RESULTS FOR LEADBUCHANS, NEWFOUNDLAND
Sample ID Pb in
<25
0u b
ulk
soil
ppb
(ug/
kg)(1
)
mas
s so
il (g
)(2)
calc
Pb
#1 (µ
g Pb
)(3)
Bio
Pb p
pb (u
g/l)(4
)
solu
tion
am
t (l)(5
)
% R
elat
ive
Pb
Bioa
cces
sabi
lity(6
)
%R
BA P
redi
cted
bas
ed o
n D
rexl
er a
nd B
ratt
in, 2
007(7
)
Laboratory of Environment and Geological Sciences, University of Colorado, Boulder
QA/QC
BLANK BLANK -0.27835 0.1 BLANK SPIKE 2500 ppb BLK SPK 2563.235 0.1 EB8844-01R MAX-23 DUP 1552071 1.00548 1560.58 13802.91 0.1 88.448 77.6289322EB8844-01R Spike 2500 ppb MAX-23 SPK 16615.96 0.1 BLANK BLANK -0.44462 BLANK SPIKE 2500 ppb BLANK SPK 2545.403 NIST 2711 NIST 2711 1162000 1.00007 1162.08 10254.93 0.1 88.246 77.452157EB8920-02R MAX-37 DUP 2010974 1.00589 2022.82 16336.17 0.1 80.759 70.8787605EB8920-02R Spike 2500 ppb MAX-37 SPK 18438.2 BLANK BLANK -0.34627 BLANK SPIKE 2500 ppb BLANK SPK 2493.81 EB8909-02R MAX-10 DUP 220627.3 1.00171 221.00 1856.755 0.1 84.014 73.7365885EB8909-02R Spike 2500 ppb MAX-10 SPK 4406.634 BLANK BLANK -0.45037 BLANK SPIKE 2500 ppb BLANK SPK 2553.42 NIST 2711 NIST 2711 1162000 1.00496 1167.76 9888.108 0.1 84.676 74.3171809EB8936-02R MAX-54 DUP 866560.9 0.99633 863.38 7271.653 0.1 84.223 73.9198111EB8936-02R Spike 2500 ppb MAX-54 SPK 9748.702 BLANK BLANK 14.13961 BLANK SPIKE 2500 ppb BLANK SPK 2444.667 EB8905-02R MAX-56 DUP 276016.2 1.00167 276.48 2294.536 0.1 82.992 72.8388831EB8905-02R Spike 2500 ppb MAX-56 SPK 4806 BLANK BLANK -0.63592 BLANK SPIKE 2500 ppb BLANK SPK 2437.322 NIST 2711 NIST 2711 1162000 1.00079 1162.92 10051.89 0.1 86.437 75.8634876EB8926-02R MAX-44 DUP 92003.77 1.00172 92.16 992.9075 0.1 107.74 94.5633367EB8926-02R Spike 2500 ppb MAX-44 SPK 3287.842
Note: Certified NIST value for bulk 2711, 2710 or 2710A are used to be consistent with historical traceability calculations.
CRA 058704 (44)

058704 (44)
APPENDIX C
PROVISIONAL PEER-REVIEWED TOXICITY VALUE FOR IRON AND COMPOUNDS

Supported by ECFlex, Incorporated, underU.S. Environmental Protection Agency Contract No. EP-C-06-088.
Superfund Technical Support CenterNational Center for Environmental Assessment
U.S. Environmental Protection Agency26 West Martin Luther King Drive, MS-AG41
Cincinnati, Ohio 45268
Jon Reid/Director, Teresa Shannon/Administrator Hotline 513-569-7300, FAX 513-569-7159, E-Mail: [email protected]
January 11, 2010
Dale MarinoConestoga Rovers & AssociatesAccepted Requestor
ASSISTANCE REQUESTED: PPRTV for Iron.
ENCLOSED INFORMATION: Attachment 1: PROVISIONAL PEER REVIEWED TOXICITY VALUES FOR IRON (CASRN 7439-89-6) AND COMPOUNDS Derivation of a Carcinogenicity Assessment
Attachment 2: PROVISIONAL PEER REVIEWED TOXICITY VALUES FOR IRON (CASRN 7439-89-6) AND COMPOUNDS Derivation of an Inhalation RfC
Attachment 3: PROVISIONAL PEER REVIEWED TOXICITY
INFORMATION FOR IRON (CASRN 7439-89-6) AND COMPOUNDS Derivation of Subchronic and Chronic Oral RfDs

Supported by ECFlex, Incorporated, underU.S. Environmental Protection Agency Contract No. EP-C-06-088.
BE ADVISED: Unless specifically indicated to have been peer reviewed, it is to be noted that theattached Provisional Toxicity Value Paper(s) have not been through the U.S. EPA’sformal review process; therefore, they do not represent a U.S. EPA verified assessment.
If you have any questions regarding this transmission, please contact the STSC at (513) 569-7300.
Attachments (3 )
cc: STSC files

7-29-05
Provisional Peer Reviewed Toxicity Values for
Iron and Compounds(CASRN 7439-89-6)
Derivation of a Carcinogenicity Assessment
Superfund Health Risk Technical Support CenterNational Center for Environmental Assessment
Office of Research and DevelopmentU.S. Environmental Protection Agency
Cincinnati, OH 45268

i
Acronyms and Abbreviations
bw body weight
cc cubic centimeters
CD Caesarean Delivered
CERCLA Comprehensive Environmental Response, Compensation and Liability Act
of 1980
CNS central nervous system
cu.m cubic meter
DWEL Drinking Water Equivalent Level
FEL frank-effect level
FIFRA Federal Insecticide, Fungicide, and Rodenticide Act
g grams
GI gastrointestinal
HEC human equivalent concentration
Hgb hemoglobin
i.m. intramuscular
i.p. intraperitoneal
i.v. intravenous
IRIS Integrated Risk Information System
IUR inhalation unit risk
kg kilogram
L liter
LEL lowest-effect level
LOAEL lowest-observed-adverse-effect level
LOAEL(ADJ) LOAEL adjusted to continuous exposure duration
LOAEL(HEC) LOAEL adjusted for dosimetric differences across species to a human
m meter
MCL maximum contaminant level
MCLG maximum contaminant level goal
MF modifying factor
mg milligram
mg/kg milligrams per kilogram
mg/L milligrams per liter
MRL minimal risk level

ii
MTD maximum tolerated dose
MTL median threshold limit
NAAQS National Ambient Air Quality Standards
NOAEL no-observed-adverse-effect level
NOAEL(ADJ) NOAEL adjusted to continuous exposure duration
NOAEL(HEC) NOAEL adjusted for dosimetric differences across species to a human
NOEL no-observed-effect level
OSF oral slope factor
p-IUR provisional inhalation unit risk
p-OSF provisional oral slope factor
p-RfC provisional inhalation reference concentration
p-RfD provisional oral reference dose
PBPK physiologically based pharmacokinetic
ppb parts per billion
ppm parts per million
PPRTV Provisional Peer Reviewed Toxicity Value
RBC red blood cell(s)
RCRA Resource Conservation and Recovery Act
RDDR Regional deposited dose ratio (for the indicated lung region)
REL relative exposure level
RfC inhalation reference concentration
RfD oral reference dose
RGDR Regional gas dose ratio (for the indicated lung region)
s.c. subcutaneous
SCE sister chromatid exchange
SDWA Safe Drinking Water Act
sq.cm. square centimeters
TSCA Toxic Substances Control Act
UF uncertainty factor
:g microgram
:mol micromoles
VOC volatile organic compound

7-29-05
1
PROVISIONAL PEER REVIEWED TOXICITY VALUES FOR IRON (CASRN 7439-89-6) AND COMPOUNDS
Derivation of a Carcinogenicity Assessment
Background
On December 5, 2003, the U.S. Environmental Protection Agency's (EPA's) Office ofSuperfund Remediation and Technology Innovation (OSRTI) revised its hierarchy of humanhealth toxicity values for Superfund risk assessments, establishing the following three tiers as thenew hierarchy:
1. EPA's Integrated Risk Information System (IRIS).
2. Provisional Peer-Reviewed Toxicity Values (PPRTV) used in EPA's SuperfundProgram.
3. Other (peer-reviewed) toxicity values, including:
< Minimal Risk Levels produced by the Agency for Toxic Substances and DiseaseRegistry (ATSDR),
< California Environmental Protection Agency (CalEPA) values, and< EPA Health Effects Assessment Summary Table (HEAST) values.
A PPRTV is defined as a toxicity value derived for use in the Superfund Program whensuch a value is not available in EPA's Integrated Risk Information System (IRIS). PPRTVs aredeveloped according to a Standard Operating Procedure (SOP) and are derived after a review ofthe relevant scientific literature using the same methods, sources of data, and Agency guidancefor value derivation generally used by the EPA IRIS Program. All provisional toxicity valuesreceive internal review by two EPA scientists and external peer review by three independentlyselected scientific experts. PPRTVs differ from IRIS values in that PPRTVs do not receive themulti-program consensus review provided for IRIS values. This is because IRIS values aregenerally intended to be used in all EPA programs, while PPRTVs are developed specifically forthe Superfund Program.
Because science and available information evolve, PPRTVs are initially derived with athree-year life-cycle. However, EPA Regions (or the EPA HQ Superfund Program) sometimesrequest that a frequently used PPRTV be reassessed. Once an IRIS value for a specific chemicalbecomes available for Agency review, the analogous PPRTV for that same chemical is retired. Itshould also be noted that some PPRTV manuscripts conclude that a PPRTV cannot be derivedbased on inadequate data.

7-29-05
2
Disclaimers
Users of this document should first check to see if any IRIS values exist for the chemicalof concern before proceeding to use a PPRTV. If no IRIS value is available, staff in the regionalSuperfund and RCRA program offices are advised to carefully review the information providedin this document to ensure that the PPRTVs used are appropriate for the types of exposures andcircumstances at the Superfund site or RCRA facility in question. PPRTVs are periodicallyupdated; therefore, users should ensure that the values contained in the PPRTV are current at thetime of use.
It is important to remember that a provisional value alone tells very little about theadverse effects of a chemical or the quality of evidence on which the value is based. Therefore,users are strongly encouraged to read the entire PPRTV manuscript and understand the strengthsand limitations of the derived provisional values. PPRTVs are developed by the EPA Office ofResearch and Development’s National Center for Environmental Assessment, Superfund HealthRisk Technical Support Center for OSRTI. Other EPA programs or external parties who maychoose of their own initiative to use these PPRTVs are advised that Superfund resources will notgenerally be used to respond to challenges of PPRTVs used in a context outside of the SuperfundProgram.
Questions Regarding PPRTVs
Questions regarding the contents of the PPRTVs and their appropriate use (e.g., onchemicals not covered, or whether chemicals have pending IRIS toxicity values) may be directedto the EPA Office of Research and Development’s National Center for EnvironmentalAssessment, Superfund Health Risk Technical Support Center (513-569-7300), or OSRTI.
INTRODUCTION
A cancer assessment for iron is not listed on IRIS (U.S. EPA, 2005a), the HEAST (U.S.EPA, 1997), or the Drinking Water Standards and Health Advisories list (U.S. EPA, 2000), andwas not considered by the CRAVE Work Group (U.S. EPA, 1995). The CARA list (1991, 1994)includes a Health Effects Assessment for Iron and Compounds (U.S. EPA, 1984) that assignediron and its compounds to weight-of-evidence Group C, possible human carcinogen. Thisassessment was based on conflicting evidence of lung tumors following occupational inhalationexposure to ferric oxide (mixed exposure), and injection-site tumors in one patient and in micetreated with iron-dextran. IARC (1972, 1987) assigned ferric oxide to Group 3, not classifiableas to its carcinogenicity to humans based on inadequate data in humans (increased incidence oflung cancer following occupational exposure to iron dusts in mixtures) and apparently negative

7-29-05
3
evidence for carcinogenicity in mice, hamsters and guinea pigs exposed by inhalation orintratracheal instillation. For ferric oxide dust and fume, the ACGIH (1991, 2001) lists an A4notation, not classifiable as a human carcinogen; this is based on mixed exposure studies inhumans and primarily negative studies in animals. In March, 2004, a literature search was alsoconducted using TOXLINE, MEDLINE, Chemical Abstracts and Biological Abstracts databases.
Iron has not been the subject of a toxicological review by ATSDR (2001) or the WHO(2001). Monographs by IARC (1972, 1984, 1987), a toxicity review on iron (Grimsley, 2001),and the NTP (2001a, 2001b) management status report and chemical repository summary wereconsulted for information relevant to the carcinogenicity of iron and inorganic iron compounds. The following computer searches, performed in April, 1993, were screened to identify additionalpertinent studies not discussed in review documents: TOXLINE (1983-April, 1993),CANCERLIT (1990 - April, 1993), MEDLINE (1991 - April, 1993), TSCATS, RTECS, andHSDB. Update literature searches were conducted in September, 2001 in TOXLINE (1992-September, 2001), CANCERLIT (1992- September, 2001), MEDLINE (1992-September, 2001),TSCATS, RTECS, DART/ETICBACK, EMIC/EMICBACK, HSDB, GENETOX, and CCRIS.
REVIEW OF PERTINENT LITERATURE
Human Studies
Oral Exposure
Because iron is an essential element, the NAS (2001) has established guidelines for dailydietary intakes, based on gender, age, and physiological status, that are designed to avoid adverseeffects of deficiency and excess. Individuals of northern European descent who are affected byhereditary hemochromatosis, an autosomal, recessive disorder, are not protected by theseguidelines. These individuals exhibit excessive absorption of dietary iron, which results inabnormally high accumulations of iron in liver and brain tissues. When the liver consequentlydevelops cirrhosis, the risk of developing primary hepatocellular carcinoma increasessignificantly. It is not clear whether these findings are relevant to excess iron intake by thegeneral population.
Bird et al. (1996) investigated the association between plasma ferritin and iron intake andthe development of adenomatous polyps, which are intermediate markers for colorectal cancer. The study population consisted of men and women between the ages of 50 and 75 years old whounderwent routine screening by flexible sigmoidoscopy at one of two medical centers during1991-1993. Individuals with cancer, inflammatory bowel disease, or familial polyposis wereexcluded. Cases (300 men and 167 women) were subjects diagnosed for the first time with one

7-29-05
4
or more histologically confirmed adenomatous polyps. Controls (331 men and 167 women) hadno history of polyps and none discovered at sigmoidoscopy. Cases and controls were matched bysex, age (± 5 years), date of sigmoidoscopy (± 3 months), and medical center. Plasma ferritinlevels, hematocrit, and certain nutritional indicators (carotenoids, ascobate, folate) weremeasured in blood samples drawn 6 months after examination. Iron intakes for the yearpreceding sigmoidoscopy were estimated by means of a semiquantitative food frequencyquestionnaire. After controlling for possible confounding factors, subjects with high plasmaferritin levels (>289 :g/L) had a multivariate-adjusted odds ratio for colorectal polyps of 1.5(95% confidence interval (C.I. = 1.0-2.3) compared to subjects with low/normal levels (73-141:g/L). The pattern for iron intake was U-shaped. Compared with subjects consuming anadequate amount of iron (11.6-13.6 mg/day), multivariate-adjusted odds ratios for colorectalpolyps in men were 1.6 (95% C.I. = 1.1-2.4) for intakes below 11.6 mg/day and 1.4 (95% C.I.= 0.9-2.0) for intakes above 27.3 mg/day. The highest odds ratio of 2.1 (95% C.I. = 1.3-3.5) wasfound after further adjustment for smoking for men at the lowest level of iron intake. Theassociation between iron intake and colorectal polyps disappeared when exposure group class ofreaction was based on dietary intake alone (i.e., high iron supplementation ignored). The authorsconcluded that there was a weak positive association between iron exposure and colorectalpolyps that may increase the risk of colorectal cancer but note that some factor insupplementation may have been responsible for the effect.
Inhalation Exposure
Most studies of cancer incidence following occupational exposure to iron dust areexcluded from consideration because of confounding exposures to silica, radon daughters, soot,asbestos, or other types of metals in the study populations (U.S. EPA, 1984; IARC, 1972, 1984,1987).
A case-control study examined cancer incidence in a Swedish male worker population(1958-1971) with a high exposure to iron oxides from the production of sulfuric acid from pyrite
2 2 3(FeS ) (Axelson and Sjöberg, 1979). The workers were exposed to iron oxide (Fe O ) along with1-2% copper, 0.01-0.1% arsenic, nickel and cobalt as impurities. Exposure in the workroom wasestimated as approximately 50-100 mg/m , and the particle size as 25% below 10 :m and 5-10%3
below 5 :m. No cases of siderosis were known from the plant. The Swedish National CancerRegister was consulted for locating cases of cancer that could have been caused byenvironmental exposure; the study examined cancers of the stomach, liver, lung, kidney, andbladder, and hematological malignancies. Each cancer case was matched with two controls fromthe local population register by matching for sex, age, and residency in the same or adjacentneighborhood block. Company files were searched to determine the length of exposure; thosewith less than 5 months of exposure were considered to be nonexposed. The study found noassociation between exposure to iron oxides and any of the selected types of cancer.

7-29-05
The authors characterized the treatment as a ‘maximum dose of 3 mg’. It is not clear whether the hamsters1
received lower doses on some occasions.
5
Animal Studies Oral Exposure
3 2Groups of F344 rats (50 per sex per group) were given ferric chloride (FeCl 6H O) in.
drinking water at concentrations of 0, 0.25, or 0.5% (weight/volume) for 104 weeks, and thengiven distilled water for an 8 week recovery period (Sato et al., 1992). The intake of ferricchloride was reported to be 0, 169.7, or 319.7 mg/kg-day for males and 0, 187.9, or 336.0 mg/kg-day for females. The iron intakes were 0, 58.4, or 110 mg/kg-day in males and 0, 64.6, or 115.6mg/kg-day in females. Rats were observed daily for clinical signs and mortality. Body weightswere measured once a week for 13 weeks and every fourth week thereafter. All rats dyingprematurely and survivors at week 112 were examined for gross and microscopic neoplastic andnon-neoplastic lesions. There were dose-related decreases in drinking water intake and terminalbody weight in both sexes. These may have been related to reduced palatability. Survival inboth sexes was not significantly affected by exposure to ferric chloride. No increases in tumorincidence were observed in rats exposed to ferric chloride for two years.
Inhalation Exposure
2 3Groups of male Syrian hamsters (132 per group) were exposed to filtered air or Fe O(analytic grade) dust at a concentration of 40 mg/m , 6 hours/day, 5 days/week for life3
(Nettesheim et al., 1975). The particle size had a geometric mean diameter of 0.11 :m. Inaddition, two satellite groups (15 hamsters per treatment ) were sacrificed, three animals at atime, at 2, 4, 8, 12, and 104 weeks, so that the accumulation of iron in the lung from inhaled
2 3Fe O could be compared to background iron concentrations in heme. The animals wereexamined daily, before and after each exposure, for clinical signs; body weights were recordedmonthly. All animals except those cannibalized (<2%) were necropsied. Histological analyseswere performed for the major organs, including heart, trachea, lungs, and nasal cavities. Examination of the satellite groups demonstrated a gradual increase in iron accumulation in the
2 3lung, reaching a total of 10 mg per lung at 104 weeks. Exposure to Fe O had no effect onsurvival or body weight gain and did not increase the incidence of tumors. The authors
2 3concluded that inhalation of Fe O was not carcinogenic to hamsters.
Groups of Syrian golden hamsters (24 per sex per group) received intratracheal
2 3instillations of 0 or 3 mg of Fe O dust in 0.2 ml of saline once a week for 15 weeks, and then1
were observed up to week 120 (Stenbäck et al., 1976). Analysis by the sedimentation methoddemonstrated that 98% of the particles were less than 10 :m in diameter. Animals were weighed

7-29-05
6
weekly and autopsied. Organs with gross lesions and the larynx, trachea, bronchi, and lungswere examined histologically. Treatment with ferric oxide had no effect on survival and did notaffect body weight except during the final weeks of survival (data not shown). Treatment did notinduce tumors of the respiratory tract and the incidence of forestomach papillomas in thetreatment group was less than in the control group.
Other Studies
Genotoxicity
Genotoxicity assays of inorganic iron salts were primarily negative in bacteria, but weremore often positive in mammalian systems. Iron did not induce reverse mutations in Salmonellatyphimurium strains TA98, TA102, TA1535, or TA1537, with or without activation (Wong,1988). Ferric chloride and ferrous sulfate tested negative in strains TA98, TA100, TA1535,TA1537, and TA1538 with or without metabolic activation (Shimizu et al., 1985; Dunkel et al.,1999). Ferrous sulfate also tested negative in strains TA97 and TA102, with or withoutactivation (Fujita et al., 1994), but positive in TA1537 and TA1538 (U.S. EPA, 1984). Ferrousand ferric chloride did not induce DNA repair in Bacillus subtilis (rec assay) (Leifer et al., 1981). Ferrous sulfate increased the frequency of mutations at the TK locus of mouse L5178Ylymphoma cells, with or without metabolic activation, but only at high concentrations that werelikely to be cytotoxic; ferric chloride only increased the frequency of TK mutations when testedwith metabolic activation (Dunkel et al., 1999). Ferrous sulfate did not induce sister chromatidexchanges in vitro (Ohno et al., 1982). DNA-protein cross-links were generated in mammaliancells cultured in the presence of ferrous iron (Altman et al., 1995). Single- and double-strandDNA breaks were produced in supercoiled plasmid DNA (Toyokuni and Sagripanti, 1992) and inisolated rat liver nuclei (U.S. EPA, 1984) treated with ferrous or ferric chloride. No breakagewas detected electrophoretically in Chinese hamster ovary cell DNA treated with ferrous chloride(U.S. EPA, 1984). In a model of oxidative damage within cells, ferrous sulfate, in the presenceof hydrogen peroxide, was demonstrated to induce double-strand breaks and intra-strand cross-links in DNA in vitro (Lloyd and Phillips, 1999).
Cell transformation
Iron compounds have yielded variable results in studies of cell transformation in vitro.
3 4Particles of magnetite (Fe O ) induced transformation of cultured a Chinese hamster lung cell
79line (V ), but only at cytotoxic concentrations (Elias et al., 1995). Ferrous chloride and ferroussulfate induced cell transformation in viral-enhanced Syrian hamster embryo (SA7/SHE) cells(U.S. EPA, 1984).

7-29-05
7
Mechanistic Studies
Adverse effects of iron are thought to be related to the formation of reactive oxygenspecies via the Fenton reaction (Henle and Linn, 1997). Hydrogen peroxide can react withferrous ion, resulting in the conversion to ferric ion and the production of hydroxyl radicals.Ferric ion can also react with hydrogen peroxide, producing superoxide radical. Reactive oxygenspecies may react with DNA. However, because of the complex homeostatic mechanismsinvolved in iron transport and metabolism, unbound ferrous iron is not likely to be present exceptin conditions of excessive iron intake.
PROVISIONAL WEIGHT-OF-EVIDENCE CLASSIFICATION
U.S. EPA (1984) classified iron and its compounds, including ferric dextran, as possiblehuman carcinogens (Group C). This assessment was based on reports associating an increasedincidence of lung cancer with exposure to hematite dust (confounded by coincident exposures totobacco, alcohol, silica, soot, and fumes of other metals), inconsistent reports of lung tumors inanimals exposed by inhalation or tracheal instillation to ferric oxide, and reports of injection sitetumors in one patient injected with iron dextran and in mice injected with iron dextran orsaccharated iron oxide. The current PPRTV assessment excludes organic forms of iron andstudies in which the levels of impurities are significant.
Results of the case-control study by Bird et al. (1996) provide evidence of a weakassociation between elevated iron intake or high plasma ferritin (a measure of body stores) andthe prevalence of adenomatous colorectal polyps, a possible precursor to colorectal cancer. Weaknesses of this study include the 6-month period between examination and ferritinmeasurements, and the possible recall errors affecting the dietary questionnaire for the previousyear. In addition, the association between iron intake and colorectal polyps was stronger at lowiron intake and not related to dietary (i.e., environmental) intake. Although the associationbetween cirrhotic hereditary hemochromatosis and hepatocellular carcinoma is well established,the evidence for dietary iron intake and hepatic cancer in the general population wascharacterized by the NAS (2001) as inconclusive. In a chronic rat assay, Sato et al. (1992) foundno evidence of carcinogenicity of ferric chloride ingested in drinking water at concentrations upto 0.5%. In summary, the evidence for carcinogenicity of ingested inorganic iron compounds inhumans and animals is inadequate.
Evidence from the case-control study of Axelson and Sjöberg (1979) suggests thatinhaled iron oxide may not be carcinogenic to humans. However, uncertainty remains becauselevels of exposure were not measured, the durations of exposure were not reported, andindividuals exposed for up to 5 months were categorized as ‘nonexposed.’ In addition, the lackof reported cases of siderosis in the workplace suggests that the exposure levels may have been

7-29-05
8
lower than estimated. Thus, the evidence for carcinogenicity of inhaled iron oxide in humans isconsidered inadequate. Results of the study of Nettesheim et al. (1975) indicate that chronicinhalation exposure to iron oxide at a concentration of 40 mg/m is not carcinogenic to hamsters. 3
This finding is supported by the negative results for carcinogenicity of iron oxide administeredby intratracheal instillation to hamsters for 15 weeks (Stenbäck et al., 1976). However, as bothhamster studies used single exposure concentrations, the possibility of carcinogenicity at higherexposure levels cannot be disregarded.
Following the U.S. EPA (2005b) guidelines for carcinogen risk assessment, the availabledata are inadequate for an assessment of the human carcinogenic potential of inhaled iron oxideor ingested iron chloride.
QUANTITATIVE ESTIMATES OF CARCINOGENIC RISK
Derivation of quantitative estimates of cancer risk for ingested or inhaled iron or ironoxide is precluded by the absence of adequate data demonstrating carcinogenicity.
REFERENCES
ACGIH (American Conference of Government Industrial Hygienists). 1991. Iron Oxide, CAS:1309-37-1. Documentation of the Threshold Limit Values and Biological Exposure Indices, 6thEd. ACGIH. Cincinnati, OH. p. 803-805.
ACGIH (American Conference of Government Industrial Hygienists). 2001. Threshold limitvalues (TLV) for chemical substances and physical agents and biological exposure indices. ACGIH, Cincinnati, OH. p. 36.
Altman, S.A., T.H. Zastawny, L. Randers-Eichhorn et al. 1995. Formation of DNA-proteincross-links in cultured mammalian cells upon treatment with iron ions. Free Radic. Biol. Med. 19: 897-902.
ATSDR (Agency for Toxic Substances and Disease Registry). 2001. Internet HazDat -Toxicological Profile Query. Examined September, 2001. Online athttp://www.atsdr.cdc.gov/gsql/toxprof.script.
Axelson, O. and A. Sjöberg. 1979. Cancer incidence and exposure to iron oxide dust. J. Occup.Med. 21: 419-422.

7-29-05
9
Bird, C.L., J.S. Witte, M.E. Swendseid, et al. 1996. Plasma ferritin, iron intake, and the risk ofcolorectal polyps. Am. J. Epidemiol. 144: 34-41.
Dunkel, V.C., R.H. San, H.E. Seifried and P. Whittaker. 1999. Genotoxicity of iron compoundsin Salmonella typhimurium and L5178Y mouse lymphoma cells. Environ. Molec. Mutagen. 33:28-41.
Elias, Z., O. Poirot, O. Schneider et al. 1995. Cytotoxic and transforming effects of some iron-containing minerals in Syrian hamster embryo cells. Cancer Detect. Prevent. 19: 405-414.
Fujita, H., N. Aoki and M. Sasaki. 1994. Mutagenicity test of food additives with Salmonellatyphimurium TA97 and TA102. IX. Tokyo-Toritsu Eisei Kenkyusho Kenkyu Nenpo. 45: 191-199.
Grimsley, L.F. 2001. Iron and cobalt. In: Patty’s Toxicology, 5 Edition, vol. 3, E. Bingham, B.th
Cohrssen and C.H. Powell, Eds. John Wiley and Sons, New York. p. 169-193.
Henle, E.S. and S. Linn. 1997. Formation, prevention, and repair of DNA damage byiron/hydrogen peroxide. J. Biol. Chem. 272: 19095-19098.
IARC (International Agency for Research on Cancer). 1972. Haematite and iron oxide. IARCMonographs on the Evaluation of the Carcinogenic Risk of Chemicals to Man. Vol. 1, pp. 29-39. Lyon, France.
IARC (International Agency for Research on Cancer). 1984. Iron and steel founding. Polynuclear Aromatic Compounds, Part 3, Industrial Exposures in Aluminium Production, CoalGasification, Coke Production, and Iron and Steel Founding. IARC Monographs on theEvaluation of the Carcinogenic Risk of Chemicals to Man. Vol. 34, pp. 133-190. Lyon, France.
IARC (International Agency for Research on Cancer). 1987. Haematite and ferric oxide. Overall Evaluations of Carcinogenicity: An Updating of IARC Monographs Volumes 1 to 42. IARC Monographs on the Evaluation of the Carcinogenic Risk of Chemicals to Man. Suppl. 7,pp. 216-219. Lyon, France.
Leifer, Z., T. Kada, M. Mandel et al. 1981. An evaluation oftests using DNA repair-deficientbacteria fro predicting genotoxicity and carcinogenicity. A report of the U.S. EPA’s Gene-Toxprogram. Mutat. Res. 87: 211-297.
Lloyd, D.R. and D.H. Phillips. 1999. Oxidative DNA damage mediated by copper(II), iron(II)and nickel(II) Fenton reactions: evidence for site-specific mechanisms in the formation of

7-29-05
10
double-strand breaks, 8-hydroxydeoxyguanosine and putative intrastrand cross-links. Mutat.Res. 424: 23-36.
NAS (National Academy of Sciences). 2001. Iron. In: Dietary Reference Intakes for VitaminA, Vitamin K, Arsenic, Boron, Chromium, Copper, Iodine, Iron, Manganese, Molybdenum,Nickel, Silicon, Vanadium, and Zinc. Institute of Medicine, Food and Nutrition Board. NationalAcademy Press, Washington, DC. p. 233-310. Online at:http://books.nap.edu/books/0309072794/html/.
Nettesheim, P., D.A. Creasia and T.J. Mitchell. 1975. Carcinogenic and cocarcinogenic effectsof inhaled synthetic smog and ferric oxide particles. J. Natl. Cancer Inst. 55: 159-169.
NTP (National Toxicology Program). 2001a. Status Report for Ferric Chloride. ExaminedSeptember, 2001. Online at: http://ntp-server.niehs.nih.gov/htdocs/Results_Status/Resstatf/7705080.Html.
NTP (National Toxicology Program). 2001b. NTP Chemical Repository Report for FerricChloride. Examined September, 2001. Online at: http://ntp-server.niehs.nih.gov/htdocs/CHEM_H&S/NTP_Chem7/Radian7705-08-0.html.
Ohno, H., F. Hanaoka and M.A. Yamada. 1982. Inducibility of sister-chromatid exchanges byheavy-metal ions. Mutat. Res. 104: 141-145.
Sato, M., F. Furukawa, K. Toyoda et al. 1992. Lack of carcinogenicity of ferric chloride in F344rats. Food Chem. Toxicol. 30: 837-842.
Shimizu, H., Y. Suzuki, N. Takemura et al. 1985. Results of microbial mutation test for forty-three industrial chemicals. Sangyo Igaku. 27: 400-419.
Stenbäck, F., J. Rowland and A. Sellakumar. 1976. Carcinogenicity of benzyo(a)pyrene anddusts in the hamster lung (instilled intratracheally with titanium oxide, aluminum oxide, carbonand ferric oxide. Oncology. 33: 29-34.
Toyokuni, S. and Sagripanti, J.L. 1992. Iron-mediated DNA damage: sensitive detection ofDNA strand breakage catalyzed by iron. J. Inorg. Biochem. 47: 241-248.
U.S. EPA. 1984. Health Effects Assessment for Iron (and Compounds). Prepared by the Officeof Health and Environmental Assessment, Environmental Criteria and Assessment Office,Cincinnati, OH for the Office of Emergency and Remedial Response, Washington, DC. EPA540/1-86-054.

7-29-05
11
U.S. EPA. 1991. Chemical Assessments and Related Activities. Office of Health andEnvironmental Assessment, Washington, DC. April, 1991. OHEA-I-127.
U.S. EPA. 1994. Chemical Assessments and Related Activities. Office of Health andEnvironmental Assessment, Washington, DC. December, 1994. OHEA-I-127.
U.S. EPA. 1995. Quarterly Status Report of RfD/RfC Work Group (as of 9/01/95). Office ofResearch and Development. National Center for Environmental Assessment, Cincinnati, OH.
U.S. EPA. 1997. Health Effects Assessment Summary Tables. Annual Update. FY-1997. Prepared by the National Center for Environmental Assessment, Cincinnati, OH, for the Officeof Research and Development, Office of Emergency and Remedial Response, Washington, D.C. July 1997. EPA-540-R-97-036. PB97-921199.
U.S. EPA. 2000. Drinking Water Standards and Health Advisories. Office of Water,Washington, DC. Summer, 2000. EPA 822-B-00-001. Examined September, 2001.http://www.epa.gov/ost/drinking/standards/dwstandards.pdf
U.S. EPA. 2005a. Integrated Risk Information System (IRIS). Office of Research andDevelopment, National Center for Environmental Assessment, Washington, DC. Online. http://www.epa.gov/iris/
U.S. EPA. 2005b. Guidelines for Carcinogen Risk Assessment. Office of Research andDevelopment, National Center for Environmental Assessment, Washington, DC.EPA/630/P-03/001F.
WHO (World Health Organization). 2001. Online catalogs for the Environmental HealthCriteria series. Examined September, 2001. Online at http://www.who.int/dsa/cat97/zehc.htmand http://www.who.int/dsa/justpub/add.htm.
Wong, P.K. 1988. Mutagenicity of heavy metals. Bull. Environ. Contam. Toixicol. 40: 597-603.

6-16-05
Provisional Peer Reviewed Toxicity Values for
Iron and Compounds(CASRN 7439-89-6)
Derivation of a Chronic Inhalation RfC
Superfund Health Risk Technical Support CenterNational Center for Environmental Assessment
Office of Research and DevelopmentU.S. Environmental Protection Agency
Cincinnati, OH 45268

i
Acronyms and Abbreviations
bw body weight
cc cubic centimeters
CD Caesarean Delivered
CERCLA Comprehensive Environmental Response, Compensation and Liability Act
of 1980
CNS central nervous system
cu.m cubic meter
DWEL Drinking Water Equivalent Level
FEL frank-effect level
FIFRA Federal Insecticide, Fungicide, and Rodenticide Act
g grams
GI gastrointestinal
HEC human equivalent concentration
Hgb hemoglobin
i.m. intramuscular
i.p. intraperitoneal
i.v. intravenous
IRIS Integrated Risk Information System
IUR inhalation unit risk
kg kilogram
L liter
LEL lowest-effect level
LOAEL lowest-observed-adverse-effect level
LOAEL(ADJ) LOAEL adjusted to continuous exposure duration
LOAEL(HEC) LOAEL adjusted for dosimetric differences across species to a human
m meter
MCL maximum contaminant level
MCLG maximum contaminant level goal
MF modifying factor
mg milligram
mg/kg milligrams per kilogram
mg/L milligrams per liter
MRL minimal risk level

ii
MTD maximum tolerated dose
MTL median threshold limit
NAAQS National Ambient Air Quality Standards
NOAEL no-observed-adverse-effect level
NOAEL(ADJ) NOAEL adjusted to continuous exposure duration
NOAEL(HEC) NOAEL adjusted for dosimetric differences across species to a human
NOEL no-observed-effect level
OSF oral slope factor
p-IUR provisional inhalation unit risk
p-OSF provisional oral slope factor
p-RfC provisional inhalation reference concentration
p-RfD provisional oral reference dose
PBPK physiologically based pharmacokinetic
ppb parts per billion
ppm parts per million
PPRTV Provisional Peer Reviewed Toxicity Value
RBC red blood cell(s)
RCRA Resource Conservation and Recovery Act
RDDR Regional deposited dose ratio (for the indicated lung region)
REL relative exposure level
RfC inhalation reference concentration
RfD oral reference dose
RGDR Regional gas dose ratio (for the indicated lung region)
s.c. subcutaneous
SCE sister chromatid exchange
SDWA Safe Drinking Water Act
sq.cm. square centimeters
TSCA Toxic Substances Control Act
UF uncertainty factor
:g microgram
:mol micromoles
VOC volatile organic compound

6-16-05
1
PROVISIONAL PEER REVIEWED TOXICITY VALUES FOR IRON (CASRN 7439-89-6) AND COMPOUNDS
Derivation of an Inhalation RfC
Background
On December 5, 2003, the U.S. Environmental Protection Agency's (EPA's) Office ofSuperfund Remediation and Technology Innovation (OSRTI) revised its hierarchy of humanhealth toxicity values for Superfund risk assessments, establishing the following three tiers as thenew hierarchy:
1. EPA's Integrated Risk Information System (IRIS).
2. Provisional Peer-Reviewed Toxicity Values (PPRTV) used in EPA's SuperfundProgram.
3. Other (peer-reviewed) toxicity values, including:
< Minimal Risk Levels produced by the Agency for Toxic Substances and DiseaseRegistry (ATSDR),
< California Environmental Protection Agency (CalEPA) values, and< EPA Health Effects Assessment Summary Table (HEAST) values.
A PPRTV is defined as a toxicity value derived for use in the Superfund Program whensuch a value is not available in EPA's Integrated Risk Information System (IRIS). PPRTVs aredeveloped according to a Standard Operating Procedure (SOP) and are derived after a review ofthe relevant scientific literature using the same methods, sources of data, and Agency guidancefor value derivation generally used by the EPA IRIS Program. All provisional toxicity valuesreceive internal review by two EPA scientists and external peer review by three independentlyselected scientific experts. PPRTVs differ from IRIS values in that PPRTVs do not receive themulti-program consensus review provided for IRIS values. This is because IRIS values aregenerally intended to be used in all EPA programs, while PPRTVs are developed specifically forthe Superfund Program.
Because science and available information evolve, PPRTVs are initially derived with athree-year life-cycle. However, EPA Regions (or the EPA HQ Superfund Program) sometimesrequest that a frequently used PPRTV be reassessed. Once an IRIS value for a specific chemicalbecomes available for Agency review, the analogous PPRTV for that same chemical is retired. Itshould also be noted that some PPRTV manuscripts conclude that a PPRTV cannot be derivedbased on inadequate data.

6-16-05
2
Disclaimers
Users of this document should first check to see if any IRIS values exist for the chemicalof concern before proceeding to use a PPRTV. If no IRIS value is available, staff in the regionalSuperfund and RCRA program offices are advised to carefully review the information providedin this document to ensure that the PPRTVs used are appropriate for the types of exposures andcircumstances at the Superfund site or RCRA facility in question. PPRTVs are periodicallyupdated; therefore, users should ensure that the values contained in the PPRTV are current at thetime of use.
It is important to remember that a provisional value alone tells very little about theadverse effects of a chemical or the quality of evidence on which the value is based. Therefore,users are strongly encouraged to read the entire PPRTV manuscript and understand the strengthsand limitations of the derived provisional values. PPRTVs are developed by the EPA Office ofResearch and Development’s National Center for Environmental Assessment, Superfund HealthRisk Technical Support Center for OSRTI. Other EPA programs or external parties who maychoose of their own initiative to use these PPRTVs are advised that Superfund resources will notgenerally be used to respond to challenges of PPRTVs used in a context outside of the SuperfundProgram.
Questions Regarding PPRTVs
Questions regarding the contents of the PPRTVs and their appropriate use (e.g., onchemicals not covered, or whether chemicals have pending IRIS toxicity values) may be directedto the EPA Office of Research and Development’s National Center for EnvironmentalAssessment, Superfund Health Risk Technical Support Center (513-569-7300), or OSRTI.
INTRODUCTION
An RfC for iron is not listed on IRIS (U.S. EPA, 2001) and was not considered by theRfD/RfC Work Group (U.S. EPA, 1995). The HEAST (U.S. EPA, 1997) reported that dataregarding iron were inadequate for quantitative risk assessment. The CARA list (1991, 1994a)includes a Health Effects Assessment for Iron and Compounds (U.S. EPA, 1984) that reportednegative epidemiological studies (no association between excess mortality or respiratory diseasesand occupational exposure to iron oxide dusts) and no available subchronic or chronic inhalationstudies in animals. In March, 2004, a literature search was also conducted using TOXLINE,MEDLINE, Chemical Abstracts and Biological Abstracts data bases.
Occupational exposure limits have been established for soluble iron salts and iron oxide,as well as for organic iron compounds not covered in this issue paper. The ACGIH (1991a,
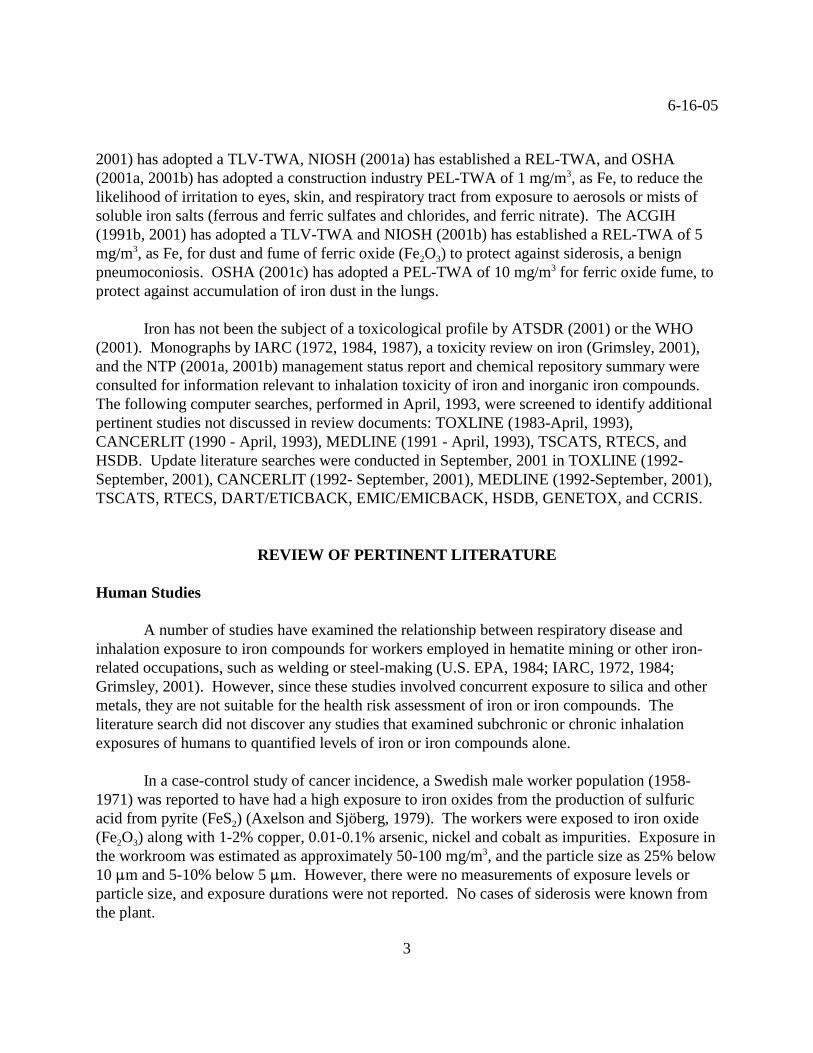
6-16-05
3
2001) has adopted a TLV-TWA, NIOSH (2001a) has established a REL-TWA, and OSHA(2001a, 2001b) has adopted a construction industry PEL-TWA of 1 mg/m , as Fe, to reduce the3
likelihood of irritation to eyes, skin, and respiratory tract from exposure to aerosols or mists ofsoluble iron salts (ferrous and ferric sulfates and chlorides, and ferric nitrate). The ACGIH(1991b, 2001) has adopted a TLV-TWA and NIOSH (2001b) has established a REL-TWA of 5
2 3mg/m , as Fe, for dust and fume of ferric oxide (Fe O ) to protect against siderosis, a benign3
pneumoconiosis. OSHA (2001c) has adopted a PEL-TWA of 10 mg/m for ferric oxide fume, to3
protect against accumulation of iron dust in the lungs.
Iron has not been the subject of a toxicological profile by ATSDR (2001) or the WHO(2001). Monographs by IARC (1972, 1984, 1987), a toxicity review on iron (Grimsley, 2001),and the NTP (2001a, 2001b) management status report and chemical repository summary wereconsulted for information relevant to inhalation toxicity of iron and inorganic iron compounds. The following computer searches, performed in April, 1993, were screened to identify additionalpertinent studies not discussed in review documents: TOXLINE (1983-April, 1993),CANCERLIT (1990 - April, 1993), MEDLINE (1991 - April, 1993), TSCATS, RTECS, andHSDB. Update literature searches were conducted in September, 2001 in TOXLINE (1992-September, 2001), CANCERLIT (1992- September, 2001), MEDLINE (1992-September, 2001),TSCATS, RTECS, DART/ETICBACK, EMIC/EMICBACK, HSDB, GENETOX, and CCRIS.
REVIEW OF PERTINENT LITERATURE
Human Studies
A number of studies have examined the relationship between respiratory disease andinhalation exposure to iron compounds for workers employed in hematite mining or other iron-related occupations, such as welding or steel-making (U.S. EPA, 1984; IARC, 1972, 1984;Grimsley, 2001). However, since these studies involved concurrent exposure to silica and othermetals, they are not suitable for the health risk assessment of iron or iron compounds. Theliterature search did not discover any studies that examined subchronic or chronic inhalationexposures of humans to quantified levels of iron or iron compounds alone.
In a case-control study of cancer incidence, a Swedish male worker population (1958-1971) was reported to have had a high exposure to iron oxides from the production of sulfuric
2acid from pyrite (FeS ) (Axelson and Sjöberg, 1979). The workers were exposed to iron oxide
2 3(Fe O ) along with 1-2% copper, 0.01-0.1% arsenic, nickel and cobalt as impurities. Exposure inthe workroom was estimated as approximately 50-100 mg/m , and the particle size as 25% below3
10 :m and 5-10% below 5 :m. However, there were no measurements of exposure levels orparticle size, and exposure durations were not reported. No cases of siderosis were known fromthe plant.

6-16-05
4
Animal Studies
Inhalation studies for iron compounds in animals include a chronic study of hamsters
2 3exposed to ferric oxide (Fe O ) dust (Nettesheim et al., 1975) and a 2-month study in rabbitsexposed to aerosols of ferric chloride (Johansson et al., 1992).
In a cancer study, groups of male Syrian hamsters (132 per group) were exposed to
2 3filtered air or Fe O (analytic grade) dust at a concentration of 40 mg/m , 6 hours/day, 53
days/week for life (Nettesheim et al., 1975). The particle size had a geometric mean diameter of0.11 :m. In addition, two satellite groups (15 hamsters per treatment ) were sacrificed, threeanimals at a time, at 2, 4, 8, 12, and 104 weeks, so that the accumulation of iron in the lung from
2 3inhaled Fe O could be compared to background iron concentrations in heme. The animals wereexamined daily, before and after each exposure, for clinical signs, and body weights wererecorded monthly. All animals except those cannibalized (<2%) were necropsied. Histologicalanalyses were performed on the major organs, including heart, trachea, lungs, and nasal cavities. Examination of the satellite groups demonstrated the gradual increase in iron accumulation in thelung, reaching a total of 10 mg per lung at 104 weeks. Histological examination revealed irondeposits in the lungs and tracheal and bronchial lymph nodes of all exposed animals. Diffuse andfocal alveolar fibrosis was also frequently observed in the lungs of treated animals. Results forthe histological endpoints were not reported quantitatively. In this study, 40 mg/m is a LOAEL3
2 3for respiratory effects (alveolar fibrosis) in hamsters exposed to Fe O dust.
Groups of 8 male rabbits (strain not reported) were exposed to aerosols of 0, 1.4, or 3.1
3mg/m of iron as FeCl 6 hours/day, 5 days/week for 2 months (Johansson et al., 1992). At3
termination, the upper left lung lobe was examined by light microscopy, pieces of the lower leftlung were analyzed by electron microscopy or used for phospholipid analysis, and the right lungwas lavaged to obtain macrophages for morphological and functional analyses. The mass medianaerodynamic diameter of the aerosols was ~1 :m as measured with an impactor. Treatment hadno effect on survival. Lungs were spotted with black in 7/8 high-iron rabbits, in 2/8 low-ironrabbits, and in 0/8 controls. The absolute weight of the left lower lobe of the lung wassignificantly elevated compared to controls in the high-iron group. Exposure-relatedhistopathology was observed in the lungs. In the high-exposure group, the lungs contained nakedgranulomas [large nodules ($1 mm) of densely packed granular macrophages], accumulations ofgranular macrophages in terminal bronchioles, and foci of interstitial lymphocytic inflammatoryreaction. Small granulomas were observed in one low-iron and one control rabbit. Accumulations of normal and granular macrophages were observed in the alveoli of exposedrabbits. In the control group, normal lung tissue contained some small accumulations ofmacrophages with occasional small inflammatory reaction. The high exposure group had asignificantly higher density of alveolar type II cells than the controls. Ultrastructural analysis ofmacrophages showed a significantly higher number of abnormal cells, cells with enlargedlysosomes, and black inclusions in cells in both exposed groups; the high-iron group had higher

6-16-05
The authors provided no further information regarding dosage. It is not clear whether animals were given 1
amounts lower than 3 mg on some occasions.
5
percentages of cells with laminar inclusions or with smooth cell surfaces. In functional tests,macrophages from the high-exposure group showed significantly elevated phagocytic activity,but no significant increase in oxidative metabolic activity (superoxide generation). Totalphospholipids were elevated in the high-exposure group, but, as indicated by the lack of increasein phosphatidyl cholines or the percentage of 1,2-dipalmitoylphosphatidylcholine, the amount ofsurfactant was unchanged. In this study, the low concentration of 1.4 mg/m is a NOAEL and the3
high concentration of 3.1 mg/m is a LOAEL for adverse lung effects (nodular granulomas $13
mm in diameter, abnormal macrophages) in rabbits exposed to ferric chloride aerosols. Becauseof its focus on alveolar macrophage effects, this study provided no information regarding clinicalsigns of toxicity, body weight changes, clinical biochemistry, nasopharyngeal effects or histologyof any other tissue besides the lung.
Other Studies
In a cancer study, groups of Syrian golden hamsters (24 per sex per group) received
2 3intratracheal instillations of 0 or “a maximum dose” of 3 mg of Fe O dust in 0.2 ml of saline1
once a week for 15 weeks, and then were observed up to week 120 (Stenbäck et al., 1976). Analysis by the sedimentation method demonstrated that 98% of the particles were less than 10:m in diameter. Animals were weighed weekly and autopsied. Organs with gross lesions andthe larynx, trachea, bronchi, and lungs were examined histologically. Treatment with ferricoxide had no effect on survival and no effect on body weight except during the final weeks ofsurvival (data not shown). Deposited iron oxide was grossly visible as dark patches on the lungsurface. Histologically, dust accumulations surrounded by cellular infiltrates were observed inthe peribronchial region. Interstitial fibrosis was observed occasionally, but distinctinflammatory changes were rare. Results for the nonneoplastic endpoints were not reportedquantitatively.
FEASIBILITY OF DERIVING A PROVISIONAL RfC FOR IRON
No adequate human or animal inhalation data are available for exposure to iron orinorganic iron compounds. The epidemiological study of Axelson and Sjöberg (1979) did notprovide quantitative measures of exposure and did not characterize noncancer endpoints.Although Nettesheim et al. (1975) reported diffuse and focal alveolar fibrosis in the lungs ofhamsters chronically exposed to iron oxide by inhalation at a concentration of 40 mg/m , the lack3
of incidence data prevents an evaluation of the significance of these findings. The subchronicstudy of Johansson et al. (1992), in which rabbits were exposed to aerosols of ferric chloride for

6-16-05
6
2 months, demonstrated a NOAEL of 1.4 mg/m and a LOAEL of 3.1 mg/m for respiratory3 3
effects (granuloma nodules greater than 1 mm diameter in the lungs). However, this study doesnot meet the minimum standards for an inhalation bioassay as stipulated by the U.S. EPA(1994b) guidelines for derivation of an inhalation reference concentration. Inadequacies of thestudy include relatively small group sizes, relatively short study duration, and the failure toexamine a sufficient array of endpoints. Thus this study is inadequate for the purposes ofderiving a p-RfC for iron. Consequently, the available data are insufficient for derivation of a p-RfC.
REFERENCES
ACGIH (American Conference of Government Industrial Hygienists). 1991a. Iron Salts(Soluble). Documentation of the Threshold Limit Values and Biological Exposure Indices, 6thEd. ACGIH. Cincinnati, OH. p. 808-809.
ACGIH (American Conference of Government Industrial Hygienists). 1991b. Iron Oxide, CAS:1309-37-1. Documentation of the Threshold Limit Values and Biological Exposure Indices, 6thEd. ACGIH. Cincinnati, OH. p. 803-805.
ACGIH (American Conference of Government Industrial Hygienists). 2001. Threshold limitvalues (TLV) for chemical substances and physical agents and biological exposure indices. ACGIH, Cincinnati, OH. p. 36.
ATSDR (Agency for Toxic Substances and Disease Registry). 2001. Internet HazDat -Toxicological Profile Query. Examined September, 2001. Online athttp://www.atsdr.cdc.gov/gsql/toxprof.script.
Axelson, O. and A. Sjöberg. 1979. Cancer incidence and exposure to iron oxide dust. J. Occup.Med. 21: 419-422.
Grimsley, L.F. 2001. Iron and cobalt. In: Patty’s Toxicology, 5 Edition, vol. 3, E. Bingham, B.th
Cohrssen and C.H. Powell, Eds. John Wiley and Sons, New York. p. 169-193.
IARC (International Agency for Research on Cancer). 1972. Haematite and iron oxide. IARCMonographs on the Evaluation of the Carcinogenic Risk of Chemicals to Man. Vol. 1, pp. 29-39. Lyon, France.

6-16-05
7
IARC (International Agency for Research on Cancer). 1984. Iron and steel founding. Polynuclear Aromatic Compounds, Part 3, Industrial Exposures in Aluminium Production, CoalGasification, Coke Production, and Iron and Steel Founding. IARC Monographs on theEvaluation of the Carcinogenic Risk of Chemicals to Man. Vol. 34, pp. 133-190. Lyon, France.
IARC (International Agency for Research on Cancer). 1987. Haematite and ferric oxide. Overall Evaluations of Carcinogenicity: An Updating of IARC Monographs Volumes 1 to 42. IARC Monographs on the Evaluation of the Carcinogenic Risk of Chemicals to Man. Suppl. 7,pp. 216-219. Lyon, France.
Johansson, A., T. Curstedt, O. Rasool et al. 1992. Macrophage reaction in rabbit lung followinginhalation of iron chloride. Environ. Res. 58: 66-79.
Nettesheim, P., D.A. Creasia and T.J. Mitchell. 1975. Carcinogenic and cocarcinogenic effectsof inhaled synthetic smog and ferric oxide particles. J. Natl. Cancer Inst. 55: 159-169.
NIOSH (National Institute for Occupational Safety and Health). 2001a. Iron salts (soluble, asFe). NIOSH Pocket Guide to Chemical Hazards. September, 2001. Online athttp://www.cdc.gov/niosh/npg/npgd0346.html.
2 3NIOSH (National Institute for Occupational Safety and Health). 2001b. Rouge (Fe O ), CAS1309-37-1. NIOSH Pocket Guide to Chemical Hazards. September, 2001. Online athttp://www.cdc.gov/niosh/npg/npgd0549.html.
NTP (National Toxicology Program). 2001a. Status Report for Ferric Chloride. ExaminedSeptember, 2001. Online at: http://ntp-server.niehs.nih.gov/htdocs/Results_Status/Resstatf/7705080.Html.
NTP (National Toxicology Program). 2001b. NTP Chemical Repository Report for FerricChloride. Examined September, 2001. Online at: http://ntp-server.niehs.nih.gov/htdocs/CHEM_H&S/NTP_Chem7/Radian7705-08-0.html.
OSHA (Occupational Safety and Health Administration). 2001a. OSHA Preambles. AirContaminants (29 CFR 1910). VI. Health Effects Discussion and Determination of Final PEL. Examined September, 2001. Online athttp://www.osha-slc.gov/Preamble/AirCont_data/AIRCON6.html.
OSHA (Occupational Safety and Health Administration). 2001b. Iron Salts, Soluble (as Fe). Chemical Sampling Information. Revision dated January 15, 1993. Examined September, 2001. Online at http://www.osha-slc.gov/dts/chemicalsampling/data/CH_247600.html.

6-16-05
8
OSHA (Occupational Safety and Health Administration). 2001c. Iron Oxide Fume. ChemicalSampling Information. Revision dated January 11, 1999. Examined September, 2001. Online athttp://www.osha-slc.gov/dts/chemicalsampling/data/CH_247400.html.
Stenbäck, F., J. Rowland and A. Sellakumar. 1976. Carcinogenicity of benzyo(a)pyrene anddusts in the hamster lung (instilled intratracheally with titanium oxide, aluminum oxide, carbonand ferric oxide. Oncology. 33: 29-34.
U.S. EPA. 1984. Health Effects Assessment for Iron (and Compounds). Prepared by the Officeof Health and Environmental Assessment, Environmental Criteria and Assessment Office,Cincinnati, OH for the Office of Emergency and Remedial Response, Washington, DC. EPA540/1-86-054.
U.S. EPA. 1991. Chemical Assessments and Related Activities. Office of Health andEnvironmental Assessment, Washington, DC. April, 1991. OHEA-I-127.
U.S. EPA. 1994a. Chemical Assessments and Related Activities. Office of Health andEnvironmental Assessment, Washington, DC. December, 1994. OHEA-I-127.
U.S. EPA. 1994b. Methods for Derivation of Inhalation Reference Concentrations andApplication of Inhalation Dosimetry. Office of Research and Development, Washington, D.C. October, 1994. EPA/600/8-90/066F.
U.S. EPA. 1995. Quarterly Status Report of RfD/RfC Work Group (as of 9/01/95). Office ofResearch and Development. National Center for Environmental Assessment, Cincinnati, OH.
U.S. EPA. 1997. Health Effects Assessment Summary Tables. Annual Update. FY-1997. Prepared by the National Center for Environmental Assessment, Cincinnati, OH, for the Officeof Research and Development, Office of Emergency and Remedial Response, Washington, D.C. July 1997. EPA-540-R-97-036. PB97-921199.
U.S. EPA. 2001. Substance index. Integrated Risk Information System (IRIS). Office ofHealth and Environmental Assessment, Environmental Criteria and Assessment Office,Cincinnati, OH. Examined September, 2001. Online athttp://www.epa.gov/iris/subst/index.html.
WHO (World Health Organization). 2001. Online catalogs for the Environmental HealthCriteria series. Examined September, 2001. Online at http://www.who.int/dsa/cat97/zehc.htmand http://www.who.int/dsa/justpub/add.htm.

9-11-2006
Provisional Peer Reviewed Toxicity Values for
Iron and Compounds (CASRN 7439-89-6)
Derivation of Subchronic and Chronic Oral RfDs
Superfund Health Risk Technical Support Center National Center for Environmental Assessment
Office of Research and Development U.S. Environmental Protection Agency
Cincinnati, OH 45268

Acronyms and Abbreviations
bw body weight cc cubic centimeters CD Caesarean Delivered CERCLA Comprehensive Environmental Response, Compensation and
Liability Act of 1980 CNS central nervous system cu.m cubic meter DWEL Drinking Water Equivalent Level FEL frank-effect level FIFRA Federal Insecticide, Fungicide, and Rodenticide Act g grams GI gastrointestinal HEC human equivalent concentration Hgb hemoglobin i.m. intramuscular i.p. intraperitoneal i.v. intravenous IRIS Integrated Risk Information System IUR inhalation unit risk kg kilogram L liter LEL lowest-effect level LOAEL lowest-observed-adverse-effect level LOAEL(ADJ) LOAEL adjusted to continuous exposure duration LOAEL(HEC) LOAEL adjusted for dosimetric differences across species to a human m meter MCL maximum contaminant level MCLG maximum contaminant level goal MF modifying factor mg milligram mg/kg milligrams per kilogram mg/L milligrams per liter MRL minimal risk level MTD maximum tolerated dose MTL median threshold limit NAAQS National Ambient Air Quality Standards NOAEL no-observed-adverse-effect level NOAEL(ADJ) NOAEL adjusted to continuous exposure duration NOAEL(HEC) NOAEL adjusted for dosimetric differences across species to a human NOEL no-observed-effect level OSF oral slope factor p-IUR provisional inhalation unit risk p-OSF provisional oral slope factor p-RfC provisional inhalation reference concentration
i

p-RfD provisional oral reference dose PBPK physiologically based pharmacokinetic ppb parts per billion ppm parts per million PPRTV Provisional Peer Reviewed Toxicity Value RBC red blood cell(s) RCRA Resource Conservation and Recovery Act RDDR Regional deposited dose ratio (for the indicated lung region) REL relative exposure level RfC inhalation reference concentration RfD oral reference dose RGDR Regional gas dose ratio (for the indicated lung region) s.c. subcutaneous SCE sister chromatid exchange SDWA Safe Drinking Water Act sq.cm. square centimeters TSCA Toxic Substances Control Act UF uncertainty factor µg microgram µmol micromoles VOC volatile organic compound
ii

9-11-2006
PROVISIONAL PEER REVIEWED TOXICITY INFORMATION FOR IRON (CASRN 7439-89-6) AND COMPOUNDS Derivation of Subchronic and Chronic Oral RfDs
Background On December 5, 2003, the U.S. Environmental Protection Agency's (EPA's) Office of Superfund Remediation and Technology Innovation (OSRTI) revised its hierarchy of human health toxicity values for Superfund risk assessments, establishing the following three tiers as the new hierarchy: 1. EPA's Integrated Risk Information System (IRIS). 2. Provisional Peer-Reviewed Toxicity Values (PPRTV) used in EPA's Superfund
Program. 3. Other (peer-reviewed) toxicity values, including:
< Minimal Risk Levels produced by the Agency for Toxic Substances and Disease Registry (ATSDR),
< California Environmental Protection Agency (CalEPA) values, and < EPA Health Effects Assessment Summary Table (HEAST) values.
A PPRTV is defined as a toxicity value derived for use in the Superfund Program when such a value is not available in EPA's Integrated Risk Information System (IRIS). PPRTVs are developed according to a Standard Operating Procedure (SOP) and are derived after a review of the relevant scientific literature using the same methods, sources of data, and Agency guidance for value derivation generally used by the EPA IRIS Program. All provisional toxicity values receive internal review by two EPA scientists and external peer review by three independently selected scientific experts. PPRTVs differ from IRIS values in that PPRTVs do not receive the multi-program consensus review provided for IRIS values. This is because IRIS values are generally intended to be used in all EPA programs, while PPRTVs are developed specifically for the Superfund Program. Because science and available information evolve, PPRTVs are initially derived with a three-year life-cycle. However, EPA Regions or the EPA Headquarters Superfund Program sometimes request that a frequently used PPRTV be reassessed. Once an IRIS value for a specific chemical becomes available for Agency review, the analogous PPRTV for that same chemical is retired. It should also be noted that some PPRTV manuscripts conclude that a PPRTV cannot be derived based on inadequate data.
1

9-11-2006
Disclaimers Users of this document should first check to see if any IRIS values exist for the chemical of concern before proceeding to use a PPRTV. If no IRIS value is available, staff in the regional Superfund and RCRA program offices are advised to carefully review the information provided in this document to ensure that the PPRTVs used are appropriate for the types of exposures and circumstances at the Superfund site or RCRA facility in question. PPRTVs are periodically updated; therefore, users should ensure that the values contained in the PPRTV are current at the time of use. It is important to remember that a provisional value alone tells very little about the adverse effects of a chemical or the quality of evidence on which the value is based. Therefore, users are strongly encouraged to read the entire PPRTV manuscript and understand the strengths and limitations of the derived provisional values. PPRTVs are developed by the EPA Office of Research and Development’s National Center for Environmental Assessment, Superfund Health Risk Technical Support Center for OSRTI. Other EPA programs or external parties who may choose of their own initiative to use these PPRTVs are advised that Superfund resources will not generally be used to respond to challenges of PPRTVs used in a context outside of the Superfund Program. Questions Regarding PPRTVs Questions regarding the contents of the PPRTVs and their appropriate use (e.g., on chemicals not covered, or whether chemicals have pending IRIS toxicity values) may be directed to the EPA Office of Research and Development’s National Center for Environmental Assessment, Superfund Health Risk Technical Support Center (513-569-7300), or OSRTI
INTRODUCTION
A reference dose (RfD) for iron is not available on the Integrated Risk Information System (IRIS) (U.S. EPA, 2006) or the Drinking Water Standards and Health Advisories list (U.S. EPA, 2005). The Health Effects Assessment Summary Tables (HEAST) (U.S. EPA, 1997) reported that data regarding iron were inadequate for quantitative risk assessment. The Chemical Assessment and Related Activities (CARA) list (1991, 1994) includes a Health Effects Assessment (HEA) for Iron and Compounds (U.S. EPA, 1984) that found no reliable quantitative oral toxicity data. Iron has not been the subject of a toxicological review by the Agency for Toxic Substances Disease Registry (ATSDR) (2005) or the World Health Organization (WHO) (2005). Monographs by the International Agency for Research on Cancer (IARC) (1972, 1987), toxicity reviews by Jacobs (1977), Bothwell et al. (1979), Lauffer (1991) and Grimsley (2001), a review on dietary iron by the National Academy of Sciences (NAS) (2001), and the National Toxicology Program (NTP) (2001, 2005) management status report and chemical repository summary were consulted for relevant information. The NAS (2001) derived a Tolerable Upper Intake (TUI) level of 45 mg iron/day. The TUI is based on a minimal LOAEL of 70 mg/day (60 mg iron as ferrous fumerate plus 11 mg/day of dietary iron) identified by Frykman et al. (1994) for gastrointestinal effects and an uncertainty factor of 1.5 for use of a minimal LOAEL; a higher
2

9-11-2006
uncertainty factor was not used since the nature of the observed gastrointestinal effects was considered to be self-limiting. The U.S. Food and Drug Administration (FDA) promulgated a Rule in 1997 for labeling of iron-containing dietary supplements for the prevention of accidental poisoning in children (U.S. FDA, 1997). The Rule, as modified in 2003, does not contain specific exposure limits (U.S. FDA, 2003). In general, the FDA follows the NAS guidance on exposure limits for toxicity of essential elements, such as iron. Previous literature searches were conducted through September, 2001 as follows: TOXLINE (oral and inhalation toxicity and cancer from 1983 - September, 2001); CANCERLIT (1990 - September, 2001); MEDLINE (1991 - September, 2001); TSCATS, RTECS, DART/ETICBACK, EMIC/EMICBACK, HSDB, GENETOX, and CCRIS. Update literature searches were performed in October, 2005 in MEDLINE, TOXLINE (NTIS subfile), TOXCENTER, TSCATS, CCRIS, DART/ETIC, GENETOX, HSDB, RTECS and Current Contents.
REVIEW OF PERTINENT LITERATURE
Iron is an essential element and deriving a risk assessment value for such chemicals poses
a special problem in that the dose-adversity curve is "U-shaped". Thus, the risk value must be protective against deficiency as well as toxicity. The NAS (2001) has established guidelines for iron intake that take into account physiological differences during different life stages. For non-breast-fed infants aged 0-6 months, the NAS (2001) established a daily adequate intake (AI) for iron of 0.27 mg/day (0.04 mg/kg-day for infants 2-6 months old) based on the daily amount of iron secreted in human milk; breast-fed infants typically receive only 0.15 to 0.3 mg Fe/day. The NAS (2001) Dietary Reference Intakes (DRIs) for children are as follows: 11 mg/day (1.2 mg/kg-day) for infants between the ages of 7 and 12 months, 7 mg/day (0.54 mg/kg-day) for children aged 1-3 years, 10 mg/day (0.45 mg/kg-day) for ages 4-8 years, 8 mg/day (0.2 mg/kg-day) for ages 9-13 years and 11 mg/day (0.17 mg/kg-day) for boys and 15 mg/day (0.26 mg/kg-day) for girls aged 14-18 years. The DRI for men aged 19 years and above is 8 mg/day (0.11 mg/kg-day). The DRI for non-pregnant women is 18 mg/day (0.29 mg/kg-day) for ages between 19 and 50 years and 8 mg/day (0.13 mg/kg-day) for ages 51 years and older. The DRI for pregnant women is 27 mg/day (0.37 mg/kg-day for those aged 14-18 years and 0.35 mg/kg-day for those aged 19-50 years). The DRI during lactation is 10 mg/day (0.18 mg/kg-day) for women aged 14-18 years and 9 mg/day (0.15 mg/kg-day) for women aged 19-50 years.
According to the Centers for Disease Control and Prevention (CDC, 1998; CDC, 2005), iron deficiency is one of the most common known forms of nutritional deficiency. Its prevalence is highest among young children and women of childbearing age, particularly pregnant women. In children, iron deficiency causes developmental delays and behavioral disturbances, and in pregnant women, it increases the risk for a preterm delivery and delivering a low-birthweight baby. Young children are at great risk of iron deficiency because of rapid growth and increased iron requirements. Iron deficiency can occur due to lack of iron in the diet. If this continues, anemia results. Anemia is a manifestation of iron deficiency when it is relatively severe. Iron deficiency anemia significantly impairs mental and psychomotor development in infants and children. Although iron deficiency can be reversed with treatment, the reversibility of the mental and psychomotor impairment is not yet clearly understood. Thus, prevention and treatment need to be emphasized more than detection. In addition, iron deficiency increases a child’s
3

9-11-2006
susceptibility to lead toxicity. Lead replaces iron in the absorptive pathway when iron is unavailable.
In humans and other animals, levels in the body are regulated primarily through changes
in the amount of iron absorbed by the gastrointestinal mucosa. The absorption of dietary iron is influenced by body stores, by the amount and chemical nature of iron in ingested food and by a variety of dietary factors that increase or decrease the availability of iron for absorption (Hillman, 2001; Santi and Masters, 2001). Iron contained in meat protein (hemoglobin and myoglobin) is absorbed intact without first being broken down to elemental iron. Non-heme iron must first be reduced to ferrous iron (Fe2+) before it can be absorbed. Ferrous iron is transported across intestinal mucosal cells by active transport with the rate of transport inversely related to body iron stores. Depending upon the iron status of the body, iron is stored bound to ferritin within mucosal cells and macrophages in the liver, spleen and bone, or is transported in the plasma bound to transferrin. Serum levels of ferritin and transferrin, along with several red blood cell parameters, can be used clinically to evaluate iron balance. Although iron absorption is regulated, excessive accumulation of iron in the body resulting from chronic ingestion of high levels of iron cannot be prevented by intestinal regulation and humans do not have a mechanism to increase excretion of absorbed iron in response to elevated body levels (NAS, 1989, 2001). Human Studies Acute Exposure Information on acute oral toxic doses of iron in humans is available from numerous case reports of ingestion by children, but values vary because it is difficult to obtain accurate estimates of the amount taken in most overdose situations. Reviews of these case reports indicate that doses in the range of 200-300 mg iron/kg are generally considered lethal (Arena, 1970; Krenzelok and Hoff, 1979; NRC, 1979; Engle et al., 1987; Mann et al., 1989; Klein-Schwartz et al., 1990). Therapeutic Studies
Ferrous salts are administered orally for the therapeutic treatment of iron deficiency. The oral absorption of ferrous iron supplements is considered to be essentially the same for all ferrous salts (e.g., sulfate, fumarate, succinate and gluconate) and is approximately three times greater than that of ferric (Fe3+) salts (Hillman, 2001); thus, ferric iron is not used therapeutically. Constipation and other gastrointestinal effects, including nausea, vomiting, diarrhea and gastrointestinal pain are commonly associated with administration of oral ferrous salt supplements (Hillman, 2001; Santi and Masters, 2001). Severity of effects is variable, ranging from mild to severe, and depends upon dose and individual susceptibility. The onset of symptoms typically occurs at the initiation of treatment and continues throughout the duration of treatment. Although there is no indication that the severity of gastrointestinal effects varies over the course of treatment, severity is decreased in some patients when iron supplements are administered with food (Hillman, 2001; Santi and Masters, 2001). For most patients, iron deficiency is reversed within six months of treatment, thus limiting the duration of exposure.
4

9-11-2006
The mechanism of iron-induced gastrointestinal toxicity is not established, although it is postulated that adverse effects are due to irritant effects of the free iron ion on the gastric muscosa (Liguori, 1993). The role of absorbed iron in the development of gastrointestinal adverse effects is unknown. The adverse effects of exposure to oral iron supplements has been investigated in several studies (Blot et al., 1981; Brock et al., 1985; Coplin et al., 1991; Fryklman et al., 1994; Hallberg et al., 1966; Liguori, 1993).
Frykman et al. (1994) evaluated the adverse effects of daily oral therapy with iron fumarate in a double-blind, crossover, placebo-controlled study in Swedish male [n=25; mean age 45 years (range 40-52)] and female [n=23; mean age 41 years (range 34-45)] adult blood donors. Study subjects were administered 60 mg elemental iron as a daily dose of iron fumarate for one month, with each study subject serving as their own placebo control. Compared to the placebo treatment period, the percentage of subjects reporting constipation (placebo 20%, ferrous fumarate 35%, p<0.05) and total gastrointestinal symptoms (nausea, obstipation, gastric pain and diarrhea (placebo 14%, ferrous fumarate 25%, p<0.01) was significantly increased during ferrous fumarate treatment. Although the severity of gastrointestinal effects was graded as minor in most study subjects, four subjects withdrew from the study due to severe gastrointestinal symptoms associated with iron fumarate. In a matched group of 49 adults taking a daily combination supplement of porcine-derived heme-iron and iron fumarate containing a total daily supplement of 18 mg iron/per day, the frequency of gastrointestinal symptoms was not increased compared to placebo. No differences in therapeutic efficacy, as measured by serum ferritin and hemoglobin levels, were observed between the non-heme iron and heme-iron treatment groups.
Adverse effects of four oral iron preparations were evaluated in 1496 male and female adult blood donors in a series of double-blind, placebo controlled trials (Hallberg et al., 1966). The following treatment groups were compared: (1) placebo (195 subjects) and ferrous sulfate (198 subjects; 222 mg elemental iron/day); (2) placebo (199 subjects), ferrous sulfate (120 subjects; 222 mg elemental iron/day), ferrous fumarate (118 subjects, 222 mg elemental iron/day), and ferrous gluconate (120 subjects; 222 mg elemental iron/day); and (3) placebo (200 subjects), ferrous sulfate (195 subjects; 180 mg elemental iron/day), ferrous glycine sulfate (200 subjects; 180 mg elemental iron/day), and ferrous gluconate (196 subjects; 180 mg elemental iron/day). Treatments were administered for two weeks. For all iron treatments, the frequency of adverse gastrointestinal effects was significantly increased compared to the matched placebo group (p<0.05). Adverse effects reported include constipation, diarrhea, heartburn, nausea and epigastric pain. No statistically significant differences in the frequency of adverse effects were observed between iron treatments for subjects receiving 222 mg elemental iron/day or between iron treatments for subjects receiving 180 mg elemental iron/day. In the seven iron treatment groups, the percentage of subjects reporting gastrointestinal effects ranged from 22.9% in the 222 mg ferrous sulfate group to 31.5% in the 222 mg ferrous gluconate group. In the three placebo treatment groups, the percentage of subjects reporting gastrointestinal effects ranged from 12.4 to 13.6%. Although statistical comparisons were not made between the 180 and 222 mg iron/day treatments, the frequency of adverse effects was similar for all iron treatment groups.
Gastrointestinal symptoms were reported in pregnant women treated daily with oral iron supplements containing 105 mg elemental iron and 500 mg ascorbic acid (55 women) or 105 mg
5

9-11-2006
elemental iron, 500 mg ascorbic acid and 350 mg folic acid (54 women) during the third trimester of pregnancy (Blot et al., 1981). The form of iron was not reported. No placebo control group was included. Gastrointestinal adverse effects reported include nausea, diarrhea, constipation and epigastric pain. Approximately 16% of all patients reported minor gastrointestinal symptoms, 14% reported severe effects and 6% stopped treatment due to adverse effects. Adverse effects occurred with approximately the same frequency in the two treatment group, although data were not reported.
The tolerability of iron protein succinylate and ferrous sulfate were compared in a double-blind clinical trial in 1095 patients with iron deficiency (Liguori, 1993). Patients received daily treatment with a controlled-release formulation of ferrous sulfate containing 105 mg elemental iron (64 males and 485 females) or iron protein succinylate containing 120 mg elemental iron (55 males and 491 females) for 60 days. No placebo control group was included. In the ferrous sulfate group, 26.3% of patients reported adverse gastrointestinal effects (heartburn, epigastric pain, constipation and abdominal pain), compared to 11.5% of patients treated with iron protein succinylate (p<0.05).
The adverse effects of oral treatment with a conventional ferrous sulfate tablet were compared to a ferrous sulfate wax-matrix tablet in a single-blind, parallel group study in 543 subjects (Brock et al., 1985). No placebo control group was included. Subjects were administered a conventional ferrous sulfate table containing 50 mg elemental iron/day (272 subjects) or a sulfate wax-matrix tablet containing 50 mg elemental iron/day (271 subjects) for 56 days. Approximately 45% of subjects treated with conventional ferrous sulfate reported moderate-to-severe gastrointestinal effects, including abdominal discomfort, nausea, vomiting, constipation and diarrhea, compared to approximately 17% of subjects treated with the ferrous sulfate wax-matrix preparation, a statistically significant difference (p<0.001).
The tolerability of ferrous sulfate (50 mg elemental iron/day) and bis-glycino iron II (50 mg elemental iron/day) was compared in a double-blind, crossover trial in 42 women (Coplin et al., 1991). The treatment period for each iron supplement was two weeks. No placebo treatment period was included. The frequency of adverse gastrointestinal effects (abdominal pain, bloating, constipation, diarrhea and nausea) was similar for the two treatments, with 54% and 59% of subjects reporting gastrointestinal symptoms during treatment with bis-glycino iron II and ferrous sulfate, respectively. The difference between treatments was not statistically significant. Effects of iron therapy on the upper gastrointestinal tract were evaluated in 14 healthy volunteers [13 women, 1 man; mean age 29 years (range: 24-48 years)] who were instructed to ingest 325 mg tablets of ferrous sulfate (119.5 mg elemental iron) three times/day before meals (358.5 mg elemental iron/day) for 2 weeks (Laine et al., 1988). Evaluation consisted of a gastrointestinal symptom survey, qualitative (Hemoccult) and quantitative (HemoQuant; mg mercury/g stool) testing for fecal blood loss, endoscopy of the upper gastrointestinal tract and histological examination of pinch biopsies of the gastric body, antrum and duodenum. Based on actual average ingestion of 2.5 tablets/day (2-week study) and 2.6 tablets/day (1-week study) and a reference human body weight of 70 kg (U.S. EPA, 1987), the estimated doses consumed by the subjects were 4.3 and 4.4 mg iron/kg-day, respectively, in addition to dietary iron. Compared to
6

9-11-2006
baseline measurements in the two weeks prior to treatment, all subjects had significantly increased (p<0.05) dark brown-black stools and symptoms of nausea and vomiting during the treatment period, but not abdominal pain. Hemoglobin levels in stool did not change significantly after iron treatment. Endoscopic examination showed a significant (p=0.003) increase in abnormalities in the stomach, but not duodenum, after therapy. These changes consisted of erythema, small areas of subepithelial hemorrhage and solitary antral erosions in nine, six and two subjects, respectively, and were considered only minimally abnormal. No treatment-related histological changes were observed. Although it was speculated that the changes in the stomach could represent a mild form of iron poisoning, the investigators concluded that the treatment caused mild endoscopic abnormalities of uncertain clinical significance in the stomach. Evidence for iron overload (tissue biopsies or hematologic iron status indices) was not examined. Considering additional dietary exposure, an exposure level of about 4.3 mg/kg-day represents, at worst, a minimal LOAEL. Adverse developmental effects in humans have not been associated with the ingestion of supplemental iron during pregnancy. As indicated above, NAS (2001) recommended that pregnant women supplement their diets with 27 mg iron/day (0.35 mg/kg-day). McElhatton et al. (1991) reported on 49 women who took an overdose of a simple iron preparation (53%) or iron with folate preparation (47%). In 48 of the women, the amount of iron ingested was known; 28 took > 1.2 g and the remainder took 1.2 g. There were 25 women who received chelation treatment with desferrioxamine (DFO) and 12 who received an emetic. Maternal toxicity, consisting of nausea, vomiting, hematoemesis, abdominal pain and diarrhea, was observed in 35 of the women. Two spontaneous abortions occurred and there were three premature deliveries. One of the spontaneous abortions and the premature deliveries were not related to the iron overdose. It is not known if the other spontaneous abortion occurring at 22 weeks (3 weeks after the overdose) was caused by the iron overdose. No conclusions on the developmental toxicity of iron can be made. Chronic Exposure While chronic iron toxicity occurs in people with genetic metabolic disorders resulting in excessive iron absorption or abnormal hemoglobin synthesis, or who receive frequent blood transfusions (Jacobs, 1977; Bothwell et al., 1979), there is a long-standing controversy as to whether a chronic overload due to oral intake is possible in individuals with a normal ability to control iron absorption (Hillman and Finch, 1985). Nevertheless, "the cumulative experience in human subjects suffering from iron overload of various etiologies strongly suggests that iron is noxious to tissues [when]...present in parenchymal cells...for a sufficiently long period of time" (Bothwell et al., 1979).
Looker et al. (1988) made comparisons of dietary iron intake and biochemical indices of iron status based on values taken from the second National Health and Nutrition Examination Survey (NHANES II) data base1. NHANES II was a probability sample of the noninstitutionalized U.S. population aged 6 months to 74 years, conducted between 1976 and
1 The latest version of this data base, NHANES III (1984-1988) evaluated 30,000 subjects aged 2 months and above (NAS, 2001). Despite minor differences in the data sets, the conclusions drawn by Looker et al. (1988) based on NHANES II appear to be valid for the NHANES III data.
7

9-11-2006
1980 by the National Center for Health Statistics. These data suggest that normal intake of iron by men 16-74 years old exceeds the DRI, and that iron intake is somewhat lower than the DRI for women younger than 51 years. Concomitant with the study of dietary intake, the NHANES II measured the iron status of these populations. The percent serum transferrin saturation, a measure of the residual capacity of the iron transport system to process potential variations in iron from dietary intake or catabolized body stores, ranged from 24% saturation for pre- and post-menopausal women not using iron supplements to 29% saturation for adult male supplement users. These values are within the normal range (20-40%). The Looker et al. (1988) evaluation of the NHANES II iron status data concerned iron deficiencies, only, and did not address iron overload directly. However, iron overload conditions would likely be evidenced by increased saturation of serum transferrin and increased serum ferritin concentrations, which were also within the normal range. Therefore, the corresponding dietary intakes are presumed to represent chronic NOAELs. Looker et al. (1988) estimated daily iron intakes ranging from 10.0 for elderly women to 18.7 mg/day for young adult men in the study population. These daily intakes correspond to a range of about 0.15 to 0.27 mg/kg-day, depending on assumptions of average body weight. Taking the highest intake level of 18.7 mg/day and a body weight of 70 kg, a NOAEL of 0.27 is established for chronic iron toxicity.
Hemosiderosis (or siderosis) and iron overload are increases in tissue iron or a general increase in iron stores without associated tissue damage (Bothwell et al., 1979; Jacobs, 1977). Hemochromatosis describes massive iron overload (15 g of body iron stores or greater) together with cirrhosis and/or other tissue damage attributable to iron. Although focal deposits of iron may occur in any part of the body where red cells are extravasated, the clinical syndrome of hemochromatosis typically involves damage to the hepatic parenchyma (particularly fibrosis), heart (cardiac dysfunction including failure) and endocrine glands (particularly hypogonadism). Pancreatic iron deposition is common and massive deposits may be associated with fibrosis and diabetes. A number of studies involving chronic oral administration of iron to animals have been designed in an attempt to identify an animal model for hemochromatosis. Most of these studies have been negative (Bothwell et al., 1979; NRC, 1979). Animal studies involving parenteral administration of iron have been generally negative as well, even though parenteral routes bypass the mechanisms that regulate absorption of iron from the gastrointestinal tract. Chronic iron toxicity has been observed in people with idiopathic hemochromatosis (a genetic metabolic disorder resulting in excessive iron absorption), abnormalities of hemoglobin synthesis (e.g., thalassemia) or various anemic states (e.g., sideroblastic anemia), frequent blood transfusions or a combination of these conditions (Jacobs, 1977; Bothwell et al., 1979). Chronic hemochromatosis has also occurred among the South African Bantu population from an excessive intake of absorbable iron in an alcoholic beverage. Habitual excessive intake of iron by the Bantus is attributed to consumption of home-brewed Kaffir beer, which was contaminated by iron vessels during brewing (Bothwell and Bradlow, 1960; Bothwell et al., 1964). The beer's high acidity (pH 3-3.5) enhanced iron leaching from the vessels. The iron in the beer is readily assimilable (i.e., ionizable) due to the acidity and presence of iron-complexing ligands such as fructose, and is absorbed to approxi-mately the same degree as ferric chloride. The alcohol content of the beer is also believed to contribute to the bioavailability of the iron (Jacobs, 1977; Finch and Monsen, 1972). Based
8

9-11-2006
primarily on drinking habits and analyses of beer samples, the estimated average dietary iron intake of the Bantu men ranged from 50-100 mg/day from beer alone (Bothwell et al., 1964). Using a reference body weight of 70 kg (U.S. EPA, 1987), this range corresponds to 0.7-1.4 mg/kg-day. Histological examinations of the liver of 147 Bantus (129 male, 18 female) ranging in age from 11-70 years (most were between 20 and 50 years old) that died from acute traumatic causes were performed (Bothwell and Bradlow, 1960). Varying degrees of hepatic siderosis were observed in 89% of the cases; the degree tended to increase with age 40-50 years or less. The siderosis was mild in 59% and severe in 19% of the cases, respectively. There was a close correlation between hepatic iron concentration and portal fibrosis and cirrhosis. Although the overall prevalence was low (15.6% fibrosis and 1.4% cirrhosis), all 11 subjects with the highest iron concentrations (>2.0% dry weight of liver) showed either fibrosis or cirrhosis. Histological examination of the spleen (50 subjects) also showed siderosis and unspecified histological changes. Malnutrition and alcoholism could have played a role in the etiology of the hepatic and splenic siderosis in the Bantus. A NOAEL in the range of 0.7 - 1.4 mg/kg-day is indicated but may be low given the likely higher bioavailability of iron in the beer than for normal dietary exposure. Given the generally poor nutritional health status of this population, the relevance of this study for application to the U.S. population is questionable. Ethiopia reportedly has the highest per capita iron intake in the world, with an average daily intake of 471 mg iron/day (range 98-1418 mg/day; 1.4-20.3 mg iron/kg-day assuming 70 kg body weight) (Roe, 1966; Hofvander, 1968). Increased stored iron in the liver and adverse health effects have not been observed due to low bioavailability of the iron in Ethiopian food. A few studies have suggested that high iron intake may be a risk factor for myocardial infarction (Salonen et al., 1992; Lauffer, 1991; Sullivan, 1992). Five other large studies found no association between serum ferritin levels and coronary heart disease (NAS, 2001). Various other measures of iron status (serum transferrin saturation, serum iron concentration and total iron-binding capacity) have been examined for a possible link to cardiovascular disease in prospective cohort studies, but results overall have been characterized as contradictory (Meyers, 1996; NAS, 2001). The NAS (2001) concluded that the available evidence “does not provide convincing support for a causal relationship” between the level of dietary iron intake and the risk for coronary heart disease, although iron cannot be definitively excluded as a risk factor. Animal Studies
Repeated-dose oral studies in experimental animals found no significant effect of treatment with inorganic iron compounds. No treatment-related adverse changes in clinical signs, body or organ weights, food consumption or histopathology were observed in male Sprague-Dawley rats that had daily dietary intakes of 35, 70 or 140 mg of iron (as FeSO4 or FeEDTA) per kg for up to 61 days (Appel et al., 2001). In male and female F344 rats that were exposed to drinking water containing 0.25 or 0.5% ferric chloride (FeCl3 • 6H2O) for 104 weeks, there were no dose-related effects other than reduced water intake (possibly affected by palatability) and body weight gain (Sato et al., 1992). In the latter study, the iron intakes were 58 or 110 mg/kg-day in males and 65 or 116 mg/kg-day in females.
9
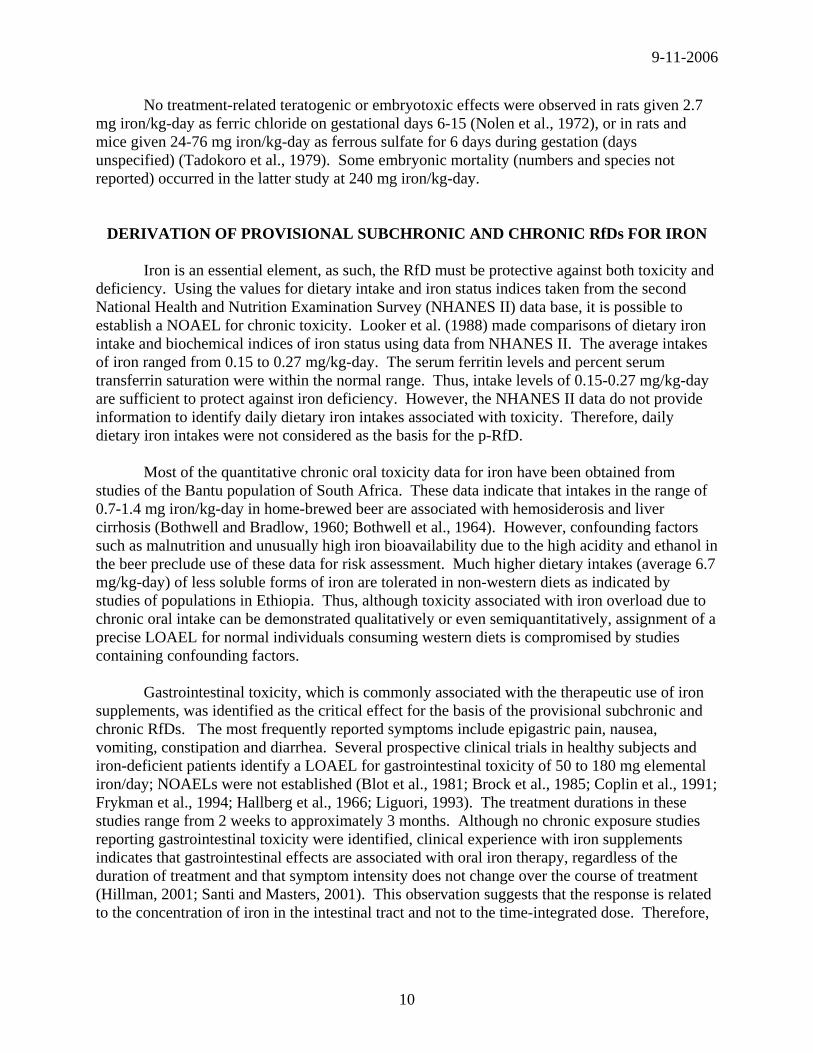
9-11-2006
No treatment-related teratogenic or embryotoxic effects were observed in rats given 2.7 mg iron/kg-day as ferric chloride on gestational days 6-15 (Nolen et al., 1972), or in rats and mice given 24-76 mg iron/kg-day as ferrous sulfate for 6 days during gestation (days unspecified) (Tadokoro et al., 1979). Some embryonic mortality (numbers and species not reported) occurred in the latter study at 240 mg iron/kg-day.
DERIVATION OF PROVISIONAL SUBCHRONIC AND CHRONIC RfDs FOR IRON Iron is an essential element, as such, the RfD must be protective against both toxicity and deficiency. Using the values for dietary intake and iron status indices taken from the second National Health and Nutrition Examination Survey (NHANES II) data base, it is possible to establish a NOAEL for chronic toxicity. Looker et al. (1988) made comparisons of dietary iron intake and biochemical indices of iron status using data from NHANES II. The average intakes of iron ranged from 0.15 to 0.27 mg/kg-day. The serum ferritin levels and percent serum transferrin saturation were within the normal range. Thus, intake levels of 0.15-0.27 mg/kg-day are sufficient to protect against iron deficiency. However, the NHANES II data do not provide information to identify daily dietary iron intakes associated with toxicity. Therefore, daily dietary iron intakes were not considered as the basis for the p-RfD. Most of the quantitative chronic oral toxicity data for iron have been obtained from studies of the Bantu population of South Africa. These data indicate that intakes in the range of 0.7-1.4 mg iron/kg-day in home-brewed beer are associated with hemosiderosis and liver cirrhosis (Bothwell and Bradlow, 1960; Bothwell et al., 1964). However, confounding factors such as malnutrition and unusually high iron bioavailability due to the high acidity and ethanol in the beer preclude use of these data for risk assessment. Much higher dietary intakes (average 6.7 mg/kg-day) of less soluble forms of iron are tolerated in non-western diets as indicated by studies of populations in Ethiopia. Thus, although toxicity associated with iron overload due to chronic oral intake can be demonstrated qualitatively or even semiquantitatively, assignment of a precise LOAEL for normal individuals consuming western diets is compromised by studies containing confounding factors.
Gastrointestinal toxicity, which is commonly associated with the therapeutic use of iron supplements, was identified as the critical effect for the basis of the provisional subchronic and chronic RfDs. The most frequently reported symptoms include epigastric pain, nausea, vomiting, constipation and diarrhea. Several prospective clinical trials in healthy subjects and iron-deficient patients identify a LOAEL for gastrointestinal toxicity of 50 to 180 mg elemental iron/day; NOAELs were not established (Blot et al., 1981; Brock et al., 1985; Coplin et al., 1991; Frykman et al., 1994; Hallberg et al., 1966; Liguori, 1993). The treatment durations in these studies range from 2 weeks to approximately 3 months. Although no chronic exposure studies reporting gastrointestinal toxicity were identified, clinical experience with iron supplements indicates that gastrointestinal effects are associated with oral iron therapy, regardless of the duration of treatment and that symptom intensity does not change over the course of treatment (Hillman, 2001; Santi and Masters, 2001). This observation suggests that the response is related to the concentration of iron in the intestinal tract and not to the time-integrated dose. Therefore,
10

9-11-2006
gastrointestinal toxicity is considered as the critical effect for both the subchronic and chronic p-RfDs.
The lowest LOAEL of 50 mg elemental iron/day for gastrointestinal toxicity associated
with iron supplements was reported in two studies that did not use a placebo-controlled design (Brock et al., 1985; Coplin et al., 1991); therefore, data were not considered suitable for derivation of the p-RfD. The placebo-controlled, cross-over design study by Frykman et al. (1994) reporting a LOAEL of 60 mg/day in Swedish men and women was identified as the critical study. Results of this study show that daily treatment with ferrous fumarate (60 mg elemental iron/day) for one month produced a statistically significant increase in gastrointestinal effects compared to placebo. To determine the LOAEL for total daily iron intake, the LOAEL for daily supplementation with ferrous fumarate of 60 mg elemental iron/day was added to the estimated mean dietary intake for six European countries of 11 mg elemental iron/day (NAS, 2001) for a total daily iron intake of 71 mg elemental iron/day. Based on a reference body weight of 70 kg (U.S. EPA, 1987), the LOAEL for gastrointestinal effects for total daily iron intake is 1 mg elemental iron/kg-day. This LOAEL is considered to be a minimal LOAEL because gastrointestinal effects were characterized by most study participants as minor in severity.
The provisional subchronic and chronic RfD for iron was derived from the LOAEL of 1
mg/kg-day for total daily iron intake for adverse gastrointestinal effects as follows: p-RfD (subchronic and chronic) = LOAEL ÷ UF = 1 mg/kg-day ÷ 1.5 = 0.7 mg/kg-day Dividing the LOAEL of 1 mg/kg-day by an uncertainty factor of 1.5 yields a subchronic and chronic p-RfD of 0.7 mg/mg-day. The uncertainty factor of 1.5 includes the individual uncertainty factors of 1.5 for use of a minimal LOAEL, 1 for sensitive individuals, 1 for less than lifetime exposure, and 1 for an adequate data base. An uncertainty factor of 1.5 was applied to account for extrapolation from a minimal LOAEL to a NOAEL for a non-serious effect. A higher uncertainty factor for use of a minimal LOAEL was not used since the observed gastrointestinal effects are not considered serious and are reversible when exposure is discontinued. Furthermore, gastrointestinal symptoms are not associated with dietary intake of similar levels of iron (NAS, 2001). Because individuals sensitive to gastrointestinal symptoms are considered to be included in the studies investigating effects of therapeutic iron; an uncertainty factor of 1 for sensitive individuals results. An uncertainty factor of 1 was used to account for less than lifetime exposure. Although exposure duration in the Frykman et al. (1994) study was only one month, there is no evidence to suggest that symptoms increase with longer exposure periods. An uncertainty factor of 1 was used to reflect an adequate database in humans, due to the extensive use of therapeutic iron.
Except for individuals with disorders of iron metabolism, little information is available on the long-term systemic toxicity of orally ingested iron. This assessment, therefore, focuses more on what is known to be a safe oral intake of iron for the general human population (i.e., apparently healthy normal individuals). The provisional reference dose is estimated to be an
11

9-11-2006
intake for the general population that is adequately protective from adverse health effects. Further, it is also important to note that individual requirements for, as well as adverse reactions to, iron may be highly variable. Some individuals may, in fact, consume a diet that contributes more than the provisional reference dose, without any cause for concern. In addition, specific population subgroups may have higher nutritional requirements than the provisional RfD would provide. The p-RfD may not be protective of individuals with inherited disorders of iron metabolism or other conditions which affect iron homeostasis. This assessment is essentially the same as that proposed by Stifelman et al. (2005).
REFERENCES Appel, M.J., C.F. Kuper and R.A. Woutersen. 2001. Disposition, accumulation and toxicity of iron fed as iron (II) sulfate or as sodium iron EDTA in rats. Food Chem. Toxicol. 39:261-269. Arena, J.M. 1970. Poisoning, 2nd ed. Thomas, Springfield, IL. p. 369. (Cited in Crotty, 1971) ATSDR (Agency for Toxic Substances and Disease Registry). 2005. Toxicological Profile Query. Available at http://www.atsdr.cdc.gov/toxprofiles/. Banner Jr., W. and T.G. Tong. 1986. Iron poisoning. Pediatr. Toxicol. 33(2):393-409. Blot, I., J.P. Kaltwasser, E.Werner and G. Tchernia. 1981. Influence of routine administration of folic acid and iron during pregnancy. Gynecol. Obstet. Invest. 12:294-304. Bothwell, T.H. and B.A. Bradlow. 1960. Siderosis in the Bantu: A combined histopathological and chemical study. Arch. Pathol. 70:279-292. Bothwell, T.H., H. Seftel, P. Jacobs et al. 1964. Iron overload in Bantu subjects: Studies on the availability of iron in Bantu beer. Am. J. Clin. Nutr. 14:47-51. Bothwell, T.H., R.W. Charlton, J.D. Cook and C.A. Finch. 1979. Iron Metabolism in Man. Blackwell Scientific Publications, Oxford, UK. p. 7-43, 105-120, 256-283. Brock, C., H. Curry and C. Hanna. 1985. Adverse effects of iron supplementation: a comparative trial of a wax-matrix preparation and conventional ferrous sulfate tablets. Clin. Therap. 7(5):568-577. CDC (Centers for Disease Control and Prevention). 1998. Recommendations to prevent and control iron deficiency in the United States. MMWR Recomm Rep. 47:1-29 (on-line) CDC (Centers for Disease Control and Prevention). 2005. Anemia and Iron Status. http://www.cdc.gov/nccdphp/dnpa/anemiron.htm
12

9-11-2006
Cook, J.D. 1991. Telephone conversation with J.A. Freedman, Syracuse Research Corporation, Syracuse, NY. Discussion of normal ranges of indices of iron status. September 5, 1991. Coplin M., S. Schuette, G. Leichtmann and B. Lashner. 1991. Tolerability of iron: A comparison of bis-glycion iron II and ferrous sulfate. Clin. Therap. 13(5):606-612. Elinder, C. 1986. Iron. In: Handbook on the Toxicology of Metals, 2nd ed., vol. II. L. Friberg, G.F. Nordberg, V.B. Vouk and E. Kessler, Eds. Elsevier Science Publishers, New York. p. 276-297. Engle, J.P., K.S. Polin and I.L. Stile. 1987. Acute iron intoxication: Treatment controversies. Drug Intell. Clin. Pharm. 21:153-159. Finch, C.A. and E.R. Monsen. 1972. Iron nutrition and the fortification of food with iron. J. Am. Med. Assoc. 219:1462-1465. Frykman, E., M. Bystrom, U. Jansson, A. Edberg and T. Hansen. 1994. Side effects of iron supplements in blood donors: Superior tolerance of heme iron. J Lab Clin Med. 123(4):561-4. Grimsley, L.F. 2001. Iron and cobalt. In: Patty’s Toxicology, 5th edition, vol. 3, E. Bingham, B. Cohrssen and C.H. Powell, Eds. John Wiley and Sons, New York. p. 169-193. Hallberg, L., L. Ryttinger and L. Solvell. 1966. Side-effects of oral iron therapy. Acta Med. Scand. Suppl. 459:3-10. Hillman, R.S. and C.A. Finch. 1985. Drugs effective in iron-deficiency and other hypochromic anemias. In: Goodman and Gilman's The Pharmacological Basis of Therapeutics, 7th ed. MacMillan Publishing Company, New York. p. 1308-1322. Hillman, R.S. 2001. Hematopoietic Agents: Growth Factor, Minerals and Vitamins. In: Goodman and Gilman’s The Pharmacological Basis of Therpeutics. J.G. Hardman, L.E. Limbird and A.G. Gilman, Eds. McGraw-Hill Companies, Inc., Medical Publishing Division, New York. p. 1487-1517. Hofvander, Y. 1968. Hematological investigations in Ethiopia with special reference to a high iron intake. Acta Med. Scand. Suppl. 494:7-74. IARC (International Agency for Research on Cancer). 1972. Haematite and iron oxide. IARC Monographs on the Evaluation of the Carcinogenic Risk of Chemicals to Man, Vol. 1. Lyon, France. pp. 29-39. IARC (International Agency for Research on Cancer). 1987. Haematite and ferric oxide. Overall Evaluations of Carcinogenicity: An Updating of IARC Monographs Volumes 1 to 42. IARC Monographs on the Evaluation of the Carcinogenic Risk of Chemicals to Man, Suppl. 7. Lyon, France. pp. 216-219.
13
9-11-2006
Jacobs, A. 1977. Iron overload – clinical and pathologic aspects. Semin. Hematol. 14:89-113. Klein-Schwartz, W., G.M. Oderda, R.L. Gorman et al. 1990. Assessment of management guidelines: Acute iron ingestion. Clin. Pediatr. 29(6):316-321. Krenzelok, E.P. and J.V. Hoff. 1979. Accidental childhood iron poisoning: A problem of marketing and labeling. Pediatrics. 63(4):591-596. Laine, L.A., E. Bentley and P. Chandrasoma. 1988. Effect of oral iron therapy on the upper gastrointestinal tract. A prospective evaluation. Digest. Dis. Sci. 33(2):172-177. Lauffer, R.B. 1991. Iron stores and the international variation in mortality from coronary artery disease. Med. Hypoth. 35(2):96-102. Liguori, L. 1993. Iron protein succinylate in the treatment of iron deficiency: controlled, double-blind, multicenter clinical trial on over 1,000 patients. Int. J. Clin. Pharmacol. Ther. Toxicol. 31(3):105-123. Looker, A., C.T. Sempos, C. Johnson and E.A. Yetley. 1988. Vitamin-mineral supplement use: Association with dietary intake and iron status of adults. J. Am. Diet. Assoc. 88:808-814. Mann, K.V., M.A. Picciotti, T.A. Spevack and D.R. Durbin. 1989. Management of acute iron overdose. Clin. Pharm. 8(6):428-440. McElhatton, P.R., J.C. Roberts and F.M. Sullivan. 1991. The consequences of iron overdose and its treatment with desferrioxamine in pregnancy. Hum. Exp. Toxicol. 10:251-259. Meyers, D.G. 1996. The iron hypothesis–Does iron cause atherosclerosis? Clin. Cardiol. 19:925-929. NAS (National Academy of Sciences). 1989. Recommended Dietary Allowances, 10th ed. National Academy of Sciences, National Research Council, Food and Nutrition Board. National Academy Press, Washington, DC. p. 195-205. NAS (National Academy of Sciences). 2001. Iron. In: Dietary Reference Intakes for Vitamin A, Vitamin K, Arsenic, Boron, Chromium, Copper, Iodine, Iron, Manganese, Molybdenum, Nickel, Silicon, Vanadium and Zinc. Institute of Medicine, Food and Nutrition Board. National Academy Press, Washington, DC. p. 233-310. Available at http://books.nap.edu/books/0309072794/html/. Nolen, G.A., R.L. Bohne and E.V. Buehler. 1972. Effects of trisodium nitrilotriacetate, trisodium citrate, and a trisodium nitrilotriacetate ferric chloride mixture on cadmium and methyl mercury toxicity and teratogenesis in rats. Toxicol. Appl. Pharmacol. 23:238-250.
14

9-11-2006
NRC (National Research Council). 1979. Iron Metabolism in Humans and Other Mammals. A Report of the Subcommittee on Iron, Committee on Medical and Biologic Effects of Environmental Pollutants, Division of Medical Sciences, Assembly of Life Sciences. University Park Press, Baltimore, MD. p. 79-105, 33-165. NTP (National Toxicology Program). 2001. NTP Chemical Repository Report for Ferric Chloride. Available at http://ntp-server.niehs.nih.gov/htdocs/CHEM_H&S/NTP_Chem7/Radian7705-08-0.html. NTP (National Toxicology Program). 2005. Management Status Report. Available at http://ntp-server.niehs.nih.gov/cgi/iH_Indexes/Res_Stat/iH_Res_Stat_Frames.html. Roe, D.A. 1966. Nutrient toxicity with excessive intake. II. Mineral overload. N.Y.S. J. Med. 66:1233-1237. Salonen, J.T., K. Nyyssonen, H. Korpela, J. Tuomilehto, R. Seppanen and R. Salonen. 1992. High stored iron levels are associated with excess risk of myocardial infarction in Eastern Finnish men. Circulation. 86(3):803-811. Santi, D.V. and S.B. Masters. 2001. Agents Used in Anemias; Hematopoietic Growth Factors. In: Basic & Clinical Pharmacology. B.G. Katzung, Ed. Lange Medical Books/McGraw-Hill Companies, Inc., Medical Publishing Division, New York. p. 549-563. Sato, M., F. Furukawa, K. Toyoda et al. 1992. Lack of carcinogenicity of ferric chloride in F344 rats. Food Chem. Toxicol. 30:837-842. Stifelman, M., L. Ingerman, B. Thayer and G. Diamond. 2005. Risk Assessment for Iron: Use of the Institute of Medicine’s Tolerable Upper Intake Level as a Surrogate Toxicity Value for Iron. Presented at the Society of Toxicology Annual Meeting, March 6, 2005, New Orleans, LA. Sullivan, J.L. 1992. Stored iron and ischemic heart disease. Empirical support for a new paradigm [editorial; comment]. Circulation. 36(3):1036-1037. Tadokoro, T., T. Miyaji and M. Okumura. 1979. Teratogenicity studies of slow-iron in mice and rats. Oyo Yakuri. 17:483. (Taken from Chem. Abstr. 91:134052f) U.S. EPA. 1984. Health Effects Assessment for Iron (and Compounds). Prepared by the Office of Health and Environmental Assessment, Environmental Criteria and Assessment Office, Cincinnati, OH for the Office of Emergency and Remedial Response, Washington, DC. EPA/540/1-86/054. U.S. EPA. 1987. Recommendations for and Documentation of Biological Values for Use in Risk Assessment. Prepared by the Office of Health and Environmental Assessment, Environmental Criteria and Assessment Office, Cincinnati, OH for the Office of Solid Waste and Emergency Response, Washington, DC. EPA/600/6-87/008. NTIS PB88-179874/AS.
15

9-11-2006
U.S. EPA. 1991. Chemical Assessments and Related Activities. Office of Health and Environmental Assessment, Washington, DC. April. U.S. EPA. 1994. Chemical Assessments and Related Activities. Office of Health and Environmental Assessment, Washington, DC. December. U.S. EPA. 1997. Health Effects Assessment Summary Tables. Annual Update. FY-1997. Office of Research and Development, Office of Emergency and Remedial Response, Washington, D.C. July 1997. EPA/540/R-97/036. NTIS PB97-921199. U.S. EPA. 2005. Drinking Water Standards and Health Advisories. Office of Water, Washington, DC. Available at http://www.epa.gov/ost/drinking/standards/dwstandards.pdf. U.S. EPA. 2006. Integrated Risk Information System (IRIS). Online. Office of Research and Development. National Center for Environmental Assessment, Washington, D.C. www.epa.gov/iris. U.S. FDA. 1997. Iron-Containing Supplements and Drugs: Label Warning Statements and Unit-Dose Packaging Requirements; Final Rule. Fed. Reg. 62(10):2217:2250. U.S. FDA. 2003. Iron-Containing Supplements and Drugs; Label Warning Statements and Unit-Dose Packaging Requirements; Removal of Regulations for Unit- Dose Packaging Requirements for Dietary Supplements and Drugs. Fed. Reg. 68(201):59714-59715. WHO (World Health Organization). 2005. Online catalogs for the Environmental Health Criteria series. Available at http://www.who.int/dsa/cat97/zehc.htm and http://www.who.int/dsa/justpub/add.htm.
16