Human Biosample Authentication Using the High-Throughput, Cost-Effective SNPtraceTM System
14
RESEARCH ARTICLE Human Biosample Authentication Using the High-Throughput, Cost-Effective SNPtrace TM System May M. Y. Liang-Chu 1‡ , Mamie Yu 1‡ , Peter M. Haverty 2 , Julie Koeman 4 , Janet Ziegle 3 , Marie Lee 3 , Richard Bourgon 2 , Richard M. Neve 1 * 1 Department of Discovery Oncology, Genentech, Inc., 1 DNA Way, South San Francisco, CA 94080, United States of America, 2 Department of Bioinformatics and Computational Biology, Genentech, Inc., 1 DNA Way, South San Francisco, CA 94080, United States of America, 3 Fluidigm Corporation, 7000 Shoreline Court, Suite 100, South San Francisco, CA 94080, United States of America, 4 Van Andel Research Institute, Cytogenetics, Grand Rapids, MI 49503, United States of America ‡ These authors contributed equally to this work. * [email protected] Abstract Cell lines are the foundation for much of the fundamental research into the mechanisms un- derlying normal biologic processes and disease mechanisms. It is estimated that 15%–35% of human cell lines are misidentified or contaminated, resulting in a huge waste of resources and publication of false or misleading data. Here we evaluate a panel of 96 single-nucleo- tide polymorphism (SNP) assays utilizing Fluidigm microfluidics technology for authentica- tion and sex determination of human cell lines. The SNPtrace Panel was tested on 907 human cell lines. Pairwise comparison of these data show the SNPtrace Panel discriminat- ed among identical, related and unrelated pairs of samples with a high degree of confi- dence, equivalent to short tandem repeat (STR) profiling. We also compared annotated sex calls with those determined by the SNPtrace Panel, STR and Illumina SNP arrays, revealing a high number of male samples are identified as female due to loss of the Y chromosome. Finally we assessed the sensitivity of the SNPtrace Panel to detect intra-human cross-con- tamination, resulting in detection of as little as 2% contaminating cell population. In conclu- sion, this study has generated a database of SNP fingerprints for 907 cell lines used in biomedical research and provides a reliable, fast, and economic alternative to STR profiling which can be applied to any human cell line or tissue sample. Introduction Human cell lines and patient-derived tissue are an essential resource for biomedical research. As the need for these resources grows in industry and academia, so have examples of biosample mix-ups [1–5]. The simple fact is that human error leads to mistakes which, unless stringent quality controls are in place, can result in costly mistakes, false and invalid data and retractions of publications [6–10]. For example, serial biopsies, matched normal and diseased tissue or PLOS ONE | DOI:10.1371/journal.pone.0116218 February 25, 2015 1 / 14 OPEN ACCESS Citation: Liang-Chu MMY, Yu M, Haverty PM, Koeman J, Ziegle J, Lee M, et al. (2015) Human Biosample Authentication Using the High- Throughput, Cost-Effective SNPtrace TM System. PLoS ONE 10(2): e0116218. doi:10.1371/journal. pone.0116218 Academic Editor: Francesc Calafell, Universitat Pompeu Fabra, SPAIN Received: October 7, 2014 Accepted: December 5, 2014 Published: February 25, 2015 Copyright: © 2015 Liang-Chu et al. This is an open access article distributed under the terms of the Creative Commons Attribution License, which permits unrestricted use, distribution, and reproduction in any medium, provided the original author and source are credited. Data Availability Statement: All relevant data are within the paper and its Supporting Information files. Funding: The authors have no support or funding to report. Competing Interests: The authors have read the journal's policy and have the following competing interests: JZ and ML are employees of Fluidigm Corporation, MMYLC, MY, PMH, RB and RMN are employees of Genentech Inc. Publication of this manuscript does not alter the authors' adherence to PLOS ONE policies on sharing data and materials.
-
Upload
independent -
Category
Documents
-
view
0 -
download
0
Transcript of Human Biosample Authentication Using the High-Throughput, Cost-Effective SNPtraceTM System

RESEARCH ARTICLE
Human Biosample Authentication Using theHigh-Throughput, Cost-Effective SNPtraceTM
SystemMayM. Y. Liang-Chu1‡, Mamie Yu1‡, Peter M. Haverty2, Julie Koeman4, Janet Ziegle3,Marie Lee3, Richard Bourgon2, Richard M. Neve1*
1 Department of Discovery Oncology, Genentech, Inc., 1 DNAWay, South San Francisco, CA 94080, UnitedStates of America, 2 Department of Bioinformatics and Computational Biology, Genentech, Inc., 1 DNAWay,South San Francisco, CA 94080, United States of America, 3 Fluidigm Corporation, 7000 Shoreline Court,Suite 100, South San Francisco, CA 94080, United States of America, 4 Van Andel Research Institute,Cytogenetics, Grand Rapids, MI 49503, United States of America
‡ These authors contributed equally to this work.* [email protected]
AbstractCell lines are the foundation for much of the fundamental research into the mechanisms un-
derlying normal biologic processes and disease mechanisms. It is estimated that 15%–35%
of human cell lines are misidentified or contaminated, resulting in a huge waste of resources
and publication of false or misleading data. Here we evaluate a panel of 96 single-nucleo-
tide polymorphism (SNP) assays utilizing Fluidigm microfluidics technology for authentica-
tion and sex determination of human cell lines. The SNPtrace Panel was tested on 907
human cell lines. Pairwise comparison of these data show the SNPtrace Panel discriminat-
ed among identical, related and unrelated pairs of samples with a high degree of confi-
dence, equivalent to short tandem repeat (STR) profiling. We also compared annotated sex
calls with those determined by the SNPtrace Panel, STR and Illumina SNP arrays, revealing
a high number of male samples are identified as female due to loss of the Y chromosome.
Finally we assessed the sensitivity of the SNPtrace Panel to detect intra-human cross-con-
tamination, resulting in detection of as little as 2% contaminating cell population. In conclu-
sion, this study has generated a database of SNP fingerprints for 907 cell lines used in
biomedical research and provides a reliable, fast, and economic alternative to STR profiling
which can be applied to any human cell line or tissue sample.
IntroductionHuman cell lines and patient-derived tissue are an essential resource for biomedical research.As the need for these resources grows in industry and academia, so have examples of biosamplemix-ups [1–5]. The simple fact is that human error leads to mistakes which, unless stringentquality controls are in place, can result in costly mistakes, false and invalid data and retractionsof publications [6–10]. For example, serial biopsies, matched normal and diseased tissue or
PLOSONE | DOI:10.1371/journal.pone.0116218 February 25, 2015 1 / 14
OPEN ACCESS
Citation: Liang-Chu MMY, Yu M, Haverty PM,Koeman J, Ziegle J, Lee M, et al. (2015) HumanBiosample Authentication Using the High-Throughput, Cost-Effective SNPtraceTM System.PLoS ONE 10(2): e0116218. doi:10.1371/journal.pone.0116218
Academic Editor: Francesc Calafell, UniversitatPompeu Fabra, SPAIN
Received: October 7, 2014
Accepted: December 5, 2014
Published: February 25, 2015
Copyright: © 2015 Liang-Chu et al. This is an openaccess article distributed under the terms of theCreative Commons Attribution License, which permitsunrestricted use, distribution, and reproduction in anymedium, provided the original author and source arecredited.
Data Availability Statement: All relevant data arewithin the paper and its Supporting Information files.
Funding: The authors have no support or funding toreport.
Competing Interests: The authors have read thejournal's policy and have the following competinginterests: JZ and ML are employees of FluidigmCorporation, MMYLC, MY, PMH, RB and RMN areemployees of Genentech Inc. Publication of thismanuscript does not alter the authors' adherence toPLOS ONE policies on sharing data and materials.

samples for personal genomics are often acquired for comparative studies and the results ofsuch studies are invalid if these tissues are mixed up [11]. Cell lines require propagation andcryopreservation which can lead to misidentification or cross-contamination, and it is estimat-ed that between 15–35% of human cell line cultures are contaminated in some manner [10].This has dramatic repercussions, represents a huge waste of resources and contributes to theirreproducibility of scientific data. The current standard for authenticating human samples isshort tandem repeat (STR) profiling. This is a multiplexed PCR-based assay which measurestetranucleotide repeats at up to 16 loci and is an American Type Culture Collection (ATCC)standardized method also recognized by the American National Standards Institute (ANSI)[2,12,13]. Detection of single-nucleotide polymorphisms (SNPs) is another established methodfor authenticating biologic samples [14–21]. However, SNP profiling has not gained significanttraction in our community as an alternative or complement to STR profiling. Here we evaluatethe SNPtrace Panel, a new high-throughput panel of 96-SNP assays utilizing Fluidigm micro-fluidics technology, for authentication and sex identification of human cell lines and tissues.The SNPtrace Panel was used to profile 907 samples for which we had also generated STR pro-files. We report the performance of the assay in comparison to STR profiling based on abilityto discriminate related and unrelated samples, sex calls and intra-human cross-contaminationand we provide a database of SNP calls for 907 individual cell lines.
Material and Methods
Cell Lines907 cell lines were used in this study (S1 Table). These consisted of 820 genetically distinctlines. 170 samples consisted of cell lines with one or more related cell lines within the panel de-rived from the same patient, termed synonymous (for example CX-1, HT-29 andWiDr) ormisidentified (for example HeLA, BT-B) or derivative (for example FA9JTO, FA9JTOTERT).STR and the SNPtrace Panel profiles for all lines can be found in S1 Table.
The SNPtrace Panel SNPsThe SNPtrace Panel is a set of SNPtype assays designed to enable sample tracking and finger-printing by genotyping 96 SNP loci across the human genome. The SNP loci consist of 90 auto-somal loci and six allosome loci. Sex calls from the SNPtrace Panel are determined by 6allosome SNPs (3 Chr X SNPs and 3 Chr Y SNPs), with redundancy to ensure that a samplecan be sex-typed if one assay were to fail. The 90 autosomal loci include 46 loci that are poly-morphic across all populations [19] and 44 ancestry-informative loci [22]. Some SNPs werealso chosen to correspond with commercial arrays. A list of the SNPtrace Panel SNP identifiersand their chromosomal location can be found in S4 Table.
DNA preparation and pre-amplificationDNA was extracted from frozen cell pellets ranging from 3e6 to 5e6 cells using either DNeasyBlood & Tissue (Qiagen, cat#69506) or 96 Blood & Tissue Kit (Qiagen, cat#69581) followingmanufacturer’s protocol. DNA concentration was determined by NanoDrop 8000 and normal-ized to 50ng/ μL.
All samples were pre-amplified in 96-well plates as described in the Fluidigm SNP Genotyp-ing User Guide. Briefly, all samples were pre-amplified in 96-well plates with the 10X SNPtracePanel specific target amplification (STA) primer pool, prepared by pooling 2 μl of all 96 pairsof 100 μM STA and 100 μM locus specific primer (LSP) primers diluted with DNA suspensionbuffer to a final concentration of 500 nM for each primer. In a DNA free hood, 60 μL of 10X
SNP-Profiling of Human Biosamples
PLOS ONE | DOI:10.1371/journal.pone.0116218 February 25, 2015 2 / 14
All data included in this manuscript is shared freely.Cell lines used in this manuscript all have associatedMTAs or licenses which may restrict Genentech'sability to distribute cell lines. If the MTA/licenseprevents sharing then the line can be obtained fromthe original supplier.

SNPtype STA Primer Pool was combined with 300 μL of Qiagen 2X Multiplex PCR MasterMix (Qiagen, PN 206143) and 90 μL of PCR-certified water to create the STA pre-mix. Next,3.75 μL of the STA pre-mix was combined with 1.25 μL of genomic DNA and thermal cycledwith a 15 minute 95°C hot start and 14 cycles alternating between 95°C for 15 seconds and60°C for 4 minutes (S5 Table). After thermal cycling, the specific target amplification reactionwas diluted 100 times and was used for the SNPtrace Panel genotyping and identification as de-scribed below. Sample preparation: 10 min. Machine time: 1 h 15 min.
The SNPtrace Panel Genotyping ReactionThe genotyping reactions were created as described in the Fluidigm SNP Genotyping UserGuide. The genotyping assays were created by combining 3 μL of each allele-specific primer(ASP) pool and 8 μL of each locus-specific primer (LSP) for each of the 96 SNPtrace Panel as-says into a 96 well plate with 29 μL of DNA suspension buffer. Next, 1 μL of each assay wascombined with 2.5 μL of 2X Assay Loading Reagent (Fluidigm, PN 85000738) and 1.5 μL ofPCR-certified water creating 5 μL of the assay mix and 4 μL of each 96 assay mixes was trans-ferred to the assay inlets. Following this, 2.5 μL of the 1:100 diluted pre-amplification reaction(see above) was combined with 3 μL of Biotium 2X Fast Probe Master Mix (Biotium, PN31005), 0.3 μL of 20X SNPtype sample loading reagent (Fluidigm, PN 100-3425), 0.1 μL of 60XSNPtype Reagent (Fluidigm, PN 100-3402), 0.036 μL of ROX (Invitrogen, PN 12223-012) and0.064 μL of PCR-certified water. Finally, 5 μL of each sample was transferred to the sampleinlets of the Fluidigm High Precision 96.96 Genotyping integrated fluidic circuit (IFC) forgenotyping.
Once the samples and assays were transferred, the IFC was inserted into the Fluidigm IFCController, HX, which created 9,216 reaction chambers. The IFC was thermal cycled and endpoint imaged on the BioMark HD System under conditions outlined in S5 Table. The datafrom the IFC were initially analyzed on the Fluidigm SNP Genotyping Analysis Software. Sam-ple preparation (96-samples): 30 min mixing, 10 min transferring samples to IFC. Machinetime (96-samples): 20 min priming, 1 h 30 min loading, 1 h 30 min thermal cycling/reading.Data analysis ~30 sec/sample (clean run) or 10 min/sample (more complex samples).
STR AnalysisAll human cell lines used in this publication were processed by Genetica DNA Laboratories(a LabCorp Specialty Testing Group; Burlington, NC) for authentication testing using analyti-cal procedures for DNA extraction (see above), polymerase chain reaction (PCR) and capillaryelectrophoresis on a 3130xl genetic analyzer (Applied Biosystems). The thirteen core CODISshort tandem repeat (STR) loci plus PENTA E and PENTA D, and the sex-specific locus, ame-logenin, were analyzed using the commercially available PowerPlex 16HS amplification kit(Promega Corporation) and GeneMapper ID v3.2.1 software (Applied Biosystems). Appropri-ate positive and negative controls were used concurrently throughout the analysis. Samplepreparation (16 samples): 30 min, 1 min (transfer). Machine run time (16 samples): DNA am-plification, 2 hr; genetic analyser, 1h; Data analysis ~30 sec/sample (clean run) or 10 min/sam-ple (more complex samples).
Pairwise comparison identity scoresFor either SNP or STR data, we followed Tanabe et al. [23] and computed an identity score forany pair of samples as follows: for each locus at which sample 1 and sample 2 both had calledalleles (i.e., where neither is a “no call”), we computed (i) the total number of distinct allelesseen in sample 1, (ii) the total number of distinct alleles seen in sample 2, and (iii) the number
SNP-Profiling of Human Biosamples
PLOS ONE | DOI:10.1371/journal.pone.0116218 February 25, 2015 3 / 14

of distinct alleles shared by both samples. Each of the three counts was then summed acrossall loci, and the identity score was defined as 2 x shared / (total 1 + total 2). The identity score is0 if and only if no common alleles are seen at any locus; it is 1 if and only if the exact same al-leles are seen in both samples at all loci. Note that this approach does not assume diploid ge-nomes or biallelic markers, nor does it require that the same set of markers be available forevery pair of samples.
P-values for relatednessMean and standard deviation for the pairwise identity scores were computed for all synony-mous pairs (excluding two outliers in Fig. 1B). The distribution of these scores was seen to beapproximately Gaussian, so non-synonymous pairs were scored based on the upper tail proba-bility of a normal distribution with the computed mean and standard deviation.
Illumina SNP ArraysIllumina HumanOmni2.5_4v1 arrays were used to assay cancer cell lines for genotype, DNAcopy and LOH at ~2.2 million SNP positions following methods published previously [24,25].
In brief, we applied a modified version of the PICNIC [26] algorithm to estimate total copynumber and allele-specific copy number / LOH. PICNIC was designed to work only with theAffymetrix SNP 6.0 array and thus some elements of the code were modified or replaced. Mostsignificantly, it was necessary to transform the two-dimensional probe intensity data for eachSNP so that the normal AA, AB, and BB genotype centroids are separated by one unit in boththe horizontal and vertical directions. To achieve this, we first used a Bayesian model to esti-mate cluster centroids for each SNP, and then applied a smooth, non-linear transform to send
Fig 1. Pairwise identity scores for cell lines using the SNPtrace Panel and STR profiling. (A) Results of pairwise analysis of all cell line samples brokenout into technical and biological replicates, synonymous samples, and unrelated samples. For unrelated samples, 24- and 48- SNPs were randomly selectedfor pairwise comparisons and contrasted with the complete 96-SNP set. (B) Comparison of pairwise scores from the SNPtrace Panel and STR profiling.Shaded region is joint distribution of SNP and STR-based identity scores for pairwise comparisons of unrelated lines (n = 467,746); in addition, two unrelatedpairs which generated unexpectedly high identity scores are called out as blue diamonds (“1” and “2”). Red and green points correspond to synonymous andreplicate pairs, respectively. Table 1 describes the cell line pairs marked by 1–6 in this figure.
doi:10.1371/journal.pone.0116218.g001
SNP-Profiling of Human Biosamples
PLOS ONE | DOI:10.1371/journal.pone.0116218 February 25, 2015 4 / 14

each centroid to the appropriate location. Genotypes were obtained using the GenomeStudio(http://bioinformatics.Illumina.com) application (version 2011.1) with the default settings.
Sample sex determination was made using both genotype and copy number data. The AA/AB/BB genotype calls were analyzed to determine the fraction of heterozygous SNPs (AB geno-type) on chromosome X. The raw, pre-segmentation copy number ratios (where 1 indicates acopy number equal to the genome average copy number) were analyzed to determine the aver-age value on chromosome Y. Visual inspection of histograms of these two values each indicatedbimodal densities. Cutoffs of< = 0.05 for the heterozygous fraction and> 0.5 for chromosomeY copy number ratio were selected to identify male samples (i.e. with only one allele for chro-mosome X genes and evidence of chromosome Y being present).
The genomic regions (hg19) covering the genes PCDH11Y (chrY:2988462-5587151) andPCDH11X (chrX:88455396-92368901) were excluded from the copy number analysis as theygenerally show locally increased copy number in putatively male samples. These regions makesup the “PAR3” pseudo-autosomal region [27] of chromosome Y and a potentially cross-hy-bridizing region on chromosome X. The array does not include SNPs in the PAR1 or PAR2regions.
Cell line SNP data has been deposited in the European Genome-phenome Archive (EGA).Accession number EGAS00001000610.
Detection of cross-contaminationTo test the sensitivity of detecting cross-contamination, we created cell mixtures, THP-1:SK-MEL-1, AU565:SK-MES-1 and MCF-7: LOX-IMVI at fixed ratios of (100:0, 99:1, 98:2, 95:5,90:10, 50:50, 5:95, 10:90, 2:98, 1:99, 0:100). Cell counts were determined by ViCELL (Beck-man). DNA was extracted from the cell mixtures using the DNeasy Blood & Tissue Kit (Qia-gen, cat#69506) following manufacturer’s protocol. DNA concentration was determined byNanoDrop 8000 and normalized to 50ng/ μL for all DNA samples.
Contamination experiments for diploid samples were performed by mixing a human maleand female sample. Three pairs were analyzed using DNA supplied by RUCDR Infinite Biolog-ics (Piscataway, NJ). Both male and female samples were diluted to 60ng/μL. Contaminatedsamples were created by mixing each 60ng/μL sample into the other to create 20%, 15%, 10%,5% and 1% contamination by volume.
Spectral Karyotyping (SKY)Metaphase slides were prepared from cell lines that were cultured, harvested, and fixed withmethanol:acetic acid (3:1), according to standard cytogenetic procedures. Seven microliters ofdenatured SkyPaint probe (Applied Spectral Imaging (ASI), Vista, CA) was added to each de-natured metaphase slide, which then was covered by a glass coverslip and incubated overnightin a 37°C humidified chamber. Slide pretreatment and post-hybridization washes were per-formed according to the standard supplied protocol (ASI) with slight modifications. Image ac-quisition was performed with a COOL-1300 SpectraCube camera (ASI) mounted on anOlympus BX43 microscope using a SKY optical filter (ASI). For each cell line, a minimum of10–15 metaphases were analyzed using the HiSKY v6.0 software (ASI).
Fluorescence in situ hybridization (FISH)FISH probes were prepared from purified BAC clones RP11-91A13 and RP11-71M14(Yq11.221) and RP11-452D1 (17p13.1/Yq12) (BACPAC Resource Center, bacpac.chori.org)and labeled with Orange-dUTP and Green-dUTP (Abbott Molecular Inc., Des Plaines, IL), re-spectively, by nick translation. The Yq11.221 FISH probe is specific for chromosomal locus
SNP-Profiling of Human Biosamples
PLOS ONE | DOI:10.1371/journal.pone.0116218 February 25, 2015 5 / 14
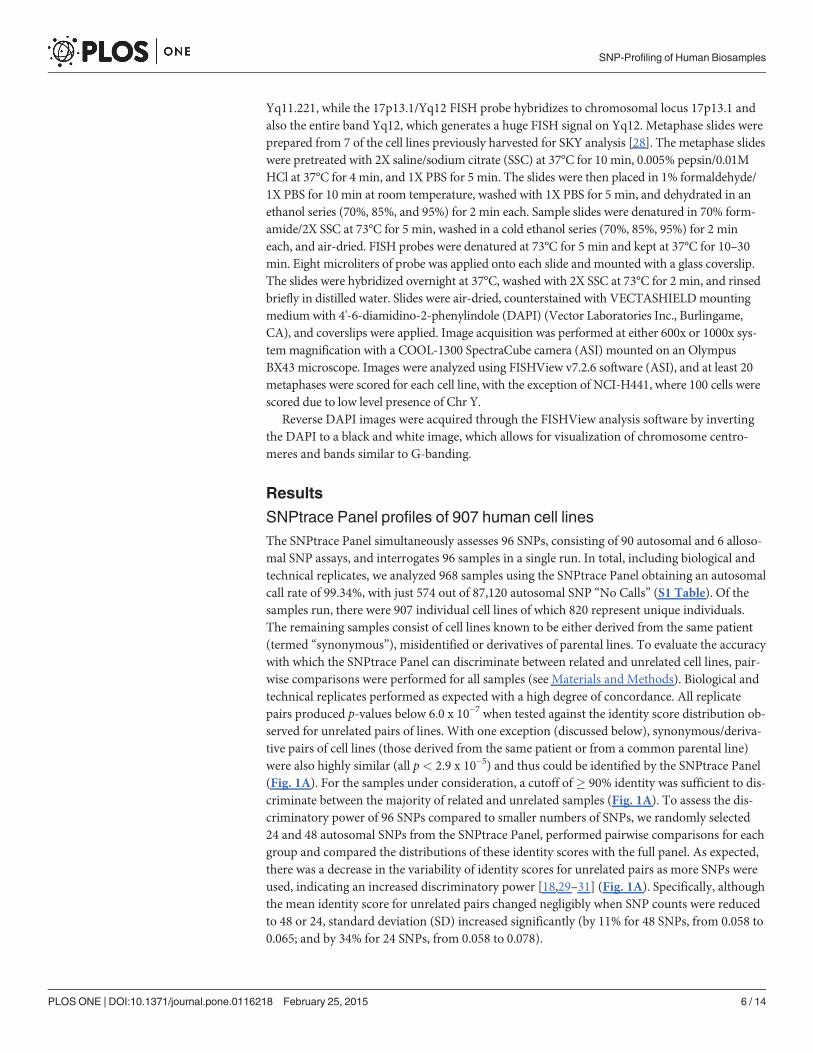
Yq11.221, while the 17p13.1/Yq12 FISH probe hybridizes to chromosomal locus 17p13.1 andalso the entire band Yq12, which generates a huge FISH signal on Yq12. Metaphase slides wereprepared from 7 of the cell lines previously harvested for SKY analysis [28]. The metaphase slideswere pretreated with 2X saline/sodium citrate (SSC) at 37°C for 10 min, 0.005% pepsin/0.01MHCl at 37°C for 4 min, and 1X PBS for 5 min. The slides were then placed in 1% formaldehyde/1X PBS for 10 min at room temperature, washed with 1X PBS for 5 min, and dehydrated in anethanol series (70%, 85%, and 95%) for 2 min each. Sample slides were denatured in 70% form-amide/2X SSC at 73°C for 5 min, washed in a cold ethanol series (70%, 85%, 95%) for 2 mineach, and air-dried. FISH probes were denatured at 73°C for 5 min and kept at 37°C for 10–30min. Eight microliters of probe was applied onto each slide and mounted with a glass coverslip.The slides were hybridized overnight at 37°C, washed with 2X SSC at 73°C for 2 min, and rinsedbriefly in distilled water. Slides were air-dried, counterstained with VECTASHIELDmountingmedium with 4'-6-diamidino-2-phenylindole (DAPI) (Vector Laboratories Inc., Burlingame,CA), and coverslips were applied. Image acquisition was performed at either 600x or 1000x sys-temmagnification with a COOL-1300 SpectraCube camera (ASI) mounted on an OlympusBX43 microscope. Images were analyzed using FISHView v7.2.6 software (ASI), and at least 20metaphases were scored for each cell line, with the exception of NCI-H441, where 100 cells werescored due to low level presence of Chr Y.
Reverse DAPI images were acquired through the FISHView analysis software by invertingthe DAPI to a black and white image, which allows for visualization of chromosome centro-meres and bands similar to G-banding.
Results
SNPtrace Panel profiles of 907 human cell linesThe SNPtrace Panel simultaneously assesses 96 SNPs, consisting of 90 autosomal and 6 alloso-mal SNP assays, and interrogates 96 samples in a single run. In total, including biological andtechnical replicates, we analyzed 968 samples using the SNPtrace Panel obtaining an autosomalcall rate of 99.34%, with just 574 out of 87,120 autosomal SNP “No Calls” (S1 Table). Of thesamples run, there were 907 individual cell lines of which 820 represent unique individuals.The remaining samples consist of cell lines known to be either derived from the same patient(termed “synonymous”), misidentified or derivatives of parental lines. To evaluate the accuracywith which the SNPtrace Panel can discriminate between related and unrelated cell lines, pair-wise comparisons were performed for all samples (see Materials and Methods). Biological andtechnical replicates performed as expected with a high degree of concordance. All replicatepairs produced p-values below 6.0 x 10⁻⁷ when tested against the identity score distribution ob-served for unrelated pairs of lines. With one exception (discussed below), synonymous/deriva-tive pairs of cell lines (those derived from the same patient or from a common parental line)were also highly similar (all p< 2.9 x 10⁻⁵) and thus could be identified by the SNPtrace Panel(Fig. 1A). For the samples under consideration, a cutoff of� 90% identity was sufficient to dis-criminate between the majority of related and unrelated samples (Fig. 1A). To assess the dis-criminatory power of 96 SNPs compared to smaller numbers of SNPs, we randomly selected24 and 48 autosomal SNPs from the SNPtrace Panel, performed pairwise comparisons for eachgroup and compared the distributions of these identity scores with the full panel. As expected,there was a decrease in the variability of identity scores for unrelated pairs as more SNPs wereused, indicating an increased discriminatory power [18,29–31] (Fig. 1A). Specifically, althoughthe mean identity score for unrelated pairs changed negligibly when SNP counts were reducedto 48 or 24, standard deviation (SD) increased significantly (by 11% for 48 SNPs, from 0.058 to0.065; and by 34% for 24 SNPs, from 0.058 to 0.078).
SNP-Profiling of Human Biosamples
PLOS ONE | DOI:10.1371/journal.pone.0116218 February 25, 2015 6 / 14

STRs are the ANSI standard for cell line authentication [12,13,32]. We generated STR pro-files for all cell lines analyzed by the SNPtrace Panel and contrasted pairwise comparisons ofthe STR profiles with those of the SNP profiles to assess the relative discriminatory power ofboth assays. This comparison showed that the SNPtrace Panel is comparable to STR profilingat discriminating between related and unrelated samples, and that biological and technical rep-licates scored equally well in both assays (Fig. 1B). This analysis identified some unexpectedfindings outlined in Table 1, including identification of two previously unknown pairs of iden-tical cell lines (NCI-H2691/NCI-H2803 and KM-12/PMFko14), and identification of uniqueprofiles for a pair of lines previously thought to be synonymous (COR-L47/CORL51, “3” inFig. 1B). We also found high concordance, as measured by the SNPtrace Panel, between fourlines reported as synonymous (HM7, LS-174T, LS-180, and MT-3, with comparisons to MT-3indicated as "4", "6" and "5," respectively, in Fig. 1B) [33,34], which had borderline/low concor-dance by STR. These findings were confirmed by the Illumina SNP arrays. These lines areknown to have microsatellite instability (MSI) which may affect STR results more than SNPs[35–37]. We also identified one sample handling error (EFM-192B) which was corrected andthus does not appear in Fig. 1 or supplementary material. Our findings highlight the need forcontinuous cell line profiling for quality control.
Cell line sex determinationUnlike other reported SNP profiling panels [29–31], the SNPtrace Panel includes six SNPs todetermine the sex of the sample (three each for X and Y). Historically, STRs have a high rate ofcalling male samples female, presumably due to loss of the amelogenin locus located on chro-mosome (Chr) Yp11.2 [38–40]. We compared sex calls made by (i) STR, (ii) Illumina SNP ar-rays (Klijn et al. In press, Nat Biotech) and (iii) the SNPtrace Panel with annotated sex calls. Allthree assays performed similarly, identifying 40–45% of males as females but only 2–7% of an-notated female cell lines as male with a high degree of concordance between assays (Table 2).The high level of consistency between the three platforms suggested the discrepancy may notbe due to a technical issue and prompted us to compare with published karyotypes for 19 celllines analyzed by Spectral Karyotyping (SKY) [24]. Table 3 compares the sex calls for the SNP-and STR-based assays with allosome calls from the SKY karyotyping for these cell lines. Out of19 cell lines, 7 were annotated as male but called female (using the Illumina SNP data), and all7 samples had no evidence of any Chr Y material by SKY (with the exception of a small portionof Yq found only in NCI-H522). Interestingly, there was no evidence of a Chr Y by SKY inNCI-H650, which was called male by Illumina SNP array (based on copy number of Chr Y)
Table 1. List of observed discrepancies between the SNPtrace Panel and STR comparisons.
Cell line 1 Cell Line2
Identity score(SNP)
Identity score(STR)
Observation
1 NCI-H2691
NCI-H2803
1.00 1.00 Cell lines are identical, not previously known
2 KM-12 PMF-ko14 0.99 0.72 Cell lines are identical, not previously known
3 COR-L47 COR-L51 0.78 0.44 Cell lines reported as synonymous (Sanger), but have unique profiles
4 HM7 MT-3 1.00 0.69 Identical by SNP, weak identity by STR. Discrepancy likely due to MSIaffecting STRs
5 LS-180 MT-3 1.00 0.60 Identical by SNP, weak identity by STR. Discrepancy likely due to MSIaffecting STRs
6 LS-174T MT-3 1.00 0.63 Identical by SNP, weak identity by STR. Discrepancy likely due to MSIaffecting STRs
doi:10.1371/journal.pone.0116218.t001
SNP-Profiling of Human Biosamples
PLOS ONE | DOI:10.1371/journal.pone.0116218 February 25, 2015 7 / 14

but female by STR and the SNPtrace Panel. In addition, NCI-H441 lacked Chr Y by SKY butwas called male by both STR and SNP assays. In light of these inconsistencies, and since thekaryotypes indicated a high degree of aneuploidy and complex chromosomal rearrangements,we hypothesized that fragments of Chr Y may be present in these aberrant genomes whichwere missed by SKY. To test this, we performed Chr Y FISH to detect Chr Y fragments inte-grated into other chromosomes (S2 and S3 Tables). No evidence of Chr Yq was found in 4 ofthe 7 male lines tested which typed as female (NCI-H23, NCI-H322T, NCI-H838 and NCI-H1299). In NCI-H522, we detected 1 copy of Chr Yq12 (der(15)t(Y;15)(q11.22?2;p11.1)) bySKY and FISH, suggesting that Chr Y was present but what remains of this portion of Chr Yapparently is not detectable by the other methods. Although SKY indicated no presence of ChrY in NCI-H441, FISH and reverse DAPI banding detected a normal Chr Y in 18% of cells, ex-plaining why the PCR-based STR and the SNPtrace Panel assays detect Chr Y. On closer
Table 2. Comparison of sex calls derived from STR profiling, the SNPtrace Panel and Illumina SNP arrays with annotated sex calls for all celllines.
Annotated Analysis Calls
STR SNPtrace Illumina Array
Male Female Male Female Male Female
Male 220 (55%) 180 (45%) 219 (60%) 144 (40%) 194 (60%) 131 (40%)
Female 8 (2%) 382 (98%) 15 (4%) 327 (96%) 23 (7%) 313 (93%)
Total 790 705 661
doi:10.1371/journal.pone.0116218.t002
Table 3. Comparison of sex calls derived from STR profiling, the SNPtrace Panel, Illumina SNP arrays and SKY.
Call (based on SNP array) Cell Line Name CLID Sex calls
Annotated STR SNPTrace illumina SKY Karyotype
Female typed as Female LXFL529 130847 Female Female Female Female XX
NCI-H1993 129701 Female Female Female Female XXXXXX
NCI-H2009 131971 Female Female Male Female X
NCI-H2073 129695 Female Female No Call Female XXX
NCI-H2122 130148 Female Female Female Female XX
NCI-H292 129184 Female Female No Call Female XX
Male typed as Female NCI-H1155 131718 Male Female No Call Female XX
NCI-H1299 129461 Male Female No Call Female XXXX
NCI-H23 129190 Male Female Female Female XX
NCI-H322T 585717 Male Female Female Female XX
NCI-H441 130150 Male Male Male Female XX
NCI-H522 129185 Male Female Female Female XX
NCI-H838 129191 Male Female Female Female X
Male typed as Male A549 130497 Male Male Male Male XXY
NCI-H1703 130536 Male Male Male Male XY
NCI-H226 129544 Male Male Male Male XYY
NCI-H358 129179 Male Male Male Male XXY
NCI-H460 129455 Male Male Male Male XXYY
NCI-H650 129187 Male Female Female Male XXX
doi:10.1371/journal.pone.0116218.t003
SNP-Profiling of Human Biosamples
PLOS ONE | DOI:10.1371/journal.pone.0116218 February 25, 2015 8 / 14

inspection, the Illumina SNP arrays did, in fact, detect a low level of Chr Y, but this was missedby the cut-offs we used to identify males (S1 Fig.). The positive control, NCI-H460, showed1–2 copies of Chr Y per cell by SKY, FISH and reverse DAPI banding.
These data suggest that many of the cancer cell lines derived from male patients which pro-filed as female may have lost the entire Y chromosome, not just the amelogenin locus, or mayhave dramatically rearranged genomes with fragments of Chr Y translocated to otherchromosomes.
Cross contaminationCell line cross-contamination is an acknowledged and major problem in biomedical sciences[10], and STRs have been reported to reliably detect a contaminant at 5–10% [41]. To test thesensitivity of the SNPtrace Panel to detect cell contaminants, we performed cell mixing experi-ments (see Materials and Methods). Initially, these were performed on normal (diploid)human DNA, and the percent identity for SNP calls was calculated between the mixes andboth the parental samples. Using an identity score cutoff of 90% to call samples as identical, theSNPtrace Panel could reliably detect 5% contamination in three independent mixes. For dip-loid cells, identity was not affected by the sample chosen, as reciprocal mixes resulted in similaridentity scores with each individual sample (Fig. 2A). We performed the same test on threepairs of tumor cell lines and found that sensitivity ranged from 2%-10% depending on the ratioof the samples, and equivalent reciprocal mixes were often not detected with the same degreeof sensitivity. For example, MCF-7 was only detected at 50% contamination (a 50:50 mix ratioin the MCF-7:LOX-IMVI mixture), whereas just 2% contamination of LOX-IMVI was detected(a 98:2 mix ratio in the MCF-7:LOX-IMVI mixture) (Fig. 2B). Similar results were observedusing STR analysis of these samples (data not shown). Our best interpretation of this data isthat the degree of aneuploidy and copy number at any given locus may influence the sensitivityof the assay and thus make contamination by a high copy number cell line easier to detect thancontamination by a line with fewer copies.
Fig 2. Detection of cell line cross-contamination by the SNPtrace Panel.DNA from two different normal human samples (A) and tumor cell lines (B) weremixed as indicated at the specified ratios, and analyzed by the SNPtrace Panel. Tables A and B include the calculated percent identity for each sample pair,and percent identities highlighted in grey indicate a non-identical call (<90%). Plots to the right of each table show the overlay of percent identities forreciprocal mixes.
doi:10.1371/journal.pone.0116218.g002
SNP-Profiling of Human Biosamples
PLOS ONE | DOI:10.1371/journal.pone.0116218 February 25, 2015 9 / 14

DiscussionDNA-based authentication is required to validate the results of any research using human bio-samples. However, there is a remarkable lack of attention to the problem of cell line misidenti-fication by researchers [42]. Some journals and grant-giving organizations are beginning torequest cell line authentication; however, the problem is not completely solved, as most do notrequire a definitive confirmation of authentication and in many cases papers are publishedwithout any assurance [43]. There are excellent resources for learning and implementing goodcell line practices [44], and these can be broken down into a few basic principles: understandingthe model, quality assurance, documentation/tracking of methods, reducing exposure to haz-ards, ethical compliance and education to ensure highest quality of work and safety [45]. Manyinstitutes enforce training and safety aspects, but do not enforce quality assurance of cell lines(and reagents) used in biomedical research which is arguably the most important aspect to en-sure reliable and reproducible data.
STR analysis is the ANSI standard for profiling cell lines. A wealth of cell line STR profilesare available for comparison (although there is no comprehensive, centralized reference data-base), and a growing number of organizations offer fee-for-service STR profiling (outsourcingSTR analyses can range from $100–295). As an alternative, SNP-based profiling has been sug-gested as a cost-effective, simple alternative [29–31]. Here we assessed the performance of anew commercial SNP profiling assay, the SNPtrace Panel, and compared it directly with STRprofiling of a panel of human cell lines. We found that the SNPtrace Panel showed equivalentperformance to STR profiling, that 96 SNPs outperformed 48 and 24 SNPs, and that a thresh-old of 90% SNP identity was able to confidently discriminate between related and unrelatedsamples. In samples with microsatellite instability, SNP profiling appeared to outperform STRprofiling in identifying related samples [37]. The system is high-throughput (96-samples perrun), and commercial reagent costs are approximately $6 per sample, compared to $15–30 forSTR analysis. Hands-on sample handling for 96-samples is 50 min for SNPs, compared to 3 hfor STR; machine run time for 96-samples is 4 h 35 min for SNPs, compared to 18 h for STR.In our experience the time needed for data analysis is equivalent for both platforms.
Similar to others, we found that SNP-based profiling can detect intra-species cross-contami-nation as low as 2% with a range of 2–10% [30], which compares favorably with STR. However,we observed that the sensitivity is dependent on the samples and the ratio of mixing for cancercell lines for both methods. We believe this is due to aneuploidy in cancer cell lines, but this re-mains to be formally tested. Therefore we advise frequent profiling of cell line stocks to catchoutgrowth of low-level contaminants over time.
There is a high rate of calling male samples female by STR [38,39]. When we compared sexcalls from three different platforms, we noted that an astounding 40–45% of cell lines annotat-ed as male were called female by all three methods we considered. Since these three methodsare quite distinct, it seemed unlikely that loss of the amelogenin locus alone was responsible,and we tentatively discounted human error since it would be expected that a similar number ofsamples annotated as female would be misidentified as male, which was not the case (Table 2).We have also sex typed a number of Coriell (diploid) cell lines without experiencing miscalls(data not shown). Some level of misdetection is inherent with all three methods we used. Forexample, the copy number algorithm we used can detect a mixture of normal and cancer cells,but it currently cannot detect sub-populations of cancer cells with copy number differenceswithin specific chromosomes. In the case of NCI-H441, the allele ratios for chromosome YSNPs were non-zero, but were closer to the expected values for zero copies than to those forone copy, resulting in a false negative call (S1 Fig.). Such discrepancies required cytogeneticanalysis which clearly showed that loss of most or all of Chr Y was occurring. A more detailed
SNP-Profiling of Human Biosamples
PLOS ONE | DOI:10.1371/journal.pone.0116218 February 25, 2015 10 / 14

cytogenetic analysis of cell lines and the tissue of origin (if available) is required to formallyprove if this is a common genomic feature for cell lines in culture, or represents a worryinglyhigh level of poorly annotated cell lines. Our data suggest that Chr Y loss is due to genomic in-stability as residual Chr Y fragments were found in some samples. While it is clear that it ischallenging to accurately determine the sex of a genomically unstable cell line, the autosomalcalls are definitive for identifying the origin of a cell line.
In summary, we demonstrated that the SNPtrace Panel is a DNA profiling technologywhich could be used alone or in conjunction with established cell line authentication methodsfor labs to continually monitor cell line identity. We have provided a resource of 907 SNP pro-files for future comparisons and have demonstrated that SNPs provide a fast, reliable, accurateand cost-effective method for assessing cell line or human biosample identity and intra-humancross-contamination.
Supporting InformationS1 Fig. Theta values [26] for chromosomes X and Y from three cell lines. Theta, a measuremuch like the B-allele frequency, gives a measure of the relative abundance of the so-called "A"and "B" alleles. A value of ~0.5 indicates heterozygosity. (A) A549 has normal sex chromo-somes for a male. The theta values indicate the absence of heterozygous alleles on chromosomeX, with the exception of the PAR1 and PAR3 regions (PAR2 is covered by only one SNP on thearray). On chromosome Y, theta indicates the presence of one copy of chromosome Y. (B)NCI-H1045 has normal female sex chromosomes. Theta indicates clear evidence for heterozy-gous alleles on chromosome X and the signal on chromosome Y is characteristic of homozy-gous deletion or the lack of chromosome Y. (C) NCI-H441 shows no evidence of heterozygousalleles on chromosome X. The signal on chromosome Y is intermediate between that of (A)and (B), suggesting a mix of cells with one chromosome X and one chromosome Y and cellswith just one chromosome X.(TIF)
S1 Table. Cell lines, annotations, SNPtrace Panel results and STR profiles for samples usedin this study. Index: simple numerical identifier; Sample Count: Number of times the samplewas run; Replicate type: TR = Technical Replicate, BR = Biological Replicate,— = unique sam-ple; Cell line name: name of cell line; CLID: unique identifier used within Genentech (this iden-tifier can be used to compare with other published data from Genentech); Species: species fromwhich the cell line was derived; Sex: annotated sex of cell line; Primary Tissue: the tissue fromwhich the cell line originated; Tissue Diagnosis: Type of disease the cell line was derived from;Synonymous/derivatives: known synonymous or derivative cell lines; Number of synonyms indataset; the count of any synonymous/derivative cell lines present in the data set related to thissample; # No call; the number of autosomal no calls for the SNPtrace Panel results. All headersfor the SNPtrace Panel and STR data indicate the SNP or STR identifiers.(XLSX)
S2 Table. Chr X / Chr Y karyotypes for 19 cell lines. Table describing the detailed karyotypeof 19 cell lines and the inferred sex type.(XLSX)
S3 Table. Chr Y FISH results. Table describing the detailed results of Chr Y FISH for 7cell lines.(XLSX)
SNP-Profiling of Human Biosamples
PLOS ONE | DOI:10.1371/journal.pone.0116218 February 25, 2015 11 / 14

S4 Table. dbSNP (“rs”) identifiers and chromosomal locations of the SNPtrace Panel SNPs.(XLSX)
S5 Table. SNPtype thermal cycling and pre-amp conditions.(XLSX)
AcknowledgmentsThe authors thank Erin Hall (Genetica DNA Laboratories, Burlington, NC) and Yvonne Reid(ATCC, Manassas, VA) for insightful discussions and sharing expertise regarding cell line au-thentication and DNA profiling.
Author ContributionsConceived and designed the experiments: MMYLCMY JK JZ ML RMN. Performed the experi-ments: MMYLCMY JK JZ ML. Analyzed the data: PMH RB RMN. Contributed reagents/ma-terials/analysis tools: MMYLC MY JK JZ ML PMH RB RMN. Wrote the paper: MMYLCMYJK JZ ML PMH RB RMN.
References1. (2010) Cell line misidentification: the beginning of the end. Nat Rev Cancer 10: 441–448. doi: 10.1038/
nrc2852 PMID: 20448633
2. Capes-Davis A, Theodosopoulos G, Atkin I, Drexler HG, Kohara A, et al. (2010) Check your cultures! Alist of cross-contaminated or misidentified cell lines. Int J Cancer 127: 1–8. doi: 10.1002/ijc.25242PMID: 20143388
3. Drexler HG, Dirks WG, Matsuo Y, MacLeod RA (2003) False leukemia-lymphoma cell lines: an updateon over 500 cell lines. Leukemia 17: 416–426. PMID: 12592342
4. Lacroix M (2008) Persistent use of "false" cell lines. Int J Cancer 122: 1–4. PMID: 17960586
5. Nardone RM (2007) Eradication of cross-contaminated cell lines: a call for action. Cell Biol Toxicol 23:367–372. PMID: 17522957
6. (2013) Retraction: Marker-independent identification of glioma-initiating cells. Nat Methods 10: 1035.doi: 10.1038/nmeth1013-1035c PMID: 24161986
7. Chatterjee R (2007) Cell biology. Cases of mistaken identity. Science 315: 928–931. PMID: 17303729
8. (2012) Retraction. Linger RMA, DeRyckere D, Brandao L, Sawczyn KK, Jacobsen KM, Liang X, Keat-ing AK, Graham DK. Mer receptor tyrosine kinase is a novel therapeutic target in pediatric B-cell acutelymphoblastic leukemia. Blood. 2009; 114(13):2678–2687. Blood 120: 1533.
9. Gao L, Wu GJ, Liu B, Shen MZ, Pan TJ, et al. (2014) Retraction. Up-regulation of pVHL along withdown-regulation of HIF-1alpha by NDRG2 expression attenuates proliferation and invasion in renalcancer cells. PLoS ONE 9: e95904. doi: 10.1371/journal.pone.0095904 PMID: 24740414
10. Masters JR (2012) Cell-line authentication: End the scandal of false cell lines. Nature 492: 186. doi: 10.1038/492186c PMID: 23235868
11. MacArthur D (2010) Sample swaps at 23andMe: a cautionary tale. Available: http://scienceblogscom/geneticfuture/2010/06/07/sample-swaps-at-23andme-a-caut/.
12. Barallon R, Bauer SR, Butler J, Capes-Davis A, Dirks WG, et al. (2010) Recommendation of short tan-dem repeat profiling for authenticating human cell lines, stem cells, and tissues. In Vitro Cell Dev BiolAnim 46: 727–732. doi: 10.1007/s11626-010-9333-z PMID: 20614197
13. Reid Y, Storts D, Riss T, Minor L (2004) Authentication of Human Cell Lines by STR DNA ProfilingAnalysis.
14. Sanchez JJ, Phillips C, Borsting C, Balogh K, Bogus M, et al. (2006) A multiplex assay with 52 singlenucleotide polymorphisms for human identification. Electrophoresis 27: 1713–1724. PMID: 16586411
15. Inagaki S, Yamamoto Y, Doi Y, Takata T, Ishikawa T, et al. (2004) A new 39-plex analysis method forSNPs including 15 blood group loci. Forensic Sci Int 144: 45–57. PMID: 15240020
16. Lee HY, Park MJ, Yoo JE, Chung U, Han GR, et al. (2005) Selection of twenty-four highly informativeSNPmarkers for human identification and paternity analysis in Koreans. Forensic Sci Int 148: 107–112. PMID: 15639604
SNP-Profiling of Human Biosamples
PLOS ONE | DOI:10.1371/journal.pone.0116218 February 25, 2015 12 / 14

17. Dixon LA, Murray CM, Archer EJ, Dobbins AE, Koumi P, et al. (2005) Validation of a 21-locus autoso-mal SNPmultiplex for forensic identification purposes. Forensic Sci Int 154: 62–77. PMID: 16182950
18. Gill P (2001) An assessment of the utility of single nucleotide polymorphisms (SNPs) for forensic pur-poses. Int J Legal Med 114: 204–210. PMID: 11355396
19. Pakstis AJ, SpeedWC, Fang R, Hyland FC, Furtado MR, et al. (2010) SNPs for a universal individualidentification panel. Hum Genet 127: 315–324. doi: 10.1007/s00439-009-0771-1 PMID: 19937056
20. Lou C, Cong B, Li S, Fu L, Zhang X, et al. (2011) A SNaPshot assay for genotyping 44 individual identifi-cation single nucleotide polymorphisms. Electrophoresis 32: 368–378. doi: 10.1002/elps.201000426PMID: 21298663
21. Johansen P, Andersen JD, Borsting C, Morling N (2013) Evaluation of the iPLEX(R) Sample ID PlusPanel designed for the SequenomMassARRAY(R) system. A SNP typing assay developed for humanidentification and sample tracking based on the SNPforID panel. Forensic Sci Int Genet 7: 482–487.doi: 10.1016/j.fsigen.2013.04.009 PMID: 23948317
22. Nassir R, Kosoy R, Tian C, White PA, Butler LM, et al. (2009) An ancestry informative marker set for de-termining continental origin: validation and extension using human genome diversity panels. BMCGenet 10: 39. doi: 10.1186/1471-2156-10-39 PMID: 19630973
23. Tanabe H, Takada Y, Minegishi D, Kurematsu M, Masui T, et al. (1999) Cell line individualization bySTRmultiplex system in the cell bank found cross-contamination between ECV304 and EJ-1/T24. Tis-sue Culture Research Communications 18: 329–338.
24. Liu J, LeeW, Jiang Z, Chen Z, Jhunjhunwala S, et al. (2012) Genome and transcriptome sequencing oflung cancers reveal diverse mutational and splicing events. Genome Res 22: 2315–2327. doi: 10.1101/gr.140988.112 PMID: 23033341
25. Seshagiri S, Stawiski EW, Durinck S, Modrusan Z, Storm EE, et al. (2012) Recurrent R-spondin fusionsin colon cancer. Nature 488: 660–664. doi: 10.1038/nature11282 PMID: 22895193
26. Greenman CD, Bignell G, Butler A, Edkins S, Hinton J, et al. (2010) PICNIC: an algorithm to predict ab-solute allelic copy number variation with microarray cancer data. Biostatistics 11: 164–175. doi: 10.1093/biostatistics/kxp045 PMID: 19837654
27. Veerappa AM, Padakannaya P, Ramachandra NB (2013) Copy number variation-based polymorphismin a new pseudoautosomal region 3 (PAR3) of a human X-chromosome-transposed region (XTR) in theY chromosome. Funct Integr Genomics 13: 285–293. doi: 10.1007/s10142-013-0323-6 PMID:23708688
28. Vanbrocklin MW, Robinson JP, Whitwam T, Guilbeault AR, Koeman J, et al. (2009) Met amplificationand tumor progression in Cdkn2a-deficient melanocytes. Pigment Cell Melanoma Res 22: 454–460.doi: 10.1111/j.1755-148X.2009.00576.x PMID: 19422607
29. Miller JK, Buchner N, Timms L, Tam S, Luo X, et al. (2014) Use of Sequenom sample ID Plus(R) SNPgenotyping in identification of FFPE tumor samples. PLoS ONE 9: e88163. doi: 10.1371/journal.pone.0088163 PMID: 24551080
30. Castro F, Dirks WG, Fahnrich S, Hotz-Wagenblatt A, Pawlita M, et al. (2013) High-throughput SNP-based authentication of human cell lines. Int J Cancer 132: 308–314. doi: 10.1002/ijc.27675 PMID:22700458
31. Demichelis F, Greulich H, Macoska JA, Beroukhim R, Sellers WR, et al. (2008) SNP panel identificationassay (SPIA): a genetic-based assay for the identification of cell lines. Nucleic Acids Res 36: 2446–2456. doi: 10.1093/nar/gkn089 PMID: 18304946
32. Masters JR, Thomson JA, Daly-Burns B, Reid YA, Dirks WG, et al. (2001) Short tandem repeat profilingprovides an international reference standard for human cell lines. Proc Natl Acad Sci U S A 98: 8012–8017. PMID: 11416159
33. Kuan SF, Byrd JC, Basbaum CB, Kim YS (1987) Characterization of quantitative mucin variants from ahuman colon cancer cell line. Cancer Res 47: 5715–5724. PMID: 3664476
34. Tom BH, Rutzky LP, Jakstys MM, Oyasu R, Kaye CI, et al. (1976) Human colonic adenocarcinomacells. I. Establishment and description of a new line. In Vitro 12: 180–191. PMID: 1262041
35. Suter CM, Norrie M, Ku SL, Cheong KF, Tomlinson I, et al. (2003) CpG island methylation is a commonfinding in colorectal cancer cell lines. Br J Cancer 88: 413–419. PMID: 12569385
36. Gorringe KL, Chin SF, Pharoah P, Staines JM, Oliveira C, et al. (2005) Evidence that both genetic insta-bility and selection contribute to the accumulation of chromosome alterations in cancer. Carcinogenesis26: 923–930. PMID: 15677628
37. Much M, Buza N, Hui P (2014) Tissue identity testing of cancer by short tandem repeat polymorphism:pitfalls of interpretation in the presence of microsatellite instability. Hum Pathol 45: 549–555. doi: 10.1016/j.humpath.2013.10.022 PMID: 24444463
SNP-Profiling of Human Biosamples
PLOS ONE | DOI:10.1371/journal.pone.0116218 February 25, 2015 13 / 14

38. ParsonW, Kirchebner R, Muhlmann R, Renner K, Kofler A, et al. (2005) Cancer cell line identificationby short tandem repeat profiling: power and limitations. Faseb J 19: 434–436. PMID: 15637111
39. Santos FR, Pandya A, Tyler-Smith C (1998) Reliability of DNA-based sex tests. Nat Genet 18: 103.PMID: 9462733
40. Thangaraj K, Reddy AG, Singh L (2002) Is the amelogenin gene reliable for gender identification in fo-rensic casework and prenatal diagnosis? Int J Legal Med 116: 121–123. PMID: 12056520
41. Lins AM, Micka KA, Sprecher CJ, Taylor JA, Bacher JW, et al. (1998) Development and populationstudy of an eight-locus short tandem repeat (STR) multiplex system. J Forensic Sci 43: 1168–1180.PMID: 9846394
42. Buehring GC, Eby EA, Eby MJ (2004) Cell line cross-contamination: how aware are Mammalian cellculturists of the problem and how to monitor it? In Vitro Cell Dev Biol Anim 40: 211–215. PMID:15638703
43. Masters JR (2002) False cell lines: The problem and a solution. Cytotechnology 39: 69–74. doi: 10.1023/A:1022908930937 PMID: 19003294
44. Coecke S, Balls M, Bowe G, Davis J, Gstraunthaler G, et al. (2005) Guidance on good cell culture prac-tice. a report of the second ECVAM task force on good cell culture practice. Altern Lab Anim 33: 261–287. PMID: 16180980
45. Hartung T, Balls M, Bardouille C, Blanck O, Coecke S, et al. (2002) Good Cell Culture Practice.ECVAMGood Cell Culture Practice Task Force Report 1. Altern Lab Anim 30: 407–414. PMID:12234246
SNP-Profiling of Human Biosamples
PLOS ONE | DOI:10.1371/journal.pone.0116218 February 25, 2015 14 / 14