Human bancroftian filariasis: immunological markers of morbidity and infection
10
Original article Human bancroftian filariasis: immunological markers of morbidity and infection Ashok K. Satapathy a , Erliyani Sartono b , Prakash K. Sahoo a , Mieke A. Dentener c , Edwin Michael d , Maria Yazdanbakhsh b , Balachandran Ravindran a, * a Division of Immunology, Regional Medical Research Centre (Indian Council of Medical Research), Chandrasekharpur, Bhubaneswar 751 023, Orissa, India b Department of Parasitology, Leiden University Medical Centre, Leiden, The Netherlands c Research Institute Maastricht (NUTRIM), Department of Respiratory Medicine, Maastricht University, Maastricht, The Netherlands d Department of Infectious Disease Epidemiology, Imperial College of Medical School, London, United Kingdom Received 13 December 2005; accepted 12 May 2006 Available online 9 June 2006 Abstract Induction of host cytokines plays a critical role in infection as well as disease in human filariasis. Measurements of such molecules in plasma could be used as windows of markers both for understanding the pathogenesis of the disease and for identifying markers of morbidity. Eight inflammatory and non-inflammatory host molecules in circulation were quantified in 207 subjects in filariasis endemic area of Orissa, India. IL-6, IL-8, IL-10, TNF-a, TNFR-I, TNFR-II, LBP and sICAM-1 were quantified by immunoassays and were analyzed by multivariate explor- atory data analysis methods followed by multivariate analysis of variance. Raised levels of IL-6 and IL-8 emerged as markers of acute as well as chronic disease, while increased TNF-a was a feature found only in acute filariasis. Decreased sICAM-1 was a feature found only in asymp- tomatic subjects with filarial infection. There was a dichotomy in plasma levels of two TNF receptors between infected subjects and patients with filarial disease. Since plasma levels of these cytokines are often determined by host genetics, studies on cytokine genetic polymorphisms could offer new insights into the relationship between infection and disease in human lymphatic filariasis. Ó 2006 Elsevier SAS. All rights reserved. Keywords: Morbidity markers; Filariasis; Wuchereria bancrofti; Cytokines; TNF-a; TNF receptors 1. Introduction A spectrum of clinical manifestations can be observed in human communities within lymphatic filariasis endemic areas. Acute filarial disease is characterized by periodic and self- limiting episodes of adenolymphangitis, fever and associated constitutional symptoms, while the chronic diseases include long-lasting and often irreversible manifestations such as lymphedema and/or hydrocele [1]. Microfilariae carriers on the other hand are generally free of overt clinical symptoms. A significant proportion of endemic subjects harbor adult filar- ial worms in their lymphatics without displaying peripheral microfilaremia and these subjects are also generally asymp- tomatic [2,3]. It is assumed that repeated episodes of acute disease could eventually lead to development of chronic man- ifestations such as lymphedema/elephantiasis [4]. However, the factors that contribute to this sequence of progression of the disease are largely unknown. Infected subjects can sustain infection for several years without displaying clinical manifes- tation; prevalence studies in age stratified populations in endemic areas have shown that chronic disease forms gener- ally manifest after many years of exposure to infective larvae, * Corresponding author. Director, Institute of Life Sciences, Nalco Square, Bhubaneswar 751023, India. Tel./fax: þ91 674 2301399. E-mail addresses: [email protected], [email protected] (B. Ravindran). 1286-4579/$ - see front matter Ó 2006 Elsevier SAS. All rights reserved. doi:10.1016/j.micinf.2006.05.003 Microbes and Infection 8 (2006) 2414e2423 www.elsevier.com/locate/micinf
Transcript of Human bancroftian filariasis: immunological markers of morbidity and infection

Microbes and Infection 8 (2006) 2414e2423www.elsevier.com/locate/micinf
Original article
Human bancroftian filariasis: immunologicalmarkers of morbidity and infection
Ashok K. Satapathy a, Erliyani Sartono b, Prakash K. Sahoo a, Mieke A. Dentener c,Edwin Michael d, Maria Yazdanbakhsh b, Balachandran Ravindran a,*
a Division of Immunology, Regional Medical Research Centre (Indian Council of Medical Research),Chandrasekharpur, Bhubaneswar 751 023, Orissa, India
b Department of Parasitology, Leiden University Medical Centre, Leiden, The Netherlandsc Research Institute Maastricht (NUTRIM), Department of Respiratory Medicine, Maastricht University, Maastricht, The Netherlands
d Department of Infectious Disease Epidemiology, Imperial College of Medical School, London, United Kingdom
Received 13 December 2005; accepted 12 May 2006
Available online 9 June 2006
Abstract
Induction of host cytokines plays a critical role in infection as well as disease in human filariasis. Measurements of such molecules in plasmacould be used as windows of markers both for understanding the pathogenesis of the disease and for identifying markers of morbidity. Eightinflammatory and non-inflammatory host molecules in circulation were quantified in 207 subjects in filariasis endemic area of Orissa, India.IL-6, IL-8, IL-10, TNF-a, TNFR-I, TNFR-II, LBP and sICAM-1 were quantified by immunoassays and were analyzed by multivariate explor-atory data analysis methods followed by multivariate analysis of variance. Raised levels of IL-6 and IL-8 emerged as markers of acute as well aschronic disease, while increased TNF-a was a feature found only in acute filariasis. Decreased sICAM-1 was a feature found only in asymp-tomatic subjects with filarial infection. There was a dichotomy in plasma levels of two TNF receptors between infected subjects and patients withfilarial disease. Since plasma levels of these cytokines are often determined by host genetics, studies on cytokine genetic polymorphisms couldoffer new insights into the relationship between infection and disease in human lymphatic filariasis.� 2006 Elsevier SAS. All rights reserved.
Keywords: Morbidity markers; Filariasis; Wuchereria bancrofti; Cytokines; TNF-a; TNF receptors
1. Introduction
A spectrum of clinical manifestations can be observed inhuman communities within lymphatic filariasis endemic areas.Acute filarial disease is characterized by periodic and self-limiting episodes of adenolymphangitis, fever and associatedconstitutional symptoms, while the chronic diseases includelong-lasting and often irreversible manifestations such as
* Corresponding author. Director, Institute of Life Sciences, Nalco Square,
Bhubaneswar 751023, India. Tel./fax: þ91 674 2301399.
E-mail addresses: [email protected], [email protected] (B.
Ravindran).
1286-4579/$ - see front matter � 2006 Elsevier SAS. All rights reserved.
doi:10.1016/j.micinf.2006.05.003
lymphedema and/or hydrocele [1]. Microfilariae carriers onthe other hand are generally free of overt clinical symptoms.A significant proportion of endemic subjects harbor adult filar-ial worms in their lymphatics without displaying peripheralmicrofilaremia and these subjects are also generally asymp-tomatic [2,3]. It is assumed that repeated episodes of acutedisease could eventually lead to development of chronic man-ifestations such as lymphedema/elephantiasis [4]. However,the factors that contribute to this sequence of progression ofthe disease are largely unknown. Infected subjects can sustaininfection for several years without displaying clinical manifes-tation; prevalence studies in age stratified populations inendemic areas have shown that chronic disease forms gener-ally manifest after many years of exposure to infective larvae,

2415A.K. Satapathy et al. / Microbes and Infection 8 (2006) 2414e2423
Table 1
Details of study populationa
Categories EC (1) AS (2) CR (3) EL (4) HYD (5) ACþ (6) AC� (7)
Sample no. (n)
male/female
27 (15/12) 25 (18/7) 22 (10/12) 24 (8/16) 23 (23/0) 23 (10/13) 63 (32/31)
Age median (range) 20 (9e60) 26 (12e65) 35 (10e62) 50 (20e75) 31 (19e65) 31 (15e70) 37 (14e82)
Mf status (%) 0 100 0 0 0 NDb NDb
Mf density/20 ml (GMI) 0 6.96 0 0 0 NDb NDb
CFA status (%) 0 88 100 29.2 30.43 100 0
CFA density (GMI) 0 26418 974 176 518 1571 0
Clinical symptoms No No No Yes Yes Yes Yes
a EC: Endemic controls; AS: asymptomatic microfilariae carriers; CR: cryptic; EL: elephantiasis; HYD: hydrocele; ACþ: acute cases with circulating filarial
antigens; AC�: acute cases without circulating filarial antigens; GMI: geometric mean index of positive cases.b Day-time collection of blood.
while a significant number of subjects are found to acquirefilarial infections at relatively younger ages [5]. Host immuneresponses appear to contribute significantly to parasite biologyas well as disease development in infected mammals [6],although we lack clear insight into the specific immunologicalfactors that contribute to one or the other forms of filarialdisease. Studies in recent years have resulted in growing evi-dence in support of the involvement of various inflammatorycytokines in parasite infections, where a central role forTNF-a has been attributed. The causal role for TNF-a inpathology associated with malaria has been established bythe successful use of TNF-a inhibitors in ameliorating thedisease in humans [7,8]. TNF-a is a known inflammatory me-diator capable of producing symptoms such as chills, fever andmyalgia in malaria [9], features that are commonly observed inacute filariasis. We had previously reported elevated levels ofTNF-a in patients and an association between circulatingTNF-a levels and severity of acute filariasis; relatively lowlevels of TNF-a were detected in microfilariae carriers or inpatients with chronic disease manifestations [10]. This studyhowever was undertaken when assays for quantifying circulat-ing filarial antigens (CFA) that detect cryptic infections werenot available. The discovery of endobacteria such as wolba-chia in filarial parasites that contain an LPS-like moleculethat induces TNF-a further emphasizes the need to reinvesti-gate TNF-a in human filariasis [11,12].
Here, we have thus measured TNF-a, TNF receptors andother cytokines such as IL-6, IL-8, lipopolysaccharide bindingprotein (LBP), sICAM-1 and IL-10, in a large cohort of 207subjects in an attempt to identify possible immunologicalmarkers of morbidity that could attribute a causal role forthe inflammatory response observed in filariasis. Circulatingconcentrations of TNF-a tend to remain elevated for longerperiods, and hence serum levels of the soluble TNF-a receptorsI (TNFR-I) and II (TNFR-II) have been found to be bettermarkers for tissue TNF production than measurement of serumlevels of TNF-a [13e19]. As a consequence, both serumlevels of TNF-a and these TNF receptors have been measuredin this study. The relationships between these immune com-ponents and their association with different chronic mani-festations were also analyzed with a view to further ourunderstanding of the pathogenesis and progression of filarialdisease.
2. Materials and methods
2.1. Study samples and patients
The study population was drawn from the coastal areas inthe state of Orissa, India. These areas are endemic for bancrof-tian filariasis of nocturnal periodicity. Initially a mass bloodsurvey was undertaken in three villages, Ranpur, Rathipurand Ekamkona, by collection of 20 ml of nocturnal blood sam-ples. Clinical assessment of subjects was carried out both bytaking a detailed clinical history using a proforma and byphysical examination. Subsequently, venous blood samples(4e5 ml) were collected into sterile EDTA tubes from thosesubjects who were included in the current investigation. Thesamples were transported to the laboratory within 2e3 h aftercollection; the plasma separated and stored at �70 �C untiluse. The venous blood (1 ml) was used for quantification ofMf by passing through a nucleopore membrane. The patientswere categorized as follows: (1) endemic controls e asymp-tomatic individuals without demonstrable circulating Mf andcirculating filarial antigens; (2) Mf carriers e individualswith circulating Mf of nocturnal periodicity; (3) cryptic casese amicrofilaremic individuals with circulating filarialantigens; (4) chronic filariasis e patients presenting with per-sistent lymphedema/elephantiasis or hydrocele for four ormore years; and (5) acute filariasis e patients presentingwith a history of one or more episodes of adenolymphangitis(ADL). Patients with acute symptoms were divided furtheron the basis of their CFA status. Blood samples from acutefilariasis cases were collected from patients reporting toa clinic and for other groups; the samples were collected inthe above-mentioned villages. Approval of the institutionalethical committee of the Regional Medical Research Centre,Bhubaneswar, was obtained for the project, and informed con-sent was given by each of the subjects.
2.2. Og4C3 circulating antigen assay
Plasma samples were examined for circulating filarialantigen. The Trop Bio ELISA kit was used for quantifyingantigen according to the manufacturer’s (Tropical BiotechnologyPty. Ltd., Townsville, Australia) protocol and expressed asantigen units.

2416 A.K. Satapathy et al. / Microbes and Infection 8 (2006) 2414e2423
2.3. Cytokine and soluble receptor assays
Plasma concentrations of TNF-a, IL-6, IL-8 and IL-10 wereall conducted using commercially available sandwich ELISAassays (Sanquin, Amsterdam) according to the manufacturer’sinstructions. The levels were determined in duplicate usingstandard curves obtained with recombinant cytokines thatwere included in each assay plate. TNF receptors, LBP andsICAM-1 were measured as described elsewhere [20e22]using MR1-1 and biotinylated polyclonal anti-human TNFR-I, MR2-2 and biotinylated polyclonal anti-human TNFR-II,polyclonal anti-human LBP and biotinylated polyclonal anti-human LBP, HM2 and biotinylated HM1 for sICAM-1.
2.4. Statistical analysis
All response data were logarithmically transformed (loge
(nþ1)) prior to performing statistical analyses. Two majortypes of analyses were performed. First, exploratory data anal-ysis (EDA) methods based on density plots, box plots andbivariate scatter plots were used to examine both the statisticalcharacteristics of each investigated response variable by infec-tion and disease category and the overall correlations betweenthese variables across the study population. Guided bythese preliminary results, the association of the response vari-ables with patient infection and disease traits or categorieswas then examined using multivariate analysis of variance(MANOVA). This enabled us to control for the likelihood ofmaking a type I error when assessing which trait from the suiteof multiple response variables studied may actually contributeindividually or collectively to differences among infection ordisease subgroups [23]. The Wilk’s lambda statistic was usedto test the significance of among-group differences, while posthoc procedures based on pair-wise contrasts and canonical
analyses were used to determine (1) which of the variousgroups actually differed from each other (pair-wise contrasts)and (2) which responses and what type of relationships amongthem were responsible for the observed inter-group differences(canonical analysis) [23e25].
3. Results
3.1. Clinical categorization and selectionof morbidity markers of filariasis
Based on the status of microfilaremia, antigenemia, andmanifestations of acute or chronic disease, the study subjectswere classified into seven categories as shown in Table 1.The first category, which was free of acute or chronic filarialdisease and demonstrable filarial infection, was considered‘endemic controls’. The remaining six categories were classi-fied based on infection status (microfilaremia/antigenemia)and/or manifestation of acute or chronic forms of the disease.Categories 1, 2, 3, 6 and 7 were homogeneous and no overlap-ping features were observed with other categories. About 30%of patients in categories 4 and 5 representing two forms ofchronic disease were found to harbor filarial infection asrevealed by antigenemia.
3.2. Distribution of different plasma correlates
Fig. 1 shows that the eight different response variables mea-sured in each study patient differed both in terms of theirobserved mean levels (as portrayed by the box plots) and var-iance (as revealed by the dot density plots of the individuallogged data) in each of the seven chosen categories. The scat-ter plot matrix displayed in Fig. 2 reveals the existence ofsignificant correlations between many of the eight variables
1 2 3 4 5 6 7-5
0
5
10
1 2 3 4 5 6 7-101
23456
7
1 2 3 4 5 6 70
5
10
15
1 2 3 4 5 6 7012345678
1 2 3 4 5 6 71
2
3
4
5
1 2 3 4 5 6 7 1 2 3 4 5 6 72
3
4
5
6
7
8
9
3
4
5
6
7
8
LN
IL
-6
LN
IL
-10
LN
IL
-8
LN
T
NF
-α
LN
L
BP
LN
T
NF
R-I
LN
IC
AM
1
CATEGORY CATEGORY CATEGORY CATEGORY
CATEGORY
1 2 3 4 5 6 75
6
7
8
9
10
LN
T
NF
R-II
CATEGORY CATEGORY CATEGORY
Fig. 1. Box plots superimposed on dot density plots of the data (natural logged values) obtained from each study individual showing variation in means of the eight
immune variables by infection/disease category. Bars within boxes indicate the mean values observed for each immune variable while the dots represent the in-
dividual datum.
2417A.K. Satapathy et al. / Microbes and Infection 8 (2006) 2414e2423
LN
IL
6L
NIL
10
LN
IL
8L
NT
NF
LN
LB
PL
NT
NF
R7
5L
NT
NF
R5
5
LNIL6
LN
IC
AM
1
LNIL10 LNIL8 LNTNF LNLBP LNTNFR75 LNTNFR55 LNICAM1
Fig. 2. A scatter plot matrix of the immunological data (natural logged values) illustrating the bivariate relationships between all possible combinations of the eight
immune variables investigated in the study. The curves in each box show the fit of a locally weighted regression smoother [25], while the circles portray the gauss-
ian bivariate ellipsoids for the samples at a nominal probability level of p¼ 0.6827. When the association between each investigated variable increases, the ellipse
for each paired data becomes more elongated in the direction of the observed association.
studied here. The frequency distribution of each variable atthe natural logarithm scale is normal with the exception ofTNF-a, which was found to be partly skewed. The interrelat-edness between most of the response variables supportsthe undertaking of a multivariate approach in the analysis ofthese data.
The results of MANOVA on the effects of the two main fac-tors e host gender and infection/disease category e on theobserved variations among the eight immunological variablesare depicted in Table 2. These indicate that while the differenthost categories may contribute significantly to differences inthese immunological parameters, the sex of individuals didnot affect these between-group variations. The value of the
Wilks’ lambda statistic listed in the table, which indicatesthe proportion of variation not explained by a factor, suggeststhat categorization of the present 207 cases (into the seven hostgroups) may account for approximately 62% of the observed
Table 2
Multivariate analysis of the effects of sex and infection/disease categories on
the combined host filarial immune responses (natural log intensities)
Source Wilks’
lambda
F Num. df Den. df Pr> F
Sex 0.954 1.12 8 186 0.3529
Category 0.386 4.08 48 919.26 <0.0001
Sex� category 0.823 0.93 40 813.55 0.5979
2418 A.K. Satapathy et al. / Microbes and Infection 8 (2006) 2414e2423
variation in the eight selected parameters. Pair-wise contrastsbetween the seven infection/disease categories to ascertainwhich of the individual categories differed significantly fromone another in terms of the observed immunological responses
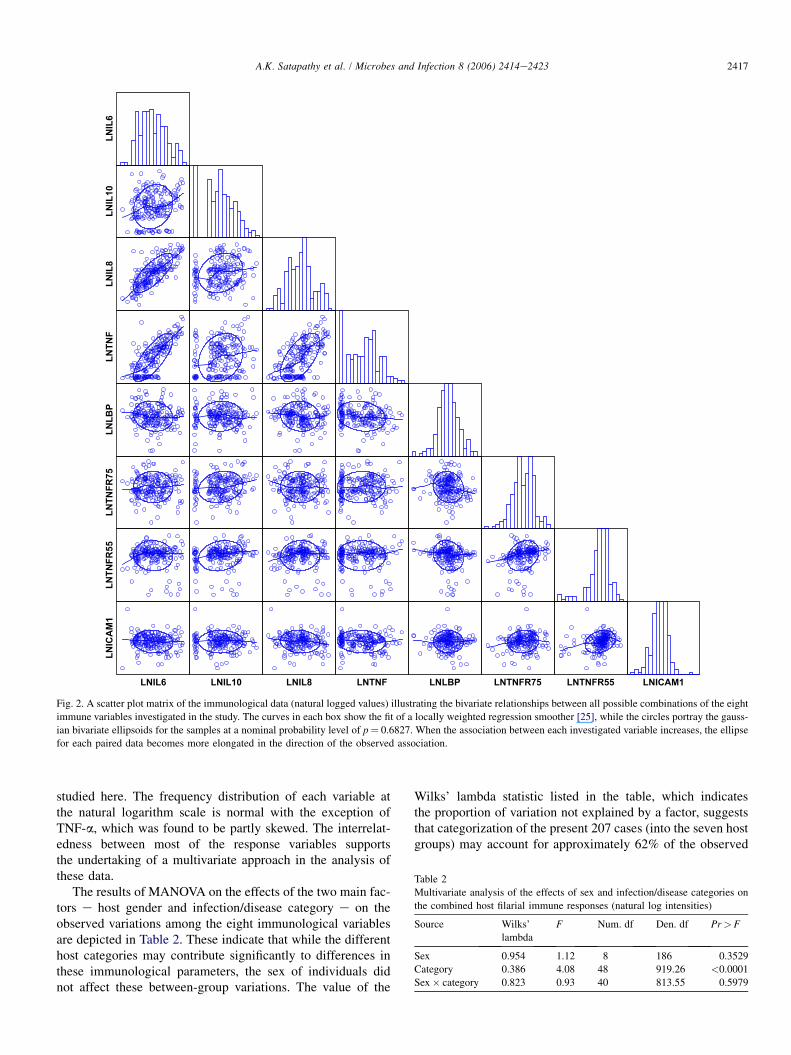
Table 3
Pair-wise contrasts of the seven infection/disease categories based on the com-
bineda (multivariate) host filarial immune responses (natural log intensities)
Contrast Wilks’ lambda F Num. df Den. df Pr> F
1 vs. 2 0.900 2.66 8 192 0.0087
1 vs. 3 0.787 6.49 8 192 <.0001
1 vs. 4 0.851 4.21 8 192 0.0001
1 vs. 5 0.933 1.72 8 192 0.0970
1 vs. 6 0.852 4.16 8 192 0.0001
1 vs. 7 0.916 2.18 8 192 0.0303
2 vs. 3 0.897 2.73 8 192 0.0072
2 vs. 4 0.903 2.59 8 192 0.0104
2 vs. 5 0.842 4.48 8 192 <.0001
2 vs. 6 0.805 5.82 8 192 <.0001
2 vs. 7 0.893 2.83 8 192 0.0047
3 vs. 4 0.893 2.86 8 192 0.0050
3 vs. 5 0.713 9.64 8 192 <.0001
3 vs. 6 0.659 12.4 8 192 <.0001
3 vs. 7 0.790 6.37 8 192 <.0001
4 vs. 5 0.805 5.81 8 192 <.0001
4 vs. 6 0.737 8.57 8 192 <.0001
4 vs. 7 0.869 3.61 8 192 0.0006
5 vs. 6 0.929 1.82 8 192 0.0762
5 vs. 7 0.954 1.15 8 192 0.3310
6 vs. 7 0.959 1.02 8 192 0.4196
a Summary of increases/decreases in eight immunological parameters in
seven different clinical groups is shown in Fig. 3.
are shown in Table 3 and reveal for example that in compari-son to endemic controls, categories 2, 3, 4, 6 and 7 differedsignificantly in their combined immunological responses.The results also reveal that the last three categories (hydrocelecases and acute filariasis patients with or without antigenemia)were comparable in their immunological responses.
3.3. Immunological markers differentiateinfection and disease
Fig. 3 presents the results of the pair-wise contrast testsshown in Table 3 in terms of the comparative differences inthe mean values of the eight immune response variablesobserved in each of the seven patient infection/disease cate-gories. Thus, here, the blank boxes in the figure indicate nosignificant differences; boxes with stripes indicate significantincreases, and ones with vertical stripes indicate significant de-creases in the levels of a given variable for each of the compar-isons shown. The results show that significantly elevated levelsof IL-6 and IL-8 were observed in categories 4, 5, 6 and 7, allcharacterized by one or the other forms of clinical filariasiswhen compared with endemic controls (category 1); increasedTNF-a on the other hand was a feature found only in patientswith acute disease (categories 6 and 7) and not in patients dis-playing chronic forms of the disease viz., elephantiasis andhydrocele. TNF-a levels in chronic disease were comparableto those of endemic controls. In contrast, the two markers ofdisease morbidity viz., IL-6 and IL-8 were not significantly
IL-6 IL-10 IL-8 TNF-α LBP TNFR-II TNFR-I ICAM-1
AS(2)CR(3)EL(4)Hyd(5)AC-(6)
EC(1) vs.
AC+(7)CR(3)EL(4)Hyd(5)AC-(6)
AS(2) vs.
AC+(7)EL(4)Hyd(5)AC-(6)
CR(3) vs.
AC+(7)Hyd(5)AC-(6)EL(4) vs.
AC+(7)AC-(6)
Hyd(5) vs.
AC+(7)AC-(6) vs.
Decrease Increase
AC+(7)
Fig. 3. Summary of increase/decrease in eight immunological parameters in seven groups. Comparisons are made between each of the groups: EC e Endemic controls;
AS e asymptomatic microfilariae carriers; CR e cryptic; EL e elephantiasis; HYD e hydrocele; ACþve e acute cases with circulating filarial antigens; AC�ve e
acute cases without circulating filarial antigens. Pair-wise contrasts of the seven infection/disease categories based on the combined (multivariate) host filarial re-
sponses (natural log intensities) are shown in Table 3 and three salient relationships between the eight immunological parameters are summarized in Table 4.

2419A.K. Satapathy et al. / Microbes and Infection 8 (2006) 2414e2423
Table 4
Canonical analysis showing the parameters and statistics of the three significant canonical variates for filarial immune response data (natural log intensities)a
Eigen-value Percent
(explainable variation)
Squared canonical
correlation
(total variation explained)
Standardized canonical coefficients
IL-6 IL-8 IL-10 TNF TNFR-II TNFR-I LBP ICAM1
Can1 0.7777 0.671 0.437 �0.513 0.147 0.348 0.383 L0.862 0.929 0.364 0.419
Can2 0.1569 0.135 0.136 L0.796 0.144 1.007 0.474 0.382 0.074 0.203 �0.426
Can3 0.1204 0.104 0.107 1.186 �0.234 0.309 L1.087 0.330 0.166 0.184 0.253
Values of canonical coefficients given in bold indicate the two most important response variables associated with each of the three estimated variates.a Summary of relationships between the eight immunological correlates in seven categories is shown in Fig. 3 while details of the three most significant cor-
relates are shown above.
EC Dis -ve Dis+ve EC Dis-ve Dis+ve10
100
1000
10000
TNFR-II TNFR-I
p=0.028 p=0.05
p<0.0001
TN
FR
(p
g/m
l)
EC CFA+ve CFA-ve EC CFA+ve CFA-ve10
100
1000
10000
TNFR-II TNFR-I
P=0.06 P=0.067
P=0.001
TN
FR
(p
g/m
l)
A
B
Fig. 4. The 207 subjects were reclassified as shown below for analysis of TNF
receptors in the context of disease or infection. Plasma levels of TNFR-I and
TNFR-II were measured by ELISA. Each dot represents the TNF receptor
levels in pg/ml of individual sera. The horizontal bars represent the mean.
(a) (1) Endemic controls (n¼ 27): asymptomatic subjects with no demonstra-
ble filarial infection; (2) disease positive (n¼ 133): patients with acute and/or
chronic filariasis (may or may not have demonstrable infection); (3) disease
negative (n¼ 47): endemic subjects displaying no clinical manifestations of
filariasis but with demonstrable filarial infection viz. Mf and/or CFA. For
TNFR-II: EC vs. Diseve, p¼ 0.028; and Diseve vs. Disþve, p¼ 0.05; for
TNFR-I: Diseve vs. Disþve, p¼< 0.0001, by Bonferroni multiple compari-
son tests following significant ANOVAs of natural log transformed data. (b)
(1) Endemic controls (n¼ 27): asymptomatic subjects with no demonstrable
filarial infection, (2) infection positive (n¼ 81): patients with demonstrable fi-
larial infection (Mf and/or CFA) with or without disease designated as
CFAþve; (3) infection negative (n¼ 99): subjects with no demonstrable filar-
ial infection but displaying acute or chronic disease, designated CFA�ve. For
TNFR-II: EC vs. CFAþve, p¼ 0.06; and CFAþve vs. CFA�ve, p¼ 0.067; for
TNFR-I: CFAþve vs. CFA�ve, p¼ 0.001, by Bonferroni multiple comparison
tests following significant ANOVAs of natural log transformed data.
elevated in categories 2 and 3 consisting of asymptomaticsubjects with patent filarial infection e category 2 character-ized by presence of circulating Mf and category 3 e amicro-filaremic but with antigenemia. Significantly decreasedlevels of circulating sICAM-1 in comparison to endemic con-trols characterized these two groups. On the other hand no sig-nificant elevation of sICAM-1 levels was observed in patientsdisplaying clinical symptoms (categories 4, 5, 6 and 7) in re-lation to endemic controls. Thus, increased levels of IL-6 andIL-8 emerged as a marker of disease expression whereas de-creased levels of sICAM-1 were a feature of asymptomaticsubjects with filarial infection (Fig. 3).
The results of a canonical analysis to determine which com-binations of the eight immune response variables are responsi-ble for the estimated differences among the present infection/disease groups are summarized in Table 4. A canonical variateis the linear combination of dependent variates that can help todiscriminate between categories based on the measured multi-ple response variables. The three significant canonical variatesderived for the present data (via the MANOVA analysis) arelisted in Table 4, and show that canonical variate 1, with aneigenvalue of 0.77 and accounting for 0.67 of explainablevariation and about 0.44 of the total variation in the groupof variables studied, may represent the composite variate
Elephantiasis Hydrocele
0.1
1
10
100
p=0.005
TN
FR
-II: T
NF
R-I ratio
Fig. 5. Ratio of TNFR-II to TNFR-I in elephantiasis (n¼ 24) and hydrocele
(n¼ 23) patients, showing significantly higher mean ratio in elephantiasis
vs. hydrocele subjects (ANOVA of square root transformed data, F¼ 8.615,
df¼ 1, 45, p¼ 0.005).

2420 A.K. Satapathy et al. / Microbes and Infection 8 (2006) 2414e2423
that results in producing the greatest amount of among-category to within-category variation, and thus has the greatestpower for discriminating among the present categories. Thestandardized canonical coefficients shown in the table indicatethe correlations (in both magnitude and sign) between each ofthe three estimated variates and each of the individual re-sponse variables examined. For canonical variate 1, theseresults show that the two TNF-a receptors contribute mostto among-category discrimination. Furthermore, the negativecorrelation between the two TNF-a receptors (coefficientswith opposite signs; Table 4) indicates a clear dichotomy inthe roles of these receptors in discriminating between thevarious host infection/disease categories. In particular, a signif-icant finding of this study is that the inverse relationship ofthese two TNF receptors appears to be related to their levelsobserved in filarial infection and disease. Thus, TNFR-I wassignificantly elevated in patients with disease manifestationsi.e., categories 4, 5, 6 and 7 (Fig. 4a), while TNFR-II on theother hand was significantly elevated in subjects with patentinfection, categories 2, 3, 6 and in 30% of patients with anti-genemia in categories 4 and 5 (Fig. 4b). Elevated TNFR-IItherefore appears to constitute a general marker of patent in-fection while elevated TNFR-I appears to be a general markerof filarial disease. While the above conclusions are broadlyvalid, it is apparent that exceptions could be observed on a finerlevel: for example, the two forms of chronic filarial diseaseswere significantly different from each other when the ratioof TNFR-II and TNFR-I were analyzed e elephantiasispatients displaying a significantly higher ratio than hydrocelepatients (Fig. 5). Interestingly, the only host response parame-ter (quantified in this study) that failed to discriminate between
the seven categories of human filariasis was the inflammatorymolecule, LBP (Fig. 3).
4. Discussion
Human lymphatic filariasis is a complex disease e many ofthe infected subjects do not display overt clinical manifesta-tion while a majority of patients with acute and/or chronicdisease are largely free of demonstrable infection [1]. Thepopulation in an endemic area can thus be classified basedon the presence/absence of disease and/or infection [26].The current study is the first of its kind to classify the filarialendemic population into seven well-defined groups based oninfection and disease status, and to use the levels of eight dif-ferent molecules of the host immune response observed inthese groups both to inspect the role of immune responses,particularly inflammatory vs. anti-inflammatory responses, inthe pathogenesis of disease, and to examine their roles as po-tential markers of morbidity. Since cytokine levels in a givenpopulation can be dictated by host genetics and more criticallyby nutritional factors [27], a novel feature of this study was touse internal controls for all the immunological parameters bycareful identification of normal subjects in the same endemicvillages (‘endemic controls’).
Plasma levels of pro- and anti-inflammatory host moleculesare not necessarily robust windows for understanding theevents that occur in different organs or cells in disease condi-tions e the half-life of the molecules are generally not verylong and time of collection of the samples could significantlyinfluence the levels, particularly in some of the acute diseaseconditions. More importantly, each of the host cytokines could
HUMAN LYMPHATIC
FILARIASIS
IL-6, IL-8,TNFR-I Filarial Disease
+VE(4,5,6,7)
Filarial Infection+VE(2,3)
TNFR-II
sICAM-1
TNF-αTNF-αAcute Disease
(6,7)
ChronicDisease
(4,5)
AS Mf +VEcases
(2)
AS CFA +VECases
(3)
TNFR-II:Iratio
TNFR-II:Iratio
Elephantiasis(4)
*Numbers of parameters indicate identity of categories viz. 2, Mf carriers 4 Elephantiasis etc.(Details of catagories shown in Table 1)
Hydrocele(5)
Fig. 6. Summary status of discriminating host immune response parameters in the seven categories of bancroftian filariasis e the comparisons shown are with
reference to levels in endemic controls (numbers in parentheses indicate identity of categories viz., two Mf carriers, four elephantiasis, etc. Details of categories
are shown in Table 1).

2421A.K. Satapathy et al. / Microbes and Infection 8 (2006) 2414e2423
have agonistic or antagonistic effects on other molecules e thusimposing limitations on using these parameters for drawingconclusions on their biological activity in a given disease con-dition [28]. Notwithstanding these limitations, measurement ofplasma cytokine levels has offered insights as markers of mor-bidity and also in the diagnosis and/or prognosis of several dis-eases [14e19].
The first major observation in this regard from this study isthat elevated plasma levels of IL-6 and IL-8 were observed in pa-tients displaying filarial disease in comparison to endemic con-trols. By contrast, the levels of these two cytokines inasymptomatic subjects with filarial infection were comparableto endemic controls. Circulating levels of IL-6 and IL-8 thusemerged as a marker of acute as well as chronic filarial disease.Similarly, significantly raised TNF-a levels were also found tobe a feature of acute filariasis (Fig. 3). While this finding essen-tially confirms our previous observations [10], an interestingcontrast in the two TNF-a receptor levels was observed in thecurrent study e lymphedema/elephantiasis displaying signifi-cantly higher ratios of type II vs. type I TNF receptors, and hy-drocele cases displaying lower ratios (Fig. 5). The causeeeffectrelationship between such contrasting features of TNF-a recep-tors and pathogenesis of the two completely diverse forms ofchronic disease manifestation is not currently clear. Unfortu-nately, this issue cannot be very successfully resolved by con-ducting similar investigations in animal models of filariasis,since development of chronic disease is not a consistent featurein animal models.
The relationship between infection and disease in humanfilariasis has been a subject of intense debate, particularlywith respect to explanations as to why subjects with demon-strable infection are largely asymptomatic and most of thepatients with disease manifestations are free of infection[29,30]. Three different models have been proposed for thisphenomenon, and empirical evidence of development ofchronic disease manifestation without necessarily goingthrough a phase of patent infection has been gaining momen-tum in recent years [31,32]. This has been suggested to implya broad dichotomy of subjects e some being prone to developdisease and some, patent infection. The observations on ele-vated inflammatory molecules such as IL-6, IL-8 and TNFR-I in patients with disease on the one hand and decreased levelsof ICAM-1 and elevated anti-inflammatory molecules likeTNFR-II in asymptomatic subjects on the other, appear to sug-gest that these features of the host immune response may lie atthe heart of this proposed dichotomy in the development ofinfection or disease in filariasis.
PBMC of Mf carriers has been shown to release higher levelsof IL-10 than in patients with chronic lymphatic pathology, thusattributing a role for this cytokine in downregulating effector im-mune responses in Mf carriers. However, antibodies to IL-10failed to significantly reverse unresponsiveness of antigen in-duced T-cell proliferation/IFN g production in microfilaremicindividuals [33]. The plasma IL-10 levels measured in this studyfailed to throw further light on the role of IL-10 in the immuno-regulation in human filariasis, since there were no significantdifferences in IL-10 plasma levels in the seven categories of
human filariasis. It is however possible that plasma levels ofIL-10 do not reflect their actual biological role at the tissue level,which could determine the outcome of infection/disease.
A key observation of this study concerns the finding thatthe levels of TNF receptors TNFR-I and TNFR-II also differ-entiated subjects with active infection from those with activedisease. TNFR-I (which was significantly raised in patientswith clinical symptoms) is known to be a receptor that medi-ates inflammatory signaling of TNF-a [34]. On the other hand,in asymptomatic subjects with filarial infection, TNFR-II(known to be a TNF-a antagonist) was found to be elevated.The plasma levels of these two TNF receptors appear to berelated to their genotypes e for example TNFR-II levelswere significantly higher in subjects with TNFR-II M allelethan in those with TNFR-II R allele [35]. The associationbetween genotypes and plasma levels points towards theneed to undertake investigations on the genetic polymor-phisms of TNFR-I and TNFR-II in filarial endemic areas esuch studies can also be expected to offer clear insights intocontentious issues on the genetic basis of infection and diseasein human lymphatic filariasis.
Two related but not comparable studies have been reportedvery recently, the results of which have a bearing on thepresent conclusions. The first study investigated plasma levelsof several chemokines in a small number of cases in three groupsof patients (endemic controls, chronically infected asymptom-atic subjects and patients with elephantiasis [36]). One of thechemokines, IL-8, was also investigated in the present studyand similar observations of elevation in filarial disease were ob-served. The second recent study addressed cellular adhesionmolecules and found decreased levels of soluble L-selectin(CD62L) in patients with chronic forms of the disease comparedto controls [37]. These investigators studied plasma levels of sI-CAM-1 in several other categories of filariasis but not in Mf car-riers e this precludes its comparison with the current study inwhich decreased levels of sICAM-1 were found in microfilare-mic subjects. Based on the combined observations of eight im-mune parameters in seven different categories of subjects ina filariasis endemic area, we propose the following model of hu-man bancroftian filariasis (Fig. 6) in which enhanced circulatingIL-6 and IL-8 are associated with disease state and lowered sI-CAM-1 with active infection. Elevated TNF-a is a feature ofacute filariasis disease but not of chronic disease manifestations.The status of the two TNF receptor levels could determine theclinical outcome of hydrocele and elephantiasis. Finally, wenote that the central role of TNF-a in both acute filariasis (pres-ent study) and in post-DEC reactions [20,38] suggests a need forundertaking clinical trials for possible use of available TNF-a in-hibitors for morbidity management of clinical filariasis. Pentox-ifilline, a TNF-a inhibitor and a commonly used drug fortreatment in sickle cell crisis has been found to be a useful ther-apeutic adjunct for clinical management of severe Plasmodiumfalciparum malaria by us and others [7,8]. Demonstrating a sim-ilar effect for TNF-a inhibition in the management of acute filar-ial episodes will clearly add to the arsenal of therapeutic toolscurrently available for the eventual global control of this highlydebilitating disease.

2422 A.K. Satapathy et al. / Microbes and Infection 8 (2006) 2414e2423
Acknowledgements
We thank Dr. S.K. Kar, the Director of Regional MedicalResearch Centre, Bhubaneswar, for sustained support, andProf. Buurman of Research Institute Maastricht (NUTRIM),Department of Respiratory Medicine, Maastricht University,Maastricht, The Netherlands for generously providing reagentsfor TNF receptor assays. The assistance of by Dr. N. Mishraand Mr. B. Rath of filariasis clinics at Puri and Jatani, respec-tively, is deeply appreciated. The Regional Medical ResearchCentre in Bhubaneswar is funded by the Indian Council ofMedical Research, New Delhi, and this project was fundedby European Commission grant: ICA4-CT-2001-10081.
References
[1] V. Kumaraswami, Lymphatic Filariasis, in: T.B. Nutman (Ed.), Imperical
College Press, London, 2000, pp. 103e126.
[2] P.K. Sahoo, J.J. Babu Geddam, A.K. Satapathy, M.C. Mohanty,
B. Ravindran, Bancroftian filariasis: prevalence of antigenaemia and
endemic controls in Orissa, India, Trans. R. Soc. Trop. Med. Hyg. 94
(2000) 515e517.
[3] B. Ravindran, A.K. Satapathy, P.K. Sahoo, J.J. Babu Geddam, Protective
immunity in human bancroftian filariasis: inverse relationship between
antibodies to microfilarial sheath and circulating filarial antigens, Para-
site Immunol. 22 (2000) 633e637.
[4] S.P. Pani, J. Yuvaraj, P. Vanamali, V. Dhanda, E. Michael, B.T. Grenfell,
D.A. Bundy, Episodic adenolymphangitis and lymphoedema in patients
with bancroftian filariasis, Trans. R. Soc. Trop. Med. Hyg. 89 (1995)
72e74.
[5] P.J. Lammie, A.W. High tower, M.L. Eberhard, Age-specific prevalence
of antigenemia in a Wuchereria bancrofti-exposed population, Am. J.
Trop. Med. Hyg. 51 (1994) 348e355.
[6] B. Ravindran, Are inflammation and immunological hyperactivity
needed for filarial parasite development? Trends Parasitol. 17 (2002)
70e73.
[7] B.K. Das, S. Mishra, P.K. Padhi, R. Manish, R. Tripathy, P.K. Sahoo,
B. Ravindran, Pentoxyifylline adjunct improves prognosis of cerebral
malaria in adults, Trop. Med. Int. Health 8 (2003) 680e684.
[8] D. Kwiatkowski, M.E. Molyneux, S. Stephens, N. Curtis, N. Klein,
P. Pointaire, M. Smit, R. Allan, D.R. Brewster, G.E. Grau, Anti-TNF
therapy inhibits fever in cerebral malaria, Q. J. Med. 86 (1993) 91e98.
[9] R.G. Titus, B. Sherry, A. Cerami, The involvement of TNF, IL-1 and IL-6
in immune response to protozoan parasites, Immunol. Today. 12 (1991)
A13eA16.
[10] B.K. Das, P.K. Sahoo, B. Ravindran, A role for tumor necrosis factor-a in
acute lymphatic filariasis, Parasite Immunol. 18 (1996) 421e424.
[11] M.J. Taylor, H.F. Cross, K. Bilo, Inflammatory responses induced by the
filarial nematode Brugia malayi are mediated by lipopolysaccharide-like
activity from endosymbiotic Wolbachia bacteria, J. Exp. Med. 17 (2000)
1429e1436.
[12] M.J. Taylor, A. Hoerauf, Wolbachia bacteria of filarial nematodes, Para-
sitol. Today 15 (1999) 437e442.
[13] M. Van Deuren, Kinetics of tumor necrosis factor-alpha, soluble tumor
necrosis factor receptors, interleukin 1-beta and its receptor antagonist
during serious infections, Eur. J. Clin. Microbiol. Infect. Dis. 13 (1994)
S12eS16.
[14] E.E. Zijlstra, T. Van der Poll, M. Mevissen, Soluble receptors for tumor
necrosis factor markers of disease activity in visceral leishmaniasis,
J. Infect. Dis. 171 (1995) 498e501.
[15] H. Kawaguchi, Y. Ina, S. Ito, S. Sato, Y. Sugiura, H. Tomita, N. Ogisu,
K. Takada, M. Yamamoto, M. Morishita, K. Yoshikawa, Serum levels
of soluble tumor necrosis factor (TNF) receptors in patients with pulmo-
nary tuberculosis, Kekkaku 71 (1996) 259e265.
[16] M.H. Godfried, J.A. Romijn, T. Van der Poll, G.J. Weverling,
E.P.M. Corssmit, E. Endert, J.K.E. Schattenkerk, H.P. Sauerwein, Soluble
receptors for tumor necrosis factor are markers for clinical course but not
for major metabolic changes in human immunodeficiency virus infection,
Metabolism 44 (1995) 1564e1569.
[17] N.P.J. Day, T.T. Hien, T. Schollaardt, P. Phu Loc, L.V. Chuong, T.T. Hong
Chau, N.T. Hoang Mai, N. Hoan Phu, D. Xuan Sinh, N.J. White, M. Ho,
The prognostic and pathophysiologic role of pro and antiinflammatory
cytokines in severe malaria, J. Infect. Dis. 180 (1999) 1288e1297.
[18] J.K. Mwatha, G. Kimani, G.G. Mbugua, J.H. Ouma, J. Mumo,
A.J.C. Fulford, F.M. Jones, A.E. Butterworth, M.B. Roberts, D.W. Dunne,
High levels of TNF, soluble TNF receptors, soluble ICAM-1, and IFN-g,
but low levels of IL-5, are associated with hepatosplenic disease in human
Schistosomiasis Mansoni, J. Immunol. 160 (1998) 1992e1999.
[19] P. Barrera, C. J Haagsma, A.M.Th. Boerbooms, P.L.C. M Van Riel,
G.F. Borm, L.B.A. Van De Putte, J.W. Van Der Meer, Effect of metho-
trexate alone or in combination with sulphasalazine on the production
and circulating concentrations of cytokines and their antagonists: longi-
tudinal evaluation in patients with rheumatoid arthritis, Br. J. Rheumatol.
34 (1995) 747e755.
[20] M. Haarbrink, G.K. Abadi, W.A. Buurman, M.A. Dentener, A.J. Terhell,
M. Yazdanbakhsh, Strong association of interleukin-6 and lipopolysac-
charide-binding protein with severity of adverse reactions after diethyl-
carbamazine treatment of microfilaraemic patients, J. Infect. Dis. 182
(2000) 564e569.
[21] M. Haarbrink, A.J. Terhell, G.K. Abadi, Y. Mitsui, M. Yazdanbakhsh,
Inflammatory cytokines following diethylcarbamazine (DEC) treatment
of different clinical groups in lymphatic filariasis, Trans. R. Soc. Trop.
Med. Hyg. 93 (1999) 665e672.
[22] A.H. Froon, M.J. Bonten, C.A. Gaillard, J.W. Greve, M.A. Dentener,
P.W. de Leeuw, M. Drent, E.E. Stobberingh, W.A. Buurman, Prediction
of clinical severity and outcome of ventilator-associated pneumonia.
Comparison of simplified acute physiology score with systemic inflam-
matory mediators, Am. J. Respir. Crit. Care Med. 158 (1998) 1026e1031.
[23] S.M. Scheiner, MANOVA: multiple response variables and multispecies inter-
actions, in: S.M. Scheiner, J. Gurevitch (Eds.), In Design and Analysis of
Ecological Experiments, Oxford University Press, Oxford, 2001, pp. 99e115.
[24] R.J. Harris, A Primer of Multivariate Statistics, Academic Press,
New York, 1985.
[25] B. Efron, R. Tibshirani, Statistical data analysis in the computer age,
Science 253 (1991) 390e395.
[26] E.A. Ottesen, Infection and disease in lymphatic filariasis: an immuno-
logical perspective, Parasitology 104 (1992) S71eS79.
[27] P. Stenvinkel, B. Lindholm, M. Heimburger, O. Heimburger, Elevated
serum levels of soluble adhesion molecules predict death in patients:
association with malnutrition, inflammation, and cardiovascular disease,
Nephrol. Dial. Transplant. 15 (2000) 1624e1630.
[28] C.E. Hack, L.A. Aarden, L.G. Thijs, Role of cytokines in sepsis, Adv.
Immunol. 66 (1997) 95e101.
[29] M.S. Chan, A. Srividya, R.A. Norman, Epifil: a dynamic model of infec-
tion and disease in lymphatic filariasis, Am. J. Trop. Med. Hyg. 59
(1998) 606e614.
[30] B. Ravindran, A.K. Satapathy, P.K. Sahoo, M.C. Mohanty, Protective
immunity in human filariasis: problems and prospects, Med. Microbiol.
Immunol. 192 (2003) 41e46.
[31] B. Ravindran, Natural history of human filariasis e the elusive road, in:
T.R. Klei, T.V. Rajan (Eds.), The Filaria, World Class Parasites, Kluwer
Academic Publishers Group, The Netherlands, 2002, pp. 87e96.
[32] D.W. Meyrowitsch, P. Simonsen, S.M. Magesa, A 26-year follow-up of
bancroftian filariasis in two communities in north-eastern Tanzania,
Ann. Trop. Med. Parasitol. 98 (2004) 155e169.
[33] S. Mohanty, M. Ravichandran, U. Raman, K. Jayaraman, V. Kumar
swamy, T.B. Natman, Regulation of parasite antigen-driven immune
responses by interleukin-10 and IL-12 in lymphatic filariasis, Infect.
Immun. 65 (1997) 1742e1747.
[34] J.J. Peschon, D.S. Torrance, K.L. Stocking, C.O. Glaccum, C.R. Willis,
TNF receptor-deficient mice reveal divergent roles for p55 and p75 in
several models of inflammation, J. Immunol. 160 (1998) 943e952.

2423A.K. Satapathy et al. / Microbes and Infection 8 (2006) 2414e2423
[35] G.L. Stark, A.M. Dickinson, G.H. Jackson, P.R. Taylor, S.J. Proctor,
P.G. Middleton, Tumor necrosis factor receptor type II 196M/R genotype
correlates with circulating soluble receptor levels in normal subjects and
with Graft-verse-host disease after sibling allogenic bone marrow trans-
plantation, Transplantation 76 (2003) 1742e1749.
[36] S. Babu, C.P. Blauvelt, V. Kumaraswami, T.B. Nutman, Chemokine
receptors of T cells and of B cells in lymphatic filarial infection: A
role for CCR9 in pathogenesis, J. Infect. Dis. 191 (2005) 1018e1025.
[37] P. Esterre, C. Plichart, M.O. Huin-Blondey, L.N. Nguyen, Soluble cellu-
lar adhesion molecules, selectins, VEGF and endothelin-1 in patients
with Wuchereria bancrofti infection and association with clinical status,
Parasite Immunol. 27 (2005) 9e16.
[38] P.F. Turner, K.A. Rockett, E.A. Ottesen, H. Francis, K. Awadzi,
I.A. Clark, Interleukin-6 and tumor necrosis factor in the pathogenesis
of adverse reactions after treatment of lymphatic filariasis and onchocer-
ciasis, J. Infect. Dis. 169 (1994) 1071e1075.