HP LoadRunner Tutorial - Support
94
HP LoadRunner Software Version: 12.50 LoadRunner Tutorial Document Release Date: August 2015 Software Release Date: August 2015
-
Upload
khangminh22 -
Category
Documents
-
view
1 -
download
0
Transcript of HP LoadRunner Tutorial - Support

HP LoadRunnerSoftware Version: 12.50
LoadRunner Tutorial
Document Release Date: August 2015Software Release Date: August 2015
Legal Notices
WarrantyThe only warranties for HP products and services are set forth in the express warranty statements accompanying suchproducts and services. Nothing herein should be construed as constituting an additional warranty. HP shall not be liablefor technical or editorial errors or omissions contained herein.
The information contained herein is subject to change without notice.
Restricted Rights LegendConfidential computer software. Valid license from HP required for possession, use or copying. Consistent with FAR12.211 and 12.212, Commercial Computer Software, Computer Software Documentation, and Technical Data forCommercial Items are licensed to the U.S. Government under vendor's standard commercial license.
Copyright Notice© Copyright 1993-2015 Hewlett-Packard Development Company, L.P.
Trademark NoticesAdobe® is a trademark of Adobe Systems Incorporated.
Microsoft® and Windows® are U.S. registered trademarks of Microsoft Corporation.
Oracle and Java are registered trademarks of Oracle and/or its affiliates.
UNIX® is a registered trademark of The Open Group.
Documentation UpdatesThe title page of this document contains the following identifying information:
l Software Version number, which indicates the software version.l Document Release Date, which changes each time the document is updated.l Software Release Date, which indicates the release date of this version of the software.
To check for recent updates or to verify that you are using the most recent edition of a document, go to:https://softwaresupport.hp.com.
This site requires that you register for an HP Passport and sign in. To register for an HP Passport ID, go tohttps://softwaresupport.hp.com and click Register.
SupportVisit the HP Software Support Online web site at: https://softwaresupport.hp.com
This web site provides contact information and details about the products, services, and support that HP Softwareoffers.
HP Software online support provides customer self-solve capabilities. It provides a fast and efficient way to accessinteractive technical support tools needed to manage your business. As a valued support customer, you can benefit byusing the support web site to:
User Guide
HP LoadRunner (12.50) Page 2

l Search for knowledge documents of interestl Submit and track support cases and enhancement requestsl Download software patchesl Manage support contractsl Look up HP support contactsl Review information about available servicesl Enter into discussions with other software customersl Research and register for software training
Most of the support areas require that you register as an HP Passport user and sign in. Many also require a supportcontract. To register for an HP Passport ID, go to: https://softwaresupport.hp.com and click Register.
To find more information about access levels, go to: https://softwaresupport.hp.com/web/softwaresupport/access-levels.
HP Software Solutions & Integrations and Best PracticesVisit HP Software Solutions Now at https://h20230.www2.hp.com/sc/solutions/index.jsp to explore how the productsin the HP Software catalog work together, exchange information, and solve business needs.
Visit the Cross Portfolio Best Practices Library at https://hpln.hp.com/group/best-practices-hpsw to access a widevariety of best practice documents and materials.
User Guide
HP LoadRunner (12.50) Page 3
Contents
LoadRunner Tutorial 1
Welcome to the Tutorial 6Where To Go From Here 10
Lesson 1: Building a Vuser Script 11Introducing VuGen - the Virtual User Generator 11Creating a Blank Vuser Script 11Recording a Vuser script 12Viewing the Vuser script 15
Where To Go From Here 18
Lesson 2: Replaying Your Vuser Script 19How do I set the Vuser's runtime behavior? 19How do I run my Vuser Script? 22Where can I view information about the replay? 23How do I know if my script replayed successfully? 25How do I search or filter the replay results? 26
Where To Go From Here 28
Lesson 3: Solving Common Replay Failures 30Preparing HPWeb Tours for replay errors 30How do I work with unique server values? 31
Where To Go From Here 33
Lesson 4: Preparing a Vuser Script for Load Testing 34How do I measure the duration of a business process? 34How do I emulate multiple users? 36How do I verify Web page content? 40How can I produce debugging information? 42Did the replay of my test succeed? 43
Where To Go From Here 44
Lesson 5: Creating a Load Testing Scenario 45Introducing the LoadRunner Controller 45
User Guide
HP LoadRunner (12.50) Page 4

How do I start the Controller? 46The Controller at a Glance 48How do I modify the script details? 48How do I generate a load on the system? 49How do I emulate real load behavior? 51How do I emulate different types of users? 54How do I monitor the system under load? 56
Where To Go From Here 59
Lesson 6: Running the Load Test 60The Controller Run view at a glance 60How do I run a load test scenario? 61How do I monitor the application under load? 62How do I watch a Vuser running in real time? 64Where can I view a summary of Vuser actions? 65How can I increase the load during the test? 65How is the application performing under load? 66Did the application encounter errors? 67How do I know that the scenario has finished running? 68Did the system perform well under load? 69
Where To Go From Here 70
Lesson 7: Analyzing Your Scenario 71How does an analysis session work? 71How do I start my analysis session? 72The Analysis window at a glance 72Did I reach my goals? (Service Level Agreement) 73How do I define an SLA? 74How do I view a summary of performance? 80How do I graphically view performance? 82Did my server perform well? 84Saving a template 86How can I pinpoint the source of the problem? 87What other information can I gather about my scenario run? 90How can I publish my findings? 91Conclusion 94
User Guide
HP LoadRunner (12.50) Page 5
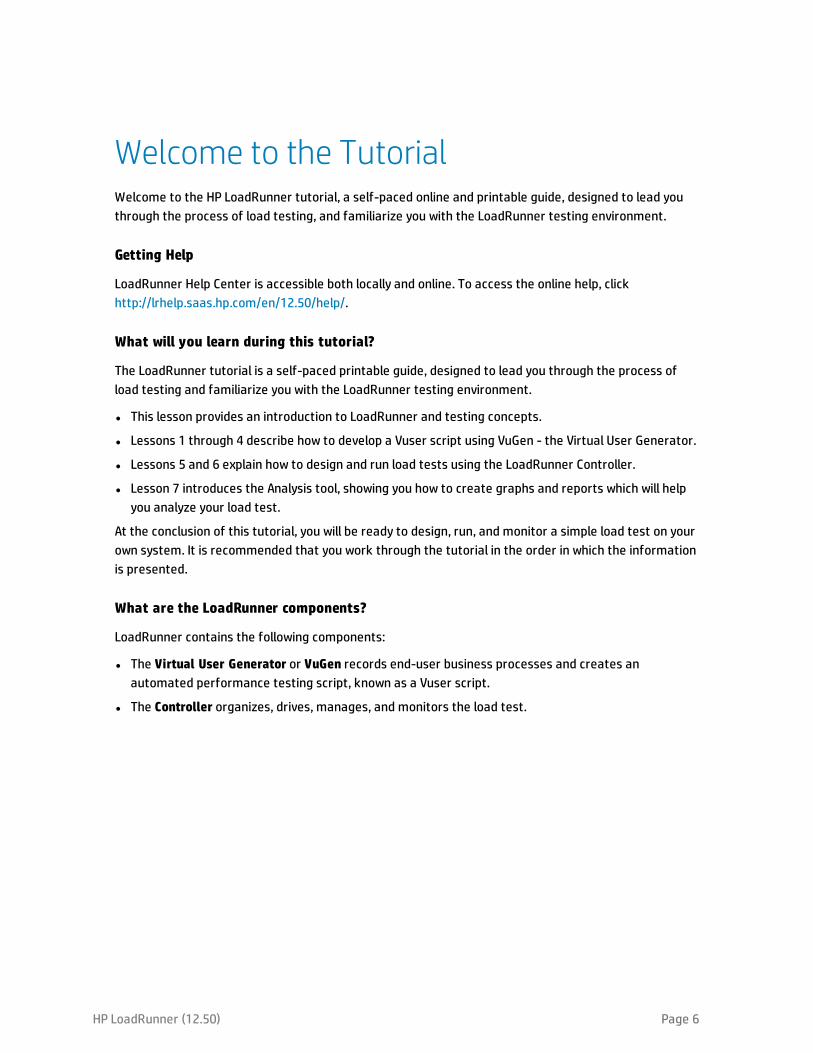
Welcome to the TutorialWelcome to the HP LoadRunner tutorial, a self-paced online and printable guide, designed to lead youthrough the process of load testing, and familiarize you with the LoadRunner testing environment.
Getting Help
LoadRunner Help Center is accessible both locally and online. To access the online help, clickhttp://lrhelp.saas.hp.com/en/12.50/help/.
What will you learn during this tutorial?
The LoadRunner tutorial is a self-paced printable guide, designed to lead you through the process ofload testing and familiarize you with the LoadRunner testing environment.
l This lesson provides an introduction to LoadRunner and testing concepts.
l Lessons 1 through 4 describe how to develop a Vuser script using VuGen - the Virtual User Generator.
l Lessons 5 and 6 explain how to design and run load tests using the LoadRunner Controller.
l Lesson 7 introduces the Analysis tool, showing you how to create graphs and reports which will helpyou analyze your load test.
At the conclusion of this tutorial, you will be ready to design, run, and monitor a simple load test on yourown system. It is recommended that you work through the tutorial in the order in which the informationis presented.
What are the LoadRunner components?
LoadRunner contains the following components:
l The Virtual User Generator or VuGen records end-user business processes and creates anautomated performance testing script, known as a Vuser script.
l The Controller organizes, drives, manages, and monitors the load test.
HP LoadRunner (12.50) Page 6
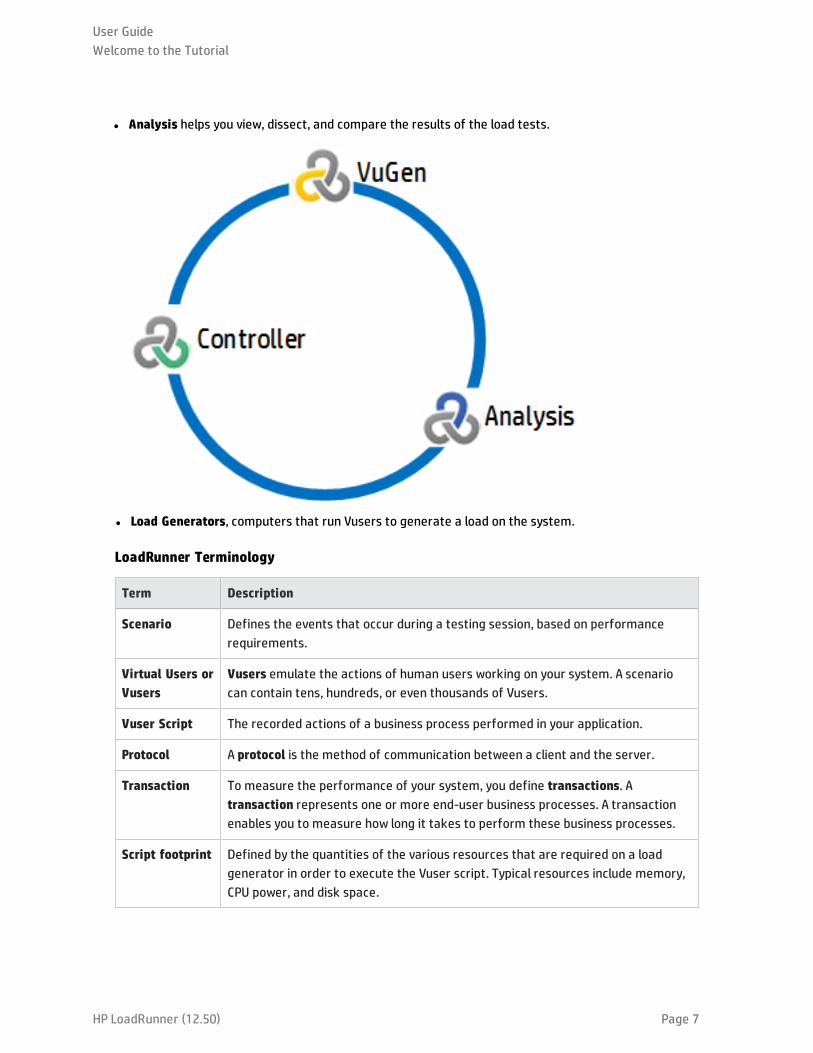
l Analysis helps you view, dissect, and compare the results of the load tests.
l Load Generators, computers that run Vusers to generate a load on the system.
LoadRunner Terminology
Term Description
Scenario Defines the events that occur during a testing session, based on performancerequirements.
Virtual Users orVusers
Vusers emulate the actions of human users working on your system. A scenariocan contain tens, hundreds, or even thousands of Vusers.
Vuser Script The recorded actions of a business process performed in your application.
Protocol A protocol is the method of communication between a client and the server.
Transaction To measure the performance of your system, you define transactions. Atransaction represents one or more end-user business processes. A transactionenables you to measure how long it takes to perform these business processes.
Script footprint Defined by the quantities of the various resources that are required on a loadgenerator in order to execute the Vuser script. Typical resources include memory,CPU power, and disk space.
User GuideWelcome to the Tutorial
HP LoadRunner (12.50) Page 7
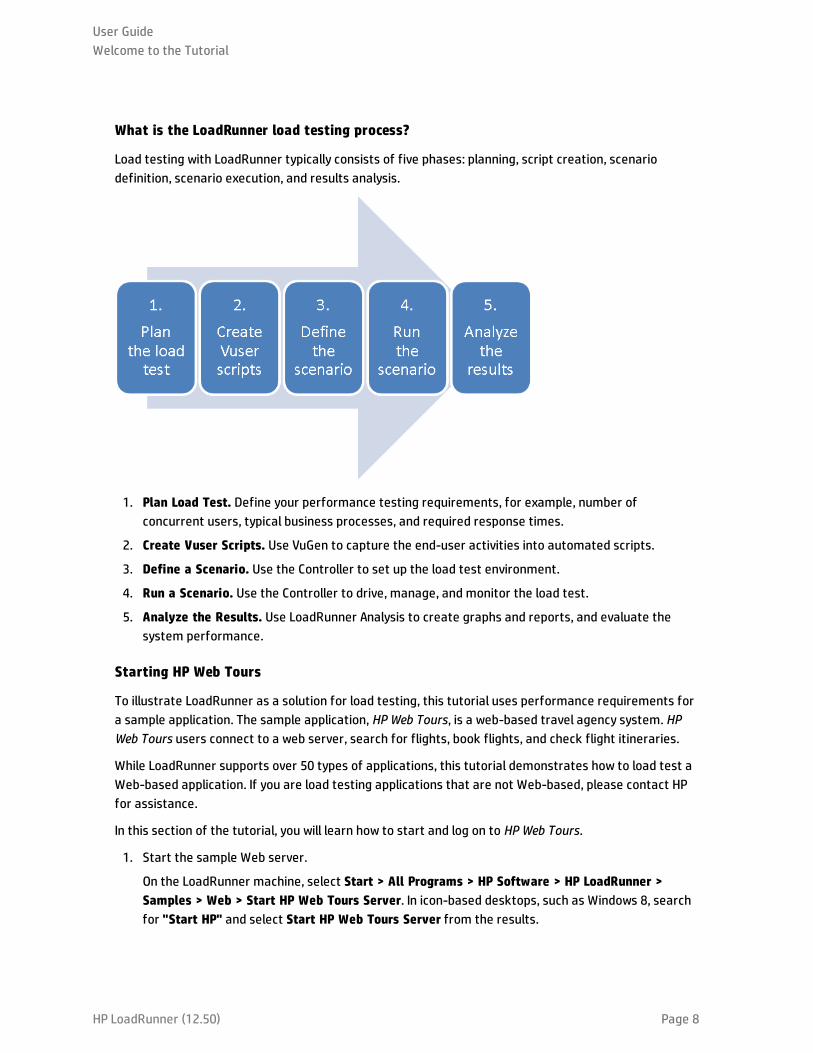
What is the LoadRunner load testing process?
Load testing with LoadRunner typically consists of five phases: planning, script creation, scenariodefinition, scenario execution, and results analysis.
1. Plan Load Test. Define your performance testing requirements, for example, number ofconcurrent users, typical business processes, and required response times.
2. Create Vuser Scripts. Use VuGen to capture the end-user activities into automated scripts.
3. Define a Scenario. Use the Controller to set up the load test environment.
4. Run a Scenario. Use the Controller to drive, manage, and monitor the load test.
5. Analyze the Results. Use LoadRunner Analysis to create graphs and reports, and evaluate thesystem performance.
Starting HP Web Tours
To illustrate LoadRunner as a solution for load testing, this tutorial uses performance requirements fora sample application. The sample application, HP Web Tours, is a web-based travel agency system. HPWeb Tours users connect to a web server, search for flights, book flights, and check flight itineraries.
While LoadRunner supports over 50 types of applications, this tutorial demonstrates how to load test aWeb-based application. If you are load testing applications that are not Web-based, please contact HPfor assistance.
In this section of the tutorial, you will learn how to start and log on to HP Web Tours.
1. Start the sample Web server.
On the LoadRunner machine, select Start > All Programs > HP Software > HP LoadRunner >Samples > Web > Start HP Web Tours Server. In icon-based desktops, such as Windows 8, searchfor "Start HP" and select Start HP Web Tours Server from the results.
User GuideWelcome to the Tutorial
HP LoadRunner (12.50) Page 8

The Start Web Server dialog box opens. Keep this dialog box open while you access the Web Toursapplication.
2. Open HPWeb Tours.
On the LoadRunner machine, select Start > All Programs > HP Software > HP LoadRunner >Samples > Web > HP Web Tours Application. In icon-based desktops, such as Windows 8, searchfor "HP Web" and select HP Web Tours Application from the results. A browser opens and displaysthe HP Web Tours home page.
Note: Ensure that LoadRunner is installed in the default folder on your computer. IfLoadRunner is installed in a non-default folder, the HPWeb Tours application will not open.
Note: The HPWeb Tours application requires a browser with Java installed. For moreinformation, refer to the relevant Java documentation.
3. Log on to HPWeb Tours.a. Type in the following information:
- User name: jojo
- Password: bean
b. On the left pane, click Login. HP Web Tours welcomes you to the application.
4. Reserve a flight.a. On the left pane click Flights. The Find Flight page opens.
b. Change the Arrival city to Los Angeles.
c. Click Continue.
d. In the Find Flight page, accept the default flight selection and click Continue.
e. In the Payment Details page, click Continue. The Invoice page is displayed, summarizing yourflight reservation.
5. End your HP Web Tours session.
On the left pane, click Sign Off to log off.
Defining the Application Performance Requirements
Now that you are familiar with HPWeb Tours, imagine that you are the performance engineerresponsible for signing off that HP Web Tours meets the needs of your business. Your project managerhas given you 4 criteria for release:
1. HP Web Tours must successfully handle 10 concurrent travel agents.
2. HP Web Tours must be able to process 10 simultaneous flight bookings with response time notexceeding 90 seconds.
3. HP Web Tours must be able to handle 10 travel agents running simultaneous itinerary checks withresponse time not exceeding 120 seconds.
User GuideWelcome to the Tutorial
HP LoadRunner (12.50) Page 9

4. HP Web Tours must be able to handle 10 agents signing in and signing out of the system withresponse time not exceeding 10 seconds.
This tutorial will walk you through the process of building load tests that validate each businessrequirement so that you can attach a pass or fail before release.
Where To Go FromHereNow that you have been introduced to the LoadRunner basics, you can proceed to "Lesson 1:Building a Vuser Script" on the next page.
User GuideWelcome to the Tutorial
HP LoadRunner (12.50) Page 10

Lesson 1: Building a Vuser ScriptTo generate a load on your system, you first build a Vuser script that you can run to emulate real userbehavior. You use VuGen to create and build Vuser scripts.
In this lesson you will cover the following topics:
l "Introducing VuGen - the Virtual User Generator" below
l "Creating a Blank Vuser Script" below
l "Recording a Vuser script" on the next page
l "Viewing the Vuser script" on page 15
Introducing VuGen - the Virtual User GeneratorIn a performance testing environment, LoadRunner replaces human users with virtual users, also knownas Vusers. Vusers generate a load on a system by emulating actions of typical users - in a repeatableand predictable manner.
You use VuGen (LoadRunner's Virtual User Generator) to create Vuser scripts. VuGen works on a record-and-playback principle. As you walk through a business process on your application, VuGen records youractions and transforms these actions into steps in a Vuser script. These Vuser scripts form thefoundation of your load tests.
Creating a Blank Vuser ScriptTo develop a Vuser script, you first open VuGen and create a blank script. Thereafter, you can enhancethe blank script by recording events and adding manual enhancements to the script.
In this section, you will open VuGen and create a blank Vuser script that is based on the Web -HTTP/HTML protocol.
Tip: A protocol is the method of communication between a client and a server.
To create a blank Vuser script:
1. On the LoadRunner machine, double-click the Virtual User Generator shortcut icon on the desktopto open VuGen.
User GuideLesson 1: Building a Vuser Script
HP LoadRunner (12.50) Page 11

2. Click File > New Script and Solution or click the Add New Script button on the VuGentoolbar. The Create a New Script dialog box opens.
3. Make sure the Category is Single Protocol. VuGen displays a list of the protocols that are availablefor a single-protocol script.
4. From the list of available protocols, select Web - HTTP/HTML and then click Create. VuGen createsa blank Vuser script and displays the script in the VuGen Editor.
Recording a Vuser scriptThe next step in developing the Vuser script is to record the actions performed by a real user. In theprevious section, you created an emptyWeb - HTTP/HTML Vuser script. Now you can begin to recordactions directly into the script. In this section, you will track the actions that a travel agent performs toreserve a flight from Denver to Los Angeles, and check the flight itinerary.
Note: To enable VuGen to record the actions that you perform in the Web Tours application,click Record > Recording Options. In the Recording Options dialog box, select General > Script,and then under Scripting Options, make sure that the Track processes created as COM localservers check box is cleared.
To record the Vuser script:
User GuideLesson 1: Building a Vuser Script
HP LoadRunner (12.50) Page 12
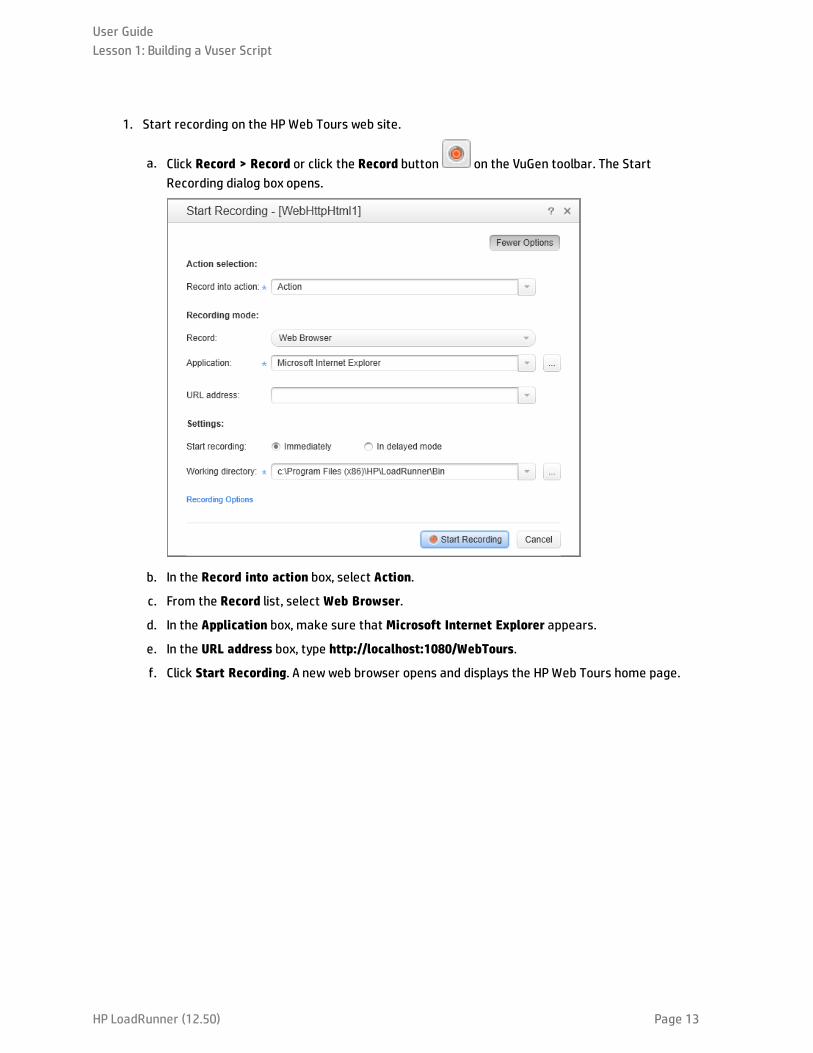
1. Start recording on the HPWeb Tours web site.
a. Click Record > Record or click the Record button on the VuGen toolbar. The StartRecording dialog box opens.
b. In the Record into action box, select Action.
c. From the Record list, select Web Browser.
d. In the Application box, make sure that Microsoft Internet Explorer appears.
e. In the URL address box, type http://localhost:1080/WebTours.
f. Click Start Recording. A new web browser opens and displays the HPWeb Tours home page.
User GuideLesson 1: Building a Vuser Script
HP LoadRunner (12.50) Page 13
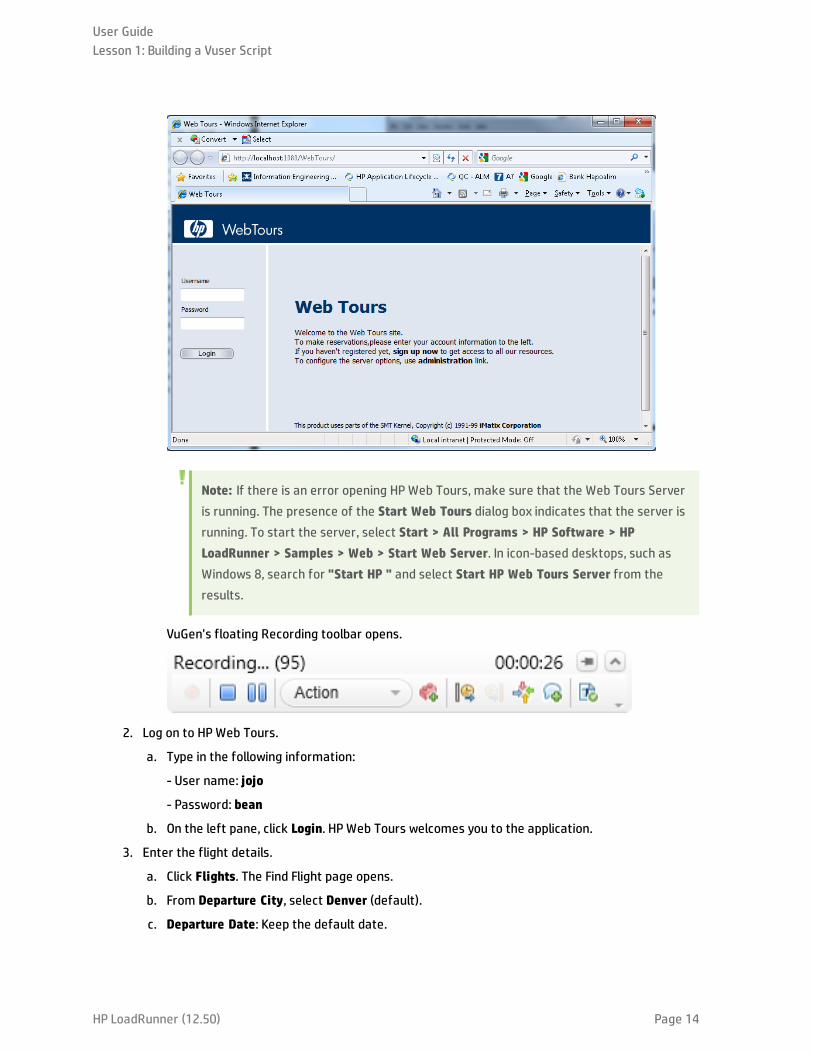
Note: If there is an error opening HPWeb Tours, make sure that the Web Tours Serveris running. The presence of the Start Web Tours dialog box indicates that the server isrunning. To start the server, select Start > All Programs > HP Software > HPLoadRunner > Samples > Web > Start Web Server. In icon-based desktops, such asWindows 8, search for "Start HP " and select Start HP Web Tours Server from theresults.
VuGen's floating Recording toolbar opens.
2. Log on to HPWeb Tours.
a. Type in the following information:
- User name: jojo
- Password: bean
b. On the left pane, click Login. HP Web Tours welcomes you to the application.
3. Enter the flight details.
a. Click Flights. The Find Flight page opens.
b. From Departure City, select Denver (default).
c. Departure Date: Keep the default date.
User GuideLesson 1: Building a Vuser Script
HP LoadRunner (12.50) Page 14

d. From Arrival City, select Los Angeles.
e. Return Date: Keep the default date.
f. From Seating Preference, select Aisle.
g. Keep the rest of the default settings and click Continue. The Find Flight page opens.
4. Select a flight.
Click Continue to accept the default flight selections. The Payment Details page opens.
5. Enter payment information and book the flight.
a. In the Credit Card box, enter 12345678.
b. In the Exp Date box, enter 06/19.
c. Click Continue. The Invoice page opens, displaying your invoice.
6. In the left pane, click Itinerary. The Itinerary page opens.
7. In the left pane, click Sign Off.
8. Close the browser, and then click the Stop Recording button on the VuGen floating toolbar tostop the recording process.
VuGen generates the required code and inserts the code into the Vuser script.
If the Design Studio opens, click Close to close the Design Studio.
9. Save the Vuser script.a. Select File > Save Script As.
b. Navigate to <LoadRunner Installation>\tutorial, create a new folder named Scripts, and thennavigate to the new Scripts folder.
c. In the File name box, type basic_tutorial.
d. Click Save. VuGen saves the script and displays the script name in the VuGen title bar.
Viewing the Vuser scriptYou have now recorded the actions of a travel agent logging in, booking a flight, checking the itinerary,and logging off. VuGen recorded your steps from the moment you clicked the Start Recording button tothe moment you clicked the Stop Recording button.
You can now use VuGen to view the script. VuGen lets you see the Vuser script in a number of formats:
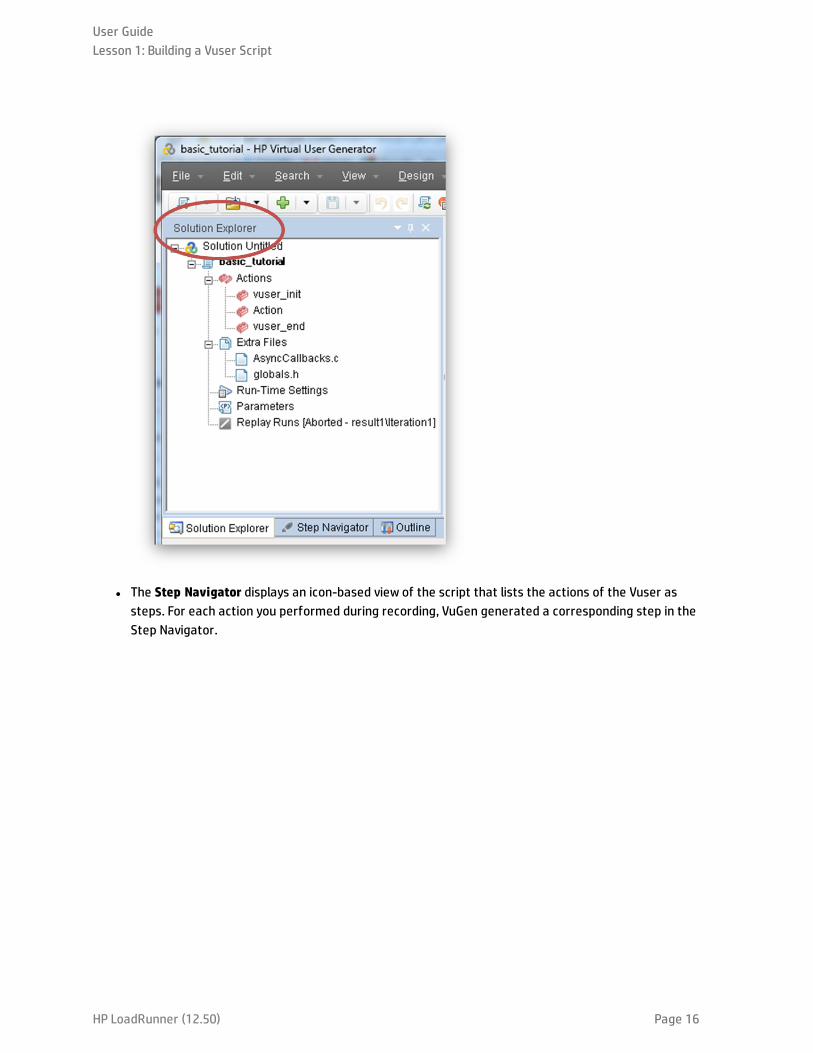
l The Solution Explorer gives you structured access to the various parts of a Vuser script, as well as toa number of files that are associated with the Vuser script.
User GuideLesson 1: Building a Vuser Script
HP LoadRunner (12.50) Page 15
l The Step Navigator displays an icon-based view of the script that lists the actions of the Vuser assteps. For each action you performed during recording, VuGen generated a corresponding step in theStep Navigator.
User GuideLesson 1: Building a Vuser Script
HP LoadRunner (12.50) Page 16
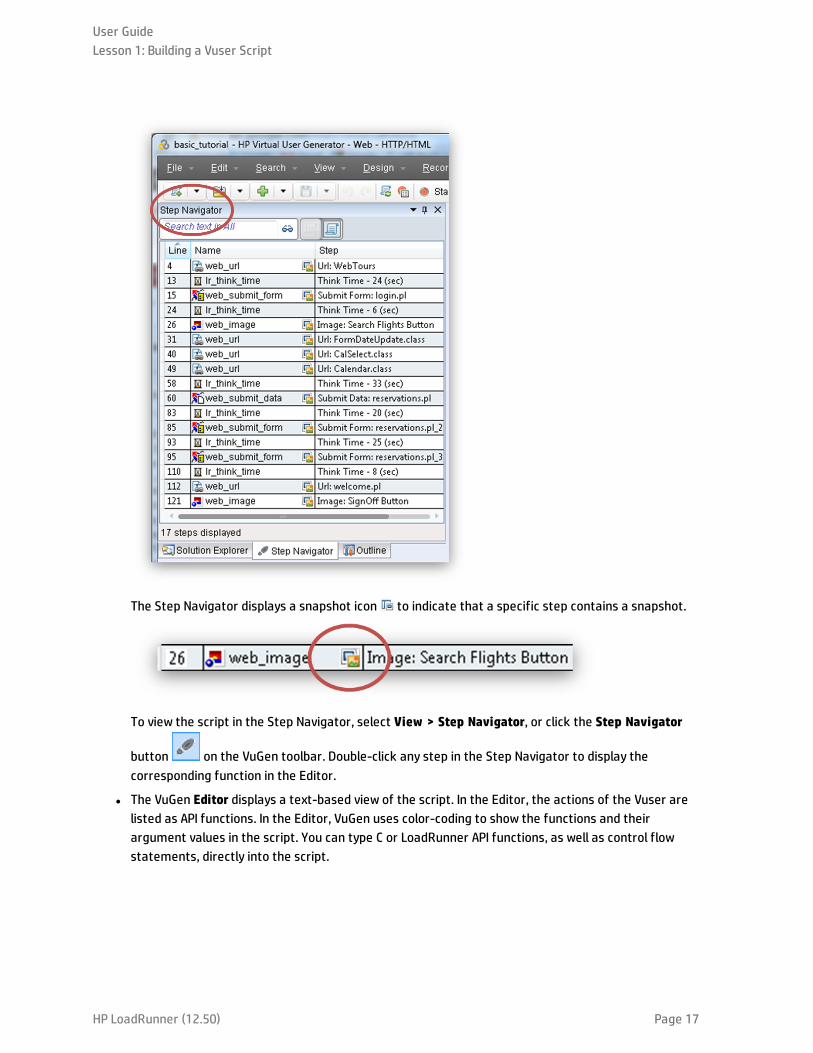
The Step Navigator displays a snapshot icon to indicate that a specific step contains a snapshot.
To view the script in the Step Navigator, select View > Step Navigator, or click the Step Navigator
button on the VuGen toolbar. Double-click any step in the Step Navigator to display thecorresponding function in the Editor.
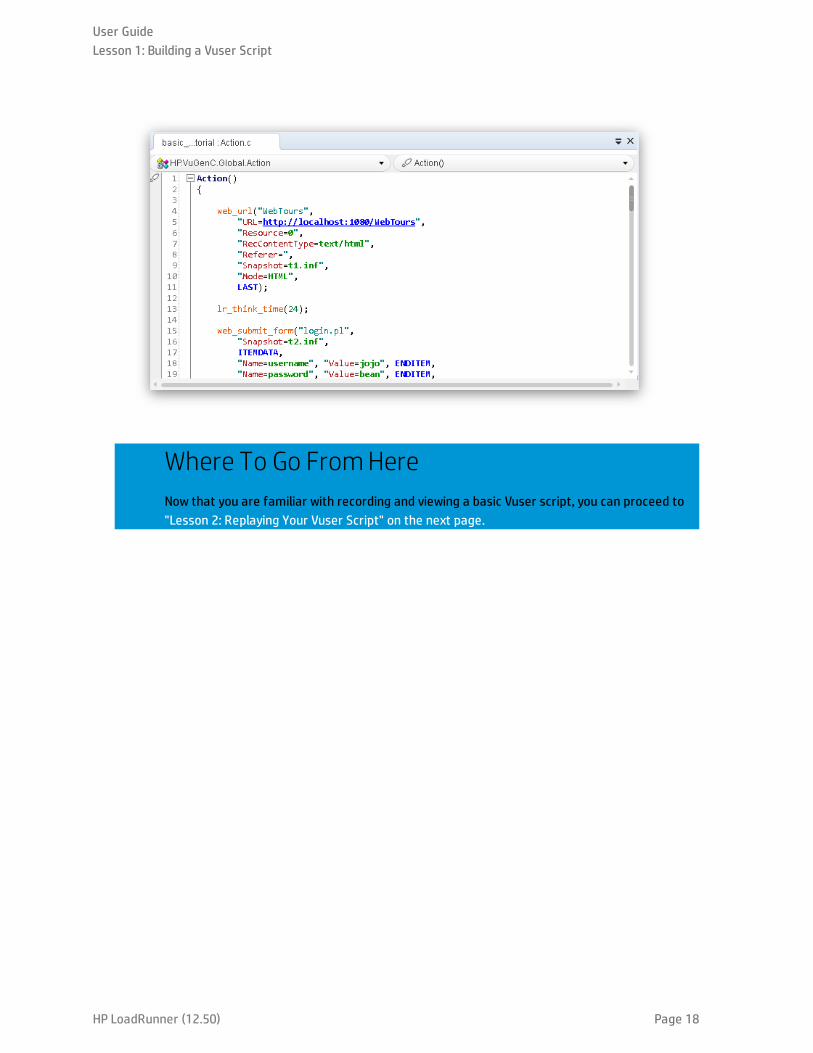
l The VuGen Editor displays a text-based view of the script. In the Editor, the actions of the Vuser arelisted as API functions. In the Editor, VuGen uses color-coding to show the functions and theirargument values in the script. You can type C or LoadRunner API functions, as well as control flowstatements, directly into the script.
User GuideLesson 1: Building a Vuser Script
HP LoadRunner (12.50) Page 17
Where To Go FromHereNow that you are familiar with recording and viewing a basic Vuser script, you can proceed to"Lesson 2: Replaying Your Vuser Script" on the next page.
User GuideLesson 1: Building a Vuser Script
HP LoadRunner (12.50) Page 18

Lesson 2: Replaying Your Vuser ScriptIn the previous lesson, you recorded a set of typical user actions, and VuGen transcribed these actions into a Vuser script. You can now replay your recorded script to verify that the script runs properly, beforeyou incorporate the script into a load testing scenario.
Before replaying the script, you must configure the runtime settings for the script, which define thebehavior of the Vuser.
In this lesson you will cover the following topics:
l How do I set the runtime behavior?
l How do I run my Vuser script?
l Where can I view information about the replay?
l How do I know if my script replayed successfully?
l How do I search or filter the results?
How do I set the Vuser's runtime behavior?LoadRunner runtime settings let you emulate different kinds of user activity and behavior. For example,you could emulate a user who responds immediately to output from the server, or a user who stops andthinks before each response. You can also configure runtime settings to specify howmany times theVuser should repeat a set of actions in the Vuser script.
There are general runtime settings, and settings that are specific to certain Vuser protocols only. Forexample, for a Web emulation, you could instruct your Vusers to replay your script in Firefox, Chrome, orInternet Explorer. Runtime settings for specific protocols will be covered in "Lesson 4: Preparing a VuserScript for Load Testing" on page 34. This lesson describes some of the general runtime settings—settings that apply to all Vuser protocols. The General runtime settings include:
l Run Logic. The number of times that a Vuser repeats various sections of the Vuser script.
l Pacing. The time to wait between repetitions.
l Think Time. The time the Vuser stops to think between steps in the script.
l Log. The level of information that you want to gather during playback.
Note: This lesson describes how to use VuGen to modify the runtime settings. A later lessondescribes how to use the LoadRunner Controller to modify the runtime settings.
To configure the runtime settings:
1. Open the Vuser script that you saved in the previous lesson.
2. Open the Runtime Settings view.
User GuideLesson 2: Replaying Your Vuser Script
HP LoadRunner (12.50) Page 19
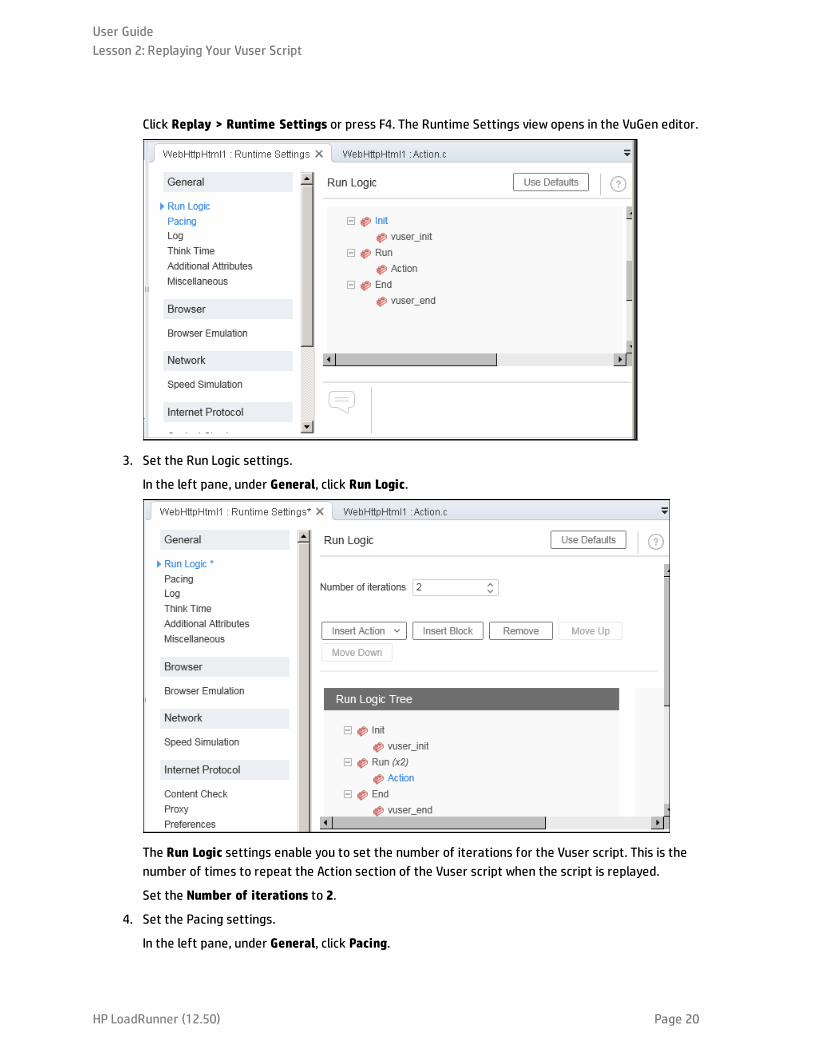
Click Replay > Runtime Settings or press F4. The Runtime Settings view opens in the VuGen editor.
3. Set the Run Logic settings.
In the left pane, under General, click Run Logic.
The Run Logic settings enable you to set the number of iterations for the Vuser script. This is thenumber of times to repeat the Action section of the Vuser script when the script is replayed.
Set the Number of iterations to 2.
4. Set the Pacing settings.
In the left pane, under General, click Pacing.
User GuideLesson 2: Replaying Your Vuser Script
HP LoadRunner (12.50) Page 20

The Pacing settings enable you to control the time between iterations. You will specify a randomtime. This accurately emulates a real-life setting where the user waits between actions, but atrandom intervals. For example, you do not see real users always waiting exactly 60 secondsbetween repeated actions.
Select the third radio button, and select the following:
Start new iteration at Random intervals, every 60.000 to 90.000 second(s).
5. Set the Log settings.
In the left pane, under General, select Log.
The Log settings indicate howmuch information to log while running the Vuser Script. Whiledeveloping a Vuser script, you may want to enable some logging for debugging purposes, but onceyou verify that your script is functional, you can enable logging for errors only, or even disablelogging.
Select Extended log and enable Parameter substitution. This option will be relevant for thefollowing lesson at which point it will be discussed.
6. View the Think Time settings.
In the left pane, under General, click Think Time.
User GuideLesson 2: Replaying Your Vuser Script
HP LoadRunner (12.50) Page 21
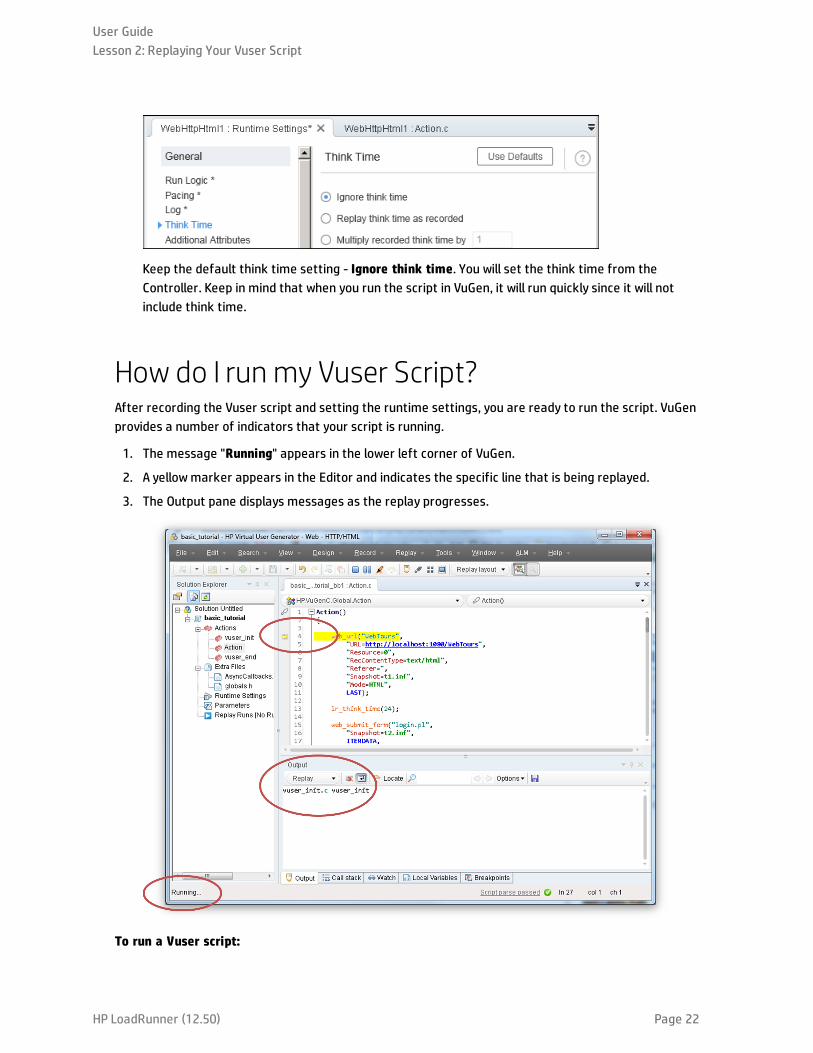
Keep the default think time setting - Ignore think time. You will set the think time from theController. Keep in mind that when you run the script in VuGen, it will run quickly since it will notinclude think time.
How do I run my Vuser Script?After recording the Vuser script and setting the runtime settings, you are ready to run the script. VuGenprovides a number of indicators that your script is running.
1. The message "Running" appears in the lower left corner of VuGen.
2. A yellowmarker appears in the Editor and indicates the specific line that is being replayed.
3. The Output pane displays messages as the replay progresses.
To run a Vuser script:
User GuideLesson 2: Replaying Your Vuser Script
HP LoadRunner (12.50) Page 22

1. Open the Vuser script in VuGen.
2. Click Replay > Run or click the Replay button on the VuGen toolbar.
After the replay ends, a message box may prompt you to scan for correlations. Click No.
Where can I view information about the replay?When the Vuser script stops running, you can view a summary of the replay. The replay summary isdisplayed in the Replay Summary tab.
The Replay Summary tab lists basic information about the script run, such as the duration of the replay,and the start and end times of the replay. In addition, the Replay Summary tab provides you with a linkthat displays a log of the script events, and another link that displays detailed results of the script run.
The Replay log - a log of the events that occurred during the replay of the script - is displayed in VuGen’sOutput pane. The Output pane uses color-coding to display a textual summary of the events thatoccurred during the replay.
In this section of the tutorial, you will open the Replay log and locate specific events and notificationswithin the log.
To view the Replay log:
1. After replaying a Vuser script, click View > Output or click the Output button on the VuGentoolbar. Alternatively, click the Replay Log link in the Replay Summary tab.
2. Make sure that Replay is selected in the Output pane.
User GuideLesson 2: Replaying Your Vuser Script
HP LoadRunner (12.50) Page 23
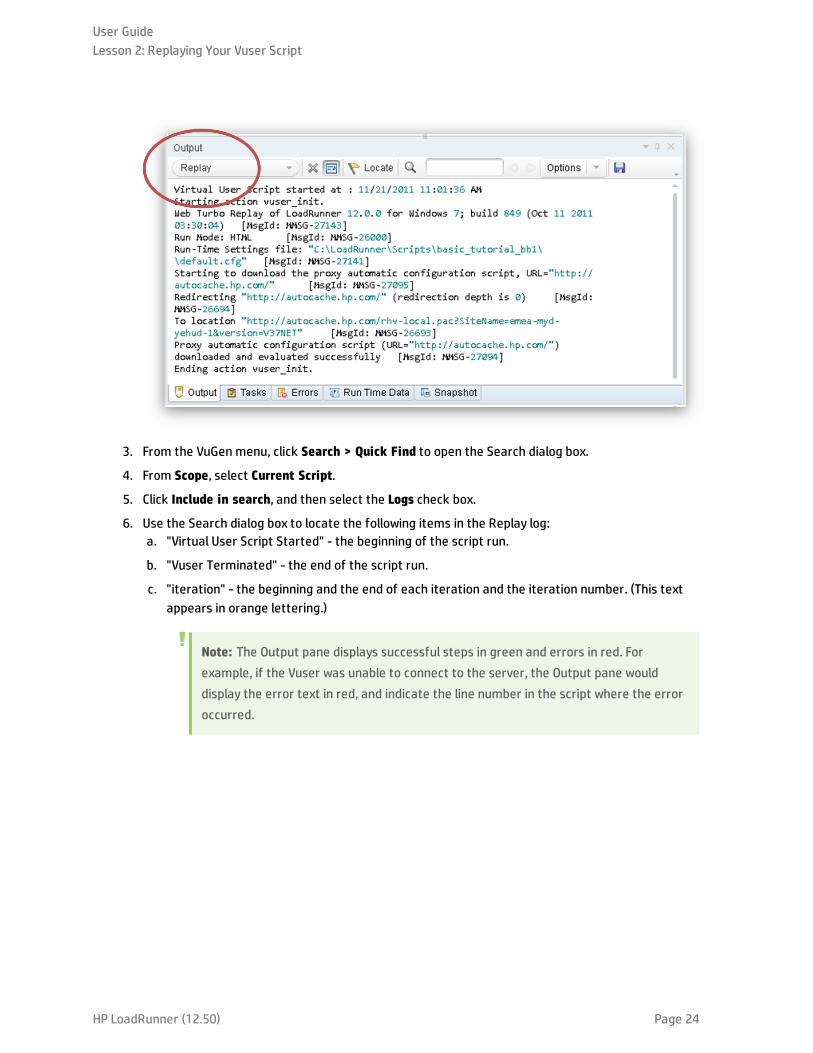
3. From the VuGen menu, click Search > Quick Find to open the Search dialog box.
4. From Scope, select Current Script.
5. Click Include in search, and then select the Logs check box.
6. Use the Search dialog box to locate the following items in the Replay log:a. "Virtual User Script Started" - the beginning of the script run.
b. "Vuser Terminated" - the end of the script run.
c. "iteration" - the beginning and the end of each iteration and the iteration number. (This textappears in orange lettering.)
Note: The Output pane displays successful steps in green and errors in red. Forexample, if the Vuser was unable to connect to the server, the Output pane woulddisplay the error text in red, and indicate the line number in the script where the erroroccurred.
User GuideLesson 2: Replaying Your Vuser Script
HP LoadRunner (12.50) Page 24
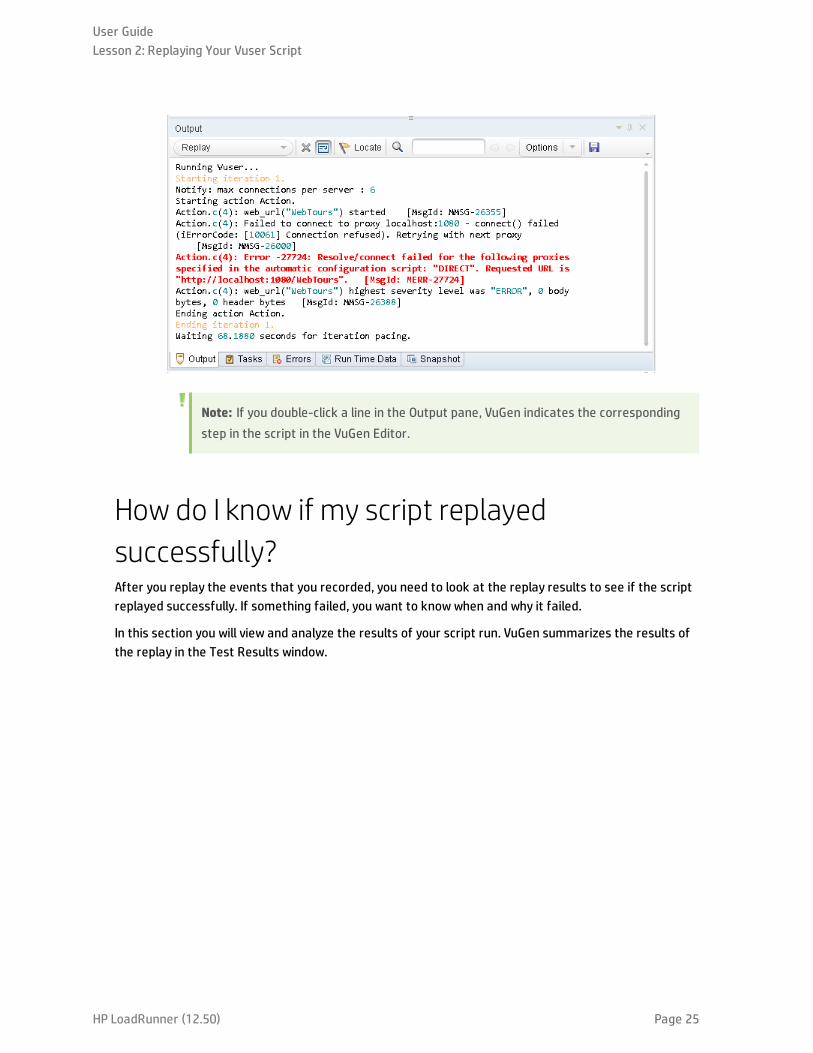
Note: If you double-click a line in the Output pane, VuGen indicates the correspondingstep in the script in the VuGen Editor.
How do I know if my script replayedsuccessfully?After you replay the events that you recorded, you need to look at the replay results to see if the scriptreplayed successfully. If something failed, you want to know when and why it failed.
In this section you will view and analyze the results of your script run. VuGen summarizes the results ofthe replay in the Test Results window.
User GuideLesson 2: Replaying Your Vuser Script
HP LoadRunner (12.50) Page 25
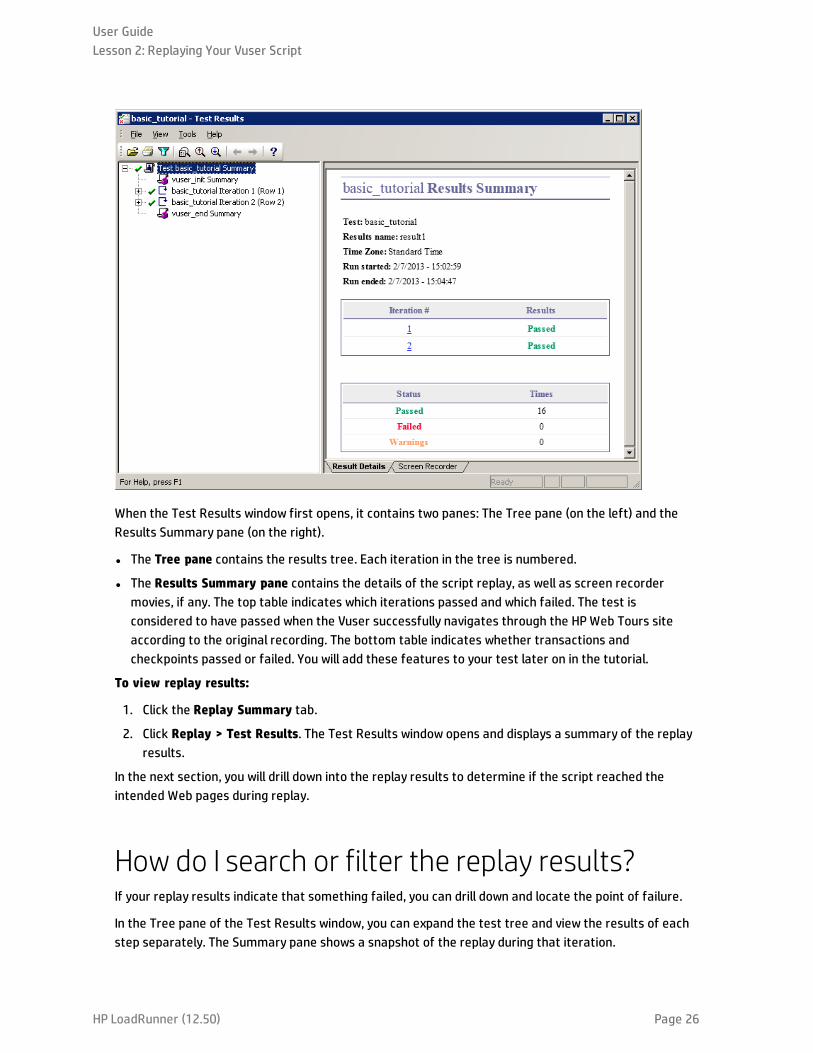
When the Test Results window first opens, it contains two panes: The Tree pane (on the left) and theResults Summary pane (on the right).
l The Tree pane contains the results tree. Each iteration in the tree is numbered.
l The Results Summary pane contains the details of the script replay, as well as screen recordermovies, if any. The top table indicates which iterations passed and which failed. The test isconsidered to have passed when the Vuser successfully navigates through the HPWeb Tours siteaccording to the original recording. The bottom table indicates whether transactions andcheckpoints passed or failed. You will add these features to your test later on in the tutorial.
To view replay results:
1. Click the Replay Summary tab.
2. Click Replay > Test Results. The Test Results window opens and displays a summary of the replayresults.
In the next section, you will drill down into the replay results to determine if the script reached theintended Web pages during replay.
How do I search or filter the replay results?If your replay results indicate that something failed, you can drill down and locate the point of failure.
In the Tree pane of the Test Results window, you can expand the test tree and view the results of eachstep separately. The Summary pane shows a snapshot of the replay during that iteration.
User GuideLesson 2: Replaying Your Vuser Script
HP LoadRunner (12.50) Page 26

1. Expand an iteration node in the tree.a. In the results tree, expand the basic_tutorial Iteration 1 node.
b. Expand the Action Summary node. The expanded node shows a list of the steps performed inthat iteration.
2. View a result snapshot.
Click the Submit Form:login.pl node. The Summary pane displays the replay snapshot associatedwith that step.
3. View the step summary.
The Summary pane displays the step summary information: the object or step name, the detailsabout whether the page loaded successfully, the result (Passed, Failed, Done, or Warning), and thetime that the step was performed.
4. Search for a result status.
You can search the replay results for the words Passed or Failed.
This is helpful, as in a case where the overall Results Summary indicates that the replay failed, youcan determine where it failed.
a. To search the replay results, select Tools > Find or click the Find button on the TestResults toolbar. The Find dialog box opens.
b. Select the Passed check box, make sure no other options are selected, and click Find Next.The Test Tree pane highlights the first step in which the status is Passed.
Note: If no steps of the selected status can be found, no step is highlighted.
5. Filter the results.
You can filter the Test Tree pane to display a specific iteration or status. For example, you canfilter it to show only Failed status.
a. Select View > Filters or click the Filters button on the Test Results toolbar. The Filtersdialog box opens.
User GuideLesson 2: Replaying Your Vuser Script
HP LoadRunner (12.50) Page 27
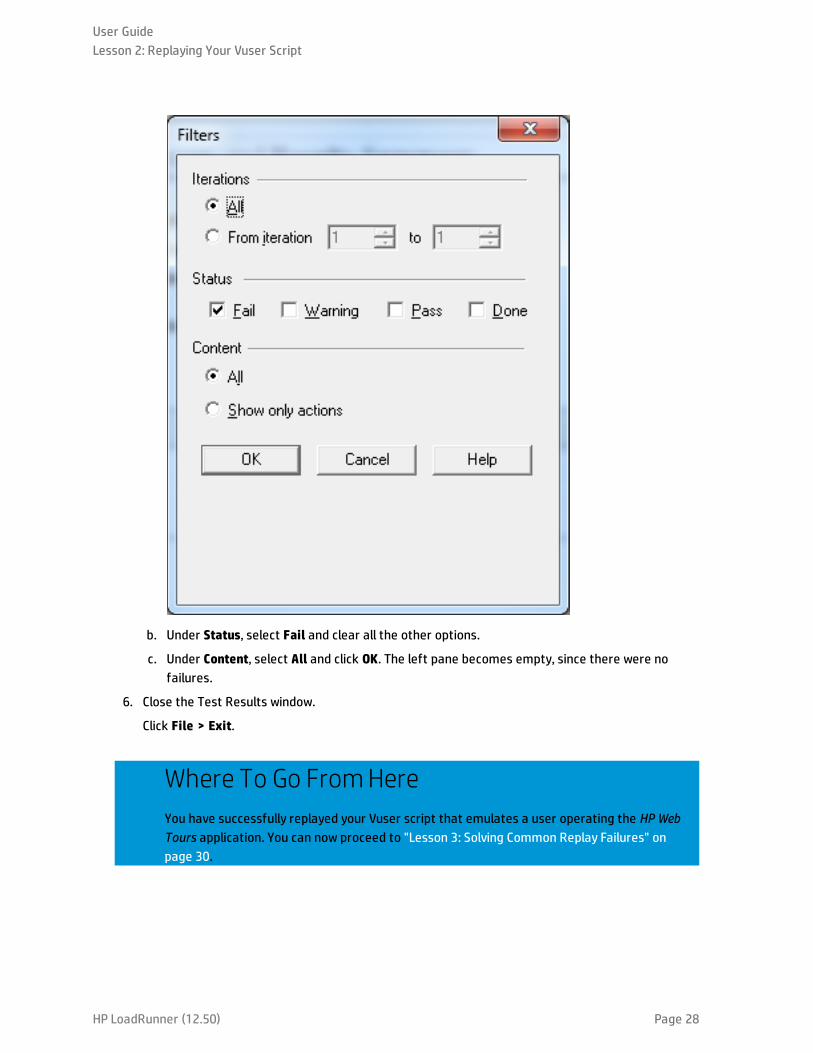
b. Under Status, select Fail and clear all the other options.
c. Under Content, select All and click OK. The left pane becomes empty, since there were nofailures.
6. Close the Test Results window.
Click File > Exit.
Where To Go FromHereYou have successfully replayed your Vuser script that emulates a user operating the HP WebTours application. You can now proceed to "Lesson 3: Solving Common Replay Failures" onpage 30.
User GuideLesson 2: Replaying Your Vuser Script
HP LoadRunner (12.50) Page 28

User GuideLesson 2: Replaying Your Vuser Script
HP LoadRunner (12.50) Page 29
Lesson 3: Solving Common ReplayFailuresAfter you create a Vuser script, you validate it by running it from VuGen. Sometimes a replay will fail,even though the recording of the same actions succeeded.
Many applications use dynamic values that change each time you use the application. For example,some servers assign a unique session ID for every new session. When you try to replay a recordedsession, the application creates a new session ID that differs from the recorded session ID. Dynamicvalues, such as these unique session IDs, may pose difficulties when you replay specific types of Vuserscripts. For example, dynamic session IDs often pose problems when replaying Web-HTTP/HTML scripts,but not when replaying TruClient scripts.
LoadRunner use correlation to address the issue of dynamic values. Correlation saves the changingvalues, in our case the session ID, to a parameter. When running the Vuser script, the Vuser does notuse the recorded value—instead, it uses the new session ID, assigned to it by the server.
In this lesson you will observe how LoadRunner solves the issue of dynamic values when running Web-HTTP/HTML Vuser scripts.
In this lesson you will cover the following topics:
l Preparing HPWeb Tours for replay errors
l How do I work with unique server values?
Preparing HP Web Tours for replay errorsTo illustrate a common replay failure, you need to modify a setting in the HP Web Tours application. Thissetting tells the HP Web Tours server to issue and require unique session IDs.
1. Open HPWeb Tours.
On the LoadRunner machine, select Start > All Programs > HP Software > HP LoadRunner >Samples > Web > HP Web Tours Application. In icon-based desktops, such as Windows 8, searchfor "HP Web" and select HP Web Tours Application from the results. A browser opens with the HPWeb Tours home page.
2. Change the server options.a. Click the administration link on the HPWeb Tours home page. The Administration Page opens.
b. Select the Set LOGIN form's action tag to an error page checkbox. This setting tells theserver not to allow duplicate session IDs.
c. Scroll down to the bottom of the page and click Update.
d. Scroll down to the bottom of the page and click the Return to the Web Tours Homepage link.
User GuideLesson 3: Solving Common Replay Failures
HP LoadRunner (12.50) Page 30
How do I work with unique server values?In the modified configuration of HP Web Tours, the server assigns a unique session ID to each Vuser. Ifyou try to replay the unmodified Vuser script that you recorded in "Lesson 1: Building a Vuser Script" onpage 11, the replay will fail.
To overcome this issue, you use VuGen to detect the need to correlate the session ID. You will instructVuGen to insert a step that saves the original session ID to a parameter. In each subsequent replaysession, VuGen saves the new unique session ID to a parameter. As the Vuser executes the steps in theVuser script, the Vuser uses the saved session ID value instead of the originally recorded value.
1. Record a new Vuser script with dynamic values.a. Record a new Vuser script with the same steps that you recorded previously in "Lesson 1:
Building a Vuser Script" on page 11.
b. Save the script as basic_tutorial_Cor.
2. Replay the new script.
Click Replay > Run or click the Replay button on the VuGen toolbar.
VuGen runs the new Vuser script. You may notice several error messages in the Replay Log in theOutput pane, indicated by the red-colored text.
After the replay ends, a message box may prompt you to scan for correlations. Click No.
3. View the Replay Summary. The summary shows that the replay of your script failed.
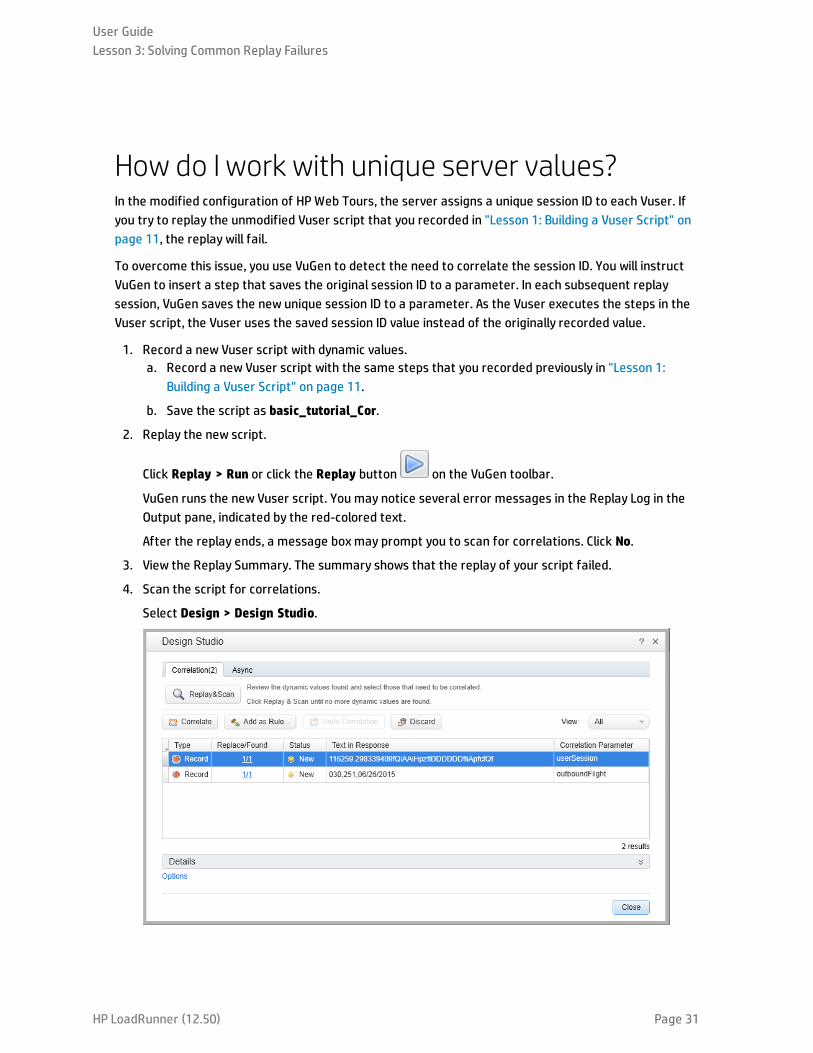
4. Scan the script for correlations.
Select Design > Design Studio.
User GuideLesson 3: Solving Common Replay Failures
HP LoadRunner (12.50) Page 31
VuGen scans the script and its associated data, searching for possible dynamic values. TheCorrelation tab of the Design Studio lists several dynamic values that may require correlation. Thelongest of the values is the Session ID.
5. Correlate the Session ID.a. Select the Session ID entry in the Correlation tab, and click Correlate. VuGen changes the
status of the Session ID to Applied, and inserts a new function at the top of the Vuser script.The new function saves the original session ID to a parameter.
In each subsequent replay session, VuGen saves the new unique session ID to a parameter.When the Vuser runs, the Vuser uses the saved ID value instead of the originally recordedvalue.
b. Click Close to close the Design Studio.
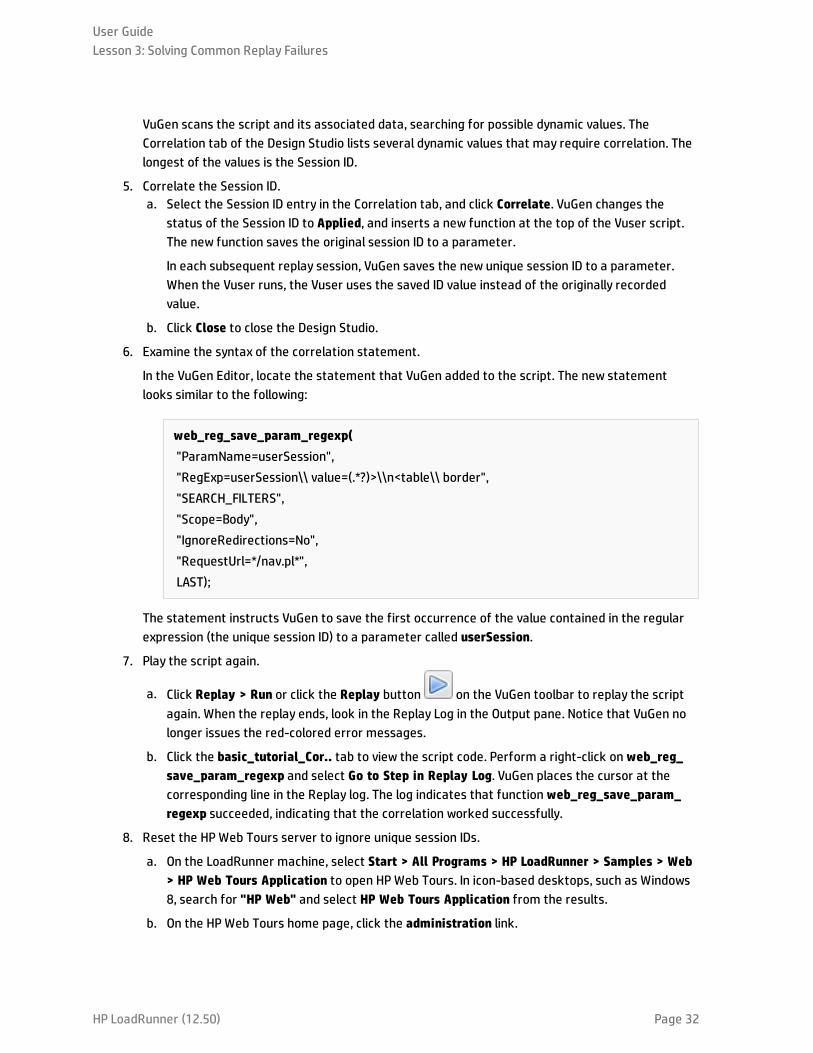
6. Examine the syntax of the correlation statement.
In the VuGen Editor, locate the statement that VuGen added to the script. The new statementlooks similar to the following:
web_reg_save_param_regexp("ParamName=userSession","RegExp=userSession\\ value=(.*?)>\\n<table\\ border","SEARCH_FILTERS","Scope=Body","IgnoreRedirections=No","RequestUrl=*/nav.pl*",LAST);
The statement instructs VuGen to save the first occurrence of the value contained in the regularexpression (the unique session ID) to a parameter called userSession.
7. Play the script again.
a. Click Replay > Run or click the Replay button on the VuGen toolbar to replay the scriptagain. When the replay ends, look in the Replay Log in the Output pane. Notice that VuGen nolonger issues the red-colored error messages.
b. Click the basic_tutorial_Cor.. tab to view the script code. Perform a right-click on web_reg_save_param_regexp and select Go to Step in Replay Log. VuGen places the cursor at thecorresponding line in the Replay log. The log indicates that function web_reg_save_param_regexp succeeded, indicating that the correlation worked successfully.
8. Reset the HPWeb Tours server to ignore unique session IDs.
a. On the LoadRunner machine, select Start > All Programs > HP LoadRunner > Samples > Web> HP Web Tours Application to open HPWeb Tours. In icon-based desktops, such as Windows8, search for "HP Web" and select HP Web Tours Application from the results.
b. On the HPWeb Tours home page, click the administration link.
User GuideLesson 3: Solving Common Replay Failures
HP LoadRunner (12.50) Page 32
c. In the Administration Page, clear the Set LOGIN form's action tag to an error page checkbox.
d. Scroll down to the bottom of the page and click Update.
Where To Go FromHereNow that you are familiar with some of the common replay problems, you can proceed to"Lesson 4: Preparing a Vuser Script for Load Testing" on the next page.
User GuideLesson 3: Solving Common Replay Failures
HP LoadRunner (12.50) Page 33
Lesson 4: Preparing a Vuser Script forLoad TestingIn the previous lessons, you verified that the replay of your Vuser script produced an accurate emulationof a real user. The next step is to prepare the script for load testing. How will the system work withmany users working simultaneously? Will the system slow down to an unacceptable level?
In this lesson you will learn about different methods to enhance the script and to make it moreeffective for the load testing process.
In this lesson you will cover the following topics:
l How do I measure the duration of a business process?
l How do I emulate multiple users?
l How do I verify Web page content?
l How can I produce debugging information?
l Did the replay of my test succeed?
How do I measure the duration of a businessprocess?When preparing an application for deployment, you need to measure the duration of specific businessprocesses—how long does it take to log on, book a flight, and so on. Each business process is normallymade up of one or more steps or actions in your script. In a Vuser script, you designate a series ofactions you want to measure by including these actions in a transaction.
When you run a Vuser script that includes a transaction, LoadRunner gathers information about thetime it takes to perform the transaction, and displays the results in color-coded graphs and reports.You use this information to help determine if the application meets the performance requirements.
You can manually insert a transaction anywhere in a Vuser script. To mark a set of steps as atransaction, insert a start_transactionmarker before the first step and an end_transactionmarkerafter the last step.
In this section you will insert a transaction into your script to measure the amount of time it takes forthe user to find and confirm a flight.
To insert a transaction into a Vuser script:
1. In VuGen, open the Basic_Tutorial script which you created in "Lesson 1: Building a Vuser Script" onpage 11. If it is still open, you can select the tab displaying its name. Otherwise you can open itfrom the File menu.
User GuideLesson 4: Preparing a Vuser Script for Load Testing
HP LoadRunner (12.50) Page 34
2. Click the Step Navigator tab to display the Step Navigator.
3. Insert a start transaction marker.a. In the Step Navigator, locate the step Image: Search Flights Button.
b. Double-click the Image: Search Flights Button step to display the corresponding web_imagestep in the Editor.
c. Click View >Steps Toolbox. The steps Toolbox appears in the right pane.
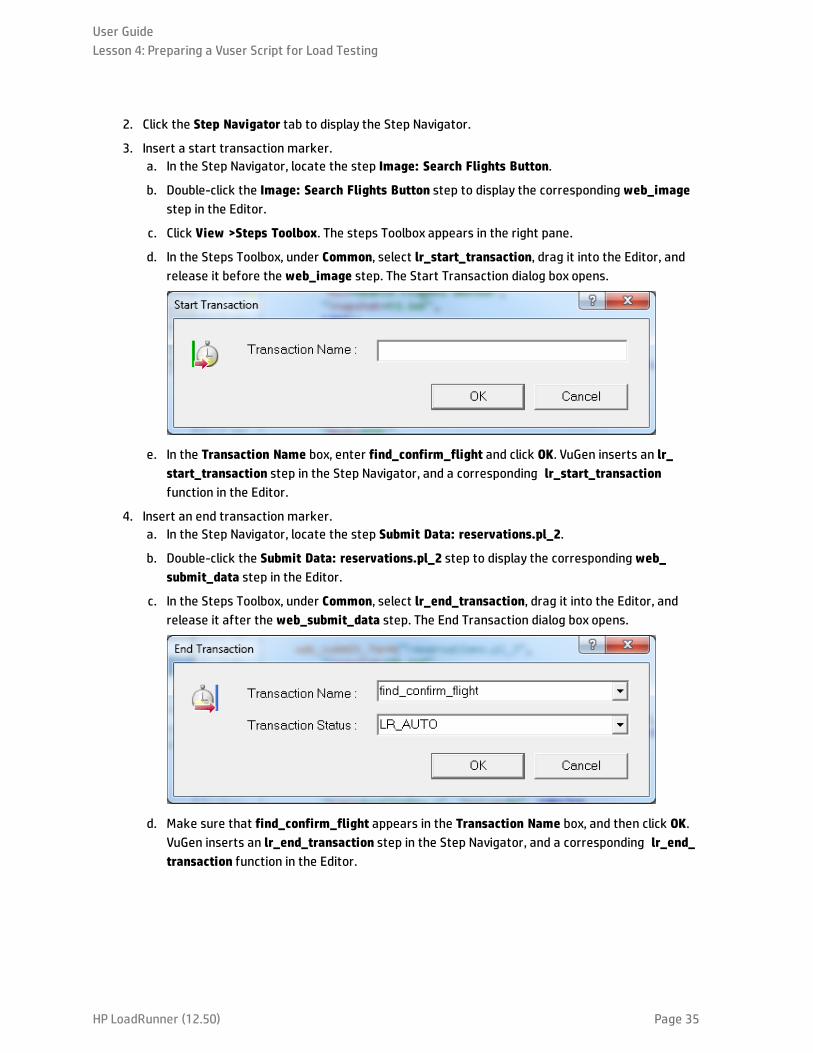
d. In the Steps Toolbox, under Common, select lr_start_transaction, drag it into the Editor, andrelease it before the web_image step. The Start Transaction dialog box opens.
e. In the Transaction Name box, enter find_confirm_flight and click OK. VuGen inserts an lr_start_transaction step in the Step Navigator, and a corresponding lr_start_transactionfunction in the Editor.
4. Insert an end transaction marker.a. In the Step Navigator, locate the step Submit Data: reservations.pl_2.
b. Double-click the Submit Data: reservations.pl_2 step to display the corresponding web_submit_data step in the Editor.
c. In the Steps Toolbox, under Common, select lr_end_transaction, drag it into the Editor, andrelease it after the web_submit_data step. The End Transaction dialog box opens.
d. Make sure that find_confirm_flight appears in the Transaction Name box, and then click OK.VuGen inserts an lr_end_transaction step in the Step Navigator, and a corresponding lr_end_transaction function in the Editor.
User GuideLesson 4: Preparing a Vuser Script for Load Testing
HP LoadRunner (12.50) Page 35

You have now defined the find_confirm_flight transaction.
How do I emulate multiple users?In your emulation, you tracked a user booking a flight and choosing an aisle seat. In a real-life setting,however, different users will have varying preferences. To improve your test, you need to check if thebooking will work when users select different seating preferences (Aisle,Window, or None).
To accomplish this, you will parameterize the script. This means that you take the recorded value, Aisle,and replace it with a parameter. You will place values for the parameter in a parameter file. When yourun the script, the Vuser will use values from the parameter file (Aisle,Window, or None) therebyemulating a true travel agency environment.
To parameterize your script:
1. Find the section where you want to vary the data.a. Select View > Step Navigator to show the Step Navigator in the left pane.
b. In the Step Navigator, locate the Submit Data: reservations.pl step.
c. Right-click the Submit Form: reservations.pl step and select Show Arguments. The SubmitForm Step Properties dialog box opens.
User GuideLesson 4: Preparing a Vuser Script for Load Testing
HP LoadRunner (12.50) Page 36
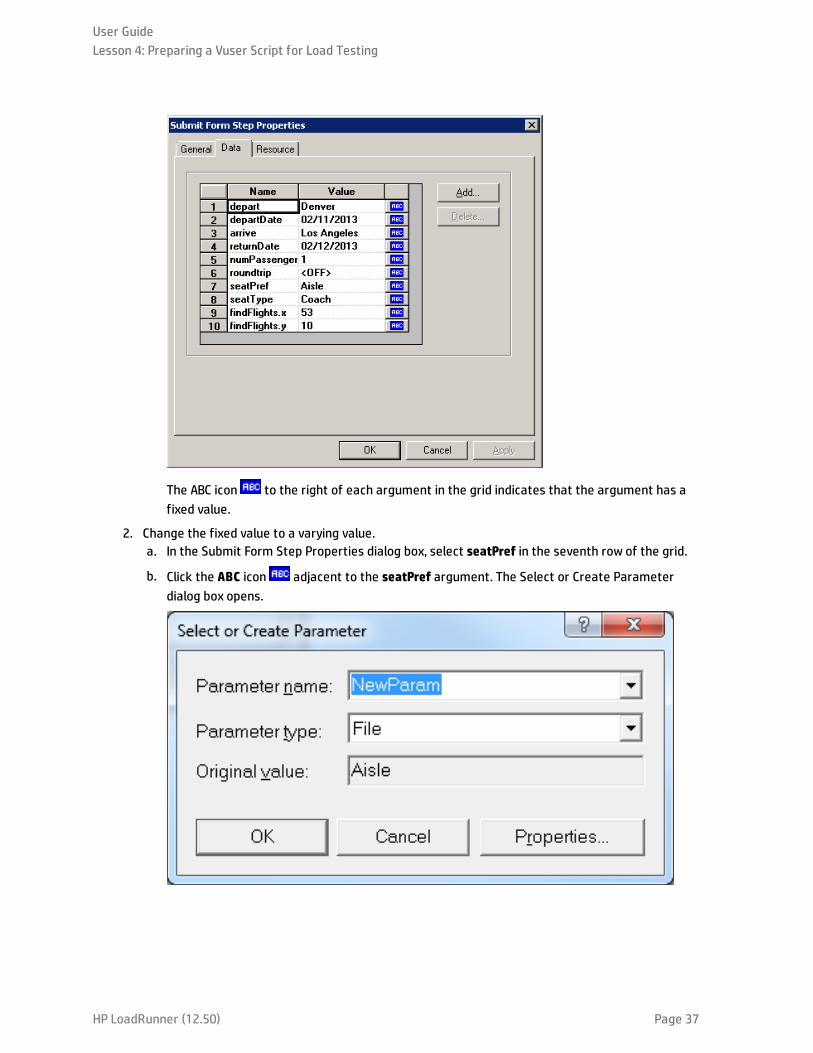
The ABC icon to the right of each argument in the grid indicates that the argument has afixed value.
2. Change the fixed value to a varying value.a. In the Submit Form Step Properties dialog box, select seatPref in the seventh row of the grid.
b. Click the ABC icon adjacent to the seatPref argument. The Select or Create Parameterdialog box opens.
User GuideLesson 4: Preparing a Vuser Script for Load Testing
HP LoadRunner (12.50) Page 37

3. Create a parameter.a. In the Parameter name box, type seat.
b. Click OK. In the Submit Form Step Properties dialog box, VuGen replaces the ABC icon witha Parameter icon .
c. Click the Parameter icon adjacent to {seat} and select Parameter Properties. The
User GuideLesson 4: Preparing a Vuser Script for Load Testing
HP LoadRunner (12.50) Page 38
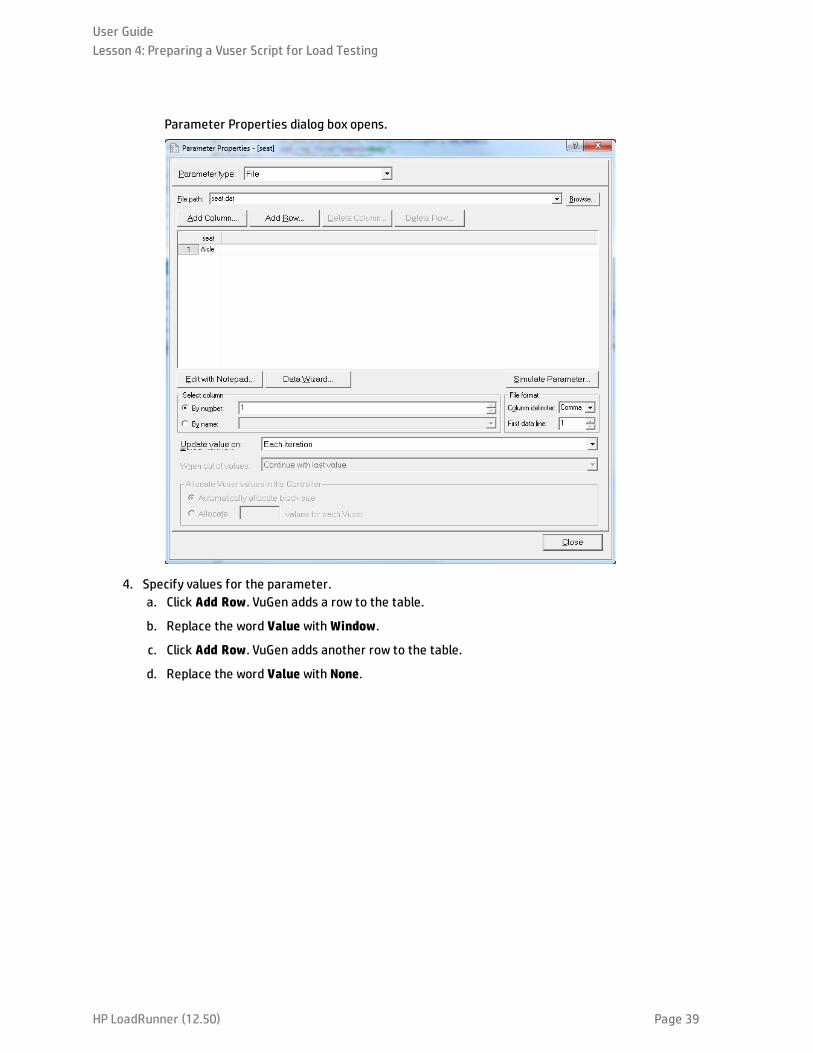
Parameter Properties dialog box opens.
4. Specify values for the parameter.a. Click Add Row. VuGen adds a row to the table.
b. Replace the word Value withWindow.
c. Click Add Row. VuGen adds another row to the table.
d. Replace the word Value with None.
User GuideLesson 4: Preparing a Vuser Script for Load Testing
HP LoadRunner (12.50) Page 39
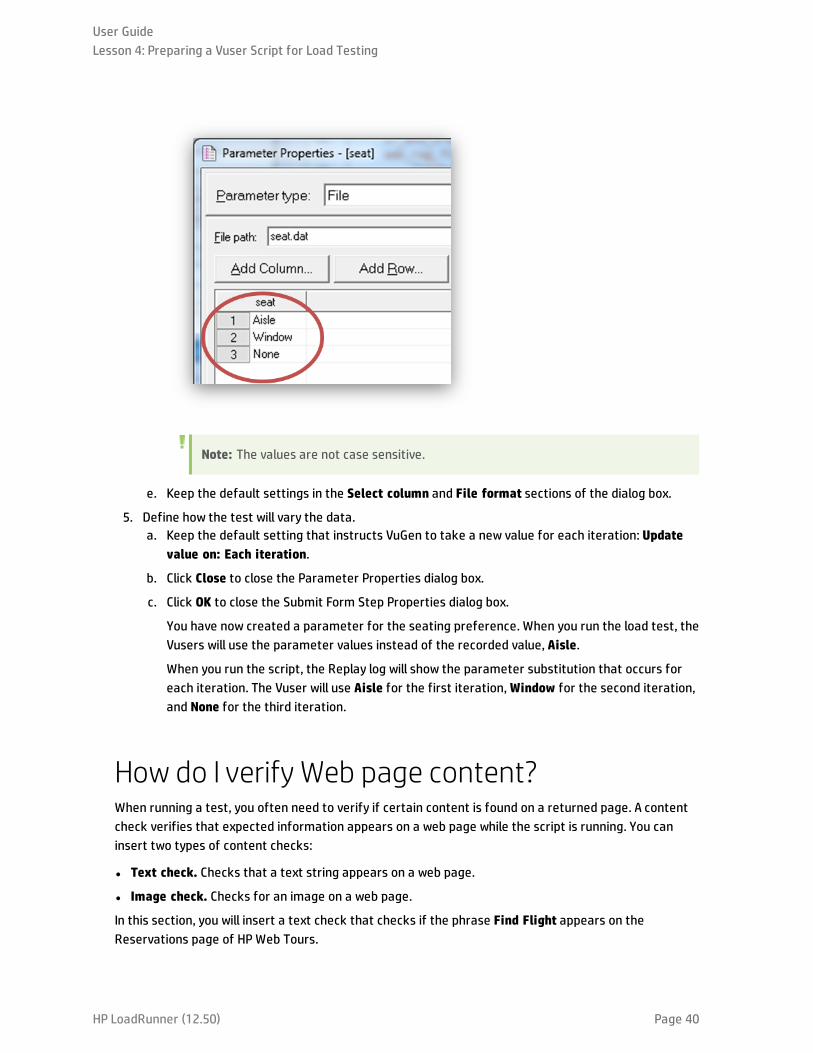
Note: The values are not case sensitive.
e. Keep the default settings in the Select column and File format sections of the dialog box.
5. Define how the test will vary the data.a. Keep the default setting that instructs VuGen to take a new value for each iteration: Update
value on: Each iteration.
b. Click Close to close the Parameter Properties dialog box.
c. Click OK to close the Submit Form Step Properties dialog box.
You have now created a parameter for the seating preference. When you run the load test, theVusers will use the parameter values instead of the recorded value, Aisle.
When you run the script, the Replay log will show the parameter substitution that occurs foreach iteration. The Vuser will use Aisle for the first iteration,Window for the second iteration,and None for the third iteration.
How do I verify Web page content?When running a test, you often need to verify if certain content is found on a returned page. A contentcheck verifies that expected information appears on a web page while the script is running. You caninsert two types of content checks:
l Text check. Checks that a text string appears on a web page.
l Image check. Checks for an image on a web page.
In this section, you will insert a text check that checks if the phrase Find Flight appears on theReservations page of HP Web Tours.
User GuideLesson 4: Preparing a Vuser Script for Load Testing
HP LoadRunner (12.50) Page 40
Inserting a text check
1. Click the Step Navigator tab to display the Step Navigator.
2. In the Step Navigator, locate the Submit Form: reservations.pl step.
3. On the VuGen toolbar, click the Show Snapshot pane button to display the Snapshot pane.
4. In the Step Navigator, double-click the snapshot icon in the Submit Form: reservations.pl step.The corresponding snapshot appears in the Snapshot pane.
5. From the VuGen menu, click View > Steps Toolbox. The Steps Toolbox pane appears.
6. In the Steps Toolbox - Search box, type in web_reg, and then locate the web_reg_find step in theFilter Results.
7. Drag the web_reg_find step from the toolbox into the Editor, before the web_submit_formfunction. The Find Text dialog box opens.
8. In the Find Text dialog box, type Find Flight into the Search for specific Text box, and then clickOK.
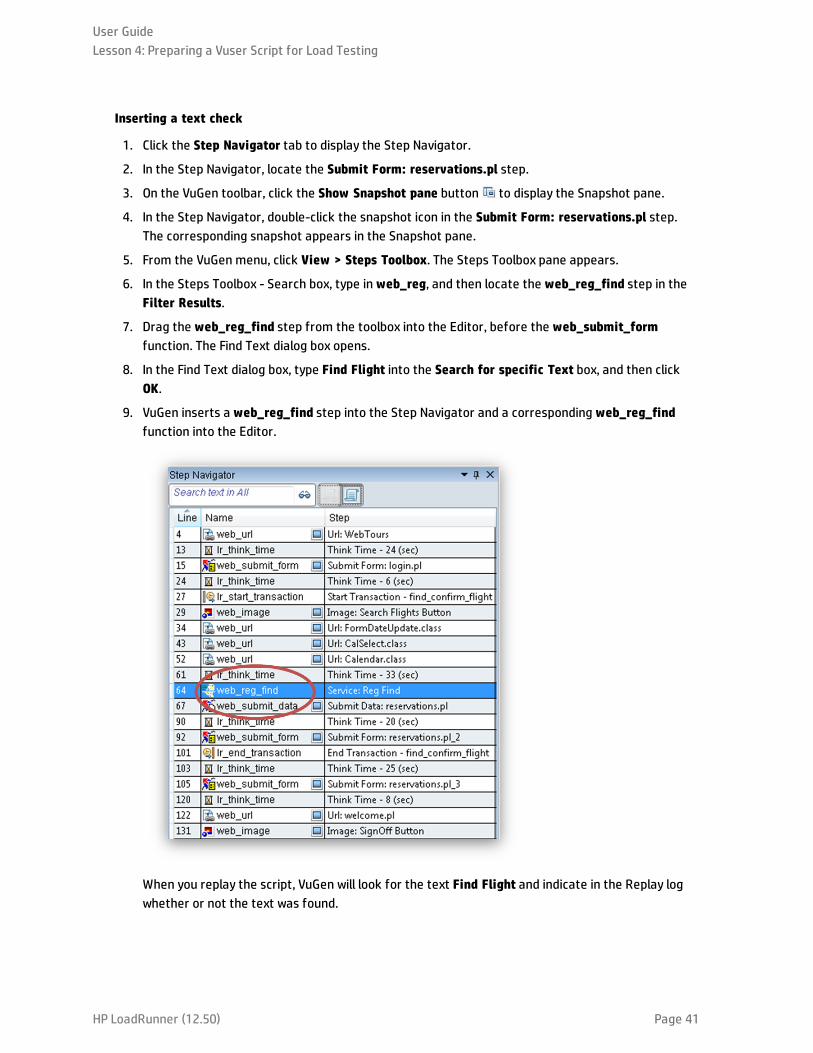
9. VuGen inserts a web_reg_find step into the Step Navigator and a corresponding web_reg_findfunction into the Editor.
When you replay the script, VuGen will look for the text Find Flight and indicate in the Replay logwhether or not the text was found.
User GuideLesson 4: Preparing a Vuser Script for Load Testing
HP LoadRunner (12.50) Page 41
How can I produce debugging information?At certain points during a test run, you may want to generate and send messages that containinformation relating to the script execution. These output messages will appear in both the Replay login the Output pane, and in the Controller’s Output window. You can send a standard output message or amessage that indicates that an error occurred.
The recommended way to work with error messages is to check for a Failed status. If the status isFailed, you instruct VuGen to issue an error message. For details, refer to the examples in the HPLoadRunner Function Reference.
In this section of the tutorial, you will instruct VuGen to insert an output message after the applicationcompletes a full booking.
To insert an output message:
1. Click the Step Navigator tab to display the Step Navigator.
2. In the Step Navigator, locate the last step, Image: SignOff Button.
3. Double-click the Image: SignOff Button step. The Editor displays the corresponding web_imagefunction.
4. In the Steps Toolbox, under Common, locate the lr_output_message function.
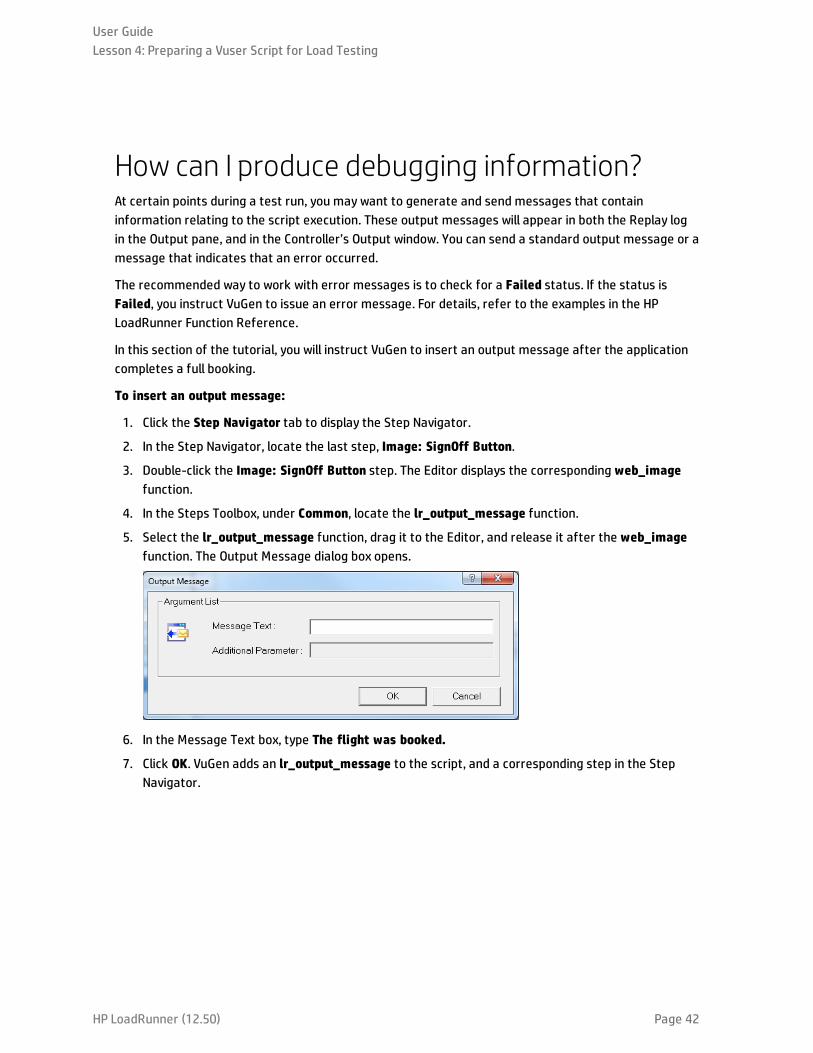
5. Select the lr_output_message function, drag it to the Editor, and release it after the web_imagefunction. The Output Message dialog box opens.
6. In the Message Text box, type The flight was booked.
7. Click OK. VuGen adds an lr_output_message to the script, and a corresponding step in the StepNavigator.
User GuideLesson 4: Preparing a Vuser Script for Load Testing
HP LoadRunner (12.50) Page 42
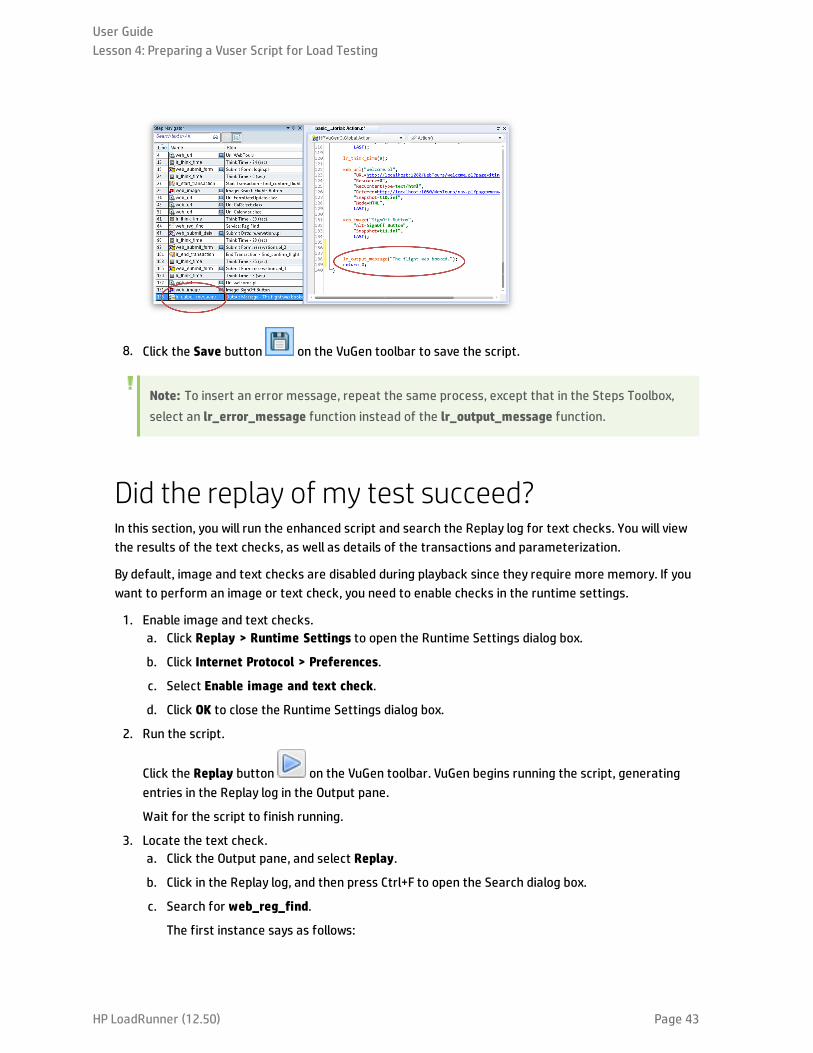
8. Click the Save button on the VuGen toolbar to save the script.
Note: To insert an error message, repeat the same process, except that in the Steps Toolbox,select an lr_error_message function instead of the lr_output_message function.
Did the replay of my test succeed?In this section, you will run the enhanced script and search the Replay log for text checks. You will viewthe results of the text checks, as well as details of the transactions and parameterization.
By default, image and text checks are disabled during playback since they require more memory. If youwant to perform an image or text check, you need to enable checks in the runtime settings.
1. Enable image and text checks.a. Click Replay > Runtime Settings to open the Runtime Settings dialog box.
b. Click Internet Protocol > Preferences.
c. Select Enable image and text check.
d. Click OK to close the Runtime Settings dialog box.
2. Run the script.
Click the Replay button on the VuGen toolbar. VuGen begins running the script, generatingentries in the Replay log in the Output pane.
Wait for the script to finish running.
3. Locate the text check.a. Click the Output pane, and select Replay.
b. Click in the Replay log, and then press Ctrl+F to open the Search dialog box.
c. Search for web_reg_find.
The first instance says as follows:
User GuideLesson 4: Preparing a Vuser Script for Load Testing
HP LoadRunner (12.50) Page 43
web_reg_find started
Click Find Next to display the next instance of web_reg_find. The second instance says asfollows:
Registering web_reg_find was successful.
This is not the actual text check—it only prepares VuGen to check for the text after the formsubmission.
Click Find Next to display the next instance of web_reg_find. This instance indicates:
Registered web_reg_find successful for “Text=Find Flight” (count=1).
This verifies that the text was found. If someone changes the Web page and removes thephrase Find Flight, then in subsequent runs, the output will indicate that the text was notfound.
4. Locate the beginning of a transaction.a. In the Replay log, press Ctrl+F to open the Search dialog box.
b. Search for the word Transaction. This notification is shown in blue.
5. View the parameter substitution.a. In the Replay log, press Ctrl+F to open the Search dialog box.
b. Search for the word Parameter. The log contains a notification “seat” = “Aisle”.
c. Search again (F3) for the next substitution. Note how VuGen takes a different value for eachiteration.
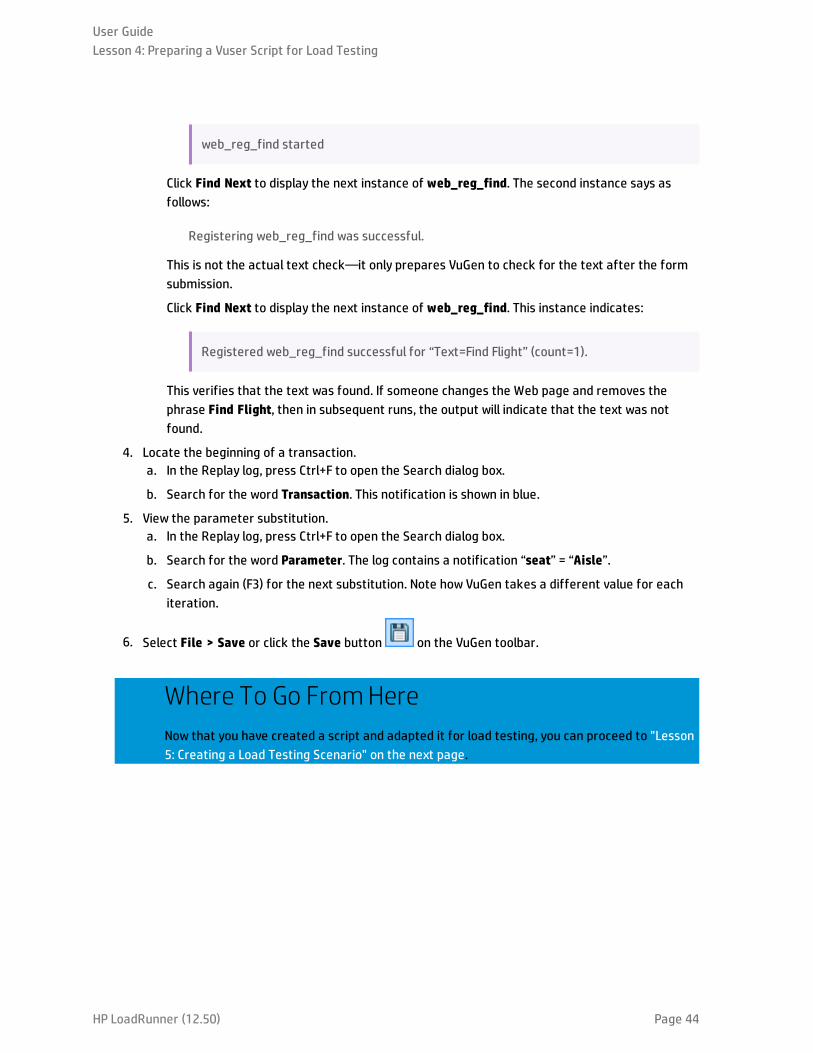
6. Select File > Save or click the Save button on the VuGen toolbar.
Where To Go FromHereNow that you have created a script and adapted it for load testing, you can proceed to "Lesson5: Creating a Load Testing Scenario" on the next page.
User GuideLesson 4: Preparing a Vuser Script for Load Testing
HP LoadRunner (12.50) Page 44

Lesson 5: Creating a Load TestingScenarioIn the previous lesson, you used VuGen to validate your Vuser script. In this lesson, you will evaluate yoursystem under the load of multiple Vusers. You will emulate the actions of ten travel agents concurrentlyusing the flight reservation system, and observe the behavior of the system under the load of theseusers. To design and run this test, you use the LoadRunner Controller.
Scenario Objectives
In this lesson, the objective is to create a scenario that emulates the behavior of ten travel agentssimultaneously logging on, searching flights, purchasing flights, checking itineraries, and logging off.
In this lesson you will cover the following topics:
l Introducing the LoadRunner Controller
l How do I start the Controller?
l The Controller at a glance
l How do I modify the script details?
l How do I generate a load on the system?
l How do I emulate real load behavior?
l How do I emulate different types of users?
l How do I monitor the system under load?
Introducing the LoadRunner ControllerLoad testing means testing your system under typical working conditions. For example, you may testthe system while many travel agents simultaneously reserve flights on the same flight reservationsystem.
You design the test to emulate real-life situations. To do this, you need to be able to generate a load onan application and schedule when the load is applied (because users do not log on and off the system atprecisely the same time). You also need to emulate different types of user activity and behavior. Forexample, some users may use Firefox to access the system, whereas other users use Internet Explorer.Users may also employ different network connections to access the system, such as modem, DSL, orcable. You create and save these settings in a scenario.
The Controller provides you with all the tools you need to help you build and run tests to accuratelyemulate your working environment.
User GuideLesson 5: Creating a Load Testing Scenario
HP LoadRunner (12.50) Page 45

How do I start the Controller?To begin developing a scenario, you open the LoadRunner Controller.
1. Open the HP LoadRunner Controller.
On the LoadRunner machine, click the Controller shortcut icon on your desktop.
The HP LoadRunner Controller opens and displays the New Scenario dialog box.
2. Select a scenario type.
There are two scenario types:
A Manual Scenario gives you control over the number of running Vusers and the times at whichthey run, and lets you test howmany Vusers your application can run simultaneously. You can usePercentage Mode to distribute the total number of Vusers between the scripts based on apercentage specified by your business analyst. The Percentage Mode check box is selected bydefault the first time you start LoadRunner following installation. If it is selected, clear it.
User GuideLesson 5: Creating a Load Testing Scenario
HP LoadRunner (12.50) Page 46
A Goal-Oriented Scenario is used to determine if your system can achieve a particular goal. Youdetermine the goal based on, for example, a specified transaction response time or number ofhits/transactions per second, and LoadRunner automatically builds a scenario for you based onthese goals.
l Click Manual Scenario.
3. Add a Vuser script to the load test.
In this tutorial, you will use only one Vuser script to model a single group of users performingidentical actions. To more accurately emulate a real-world scenario with more versatile userprofiles, you would create a number of different Vuser groups, with each group running severalscripts with different user settings.
The script that you previously recorded in VuGen contains the business processes that you want totest. They include logging on, searching for a flight, buying a ticket, checking the flight itinerary,and then logging off the site. You will add a similar script to the scenario, and configure thescenario to emulate eight travel agents simultaneously performing these actions on the flightreservation system. You will add two more Vusers during the test.
For this purpose, a sample script is provided that is similar to the one you created. We recommendthat you use the sample script.
a. If basic_script is already in the Available Scripts pane, select it and click the Add button tomove the script to the Scripts in Scenario pane .
b. If basic_script is not in the Available Scripts pane, click the Browse button. Locate basic_script in the <LoadRunner Installation>\Tutorial folder. Click Open. Click the Add button tomove the script to the Scripts in Scenario pane.
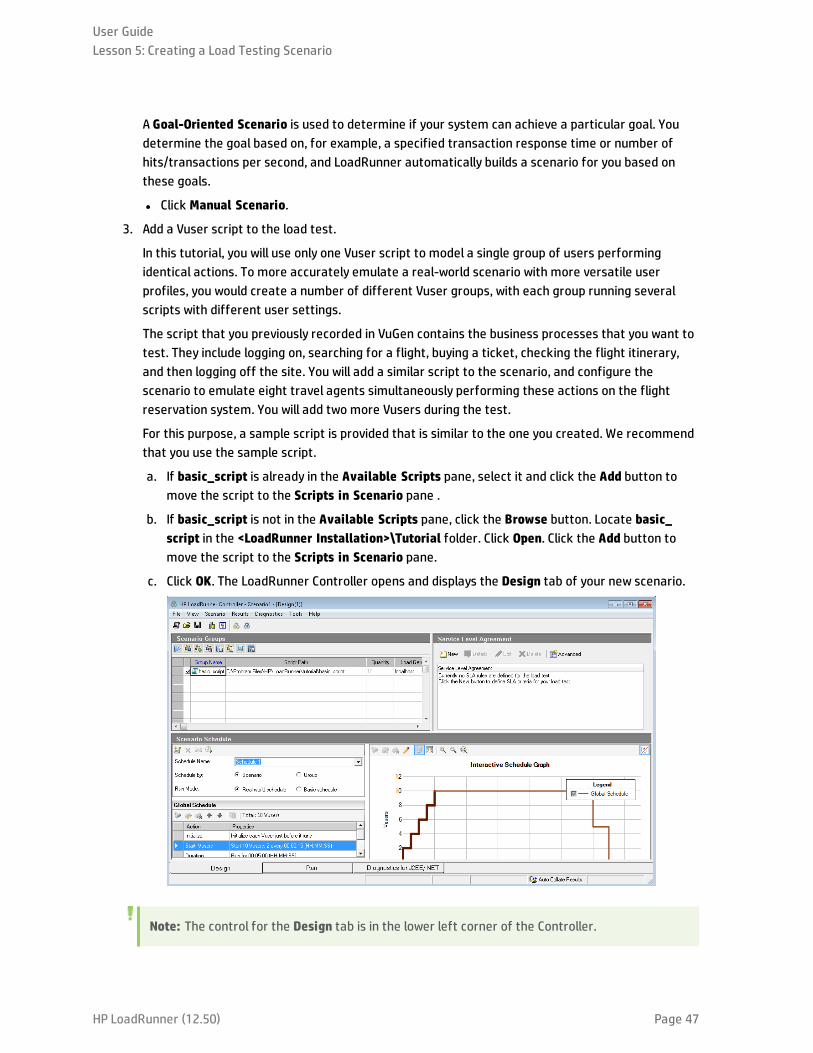
c. Click OK. The LoadRunner Controller opens and displays the Design tab of your new scenario.
Note: The control for the Design tab is in the lower left corner of the Controller.
User GuideLesson 5: Creating a Load Testing Scenario
HP LoadRunner (12.50) Page 47
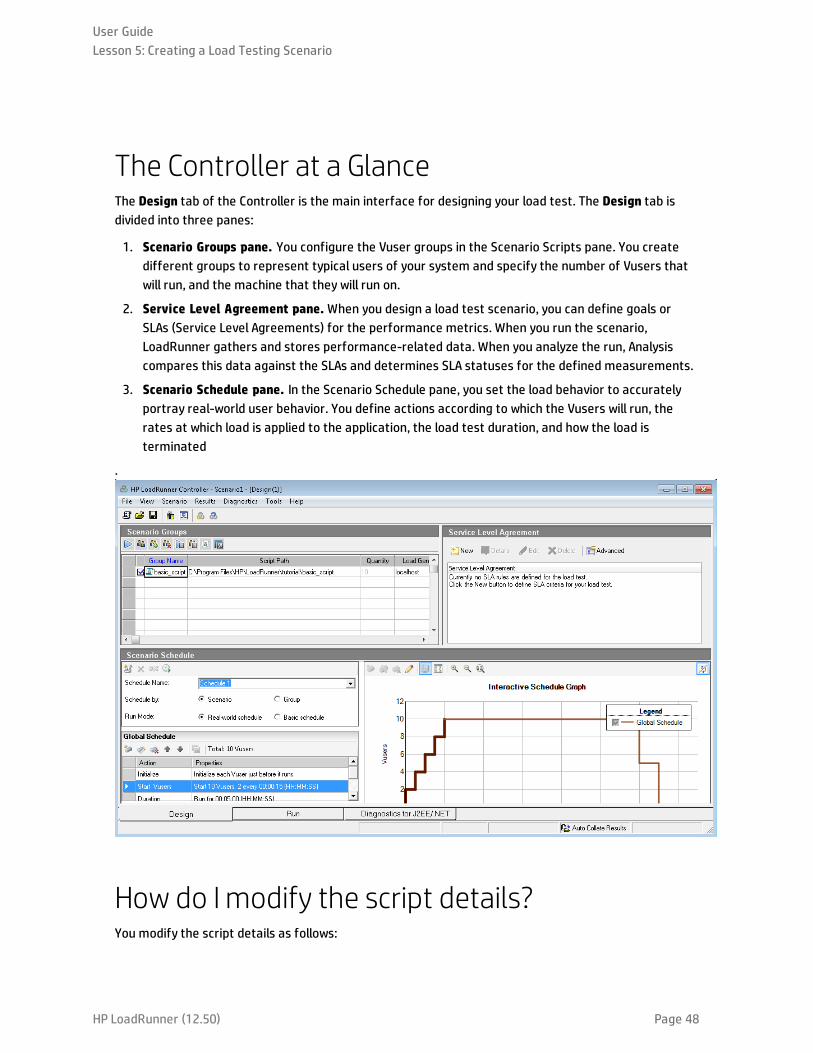
The Controller at a GlanceThe Design tab of the Controller is the main interface for designing your load test. The Design tab isdivided into three panes:
1. Scenario Groups pane. You configure the Vuser groups in the Scenario Scripts pane. You createdifferent groups to represent typical users of your system and specify the number of Vusers thatwill run, and the machine that they will run on.
2. Service Level Agreement pane.When you design a load test scenario, you can define goals orSLAs (Service Level Agreements) for the performance metrics. When you run the scenario,LoadRunner gathers and stores performance-related data. When you analyze the run, Analysiscompares this data against the SLAs and determines SLA statuses for the defined measurements.
3. Scenario Schedule pane. In the Scenario Schedule pane, you set the load behavior to accuratelyportray real-world user behavior. You define actions according to which the Vusers will run, therates at which load is applied to the application, the load test duration, and how the load isterminated
.
How do I modify the script details?You modify the script details as follows:
User GuideLesson 5: Creating a Load Testing Scenario
HP LoadRunner (12.50) Page 48
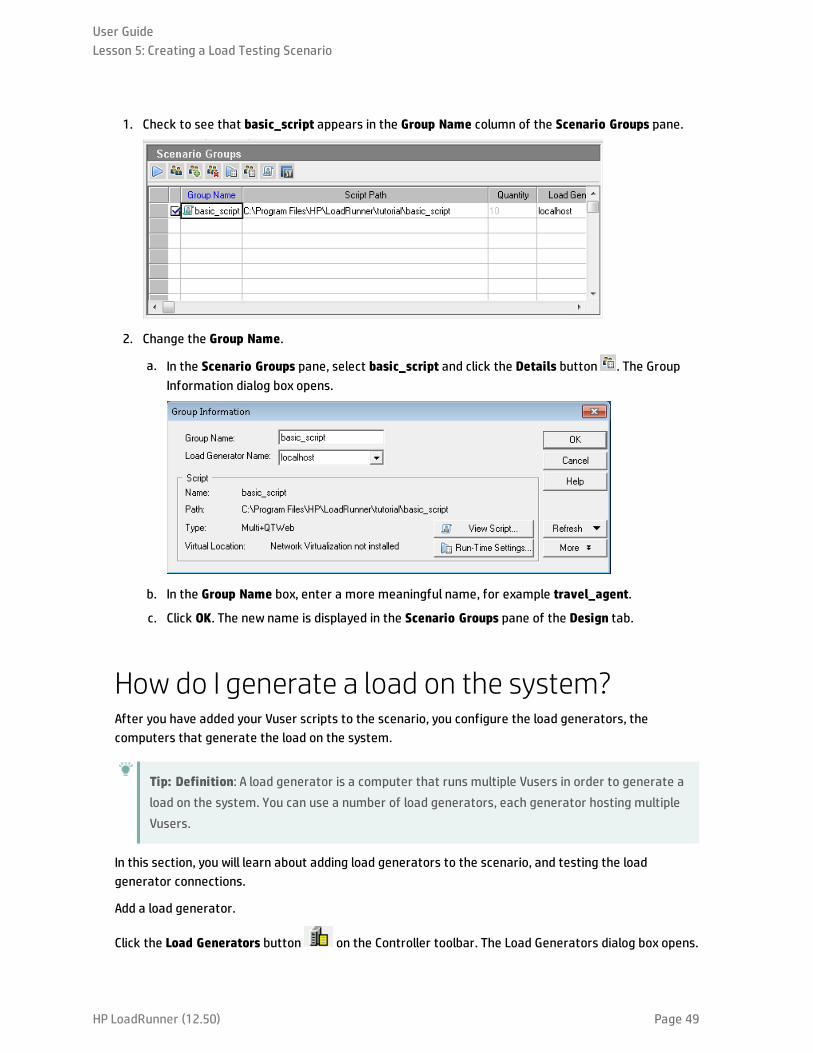
1. Check to see that basic_script appears in the Group Name column of the Scenario Groups pane.
2. Change the Group Name.
a. In the Scenario Groups pane, select basic_script and click the Details button . The GroupInformation dialog box opens.
b. In the Group Name box, enter a more meaningful name, for example travel_agent.
c. Click OK. The new name is displayed in the Scenario Groups pane of the Design tab.
How do I generate a load on the system?After you have added your Vuser scripts to the scenario, you configure the load generators, thecomputers that generate the load on the system.
Tip: Definition: A load generator is a computer that runs multiple Vusers in order to generate aload on the system. You can use a number of load generators, each generator hosting multipleVusers.
In this section, you will learn about adding load generators to the scenario, and testing the loadgenerator connections.
Add a load generator.
Click the Load Generators button on the Controller toolbar. The Load Generators dialog box opens.
User GuideLesson 5: Creating a Load Testing Scenario
HP LoadRunner (12.50) Page 49

The Load Generators dialog box enables you to view and configure the load generators that are definedin the scenario. The Load Generators dialog box shows details for the load generator called localhost.The status of the localhost load generator is Down. This indicates that the Controller is not connectedto the localhost load generator.
In this tutorial, you will use your local computer as the load generator.
Note: In a typical operational system, you would have several load generators, each hostingmultiple Vusers.
Test the load generator connection.
When you run a scenario, the Controller connects to the load generators automatically. However, youcan test the connections before trying to run the scenario.
1. In the Load Generators dialog box, select localhost and click Connect.
The Controller attempts to connect to the load generator machine. When a connection has beenmade, the Status of the load generator changes from Down to Ready.
2. Click Close.
User GuideLesson 5: Creating a Load Testing Scenario
HP LoadRunner (12.50) Page 50

How do I emulate real load behavior?After you have added your load generators, you are ready to configure load behavior.
Typical users do not log on and off the system at precisely the same time. LoadRunner allows users togradually log on to and off the system. It also lets you determine the duration of the scenario, and theway in which the scenario terminates. The scenario that you will configure below will be relativelysimple. However, when designing a scenario that more accurately reflects a real life scenario, you candefine more true-to-life Vuser activity.
You configure the load behavior for a manual scenario in the Scenario Schedule pane of the Controller.The Scenario Schedule pane is divided into three sections: the Schedule Definition area, the Actionsgrid, and the Interactive Schedule graph.
You will now change the default load settings and configure a scenario schedule.
1. Select schedule type and run mode.
In the Scenario Schedule pane, make sure that Schedule by: Scenario and Run Mode: Real-worldschedule are selected.
2. Set the scheduled action definitions.
You can set the Start Vusers, Duration, and Stop Vusers actions for the scenario schedules fromeither the Global Schedule grid, or by manipulating the Interactive Schedule graph. When you setthe definitions from the graph, the Global Schedule grid properties adjust accordingly.
You will now set the definitions so that the Global Schedule grid will look as below.
User GuideLesson 5: Creating a Load Testing Scenario
HP LoadRunner (12.50) Page 51
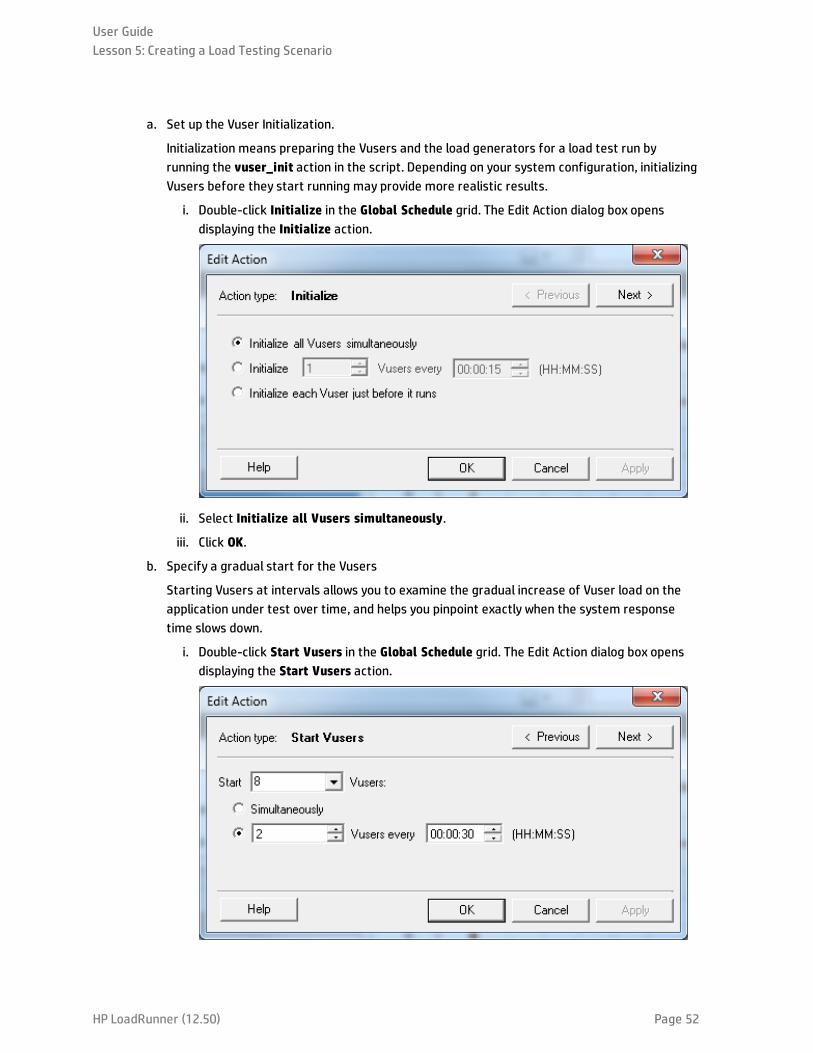
a. Set up the Vuser Initialization.
Initialization means preparing the Vusers and the load generators for a load test run byrunning the vuser_init action in the script. Depending on your system configuration, initializingVusers before they start running may provide more realistic results.
i. Double-click Initialize in the Global Schedule grid. The Edit Action dialog box opensdisplaying the Initialize action.
ii. Select Initialize all Vusers simultaneously.
iii. Click OK.
b. Specify a gradual start for the Vusers
Starting Vusers at intervals allows you to examine the gradual increase of Vuser load on theapplication under test over time, and helps you pinpoint exactly when the system responsetime slows down.
i. Double-click Start Vusers in the Global Schedule grid. The Edit Action dialog box opensdisplaying the Start Vusers action.
User GuideLesson 5: Creating a Load Testing Scenario
HP LoadRunner (12.50) Page 52

ii. In the Start X Vusers box, enter 8, and select the second option— 2 Vusers every00:00:30 (30 seconds).
iii. Click OK.
c. Schedule the duration.
You specify a duration to make sure that the Vusers continue performing the schedule actionfor a specific period so you can measure continuous load on the server. If you set a duration,the script will run for as many iterations as necessary during that period, disregarding thenumber of iterations set in the script’s runtime settings.
i. Make sure that the Interactive Schedule Graph is in Edit mode by clicking the Edit Mode
button on the Interactive Schedule Graph toolbar.
ii. In the Interactive Schedule Graph, click the horizontal line which represents Duration. Theline is highlighted and a dot and a diamond are displayed at its endpoints.
Note: The legend is displayed on top of the diamond, click the Hide Legend
button on the Interactive Schedule Graph toolbar to show the diamond.n
iii. Drag the diamond shaped endpoint to the right until the time in brackets reads 00:11:30.You have just set the Vusers to run for a period of 10 minutes.
d. Schedule a gradual closure.
Gradually stopping Vusers is recommended to help detect memory leaks and check systemrecovery, after the application has reached a threshold.
i. Double-click Stop Vusers in the Global Schedule grid. The Edit Action dialog box opensdisplaying the Stop Vusers action.
ii. Select the second option and enter the following values—2 Vusers every 00:00:30 (30
User GuideLesson 5: Creating a Load Testing Scenario
HP LoadRunner (12.50) Page 53

seconds).
iii. Click OK.
How do I emulate different types of users?Now that you have configured a load schedule, you will specify how the Vusers will behave during thetest.
When emulating a real user, you need to consider the user’s actual behavior. Behavior refers to the timethat a user takes to pause between actions, the number of times a user repeats an action, and so on.
In this section, you will learn more about LoadRunner’s runtime settings, and you will enable Think Timeand Logging.
1. Open the runtime settings.a. In the Controller, click the Design tab.
b. In the Scenario Groups pane, select the travel_agents group.
c. Click the Runtime Settings button on the Scenario Groups toolbar. The Runtime Settingsdialog box opens.
The runtime settings let you emulate different kinds of user activity and behavior. Theyinclude:
Run Logic. The number of times a Vuser repeats a set of actions.
Pacing. The time to wait before repeating the action.
Log. The level of information that you want to gather during the test. The first time you run ascenario, it is recommended to generate log messages to make sure that you have debugginginformation in case the first run fails.
User GuideLesson 5: Creating a Load Testing Scenario
HP LoadRunner (12.50) Page 54
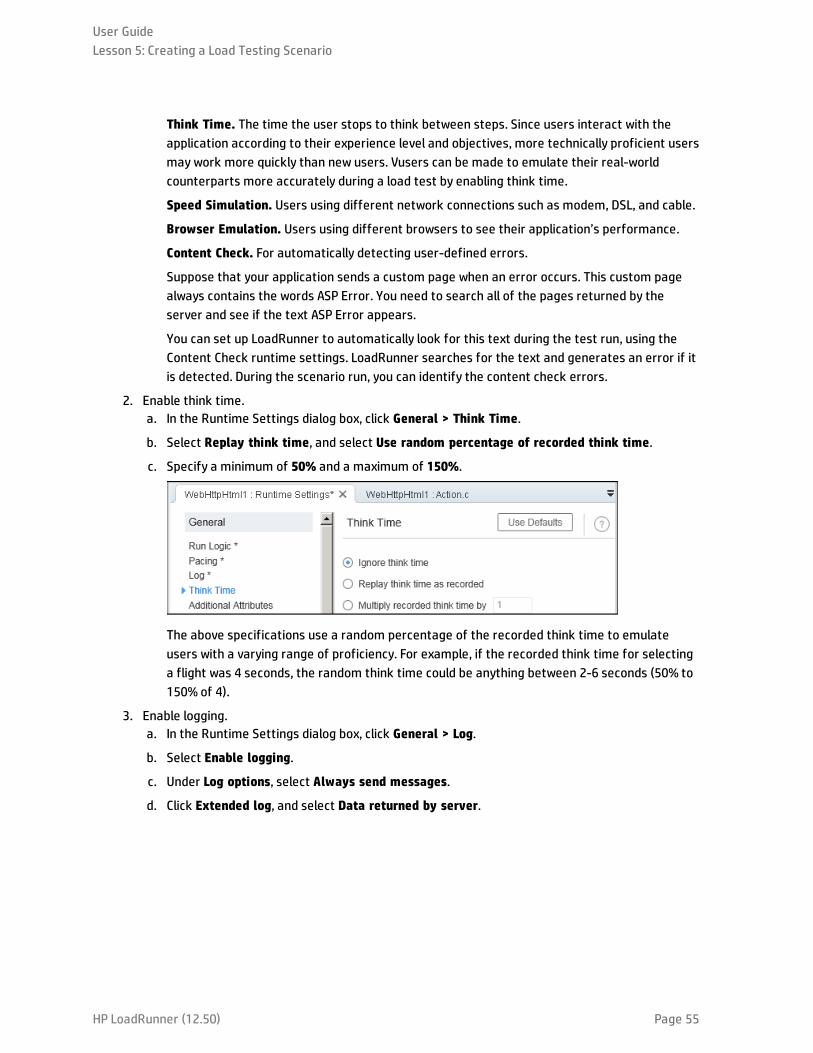
Think Time. The time the user stops to think between steps. Since users interact with theapplication according to their experience level and objectives, more technically proficient usersmay work more quickly than new users. Vusers can be made to emulate their real-worldcounterparts more accurately during a load test by enabling think time.
Speed Simulation. Users using different network connections such as modem, DSL, and cable.
Browser Emulation. Users using different browsers to see their application’s performance.
Content Check. For automatically detecting user-defined errors.
Suppose that your application sends a custom page when an error occurs. This custom pagealways contains the words ASP Error. You need to search all of the pages returned by theserver and see if the text ASP Error appears.
You can set up LoadRunner to automatically look for this text during the test run, using theContent Check runtime settings. LoadRunner searches for the text and generates an error if itis detected. During the scenario run, you can identify the content check errors.
2. Enable think time.a. In the Runtime Settings dialog box, click General > Think Time.
b. Select Replay think time, and select Use random percentage of recorded think time.
c. Specify a minimum of 50% and a maximum of 150%.
The above specifications use a random percentage of the recorded think time to emulateusers with a varying range of proficiency. For example, if the recorded think time for selectinga flight was 4 seconds, the random think time could be anything between 2-6 seconds (50% to150% of 4).
3. Enable logging.a. In the Runtime Settings dialog box, click General > Log.
b. Select Enable logging.
c. Under Log options, select Always send messages.
d. Click Extended log, and select Data returned by server.
User GuideLesson 5: Creating a Load Testing Scenario
HP LoadRunner (12.50) Page 55

Note: After the initial debugging run, extended logging is not recommended for a loadtest. It is enabled only for the purposes of this tutorial to provide information for theVuser Output log.
e. Save the scenario.
How do I monitor the system under load?Now that you have defined how your Vusers will behave during the test, you are ready to set up yourmonitors.
While generating a load on an application, you want to see how the application performs in real timeand where potential bottlenecks exist. You use LoadRunner’s suite of integrated monitors to measurethe performance of every single tier, server, and component of the system during the load test.LoadRunner includes monitors for a variety of major backend system components including Web,application, database, and ERP/CRM servers.
For instance, you can select a Web Server Resources monitor according to the type of Web server thatis running. You can purchase a license for the relevant monitor, for example IIS, and use that monitor topinpoint problems reflected in the IIS resources.
In this section, you will learn how to add and configure the Windows Resources monitor. You can use thismonitor to determine the impact of load on your CPU, disk, and memory resources.
1. Select the Windows Resources Monitor.a. Click the Run tab at the bottom of the Controller.
The Windows Resources graph is one of four default graphs that are displayed in the graphviewing area. You will learn how to open other graphs in the next lesson.
User GuideLesson 5: Creating a Load Testing Scenario
HP LoadRunner (12.50) Page 56
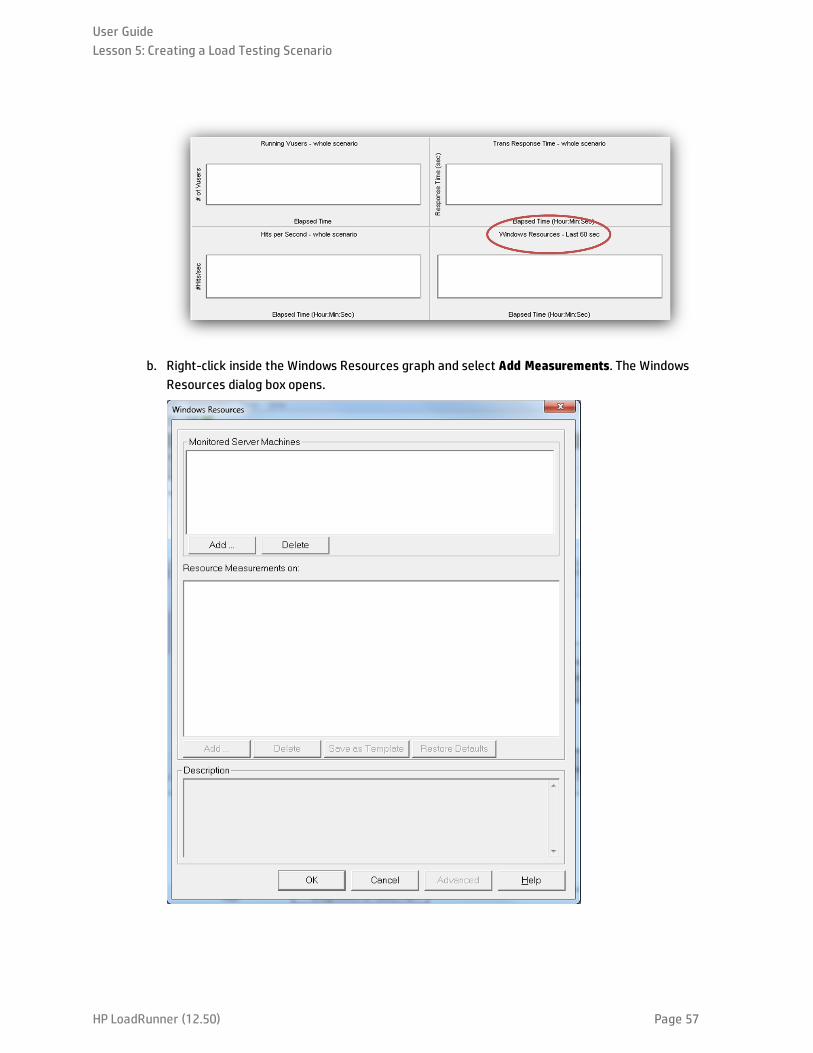
b. Right-click inside the Windows Resources graph and select Add Measurements. The WindowsResources dialog box opens.
User GuideLesson 5: Creating a Load Testing Scenario
HP LoadRunner (12.50) Page 57

2. Select the monitored server.a. In the Monitored Server Machines section of the Windows Resources dialog box, click Add. The
Add Machine dialog box opens.
b. In the Name box, type localhost. (If your load generator was running off a different machineyou would type the server name or IP address of that machine.)
c. From the Platform list, select the platform on which the machine runs.
d. Click OK.
The default Windows Resources measurements are listed under the Resource Measurements
User GuideLesson 5: Creating a Load Testing Scenario
HP LoadRunner (12.50) Page 58
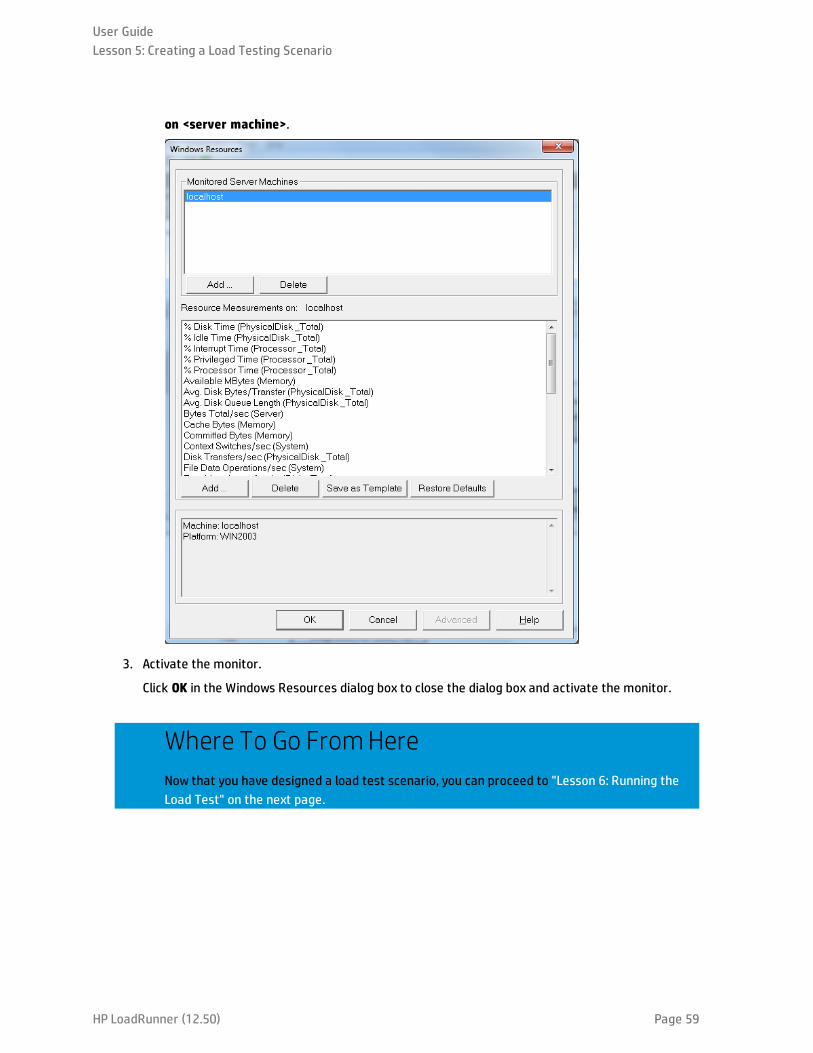
on <server machine>.
3. Activate the monitor.
Click OK in the Windows Resources dialog box to close the dialog box and activate the monitor.
Where To Go FromHereNow that you have designed a load test scenario, you can proceed to "Lesson 6: Running theLoad Test" on the next page.
User GuideLesson 5: Creating a Load Testing Scenario
HP LoadRunner (12.50) Page 59
Lesson 6: Running the Load TestWhen you run a load test, LoadRunner generates a load on the system. You can then use LoadRunner’smonitors and graphs to observe the performance of the system under load.
In this lesson you will cover the following topics:
l The Controller Run view at a glance
l How do I run a load test scenario?
l How do I watch a Vuser running in real time?
l Where can I view a summary of user actions?
l How can I increase the load during the test?
l How is the application performing under load?
l Did the application encounter errors?
l How do I know that the test finished running?
l Did the application perform well under load?
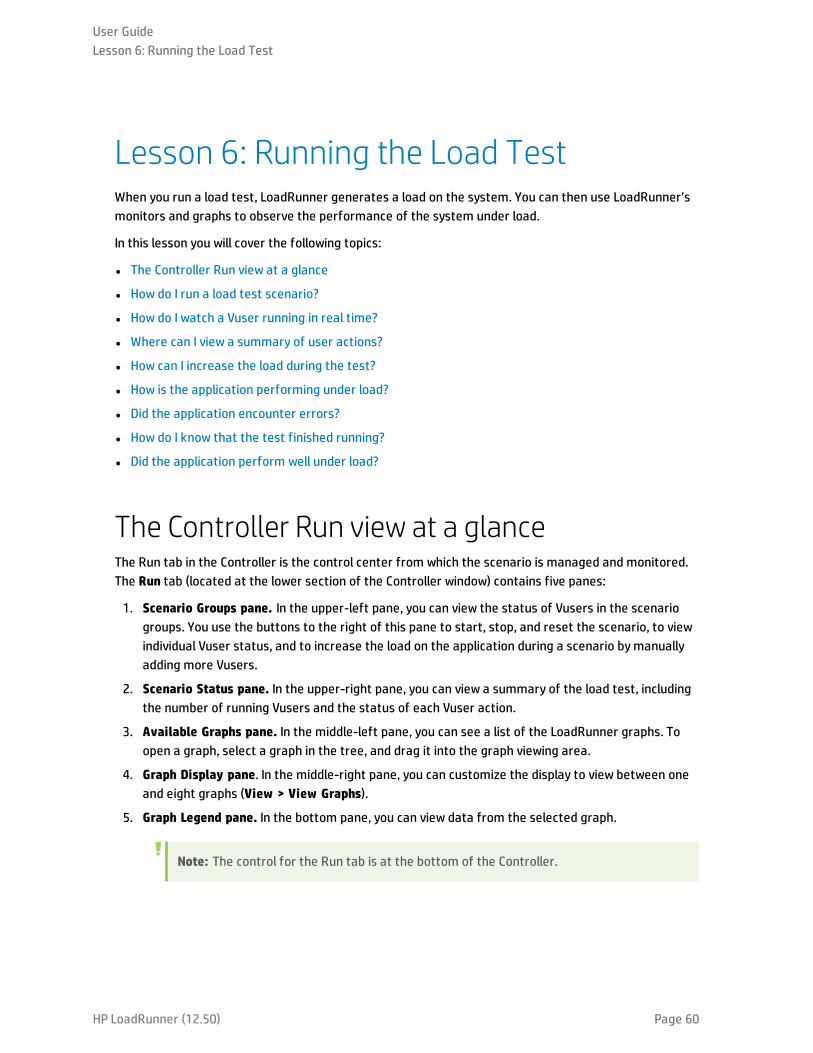
The Controller Run view at a glanceThe Run tab in the Controller is the control center from which the scenario is managed and monitored.The Run tab (located at the lower section of the Controller window) contains five panes:
1. Scenario Groups pane. In the upper-left pane, you can view the status of Vusers in the scenariogroups. You use the buttons to the right of this pane to start, stop, and reset the scenario, to viewindividual Vuser status, and to increase the load on the application during a scenario by manuallyadding more Vusers.
2. Scenario Status pane. In the upper-right pane, you can view a summary of the load test, includingthe number of running Vusers and the status of each Vuser action.
3. Available Graphs pane. In the middle-left pane, you can see a list of the LoadRunner graphs. Toopen a graph, select a graph in the tree, and drag it into the graph viewing area.
4. Graph Display pane. In the middle-right pane, you can customize the display to view between oneand eight graphs (View > View Graphs).
5. Graph Legend pane. In the bottom pane, you can view data from the selected graph.
Note: The control for the Run tab is at the bottom of the Controller.
User GuideLesson 6: Running the Load Test
HP LoadRunner (12.50) Page 60
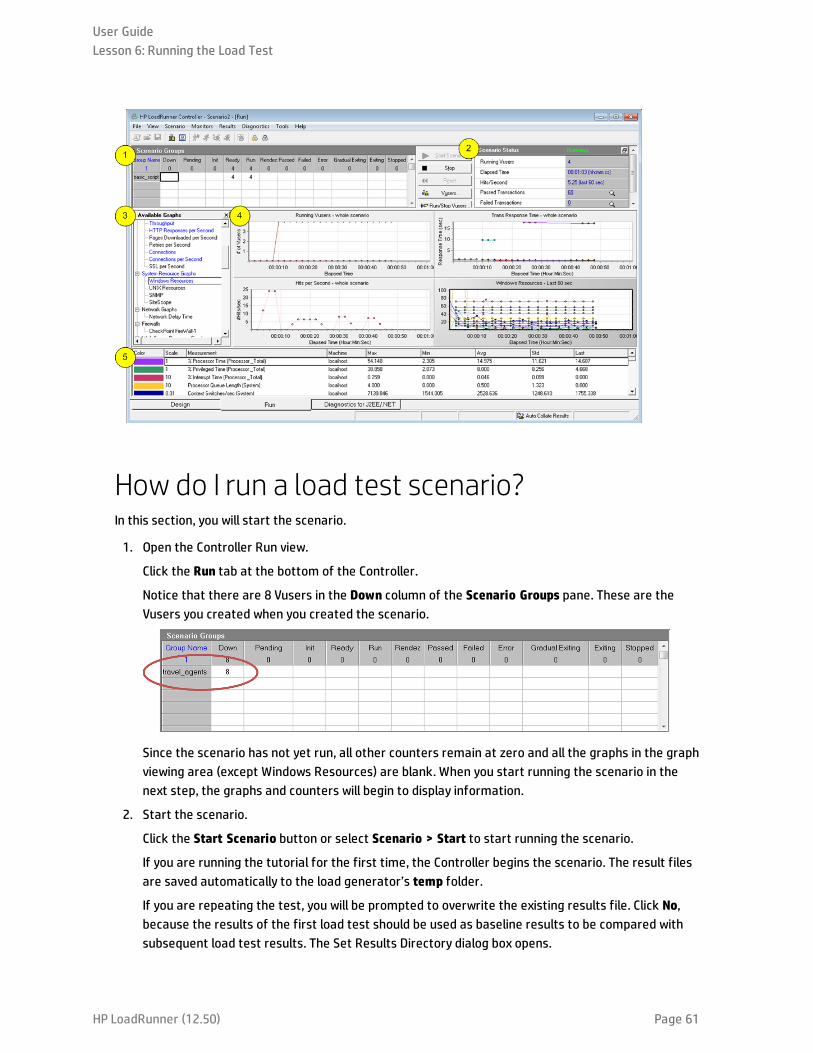
How do I run a load test scenario?In this section, you will start the scenario.
1. Open the Controller Run view.
Click the Run tab at the bottom of the Controller.
Notice that there are 8 Vusers in the Down column of the Scenario Groups pane. These are theVusers you created when you created the scenario.
Since the scenario has not yet run, all other counters remain at zero and all the graphs in the graphviewing area (except Windows Resources) are blank. When you start running the scenario in thenext step, the graphs and counters will begin to display information.
2. Start the scenario.
Click the Start Scenario button or select Scenario > Start to start running the scenario.
If you are running the tutorial for the first time, the Controller begins the scenario. The result filesare saved automatically to the load generator’s temp folder.
If you are repeating the test, you will be prompted to overwrite the existing results file. Click No,because the results of the first load test should be used as baseline results to be compared withsubsequent load test results. The Set Results Directory dialog box opens.
User GuideLesson 6: Running the Load Test
HP LoadRunner (12.50) Page 61
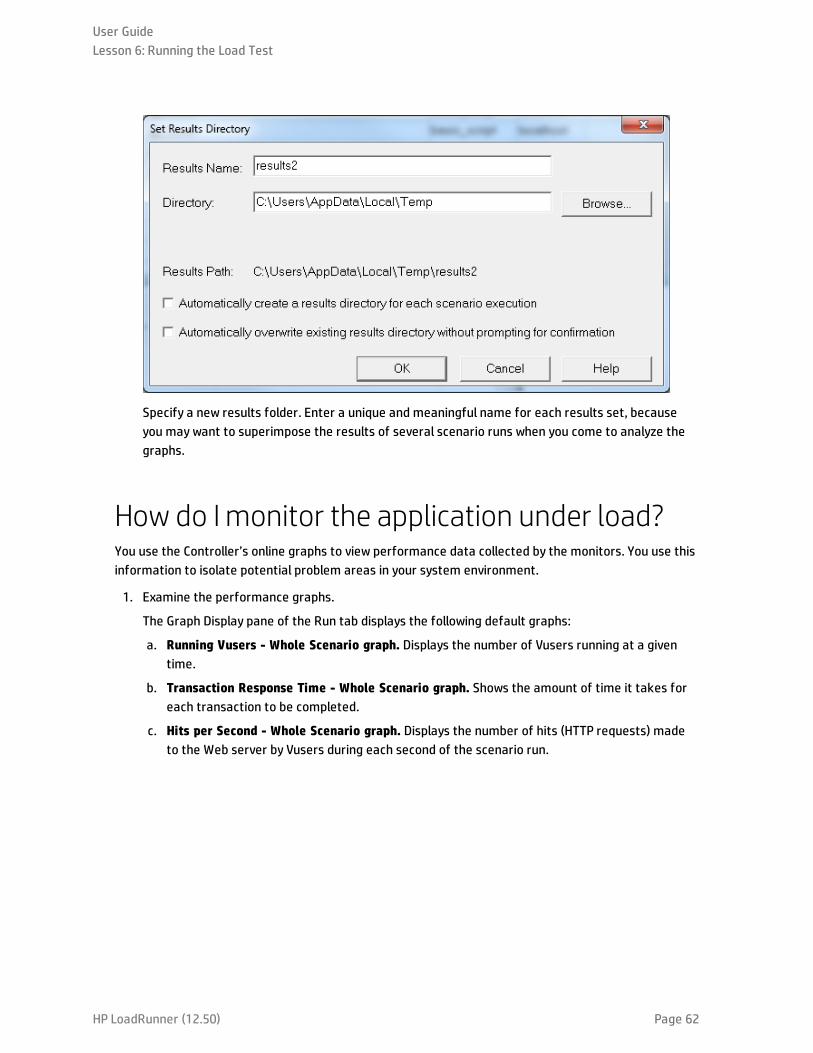
Specify a new results folder. Enter a unique and meaningful name for each results set, becauseyou may want to superimpose the results of several scenario runs when you come to analyze thegraphs.
How do I monitor the application under load?You use the Controller’s online graphs to view performance data collected by the monitors. You use thisinformation to isolate potential problem areas in your system environment.
1. Examine the performance graphs.
The Graph Display pane of the Run tab displays the following default graphs:
a. Running Vusers - Whole Scenario graph. Displays the number of Vusers running at a giventime.
b. Transaction Response Time - Whole Scenario graph. Shows the amount of time it takes foreach transaction to be completed.
c. Hits per Second - Whole Scenario graph. Displays the number of hits (HTTP requests) madeto the Web server by Vusers during each second of the scenario run.
User GuideLesson 6: Running the Load Test
HP LoadRunner (12.50) Page 62
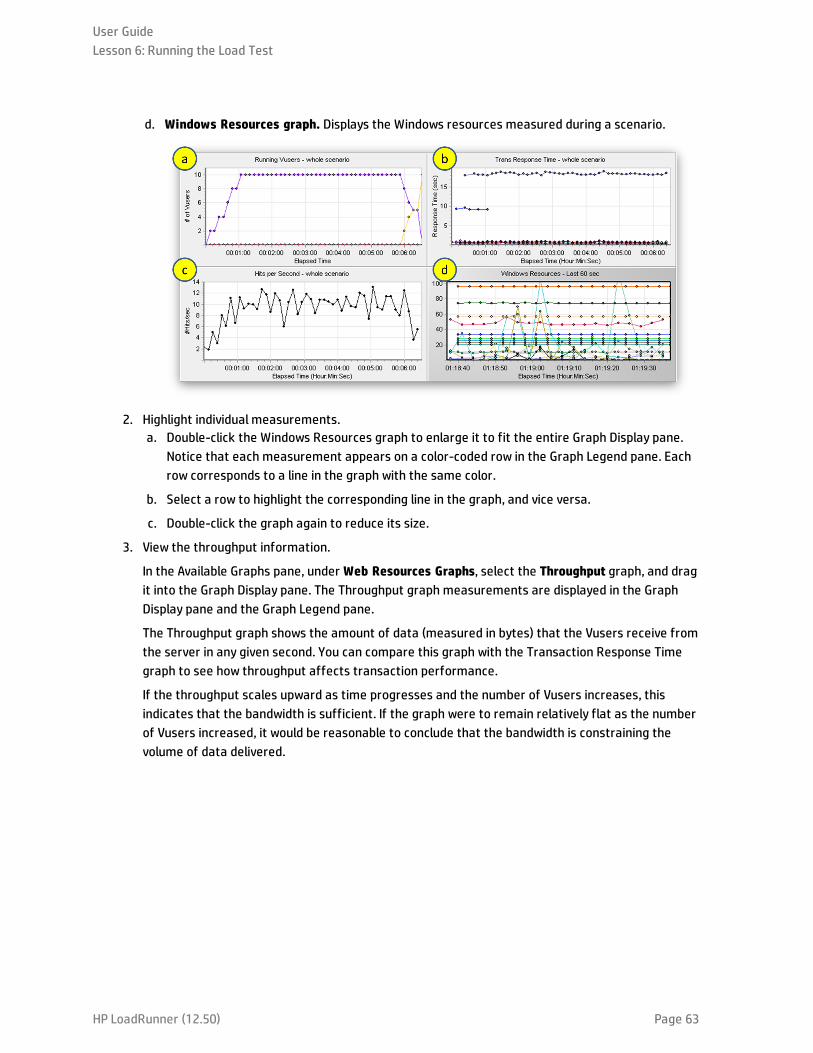
d. Windows Resources graph. Displays the Windows resources measured during a scenario.
2. Highlight individual measurements.a. Double-click the Windows Resources graph to enlarge it to fit the entire Graph Display pane.
Notice that each measurement appears on a color-coded row in the Graph Legend pane. Eachrow corresponds to a line in the graph with the same color.
b. Select a row to highlight the corresponding line in the graph, and vice versa.
c. Double-click the graph again to reduce its size.
3. View the throughput information.
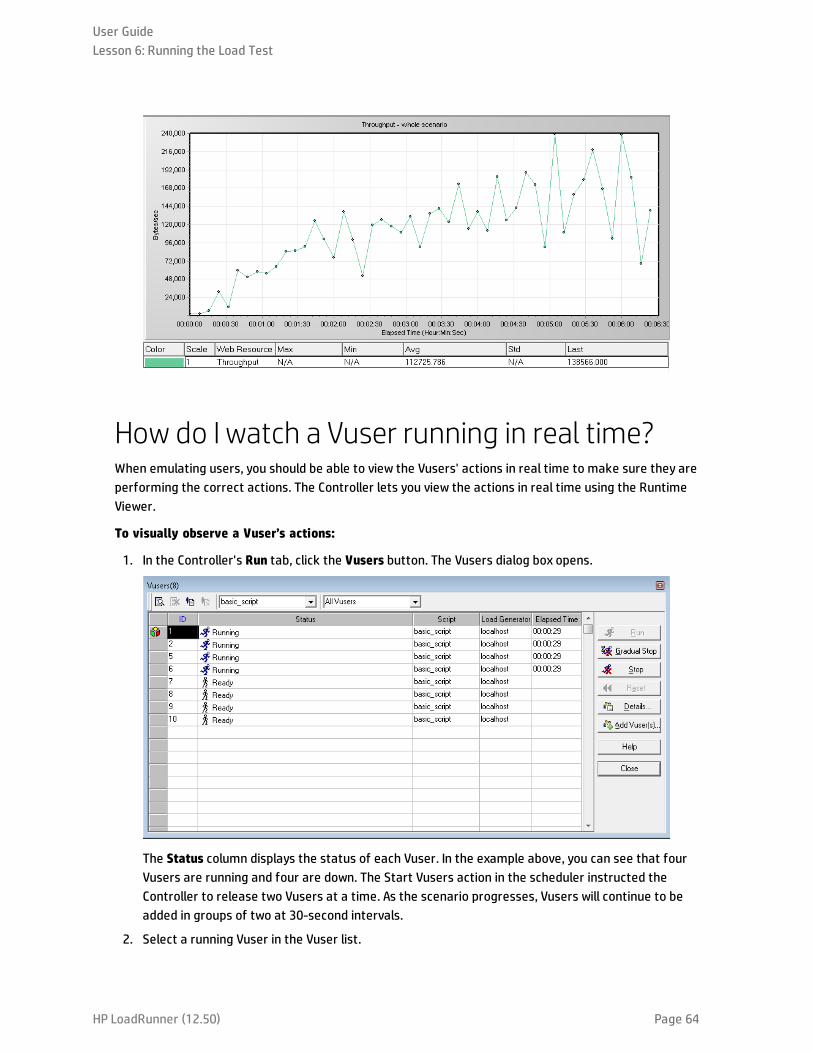
In the Available Graphs pane, under Web Resources Graphs, select the Throughput graph, and dragit into the Graph Display pane. The Throughput graph measurements are displayed in the GraphDisplay pane and the Graph Legend pane.
The Throughput graph shows the amount of data (measured in bytes) that the Vusers receive fromthe server in any given second. You can compare this graph with the Transaction Response Timegraph to see how throughput affects transaction performance.
If the throughput scales upward as time progresses and the number of Vusers increases, thisindicates that the bandwidth is sufficient. If the graph were to remain relatively flat as the numberof Vusers increased, it would be reasonable to conclude that the bandwidth is constraining thevolume of data delivered.
User GuideLesson 6: Running the Load Test
HP LoadRunner (12.50) Page 63
How do I watch a Vuser running in real time?When emulating users, you should be able to view the Vusers' actions in real time to make sure they areperforming the correct actions. The Controller lets you view the actions in real time using the RuntimeViewer.
To visually observe a Vuser’s actions:
1. In the Controller's Run tab, click the Vusers button. The Vusers dialog box opens.
The Status column displays the status of each Vuser. In the example above, you can see that fourVusers are running and four are down. The Start Vusers action in the scheduler instructed theController to release two Vusers at a time. As the scenario progresses, Vusers will continue to beadded in groups of two at 30-second intervals.
2. Select a running Vuser in the Vuser list.
User GuideLesson 6: Running the Load Test
HP LoadRunner (12.50) Page 64
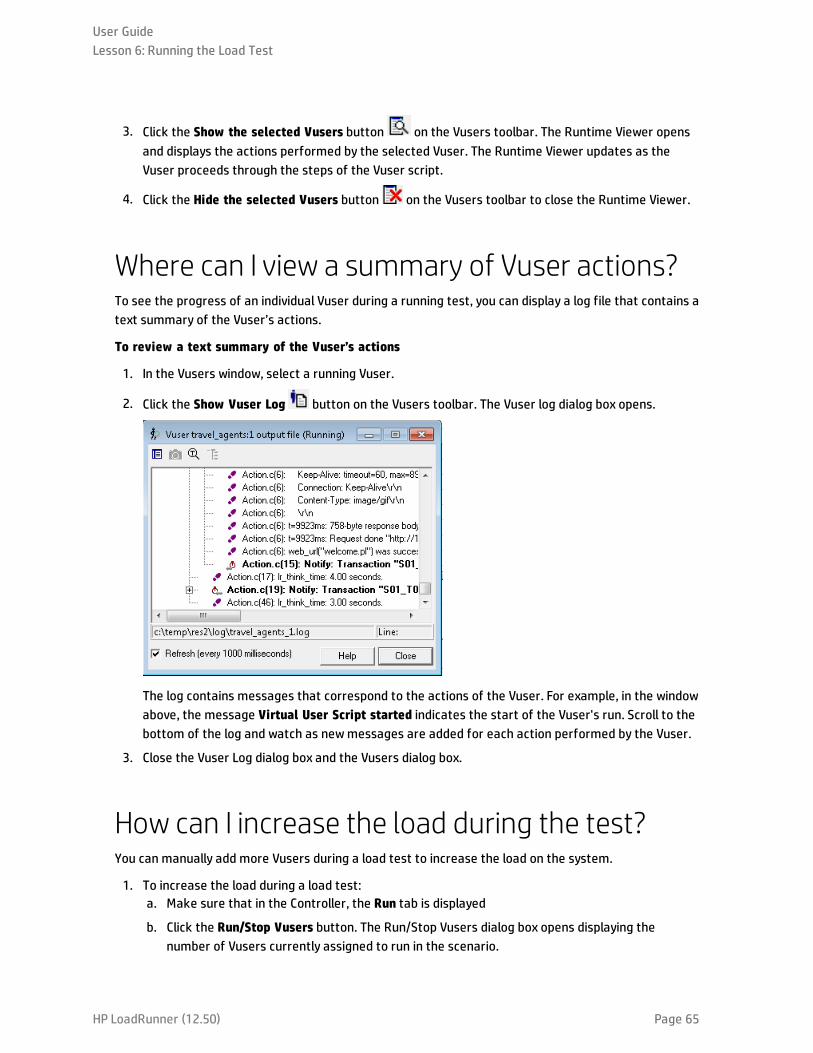
3. Click the Show the selected Vusers button on the Vusers toolbar. The Runtime Viewer opensand displays the actions performed by the selected Vuser. The Runtime Viewer updates as theVuser proceeds through the steps of the Vuser script.
4. Click the Hide the selected Vusers button on the Vusers toolbar to close the Runtime Viewer.
Where can I view a summary of Vuser actions?To see the progress of an individual Vuser during a running test, you can display a log file that contains atext summary of the Vuser’s actions.
To review a text summary of the Vuser’s actions
1. In the Vusers window, select a running Vuser.
2. Click the Show Vuser Log button on the Vusers toolbar. The Vuser log dialog box opens.
The log contains messages that correspond to the actions of the Vuser. For example, in the windowabove, the message Virtual User Script started indicates the start of the Vuser's run. Scroll to thebottom of the log and watch as newmessages are added for each action performed by the Vuser.
3. Close the Vuser Log dialog box and the Vusers dialog box.
How can I increase the load during the test?You can manually add more Vusers during a load test to increase the load on the system.
1. To increase the load during a load test:a. Make sure that in the Controller, the Run tab is displayed
b. Click the Run/Stop Vusers button. The Run/Stop Vusers dialog box opens displaying thenumber of Vusers currently assigned to run in the scenario.
User GuideLesson 6: Running the Load Test
HP LoadRunner (12.50) Page 65

c. In the # column, enter the number of Vusers that you want to add to the group. To run twoadditional Vusers, replace the number 8 with the number 2, in the # column.
d. Click Run to add the Vusers.
e. If some of the original Vusers have not yet been initialized, the Run Initialized and Run Newoptions appear. Select the Run New option.
The two additional Vusers are distributed to the travel_agent group and are run on thelocalhost load generator. The Scenario Status pane shows that there are now 10 runningVusers.
Note: You may get a warning message that the LoadRunner Controller cannot activateadditional Vusers. This is because you are using your local machine as a load generatorand it has limited memory resources. Generally, use a dedicated machine as a loadgenerator to avoid this issue.
How is the application performing under load?Check the Scenario Status pane [on the Run tab] for a summary of the running scenario. In the ScenarioStatus pane, you can drill down to see which Vuser actions are causing the application problems. A highnumber of failed transactions and errors may indicate that the application is not performing asrequired under load.
User GuideLesson 6: Running the Load Test
HP LoadRunner (12.50) Page 66
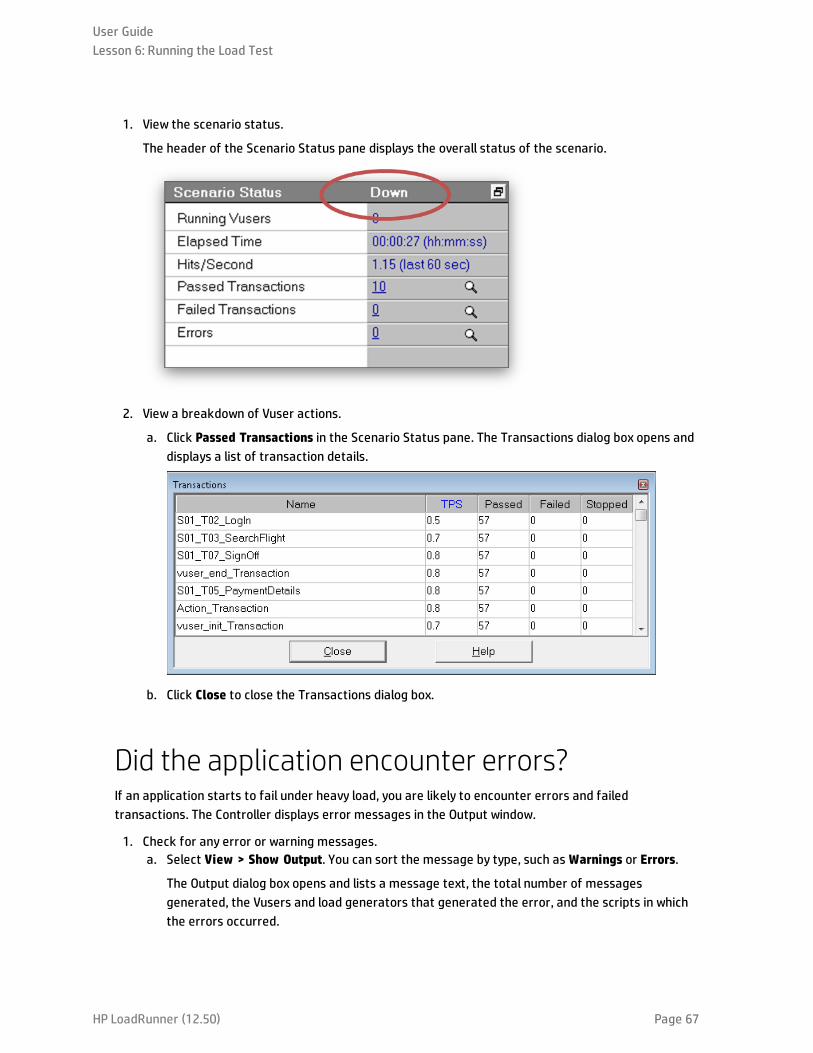
1. View the scenario status.
The header of the Scenario Status pane displays the overall status of the scenario.
2. View a breakdown of Vuser actions.
a. Click Passed Transactions in the Scenario Status pane. The Transactions dialog box opens anddisplays a list of transaction details.
b. Click Close to close the Transactions dialog box.
Did the application encounter errors?If an application starts to fail under heavy load, you are likely to encounter errors and failedtransactions. The Controller displays error messages in the Output window.
1. Check for any error or warning messages.a. Select View > Show Output. You can sort the message by type, such asWarnings or Errors.
The Output dialog box opens and lists a message text, the total number of messagesgenerated, the Vusers and load generators that generated the error, and the scripts in whichthe errors occurred.
User GuideLesson 6: Running the Load Test
HP LoadRunner (12.50) Page 67
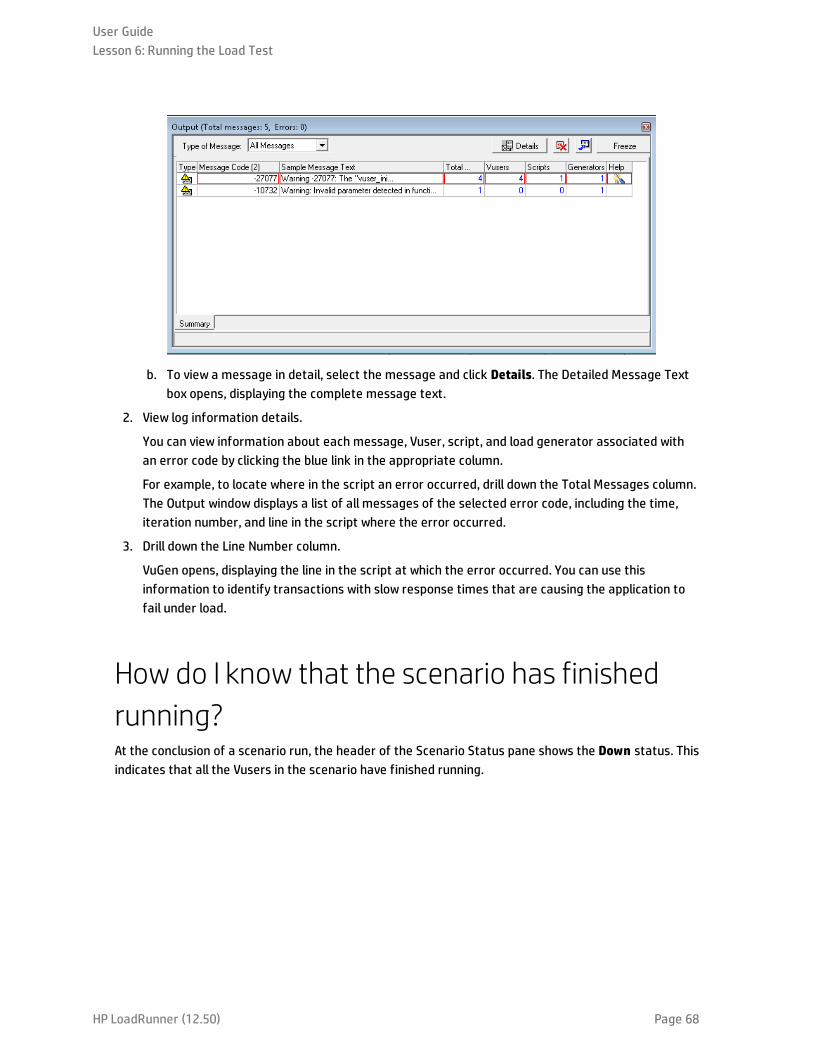
b. To view a message in detail, select the message and click Details. The Detailed Message Textbox opens, displaying the complete message text.
2. View log information details.
You can view information about each message, Vuser, script, and load generator associated withan error code by clicking the blue link in the appropriate column.
For example, to locate where in the script an error occurred, drill down the Total Messages column.The Output window displays a list of all messages of the selected error code, including the time,iteration number, and line in the script where the error occurred.
3. Drill down the Line Number column.
VuGen opens, displaying the line in the script at which the error occurred. You can use thisinformation to identify transactions with slow response times that are causing the application tofail under load.
How do I know that the scenario has finishedrunning?At the conclusion of a scenario run, the header of the Scenario Status pane shows the Down status. Thisindicates that all the Vusers in the scenario have finished running.
User GuideLesson 6: Running the Load Test
HP LoadRunner (12.50) Page 68

You can open the Vusers dialog box to see the status of each individual Vuser. The Vuser dialog boxdisplays the number of iterations that each Vuser performed, the number of successful iterations, andthe elapsed time.
Did the system perform well under load?To see how well the system performed under load, look at the transaction response times anddetermine whether the response times were within acceptable limits. If the transaction response timesincrease during the scenario, you need to look for bottlenecks. You will learn more about this in "Lesson7: Analyzing Your Scenario" on page 71.
Once a problem has been isolated, a corroborative effort involving developers, DBAs, network, and othersystems experts is required to fix the problem. After adjustments are made, the load test is repeated toconfirm that the adjustments had the desired effect. You repeat this cycle to optimize systemperformance.
To save the scenario so that you can run it again with the same settings, select File > Save or click the
Save button on the Controller toolbar.
User GuideLesson 6: Running the Load Test
HP LoadRunner (12.50) Page 69

Where To Go FromHereNow that you have learned how to run and view a simple load test scenario, you can proceed to"Lesson 7: Analyzing Your Scenario" on the next page.
User GuideLesson 6: Running the Load Test
HP LoadRunner (12.50) Page 70
Lesson 7: Analyzing Your ScenarioIn the previous lessons you learned how to design, control, and execute a scenario run. Once you haveloaded your server, you want to analyze the run, and pinpoint the problems that need to be eliminatedto improve system performance.
The graphs and reports produced during your analysis session present important information about theperformance of your scenario. Using these graphs and reports, you can pinpoint and identify thebottlenecks in your application, and determine what changes need to be made to your system toimprove its performance.
In this lesson, you will cover the following topics:
l How does an analysis session work?
l How do I start my analysis session?
l The Analysis window at a glance
l Did I reach my goals? (Service Level Agreement)
l How do I view a summary of performance?
l How do I graphically view performance?
l Did my server perform well?
l How can I pinpoint the source of a problem?
l What other information can I gather about my scenario run?
l How can I publish my findings?
l Conclusion
How does an analysis session work?The aim of the analysis session is to find the failures in your system’s performance and then pinpointthe source of these failures, for example:
l Were the test expectations met? What was the transaction time on the user’s end under load? Didthe SLAmeet or deviate from its goals? What was the average transaction time of the transactions?
l What parts of the system could have contributed to the decline in performance? What was the timeof the network and servers?
l Can you find a possible cause by correlating the transaction times and backend monitor matrix?
In the following sections, you will learn how to open LoadRunner Analysis, and build and view graphs andreports that will help you find performance problems and pinpoint the sources of these problems.
User GuideLesson 7: Analyzing Your Scenario
HP LoadRunner (12.50) Page 71

How do I start my analysis session?1. Open HP LoadRunner Analysis.
On the LoadRunner machine, double-click the Analysis icon on the Desktop. LoadRunner Analysisopens.
2. Open the analysis session file.
For the purpose of this section in the tutorial, in order to illustrate more diverse results, we ran ascenario similar to those you ran in the previous lessons. This time, however, the scenarioincorporated 70 Vusers rather than 10 Vusers. You will now open the analysis session created fromthe results of this scenario.
a. In the Analysis window, select File > Open. The Open Analysis Session dialog box opens.
b. From the <LoadRunner Installation>\tutorial folder, select analysis_session and click Open.Analysis opens the session file.
The Analysis window at a glanceAnalysis contains the following primary panes:
User GuideLesson 7: Analyzing Your Scenario
HP LoadRunner (12.50) Page 72
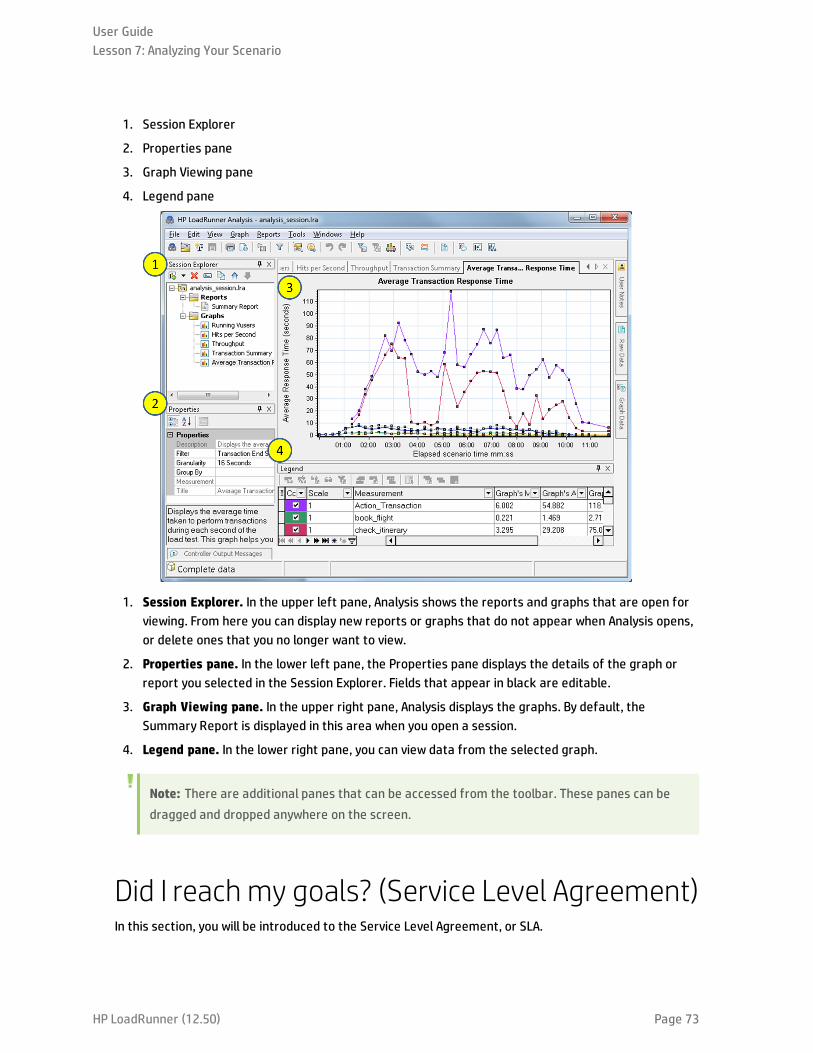
1. Session Explorer
2. Properties pane
3. Graph Viewing pane
4. Legend pane
1. Session Explorer. In the upper left pane, Analysis shows the reports and graphs that are open forviewing. From here you can display new reports or graphs that do not appear when Analysis opens,or delete ones that you no longer want to view.
2. Properties pane. In the lower left pane, the Properties pane displays the details of the graph orreport you selected in the Session Explorer. Fields that appear in black are editable.
3. Graph Viewing pane. In the upper right pane, Analysis displays the graphs. By default, theSummary Report is displayed in this area when you open a session.
4. Legend pane. In the lower right pane, you can view data from the selected graph.
Note: There are additional panes that can be accessed from the toolbar. These panes can bedragged and dropped anywhere on the screen.
Did I reach my goals? (Service Level Agreement)In this section, you will be introduced to the Service Level Agreement, or SLA.
User GuideLesson 7: Analyzing Your Scenario
HP LoadRunner (12.50) Page 73
SLAs are specific goals that you define for your load test scenario. Analysis compares these goalsagainst performance-related data that LoadRunner gathers and stores during the run, and thendetermines the SLA status (Pass or Fail) for the goal.
For example, you can define a specific goal, or threshold, for the average transaction time of atransaction in your script. After the test run ends, LoadRunner compares the goals you defined againstthe actual recorded average transaction times. Analysis displays the status of each defined SLA, eitherPass or Fail. For example, if the actual average transaction time did not exceed the threshold youdefined, the SLA status will be Pass.
As part of your goal definition, you can instruct the SLA to take load criteria into account. This meansthat the acceptable threshold will vary depending on the level of load, for example, Running Vusers,Throughput, and so on. As the load increases, you can allow a higher threshold.
Depending on your defined goal, LoadRunner determines SLA statuses in one of the following ways:
l SLA status determined at time intervals over a timeline. Analysis displays SLA statuses at set timeintervals (for example, every 5 seconds) over a timeline within the run.
l SLA status determined over the whole run. Analysis displays a single SLA status for the wholescenario run.
SLAs can be defined either before running a scenario in the Controller, or after in Analysis itself.
In the following section, you will define an SLA using the HPWeb Tours example. Assume that theadministrator of HP Web Tours would like to know whenever the average transaction times of thebook_flight and search_flight transactions exceed certain values. To do this, you select thetransactions and then set threshold values. These threshold values are the maximum amounts of timethat would be acceptable as average transaction times.
You will also set these threshold values to take certain load criteria into account; in this case RunningVusers. In other words, as the number of running Vusers increases, the threshold value rises.
This is because although the HPWeb Tours administrator would like the average transaction times tobe as low as possible, it is understood that at certain times of the year it is reasonable to assume thatthe HPWeb Tours site will have to handle a higher load than at other times of the year. For example,during peak travel season, a higher number of travel agents log on to the site to book flights, checkitineraries, and so on. Given this understandably higher load, at these times a slightly longer averagetransaction time will be acceptable.
You will set the SLA to take three load scenarios into account: light load, average load, and heavy load.Each scenario will have its own threshold value.
How do I define an SLA?You will define an SLA in Analysis after the scenario run.
Note: It is preferable to define an SLA in the Controller before a scenario run. However, for the
User GuideLesson 7: Analyzing Your Scenario
HP LoadRunner (12.50) Page 74
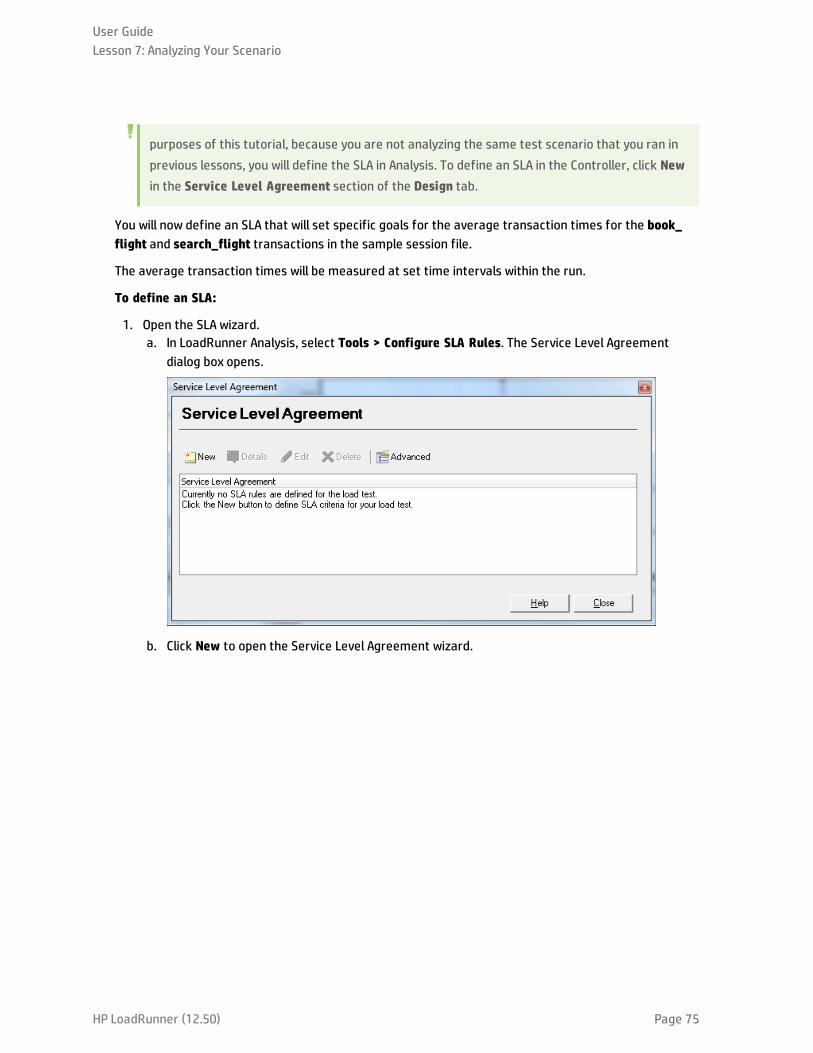
purposes of this tutorial, because you are not analyzing the same test scenario that you ran inprevious lessons, you will define the SLA in Analysis. To define an SLA in the Controller, click Newin the Service Level Agreement section of the Design tab.
You will now define an SLA that will set specific goals for the average transaction times for the book_flight and search_flight transactions in the sample session file.
The average transaction times will be measured at set time intervals within the run.
To define an SLA:
1. Open the SLA wizard.a. In LoadRunner Analysis, select Tools > Configure SLA Rules. The Service Level Agreement
dialog box opens.
b. Click New to open the Service Level Agreement wizard.
User GuideLesson 7: Analyzing Your Scenario
HP LoadRunner (12.50) Page 75

Note: The first time you open the Service Level Agreement wizard, the Start page isdisplayed. If you do not want this page to be displayed the next time you run thewizard, select the Skip this page next time check box.
c. Click Next.
User GuideLesson 7: Analyzing Your Scenario
HP LoadRunner (12.50) Page 76

2. Select a measurement for your goal.a. In the Select a Measurement for Your Goal page, select Transaction Response Time: Average.
b. Click Next.
3. Select the transactions to monitor.
In the Select Transactions page, select a transaction to monitor from the Available Transactionslist.
User GuideLesson 7: Analyzing Your Scenario
HP LoadRunner (12.50) Page 77

a. Double-click the check_itinerary transaction to move it to the Selected Transactions list.
b. Click Next.
4. Set the load criteria.
In the Set Load Criteria page, you instruct the SLA to take different load scenarios into account.
a. Select Running Vusers from the Load Criteria drop down list.
b. Set the Load Values to look like the following example:
User GuideLesson 7: Analyzing Your Scenario
HP LoadRunner (12.50) Page 78
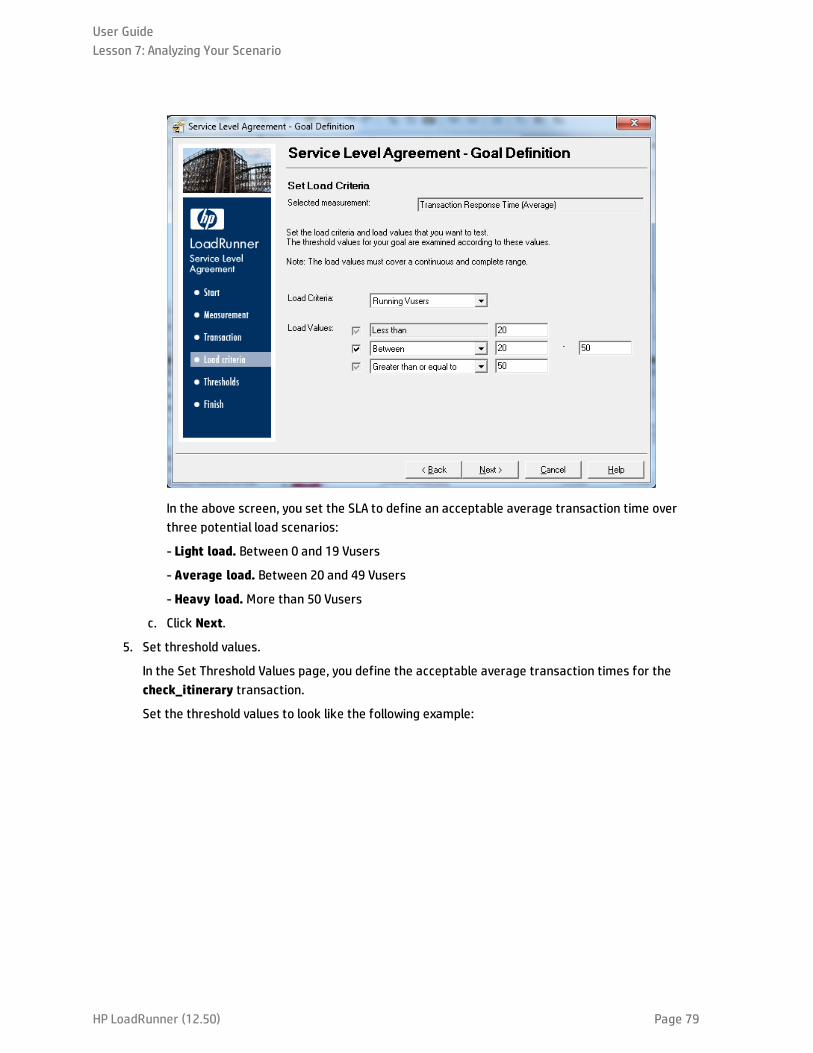
In the above screen, you set the SLA to define an acceptable average transaction time overthree potential load scenarios:
- Light load. Between 0 and 19 Vusers
- Average load. Between 20 and 49 Vusers
- Heavy load. More than 50 Vusers
c. Click Next.
5. Set threshold values.
In the Set Threshold Values page, you define the acceptable average transaction times for thecheck_itinerary transaction.
Set the threshold values to look like the following example:
User GuideLesson 7: Analyzing Your Scenario
HP LoadRunner (12.50) Page 79
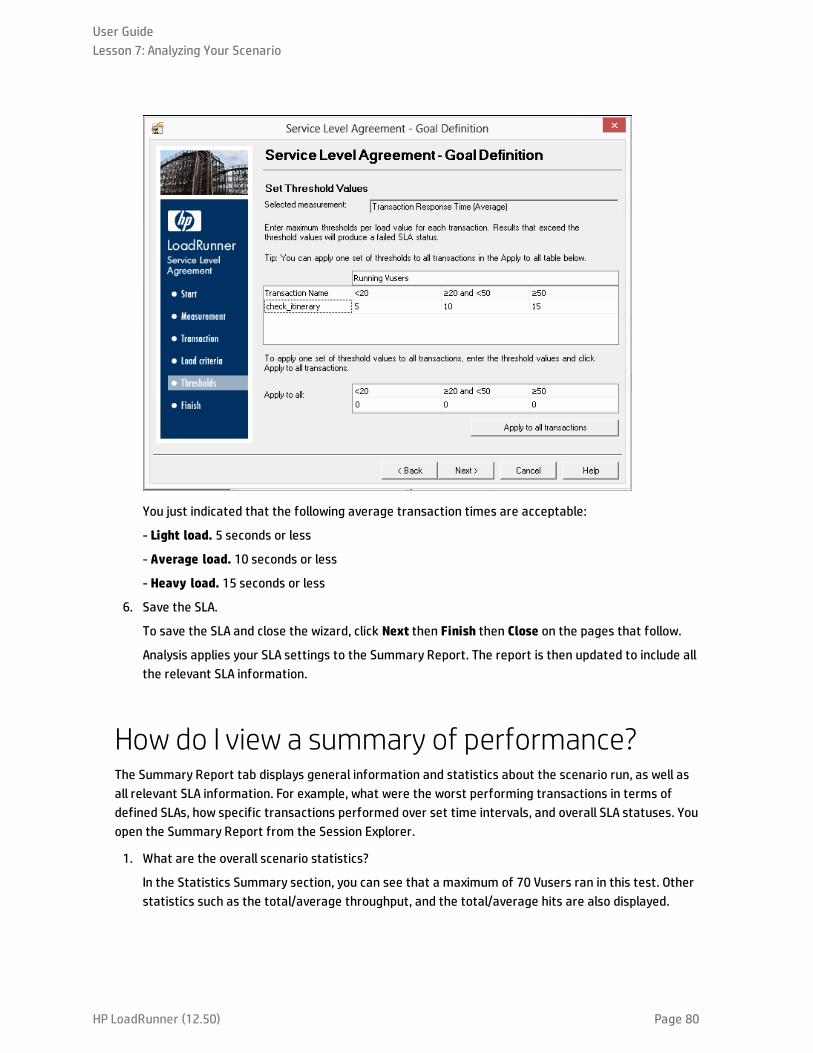
You just indicated that the following average transaction times are acceptable:
- Light load. 5 seconds or less
- Average load. 10 seconds or less
- Heavy load. 15 seconds or less
6. Save the SLA.
To save the SLA and close the wizard, click Next then Finish then Close on the pages that follow.
Analysis applies your SLA settings to the Summary Report. The report is then updated to include allthe relevant SLA information.
How do I view a summary of performance?The Summary Report tab displays general information and statistics about the scenario run, as well asall relevant SLA information. For example, what were the worst performing transactions in terms ofdefined SLAs, how specific transactions performed over set time intervals, and overall SLA statuses. Youopen the Summary Report from the Session Explorer.
1. What are the overall scenario statistics?
In the Statistics Summary section, you can see that a maximum of 70 Vusers ran in this test. Otherstatistics such as the total/average throughput, and the total/average hits are also displayed.
User GuideLesson 7: Analyzing Your Scenario
HP LoadRunner (12.50) Page 80

2. What were the worst performing transactions?
The 5 Worst Transactions table shows you up to five worst-performing transactions for which SLAswere defined.
You can see that over the duration of the check_itinerary transaction, the SLA threshold wasexceeded 66.4% of the time. The average percentage by which it exceeded the SLA threshold overthe whole run was 200.684%.
3. Over which time intervals was the SLA threshold exceeded?
The Scenario Behavior Over Time section shows how each transaction performed during differenttime intervals. The green squares show time intervals where the transaction performed within theSLA threshold, red squares where the transaction failed, and gray squares where no relevant SLAwas defined.
User GuideLesson 7: Analyzing Your Scenario
HP LoadRunner (12.50) Page 81
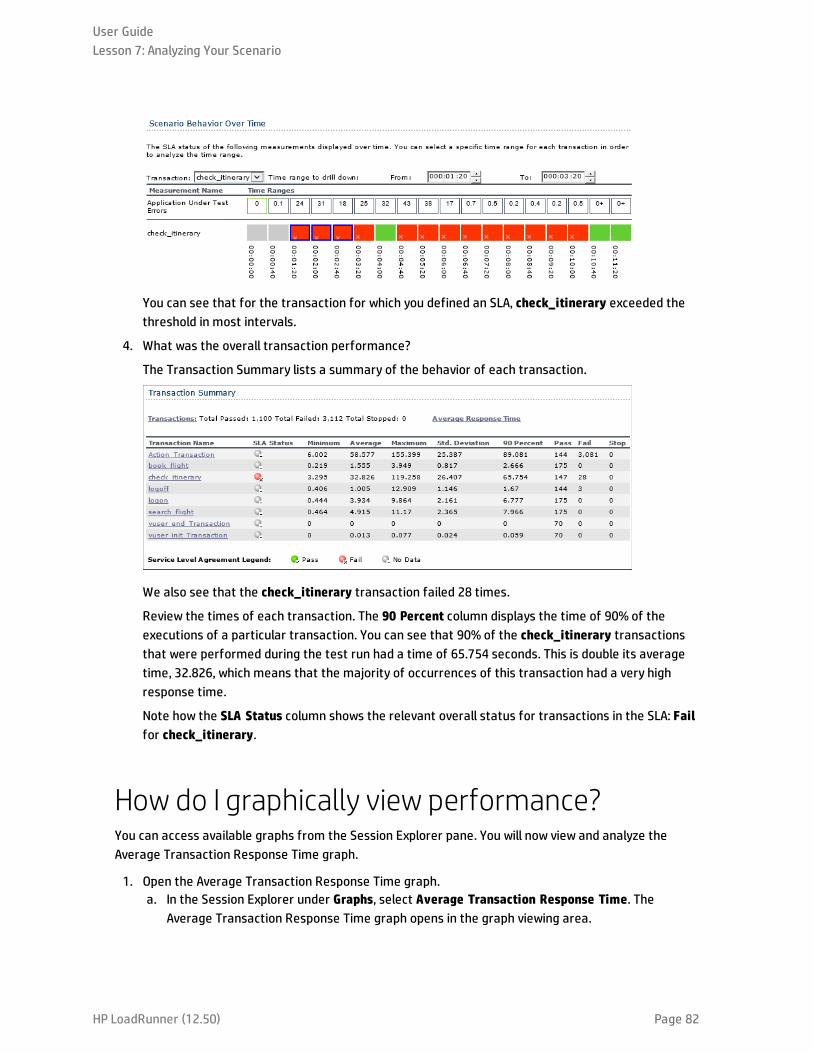
You can see that for the transaction for which you defined an SLA, check_itinerary exceeded thethreshold in most intervals.
4. What was the overall transaction performance?
The Transaction Summary lists a summary of the behavior of each transaction.
We also see that the check_itinerary transaction failed 28 times.
Review the times of each transaction. The 90 Percent column displays the time of 90% of theexecutions of a particular transaction. You can see that 90% of the check_itinerary transactionsthat were performed during the test run had a time of 65.754 seconds. This is double its averagetime, 32.826, which means that the majority of occurrences of this transaction had a very highresponse time.
Note how the SLA Status column shows the relevant overall status for transactions in the SLA: Failfor check_itinerary.
How do I graphically view performance?You can access available graphs from the Session Explorer pane. You will now view and analyze theAverage Transaction Response Time graph.
1. Open the Average Transaction Response Time graph.a. In the Session Explorer under Graphs, select Average Transaction Response Time. The
Average Transaction Response Time graph opens in the graph viewing area.
User GuideLesson 7: Analyzing Your Scenario
HP LoadRunner (12.50) Page 82
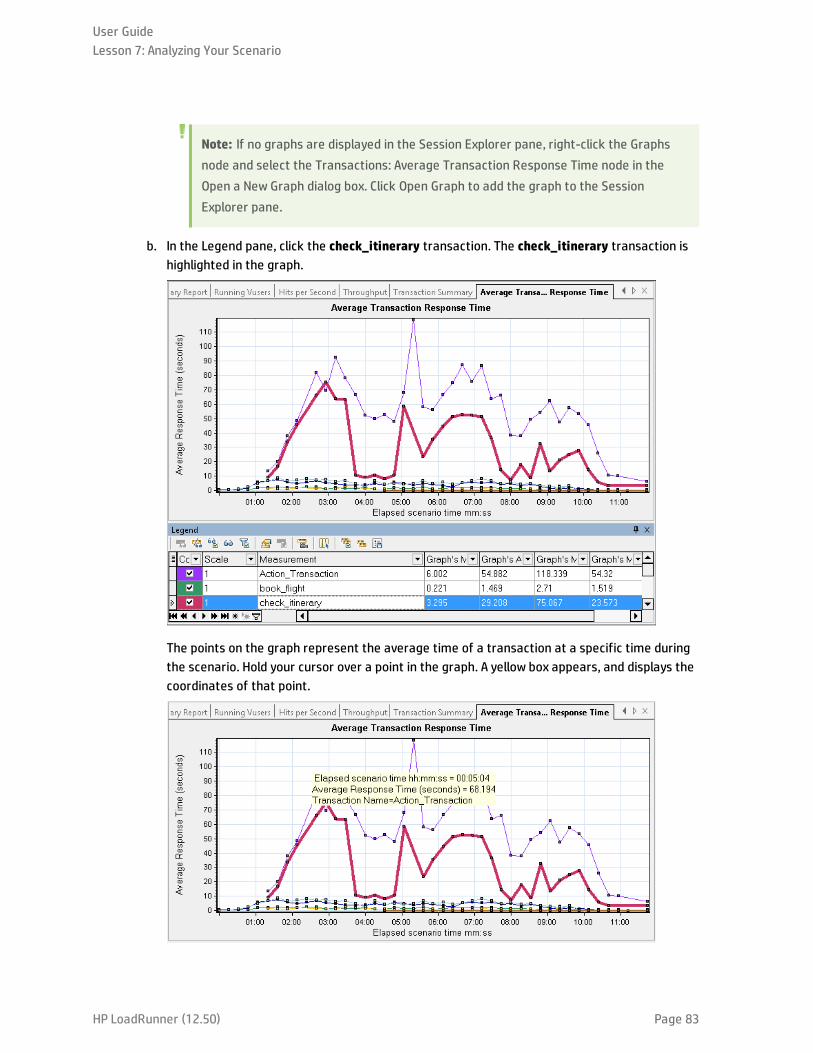
Note: If no graphs are displayed in the Session Explorer pane, right-click the Graphsnode and select the Transactions: Average Transaction Response Time node in theOpen a New Graph dialog box. Click Open Graph to add the graph to the SessionExplorer pane.
b. In the Legend pane, click the check_itinerary transaction. The check_itinerary transaction ishighlighted in the graph.
The points on the graph represent the average time of a transaction at a specific time duringthe scenario. Hold your cursor over a point in the graph. A yellow box appears, and displays thecoordinates of that point.
User GuideLesson 7: Analyzing Your Scenario
HP LoadRunner (12.50) Page 83
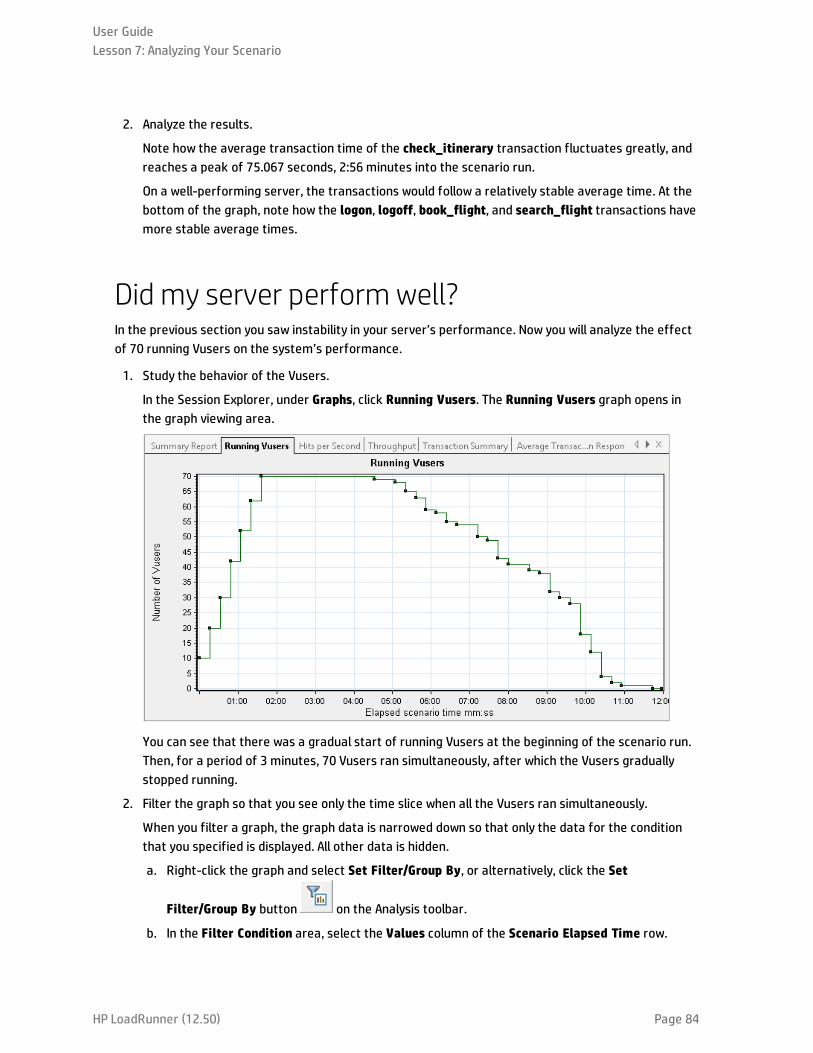
2. Analyze the results.
Note how the average transaction time of the check_itinerary transaction fluctuates greatly, andreaches a peak of 75.067 seconds, 2:56 minutes into the scenario run.
On a well-performing server, the transactions would follow a relatively stable average time. At thebottom of the graph, note how the logon, logoff, book_flight, and search_flight transactions havemore stable average times.
Did my server perform well?In the previous section you saw instability in your server’s performance. Now you will analyze the effectof 70 running Vusers on the system’s performance.
1. Study the behavior of the Vusers.
In the Session Explorer, under Graphs, click Running Vusers. The Running Vusers graph opens inthe graph viewing area.
You can see that there was a gradual start of running Vusers at the beginning of the scenario run.Then, for a period of 3 minutes, 70 Vusers ran simultaneously, after which the Vusers graduallystopped running.
2. Filter the graph so that you see only the time slice when all the Vusers ran simultaneously.
When you filter a graph, the graph data is narrowed down so that only the data for the conditionthat you specified is displayed. All other data is hidden.
a. Right-click the graph and select Set Filter/Group By, or alternatively, click the Set
Filter/Group By button on the Analysis toolbar.
b. In the Filter Condition area, select the Values column of the Scenario Elapsed Time row.
User GuideLesson 7: Analyzing Your Scenario
HP LoadRunner (12.50) Page 84
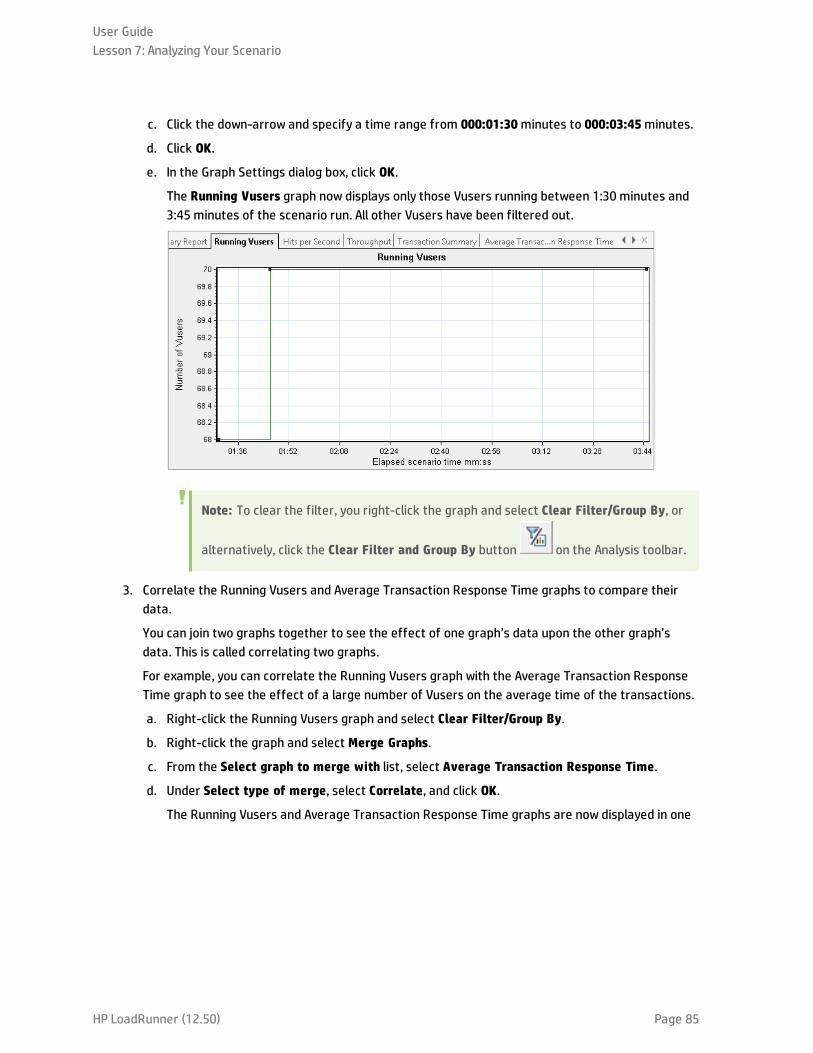
c. Click the down-arrow and specify a time range from 000:01:30minutes to 000:03:45minutes.
d. Click OK.
e. In the Graph Settings dialog box, click OK.
The Running Vusers graph now displays only those Vusers running between 1:30 minutes and3:45 minutes of the scenario run. All other Vusers have been filtered out.
Note: To clear the filter, you right-click the graph and select Clear Filter/Group By, or
alternatively, click the Clear Filter and Group By button on the Analysis toolbar.
3. Correlate the Running Vusers and Average Transaction Response Time graphs to compare theirdata.
You can join two graphs together to see the effect of one graph’s data upon the other graph’sdata. This is called correlating two graphs.
For example, you can correlate the Running Vusers graph with the Average Transaction ResponseTime graph to see the effect of a large number of Vusers on the average time of the transactions.
a. Right-click the Running Vusers graph and select Clear Filter/Group By.
b. Right-click the graph and select Merge Graphs.
c. From the Select graph to merge with list, select Average Transaction Response Time.
d. Under Select type of merge, select Correlate, and click OK.
The Running Vusers and Average Transaction Response Time graphs are now displayed in one
User GuideLesson 7: Analyzing Your Scenario
HP LoadRunner (12.50) Page 85
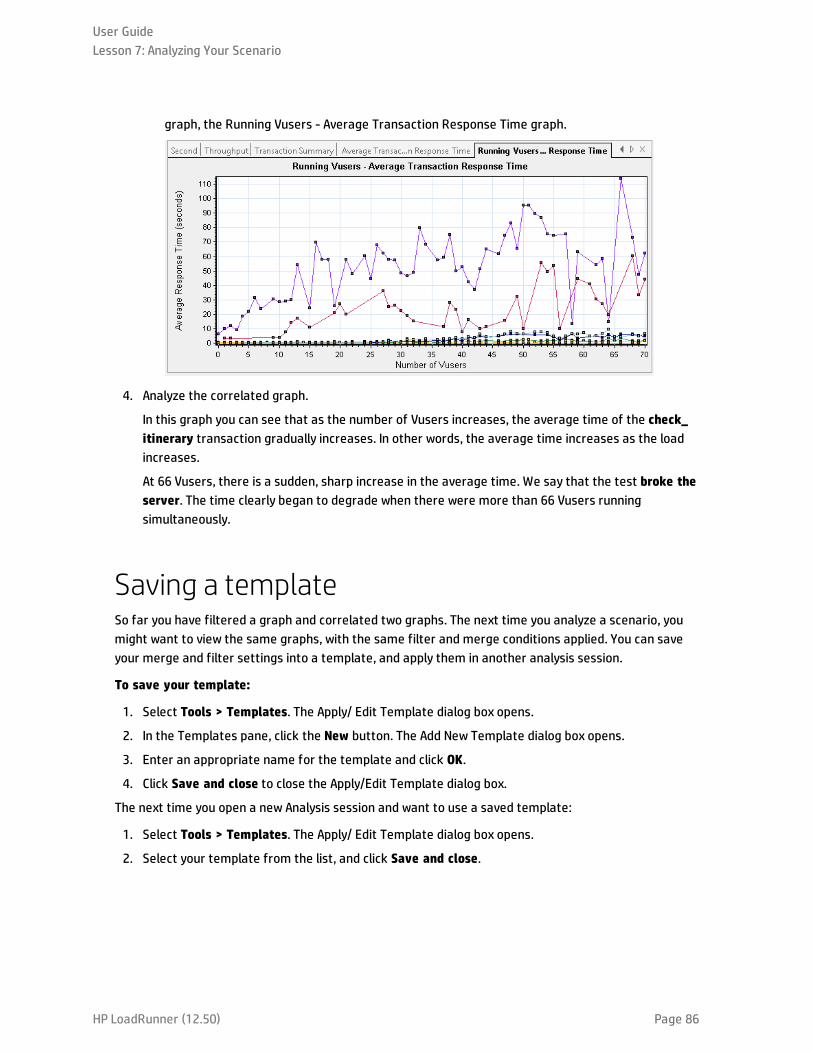
graph, the Running Vusers - Average Transaction Response Time graph.
4. Analyze the correlated graph.
In this graph you can see that as the number of Vusers increases, the average time of the check_itinerary transaction gradually increases. In other words, the average time increases as the loadincreases.
At 66 Vusers, there is a sudden, sharp increase in the average time. We say that the test broke theserver. The time clearly began to degrade when there were more than 66 Vusers runningsimultaneously.
Saving a templateSo far you have filtered a graph and correlated two graphs. The next time you analyze a scenario, youmight want to view the same graphs, with the same filter and merge conditions applied. You can saveyour merge and filter settings into a template, and apply them in another analysis session.
To save your template:
1. Select Tools > Templates. The Apply/ Edit Template dialog box opens.
2. In the Templates pane, click the New button. The Add New Template dialog box opens.
3. Enter an appropriate name for the template and click OK.
4. Click Save and close to close the Apply/Edit Template dialog box.
The next time you open a new Analysis session and want to use a saved template:
1. Select Tools > Templates. The Apply/ Edit Template dialog box opens.
2. Select your template from the list, and click Save and close.
User GuideLesson 7: Analyzing Your Scenario
HP LoadRunner (12.50) Page 86

How can I pinpoint the source of the problem?Until now, you have seen that an increase in load on the server had a negative impact on the averageresponse time of the check_itinerary transaction.
You can drill down further into the check_itinerary transaction to see which system resources mayhave negatively influenced its performance.
The Auto-correlate tool can merge all the graphs that contain data that could have had an effect on theresponse time of the check_itinerary transaction, and pinpoint what was happening at the moment theproblem occurred.
1. From the graph tree, select the Average Transaction Response Time graph.
Look at the check_itinerary transaction, particularly at the slice of elapsed time between 1 and 4minutes. The average response time started to increase almost immediately, until it peaked atnearly 3 minutes.
2. Filter the Average Transaction Response Time graph to display only the check_itinerarytransaction.a. Right-click the graph, and select Set Filter/Group by.
b. In the Transaction Name / Value cell, select check_itinerary.
c. Click OK.
User GuideLesson 7: Analyzing Your Scenario
HP LoadRunner (12.50) Page 87
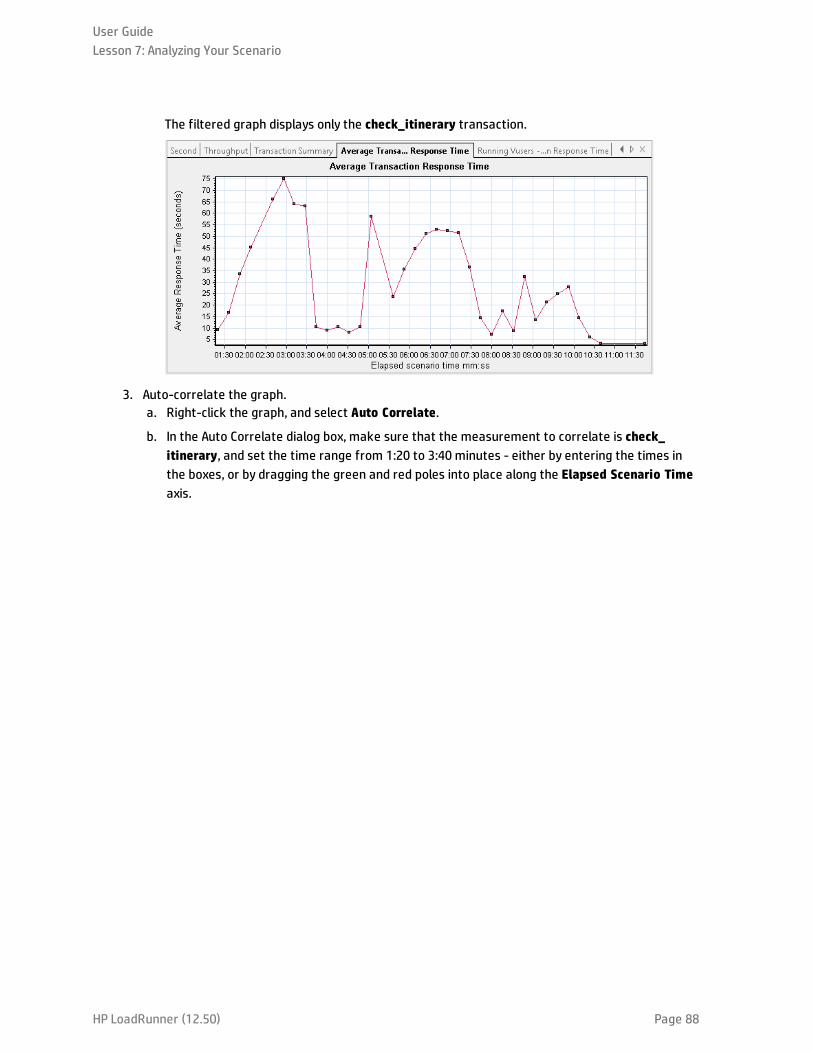
The filtered graph displays only the check_itinerary transaction.
3. Auto-correlate the graph.a. Right-click the graph, and select Auto Correlate.
b. In the Auto Correlate dialog box, make sure that the measurement to correlate is check_itinerary, and set the time range from 1:20 to 3:40 minutes - either by entering the times inthe boxes, or by dragging the green and red poles into place along the Elapsed Scenario Timeaxis.
User GuideLesson 7: Analyzing Your Scenario
HP LoadRunner (12.50) Page 88
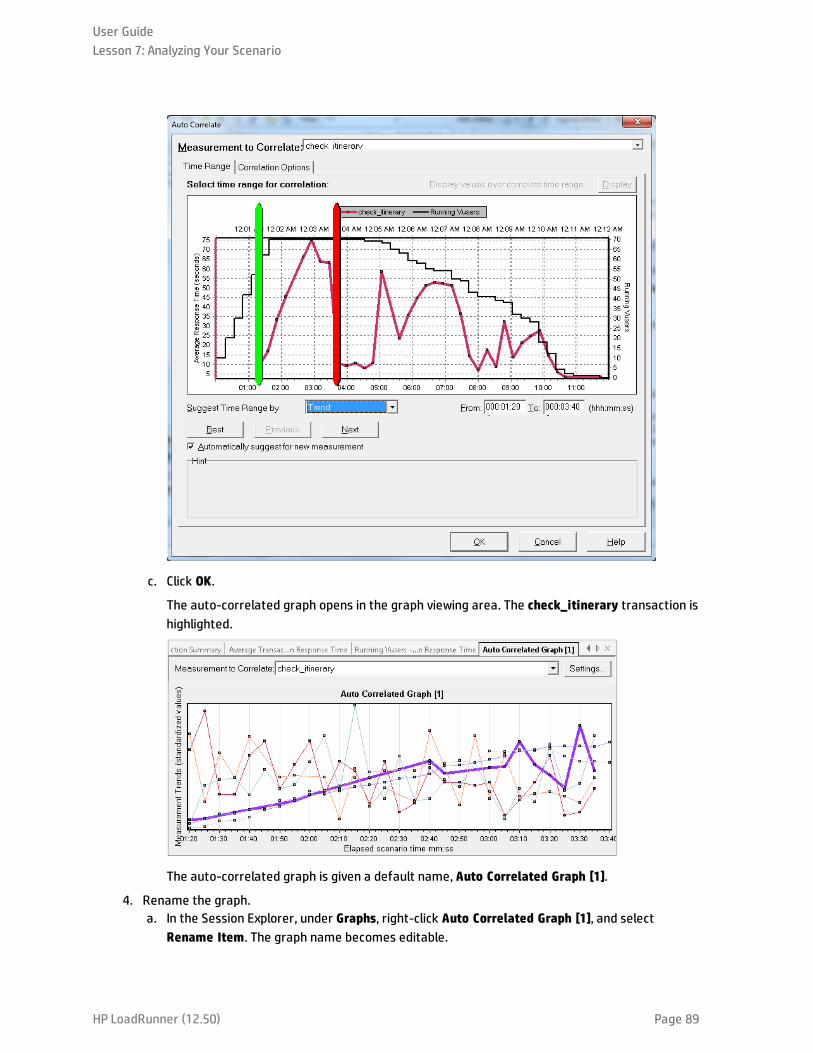
c. Click OK.
The auto-correlated graph opens in the graph viewing area. The check_itinerary transaction ishighlighted.
The auto-correlated graph is given a default name, Auto Correlated Graph [1].
4. Rename the graph.a. In the Session Explorer, under Graphs, right-click Auto Correlated Graph [1], and select
Rename Item. The graph name becomes editable.
User GuideLesson 7: Analyzing Your Scenario
HP LoadRunner (12.50) Page 89

b. Type Auto Correlated - check_itinerary and press Enter, or click anywhere in the Analysiswindow.
5. Analyze the auto-correlated graph.
In the Legend pane below the graph, from the Graph column, scroll down to the WindowsResources: Pool Nonpaged Bytes and Private Bytesmeasurements.
In the Measurement and Correlation Match columns, you can see that these memory-relatedmeasurements, have a Correlation Match of over 70%with the check_itinerary transaction. Thismeans that the behavior of these elements was closely related to the behavior of the check_itinerary transaction during the specified time interval.
We can conclude that exactly when the check_itinerary transaction’s response time peaked, therewas a shortage of system memory resources.
What other information can I gather about myscenario run?In addition to the graphs that appear in the graph tree at the start of an analysis session, you candisplay different graphs to get other information about your scenario run.
1. Click Graph > Add New Graph.
The Open a New Graph dialog box opens and lists the categories of graphs that contain data andcan be displayed.
User GuideLesson 7: Analyzing Your Scenario
HP LoadRunner (12.50) Page 90
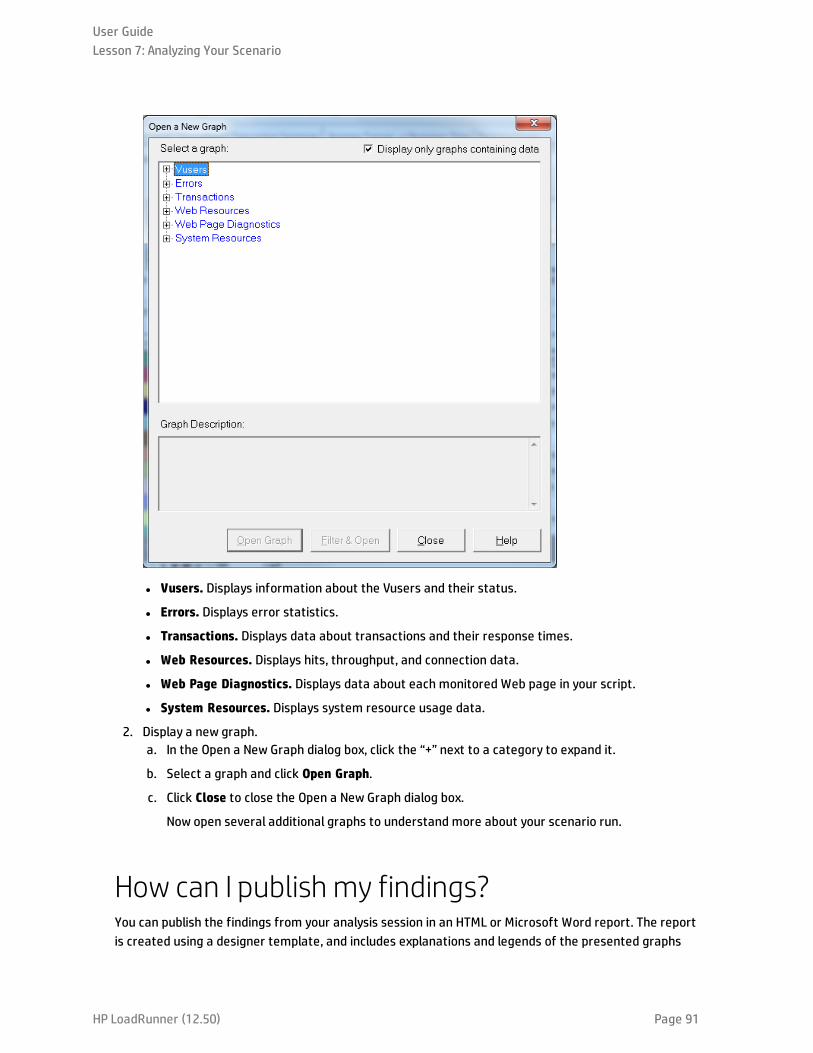
l Vusers. Displays information about the Vusers and their status.
l Errors. Displays error statistics.
l Transactions. Displays data about transactions and their response times.
l Web Resources. Displays hits, throughput, and connection data.
l Web Page Diagnostics. Displays data about each monitored Web page in your script.
l System Resources. Displays system resource usage data.
2. Display a new graph.a. In the Open a New Graph dialog box, click the “+” next to a category to expand it.
b. Select a graph and click Open Graph.
c. Click Close to close the Open a New Graph dialog box.
Now open several additional graphs to understand more about your scenario run.
How can I publish my findings?You can publish the findings from your analysis session in an HTML or Microsoft Word report. The reportis created using a designer template, and includes explanations and legends of the presented graphs
User GuideLesson 7: Analyzing Your Scenario
HP LoadRunner (12.50) Page 91
and data.
HTML Reports
The HTML report can be opened and viewed in any browser.
To create an HTML report:
1. Click Reports > HTML Report.
2. Specify a file name for your report, and the path where you want to save it.
3. Click Save.
Analysis creates the report and displays it in your Web browser. Note how the layout of the HTMLreport is very similar to the layout of your analysis session. You can click on the links in the leftpane to see the various graphs. A description of each graph is given at the bottom of the page.
Microsoft Word Reports
You can present your analysis session in a Microsoft Word report. The Word report is morecomprehensive than the HTML report, because you have the option to include general informationabout the scenario, measurement descriptions, and so on. You can also format the report to includeyour company’s name and logo, and the author’s details.
Like any Microsoft Word file, the report is editable, so you can add further comments and findings afteryou build the report.
To create a Microsoft Word report:
1. Click Reports > New Report.
The New Report dialog box opens.
User GuideLesson 7: Analyzing Your Scenario
HP LoadRunner (12.50) Page 92
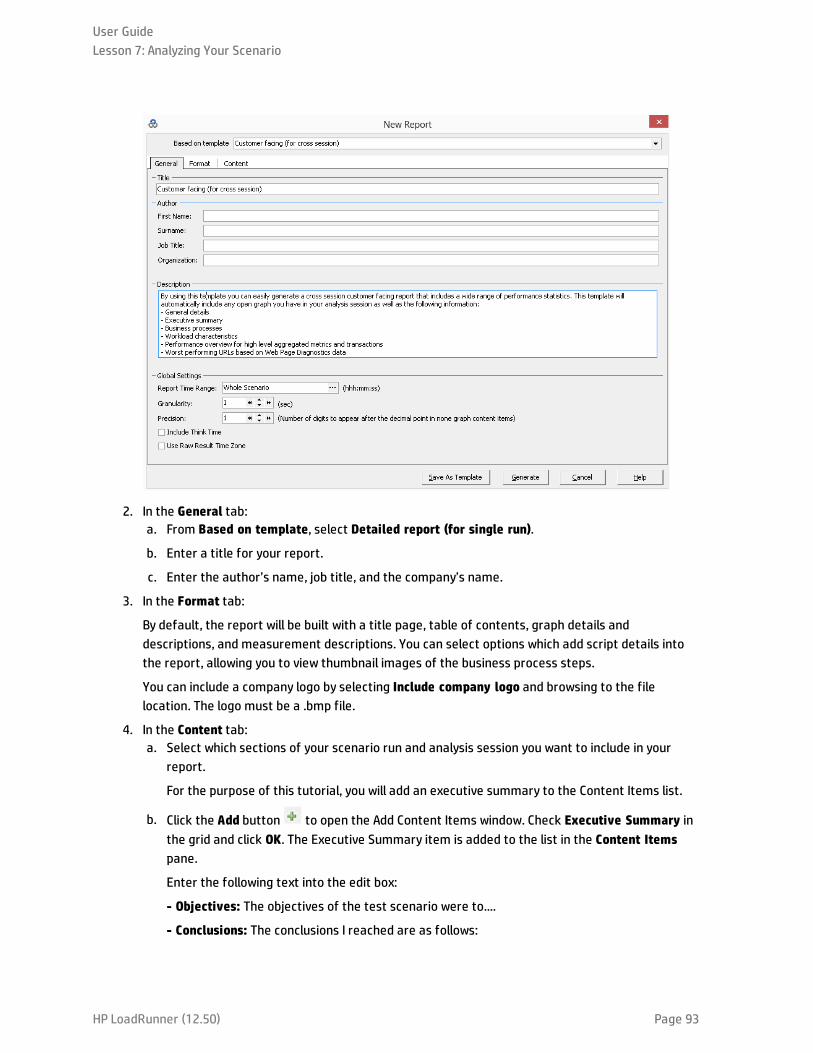
2. In the General tab:a. From Based on template, select Detailed report (for single run).
b. Enter a title for your report.
c. Enter the author’s name, job title, and the company’s name.
3. In the Format tab:
By default, the report will be built with a title page, table of contents, graph details anddescriptions, and measurement descriptions. You can select options which add script details intothe report, allowing you to view thumbnail images of the business process steps.
You can include a company logo by selecting Include company logo and browsing to the filelocation. The logo must be a .bmp file.
4. In the Content tab:a. Select which sections of your scenario run and analysis session you want to include in your
report.
For the purpose of this tutorial, you will add an executive summary to the Content Items list.
b. Click the Add button to open the Add Content Items window. Check Executive Summary inthe grid and click OK. The Executive Summary item is added to the list in the Content Itemspane.
Enter the following text into the edit box:
- Objectives: The objectives of the test scenario were to....
- Conclusions: The conclusions I reached are as follows:
User GuideLesson 7: Analyzing Your Scenario
HP LoadRunner (12.50) Page 93
c. In the Content Items pane, select the Largest URLs by Average Kbytes and click the Delete
button . This will exclude this graph from the report.
d. Change the order in which to display the items in the report.
- In the Content Items pane, select Workload Characteristics. Click on Average Hits perSecond in the Selected Columns list.
- Click the Down arrow until the item appears under Total Transactions Number. In the report,the Average Hits per Second item will follow the Total Transactions Number item.
5. Click Generate.
The data is gathered and the report is created in a Microsoft Word file, which opens in MicrosoftWord.
In addition to the graphs that you generated during your analysis session, the report includes anobjective and a conclusion, and other sections and graphs that you chose to include while buildingthe report.
ConclusionIn this lesson you learned the basics of defining a Service Level Agreement, analyzing a scenario run,and publishing your results in a report.
You have learned that performance problems can be pinpointed by studying various graphs that showbottlenecks on the server, possibly due to too heavy a load. You have seen that you can pinpoint thesources of these bottlenecks by configuring graphs to display correlated data.
Send Us Feedback
Let us know how we can improve your experience with the User Guide.
Send your email to: [email protected]
User GuideLesson 7: Analyzing Your Scenario
HP LoadRunner (12.50) Page 94