
HOW TO DO SCIENCE - Library
185
Louise Lexis Brianna Julien A guide to researching human physiology HOW TO DO SCIENCE
-
Upload
khangminh22 -
Category
Documents
-
view
1 -
download
0
Transcript of HOW TO DO SCIENCE - Library

Louise LexisBrianna Julien
A guide to researching human physiology
HOW TO DO SCIENCE

2
La Trobe University EbureauMelbourne, VIC 3086, Australia
www.latrobe.edu.au
Published in Australia by La Trobe University
© La Trobe University 2017
First published 2017
Updated edition (v1.1) published 2021
Copyright Information Copyright in this title and published edition vests exclusively in La Trobe University
Copyright in the work contributed to this published edition vests in individual authors.
La Trobe University’s name and logo are registered trade marks. Except for the University’s name and logo and any third party content noted or referenced in this publication, this work is licensed under a Creative Commons Attribution, Non-Commercial, Share Alike licence (CC BY-NC-SA 4.0). (in force 23/11/2021)
https://creativecommons.org/licenses/by-nc-sa/4.0/
ISBN 978-0-9953727-2-6DOI https://doi.org/10.26826/1001
Other informationEdited and designed by Biotext
Enquiries: [email protected]

3
How to do science A guide to researching human physiologyLouise Lexis and Brianna Julien

4About the authors
i
About the authors
Dr Louise LexisDr Louise Lexis is a Senior Lecturer in human physiology in the School of Life Sciences at La Trobe University. Louise is an accomplished scientist, having completed a Master of Science in Exercise and Sport Science at the University of Florida, and a PhD in cyclosporine A–induced oxidative stress at the University of Queensland. Louise has extensive science teaching experience, beginning with high school teaching and expanding to lecturing at university level in the United States, New South Wales and Victoria. Most recently, Louise has combined her passions for science, and teaching and learning to develop an award-winning (Australian Government Office for Learning and Teaching), 60-credit point advanced human physiology capstone program for final-year Bachelor of Health Science students at La Trobe University with colleague Brianna Julien. Louise is committed to providing students with the best possible opportunities to gain up-to-date physiology knowledge while also developing their research and communication skills, allowing them to become accomplished scientists and scientifically literate citizens. Reflecting this commitment, Louise completed a Graduate Certificate in Higher Education in 2015.
Dr Brianna JulienDr Brianna Julien is a Lecturer in human physiology in the School of Life Sciences at La Trobe University. While completing her PhD on factors influencing postural reflex activity, Brianna developed passions for science, and teaching and learning. Since beginning her first academic position at La Trobe University, Brianna has expanded her list of passions to include curriculum development, and has channelled this enthusiasm into the development of an award-winning (Australian Government Office for Learning and Teaching), 60-credit point advanced human physiology capstone program for final-year Bachelor of Health Science students at La Trobe University with colleague Louise Lexis. Brianna is dedicated to meeting the challenges facing all science educators in preparing students for a fast-moving and uncertain future, and is committed to developing innovative and engaging learning experiences that will stimulate a love of science and lifelong learning in the next generation of scientists. Reflecting this commitment, Brianna completed a Graduate Certificate in Higher Education in 2015.
AcknowledgementsWe thank the many human physiology students whose enthusiasm and passionate engagement in development of scientific skills inspired us to create this resource.
We express our gratitude to Dr John Waters, Mr Bill Perrotti and Dr Valerie O’Loughlin – past presidents of the Human Anatomy and Physiology Society – who first recommended we publish the How to do science guide with the intention for it to be used as a resource for science students worldwide. Their enthusiasm and encouragement set us on the path to publishing this e-textbook.
We also thank Carrie DeHaan, Kirsten Duncan, Tim Meyen and the rest of the Biotext team for their outstanding editing and design work that elevated our work, and resulted in an e-textbook that exceeded our hopes and initial vision.
This project would have been impossible without the support of a La Trobe University Digital Learning Strategy Innovation Grant, and the opportunities and support provided by La Trobe University Library staff Fiona Salisbury, Deputy Director Learning and Teaching, and Jennifer Peasley, Executive Director and University Librarian.

5Contents
i
Contents: quick guide Introduction 13
Chapter 1: Researching science using the scientific method 16
Chapter 2: Designing for discovery 30
Chapter 3: Performing statistical analyses 50
Chapter 4: Visualising data 84
Chapter 5: Accessing scientific literature and referencing 98
Chapter 6: Communicating scientific discoveries to peers 105
Chapter 7: Writing a literature review 134
Chapter 8: Sharing science with the community 152
Chapter 9: Your life and career as a scientist 166
Glossary 178
4

6Contents
i
Contents: detailed
About the authors ........................................................ 4Dr Louise Lexis ...................................................................................................4
Dr Brianna Julien ...............................................................................................4
Acknowledgements ..................................................... 4
i Introduction ......................................................... 14What is in this guide? ......................................................................................14
A better way to learn science .........................................................................14
How to use this book .......................................................................................15Icons .................................................................................................................. 15Navigation ......................................................................................................... 15Application tutorials ......................................................................................... 15Text examples ................................................................................................... 15
References .......................................................................................................15
1 Researching science using the scientific method ................................................................. 17
1.1 How physiology has shaped our history ..............................................17
1.2 Current issues in physiology .................................................................18
1.3 Science literacy ......................................................................................19
Knowledge of science concepts, or ‘what do we know?’ .............................. 19Knowledge of the scientific method, or ‘how did we come to know it?’ ...... 20Knowledge and appreciation of science in society, or ‘how can we contribute?' .................................................................................................. 25
1.4 Pseudoscience .......................................................................................28
References .......................................................................................................29
2 Designing for discovery ...................................... 312.1 Researching human physiology ............................................................31
Where to start? .................................................................................................32
2.2 Designing an experiment to test your hypothesis ...............................35Control group experimental design ................................................................ 35Treatment order control/crossover experimental design ............................. 37Placebos ............................................................................................................ 37Blinding ..............................................................................................................38Animal subjects and human participants ...................................................... 39
2.3 Examples of experimental design in human physiology .....................39Control group experimental design ................................................................40Treatment order control/crossover experimental design .............................44Investigating the effect of multiple independent variables .......................... 46
References ...................................................................................................... 48
3 Performing statistical analyses ......................... 513.1 Statistics as part of everyday life .........................................................51
Cholera map made by John Snow in 1854 ..................................................... 51Sporting performance ...................................................................................... 51Health of the population .................................................................................. 52

7Contents
i
3.2 Setting up Excel for statistical analysis ...............................................52
3.3 Calculating descriptive statistics using Excel ......................................53
3.4 Manually calculating mean and standard deviation in Excel ............56
3.5 The p value ..............................................................................................611- and 2-tailed tests .......................................................................................... 61Calculating the p value using an independent t-test in Excel ....................... 61Calculating the p value using a paired t-test in Excel ....................................64Calculating the p value using a 1-factor analysis of variance (ANOVA) ...... 67
3.6 Linear correlation ....................................................................................71When do I use a linear correlation? ................................................................ 71Testing for a correlation using Excel .............................................................. 72Reporting the results of the correlation ......................................................... 74
3.7 VassarStats .............................................................................................74Calculating the p value using a 1-factor analysis of variance (ANOVA) independent samples test ............................................................................... 74Calculating the p value using a 1-factor analysis of variance (ANOVA) correlated samples test ...................................................................................77Testing for a correlation using VassarStats ................................................... 80
References ......................................................................................................82
Further reading ................................................................................................83
4 Visualising data ................................................... 854.1 Creating a column graph in Excel .........................................................85
A completed scientific column graph ............................................................. 91
4.2 Creating a line graph in Excel ................................................................92Adding markers to data points ........................................................................ 92
4.3 Creating a table using Word ...................................................................93
Entering a basic table .......................................................................................93A completed scientific table ............................................................................ 97
Further reading ................................................................................................97
5 Accessing scientific literature and referencing 995.1 Types of scientific literature ..................................................................99
5.2 Accessing scientific literature ...............................................................99Google Scholar .................................................................................................99Databases: what are they and how do I use them to find information? .... 100Journals........................................................................................................... 101
5.3 Determining if an article is peer reviewed ..........................................101
5.4 Library website resources to help with searching for authoritative information .....................................................................101
5.5 Referencing ...........................................................................................101Author–date system....................................................................................... 102Number system .............................................................................................. 103Using EndNote ................................................................................................ 103
References .....................................................................................................104
6 Communicating scientific discoveries to peers ................................................................... 106
6.1 Research articles ..................................................................................107Summary for non-experts ............................................................................. 107Abstract ............................................................................................................110Introduction......................................................................................................110Methods and statistics ...................................................................................111

8Contents
i
Results ..............................................................................................................113Discussion and conclusion ............................................................................115References .......................................................................................................118
6.2 Poster presentations ............................................................................ 118
6.3 Oral communications ...........................................................................124Visual aids ....................................................................................................... 124Language use ................................................................................................. 133Delivery ............................................................................................................ 133
References .....................................................................................................133
7 Writing a literature review ................................. 1357.1 What is a literature review? ..................................................................135
7.2 Steps of writing a literature review ......................................................136Analysis and synthesis .................................................................................. 137Evaluation ........................................................................................................ 140
7.3 Writing your literature review ...............................................................142
7.4 Referencing the review .........................................................................151
References .....................................................................................................151
8 Sharing science with the community .............. 1538.1 Where to start .......................................................................................153
Know your audience ....................................................................................... 155Ensure that your topic is significant and relevant to your audience .......... 156Ensure that your communication platform is appropriate for your audience .......................................................................................................... 157Use language suitable for your audience ..................................................... 158
8.2 Examples of communication pieces for nonscientific audiences ...160Michiko Maruyama and Art of learning ........................................................ 160Magazine article explaining recent research findings to a non-expert audience .......................................................................................................... 161News story published on a website explaining exciting new scientific inventions for studying disease and what this means for patients ........... 161News story published on a website about a new potent antibiotic that doesn’t encounter any detectable resistance .............................................. 162News story published on a website explaining an important discovery of a genetic mutation.................................................................... 162News story published on a website announcing the trial of an Ebola vaccine .................................................................................................. 163Classroom activity/lesson plan to help explain a concept to primary school students .............................................................................................. 163Classroom activity/lesson plan to help explain a concept to first-year university students studying physiology ..................................................... 163A poster displayed in a clinic waiting room to communicate ways to reduce the risk of contracting/transmitting an illness or disease ............. 163A game for university classmates to help remember a difficult concept . 164A video explaining a useful concept to non-experts ................................... 164A song explaining a useful concept to non-experts .................................... 164A podcast in which you explain an important concept for a non-expert audience ...................................................................................... 164A mobile app for smartphones or tablets that allows students of any age to better understand a concept ............................................................. 164An artwork for display that demonstrates your understanding of a concept .................................................................................................... 164
References .....................................................................................................164
9 Your life and career as a scientist .................... 1679.1 Being independent and self-directed learners ...................................167

9Contents
i
Cognitive skills you need to be a good scientist ......................................... 168Capabilities and attributes required to be a scientist ................................. 168
9.2 Working effectively, responsibly and safely as an individual or a team ...................................................................................................170Team context .................................................................................................. 171Team projects ................................................................................................. 171
9.3 Guidelines, laws and ethical conduct .................................................172How to be an ethical scientist – personal responsibility............................ 172How to be an ethical scientist – guidelines and laws ..................................174
9.4 Careers for science graduates ............................................................175
References .....................................................................................................176
g Glossary ............................................................. 179

10Contents
i
FiguresFigure 1.1 Nobel Prize winners in physiology or medicine 17
Figure 1.2 Elements of scientific literacy 19
Figure 1.3 Examples of scientific theories 20
Figure 1.4 ‘Cholera art’ – a representation of the cholera epidemic of the 19th century by Robert Seymour titled Cholera ‘Tramples the victors & the vanquished both’ 21
Figure 1.5 Elements of the scientific method 21
Figure 1.6 The scientific method 22
Figure 1.7 The scientific method as an ongoing process 23
Figure 1.8 Questions used to judge a scientific method 24
Figure 1.9 Categories for scientists depicted in western literature and film 27
Figure 1.10 Australian Government’s Science and Research Priorities 28
Figure 1.11 Characteristics of a pseudoscientist 28
Figure 2.1 The scientific method 32
Figure 2.2 Independent and dependent variables 32
Figure 2.3 Creating gender-balanced groups in a human study 36
Figure 2.4 Creating performance-balanced groups 36
Figure 2.5 A crossover experimental design with 2 conditions 37
Figure 2.6 Example of a study using control group experimental design to determine the effect of an immunosuppressive drug on blood vessel function in animal subjects 40
Figure 2.7 Example of a study using control group experimental design to determine the effect of gender on aerobic running exercise performance in human participants 41
Figure 2.8 Example of a study using control group experimental design to determine the effect of a moderate dose of growth hormone and a high dose of growth hormone on muscle mass in animal subjects 42
Figure 2.9 Example of a study using control group experimental design to determine the effect of moderate practice and high practice on development of touch-typing skill in human participants who have never learnt to touch type 43
Figure 2.10 Example of a study using treatment order control/crossover experimental design to determine the effect of caffeine on cognitive function in human participants 44
Figure 2.11 Example of a study using treatment order control/crossover experimental design to determine the effects of moderate and high doses of caffeine on endurance running performance in human participants 45
Figure 2.12 Example of a study using control group experimental design to investigate the effect of diet and exercise intervention on the cardiovascular disease risk profile in humans who have suffered a cardiovascular event 46
Figure 2.13 Example of a study using treatment order control/crossover experimental design to determine the effects of caffeine and exercise on short-term memory in human participants 47
Figure 2.14 How to choose the right experimental design 49
Figure 3.1 Cases of cholera in London in 1854 51
Figure 3.2 Test bowling career statistics for Imran Khan 51

11Contents
i
Figure 3.3 Prevalence of dementia among people aged 60 years and over 52
Figure 3.4 How to interpret the size of a correlation 71
Figure 3.5 Possible associations between 2 variables 72
Figure 5.1 An example of an original investigation 99
Figure 5.2 An example of a literature review 99
Figure 5.3 An example of referencing using the author–date system 102
Figure 5.3 An example of referencing using the number system 103
Figure 6.1 The scientific method and the final stage – sharing results 106
Figure 6.2 Example of an original research article published in Physiological Reports 107
Figure 6.3 Sections of a research article 108
Figure 6.4 Poster session at the 17th International Symposium on Graph Drawing 118
Figure 6.5 Oral communication by Ashwin Baindur at the Bengali Wikipedia 10th Anniversary Celebration 124
Figure 7.1 Example of a review article published in Frontiers in Physiology 135
Figure 7.2 Stages of writing a literature review 136
Figure 7.3 Cognitive skills required for writing a literature review 137
Figure 7.4 Combining synthesis and evaluation information to write a paragraph for a literature review 142
Figure 8.1 How to increase scientific literacy in the general public 153
Figure 8.2 Relationship between concept, audience and mode when communicating science 155
Figure 8.3 How to simplify a complex message 159
Figure 9.1 Three areas of personal and professional responsibility for science graduates to master 167
Figure 9.2 Characteristics of an independent and self-directed learner 168
Figure 9.3 Bloom’s taxonomy of learning 168
Figure 9.4 La Trobe University’s graduate capabilities 169
Figure 9.5 The La Trobe Essentials 169
Figure 9.6 Working effectively, responsibly and safely, as an individual or as part of a team 170
Figure 9.7 Features of successful teams 171
Figure 9.8 How to be an effective and efficient team member 171
Figure 9.9 Team communication tips 172
Figure 9.10 Fundamental principles of scientific research 173
Figure 9.11 Practical skills student scientists develop during their training 175
Figure 9.12 The Science Council’s 10 types of scientist 176

12Contents
i
Boxes and research case studiesBox 1.1 Recent breakthroughs in physiology 18
Box 1.2 Scientific hypothesis, testing and theory 20
Box 1.3 The difficulties in changing scientific theory 21
Box 1.4 Peer-reviewed articles and academic journals 25
Box 1.5 The scientific method in action 26
Research case study: The Tuskagee study and African–American men 27
Box 2.1 Extraneous variables in control and treatment groups 36
Box 3.1 Difference between correlation and causation 71
Research case study: Example of correlation analysis 72
Box 8.1 What experts have to say about scientific literacy and science communication to the general public 154
Box 8.2 Examples of topics and appropriate target audiences 157
Box 8.3 Useful programs for creating communication pieces 158
Box 9.1 Ethics of stem cell research 173

Photo: La Trobe University
Introduction

14Introduction
i
i Introduction
S o, you’ve decided to become a scientist. It’s a wise choice, since the knowledge and skills gained
by science, technology, engineering and mathematics (STEM) graduates are valuable in many careers, including in the government, business, law, education and health sectors.1
What is in this guide?How to do science: a guide to researching human physiology has been written for students of the life sciences who are actively engaged in the scientific process. A lot of support is available for students learning scientific facts, but we found that it was harder to find resources to support students to become scientists.
This guide introduces you to what it means to be a scientist. You will learn about the scientific method (Chapter 1) and how to do many tasks of a scientist, including:• designing experiments to test a hypothesis
(Chapter 2)• analysing data (Chapter 3)• visualising data by creating graphs and tables
(Chapter 4)• accessing scientific literature and using
referencing software (Chapter 5)
• communicating findings from original investigations through research papers, posters and oral presentations (Chapter 6)
• writing literature reviews and summaries (Chapter 7)
• communicating science to a non-expert audience (Chapter 8).
Finally, you’ll learn about your roles and responsibilities as a scientist, possible career paths, and how to use your skills as a science graduate to get a leg up in the job market (Chapter 9).
A better way to learn scienceA global issue facing the science disciplines in higher education is perhaps summed up in the title of an article published in The New York Times in 2011, ‘Why science majors change their minds (it’s just so darn hard)’.2 Research from the 1990s confirmed that students learn more by grappling with open-ended problems, rather than listening to lectures.2 But lectures are far cheaper to produce and deliver. With many academics focused on bringing in research grants, inquiry-oriented learning has, to date, failed to become ‘mainstream’ in undergraduate science education.
In an attempt to address this problem, many science education experts have implored educators to deliver curriculums that encourage students to engage in the practice of science. For example, leading biology and life sciences experts put out a call to educators to change the way we deliver undergraduate biology education worldwide.3 The plea urges educators to engage students as active participants in the scientific
process, so they can be better prepared for the biology-related challenges of the 21st century.
What the experts made clear in their plea for better scientists is that recent advances throughout the life sciences require new approaches, and these advances call out for new ways to prepare all undergraduates, regardless of their eventual career paths. This is consistent with the recommendations of Australia’s former Chief Scientist, Professor Ian Chubb, and other leading scientists, such as Professor Suzanne Cory, who is one of Australia’s most distinguished molecular biologists.4 After heeding the call to action, and developing and introducing curriculums designed to engage students in the scientific process, we soon realised that support materials for life sciences enquiry-based education were lacking. Therefore, this guide was born out of necessity – because, as the famous saying goes, ‘necessity is the mother of invention’.
This guide is suitable for life sciences students at all levels of undergraduate study, and could also be beneficial to postgraduate students.

15Introduction
i
How to use this book
IconsThroughout the guide, information has been presented in a consistent way. Tips, examples, and web and video links are presented as follows:
• This indicates a tip. Useful information is summarised here.
• This icon indicates a web link. Click the underlined (link) text to open the link in a browser window.
• Video links are denoted by this icon. You can click the underlined (link) text to open a browser window with
the featured link.
NavigationYou can quickly jump to any chapter of the guide using the navigation sidebar, which is on the far left of every page. Each number in the sidebar corresponds to a chapter; 'i' takes you to the introduction and 'g' to the glossary. The three horizontal lines icon ( ) at the top of the sidebar takes you back to the table of contents.
Application tutorialsChapters 3 and 4 feature tutorial sections on how to use particular computer applications for statistics and data visualisation.
Screenshots in these chapters help to clarify the instructions. These are annotated with arrows and boxes to highlight particular areas, as in the example below:
Text examplesSome chapters, particularly Chapters 6 and 7, contain examples of scientific writing with annotations pointing out structural and stylistic elements. These examples are presented using colour-coded boxes and arrows, as shown in the example below:
In this study, further gains in muscle size and strength after resistance training under systemic hypoxia were not observed.
We have previously confirmed that the same resistance exercise protocol performed under hypoxia induces a greater response in GH which has anabolic effects as compared to resistance exercise under normoxia (Kon et al. 2010). However, a consensus view on the relationship between the change in GH following a single session of resistance exercise and muscular hypertrophy with resistance training has not been achieved so far (McCall et al. 1999; Mitchell et al. 2013). Additionally, GH administration does not have an additive effect muscle hypertrophy and strength when combined with resistance training in healthy elderly men (Lange et al. 2002).
These observations suggest that the increase in GH following resistance exercise may not be implicated in the muscle hypertrophy and strength gain induced by such training.
Some discussions use subheadings to guide the reader.
Evaluation of the findings
First sentence of paragraph states the next important finding of the study.
Synthesis of the finding
A key at the bottom left of each page explains the colour-coding on pages featuring these examples.
References1 West, M 2012, STEM education and the
workplace, Occasional Paper Series, Office of the Chief Scientist, Canberra.
2 Drew, C 2011, ‘Why science majors change their minds (it’s just so darn hard)’, New York Times, 4 November.
3 American Association for the Advancement of Science 2011, Vision and change in undergraduate biology education: a call to action, American Association for the Advancement of Science, Washington, DC.
4 McEvoy, P 2014, ‘Science: precious petals to passionate teachers’, Q&A, Australian Broadcasting Corporation, Ultimo, New South Wales.

Photo: La Trobe University
Chapter 1: Researching science using the scientific method
1

1 Researching science using the scientific method 17
1
1 Researching science using the scientific method
T his chapter introduces the concept of science and its importance in our lives. Student scientists will learn
about what science is and how it works, and how science graduates are able to change society for the better. The last section warns the student scientist about pseudoscience, and how it differs from ‘real’ science – what you are here to learn.Science is with us everywhere. Advances in technology and science are rapidly transforming our world – from growing food, developing medicines, making exercise regimes, recycling and presenting the daily weather report, to reading a map, and using our mobile phones and computers.
The modern world would not be modern at all without the understandings and technology enabled by science. In the future, being science literate will be a necessity, not an option. We cannot escape from the significance of science.
• A student scientist is someone who is being formally educated about science and how to practise science,
as well as developing scientific skills and attributes such as teamwork, communication, and personal and professional responsibility.
1.1 How physiology has shaped our history
• Physiology is a branch of biology that deals with the normal functions and activities of living organisms
and their parts. Physiologists are interested in the mechanical, physical and biochemical functions of humans or animals, and their organs and cells.
Understanding and appreciating the history of physiology provides a context for learning current physiology. It also highlights how scientific understanding can change, and how current beliefs may one day be obsolete. Figure 1.1 presents some of the notable discoveries in physiology that have informed our understanding of the human body and treatment for many diseases. These scientists have all been awarded the Nobel Prize in Physiology or Medicine for their discoveries.1
• The website physiologyinfo.org, sponsored by the American Physiological Society, presents
a timeline of physiology that highlights important discoveries between 1822 and 2013. Milestones in both general physiology and endocrinology and metabolism are presented.
Karl Landsteiner (1868–1943)Discovered human blood groupsWon the Nobel Prize in 1930
Gerty Cori (1896–1957) and Carl Cori (1896–1984)Discovered glycogen and the Cori cycleWon the Nobel Prize in 1947
Gertrude Elion (1918–99), George Hitchings (1905–98) and Sir James Black (1924–2010)Discovered important principles of drug production and treatment for diseases such as leukaemia and malaria, and developed the first immunosuppressive agent to help solve the problem of organ rejection in transplant recipientsWon the Nobel Prize in 1988
Françoise Barré-Sinoussi (1947–) and Luc Montagnier (1932–)Discovered human immunodeficiency virus (HIV), the cause of acquired immunodeficiency syndrome (AIDS)Won the Nobel Prize in 2008
Elizabeth Blackburn (1948–), Carol Greider (1961–) and Jack Szostak (1952–)Discovered how chromosomes are protected by telomeres and the enzyme telomeraseWon the Nobel Prize in 2009
Youyou Tu (1930–)Discovered a novel therapy for malariaWon the Nobel Prize in 2016
Source: Nobelprize.org1
Figure1.1 Nobel Prize winners in physiology or medicine
1 Researching science using the scientific method 18
1
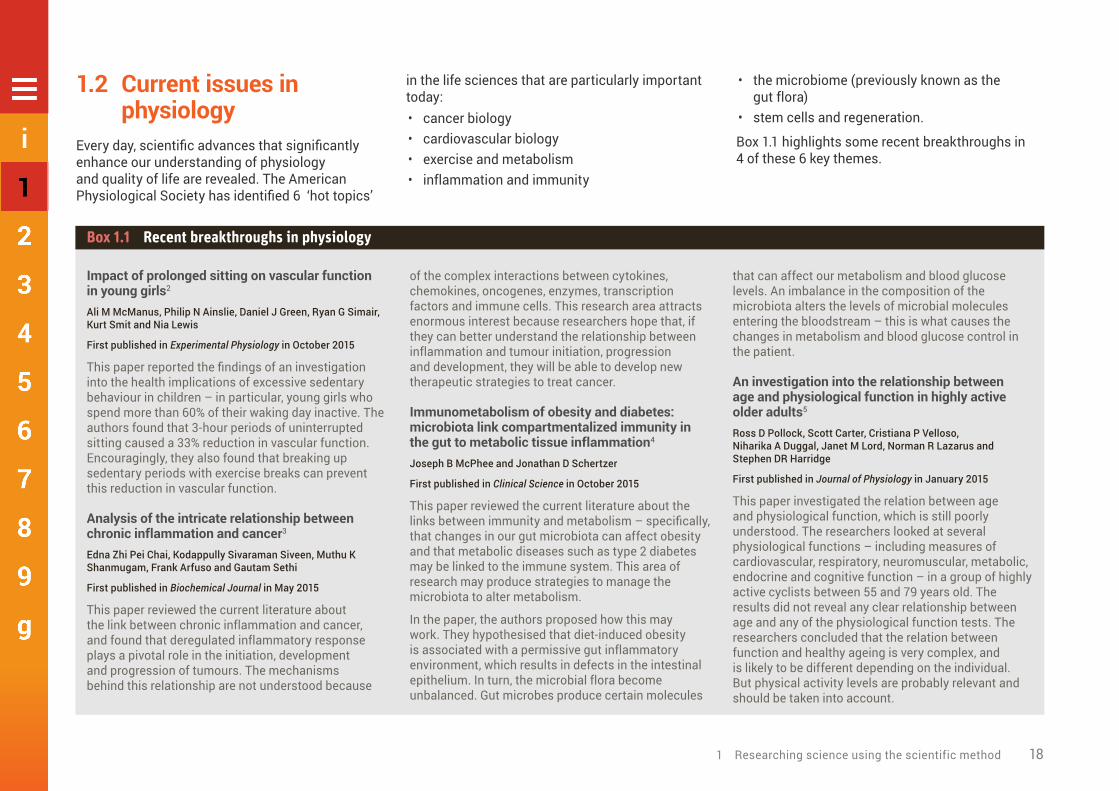
1.2 Current issues in physiology
Every day, scientific advances that significantly enhance our understanding of physiology and quality of life are revealed. The American Physiological Society has identified 6 ‘hot topics’
in the life sciences that are particularly important today:• cancer biology• cardiovascular biology• exercise and metabolism• inflammation and immunity
• the microbiome (previously known as the gut flora)
• stem cells and regeneration.
Box 1.1 highlights some recent breakthroughs in 4 of these 6 key themes.
Box 1.1 Recent breakthroughs in physiology
Impact of prolonged sitting on vascular function in young girls2
Ali M McManus, Philip N Ainslie, Daniel J Green, Ryan G Simair, Kurt Smit and Nia Lewis
First published in Experimental Physiology in October 2015
This paper reported the findings of an investigation into the health implications of excessive sedentary behaviour in children – in particular, young girls who spend more than 60% of their waking day inactive. The authors found that 3-hour periods of uninterrupted sitting caused a 33% reduction in vascular function. Encouragingly, they also found that breaking up sedentary periods with exercise breaks can prevent this reduction in vascular function.
Analysis of the intricate relationship between chronic inflammation and cancer3
Edna Zhi Pei Chai, Kodappully Sivaraman Siveen, Muthu K Shanmugam, Frank Arfuso and Gautam Sethi
First published in Biochemical Journal in May 2015
This paper reviewed the current literature about the link between chronic inflammation and cancer, and found that deregulated inflammatory response plays a pivotal role in the initiation, development and progression of tumours. The mechanisms behind this relationship are not understood because
of the complex interactions between cytokines, chemokines, oncogenes, enzymes, transcription factors and immune cells. This research area attracts enormous interest because researchers hope that, if they can better understand the relationship between inflammation and tumour initiation, progression and development, they will be able to develop new therapeutic strategies to treat cancer.
Immunometabolism of obesity and diabetes: microbiota link compartmentalized immunity in the gut to metabolic tissue inflammation4
Joseph B McPhee and Jonathan D Schertzer
First published in Clinical Science in October 2015
This paper reviewed the current literature about the links between immunity and metabolism – specifically, that changes in our gut microbiota can affect obesity and that metabolic diseases such as type 2 diabetes may be linked to the immune system. This area of research may produce strategies to manage the microbiota to alter metabolism.
In the paper, the authors proposed how this may work. They hypothesised that diet-induced obesity is associated with a permissive gut inflammatory environment, which results in defects in the intestinal epithelium. In turn, the microbial flora become unbalanced. Gut microbes produce certain molecules
that can affect our metabolism and blood glucose levels. An imbalance in the composition of the microbiota alters the levels of microbial molecules entering the bloodstream – this is what causes the changes in metabolism and blood glucose control in the patient.
An investigation into the relationship between age and physiological function in highly active older adults5
Ross D Pollock, Scott Carter, Cristiana P Velloso, Niharika A Duggal, Janet M Lord, Norman R Lazarus and Stephen DR Harridge
First published in Journal of Physiology in January 2015
This paper investigated the relation between age and physiological function, which is still poorly understood. The researchers looked at several physiological functions – including measures of cardiovascular, respiratory, neuromuscular, metabolic, endocrine and cognitive function – in a group of highly active cyclists between 55 and 79 years old. The results did not reveal any clear relationship between age and any of the physiological function tests. The researchers concluded that the relation between function and healthy ageing is very complex, and is likely to be different depending on the individual. But physical activity levels are probably relevant and should be taken into account.

1 Researching science using the scientific method 19
1
1.3 Science literacyA science degree helps students develop science literacy, so that graduates can contribute to society positively. Experts including science academics, science students, employment groups and professional societies identified 3 elements of science literacy that a science student should understand by the time they graduate (Figure 1.2).6
Graduates with scientific literacy are well prepared to participate in decision making and debate socioscientific issues that will improve society.
• The scientific method is the procedure of systematic observation, and forming, testing
and modifying hypotheses.
In high school and university, we learn science mostly from textbooks, which often present science as absolute facts that we have always known. What the textbook doesn’t make obvious is that these facts are only the best current information we have, and that these facts are the results of years of work by many scientists experimenting.
To fully understand science, we need to know how scientists do science and obtain facts.
Cutting-edge knowledge at the frontier of science is not as thoroughly tested as the well-tested and longstanding knowledge existing in contemporary textbooks.7 New data may not stand up to the test of time. New theories, ideas and possibilities can easily disappear as research progresses and data are generated.7 What might have been initially imagined by the physiologist as a ‘breakthrough’
discovery can easily end up as nothing more than a hypothesis without data to support it.
Student scientists should have the opportunity to appreciate the full scope of science during their undergraduate degrees, which includes the freedom to imagine new ideas, but with adequate educator support to actually take on the role of a scientist and test these ideas. This way, a student can learn about and understand science.
Knowledge of science concepts, or ‘what do we know?’
Scientific knowledge is no more than a guide to reality; it is not the real thing itself. – Henry Bauer7
The first element of scientific literacy is the most obvious – knowledge in science or the collection of facts that science has produced. Student scientists spend a large part of their undergraduate degrees learning scientific facts in their discipline
area – that is, they focus on ‘what we know’ and not on ‘how we came to know it’.6 Scientific facts are claims about the world that can be directly established by a careful, unprejudiced use of the senses,8 or repeated and verifiable observations.9
Scientific knowledge tells us about the nature of the world beyond what we see on the surface. It tells us about our cells and the organelles within, the transmission of energy from light hitting the retina in the eye to the electrical energy travelling down the optic nerve, and even about the conditions that existed in the world long before humans were around to observe it.8
Scientific theoryThe ultimate goal of science is to understand the natural world in terms of scientific theories – that is, concepts based on what we learn from experimentation. In science, our understanding is constantly increasing and, as a result, our theories develop and change.
What science is and what scientific concepts are
The practice of scienceincluding the methods and tools that scientists use – that is, the scientific method
The role of science in society
Figure1.2 Elements of scientific literacy
1 Researching science using the scientific method 20
1
Knowledge of the scientific method, or ‘how did we come to know it?’
Science is the pursuit and application of knowledge and understanding of the natural and social world following a systematic methodology based on evidence. – The Science Council10
According to this definition, the scientific method includes the elements shown in Figure 1.5.
In a speech to graduating students at the California Institute of Technology in 2016, Atul Gawande, a surgeon and public health researcher, said:
Science is not a major or a career. It is a commitment to a systematic way of thinking, an allegiance to a way of building knowledge and explaining the universe through testing and factual observation.11
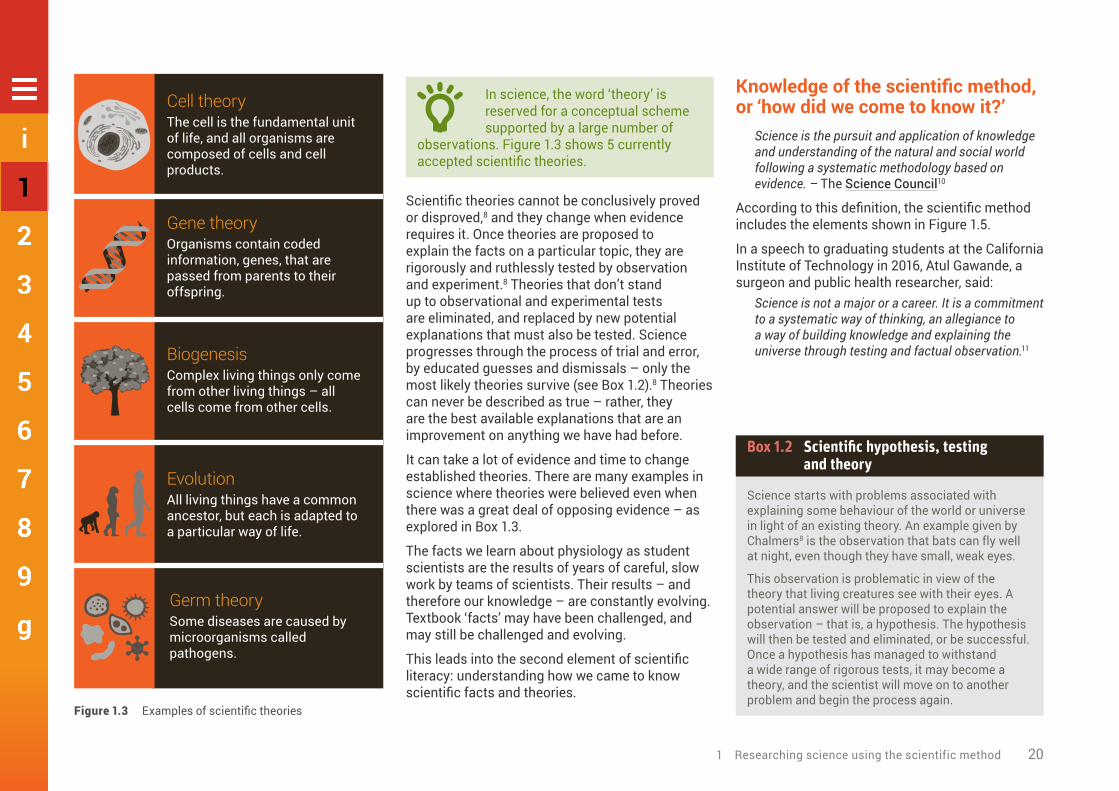
• In science, the word ‘theory’ is reserved for a conceptual scheme supported by a large number of
observations. Figure 1.3 shows 5 currently accepted scientific theories.
Scientific theories cannot be conclusively proved or disproved,8 and they change when evidence requires it. Once theories are proposed to explain the facts on a particular topic, they are rigorously and ruthlessly tested by observation and experiment.8 Theories that don’t stand up to observational and experimental tests are eliminated, and replaced by new potential explanations that must also be tested. Science progresses through the process of trial and error, by educated guesses and dismissals – only the most likely theories survive (see Box 1.2).8 Theories can never be described as true – rather, they are the best available explanations that are an improvement on anything we have had before.
It can take a lot of evidence and time to change established theories. There are many examples in science where theories were believed even when there was a great deal of opposing evidence – as explored in Box 1.3.
The facts we learn about physiology as student scientists are the results of years of careful, slow work by teams of scientists. Their results – and therefore our knowledge – are constantly evolving. Textbook ‘facts’ may have been challenged, and may still be challenged and evolving.
This leads into the second element of scientific literacy: understanding how we came to know scientific facts and theories.
Cell theoryThe cell is the fundamental unit of life, and all organisms are composed of cells and cell products.
Gene theoryOrganisms contain coded information, genes, that are passed from parents to their offspring.
BiogenesisComplex living things only come from other living things – all cells come from other cells.
EvolutionAll living things have a common ancestor, but each is adapted to a particular way of life.
Germ theorySome diseases are caused by microorganisms called pathogens.
Figure1.3 Examples of scientific theories
Box 1.2 Scientific hypothesis, testing and theory
Science starts with problems associated with explaining some behaviour of the world or universe in light of an existing theory. An example given by Chalmers8 is the observation that bats can fly well at night, even though they have small, weak eyes.
This observation is problematic in view of the theory that living creatures see with their eyes. A potential answer will be proposed to explain the observation – that is, a hypothesis. The hypothesis will then be tested and eliminated, or be successful. Once a hypothesis has managed to withstand a wide range of rigorous tests, it may become a theory, and the scientist will move on to another problem and begin the process again.

1 Researching science using the scientific method 21
1
Box 1.3 The difficulties in changing scientific theory
Source: collections.nlm.nih.gov/catalog/nlm:nlmuid-101393375-img, used under CC0 1.0
Figure1.4 ‘Cholera art’ – a representation of the cholera epidemic of the 19th century by Robert Seymour titled Cholera ‘Tramples the victors & the vanquished both’
Widely accepted during the 18th and 19th centuries, the miasma (Greek for pollution) theory of disease transmission explained the origin and spread of some epidemic diseases such as cholera. According to the theory, these diseases were caused by miasma – an ill-defined, poisonous vapour secreted by rotting organic matter, or a noxious form of ‘bad air’ (Figure 1.4).12-14
In 1546, Italian physician, poet, astronomer and geologist Girolamo Fracastoro first proposed a hypothesis that contradicted the miasma theory – that contagious diseases were caused and spread by transferrable seed-like bodies. Other scientists proposed similar hypotheses, but it wasn’t until the work of Louis Pasteur and Robert Koch in the late 1860s that the germ theory became widely accepted. Joseph Lister, who came to be known as the ‘father of modern surgery’, applied the advances made by Pasteur to the hospital environment, and introduced sterilisation of equipment, bedding, gowns and wounds, and washing hands to prevent infection.
Lister faced opposition despite the positive results he was achieving. It didn’t help that bacteria were too
small to see, but eventually his aseptic techniques were adopted throughout Germany, the United States, France and, finally, Great Britain.
Sometimes scientists believe in a hypothesis so much that they may think they are observing things that are not there. The canals of Mars are a fascinating (although nonphysiological) example of this.
In 1877, Italian astronomer Giovanni Schiaparelli reported the discovery of canals on Mars;15 many astronomers, including Percival Lowell (1911) and Eugène Antoniadi (1930), also documented seeing the canals and drew detailed maps. Around 1895, these drawings led to Lowell concluding that the canals were an irrigation system developed by Martians. When more sophisticated telescopes and imaging technology were available, astronomers – including Antoniadi – proposed that the canals were an optical illusion caused by dust moving across the surface of Mars as a result of strong winds.16 This was supported by images obtained in the 1960s by unmanned NASA spacecraft.
Objective observationMeasurement and data (possibly although not necessarily using mathematics as a tool)
Evidence
Experiment and/or observationas benchmarks for testing hypotheses
Verification and testingCritical exposure to scrutiny,peer review and assessment
Critical analysis
Repetition
InductionReasoning to establish general rules or conclusions drawn from facts or examples
Source: The Science Council10
Figure1.5 Elements of the scientific method

1 Researching science using the scientific method 22
1
The process of making new discoveries in science is not as straightforward and neat as it may first appear. As a student scientist, you read textbooks, and conduct ‘cookbook’ practicals in which you follow a series of steps. In practice, creating new knowledge in science is characterised by difficulties, uncertainties and competing hypotheses.
Science is a huge discipline, and the way science is done depends on the field of study. Exactly how scientists conduct their craft depends on what knowledge and answers they are pursuing. For example, astronomers and geologists base their understanding on field observations, whereas physiologists and chemists base their understanding on experiments.
• To a physiologist, the scientific method means implementing a series of experimental steps
to create new knowledge and develop a more sophisticated understanding of a particular topic.
The scientific method follows 7 general steps (see Figure 1.6):1. Make an observation.2. Research the topic.3. Form a testable hypothesis that may explain
the observation.4. Perform an experiment or series of
experiments.5. Analyse the results.6. Accept or dismiss the hypothesis (conclusion).7. Share the results.
Some philosophers and scientists prefer to see the scientific method as an ideal rather than a rule or a description of the practice of all scientists. Scientists are humans; this means that we are not perfect and that we are different in terms of our motivation, drive and ideas – all of which may result in science being practised differently.
Scientists may approach their quest for new discoveries differently, but they will always seek evidence, which can be obtained in different ways. The scientific method combines rational thought and imagination to predict and explain phenomena, and the work of scientists is always open to scrutiny, criticism and debate.
Figure 1.7 shows a different model of the scientific method, indicating how it may not be strictly linear.
• Video overview of the scientific method. TED-Ed presentation by Adam Savage on 2 spectacular
examples of profound scientific discoveries that came from simple, creative methods that anyone could have followed.
Observation and researchScientific research starts with a scientist making an initial observation that they cannot explain with an existing theory. It can also be a more open-ended question, such as ‘How can I treat this particular disease?’ The scientist will study any previous data – that is, review the existing literature on the topic area, which are facts relevant to the problem at hand. This research may reveal that another scientist has already answered the question and, in this case, a new question will be asked. If the question hasn’t been answered, the scientist will
Observation
Research
Hypothesis and aim
Experiment
Results
Conclusion
Share results
Make an observation
Research the topic
Form a testable hypothesis that may explain the observation
Perform an experiment or series of experiments
Analyse the results
Accept or dismiss the hypothesis (conclusion)
Share the results
Figure1.6 The scientific method

1 Researching science using the scientific method 23
1
use the findings of their research to help them to design a good question that they can test.
Hypothesis and aimResearch, and imaginative and creative thinking help the scientist to formulate a hypothesis that they can test to explain an observation or answer a question. A hypothesis is an assumption based on knowledge obtained during the observation stage – it is an ‘educated guess’.
Data generated during an experiment either support or fail to support the hypothesis. Hypotheses may be specific (eg chronic ingestion of artificial sweeteners causes weight gain in humans) or broad (eg viruses cause disease in animals), and are always subject to modification.
It is important to note that hypotheses may be proven untrue. This occurs when the data do not support the hypothesis, in which case the hypothesis must be rejected or refined.
A hypothesis is tightly linked to the aim of the study, which is the objective or goal of an experiment or series of experiments. The aim is written in a similar manner to the hypothesis. A hypothesis is a prediction about the outcome of an experiment; an aim is usually written in the form of an instruction:
Hypothesis: Chronic ingestion of artificial sweetener causes weight gain in humans.
Aim: To determine if chronic ingestion of artificial sweetener causes weight gain in humans.
ExperimentPhysiologists do experiments to test whether the real world behaves as predicted by the hypothesis. The purpose of the experiments is to find out if the resulting observations of the real world agree or
conflict with the prediction – if they agree, we can be more confident that the hypothesis is true, but if they disagree we become less confident.
Experiments are a valuable scientific tool, because when experimenting we are able to control and manipulate phenomena and events. However, this also means that we are creating an ‘artificial environment’ for our experiments. This may not end up reflecting what is happening in the real – messy – world.
Experiments will only help us to support or not support a hypothesis if they are done properly. This means using care and the right equipment
and settings, with the goal of minimising error. If experiments are done carelessly, introducing error into the results, the observations (or data) are useless when we try to evaluate our hypothesis.
Part of understanding how science works includes becoming aware of the methods and tools of science. Each scientific discipline has its own specialised techniques and tools that it uses to observe the natural world; student scientists will be exposed to some of these methods in practical classes during their studies. Experimental methods are not perfect, even when scientists try their best, and they can be updated or replaced
Ask questionsWhy does that occur?
Make observationsWhat do I see? This can be different from personal experience, thoughts or reading.
Develop general theoriesThese must be consistent with most or all available data, which means they must be consistent with other theories.
Gather data to test predictionsData can come from literature (desktop) reviews, new observations or formal experiments. Thorough testing needs replication to verify the results.
Develop testable predictionsIf ‘a’ depends on ‘b’, then I expect ‘c’ to happen.
Refine, alter, expand or reject hypotheses
Formulate a hypothesisI think ‘a’ depends on ‘b’.
Source: Archon Magnus, used under CC BY-SA 4.0
Figure1.7 The scientific method as an ongoing process

1 Researching science using the scientific method 24
1
over time. Advances in technology or scientific understanding may mean that previously accepted methods are rejected and replaced with new ones. This may also mean that experimental results obtained using old methods are ignored, or viewed as less relevant, because our way of thinking about the topic has changed.
It is not always easy and straightforward to conduct well-designed experiments and get reliable results. New experiments may take months or even years to perfect. Scientists need to work hard to collect high-quality results, including:• developing their theoretical and practical
knowledge of an area and a technique• learning through trial and error• mastering the available technology.
Researchers must provide details on how their experiments were done, because other researchers must be able to repeat the results. If results cannot be repeated, the hypothesis is no longer supported, and the conclusion may be incorrect. When the results of experiments are shared with the wider scientific community, the research will be judged on many things, including the methods employed (Figure 1.8).
Also, it is very rare for a researcher to generate their experimental methods from scratch; it is more common to use methods that have been shown by other researchers to be successful at measuring particular variables. This is another reason why it is important to provide details of your methodology.
ResultsScientists collect the data generated from their experiments and analyse them to determine
whether the hypothesis was supported or not. In the analysis stage, the scientist combines the results from repeated experiments and uses statistical analysis to test the hypothesis – for example, to determine whether differences exist between different experimental groups. Scientists will present their results as text, tables and graphs.
Results should be reproducible – that is, another scientist should be able to follow the same method and obtain the same results. If they are not able to do this, it may mean that the original results were an error. For this reason, scientists will usually repeat a single experiment multiple times.
Scientists rarely attempt to replicate the findings of other scientists, despite the importance of reproducibility, partly because there are few
incentives for scientists to dedicate time to replicating existing studies.
Recently, some scientists have found that, when they do try to replicate studies, they have not been able to obtain the same results. This has led to a ‘crisis of reproducibility’. For example, scientists who have investigated reproducibility have found that few findings published in top psychology journals and in highly cited papers on psychiatric treatment18 could be replicated.19 This issue is gaining more attention and must be addressed by scientists from all disciplines.
ConclusionConclusions are made about the results of the experiment in light of the hypothesis. Simply, the results do or do not support the hypothesis. The
Were the methods satisfactorily performed?
Could or should the investigation have been done
differently?
Were the methods well chosen?
How was the evidence acquired?
What errors are likely, and how, if at all, were they
estimated?
What instruments were used and why?
Source: Hodson17
Figure1.8 Questions used to judge a scientific method

1 Researching science using the scientific method 25
1
conclusions below are the 2 possibilities arising from the example hypothesis and aim shown previously:
Conclusion: Chronic ingestion of artificial sweetener caused weight gain in humans
Conclusion: Chronic ingestion of artificial sweetener did not cause weight gain in humans.
The study hypothesis, aim and conclusion are therefore highly connected.
Scientific conclusions are subject to change when new findings dictate that they need to be changed. Quite often in science, new studies, which might use new techniques and equipment, tell us when conclusions need to be modified or changed entirely.
Share resultsResults of experiments should be shared with the wider scientific community, so they can contribute to the pool of knowledge on a topic and lead to better understanding for everyone.
Scientists can communicate with their peers in different ways:• make an oral presentation at a conference• present a poster at a conference• publish a journal article in a peer-reviewed
academic journal (see Box 1.4).
Publication of results makes information widely available, and the results will be used by others if they are seen as interesting – results not deemed interesting will fade from sight; sadly, this is the fate of most published articles.
Interesting and important results will be cited by other scientists in the field who will test the results, and often modify and extend the research.
They may also report back if they find something wrong or inadequate in the research. Results that withstand scrutiny by peers and continue to be seen as interesting, useful and correct (or not obviously wrong) will make their way into secondary literature – that is, review articles, monographs and graduate-level textbooks. If more time passes and the results are still interesting and correct, they will find their way into high school–level textbooks, which have the widest reach and influence.
An example of the scientific method in action is shown in Box 1.5.
The language used in presentations and journal articles is highly technical and will contain a lot of scientific jargon. A non-expert audience will struggle to understand the meaning of such publications. To communicate their findings to lay – or non-expert – audiences, scientists may talk about their work during, for example, a radio or television interview.
Chapters 6 and 7 discuss the ins and outs of writing technical publications, and Chapter 8 talks more about communicating science to the non-expert audience.
Knowledge and appreciation of science in society, or ‘how can we contribute?'Understanding how science influences society – and vice versa – is an important aspect of scientific literacy. Science graduates who are able to combine their knowledge of science and how it works with an understanding of the role of science in society will be valuable citizens who can contribute effectively to debates and decision making about science-related public issues.
One of the roles of a science graduate is to uphold the reputation of science in society by explaining what it is and why it is important. Many members of the public misunderstand
Box 1.4 Peer-reviewed articles and academic journals
Results do not become part of the pool of shared knowledge until they are published, but not all results achieve this outcome. Scientists must present their findings in the accepted format – that is, a journal article – and convince journal editors and referees that their work is interesting, sound and useful.
Once a journal editor accepts an article, it is peer reviewed. This is where others scientists with expertise in the relevant field, usually anonymously, read through and check that the work is of sufficient quality and worthy of publication. The publication and peer-review process is at the mercy of people and
therefore not perfect – error, bias and dishonesty are inherent. As a result, some research that should be published isn’t – and some research that shouldn’t be published is.
This is a stressful process because research scientists in universities and industry aim to publish their work in academic and professional journals. A scientist’s publication record is tremendously important because it is often used to judge the quality of their work. Ultimately, a researcher’s publication record determines whether they get or keep jobs, or gain funding to continue their work.

1 Researching science using the scientific method 26
1
what science is, what it means if something is scientific, and how science and technology are related. Some scientists may also share these misunderstandings.7
• Video interview with Steven Pinker, renowned experimental psychologist and Professor in
the Department of Psychology at Harvard University, on the place of science in society.
Many people already do respect science, and this has been exploited in some advertisements that tell us that a product has been ‘scientifically proven’ to be better, stronger, faster, more efficient or even sexier than its rivals. This is meant to make the product more attractive to consumers because it implies that the claims are well founded and perhaps beyond dispute.8
On the other hand, some people do mistrust science, as evidenced by some views about climate change and childhood vaccinations. Although most scientists agree that climate change is occurring, some of the public still view it as an issue that is up for debate. And despite the evidence supporting the positive impact of immunisation on human health, some parents are reluctant to vaccinate their children.
Scientists are responsible for discoveries that have resulted in death and destruction, for example, nuclear weapons and pollution, and – as a result – are distrusted by some members of the public. A study published in 2012 reviewed data collected from American citizens from 1974 to 2010 on their social attitudes.20 The author found that trust in science did not decline during this period, except among people who described themselves as
Box 1.5 The scientific method in action
Observation: A physiologist determines that available evidence indicates that drug X – which is not yet approved by Australia’s Therapeutic Goods Administration – increases the metabolic rate, and may therefore be a promising weight loss drug.
Hypothesis: The physiologist hypothesises that ‘drug X will cause weight loss in adult rats’.
Aim: The physiologist plans a study, with the aim to ‘determine if drug X will cause weight loss in adult rats’.
Experiment: The physiologist randomly assigns 20 adult rats to control and treatment groups – 10 per group. The control group is administered a daily dose of the placebo for 4 months, and the treatment group is administered a daily dose of drug X for 4 months.
The control group receives a placebo instead of the drug, and all other conditions are identical to the treatment group. They receive the same kind of food and water.
Body weight is recorded daily.
Results: At the end of the 4-month treatment period, the physiologist analyses the body weight data. The data reveal that there is a statistical difference between experimental groups, with the treatment rats weighing less than the control rats.
Conclusion: Drug X caused weight loss in adult rats.
Share results: The physiologist will share their work with peers through a poster or oral presentation at a conference, and/or a journal article.
Placebo
Same diet and conditions
Drug
Control group Treatment group

1 Researching science using the scientific method 27
1
politically conservative and those who frequently attended church. Also, levels of trust in science varied a lot according to social class, ethnicity, gender, and region. This is not surprising, given the way science and scientists have treated some populations – for example, African–American men in the Tuskegee study (see the associated Research case study).
Misconceptions about what scientists do are also widespread in society. Many of these misconceptions result from stereotypical scientists represented in the media. Roslynn Haynes22 studied how scientists are portrayed in western literature and film, and, in her book, proposed that scientists can be put into 6 categories (Figure 1.9).
Although science influences how society functions, it is also true that society influences which topics are chosen for research and government funding. In 2015, the Australian Government developed a set of Science and Research Priorities (Figure 1.10). This project was led by the former Chief Scientist, Professor Ian Chubb, and included consultation with researchers,
Research case study: The Tuskagee study and African–American men
Marcella Alsan and Marianne Wanamaker published a working paper for the National Bureau of Economic Research in 2016;21 the abstract summarises their study:
For forty years, the ‘Tuskegee study of untreated syphilis in the Negro male’ passively monitored hundreds of adult black males with syphilis despite the availability of effective treatment. The study’s methods have become synonymous with exploitation and mistreatment by the medical community. We find that the historical disclosure of the study in 1972 is correlated with increases in medical mistrust and mortality, and decreases in both outpatient and inpatient physician interactions for older black men. Our estimates imply life expectancy at age 45 for black men fell by up to 1.4 years in response to the disclosure, accounting for approximately 35% of the 1980 life expectancy gap between black and white men.
Alsan and Wanamaker’s research showed that the unethical study may have led to a distrust in doctors, which contributed to (~35%) African–American men avoiding the health care system and therefore dying earlier. This effect was stronger the closer the men lived to Macon County, Alabama, where the Tuskegee study took place.
AlchemistAn obsessed or maniacal scientistExamples: Dr Evil in the Austin Powers trilogy, Doc Emmett Brown in the Back to the Future trilogy, Walter White in Breaking Bad
Stupid virtuosoThe absent-minded professor, possibly out of touch with the real worldExamples: Jillian Holtzmann in Ghostbusters, Dr Bunsen Honeydew in The Muppets, Hubert J Farnsworth in Futurama
Unfeeling scientistSacrifices human relationships for the sake of scientific achievement; may lack moralsExamples: Dr Ellie Arroway in Contact, Dr Temperance Brennan in Bones, Mr Spock in Star Trek
Helpless scientistHas lost control of their discovery or over the way it is usedExamples: Dr Frankenstein in Frankenstein, and Dr Henry Jekyll in Dr Jekyll and Mr Hyde
Scientist as idealistHolds out hope for a scientifically sustained utopia, but is often in conflict with a technology-based system that isn't consistent with human valuesExamples: Dr Grace Augustine in Avatar, Dr Ellie Sattler in Jurassic Park, Professor Xavier in X-Men
Heroic adventurerExplores new territories or engages with new conceptsExamples: : Tony Stark in Iron Man, Sherlock Holmes in books by Arthur Conan Doyle or associated movies and television, Indiana Jones in Raiders of the Lost Ark
Source: Haynes22
Figure1.9 Categories for scientists depicted in western literature and film
1 Researching science using the scientific method 28
1
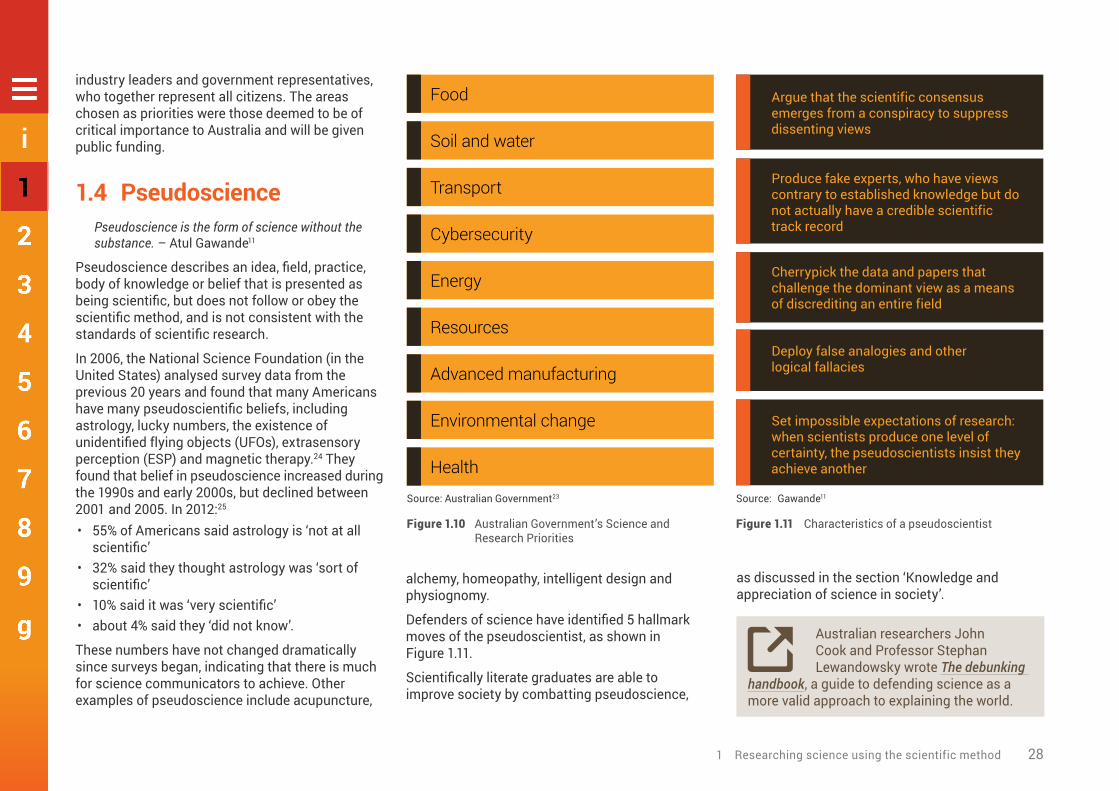
industry leaders and government representatives, who together represent all citizens. The areas chosen as priorities were those deemed to be of critical importance to Australia and will be given public funding.
1.4 PseudosciencePseudoscience is the form of science without the substance. – Atul Gawande11
Pseudoscience describes an idea, field, practice, body of knowledge or belief that is presented as being scientific, but does not follow or obey the scientific method, and is not consistent with the standards of scientific research.
In 2006, the National Science Foundation (in the United States) analysed survey data from the previous 20 years and found that many Americans have many pseudoscientific beliefs, including astrology, lucky numbers, the existence of unidentified flying objects (UFOs), extrasensory perception (ESP) and magnetic therapy.24 They found that belief in pseudoscience increased during the 1990s and early 2000s, but declined between 2001 and 2005. In 2012:25
• 55% of Americans said astrology is ‘not at all scientific’
• 32% said they thought astrology was ‘sort of scientific’
• 10% said it was ‘very scientific’• about 4% said they ‘did not know’.
These numbers have not changed dramatically since surveys began, indicating that there is much for science communicators to achieve. Other examples of pseudoscience include acupuncture,
alchemy, homeopathy, intelligent design and physiognomy.
Defenders of science have identified 5 hallmark moves of the pseudoscientist, as shown in Figure 1.11.
Scientifically literate graduates are able to improve society by combatting pseudoscience,
as discussed in the section ‘Knowledge and appreciation of science in society’.
• Australian researchers John Cook and Professor Stephan Lewandowsky wrote The debunking
handbook, a guide to defending science as a more valid approach to explaining the world.
Food
Soil and water
Transport
Cybersecurity
Energy
Resources
Advanced manufacturing
Environmental change
Health
Source: Australian Government23
Figure1.10 Australian Government’s Science and Research Priorities
Argue that the scientific consensus emerges from a conspiracy to suppress dissenting views
Produce fake experts, who have views contrary to established knowledge but do not actually have a credible scientific track record
Cherrypick the data and papers that challenge the dominant view as a means of discrediting an entire field
Deploy false analogies and other logical fallacies
Set impossible expectations of research: when scientists produce one level of certainty, the pseudoscientists insist they achieve another
Source: Gawande11
Figure1.11 Characteristics of a pseudoscientist

1 Researching science using the scientific method 29
1
References1 Nobelprize.org, All Nobel Laureates in Physiology or
Medicine, Nobelprize.org, viewed 12 August 2016, <www.nobelprize.org/nobel_prizes/medicine/laureates>.
2 McManus, A, Ainslie, P, Green, D, Simair, R, Smith, K & Lewis, N 2015, ‘Impact of prolonged sitting on vascular function in young girls’, Experimental Physiology, vol. 100, no. 111, pp. 1379–1387.
3 Chai, E, Siveen, K, Shanmugam, M, Arfuso, F & Sethi, G 2015, ‘Analysis of the intricate relationship between chronic inflammation and cancer’, Biochemistry Journal, vol. 468, no. 1, pp. 1–15.
4 McPhee, JB & Schertzer, JD 2015, ‘Immunometabolism of obesity and diabetes: microbiota link compartmentalized immunity in the gut to metabolic tissue inflammation’, Clinical Science (London), vol. 129, no. 12, pp. 1089–1096.
5 Pollock, R, Carter, S, Velloso, C, Duggal, N, Lord, J, Lazarus, N & Harridge, S 2015, ‘An investigation into the relationship between age and physiological function in highly active older adults’, Journal of Physiology, vol. 593, no. 3, pp. 657–680.
6 Yucel, R 2013, Good practice guide (science). Threshold learning outcome 1: understanding science, Office for Learning and Teaching, Sydney.
7 Bauer, HH 1992, Scientific literacy and the myth of the scientific method, University of Illinois Press, Chicago.
8 Chalmers, AF 2013, What is this thing called science? Hackett Publishing, Indianapolis.
9 Toplis, R 2011, How science works: exploring effective pedagogy and practice, Routledge, Abingdon on Thames, United Kingdom.
10 Science Council, Our Definition of Science, viewed 9 August 2015, <http://sciencecouncil.org/about-us/our-definition-of-science/>.
11 Gawande, A 2016, ‘The mistrust of science’, New Yorker, 10 June, <www.newyorker.com/news/news-desk/the-mistrust-of-science>.
12 Last, JM 2007, ‘Miasma theory’, in A dictionary of public health, Oxford University Press, Oxford.
13 Harvard University Library 2016, Contagion: Historical Views of Diseases and Epidemics – Germ Theory, Harvard University Library, viewed 12 August 2016, <http://ocp.hul.harvard.edu/contagion/germtheory.html>.
14 Pitt, D & Aubin, JM 2012, ‘Joseph Lister: father of modern surgery’, Canadian Journal of Surgery, vol. 55, no. 5, pp. E8–E9.
15 Hetherington, NS 1976, ‘The British Astronomical Association and the controversy over canals on Mars’, Journal of the British Astronomical Association, vol. 86, pp. 303–308.
16 Gifford, FA 1964, The Martian canals according to a purely aeolian hypothesis, Icarus Publishing.
17 Hodson, D 2008, Towards scientific literacy: a teachers’ guide to the history, philosophy and sociology of science, Sense Publishers, Rotterdam.
18 Tajika, A, Ogawa, Y, Takeshima, N, Hayasaka, Y & Furukawa, TA 2015, ‘Replication and contradiction of highly cited research papers in psychiatry: 10-year follow-up’, British Journal of Psychiatry, vol. 207, no. 4, pp. 357–362.
19 Open Science Collaboration 2015, ‘Estimating the reproducibility of psychological science’, Science and Engineering Indicators, vol. 349, no. 6251, doi: 10.1126/science.aac4716.
20 Gauchat, G 2012, ‘Politicization of science in the public sphere: a study of public trust in the United States, 1974 to 2010’, American Sociological Review, vol. 77, no. 2, pp. 167–187.
21 Alsan, M & Wanamaker, M 2016, Tuskegee and the health of black men, Working Paper 22323, National Bureau of Economic Research, Cambridge, Massachusetts.
22 Haynes, RD 1994, From Faust to Strangelove: representations of the scientist in western literature, John Hopkins University Press, Baltimore.
23 Australian Government 2015, Science and Research Priorities, Australian Government, Canberra.
24 National Center for Science and Engineering Statistics 2006, ‘Science and technology: public attitudes and understanding’, in Science and engineering indicators, National Science Foundation, Arlington.
25 National Center for Science and Engineering Statistics 2014, ‘Science and technology: public attitudes and understanding’, in Science and engineering indicators, National Science Foundation, Arlington.
Photo: Science Photo Library
Chapter 2: Designing for discovery
2

2 Designing for discovery 31
2
2 Designing for discovery
T his chapter explains the principles of experimental design and leads you through some examples of
experimental design in human physiology.New and exciting scientific discoveries that have a positive impact on humanity are not usually stumbled upon by chance. Scientists systematically go about their work to create new knowledge in many important areas such as the treatment and prevention of disease.
We gain improved understandings of our natural world when scientists dedicate themselves to the pursuit of discovery by carefully preparing for, planning and conducting experiments. A scientist’s carefully controlled experiments produce data, and the data that build from many different – yet similar – experiments on a given topic provide evidence to help us understand more about a particular field or topic.
Effective experimental design is not haphazard; it is in itself a science, where a set of rules are followed to produce valid and reliable data.
In Chapter 1, we introduced the importance of scientific literacy, which includes the recommendation that student scientists understand science, including how we come by our scientific knowledge. We introduced the scientific method, of which a big component is experimentation. During your undergraduate
degree, you will likely be given a chance to practise the scientific method and to design your own study.
2.1 Researching human physiology
Human research is research conducted with or about people, or their data or tissue. – National Statement on Ethical Conduct in Human Research1
Although there is no one perfect definition of research, it is generally agreed that research includes investigation with the purpose of gaining knowledge and understanding, or for training researchers. The British Research Assessment Exercise has a broader definition of research:
‘Research’ ... includes work of direct relevance to the needs of commerce, industry, and to the public and voluntary sectors; scholarship; the invention and generation of ideas, images, performances, artefacts including design, where these lead to new or substantially improved insights; and the use of existing knowledge in experimental development to produce new or substantially improved materials, devices, products and processes, including design and construction. It excludes routine testing and routine analysis of materials, components and processes such as for the maintenance of national standards, as distinct from the development of new analytical techniques. It also excludes the development of teaching materials that do not embody original research. – Research Assessment Exercise2
In research in human physiology, investigators may use human participants or animal subjects. Animals are commonly used to inform our understanding of how humans work. In contrast,
animal physiologists study animals to inform their understanding of how animals function.
In this chapter, we will provide some practical tips on writing hypotheses, aims and conclusions, and then focus on the ‘experiment’ step of the scientific method (Figure 2.1).

2 Designing for discovery 32
2
Where to start?Before designing an experiment, you will have read some research on the existing scientific literature on a topic, and made an observation you cannot yet explain. This process will lead you to write the hypothesis for the study. More scientifically put, the hypothesis is a prediction of the effect of the independent variable on the dependent variable in a scientific research study.
• A hypothesis is an assumption or prediction based on sound evidence – that is, an ‘educated guess’.
Scientists may differ on how they write their hypotheses; one simple model is presented here. Firstly, identify your independent and dependent variables (Figure 2.2); these are essential to the aim, hypothesis and conclusion of a study.
Now that you have researched the topic, decided on what you predict will happen under your experimental conditions, and established your independent and dependent variables, you can use the following schema to write your hypothesis.
Observation
Research
Hypothesis and aim
Experiment
Results
Conclusion
Share results
Make an observation
Research the topic
Form a testable hypothesis that may explain the observation
Perform an experiment or series of experiments
Analyse the results
Accept or dismiss the hypothesis (conclusion)
Share the results
This phase of the scientific method is where you implement your methodology to generate data; for a sound project, it is imperative that your experiment is designed appropriately
Figure2.1 The scientific method
Independent variable
Dependent variable
The variable that the investigator intentionally changes in an experiment to observe its effect on other variablesExample: in an experiment where a scientist studies the effect of artificial sweetener on body weight, artificial sweetener is the independent variable
The variable that changes in an experiment as a result of the independent variableExample: in an experiment where a scientist studies the effect of artificial sweetener on body weight, body weight is the dependent variable
Figure2.2 Independent and dependent variables

2 Designing for discovery 33
2
HypothesisSimply replace the highlighted text below with information specific to your experiment.
Independent variable
will cause dependent variable
to predicted direction of change
experimental conditions
For example:Artificial sweetener
will cause
body weight to increase in healthy elderly humans
Or:
An acute dose of 100 mg of drug Y
will cause oxygen consumption
to decrease in healthy young adults
Try to avoid hypothesising that your independent variable will have no effect on your dependent variable.
Here is a hypothesis written by a student and a suggestion for how it could be improved. The original hypothesis is missing information that will make it clear and specific to the experiment that the student is planning to do.
Original hypothesis that needs some work:
Listening to fast music will increase activity in the cardiovascular system
Revised hypothesis that is more precise and indicates what is being compared:
Music with a high tempo (150 beats per minute [bpm])
will cause
heart rate and mean arterial pressure
to increase more than music with a low tempo (75 bpm)
Now that you have your hypothesis, it is simple to slightly modify this statement to write your aim.
AimThe aim can be written using the same words as the hypothesis, with the addition of ‘to determine the effect of’ or ‘to determine if’ at the beginning of the sentence.
• The aim is the goal or objective of a scientific research study – that is, to determine the effect of the independent variable(s) on the dependent variable(s).
Simply replace the boxes below with information specific to your experiment.
To determine if
independent variable
will cause
dependent variable
to predicted direction of change
experimental conditions
For example (this matches the hypothesis presented in the previous section):
To determine if
artificial sweetener
will cause
body weight to increase in healthy elderly humans
Or (this matches the hypothesis presented in the previous section):
To determine if
an acute dose of 100 mg of drug Y
will cause
oxygen consumption
to decrease in healthy young adults
Here is an aim written by a student and a suggestion for how it could be improved. The original aim is missing information that will make it clear and specific to the experiment that the student is planning to do.
Original aim that needs some work:Introduce participants to music with a range of BPMs to establish what effect if any the speed of music had on their cardiovascular system.
Revised aim that is more precise and indicates what is being compared:
To determine if
music with a high tempo (150 bpm)
will cause
heart rate and mean arterial pressure
to increase more than music with a low tempo (75 bpm)
We’re jumping ahead a bit, but it is a good place to discuss writing your conclusion. Your conclusion should be very tightly linked to your hypothesis and aim. In fact, you can base the wording of your conclusion on the wording of your hypothesis (and aim, since it is written similarly to the hypothesis).

2 Designing for discovery 34
2
ConclusionThe conclusion can be written using the same words as the hypothesis. Just change the wording slightly to indicate how the results compared with your prediction.
• A conclusion is the answer to your research question – a summary of how the results of a scientific study support or fail to support the hypothesis.
Simply replace the highlighted text below with information specific to your experiment.
Independent variable
caused or did not cause
dependent variable
to observed direction of change
experimental conditions
For example:
Artificial sweetener caused body weight to increase in healthy elderly individuals
Or:
An acute dose of 100 mg of drug Y
did not cause oxygen consumption
to decrease in healthy young adults
Here are some conclusions written by students and suggestions for how they could be improved. The original conclusions are longwinded and wordy, and do not clearly link back to the hypothesis and aim.
Remember, if you collected usable data in your experiment, you can always state a conclusion! If you did not find a significant difference between groups or conditions, this is still a valid conclusion.
Original conclusion that needs some work:Despite the results indicating a slight increase in the cardiovascular system, statistical tests indicate that there was no statistically significant difference between the control and the music group. Therefore, because of the inconclusive results we cannot make any conclusions and further studies need to be completed.
Revised conclusion that is more concise and reflective of what the student investigated:
Music with a high tempo (150 bpm)
did not cause
heart rate and mean arterial pressure
to increase more than music with a low tempo (75 bpm)
Original conclusion that needs some work:Despite the results indicating a slight increase in time to exhaustion, statistical tests indicate that there was no statistically significant difference between the control and the caffeine group. Therefore, according to statistical tests, caffeine does not provide any additional benefits in improving time to exhaustion in cold conditions.
Revised conclusion that is more concise and reflective of what the student investigated:
Caffeine did not cause running time to exhaustion to increase in cold conditions
Original conclusion that needs some work:An increased dosage of caffeine caused an increase in cognitive performance; however, due to lack of statistical significant results, further research is warranted.
Revised conclusion that is more concise and reflective of what the student investigated:
An acute dose of 150 mg of caffeine
did not cause
cognitive performance
to improve more than an acute dose of 50 mg of caffeine
Original conclusion that needs some work:There were no statistically significant results, although a trend was observed with caffeine having a positive effect on cognitive performance.
Revised conclusion that is more concise, although more information could have been included to better reflect the experimental conditions:
Caffeine did not cause cognitive performance to improve
Now, let’s design your experiment …

2 Designing for discovery 35
2
2.2 Designing an experiment to test your hypothesis
Now that you have your independent and dependent variables, an idea of your experimental conditions, and a hypothesis and aim, it’s time to design your experiment.
Control group experimental design
• In a control group experimental design, the participants are divided into 2 groups, one of which is
designated the control and the other the treatment group.
Before you begin your physiology experiment, you will need to create groups. If the purpose of your study is to investigate the differences between, or the influence of an independent variable on, distinct populations – for example, males and females – this task will be simple. You would simply place the males into one group and the females into the other group.
If your study is not investigating distinct populations, and the purpose of your study is to investigate the effect of an intervention that may have permanent or long-lasting effects, or the experiments will be terminal for animal subjects (eg mice or rat study where animals are sacrificed to harvest organs and tissues for analysis), you will have to be a bit more thoughtful. In this situation, you will create 2 groups: a control group and a treatment group.
A key feature of this type of experimental design is that the groups contain different individual animal subjects or human participants.
Control groupThis group of animal subjects or human participants is treated identically to the treatment group, except the participants do not receive or experience the independent variable of interest.
Treatment groupThis group of animal subjects or human participants is exposed to the independent variable of interest – for example, chronic drug treatment or participation in a long-term exercise program.
A simple ‘before and after’ comparison on the same set of individuals is not valid, because it does not control for extraneous time-dependent variables (eg developmental age and learning).
In a control group experimental design, you would typically only have 1 control group. But you could have 1 or more treatment groups, depending on the specifics of your study.
Creating control and treatment groups
Random assignmentIf you have large sample sizes, or if the groups of animal subjects or human participants are very similar, you can randomly assign the animals or humans to the control and treatment groups.
For example, when inbred strains of rat of a particular sex and age are being studied, the animals are so similar – genetically and physiologically – that random assignment to treatment groups is highly unlikely to produce groups with systematic differences. Systematic
differences can introduce extraneous variables that interfere with the results of your experiment (see the next section).
Extraneous variablesAn extraneous variable is an unwanted variable that is not the independent variable of interest, but influences the outcome of – and therefore adds error to – an experiment.3 A major goal in research design is to decrease or control the influence of extraneous variables as much as possible. If you randomly allocate animal subjects or human participants that are very different to your control and treatment groups, you may find that these differences influence the outcome of your experiment (see Box 2.1).
Balanced groupsIf you don’t have large sample sizes, or your animal subjects or human participants are quite different, you should create balanced groups. Creating balanced groups will minimise or eliminate the effect of variables other than the ones you are investigating – that is, your independent variables.
• Balanced groups are experimental groups with no obvious differences.
To create balanced groups, baseline measurements are taken and used to create groups with no obvious differences. This may be simple, such as equally assigning male and female subjects or participants to each group (Figure 2.3). You may use measurements such as the mean body mass index, grade point average, short-term
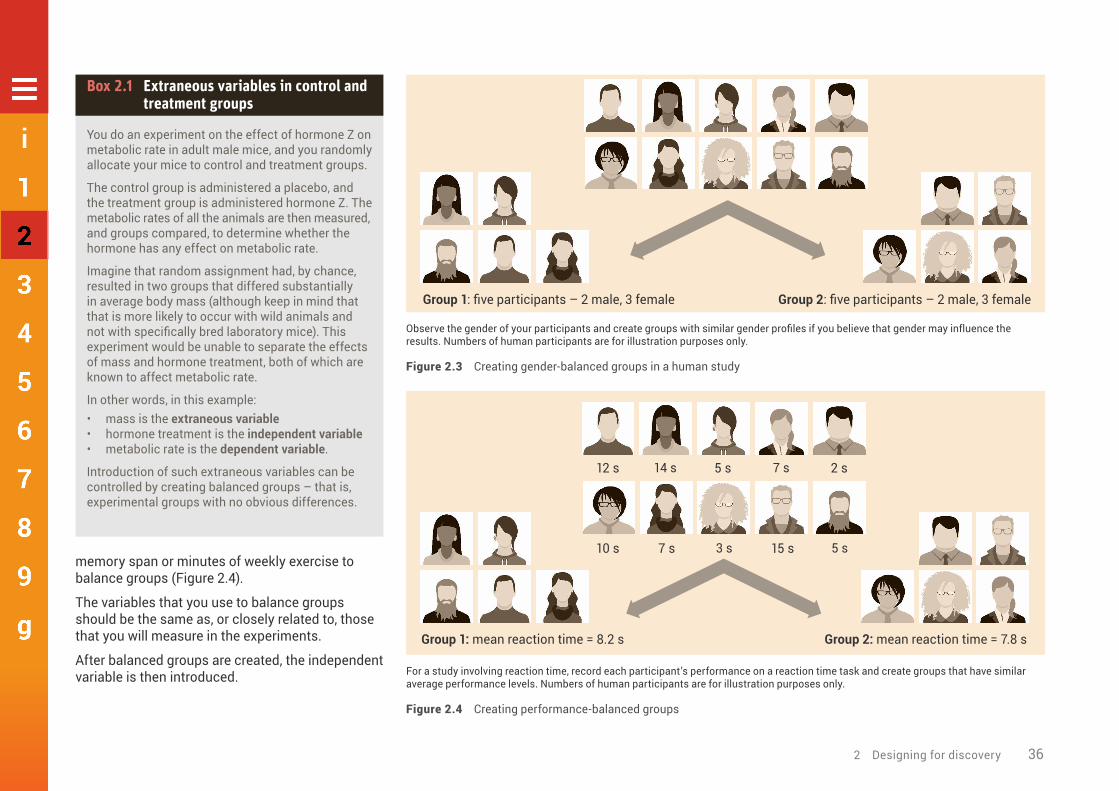
2 Designing for discovery 36
2
memory span or minutes of weekly exercise to balance groups (Figure 2.4).
The variables that you use to balance groups should be the same as, or closely related to, those that you will measure in the experiments.
After balanced groups are created, the independent variable is then introduced.
Group 2: five participants – 2 male, 3 femaleGroup 1: five participants – 2 male, 3 female
Observe the gender of your participants and create groups with similar gender profiles if you believe that gender may influence the results. Numbers of human participants are for illustration purposes only.
Figure2.3 Creating gender-balanced groups in a human study
Group 2: mean reaction time = 7.8 sGroup 1: mean reaction time = 8.2 s
12 s
10 s
14 s
7 s
5 s
3 s
7 s
15 s
2 s
5 s
For a study involving reaction time, record each participant’s performance on a reaction time task and create groups that have similar average performance levels. Numbers of human participants are for illustration purposes only.
Figure2.4 Creating performance-balanced groups
Box 2.1 Extraneous variables in control and treatment groups
You do an experiment on the effect of hormone Z on metabolic rate in adult male mice, and you randomly allocate your mice to control and treatment groups.
The control group is administered a placebo, and the treatment group is administered hormone Z. The metabolic rates of all the animals are then measured, and groups compared, to determine whether the hormone has any effect on metabolic rate.
Imagine that random assignment had, by chance, resulted in two groups that differed substantially in average body mass (although keep in mind that that is more likely to occur with wild animals and not with specifically bred laboratory mice). This experiment would be unable to separate the effects of mass and hormone treatment, both of which are known to affect metabolic rate.
In other words, in this example:• mass is the extraneous variable• hormone treatment is the independent variable• metabolic rate is the dependent variable.
Introduction of such extraneous variables can be controlled by creating balanced groups – that is, experimental groups with no obvious differences.

2 Designing for discovery 37
2
Treatment order control/crossover experimental design
• In a treatment order control/crossover experimental design, each participant is measured
under the control and experimental treatment conditions, with one-half of the participants experiencing the conditions in reverse order.
You should use a treatment order control experimental design, also known as a crossover experimental design, for some types of experiments – for example, if you are investigating the effects of a treatment that only causes short-term effects, and you are not studying the difference between distinct populations or using animal subjects where the experiment will be terminal for them.
In this experimental design, you will decide on your conditions – for example, the effects of an acute bout of aerobic exercise on short-term memory. Instead of having 2 separate groups – one as a control (no exercise) and the other as a treatment group (exercise), as you would for the control group experimental design – each participant is measured under the control and treatment conditions, with one-half of the participants experiencing the conditions in the reverse order.
This type of design can also have more than 1 treatment condition. In this case, animal subjects or human participants will experience all conditions, but in a different order.
The analysis for a crossover design considers only the differences between the 2 (or more) measurements (dependent variables) from each
individual. This makes it a powerful design, because it eliminates the ‘noise’ resulting from differences between individuals.4 Put more simply, each animal subject or human participant acts as their own control (Figure 2.5).
• Experimental noise is the inherent variation existing between different subjects for a variable measured
under control or treatment conditions.
It is important to note that physiological experiments that use animal subjects generally use the control group experimental design, and not
the crossover design. In animal studies, it is very common that the experiments are terminal.
PlacebosA placebo is used in research studies that investigate the effects of medicines. The treatment group receives the medicine, and the control group receives a placebo – a dummy medicine that has no therapeutic effect. An example of a dummy medicine is a sugar pill that looks identical to the real medicine. Comparing the results from both groups should indicate the effectiveness and side effects of the drug.
No exercise
No exercise
Exercise
Exercise
Session 1
Session 2
All participants will experience both conditions (no exercise and exercise) before short-term memory testing, with one-half of the participants experiencing the conditions in the reverse order. Numbers of human participants are for illustration purposes only.
Figure2.5 A crossover experimental design with 2 conditions

2 Designing for discovery 38
2
Placebos can be used in both control group experimental designs and crossover designs. However, keep in mind that the crossover experimental design would not be appropriate if:• the drug was to be taken over a long period of
time – say, years• it could cure a disease or condition• it had long-lasting effects.
Interestingly, in studies that use placebos, human participants don’t know if they are receiving the dummy medication or the real thing, and sometimes not even the researchers know. We will expand on this concept of blinding a bit later.
• Logic should tell you that the placebo will have no effect. However, a strange phenomenon
called the ‘placebo effect’ can occur, which is when people get better when they are taking the placebo. There are various hypotheses that attempt to explain this phenomenon, but the underlying mechanisms remain mysterious.
Another interesting piece of information that you may initially find odd is that placebos are also administered in animal studies.
Why would scientists do this? What’s the point if the animals are not going to be psychologically concerned with the treatment – that is, why bother if there is no placebo effect?
Well, imagine a control group experimental design study where treatment rats are injected with a drug every day for a month. Remember that the only difference between control and treatment groups
should be the independent variable – in this case, the drug.
Keep in mind that, in addition to the independent variable (the drug), the treatment animals will also receive an injection every day.
Can you determine what the placebo would be for this experiment?
If you said that the control group would also receive a daily injection, but with just the drug vehicle (the substance that the drug is dissolved or suspended in, without the drug), you’d be right.
If the placebo isn’t administered, the drug would not be the only variable that the treatment animals receive compared with the control animals. The extraneous variables introduced into the study are the injection itself and the drug vehicle, which may affect the results. For example, the injections could cause the animals stress each day, in which case the study would be investigating the effects of the drug and stress. However, if the control group received a daily injection as well, the investigators could conclude that any differences seen between the two groups were a result of the drug only.
BlindingHow much will the participants and investigators know about the details of the experiment?
• Blinding refers to hiding certain information (eg group allocation) from participants or both
participants and investigators involved in a research study.5
Blinding attempts to minimise or eliminate bias that may result if the participants or investigators know too much about the experimental conditions. As a result, those involved in the research may unconsciously change their behaviour. Investigators may observe participants differently if they know they received the experimental drug rather than the placebo – this may bias the results. Participants may respond differently if they know they received the drug and not the placebo, based on their preconceived ideas about what should happen.
• Bias is a process where the scientists doing the research or the participants of the research
influence the results, to portray a certain outcome.
Blinding is used in both control group and crossover experimental designs. The best strategy is to blind as many individuals as possible in a research study. You may choose to have a single-blind or double-blind study.
Single-blind studyIn a single-blind experiment, the investigator knows which group each individual participant is in (control or treatment) and what intervention they will receive. However, the participants do not.
Investigator Participant

2 Designing for discovery 39
2
For example, in a study investigating the effects of caffeine ingestion on endurance running performance, participants don’t know if they are taking caffeine or a placebo.
Double-blind studyIn a double-blind experiment, the individual participants and the persons administering the experiment are unaware of critical aspects of the experiment, with this information being held by a third party, and only revealed to the investigators when the study is over. A double-blind procedure is used to protect against both placebo effects and investigator bias.
Investigator Participant
For example, in a study investigating the effects of caffeine ingestion on endurance running performance, the participants and the investigators don’t know who is taking a placebo and who is taking caffeine at the time of ingestion.
Animal subjects and human participantsWhen physiologists experiment to learn more about humans, it may surprise you to hear that we often use animal subjects as well as human participants. Of the laboratory animals that we use for research, 95% are mice and rats. Laboratory
mice and rats make an ideal model to study human physiology because:• their genetic, biological and behavioural
characteristics closely resemble those of humans
• many human disease states can be replicated in these animals
• they are inexpensive, and easy to handle and house
• they have a short life span• they are almost genetically identical – apart
from sex differences – because they are usually inbred.
Genetic similarity greatly reduces the risk of introducing extraneous variables into the study, and is the reason why random assignment is an appropriate method for creating groups. Group size would typically be around 10 animals, although this may differ depending on techniques used. It is standard practice to use the same strain, sex and age of animal in any given study.
Animal studies usually have a control group experimental design, because these types of experiments are often terminal for the animals.
Human studies are not as straightforward and may vary widely – experiments may have 5–10 participants per group, and up to thousands in longitudinal analyses or meta-analyses. Reading the current literature on your topic will give you an indication of how many study participants are commonly required in your area of research.
There is likely to be much greater genetic variation among study participants, as well as differences in lifestyle factors (eg different diets and levels of exercise, and some people smoke). Because of
these differences in humans, it becomes crucial when using control group experimental designs to balance groups, to try to limit the number of extraneous variables introduced to the study.
The size of the expected effect of the phenomena you are investigating is important. If you are investigating something that is likely to have a small effect, you will need more subjects or participants than if you are studying something that is likely to have a large effect. An investigator will do a power analysis when designing their study. A power analysis is a statistical approach used to determine the minimum number of subjects or participants required to reasonably expect to detect an effect of a given size.
2.3 Examples of experimental design in human physiology
The following sections are examples of human participant studies using different experimental designs. To determine if there are significant differences between your 2 groups after collecting the data (datasets), you will need to do a statistical analysis. The experimental design that you choose will determine which statistical test you should use.
Chapter 3 tells you how to do these statistical analyses. The flowchart on page 48 will help you to select the best experimental design for your study.

2 Designing for discovery 40
2
Control group experimental design
Two experimental groups
Example of a study of animal subjects using control group experimental designAn example of a control group experimental design is shown in Figure 2.6.
AimTo determine the effect of an immunosuppressive drug (independent variable) on blood vessel function (dependent variable).
ExperimentA group of animals is randomly assigned to either a control or a treatment group, with each group containing equal numbers. All animals are housed under the same conditions, but the treatment group animals receive the drug and the control group receives a placebo.
Same housing conditions
Same diets
Immunosuppressive drugPlacebo
Control group Treatment group
Note: Numbers of animal subjects are for illustration purposes only.
Figure2.6 Example of a study using control group experimental design to determine the effect of an immunosuppressive drug on blood vessel function in animal subjects

2 Designing for discovery 41
2
Example of a study of human participants using control group experimental designAn example of a control group experimental design for human participants is shown in Figure 2.7.
AimTo investigate and determine the effect of gender on exercise performance.
ExperimentHuman participants are assigned to either a male or a female group. All participants experience the same conditions – the difference is their gender (independent variable).
For Figures 2.6 and 2.7, use an independent t-test to compare the measurements (dependent variables) from the two groups (conditions). By doing this, you will determine the effect of the independent variable on the dependent variable(s).
See page 60.
Male groupFemale group
Same diets (eg have a meal 2 h before testing, no alcohol in 24 h before testing
Same conditions (eg attend testing laboratory at 2 pm on Monday)
Task for both groups: 5-km time trial on treadmill at 5% incline
Note: Numbers of human participants are for illustration purposes only.
Figure2.7 Example of a study using control group experimental design to determine the effect of gender on aerobic running exercise performance in healthy active human participants

2 Designing for discovery 42
2
More than 2 experimental groups
Example of a study of animal subjects using control group experimental designAn example of a control group experimental design with more than 2 experimental groups is shown in Figure 2.8.
AimTo determine the effect of chronic administration of 2 doses (moderate and high) of growth hormone (independent variable) on muscle size (dependent variable).
Experiment• The control group receives daily administration
of a placebo.• Treatment group 1 receives daily administration
of the moderate dose of growth hormone.• Treatment group 2 receives daily administration
of the high dose of growth hormone.
Same housing conditions
Same diets
Plus independent variable
Moderate dose of growth hormone
Placebo High dose of growth hormone
Control group Treatment group 2Treatment group 1
Note: Numbers of animal subjects are for illustration purposes only.
Figure2.8 Example of a study using control group experimental design to determine the effect of a moderate dose of growth hormone and a high dose of growth hormone on muscle mass in animal subjects

2 Designing for discovery 43
2
Example of a study of human participants using control group experimental designAn example of a control group experimental design with more than 2 experimental groups is shown in Figure 2.9.
AimTo determine the effect of different amounts of touch-typing practice (independent variable) on touch-typing skill development (dependent variable).
ExperimentIn this case, a crossover design would be inappropriate. Because of the learning effect of the treatment, an extraneous variable is introduced.
For Figures 2.8 and 2.9, use a one-factor analysis of variance (ANOVA) independent samples test to compare the measurements (dependent variables) made in the 3 or more groups. By doing this, you will determine the effect of the independent variable on the dependent variable.
If the ANOVA reveals statistical significance between the groups, do a post hoc test to determine where the statistically significant differences exist (eg in Figures 2.8 and 2.9, there could be significant differences in the dependent variable between the control and treatment group 1, the control and treatment group 2, and/or treatment groups 1 and 2).
See page 66.Note: Numbers of human participants are for illustration purposes only.
Figure2.9 Example of a study using control group experimental design to determine the effect of moderate practice and high practice on development of touch-typing skill in human participants who have never learnt to touch type
Same diets (eg have a meal 2 h before testing, no alcohol in 24 h before testing)
Same conditions (eg attend testing laboratory at 2 pm on Monday)
Task:
Control group Treatment group 2Treatment group 1
No practice Practice touch-typing for 1 h every second day
(moderate practice)
Practice touch-typing for 1 h every day (high practice)

2 Designing for discovery 44
2
Treatment order control/crossover experimental design
Two experimental groups
Example of a study of human participants using treatment order control/crossover experimental designAn example of a crossover experimental design is shown in Figure 2.10.
AimTo determine the effect of caffeine on cognitive performance.
ExperimentA group of participants have their cognitive performance measured after consuming either caffeine or a placebo on 2 test days, separated by at least 7 days.
Caffeine is usually eliminated from the body in under 2 days, so there would not be a carryover effect of caffeine in group 2 participants 1 week after initial testing when the second session of testing occurs.
Use a paired t-test to compare the measurements obtained in the two conditions.
To determine the effect of the independent variable, combine the data (dependent variable) from groups 1 and 2 for each condition, and do a paired t-test.
See page 60.
Group 1
Session 2
Session 1
Group 2
Control condition: placebo
Control condition: placebo
Treatment condition: caffeine
Treatment condition: caffeine
Note: Numbers of human participants are for illustration purposes only.
Figure2.10 Example of a study using treatment order control/crossover experimental design to determine the effect of caffeine on cognitive function in human participants

2 Designing for discovery 45
2
More than 2 experimental groups
Example of a study of human participants using treatment order control/crossover experimental designAn example of a treatment order control/crossover experimental design with more than 2 experimental conditions is shown in Figure 2.11.
AimTo determine the effect of moderate and high doses of caffeine (independent variable) on the time it takes to complete a 5-km running trial (dependent variable).
ExperimentIn this example, participants have their running performance measured after consuming either moderate- or high-dose caffeine, or placebo, on 3 test days, with testing separated by at least 7 days.
Caffeine is eliminated from the body in less than 2 days, so there would not be a carryover effect 1 week after testing.
Use a one-factor analysis of variance (ANOVA) correlated samples test to compare the measurements (dependent variables) when there are at least 3 conditions. To determine the effect of the independent variable, combine the data (dependent variable) from all groups for each condition.
If the ANOVA reveals statistical significance between the groups, do a post hoc test to determine where the statistically significant differences exist (eg in Figure 2.11, there could be significant differences in the dependent variable between the control and treatment level 1, the control and treatment level 2, and/or treatment levels 1 and 2).
See page 66.
Group 1
Session 2
Session 1
Session 3
Group 3Group 2
Control condition: placebo
Control condition: placebo
Treatment condition: moderate dose
Treatment condition: moderate dose
Control condition: placebo
Treatment condition: moderate dose
Treatment condition: high dose
Treatment condition: high dose
Treatment condition: high dose
Note: Numbers of human participants are for illustration purposes only.
Figure2.11 Example of a study using treatment order control/crossover experimental design to determine the effects of moderate and high doses of caffeine on endurance running performance in human participants

2 Designing for discovery 46
2
Investigating the effect of multiple independent variablesA more complex experiment could test the effect of multiple independent variables, such as time (pre-test and post-test) and drug (placebo and drug).
Example of a study of human participants using control group experimental design where more than 2 independent variables are introducedAn example of this experimental design is shown in Figure 2.12, where the aim of the study is to investigate the effect of diet and exercise intervention on the cardiovascular disease risk profile in humans who have suffered a cardiovascular event. The 2 independent variables are the exercise program and the diet.
Long-term and ongoing adoption of the diet exercise program rules out the possibility of using a crossover design.
Use a 2-factor analysis of variance (ANOVA) independent measures test to compare the measurements (dependent variables) made in the 3 or more conditions. By doing this, you will determine the effects of the independent variables on the dependent variable.
When this study design is used, it is possible to find main effects and interaction effects. Main effects are significant differences in dependent variables caused by the independent variables. In this example, this means effects of diet or exercise on their own. Interaction effects are significant effects that result when independent variables are combined – in this example, this means effects of diet and exercise together.
When the ANOVA finds significant main effects of one or more factors (independent variables), do a post hoc analysis to determine which differences are significant.
See Chapter 3.
Control group Exercise only group Diet only group Exercise + diet group
No Mediterranean dietNo exercise program
No Mediterranean dietExercise program
Mediterranean dietNo exercise program
Mediterranean dietExercise program
Note: Numbers of human participants are for illustration purposes only.
Figure2.12 Example of a study using control group experimental design to investigate the effect of diet and exercise intervention on the cardiovascular disease risk profile in humans who have suffered a cardiovascular event

2 Designing for discovery 47
2
Example of a study of human participants using treatment order control/crossover experimental design where more than 2 independent variables are introduced
An example of a study of experimental design An example of this experimental design is shown in Figure 2.13.
AimTo determine the effect of an acute bout of exercise alone, and exercise plus an acute dose of caffeine, on short-term memory function in humans.
ExperimentThe 2 independent variables are exercise and caffeine. The short-term effect of caffeine allows us to use a crossover design. The participants and investigators can be blinded to caffeine, but not to exercise.
Use a 2-factor analysis of variance (ANOVA) repeated measures test to compare the measurements (dependent variables) when there are at least 2 independent variables. To determine the effects of the independent variables, combine all data (dependent variable) from all groups for each condition.
When this study design is used, it is possible to find main effects and interaction effects. Main effects are significant differences in dependent variables caused by the independent variables. In this example, this means the effects of caffeine or exercise on their own. Interaction effects are significant effects that result when independent variables are combined – in this example, this means the effects of caffeine and exercise together.
Group 1 Group 2 Group 3 Group 4
No caffeine (placebo)No exercise
No caffeine (placebo)Exercise
CaffeineNo exercise
CaffeineExercise
CaffeineExercise
No caffeine (placebo)No exercise
No caffeine (placebo)Exercise
CaffeineNo exercise
CaffeineNo exercise
CaffeineExercise
No caffeine (placebo)No exercise
No caffeine (placebo)Exercise
No caffeine (placebo)Exercise
CaffeineNo exercise
CaffeineExercise
No caffeine (placebo)No exercise
Session 1
Session 2
Session 3
Session 4
Note: Numbers of human participants are for illustration purposes only.
Figure2.13 Example of a study using treatment order control/crossover experimental design to determine the effects of caffeine and exercise on short-term memory in human participants

2 Designing for discovery 48
2
When the ANOVA finds significant main effects of one or more factors (independent variables), do a post hoc analysis to determine which differences are significant.
See Chapter 3.
All of this can be a bit overwhelming; the flowchart in Figure 2.14 summarises how to decide which experimental design and statistical analysis to use.
References1 National Health and Medical Research Council,
Australian Research Council & Australian Vice-Chancellors’ Committee 2015, National statement on ethical conduct in human research 2007, updated May 2015, National Health and Medical Research Council, Canberra.
2 Higher Education Funding Council for England, Scottish Higher Education Funding Council, Higher Education Funding Council for Wales & Department for Employment and Learning 2005, RAE 2008 (Research Assessment Exercise): guidance to panels, United Kingdom, <www.rae.ac.uk/pubs/2005/01/rae0105.pdf>.
3 Hall, R 1998, Extraneous and Confounding Variables and Systematic vs Non-systematic Error, viewed 13 January, <https://web.mst.edu/~psyworld/extraneous.htm>.
4 Hiebert, SM 2007, ‘Teaching simple experimental design to undergraduates: do your students understand the basics?’ Advances in Physiology Education, vol. 31, no. 1, pp. 82–92.
5 Karanicolas, PJ, Farrokhyar, F & Bhandari, M, 2010, ‘Blinding: who, what, when, why, how?’ Canadian Journal of Surgery, vol. 53, no. 5, pp. 345–348.

2 Designing for discovery 49
2
What are you
investigating?
How many
experimental groups do you
have?
How many
conditions are you testing?
• Differences between separate groups
• Effects of an independent variable that may cause permanent changes or very long-term effects
• Experiment that may be terminal for animal subjects
Use control group experimental design: each subject or participant will only experience one condition
Two
• Create balanced groups if the study population has variation in terms of the dependent variable
• Use an independent t-test to analyse your results
Two
• All participants will experience the same experimental conditions, but half in reverse order
• Use a paired t-test to analyse your results
• Create balanced groups if the study population has variation in terms of the dependent variable
• Use a 1-factor independent samples ANOVA to analyse your results
Three or more
Three or more
• All participants will experience the same experimental conditions, but in different order
• Use a 1-factor correlated samples ANOVA to analyse your results
Use treatment order control/crossover experimental design: each subject or participant will experience all conditions
For example:• elderly versus
young• males versus
females• drug that cures
a disease, a learning effect, physiological adaptation to chronic endurance exercise training
• mice and rat study where animals are sacrificed to harvest organs and tissues for analysis
For example:• males and
females, or • untrained and
trained
For example:• placebo and
100 mg caffeine
For example:• placebo, 100 mg
caffeine and 200 mg caffeine
For example:• placebo, low-dose
drug that has long-term effects and high-dose drug that has long-term effects; or
• no fine-motor practice, low-volume fine-motor practice and high-volume fine-motor practice
• Effects of an independent variable that causes short-term effects
Start
Figure2.14 How to choose the right experimental design

Photo: Science Photo Library
Chapter 3: Performing statistical analyses

3 Performing statistical analyses 51
3
3 Performing statistical analyses
I n this chapter, we explain some of the basic statistical analyses student scientists will do – many
of which were referred to in Chapter 2 when you learned about designing experiments. This chapter also provides instructions for doing these tests using Microsoft Excel software and the VassarStats website.Statistics has entered almost every aspect of human endeavour. We can use it for better planning, more efficient delivery of services and increased productivity. Although statistics is a rewarding career choice, most of us will not specialise in this field.
It is, however, important to improve statistical literacy among scientists, journalists, doctors, patients and the community at large, so we can make informed decisions in the face of uncertainty.
• Statistics is the science that deals with the collection, analysis and interpretation of
numerical data.
In scientific research, statistical analyses are used to help us determine whether datasets are different from each other. When statistical
analysis determines that datasets are different, we refer to the datasets as ‘statistically different’, or the difference as ‘statistically significant’ or say that there is ‘a significant difference’.
When statistical analysis reveals that datasets are not different, we say that there is ‘no significant difference’ between groups.
3.1 Statistics as part of everyday life
Cholera map made by John Snow in 1854The locations of reported cases of cholera are shown in Figure 3.1. Presentation of the data collected on the number of cases and where they occurred was very useful in understanding the spread of the disease and contributing to prevention.
Sporting performanceFigure 3.2 summarises the test bowling statistics of cricketer Imran Khan, including the number of runs conceded each innings, wickets taken each innings and bowling average. Collecting so much information in one figure, combining raw data and averages, is a very economical way to summarise a sportsperson’s career.
Source: ‘Snow-cholera-map-1’ by John Snow, used under CC0 1.0
Figure3.1 Cases of cholera in London in 1854
Source: ‘Imran Khans bowling statistic’ by Masai 162, used under CC0 1.0
Figure3.2 Test bowling career statistics for Imran Khan

3 Performing statistical analyses 52
3
Health of the populationThe bar graph in Figure 3.3 presents the percentage of the population in 41 countries aged 60 years and over who have dementia. This figure provides the reader with details of the percentage of the population diagnosed with dementia, at the same time allowing a comparison of the percentages across a number of countries.
Source: ‘Oecd-dementia’ by Yuasan, used under CC0 1.01
Figure3.3 Prevalence of dementia among people aged 60 years and over
3.2 Setting up Excel for statistical analysisYou may need to make some changes to your Excel setup to gain access to the Data Analysis tool that we will use throughout this chapter.
Note that the screenshots in this section are from Microsoft Office Professional Plus 2013; if you are using a different version, your screen may look slightly different.
1. Open a new Excel file and click on the ‘Data’ tab.
2. Check that there is a ‘Data Analysis’ icon on the far right of the Data tab; if the ‘Data Analysis’ tab is not visible, complete steps 3–5 below.

3 Performing statistical analyses 53
3
3. Click on ‘File’, then ‘Options’.
4. Click on ‘General’, then ‘Add-Ins’.5. Select ‘Manage. Excel Add-ins’ and click ‘Go’.
6. Check the boxes next to ‘Analysis ToolPak’ and ‘Analysis ToolPak – VBA’ and then click ‘OK’.
3.3 Calculating descriptive statistics using Excel
• Descriptive statistics are obtained to provide a simple summary of a dataset. Common summary values obtained are mean (the average value of a set of numbers), such as a geometric
mean or an arithmetic mean; and standard deviation – a statistic used as a measure of the dispersion or variation in a distribution (ie how much the data points differ from the mean).
1. Open a given dataset in an Excel spreadsheet.

3 Performing statistical analyses 54
3
2. Click on the ‘Data’ tab and select the ‘Data Analysis’ tool (if this doesn’t appear on your toolbar, follow the instructions in Section 3.2, ‘Setting up Excel for statistical analysis’).
3. In the box that pops up, select ‘Descriptive Statistics’ and then click ‘OK’.
4. The following window will appear.

3 Performing statistical analyses 55
3
5. To enter the relevant information into the ‘Input Range’ field, click in the ‘Input Range’ field and drag the cursor over the relevant cells (cells A1–A11 in the example).Because you highlighted the column description (cell A1 in the example), check the box next to ‘Labels in First Row’.
Select the box next to ‘Summary Statistics’.
Select the button next to ‘Output Range’ and then click in the field to the right. Click the cursor in the cell in the spreadsheet where you would like the descriptive statistics to appear. The example below shows the output cell to be A14.
6. Click ‘OK’, and the descriptive statistics will be calculated; the result is shown below with important information highlighted.

3 Performing statistical analyses 56
3
3.4 Manually calculating mean and standard deviation in Excel
1. Enter data into your spreadsheet, using meaningful column and row labels. Generally, mean data will be used in graphs and tables; a quick way to calculate means, and standard deviations, is shown below.
2. Select the cell in which you want the mean to appear.
3. Select the ‘Formulas’ tab and click on the ‘AutoSum’ drop-down button; select ‘Average’.

3 Performing statistical analyses 57
3
4. A range of cells will automatically appear, as shown below; make sure the correct cells are selected; if so, hit ‘Enter’ on your keyboard.
5. The mean will now appear in the cell you selected, as shown below. You could repeat these steps for each column OR you could continue on to the next step, which will save you a lot of time!
6. Select the cell in which you want the standard deviation to appear.
7. Select the ‘Formulas’ tab and click on the ‘AutoSum’ drop-down button; select ‘More Functions’.

3 Performing statistical analyses 58
3
8. The following dialog box will appear. 9. In the search box, type in ‘Standard Deviation’ (the search is not case sensitive, so you can also enter ‘standard deviation’) and click ‘Go’; select the function highlighted below and then click ‘OK’.

3 Performing statistical analyses 59
3
10. A new dialogue box will appear. Click in the ‘Number1’ field and then select the data you want to use to calculate standard deviation; click ‘OK’.
11. The standard deviation will now be entered into your spreadsheet.
12. Select the mean and standard deviation that you have just calculated.

3 Performing statistical analyses 60
3
13. Position the cursor at the bottom right edge of the box you have created; a ‘+’ should appear.
14. When the ‘+’ appears, hold down the mouse button and drag across the cells where you want the mean and standard deviation to be calculated.
15. When you release the mouse button, you should have means and standard deviations for the remaining columns.
Now that you have all of the data you need, you can create a graph or a table. (See Chapter 4.)

3 Performing statistical analyses 61
3
3.5 The p value
• In scientific research, we refer to the p value to determine if there is a statistical difference (significant difference) between datasets.
Traditionally, in scientific research, a p value of less than 0.05 is considered significant (mean values are different). A p value of 0.05 means that there is a 95% likelihood that the difference between the means is because of the experimental conditions and not chance. In other words, there is only a 5% likelihood that the difference between the means is because of chance, and not the treatment.
• This video explains what a p value tells us. There are different types of statistical tests used to determine the p value, depending on the type of data you have.
1- and 2-tailed testsWhen you use Excel (and most other statistics software) for statistical tests, you will see 2 p values in the outputs: one for a 1-tailed test, and the other for a 2-tailed test; the values will be different.
• A 2-tailed test, also known as a nondirectional hypothesis, is the standard test of significance to determine if there is a relationship between variables in either direction.
A 1-tailed test, also known as a directional hypothesis, is a test of significance to determine if there is a relationship between the variables in 1 direction. A 1-tailed test is useful if you have a good idea, usually based on your knowledge of the subject, of the direction of the difference that exists between variables. This makes our statistics more sensitive and able to detect more subtle differences. Unless you can justify why you are using a 1-tailed test, it is recommended that you use a 2-tailed test.
Calculating the p value using an independent t-test in ExcelThis statistical hypothesis test is used to determine whether there is a statistically significant difference between the means in 2 unrelated groups (eg females and males).
1. Organise the data in an Excel spreadsheet in 2 columns.

3 Performing statistical analyses 62
3
2. Open the ‘Data’ tab and select ‘Data Analysis’ (if this doesn’t appear on your toolbar, follow the instructions in Section 3.2, ‘Setting up Excel for statistical analysis’).
3. In the box that pops up, select the independent t-test option (t-test: Two-Sample Assuming Equal Variances), then click ‘OK’.
4. The following window will appear.
5. To enter the relevant information into the ‘Variable 1 Range’ field, click in the ‘Variable 1 Range’ cell and drag the cursor across the relevant cells (cells A1–A11 in the example).

3 Performing statistical analyses 63
3
6. To enter the relevant information into the ‘Variable 2 Range’ cell, click in the ‘Variable 2 Range’ cell and drag the cursor across the relevant cells (cells B1–B11 in the example).
7. Enter zero in the ‘Hypothesized Mean Difference’ field and check the box next to ‘Labels’.
8. Select the button next to ‘Output Range’ and then click in the field to the right. Click in any cell on the Excel spreadsheet; this will determine where the output (information) for the statistical test appears. The example below shows the output cell to be A14.
Click ‘OK’, and the t-test will be calculated.

3 Performing statistical analyses 64
3
9. The t-test result is shown below with important information highlighted: means for each variable, and the p values for the 1-tailed and 2-tailed tests.
Calculating the p value using a paired t-test in ExcelThis statistical hypothesis test is used to determine whether there is a statistically significant difference between the means in 2 related groups (eg control and treatment measures in a group of participants in an experiment using a crossover design).
1. Organise the data in an Excel spreadsheet. Use a different row for each participant.

3 Performing statistical analyses 65
3
2. Open the ‘Data’ tab and select ‘Data Analysis’ (if this doesn’t appear on your toolbar, follow the instructions in Section 3.2, ‘Setting up Excel for statistical analysis’).
3. In the box that pops up, select the paired t-test option (t-Test: Paired Two Sample for Means), then click ‘OK’.
4. The following window will appear.
5. To enter the relevant information into the ‘Variable 1 Range’ field, click in the ‘Variable 1 Range’ field and drag the cursor across the relevant cells (cells A1–A11 in the example).

3 Performing statistical analyses 66
3
6. To enter the relevant information into the ‘Variable 2 Range’ cell, click in the ‘Variable 2 Range’ field and drag the cursor across the relevant cells (cells B1–B11 in the example).
7. Enter zero in the ‘Hypothesized Mean Difference’ cell and check the box next to ‘Labels’.
8. Select the button next to ‘Output Range’ and then click in the field to the right. Click in any cell on the Excel spreadsheet; this will determine where the output (information) for the statistical test appears. The example below shows the output cell to be A14.
Click ‘OK’, and the t-test will be calculated.

3 Performing statistical analyses 67
3
9. The t-test result is shown below with important information highlighted: means for each variable, and the p values for the 1-tailed and 2-tailed tests.
Calculating the p value using a 1-factor analysis of variance (ANOVA) The 1-factor analysis of variance (ANOVA) test is used to determine whether there is a statistically significant difference between the means of 3 or more groups. The groups may be independent or unrelated, or they may be related.
Unrelated groups are made up of separate groups where a given participant will only experience 1 condition in a control group experimental design (eg children, adults, older people).
Related groups are made up of the same participants, with each participant experiencing all conditions, as would occur in a crossover experimental design (eg placebo, acute low-dose caffeine, acute high-dose caffeine).
In Excel, the same test is used to determine if there are significant differences between groups. It doesn’t matter if the groups are independent or related. (But note that this is not the case with all analytic tools.)
1. Organise the data in an Excel spreadsheet. Use a different row for each participant if data is from related groups.

3 Performing statistical analyses 68
3
2. Open the ‘Data’ tab and select ‘Data Analysis’ (if this doesn’t appear on your toolbar, follow the instructions in Section 3.2, ‘Setting up Excel for statistical analysis’).
3. In the box that pops up, select the ‘ANOVA: Single Factor’ test option, then click ‘OK’.

3 Performing statistical analyses 69
3
4. The following window will appear. 5. To enter the relevant information into the ‘Input Range’ field, click in the ‘Input Range’ field and drag the cursor across the entire dataset (cells A1–A11, B1–B11 and C1–C11 in the example).

3 Performing statistical analyses 70
3
6. If your data are organised as in the example (each dataset in a different column), select the ‘Columns’ button in the ‘Grouped By’ option.
Check the box next to ‘Labels in First Row’.
Select the button next to ‘Output Range’ and then click in the field to the right. Click in any cell on the Excel spreadsheet; this will determine where the output (information) for the statistical test appears. The example below shows the output cell to be A14.
Click ‘OK’, and the ANOVA will be calculated.
7. The ANOVA result is shown below with important information highlighted: means for each variable, and the p values for the between-groups comparison.
To determine which datasets are statistically different from each other, use independent t-tests (using the instructions shown previously) to compare variable 1 and variable 2, variable 2 and variable 3, and variable 1 and variable 3.
This is not the ideal way to do a post hoc analysis, but is the simplest way to do it using Excel. We suggest using VassarStats for 1-factor ANOVA tests; go to page 73 for instructions on how to do this test on independent samples, and page 76 for instructions on how to do this test on correlated samples.

3 Performing statistical analyses 71
3
3.6 Linear correlation
When do I use a linear correlation? You may choose to use correlation when you are trying to determine whether, and how strongly, 2 variables are related (linearly). Correlations are appropriate when your data are continuous, which means that the values are not restricted to defined separate values, but can be any value across an endless range. Examples of continuous data are temperature in degrees Celsius and height in centimetres. (Note, data should be normally distributed and not contain any significant outliers if you plan to test for correlations; these factors are not addressed in this guide.)
One of the simpler correlations is called Pearson’s product-moment correlation. This test produces a correlation coefficient, r, which is the number that indicates the strength or magnitude, and the direction of the relation between the 2 variables. The correlation attempts to draw a line of best fit through the data points, and r indicates how far away the data points are from the line. There are different guidelines for interpreting the strength of the relation – one example is shown in Figure 3.4.
Generally speaking, the more the relation between the 2 variables looks like a straight line, the closer r gets to 1.0 or –1.0. If r is positive, you have a direct or increasing relation between variables, and, if r is negative, you have an inverse or decreasing relation between variables (Figure 3.5 in Research case study).
Remember that correlation does not indicate causation. Finding a correlation between 2 data points does not mean that one caused the other. Box 3.1 gives a more detailed explanation of this.
r = 0.8–1.0 is a verystrong relation
r = 0.6–0.8is a strong relation
r = 0.4–0.6is a moderate relation
r = 0.2–0.4is a weak relation
r = 0.0–0.2is a weak or no relation
Figure3.4 How to interpret the size of a correlation
Box 3.1 Difference between correlation and causation
A physiological example of the difference between correlation and causation can be seen in heart disease studies.
Correlation studies2-7
Many epidemiologic studies show inverse associations between antioxidant intake and the incidence of atherosclerosis. In other words, high antioxidant intake is related to low incidences of atherosclerosis. Because the epidemiologic data only show a correlation, however, it would be incorrect to say that ‘low antioxidant intake causes atherosclerosis’, based on these studies.
Similarly, a number of early studies showed that low concentrations of blood antioxidants were associated with an increased risk of adverse cardiac events. In other words, there was an inverse correlation between blood antioxidants and adverse cardiac events. Because correlation does not indicate causation, the authors of this group of studies could not conclude that low blood antioxidants caused adverse cardiac events, or vice versa.
Cause-and-effect studies8-18
Follow-up studies went further than looking for correlation between these variables. Experiments were designed to determine the effect of antioxidant supplementation on atherosclerosis and adverse cardiac events. To determine cause and effect, groups of investigators designed randomised controlled trials (RCTs) where 1 group of human participants received long-term antioxidant supplementation, and the other group received a placebo.
Overall, these studies have shown conflicting findings, with some studies showing that antioxidant supplementation reduced atherosclerosis and adverse cardiac events, and other studies showed no effect. The exact reasons for the contradictory findings observed in the RCTs are not known, although it has been suggested that differences in the study populations, supplements administered and outcome measures may explain the variability.
A key point that you should take from this example is that these later experiments were specifically designed to determine if cause and effect exists. In this case, it would be incorrect to talk about associations or correlations between antioxidant intake and atherosclerosis and adverse cardiac events.
• Correlation is a statistical approach to determining if and how well 2 variables are related to each other.

3 Performing statistical analyses 72
3
Testing for a correlation using ExcelWe will look at the steps to follow for a correlation using the example of investigating whether time spent exercising per week was associated with performance on physiology exams.
1. First, use Excel or other graphing software to create a simple scatterplot and see if there is any sign of a linear relation.
Enter your data into two columns in Excel.
Research case study: Example of correlation analysis
Wisløff and colleagues2 investigated whether maximal strength was related to sprint performance in elite male soccer players. The first variable, maximal strength, was the maximum load the participants could lift in half squats (1 repetition maximum, in kilograms). The second variable, sprint performance, was time taken to sprint 10 m (10-m sprint, in seconds). The scatter plot revealed a direct linear relation and this was supported by the correlation coefficient and the p value: r = 0.94, p < 0.001. According to the r value, the direct linear relation was very strong (see Figure 3.5). The investigators concluded that maximal strength in half squats was associated with sprint performance – participants with high strength ran 10 m faster than participants with low strength.
Perfect direct or increasing linear correlationr = +1.0Very rare/ almost impossible
Direct or increasing linear correlation
Nonlinear correlation
No correlation
Perfect inverse or decreasing linear correlationr = –1.0Very rare/almost impossible
Inverse or decreasing linear correlation
Figure3.5 Possible associations between 2 variables

3 Performing statistical analyses 73
3
2. Highlight the columns. Choose the ‘Insert' tab and, in the drop-down menu in the ‘Charts’ area, select ‘Scatter plot’. Click ‘OK’.
A scatter plot will be added to the spreadsheet.
3. If your scatter plot reveals what looks like a linear relation, you can use Excel to find out what the correlation coefficient or r value is.
Label a cell with r. Next to this cell, enter the formula for calculating r = correl(array1, array2)
where array1 is the data in column 1 and array2 is the data in column 2.
4. Hit ‘Enter’ and the r value will be calculated.

3 Performing statistical analyses 74
3
Reporting the results of the correlationIf you did not test the significance, then:
r(df) = [Pearson coefficient]
where df = total number of observations or data points – 1
Using the example above, r(9) = 0.87
If you did test the significance, then:
r(df) = [Pearson coefficient], p = [p value]
Using the example above, r(9) = –0.87, p = 0.001
Excel will not easily test the significance of a correlation; however, if you are using more powerful statistical software (or VassarStats), you will obtain a p value that you can interpret as previously discussed. See pages 79–80 for instructions on how to do a correlation analysis using VassarStats.
When describing and discussing your data, you can refer to the strength of the relation between the variables using the wording shown in Figure 3.4; the direction will be determined by whether r is positive or negative.
In this example:A very strong direct relation was observed between time spent exercising per week and performance on a physiology exam.
Remember, you cannot conclude that long periods of time spent exercising caused high performance on a physiology exam, or vice versa, just that these variables are associated with each other.
3.7 VassarStatsVassarStats is a free web-based program that you can use for statistical analysis. We recommend using this program for 1-factor ANOVA, 2-factor ANOVA and linear correlations. Unlike Excel, VassarStats allows you to do post hoc tests after your ANOVA and to determine the statistical significance of linear correlations. The website is simple to use, and steps you through each phase of the test.
Use VassarStats to calculate ANOVA and linear correlations.
If you use VassarStats for 1-factor ANOVA tests, use the following:• independent group comparison: One-factor ANOVA Independent Samples
test• related group comparison: One-factor ANOVA Correlated Samples test.
The designers of this site suggest using the following web browsers: Firefox, Safari and Chrome. Note that Internet Explorer is not recommended.
Below are instructions for using VassarStats for the following tests:• 1-factor ANOVA independent samples test• 1-factor ANOVA correlated samples test• linear regression.
Calculating the p value using a 1-factor analysis of variance (ANOVA) independent samples testThis statistical hypothesis test can be used to determine whether there is a statistically significant difference between the means of 3 or more groups when the groups are independent or unrelated.
Unrelated groups are made up of separate groups where a given participant will only experience 1 condition in a control group experimental design – for example, children, adults and older participants.
All screenshots in this section are used with permission from the copyright owner, Richard Lowry.

3 Performing statistical analyses 75
3
1. Access the VassarStats homepage and select ‘ANOVA’ from the menu.
2. Select the link to ‘One-Way ANOVA’.
3. The ‘One-Way ANOVA’ window will appear. The ‘Procedure’ section provides instructions to help you enter your data correctly.
Scroll down to ‘Setup’.

3 Performing statistical analyses 76
3
4. Enter the number of samples you have for analysis (must be 3 or more) and click the ‘Independent Samples’ button.
5. You can now enter your data – 1 column for each dataset. Make sure that you don’t leave a blank row at the bottom of the entered data. Once your data have been added, click the ‘Calculate’ button.
6. The ‘Data Summary’ will appear. You will see descriptive statistics for each of your datasets and the p value.Firstly, check to see if the ANOVA is significant by looking at the p value. In this example, p < 0.05, so we know there is a significant difference because of the independent variable, but we don’t know where.
To find out which datasets are different, VassarStats has conducted a post hoc test called the Tukey HSD Test. In this example, it shows that the significant differences are between datasets (columns) 1 and 2, but not between datasets 1 and 3, or 2 and 3.

3 Performing statistical analyses 77
3
Calculating the p value using a 1-factor analysis of variance (ANOVA) correlated samples testThis statistical hypothesis test can be used to determine whether there is a statistically significant difference between the means of 3 or more groups when the groups are related.
Related groups are made up of the same participants, with each participant experiencing all conditions, as would occur in a crossover experimental design – for example, placebo, acute low-dose caffeine, acute high-dose caffeine.
All screenshots in this section are used with permission from the copyright owner, Richard Lowry.
1. Access the VassarStats homepage and select ‘ANOVA’ from the menu.

3 Performing statistical analyses 78
3
2. Select the link to ‘One-Way ANOVA’.
3. The 'One-Way ANOVA' window will appear. The ‘Procedure’ section provides instructions to help you enter your data correctly.
Scroll down to ‘Setup'.
4. Enter the number of samples you have for analysis (must be 3 or more) and click the ‘Correlated Samples’ button.

3 Performing statistical analyses 79
3
5. You can now enter your data – 1 column for each dataset and a different row for each participant.. Make sure that you don’t leave a blank row at the bottom of the entered data. Once your data have been added, click the ‘Calculate’ button.
6. The Data Summary will appear. You will see descriptive statistics for each of your datasets and the p value. Firstly, check to see if the ANOVA is significant by looking at the p value. In this example, p > 0.05, so we know there is no significant difference because of the independent variable.
If p < 0.05, to find out which datasets are different, VassarStats would conduct a post hoc test called the Tukey HSD Test.
The example on page 76 shows you what the Tukey HSD Test output looks like when the ANOVA found a significant difference.

3 Performing statistical analyses 80
3
Testing for a correlation using VassarStatsWe will now look at the steps to follow if trying to determine correlation, using the example of investigating whether time spent exercising per week was associated with performance on physiology exams in the section ‘Testing for a correlation using Excel’.
All screenshots in this section are used with permission from the copyright owner, Richard Lowry.
1. First, use Excel or other graphing software to create a simple scatter plot and see if there is any sign of a linear relation.
2. If you would like to test for a correlation, access the VassarStats homepage and select ‘Correlation & Regression’ from the menu.
3. Under the heading ‘Basic Linear Correlation and Regression’, select the option appropriate to your planned mode of data entry – either ‘Data-Import Version’ if your data are already in a spreadsheet or ‘Direct-Entry Version’ if you plan to enter your data into the provided cells.For this example, we will use the Data-Import Version.
4. You will see instructions for cutting and pasting your data for the Data-Import Version.

3 Performing statistical analyses 81
3
5. Cut and paste your data (use a different row for each participant), both columns together, into the Data Entry box. Make sure that you don’t leave a blank row at the bottom of the entered data.
6. Click the ‘Calculate’ button.
7. The Data Summary will appear. You will see the r value and the p value.See page 60 for reasons to use the 2-tailed result in this example.

3 Performing statistical analyses 82
3
References 1 Organisation for Economic Co-operation and
Development 2013. Health at a glance 2013: OECD Indicators, Organisation for Economic Co-operation and Development, Paris.
2 Blankenberg, S, Rupprecht, HJ, Bickel, C, Torzewski, M, Hafner, G, Tiret, L, Smieja, M, Cambien F, Meyer, J, Lackner, KJ & AtheroGene Investigators 2003, ‘Glutathione peroxidase 1 activity and cardiovascular events in patients with coronary artery disease’, New England Journal of Medicine, vol. 349, no. 17, pp. 1605–1613.
3 Gey, KF & Puska, P 1989, ‘Plasma vitamins E and A inversely correlated to mortality from ischemic heart disease in cross-cultural epidemiology’, Annals of the New York Academy of Sciences, vol. 570, pp. 268–282.
4 Regnstrom, J, Nilsson, J, Moldeus, P, Strom, K, Bavenholm, P, Tornvall, P & Hamsten, A 1996, ‘Inverse relation between the concentration of low-density-lipoprotein vitamin E and severity of coronary artery disease’, American Journal of Clinical Nutrition, vol. 63, no. 3, pp. 377–385.
5 Miwa, K, Miyagi, Y, Igawa, A, Nakagawa, K & Inoue, H 1996, ‘Vitamin E deficiency in variant angina’, Circulation, vol. 94, no. 1, pp. 14–18.
6 Nyyssonen, K, Parviainen, MT, Salonen, R, Tuomilehto, J & Salonen, JT 1997, ‘Vitamin C deficiency and risk of myocardial infarction: prospective population study of men from eastern Finland’, BMJ, vol. 314, no. 7081, pp. 634–638.
7 Riemersma, RA, Wood, DA, Macintyre, CC, Elton, RA, Gey, KF & Oliver, MF 1991, ‘Risk of angina pectoris and plasma concentrations of vitamins A, C, and E and carotene’, Lancet, vol. 337, no. 8732, pp. 1–5.
8 Salonen, RM, Nyyssonen, K, Kaikkonen, J, Porkkala-Sarataho, E, Voutilainen, S, Rissanen, TH, Tuomainen, TP, Valkonen, VP, Ristonmaa, U, Lakka, HM, Vanharanta, M, Salonen, JT & Poulsen, HE 2003, ‘Six-year effect of combined vitamin C and E supplementation on atherosclerotic progression: the Antioxidant Supplementation in Atherosclerosis Prevention (ASAP) study’, Circulation, vol. 107, no. 7, pp. 947–953.
9 Hodis, HN, Mack, WJ, LaBree, L, Mahrer, PR, Sevanian, A, Liu, CR, Liu, CH, Hwang, J, Selzer, RH, Azen, SP & VEAPS Research Group 2002, ‘Alpha-tocopherol supplementation in healthy individuals reduces low-density lipoprotein oxidation but not atherosclerosis: the vitamin E atherosclerosis prevention study (VEAPS)’, Circulation, vol. 106, no. 12, pp. 1453–1459.
10 de Gaetano G & Collaborative Group of the Primary Prevention Project 2001, ‘Low-dose aspirin and vitamin E in people at cardiovascular risk: a randomised trial in general practice’, Lancet, vol. 357, no. 9250, pp. 89–95.
11 Fang, JC, Kinlay, S, Beltrame, J, Hikiti, H, Wainstein, M, Behrendt, D, Suh, J, Frei, B, Mudge, GH, Selwyn, AP & Ganz, P 2002, ‘Effect of vitamins C and E on progression of transplant-associated arteriosclerosis: a randomised trial’, Lancet, vol. 359, no. 9312, pp. 1108–1113.
12 Stephens, NG, Parsons, A, Schofield, PM, Kelly, F, Cheeseman, K & Mitchinson, MJ 1996, ‘Randomised controlled trial of vitamin E in patients with coronary disease: Cambridge heart antioxidant study (CHAOS)’, Lancet, vol. 347, no. 9004, pp. 781–786.
13 Boaz, M, Smetana, S, Weinstein, T, Matas, Z, Gafter, U, Iaina, A, Knecht, A, Weissgarten, Y, Brunner, D, Fainaru, M & Green, MS 2000, ‘Secondary prevention with antioxidants of cardiovascular disease in endstage renal disease (SPACE): randomised placebo-controlled trial’, Lancet, vol. 356, no. 9237, pp. 1213–1218.
14 Yusuf, S, Dagenais, G, Pogue, J, Bosch, J & Sleight, P 2000, ‘Vitamin E supplementation and cardiovascular events in high-risk patients: the Heart Outcomes Prevention Evaluation Study Investigators’, New England Journal of Medicine, vol. 342, no. 3, pp. 154–160.
15 Lonn, E, Yusuf, S, Dzavik, V, Doris, C, Yi, Q, Smith, S, Moore-Cox, A, Bosch, J, Riley, W, Teo, K & SECURE Investigators 2001, ‘Effects of ramipril and vitamin E on atherosclerosis: the study to evaluate carotid ultrasound changes in patients treated with ramipril and vitamin E (SECURE)’, Circulation, vol. 103, no. 7, pp. 919–925.
16 Rapola, JM, Virtamo, J, Ripatti, S, Huttunen, JK, Albanes, D, Taylor, PR & Heinonen, OP 1997, ‘Randomised trial of alpha-tocopherol and beta-carotene supplements on incidence of major coronary events in men with previous myocardial infarction’, Lancet, vol. 349, no. 9067, pp. 1715–1720.

3 Performing statistical analyses 83
3
17 Waters, DD, Alderman, EL, Hsia, J, Howard, BV, Cobb, FR, Rogers, WJ, Ouyang, P, Thompson, P, Tardif, JC, Higginson, L, Bittner, V, Steffes, M, Gordon, DJ, Proschan, M, Younes, N & Verter, JI 2002, ‘Effects of hormone replacement therapy and antioxidant vitamin supplements on coronary atherosclerosis in postmenopausal women: a randomized controlled trial’, JAMA, vol. 288, no. 19, pp. 2432–2440.
18 Heart Protection Study Collaborative Group 2002, ‘MRC/BHF heart protection study of antioxidant vitamin supplementation in 20,536 high-risk individuals: a randomised placebo-controlled trial’, Lancet, vol. 360, no. 9326, pp. 22–33.
Further readingKowalczyk, D, ‘One-tailed vs. two-tailed tests: differences & examples’, in Psychology 105: research methods in psychology (Chapter 14, Lesson 4).
Speed, T 2014, Statistics is More Than a Numbers Game – It Underpins All Sciences, Office of the Chief Scientist, <www.chiefscientist.gov.au/2014/07/australia-2025-smart-science-statistics/>.

Photo: Science Photo Library
Chapter 4: Visualising data

4 Visualising data 85
4
4 Visualising data
I n this chapter, you will learn how to create column and line graphs (figures) with correct axis titles, error bars and significance symbols using Microsoft Excel and Word
software. You will also learn how to create scientific tables.Now that you are familiar with the scientific method, know how to design experiments, and have collected and analysed the results, what do you do next?
By the time you arrive at this stage, you will know your research project and data inside out. Other than your immediate colleagues, most people will not be as familiar with the work.
The next thing you need to do is share your findings with your colleagues. You will increase the chance of engaging and informing your audience by communicating the findings of your research visually, through figures and tables. Presenting data in figures and tables, rather than in text alone, will help the audience grasp difficult concepts and observe patterns. You saw some good examples of these in Section 3.1.
4.1 Creating a column graph in Excel
• Column or bar graphs are used to show patterns and relationships across and between datasets when the general pattern is more important than the exact data values.
Start by calculating descriptive statistics (mean, standard deviation) using one of the methods shown in Chapter 3.
1. Highlight the data you wish to graph.
First, select the values you want to graph (eg means), then hold down the Ctrl button on your keyboard and select the column headings – this will automatically label the datasets in the figure that are added when you follow step 2.
2. Select the ‘Insert’ tab and choose the type of graph you want to create – for example, click the drop-down arrow next to the icon of a column graph and select a column graph style.
3. The figure will be added to your spreadsheet.

4 Visualising data 86
4
4. When the graph is selected, you have access to the ‘Chart Tools’ tab.
The ‘Design’ and ‘Format’ tabs contain options for changing the appearance of your graph, and adding or removing features.
Three buttons also appear next to the graph when the graph is selected: ‘Chart Elements’, ‘Chart Styles’ and ‘Chart Filters’.
Chart Styles
Chart elements
Chart Filters
Using the ‘Chart Elements’ featureYou can use this menu to change how your graph looks and what data are displayed.
Changing axes and axis titlesIf you untick the box next to ‘Axes’, you can remove both the x and y axes. If you hover your mouse over ‘Axes’ or ‘Axis Titles’, clicking on the arrow to the right allows you to access more options for formatting the axes.
Check or uncheck the boxes to add or remove axes
Add axis titles and format the titles. If you selected column headings when creating the graph, each column will already be labelled with that information (rest, exercise and post-exercise in this example).
‘More Options’ allows access to the ‘Format Axis’ tab

4 Visualising data 87
4
When the ‘Axis Titles’ box is checked, generic axis labels will be added. Right-click on the labels and select ‘Edit Text’ to replace the generic title with your own.
Generic 'Axis Titles' boxOptions appear on right-click
Deleting the chart titleIn most cases, you will not need a chart title because this information will be provided in the figure name or caption, so uncheck the box next to ‘Chart Title’.
Adding or removing gridlinesCheck or uncheck the ‘Gridlines’ box to add or remove gridlines.
Select the arrow to add a range of gridlines or select ‘More Options’ to format existing gridlines

4 Visualising data 88
4
Adding error bars1. Check the box next to ‘Error Bars’, click on the arrow and select ‘More Options’.
You will now have access to the ‘Format Error Bars’ tab on the right-hand side of the screen.
2. For ‘Error Amount’, select the ‘Custom’ option and click the ‘Specify Value’ button.
You would usually have both plus and minus error bars
The ‘Custom Error Bars’ dialogue box will appear.
3. This is where you add the cell references of the values to be used for the error bars. When adding both positive and negative error bars, you enter the same cell locations/standard deviation values to both fields. To enter the values, click in the field for ‘Positive Error Value’ and clear it; click in the first relevant cell in your spreadsheet and drag across the cells you need (cells B15:D15 in this example). Repeat for the ‘Negative Error Value’ field.
If you get an error message after entering your standard deviation values into the ‘Custom Error Bars’ fields, check to make sure the text present in these fields when the window first appeared was deleted before you added your values.

4 Visualising data 89
4
4. Error bars (representing standard deviations) will appear on your graph.
Adding significance symbols1. In the ‘Chart Tools’ tab, click on the ‘Format’ subtab. In ‘Insert Shapes’, click
on the ’Text Box’ icon in the upper left.
2. In your graph, position the cursor where you want to add the significance symbol. Hold your mouse button down and draw the text box.
3. The cursor will automatically appear in the text box. Select the ‘Insert’ tab and click on the ‘Symbol’ button.

4 Visualising data 90
4
4. Select the symbol you want to use and click ‘Insert’; when finished, click ‘Close’.
5. You may need to click on the box and move it around to position it correctly; you will then have a significance symbol included on your graph.
Changing the look of your column graph using ‘Format Data Series’You can make your Excel graph look more attractive by using options in the ‘Format Data Series’ tab.
1. Select the columns by clicking on one of the columns/bars; right-click and select ‘Format Data Series’.

4 Visualising data 91
4
2. The ‘Format Data Series’ tab will appear on the right-hand side of the screen. Click on the symbols and drop-downs to change the appearance of elements in the graph.
Clicking on this symbol will reveal options for changing the amount of space between columns
Clicking on the first 2 symbols will reveal options for changing how your graph looks, including the colours of the columns
A completed scientific column graphAfter following the previous instructions, you will have a completed scientific column graph. Add a figure caption below the graph, and it will be ready to share. The example shown below is for illustration purposes only – usually data this simple would be presented in text with no need for a figure.
Y-axis title (include units)
Symbol indicating significant difference (p < 0.05)
Error bars indicating standard deviation; this is explained in the figure caption below
X-axis title
Figure1 Heart rate at rest and during a 10-minute bout of submaximal exercise on a cycle ergometer. The data are means ± SD. * Significant difference, p < 0.05.
Figure caption– simple, descriptive title that explains to the reader what they are seeing; the reader should be provided with all the information they need to interpret the figure. A chart title is not necessary
Explanation of what data are shown in the figure
Indicate the outcomes of statistical tests. If no significant difference was found, state: No significant differences (p > 0.05)
If abbreviations are used in the figure that are commonly understood, they don’t need to be defined in the caption (eg SD)

4 Visualising data 92
4
4.2 Creating a line graph in Excel
• Line graphs are used to show patterns and relationships across and between datasets when the general pattern is more important than the exact data values. Line graphs are
particularly useful if you want to show a trend over time occurring in 2 or more groups.
Most of the principles of creating a line graph are the same as for creating a bar or column graph, so follow the instructions in Section 4.1 when changing axis titles, and adding error bars and significance symbols. Formatting specifically for line graphs is described in the following steps.
Start by calculating descriptive statistics (mean, standard deviation) using one of the methods shown in Chapter 3.
1. Highlight the data you wish to graph.2. Select the ‘Insert’ tab and choose the type of graph you want to create –
for example, click the drop-down arrow next to the icon of a line graph and select a line graph style:
3. A simple line graph will appear in your spreadsheet ready for you to format using the steps shown in Section 4.1.
Adding markers to data pointsSelect the data in your graph; right-click and select ‘Format Data Series’. The ‘Format Data Series’ tab will appear on the right-hand side of your screen.
Click on the ‘Fill & Line’ icon and then the ‘Marker’ label, and click the arrow at the side of ‘Marker Options’.
If you want to customise your markers, select the ‘Built-in’ button and select a marker from the drop-down box.
Use the options below to change the colour, transparency and width of markers
Choose an ‘Automatic’ or ‘Built-in’ marker. You will now have data markers on your line.

4 Visualising data 93
4
A completed scientific line graphAfter following the instructions above, you will have a completed scientific line graph. Add a figure caption below the graph, and it will be ready to share.
Y-axis title (include units)Error bars indicating standard deviation; this is explained in the figure caption below
Figure2 Sway across 4 trials of tandem standing control (no task) and cognitive task (backwards counting) subjects. The data are means ± SD. COP = centre of pressure. * Significantly different from trial 1, p < 0.05. There was no significant difference between control and cognitive task groups, p > 0.05.
Figure caption – simple, descriptive title that explains to the reader what they are seeing; the reader should be provided with all the information they need to interpret the figure. A chart title is not necessary
Explanation of what data are shown in the figure
Indicate the outcomes of statistical tests
If abbreviations are used in the figure that are commonly understood, they don’t need to be defined in the caption (eg SD)
X-axis title
Symbol indicating significant difference (p < 0.05)
4.3 Creating a table using Word
• Tables are used to present many precise numerical values and other specific data in a small space, particularly when you don’t want to show patterns and relationships across and
between datasets.
Start by calculating descriptive statistics (mean, standard deviation) using one of the methods shown in Chapter 3.
Note that the screenshots in this section are from Microsoft Office Professional Plus 2013; if you are using a different version, your screen may look slightly different.
Entering a basic table1. In Word, access the ‘Insert’ tab and click on the ‘Table’ symbol. You can
select the number of rows and columns that you need by highlighting the cells in the box that appears. If you need to estimate, you can easily add or remove cells later.

4 Visualising data 94
4
2. Add titles to the columns and rows.
3. If you need to add extra columns or rows, place your cursor in one of the table columns and click the ‘Layout’ subtab.In this subtab, you can insert rows above or below where your cursor is located, and insert columns to the left or right of where your cursor is.
4. Column (and sometimes row) headings are bolded, as shown below. Also, it is helpful to define the header row in Word. This can be done by highlighting the header row, and clicking ‘Repeat Header Rows’ in the Layout subtab.
Include units where appropriate You can use abbreviations, but remember to define them in the table caption
Now you can enter your mean data with standard deviations. You can do this in different ways:
a. mean value (SD)b. mean value ± SD.Remember to indicate what the values in your table represent in your table caption.

4 Visualising data 95
4
3. If you use the format shown in b, you will find the plus–minus symbol by clicking the ‘Insert’ tab and then clicking on the ‘Symbol’ icon. The symbol you want may already be showing, in which case you can simply click on it. If it is not showing, select ‘More Symbols’.
You can scroll through all of the symbols or, if you have the same settings as below, [Font = (normal text) and Subset = Latin-1 Supplement)] you can jump to the right area.
4. Select the plus–minus symbol, click on ‘Insert’ and then ‘Cancel’.
You can also use these steps to add significance symbols to your table to indicate where significant differences occur; make sure you define what the symbol means in the table caption.
You can use the options in the ‘Design’ subtab of the ‘Table Tools’ tab to change the look of your table.

4 Visualising data 96
4
A range of templates can be applied to change the design and colour of your table
You can add and remove borders from the table and individual cells
You can also use the options in the ‘Layout’ subtab of the ‘Table Tools’ tab to change the look of your table.
You can delete unwanted columns/rows
Use these options to merge and split cells
You can automatically make all selected columns/rows equal width or heightYou can
manually change the height and width of columns/rows

4 Visualising data 97
4
A completed scientific tableAfter following the instructions above, you will have a completed scientific table. Add a table caption above the table and it will be ready to share.
Further readingSpeed, T 2014, Statistics is More Than a Numbers Game – It Underpins All Sciences, Office of the Chief Scientist, <www.chiefscientist.gov.au/2014/07/australia-2025-smart-science-statistics/>.
Table1: Comparison between female and male predicted and actual O2max, using submaximal testing (predicted) on a cycle ergometer and treadmill, and maximal-testing (actual) on a cycle ergometer and treadmill. Values are means ± SD. * Significantly different from female values (p < 0.05).
Type of testing ConditionFemale O2max (mL/kg/min)
Male O2max (mL/kg/min)
Submaximal testing Cycle ergometer 33.5 ± 2.8 46.5 ± 1.6*
Treadmill 37.9 ± 2.0 48.9 ± 2.4*
Maximal testing Cycle ergometer 32.4 ± 2.4 44.3 ± 1.9*
Treadmill 34.7 ± 2.0 46.9 ± 2.3*
Simple, descriptive title that explains to the reader what they are seeing – the reader should be provided with all the information they need to interpret the table
Explanation of what data are shown in the table
Indicate the outcomes of statistical tests.If no significant difference was found, state: No significant differences (p > 0.05)
If abbreviations are used in the figure that are not commonly understood, they should be defined in the caption
The mean presented with the standard deviation; this is explained in the table caption. Could also be presented as mean (SD)
Include units
Symbol indicating significant difference (p < 0.05)
Rows for each of the conditions
Columns for each dependent variable

Photo: La Trobe University
Chapter 5: Accessing scientific literature and referencing

5 Accessing scientific literature and referencing 99
5
5 Accessing scientific literature and referencing
T his chapter will help student scientists navigate the many avenues for locating scientific literature
and referencing it, including using the reference management software EndNote.An essential skill for all scientists to master is the ability to access relevant and reliable scientific information from a variety of sources.
You will need access to scientific literature for a variety of reasons:• designing an experiment• writing an article• designing a poster.
All of these tasks involve sourcing reliable, authoritative literature, and you’ll need to know how to reference it.
5.1 Types of scientific literature
The two main types of scientific literature are original investigations and literature reviews.
Original investigations (Figure 5.1) are published accounts of new studies about a particular topic. They will generally step the reader through the stages of the study:• introduction• methods• results• discussion• conclusion• references.
Published literature reviews (Figure 5.2) present a synthesis and evaluation of the existing literature on a particular topic with the aim of gaining a new, deeper understanding of the topic. The review article will be structured around themes rather than stages of the scientific method.
5.2 Accessing scientific literature
When you are looking for a specific article or searching for literature on a specific topic, you can use Google Scholar, online databases such as PubMed, and the La Trobe University library website (Figure 5.3).
Google ScholarGoogle Scholar provides a simple way to do a broad search for academic literature. From one place, you can search across many disciplines and sources:• articles• theses• books• abstracts• court opinions.
Academic publishers, professional societies, online repositories, universities and other websites all publish these types of literature. Google Scholar helps you to find relevant work across the world of academic research.
Source: Physiological Reports,1 used under CC BY 2.0
Figure5.1 An example of an original investigation
Source: Frontiers in Physiology,2 used under CC BY 2.0
Figure5.2 An example of a literature review

5 Accessing scientific literature and referencing 100
5 Search tips• Set your preferences to retrieve La Trobe
resources: scholar.google.com.• Select Settings > Library Link > add La Trobe
University Library > Save.• Use the asterisk * (eg child* will find child,
children, childhood, childless).• Use the asterisk as a placeholder to find a
word within words (eg “acquired * injury” finds acquired brain injury).
• Use quotes to search by phrase (eg “type 2 diabetes” or “social media”).
• Search sites for a credible domain (eg site:.gov or site:.edu).
Try this search in Google Scholar: “patient information” “back pain” site:.gov
• Extra help with using Google Scholar is at the link http://scholar.google.com/intl/en/scholar/help.
html#searching
Databases: what are they and how do I use them to find information?Databases are another way to find quality academic information. The library subscribes to many databases that are relevant to your studies in human physiology, such as:• PubMed• Web of Science• EMBASE• ProQuest.
• PubMed is a database that comprises more than 26 million citations for biomedical literature
from MEDLINE, life science journals and online books. Citations may include links to full-text content from PubMed Central and publisher websites.
• Finding the right database to use can sometimes be difficult. There are also a number of ways you can
access them. These video clips can help you to select the right database.
Video5.2 What's a library database?
Video5.3 Accessing databases
• This video clip will give you an introduction to using Google Scholar.
Video5.1 Using Google Scholar
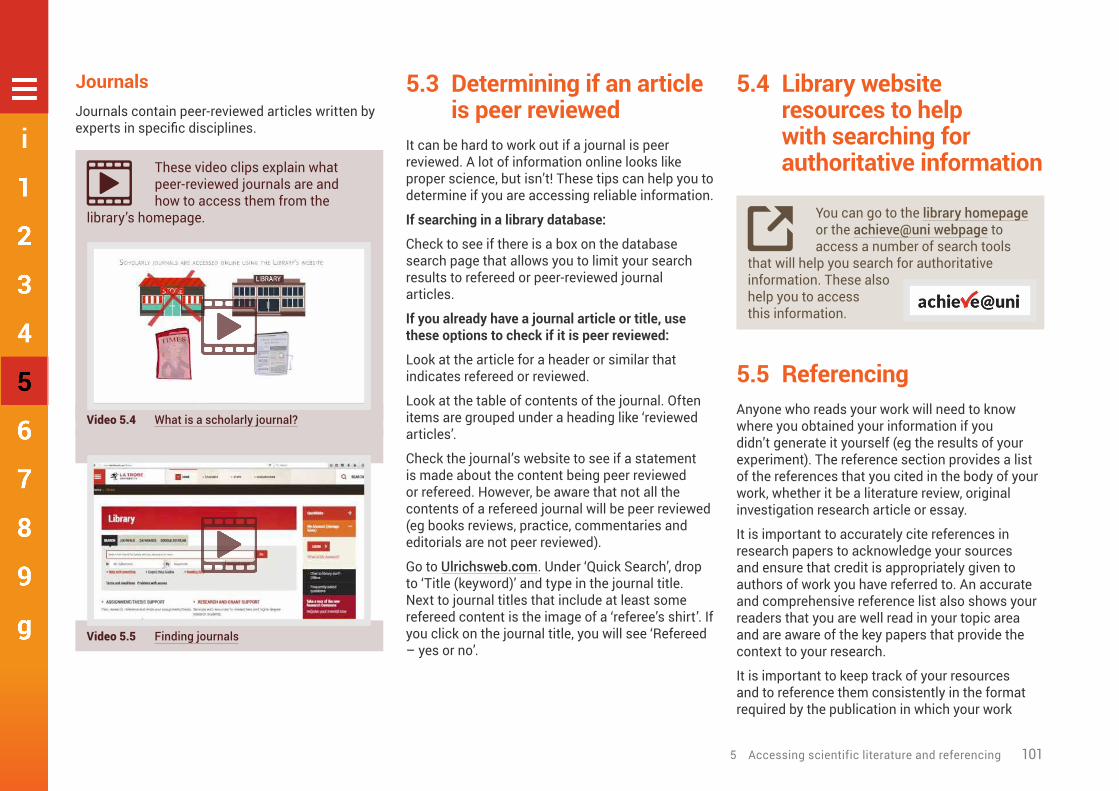
5 Accessing scientific literature and referencing 101
5
JournalsJournals contain peer-reviewed articles written by experts in specific disciplines.
• These video clips explain what peer-reviewed journals are and how to access them from the
library’s homepage.
Video5.4 What is a scholarly journal?
Video5.5 Finding journals
5.3 Determining if an article is peer reviewed
It can be hard to work out if a journal is peer reviewed. A lot of information online looks like proper science, but isn’t! These tips can help you to determine if you are accessing reliable information.
If searching in a library database:
Check to see if there is a box on the database search page that allows you to limit your search results to refereed or peer-reviewed journal articles.
If you already have a journal article or title, use these options to check if it is peer reviewed:
Look at the article for a header or similar that indicates refereed or reviewed.
Look at the table of contents of the journal. Often items are grouped under a heading like ‘reviewed articles’.
Check the journal’s website to see if a statement is made about the content being peer reviewed or refereed. However, be aware that not all the contents of a refereed journal will be peer reviewed (eg books reviews, practice, commentaries and editorials are not peer reviewed).
Go to Ulrichsweb.com. Under ‘Quick Search’, drop to ‘Title (keyword)’ and type in the journal title. Next to journal titles that include at least some refereed content is the image of a ‘referee’s shirt’. If you click on the journal title, you will see ‘Refereed – yes or no’.
5.4 Library website resources to help with searching for authoritative information
• You can go to the library homepage or the achieve@uni webpage to access a number of search tools
that will help you search for authoritative information. These also help you to access this information.
5.5 ReferencingAnyone who reads your work will need to know where you obtained your information if you didn’t generate it yourself (eg the results of your experiment). The reference section provides a list of the references that you cited in the body of your work, whether it be a literature review, original investigation research article or essay.
It is important to accurately cite references in research papers to acknowledge your sources and ensure that credit is appropriately given to authors of work you have referred to. An accurate and comprehensive reference list also shows your readers that you are well read in your topic area and are aware of the key papers that provide the context to your research.
It is important to keep track of your resources and to reference them consistently in the format required by the publication in which your work

5 Accessing scientific literature and referencing 102
5
will appear. Most scientists will use referencing software to store details of all of the journal articles (and other sources) they use while writing their article. This software also automates the process of adding in-text references and creating a reference list.
• A bibliography is a list at the end of a book or article that may show what works the author used in
writing the article or book. A bibliography may also list works that a reader might find useful – sometimes called ‘further reading’.
• A reference list is a list of all the sources that you have used as in-text references in your scientific
paper that enables the reader of your work to locate and verify the sources you have used.
The 2 basic formats for a reference list are:• an alphabetical listing by first author’s last
name (author–date system)• a numerical listing that reflects the order of
the citations in the body of the paper (number format).
The format will depend on the journal, as each journal has its own specific referencing format.
A bibliography tends to use the author–date format, as the works might not be cited in the text.
Author–date system
• In the author–date reference system, in-text citations are indicated by placing the author’s
surname and the date of publication in brackets, and the reference list is in alphabetical order by the author’s surname. This system is sometimes referred to as Harvard referencing.
Figure 5.3 shows a section of the discussion and a section of the reference list of a research article2 that used the author–date system.
• This short video introduces you to the La Trobe University Academic Referencing Tool (ART).
Video5.6 La Trobe University Academic Referencing Tool
In-text citation where the authors are mentioned by name within the sentence
In-text citation where the authors are mentioned at the end of the sentence
Two examples of the format of references in the reference list
Examinations of cerebral oxygenation during exercise using near-infrared spec-troscopy (NIRS) suggest that cerebral oxygenation is not impaired, including when subjects are passively heated to core temperatures up to 39.5°C (Morrison et al., 2009). However, it is now clear that changes in skin blood flow can alter the NIRS-derived oxygenation values (e.g., Davis et al., 2006); thus, data using only this measure must be interpreted with caution. Using the Kety-Scmidt protocol to measure global CBF, Nybo et al. (2002a) and Rasmussen et al. (2010) reported that uncompensable hyperthermic exercise elicited reduction in CBF by ~18 and 15% greater than "nor-mothermic" exercise respectively. Of note, Rasmussen et al. (2010) further estimated cerebral mitochondrial oxygen tension, and found it to be declined by ~5mmHg during hyperthermic compared to normothermic exercise. This reduction was attributed to the fact that cerebral …
ReferencesAinslie, P.N., and Duffin, J. (2009). Integration of cerebrovascular CO2 and chemoreflex control of breathing: mechanisms of regulation, measurement, and inter-pretation. Am. J. Physiol. Regul. Integr. Comp. Physiol. 296, R1473–R1495. doi: 10.1152/ajpregu.91008.2008
Albrecht, R. F., Miletich, D. J., and Ruttle, M. (1987). Cerebral effects of extended hyper-ventilation in unanesthetized goats. Stroke 18, 649–655. doi: 10.1161/01.STR.18.3.649
Figure5.3 An example of referencing using the author–date system

5 Accessing scientific literature and referencing 103
5
• You can download EndNote and find videos to get you started at the La Trobe University EndNote X7
webpage.
Number system
• In the number reference system, a source is cited in-text using the number assigned to that source in
the reference list. This system is sometimes referred to as Vancouver referencing.
Figure 5.3 shows a section of the introduction and a section of the reference list in a research article3 that used the number format.
• The ART will help you to find information about the American Chemical Society (ACS) style that
you are using in this course – this short video shows you how to access the ART from the library homepage.
Video5.7 Accessing the ART from the La Trobe University library website
In-text citation where the authors are mentioned by name within the sentence
In-text citation where the authors are mentioned at the end of the sentence
Two examples of the format of references in the reference list
The AT has been one of the most studied of all physiological variables [1-4]. In human studies, the interest of researchers has ranged from its better comprehension [5,6] to its use in medicine [7-9] and training [9-11].
The term 'anaerobic threshold' was coined by Wasserman and McIlroy [12] when using the respiratory exchange ratio (RER) to detect the beginning of anaerobic metabo-lism in patients with heart problems performing stress tests [12]. Later, Wasserman et al. [13] defined the AT as: 1) a non-linear increase in ventilation (Ve), 2) a non-lin-ear increase in the elimination of CO2 (VCO2), 3) an increase in the end-tidal partial pressure of O2 during a series of breaths (PetO2) with no corresponding drop in the end-tidal partial pressure of CO2 (PetCO2), and 4) an increase in the RER with work load (all during an incremental exercise test) [13].
References1. Gondim FJ, Zoppi CC, Pereira-da-Silva L, De Macedo DV: Determination of the
anaerobic threshold and maximal lactate steady state speed in equines using the lactate minimum speed protocol. Comp Biochem Physiol A Mol Integr Physiol 2007, 146:375–380
2 Hopkins SR, Stary CM, Falor E, Wagnor H, Wagner PD, McKiman MD,: Pulmonary gas exchange during exercise in pigs. J Appl Physiol 1999, 86:92–100
Figure5.3 An example of referencing using the number system
Using EndNote
• EndNote is a reference management software package that you can use to organise your
bibliographies and references when writing essays and articles.
With EndNote, you can create a personalised database of references, by either manually entering them into EndNote or importing them from a database. You can then output a reference list for your thesis or article in the citation style you choose.

5 Accessing scientific literature and referencing 104
5
References1 Kon, M, Ohiwa, N, Honda, A, Matsubayashi, T,
Ikeda, T, Akimoto, T, Suzuki, Y, Hirano, Y & Russell, A 2014, ‘Effects of systemic hypoxia on human muscular adaptations to resistance exercise training’, Physiological Reports, vol. 2, p. e12033.
2 Bain, AR, Morrison, SA & Ainslie, PN 2014, ‘Cerebral oxygenation and hyperthermia’, Frontiers in Physiology, vol. 5, p. 92.
3 Peinado, AB, Rojo, JJ, Calderon, FJ & Maffulli, N 2014, ‘Responses to increasing exercise upon reaching the anaerobic threshold, and their control by the central nervous system’, BMC Sports Science, Medicine and Rehabilitation, vol. 6, p. 17.

Photo: La Trobe University
Chapter 6: Communicating scientific discoveries to peers
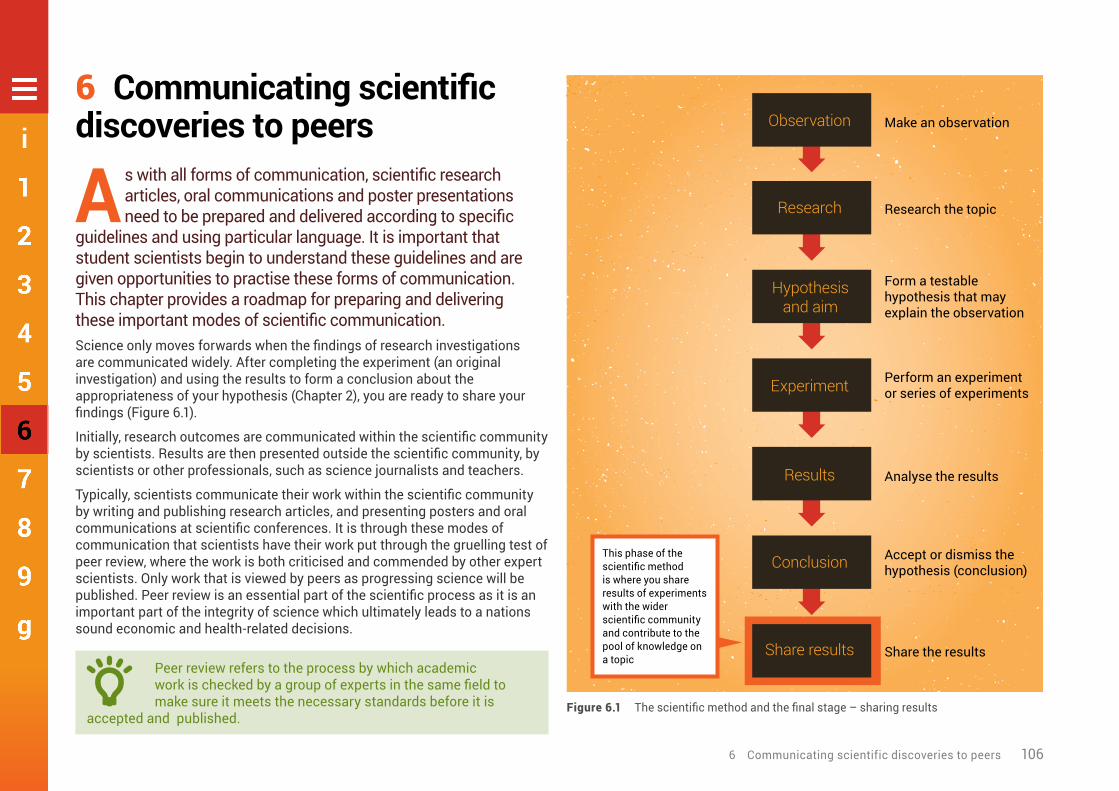
6 Communicating scientific discoveries to peers 106
6
6 Communicating scientific discoveries to peers
A s with all forms of communication, scientific research articles, oral communications and poster presentations need to be prepared and delivered according to specific
guidelines and using particular language. It is important that student scientists begin to understand these guidelines and are given opportunities to practise these forms of communication. This chapter provides a roadmap for preparing and delivering these important modes of scientific communication.Science only moves forwards when the findings of research investigations are communicated widely. After completing the experiment (an original investigation) and using the results to form a conclusion about the appropriateness of your hypothesis (Chapter 2), you are ready to share your findings (Figure 6.1).
Initially, research outcomes are communicated within the scientific community by scientists. Results are then presented outside the scientific community, by scientists or other professionals, such as science journalists and teachers.
Typically, scientists communicate their work within the scientific community by writing and publishing research articles, and presenting posters and oral communications at scientific conferences. It is through these modes of communication that scientists have their work put through the gruelling test of peer review, where the work is both criticised and commended by other expert scientists. Only work that is viewed by peers as progressing science will be published. Peer review is an essential part of the scientific process as it is an important part of the integrity of science which ultimately leads to a nations sound economic and health-related decisions.
• Peer review refers to the process by which academic work is checked by a group of experts in the same field to make sure it meets the necessary standards before it is
accepted and published.
Observation
Research
Hypothesis and aim
Experiment
Results
Conclusion
Share results
Make an observation
Research the topic
Form a testable hypothesis that may explain the observation
Perform an experiment or series of experiments
Analyse the results
Accept or dismiss the hypothesis (conclusion)
Share the results
Figure6.1 The scientific method and the final stage – sharing results
This phase of the scientific method is where you share results of experiments with the wider scientific community and contribute to the pool of knowledge on a topic

6 Communicating scientific discoveries to peers 107
6
The peer-review process for oral communications and poster presentations at scientific conferences is a little less gruelling than for journals, but is still used by conference organisers to determine the work accepted for presentation. Although many scientists will grimace at the mention of ‘peer review’, it is through this process that we increase the likelihood that valid science (and not pseudoscience) is shared with the world.
6.1 Research articles
• A research article reports the results of original research, assesses its contribution to the
body of knowledge in a given area, and is published in a peer-reviewed academic journal.
Research articles generally step the reader through the stages of the study. An example of a research article presenting the results of an original investigation is shown in Figure 6.2.
There are now thousands of peer-reviewed journals in which scientists can publish the outcomes of their research. Each journal will have a slightly different format for its papers, but generally will include an abstract, introduction, methods, results, discussion and conclusion, and a references section (Figure 6.3). In addition, some journals are requiring plain-English summaries.
We will look at each section in turn, and provide some tips for writing each section for your research.
When looking at each section of a journal article, we will highlight how the authors have presented
certain information processes. We will explain how to write the sections of an article by referring to a research article of an original investigation that was published in Physiological Reports and is shown in Figure 6.2.1
Summary for non-expertsIn recent years, it has become more common for journals to request authors to provide a short summary of their research paper that is understandable by non-experts, such as members of the public, high-school and university students, scientists from other disciplines, and members of the health care community. For example, The Journal of Physiology publishes a ‘Key-points summary’ at the beginning of each research article. According to the journal’s editors, this
summary was introduced with the following intentions:• It can help readers to decide quickly if the paper
is relevant or interesting.• It helps scientists from disciplines related to
physiology to learn about the work by providing an easy-to-read summary of the research.
• It allows audiences other than scientists to engage with current research in physiology, including students, patients or carers, and the media.
The summaries are written clearly in plain English, without scientific jargon, abbreviations or acronyms. Sentences are kept as short as possible.
The specific format for a summary for the non-expert audience will vary from journal to journal, but will have the same principles. We’ll use
Source: Physiological Reports,1 used under CC BY 2.0
Figure6.2 Example of an original research article published in Physiological Reports

6 Communicating scientific discoveries to peers 108
6
the ‘Key-points summary’ in The Journal of Physiology as an example to look at this type of writing in more detail.
The Journal of Physiology gives authors guidelines for preparing their ‘Key-points summary’;2 these are summarised below, with an example that has been annotated to highlight important features.
General guidelines for writing a ‘Key-points summary’:• The summary should have no more than 150 words and no more than five bullet
points - One or two points on background to the present study - One or two points on what the paper adds to existing knowledge - One or two points on the importance of the results to body function in health
and/or disease.• Language used should be understood by nonspecialists with general scientific
knowledge.• The summary should accurately reflect the findings of the paper and implications
for future research.
English summary
Abstract
Introduction
Methods
Results
Discussion and conclusion
References
• Concise summary of findings and implications for the non-expert audience
• Plain English, no jargon
• Short summary of each stage described in the research paper
• Usually betwen 200 and 300 words
• Context and importance of the research• Reference to relevant background from
current literature on topic
• Description of experimental methods, including statistical methods
• Detailed enough to allow another researcher to repeat the study
• Outcomes of the experiments, in text, and supported by figures and tables
• How your results fit into the current knowledge on the topic
• What physiological mechanisms could explain your results
• List of references cited in the body of the research article
Figure6.3 Sections of a research article

6 Communicating scientific discoveries to peers 109
6
Examples of ‘Key-points summaries’ from The Journal of Physiology Instructions to Authors2 have been highlighted to show how to write summaries that adhere to the guidelines and state:• what is known • what the paper adds to
existing knowledge • the importance of results.
Example 12
• Intermittent hypoxia increases oxidative stress and decreases nitric oxide metabolism.• These two responses are involved in hypoxia-induced hypertension and may be
mediated by angiotensin II.• In a new human experimental model, the drug losartan blocked type 1 angiotensin
II receptors and prevented the increase in oxidative stress and the decrease in nitric oxide metabolism induced by 6 h of intermittent hypoxia.
• This shows that the upregulation of angiotensin II contributes to the overproduction of free radicals associated with intermittent hypoxia.
• The results help us better understand why blood pressure increases in medical disorders associated with intermittent hypoxia, such as obstructive sleep apnoea.
Word count: 111
Example 22
• Activation of the trigeminal nerve during eye and head surgery often evokes a dramatic decrease in heart rate, blood pressure and breathing rate, referred to as the trigeminocardiac reflex.
• Different anaesthetics can depress or amplify this reflex with serious clinical consequences.
• In this study we focused on two populations of neurones, the neurones that receive sensory information and the neurones that control heart rate.
• We show that these two groups of neurones in the brain are activated in the reflex circuitry and how different anaesthetics differentially modulate the neurotransmission to these neurones.
• These results help us understand the mechanisms and anaesthetic modulation of the trigeminocardiac reflex and can help reduce its rate of occurrence and increase patients’ safety during surgery.
Word count: 120
What is known
What the paper adds to existing knowledge
The importance of results
What is known
What the paper adds to existing knowledge
The importance of results

6 Communicating scientific discoveries to peers 110
6
Key Physiological significance Aim Methods Results Conclusion Background information Synthesis Summary synthesis Evaluation, including hypotheses Literature is lacking
AbstractAn abstract is generally a single paragraph that accurately reflects the contents of the paper – that is, the introduction, methods, results and conclusion.
Physiological significance
Aim
Hypoxia is an important modulator of endurance exercise-induced oxidative adaptations in skeletal muscle. However, whether hypoxia affects resistance exercise-induced muscle adaptations remains unknown.
Here, we determined the effect of resistance exercise training under systemic hypoxia on muscular adaptations known to occur following both resistance and endurance exercise training, including muscle cross-sectional area (CSA), one-repetition maximum (1RM), muscular endurance, and makers of mitochondrial biogenesis and angiogenesis, such as peroxisome proliferator-activated receptor-c coactivator-1a (PGC-1a), citrate synthase (CS) activity, nitric oxide synthase (NOS), vascular endothelial growth factor (VEGF), hypoxia-inducible factor-1 (HIF- 1), and capillary-to-fiber ratio.
Sixteen healthy male subjects were randomly assigned to either a normoxic resistance training group (NRT, n = 7) or a hypoxic (14.4% oxygen) resistance training group (HRT, n = 9) and performed 8 weeks of resistance training. Blood and muscle biopsy samples were obtained before and after training.
After training muscle CSA of the femoral region, 1RM for bench-press and leg-press, muscular endurance, and skeletal muscle VEGF protein levels significantly increased in both groups. The increase in muscular endurance was significantly higher in the HRT group. Plasma VEGF concentration and skeletal muscle capillary-to-fiber ratio were sig-nificantly higher in the HRT group than the NRT group following training.
Our results suggest that, in addition to increases in muscle size and strength, HRT may also lead to increased muscular endurance and the promotion of angiogenesis in skeletal muscle.
Methods
Conclusion
Results
IntroductionThe introduction should establish the context and importance of the research. You may state your hypotheses and aims in the introduction; see Chapter 2 for tips on how to write hypotheses and aims.
Skeletal muscles undergo structural and functional adaptations to various stimuli including mechanical (e.g., exercise) and environmental (e.g., systemic hypoxia) stimuli. Endurance exercise training results in improved muscle oxidative capacity (Holloszy and Booth 1976), whereas resistance exercise training leads to increases in muscle size and strength (McDonagh and Davies 1984). Endurance exercise training (5–6 times/week for 3–6 weeks at 70–80% maximal oxygen uptake) performed in systemic hypoxia induces a greater increase in muscle oxidative capacity when compared to endurance exercise training under normoxia (Desplanches et al. 1993; Geiser et al. 2001).
This suggests that skeletal muscle adaptations are specific to the type of exercise stimuli, and that the combination of exercise and systemic hypoxia may have a synergistic effect on skeletal muscle adaptations such as muscular endurance.
It is generally recognized that endurance exercise training causes a significant increase in skeletal muscle capillarization, characterized by an elevated capillary density and capillary-to-fiber ratio (Andersen 1975; Brodal et al. 1977; Hudlicka et al. 1992). This physiological adaptation contributes to enhanced aerobic capacity via an increase in the transport, conductance, and extraction of oxygen in skeletal muscle. Vascular endothelial
Relevant background information
Evaluation
Summary synthesis

6 Communicating scientific discoveries to peers 111
6
Key Physiological significance Aim Methods Results Conclusion Background information Synthesis Summary synthesis Evaluation, including hypotheses Literature is lacking
Evaluation and judgement based on evidence provided in the background and syntheses
Aim
Synthesis with reference to physiological mechanisms
Hypothesis and evaluation
growth factor (VEGF) (Folkman and Shing 1992; Hudlicka et al. 1992; van Weel et al. 2004; Olfert et al. 2009), the generation of nitric oxide by nitric oxide synthase (NOS) (Baum et al. 2004, 2013), and peroxisome proliferator-activated receptor-c coactivator-1a (PGC-1a) (Arany et al. 2008; Leick et al. 2009) are positive regulators of angiogenesis in skeletal muscle. Among these regulators, VEGF is known to play a critical role in increas-ing angiogenesis.
When compared with wild-type mice, VEGF transgenic mice (van Weel et al. 2004) and muscle-specific VEGF knock-out mice (Olfert et al. 2009), respectively, have increased and decreased skeletal muscle capillary density. Both NOS (Baum et al. 2013) and PGC-1a (Leick et al. 2009) knock-out mice have decreased skeletal muscle VEGF expression and capillary-to-fiber ratio. Acute high-intensity resistance exercise (three sets of 10 repeti-tions of two legged knee extensor exercise at 60–80% of 1RM) in humans increases the expression of skeletal muscle VEGF mRNA and protein (Gavin et al. 2007). Hypoxic stimuli in cells also increase VEGF mRNA levels through the activation of the nuclear transcrip-tion factor, hypoxia-inducible factor-1 (HIF-1) (Forsythe et al. 1996).
Thus, it is possible that resistance exercise training under systemic hypoxia, when compared with normoxia, causes a greater increase in skeletal muscle VEGF and capillar-ization potentially leading to increased muscular endurance.
Therefore, this study investigated the effects of resistance exercise training under systemic hypoxia on the angiogenic response and muscular endurance in human skeletal muscle.
Summary synthesis
Introduction(continued)
Synthesis
Methods and statisticsIn the ‘Methods and statistics’ section, you explain clearly how you did your study. The importance of providing sufficient information in this section was discussed in Chapter 2.
SubjectsSixteen healthy, nonsmoking, male subjects participated in this study. The subjects were randomly assigned to either the normoxic resistance training group (NRT, n = 7) or the hypoxic resistance training group (HRT, n = 9). The physical characteristics of the subjects are shown in Table 1. All subjects performed exercise two to three times per week and had experience of recreational resistance training within the past 10 years. None of the subjects were involved in a regular resistance training program for at least 6 months prior to this study. Before or during participation in this study, subjects reported no exposure to an altitude of >3000 m within 1 month before the experimental trial, no history of severe acute mountain sickness, and no medications (e.g., anabolic steroids, creatine, or sympathoadrenal drugs) were taken during the experimental period. The experimental procedure as well as the purpose of this study was explained in detail to the subjects, and
Include a section on subjects, experimental design and ethical approval
Subject numbers and characteristics
Study design: control group (see Chapter 2)
Additional subject characteristics

6 Communicating scientific discoveries to peers 112
6
Key Physiological significance Aim Methods Results Conclusion Background information Synthesis Summary synthesis Evaluation, including hypotheses Literature is lacking
We hypothesized that resistance exercise training under systemic hypoxia would lead to a greater development of muscular endurance and greater increase in angiogenic and mito-chondrial responses as demonstrated by increases to-fi ratio.

6 Communicating scientific discoveries to peers 113
6
This section should provide readers with sufficient detail to allow them to repeat your study
Methods and statistics(continued)
their written informed consent was obtained in advance. The study was approved by the Japan Institute of Sports Sciences Ethics Committee. This study was done from September to December in 2009.
Resistance exercise training protocolThe subjects performed 8-week resistance training on nonconsecutive days (every Monday and Thursday or every Tuesday and Friday; 16 sessions in total). Except for the 1st and 16th training session, the HRT group was exposed to normobaric hypoxia conditions (14.4% oxygen) from 10 min before the resistance exercise session until 30 min after the exercise session. To investigate acute hormonal responses, the HRT group was exposed to hypoxic conditions from 15 min before the resistance exercise session until 60 min after the exercise session during the 1st and 16th training session. The resistance exercise consisted of two consecutive exercises (free-weight bench-press and bilateral leg-press using weight-stack machine), each with 10 repetitions for five sets at 70% of pretraining one-repetition maximum (1RM). All the sets and exercises were separated by 90-s rest intervals. The training intensity was increased (2.5 kg in bench-press and 5.0 kg bilateral leg-press, respectively) in subsequent training sessions when a subject completed 10 repetitions for five sets, or the training intensity was adjusted to 70% of each new 1RM after determination of 1RM after 2 weeks of training. The subjects were instructed to lift and lower the load at a constant velocity, taking ~2 sec (bench-press) or 4 sec (bilateral leg-press) for each repeti-tion. The total exercise time was approximately 20 min at each session. If the load became too heavy, the subject was assisted. All training sessions were performed in the strength and conditioning facilities at the Japan Institute of Sports Sciences (Tokyo, Japan) under the supervision of assistant trainers. The HRT group used a specially designed hypoxic training room within the facility. The hypoxic environment was created by filtering com-pressed air through a high-polymer membrane. The subjects were asked to refrain from performing other resistance training during the experiment period.
Measurements of body compositionBody mass was measured with an electric scale to the nearest 0.1 kg before and after the training period. Lean body mass and percentage body fat were measured by dual-en-ergy X-ray absorptiometry (DXA, QDR-4500A, Hologic, Waltham, MA) before and after the training period. The subjects did not perform any strenuous exercise 48 h before measuring body composition.
Statistical analysisAll data were analyzed by a two-way ANOVA with repeated measures. When required a Fisher’s PLSD post hoc analysis was performed. The level of statistical significance was set at P < 0.05.
Data are expressed as mean ± SE.
Statement that written informed consent from the subjects was obtained
In detail, describe how the dependent variables were measured. Use headings, as appropriate, to guide the reader
The last section of the methods describes the statistical analysis used
Include details of the equipment used, including manufacturer
A statement explaining what the dependent variable values are. Another example is percentage change
A statement describing the statistical tests used
A statement identifying when significance is established
Details regarding informed consent by the subjects and ethical approval

6 Communicating scientific discoveries to peers 114
6
Figure2 Changes in exercise volume during leg-press exercises at 70% of 1RM before (baseline) and after (8 weeks) the resistance training program. NRT, nomoxic resistance training (n = 7); HRT, hypoxic resistance training (n = 9). Values are represented as means ± SE. Significantly different from baseline **P < 0.01; significantly different from NRT #P < 0.05.
NRT HRT
Exer
cise
vol
ume
(kg)
**
#**
0
1000
2000
3000
4000
5000
6000Baseline 8 weeks
ResultsResults appear in written form, supported by figures and tables, as appropriate. Examples of how to present all 3 forms of results are provided below. Chapter 3 and Chapter 4 provide details on conducting statistical tests, and creating figures and tables, respectively.
Body compositionIn both the groups, body mass (P < 0.05) and lean body mass (P < 0.01) significantly increased, while percent body fat decreased after training (Table 1). There were no significant differ-ences in these parameters between the two groups.
Total training volumeTotal training volume (calculated as load multiplied by repetitions) during the training period for the bench press was 36,500 ± 3933 kg for the NRT group and 42,000 ± 3304 kg for the HRT group, and for bilateral leg-press was 123,500 ± 10,795 kg for the NRT group and 129,111 ± 6006 kg for the HRT group (n.s. between groups).
Reference to statistical significance is included in written text
Explanation of the results, in text form, which summarises the findings
Refers to the relevant figures or tables
Mean values plus or minus SD/SE appear in text. These data will not be repeated in a table or figure
Caption contains definitions of abbreviations used in the figure, which allows the figure to stand alone without reference to the text
Axes labelled with group names, defined in the caption
Caption contains key for significance symbols used in figures What data are presented
Error bars used to show variability; what they represent is explained in the caption
Significance symbols (*, #) used to indicate where the datasets are statistically different
Axes labelled with units included, where appropriate
Datasets clearly distinguishable

6 Communicating scientific discoveries to peers 115
6
Results(continued)
Caption allows the table to stand alone without reference to the text
Simple column and row labels, with units included where appropriate
Significance symbol (*) used to indicate where the datasets are statistically different
Variability indicated by SE following the mean (sometimes in parentheses); what they represent is explained in the caption
Table1 Changes in testosterone, cortisol, testosterone/cortisal (T/C) ratio, insulin-like growth factor-1 (IGF-1), IGF binding protein-3 (IGFBP-3), red blood cell (RBC), hemoglobin (Hb), and hematocrit (Hct) before (baseline), during (4 weeks), and after (8 weeks) the resistance training program
Variable Baseline 4 weeks 8 weeksTestosterone (ng/mL)
NRT 5.74 ± 0.93 5.32 ± 0.64 4.54 ± 0.79
HRT 3.98 ± 0.45 5.20 ± 0.33 4.65 ± 0.22
Cortisol (µg/dL)
NRT 14.4 ± 1.0 12.0 ± 1.5 ** 9.3 1.0 **
HRT 16.0 ± 1.7 11.4 ± 1.2 ** 10.7 ± 1.0 **
T/C ratio
NRT 4.03 ± 0.65 5.32 ± 1.27 ** 5.64 ± 1.42 **
HRT 2.87 ± 0.61 5.13 ± 0.92 ** 4.66 ± 0.46 **
IGF-1 (ng/mL)
NRT 234.4 ± 21.2 233.9 ± 22.3 232.4 ± 17.1
HRT 246.8 ± 24.9 261.1 ± 21.5 267.6 ± 21.9
IGFBP-3 (ng/mL)
NRT 2.56 ± 0.10 2.46 ± 0.19 2.47 ± 0.19
HRT 2.19 ± 0.17 2.55 ± 0.16 2.67 ± 0.14
RBC (/L)
NRT 465.5 ± 51.1 498.2 ± 13.6 500.5 ± 8.1
HRT 495.0 ± 9.3 503.9 ± 8.6 494.2 ± 9.6
Hb (g/dL)
NRT 15.4 ± 0.3 15.3 ± 0.3 15.3 ± 0.3
HRT 14.8.0 ± 0.2 15.3 ± 0.2 15.0 ± 0.3
Hct (%)
NRT 47.7 ± 1.1 46.8 ± 1.0 46.5 ± 0.9
HRT 46.0 ± 0.6 46.4 ± 0.4 45.2 ± 0.7
NRT, normoxic resistance training; HRT, hypoxic resistance training.Values are represented as means ± SE.Significantly different from baseline **P < 0.01
Definitions of abbreviations used in table; this is often included in the legend above. Allows the table to stand alone without reference to the text
Key for significance symbols used in tableWhat data are presented
Sensible number of decimal places given (and used consistently); this will vary depending on the variable

6 Communicating scientific discoveries to peers 116
6
Key Physiological significance Aim Methods Results Conclusion Background information Synthesis Summary synthesis Evaluation, including hypotheses Literature is lacking
DiscussionSystemic hypoxia is a potent stimulator of endurance exercise adaptations. However, its effect of resistance training adaptations has received little attention. This study therefore investigated the effects of 8 weeks of resistance exercise training, performed under hypoxic (HRT) and normoxic conditions (NRT), on skeletal muscle adaptations known to occur following both resistance and endurance exercise training.
Novel findings from this study included: (1) a significant improvement in muscular endurance; (2) increases in plasma VEGF concentration and capil-lary-to-fiber ratio following training under hypoxic conditions; and (3) similar gains in muscle CSA and strength, independent of the training protocol.
These results demonstrate that resistance training under systemic hypoxia not only stimulates classical resistance training adaptations but also promotes adaptations more commonly associated with endurance exercise training in skeletal muscle.
For the first time, we demonstrate a significant resistance training-induced increase in muscular endurance in the HRT group.
Recently, Faiss et al. (2013) showed a larger improvement in repeated sprint performance following sprint training in hypoxia when compared to sprint training in normoxia. This was associated with significant increases in carbonic anhydrase III and mono-carboxylate transporter 4 mRNA levels; a protein involved in muscle buffering capacity.
Improvements in muscular endurance are influenced by increases in skeletal muscle oxidative fiber types, activities of metabolic enzymes, improvement in muscle buffering capacity, and capillarization.
Our observed increase in muscular endurance following resistance exercise training under systemic hypoxia was paralleled by increases in the capillary-to-fi-ber ratio. As far as we aware no studies have examined the effect of resistance training under systemic hypoxia on muscle capillarization. However, it has been observed that endurance training under systemic hypoxia induces a greater increase in muscle capillary density and capillary-to-fiber ratio, respectively, than normoxia (Desplanches et al. 1993; Geiser et al. 2001). In addition, Vogt et al. (2001) reported greater increases in VEGF mRNA expression and capillary density in skeletal muscle by endurance training under systemic hypoxia.
Discussion and conclusionThe function of the discussion is to interpret your results in light of what was already known about the topic, and to explain our new understanding after evaluating your results.
It is generally accepted that a discussion will begin with a summary of the main findings of the study. This is followed by presenting the findings of the present study and comparing and contrasting them to the findings of similar previously published studies. You will also evaluate the findings and discuss the implications for our understanding of the physiological mechanisms . This section will conclude with a brief summary and implications for future research. See Chapter 2 for tips on writing a conclusion.
First sentence of paragraph states an important finding of the study, which is then followed by synthesis of the finding with other similar published studies, and an evaluation of the findings
Comparison of finding with other similar and/or relevant published study (synthesis), with reference to physiological mechanisms, as appropriate
Synthesis of the literature in combination with the findings of the present study
Some discussions use subheadings to guide the reader through the discussion of the results; an appropriate subheading here would be ‘Muscular endurance’
The main findings of the study are summarised in the introductory paragraph
Authors interpret the findings and evaluate the results
Relevant background information included to guide the reader in light of the finding of the present study
It is important to point out to the reader where a lack of literature is apparent

6 Communicating scientific discoveries to peers 117
6
Key Physiological significance Aim Methods Results Conclusion Background information Synthesis Summary synthesis Evaluation, including hypotheses Literature is lacking
Combined these observations demonstrate that exercise training under systemic hypoxia may increase skeletal muscle angiogenesis, independent of the training mode. The greater angiogenesis is likely to be achieved by hypoxic resistance training-induced increase in VEGF levels. We were not able to define whether the greater increase in muscular endurance in the HRT group was due to the promotion of angiogenesis in skeletal muscle and this should be the focus of future studies.
To our knowledge, this study is the first study to identify an increase in basal VEGF protein levels in skeletal muscle following resistance training.
Basal VEGF mRNA levels do not change following high-intensity resistance exercise training (Lundberg et al. 2013) or low-intensity resistance training under systemic hypoxia (Friedmann et al. 2003). In addition, the basal VEGF mRNA levels in skeletal muscle did not change after high-intensity intermit-tent training under systemic hypoxia. Following training in normoxia there are conflicting results with studies showing that VEGF mRNA levels may increase (Mounier et al. 2009) or decrease (Faiss et al. 2013). However, VEGF mRNA levels are increased between 2 and 4 h following moderate–high-intensity acute resis-tance exercise (Gavin et al. 2007) and 4 and 24 h following low-intensity acute resistance exercise performed with blood flow restriction-induced local hypoxia (Larkin et al. 2012).
The transient increase in VEGF mRNA following an acute resistance exercise bout may contribute to an increase in VEGF protein levels following repeated exercise bouts as observed in this study.
Some previous studies have obtained similar results regarding the changes of oxidative capacity to resistance training (MacDougall et al. 1979; Chilibeck et al. 1999; Masuda et al. 1999). Protein level of PGC-1a, a key regulator of mitochon-drial biogenesis, angiogenesis, and endurance capacity, did not change, while CS enzyme activity, another regulator of endurance capacity, and mitochondrial content were reduced, following training
Resistance training might induce muscular hypertrophy to a greater extent than mitochondrial biogenesis, resulting in decreased CS activity relative to the muscle fiber area. It is possible that the increase in endurance capacity following HRT was not significantly influenced by changes in mitochondrial biogenesis or oxidative capacity.
Discussion and conclusion(continued)
Evaluation or explanation of the findings with reference to evidence published in the literature
First sentence of the paragraph states the next important finding of the study, which is then followed by synthesis of the finding with other similar published studies, and an evaluation of the findings
Some discussions use subheadings to guide the reader through the discussion of the results; an appropriate subheading here would be ‘Basal VEGF protein levels’
Synthesis of the literature in combination with the findings of the present study
Synthesis
Evaluation of the findings
Evaluation of the findings

6 Communicating scientific discoveries to peers 118
6
Key Physiological significance Aim Methods Results Conclusion Background information Synthesis Summary synthesis Evaluation, including hypotheses Literature is lacking
In this study, further gains in muscle size and strength after resistance training under systemic hypoxia were not observed.
We have previously confirmed that the same resistance exercise protocol performed under hypoxia induces a greater response in GH which has anabolic effects as compared to resistance exercise under normoxia (Kon et al. 2010). However, a consensus view on the relationship between the change in GH following a single session of resistance exercise and muscular hypertrophy with resistance training has not been achieved so far (McCall et al. 1999; Mitchell et al. 2013). Additionally, GH administration does not have an additive effect muscle hypertrophy and strength when combined with resistance training in healthy elderly men (Lange et al. 2002).
These observations suggest that the increase in GH following resistance exercise may not be implicated in the muscle hypertrophy and strength gain induced by such training.
The increase in T/C ratio in this study was caused by the resistance training-induced decrease in cortisol and was independent of the training protocol.
Testosterone is an androgenic-anabolic hormone and plays a role in promoting muscle growth (Vingren et al. 2010). On the other hand, cortisol has catabolic functions that have greater effects in fast-twitch muscle fibers (Crowley and Matt 1996). Therefore, T/C ratio has been suggested to be an indicator of the anabolic/catabolic status of skeletal muscle during resistance training (Häkkinen 1989).
The present result suggests that systemic hypoxia does not affect the response of the resting T/C ratio to resistance training.
ConclusionsWe demonstrated that resistance training under systemic hypoxia led to greater increases in muscular endurance and angiogenesis in the skeletal muscle.
Discussion and conclusion(continued)
Some discussions use subheadings to guide the reader through the discussion of the results; an appropriate subheading here would be ‘Muscle size and strength’
Evaluation of the findings
Evaluation of the findings
Accurate, succinct conclusion referring back to the hypothesis and aim
First sentence of paragraph states the next important finding of the study, which is then followed by synthesis of the finding with other similar published studies, and an evaluation of the findings
Synthesis of the finding of the present study with that of previously published research by the author of the current study (authors can cite their own previous work if it is relevant)
Reference to findings of present study
Relevant background information included to guide the reader in light of the finding of the present study

6 Communicating scientific discoveries to peers 119
6
ReferencesThe reference section provides a list of the references that you cited in the body of your original investigation research article. The format will depend on the journal, because each journal has its own specific referencing format (see Chapter 5 for more about types of referencing formats).
It is important to accurately cite references in research papers to acknowledge your sources and ensure that credit is appropriately given to authors of work you have referred to. An accurate and comprehensive reference list also shows your readers that you are well read in your topic area and are aware of the key papers that provide the context to your research.
The research article by Kon et al1 used as an example in this chapter lists 34 references – imagine how much help referencing software would be. Chapter 5 provides support for using EndNote, an example of reference management software.
6.2 Poster presentations
• Scientific posters summarise research concisely and attractively to help publicise it and generate
discussion when presented at scientific conferences.
Posters are presented at scientific conferences, and include brief text mixed with tables and/or graphs, and other presentation formats. A room will be set up with posters displayed on poster boards, and times will be set aside for attendees to view the posters while their authors stand by to answer questions and discuss their research (Figure 6.4).
Source: GD09 Poster Session by David Eppstein, used under CC BY-SA 3.0
Figure6.4 Poster session at the 17th International Symposium on Graph Drawing
The most important thing to remember when writing a poster is to keep things concise. A very wordy poster will be hard for a viewer to read, because the conference organisers will give you a maximum poster size that you can display.
The hardest part about creating a poster is cutting out any information that is not strictly necessary; this takes time and possibly a number of drafts.
When creating a poster, you are stepping through a similar process to the process of writing up your research in research article format, but with much less detail.
This section provides an example of a poster that presents an overview of an original investigation. We will also look at each section of the poster, and highlight important features of the format of the poster.

6 Communicating scientific discoveries to peers 120
6
Use colour carefully.
Dark letters on a white background are best for text. Also be mindful that some people are colour blind
Readers’ eyes naturally move from top to bottom and from left to right; consider this when designing your poster layout
Use graphical representations of data such as figures and tables, where possible. This is more attractive and is easier for the reader to quickly take in than a slab of text
Incorporate photos or flowcharts to help explain and represent your methods. This is more attractive and is easier for the reader to quickly take in than a slab of text
Don’t devote too much space to your methods; readers will be most interested in your results and the implications of these findings

6 Communicating scientific discoveries to peers 121
6
Poster heading
Background or introduction
Include full author details and details of where the research was conducted.
This may be more than 1 location if researchers from different places are collaborating
Include your institution’s logo
The title, in large print across the top of the poster; this may be written in a way that summarises the findings of the study
Start by briefly stating the context for your research and the wider significance of your topic
Include references to current literature
Explain how your research fits in – how are you planning on adding to the body of knowledge on your topic?
State your hypothesis here, or you may have a separate section for hypotheses and aims if they are more complicated

6 Communicating scientific discoveries to peers 122
6
Methods and statistics
Briefly explain the experimental design used
State the number of participants and any relevant information about them (eg age, gender), or features relevant to your study (eg trained or untrained)
Explain what your participants did
Use examples to help explain tests that the reader may not be familiar with; this also helps to break up the text
A photo (taken and used with permission) will help to break up the text
Finish with details of data and statistical analysis
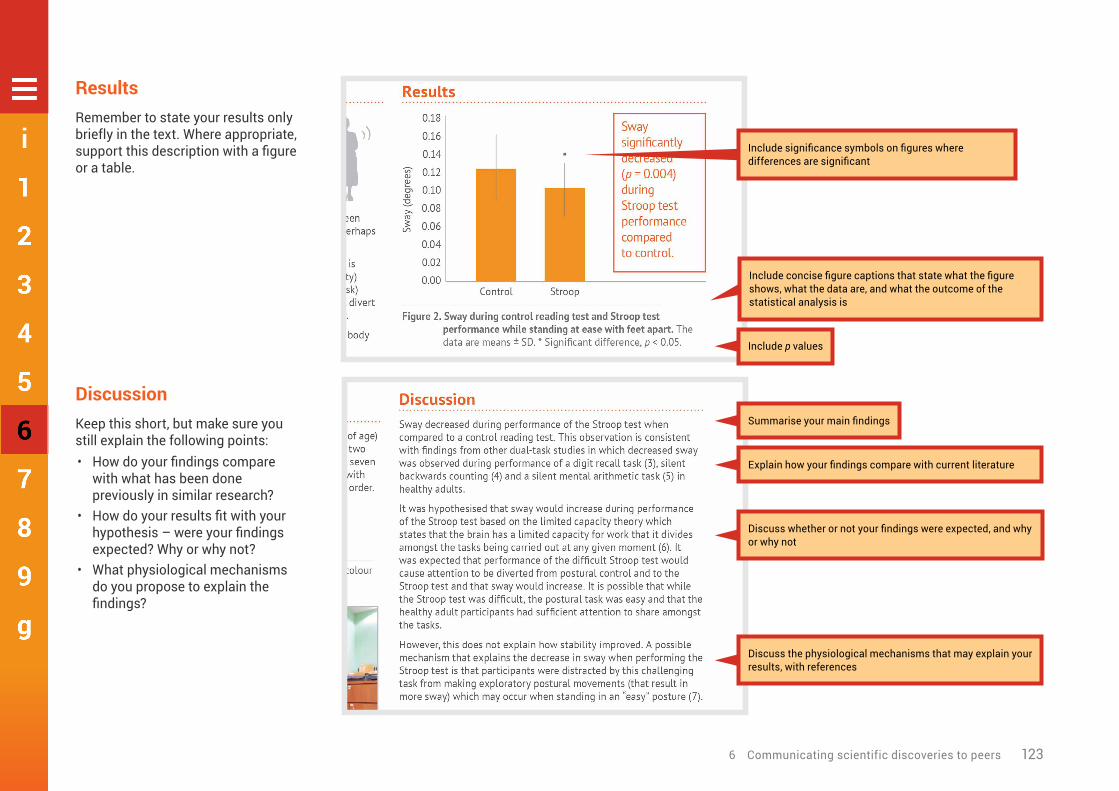
6 Communicating scientific discoveries to peers 123
6
ResultsRemember to state your results only briefly in the text. Where appropriate, support this description with a figure or a table.
DiscussionKeep this short, but make sure you still explain the following points:• How do your findings compare
with what has been done previously in similar research?
• How do your results fit with your hypothesis – were your findings expected? Why or why not?
• What physiological mechanisms do you propose to explain the findings?
Include p values
Summarise your main findings
Explain how your findings compare with current literature
Discuss whether or not your findings were expected, and why or why not
Discuss the physiological mechanisms that may explain your results, with references
Include concise figure captions that state what the figure shows, what the data are, and what the outcome of the statistical analysis is
Include significance symbols on figures where differences are significant

6 Communicating scientific discoveries to peers 124
6
ConclusionKeep the conclusion concise. We suggest using the schema introduced in Chapter 2 to write a short, direct conclusion that is consistent with your hypotheses and aims.
AcknowledgementsThe acknowledgements section is an optional chance to thank people who contributed to your poster, including during the planning, data collection, analysis and presentation phases.
ReferencesKeep your reference list as short as possible. Ensure your in-text citations are consistent with the reference list.

6 Communicating scientific discoveries to peers 125
6
6.3 Oral communications
• A scientific oral communication is a prepared, purposeful presentation designed to share your research
work with other scientists. Here, you try to convince your audience that your research is valid and important.
Oral communications are often given at scientific conferences and are usually followed by questions from fellow scientists in the audience (Figure 6.5).
Similar to a poster presentation, the challenge of an oral communication is keeping things concise. You will have a limited opportunity to present the outcomes of your original investigation, so you want to spend this time focused on the most important aspects of the project – particularly the results and the implications of these findings.
• The Undergraduate Research Office at Michigan State University created this video called How to
prepare an oral research presentation
Most students will agree that oral communications are one of the most stressful tasks you will undertake during your degree. As a student scientist, you will have spent hours engaging with live and recorded lecture presentations, and will have experienced many different types of presentations. As a result, you know what it is like to be an audience member. What kept you engaged? What had you reaching for your phone? Consider the good and not so good lectures you
have experienced as an audience member as you prepare your presentation. Try to embody the presenters that you enjoyed listening to.
When preparing your oral communication, you have 3 elements to consider:• visual aids• language use• delivery.
Visual aidsVery wordy presentation slides will be hard for the audience to read and will be overwhelming. You will need to cut out any information that is not strictly necessary; this takes time and possibly a number of drafts.
Remember, you don’t need to include everything you are going to say on your slides. Rather, you should use the limited space on the slides to state key ideas and use these as prompts for your talk.
In a scientific oral communication, you should include slides for each of the major sections of a research article:• introduction• methods• results• discussion• conclusion.
Since you have limited time, devote less time to your methods, and more to your results and discussion of the implications of your findings.
For your presentation slides, avoid large blocks of text. Try to break up the text you include using bullet points and also images, where appropriate.
Keep your presentation design simple – use dark fonts on a light background or light fonts on a dark background. Ensure that the font size is readable by your audience. Avoid overly distracting slide transitions or sound effects; these detract from your talk and may appear unprofessional.
Take the time to proofread your slides so that there are no spelling or grammatical errors.
The following sections show an example of slides from an overview of an original investigation. We discuss each section of the presentation and highlight important features relating to the content of the slides. We also provide suggestions for how slides can complement your talk.
Source: ‘Ashwin Baindur - Presentation – Crafting Knowledge-smiths Attributes of Accomplished Wikipedia Editors – Bengali Wikipedia 10th Anniversary Celebration – Jadavpur University – Kolkata 2015-01-10 3317’ by Biswarup Ganguly, used under CC BY 3.0.
Figure6.5 Oral communication by Ashwin Baindur at the Bengali Wikipedia 10th Anniversary Celebration

6 Communicating scientific discoveries to peers 126
6
Title slide
Include full author details and details of where the research was conducted – this may be more than 1 location if researchers from different places are collaborating
Include your institution’s logo
Use colour carefully.
Dark letters on a white background or white letters on a dark background
The title, in large print across the top of the slide; it may be written in a way that summarises the findings of the study
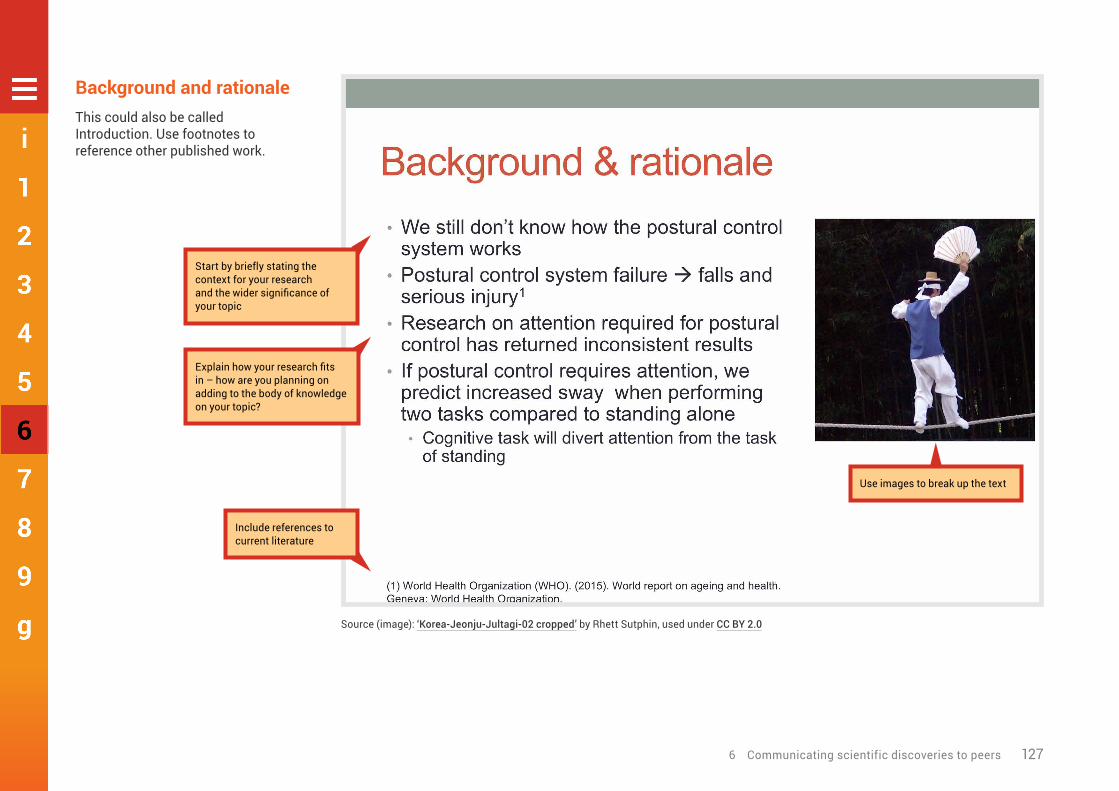
6 Communicating scientific discoveries to peers 127
6
Background and rationaleThis could also be called Introduction. Use footnotes to reference other published work.
Use images to break up the text
Start by briefly stating the context for your research and the wider significance of your topic
Explain how your research fits in – how are you planning on adding to the body of knowledge on your topic?
Include references to current literature
Source (image): ‘Korea-Jeonju-Jultagi-02 cropped’ by Rhett Sutphin, used under CC BY 2.0

6 Communicating scientific discoveries to peers 128
6
Hypothesis and aim
State your hypothesis and aim as part of the ‘Background and rationale’. If they are complicated, you may have a separate section for hypotheses and aims

6 Communicating scientific discoveries to peers 129
6
Methods and statisticsAgain, use footnotes for referencing.
Briefly explain the experimental design used
Include details of data and statistical analysis
State the number of participants and any relevant information about them (eg age, gender) or features relevant to your study (eg trained or untrained)

6 Communicating scientific discoveries to peers 130
6
Methods and statistics(continued)
As an example of how to expand on the concise text shown in your slides during your presentation, you could say ‘Each participant was measured under both conditions, with half of the subjects experiencing the conditions in reverse order’.
Another example of how you could expand on the concise text shown in your slides during your presentation: ‘Each participant stood on the force plate for 1-minute trials’.
Use examples to help explain tests that the reader may not be familiar with; this also helps to break up the text
Explain what your participants did; a photo (taken and used with permission) will help to break up the text

6 Communicating scientific discoveries to peers 131
6
ResultsYou may choose to have separate ‘Results’ and ‘Discussion’ slides, as in this example. Alternatively, where you have more than 1 major result to present, you may present each finding on a separate slide, where you combine ‘Results and discussion’.
Figure2. Sway during control reading text and Stroop test performance while standing at ease with feet apart. The data are means ± SD. *Significant difference, p < 0.05.
Include p values
Include significance symbols on figures where differences are significant
Include concise figure legends that state what the figure shows, what the data are and what the outcome of the statistical analysis is

6 Communicating scientific discoveries to peers 132
6
DiscussionKeep this short, but make sure that you still explain the following points:• How do your findings compare
with what has been done previously in similar research?
• How do your results fit with your hypothesis? Were your findings expected? Why or why not?
• What physiological mechanisms do you propose to explain the findings?
Summarise your main findings
Explain how your findings compare with current literature
As before, use footnotes for referencing
Discuss whether or not your findings were expected, and why or why not
Discuss the physiological mechanisms that may explain your results, with references

6 Communicating scientific discoveries to peers 133
6
ConclusionKeep the conclusion concise. We suggest using the schema introduced in Chapter 2 to write a short, direct conclusion that is consistent with your hypotheses and aims.

6 Communicating scientific discoveries to peers 134
6
Language useYou may want to begin work on the delivery aspect of your presentation by writing a script, but keep in mind that the written word is very different from the spoken word. Reading your script aloud, to yourself and to a practice audience, will allow you to hear your speech so that you can judge whether the language is appropriate for a presentation.
Remember that the way we write and speak are very different.
Try to make language choices that are imaginative, memorable and compelling, and improve the effectiveness of your presentation. Watch presentations by people you admire and study the way they use language to engage the audience.
• Ted talks has thousands of presentations that you can use for inspiration.
Remember to consider the level of expertise of your audience when deciding on the language to use.
DeliveryDuring your practice sessions, you can work on your delivery. A good presenter will be audible to everyone in the audience and will speak fluently, and not rely on notes. If you simply read your notes or presentation slides, it is very distracting to the audience. Practice will allow you to know your presentation well enough to leave the notes aside and speak to the audience.
Be conscious of your posture, use of gestures and eye contact, and vocal expressiveness. These elements will make your presentation compelling, and make you appear polished and confident.
Be aware of the time limit for your talk and be mindful of how close you are to the limit during your practice runs. You should make use of most or all of the allocated presentation time.
Remember to find out if there will be time allowed for questions after your talk, and ensure that you consider this when preparing your presentation.
References1 Kon, M, Ohiwa, N, Honda, A, Matsubayashi, T,
Ikeda, T, Akimoto, T, Suzuki, Y, Hirano, Y & Russell, A 2014, ‘Effects of systemic hypoxia on human muscular adaptations to resistance exercise training’, Physiological Reports, vol. 2, p. e12033.
2 The Physiological Society 2016, Guidelines for Writing a Key Points Summary: Information for Authors, The Physiological Society, viewed 24 August 2016, <http://jp.msubmit.net/html/Keypoints_Guidelines.pdf>.

Photo: La Trobe University
Chapter 7: Writing a literature review

7 Writing a literature review 136
7
7 Writing a literature review
I n this chapter, we explain what a literature review is, including the stages of writing one. We also provide practical
tips on how to communicate the results of a review of current literature on a topic in the format of a literature review.Hundreds of original investigation research papers are published in physiology each year. It is becoming harder and harder to keep on top of all new findings in a topic area and – more importantly – how they all fit together to determine our current understanding of a topic. This is where literature reviews come in.
7.1 What is a literature review?
• Literature reviews provide a synthesis and evaluation of the existing literature on a particular
topic with the aim of gaining a new, deeper understanding of the topic.
Published literature reviews are typically written by scientists who are experts in that particular area of science. Usually, they will be widely published as authors of their own original work, making them highly qualified to write a literature review.
However, literature reviews are still subject to peer review before being published. Literature reviews provide an important bridge between the expert scientific community and many other communities, such as science journalists, teachers, and medical and allied health professionals. When the most up-to-date knowledge reaches such audiences, it is more likely that this information will find its way to the general public. When this happens, the ultimate good of science can be realised.
Literature reviews are structured differently from original research findings. They are developed based on themes, rather than stages of the scientific method.
In the article 'Ten simple rules for writing a literature review', Marco Pautasso1 explains the importance of literature reviews:
Literature reviews are in great demand in most scientific fields. Their need stems from the ever-increasing output of scientific publications. For example, compared to 1991, in 2008 three, eight,
and forty times more papers were indexed in Web of Science on malaria, obesity, and biodiversity, respectively. Given such mountains of papers, scientists cannot be expected to examine in detail every single new paper relevant to their interests. Thus, it is both advantageous and necessary to rely on regular summaries of the recent literature. Although recognition for scientists mainly comes from primary research, timely literature reviews can lead to new synthetic insights and are often widely read. For such summaries to be useful, however, they need to be compiled in a professional way.
An example of a review article is shown in Figure 7.1.
• Watch this video created by Steely Library at Northern Kentucky Library called ‘What is a literature
review?’
Source: Frontiers in Physiology, used under CC BY 2.0
Figure7.1 Example of a review article published in Frontiers in Physiology
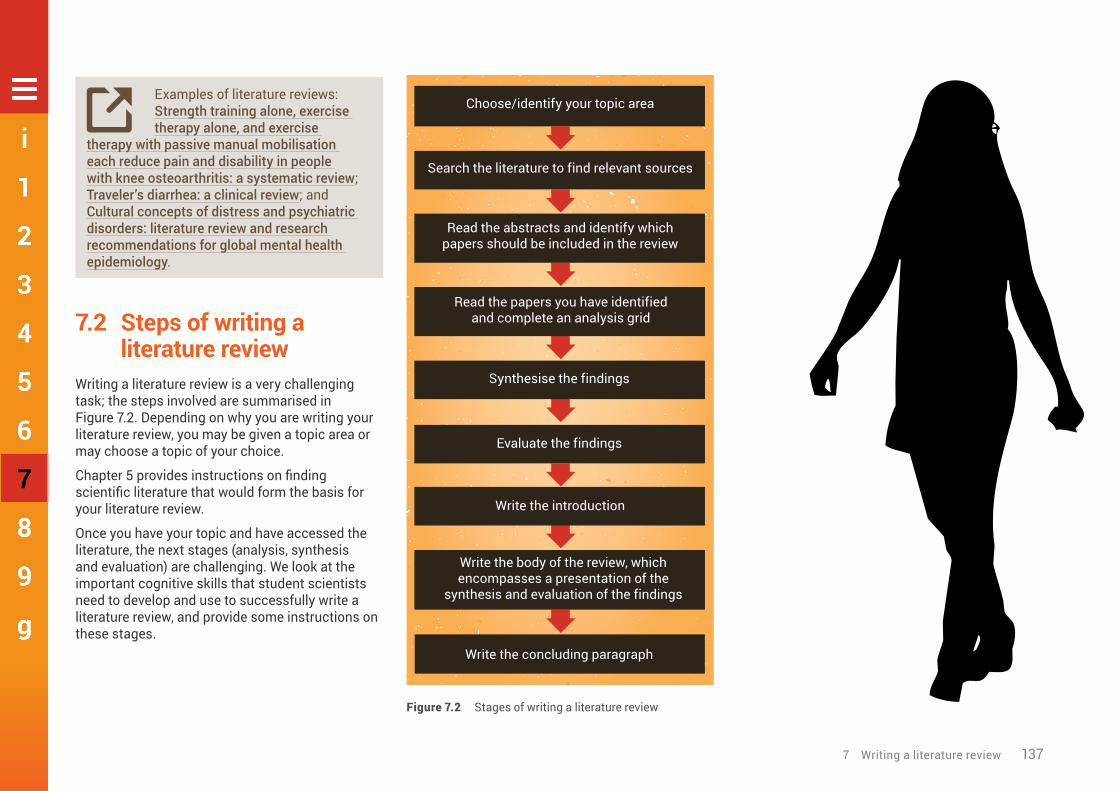
7 Writing a literature review 137
7
• Examples of literature reviews: Strength training alone, exercise therapy alone, and exercise
therapy with passive manual mobilisation each reduce pain and disability in people with knee osteoarthritis: a systematic review; Traveler’s diarrhea: a clinical review; and Cultural concepts of distress and psychiatric disorders: literature review and research recommendations for global mental health epidemiology.
7.2 Steps of writing a literature review
Writing a literature review is a very challenging task; the steps involved are summarised in Figure 7.2. Depending on why you are writing your literature review, you may be given a topic area or may choose a topic of your choice.
Chapter 5 provides instructions on finding scientific literature that would form the basis for your literature review.
Once you have your topic and have accessed the literature, the next stages (analysis, synthesis and evaluation) are challenging. We look at the important cognitive skills that student scientists need to develop and use to successfully write a literature review, and provide some instructions on these stages.
Search the literature to find relevant sources
Read the abstracts and identify which papers should be included in the review
Read the papers you have identified and complete an analysis grid
Synthesise the findings
Evaluate the findings
Write the introduction
Write the body of the review, which encompasses a presentation of the
synthesis and evaluation of the findings
Write the concluding paragraph
Choose/identify your topic area
Figure7.2 Stages of writing a literature review

7 Writing a literature review 138
7
Analysis and synthesisAnalysis, synthesis and evaluation are 3 essential skills that scientists require – and you will use these skills if you are to write a good literature review (Figure 7.3). These important cognitive skills are discussed in more detail in Chapter 9.
AnalysisThe first step in writing a literature review is to analyse the original investigation research papers that you have gathered about your topic.
Analysis requires examining the papers methodically and in detail, so that you can understand and interpret aspects of the study described in each paper.
An analysis grid is a simple tool that can help you to carefully examine and break down each paper. This tool will allow you to create a concise summary of each paper; see Table 7.1 for how to set up an analysis grid. When filling in the table, the aim is to draw out key aspects of each paper. Use a different row for each paper, and a different column for each aspect of the paper (Tables 7.2 and 7.3 show how a completed analysis grid may look).
Before completing your own grid, look at these examples and note the types of information that have been included, as well as the level of detail. Completing an analysis grid with a sufficient level of detail will help you to effectively synthesise and evaluate the information. This grid will allow you to more easily observe similarities and differences across the findings of the research papers, and to identify possible explanations (eg differences in methodologies employed) for observed differences between the findings.
Table7.1 Example of an analysis grid
Author, date and rationale Aim
Experimental design Results Conclusion Evaluation of findings
[Include details about the authors, date of publication and the rationale for the review]
[State the aim of the experiment]
[Summarise the experiment design, include the subjects used and experimental groups]
[Summarise the main findings]
[State the conclusion]
[Evaluate the paper’s findings, and highlight any terms or physiology concepts that you are unfamiliar with and should be included in your review]
AnalysisTaking a process or thing, and breaking it down into its basic parts
SynthesisCombining constituent elements of separate material into a single or unified entity
EvaluationCritiquing a product,a process or a theory, including identifying problems, and establishing cause and effect
Figure7.3 Cognitive skills required for writing a literature review

7 Writing a literature review 139
7
Author, date and rationale Aim Experimental design Results Conclusion Evaluation of findings
Schubert 2013A yet-to-be evaluated caffeine supplement is the energy shot, which is smaller in volume and lacks large amounts of sugars and/or carbonated water. They may be a viable precompetition supplement for runners
To examine the effects of energy shot caffeine consumption on time-trial performance in trained runners
6 male runners (competitive middle distance, and distance runners who participated in cross country, road races, and/or track racing) completed a 5-km time trial on a treadmillAge 22.5±1.8 yearsVO2max 69.1±5.7 mL/kg/minWeight (kg) 65.4±10.0Non-users of caffeine to moderate consumers of tea and coffee (n = 2, 150–200 mg/day)Randomised, single-blind placebo-controlled crossover design3 drinks (59 mL) 60 min before time trial:• placebo 0 mg caffeine (tasted like Red Bull)• Red Bull energy shot 80 mg caffeine• Guayaki Yerba Mate Organic Energy Shot
140 mg caffeine
Subjects refrained from caffeine consumption 36 h pre-test and did not perform intense exercise in the 48 h before testingDiet monitored for 24 h before first trial and repeated for 24 h before 2nd trialGas exchange data were recorded continuously; heart rate (HR) and rating of perceived exertion (RPE) were recorded every 3 min
Placebo 17.44±1.25 minRed Bull 17.55±1.01 minGuayaki 17.86±1.59 minNo significant difference in running time between treatment groups and placebo (p > 0.05)No difference in HR, RPE, VO2, VE, RER (p > 0.05)
Energy shot caffeine consumption did not improve time-trial running performance in trained runners
The dose of caffeine administered in this study (1.43–2.5 mg/kg for the lightest participant and 0.95–1.66 mg/kg for the heaviest participant) is below what may be a threshold dose (>2.5 mg/kg) for caffeine to elicit an ergogenic response
Details of subjects, including values
Conclusion of the research study; links back to aimUsually the most detailed column. Summarise the design of the study and include details. This will allow easy comparison with other papers
Summary of the basis for the research study
Summary of the key results (significant and nonsignificant), including values to allow comparison with other papers
Table7.2 Sample filled-in analysis grid for a research paper by Schubert and colleagues2
Study design
Details of doses
Details of data collection

7 Writing a literature review 140
7
Table7.3 Sample filled-in analysis grid for a research paper by Ping and colleagues3
Author, date and rationale Aim Experimental design Results Conclusion Evaluation of findings
Ping 2010The effect of chronic caffeine supplementation on endurance performance has been studied extensively in different populations. However, concurrent research on the effects of acute supplementation of caffeine on cardiorespiratory responses during endurance exercise in hot and humid conditions is unavailable
To determine the effect of caffeine supplementation on cardio-respiratory responses during endurance running in hot and humid conditions
9 heat-adapted recreational male runnersAge 25.4±6.9 yearsWeight (kg) 57.6±8.4Non-users of caffeine (23.7±12.6 mg/day)Randomised, double-blind placebo-controlled crossover design (at least 7 days gap between trials to nullify effect of caffeine)Caffeine (5 mg/kg) or placebo ingested as a capsule 1 hour before a running trial to exhaustion (70% VO2max on a motorised treadmill in a heat-controlled laboratory (31 °C, 70% humidity)Diet monitored for 3 days before 1st trial and repeated for 3 days before 2nd trial (to minimise variation in pre-exercise muscle glycogen)Subjects asked to refrain from heavy exercise for 24 h before trialsSubjects drank 3 mL of cool water per kg of body weight every 20 min during running trial to stay hydratedHeart rate (HR), core body temperature and rating of perceived exertion (RPE) were recorded at intervals of 10 min, while oxygen consumption was measured at intervals of 20 min
Mean exhaustion time was 31.6% higher in the caffeine group:• placebo 83.6±21.4• caffeine 110.1±29.3Running time to exhaustion was significantly higher (p < 0.05) in the caffeine trial compared with the placebo trialHR, core body temp, VO2 did not show any significant variation between trials (p > 0.05)Caffeine ingestion significantly (p < 0.05) decreased the RPE at 30, 40, 50 and 60 min. There were no differences (p > 0.05) between trials at 10 and 20 min, and at the end of the trial
Ingestion of caffeine improved endurance running performance, but did not affect heart rate, core body temperature, oxygen uptake or RPE
The lower RPE during the caffeine trial may be because of the positive effect of caffeine ingestion on nerve impulse transmission, as well as an analgesic effect and psychological effect. Perhaps this is the same reason subjects could sustain the treadmill running for longer in the caffeine trial

7 Writing a literature review 141
7
SynthesisStep 2 of writing a literature review is synthesising the papers, which you are now able to do after analysing them.
• Synthesis describes combining separate components or elements to form a connected whole.
You will use the results of your analysis to find themes to build your literature review around. Each of the themes identified will become a subheading within the body of your literature review.
• A good place to start when identifying themes is with the dependent variables
(results/findings) that were investigated in the research studies.
Because all of the research papers you are incorporating into your literature review are related to your topic, it is likely that they have similar study designs and have measured similar dependent variables. Review the ‘Results’ column of your analysis grid. You may like to collate the common themes in a synthesis grid (see, for example, Table 7.4).
This chapter includes a published literature review with annotations pointing out examples of synthesis; see pages 142–148 for examples of how to present synthesis in your literature review.
Look out for the green boxes like this. They indicate examples of synthesis.
Table7.4 Sample filled-in synthesis grid for comparison of research papers by Schubert et al2 and Ping et al3
Theme number Theme description
1 Running performanceCaffeine had no effect on running performance in the study by Schubert et al (2013). In contrast, caffeine ingestion improved running performance in the study by Ping et al (2010)
2 Rating of perceived exertion (RPE)Caffeine had no effect on RPE in the study by Schubert et al (2013). In contrast, caffeine ingestion decreased RPE at 30, 40, 50 and 60 minutes in the study by Ping et al (2010)
3 Heart rate (HR)Caffeine had no effect on HR in studies by Ping et al (2010) and Schubert et al (2013)
4 Oxygen uptakeCaffeine had no effect on total body oxygen consumption in studies by Ping et al (2010) and Schubert et al (2013)
Theme = dependent variable common to at least 2 analysed research articles
EvaluationStep 3 of writing a literature review is evaluation, which can only be done after carefully analysing your research papers and synthesising the common themes (findings).
During the evaluation stage, you are making judgements on the themes presented in the research papers that you have read – this includes providing physiological explanations for the findings. It may be useful to refer to a published discussion section of original investigation
research papers, or another literature review, where the authors may mention tested or hypothetical physiological mechanisms that may explain the findings.
When the findings of the papers related to a particular theme are inconsistent (eg one study shows that caffeine affects performance and another study shows that caffeine had no effect on performance), you should attempt to explain why the results differ, including physiological explanations. A good place to start is by comparing the methodologies to determine if there are any
Summary of the findings relating to this dependent variable

7 Writing a literature review 142
7
differences that may explain the inconsistencies in the findings (see the ‘Experimental design’ column of your analysis grid). An example of evaluation is shown in the ‘Running performance’ and ‘RPE ratings’ examples, opposite.
When the findings of the papers related to a particular theme are consistent (eg caffeine had no effect on oxygen uptake in both studies), an evaluation should include an explanation of why the results are similar, as well as physiological explanations. It is still a good idea to compare methodologies as a background to the evaluation. An example of evaluation is shown under the ‘Oxygen consumption’ example, opposite.
In addition to the examples shown here, this chapter includes a published literature review with annotations pointing out examples of evaluation; see pages 142–148 for examples of how to present evaluation in your literature review.
Look out for the orange boxes like this. They indicate examples of Evaluation.
Differences in caffeine doses presented as possible explanation for different results obtained by Ping and Schubert
Running performanceThe dose of caffeine administered in the study by Schubert et al (2013) was 1.43-2.5 mg/kg for the lightest participant and 0.95-1.66 mg/kg for the heaviest participant. This is below what may be a threshold dose (>2.5 mg/kg) for caffeine to elicit an ergogenic response. In contrast, the study by Ping et al (2010) admin-istered a higher dose of 5 mg/kg body weight, which appears to have been high enough to improve running performance.
Another potential mechanism to explain the discrepant findings is the different time periods the subjects were running for in the two studies. In the study by Ping et al (2010), the subjects ran for 84 minutes in the placebo trial, whereas in the study by Schubert et al (2013) subjects ran for 17 minutes in the placebo trial. It is possible that the ergogenic effect of caffeine on running performance is increased with a greater running work output. Indeed, other studies have shown that caffeine’s mechanism of action is to reduce perceptions of exertion and pain, enhance motor unit recruitment, and greater preservation of strength (Schubert et al 2013).
RPE ratingsThe lower RPE during the caffeine trial in the study by Ping et al (2010) may be due to the positive effect of caffeine ingestion on nerve impulse transmission, as well as an analgesic effect and psychological effect. This contrasts with the findings of Schubert et al who showed no effect of caffeine on RPE. This may be explained by the lower dose administered in this study by Schubert et al. (<2.5 mg/kg) compared to the higher dose administered in the study by Ping et al. (5 mg/kg).
Oxygen consumptionCaffeine had no effect on total body oxygen consumption in studies by Ping et al (2010) and Schubert et al (2013). These results indicate that caffeine had no effect on pulmonary oxygen diffusion and the ability of the cardiovascular system to deliver oxygen to the contracting muscle. The caffeine-induced improvement in performance seen in the study by Ping and colleagues (2010) may be explained by an enhanced reliance on anaerobic sources of energy, however, further research would be required to test this hypothesis.
Physiological explanation provided
Physiological explanation provided
Possible explanation for inconsistent results
Physiological explanation provided
Differences in running time presented as possible explanation for different results obtained by Ping and Schubert
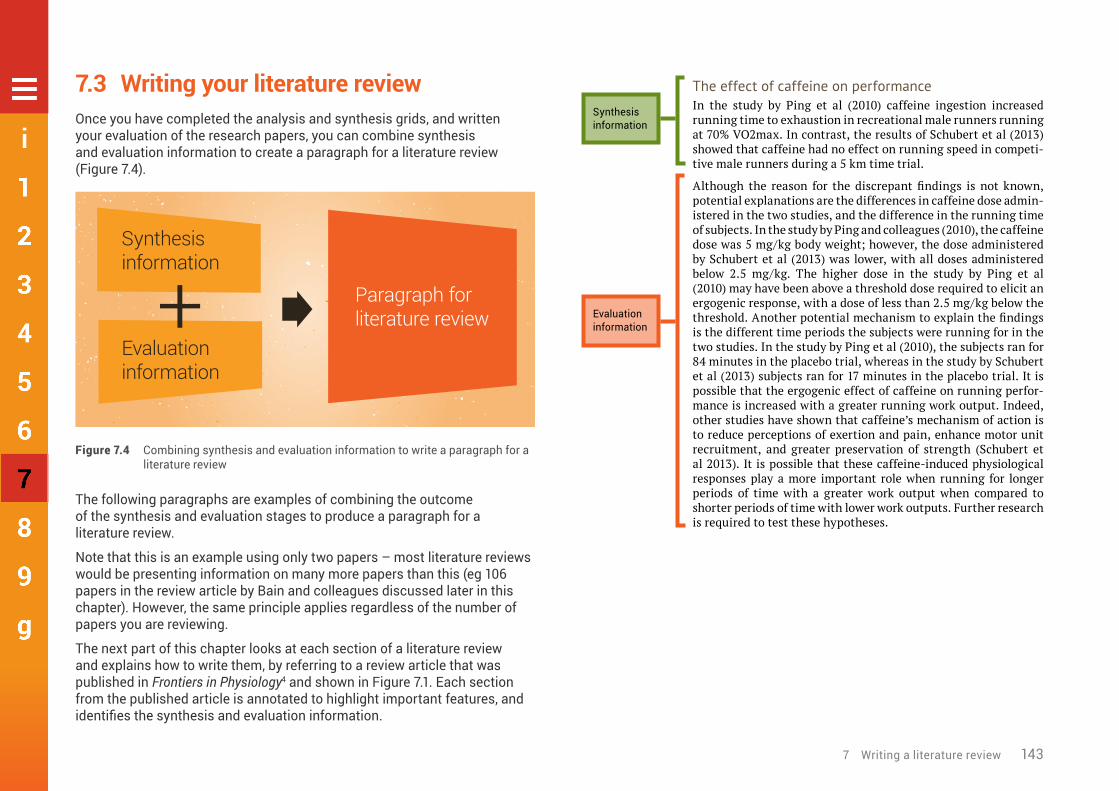
7 Writing a literature review 143
7
7.3 Writing your literature reviewOnce you have completed the analysis and synthesis grids, and written your evaluation of the research papers, you can combine synthesis and evaluation information to create a paragraph for a literature review (Figure 7.4).
Synthesis information
Evaluation information
Paragraph for literature review
Figure7.4 Combining synthesis and evaluation information to write a paragraph for a literature review
The following paragraphs are examples of combining the outcome of the synthesis and evaluation stages to produce a paragraph for a literature review.
Note that this is an example using only two papers – most literature reviews would be presenting information on many more papers than this (eg 106 papers in the review article by Bain and colleagues discussed later in this chapter). However, the same principle applies regardless of the number of papers you are reviewing.
The next part of this chapter looks at each section of a literature review and explains how to write them, by referring to a review article that was published in Frontiers in Physiology4 and shown in Figure 7.1. Each section from the published article is annotated to highlight important features, and identifies the synthesis and evaluation information.
The effect of caffeine on performanceIn the study by Ping et al (2010) caffeine ingestion increased running time to exhaustion in recreational male runners running at 70% VO2max. In contrast, the results of Schubert et al (2013) showed that caffeine had no effect on running speed in competi-tive male runners during a 5 km time trial.
Although the reason for the discrepant findings is not known, potential explanations are the differences in caffeine dose admin-istered in the two studies, and the difference in the running time of subjects. In the study by Ping and colleagues (2010), the caffeine dose was 5 mg/kg body weight; however, the dose administered by Schubert et al (2013) was lower, with all doses administered below 2.5 mg/kg. The higher dose in the study by Ping et al (2010) may have been above a threshold dose required to elicit an ergogenic response, with a dose of less than 2.5 mg/kg below the threshold. Another potential mechanism to explain the findings is the different time periods the subjects were running for in the two studies. In the study by Ping et al (2010), the subjects ran for 84 minutes in the placebo trial, whereas in the study by Schubert et al (2013) subjects ran for 17 minutes in the placebo trial. It is possible that the ergogenic effect of caffeine on running perfor-mance is increased with a greater running work output. Indeed, other studies have shown that caffeine’s mechanism of action is to reduce perceptions of exertion and pain, enhance motor unit recruitment, and greater preservation of strength (Schubert et al 2013). It is possible that these caffeine-induced physiological responses play a more important role when running for longer periods of time with a greater work output when compared to shorter periods of time with lower work outputs. Further research is required to test these hypotheses.
Evaluation information
Synthesis information

7 Writing a literature review 144
Key Physiological significance Aim Methods Conclusion Background information Synthesis Summary synthesis Evaluation, including hypotheses Identification of the problem & gap in understanding
Hyperthermia is associated with marked reductions in cerebral blood flow (CBF). Increased distribution of cardiac output to the periphery, increases in alveolar ventilation and resultant hypocapnia each contribute to the fall in CBF during passive hyperthermia; however, their relative contribution remains a point of contention, and probably depends on the experimental condition (e.g., posture and degree of hyperthermia).
The hyperthermia-induced hyperventilatory response reduces arterial CO2 pressure (PaCO2) causing cerebral vasoconstriction and subsequent reductions in flow. During supine passive hyperthermia, the majority of recent data indicate that reductions in PaCO2 may be the primary, if not sole, culprit for reduced CBF. On the other hand, during more dynamic conditions (e.g., hemorrhage or orthostatic challenges), an inability to appro-priately decrease peripheral vascular conductance presents a condition whereby adequate cerebral perfusion pressure may be compromised secondary to reductions in systemic blood pressure. Although studies have reported maintenance of pre-frontal cortex oxy-genation (assessed by near-infrared spectroscopy) during exercise and severe heat stress, the influence of cutaneous blood flow is known to contaminate this measure.
This review discusses the governing mechanisms associated with changes in CBF and oxy-genation during moderate to severe (i.e., 1.0°C to 2.0°C increase in body core temperature) levels of hyperthermia. Future research directions are provided.
Relevant background information
Relevant background information
Identification of the problem
Summary of recent literature on the topic
Purpose of the review
The dependence to maintain body core temperature within critically functioning limits (i.e., 37 ± 3°C) has led to seminal thermoregulatory research spanning the past 100 years (e.g., Haldane, 1905; Lindhard, 1910). From this, the capacity to effectively dissipate heat through convective and evaporative means and the concomitant cardiovascular adjust-ments to maintain thermoregulatory homeostasis has been topic of several extensive literature reviews (e.g., Rowell, 1974; Crandall and González-Alonso, 2010; Johnson and Proppe, 2011).
Only in the last decade, however, have we begun to appropriately understand the cerebro-vascular adjustments to hyperthermia.
The integrative components of cerebrovascular control and ultimately oxygenation, with focus on commonly occurring levels of hyperthermia (i.e., up to +2°C core temperature) form the basis of this review. Adjustments to the three variables germane to cerebral oxy-genation, fundamentally the components of the Fick equation; (1) cerebral metabolism, (2) cerebral O2 extraction, and (3) oxygen delivery (cerebral blood flow—CBF), are discussed. We further highlight the implications of cerebral heat balance and oxygenation during hyperthermic exercise, and provide methodological considerations for future work.
Identification of the issue
Overview of points covered in the review
IntroductionThe introduction should establish the context and importance of the review.
AbstractThe abstract should be 1 paragraph that accurately reflects the contents of the review article.

7 Writing a literature review 145
Key Physiological significance Aim Methods Conclusion Background information Synthesis Summary synthesis Evaluation, including hypotheses Identification of the problem & gap in understanding
Cerebral metabolismThe metabolic demand of human cerebral tissue is such that ~20% of total body oxygen consumption is taken up by the brain, despite only occupying 2–3% of total body mass. During passive hyperthermia of 1.5°C to 2°C above resting core temperature, whole body metabolic rate increases by ~25% (Saxton, 1981).
It remains unclear whether cerebral tissue significantly contributes to the rise in whole-body metabolism during passive hyperthermia.
For example, the Arrhenius activation law (or Q10, temperature coefficient), which describes the relation of biological activity to changes in temperature, implies that a rise in 2°C from 37°C should yield an increase in metabolic rate of ~10%, (South, 1958). However, the change in metabolic rate associated with the Q10 effect in vitro may be more sensitive during hypothermia, compared to hyperthermia (Sébert et al., 2003).
Nonetheless, several animal preparations have demonstrated that local cerebral or whole-body passive heating yields an increase in cerebral glucose utilization (McCulloch et al., 1982; Mickley et al., 1997) and cerebral metabolic rate (CMRO2) by 5 to 10% per degree Celsius rise in core temperature (Nemoto and Frankel, 1970a,b; Carlsson et al., 1976; Busija et al., 1988). In the dog, CMRO2 was elevated by 21% at a rectal temperature (Tre) of 42.1°C compared to baseline (Tre of 37.7); however, it began to fall at 43°C (Nemoto and Frankel, 1970b).
These latter data likely reflect the temperature dependence on critical cellular activity, whereby nucleotide degradation and blood brain barrier disruption (and imminent death if not treated) begins to occur at extreme core temperatures (i.e., 42°C in the human) (Bynum et al., 1978).
The molecular mechanisms that might impact on cerebral metabolism and oxygenation beyond a rise of 3°C have not been explored in humans, and are therefore beyond the scope of this review.
In humans, positron emission tomography measurements during passive heating to roughly +2°C rectal temperature show an increased metabolic rate of glucose in the hypo-thalamus, thalamus, corpus callosum, cingulate gyrus, and cerebellum (Nunneley et al., 2002). However, in the same study, significant declines in metabolic rate were observed in the caudate, putamen, insula, and posterior cingulum. To date, although regional dif-ferences are apparent, no study exists (to our knowledge) in the healthy awake human providing a measure of global cerebral metabolic rate during passive hyperthermia. In healthy humans during exercise, however, Nybo et al., (Nybo et al., 2002a) demonstrated with arterial and jugular venous sampling that cerebral metabolic rate is higher by ~7–8% when subjects are hyperthermic (see Discussion on Exercise).
Whether the confounding factor of exercise precludes the conclusion that hyperthermia alone causes an increase in cerebral metabolism, remains unknown.
Introductory sentences with general background information
Relevant theoretical background information
Synthesis of findings relating to human studies
Synthesis of literature relating to the potential importance of cerebral tissue metabolism in the rise of whole-body metabolism during hyperthermia in animal studies
The authors provide a hypothesis to explain the findings – this is the evaluation
Identification of gaps in knowledge; important that a literature review conveys current understanding of a topic area and highlights current knowledge gaps
Author evaluation
Identification of gap in current knowledge
Subheadings are included that separate the body of the review into themes
Body of literature review

7 Writing a literature review 146
Key Physiological significance Aim Methods Conclusion Background information Synthesis Summary synthesis Evaluation, including hypotheses Identification of the problem & gap in understanding
Still, given the theoretical Q10 (temperature coefficient) considerations, in conjunction with animal studies, human positron emission tomography data and exercise studies,it is likely that hyperthermia (of up to +3°C) proffers a dose-dependent response to increase cerebral metabolic rate.
Oxygen extractionOxygen is transported into cerebral tissue by diffusion, the speed of which is determined by the oxygen conductivity of cerebral tissue. Oxygen conductivity of cerebral tissue is fundamentally determined by the geometry of the capillaries and surrounding tissue (diffusion area and distance), and the tissue metabolism for a given oxygen gradient from the capillary to tissue (Gjedde, 2005). The speed of oxygen transport, or O2 extraction, can therefore be described as being inversely proportional to blood flow (when metabolism is held constant), and directly proportional to metabolism (when flow is held constant), and the surface area between the tissue and capillaries. As CBF, and subsequently O2 delivery is reduced, tissue extraction increases. However, because of the inverse relationship between blood flow and O2 extraction, when CBF is reduced by ~50–60%, the correspond-ing increase in O2 extraction (i.e., of 50–60%) is no longer sufficient to maintain a constant CMRO2 or adequate cerebral oxygenation (Lennox et al., 1935; Gjedde, 2005); i.e., a critical blood flow limit is reached. It follows that this theoretical critical flow limit is altered if metabolism changes; that is, the brain has a reduced critical CBF reserve for the mainte-nance of adequate cerebral oxygenation when metabolism (O2 demand) is increased.
Given the above theoretical considerations, if brain metabolism increases by a liberal 10% following a 2°C increase in tissue temperature, the critical reduction in blood flow to maintain oxygenation would be ~40–50%.
Cerebral blood flowDuring passive hyperthermia, respiratory and cardiovascular adjustments disrupt the natural coupling between CMRO2 and CBF. A neurogenic mechanism, i.e., cerebral vaso-constriction from increases in sympathetic nerve activity (SNA), has also been suggested to contribute to reductions in CBF during hyperthermia (e.g., Brothers et al., 2009b). Recent work in partitioning the roles of respiratory and cardiovascular mechanisms and considerations for neurogenic control of CBF during passive hyperthermia is discussed next.
Respiratory—arterial PCO2 (PaCO2)Hyperthermia in humans (among other species) is accompanied by a hyperventilatory response, and subsequently marked respiratory alkalosis. In 1905, Haldane was the first to describe, “breathing being more deeper and more frequent than usual” when hyperther-mic (Haldane, 1905).
A summary synthesis of this theme and …
Theoretical information provided and followed up with …
… the authors’ prediction of the effect of increased brain metabolism on oxygenation – this is the evaluation
Introductory text to lead the reader to the following headings within the theme
Introductory sentence setting the scene for the following text
Example of headings within the subheadings; helps to organise the information in a coherent manner
… the authors’ evaluation of the current knowledge of hyperthermia and cerebral metabolic rate
Body of literature review(continued)

7 Writing a literature review 147
Key Physiological significance Aim Methods Conclusion Background information Synthesis Summary synthesis Evaluation, including hypotheses Identification of the problem & gap in understanding
The magnitude of the hyperventilatory response is highly variable between individuals, and is likely dependent upon the rate and magnitude of rise in skin and core temperature; however, the reflex hyperventilation is not usually pronounced until a threshold increase in core temperature of at least 1°C (Barltrop, 1954 and for review see White, 2006). On average, a 1.5–2.0°C increase in core temperature during passive heating yields a reduction in end tidal CO2 (PETCO2), a validated surrogate for PaCO2 (Brothers et al., 2011a) of ~ 5–15 mmHg (see Table 1). However, the reported decline in PaCO2 varies considerably for a give increase in core temperature, which is likely governed by whether the external heating (i.e., skin temperature) was continued or attenuated to provide a steady-state core temperature. In some studies, PaCO2 can drop below 20 mmHg, and with severe passive heating (≥2°C) pronounced hyperventilation can lead to hypocapnia-induced carpopedal spasms and tetany (Iampietro et al., 1966 and unpublished observations).
The exact mechanisms responsible for the hyperventilatory response during hyperthermia in humans have not been fully delineated.
It is likely that a medullar integration of skin, and deep tissue temperature, principally hypothalamic temperature (Ingram and Whittow, 1962; Boden et al., 2000), primarily determine the magnitude of hyperventilatory response to hyperthermia. Temperature reception at the carotid bodies may also play an independent role (Zapata et al., 1994). For example, perfusion of warmed blood to the isolated carotid bifurcation elicits a transient hyperventilation in dogs (Bernthal and Weeks, 1939), while bilateral dissec-tion of the carotid nerves mitigates the ventilatory increase to whole body heating in cats (Fadic et al., 1991).
It is well established that PaCO2 is a potent modulator of CBF (Ainslie and Duffin, 2009). At rest, each mmHg change in PaCO2 above and below eupnia yields an approximate 4% increase and 2% decrease in CBF, respectively (Willie et al., 2012; and Willie et al., 2014 for review). During passive supine hyperthermia of +1–1.5°C core temperature above resting, a 10–20% reduction in cerebral blood flow is typically observed (see Figure 1 and Table 1).
The role of PaCO2 in the reduction of CBF during hyperthermia remains debatable.
Bain et al. (2013) recently demonstrated, using both volumetric and intra-cranial velocity measurements, that global (anterior and posterior) CBF during supine severe (+2°C esoph-ageal temperature) hyperthermia is completely restored to normothermic values upon returning PET CO2 back to normothermic levels (Figure 2). This finding is notionally corroborated by other studies (Fan et al., 2008; Nelson et al., 2011). It should be noted, however, that although middle cerebral artery (MCAv) and posterior cerebral artery (PCAv) velocities were statistically restored to normothermic values following PET CO2 restoration during +2°C hyperthermia in Nelson et al. (2011), they were still 9 and 3% lower respectively, than baseline values. To that end, in opposition of complete CBF res-toration following a return to eucapnia, Brothers et al. (2009b) reported that MCAv was only 50% restored back to normothermic values upon the restoration of PETCO2 during supine hyperthermia.
Synthesis
Theoretical information provided with reference to the literature
Followed by a comment clearly communicating current gaps in understanding
Synthesis of results summarising mechanisms most likely to explain the gap in understanding
More synthesis providing support for the hypotheses put forward in the text
Summary sentence clearly identifying current knowledge
Current gap in understanding
Body of literature review(continued)

7 Writing a literature review 148
Key Physiological significance Aim Methods Conclusion Background information Synthesis Summary synthesis Evaluation, including hypotheses Identification of the problem & gap in understanding
Although difficult to reconcile, these divergent findings may be explained by the variabil-ity in “steady-state” CBF following baseline PETCO2 restoration. For example, although absolute CO2 reactivity appears to be maintained during hyperthermia (Low et al., 2008), the dynamics of the CBF response to eucapnic restoration will in part be determined by the magnitude of the hyperventilation response (and resultant respiratory alkalosis) (Ide et al., 2003). That is, those with a larger hyperventilatory response will likely require a longer time to reach steady-state CBF values upon restoration of baseline PaCO2 due to a larger extra-cellular pH gradient. Moreover, sustained hypoventilation may eventu-ally lead to an adaptive response whereby restoration of baseline eucapnia will yield a temporary overshoot in CBF (compared to pre-stimulus values) (Ide et al., 2003).
The mechanisms of this CBF overshoot remains unclear, but may involve changes in lactate and bicarbonate (Albrecht et al., 1987; Marder et al., 1990).
The transient magnitude of the CBF overshoot therefore probably depends upon the length of time and magnitude of the hypocapnia. It is clear that this can influence “steady-state eucapnic” CBF measures, and may explain the variable conclusions for the role of PaCO2 in reducing CBF during hyperthermia. Nonetheless, taken the most recent data (Nelson et al., 2011; Bain et al., 2013), it is more than likely that PaCO2 explains the majority of the CBF reduction during passive hyperthermia, at least when subjects are kept in the supine position.
Still, future research is warranted to better clarify this role.
In contrast to supine hyperthermia, during upright seated hyperthermia, Fujii et al. (2008) and Ross et al. (2012), found that MCAv is only partially restored back to normother-mic levels upon restoration of PETCO2 with the addition of 5% CO2 to the inspired air. Furthermore, Nelson et al. (2011) found that head up tilt exacerbated the decline in MCAv and PCAv while hyperthermic, in the absence of significant further reductions in PETCO2.
It is therefore evident that, during hyperthermia, CBF is declined by increased hydrostatic pressure associated with posture (see Cardiovascular Section), independently of PaCO2.
Do changes in PaCO2 alter tolerance time to a simulated hemorrhage?Tolerance time to a simulated hemorrhage is clearly reduced while hyperthermic compared to normothermic (Allan and Crossley, 1972; Wilson et al., 2006; Keller et al., 2009; Brothers et al., 2011b). Reductions in PaCO2 associated with hyperthermia-induced hyper-ventilation appear to have little influence on the reduced ability to withstand simulated hemorrhage (Lucas et al., 2013; Pearson et al., 2013).
This suggests that cardiovascular adjustments contribute more to tolerance time (i.e., minimum cerebral oxygenation levels before syncope) than baseline CBF during a graded hemorrhage simulation. This notion is supported by findings from our laboratory where tolerance to graded lower body negative pressure was unaltered even when baseline CBF was reduced by ~30% via administration of indomethacin, independently of changes in PaCO2 (Lewis et al., under review).
More evaluation
Synthesis
Evaluation
Summary synthesis
Evaluation
Evaluation – theory presented that may explain inconsistent findings
Current gap in understanding
Evidence provided to support the hypothesis – also evaluation
Body of literature review(continued)

7 Writing a literature review 149
Key Physiological significance Aim Methods Conclusion Background information Synthesis Summary synthesis Evaluation, including hypotheses Identification of the problem & gap in understanding
Such findings may be attributed to the fact that simulated hemorrhage time is typically determined by the time elapsed before ethically low blood pressure levels (usually a SBP of <80 mmHg) are attained, rather than syncope itself. A perhaps more ecological stance is the view that a reduction in CBF at baseline, although not effecting tolerance time to simulated hemorrhage, effectively reduces the buffer zone for CBF to change before syncope occurs. As such, when PaCO2 and subsequently CBF, is reduced from hyper-thermia, any condition eliciting a faster or larger perturbation in BP (i.e., a period when cerebral autoregulation is less effective) (Tzeng and Ainslie, 2013) compared to graded lower body negative pressure, may pose an increased risk of syncope.
It should be noted, however, that dynamic cerebral autoregulation, as indexed by steady-state linear transfer function analysis, appears to be maintained (Low et al., 2009) or perhaps even improved, with hyperthermia (Brothers et al., 2009a).
Cardiovascular controlIn order to promote heat loss via evaporative and convective means during severe passive hyperthermia, cutaneous blood flow can increase upwards of 25-fold (e.g., from ~300 to 7500 mL•min−1) (Rowell et al., 1969; Rowell, 1986). The large increase in cutaneous vascular conductance is met by concomitant increases in cardiac output (at times up to 13 mL•min−1) (Rowell et al., 1969; Rowell, 1986), accomplished almost exclusively via increases in heart rate. In turn, it is now well accepted that resting BP, and therefore perfusion pressure to the brain during passive, supine hyperthermia, is generally preserved, or only moderately decreased (see Crandall and González-Alonso, 2010 for a comprehensive review on the cardiovascular functioning during hyperthermia).
It is interesting to note, however, that BP estimations during passive hyperthermia vary considerably (see Table 1).
These variations likely reflect the difficulty in acquiring accurate BP measurements without measuring it intra-arterially during hyperthermia (Ganio et al., 2011).
Nonetheless, in contrast to passive supine hyperthermia, it is generally accepted that adequate BP is not maintained under dynamic hyperthermic conditions, e.g., with an orthostatic challenge or hemorrhage.
Any condition that compromises CBF maintenance inherently increases the risk of syncope/reduction of cerebral oxygenation. As mentioned, tolerance to an orthostatic challenge or simulated hemorrhage is reduced when hyperthermic (Allan and Crossley, 1972; Wilson et al., 2006; Keller et al., 2009; Brothers et al., 2011b).
Given that changes PaCO2 seem to play a negligible role in determining tolerance time to a simulated hemorrhage (see section Do changes in PaCO2 alter tolerance time to a simulated hemorrhage?), two key cardiovascular adjustments are likely responsible; (1) the inability to decrease systemic vascular compliance (SVC) (Wilson et al., 2002a; Ganio et al., 2012), and (2) a greater reduction in stroke volume for a given reduction in left ven-tricular filling pressure (i.e., a leftward shift of the operating point to a steeper portion on the Frank Starling curve) (Wilson et al., 2009).
Evaluation
Background
Evaluation
Summary synthesis
Summary
Body of literature review(continued)

7 Writing a literature review 150
Key Physiological significance Aim Methods Conclusion Background information Synthesis Summary synthesis Evaluation, including hypotheses Identification of the problem & gap in understanding
Clearly, the former dictates the latter.
When normothermic, it is well established that SVC decreases during a simulated hemor-rhage (Murray et al., 1968).
Why SVC does not also decrease when hyperthermic, is not entirely understood.
However, it is generally accepted that an inhibition of cutaneous vasoconstriction is likely at play (Crandall et al., 2010).
An improvement to orthostatic tolerance following acute skin cooling while hyperthermic lends evidence to this hypothesis (Wilson et al., 2002b).
The mechanisms of cutaneous vasculature control remains a complex field of study, riddled with redundant mechanistic pathways (for a review see Charkoudian, 2010).
Nonetheless, it appears that human physiology places a hierarchy for heat loss during hyperthermia, potentially to the detriment of adequate central blood volume and subse-quently CBF/consciousness.
Dehydration (i.e., ≥2% loss of body mass) often follows prolonged sweating, and is therefore closely tied to hyperthermia. A major cardiovascular consequence of dehydration is a dose-dependent decrease in blood volume (Kempton et al., 2009). In turn, dehydration impairs the ability to maintain adequate central blood volumes, and thus CBF during an orthostatic challenge (Harrison et al., 1986; Romero et al., 2011).
Carter et al. (2006) demonstrated that the transient reductions in MCAv were larger upon standing from sitting when dehydrated (3.0% reduction in body mass), compared to euhy-drated. Consistent with this finding, Moralez et al. (2012) demonstrated that dehydration (2.7% reduction in body mass) exacerbated the reductions in BP and MCAv upon standing following a 10-rep maximum leg press.
It is therefore reasonable to assume that when hyperthermia is coupled with dehydration, the ability to maintain adequate CBF is further reduced during orthostatic challenges or hemorrhage.
In contrast to the apparent reduction in CBF with an orthostatic challenge when dehy-drated, Fan et al., (Fan et al., 2008) demonstrated that when subjects were supine, dehydration (1.5% reduction in body mass) increased resting MCAv by ~11%. When subjects were made hyperthermic, however, dehydration appeared to have little or no effect on the reduction in MCAv.
It is difficult to reconcile why MCAv was increased with normothermic dehydration compared to euhydration. Increases in CBF during passive supine dehydration may be related to the increased osmolality of extracellular fluid via cerebral cellular shrinkage [i.e., increased concentrations of solutes in the extracellular fluid cause an intra-to extra
Summary synthesis
Background
Synthesis
Synthesis
Evaluation
Evaluation
Background information
Current gap in understanding
Summary synthesis
Linking word
Body of literature review(continued)
Evaluation
Evidence provided to support the hypothesis – also evaluation

7 Writing a literature review 151
Key Physiological significance Aim Methods Conclusion Background information Synthesis Summary synthesis Evaluation, including hypotheses Identification of the problem & gap in understanding
cellular fluid shift (Kempton et al., 2009)]. In turn, CBF during supine dehydration may be increased to maintain an appropriate ionic milieu for neuronal function.
Nonetheless, during passive supine hyperthermia, the marked reductions in MCAv associ-ated with the reduced PaCO2 seem to shadow any effect of dehydration (Fan et al., 2008).
…
Conclusions and future directionsThe fate of cerebral oxygenation during hyperthermia of up to +2°C core temperature is dependent upon the integrative balance between increases in metabolism and oxygen extraction, with declines in cerebral perfusion pressure from reductions in PaCO2 and increased systemic vascular conductance (Figure 3).
When left in the supine position, a ~10 mmHg drop in PaCO2 following a 2°C increase in core temperature yields an average CBF reduction by ~25%. At which point, it stands to reason that the global theoretical capacity to increase cerebral O2 extraction is, on average, effective in maintaining cerebral oxygenation, even with an increase in cerebral metabolism of ~10%. On the other hand, the inability of the cardiovascular system to maintain perfusion pressure to the brain during more dynamic conditions (e.g., hem-orrhage or orthostatic challenge), coupled with a reduced CBF baseline from reductions in PaCO2, potentiates a condition whereby cerebral oxygenation could be compromised following maximal O2 extraction potential. This fact is clearly evidenced by the reduced tolerance time to simulated hemorrhage, and the increased occurrence of syncope during hyperthermia.
Recent data have collectively provided a salient understanding of cerebral oxygenation during varying degrees of whole-body hyperthermia, however several avenues of exper-imentation remain. First, it is evident that direct measurements of arterial and cerebral venous blood in humans are required to experimentally verify changes in cerebral metab-olism and oxygenation with separate levels of CBF during hyperthermia. Second, albeit inherently difficult to execute, a conclusive study on the role of SNA on CBF during hyperthermia is required. Third, the importance of extra-cranial contamination on NIRS-derived oxygenation values has been highlighted during changes in skin blood flow (Davis et al., 2006) and also where scalp ischemia induced by inflation of a circumferential cranial tourniquet impacted NIRS readings (Davie and Grocott, 2012). Although newer clinically available NIRS monitors use algorithms to subtract light absorption from superficial tissue (e.g., scalp, skin, bone, pia matter) from deeper tissue (Zheng et al., 2013), the utility during hyperthermia and/or exercise remains to be established. Lastly, the interactive role of dehydration, heat acclimatization and certain pathologies (e.g., heart failure, diabetes, autonomic disorders, etc.) on cerebral oxygenation during heat stress should be focus for future work.
Evaluation
Summary of the main findings of the studies presented, referring to physiological mechanisms, and application of the evidence presented
The next sections follow the same pattern described here.
Body of literature review(continued)

7 Writing a literature review 152
7
7.4 Referencing the reviewThe reference section provides a list of the references that you cited in the body of your review article. The format will depend on the journal of publication because each journal has its own specific referencing format.
It is important to accurately cite references in research papers to acknowledge your sources and ensure that credit is appropriately given to authors of work you have referred to. An accurate and comprehensive reference list also shows your readers that you are well read in your topic area and are aware of the key papers that provide the context to your research.
It is important to keep track of your resources and to reference them consistently in the format required by the publication in which your work will appear. Most scientists will use reference management software to store details of all of the journal papers (and other sources) they use while writing their review article. This software also automates the process of adding in-text references and creating a reference list. In the review article by Bain et al4 used as an example in this chapter, the reference list contains 106 items, so you can imagine how much help referencing software would be. Chapter 5 shows you how to use EndNote – one example of reference management software.
References1 Pautasso, M 2013, ‘Ten simple rules for writing
a literature review’, PLoS Computational Biology, vol. 9, no. 7, pp. e1003149.
2 Schubert, MM, Astorino, TA & Azevedo, JJL 2013, ‘The effects of caffeinated ‘energy shots’ on time trial performance’, Nutrients, vol. 5, no. 6, pp. 2062–2075.
3 Ping, WC, Keong, CC & Bandyopadhyay, A 2010, ‘Effects of acute supplementation of caffeine on cardiorespiratory responses during endurance running in a hot and humid climate’, Indian Journal of Medical Research, vol. 132, pp. 36–41.
4 Bain, AR, Morrison, SA & Ainslie, PN 2014, ‘Cerebral oxygenation and hyperthermia’, Frontiers in Physiology, vol. 5, p. 92.
Photo: La Trobe University
Chapter 8: Sharing science with the community

8 Sharing science with the community 154
8
8 Sharing science with the community
I n this chapter, you will learn more about what some high-profile scientists have to say on the importance
of scientific literacy, and science communication to the general public or non-expert audience (see Box 8.1). We will share some simple tips on how you can communicate effectively with the community at large to make your impact.Our society advances depending on the scientific literacy of its citizens. Scientifically literate individuals – such as science graduates – are trained to think scientifically. Not only do they understand scientific concepts, but they also know the nature of science and how we came to know what we do.
Thinking scientifically and critically – separating false claims that lack scientific evidence from
scientifically valid information – is essential for everyday life. Individuals who are scientifically literate are able to make responsible decisions and participate in society in a positive way.
Citizens cannot be expected to improve their scientific literacy on their own, but many people can play a part in this important endeavour. This includes graduates from science, the medical and dental professions, the allied health disciplines, and other science-related fields, including science journalism.
What the future holds in store for individual human beings, the nation, and the world depends largely on the wisdom with which humans use science and technology. And that, in turn, depends on the character, distribution, and effectiveness of the education that people receive. – Science for All Americans, American Association for the Advancement of Science1
Improving the scientific literacy in our communities depends on the ability of science-educated individuals to reach out to our citizens and communicate science to them in a way that has a long-lasting affect.
Your task is to inspire the community, fascinate them – and scare them when appropriate. Overall, you must help to educate the public and instil a passion that makes them want to learn more. This is how we can get people to change their behaviours in ways that will positively affect our future. Scientifically literate members of society will then go on to educate their own children, who will, in turn, instil scientific literacy in their children, and so on.
• The general public is an audience with variable educational backgrounds and scientific
understanding. Initially, it may be more difficult to communicate effectively with them than with your scientific peers. But this just takes practice. Many science curriculums focus on teaching facts. Communication tasks tend to be largely restricted to the scientific community.
For the student scientist, it should be clear that one of the many important things that we need to achieve is an increase in the scientific literacy of our citizens, if humanity is to have the best possible future.
8.1 Where to startSo what are some relatively straightforward and simple ways that people can communicate both formally and informally to the general public – in a way that is effective? Although there is no definite and correct answer, the suggestions in Figure 8.1 should steer you in the right direction.
Enhancedscientific literacy
Know your audience demographics,
disposition, knowledge
Ensure your topic is significant and relevant to your
audience
Include information about how science came to know the
facts on your topic
Know the effect you wish to have on your audience
Ensure your communication platform is appropriate for your audience
Use language suitable to your audience
Figure8.1 How to increase scientific literacy in the general public
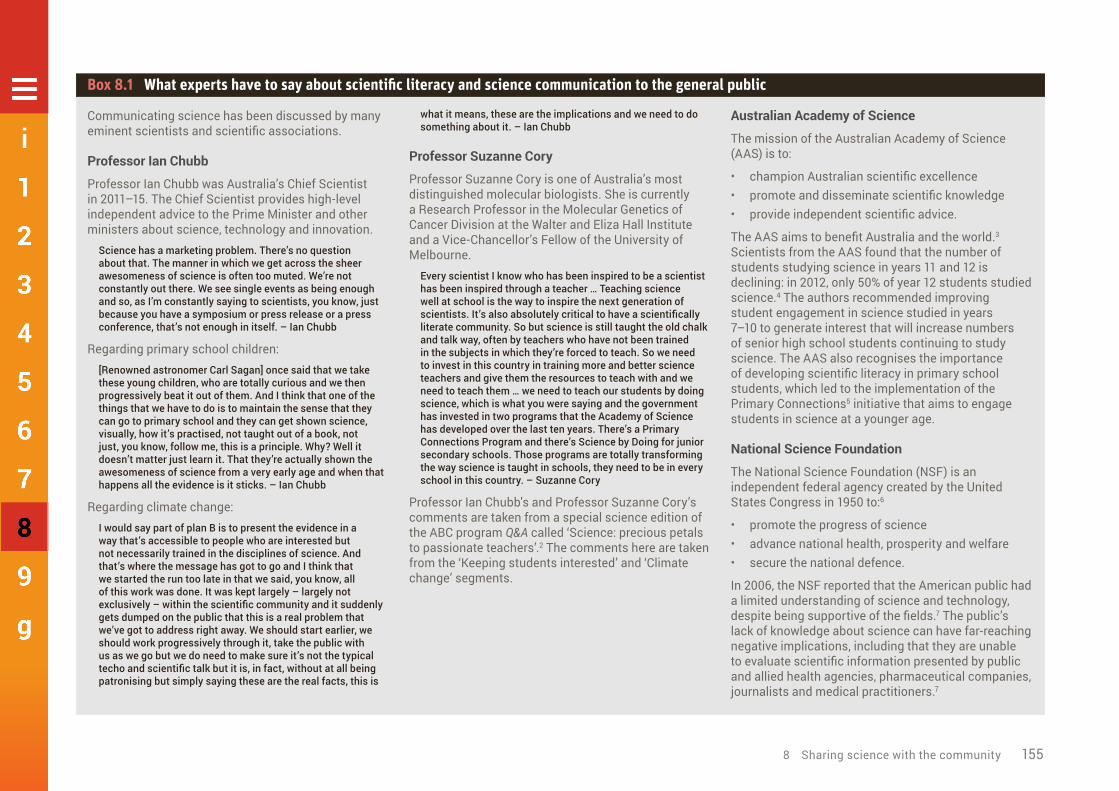
8 Sharing science with the community 155
8
Box 8.1 What experts have to say about scientific literacy and science communication to the general public
Communicating science has been discussed by many eminent scientists and scientific associations.
Professor Ian Chubb
Professor Ian Chubb was Australia’s Chief Scientist in 2011–15. The Chief Scientist provides high-level independent advice to the Prime Minister and other ministers about science, technology and innovation.
Science has a marketing problem. There’s no question about that. The manner in which we get across the sheer awesomeness of science is often too muted. We’re not constantly out there. We see single events as being enough and so, as I’m constantly saying to scientists, you know, just because you have a symposium or press release or a press conference, that’s not enough in itself. – Ian Chubb
Regarding primary school children:[Renowned astronomer Carl Sagan] once said that we take these young children, who are totally curious and we then progressively beat it out of them. And I think that one of the things that we have to do is to maintain the sense that they can go to primary school and they can get shown science, visually, how it’s practised, not taught out of a book, not just, you know, follow me, this is a principle. Why? Well it doesn’t matter just learn it. That they’re actually shown the awesomeness of science from a very early age and when that happens all the evidence is it sticks. – Ian Chubb
Regarding climate change:I would say part of plan B is to present the evidence in a way that’s accessible to people who are interested but not necessarily trained in the disciplines of science. And that’s where the message has got to go and I think that we started the run too late in that we said, you know, all of this work was done. It was kept largely – largely not exclusively – within the scientific community and it suddenly gets dumped on the public that this is a real problem that we’ve got to address right away. We should start earlier, we should work progressively through it, take the public with us as we go but we do need to make sure it’s not the typical techo and scientific talk but it is, in fact, without at all being patronising but simply saying these are the real facts, this is
what it means, these are the implications and we need to do something about it. – Ian Chubb
Professor Suzanne Cory
Professor Suzanne Cory is one of Australia’s most distinguished molecular biologists. She is currently a Research Professor in the Molecular Genetics of Cancer Division at the Walter and Eliza Hall Institute and a Vice-Chancellor’s Fellow of the University of Melbourne.
Every scientist I know who has been inspired to be a scientist has been inspired through a teacher … Teaching science well at school is the way to inspire the next generation of scientists. It’s also absolutely critical to have a scientifically literate community. So but science is still taught the old chalk and talk way, often by teachers who have not been trained in the subjects in which they’re forced to teach. So we need to invest in this country in training more and better science teachers and give them the resources to teach with and we need to teach them … we need to teach our students by doing science, which is what you were saying and the government has invested in two programs that the Academy of Science has developed over the last ten years. There’s a Primary Connections Program and there’s Science by Doing for junior secondary schools. Those programs are totally transforming the way science is taught in schools, they need to be in every school in this country. – Suzanne Cory
Professor Ian Chubb's and Professor Suzanne Cory’s comments are taken from a special science edition of the ABC program Q&A called ‘Science: precious petals to passionate teachers’.2 The comments here are taken from the ‘Keeping students interested’ and ‘Climate change’ segments.
Australian Academy of Science
The mission of the Australian Academy of Science (AAS) is to:
• champion Australian scientific excellence• promote and disseminate scientific knowledge• provide independent scientific advice.
The AAS aims to benefit Australia and the world.3
Scientists from the AAS found that the number of students studying science in years 11 and 12 is declining: in 2012, only 50% of year 12 students studied science.4 The authors recommended improving student engagement in science studied in years 7–10 to generate interest that will increase numbers of senior high school students continuing to study science. The AAS also recognises the importance of developing scientific literacy in primary school students, which led to the implementation of the Primary Connections5 initiative that aims to engage students in science at a younger age.
National Science Foundation
The National Science Foundation (NSF) is an independent federal agency created by the United States Congress in 1950 to:6
• promote the progress of science• advance national health, prosperity and welfare• secure the national defence.
In 2006, the NSF reported that the American public had a limited understanding of science and technology, despite being supportive of the fields.7 The public’s lack of knowledge about science can have far-reaching negative implications, including that they are unable to evaluate scientific information presented by public and allied health agencies, pharmaceutical companies, journalists and medical practitioners.7

8 Sharing science with the community 156
8
To help you decide what to do next, choose your starting point – one of concept, audience or mode – and refer to Figure 8.2.
If you are interested in a particular concept, follow the yellow arrows in Figure 8.2:• Who needs to know about this concept?• What mode of communication is this audience
most likely to respond to?
If you have identified an audience you would like to communicate to, follow the brown arrows in Figure 8.2:• What is a concept this audience needs to know
about?• How do you best communicate to this
audience?
If you have identified a mode of communication you would like to use, follow the red arrows in Figure 8.2:• Who would be most likely to respond to this
mode of communication?• What is a concept this audience needs to
know about?
Know your audienceSuccessful science communicators must be able to recognise and understand their target audience, and make the science accessible to them.8 Examples of discrete audiences include:• preschool children• primary school children• secondary school students• university students• patients diagnosed with a particular condition• family members of patients diagnosed with a
particular condition• older people• people from a particular demographic (eg non-
English speaking background)• inactive individuals• overweight individuals• smokers.
As you can see, your audience can vary a lot!
To narrow down and understand your audience, analyse the audience. This will allow you to communicate with them more effectively.
TopicWHAT…
AudienceWHO…
ModeHOW…
Figure8.2 Relationship between concept, audience and mode when communicating science

8 Sharing science with the community 157
8
• One of the resources for ‘The writer’s workshop: skills for success' course offered by
the Business Administration Program at the University of Washington is a series of questions to help you analyse your audience.9 This resource lists 3 main areas to consider when analysing your audience: demographics, disposition and knowledge. These questions are written in reference to a reading audience, but they apply to all audience types. The resource also suggests that you consider how each of the factors you identify affects your readers’ attitudes, expectations and opinions about you and your topic.
• The Australian Bureau of Statistics website allows you to access national and regional statistics on
the Australian population. Results from the most recent census as well as statistics on social trends are available.
• The Australian Curriculum sets consistent national standards to improve learning outcomes for
all young Australians; implementation began in 2014. The Australian Curriculum website contains information on the science curriculum taught from foundation to year 10 and in senior secondary years.
• The Victorian Environmental Assessment Council published a report called Demographic
characteristics of communities within the Melbourne Investigation Area.
Ensure that your topic is significant and relevant to your audienceTo have a significant and positive impact on improving scientific literacy in the community, your choice of topic should be contemporary and highly relevant to your audience. Equally important, you need to communicate in such a way that – in the end – the audience truly believes that the issue really matters to them. If your audience believes this, their attitude and behaviour will start to change in line with what the science is telling us.
Remember that members of the general public are likely to be more interested in the implications and impact of science, rather than the scientific technicalities that we talk about with our scientific peers.
A good way to determine why a particular concept is important is by asking yourself that exact question. Is it related to a significant health issue for the Australian population, such as mental health, inactivity, poor diet, diabetes mellitus, cardiovascular disease or cancer? Is it an important global issue, such as climate change?
The world faces myriad issues: energy, food and water security; climate change; biodiversity; infectious diseases and conditions, such as those caused by Zika virus and Ebola virus; health issues such as cardiovascular health and diabetes; air

8 Sharing science with the community 158
8
pollution; and mental health for trauma survivors. These are only a small percentage of the world’s most important problems – many more need to be communicated to the public.
• The Australian Institute of Health and Welfare website has a list of national health priority areas, as
well as data on a range of health and welfare issues sorted by subject.
Contrary to what you might think, science professionals are yet to successfully communicate these issues adequately to the general public. If we improve our science communication to the public and increase scientific literacy, we increase our chances of successfully confronting these challenges, both domestically and globally.
Box 8.2 provides some examples of topics, target audiences and desired outcomes.
Ensure that your communication platform is appropriate for your audienceConsider the vast array of available platforms for communicating about your topic to your audience:• websites• posters and brochures• newspaper and magazine articles• songs, games and videos• classroom activities• podcasts and mobile apps• artworks.
Box 8.2 Examples of topics and appropriate target audiences
Never forget that the knowledge we have is because of science. Wherever possible, include relevant information on how we came to know what we do. In other words, how has the science evolved that has led us to our current understandings on the issue?
It’s also important to know what types of attitude and behaviour changes the science is telling us should take place. Your communication should help the population move towards these changes, along with an understanding of why the changes should occur.
Type II diabetes prevention
Audience and task: Communicate to a group of newly joined Weight Watchers members on how they can reduce their risk of developing type II diabetes. These individuals will be overweight and at an increased risk of developing the disease.
Desired outcome: Increased activity and weight loss, and decreased risk of developing type II diabetes in these individuals, combined with an understanding of how poor diet and inactivity increase the risk of developing diabetes.
Cardiovascular disease prevention
Audience and task: Communicate to the general public on what the risk factors are for developing cardiovascular disease, and what can be done to reduce the risk.
Desired outcome: Increased activity, weight loss in overweight individuals, a healthier diet rich in antioxidants, quitting smoking or never taking it up, decreased risk of developing cardiovascular disease, combined with an understanding of the science behind the risks of cardiovascular disease.
The benefits of quitting smoking
Audience and task: Communicate to the smoking population the dangers of smoking and some tips on how to stop.
Desired outcome: Quit smoking and understand the health benefits of doing so.
The benefits of not taking up smoking
Audience and task: Communicate to a group of primary school children the dangers of smoking and some tips on how not to take it up.
Desired outcome: Reduce rates of smoking uptake in our young population and increase understanding of the health benefits of not taking up smoking.
The benefits of regular physical activity
Audience and task: Communicate to a group of primary school children the benefits of regular physical activity before bad habits set in.
Desired outcome: Increased activity levels, reducing the risk of cardiovascular disease, diabetes and obesity, combined with an understanding of why exercise helps do this.
How to prevent the spread of Zika virus
Audience and task: Communicate to the general public in South America and North America what science tells us about the best way to treat and prevent the spread of Zika virus.
Desired outcome: Decreased spread of Zika virus, combined with an understanding of how Zika virus spreads.

8 Sharing science with the community 159
8
It is important to engage with the audience using a genre appropriate to that audience. For example, if you would like to create a video to communicate your topic, would it be best to select a topic that would be of interest to 15–20-year-olds or to 60–70-year-olds? Consider how you would justify your decision. Box 8.3 provides a list of resources that can help you decide on your communication platform.
Regardless of the communication platform that you choose, take care to present your communication piece professionally – this is likely to have a greater impact on your audience.
Which communication platform to use?
• The Australian Bureau of Statistics published a report called Household use of information
technology, Australia.
• The Australian Communications and Media Authority (ACMA) published a report called
Smartphones and tablets take-up and use in Australia.
• Roy Morgan Research posts details on readership statistics for major Australian newspapers.
• YouTube provides summary statistics on viewers of content on its site.
Use language suitable for your audienceTo successfully communicate your topic or concept to your target audience, you must
consider the unique characteristics of your audience and their knowledge in the area.
As part of your audience analysis, you will research the characteristics of your audience. This analysis will tell you important information about the demographics, disposition and knowledge of your audience. All of these factors will influence your choice of language for your communication piece.There are a few dos and don’ts when communicating with nonscientific audiences:• DO use plain language.• DO NOT use scientific jargon.• DO use compelling arguments and scenarios.• DO use symbolism and analogies.
Plain languageCommunicating to the public in simple language was important enough to see the Plain Writing Act of 2010 passed into law in the United States by President Barack Obama in 2010.
• A website called PlainLanguage.gov was set up to provide resources to help communicate in plain
language. On this website, Kathy McGinty10 provides an example of how easy it is to complicate a simple message. In Figure 8.3, we reversed the example to show how to simplify a complex statement.
Avoid using scientific jargonJargon is the specialised vocabulary of any profession, trade, science or hobby. Scientific jargon is that vocabulary specific to science, and each field of science will have its own jargon.
Box 8.3 Useful programs for creating communication pieces
Many easy-to-use programs are available for creating communication pieces that look professional. This is not an exhaustive list of useful software but it’s certainly a great place to start:
• Adobe Spark can help you create social graphics, web stories and animated videos – in minutes.
• Microsoft Sway helps you make and share interactive reports, presentations and stories.
• iMovie or Windows Movie Maker helps you to make short movies; it comes standard with your Apple or Windows PC.
• Moovly allows you to make animated videos, presentations, infographics and videoclips.
• Visme allows you to create presentations and infographics.
• Audacity is a free, sophisticated audio recording and editing software.
• Canva is a free-to-access website that allows you to do simple graphic design, and create flyers, posters and presentations.
• PowToon allows you to create animated videos and presentations.
• VideoScribe offers a 7-day free trial to create whiteboard-style animations.

8 Sharing science with the community 160
8
There is no escaping the fact that it is considered very important to note that a number of various available applicable studies ipso facto have generally identified the fact that additional appropriate nocturnal employment could usually keep juvenile adolescents off thoroughfares during the night hours, including but not limited to the time prior to midnight on weeknights and/or 2 a.m. on weekends.
There is no escaping the fact that it is considered very important to note that a number of various available applicable studies have generally identified the fact that additional appropriate nocturnal employment could usually keep juvenile adolescents off thoroughfares.
A number of various available applicable studies have generally iden-tified the fact that additional appropriate nocturnal employment could usually keep adolescents off thoroughfares.
Various available applicable studies have identified the fact that addi-tional appropriate nocturnal employment would keep adolescents off thoroughfares.
Studies have identified the fact that additional nocturnal employment would keep adolescents off thoroughfares.
Studies have found that additional nocturnal employment would keep adolescents off thoroughfares.
Night work would keep teens off the streets.
Step 1: Eliminate foreign words and phrases. They only lengthen your sentences without adding meaning. Especially popular are Latinisms and other obscurities whose meanings have long been forgotten (if they were ever known).
Step 4: Sentences are often sprinkled with classic redundancies, which repeat meaning or information already included. Remove these.
Step 5: Sentences are often full of weasel words. Take these out. ‘A number’ is a popular weasel phrase because it can refer to any number at all: –9, 4.78, 0, 5 billion, you name it. ‘Usually’ and ‘generally’ are also weasel words that just fill space without adding meaning.
Step 6: Do not rely on adjectives such as available, applicable and appropriate to lengthen sentences – these do not add meaning.
Step 7: Eliminate ‘sophisticated-sounding’ verbs. Most are vague and complicate the message. The verb ‘found’ is clear and simple, whereas 'indicate', 'develop' and 'identify' are verbs with so many meanings that you can use them in almost any context to mean almost anything – and therefore nothing. People who use 'identify' or 'indicate' often add ‘the fact that’ to the sentence to make it even more longwinded and meaningless.
Step 8: Replace complex multiple-syllable words of Latin or Greek origin with simple words like more, jobs, night, youths and streets.
Step 9: Shorten your statement by deleting any reference to studies. Often, the author is not even aware of any studies, and they often use weaseling to get out of this (see Step 5). However, as a good science communicator, you would be aware of studies, and you must reference these!
Step 2: Get rid of legalisms – they are generally redundant.
Step 3: Remove meaningless ‘it is’ and ‘there is/are’ expressions. Some people believe that they give a ‘scholarly ring’ to your sentences, but they don’t!
Source: McGinty10
Figure8.3 How to simplify a complex message
verbose and unclear
concise and clear

8 Sharing science with the community 161
8
Any biochemist researching in the area of antioxidants and oxidative stress will be familiar with terms and acronyms such as free radical, superoxide dismutase, catalase, glutathione peroxidase, reactive oxygen species, superoxide, hydroxyl radical, hydrogen peroxide, SOD, GPX and H2O2.
But do not use any of this jargon when communicating with non-expert audiences. Instead, you will need to replace the relevant jargon with simple words that your audience will understand:
Low levels of alpha-tochopherol promote endothelial dysfunction.
becomes:An appropriate intake of vitamin E in the diet is important to maintain healthy blood vessels. (Scientific statement translated for a group of individuals who need to improve their diet to reduce the risk of cardiovascular disease.)
Use compelling arguments and scenariosAlthough you should never exaggerate the science when communicating with your audience, it is appropriate to tell the truth and share scenarios that may be confronting.
For example, if you are communicating with a group of smokers, it might be appropriate to show pictures of what a smoker's lung looks like. Likewise, let your audience know what their health outcome could be if they continue to smoke heavily.
Compelling arguments and scenarios are more likely to affect the audience and – as we already know – this brings potential for action and positive change.
Use symbolism such as analogiesUsing symbolism or analogies is not a necessity when communicating science to the public, but it may be appropriate in some circumstances.
• An analogy is a comparison between one thing and another, typically to explain or clarify something.
Given that scientific concepts may be difficult for the general public to grasp, using an example of something the audience is already familiar with can help them to understand what you are trying to tell them.
8.2 Examples of communication pieces for nonscientific audiences
As you can see from the examples in this section, the ideas for communicating effectively are endless.
It might be easier than you think to create something that will have an impact on a population group and help increase the scientific literacy in our society. What are you waiting for?
Michiko Maruyama and Art of learning
Source: by Michiko Maruyama from www.artoflearning.ca and used with permission from Michiko Maruyama.
Michiko Maruyama was a medical student at the University of British Columbia Northern Medical Program. Before starting medical school, Michiko completed an industrial design degree at the University of Alberta.
At the end of each day, I sit and I think about everything that I had learned from morning till night and I transform it into a Daily Doodle. By combining studying and drawing, each doodle acts as a learning tool and a creative exercise. – Michiko Maruyama11
Schwann cells are the main supporting cells (glia cells) of the peripheral nervous system. Similar to the oligodendrocytes in the CNS, the purpose of the Schwann cell is to produce a fatty insulating blanket of myelin. The myelin sheath is wrapped around the axon in a fashion similar to rolling a cinnamon bun, creating concentric layers called lamellae. The purpose of the myelin sheath is to increase the speed of impulses across the axon, similar to the insulation around an electric wire. Unlike electric wires that have continuous insulation, gaps exist between the multiple blankets of myelin. These

8 Sharing science with the community 162
8
gaps, known as Nodes of Ranvier, allow the impulse to 'jump' from node to node, increasing the impulse’s speed even more.
This Daily Doodle captures the interdependent relationship between the Schwann cell and the peripheral nerve axon. Both the axon and the Schwann cell depends on each other for support and development. If the axon is destroyed, the Schwann cell will begin to de-differentiate and if the Schwann cells are destroyed, the axon will begin to degrade.12
blue = Schwann cell; pink = nucleus of Schwann cell; yellow = axon of a peripheral nerve
Bundle of love
Source: ‘Bundle of love’ by Michiko Maruyama from www.artoflearning.ca and used with permission from Michiko Maruyama
Magazine article explaining recent research findings to a non-expert audienceYou need to write a 500-word article for a non-expert audience explaining the pathophysiology of a disease. In addition, you include recent research findings from a recently published journal article.
• E Vance (2010). Is estrogen the new ritalin?, in Scientific American Mind, p. 6.
News story published on a website explaining exciting new scientific inventions for studying disease and what this means for patients
Lab-developed organoids
Source: Used with permission from copyright owner: Cincinnati Children’s13

8 Sharing science with the community 163
8
News story published on a website about a new potent antibiotic that doesn’t encounter any detectable resistance
Game Changing New Antibiotic, ABC News Online Screenshot
Source: Australian Broadcasting Corporation (ABC) Library Sales, used under ABC licence
News story published on a website explaining an important discovery of a genetic mutation
Gene Mutations, ABC Science Online Screenshot
Source: Australian Broadcasting Corporation (ABC) Library Sales, used under ABC licence

8 Sharing science with the community 164
8
Classroom activity/lesson plan to help explain a concept to primary school studentsA primary school teacher needs a lesson for a 1-hour class. You could provide a solution that includes a few PowerPoint slides, an activity for the students to do and some questions at the end so they can test how well they did.
• The game Synaptic Tag helps students learn about neuroscience.
Classroom activity/lesson plan to help explain a concept to first-year university students studying physiologyFirst-year physiology students need to understand a challenging concept in an upcoming workshop. The communication activity could help students with terminology, or an activity that is structured as a group activity to help the students understand the concept.
• H Carvalho (2011). A group dynamic activity for learning the cardiac cycle and action potential.
• T Thompson (2009). Respiratory action maze.
A poster displayed in a clinic waiting room to communicate ways to reduce the risk of contracting/transmitting an illness or diseaseYou did a short course in graphic design a few years ago, and you could use these skills to design a poster that incorporates some physiology and a public health message. You could also design a brochure to give health centre patients to take home.
• See some historical examples of public health posters collected by the US National Library of Medicine.
A game for university classmates to help remember a difficult concept
You studied a challenging concept in second-year physiology, and want to design a fun game that will help students understand the physiology or revise before an exam.
• Odenweller, C Hsu and S DiCarlo (1998). Educational card games for understanding gastrointestinal physiology.
Source: ‘ “Cover Coughs, Cover Sneezes” – NARA – 514081’ by US National Archives and Records Administration, used under CC0 1.0

8 Sharing science with the community 165
8
A video explaining a useful concept to non-expertsYou have learned to use some video production software, and you want to use these skills to make a video (or a 12–14-frame storyboard) explaining an important concept.
• Kidney physiology, cardiovascular system, and Primary amoebic meningoencephalitis and
Naegleria fowleri.
A song explaining a useful concept to non-expertsIf you are a talented songwriter, you write a song suitable for your target audience that explains a scientific concept, or a jingle for an advertising campaign. Your target audience could be primary school or university students, or the general public.
• Circulatory system song.
A podcast in which you explain an important concept for a non-expert audienceYou love making podcasts, so you make one about something that you find interesting and important enough to be published on your university website.
• The Infinite Monkey Cage, 60-Second Science, and Talk Nerdy.
A mobile app for smartphones or tablets that allows students of any age to better understand a conceptYou may want to design a mobile app that secondary or tertiary students can use to start understanding physiology – in a fun way!
An artwork for display that demonstrates your understanding of a conceptIf you are a talented artist, you could create an artwork (painting, mixed-media model, sculpture or a set of mounted photographs) that could be displayed in the newly refurbished physiology laboratories, or in an appropriate setting such as a physiotherapist’s waiting room. The artwork explains an important concept in a creative and appealing way.
• Running and Calcium and the pancreas.
References1 Nelson, GD 1998, ‘Science literacy for all: an
achievable goal?’ Optics and Photonics News, vol. 9, no. 9, p. 42.
2 McEvoy, P 2014, ‘Science: precious petals to passionate teachers’, Q&A, Australian Broadcasting Corporation, Ultimo, New South Wales.
3 Australian Academy of Science, About Us, Australian Academy of Science, viewed 19 January 2015, <https://www.science.org.au/about-us>.
4 Goodrum, D, Druhan, A & Abbs, J 2012, The status and quality of Year 11 and 12 science in Australian schools, Australian Academy of Science, Canberra.
5 Australian Academy of Science, PrimaryConnections: Linking Science with Literacy, viewed 21 October 2013, <http://primaryconnections.org.au/index.html>.
6 National Science Foundation, About the National Science Foundation, National Science Foundation, viewed 19 January 2015, <http://www.nsf.gov/about/>.
7 Kahlor, L & Stout, P 2010, Communicating science: new agendas in communication, Taylor and Francis, New York.
8 Colthorpe, K, Rowland, S & Leach, J 2013, Good practice guide (science). Threshold learning outcome 4: communication, Office for Learning and Teaching, Sydney.

8 Sharing science with the community 166
8
9 University of Washington, Audience Analysis, University of Washington, viewed 5 December 2014, <http://faculty.washington.edu/ezent/aaaa.htm>.
10 McGinty, K, 9 Easy Steps, viewed 19 January 2015, <www.plainlanguage.gov/testexamples/indexExample.cfm?record=6&search=humor>.
11 Maruyama, M 2016, Art of Learning, viewed 3 April 2015, <www.artoflearning.ca>.
12 Verkhratsky, A & Butt, A 2007, Glial neurobiology, Wiley.
13 Cincinnati Children’s 2014, Lab-developed Intestinal Organoids Form Mature Human Tissue in Mice, Cincinnati Children’s, viewed 16 January 2015, <www.cincinnatichildrens.org/news/release/2014/lab-grown-intestines-10-19-2014>.

Photo: La Trobe University
Chapter 9: Your life and career as a scientist

9 Your life and career as a scientist 168
9
9 Your life and career as a scientist
T his chapter explains what it means to be a scientist, which is more than just ‘doing science’. You’ll also learn
about career options, and how to use your skills once you enter the workforce.So far, you have learned ‘how to do science’. But what now? Being a scientist means that science will be a part of your life for years to come. The way a scientist thinks and behaves informs how they do scientific tasks. Alongside developing your scientific knowledge and skills throughout your science degree, you will be given the opportunity to develop the personal and professional responsibility that will guide you throughout your life. A group of science academics, science students, employment groups and professional societies identified 3 things that a science graduate should know and be able to do regarding accountability for their own learning and scientific work by the time they graduate (Figure 9.1).
9.1 Being independent and self-directed learners
Employers of science graduates often try to find candidates with a variety of skills, such as having the ability to make decisions, being project
Being independent and self-directed learners
scientist
Working effectively, responsibly and
safely as an individual or a team
Demonstrating knowledge of the guidelines and laws relevant to their disciplinary area, and personally practising ethical conduct
Source: Yucel1
Figure9.1 Three areas of personal and professional responsibility for science graduates to master

9 Your life and career as a scientist 169
9
management minded, being resourceful and having good problem-solving abilities.1
In the workforce, science graduates often find themselves in an environment that has little direction from management, and they may need to develop or adapt new skills and understandings.1
Therefore, as a student scientist, learn to take responsibility for your success during your studies, so you will be prepared to continue doing so after you graduate.
To succeed in your chosen career, you will need to develop autonomy as a learner and be able to judge your own performance – Figure 9.2 shows the characteristics you will need to become an independent and self-directed learner.1
• This video was produced by Nottingham Trent University. It summarises independent learning –
what it is, how to do it, why it is important and what it means for a university student.
Cognitive skills you need to be a good scientistTo be able to think like a scientist and do all of the tasks required of a scientist, you need to develop the cognitive skills lying along a continuum – from simple to complex – as shown in Bloom’s taxonomy of learning (Figure 9.3).2
Capabilities and attributes required to be a scientist
• Capabilities and attributes are skills that you can demonstrate; they are highly valued by employers.
Most universities have a set of skills that are referred to as ‘graduate capabilities’; these
are usually focused around similar skill sets. Sometimes graduate capabilities are referred to as ‘generic skills’ or ‘transferable skills’ – but most of all they can be thought of as ‘interdisciplinary skills’ that are important in science as well as a range of other disciplines.3
Interdisciplinary skills are the foundation skills that graduates will use in their everyday work to communicate effectively, professionally, ethically and with understanding of the diversity of the population in all occupations and disciplines.3
As an example, La Trobe University’s graduate capabilities are summarised into 4 areas and sets of skills; see Figure 9.4.
La Trobe University has seen the importance of skills beyond the basic capabilities discussed above, and has recently introduced the La Trobe Essentials (Figure 9.5).5 The 3 Essentials – Global
Self-motivators
Self-managers
Self-appraisers
Figure9.2 Characteristics of an independent and self-directed learner
create
evaluate
analyse
apply
understand
remember
Produce new or original workDesign, assemble, construct, conjecture, develop, formulate, author, investigate
Justify a stand or decisionAppraise, argue, defend, judge, select, support, value, critique, weigh
Draw connections among ideasDifferentiate, organise, relate, compare, contrast, distinguish, examine
Use information in new situationsExecute, implement, solve, use, demonstrate, interpret, operate, schedule, sketch
Explain ideas or conceptsClassify, describe, discuss, explain, identify, locate, recognise, report,
select, translate
Recall facts and basic conceptsDefine, duplicate, list, memorise, repeat, state
Figure9.3 Bloom’s taxonomy of learning

9 Your life and career as a scientist 170
9citizenship, Innovation and entrepreneurship, and Sustainability thinking – were chosen as the specialist areas that leaders and experts at La Trobe University believe will give their students an edge when seeking employment. Focusing on these areas during their undergraduate degree
will give students the opportunity to adapt their knowledge and skills to new contexts in a rapidly changing world.
Innovation and entrepreneurship
Global citizenship
Sustainability thinking
Global citizenship recognises that we live in an interconnected world and all of the work we do, no matter the discipline, is happening in this context. This Essential will prepare students to recognise the global context we live and work in, exchange values and perspectives across diverse cultures, act across diverse cultures and boundaries, and work with diverse communities.
Innovation and entrepreneurship is the Essential that will support students to tackle problems creatively, generate new ideas, create change, resolve problems and take risks in whatever field they choose.
Sustainability thinking gets students to think about the responsibility we all have to our planet and to future generations. This Essential will prepare students to harness the economic benefits of sustainability, develop solutions that transcend borders, work to renew people and cultures, and build social cohesion.
Source: La Trobe University3,5,6
Figure9.5 The La Trobe Essentials
Literacies and communication skillsThe key elements of this capability are: • writing• speaking• quantitative literacy• cultural literacy.
Personal and professional skillsThe key elements of this capability are: • teamwork, including leadership• autonomy and independence• ethical behaviour• adaptability skills• study and learning skills.
Inquiry and analytical skillsThe key elements of this capability are: • critical thinking• creative problem solving• inquiry and research.
Discipline-specific knowledge and skillsThe key elements of this capability are those specific to the discipline area for which it is being articulated, but are not covered by the other attributes.
Source: La Trobe University4
Figure9.4 La Trobe University’s graduate capabilities

9 Your life and career as a scientist 171
9
9.2 Working effectively, responsibly and safely as an individual or a team
Scientists will work both independently and in teams, and will practise working in both contexts during their undergraduate degree – see Figure 9.6.
As a student scientist, it is essential that you adopt a professional approach to your scientific learning and work because this will ultimately help you to make important contributions to science and society.
Ways in which you can adopt a professional approach include: • demonstrate the use of appropriate techniques
and equipment in projects• be organised, on time and respectful to
colleagues• demonstrate an awareness of relevant issues
such as environmental, safety, community or political issues
• seek a range of information to develop and strengthen projects that you are part of
• interact with appropriate specialists to achieve agreed outcomes and develop broader knowledge
• adapt positively to change and take initiative • complete tasks in a safe, competent and timely
manner • demonstrate professional ethics.
Student scientists should conduct scientific enquiry in a manner that falls within the codes of practice for workplace health and safety. This includes considering the following, when relevant:• basic workplace health and safety• biological safety• chemical safety• electrical safety• laboratory equipment safety• personal protective equipment• radiation and laser safety.
Source: ‘Researchers review documents’ by Rhoda Baer, used under CC0 1.0
Working effectively, responsibly and safely Understand how to take responsibility for yourself and others, and understand relevant occupational health and safety requirements of scientific work.
Working as a teamHave the skills to function effectively as members or leaders of scientific or multidisciplinary teams, and appreciate that science is primarily a collaborative activity
Working as an individual Work independently, with limited supervision
Source: Whatley7
Figure9.6 Working effectively, responsibly and safely, as an individual or as part of a team

9 Your life and career as a scientist 172
9Team contextAll scientists work in teams, and student scientists will get to practise their teamwork skills during their undergraduate degree. Some features of successful teams are shown in Figure 9.7.
• Teams are formed when people come together to work towards a common goal.
Figure 9.8 lists some ways that you can be an effective and efficient team member.
Team projectsThere are several things you should consider when starting a team project:• Get to know the rest of your team. Think of
your team as puzzle pieces that can be placed together in a variety of ways.9
• Establish team work agreements. Newly established teams should consider completing a team work agreement. It has been shown that team cohesion, trust, and awareness of members’ obligations, expectations of others and working relationships are improved when teams establish ground rules at the beginning of a project.7
A clear mission for the team with defined outcomes
Creation of an environment where leadership is fostered
Established roles in addition to leaders, where each team member has a role to play
Accountability that fosters mutual curiosity and maintains a high work standard
Creation of an environment where interpersonal relations are developed
Source: Whatley7
Figure9.7 Features of successful teams
Communicate effectively with others, which includes listening, praising the good work of others, and giving and receiving constructive criticism
Develop and maintain the trust and confidence of your peers by performing tasks to the best of your ability
Encourage mutual respect
Seek input from internal and external sources to improve communication
Attempt to build and maintain network relationships and, in doing so, sustain a team ethicBe willing to compromise and
manage disagreements
Motivate the team and keep track of goals (leadership roles can be taken on by different students at different times)
Source: Loughlin8
Figure9.8 How to be an effective and efficient team member

9 Your life and career as a scientist 173
9
• Create team goals. Decide on the big-picture goals of the team and record these (perhaps in your team agreement).
• Create task lists, and clearly define roles and responsibilities. A team should operate as a mosaic whose unique strengths and differences convert into a powerful united force.9 Create a detailed task list and a timeline to complete these tasks.
• Decide on a team communication process. This includes the preferred method, frequency and nature of team communication, and ensuring that relevant contact details are shared. Consider making use of tools that let you communicate and collaborate with your team mates online. For example, use Zoom software for online video meetings when you can’t meet in person. Office365 and Google software allow multiple people to work together on one document, spreadsheet or presentation.
• Establish proper team dynamics. Decide on acceptable and unacceptable team dynamics, and record how unacceptable team dynamics will be dealt with should they arise (perhaps in your team agreement).
Figure 9.9 shows some effective ways to communicate with your team – it is compiled from past student scientists.
9.3 Guidelines, laws and ethical conduct
High-quality science graduates have an understanding of their social, cultural and environmental responsibilities as they study the natural world.
As a student scientist, you should do your best to behave ethically throughout your undergraduate study, to prepare you to become an ethical professional. Examples of ethical conduct in action include:• accurate data recording and storage• proper referencing and avoiding plagiarism• intellectual integrity• safe disposal of biological and chemical waste• knowledge and application of the principles of
animal ethics and/or human ethics.
Being an ethical scientist is more than just doing the right thing. It requires scientists to act in the right spirit, out of respect and concern for one’s fellow creatures.10
How to be an ethical scientist – personal responsibilityScientists and philosophers have spent their lives considering the aims of science and how scientific research should be conducted. David Resnik summarised the most important principles displayed by an ethical scientist (Figure 9.10):11
• The principle of honesty may be the most important – without it, science as we know it would not be possible. You can’t find truth if lying is acceptable.
• Carefulness is important because it encourages scientists to do their best to avoid careless errors and oversights. As humans, we do make mistakes, but explicit carelessness can impede the search for truth and knowledge.
Share phone numbers and email addresses
Complete necessary and appropriate prereading
Reply to team members in a timely fashion
Arrive at team meetings and class on time
Have a team brief at the beginning of team sessions
Use time wisely
Use social media to communicate
Set small, achievable deadlines frequently
Figure9.9 Team communication tips

9 Your life and career as a scientist 174
9
Scientific honesty
Intellectual freedom
Carefulness
Openness
Credit
Public responsibility
Do not commit scientific fraud – that is, do not fabricate, fudge, trim, cook, destroy or misrepresent data.
Share data, results, methods, theories, equipment and so on. Allow people to see your work, and be open to criticism.
Do not plagiarise the work of other scientists; give credit where credit is due (but not where it is not due).
Strive to avoid careless errors or sloppiness in all aspects of scientific work.
Scientists should be allowed to pursue new ideas and criticise old ones. They should be free to conduct research they find interesting.
Report research in the media when the research has an important and direct bearing on human happiness, and when the research has been validated by scientific peers.
Source: Resnik11
Figure9.10 Fundamental principles of scientific research
Box 9.1 Ethics of stem cell research
Most of us have heard of stem cell research, but what exactly is it?
Stem cell research involves using embryonic stem cells or adult stem cells to learn more about human health and disease. Embryonic stem cells are derived from embryos and are highly versatile – they can give rise to any type of cell in the fully developed body. Adult stem cells are more limited, because they can only give rise to certain cell types.
Australian scientists have been at the cutting edge of stem cell research since the discovery of the human embryonic stem cell line in the late 1990s. Despite the overwhelming potential of this research to progress human health, some individuals are highly opposed to the use of embryonic stem cells because of the associated ethical issues.
Much debate has surrounded the ethical issues associated with stem cell research. The following videos show the views of US President Obama and former president Bush of this research.
As you will see, world leaders don’t always agree on the ethical issues surrounding modern-day scientific research.
George W Bush on stem cell research
President Obama on stem cell research

9 Your life and career as a scientist 175
9
• Openness among scientists increases our ability to obtain knowledge and solve problems. By allowing criticism of our work, we get closer to the truth.
• The principle of credit motivates scientists to do good work and makes them accountable for their work.
How to be an ethical scientist – guidelines and lawsIn many cases, the government may be involved in establishing guidelines or laws for safe and ethical behaviour.
• Guidelines are sets of nonmandatory rules, principles or recommendations for procedures or
practices in a particular field.12 Laws are rules that regulate the actions of people and may be enforced by applying penalties.
Guidelines and laws relevant to scientists cover experimentation and data collection, quality control procedures, and appropriate safety procedures. For example, scientists and student scientists need to perform scientific work in accordance with the Workplace Health and Safety Act 2011. This Act provides a balanced and nationally consistent structure to help protect workers, including science students, against harm to their health, safety and welfare by eliminating or minimising work-related risks. There are also instances when you might need to obtain a government permit for a certain type of activity or research.
Human researchScientists and science students involved in human research studies need to respect human research participants. They also need to comply with ethical principles of integrity, respect for persons, justice and goodness, as elaborated in the National statement on ethical conduct in human research (2007).
The statement is a series of guidelines developed by the National Health and Medical Research Council, the Australian Research Council and Universities Australia. These guidelines were developed to promote ethically good human research, protect participants and foster research that will benefit the community.10
Unfortunately, history shows us that human research participants have not always been treated with respect. Some research studies have been done in the past that humanity should not be proud of.
• The following thought-provoking videos are on bioethics, the history of bioethics and why we need to
respect human participants during scientific research studies.
Ethics in science (in 4:30)
The Nuremberg Code: a turning point in the history of bioethics
The worst Nobel Prize ever awarded
See how research ethics have changed since 1932 in a comprehensive research ethics timeline.
Animal researchTo learn more about human health and disease, many scientists use animal models. When doing so, the welfare of the animals must be respected.
The Australian code for the care and use of animals for scientific purposes, 8th edition (2013) provides principles for the guidance of teachers, investigators, and all people involved in the care and use of animals for scientific purposes. It provides guidelines for the humane conduct of scientific and teaching activities, and for accessing animals.
The code of practice states that animals should only be used for scientific purposes when the study:13
• has scientific or educational merit• aims to benefit humans, animals or the
environment• is conducted with integrity.
In addition, the number of animals used should be minimised, the wellbeing of the animals must be supported, and harm (including pain and distress) to the animals must be avoided or minimised.13
Nevertheless, the community still debates whether animals should be used to progress science. The following videos present both sides of this debate:
• Ethics of Animal Testing Debate
Animal Research Laboratory
Animal Testing Ethics
Taboos of Science

9 Your life and career as a scientist 176
9
9.4 Careers for science graduates
The great physicist Edwin Hubble, speaking at Caltech’s commencement in 1938, said a scientist has ‘a healthy skepticism, suspended judgement, and disciplined imagination’ – not only about other people’s ideas but also about his or her own. The scientist has an experimental mind, not a litigious one. – Atul Gawande14
Student scientists don’t necessarily go on to a career as a laboratory-based scientist. They do, however, take their scientific literacy and skills to whatever profession they enter. Trained scientists from a range of disciplines and fields are valuable additions to teams and companies.
Australia’s former Chief Scientist Professor Ian Chubb and his office prepared a report on the importance of science, technology, engineering and mathematics (STEM) graduates in Australia’s future, which stated:
An education in STEM … fosters a range of generic and quantitative skills and ways of thinking that enable individuals to see and grasp opportunities. These capabilities – including deep knowledge of a subject, creativity, problem solving, critical thinking and communication skills – are relevant to an increasingly wide range of occupations. They will be part of the foundation of adaptive and nimble workplaces of the future. – Office of the Chief Scientist15
Throughout your undergraduate degree, you will develop a range of practical skills that will be useful in whatever professional roles you take on in the future – Figure 9.11 summarises a number of these skills.
The United Kingdom’s Science Council has identified 10 types of scientists working today (Figure 9.12).16 This list highlights that not all scientists end up working in laboratories – in fact, a wide variety of jobs need the knowledge and skills developed during a science degree, as discussed earlier in this chapter.
How to work in a laboratory
How to reference
How to do statistical analyses
How to search databases
How to talk and write about science and other topics
How to work as part of a team
How to present data in, for example, graphs or tables
Figure9.11 Practical skills student scientists develop during their training

9 Your life and career as a scientist 177
9
References1 Yucel, R 2013, Good practice guide (science).
Threshold learning outcome 1: understanding science, Office for Learning and Teaching, Sydney.
2 Bloom, BS 1984, Taxonomy of educational objectives book 1: cognitive domain, Longman, New York.
3 La Trobe University 2016, La Trobe Essentials: Sustainability Thinking, La Trobe University, viewed 12 August 2016, <www.latrobe.edu.au/essentials/sustainability-thinking>.
4 La Trobe University 2016, Graduate Capabilities. La Trobe Framework 2016, La Trobe University, viewed 12 August 2016, <www.latrobe.edu.au/sdvc/la-trobe-framework/graduate-capabilities>.
5 La Trobe University 2016, La Trobe Essentials, La Trobe University, viewed 12 August 2016, <www.latrobe.edu.au/essentials>.
6 La Trobe University 2016, La Trobe Essentials: Innovation and Entrepreneurship, La Trobe University, viewed 12 August 2017, <www.latrobe.edu.au/essentials/innovation-and-entrepreneurship>.
7 Whatley, J 2009, ‘Ground rules in team projects: findings from a prototype system to support students’, Journal of Information Technology Education, vol. 8, pp. 161–176.
8 Loughlin, W 2013, Good practice guide (science). Threshold learning outcome 5: personal and professional responsibility, Australian Government Department of Education, Canberra, <www.olt.gov.au/system/files/resources/Science%20Good%20Practice%20Guide%202013%20TLO5.pdf>.
The business scientist• Combines their scientific knowledge and evidence-led
decision-making skills with excellent management and business skills
• Works in science and technology companies in roles including research and development, and marketing
The developer scientist• Transforms knowledge generated by other people into
something that society can use, such as products, services, improvements in health care and medicine, or application of existing technology to new settings
• Works in research environments, possibly with entrepreneur and business scientists to turn ideas into realities
The explorer scientist• Searches for the next piece of the jigsaw puzzle of
scientific knowledge and understanding• Works in universities, research centres, or research and
development, likely on their own
The policy scientist• Combines scientific knowledge with an understanding
of government and policy making to help create evidence-based legislation and policy
• Works in government, nongovernment organisations, campaign groups and charities
The service provider scientist• Applies their scientific knowledge and skills in health
services, forensic science, food science, health and safety, materials analysis and testing, and education
• Works in laboratories and support service environments
The communicator scientist• Combines their scientific knowledge and
communication skills to effectively engage and inform a variety of audiences
• Works in media, advertising and promotion, regulation, and public affairs
The entrepreneur scientist• Makes innovations happen through their scientific
knowledge, people management skills, entrepreneurship and ability to make connections
• Works in their own businesses, or helps to grow existing companies
The investigator scientist• Digs into the unknown, and pieces together in-depth
knowledge and data to set the landscape for others to translate and develop
• Works in universities, research centres, research and development, likely in a team or multidisciplinary environment
The regulator scientist• Uses their understanding of science and the processes
involved in monitoring its use to reassure the public that systems and technology are reliable and safe through monitoring and regulation
• Works in regulatory bodies such as the Therapeutic Goods Administration, and testing and measurement services
The teacher scientist• Combines their scientific knowledge with teaching skills
to train the next generation of scientists• Works in schools, universities and other educational
organisations
Figure9.12 The Science Council’s 10 types of scientist

9 Your life and career as a scientist 178
9
9 Llopis, G 2012, 6 Ways Successful Teams Are Built to Last, Forbes, <www.forbes.com/sites/glennllopis/2012/10/01/6-ways-successful-teams-are-built-to-last/>.
10 National Health and Medical Research Council, Australian Research Council & Australian Vice-Chancellors’ Committee 2015, National statement on ethical conduct in human research 2007, updated May 2015, National Health and Medical Research Council, Canberra.
11 Resnik, D 1993, ‘Philosophical foundations of scientific ethics’, Ethical Issues in Physics Workshop Proceedings.
12 National Health and Medical Research Council 2014, How NHMRC Develops Its Guidelines, NHMRC, Canberra, <www.nhmrc.gov.au/guidelines-publications/how-nhmrc-develops-its-guidelines>.
13 National Health and Medical Research Council 2013, Australian code for the care and use of animals for scientific purposes, National Health and Medical Research Council, Canberra.
14 Gawande, A 2016, ‘The mistrust of science’, New Yorker, 10 June, <www.newyorker.com/news/news-desk/the-mistrust-of-science>.
15 Office of the Chief Scientist 2014, Science, technology, engineering and mathematics: Australia’s future, Australian Government, Canberra.
16 Science Council 2016, 10 Types of Scientist, Science Council, viewed 1 July 2016, <http://sciencecouncil.org/about-us/10-types-of-scientist/>.

causationskills
observation
hypothesis
aimexperiment
results
control
randomisationevidence
data
analysistesting
scrutinypeer review
measurementreasoning
correlation
scientific
method
process
subjects
prediction
researchpublish
share
treatment
drug
studyliterature
abstract
laboratorystatistics
referencing
graphs communication
databaseteamwork
regulations
investigate
critique
placebotheory
academic
businessindustryprofessional
Glossary9

g Glossary 180
g GlossaryAbstract A paragraph of 200 to 300 words that accurately reflects the contents of a research article or literature review.
Adaptability The ability to change positively and with ease to fit changed circumstances.
Aim The goal or objective of a scientific research study; to determine the effect of the independent variable(s) on the dependent variable(s). Appears in an abstract or introduction of an original investigation.
Analysis The ability to take a process or thing and break it down into its basic parts and draw connections.
Analysis grid A tool that helps with the careful examination and breakdown of a research paper.
Analysis of variance (ANOVA) A statistical procedure used to test the degree to which the dependent variable values for 3 or more groups differ in an experiment.
Apply To use information in new situations.
Author–date reference system A type of referencing system where in-text citations are indicated by placing the author’s surname and the date of publication in brackets, and the reference list is in alphabetical order by author’s surname.
Balanced groups Different experimental groups with no obvious differences.
Baseline measurements Dependent variables measured at the beginning of an experiment; generated to balance groups or to compare with the same dependent variables measured throughout or at the end of the experiment.
Bibliography A list at the end of a book or article that shows the works used by the author in writing the article or book, or a list of works that a reader might find useful.
Citation A reference to a book, paper or author, especially in an academic work.
Column graph A figure that uses bar shapes to plot the mean values.
Communication platform The mode of communicating information, such as podcast, video, brochure, poster or book.
Conclusion The answer to your research question; it summarises how the results of a scientific study support or fail to support the hypothesis. Appears at the end of the discussion section of a research article.
Control group A group of animals or humans that receive experimental conditions identical to that of the treatment group (eg for animals’ diet and housing conditions), except for the independent variable(s) of interest.
Control group experimental design Experimental design in which the participants are divided into 2 groups, one of which is designated the control and the other the experimental group.
Correlation A statistical approach to determine how well 2 variables are related to each other.
Create To produce new or original work.
Critical analysis An examination and evaluation of a text or other work that may help us to understand the interaction of the particular components that contribute to the value of the work; it is not a quest to find fault with the work.
Critical thinking The analysis and evaluation of an issue that is based on sound logic.
Crossover experimental design Each participant is measured under the control and experimental treatment conditions, with one-half of the participants experiencing the conditions in reverse order.
Cultural literacy The ability to understand and participate fluently in a given culture; citizens share a common body of knowledge that allows the building of positive communication, acceptance and understanding in a changing world.
Demographic analysis Determination of the age, sex and racial composition of a population.
Dependent variable The variable (or variables) that changes in an experiment as a result of the independent variable.
Descriptive statistics A quantitative summary of features of a dataset; includes mean and standard deviation.
Discipline-specific knowledge and skills Capabilities specific to the field of study (eg human physiology), but not covered by other more generic capabilities such as literacies and communication skills, personal and professional skills, and inquiry and analytical skills.
Disposition analysis Determination of the usual attitude or mood of a particular group of people, their tendency to act or think in a particular way, as well as their needs, goals and interests.

g Glossary 181
Double-blind study Study in which the individual participants and the people administering the experiment are unaware of critical aspects of the experiment, with this information being held by a third party and only revealed to the investigators when the study is completed.
Employability A set of achievements, understandings and personal attributes that make individuals more likely to gain employment and to be successful in their chosen occupations.
EndNote A software package used to manage bibliographies and references when writing scientific papers.
Error bars Graphical representation of the variability of data around the mean (eg standard deviation).
Evaluate To critique and appraise information to come to a conclusion, and to defend the conclusion.
Evidence Data or information on which to base proof, or to establish truth or falsehood.
Experiment A test conducted under controlled conditions to test a hypothesis.
Experimental design A research design that eliminates all factors that influence outcome except for the variable being studied.
Extraneous variable An unwanted variable that is not the independent variable of interest, but influences the outcome of an experiment, and therefore adds error to an experiment.
General public People in society; used when contrasting people in general with a small group – for example, scientists.
Generic skills Important in science and other fields, and often referred to as graduate capabilities. They can include literacies and communication skills, inquiry and analytical skills, personal and professional skills, and discipline-specific knowledge and skills.
Google Scholar An online, freely accessible search engine used to search for scholarly literature across a range of publishing formats and disciplines.
Graduate capabilities Generic skills that are important in science. They can include literacies and communication skills, inquiry and analytical skills, personal and professional skills, and discipline-specific knowledge and skills.
Guideline A general rule, principle or piece of advice designed to streamline particular processes according to a set routine or sound practice, and, by definition, not mandatory.
Human physiology The science of the mechanical, physical and biochemical functions of normal humans, or human tissues or organs, primarily at the level of organs and systems.
Hypothesis An assumption or prediction based on sound evidence (educated guess) assumed for the sake of testing its soundness; a prediction of the effect of the independent variable(s) on the dependent variable(s) in a scientific research study.
Independent learning When an individual executes autonomy over their learning and evaluates their own learning.
Independent t-test A statistical test to determine whether there is a statistically significant difference between the means in 2 unrelated groups.
Independent variable The variable that the investigator intentionally changes in a scientific experiment to observe its effect on other variables.
Inquiry and analytical skills Capabilities around critical thinking, creative problem solving, inquiry and research.
In-text-citation A reference placed immediately after the information being cited, which helps readers easily reconcile the information and the source.
Introduction The section of an original investigation research article that provides a brief literature review that encapsulates the rationale for the study, as well as the hypotheses and aims.
Investigator A researcher or scientist who implements the scientific method to generate new scientific knowledge.
Knowledge analysis Determination of the knowledge base on a given topic area in a given cohort of people.
Laws A rule established by some authority and enforced by judicial decision.
Line graph A figure that plots the mean values and connects the points with a line to show something that happens over time.
Literacies and communication skills Capabilities around writing, speaking, quantitative literacy and cultural literacy.
Literature review An academic paper that is an assessment of a body of research on a particular topic; they are secondary sources and don’t report on original investigations.

g Glossary 182
Mean Gives a very good idea about the central tendency of the data being collected; determined by adding all the data points in a dataset and then dividing the total by the number of points.
Methods The section of a research article that explains how the original investigation was done.
Number reference system A type of referencing system where a source is cited in the text using the number assigned to that source in the reference list.
Observation The active acquisition of information from a primary source, either through our senses, or data recorded during an experiment using scientific tools and instruments.
One-factor analysis of variance (ANOVA) A statistical procedure used to test the degree to which the dependent variable values for 3 or more groups differ in an experiment where there is 1 independent variable.
Original investigation research article Published account of a new study undertaken on a particular topic.
Paired t-test A statistical test to determine whether there is a statistically significant difference between the means in 2 groups each containing the same subjects.
Participant An individual who participates in a research study as a human subject and is the target of observation by researchers.
Peer review A process by which scholarly work is checked by a group of experts in the same field to make sure it meets the necessary standards before it is published or accepted.
Personal and professional skills Capabilities around teamwork, leadership, autonomy and independence, ethical behaviour, adaptability, and study and learning skills.
Physiology The branch of biology that deals with the normal functions of living organisms and their parts.
Placebo A dummy medication that has no therapeutic effect given to the control group in a study that is investigating the effect of a medication on relevant physiological variables.
Post hoc test A stepwise multiple comparisons procedure used to identify sample means that are significantly different from each other when a significant difference between 3 or more sample means has been determined by an analysis of variance (ANOVA).
Problem solving The process of finding solutions to difficult or complex issues.
Pseudoscience A form of science without substance; a claim, belief or practice presented as scientific but doesn’t adhere to the scientific method.
PubMed An online, freely accessible search engine for accessing primarily the MEDLINE database of references and abstracts on life sciences and biomedical topics.
p value A statistical value that helps you to determine the significance of your results; a conventional (and arbitrary) threshold is a value of less than 0.05.
Quantitative literacy The ability to understand and interpret numerical information, and the ability to apply mathematical skills when solving real-world problems.
Random assignment An experimental technique used where human participants or animal subjects are arbitrarily assigned to different groups in an experiment, because the experimenters are confident that this will result in balanced groups.
Reference The use of a source of information to ascertain something.
Reference list A list of all the sources used as in-text references in a scientific paper that enables the reader of the work to locate and verify the sources used.
Referencing style The particular format of a reference that is used throughout the reference list for consistency.
Reliable evidence Stable and consistent data generated from an assessment tool.
Remember To recall facts and basic concepts.
Results The findings of an original research investigation.
Science The pursuit and application of knowledge and understanding of the natural and social world following a systematic methodology based on evidence.
Science literacy The knowledge and understanding of scientific concepts and processes required for personal decision making, participation in civic and cultural affairs, and economic productivity.
Scientific figure A standalone and interpretable graphic representation of scientific research findings that plots descriptive statistics and has significance symbols, labelled x and y axes with units, and a caption.

g Glossary 183
Scientific figure caption Conveys relevant information about a graphic representation of scientific research findings; appears below the graph and includes a descriptive title, the summary statistics that have been plotted, and a statement as to whether or not there is a statistical difference between results.
Scientific literature The aggregate of scholarly publications written to inform on the latest achievements of science, and within an academic field; includes primary, secondary, tertiary and grey literature.
Scientific method A method of procedure consisting of systematic observation, and the formulation, testing and modification of hypotheses.
Scientific table A standalone and interpretable tabular representation of scientific research findings that has summary statistics presented as numerical data, significance symbols and a caption.
Scientific table caption Conveys relevant information about a tabular representation of scientific research findings, appears above the table and includes a descriptive title, the descriptive statistics presented, and a statement as to whether or not there is a statistical difference between results.
Scientific theory A conceptual scheme supported by a large number of observations and not yet found lacking.
Scientific units A standard of measurement (eg metre, kilogram) used to quantify variables. Some well-known variables and their standard of measurement in physiology are heart rate (beats per minute), mean arterial pressure (mmHg), blood glucose (millimoles per litre) and ventilation (litres per minute).
Scientist An expert in one or more areas of science who creates knowledge via systematic activity or implementation of the scientific method, and shares this information with other experts in the field.
Secondary literature Publications that rely on primary sources for information, and where it is not a requirement for the authors to have done the work themselves, since the purpose of the publication is to summarise and synthesise knowledge in a specific area for other scientists who already have an understanding of the topic.
Self-directed learning When an individual executes autonomy over their learning and evaluates their own learning.
Significance symbol A character used in a scientific figure or table to represent statistical difference between datasets.
Single-blind study Experiment in which the individual participants do not know whether they are are control or treatment group participants.
Standard deviation A measure of the dispersion of a set of data from its mean.
Statistical analysis The science that deals with the collection, analysis and interpretation of numerical data.
Statistical significance A result from testing or experimentation that is not likely to occur randomly or by chance, but is instead likely to be attributable to a specific cause; a conventional (and arbitrary) threshold for declaring this is a p value of less than 0.05.
Statistics The science that deals with the collection, analysis and interpretation of numerical data.
Student scientist An individual who is undergoing formal education where they are learning about science and how to practise science, as well as developing scientific skills and attributes such as teamwork, communication, and personal and professional responsibility.
Summary synthesis The ability to combine discrete pieces of information into a number of whole parts, and then summarise the whole parts and draw connections between them.
Synthesise To combine discrete pieces of information into a whole.
Synthesis grid A tool that helps with the amalgamation of findings from separate original investigations.
Team A group of people with a full set of complementary skills who work together to achieve a common goal.
Teamwork The combined efforts and actions of a group of people working together to achieve a common goal.

g Glossary 184
Transferable skills Important in science and other fields, and often referred to as graduate capabilities. They can include literacies and communication skills, inquiry and analytical skills, personal and professional skills, and discipline-specific knowledge.
Treatment group The experimental group that is exposed to the independent variable(s) of interest.
Treatment order control experimental design Experimental design in which each participant is measured under the control and experimental treatment conditions, with one-half of the participants experiencing the conditions in reverse order.
Two-factor analysis of variance (ANOVA) A statistical procedure used to test the degree to which the dependent variable values for 3 or more groups differ in an experiment where there are 2 independent variables.
Two-tailed statistical test A test of significance to determine if there is a relationship between variables in either direction.
Understand To comprehend ideas or concepts.
Valid evidence Data generated during an experiment that have a sound, factual basis.
X axis The line on a graph that runs horizontally (left–right) through zero.
X-axis title The title for data presented on the x axis.
Y axis The line on a graph that runs vertically (up–down) through zero.
Y-axis title The title for data presented on the y axis.

Version HistoryVersion Date Change Further notes
v1.1 23/11/2021 Updated license to CC-BY-NC-SA (from the original CC-BY-NC-ND)