How to deal with the syntonic comma in music education?
296
UNIVERSITATIS OULUENSIS ACTA E SCIENTIAE RERUM SOCIALIUM E 196 ACTA Markku Viitasaari OULU 2020 E 196 Markku Viitasaari HOW TO DEAL WITH THE SYNTONIC COMMA IN MUSIC EDUCATION? RECOGNITION, PREFERENCES OF USAGE, AND UTILITY UNIVERSITY OF OULU GRADUATE SCHOOL; UNIVERSITY OF OULU, FACULTY OF EDUCATION
-
Upload
khangminh22 -
Category
Documents
-
view
3 -
download
0
Transcript of How to deal with the syntonic comma in music education?

UNIVERSITY OF OULU P .O. Box 8000 F I -90014 UNIVERSITY OF OULU FINLAND
A C T A U N I V E R S I T A T I S O U L U E N S I S
University Lecturer Tuomo Glumoff
University Lecturer Santeri Palviainen
Postdoctoral researcher Jani Peräntie
University Lecturer Anne Tuomisto
University Lecturer Veli-Matti Ulvinen
Planning Director Pertti Tikkanen
Professor Jari Juga
University Lecturer Anu Soikkeli
University Lecturer Santeri Palviainen
Publications Editor Kirsti Nurkkala
ISBN 978-952-62-2790-0 (Paperback)ISBN 978-952-62-2791-7 (PDF)ISSN 0355-323X (Print)ISSN 1796-2242 (Online)
U N I V E R S I TAT I S O U L U E N S I SACTAE
SCIENTIAE RERUM SOCIALIUM
E 196
AC
TAM
arkku Viitasaari
OULU 2020
E 196
Markku Viitasaari
HOW TO DEAL WITHTHE SYNTONIC COMMAIN MUSIC EDUCATION?RECOGNITION, PREFERENCES OF USAGE,AND UTILITY
UNIVERSITY OF OULU GRADUATE SCHOOL;UNIVERSITY OF OULU,FACULTY OF EDUCATION


ACTA UNIVERS ITAT I S OULUENS I SE S c i e n t i a e R e r u m S o c i a l i u m 1 9 6
MARKKU VIITASAARI
HOW TO DEAL WITHTHE SYNTONIC COMMAIN MUSIC EDUCATION?Recognition, preferences of usage, and utility
Academic dissertation to be presented with the assent ofthe Doctoral Training Committee of Human Sciences ofthe University of Oulu for public defence in the OPauditorium (L10), Linnanmaa, on 18 December 2020, at12 noon
UNIVERSITY OF OULU, OULU 2020

Copyright © 2020Acta Univ. Oul. E 196, 2020
Supervised byProfessor Juha OjalaProfessor Erkki HuovinenDoctor Jouni Peltonen
Reviewed byAssociate Professor Jonna VuoskoskiDoctor Pekka Toivanen
ISBN 978-952-62-2790-0 (Paperback)ISBN 978-952-62-2791-7 (PDF)
ISSN 0355-323X (Printed)ISSN 1796-2242 (Online)
Cover DesignRaimo Ahonen
PUNAMUSTATAMPERE 2020
OpponentAssociate Professor Esa Lilja

Viitasaari, Markku, How to deal with the syntonic comma in music education?Recognition, preferences of usage, and utilityUniversity of Oulu Graduate School; University of Oulu, Faculty of EducationActa Univ. Oul. E 196, 2020University of Oulu, P.O. Box 8000, FI-90014 University of Oulu, Finland
Abstract
This dissertation concerns interval intonation, tuning systems, and temperaments and theirrelevance to music education. It considers a historically well-known tuning discrepancy, thesyntonic comma, from three different perspectives: 1) recognition, 2) preferences of usage, and 3)utility in music education. The first objective was investigating to what extent students in music-intensive classes and university music students are able to recognize a mistuning of the syntoniccomma in musical passages tuned in just intonation. This was investigated through an experimentcomprising 40 chord progressions. The second objective was to determine the preferences ofuniversity music students and teachers for dealing with the syntonic comma by way of centrallyrecognized tuning alternatives through an experiment with 30 pairs of chord progressions. Thethird objective was to consider how the present results and other recent research about the syntoniccomma could help with teaching intonation skills. The Experiment 1, recognition of mistuning,revealed a wide distribution among listeners (n=168). The recognition of mistuning in verticalharmony decreased significantly according to the complexity of the chord progressions. Mistuningbetween successive notes of the melody line helped recognition. The recognition of mistuning wasalso influenced by the choir voice participants were repsenting: In one category of chordprogressions, participants representing the bass voice in a choir detected mistuned triads betterthan participants representing the top voice. There was also a significant correlation of themutually interrelated variables of instrumental experience and age with recognition of mistuning.In Experiment 2, intonation preferences, music university students and teachers (n=93) wereasked a preference from among four tuning strategies with pairs of differently tuned but otherwiseidentical chord sequences. Meantone tuning (85.9%) and equal temperament (85.2%) wereoverwhelmingly preferred, with local tempering falling behind, and there was overall rejection ofpitch drift. The results motivate the development of new exercises for intonation skills, and theexperiments shed light on the problem of the syntonic comma, proving potential for practicalmusic pedagogy. Several suggestions for further research are presented.
Keywords: consonance, dissonance, intonation, intonation systems, just intonation,meantone tuning, mistuning, pitch drift, pitch/frequency discrimination, pure intonation,pythagorean tuning, syntonic comma, temperament, tempering, tuning, welltemperament


Viitasaari, Markku, Kuinka musiikkikasvatuksessa tulisi käsitellä syntonistakommaa? Tunnistaminen, käsittelyn mieltymykset ja hyödyllisyysOulun yliopiston tutkijakoulu; Oulun yliopisto, Kasvatustieteiden tiedekuntaActa Univ. Oul. E 196, 2020Oulun yliopisto, PL 8000, 90014 Oulun yliopisto
Tiivistelmä
Tämä väitöskirja käsittelee intervallien intonaatiota, viritysjärjestelmiä, virityksiä ja niiden rele-vanssia musiikkikasvatuksessa. Työ keskittyy historiallisesti hyvin tunnettuun virityspoikkea-maan, syntoniseen kommaan kolmesta näkökulmasta: 1) tunnistamisesta, 2) käsittelyn mielty-myksistä ja 3) hyödyllisyydestä musiikkikasvatuksessa. Ensimmäisenä tavoitteena oli tutkia,missä määrin musiikkiluokkien oppilaat ja musiikin yliopisto-opiskelijat tunnistavat syntonisenkomman puhdasvireisesti viritetyissä musiikkikatkelmissa. Tätä tutkittiin 40 sointusarjankokeella. Toisena tavoitteena oli selvittää musiikin yliopisto-opiskelijoiden ja musiikin ammatti-laisten mieltymyksiä erilaisiin syntonisen komman ratkaisutapoihin eli erilaisiin virityksiin 30sointusarjaparin kokeella. Kolmantena tavoitteena oli selvittää, miten kokeiden tulosten ja tutki-muskirjallisuuden perusteella voisi edistää intonaatiotaitojen opettamista. Epävireisyyden tun-nistamisen koe (1) paljasti laajan jakauman koehenkilöiden (n=168) kesken. Vertikaalisessa har-moniassa epävireisyyden tunnistaminen väheni merkittävästi harmonian kompleksisoitumisenmyötä. Epävireisyys peräkkäisten sävelten välillä melodialinjassa auttoi epävireisen soinnuntunnistamista. Tunnistamiseen vaikutti myös se, mitä ääntä lauloi kuorossa: Yhdessä sointukate-goriassa alinta ääntä laulavat osallistujat havaitsivat epävireisyyksiä paremmin kuin ylintä ääntälaulavat. Havaittiin myös merkittävä korrelaatio tunnistamisen sekä instrumenttiharrastuksenkeston ja myös iän välillä. Intonaatiomieltymysten kokeessa (2) musiikin opiskelijoita ja opetta-jia pyydettiin valitsemaan identtisistä sointusarjapareista heille mieluisimman virityksen. Keski-sävelviritys (85,9 %) ja tasavireinen viritys (85,2 %) koettiin selkäesti mieluisimmiksi, paikalli-sen temperoinnin jäädessä kolmanneksi. Sävelkorkeuden ajautumaa vierastettiin kauttaaltaan.Tulokset kannustavat kehittämään intonaatiotaitoja parantavia uusia harjoituksia ja kokeet valai-sevat syntonisen komman ongelmaa osoittaen mahdollisuuksia musiikillisten käytäntöjen peda-gogiikkaan. Diskussiossa esitetään useita jatkotutkimusehdotuksia.
Asiasanat: dissonanssi, epävireisyys, hyvä temperatuuri, intonaatio, keskisävelviritys,konsonanssi, paikallinen temperointi, puhdasvireinen viritys, pythagoralainen viritys,syntoninen komma, sävelkorkeuden ajautuma, sävelkorkeuden/frekvenssin erottelu,tasavireinen viritys, temperatuuri, temperointi, viritys, viritysjärjestelmä


7
Acknowledgments
I want to thank my supervisors PhD Juha Ojala, PhD, MSc. Erkki Huovinen and
PhD (Education) Jouni Peltonen for supervising and support. They patiently guided
me over several “final versions”. MA (Education) Antti Siipo was an important
person in building the auditive experiment material with Logic Pro software. Antti
gave also many valuable comments concerning the experiment design. I also thank
my follow-up group, PhD (Education, Psychology) Mirka Hintsanen and PhD
Jukka Louhivuori.
The process of gathering the material was not so easy, indeed. I warmly thank
PhD (Education) Leena Pääkkönen for the essential help of getting participants in
on music-intensive classes in comprehensive school. Further, I am grateful to Mervi
Paalanen (MA, Education) who helped me several times for persuading music
teachers as participants.
I warmly thank composer Juhani Nuorvala for valuable advices concerning
terminology of intonation. PhD Jouko Laaksamo read one of the “final versions”
and gave essential comments in a critical phase. PhD (Education) Veli-Matti
Ulvinen was helpful and, first of all, extremely effective in procedures after proof-
reading.
I could never forget our peer-to-peer support group: PhD Timo Kovanen, MA
(Education) Mari Leppävuori, and PhD (Education) Katja Sutela. We supported
each other in countless reading sessions.
My beloved wife Maria (MA, Education) has tolerated my absence on
vacations and weekends for seven years. In addition, she helped me in the
experiment design and contributed to get participants on music-intensive classes in
comprehensive school. This work would not have finished without her.
I also thank Oulu University Scholarship Foundation for a grant of 5000 euros
in 2015.
Finally, I want to thank everyone, who was willing to be involved in my
experiments.
October 2020 Markku Viitasaari

8
9
Contents
Abstract
Tiivistelmä
Acknowledgments 7
Contents 9
1 Introduction 13
1.1 Researcher’s path to the topic ................................................................. 13
1.2 Background ............................................................................................. 15
1.3 Objectives and scope ............................................................................... 18
1.4 Dissertation structure .............................................................................. 19
2 Theoretical framework 21
2.1 Key concepts ........................................................................................... 21
2.1.1 Tuning, temperament, and intonation ........................................... 21
2.1.2 Harmonic series ............................................................................ 24
2.1.3 Consonance and dissonance ......................................................... 26
2.1.4 Pythagorean tuning ....................................................................... 28
2.1.5 Just intonation and the syntonic comma ....................................... 30
2.1.6 Keyboard temperaments ............................................................... 36
2.1.7 Pitch drift ...................................................................................... 43
2.1.8 Harmonic and melodic intonation ................................................ 50
2.2 Recognition of mistuning: Previous research ......................................... 52
2.2.1 Musical interval perception .......................................................... 53
2.2.2 Discrimination thresholds in perception of successive
tones ............................................................................................. 56
2.2.3 Discrimination thresholds in perception of simultaneous
tones ............................................................................................. 59
2.2.4 Perception of horizontal mistuning .............................................. 60
2.2.5 Perception of vertical mistuning ................................................... 62
2.2.6 Perception and intonation in performance .................................... 64
2.2.7 Effects of vibrato and timbre ........................................................ 65
2.2.8 Synopsis of previous research on recognition of mistuning ......... 68
2.3 Intonation preferences: Previous research .............................................. 77
2.3.1 Intonation in performance ............................................................ 77
2.3.2 Intonation preferences and judgments .......................................... 84
2.3.3 Pitch drift in performing situations ............................................... 87
2.3.4 Synopsis of previous research on intonation preferences ............. 90

10
2.4 Pedagogical motivations: Previous research ........................................... 95
2.4.1 Factors influencing intonation ...................................................... 95
2.4.2 Improving intonation .................................................................. 100
2.5 Research questions ................................................................................ 105
2.6 Research process ................................................................................... 107
3 Experiment 1: Recognition of mistuning 109
3.1 Aims of Experiment 1 ........................................................................... 109
3.2 Method of Experiment 1 ....................................................................... 109
3.2.1 Participants ................................................................................. 109
3.2.2 Musical materials ........................................................................ 110
3.2.3 Design ......................................................................................... 123
3.2.4 Procedure .................................................................................... 123
3.2.5 Data analysis ............................................................................... 124
3.3 Results ................................................................................................... 126
3.3.1 Recognition of mistuning throughout the complete data
set and in categories.................................................................... 126
3.3.2 Locations of the mistuned triad .................................................. 133
3.3.3 Mistuning misattributions to a minor and major triad ................ 134
3.3.4 Background variables ................................................................. 139
3.3.5 Recognition of mistuning, music analysis observations ............. 147
3.4 Reliability and validity .......................................................................... 154
3.4.1 Validity of Experiment 1 ............................................................. 154
3.4.2 Reliability of Experiment 1 ........................................................ 159
4 Experiment 2: Intonation preferences 163
4.1 Aims of Experiment 2 ........................................................................... 163
4.2 Method of Experiment 2 ....................................................................... 164
4.2.1 Participants ................................................................................. 164
4.2.2 Musical materials ........................................................................ 165
4.2.3 Design ......................................................................................... 172
4.2.4 Procedure .................................................................................... 172
4.2.5 Data analysis ............................................................................... 173
4.3 Results ................................................................................................... 174
4.3.1 Preferences of the four tuning alternatives ................................. 174
4.3.2 Comparisons of preferences of four tuning alternatives ............. 179
4.3.3 Background variables ................................................................. 181
4.3.4 Comparisons of preferences between experimental blocks ........ 182
4.4 Reliability and validity of Experiment 2 ............................................... 185

11
5 Discussion 189
5.1 Answering the first and second research question ................................ 189
5.2 Answering the third and fourth research question ................................ 193
5.3 Practical implications from Experiment 1 ............................................. 195
5.4 Practical implications from Experiment 2 ............................................. 197
5.5 Practical implications from pedagogical motivations ........................... 201
5.5.1 Factors influencing intonation: Summary .................................. 201
5.5.2 Improving intonation: Summary ................................................ 203
5.6 Music without syntonic commas ........................................................... 205
5.7 Description of ethical issues ................................................................. 205
5.8 Critical observations of the present research ........................................ 206
5.9 Recommendations for further research ................................................. 209
References 215
Appendices 225

12

13
1 Introduction
In this chapter, I will tell something about my personal musical background
connected to this research. I also will introduce the basic knowledge about
intonation issues in Sub-chapter 1.2. In addition, I will sketch the objectives and
scope of this research in Sub-chapter 1.3. Dissertation structure is seen in Sub-
chapter 1.4.
1.1 Researcher’s path to the topic
I became interested in intonation issues as a university student when I was
conducting different wind instrument groups of amateur players and music students.
Later, while working as principal of the Panula College of Music in the Southern
Ostrobothnia region in Finland, I had the opportunity to conduct elementary string
ensembles and symphony orchestras. In addition, I have experience playing and
singing in different groups. Intonation problems were often solved with vague
instructions, like “listen to purity,” or “listen to each other,” or “your singing is
mistuned.” I noticed that a surprisingly common misunderstanding of intonation
errors is that everything gets better if the out-of-tune tone is corrected in the sharp
direction. A continuous stretching of intervals does not help the situation. I found
out that many conductors of amateur groups completely ignore intonation errors.
Such groups simply play pieces of music again and again without progress worth
mentioning. A natural consequence of ignoring intonation is the lack of
motivation—especially among young players. Accordingly, I became more and
more interested in intonation problems and how to solve them. In brief, there were
many intonation problems but few practical solutions.
These practical interests led me to write a study of intonation when I graduated
from Helsinki Conservatory in 1999. The composer and lecturer of music theory
Mauri Viitala guided me through the essential knowledge. As a master of ear
training, the Conservatory’s principal lecturer, DMA Timo von Creutlein, likewise
put particular emphasis on intonation in ear training among students and required
the same intensity from music graduates. I also came to understand that the
requirement of pure or correct intonation can be used as an instrument of power,
even arbitrarily.
Pitch-matching exercises, if realized without keyboard, are necessarily not
locked into absolute pitches. Leading notes, for instance, can be intonated
melodically as “high” but also clearly “lower” if followed by harmonic intonation.

14
A strong educator may misuse the power of expertise in working with an uncertain
student with incomplete experience in intonation issues. This can happen both in
ear training and instrumental lessons, meaning that it could be useful for music
educators to be sensitive in this respect.
Gradually, when I became familiar with tuning systems and theories of
intonation, I observed practical situations more carefully. I learned that brass
sections are rewarding with respect to intonation training because small changes in
tuning practices bring clear improvements that even amateur participants can
aurally appreciate. String groups, conversely, may sound tolerable even when
slightly poorly tuned. Tuning exercises in wind ensembles thus seem more
productive than in string ensembles. Simple pitch matching to build chords helps
enormously, especially if this kind of training is regular. At the same time, young
players learn early that there is something that can be done to improve intonation.
The singing voice seems to be a world of its own. I have had countless
frustrating discussions with classical singers regarding intonation in classical song
performance. Perceptible tuning errors have only elicited mild comments about
“small technical problems.” Perhaps “the tempo was too slow,” but nevertheless,
“she has a superior quality of voice.” Over time, I have learned to remain silent.
I continued this topic in my licentiate thesis, supervised by PhD, PhLic
(Education) Professor Matti Vainio at the University of Jyväskylä in 2001. The
subject of that thesis was Yksi vai useampi intonaatio [One intonation or several
intonations], for which I investigated the methodology of teaching intonation based
on historical style periods of Western music. This study revealed that there are
plenty of methods to extend awareness of intonation in the Western tradition on the
basis of style periods. I described several harmonic progressions and analyzed them
on the basis of Pythagorean tuning, just intonation, and extended just intonation,
applying these analyses to ear training. The empirical part of the study showed that
intonation issues were almost ignored in current Finnish learning materials on ear
training (Viitasaari, 2001, pp. 76–78, 133–134).
After publishing my licentiate thesis, the deeper investigation of intonation
issues continued bothering me, and I became a doctoral student of musicology at
the University of Turku in 2003. Unfortunately, I had to interrupt these studies, but
my lifetime interest in intonation issues persisted. However, PhD, MSoc.Sc. Erkki
Huovinen supervised my work for a couple of years, and several ideas were
developed. The basis of the chord progressions used in this research was planned
at that time.
15
1.2 Background
When children learn to play an instrument with non-fixed tuning (string
instruments and wind instruments), they first must learn how to produce a sound
from the instrument. Quite soon, they have to somehow learn to adjust the pitch.
Usually, young instrumentalists learn this adjustment close to the fixed pitches of
equal temperament —often in reference to the piano or a keyboard. When young
players play together in an ensemble or orchestra, they have to adjust the pitch
without a fixed reference system. According to Leedy and Haynes (2005, p. 503)
intonation can be defined as an acoustically and artistically correct pitch of the tone
played by a musician or sung by a singer. In other words, accurate pitch matching
belongs to intonation. The concept of intonation is discussed in Sub-chapter 2.1.1.
Musical intervals are defined by pitch differences, and melodies are formed
using pitch variations over time (Micheyl, Delhommeau, Perrot & Oxenham, 2006,
p. 36). Thus, pitch perception is considered an essential ability for a musician
(Geringer, MacLeod, Madsen & Napoles, 2015, p. 675). Indeed, playing in tune is
an ability that musicians distinctly emphasize (Geringer, MacLeod & Sasanfar,
2015, p. 90). For musicians or singers to perform in tune, they must have the ability
to accurately perceive pitch in the surrounding music and in their own performance.
In-tuneness can be understood as proper intonation, and out-of-tuneness can be
understood as poor intonation. What exactly is meant by “poor” intonation or being
“out of tune” demands more analytical work. For instance, a performance can be
said to have poor intonation when it includes some mistuned chords. The melody
can be mistuned, yet the accompaniment sounds correct. Musical performances can
be experienced as being in tune or out of tune. One problem with this dichotomy is
determining the correct reference system, and the question of in-tuneness and out-
of-tuneness is contextual; there are numerous tuning systems. It is also a question
of artistic interpretation, such as when, for example, the singer of, say, an opera aria
performing with a symphony orchestra may, in relation to the orchestra, use
ambiguous intervals that someone could judge as being out of tune.
If musicians play with a piano or keyboard accompaniment, it seems natural
that the “right” pitch will be the equal temperament. But in a different circumstance,
such as an a cappella choir singing a piece from the Renaissance, there are
possibilities for just intonation intervals, which deviate from equally tempered
pitches. Hence, mistuned intervals in such cases might be evaluated in relation to
just intonation, not to equal temperament. Further, if an a cappella group sings
medieval organa, they possibly aim at Pythagorean tuning (introduced in Sub-

16
chapter 2.1.4), where the scale is built of successive perfect fifths, and it contains
large major thirds. In this context, the major third of just intonation, for instance, is
mistuned in relation to the Pythagorean tuning.
Most music listeners can understand that all kinds of music can be played with
piano or keyboard accompaniment: a child playing the violin, a popular artist
singing, and a professional opera singer performing. We hear J. S. Bach’s fugues
and contemporary music played on the piano, and the instrument is used for choir
accompaniment as well. Everything seems to work straightforwardly with piano
accompaniment. Modern piano is equally tempered, which means (in the Western
tradition) that an octave interval is divided into 12 equal subdivisions (Renney,
Gaster & Mitchell, 2018, p. 2). Johnson-Laird, Kang, and Leong (2012, p. 32) claim
that very few people have the possibility of hearing music any tuning other than
equal temperament in their lifetime. If one listens to industrially produced pop
music and does not experience concert situations with choirs or acoustic ensembles,
this may be true.
On the basis of ordinary observations, the teaching of musical instruments
seems to be steeped in equal temperament, independent of context. Students
practice their melodic instruments alone or with piano accompaniment. Players of
orchestral instruments—percussion, string, and wind instruments—practice with a
pianist. This is pedagogically understandable and even mostly prudent in many
situations. However, if the only approach is equal temperament, it may be
challenging to achieve more sophisticated pitch adjustments in the tonal music
repertoire. To simplify, pitch matching as a part of non-fixed intonation is a more
complicated skill than matching the pitch with the modern piano. Jeans (1937, p.
184) remarked that due to equal temperament, the music of, say, Bach and Handel,
is not heard tonally as it was intended to be heard. Ryan (2016, p. 34) suggested
that the equal division of the octave is an oversimplification that conceals the
mathematical scope of frequency from the musician. Bohrer (2002, p. 50) argued
that equal temperament has been the absolute ruler over intonation. It is quite
challenging to learn to intonate in just tuning (i.e., just intonation, presented in Sub-
chapter 2.1.4) without the experience of hearing just intonation chords and intervals.
According to Kopiez (2003, p. 404), the use of equally tempered piano in the early
phase of instrumental teaching may cause a sort of burn-in effect in intonational
behavior.
At a time when intonation was more flexible, musicians, and even audiences,
may have been more aware of temperament’s transient nature. There has been a
long-standing misunderstanding that a fixed model of intonation should be the

17
guideline of intonation (Bohrer, 2002, p. 50). Duffin (2008, p. 159) puts it clearly:
“ET [equal temperament] is not necessarily the best temperament for every single
musical situation encountered by today’s musicians.”
However, the dominance of equal temperament in the Western tradition is quite
new in music history. The equal temperament, the way we tune modern pianos and
keyboards, was not adopted on a large scale until the middle of the 19th century.
Moreover, Duffin (2007) and Jeans (1937, p. 175) note that the acceptance of equal
temperament was not a quick process. Starting around 1850, it gradually became
more common to tune pianofortes and pianos in equal temperament. After that,
tuning organs in equal temperament became more common with new instruments,
but old organs were still tuned to the meantone temperament for decades. Duffin
(2008) thinks that William Braid White’s book Modern Piano Tuning and Allied
Arts can be considered a kind of turning point in the generalization of equal
temperament (Duffin, 2008, pp. 106–115).
For modern people, equal temperament is an understandable and easy approach
to Western music, independent of context and century. It provides approximate
values that are useful as a referential system. It is tempting to resort to the piano
and keyboards in sight singing, choral training, and ensembles of young players.
Aiming toward optimal intonation can begin with equal temperament, but in most
cases, it can be improved by familiarizing oneself with more profound intonation
issues and the history of tunings and temperaments. Awareness of historical
keyboard temperaments and tuning systems and fine accurate adjustment of
musical intonation could perhaps be more widespread, at least for music education
and the training of music professionals. As Bohrer (2002, p. 43) notes, a huge
number of keyboard temperaments have been proposed during the past centuries,
and this richness could be easily put to use with electric keyboard instruments. In
particular, several temperaments were developed for keyboards during the baroque
period (Reinhard, 2016, p. 3), and the repertoire of the baroque period is in common
use; why not use the temperaments made for this music?
All this generates questions: Why are there so many different temperaments in
the history of Western music? What about music without keyboards? What should
a conductor do to improve intonation in an amateur choir? What should the
conductor of a junior wind band do to improve intonation? One possible answer is
simple at the level of understanding the history of intonation systems—especially
the principle of “just intonation.” This tuning system, which uses intervals
corresponding to simple integer ratios (Renney et al. 2018, p. 2), is presented in
more detail in Sub-chapter 2.1.5. The problem of the so-called syntonic comma

18
(also presented in more detail in Sub-chapter 2.1.5) becomes visible when those
small-integer ratios are used to create the Western scale on a fixed tuning
instrument, like the piano (Sponsler, 2011). Basically, the syntonic comma appears
as a conflict between the major third and the perfect fifth. Practical solutions for
intonation problems are called temperaments, and they are the focus of Sub-
chapters 2.1.4, 2.1.5, 2.1.6, and 2.1.7.
According to Stange, Wick, and Hinrichsen (2018), attention to historical
performance practices, just intonation, and other non-equally tempered ways of
tuning increased during the second half of the 20th century. From this perspective,
equal temperament can be seen as an intermediate step rather than a final solution
to intonation issues. The development of digital media further improves the
dialogue between different music cultures and intonation systems (Stange et al.
2018, pp. 58–59).
1.3 Objectives and scope
The concepts of “just intonation” and “syntonic comma” are in focus in this
dissertation, along with the notions of “pitch perception,” “pitch discrimination,”
“temperament,” and “tuning.” The research literature on these issues may seem
complicated and theoretical from the music learner’s point of view. This includes
the central tuning theoretical notion of the syntonic comma—a fundamental
discrepancy between pure perfect fifths and pure major thirds and that is thus
involved in most commonly used tuning systems and temperaments. Interestingly,
musicians must implicitly find solutions to the problem of the syntonic comma in
ordinary musical performances.
Thus, the overall objective of this work is to address the relevance of the
syntonic comma in music education. Do young musicians recognize the comma at
all? If so, what factors influence such recognition? Do they prefer any of the
theoretical solutions proposed for dealing with this problem? If they do, could this
information somehow be useful for music education?
First, then, we may ask whether and to what extent the fine distinctions of
tuning described in the theoretical literature are perceptible to musicians and music
listeners. Here, my purpose is to clarify to what extent young music learners
recognize the syntonic comma in certain contexts and what factors influence that
recognition. On the one hand, there are reasons to assume that the harmonic context
of musical material could influence recognition. It might be, for instance, that fine
mistunings are mostly recognizable only in very simple tonal contexts. On the other

19
hand, aspects of musical experiences might also affect listeners’ sensitivity to
tuning. By mistuning, I am referring to the differences and distinctions of one
solution to the comma problem in comparison to other such solutions.
Further, I am interested in more advanced music students’ sensitivity to
different tuning and temperament alternatives. In particular, I will address whether
musically educated listeners find certain methods of dealing with the syntonic
comma more preferable than others. As will be seen in Chapter 2, different style
periods of Western music have provided a large number of tuning alternatives to
equal temperament. It is worth exploring which tuning solutions sound best to
musicians’ ears. There are justifiable reasons to assume that equal temperament has
numbed musicians’ sensitivity to different intonation adjustments. If this
assumption is shown to be correct, there may be clear pedagogical challenges to
revive the sense of fine adjustments in intonation. Conversely, if music students
and music professionals also accept the sounds of tuning methods other than equal
temperament, that alone might offer an interesting basis for efforts to broaden their
consciousness of intonation issues.
Finally, we may also ask how the various usages of the syntonic comma could
play helpful roles in teaching intonation skills. Following the two empirical
experiments of this work, I will be able to address any potential pedagogical
implications of the results. In this context, previous research regarding intonation
issues in musical performance may be interpreted from a pedagogical point of view.
As a whole, the dissertation thus aims to strengthen the pedagogy of intonation
issues in music education.
1.4 Dissertation structure
This dissertation consists of five chapters and a broad list of appendices. In Chapter
1, I have outlined the context for the research agenda. The key concepts of
intonation are introduced in Sub-chapter 2.1. The literature review laying the
foundation for Experiment 1 (recognition of mistuning) is introduced in Sub-
chapter 2.2, separately from the literature review for the experiment of intonation
preferences presented in Sub-chapter 2.3. The literature review for pedagogical
motivations is presented in Sub-chapter 2.4. The research questions (see Sub-
chapter 2.5) are presented next, and a short description of the study’s processes then
ends Chapter 2.
Because of the unique research design, the introduction of experiments
requires a rather large amount of space. The main findings of Experiment 1

20
(recognition of mistuning) are presented in Chapter 3, Sub-chapter 3.3, and the
main findings of Experiment 2 (intonation preferences) follow, in Chapter 4, Sub-
chapter 4.3.
The discussion in Chapter 5 answers the research questions (see Sub-chapter
5.1) and discusses the practical implications of this study’s results (see Sub-
chapters 5.2, 5.3, and 5.4). Critical observations from the present work are
discussed in Sub-chapter 5.7. Finally, recommendations for further research are
presented in Sub-chapter 5.8. A broad methodological list of appendices is
necessary because of the unique musical material of these experiments.

21
2 Theoretical framework
In this chapter, I will introduce the key concepts (see Sub-chapter 2.1) of theoretical
framework concerning intonation issues: There will be eight sub-chapters (2.1.1–
2.1.8) clarifying the vast richness of historical tunings and temperaments. Sub-
chapter 2.2 creates an overview to previous research of recognition of mistuning.
Sub-chapter 2.3 includes an overview to previous research of intonation
preferences. These sub-chapters are connected to two experiments of this research.
In addition, there will be a short review without a separate experiment: Pedagogical
motivations are presented in Sub-chapter 2.4. The research questions are written in
Sub-chapter 2.5. The last sub-chapter includes a short description of the study’s
processes.
2.1 Key concepts
The issues of intonation have long inspired researchers, and music theorists and
musicians have been interested in the problems of tuning musical instruments since
ancient Greece. Numerous temperaments have been developed, mainly for
keyboards, during the different style periods of Western music. This richness of
tuning systems flourished until the 19th century, but the last 150 years have been
more or less dominated by equal temperament. In particular, the electric context of
popular music has adopted it without question. In ordinary observations, it seems
that the mainstream of education in music theory and ear training has been satisfied
with the viewpoint of equal temperament. It would not be difficult to argue that
something has been lost. During the last few decades, numerous composers of
contemporary music have rediscovered the diversity of tuning systems, which
might also be fruitful in the context of music education.
2.1.1 Tuning, temperament, and intonation
The tuning of musical instruments has kept music theorists busy since antiquity.
It is a [sic] commonplace—although no less true for that—to say that each
period in the history of music has had its own theory of tuning in order to meet
its own musical needs. (Rasch, 2002, p. 193)
This quote describes well the vast breadth of intonation systems. It would be
fascinating to chart out the immense richness of historical tuning systems and

22
temperaments. However, only the essential key concepts will be introduced in this
chapter. This work focuses on the syntonic comma and its occurrence in practical
situations related to music education.
Villegas and Cohen (2010) defined the concepts of intonation and tuning,
saying, “Tuning refers to the frequency specification of an entire set of tones
available for a given instrument” (p. 78). Villegas and Cohen (2010) argue that a
tuning system determines the gamut of available tones that can be used for
constructing scales and modes. Tuning systems mostly involve a repetition factor—
the octave is a representative example. Hence, it also defines a number of divisions
between repetition factors, for example, pitch classes or chroma, generally 12
divisions per octave (Villegas & Cohen, 2010, pp. 78–79).
Sponsler (2011, p. 7) described temperaments, or “systems of incorporating the
comma into the scale in various intervals.” Various temperaments are introduced in
the following sub-chapters. Villegas and Cohen (2010, p. 79) define the concept of
temperament in music: “Temperament is a technique in which pure intervals are
altered to satisfy other requirements, such as distributing a comma (an interval
smaller than a semitone resulting from dividing the octave according to small
integer numbers).” The syntonic comma is examined more closely in Sub-chapter
2.1.5. Bohrer (2002) argues that the syntonic comma is the main goal of the
procedures designed to realize temperaments, and it thus has spread out in a variety
of ways in all temperaments. These systems are called closed temperaments. In this
approach, the term ”tuning system” implies openness in that the number of notes
in the system may be extended by employing higher integers in the just frequency
ratios of the intervals. By contrast, ”temperaments” are closed systems in which
the number of notes is constrained by intonational adjustments (Bohrer, 2002, pp.
42–43). This distinction of Bohrer’s is interesting, but it has not been generally
adopted in the literature.
Intonation as a multilateral concept
In-tuneness is a central concept in many definitions of intonation. Yarbrough,
Karrick, and Morrison (1995, p. 32) define intonation as the “ability to perform in
tune.” According to Kopiez (2003), intonation “refers to skillful ability of playing
in tune” (p. 384). Leedy and Haynes (2005, p. 503) argue that intonation is often
understood in a narrow way: the acoustically and artistically correct pitch of the
tone played by a musician or sung by a singer. In the present study, this aspect of
intonation (playing in tune) is examined on the basis of recent research.

23
According to Karrick (1998), the term “intonation” can denote the results of
tuning or the level to which players achieve in-tuneness (1998, p. 112). Morrison
and Fyk (2002) emphasize the viewpoint of audience: “To many listeners, in-
tuneness might be a more global assessment of musical quality thanks to just pitch
precision” (p. 185). Indeed, audiences deserve well-intonated performances.
Geringer and Worthy (1999, p. 135) point out the pedagogical aspect of in-
tuneness: ”Learning to play in tune is of paramount importance in instrumental
music education.” According to Yarbrough et al. (1995, p. 232), intonation is one
of the primary aspects in the evaluation of both ensemble and solo performances.
Cuffman (2016, p. 73) refers to the complexity of intonation, saying, “Learning to
play in tune together is an endless process.” This is a definition with truth—the
improvement of intonation never ends. Indeed, Scholtz (1998) thinks that the
solution to intonation problems lies only in dynamic “ad hoc adjustments of pitch.”
These adjustments help to obtain optimal consonance, but also preserve the melodic
line and pitch stability (Scholtz, 1998, p. 10).
Bohrer (2002) has defined two separate principles for intonation. In the case of
fixed pitch instruments, the reference note of a scale, temperament, or tuning
system is expected to remain unchanged. Bohrer calls this the fixed frequency
principle. In the case of instruments with flexible intonation and the singing voice,
the necessity or value of complying with a reference frequency is not apparent at
all. In Bohrer’s terminology, this principle is called the flexible reference principle
(Bohrer, 2002, p. 52). These concepts may not have been widely adopted in the
literature, but they are understandable and logical, and they provide a useful starting
point for thinking about performers’ solutions for intonation.
Morrison and Fyk (2002) suggest that intonation consists of several sub-skills,
which are pitch discrimination, pitch matching, and instrument tuning. Pitch
discrimination is a listener’s ability to perceive simultaneous pitches (chords) and
successive pitches (melodies). Pitch matching is a kind of active sound shaping,
and it is a separate skill from manipulating pitches. It is unclear whether
instructions improve intonation skills. It is also not clear enough whether even
experience improves intonation skills. Pitch-matching accuracy seems to improve
with training (Morrison & Fyk, 2002, pp. 187–190). However, from the present
study’s point of view, pitch discrimination is an essential skill. Experiment 1
(recognition of mistuning) is strongly related to this aspect of intonation.
Morrison (2000) defines the concept of good intonation as “the ability to adjust
performed pitches to minimize or eliminate perceived discrepancies” (p. 40). This
is, according to Morrison, a kind of amalgam of many abilities that have been

24
developed over time, and the progressive interaction of these abilities underlies
high-level musical achievements (2000, p. 40). Eliminating perceived
discrepancies resonates very well with the present study—the tuning alternatives
used in Experiment 2 are solutions to the problem of the syntonic comma. Some
researchers bring the multidimensionality of intonation to the fore. According to
Leedy and Haynes (2005, p. 503), intonation has remarkable significance for the
musical expression of various styles and for their meaningful features, such as
tension and release and the coloring of melodies. Kanno (2003) largely agrees with
them: “Pitch is always related to other musical elements such as tone color, register,
dynamics and articulation” (p. 42). Intonation is one way to make musical timbre
perceptual—which is something music notation does not convey (Kanno, 2003, p.
48). From this perspective, intonation also covers aesthetic aspects that go beyond
such skills as Morrison and Fyk’s pitch discrimination, pitch matching, and
instrument tuning. In this vein, Kopiez (2003) notes: “The perception of mistuning
of varying degrees is not simply a question of psychoacoustics but also has a
considerable influence upon aesthetic appreciation” (pp. 384–385). Appreciating
intonation as an aesthetic experience is relevant for Experiment 2 (intonation
preferences), where different tuning alternatives are compared in a holistic fashion.
2.1.2 Harmonic series
Singers and instrumentalists produce harmonic tones that include, above and
beyond the fundamental frequency, an overtone series of frequencies based on
simple integer (whole number) ratios. The tuning of intervals can be derived from
the distances of these so-called harmonics or harmonic partials. The basics of
different tuning systems like Pythagorean tuning and 5-limit just intonation can
thus be deduced from the harmonic series (see, e.g., Devaney 2011, pp. 10–11).

25
Fig. 1. The harmonic series presented in musical notation. The ordinals of the harmonic
partials can be used to indicate frequency ratios corresponding to the intervals formed
within the harmonic series.
Musical intervals can be determined straight from the harmonic spectrum. The
intervallic distance between the first and second partials constitutes an octave and
corresponds, in the physical domain, to the frequency ratio 2:1. The distance
between the second and third partials constitutes a perfect fifth (3:2), while the third
and fourth partials constitute a perfect fourth (4:3). Similarly, the fourth and fifth
partials make up a major third (5:4), and the fifth and sixth partials constitute a
minor third (6:5). This list could be continued with ever smaller intervals.
Intervals can be calculated and “piled” very easily using the ratios inherent in
the harmonic series. Piling requires the multiplication of ratios. Let us take the pure
fifth and the pure fourth. Adding these two intervals should yield the perfect octave.
This corresponds to the following multiplication of frequency ratios:
3:2 × 4:3 = 12:6 = 2:1
Similarly, adding the intervals of a major third and a minor third gives the perfect
fifth:
5:4 × 6:5 = 30:20 = 3:2
Likewise, a minor second and a major third produce the perfect fourth:
16:15 × 5:4 = 80:60 = 4:3
A pure fifth and a major third give the major seventh:
3:2 × 5:4 = 15:8
As a final example, consider adding a pure fourth and a major third, resulting in the
major sixth:

26
4:3 × 5:4 = 20:12 = 5:3
In this research, intervals are usually presented both as ratios (2:1, 3:2) and as cents.
The octave is 1200 cents, and in equal temperament, the semitone is 100 cents, the
whole tone 200 cents, and so on. When an interval with a simple integer ratio is
transformed into cents, the following formula is used:
log2(f2/f1) × 1200 ≈ 3986 × log10(f2/f1)
(cf. Gordon, 1983, p. 24; Sethares, 2005, p. 317). Tunings and temperaments are
introduced in Sub-chapters 2.1.4, 2.1.5, and 2.1.6.
2.1.3 Consonance and dissonance
Harmony is a fundamental feature of Western tonal music that consists of
simultaneous pitch combinations. These pitch connections are traditionally
classified as either consonant or dissonant. Musical consonance and dissonance
have thus been widely discussed in musical and acoustic theory (Backus, 1977;
Parncutt & Hair, 2011; Partch, 1974; Rameau, 1722/1971; Schoenberg, 1911/1978;
Schön, Regnault, Ystad & Besson, 2005; Tenney, 1988; Terhardt, 1984; Von
Helmholtz, 1912).
The use of these concepts has also evolved through music history, from the Ars
Antiqua to the 20th century (see Tenney, 1988). Consonant intervals are usually
associated with pleasantness and dissonant ones with unpleasantness, and it is often
thought that consonance is somehow fundamental and primary (see, e.g., Schenker,
1935/1979). Despite centuries of discussion and theories concerning pitch
relationships, it seems that certain claims regarding intervallic consonance remain
stable. Behavioral evidence shows, time and again, that, for example, an octave
(2:1) or a perfect fifth (3:2) are perceived as more pleasant (consonant) than
intervals with more complex ratios (see, e.g., Schön et al., 2005).
It has thus been common for scholars in this field to make strict categorizations
of intervals into consonant and dissonant classes. A typical distinction is the one
made between perfect consonances (unison, perfect fourth, perfect fifth, and
perfect octave), imperfect consonances (minor third, major third, minor sixth, and
major sixth), and dissonances (minor second, major second, minor seventh, and
major seventh) (Bidelman & Krishnan, 2009, p. 13166). This distinction has
received empirical support, including in recent neurophysiological research. Schön
et al. (2005) investigated the experienced pleasantness and event-related brain
potentials (ERPs) of consonant and dissonant intervals. They found that musicians’

27
judgments of pleasantness were in line with the traditional music theory
categorizations of intervals as perfect consonances, imperfect consonances, and
dissonances. Non-musicians’ pleasantness judgments did not follow this pattern,
which shows that musical experience strongly influences the processing of
consonance/dissonance. Furthermore, electrophysiological results revealed
significant differences between the consonance categories for both musicians and
non-musicians. They also found that these effects of consonance seemed to rely on
the simultaneous presentation of notes (Schön et al., 2005, pp. 107, 113–116).
Johnson-Laird et al. (2012) introduced a dual-process theory of dissonance that
combines “sensory dissonance” as a psychoacoustic phenomenon and “tonal
dissonance,” which relies on culturally learned expectations regarding tonal syntax
(or “cultural familiarity”; see Cazden, 1980). Its basis is in the hypotheses of
Helmholtz (1912) and Terhardt (1984). The dual-process theory of dissonance
consists of four main principles: 1) tonal dissonance, which depends on scales; 2)
chords with a major third are more consonant than chords with no major third; 3)
chords built from thirds are more consonant than chords that are not; and 4) tonal
chords sound more consonant in tonal sequence than in a random sequence (the
circle of fifths is an example of a tonal sequence) (Johnson-Laird et al., 2012, pp.
24–25).
Consonance and dissonance have been examined in the traditions of both
music theory and music psychology. Parncutt and Hair (2011) promote a holistic
approach in which both traditions are needed. Consonance is often connected to
diatonicism and centricity, while dissonance is connected to chromaticism and
“acentricity,” which they take as too simplifying. Around consonance/dissonance
are other dichotomies to be analyzed, including diatonic/chromatic, centric/acentric,
stable/unstable, tense/relaxed, similar/different, close/distant, primary/subordinate,
and local/global (Parncutt & Hair, 2011, pp. 119–121).
Beats and roughness
Beats in musical tones were already known in the 19th century (see, e.g., Helmholtz,
1912, pp. 159–162). Campbell, Greated, and Myers (2004, p. 26) defined musical
beats as when “the addition of the two steady notes of slightly different pitch results
in a sound whose amplitude regularly rises to a maximum and dies away again. The
characteristic effect resembles a series of sound pulses, and each pulse is called a
beat.” Hence, the frequency difference between two adjacent notes is equal to the
number of beats per second. Acoustic “beats” are the result of the interference of

28
two sound waves with slightly different frequencies (see, e.g., Garofalo, 1996).
Villegas and Cohen (2010) stated, “Beats can be illustrated by the interference
produced by adding two sinusoids with slightly different frequencies” (p. 76). The
same authors described the concept of roughness as well: “Temporal envelope
changes produced by amplitude modulation can be perceived as ‘fluctuation
strength’ or ‘roughness,’ depending upon the modulation rate” (Villegas & Cohen,
2010, pp. 76–77).
Bohrer (2002) argues that the minimization of beats defines consonance (in
psychoacoustic terms). This involves the presence of beats at the levels of both the
fundamental and harmonics. The perception of roughness gives dissonance its
character. Beat perception is connected to the arithmetic difference between the
frequencies involved. In Bohrer’s terminology, dissonant intervals tuned according
to the harmonic series can be called the harmonic series principle, which says that
there is roughness but no extra beats (Bohrer, 2002, p. 53). In particular, the beats
of high-frequency components help us understand musical consonance and
harmony (Villegas & Cohen, 2010, p. 76).
2.1.4 Pythagorean tuning
The concepts of consonance and dissonance have been fundamental to music
theory since ancient Greece. An early attempt to define consonance and dissonance
is found in the number ratios of Pythagorean tuning (Duffin, 2007, p. 463; Gordon,
1983, p. 21; Jeans, 1937, pp. 166–172; Rasch, 2002; Sethares, 2005, pp. 52–56;
Von Helmholtz, 1912, p. 433; Weiss & Taruskin, 2007, pp. 2–4; White, 1975; Wood,
1975, pp. 137–140). According to legend, Pythagoras noticed that consonant (pure,
in tune) intervals corresponded to small-integer ratios of string lengths on a simple
string instrument called a monochord (Hall, 1974, p. 545). Pythagorean tuning is
based on the prime number 3-limit, which means that basic intervals used for
constructing the tuning can be accounted for by numbers that are divisible by 2 and
3 but no larger numbers (i.e., 2:1, 3:2, 4:3, and 9:8).
Pythagorean tuning is arrived at by tuning a succession of 12 perfect fifths from
an arbitrary reference pitch. To keep the pitches in the same octave range, some of
the 3:2 ratios in the succession have to be divided by 2 (Scholtz, 1998, pp. 7–8).
Thus, dividing by 2 converts fifths to fourths in the opposite registral direction.
Simply put, Pythagorean tuning is merely a series of pure (3:2) fifths piled in a
successive chain. Yet, if there are 12 fifths in the chain, the pitch of B# is 23.46
cents higher than the original pitch (supposing octave equivalence). The ratio is
29
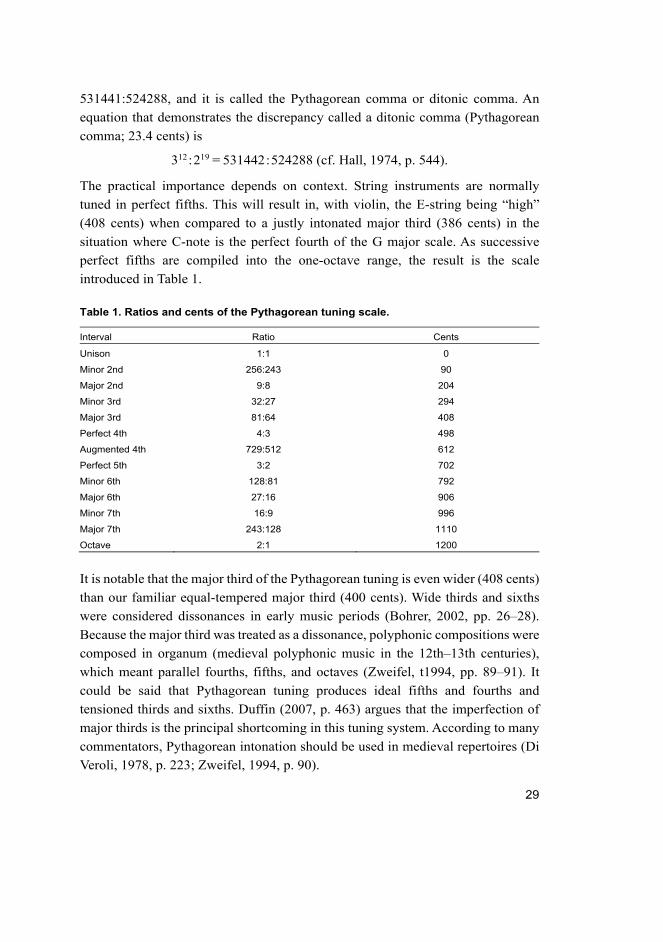
531441:524288, and it is called the Pythagorean comma or ditonic comma. An
equation that demonstrates the discrepancy called a ditonic comma (Pythagorean
comma; 23.4 cents) is
312 : 219 = 531442 : 524288 (cf. Hall, 1974, p. 544).
The practical importance depends on context. String instruments are normally
tuned in perfect fifths. This will result in, with violin, the E-string being “high”
(408 cents) when compared to a justly intonated major third (386 cents) in the
situation where C-note is the perfect fourth of the G major scale. As successive
perfect fifths are compiled into the one-octave range, the result is the scale
introduced in Table 1.
Table 1. Ratios and cents of the Pythagorean tuning scale.
Interval Ratio Cents
Unison 1:1 0
Minor 2nd 256:243 90
Major 2nd 9:8 204
Minor 3rd 32:27 294
Major 3rd 81:64 408
Perfect 4th 4:3 498
Augmented 4th 729:512 612
Perfect 5th 3:2 702
Minor 6th 128:81 792
Major 6th 27:16 906
Minor 7th 16:9 996
Major 7th 243:128 1110
Octave 2:1 1200
It is notable that the major third of the Pythagorean tuning is even wider (408 cents)
than our familiar equal-tempered major third (400 cents). Wide thirds and sixths
were considered dissonances in early music periods (Bohrer, 2002, pp. 26–28).
Because the major third was treated as a dissonance, polyphonic compositions were
composed in organum (medieval polyphonic music in the 12th–13th centuries),
which meant parallel fourths, fifths, and octaves (Zweifel, t1994, pp. 89–91). It
could be said that Pythagorean tuning produces ideal fifths and fourths and
tensioned thirds and sixths. Duffin (2007, p. 463) argues that the imperfection of
major thirds is the principal shortcoming in this tuning system. According to many
commentators, Pythagorean intonation should be used in medieval repertoires (Di
Veroli, 1978, p. 223; Zweifel, 1994, p. 90).

30
2.1.5 Just intonation and the syntonic comma
The diatonic just intonation scale can be formed by searching for the tonal functions
from harmonic series. As is widely known, the tonic triad consists of the perfect
fifth and major third. In the harmonic series, the perfect fifth comes from the
relationship between the third and second partials, thus corresponding to the ratio
of 3:2. The major third consists of the ratio 5:4, which is the relationship between
the fourth and fifth partials. Assuming the fundamental tone as C, we may
determine the notes E and G in this way (e.g., Ellis 1874; see also Backus, 1977;
Barbour, 1951/2004; Gordon, 1983; Jeans, 1937; Partch, 1974; Pierce, 1983;
Sethares, 2005; Von Helmholtz, 1912; Wood, 1975).
It is possible to adopt the dominant triad directly from the harmonic series, as
well. The root of the dominant triad would thus correspond to the third partial. The
fifth of the dominant triad is the ninth partial, and the third is the 15th partial. Hence,
the ratios involved are 15:9:3. All three ratios are divisible by 3. 15:9:3 = 5:3:1. The
latter ratio reveals that the dominant triad is formally a major triad, just like the
tonic one. The tones of the subdominant triad cannot be directly found in the
harmonic series. One way of generating the subdominant triad is to simply take a
perfect fifth downward from the reference tone (the fundamental of the original
harmonic series discussed above), thus arriving at F from C, for instance. Then a
major third (5:4) must be added to the subdominant root of F. The fifth of the triad,
C-tone, is already present as the original fundamental tone, C. Following this line
of thought, we get three pure or “just” major triads representing three tonal
functions: tonic, dominant, and subdominant. Three pure major triads constitute the
basis of the just intonation scale. The scale can be illustrated as a two-dimensional
lattice consisting of a “fifth dimension” and a “third dimension” (see Fig. 3), which
shows the white keys of the just intonation scale, so to speak.
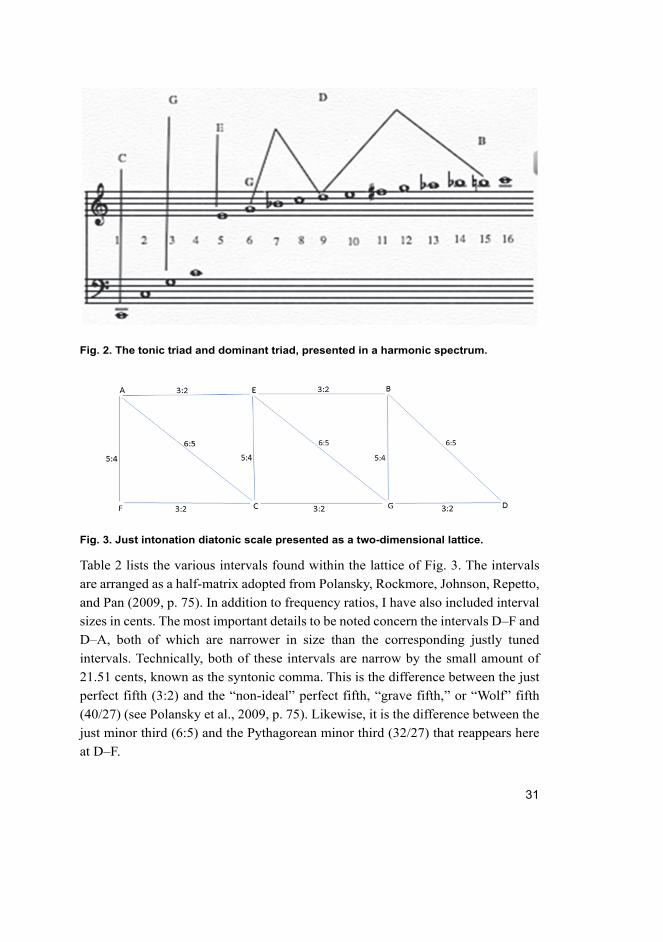
31
Fig. 2. The tonic triad and dominant triad, presented in a harmonic spectrum.
Fig. 3. Just intonation diatonic scale presented as a two-dimensional lattice.
Table 2 lists the various intervals found within the lattice of Fig. 3. The intervals
are arranged as a half-matrix adopted from Polansky, Rockmore, Johnson, Repetto,
and Pan (2009, p. 75). In addition to frequency ratios, I have also included interval
sizes in cents. The most important details to be noted concern the intervals D–F and
D–A, both of which are narrower in size than the corresponding justly tuned
intervals. Technically, both of these intervals are narrow by the small amount of
21.51 cents, known as the syntonic comma. This is the difference between the just
perfect fifth (3:2) and the “non-ideal” perfect fifth, “grave fifth,” or “Wolf” fifth
(40/27) (see Polansky et al., 2009, p. 75). Likewise, it is the difference between the
just minor third (6:5) and the Pythagorean minor third (32/27) that reappears here
at D–F.

32
Table 2. Interval half-matrix of the just diatonic scale.
No. C D E F G A B C
C 9/8
203.91
5/4
386.31
4/3
498.05
3/2
701.95
5/3
884.37
15/8
1088.27
2/1
1200.00
D 10/9
182.40
32/27
294.14
4/3
498.05
40/27
680.45
5/3
884.37
16/9
996.09
E 16/15
111.73
6/5
315.64
4/3
498.05
3/2
701.95
8/5
813.68
F 9/8
203.91
5/4
386.31
45/32
590.22
3/2
701.95
G 10/9
182.40
5/4
386.31
4/3
498.05
A 9/8
203.91
6/5
315.64
B 16/15
111.73
Syntonic comma, the conflict between the pure major third and the perfect
fifth
As noted earlier, the difference between the major third counted from four
ascending fifths and a major third (5:4) is called the syntonic comma (81:80) (cf.
Hall, 1974, pp. 547–548). The four unavoidable tuning discrepancies, according to
Zweifel (1994, pp. 92–93, 113) are the following:
1. The syntonic comma is the ratio that is achieved by the sequence of four perfect
fifths (3:2). The resulting pitch has to be brought down twice to stay within the
octave. The major third that is achieved is wider than the just major third. The
difference between those two major thirds is the ratio of 81/80, the syntonic
comma. The definition (four pure fourths—two pure octaves—major
third) = 21.51 cents.
2. The ditonic comma (Pythagorean comma) is the ratio achieved with the
sequence of 12 fifths (the complete circle of fifths). The final tone, B#, is
sharper than C. The definition (12 perfect fifths—seven perfect octaves) = 23.5
cents, with a ratio of 531441:524288.
3. The lesser diesis is the difference between the perfect octave and three major
thirds (5:4), and the octave is wider. The definition (the octave—three major
thirds) = 41.1 cents, and the ratio is 128/125.
33
4. The greater diesis is the difference between four minor thirds (6:5) and the
octave. The sequence of these four minor thirds clearly produces a wider
interval than the octave. The definition (four minor thirds—the perfect
octave) = 62.6 cents, with the ratio 648/625.
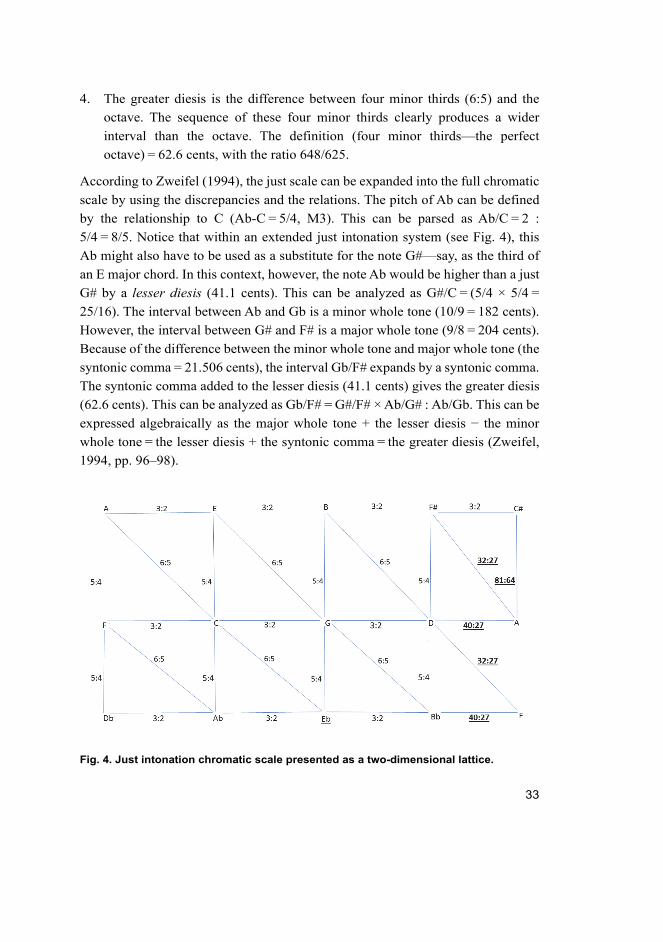
According to Zweifel (1994), the just scale can be expanded into the full chromatic
scale by using the discrepancies and the relations. The pitch of Ab can be defined
by the relationship to C (Ab-C = 5/4, M3). This can be parsed as Ab/C = 2 :
5/4 = 8/5. Notice that within an extended just intonation system (see Fig. 4), this
Ab might also have to be used as a substitute for the note G#—say, as the third of
an E major chord. In this context, however, the note Ab would be higher than a just
G# by a lesser diesis (41.1 cents). This can be analyzed as G#/C = (5/4 × 5/4 =
25/16). The interval between Ab and Gb is a minor whole tone (10/9 = 182 cents).
However, the interval between G# and F# is a major whole tone (9/8 = 204 cents).
Because of the difference between the minor whole tone and major whole tone (the
syntonic comma = 21.506 cents), the interval Gb/F# expands by a syntonic comma.
The syntonic comma added to the lesser diesis (41.1 cents) gives the greater diesis
(62.6 cents). This can be analyzed as Gb/F# = G#/F# × Ab/G# : Ab/Gb. This can be
expressed algebraically as the major whole tone + the lesser diesis − the minor
whole tone = the lesser diesis + the syntonic comma = the greater diesis (Zweifel,
1994, pp. 96–98).
Fig. 4. Just intonation chromatic scale presented as a two-dimensional lattice.
34
Complementing the just scale, Zweifel (1994) introduced an axiom of chromatic
invariance stating that the interval between any pair of notes is not affected by
chromatic alteration. This leads to the theorem that all augmented unisons in total
are 71 cents. For example, the difference between B and B# can be calculated. B
has a ratio of 15/8 = 1088 cents. B# is the result of three major thirds (5/4), which
gives the value of 1159 cents. This is the perfect octave (1200 cents) and the lesser
diesis (41.1 cents). The difference between B and B# is 71 cents (1159 − 1088). It
can be expressed as | X − X# | = 71 cents, and similarly true is X# − X## | = 71
cents. Correspondingly, | Xb − X | = 71 cents, and | Xbb − Xb | = 71 cents. One can
test this theorem by calculating Ab–G#. If Ab − A is 71 cents, G − A is 182 cents,
and, finally, G# − G is 71 cents and can be parsed as −71 cents + 182 cents – 71
cents. This gives 40 cents, which is an approximation of the lesser diesis, which is
in fact the classic example (Zweifel, 1994, pp. 99–101).
The chromatically extended just intonation scale differs essentially from the
Pythagorean tuning scale in the sizes of thirds and sixths and semitones and major
seventh. Fifths, fourths, octaves, and the major whole tones are the same because
they are derived from simple integer ratios of 2 and 3. Zweifel (1994, pp. 94–97)
shows the relationships of these four discrepancies:
the syntonic comma = the greater diesis − the lesser diesis 81/80 = (648/625) : (128/125).
the lesser diesis + the ditonic comma = three syntonic commas (128/125) × (312/219) = (81/80)3.
The difference between the whole tones (9:8) and (10:9) is also a syntonic comma,
9/8 : 10/9 = 81/80. Similarly, the interval that consists of the cycle of three perfect
fifths is higher than the major sixth (5:3) by a syntonic comma (Zweifel, 1994, pp.
94–97).
The utility of just intonation
Blackwood (1985) has listed several principles describing just tuning, including
that octaves, perfect fifths, perfect fourths, and major and minor triads have to be
pure. This means that Pythagorean thirds and sixths have to be avoided, if possible,
which in turn means avoiding high leading tones. Blackwood notes that this is
possible if the third of a major triad is lowered by a syntonic comma (compared to
Pythagorean intonation). Respectively, the third of a minor triad must be raised by
a syntonic comma (compared to Pythagorean intonation). Another way to make this
35
minor triad pure is to lower the root and the fifth by a syntonic comma, which
minimizes the risk of occurrence of the syntonic comma in melodic lines. In the
case of minor keys in just tuning, the aim should be to maximize the number of
tones from the relative major scale using the syntonic comma (Blackwood, 1985,
pp. 129–130). The fourth degree in the minor scale and the second degree in the
major scale give the possibility of adjusting pitches by a syntonic comma.
Cuffman (2016) presented an introduction to just intonation through string
quartet playing. The players in a string quartet usually make intonation adjustments
based on the melodic line of their part. Music students may be unaware of the
differences between melodic and harmonic intonation. Cuffman argues that
melodic intonation is often determined by Pythagorean intonation, whereas
harmonic intonation is based on just intonation. A horizontal approach to intonation
is present through education, where learning harmony belongs to chamber music
playing. The study by Cuffman presents 34 examples for improvement of
intonation concerning intervals, chords, and harmonic progression from the
standpoint of a string quartet. Cuffman (2016) points out quite ordinary successions
of double stops where the player needs to adjust common notes by a syntonic
comma in order for the successive harmonic intervals to be purely tuned (pp. 26–
29, 32).
Bohrer (2002) wrote that the implementation of pure intonation gives the
natural basis of extended, flexible intonation. It includes the idea of mutable notes,
which are natural events in enharmonic passages. The harmonic complexity of
musical passages determines how many notes have to be mutable. In simple
passages, the second degree of the major key and the second and seventh degrees
of the minor key would necessarily involve mutable notes (Bohrer, 2002, pp. 54–
55).
Pure intonation demands an increase in the number of pitches per octave. Some
investigators added extra keys for keyboard instruments. Examples include Ellis’s
Duodenarium, Colin Brown’s voice harmonium, General Perronet Thompson’s
enharmonic organ, Henry Ward’s Poole’s organ, and Bosanquet’s generalized
keyboard implements, the 53-tone equal temperament (Bohrer, 2002, p. 31).
Werntz (2001) claims that just intonation theory has fundamental weaknesses
with theoretical premises, and there are also fundamental practical limitations when
applying just intonation principles. Just intonation is a one-dimensional musical
conception, specifically, a vertical view of music. Werntz claims that it includes a
belief according to which music is generated by harmony (Werntz, 2001, pp. 163–
165). Ternström and Karna (2011) argue, “There is no inherent advantage of using

36
just intonation in choir music” (p. 280). Blackwood (1985) analyzed an extract
from César Franck’s Symphony in D minor and concluded that just tuning was
inappropriate for that piece of music. In general, Blackwood was not able to find
any professional composer whose style could be adapted to the limitations of just
tuning. He claimed that just tuning is of no practical use among the Western
repertoire (Blackwood, 1985, pp. 150, 153). In a rather complex tonal music
repertoire, the necessity of temper thirds or fifths is so complex that Blackwood’s
comment is understandable.
In a performance context, differences within 1 or 2 cents would have little
practical consequence for musicians (Spiegel & Watson, 1984, p. 1694). The
difference between the perfect fifth (3:2 = 702 cents) in just intonation and equal
temperament (700 cents) is an illustrative example of this. Hall (1974) says that
“there does not exist any arrangement which constitutes a ‘tuning’ for both fifths
and thirds” (p. 547). Hall denotes the musical scale of 12 notes/octave.
Barbour (1951/2004) argued that performers’ intonations include errors most
of the time. These errors are the deviations from equal temperament that Barbour
considered to be the standard of intonation. Music with a lot of chromaticism makes
professional singers flounder in intonation and makes just intonation singing
impossible (Barbour, 1951/2004, pp. 196–198). He was remarkably strict in
relation to just intonation, saying, “Just intonation is [a] very limited, cumbersome
and unsatisfactory tuning system” (Barbour, 1938, p. 48).
It is obvious that an analytical approach to most simple harmony gives
evidence of how far just intonation can reach. In this study, beat-free triadic chord
progressions are charted in Experiment 1 (see Chapter 3) and Experiment 2 (see
Chapter 4).
2.1.6 Keyboard temperaments
Temperaments for keyboards are concrete implications of tempering intervals.
Simplifying the issue, this means that the pure intervals derived from a harmonic
series are slightly altered in keyboard temperaments—that is, made impure—such
that it renders the temperament usable in more than one key. This alteration happens
by distributing the syntonic comma around the scale being used. The history of
Western music recognizes a vast number of keyboard temperaments that have been
employed during various style periods.

37
Meantone tuning
The aforementioned Pythagorean tuning leaves perfect fifths pure but produces
wide major thirds and narrow minor thirds, as noted in the previous sub-chapter.
Meantone tuning leaves thirds pure but tempers fifths (see, e.g., Backus, 1977;
Barbour, 1951/2004; Chuckrow, 2006; Jeans, 1937; Kassel & Bush, 2006; Lindley,
1990; Neuwirth, 2012; Rasch, 2002; Sethares, 2005; Von Helmholtz, 1912; Wood,
1975). Within these two extremes, there is a large number of compromise tunings,
which lets all intervals be tempered (Hall, 1974, p. 546). Hall argued that meantone
tuning replaced Pythagorean tuning because the syntonic comma error is split
equally among four fifths. At the same time, the related third is just. According to
Hall, it is easier for the human ear to detect mistuning in a fifth than in a third (Hall,
1974, p. 550).
Meantone tuning could be used practically in one key at a time, depending on
composition, and it was usual for meantone tuning to be tuned separately for
various keys. Therefore, music could not modulate in the way that is common today.
Di Veroli (1978) argues that the standard meantone temperament should be used in
Renaissance and baroque repertoires. In addition, singers should be preceded by
sharp/flat alternatives (Di Veroli, 1978, p. 223 a-b).
The 1/4 comma meantone tuning enables pure thirds (386 cents) for C–E, D–
F#, Eb–G, E–G#, F–A, G–B, A–C#, and A#–D. The last interval is, of course, a
diminished fourth, but in a fixed temperament, it is also used as the major third.
Conversely, the perfect fifths have been narrowed by 5.43 cents, which is 1/4 of a
syntonic comma (21.51 cents). The syntonic comma here is the difference between
the major whole tone (9:8 = 204 cents) and minor whole tone (10:9 = 182 cents).
These intervals form a pure major third (5:4 = 386 cents). In this tuning, the major
third is split into two equal intervals, which gives 193 cents, and this procedure was
translated to the name “meantone.” The 1/4 comma meantone tuning will be used
in Experiment 2; it is presented in Table 3.

38
Table 3. The 1/4 comma meantone tuning scale from Pietro Aaron (1523) compared to
the 5-limit just intonation scale and Pythagorean tuning scale, in cents.
Pitch Pythagorean tuning scale in
cents
5-limit just intonation Meantone tuning scale in
cents
C 0 0 0
C# 90 112 76
D 204 204 193
Eb 294 316 310
E 408 386 386
F 498 498 503
F# 612 590 580
G 702 702 697
G# 792 814 773
A 906 884 890
A# 996 1018 1007
B 1110 1088 1083
C 1200 1200 1200
Well temperaments
The terms well temperaments, circulating temperaments, and irregular
temperaments all refer to 12-tone scales in which the wolf fifth is distributed to
several fifths. This enables 12 possible key signatures, including fifths that are more
or less tolerable. Irregular temperaments lived side by side with meantone tuning
during the 17th century and were used for two centuries (Benson, 2006, p. 181).
Sponsler (2011, pp. 8–9) emphasizes that well temperaments distributed the comma
in various ways that led to a particular sense of character in different keys. This
was known among composers. Well temperaments also tempered major thirds, not
just perfect fifths. Benson (2006, p. 183) refers to the key characteristics originally
published by Christian Schubart in his book Ideen zu ainer Aesthetik der Tonkunst
(1806). Different key signatures have their own character among irregular
temperaments (see e.g., Barbour, 1951/2004; Benade, 1990; Chuckrow, 2006; Cyr,
2017; Rowland, 2001; Sethares, 2005).
The term “well tempered” comes from Johann Sebastian Bach’s (1685–1750)
Das Wohltemperierte Clavier. During his time, Andreas Werckmeister (1645–1706)
used this term as the title of his first published book, Erweiterte und Verbesserte
Orgel-Probe (1681/1976). Werckmeister developed six temperaments named
according to him. Werckmeister I tuning (in the following table) was picked up
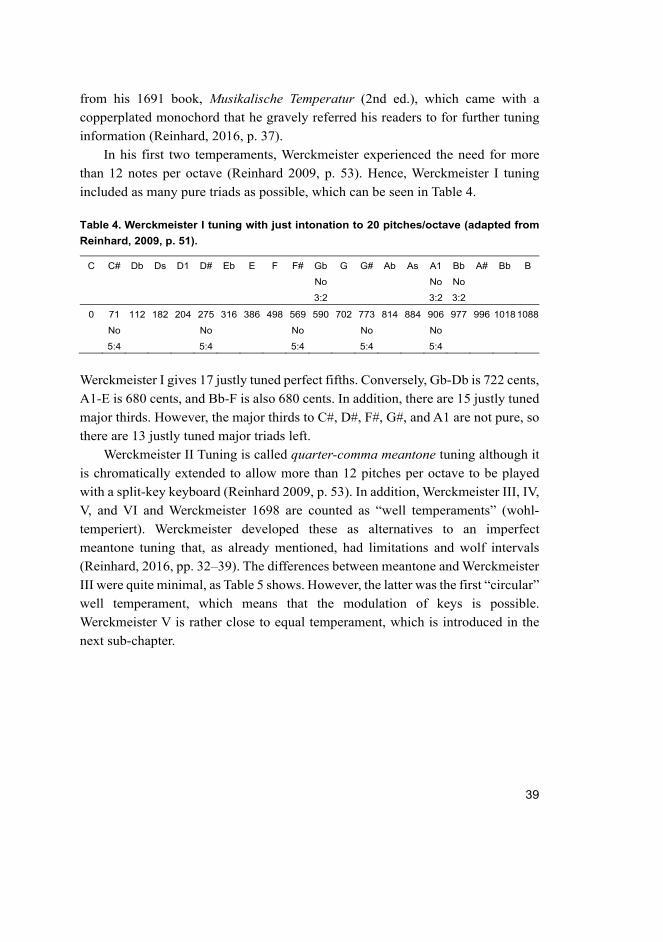
39
from his 1691 book, Musikalische Temperatur (2nd ed.), which came with a
copperplated monochord that he gravely referred his readers to for further tuning
information (Reinhard, 2016, p. 37).
In his first two temperaments, Werckmeister experienced the need for more
than 12 notes per octave (Reinhard 2009, p. 53). Hence, Werckmeister I tuning
included as many pure triads as possible, which can be seen in Table 4.
Table 4. Werckmeister I tuning with just intonation to 20 pitches/octave (adapted from
Reinhard, 2009, p. 51).
C C# Db Ds D1 D# Eb E F F# Gb
No
3:2
G G# Ab As A1
No
3:2
Bb
No
3:2
A# Bb B
0 71
No
5:4
112 182 204 275
No
5:4
316 386 498 569
No
5:4
590 702 773
No
5:4
814 884 906
No
5:4
977 996 1018 1088
Werckmeister I gives 17 justly tuned perfect fifths. Conversely, Gb-Db is 722 cents,
A1-E is 680 cents, and Bb-F is also 680 cents. In addition, there are 15 justly tuned
major thirds. However, the major thirds to C#, D#, F#, G#, and A1 are not pure, so
there are 13 justly tuned major triads left.
Werckmeister II Tuning is called quarter-comma meantone tuning although it
is chromatically extended to allow more than 12 pitches per octave to be played
with a split-key keyboard (Reinhard 2009, p. 53). In addition, Werckmeister III, IV,
V, and VI and Werckmeister 1698 are counted as “well temperaments” (wohl-
temperiert). Werckmeister developed these as alternatives to an imperfect
meantone tuning that, as already mentioned, had limitations and wolf intervals
(Reinhard, 2016, pp. 32–39). The differences between meantone and Werckmeister
III were quite minimal, as Table 5 shows. However, the latter was the first “circular”
well temperament, which means that the modulation of keys is possible.
Werckmeister V is rather close to equal temperament, which is introduced in the
next sub-chapter.

40
Table 5. The 1/4 comma meantone scale compared with the Werckmeister III and
Werckmeister V scales.
Note 1/4 Comma meantone
tuning
Werckmeister III well
temperament
Werckmeister V
C 0 0 0
C# and Db 76 90 96
D 193 192 204
D# and Eb 310 294 300
E 386 390 396
F 503 498 504
F# and Gb 580 588 600
G 697 696 702
G# and Ab 773 792 792
A 890 888 900
A# and Bb 1007 996 1002
B 1083 1092 1098
C 1200 1200 1200
The aforementioned temperaments are only a thin sample of irregular
temperaments in Western music, but they give some perspective on the abundance
of tuning systems and temperaments used. According to Benson (2006, pp. 184–
186), in addition to Werckmeister, irregular temperaments were developed by at
least Mersenne (1644), Bendeler (1690/1739), Neidhardt (1724), Kirnberger (1764,
1779), Lambert (1774), Marpurg (1776), Barca (1786), Vallotti (1780), and Young
(1800).
Equal temperament
Described as the simpliest, the equal temperament scale is divided into 12 pitches
with equal distance. The semitones of equal temperament originate from the
frequency ratio 1:1.05946 invented by French mathematician Mercenne in the book
Harmonie Universelle (1636) (Jeans 1987, p. 174). The formula is (White, 1975, p.
398):
n 12 = 2 n = (2)1/12 = 1.05946.
In fact, the pitches of the equal temperament scale are closer to Pythagorean tuning
than just intonation. The equal temperament scale is widely discussed in the
literature (see, e.g., Backus, 1977; Benade, 1990; Gordon, 1983; Jeans, 1937;

41
Sethares, 2005; Von Helmholtz, 1912; Wood, 1975). Table 6 introduces the
frequency ratios, frequencies (Hz), and cents of equal temperament and compares
them to the cent values of Pythagorean tuning.
Table 6. Frequency ratios, frequencies (Hz), and cents of equal temperament compared
to Pythagorean tuning.
Note ET1 frequency ratio ET frequency in hertz
(Hz) (A4 = 440 Hz)
ET in cents Pythagorean tuning
in cents
C 1.000 262 0 0
C# and Db 1.059 277 100 90
D 1.122 294 200 204
D# and Eb 1.189 311 300 294
E 1.260 330 400 408
F 1.335 349 500 498
F# and Gb 1.414 370 600 612
G 1.498 392 700 702
G# and Ab 1.587 415 800 792
A 1.682 440 900 906
A# and Bb 1.782 466 1000 996
B 1.888 494 1100 1110
C 2.000 523 1200 1200
1 ET = equal temperament
Concerning enharmonic pairs of equal temperament, 12 perfect fifths give from Eb
the pitch for D#, which is higher than Eb (from the chain of seven perfect octaves)
by a Pythagorean comma. To get D# and Eb to the same pitch, the fifths have to be
tempered by a 1/12 Pythagorean comma. The perfect fifth is 702 in cents. The fifth
in the equal temperament is 700 cents. This leads to enharmonic pairs of the equal
temperament (Scholtz, 1998, pp. 5–6).
Bohrer (2002) says that the effort to minimize impurities is an essential feature
of temperaments as they attempt to close the octave range within a fixed number
of pitches. This led to an endless number of temperaments, and the final destination
was equal temperament. It was the extreme compromise between consonance and
the number of fixed keys per octave—transpositions were to sound homogenized
(Bohrer, 2002, p. 43). Jorgensen (1991) described the situation before 1917, when
tempering intervals of keyboard instruments was an art based on an enthusiastic
sense of key colors for each individual interval or chord. But with equal
temperament, this sense of color has disappeared (Jorgensen, 1991, p. 3).
Blackwood (1985) says, “The equal tuning theorem states that if all the pitches

42
forming any closed circle of intervals are reproduced in all registers by octave
transpositions, the result is an equal tuning” (p. 226). The temperaments other than
12-tone equal temperament are limited to certain historical periods. According to
Blackwood (1985), equal temperament is the most appropriate temperament for all
polyphonic music, despite it being imperfect (Blackwood, 1985, p. 244). Violinist
and professor of music performance Mieko Kanno (2003) considered the
generalization of equal temperament and its effects on violin playing and intonation
strategies, saying, “The vital link between composition and performance was
broken. Intonation became an issue of performance practice alone” (p. 36).
The equal temperament was used from the middle of the 19th century with
pianos and organs, and it was used in fretted guitars and lutes even before that
(Scholtz, 1998, pp. 4–5). Sethares (1994) says: ”Just intonations (and the related
scales) sacrifice the ability to modulate music through multiple keys, while 12-tone
equal temperament sacrifices the consonance of intervals” (p. 17). The above brief
presentation of central tuning systems in Western music can be summarized in the
comparison given in Table 7.
Table 7. Pythagorean tuning, 5-limit just intonation, 1/4 comma meantone tuning,
Werckmeister III, Werckmeister V, and equal temperament scales in cents.
Note PT1 5-limit JI2 1/4 comma
MT3
Werckmeister III
well
temperament
Werckmeister V Equal
temperament
C 0 0 0 0 0 0
C# and Db 90 112 76 90 96 100
D 204 204 193 192 204 200
D# and Eb 294 316 310 294 300 300
E 408 386 386 390 396 400
F 498 498 503 498 504 500
F# and Gb 612 590 580 588 600 600
G 702 702 697 696 702 700
G# and Ab 792 814 773 792 792 800
A 906 884 890 888 900 900
A# and Bb 996 1018 1007 996 1002 1000
B 1110 1088 1083 1092 1098 1100
C 1200 1200 1200 1200 1200 1200
1 PT = Pythagorean tuning, 2 JI = just intonation 3 MT = meantone tuning
Bohrer (2002) argues that equal temperament sets requirements that are difficult to
satisfy in a cappella singing; singers can hardly replicate a tuning built on fixed-

43
layout instruments. However, counting beats is not feasible in a performance
situation. Performers often ignore the deviations from the various tuning systems,
and the fixed layout of the keyboard strongly influences intonational strategies.
There are hundreds of temperaments, all of them imperfect. At the same time, there
has been no attempt to provide for a flexible procedure toward intonation (Bohrer,
2002, p. 51).
2.1.7 Pitch drift
Pitch drift was already known in the 16th century. The example in Fig. 5 illustrates
the phenomenon of pitch drift that takes place while keeping the note A of the
soprano voice stationary in the first two bars.
Between the two upper voices, the first two bars of the example would urge us
to first tune a pure fifth between D and A, and then, keeping the latter note in place,
a pure fourth between E and A. Considering the example with the just intonation
lattice in Fig. 3 in mind, we would start from the D at the far right of the lattice,
reaching out from the lattice by two new horizontal steps to the right: D–A–E. Thus,
we would have arrived at a new E that is no longer the one seen in the original
lattice. More technically speaking, the notes E and C in the second bar would have
to be raised by a syntonic comma to make the intervals E–A (4:3) and C–A (5:3)
pure. This happens four times in the example. Here, maximizing the purity in
vertical intervals gradually leads to a pitch drift by four syntonic commas,
amounting to a shift of fundamental frequency by 86 cents, or almost a semitone.

44
Fig. 5. Giovanni Benedetti 1563: Drift by a comma during a progression, with intonation
analysis of the author.
Pitch drift may also take place in quite ordinary harmonic progressions (Hall, 1974,
p. 549). He illustrates pitch drift with the typical tonal cadence I – vi – ii6 – V – I.
In Fig. 6, I have added an intonation analysis to Hall’s example of pitch drift. Let
us first consider what would happen if the example were performed in just
intonation, without pitch drift. In just intonation, all vertical triads in the example

45
could be tuned according to small-integer ratios, except the ii6 triad on the third
beat of the first bar. Holding on to the fixed pitches of the just intonation scale, the
ii6 triad would be mistuned by a syntonic comma (21.51 cents; see Table 2).
Fig. 6. Intonation analysis of the cadence I – vi – ii6 – V – I by the author.
To avoid the mistuned ii6 triad, there is not much to do. Theoretically, we could
raise the A in soprano (third beat of the bar) to form a pure fifth (702 cents) with D.
However, this note is tied to the second beat of the bar. It might not seem
appropriate to raise the tied A by a syntonic comma because of voice leading and
tradition. So, it is better to keep the A stable. But then we are forced to lower the D
of the ii6 triad to make that triad pure. Then, to make the next V triad pure, we must
remember that the fifth of the dominant triad was lowered by a syntonic comma (to
make the ii6 triad pure). Now D of this ii6 triad is tied to the next bar, so the root and
the third of the V triad have to be lowered by a syntonic comma. The consequence
is, of course, that the melodic movements to the root of the V triad have to be altered
by syntonic comma (expand downward, reduce upward). The melodic movement
in tenor voice from D to B is 6:5 (316 in just intonation), but the third of the

46
dominant triad is a syntonic comma lower than in the original pitch because the
previous D was lowered. Now pitch drift has happened. The next triad will
inevitably be flattened by a syntonic comma. As Hall (1974) writes, “If sung in just
intonation, with each tied note being held at constant pitch, it will leave the chord
21.5 cents lower at the end than at the beginning” (p. 549). In other words, in a
major key context, pitch drift is the consequence of the combination of making the
ii triad pure and tying it by common notes to other chords around it. After this
examination, it is much easier to understand the following remark from Hall (1974):
“Anyone who thinks ‘going flat’ is evidence for lack of skill in a choir should work
out the arithmetic of this example for himself” (p. 548). Barbour managed to define
pitch drift, although he spoke about fluctuating:
On the assumption that the pitch of a repeated note remains constant in
successive chords, the pitch of the key will not vary so long as the roots of
chords move by fourth or by fifths; but if a root falls a minor third or rises a
major third, the pitch is lowered by a comma; in the reverse progressions (root
falling a major third or rising a minor third) the pitch is raised by a comma.
(1938, p. 50)
Barbour (1938) uses the first phrase of God Save the King as an example. He seems
to have thought that the origin of pitch drift lies in certain root progressions, but as
a matter of fact, his generalization is not completely correct. For example, a I–iii
movement in a major key would not lead to pitch drift, although chord roots are
related by a major third. As the following intonation analysis of Barbour’s sample
shows, the reason for pitch drift is, again, in achieving a vertically pure ii triad in a
context where it shares some pitches with the surrounding chords. One of the root
progressions that Barbour points out—a falling minor third—indeed takes place
between the two first chords (I–vi), but what is important in this is the resulting
note E in the alto voice, representing the sixth degree of the G major scale. As this
note is repeated in the following ii6 triad, it forces the root in the soprano voice to
be lowered by a syntonic comma in order to create a vertically pure ii6 triad. The
lowered ii6 root will draw the rest of the voices downward in the subsequent
melodic movements leading to the next chord. Hence, the melodic movements from
the third and fifth ii6 triads (across the first barline in Fig. 7) are all altered by a
syntonic comma.

47
Fig. 7. The author’s intonation analysis of God Save the King.
In Fig. 8, I took the passage from Howard’s (2007b) study, where it is used to
illustrate pitch drift, and made an analysis of it. The analysis shows that the
fundamental frequency falls no less than 129 cents if vertical triads stay in just
intonation.

48
Fig. 8. The author’s intonation analysis of the exercise from Howard (2007b, p. 88).
The previous examples of pitch drift demonstrated the phenomenon by means of
examples from the research literature. In typical tonal harmonic contexts, pitch drift
occurs around the ii triad. In order to achieve pure intonation of this triad, either its

49
root is lowered by a syntonic comma (pitch drift down), or its third and fifth are
raised by a syntonic comma (pitch drift up). The mistuning of the ii triad is thus
transferred to the melodic movements around it. To sum up, there are two
possibilities for pitch drift (in a major key context):
– Pitch drift up: The third and the fifth of the ii triad are raised by a syntonic
comma:
– If the root of the ii triad is kept stable at 204 cents from the tonic note
(according to just intonation), the melodic movements to the third and fifth
of this triad have to be raised by a syntonic comma compared with melodic
movements of original pitch in just intonation.
– Thereafter, the melodic movement from the root of the ii triad has to be
raised by a syntonic comma, completing the upward pitch drift (compared
with melodic movements of the original pitch in just intonation).
– The common tied notes are kept stationary, and the tuning of the following
chord is defined by it.
– Pitch drift down: The root of the ii triad is lowered by a syntonic comma:
– If the third and fifth of the ii triad are kept stable at 498 and 884 cents,
respectively, from the tonic note (according to just intonation), the melodic
movement to the root of this triad has to be lowered by a syntonic comma
(compared with melodic movements of original pitch in just intonation).
– Thereafter, the melodic movements from the third and fifth of the ii triad
have to be lowered by a syntonic comma, completing the downward pitch
drift (compared with melodic movements of the original pitch in just
intonation).
– The common tied notes are kept stationary, and the tuning of the following
chord is defined by it.
In a major key just intonation context, pitch drift can thus be defined as a change
of fundamental frequency as a result of a phenomenon where the second degree
syntonic comma is allocated to melodic movements surrounding this triad due to
keeping common notes between successive chords stationary. In fact, this demand
for stationary notes explains the phenomenon where a syntonic comma transfers
into melodic movements. Hence, pitch drift can also be defined as a change of
fundamental frequency due to successively drifting away from the original just

50
intonation lattice via domino-like chord changes where successive chords share
common notes and where new notes are tuned as pure intervals in relation to them.
The aforementioned examples show theoretically potential situations where a
syntonic comma can be transferred to melodic movements and pitch drift can
happen “in the wholeness”. Of course, all these phenomena can occur imperfectly.
The ii triad can stay mistuned less than 21.51 cents, and hence only a part of a
syntonic comma can be allocated to melodic movements. Pitch drift may be only,
say, 5–10 cents, which might be more probable than a complete pitch drift. As
discussed in Sub-chapter 2.3.3, Howard (2007b) has investigated this and showed
that the ditonic comma (23.5 cents), the lesser diesis (41.1 cents), and the greater
diesis (62.6 cents) can be involved in pitch drift phenomena.
There have been some interesting examinations of pitch drift in recent research,
and they are presented in Sub-chapter 2.4.3. Villegas and Cohen (2010) mentioned
the concept of pitch drift, referring to the tendency where the actual pitches are
different from those nominally determined by a certain tuning system. This
necessitates the absence of fixed-pitch instruments, like keyboards. Musicians
adjust intervals to a maximum consonance in consonant chords. In practice,
however, musicians often try to prevent excessive pitch drift in performance
(Villegas & Cohen, 2010, p. 79). This means distributing the syntonic comma over
the adjusted intonation both horizontally and vertically. In temperaments, this is
done by tempering, as will be remembered from Sub-chapter 2.1.6.
Stange et al. (2018) presented another example of pitch drift: playing a full
chromatic scale with semitones of 16:15 (111.73 cents) will end up in an octave of
1340 cents instead of 1200 cents. Another way would be alternating sizes of 111.73
cents and 92.18 cents, which ends up at 1223.46 cents. Therefore, the authors
present an equation to implement an additional pitch drift compensating
mechanism (Stange et al., 2018, p. 56). This kind of perspective of pitch drift differs
from the one used in this research but broadens the concept. Pitch drift phenomena
that are based on chains of melodic intervals are perhaps not so probable in singing,
not to mention in acoustic instrumental music. In this study, pitch drift is conceived
of as a discrepancy of just intonation that is realized in tonal chord movements.
2.1.8 Harmonic and melodic intonation
The question of melodic and harmonic intonation in tonal music relates firmly to
the problem of the syntonic comma previously presented in Sub-chapter 2.1.5. The
understanding of pitch drift also makes the distinction of harmonic and melodic
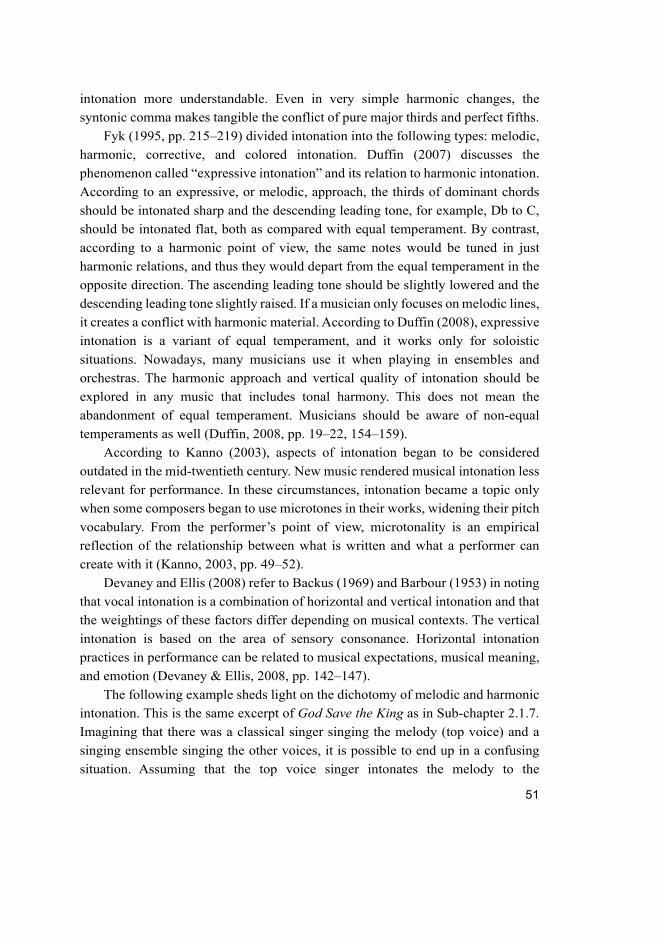
51
intonation more understandable. Even in very simple harmonic changes, the
syntonic comma makes tangible the conflict of pure major thirds and perfect fifths.
Fyk (1995, pp. 215–219) divided intonation into the following types: melodic,
harmonic, corrective, and colored intonation. Duffin (2007) discusses the
phenomenon called “expressive intonation” and its relation to harmonic intonation.
According to an expressive, or melodic, approach, the thirds of dominant chords
should be intonated sharp and the descending leading tone, for example, Db to C,
should be intonated flat, both as compared with equal temperament. By contrast,
according to a harmonic point of view, the same notes would be tuned in just
harmonic relations, and thus they would depart from the equal temperament in the
opposite direction. The ascending leading tone should be slightly lowered and the
descending leading tone slightly raised. If a musician only focuses on melodic lines,
it creates a conflict with harmonic material. According to Duffin (2008), expressive
intonation is a variant of equal temperament, and it works only for soloistic
situations. Nowadays, many musicians use it when playing in ensembles and
orchestras. The harmonic approach and vertical quality of intonation should be
explored in any music that includes tonal harmony. This does not mean the
abandonment of equal temperament. Musicians should be aware of non-equal
temperaments as well (Duffin, 2008, pp. 19–22, 154–159).
According to Kanno (2003), aspects of intonation began to be considered
outdated in the mid-twentieth century. New music rendered musical intonation less
relevant for performance. In these circumstances, intonation became a topic only
when some composers began to use microtones in their works, widening their pitch
vocabulary. From the performer’s point of view, microtonality is an empirical
reflection of the relationship between what is written and what a performer can
create with it (Kanno, 2003, pp. 49–52).
Devaney and Ellis (2008) refer to Backus (1969) and Barbour (1953) in noting
that vocal intonation is a combination of horizontal and vertical intonation and that
the weightings of these factors differ depending on musical contexts. The vertical
intonation is based on the area of sensory consonance. Horizontal intonation
practices in performance can be related to musical expectations, musical meaning,
and emotion (Devaney & Ellis, 2008, pp. 142–147).
The following example sheds light on the dichotomy of melodic and harmonic
intonation. This is the same excerpt of God Save the King as in Sub-chapter 2.1.7.
Imagining that there was a classical singer singing the melody (top voice) and a
singing ensemble singing the other voices, it is possible to end up in a confusing
situation. Assuming that the top voice singer intonates the melody to the

52
Pythagorean direction (high major thirds and leading tones, narrow semitones,
whole tones as 204 cents, which is common in melody lines), the top voice can drift
to the sharp direction momentarily even two syntonic commas, which means 43
cents. Yet assuming that other voices, following just intonation, intonate vertically
pure intervals with respect to one another, without being affected by the top voice,
then the distance between the top voice and second voice produces unpleasant
intervals (520 cents, 429 cents, 337 cents). This extremely simple example shows
that practical intonation in non-fixed intonation is a continuous process.
Fig. 9. An example of dichotomy of harmonic and melodic intonation.
2.2 Recognition of mistuning: Previous research
The first experiment of the present research explores the recognition of mistuned
triads by a syntonic comma. In this sub-chapter, I will introduce the reader to the
central previous research undertaken in this field. These studies are focused on
53
perception and discrimination of intervals, perception of mistuning, perceived pitch
of vibrato, and perception related to intonation in performance.
2.2.1 Musical interval perception
The performance and perception of intonation have been the research topic in
numerous studies. I will introduce general principles of perception of musical
elements, method of adjustment, identification on intervals, and categorical
perception.
Pitch
Pitch is “the perceptual correlate of fundamental frequency (F0), that is, the rate at
which a periodic waveform repeats itself” (de Cheveigné, 2010, p. 71). This
definition is for the psychoacoustician. Pitch is the stuff of which melody, harmony,
and tonality are made. Pitch (physically “periodicity”) is essential for segregating
rival sound sources in perception. In spite of different amplitudes, durations, spatial
positions, and spectral contents, the sound stimuli can invoke the same pitch. An
accurate pitch perception can mean a superlative sensitivity to tiny changes of
fundamental frequency but also a skill in ignoring huge differences in other
dimensions of pitch (de Cheveigné, 2010, p. 71). Micheyl et al. (2006) wrote,
“Pitch is a fundamental dimension of auditory perception, which plays an essential
role in most forms of music” (p. 36). Oxenham (2013) added, “Pitch is arguably
the most important dimension for conveying music” (p. 9).
General principles
Before I present an overview of prior research concerning the human ability to
perceive pitch, musical intervals, and slight differences and mistunings between
musical tones, it is important to realize that previous investigations of pitch
perception are, on the whole, ultimately based on the pitch of pure tones or the pitch
of complex tones. As Oxenham (2013) put it, “Pure tones produce a clear,
unambiguous pitch, and we are very sensitive to changes in their frequency” (p. 9).
Musical sounds are mostly complex tones, and most have a pitch. Harmonic
complex tones are composed of the fundamental frequency that corresponds to the
repetition rate of the entire waveform. In addition, they include upper partials,

54
harmonics (overtones) that are spaced at integer multiples of the fundamental
frequency (Oxenham 2013, p. 12).
Another dichotomy of perception is successive (melodic) tones and
simultaneous (harmonic) tones. Benson (2006) relates this conceptual distinction
to the distinction between two types of measurements—just noticeable difference
(JND), or limen, for successive tones and the discrimination threshold for
simultaneous tones (Benson, 2006, pp. 11–12). However, there is some diversity of
usage of these concepts.
A third dichotomy of tone perception issues is that between identification
resolution and the discrimination resolution. A very well-known rule of thumb
concerning working memory capacity, 7 ± 2, by Miller (1956, pp. 87–91), when
applied to musical intervals, refers to the finding that resolution in single-interval
absolute identification tasks is quite limited. According to Burns and Campbell
(1994), subjects “are able to identify only about five to nine stimuli over the entire
stimulus range with perfect consistency, or equivalently, are able to place a large
number of stimuli drawn from this range into only five to nine categories without
error” (p. 2704). A discrimination resolution, instead, is much more accurate. In
pairwise discrimination tasks, this can mean dozens to hundreds of different stimuli
that subjects are able to discriminate (Burns & Campbell, 1994, p. 2704).
Method of adjustment
One frequently used method of investigating the perception of musical intervals is
the method of adjustment, where a pair of tones is presented to the participant. The
first tone is fixed in frequency, and the participant can control the second one. The
participant is asked to adjust the second tone to correspond to a certain musical
interval. Burns (1999, p. 220) refers to Moran and Pratt (1926), who reported an
average deviation of 14–22 cents when using simultaneously presented chromatic
pure tones. Burns (1999, p. 220) also refers to Terhardt (1969) and Ward (1953,
1954), where simultaneous octaves composed of sinusoids produced an average
standard deviation (SD) of 10 cents in repeated adjustments. Meanwhile, Burns and
Campbell (1994, p. 2715) found a standard of deviation of 18.2 cents for
adjustments of semitones and 20.9 cents for quarter tone adjustments.
Elliot, Platt, and Racine (1987) investigated the adjustment of successive and
simultaneous intervals among musically experienced and inexperienced subjects,
and the mean constant error among musically experienced subjects varied from −1
cent to +5 cents. The corresponding result among inexperienced subjects varied
55
from −1 cent to −11 cents. Mean relative errors on six simultaneous intervals varied
from 11.3 to 19.8 cents among musically experienced subjects. The corresponding
values on successive intervals were 12.5–25.4 cents (Elliot et al., 1987, pp. 596–
597).
Identification of intervals: Magnitude and absolute identification
The above-mentioned 7 ± 2 rule from Miller (1956) does not seem to be true for
identifying the pitch of a single tone. As a highly educated professional in ear
training, I know dozens of colleagues, as well as myself, who can readily identify
all categories from unison to major tenth with perfect accuracy. Killam, Lorton, and
Schubert (1975) also found this. They investigated the identification of harmonic
and melodic intervals among musically trained students and undergraduate music
students. The subjects identified chromatic intervals within an octave rather well:
Overall, the percentage of identification was from 55% (major sixth) to 88%
(perfect octave). The average correct identification was 77% (.2 sec) and 76% (.1
sec) (Killam et al., 1975, pp. 217–218). In the case of intervals of chromatic scale
over a range of two to five semitones, category-scaling identification functions
have obtained 10–20 cents of increments (Burns, 1999, p. 222). ”Relative pitch
possessors can categorize frequency ratios into more than 12 categories per octave
at better than chance level performance, that is, they can judge ‘out of tune’
intervals” (Burns, 1999, p. 223).
Categorical perception
Categorical perception can be defined by two attributes: well-defined identification
functions and discrimination functions. Stimuli must be systematically and reliably
categorized by subjects. In addition, discrimination functions have to be predicted
from identification functions. Here, the assumption is that subjects cannot
discriminate stimuli better than they can identify them differentially (Burns & Ward,
1978, p. 457). Categorical perception of intervals has been charted out by a few
investigators (Burns & Ward, 1999; Siegel & Siegel, 1977; Zatorre & Halpern,
1979). In a study by Siegel and Siegel (1977b), a group of musicians made
magnitude estimations of simultaneous musical intervals: the fourth, the tritone,
and the fifth. The stimulus tones (sine-wave) were presented in increments of 20
cents. The magnitude judgments of the subjects did not follow the stimulus
magnitude but rather revealed discrete steps corresponding to musical intervals of

56
the fourth, #fourth, and fifth. In labeling tasks, the subjects produced identification
functions with strictly defined boundaries: step-like estimation functions that
constantly corresponded, more or less, to semitones. This happened between each
of the three musical categories and was regarded by the authors as evidence for
categorical perception in the pitch domain. According to the results, musicians had
a clear tendency to judge out-of-tune stimuli as being in tune—within-category
ratings were inaccurate and unreliable (Siegel & Siegel, 1977, pp. 402–405).
In essence, the categorical perception of intervals means, on the one hand,
identification of different musical intervals in reliable category boundaries and, on
the other hand, the discrimination of two stimuli only to the extent that those
intervals are differentially identified (Burns, 1999, p. 226). Burns and Ward (1978)
investigated categorical perception of melodic musical intervals. Musically trained
listeners could almost perfectly identify five chromatic musical interval categories
presented in ascending intervals as sinusoids (M2, m3, M3, p4, and triton).
Discrimination thresholds were, on average, approximately 20 cents for the
aforementioned intervals. For musically untrained subjects, the discrimination
thresholds were much larger at 74.5 cents on average. Thus, the musically untrained
observers did not show evidence of some kind of “natural” categories for musical
intervals (Burns & Ward, 1978, pp. 459–466). Concerning musical intervals, Burns
(1999) puts it this way: “In general, only musicians are able reliably to label
musical intervals, and only musicians show evidence of categorical perception for
musical intervals” (p. 229).
2.2.2 Discrimination thresholds in perception of successive tones
A number of investigations have been conducted concerning the perception of tones
that are very close to each other. The majority of these studies concern pitch
discrimination of successive stimuli. We will concentrate more closely on a few of
them.
In the study by Spiegel and Watson (1984), frequency discrimination skills
were tested among orchestral musicians and non-musicians, and the two groups
were compared. The authors found a clear relationship between musical
background and frequency discrimination skills. Among musicians, the median
difference thresholds for single successive tones (2–8 cents) were three times
smaller than the values of non-musicians (Spiegel & Watson, 1984, pp. 1690, 1694).
Schellenberg and Trehub (1994) found that changes from simple melodic
patterns representing simple frequency ratios to more complex ones were more

57
easily recognized than were changes from complex to simple ratios (p. 476).
Houtsma (1968, p. 383) found that the JND defined as the 75% correct point
between two successive in frequency ratios was 16 cents for several ratios in the
vicinity of the octave.
Tervaniemi, Just, Koelsch, Widmann, and Schröger (2005) also investigated
pitch-discrimination accuracy for defining frequency difference thresholds among
musicians and non-musicians. In discrimination tasks, the stimulus frequency was
528 Hz and the deviating frequencies, presented successively, were 532 Hz (0.8%),
539 Hz (2.1%), and 550 Hz (4.2%). Musicians discriminated the pitch deviations
faster and were more accurate in the task with small and medium pitch changes
(0.8% and 2.1%, respectively) than non-musicians. However, even non-musicians
detected pitch changes surprisingly reliably: The hit rate of non-musicians for small
deviations of 0.8% (14 cents) was as high as 41.7%. Musicians detected mistuning
in all conditions, and the weakest hit rate was 91.3% with small deviations of 14
cents (Tervaniemi et al., 2005, pp. 3–8). Tervaniemi and the team could perhaps
have assembled one more level with a smaller deviation than 0.8%. In fact, Micheyl
et al. (2006, p. 36) investigated the effects of musical and psychoacoustic training
on the discrimination of successive tones. In the pre-test for the study, the
discrimination threshold of musically trained participants was 0.13% in all test
conditions (pure tones, complex tones, monoaural condition, and contralateral
noise condition) with stimuli of 330 Hz. This corresponds to only 2 cents, which is
quite low. Also, 0.13% is remarkably smaller than the results with musically
untrained participants (0.86%, on average, across all test conditions, which equates
to 15 cents). The difference was larger for complex tones than pure tones (Micheyl
et al., 2006, pp. 39–45).
In the study by Marmel, Tillmann, and Dowling (2008), listeners discriminated
slightly mistuned tones more sensitively when they were tonally more related to
the context key than with tones that were tonally less related. The effect occurred
only for the finer mistuning (9 cents), not for the 17-cent mistuning (Marmel et al.,
2008, pp. 848–849). Zarate, Ritson, and Poeppel (2012, pp. 988–991) found that
the pitch-discrimination threshold for musicians was 14 ± 3 cents at 225 Hz and 25
± 6 cents at 475 Hz in pairs of successive tones. Another study with comparisons
between successive pure tones (standard stimulus of 1000 Hz) reported a frequency
discrimination threshold for musicians of 4 Hz (approximately 6 cents), and for
non-musicians, the threshold was slightly under 6 Hz (approximately 10 cents)
(Parbery-Clark, Skoe, Lam & Kraus, 2009, pp. 655–657).

58
In a study with a similar 1000 Hz standard stimulus, Strait, Kraus, Parbery-
Clark, and Ashley (2010) found a mean discrimination threshold of 0.85% among
musicians and 3.12% among non-musicians—this means 15 cents for musicians
and 53 cents for non-musicians. A low-frequency discrimination threshold
correlated with cognitive performance as measured by non-verbal IQ. This
correlation was found in both groups, but the correlation was stronger among
musicians than among non-musicians (Strait et al., 2010, pp. 24–25).
Schellenberg and Moreno (2010) studied the connection between musical
training, pitch-processing speed, and frequency discrimination and general
intelligence (g). In the frequency discrimination of pure tones, musically trained
participants achieved better scores than did untrained participants in musically
common registers (two octaves above middle C) but not in very high registers (e.g.,
4000 Hz). Mean thresholds in frequency discrimination with low-frequency tasks
were 18.36 cents for trained participants and 48.07 cents for untrained participants.
On the high-frequency task, the thresholds of both groups increased remarkably
(trained, 66.25 cents; untrained, 79.88 cents), and there was more variability within
groups (Schellenberg & Moreno, 2010, pp. 214–216).
Stolzenburg (2015, p. 11) studied harmonic perception and generalized that the
JND between pitches for human beings is approximately 1% for the low-frequency
range that is usable for musical purposes. In musicians’ language, this would be 17
cents at the pitch level of A3 (220 Hz). Further, Stolzenberg (2015) concluded that
the JND can be 0.7% (equating to 12 cents) in medium and high frequencies but
was clearly larger at low frequencies.
Slater, Azem, Nicol, Swedenborg, and Kraus (2017) compared professional
singers, professional percussionists, and non-musicians with regard to their
“signature of expertise” as musicians. Vocalists showed better scores in frequency
discrimination in pure-tone thresholds and better encoding of speech harmonics
compared to non-musicians. Percussionists were more precise in encoding quickly
altered acoustic features of speech compared to non-musicians. In frequency
discrimination tasks, the standard (pure) tone used in the test was 1000 Hz. Non-
musicians could perceptually differentiate between two pitches that differed by 36
cents, corresponding to an average threshold of 2.09%. Among professional
musicians, vocalists scored a mean threshold of 0.45% (8 cents) and percussionists
scored 0.53% (9 cents) (Slater et al., 2017, pp. 954–960).
In general, independent of the stimuli, Ballard (2011, p. 30) assumed on the
grounds of earlier findings that the difference limen for pitch perception is, in
general, between 3 and 8 cents. Karrick (1998, p. 119) assumes that recognizable

59
intonation errors could range between 2 and 20 cents. Taken all together, the above-
mentioned results seem to follow these limits within a fair variance.
2.2.3 Discrimination thresholds in perception of simultaneous tones
From the point of view of the present study, it is also relevant to take an overview
of discrimination results in the context of simultaneous tones. Both pure tones and
complex tones have been used in previous investigations regarding this question.
In this overview, I will neglect thresholds of sound pressure level (dB) and duration
and reaction time and timbre.
Vos (1982) investigated the discriminability of pure and mistuned musical
intervals as complex tones that were performed simultaneously. In addition, Vos
studied the beat thresholds of different beat frequencies and the determination of
the direction of mistuning. The results showed that discrimination thresholds are
higher for major thirds than for fifths, and they are highest for the lowest beat
frequencies. Further, the sensitivity to beats for mistuned fifths and major thirds
was almost similar. Beat frequency seemed to influence sensitivity to beats only in
some conditions. Finally, the mean identification of directional mistuning for the
fifth and major third ranged from 20 to 30 cents (Vos, 1982, pp. 304, 309–312).
According to Burns and Ward (1978, p. 456), the difference limen for musical
interval discrimination can be estimated from the SD of repeated adjustments being
in the range of 10 to 30 cents.
Elliot et al. (1987) investigated the adjustment of simultaneous intervals among
musically experienced and inexperienced subjects. Mean relative errors on six
simultaneous intervals varied from 11.3 to 19.8 cents among musically experienced
subjects and from 18.1 to 23.3 cents for musically untrained subjects (Elliot et al.,
1987, pp. 596–597).
Burns (1999) wrote that ”for simultaneous intervals composed of two complex
tones with many harmonics, subjects can easily distinguish on this basis intervals
mistuned from exact small-integer ratios by as little as ±2 cents” (p. 245). However,
the deviation of simultaneous low-level pure tones can raise the threshold up to 50
cents. In summary, participants can use beats and roughness connected to sensory
dissonance of intervals to discriminate small mistunings, especially in the case of
typical musical instruments with rich harmonic spectra (Burns, 1999, p. 245).
The above-mentioned studies show a wide range of discrimination thresholds
for simultaneous tones. Moreover, there seems to be a lack of investigations
addressing the perception of mistuned harmonic chords. Experiment 1 with

60
harmonic mistunings fills this gap. Dunnigan (2002, p. 81) argued that
identification of a note error seems to be a different task from the accurate
discrimination of a note being sharp or flat. In the following sub-chapter, we
concentrate on the latter phenomenon.
2.2.4 Perception of horizontal mistuning
The following paragraphs introduce investigations where the perception of
horizontal mistunings among melodic intervals or in melodies of musical excerpts
were in focus.
Dobbins and Cuddy (1982) investigated the “discrimination of octave” finding
support of the phenomenon called “octave stretch.” The stimulus tones were
sinusoidal, with the manipulated octaves presented linearly, and the participants
used the method of adjustment. The results showed that the subject’s estimated
octave was approximately 22 cents sharper than the physical octave (1200 cents).
The differences between subjects were rather large, from −2.43 cents up to 34.25
cents (Dobbins & Cuddy, 1982, pp. 412–413).
Schellenberg (2001) studied musically trained and non-trained listeners who
were tested on their ability to discriminate pure-tone intervals belonging to the
perfect fifth category of an equally tempered fifth of 700 cents. Other fifths were
mistuned at 660, 680, 720, and 740 cents. The intervals to be compared were
presented in both sequential (melodic) and simultaneous (harmonic) conditions.
Participants succeeded in discriminating better when the standard interval was
more in tune than the comparison interval. When the standard interval was less
accurately tuned than the comparison interval, remarkably poorer scores were
observed. The results of the trained listeners were significantly better than the
performance of the untrained listeners, and a significant correlation was found
between musical training and discrimination of flat intervals (Schellenberg, 2001,
pp. 232–241). The size of differences, 20 cents, is close to the syntonic comma
(21.51 cents) used in this research.
Vurma and Ross (2006) asked 13 professional singers to perform a series of
melodic intervals, a minor second, a tritone, and a perfect fifth, both ascending and
descending. Listeners—both the participants themselves and other participants—
were asked to listen to the performance and estimate whether each interval was
tuned correctly. For the intervals judged to be in tune, the average deviation
compared to just intonation intervals was 11 cents. In some cases, melodic intervals

61
could be accepted as correctly tuned even when they were 20–25 cents out of tune
(Vurma & Ross, 2006, pp. 331–342).
Tonal expectations can influence pitch perception, as shown by Marmel et al.
(2008) when, using short melodies, participants judged the pitch of tonally related
tones more accurately than the pitch of less related target tones. This occurred even
if participants judged tonally related targets more in tune overall. Mistunings in
melodies were 17 and 35 cents (Marmel et al., 2008, pp. 843–849).
Vurma (2010) studied the pitch-matching strategy of singers in two-part a
cappella singing in reaction to pitch deviations of equally tempered values on the
ensemble partner’s part. Most singers preferred equally tempered melodic intervals
in their own part, while they usually ignored the mistuning (20 and 40 cents) in
vertical intervals. Hence, they followed the preciseness of melodic intervals to that
of harmonic intervals in the accompaniment part and ignored the harmonic
mistuning between their part and the synthesized accompaniment. In a perception
task, the participants recognized 58% of 40 cent mistunings and 34% of 20 cent
mistunings in the accompaniment part (Vurma, 2010, pp. 27–28). Vurma (2010, p.
32) speculated that the result would have been different if the singers had been
asked to follow the purity of harmonic intervals for accompaniment with all those
modifications. For the present research, it is relevant to note that the latter
mistuning is close to the syntonic comma (21.51 cents). In the experiment by
Vurma (2010), there were mistunings of 40 cents and 20 cents. These mistunings
seem arbitrary, but 20 cents is near the syntonic comma, and 40 cents is very close
to the diminished second (16:15 × 25:24 = 128:125 = 41.059 cents).
Van Besouw, Brereton, and Howard (2008) studied the range of acceptable
tones (RAT) for those with vibrato and those without vibrato, using repeating
ascending and descending three-tone arpeggios. The RAT varied from 21.9 cents
to 37.55 cents and was approximately 10 cents greater (30–36 cents) for vibrato
tones than for unmodulated tones (21–25 cents). The interesting detail is that in just
intonation, the lower RAT limit in major thirds was 1.5 cents wider than the upper
tone of the M3 interval in just intonation (386 cents). The upper RAT limit was 6.5
cents wider than M3 in Pythagorean tuning (408 cents). Yet, widening of M3 does
not seem to alter the results. In perfect fifths, 686 was the lower RAT limit. Sharp
perfect fifths were not accepted because the upper RAT limit was 710 cents (van
Besouw et al., 2008, pp. 147–152).
Hedden and Baker (2010) investigated children’s singing accuracy with a
familiar melody, both accompanied by a piano and a cappella. One observation in
perceptual analysis was that the expert judges did not judge pure a cappella singing

62
as being pure. Instead, the acoustic and perceptual analyses were parallel when
judging out-of-tune singing with accompaniment (Hedden & Baker, 2010, pp. 42–
44).
Larrouy-Maestri (2018) studied the perception of mistuning with a method
called the “limits procedure.” The subjects were asked to identify sung manipulated
six-tone melodies as in tune or out of tune. The measured tolerance for mistuning
was approximately 25 cents and varied from 10 cents to 50 cents. Concerning the
subjects’ tolerance with regard to mistuning across six-tone melodies, the mean
tolerance threshold was approximately 21 cents. Music experts showed smaller
thresholds (10 cents) than lay listeners (25 cents) (Larrouy-Maestri, 2018, pp. 6–9).
2.2.5 Perception of vertical mistuning
This sub-chapter introduces investigations in which the perception of vertical
mistunings was the focus. It is a question of perception of mistuned simultaneous
intervals or chords in harmonic musical excerpts.
Zatorre and Halpern (1979) investigated the perception of major and minor
thirds of simultaneously sounded pure tones. Musicians judged 300, 314, 329, and
mostly 342 cent intervals as a minor third. Respectively, intervals of 400, 386, and
mostly 371 cents were judged as major thirds (Zatorre & Halpern, 1979, pp. 386–
387).
In a study by Hall and Hess (1984), the identification threshold of mistuning
of simultaneous musical intervals was mostly between 15 and 30 cents. The authors
had only seven subjects, and the results varied among them with regard to intervals.
The mistuning was hardest to detect in minor seventh and tritone intervals. Further,
just intonation intervals were judged more in tune than equally tempered intervals
(Hall & Hess, 1984, pp. 175–177, 191).
Rasch (1985) investigated the perception of melodic and harmonic intonation
in two-part musical fragments. The melody was intonated in equal temperament,
while the harmonic intervals were justly intonated. In addition to this “correct”
intonation, he used mistuning factors with weighted mean values of 6.6 cents, 16.6
cents, and 33.1 cents. Rasch (1985) found that the larger the size of the mistuning,
the poorer the samples were judged. Surprisingly, the mistuning factor of 6.6 cents
was preferred over the correctly tuned one. Mistuning in the melodic line was
experienced as most disturbing, and mistuning in the bass part was least disturbing.
Mistuning of 16.6 cents (weighted mean) in harmonic intonation was more often
experienced as being out of tune than in tune. The last category of 33.1 cents with

63
harmonic mistuning was judged out of tune by nearly all the participants (Rasch,
1985, pp. 446–448).
Not surprisingly, musical expertise affects the discrimination of vertical
mistunings. Koelsch, Schröger, and Tervaniemi (1999) investigated the pitch-
discrimination accuracy of professional violinists and non-musicians. The standard
stimulus involved major triads of sinusoidal tones, including a pure major third and
a perfect fifth. The comparison triad had its third lowered from 495 Hz to 491.25
Hz, which corresponds to 12 cents. Violin players recognized 80% of the mistuned
triads, and non-musicians only recognized 10% (Koelsch et al., 1999, pp. 1310–
1313). If the reported hertz values hold true, the stimulus triad was, in fact, not pure
but had a relatively large fifth (708 cents). This presumably could have affected the
results.
In the aforementioned study by Schellenberg (2001), musically trained and
non-trained listeners were tested on their ability to discriminate pure-tone intervals
belonging to the perfect fifth category of equally tempered fifths of 700 cents. With
regard to harmonic intervals, in Schellenberg’s study, musically trained participants
had clearly better performance than untrained participants only in flat intervals. For
sharp intervals, there were no differences between groups (Schellenberg, 2001, p.
244).
Dunnigan (2002) found that college music majors identified intonation errors
significantly more accurately than college non-music majors and high school
students. Dunnigan used equally tempered tonic chords in a perception task. Sharp
thirds were easier to perceive than flat thirds, and sharp roots and fifths of a tonic
chord were harder to perceive than flat roots and fifths (Dunningan 2002, pp. 145–
146).
Vurma (2010, pp. 27–28) found that 22% of his participants correctly judged a
tuned accompaniment to be flat and 24% judged it to be sharp. Indeed, it should be
remembered that even octaves are more easily accepted as somewhat stretched (+
10–17 cents), although horizontally performed, than theoretically pure versions
(Sundberg, 1982, pp. 64–71, 75–76). Also, Hartmann (1993, pp. 3403–3405)
investigated octave stretch with successive sine tones involving octaves mistuned
by 11, 23, and 34 cents. Listeners’ matching reproducibility showed an average SD
of 8.6 cents, while the largest of the SDs was 19.6 cents.
Larrouy-Maestri, Harrison, and Müllensiefen (2019) introduced an adaptive
test of mistuning perception ability. Excerpts of pop music performances were
assembled as stimulus material involving a pitch-manipulated vocal track. Another
validation study applied this test to 66 subjects with great amounts of experience

64
and musical expertise to produce evidence of the reliability and validity of the test.
At the conclusion of this test, the authors stated that it is a capable experimental
tool for testing human ability to judge mistuning (Larrouy-Maestri et al., 2019).
2.2.6 Perception and intonation in performance
The important 20th century tuning theorist J. Murray Barbour (1951/2004) was not
convinced that singers can sing thirds and sixths purely without beats because he
thought that the human ear has no affinity for justly tuned intervals. He was
skeptical of singers’ ability to perceive errors in the range of the syntonic comma
(21.5 cents) (1951/2004, pp. 196–198). However, as the following brief review will
show, musicians can often make smaller perceptual distinctions than they are able
to show in their own performance intonations.
Yarbrough et al. (1995) studied tuning performance and perception of young
instrumentalists and found no correlation between performance and perception in
terms of cent deviation scores, which corroborates earlier findings. The direction
of original mistuning affected the direction of the errors for both performance tasks
(tuning F or Bb with their own instrument) and perception (tuning knob of a
variable-pitch keyboard). In the performance task, approaching the target pitch
from above resulted in sharper responses; approaching it from below resulted in
flatter responses. Mechanical limits of wind instruments affected intonation more
than the perception of intonation (Yarbrough et al., 1995, pp. 237–240).
Again, Morrison (2000, pp. 47–50) noticed that melodic context did not seem
to affect the accuracy of wind players, and the pitch accuracy demonstrated within
a musical context only had a weak connection to the ability of a performer to tune
an isolated pitch. Also, in the study by Worthy (2000, p. 232), only a low correlation
was found between perception and performance responses. Bradshaw and
McHenry (2005) studied pitch discrimination and pitch production of inaccurate
adult singers. They also did not find a statistically significant relationship between
pitch-discrimination and pitch-matching skills. Some singers discriminated both
pitches and produced pitches inaccurately. The second group consisted of singers
who discriminated pitches accurately but produced pitches inaccurately. Reasons
for this might be a lack of experience or an inflexible vocal mechanism that is
difficult to coordinate. The investigators emphasized that music teachers should
notice this characteristic (Bradshaw & McHenry, 2005, pp. 436–439).
In Dunnigan’s (2002) study, clarinet players tended to play the root and the
fifth of tonic chord sharp, whereas the third was usually played slightly flat. Slow

65
tempo was connected to sharp intonation. They also performed significantly
sharper melodies in the descending melodic directions than with ascending
directions (Dunnigan, 2002, pp. 145–146). It is no wonder that clarinet players
tended to play thirds a bit flat. The third in just intonation is 386 cents and equally
tempered is 400 cents. Perhaps the players were aiming to beat minimization in
thirds. If the roots and the fifths were played sharp and the thirds slightly flat, the
relationships between intervals are close to just intonation intervals. Kopiez (2003,
p. 407) wrote, “A certain degree of dependence of the melody on the harmonic
progressions is necessary for successful intonation adaptation.”
Ballard (2011) studied the perceived intonation and performance intonation by
undergraduate wind instrument majors and compared it with just intonation, equal
temperament, and Pythagorean tuning. The accompaniment was executed with
those three tunings. No significant correlations with any single tuning system were
found, although equal temperament had some advantages in performance. Again,
there was no correlation between perceived intonation and performed intonation,
nor was there a correlation between participants’ vocal and instrumental
performances. The participants intonated better (correct responses 68%) in
comparison to their performance in perception (47%). In addition, the instrumental
task produced lower deviations (from 7.36 to 9.64 cents) than the vocal task
(deviations from 16.80 to 23.47 cents) (Ballard, 2011, pp. 24–30). On the basis of
Ballard’s study and the other reviewed studies, it seems that intonation perception
and intonation performance are not strongly connected. Powell (2010, p. 91)
crystallizes the idea, saying, “Intonation perception and intonation performance
may be discrete abilities.”
2.2.7 Effects of vibrato and timbre
Vibrato and timbre and their influence on intonation have been in focus in several
investigations. They are mostly connected to musical practices. I will introduce a
few studies of them.
Vibrato and masking
In a study of violinists’ and cellists’ use of vibrato, Geringer and Allen (2004, pp.
167, 173–176) found that the use of vibrato increased the stability of a performer’s
intonation. The previous result is in line with Morrison and Fyk (2002, p. 189), who

66
wrote, “The presence of vibrato in a target stimulus has also been found to affect
the accuracy of pitch responses.”
String instrument vibrato was the attraction in a study by MacLeod (2008), as
well. Among university and high school violin and viola players, pitch register
affected the vibrato rates and widths. The findings were surprising: mean vibrato
width was 34 cents in the lower register and 58 cents in the upper register, and
vibratos were wider when performing forte passages as compared with piano
passages (MacLeod, 2008, pp. 52–53); 58 cents sounds like a lot, indeed.
Pope (2012) investigated the influence of playing position, fingers used, and
level of training on vibrato, and playing position had a significant impact on vibrato
rates, widths, and pitch with both vibrated and non-vibrated tones. The mean
vibrato width for cellists was 32.51 cents. Vibrato oscillation patterns were found
both above and below the note (Pope, 2012, pp. 60–61). Mick (2014) found
convergent results regarding double bass players’ vibrato width. Total vibrato
widths ranged from 7 to 55 cents. Vibrato widths increased consecutively with
higher pitch registers or positions. For all fingers, vibrato width was increased by
multiple cents in consecutively higher positions. The pitch matching of vibrato
tones was almost exact with non-vibrated tones (Mick, 2014, pp. 50–52).
Interestingly, van Besouw et al. (2008) noticed that vibrato tone can be 10 cents
flat before it is perceived as being out of tune. However, in the study by Geringer,
MacLeod, and Ellis (2014), the pitches of vibrato tones on the violin were
perceived as significantly (2–5 cents) lower than corresponding tones without
vibrato. Among experienced players, the differences were smaller than among less
experienced players. In a performance task, the participants were asked to tune their
own instrument to match stimulus tones. The responses with vibrato were a few
cents lower than the responses without vibrato (Geringer et al., 2014, pp. 359–361).
Cello and violin sounds were also used in the study by Geringer, MacLeod,
and Allen (2010), in which string performers and music majors (without string
performance experience) were asked to adjust to match the perceived pitch of
vibrato stimuli. The distribution of scores produced a significant difference
between the two groups: For violin and cello tones, the string performers exhibited
a smaller deviation in tuning estimations than non-string players. Listeners
apparently perceive the intended and performed pitch as a mean of the performed
vibrato extents (Geringer et al., 2010, pp. 354, 359–361).
Using vibrato can make intonation more indistinct. Among others, Sundberg
(1982, p. 76) thinks that the vibrato in Western repertoire is an essential means to
reduce the risk for beats in pitch matching: With vibrato, pitches that deviate from

67
theoretical values are better accepted by listeners than are pitches without vibrato.
Bohrer (2002) argued outright that it is a misunderstanding to assume that vibrato
should always be present in musical practice: Vibrato has the capacity of turning
beat detection inoperative because vibrato disguises beats; vibrato singers and non-
vibrato singers use different tools to develop their intonation control, and the
masking effect covers the harmonics in all articulated vowels (Bohrer, 2002, pp.
40–41). In a related manner, Duffin (2008) argued that constant vibrato in musical
performance can be related to the generalization of equal temperament. He
wondered if performers’ sensation of the vibrato masks the unpleasantness of
equally tempered thirds. However, during the periods when non-equal
temperaments were used, vibrato was used as an ornament (Duffin, 2008, pp. 158–
159). Van Besouw et al. (2008, p. 145) noted, “It is widely believed that vibrato, a
musical device consisting primarily of a modulation in frequency, can be used to
disguise errors in tuning.”
The influence of tone quality on pitch perception
The influence of timbre on intonation has been observed from several aspects: tone
quality of wind instruments related to intonation ratings, effects of changes in tone
quality on the perception of interval size, influences of tone quality with instrument
and singing voice intonation, and the influence of timbre on perceived interval size.
Geringer and Worthy (1999) investigated the effect of tone quality on
intonation ratings with clarinet, trumpet, and trombone stimuli. Non-majors and
high school students had a sharp tendency in their intonation ratings when there
were changes of tone quality in the bright direction. Intonation by clarinet with tone
quality changes in the bright direction was judged sharper than intonation by
trumpet and trombone. Contrary to the high intonation judgments accompanying
changes of tone quality in the bright direction, the stimuli with darker tone quality
were judged as flatter in intonation (Geringer & Worthy, 1999, pp. 142–147).
Worthy (2000, p. 231) also found that the participants combined “bright” tone
quality with sharp tuning and the “dark” tone quality with flat tuning.
Further, Russo and Thompson (2005) found that for musically untrained
participants, timbre had an influence on the perceived size of melodic intervals.
The six-semitone interval changes were manipulated with congruent timbre change,
which means that an ascending interval involves a shift from a dull to a bright
timbre, and this was perceived to be larger than the seven-semitone interval with
an incongruent timbre change (ascending interval involving a shift from bright to a

68
dull timbre). Russo and Thompson called this an interval illusion. In addition,
musically trained participants were sensitive to the effect of timbre on perceived
interval size, especially for descending pitch intervals. To summarize, pitch and
timbre are not perceived independently (Russo & Thompson, 2005, pp. 565–567).
Vurma, Raju, and Kuuda (2011) noticed that the differences in timbre in
musical instruments affected assessments of the pitch of sound played on one
instrument in relation to the pitch of a sound played on another instrument. In their
test, the participants were asked to rate two consecutive sounds as being in tune,
flat, or sharp. In comparisons between sounds having different timbres, the brighter
sounds of a trumpet and a professional opera tenor were most often perceived as
being in tune with a duller viola sound when the latter was 15–20 cents higher than
the brighter sounds (Vurma et al., 2011, pp. 298–304).
According to Hutchins, Roquet, and Peretz (2012), vocal generosity is a
phenomenon where listeners more easily accept tuning errors performed by singing
voice than they do performances with other timbres. This effect seems to occur in
small tuning deviations (10–30 cents), which in singing were consistently judged
as being in tune. Vocal pitches needed around 50 cents of mistuning on average to
be deemed out of tune. Violin pitches mistuned about 50 cents were judged as a
fundamentally different note, while the corresponding limit for vocal timbre was
90 cents (Hutchins et al., 2012, pp. 155–158). These results are startling but
somehow make sense. An incredible amount of mistuning is tolerated in
performances by classical singers all the time.
2.2.8 Synopsis of previous research on recognition of mistuning
In previous investigations concerning intonation perception, the main focus has
often been on separate intervals and chords in melodic contexts. The pitch
discrimination related to vibrato has also been charted quite thoroughly, and the
pitch of vibrato tone is perceived as flatter than a non-vibrated tone. Timbre affects
pitch discrimination in many ways. An ability with pitch discrimination does not
necessarily correlate with ability in pitch matching and performance. A musician
can be capable of proper intonation independent of pitch discrimination skills. The
intonation errors of a singing voice are more acceptable than other voice sources.
Table 8 provides a synopsis of previous research on the recognition of mistuning.

69
Table 8. Synopsis of previous research on recognition of mistuning.
Theorem More exactly Reference
Thresholds in simultaneous tones
varied considerably.
The thresholds for simultaneous
tones can vary from 2 cents
(complex tones) to 50 cents (low-
level pure tones).
Burns (1999)
Relative errors on adjusting six
simultaneous intervals varied from
11.3 to 19.8 cents among
musically experienced subjects
and from 18.1 to 23.3 cents for
musically untrained subjects.
Elliot et al. (1987)
Thresholds between 2 cents and
19 cents for musicians in
successive tones.
The median difference thresholds
for single successive tones (2–8
cents) were three times smaller
among musicians than the values
of non-musicians. They can vary
from 2 cents to 19 cents among
professional musicians.
Spiegel & Watson (1984)
A threshold of 12 cents for
musicians, which is the average
level of this review.
Tervaniemi et al. (2005)
The discrimination thresholds of
musically trained participants were
only 2 cents in all test conditions,
while non-musicians had a
threshold of 13 cents.
Micheyl et al. (2006)
A mean threshold for musicians of
approximately 6 cents and
approximately 10 cents for non-
musicians.
Parbery-Clark et al. (2009)
The mean thresholds in frequency
discrimination were 18.36 cents
for musically trained participants
and 48.07 cents for musically
untrained participants on a low-
frequency task (the lower tone
being 400 Hz).
Schellenberg & Moreno (2010)
A mean threshold of 15 cents
among musicians and 53 cents
among non-musicians.
Strait et al. (2010)
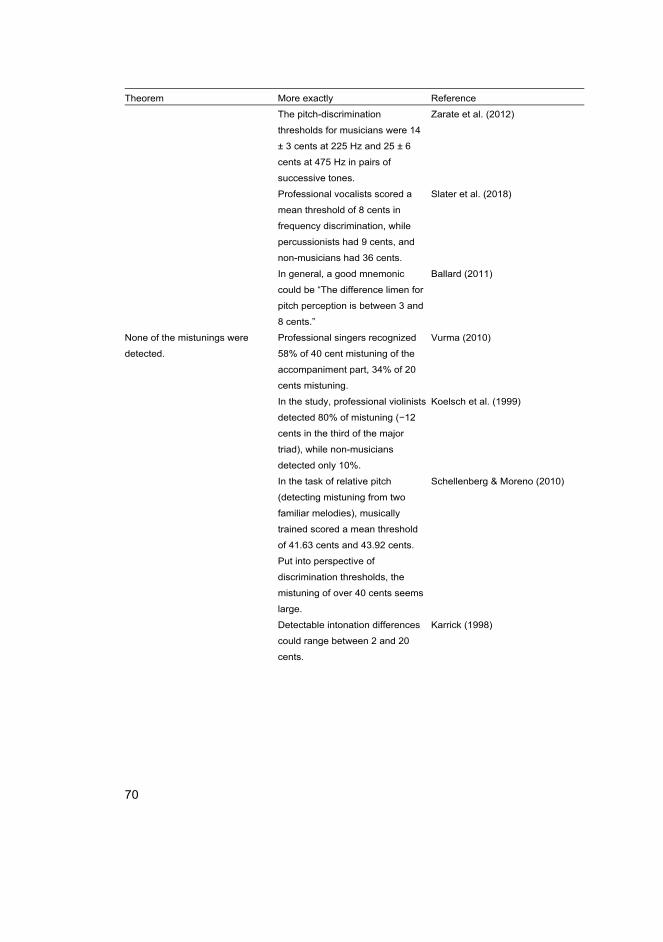
70
Theorem More exactly Reference
The pitch-discrimination
thresholds for musicians were 14
± 3 cents at 225 Hz and 25 ± 6
cents at 475 Hz in pairs of
successive tones.
Zarate et al. (2012)
Professional vocalists scored a
mean threshold of 8 cents in
frequency discrimination, while
percussionists had 9 cents, and
non-musicians had 36 cents.
Slater et al. (2018)
In general, a good mnemonic
could be “The difference limen for
pitch perception is between 3 and
8 cents.”
Ballard (2011)
None of the mistunings were
detected.
Professional singers recognized
58% of 40 cent mistuning of the
accompaniment part, 34% of 20
cents mistuning.
Vurma (2010)
In the study, professional violinists
detected 80% of mistuning (−12
cents in the third of the major
triad), while non-musicians
detected only 10%.
Koelsch et al. (1999)
In the task of relative pitch
(detecting mistuning from two
familiar melodies), musically
trained scored a mean threshold
of 41.63 cents and 43.92 cents.
Put into perspective of
discrimination thresholds, the
mistuning of over 40 cents seems
large.
Schellenberg & Moreno (2010)
Detectable intonation differences
could range between 2 and 20
cents.
Karrick (1998)

71
Theorem More exactly Reference
The measured tolerance
concerning the subjects’ tolerance
with regard to mistuning across
six-tone melodies, the mean
tolerance threshold was
approximately 21 cents. Music
experts showed smaller
thresholds (10 cents) than lay
listeners (25 cents).
Larrouy-Maestri (2018)
The acceptance of sharp octave
and major thirds vs. flat fifths.
Stretched octaves (+15 cents or
more) were better accepted than
the theoretically pure octave
among concert singers.
Sundberg (1982); Hartmann
(1993)
The subject’s estimated octave
was approximately 22 cents
sharper than the physical octave
(1200 cents).
Dobbins & Cuddy (1982)
Flat fifths were easier to accept
than sharp fifths.
Schellenberg (2001); Dunnigan
(2002)
The range of acceptable tones
(RAT) limits in major thirds was
1.5 cents wider than the upper
tone of the M3 interval in just
intonation (386 cents). The upper
RAT limit was 6.5 cents wider
than M3 in Pythagorean tuning
(408 cents).
Van Besouw et al. (2008)
There was difficulty in recognizing
correct intonation.
23% of samples were musically
accurate, but the subjects judged
up to 63%: Musicians had a clear
tendency to judge out-of-tune
stimuli as in tune.
Siegel & Siegel (1979)
Mistuning factor of 6.6 cents was
preferred over the correct one.
Rasch (1985)
Expert listeners may judge
mistuned melodic intervals (20 to
25 cents out of tune) as correctly
tuned.
Vurma & Ross (2006)
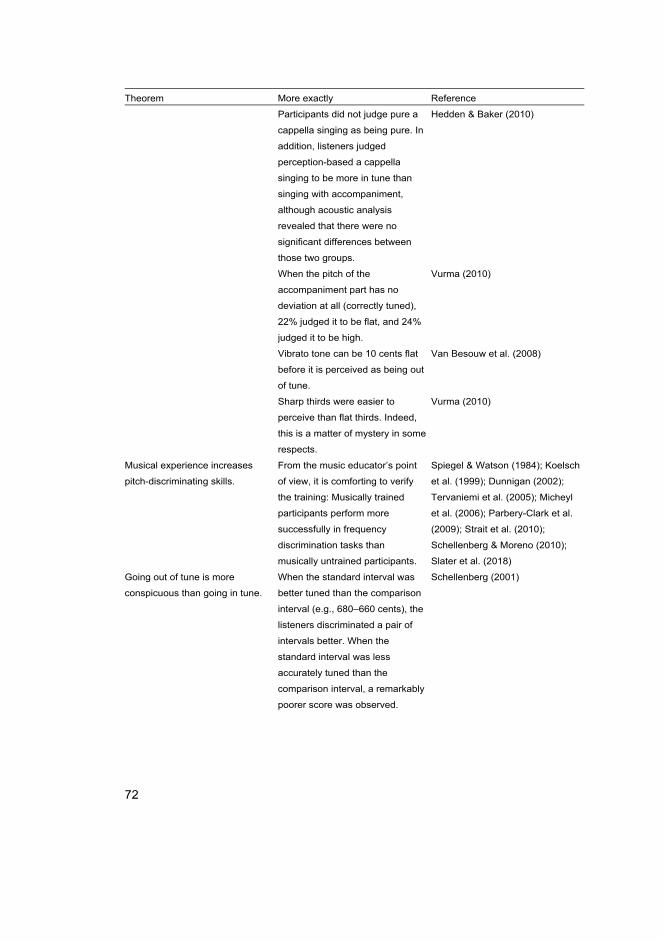
72
Theorem More exactly Reference
Participants did not judge pure a
cappella singing as being pure. In
addition, listeners judged
perception-based a cappella
singing to be more in tune than
singing with accompaniment,
although acoustic analysis
revealed that there were no
significant differences between
those two groups.
Hedden & Baker (2010)
When the pitch of the
accompaniment part has no
deviation at all (correctly tuned),
22% judged it to be flat, and 24%
judged it to be high.
Vurma (2010)
Vibrato tone can be 10 cents flat
before it is perceived as being out
of tune.
Van Besouw et al. (2008)
Sharp thirds were easier to
perceive than flat thirds. Indeed,
this is a matter of mystery in some
respects.
Vurma (2010)
Musical experience increases
pitch-discriminating skills.
From the music educator’s point
of view, it is comforting to verify
the training: Musically trained
participants perform more
successfully in frequency
discrimination tasks than
musically untrained participants.
Spiegel & Watson (1984); Koelsch
et al. (1999); Dunnigan (2002);
Tervaniemi et al. (2005); Micheyl
et al. (2006); Parbery-Clark et al.
(2009); Strait et al. (2010);
Schellenberg & Moreno (2010);
Slater et al. (2018)
Going out of tune is more
conspicuous than going in tune.
When the standard interval was
better tuned than the comparison
interval (e.g., 680–660 cents), the
listeners discriminated a pair of
intervals better. When the
standard interval was less
accurately tuned than the
comparison interval, a remarkably
poorer score was observed.
Schellenberg (2001)

73
Theorem More exactly Reference
Note error vs. accurate
discrimination.
In the present research, the
following point is essential:
Identification of a note error
seems to be a different task than
an accurate discrimination of note
being sharp of flat.
Dunnigan (2002)
Tonality and direction of mistuning
are related to pitch perception.
The following aspect is pursued to
eliminate from the experiments of
this book: Tonally related targets
were discriminated more
sensitively than tonally less
related targets.
Marmel et al. (2008)
Direction of original mistuning
significantly affected the direction
of the errors for both performance
tasks and perception.
Yarbrough et al. (1995)
Pitch discrimination does not
seem to depend on the tuning
system.
No significant correlation was
found to any tuning system (just
intonation, equal temperament,
Pythagorean tuning) for melodic
pitch perception.
Ballard (2011)
Good pitch discrimination skills do
not guarantee accurate
performance.
Pitch-matching accuracy and pitch
perception ability do not seem to
be related.
Yarbrough et al. (1995); Kopiez
(2003); Bradshaw & McHenry
(2005); Powell (2010); Vurma
(2010); Ballard (2011)
Only a low correlation between
perception and performance
responses.
Morrison (2000); Worthy (2000)
Inaccurate singers could be
divided into two groups: A)
singers, who discriminated pitches
and produced pitches
inaccurately, and B) singers, who
discriminated pitches accurately
but produced pitches inaccurately.
Bradshaw & McHenry (2005)
Vibrato widths vary, with long
ranges above and below the
stimulus.
Vibrato widths seem to vary
between 30–60 cents among
string players, more in high
register, less in low register.
Oscillation patterns divided above
and below a note.
Geringer & Allen (2004); MacLeod
(2008); Pope (2012); Mick (2014)

74
Theorem More exactly Reference
String instrumentalists recognize
well the pitch of vibrated tones.
String instrumentalists and music
majors (no string performance
experience) perceived the pitch of
vibrato tones very close to the
center of the vibrato both for violin
and cello tones. String players
exhibited a smaller deviation than
non-string players.
Geringer et al. (2010)
The pitches of vibrated tones are
perceived as flatter than tones
without vibrato.
Vibrato tone can be 10 cents flat
before it is perceived as being out
of tune, which is quite small
compared with the extent of
vibrato used, which was even +/-
70 cents.
Van Besouw et al. (2008)
The pitches of vibrato tones,
played by violin, were perceived
significantly (2–5 cents lower)
than corresponding tones without
vibrato.
Geringer et al. (2014)
Vibrato masks intonation errors. It is a misunderstanding to
assume that vibrato should always
be present in musical practice.
Bohrer (2002)
Range of acceptable tones (RAT)
among six professional musicians
varied from 21.9 cents to 37.55
cents when the participant was
asked to give in-tune and out-of-
tune judgments for vibrated and
non-vibrated tones. The RAT for
vibrato tone was around 10 cents
greater than for non-vibrated
tones.
Van Besouw et al. (2008)
Tone quality influences pitch
perception.
Intonation by clarinet with tone
quality changes in bright direction
was judged sharper than
intonation by trumpet and
trombone.
Geringer & Worthy (1999)
Participants combine “bright” tone
quality with sharp tuning and the
“dark” intonation with flat tuning.
Geringer & Worthy (1999); Worthy
(2000)

75
Theorem More exactly Reference
“Interval illusion” exists when an
internal interval involves a shift
from a dull to a bright timbre; as a
result, the interval is perceived as
larger.
Russo & Thompson (2005)
Trumpet sound and professional
opera singer sound (tenor), which
are bright in timbre, were
perceived as 15–20 cents higher
than viola sound (dull timbre). The
maximum number of ”in-tune”
ratings was given for the voice
that was 15–20 cents lower than
the reference sound.
Vurma et al. (2011)
Vocal generosity is noticeable. Singing performances were
judged in tune or out of tune. The
average deviations were 11 cents
for those intervals judged as in
tune. For those intervals judged
as out of tune, the average
deviations were 25 cents. Melodic
intervals were accepted as
correctly tuned even when they
were 20–25 cents out of tune.
Vurma & Ross (2006)
The vocal generosity effect is a
phenomenon in which listeners
accept tuning errors performed by
singing voice more than
performances by another timbre.
This effect seems to occur in
small tuning deviations (10–30
cents), which are consistently
judged as being in tune. Vocal
tones need around 50 cents of
mistuning on average to be
estimated as out of tune (violin
tone, 30 cents). Violin pitches
mistuned about 50 cents were
judged as a fundamentally
different note. The corresponding
number for vocal tone was 90
cents.
Hutchins et al. (2012)

76
Formatting Experiment 1
Previous investigations of frequency discrimination thresholds, perception of
intervals, and chords with several factors influencing pitch discrimination showed
that recognition of mistuning of 21.51 cents (81:80), the syntonic comma, is worth
exploring. The size of deviation is suitable: Thresholds for pitch discrimination in
cents vary from 2 up to 20 among professionals in a harmonic context. The
perceived mistunings used in previous studies have ranged from 10 cents to dozens
of cents. In this research, the focus is not on investigating the threshold of
perception of intonation errors, nor it is not meaningful to investigate participants’
reactions to different sizes (in cents) of errors. The problem with just intonation is
that apart from ‘just’ intervals, it also produces a set of mistuned intervals. From
the approach of four-part harmony in Western tradition, the unavoidable
discrepancy of just intonation is the syntonic comma, which sets boundaries on the
intonation of musical intervals in real musical contexts, and a conflict of pure major
thirds and the pure fifth produces a discrepancy of 21.51 (21.506) cents (Paret &
Sibony, 2017, p. 79).
In Experiment 1 (discussed in Chapter 3), the target triad is, as mentioned
earlier, the second-degree minor triad with the minor third of 32:27 and the perfect
fifth of 40:27. Both were judged as unpleasant and out of tune in the baroque era,
and both were judged as unsatisfying hundreds of years ago as well (Barbour, 1938,
p. 49). Hence, this interpretation of the mistuned triad is very traditional. On the
other hand, the fifth of the mistuned second-degree minor triad (ii triad) is 680.45
cents in the present study, which is practically the same as the standard and
comparison intervals of 680 cents in Schellenberg’s (2001) study. In addition,
recent investigations of the perception of mistuning and pitch discrimination
thresholds have highlighted that a deviation of 21.51 cents can be judged as
mistuned.
The syntonic comma and its discrepancies with the intonation in tonal texture
are not very well known in music education and the instrumental pedagogy of our
time. Throughout the history of Western music, there have been countless attempts
to avoid the syntonic comma in practical applications of intonation. Now, after 150
years of dominance by equal temperament, it seems reasonable to investigate
whether young music learners, on the whole, recognize this mistuning among pure
triads of just intonation.
On the grounds of previous investigations, it can be assumed that the mistuning
of 21.51 cents is possible to detect for the pupils and students in music-intensive

77
classes. There are also reasons to expect that the majority of participants should
recognize a mistuning of this size. Yet a corresponding empirical study has not, to
the best of my knowledge, been done before now.
2.3 Intonation preferences: Previous research
This sub-chapter presents an overview of research findings related to intonation in
musical performance. Pitch matching in musical performance has been the subject
of a variety of investigations. The ability to perform with error-free accuracy is an
important aim for musicians and music educators (Schlegel & Springer, 2018, p.
394). First, I will review previous research on intonation in performance with
various musical instruments. Second, I will go through some studies concerning
the judgments and preferences of different aspects of intonation. Third, the concept
of pitch drift has been the subject of some recent investigations, mainly as regards
the performance of singing groups. There are no earlier studies, to my experience,
where pitch drift would have been offered as a preferred choice of intonation
system.
2.3.1 Intonation in performance
Intonation in performance is affected by several aspects. One remarkable factor is
simply the instrument group. I will introduce some earlier findings regarding the
intonation issues of different instrument groups, starting with string instruments.
Intonation by string instrumentalists
Measuring intonation by a string trio, Sundberg (1982) noted that the intervals
played were rather close to equally tempered intervals, but often slightly larger. A
part of these values was close to the Pythagorean values (Sundberg, 1982, p. 54).
Kantorski (1986) studied the intonation of college-aged string instrumentalists
playing ascending and descending whole-tone tetrachords with different
accompaniment intervals and compared them to equal temperament. The results
showed an overall tendency toward sharpness. Playing in the upper register (with
accompaniment below), the deviations from equal temperament were larger than
while playing in lower registers (with accompaniment above). Both were sharp in
intonation compared with equal temperament (from 42.2 cents up to 75.4 cents).
The intonation of thirds produced the largest deviations in both the lower and upper

78
registers. The deviation range of bassists was larger than other string players
(Kantorski, 1986, pp. 200–208). The measured sharpness of intonation in
Kantorski’s study seems large, but it is in line with my ordinary observations. For
example, the justly intonated major third of vertical major triad may feel odd to
string players.
Fyk (1995) investigated intonation by violinists in several experiments with
Paganini’s Theme and Variations V; the measured deviations were largest compared
with just intonation and smallest compared with Pythagorean tuning. Melodic
major thirds were very sharply tuned (up to 413 cents), and minor seconds were
narrow (mostly under 90 cents), which means a close correlation with Pythagorean
tuning (Fyk, 1995, pp. 110–190). This is in line with Bohrer (2002, p. 5), who
claims that musicians, in general, tend to sharpen higher notes and flatten lower
notes, meaning interval stretching, which could be associated with expressive
intonation.
A sharp tendency might be derived from rehearsing Pythagorean scales with
large thirds and narrow semitones. Basically, it could be partly a question of string
instrument pedagogy.
Intonation by wind instrumentalists
Duke (1985) studied wind instrumentalists’ intonational performance. Participants
played major third, perfect fourth, perfect fifth, and major sixth melodically and
harmonically. Melodic intervals were narrowed when performed in an ascending
direction and expanded when performed in a descending direction. Junior high
school participants tended to play sharp in relation to equally tempered intervals.
College wind players evidenced a slight tendency toward flat intonation (Duke,
1985, pp. 108–110). Duke’s results generate a sentiment where narrow ascending
intervals connected to expanding descending intervals lead to a downward pitch
drift.
Karrick (1998) studied intonation by wind instrumentalists (advanced students
and professional musicians). The participants were asked to play a duet with
computer-based oboe sound without vibrato in a two-part adaptation of the chorale
O Haupt voll Blut und Wunden (BWV 244) by J.S. Bach. The deviations were
largest compared with just intonation and smallest compared with equal
temperament. The out-of-tune pitches usually deviated in the direction of sharpness.
Thirds and sixths deviated more from equal temperament than octaves, fifths, and
fourths (Karrick, 1998, pp. 112–125). Morrison (2000) studied young players’

79
(experience 1–7 years) intonation of a short melody, and a tendency for sharp
intonation was found among the experienced players (Morrison, 2000, pp. 47–48).
Kopiez (2003) studied musicians’ adaptability to tuning systems. Professional
trumpet players were asked to play, in realistic conditions, the top voice of a chorale
in 5-limit just intonation and equal temperament. The results showed that the
musicians could not adapt their playing to just intonation. The average deviations
were 4.8 cents (SD = 6.5 cents) when the players were asked to play in equal
temperament and 6.7 cents (SD = 8.1 cents) in 5-limit just intonation. An overall
tendency toward higher pitched intonation was found. In particular, harmonic
major thirds were intonated sharp in both tunings. In just intonation, the deviations
in major thirds were always upward (from 5.6 cents to 23.1 cents), while the minor
thirds were slightly narrowed. The greater adaptability to equal temperament
suggests that exposure to equally tempered piano very early in instrumental lessons
might cause a “burn-in-effect” (Kopiez, 2003, pp. 383–407). Interestingly, in just
intonation, the melodic line in Kopiez’s example would include six syntonic
commas. In addition, the dominant seventh chords include syntonic commas in
harmonic intervals. This piece of music cannot be intonated in just intonation
without tempering certain intervals with a syntonic comma. In an email (personal
communication, January 19, 2014), Kopiez advised that the problem was solved in
his experiment with an adaptive approach. Only the harmonic intervals were based
on just intonation; the chord roots defined the vertical tuning. Hence, chromatic
steps in the bass line were compromised, and they were played in equal
temperament.
Leukel and Stoffer (2004) studied intonation by professional flautists in
simultaneous intervals (major triad, minor triad, diminished triad, and dominant
seventh chord) in different harmonic contexts. Major thirds were intonated very
close to just intonation and minor thirds close to equal temperament, practically
independently of harmonic context. Pythagorean tuning seemed not to be a
reference system at any chords intonated in this experiment (Leukel & Stoffer, 2004,
pp. 84–86). These results were somewhat contrary to the results of previous studies
mentioned. I have found in several conducting situations that brass instrumentalists,
in particular, can learn aim to pure vertical intervals in harmonic context if they are
guided the right way.
Byo, Schlegel, and Clark (2011) summarized previous investigations on
intonation in performance, noting that there is a tendency to play sharp and a
tendency toward octave stretch. In addition, judging intonation and “doing”
intonation have not shown significant relationships (Byo et al., 2011, p. 318) Burns
80
(1999, pp. 245–248) summarized the most important intonation adjustment trends:
short-term variability, intersubject variability, and the tendency to compress smaller
intervals and stretch larger intervals. It could be added that a certain harmonic
context may tend to bias intonation closer to just intonation, as Leukel and Stoffer
(2004) showed.
Classical singers, choir singers, vocal ensemble singers
There are presumably differences between intonation manners of solo singers and
ensemble singers. Classical solo singers may concentrate on melodic procedures,
whereas ensemble singers may focus on consonances of harmonic procedures and
minimizing beats. Bohrer (2002) suggested that the opera singing style does not fit
in ensemble singing. The singer’s ability to control pitch by means of the aural
feedback from acoustic context affects intonation remarkably. He assumes that the
use of equal-tempered keyboards in singer training affects intonation and notes that
there exists a different way of thinking: extending the number of pitches per octave.
The categorical perception principle and the beat detection principle are the
cornerstones for dealing with intonation in a performance context (Bohrer, 2002,
pp. 32–36).
In the study by Hagerman and Sundberg (1980), two barbershop quartet singers
performed a chord progression. Most intervals in the experiment deviated from the
reference values of just intonation and Pythagorean tuning. In the dominant chord,
the major third seemed to be a stretched version of a pure major third, but in the
tonic chord, the major third was intonated as some kind of flattened version of the
Pythagorean major third. The minor thirds were flatter than in just intonation
(Hagerman & Sundberg, 1980, p. 42). Interestingly, the cent values of barbershop
quartets singing chord progressions were very close to equal temperament.
However, the authors did not mention this. In another study of barbershop singing
by Sundberg (1982), barbershop singers seem to aim at pure (just intonation)
intervals. The major third and the major sixth deviated the most compared to equal
temperament, which refers to the harmonic component of this art form (Sundberg,
1982, pp. 60–64).
Price (2000) studied interval matching of undergraduate non-music majors.
The participants were classified as uncertain, modulating, and certain singers on
the basis of a singing test, where they sang a simple tune without accompaniment.
Inaccurate singers were less in tune than modulating or certain singers. The
acceptable reliability was an increment of 10 cents. Modulating singers echoed

81
descending minor thirds as well as certain singers, but they could not maintain
tonality. Poor singing skills cause problems for uncertain singers (Price, 2000, pp.
363–369).
Vurma and Ross (2006) investigated the intonation by singers. Individual
singers varied as much as 50 to 55 cents in pitch during a production task (SD = 10
cents or less). Compared with equally tempered intervals, the minor second was
performed narrower and the perfect fifth wider in both ascending and descending
modes. The singers tuned the minor seconds and perfect fifths more accurately than
tritones. Performed intervals were compared individually to the intervals of equal
temperament on the basis of the fundamental frequency of 440 Hz. The
investigators suggested that in their performance strategy, singers may have
concentrated more on the individual interval sizes and less on the stability of the
whole scale (Vurma & Ross, 2006, pp. 338–343). One might say that 55 cents out
of tune sounds unsatisfying.
Pfordresher, Brown, Meier, Belyk, and Lioti (2010) introduced a distinction in
the measurement of poor-pitch singing: the distinction between singing accuracy
and singing precision. This measurement distinction is familiar within statistics but
not yet in singing research. Accuracy in singing points to the average difference
between the sung note and target pitch. Precision in singing refers to the
consistency of sung pitches that are repeated independent of target pitch. According
to this division, singing can be, for example, inaccurate but precise, accurate but
imprecise, or inaccurate and imprecise. The results indicated that imprecise singing
is widespread, whereas inaccuracy occurs at essentially lower rates. In addition, an
inaccurate singer was also imprecise, but an imprecise singer could or could not be
inaccurate. Thus, inaccurate singing reflects a more serious deficit than imprecision
(Pfordresher et al., 2010, pp. 2182–2189).
Hedden and Baker (2010) investigated children’s singing accuracy with piano
accompaniment and a cappella using perceptual analysis and acoustic analysis,
judging whether a perceived performance was in tune or out of tune. The authors
speculate that singing without lyrics (with loo-syllable) would have weakened the
results: Only 20% were singing in tune (a cappella and accompaniment, acoustic
analysis). All in all, the authors recommend that accompaniment should be used
only prudently (Hedden & Baker, 2010, pp. 42–44).
Devaney, Mandel, Ellis, and Fujinaga (2011) introduced an algorithm that
automatically extracts performance data from the recordings of the singing voice.
Participants were undergraduate and professional singers who sang Schubert’s Ave
Maria a cappella and with accompaniment. The interval widths for whole tones

82
were measured to lie within the 196–209 cent range. In a cappella singing,
undergraduate singers tuned both semitones and whole tones mainly narrower than
professional singers. The undergraduate singers tuned their semitones (79–95 cents)
close to the Pythagorean tuning (narrow semitones, high leading tones) and whole
tones close to the equal temperament. Professional singers tuned semitones close
to equal temperament and the whole tones close to just intonation. The descending
intervals were, on average, 8 cents narrower than the ascending intervals (101
cents). The non-professionals’ semitones tended to be smaller than the equal-
tempered semitone. The professionals’ semitones were closer to equal temperament.
There was no significant difference between semitones sung a cappella and
semitones sung with accompaniment (Devaney et al., 2011, pp. 115–121).
In Devaney’s dissertation (2011), experiments with solo singers and vocal
ensemble (SATB) showed no particular characteristic intonation tendencies that
singers used in general. The overall tendency toward equal temperament was found
despite a surprisingly wide range of intervals, both vertical and horizontal.
Analyzing vertical intervals, the investigators found that in cadential contexts,
vertical intonation was closer to just intonation than in non-cadential contexts
(Devaney, 2011, pp. 253–254).
D’Amario, Howard, Daffern, and Pennill (2018) investigated a semi-
professional a cappella vocal quintet in a longitudinal study using the homophonic
arrangement of the chorale of J.S. Bach. The singers performed three repetitions of
the piece before rehearsal and after rehearsal. In horizontal tuning, the participants
intonated closer to equal temperament than just intonation, which happened
throughout the measurements. In vertical tuning, major thirds were intonated a bit
closer to just intonation than equal temperament, with the average size being 392.17
cents (SD = 27.56 cents). The results from pairs of singers deviated from each other.
Minor thirds were intonated practically to equal temperament (the average size was
299.13 cents, SD = 29.28 cents). Tuning behavior in vertical thirds seemed
consistent and repeatable. Investigators found four strategies for solving tuning
strategies: Tuning “doubled” notes, balancing voices, tuning the whole chord, and
tuning melodic intervals (D’Amario et al., 2018, pp. 6–14). Doubled notes seem to
refer to the same pitch in different voices of an ensemble.
Computer-assisted methods for analyzing intonation in performance
Morrison and Fyk (2002) argued, “It seems clear that pitch alternatives advanced
performers make do not conform to a specific tuning system” (p. 187). And further:

83
“It is probably inappropriate to say that performers play in a given system.” These
citations can issue a picture according to which intonation is accidental. It
sometimes probably is.
Devaney and Ellis (2008) presented signal processing and machine learning
methods for studying polyphonic vocal intonation practices that are not locked into
a single reference system. Devaney and Ellis (2008, p. 142) refer to Backus (1969)
and Barbour (1953): Vocal intonation is a combination of horizontal and vertical
intonation and the weightings of these factors differ depending on musical contexts.
According to Devaney and Ellis (2008), the new methodology constructs and
expands the theory of tuning and intonation practices. Vertical intonation is based
on sensory consonance, while horizontal intonation practices in performance can
be related to musical expectations, musical meaning, and emotion. The purpose is
to analyze the intonation of the recordings in terms of real musical performances.
This technology helps investigators to estimate the perceived fundamental
frequencies for the sung notes (Devaney & Ellis, 2008, pp. 142–152).
Vurma (2010) found that singers tended to sing melodic intervals according to
equal temperament and preferred the preciseness of a melodic interval to the
harmonic interval of accompaniment (Vurma, 2010, pp. 24–25). Fischinger and
Hemming (2011) investigated individual intonation and timing measures of vocal
ensembles. In their experiment, the fundamental pitch rose, on average, 25.12 cents
from the beginning to the end. The fifths and octaves were intonated close to equal
temperament. There was no tendency to pure intervals, but there was for sharp
intonation. The SD of female singers was smaller than for male singers (Fischinger
& Hemming, 2011, pp. 51–53).
Equal temperament turned out to be the reference system in the study by
Devaney, Mandel, and Fujinaga (2012) among vocal ensembles. If the melodic
intervals were not within one SD of equal temperament, the intervals were smaller,
near the minor justly intonated minor whole tone (182 cents). Most of the vertical
intervals fell within one SD of non-equal temperament tunings. Some exceptions
were found. Ensemble 1 tuned the minor thirds (316 cents) and the major third (386
cents) in just intonation, and Ensemble 2 tuned the major thirds close to
Pythagorean tuning (408 cents) (Devaney et al., 2012, pp. 515–516).
Howard, Daffern, and Brereton (2013) introduced a four-part chorale synthesis
system that enables hearing the differences between just and equal-tempered
versions of individual chords. The system also enables the tuning differences in
items from the choir repertoire to be appreciated. One or more of its four parts can
be replaced with a human singer whose fundamental frequency can be measured as

84
they sing along with the other three parts. Fundamental frequency, vibrato rate and
depth, overall amplitude, and vowels were controlled by the Xbox controller. The
singers intonated sharply against a justly intonated version. Performances against
an equal temperament reference were sung flat. It was assumed that tuning notes
of chords to a maximum consonance involves the use of relative pitches. This can
be a manner of intonation in a cappella singing and requires, naturally, critical
listening skills. The application of a practical multi-part real-time synthesis system
helps singers develop these skills (Howard et al., 2013, pp. 136–141).
Abeßer, Frieler, Cano, Pfleiderer, and Zaddach (2017) proposed a framework
for analyzing tuning, intonation, pitch, modulation, and dynamics in monophonic
solos of reed and brass instrument players on jazz recordings. The authors picked
up high-quality transcriptions and separated the audio sample into a solo instrument
and the rhythm section. The tuning frequency of the backing track was defined first.
Next, the fundamental frequency and intensity contours were estimated for each
note of the solo part. Among other features, intonation tendencies were derived
from the collected data and analyzed together with data that were adopted from
existing symbolic representations. Manual annotations and external metadata were
related to analysis. The results showed a strong variation with different context
parameters. A personal style seemed to be the most important factor, but there were
also overall styles, and the specifics of the instrument played a role (Abeßer et al.,
2017, pp. 173–176).
2.3.2 Intonation preferences and judgments
The present sub-chapter concerns intonation judgments and preferences:
consonant–dissonant judgments, intonation and tone quality judgments, effects of
reverberation, good–bad ratings, in-tune and out-of-tune judgments, and intonation
adjustments.
Which tuning to prefer?
Loosen (1994) investigated the tuning preferences of highly trained violinists and
pianists, as well as non-musicians, in an adjusting task where they were asked to
set tone three (E, A, and B) computer-generated tones of eight-tone ascending and
descending diatonic scales of C major. Violinists adjusted the tones closer to
Pythagorean tuning than pianists (the average deviation from Pythagorean tuning
was 3.5 cents). Pianists adjusted closest to equal temperament (M of constant errors
85
was 0.6 cents). Non-musicians did not favor any specific intonation model. Loosen
refers to his earlier findings and supposed violin intonation to be something
between Pythagorean tuning and equal temperament (Loosen, 1994, pp. 223–224).
As the research literature has shown, string players might tend to intonate sharp
intervals, which means a close relationship to Pythagorean tuning. Therefore, it is
understandable that they prefer to adjust near Pythagorean tuning. Piano players
rehearse with equally tempered instruments—and adjust close to equal
temperament. You prefer what you have gotten used to.
In the study by Nordmark and Ternström (1996), 16 musically experienced
participants (choral conductors, choral singers, orchestral musicians) were asked to
adjust the intonation of 20 major third intervals so that the result was pleasing with
synthetic ensemble sounds. The major third of 395.4 cents was the preferred size,
with an overall SD of 7.3 cents. The range of adjustment was from 388 to 407 cents.
These results are closer to equal temperament major thirds than they correspond to
major thirds of just intonation, and the major third of just intonation (386 cents) did
not seem to be universally desirable (Nordmark & Ternström, 1996, pp. 59–61). It
seems that purely intonated thirds are probably slightly strange to musicians.
However, the simplest way to improve intonation in tonal homophonic texture is to
“release” tensioned major thirds of major triads.
Long (2008) investigated perceived preference (most consonant) of harmony
excerpts that were tuned to equal temperament, just intonation, and Pythagorean
tuning. Equal temperament turned out to be preferred over other tuning alternatives
in most passages. The choosing of one intonation system over another seemed not
to occur accidentally. This is contradictory to her hypothesis, according to which
beat elimination increases the perception of consonance regarding the musical
sound. Further, beats (of small numbers) distort harmony consonance among
similar frequencies (Long, 2008, pp. 99–103). This coincidence theory was
originally based on early 17th century writers, including Benedetti, Galilei, Kepler,
Mersenne, and Stevin (Cohen, 1984, pp. 11–12). It seems that the acceptance of
equal temperament has increased.
Different judgments
In a study by Geringer and Madsen (1998), the participants were asked to rate
excerpts on phrasing/expression, intonation, rhythm, dynamics, and tone quality to
give an overall rating judging them as “good” or “bad.” Musicians could very
clearly discriminate between the good and bad performances. Most listeners (78%)

86
specified intonation in identifying the aspects most in need of improvement. The
presence of accompaniment did not seem to affect tone quality and intonation
ratings. The importance of good intonation and tone quality was secured to
participants’ perceptions and ratings. Other rating categories (phrasing/expression,
rhythm, and dynamics) were less important (Geringer & Madsen, 1998, pp. 525–
533). The importance of proper intonation is well seen in this paper.
Zabriskie (2011) studied the effect of reverberation time and dynamics on
choral ensemble singers’ preferences regarding tone quality and intonation in
soloistic singing. The ratings for intonation showed that the listeners chose higher
ratings to the forte reverberation stimuli over the forte non-reverberation stimuli.
In addition, the piano reverberant ratings were higher than those of piano non-
reverberant ratings. In tone quality ratings, the participants rated reverberant
stimulus with forte dynamic level and piano dynamic level higher than the forte
non-reverberant stimulus. In general, auditors were unable to distinguish
perception of tone quality from intonation or intonation from tone quality. The
reverberation added to performance masked intonation errors. The participants
rated soloistic choral tone quality higher at the forte dynamic level, when the
reverberation time was increased (Zabriskie, 2011, pp. 60–64). In the present
research, the original design of the experiment of mistuning recognition was to use
different sounds in samples to listen to. For practical reasons, there will finally be
only one sound selected. A study by Zabriskie (2011) gives a hint that reverberation
and dynamic variations influence intonation judgments.
In the experiment by Johnson-Laird et al. (2012), participants judged major,
minor, diminished, and augmented triads on a scale of 1–7, highly pleasant
(consonant) to highly unpleasant (dissonant). The measured roughness put those
triads in a slightly different order. The lowest experienced roughness was
experienced, again, with major triad and minor triad, in that order. The judgments
did not follow the roughness values with diminished and augmented chords: the
diminished triad had the highest experienced roughness value. In the second
experiment, the authors studied the roughness of 43 four-note chords and ratings of
a consonant–dissonant axis. The consistent major scale triads with thirds and with
no thirds had the lowest rating. The inconsistent major scale chord and minor scale
chord with thirds had practically the same rating, and the roughness values mainly
followed the ratings. The third experiment showed that the presence of tonal syntax
in chord progression can influence the pleasantness of heard chords. In particular,
tonal chords were heard as more pleasant in a tonal sequence than in a random one
(Johnson-Laird et al., 2012, pp. 26–30). The musical material was executed in equal

87
temperament. One might speculate what different tuning alternatives would affect
participants’ judgments. A justly intonated major triad sounds different from the
one in equal temperament. On the other hand, triads occurring in atonal texture
might sound pleasant independent of a tuning system.
Larrouy-Maestri, Lévêque, Schön, Giovanni & Morsomme (2013) introduced
a comparison of acoustic analyses and subjective judgments in evaluating vocal
accuracy. Investigators found that subjective ratings by expert judges conformed to
objective measures. The perceptual rating of the subjective analyses seemed more
critical when an accurate singer sung a false note compared with an inaccurate
singer. This study also underlines the importance of three criteria used in objective
measurements: pitch deviation, the number of contour errors, and the number of
tonality modulations (Larrouy-Maestri et al., 2013, pp. 3–4). This study is a good
example of intonation judgments made with both subjective and objective methods.
As can be seen, a rather broad variety of results can be found regarding
intonation preferences. Generally, just intonation, equal temperament, and
Pythagorean tuning have been compared. On the grounds of previous research in
the literature, there is a lack of experiments with innovative tuning alternatives and,
for instance, old temperaments.
2.3.3 Pitch drift in performing situations
Pitch drift is, at least theoretically, a solution to the problem of the syntonic comma.
If keeping vertical intonation pure, the consequence is pitch drift, and the horizontal
intervals have to be altered by a syntonic comma. In previous studies, pitch drift
has interested researchers in different ways. Using pitch drift in an auditory sample,
however, is missing among these studies. Pitch drift was presented in Sub-chapter
2.1.7. There have been some investigations concerning this phenomenon within the
last two decades.
Scholtz (1998, p. 10) says a “string quartet could not play passages containing
a sequence of triads in just intonation without altering the melodic intervals and,
possibly the overall level of pitch.” Howard (2007b, p. 303) reminds us that the fall
of the fundamental frequency can refer to pitch drift. Indeed, if a highly trained
singing group gradually changes the fundamental frequency, it may not be a
question about poor intonation but pitch drift. Sometimes both.
Kalin (2005) investigated the formant frequencies of a barbershop quartet,
reminding that intonation in this kind of singing is of ultimate importance. As some
kind of by-product, he found out that the fundamental frequency in vocal

88
performances was falling in all recordings approximately 40 cents. He speculated
that this could be the consequence of singing according to room acoustics (Kalin,
2005, p. 3, 40). Pitch drift was not mentioned in the study, but it might be possible
that the fall of fundamental frequency can be caused by the factors of pitch drift:
pure vertical intonation or aiming to pure vertical intonation. Or again, both.
Howard (2007a) studied intonation by an a cappella quartet (SATB) to clarify
whether singers use equal temperament or non-equal temperament. The singers
modified tuning in relation to each other toward just intonation. There were two
tuning strategies with a cappella singers and choir conductors: to remain in pitch or
to keep harmony consonant. The latter demands shifting the overall pitch in every
modulation. It is possible that singers pursue consonant tuning and sacrifice the
constant pitch. Interestingly, two of the quartets in the study claimed to have strived
for a constant pitch level, but they actually tended to sing consonant chords with
pitch drift. Singers in a cappella choirs tend to intonate in just intonation and the
overall pitch drifts (Howard, 2007a, pp. 87–93). Further, Howard speculates:
It is interesting to speculate on the skills that are required to tune intervals in
equal temperament, since there is no readily available physical guide to be
derived such as the absence of beating. This suggests that tuning notes in equal
temperament must probably rely on memory fed by the ubiquity of equal
temperament in the exposure of Western ears to music from an early age.
(2007a, p. 93)
Howard continues: “an a cappella group does indeed have to stray in pitch in order
to stay in tune. Choral conductors need to understand this and make appropriate
pitching strategy decisions” (2007a, p. 94).
Howard (2007b) wrote four-part exercises with modulations for a cappella
quartet (SATB) in sequential progression. As remembered, I analyzed the very
example of Howard in Sub-chapter 2.1.7 (see Fig. 8). As Howard (2007b, p. 303)
points out, it is not possible to both maintain just intonation in chord progressions
and to stay in pitch throughout music that modulates in key. In that case, the pitch
center will have to shift from its starting point; this is a discrepancy of just
intonation. According to Howard (2007b, p. 303), singers prefer just intonation on
average. Just intonated thirds and fifths seemed to be a proper approach, but the
use of seventh in exercises caused difficulties in tuning accuracy. He claims that
correcting the overall intonation pitch drift for its own sake in a cappella contexts
with modulating harmony may be a mistake. If one demands the correction of pitch
drift, one might need to modify the tuning all the time, like the American
89
Barbershop singers. Howard emphasizes that the meantone tempered organs give
the opportunity for beat-free singing, especially if there are certain types of organs
with alternative enharmonics available (Howard, 2007b, pp. 303–304, 314). To be
more exact: Meantone systems are fixed, and they sacrifice fifths in normal 12
tones/octave keyboard. The problem of the syntonic comma does not disappear, but
it transfers to fifths. This is, of course, one possible solution for the discrepancy of
the syntonic comma, but it does not omit beats from narrowed fifths.
Hancock (2008) studied musicians’ and non-musicians’ aesthetic responses to
pitch center changes. In stimulus excerpts, the pitch rose or fell one cent/second up
to 300 cents rise/fall. There was also an excerpt that was stable in pitch. The
participants were asked to react by recording their aesthetic responses via
Continuous Response Digital Interface (CRDI). Hancock found a significant main
influence for pitch condition and an interaction effect for musicianship status and
pitch condition: Non-professionals’ aesthetic responses were similar to the rise of
pitch and stable pitch. The gradual change of pitch does not seem to bother most
listeners (Hancock, 2008, pp. 85–94). Perhaps the audience could possibly be more
prepared for pitch drift than professional musicians, who tend to relate pitch drift
to poor intonation.
Devaney et al. (2012) introduced AMPACT, a MATLAB toolkit for
automatically extracting, analyzing, and comparing performance data from the
aligned recordings for which a score is available. The investigators studied four
three-part singing ensembles with a short exercise by Benedetti. This Renaissance
theorist designed the exercise to highlight the conflict of just intonation tuning and
pitch drift. I made an analysis of this exercise in Sub-chapter 2.1.7 (see Fig. 5).
In the investigation of Devaney et al. (2012), the singers did not exhibit pitch
drift. They did drift up slightly on average. Equal temperament turned out to be the
reference system in this experiment. If the melodic intervals were not within one
SD of equal temperament, the intervals were smaller, near the minor just intonation
semitone (182 cents). Most vertical intervals fell within one SD of non-equal
temperament tunings. Some exceptions were found. Ensemble 1 tuned the minor
thirds (316 cents) and the major third (386 cents) in just intonation. Ensemble 2
tuned the major thirds close to Pythagorean tuning (408 cents) (Devaney et al.,
2012, pp. 515–516).
Fischinger, Frieler, and Louhivuori (2015) studied the influence of room
acoustics on tuning and drift, intonation of single pitches, and intonation on
consonance. The investigators found a significant drift (−4.6 cents) in room size at
a reverberation level of 1.77 s, which means a medium-sized “Concertgebouw”

90
(Fischinger et al., 2015, p. 12). Mauch, Frieler, and Dixon (2014) verified
intonation drift. They investigated intonation and intonation drift in unaccompanied
singing under three conditions (normal, masked, and imagined). The reference
tuning system was equal temperament, and the song was familiar Happy Birthday.
The results of recordings showed a median intonation drift with a value of 11 cents;
22% of observed drifts were significant while they were smaller than the median
note error (19 cents). The clear majority of observed drifts were upward. According
to the authors, drift is a true phenomenon and common in solo singing, and it is not
correlated to musical background in addition to pitch or interval accuracy. Masking
conditions did not affect singing intonation (Mauch et al., 2014, pp. 403–410).
In the study of D’Amario et al. (2018), there occurred no pitch drift among the
participants of an a cappella singing quintet. This result did not corroborate with
earlier findings of Howard (2007a, 2007b). The investigators supposed that the
characteristics of musical material, individual singers, and the combination of
singers affect the tuning of singing ensembles (D’Amario et al., 2018, p. 12).
Pitch drift is one way to understand the outline of just intonation discrepancies.
Here lies the discrepancy of the syntonic comma. Although Howard does not
explicitly mention the syntonic comma, his musical example involves a series of
secondary dominants, each of which potentially causes the overall pitch to drift by
a syntonic comma.
2.3.4 Synopsis of previous research on intonation preferences
As can be noticed from the grounds of previous sub-chapters, intonation in
performance is not an unambiguous issue. An overview of measured intonation
conventions helps one to understand the essence of intonation issues on the whole.
A synopsis of previous research on this era is presented in Table 9.
Table 9. Synopsis of previous research on intonation preferences.
Theorem More exactly Reference
Sharp tendency is common. Sharp tendency seems to be true
among string instrument players.
Sundberg (1982); Kantorski
(1986); Fyk (1998); Burns & Ward
(1999); Bohrer (2002); Byo et al.
(2011)
Sharp tendency among wind
players.
Duke (1985); Burns & Ward
(1999); Morrison (2000); Kopiez
(2003); Byo et al. (2011)

91
Theorem More exactly Reference
Mostly close to equal but
occasionally just.
The intonation in performance
among wind instrument players is
a multilateral and complex
phenomenon. Equal temperament
has been found to be a common
reference system among wind
instrumentalists.
Duke (1985); Karrick (1998);
Kopiez (2003); Leukel & Stoffer
(2004)
A flat tendency among wind
players. Wind players tended to
narrow ascending intervals and
stretch descending intervals.
Duke (1985)
Aiming at just intonation was
seen. Flautists intonate near just
intonation in thirds and sixths.
Karrick (1998); Leukel & Stoffer
(2004)
Musicians tended to sharpen
higher notes and flatten lower
notes.
Kantorski (1986); Bohrer (2002)
Singers’ intonation depends on
performing style.
Barbershop singing operates
between just intonation and
Pythagorean tuning.
Hagerman & Sundberg (1980);
Sundberg (1982)
Solo singers and ensemble
singers use different strategies for
intonation, and the latter
mentioned aim to consonance
and beat minimization. This
seemed to succeed in vertical
thirds.
Bohrer (2002)
The vertical intonation was closer
to just intonation in cadential than
in non-cadential context,
analyzing vertical intervals of
vocal ensemble.
D’Amario et al. (2018)
No particular characteristic
intonation tendencies that singers
used in general.
Devaney (2011)
The performed intonation by
classical singers can be
remarkably inaccurate and
imprecise.
Devaney et al. (2011); Price
(2000); Pfordresher et al. (2010);
Vurma & Ross (2006)
Horizontally equal, vertically just,
sometimes sharp.
Equal temperament seemed to be
a reference system, especially in
horizontal intonation.
Devaney et al. (2012); Vurma
(2010)

92
Theorem More exactly Reference
In vertical tuning, just intonation
thirds were used by one ensemble
and Pythagorean thirds by
another ensemble.
Devaney et al. (2012)
Vocal ensembles had no
tendency for just intonation, but
rather for sharp intonation.
Fischinger & Hemming (2011)
Choral singers sang out of tune
with reference stimulus of just
intonation.
Howard et al. (2013)
Vocal polyphonic intonation is a
combination of vertical and
horizontal intonation.
Backus (1977); Barbour
(1951/2004); Devaney & Ellis
(2008); D’Amario et al. (2018)
Violinists preferred Pythagorean
tuning; pianists preferred equal
temperament.
Equal temperament turned out to
be preferred over other tuning
alternatives in most passages:
The selection of one intonation
system preferred over another
seemed not to occur accidentally.
Long (2008)
Pianists adjusted close to equal
temperament. Violinists preferred
Pythagorean tuning. Non-
musicians did not favor any
specific system.
Loosen (1994)
Experienced musicians preferred
major thirds (mean 395.4 cents)
closer to equal temperament than
just intonation.
Nordmark & Ternström (1996)
Good and bad performances were
discriminated, but tone quality can
be mixed with intonation.
Musicians could very clearly
discriminate between good and
bad performances. Most listeners
(78%) specified intonation in
identifying aspects of most in
need of improvement. Tone
quality was the next in order
(17%). Choral ensemble singers
were unable to distinguish the
perception of tone quality from
intonation or intonation from tone
quality.
Geringer & Madsen (1998)

93
Theorem More exactly Reference
Reverberation masks intonation
errors.
The room reverberation combined
to make performance masked
intonation errors.
Zabriskie (2011)
Major triad was experienced as
the most consonant chord.
Major triad was the most
consonant chord (rated 1.67),
whereas minor triad had a rated
dissonance of 2.41 on a scale of
1–7, highly pleasant (consonant)
to highly unpleasant (dissonant).
Johnson-Laird et al. (2012)
Subjective judgments
corresponded to acoustic
analyzes.
In a comparison of acoustic
analyses and subjective
judgments in evaluating vocal
accuracy, subjective ratings by
expert judges conformed to
objective measures.
Larrouy-Maestri et al. (2013)
Pitch drift can occur, and it does
not necessarily bother.
A sequence of triads in just
intonation without altering the
melodic intervals can refer to pitch
drift.
Scholtz (1998)
Singers in a cappella choirs tend
to intonate in just intonation and
the overall pitch drifts.
Howard (2007a)
It is not possible to both maintain
just intonation in chord
progressions and to stay in pitch
throughout music that modulates
in key.
Howard (2007b)
Room acoustics had only a weak
connection to intonation, but a
drift (−4.6 cents) was found on a
reverberation level of 1.77 s.
Mauch et al. (2014)
Pitch drift is a true phenomenon
and common in solo singing, and
it is not correlated to musical
background in addition to pitch or
interval accuracy.
Fischinger et al. 2015
The gradual change of pitch does
not seem to bother most listeners.
Hancock (2008)
Pitch drift did not happen despite
expectations.
The fixed fundamental frequency
of pitch seems persistent: The
singers did not exhibit the pitch
drift.
Devaney et al. (2012); D’Amario
et al. (2018)

94
Theorem More exactly Reference
Another aspect to pitch drift. An equation to implement an
additional pitch drift compensating
mechanism by filling chromatic
scale with 16:15 semitones
(Octave = 1340 cents) or using
both 16:15 semitones and greater
chromatic semitones (135/128)
which ends up to 1223.46 cents.
Stange et al. (2018)
Formatting Experiment 2
The second empirical experiment in this study will address the question of how
receptive music professionals are for different usages of syntonic comma. As can
be seen from previous studies presented, the general manner of approach to
intonation experiments is to compare produced intonation to Pythagorean tuning,
equal temperament or just intonation. However, as presented earlier, there have
been a huge number of keyboard temperaments developed through the centuries. A
majority of them could be used today—if the awareness of intonation issues was
better. Therefore, Experiment 2 of this research charts out which ways of dealing
with the syntonic comma in tonal and modal chord progressions are judged more
preferable than other ways. Meantone tuning was a widely used keyboard
temperament in the late Renaissance and early baroque periods. It is still in active
use among early music specialists. However, the sensitivity for it has not been
investigated, to my knowledge, in previous research. So, it was the apparent
alternative for this experiment. There are lots of simple, tonal contemporary music
works that could be played with meantone tuning, not to mention the early music
repertoire. Surprisingly, perhaps, this usable tuning system has not inspired much
empirical research. Therefore it was chosen for Experiment 2.
The hegemony of equal temperament in Western music culture and its
intonation practices seems obvious. Likewise, in a few investigations of
preferences for intonation systems, equal temperament seems to rule (see e.g.,
Kopiez, 2003, p. 404). Equal temperament obviously can provide targets for
musicians’ pitch matching. Hence, it was an obvious choice for this experiment
because of its widespread hegemony of all Western music, independent of genres.
As discussed in Sub-chapters 1.2 and 2.1.7, this hegemony of equal temperament
might result in outstanding popularity in preferences of Experiment 2.

95
A new contribution presented in this experiment is that local tempering is a
technical combination of just intonation and equal temperament. The second-
degree minor triad (ii triad) with a syntonic comma is simply replaced with an
equally tempered minor triad. The idea is to use pure triads where it is possible.
Correspondingly, tempering is used only where it is necessary in the ii triad.
The second contribution is using pitch drift as an aural choice for intonation
preferences. This phenomenon itself, as written earlier, has been known for
centuries. Pitch drift was chosen on the basis of recent research literature. As
written in Sub-chapter 2.3.1, it means a rise or fall of fundamental frequency during
performance. Pitch drift is a consequence of vertically pure harmonic intonation in
certain chord progressions and always in modulations. The investigations of pitch
drift have concentrated on singing in performance and pitch drift: It seemed to be
a true phenomenon according to these studies. It seems clear that pitch drift is
related to pure vertical intonation, at least among well-trained solo or ensemble
singers. However, it is too often straightforwardly associated with mistuned
performance, although this may only reflect one possible aesthetic position.
Hancock’s (2008) observations of aesthetic responses to changes in pitch center
were nearest to this experiment design. Pitch drift within an aural sample among
other tuning alternatives has not presumably been examined earlier. Therefore,
pitch drift will be one of the four tuning alternatives in the experiment of intonation
preferences. The participants’ reactions to chord progressions with pitch drift bring
relevant information to develop intonation skills. At the same time, the whole
phenomenon becomes more familiar in musical contexts.
2.4 Pedagogical motivations: Previous research
There will be numerous factors influencing intonation in performance: timbre is
one of the most examined. Tools for improving intonation have also interested
researchers, especially in music education. In the Sub-chapter 2.4.1, I will examine
studies concerning factors influencing intonation, especially in the context of choirs
and orchestras. In Sub-chapter 2.4.2, I will present investigations that consider tools
that can improve intonation.
2.4.1 Factors influencing intonation
There are a number of aspects influencing intonation. Jeans (1937, p. 176) noticed
that string players and singers may intonate differently with accompaniment in

96
equal temperament and without accompaniment. Here, we find one aspect
influencing intonation: accompaniment versus without accompaniment. I will
introduce some investigations concerning factors influencing intonation.
Choirs
According to Ternström and Sundberg (1988), the topics of voice producing
affecting intonation are breath support and vibrato in choir. The topic of room
acoustics affecting intonation is the effect of SOR (singer spacing and room
absorption on the self-to-other ratio). In their study, common partials, high partials,
vibrato, and the interval significantly affected the accuracy of intonation among the
choir singers. Reference vowels with common partials, which were strengthened
by formants, were found to increase fundamental frequency precision. If the lowest
common partial was strengthened, the accuracy of intonation increased. The most
powerful effect was found when the first and the second formants reinforced the
first and the second partials. The spectral properties of the reference sound affected
the precision of a choir singer’s fundamental frequency adjustment. Among the
amateur bass singers, the deviation of fundamental frequency varied from 13 to 45
cents. In singing, there is a difference of 30 cents between the i-vowel and e-vowel
in measured pitch (Ternström & Sundberg, 1988, p. 59–69).
To my experience, amateur bass singers with fundamental frequency errors of
45 cents cause damage to the intonation of choirs. A common worry among choirs
is the lack of tenor singers. I think the more essential worry should be the intonation
of bass singers.
Ternström and Karna (2011) note that intonation is one of the topics in choir
acoustics. The topic of perception affecting intonation is pitch/amplitude effect.
The pitch can differ a bit in the left and right ears. The topic of sound technology
affecting intonation is the device for giving the starting pitch. The writers made a
list about possible relevant factors in situations where a choir tends to go out of
tune: the intrinsic pitch, the pitch-amplitude effect, breath support, and complex
modulations (Ternström & Karna, 2011, pp. 280–282). Indeed, complex
modulations can lead to out-of-tune situations: This phenomenon attaches to pitch
drift.
Demorest and Clements (2007) studied the factors that influence the pitch
matching of junior high school boys who were divided into three groups: certain,
inconsistent, and uncertain singers. The inconsistent group performed better when
there was a tonal context provided. Singing register does not necessarily influence

97
pitch-matching or perception skills as long as tasks assessed are range appropriate.
The margin of in tune and out-of-tune errors was 50 cents. To my touch, 50 cents
sounds a lot. According to Demorest and Clements (2007, p. 200), choir teachers
should concentrate more on dealing with the more basic issue of pitch matching.
This skill seems to be built on several skills that may improve both the perception
and production skills from contextual to isolated pitches (Demorest & Clements,
2007, pp. 199–200). The recommendations of just mentioned investigators seem
foregone conclusion, but I have experienced same in practice.
Then, do the gestures help singers? To my experience, they do, as long as
gestures are appropriate. Liao (2008) studied the effectiveness of gesture use in
facilitating children’s pitch accuracy. The study also compared the results between
boys and girls. The gestures affected positively on children’s singing accuracy
when they sing tonal patterns. It is possible that the success in using gestures in
singing is due to attitude toward motor learning. In addition, most participants had
a positive attitude regarding gestures in singing. Both the girls and the boys sang
more accurately with gestures than without gestures. The improvement of boys in
singing accuracy with gestures was slightly greater than the improvement of girls.
However, the girls sang more accurately than whether they used gestures or not
(Liao, 2008, pp. 207–208). However, to my experience, the borderline where
gestures may disturb singing is subtle. In particular, amateur conductors may
gesture lavishly, which can even disturb singers.
Liao and Davidson (2016), too, clarified the effects of gesture as well as
movement training on the intonation of children’s singing. The context of this study
was vocal warm-up sessions with regard to improving intonation. The participants
(10–11 years old) were divided into three training groups. The participants who
received gesture and/or movement training yielded significantly better
improvement in singing in tune than those children who did not receive any training,
which was also compatible with earlier findings. There were five different vocal
patterns, and the ratings of the chidren’s improvement varied between those
patterns. Three gestures (gathering, pushing, and opening–closing) would seem to
have positively influenced children’s intonation (Liao & Davidson, 2016, p. 4, 14–
15). These results abolish the doctrine of some choir conduction educators who
emphasize that conductors should not express anything with the face.
Fischinger et al. (2015) studied how virtual, varied room acoustics (three levels
of reverberation times) influenced choir singing with regard to intonation, loudness,
tempo, and timing precision. The aspects of intonation investigated were tuning
and drift, intonation of single pitches, and intonation on consonance. The findings

98
showed that intonation is only weakly influenced by room acoustics. However,
intonation analyses revealed an optimal singing room size on a reverberation level
of 1.77 s (Fischinger et al., 2015, pp. 24–26).
Wind bands and orchestras
Garofalo (1996) listed 10 main factors that may cause poor intonation in band and
orchestra performance: 1) condition and quality of the instruments and accessories,
2) basic playing procedures, 3) insufficient warm-up (wind instruments), 4) playing
the standard tuning frequency (wind instruments), 5) psychological and musical
phenomena, 6) pitch tendencies of instruments and performers, 6) poorly trained
ears (students with little or no ear training), 8) poor balance (vertical dynamics), 9)
poor seating arrangement, and 10) poor acoustics in the rehearsal and performance
environments (Garofalo, 1996, pp. 9–15). Geringer and Worthy (1999, p. 147)
approach this question more generally. According to them, pitch perception was
influenced by several factors: fundamental frequency, tone quality, tuning situation,
consistency across listeners, and additional factors. Jagow (2012, pp. 72–73) lists
factors influencing pitch: Air, posture, embouchure, mouthpiece, amount of
mouthpiece, angle of mouthpiece, lay of mouthpiece, barrel and bocal length, horn
hand positions, tongue positions, reed condition, equipment, dynamics, pitch
concept, balance, timpani pitch, percussion, and temperature are the factors
affecting pitch. Several factors, indeed.
Powell (2010) summarizes that the effect of vocalization on wind
instrumentalists’ intonation skills is ambivalent and thus not clear. But temperature
influences: The lowered external temperature lowers the pitch (Powell, 2010, pp.
183–184). I assume that every single wind player, at least wind conductor, has
experienced that temperature really influences intonation. I remember dozens of
performances with a wind ensemble in the circumstances of −15 ℃ in Finland. It
is rather hopeless to stay in tune, especially if one is not familiar with intonation
issues.
It is not indifferent which instrument is used as stimulus tone. Byo et al. (2011)
write that it has become general that band and wind ensemble conductors use tuba
as a reference for mass tuning: the players build primes and octaves on tuba sound.
The authors doubted if players can resolve the second, fourth, and eighth partial,
which means, of course, octaves built on a reference tone. In their findings, tuning
responses to tuba stimulus deviated 9.05 cents on average. Among tuning responses,
mean cent deviations were smallest to clarinet stimulus and largest to tuba stimulus.
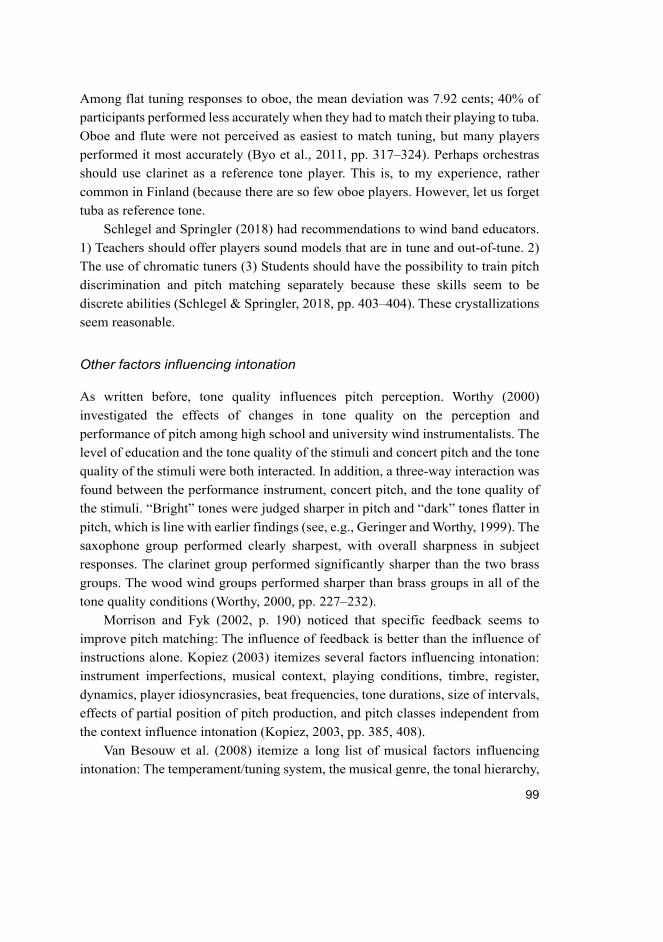
99
Among flat tuning responses to oboe, the mean deviation was 7.92 cents; 40% of
participants performed less accurately when they had to match their playing to tuba.
Oboe and flute were not perceived as easiest to match tuning, but many players
performed it most accurately (Byo et al., 2011, pp. 317–324). Perhaps orchestras
should use clarinet as a reference tone player. This is, to my experience, rather
common in Finland (because there are so few oboe players. However, let us forget
tuba as reference tone.
Schlegel and Springler (2018) had recommendations to wind band educators.
1) Teachers should offer players sound models that are in tune and out-of-tune. 2)
The use of chromatic tuners (3) Students should have the possibility to train pitch
discrimination and pitch matching separately because these skills seem to be
discrete abilities (Schlegel & Springler, 2018, pp. 403–404). These crystallizations
seem reasonable.
Other factors influencing intonation
As written before, tone quality influences pitch perception. Worthy (2000)
investigated the effects of changes in tone quality on the perception and
performance of pitch among high school and university wind instrumentalists. The
level of education and the tone quality of the stimuli and concert pitch and the tone
quality of the stimuli were both interacted. In addition, a three-way interaction was
found between the performance instrument, concert pitch, and the tone quality of
the stimuli. “Bright” tones were judged sharper in pitch and “dark” tones flatter in
pitch, which is line with earlier findings (see, e.g., Geringer and Worthy, 1999). The
saxophone group performed clearly sharpest, with overall sharpness in subject
responses. The clarinet group performed significantly sharper than the two brass
groups. The wood wind groups performed sharper than brass groups in all of the
tone quality conditions (Worthy, 2000, pp. 227–232).
Morrison and Fyk (2002, p. 190) noticed that specific feedback seems to
improve pitch matching: The influence of feedback is better than the influence of
instructions alone. Kopiez (2003) itemizes several factors influencing intonation:
instrument imperfections, musical context, playing conditions, timbre, register,
dynamics, player idiosyncrasies, beat frequencies, tone durations, size of intervals,
effects of partial position of pitch production, and pitch classes independent from
the context influence intonation (Kopiez, 2003, pp. 385, 408).
Van Besouw et al. (2008) itemize a long list of musical factors influencing
intonation: The temperament/tuning system, the musical genre, the tonal hierarchy,

100
the tonal function of individual notes, the melodic function of an individual note,
its position in a melodic phrase, the context of performance and the rhythmical
context (van Besouw et al., 2008, p. 154). This is something I have experienced
frequently: When I improvise, I pay attention to music analysis factors like the
following: “This is a leading tone,” “this is the third of subdominant chord,” “now
I trifle with the blue tone,” etc.
Schlegel and Springler (2018) investigated the influence of tuner condition
(displayed visually by tuners: flat = 437 Hz, in tune = 440 Hz, and sharp = 443 Hz)
and instrumental experience on trombone players’ pitch-matching accuracy and
other hand, tuning confidence. The players at college level intonated more
accurately than high school trombonists in all tuner conditions. Experience linearly
increased the accuracy of pitch performance. The performed cent deviations in
sharp tuner conditions were larger than in-tune condition (440 Hz) and in flat
condition (437 Hz): Players seemed to avoid flatness, and a slight sharp tendency
was found (Schlegel & Springer, 2018, pp. 400–402). A sharp tendency is common,
as noted in Sub-chapter 2.2.
Indeed, a huge number of factors seem to influence produced intonation. A
music education professional, especially conductors, should recognize all these
aspects. Intonation awareness is a vast potential for conductors and educators.
2.4.2 Improving intonation
It is comforting to know that intonation skills can be improved. A number of
methods have been developed. In essence, it is a question of elimination of beats.
The methods to achieve this are diverse. Let us create a short overview of a few of
them.
Beat elimination
Frequently cited Miles (1972) studied beginning wind instrumentalists and their
ability to improve their pitch-matching skills by learning to perceive beats in two
or more mismatched tones. The participants practiced playing in unison and the
following intervals: major third, perfect fifth, and triads with other instrumentalists.
All the participants succeeded in a tuning unison free of beats at some time during
each step of the study; 95% of the participants were able to tune a perfect fifth free
of beats, and 88% of the participants were able to tune a major third free of beats.
Furthermore, 80% of the participants were able to tune a perfect fifth free of beats

101
in a triad, and 79% were able to tune a major third free of beats in a triad. The beat
elimination process applied with the Intonation Trainer (an electronic pitch-
matching device) was clearly effective in teaching beginning wind instrumentalists
to play in tune (Miles, 1972, pp. 497–500). The results of this investigation are
encouraging for educators. Garofalo (1996) reminds us that improving intonation
in ensemble performance demands continuing listening for the presence of acoustic
beats and sudden elimination of the pulsations by adjusting pitches with one’s own
instrument. The beat elimination process is one of the performance skills (Garofalo,
1996, p. 23).
Wolbers (2002) recommended singing in the band rehearsal because it can be
a tool to explore pitch, balance, and musical syntax: Singing can also help to
discover musical shapes and nuances. He also advises us to begin singing with
melodic intervals and phrases. Players in the band should be encouraged to find the
thirds by ear; the just intonation major third (386 cents) would be the aim. Singing
helps the player to recognize intervals of the chords. Then conceptualizing and thus
hearing the intervals before playing them with instruments improve intonation
accuracy. Wolbers refers to Miles (1972) and describes the technique of matching
the pitches and listening interference beats, which occur between the reference
sound and the sound the player is producing (Wolbers, 2002, pp. 38–40). To my
experience, major thirds are possible to achieve in wind ensembles, especially in
brass ensembles, also without theoretical formatting. Even amateur players with
modest technical skills can learn to avoid beats in simple exercises of building
intervals and triads. This, however, requires professional conducting.
Likewise, Powell (2010, pp. 88–89) noticed that beat elimination and
vocalization can improve the intonation of players. Ballard (2011, p. 30) accounts
sensible to teach technique of pitch adjustment, where beat elimination rehearsal is
essential. Kopiez (2003, p. 406) says, “Beat rates are only one acoustic cue in the
successful adaptation to different tuning systems.”
Bohrer (2002) emphasizes that it is possible to detect a mistuning of the
magnitude of syntonic comma through beat detection. Scooping and portamento
could be present in any intonational strategy adopted by singers. Adequate training
can help to overcome the predicament of vibrato’s effects on intonation. The
reference frequencies in flexible intonation may be changed during the
performance (Bohrer, 2002, pp. 47–48). Bohrer helps us to approach the essential:
syntonic comma mentioned.
Wuttke (2011) found that instruction plays an important role in producing
desirable wind band intonation. A band director who concentrated on intonation

102
(tuning octaves and chords and using the beat elimination method) of an ensemble
achieved high scores in tests that measured equipment quality, knowledge of
instrument pitch tendencies, and aural discrimination abilities. The next methods
turned out to be effective in training intonation: voice groups tune perfect intervals,
building chords (root-fifth-third), performing chords ascending and descending by
semitone, performing exercises and stopping on chords (identifying the partials of
the chord), and using beat elimination process to build the awareness of intonation
(Wuttke, 2011, pp. 91–95).
I have noticed that conducting junior ensembles, particularly, demands
conductor special skills dealing with intonation problems. The conductors of
professional symphony orchestras may even ignore intonation issues, because the
average level of intonation is “sufficient.” It really matters, a lot, who complies to
conduct junior ensembles. Sometimes it is challenging to get one major triad to
sound correctly. It is a most demanding work and calls for a deep understanding of
intonation issues.
Algorithms for pitch matching
New technology has also brought new tools for intonation rehearsals. It is possible
that technology makes everything easier, if we are unprejudiced. I will present a
short overview of some of them.
Dalby (1992) developed and designed the Harmonic Intonation Training
Program (HITP). The program had two parts: The first one included a lesson about
basic acoustic foundations of two tuning systems, equal temperament and just
intonation. The second part included drill-and-practice exercises using intervals,
triads, and musical passages with two and three voices. The passages were chosen
by using six criteria: conventional triadic harmony, homophonic texture, no unison
doublings and cross-voicings, low complexity of rhythms, moderate tempos, and
moderate registers for vocal writing. In Dalby’s study, 176 undergraduate music
majors were tested by the Harmonic Intonation Discrimination Test (HIDT) as a
pre-test. The use of the HIDT enhanced the post-test score. The attitudes of
participants toward the training program were mostly positive (1992, pp. 141–151).
Milne, Sethares, and Plamandon (2007) introduced a system that simplifies
intonation into a system that can be controlled and played easily. ”A higher-
dimensional tuning system such as a just intonation can be mapped to a lower-
dimensional tuning system by tempering its intervals” (Milne et al., 2007, p. 15).
The syntonic rational continuum is a tuning apparatus, which is based on different

103
sizes of perfect fifths (685–721 cents). The basement of this continuum is in
Barbour’s thoughts (1951/2004), Lorenz (2001), Sethares (2004), and Huygens-
Fokker Foundation Web site (see http://www.huygens-fokker.org). The isomorphic
controller is a user keyboard interface for different tunings. The authors introduced
keyboard fingering models to different tunings and keyboard fingering models for
different tone order to several tuning systems, not only to equal temperament. There
are also keyboard fingering models for different meantone temperaments. The
authors introduced a cadence (I–IV–V–I) that can be played with identical
fingering in all keys and in all tuning systems with a syntonic rational continuum
(Milne et al., 2007, pp. 15–32).
Stange et al. (2018) have presented a dynamically adapting tuning scheme,
which allows the musician to play in just intonation in any key. This novel tuning
scheme solves a system of vertical intonation, horizontal intonation, and non-
unique interval sizes. The authors presume that the art of instrument making will
develop quickly, which probably means the decrease of instruments with fixed
tuning. The significance of dynamically adapting constitutions of intonation will,
on the contrary, increase (Stange et al., 2018, pp. 58–59).
All mentioned inventions aim at flexible intonation. However, the distance
between the praxis of music education and technological inventions in intonation
issues is quite long. Until now, to my experience, technology has advanced the
usage of clinical equal temperament. A lot of opportunities could be put to use
among new equipment.
Other methods for training intonation skills
Yarbrough et al. (1995) studied the effect of knowledge of directional mistunings
on tuning accuracy of wind players. Total cent deviations from correct pitch and
SDs grew smaller each year by years of instruction (Yarbrough et al., 1995, pp.
237–240). Garofalo (1996) noted several ideas for improving intonation: Treating
intonation awareness of players, demonstrating “in-tuneness” and “out-of-
tuneness,” requiring intonation charting with electronic tuner, teaching theory
fundamentals and ear training, teaching singing, maintaining constant temperature
and humidity, assigning parts for good balance, experimenting with seating (in
orchestra), and refining warm-up and tuning procedures (Garofalo, 1996, pp. 84–
85).
The following point is easy to understand: Playing one note alone does not
improve a player’s intonation (Morrison, 2000, p. 47; Yarbrough et al., 1995, pp.
104
237–240). In my personal experience, some pedagogues use the method “play long
notes” (alone). The benefit of these exercises seems minor from the intonation’s
point of view.
Morrison (2000) investigated band students and the effect of melodic context,
tuning behaviors, and experience on intonation accuracy. Intonation accuracy was
noticed to improve with experience: The deviation from optimal pitches played by
instruments got smaller every year (from 25.06 cents to 8.23 cents, SD) in seven
years. Melodic context did not seem to affect performance accuracy. The absence
of a melodic context seemed to have a significant impact on performance accuracy.
Participants responded to tuning pitch more accurately than for melodic pitches.
Tuning behaviors (tuning one’s own instrument to a single pitch, verbal instruction
to play in tune, and receiving no information) did not seem to influence intonation
accuracy (Morrison, 2000, pp. 47–49). Totally useless, in my opinion, are the
exclamations like “listen to the intonation,” “listen to the each other,” and “this is
out of tune.” Perhaps to most common fallacy is to judge all mistunings to be “flat.”
Conductors should know (and hear) what to correct.
Pasqua (2001) developed a method to develop intonation awareness and
improve tuning skills of high school wind instrumentalists. This method was used
during regularly scheduled instrumental lessons, and it was designed in a
cooperative learning model using four phases of tuning activities. The method was
evaluated in terms of student skills, attitudes, and feasibility of implementation:
Thet adjusted flat and sharp pitches, pure fourths, and pure fifths. The results
showed that the time of tuning shortened remarkably, tuning accuracy was
improved, and the confidence in participants’ tuning abilities was improved. In
addition, the participants seemed to enjoy the cooperative learning approach, and
they were able to implement intonation awareness studies during scheduled lessons
(Pasqua, 2001, pp. 92–95). Pasqua (2001, p. 96) writes: “Students were able to
explore, express, and evaluate ideas as they improved their intonation awareness
and tuning capabilities.” This citation is encouraging.
Schellenberg and Moreno (2010) studied the connection between musical
training, pitch-processing speed, frequency discrimination, and general intelligence
(g). Musically trained and untrained participants achieved similar results on a
measure of g. Musical training was observed to have a positive influence on pitch-
processing speed and relative pitch and frequency discrimination (Schellenberg &
Moreno 2010, pp. 214–216).
Villegas and Cohen (2010) developed computer sofware that made it possible
to use adjustable intonation. The program adjusted the maximum pureness to

105
intervals. The aim of using this program was to minimize the roughness of
sonorities that are parallel, and which can be measured. This would be done as the
sonorities are produced by calculating the pitch of each tone, which happens in real
time (Villegas & Cohen, 2010, pp. 75, 90).
As can be seen, most of these approaches ignore the structural mistuning that
the syntonic comma represents. Bohrer (2002) and Kopiez (2003) are exceptions.
It would probably be easier to concentrate on minimization of beats if one
recognizes the places where tempering is necessary (if pitch drift is not desirable).
2.5 Research questions
The first large issue of the two experiments of this research, as justified in previous
sub-chapters, is the phenomenon called the syntonic comma. It will be investigated
through two approaches: the first of these concerns the recognition of the syntonic
comma. To the best of my knowledge, aural recognition of the syntonic comma has
not been investigated in empirical research. This research aims to bring the
phenomenon of the syntonic comma audible and visible with Experiment 1 (see
Chapter 3). The second approach is the usage of the syntonic comma, which is
presented and underlined with Experiment 2 in Chapter 4.
For this research, the intonation scale was extended to allow certain tonal and
modal triadic progressions. As explained in Sub-chapter 2.1.5, just intonation scale
leaves the second-degree minor triad mistuned by a syntonic comma concerning
both the third and the fifth of the root. Hence, the “mistuning” in this experiment
is the second-degree minor triad (ii triad). One starting point for the study was the
simple idea that these mistunings would be easiest to recognize in simple harmonic
contexts.
Experiment 1 (recognition of mistuning) will chart out the recognition of the
syntonic comma in the context of chord progressions involving target chords
mistuned by a comma. Two research questions will be addressed:
1. To what extent do young music learners recognize mistuned triads in simple
four-voiced just intonation harmony?
2. To what extent can the recognition of the mistuned triads be explained by
musical features, such as the complexity of harmony or the target location, and
the participants’ individual features (e.g., instrumental experience)?
The location of the target here simply means the location of the mistuned triad in
chord progression listened to in Experiment 1. Assuming that young music learners

106
cannot recognize the mistunings in Experiment 1, the relevance of the syntonic
comma to music education could be called into question. However, if they do
significantly recognize these mistunings, it would become a relevant question how
to deal with the comma—how to use it. What I mean by usage is that the problem
of syntonic comma could be solved in several different ways. First, as explained
above, the comma could be distributed to the whole tuning system, in which case
we often speak of temperaments. Second, we could locally “correct” the mistuning
in the vertical chords where it occurs. Third, it would also be possible to transfer
the comma to melodic movements, causing pitch drift to happen. Syntonic comma
actually cannot be eliminated—we must only deal with it in one way or another.
Experiment 2 (intonation preferences) will explore the following three
different ways of using the syntonic comma. First, I have chosen to use two
varieties of distributing the comma—meantone tuning and equal temperament.
Second, local tempering will substitute the equal-tempered ii triad (in major keys)
for the mistuned one in a (modified) just intonation scale. The fourth usage of the
syntonic comma is pitch drift. Here, two further research questions will be
addressed:
3. Which usages of the syntonic comma university music students and
professional music educators prefer in tonal and modal four-part texture?
4. To what extent can these preferences be explained by the participants’
individual features (e.g., choral experience)?
The third objective of this dissertation is to pave the way for how the recognition
and usage of the syntonic comma, as assembled in Experiments 1 and 2, could help
in teaching intonation skills in music education. The results of Experiment 1 and 2
are hoped to bring practical implications that can be deduced based on two
empirical experiments of this research and, on the other hand, based on research
literature concerning intonation issues from the music education point of view.
Music educators may benefit from increasing awareness of intonation issues.
Which factors influence pitch matching? How can intonation be improved in
practical situations of music?
After the two empirical experiments of this work, I will also be able to address
the potential pedagogical implications of the results. In this context, previous
research literature regarding intonation issues in musical performance may also be
interpreted from a pedagogical point of view. As a whole, the dissertation thus aims
to strengthen the pedagogy of intonation issues in music education.

107
The answers to the research questions are planned to be received by means of
two music psychological experiments. The original musical material was
developed first for the experiment on recognition of mistuning (Experiment 1).
There were 40 chord progressions that were developed based on certain music
analysis premises. After this material was made, 30 of 40 chord progressions were
selected for the following experiment on intonation preferences. The complete
description of Experiment 1 (recognition of mistuning) is presented in Sub-chapter
3.2 and Experiment 2 (intonation preferences) in Sub-chapter 4.2. Both
experiments of this research are hoped to provide new tools for music education
and instrumental pedagogy concerning the problem of how to deal with the problem
of the syntonic comma.
2.6 Research process
I contacted three school units in December 2014. The participants in Experiment 1
were 166 pupils in music-intensive classes in two comprehensive schools, primary
education (from grades three through nine age 9–16 years), in one secondary school
(17–19 years) and university students (music education with a background in
music-intensive classes) in Finland. The experiment was planned so that the session
could be carried out during the school lesson. The experiment sessions were carried
out in school rooms with equal written and aural instructions and with equal
technical circumstances. The auditory instructions implemented in Experiment 1,
the questionnaire, and the response packet are presented as written in Appendix 1.
The approval form for parents of the underaged participants of Experiment 1 is
presented in Appendix 2. The data was collected with a questionnaire on the front
page of the response packet during spring 2015, and it was entered into the SPSS
software in June 2015.
The analyses of the collected data, in the first place, were implemented through
the SPSS software (version 24, with TETRA-COM SPSS syntax program; see
Lorenzo-Seva & Ferrando, 2012) for estimating the tetrachoric correlations to be
used in exploratory factor analysis (hereafter EFA) and principal component
analysis (hereafter PCA).
The character of this research is purely quantitative, and it required statistical
processing. A reasonable number of figures and tables were produced to illustrate
the analyses of the results. In addition to statistical methods, a number of music
theory analyses were used in analyzing the results of the experiments. Naturally,
music theory issues were present in the phase on composing the chord progressions.

108
The interpretations, conclusions, and deductions of the statistical analyses
attached to Experiment 1 are presented in Sub-chapter 3.3.
In Experiment 2 (intonation preferences), the participants (N = 93) were
university music students and professional music teachers from two Finnish
universities with the age of 18 years or older. The participants were asked to fulfill
the approval form (see Appendix 3). They received aural instructions and wrote
their answers on a response packet (see Appendix 4). The experiment sessions were
carried out in rooms of a university environment and once in a private apartment
with equal written and aural instructions and with equal technical circumstances.
The data were collected between May 2015 and October 2016 and were entered
into SPSS software in June 2015 and October 2016.
The analyses of the collected data, in the first place, were implemented through
SPSS software. The quantitative results were subjected to interpretative analyses in
terms of music theory. The interpretations, conclusions, and deductions of the
statistical analyses attached to Experiment 2 are presented in Sub-chapter 4.3.
Reliability and validity are estimated separately when reporting both
experiments. The discussion regarding both experiments is introduced in Chapter
5.

109
3 Experiment 1: Recognition of mistuning
Now, it is time to come back to the roots, the pitch discrimination of intervals and
chords. The following main chapter will present an experiment in which the
recognition of mistuned triads was performed by young music hobbyists. The first
Sub-chapter 3.1 repeats shorty the aims of forthcoming experiment, recognition of
mistuning. Method of this experiment is described in Sub-chapter 3.2. The results
of experiment are presented in Sub-chapter 3.3. Reliability and validity are
included in Sub-chapter 3.4.
3.1 Aims of Experiment 1
As remembered from Sub-chapter 2.1.5, the by-product of just intonation is the
second-degree minor triad, which is mistuned by a syntonic comma. The main
purpose of Experiment 1 was to find out how well the participants recognize this
mistuned target triad in certain chord progressions, while other triads of chord
progressions are purely tuned in just intonation. In particular, it was hoped that the
experiment would shed light on participants’ ability to perceive a mistuned triad in
tonal environments representing varying levels of harmonic complexity. In addition,
there was a certain interest in exploring how the false judgments in participants’
answers were divided between purely tuned minor and major triads. There were
only pure minor and major triads to misattribute.
3.2 Method of Experiment 1
This sub-chapter is divided on five sub-chapters. Sub-chapter 3.2.1 includes the
essential information of the participants of Experiment 1. Musical material is
described in Sub-chapter 3.2.2 and it is quite a wide overview of self-made chord
progressions used in this experiment. Sub-chapter 3.2.3 introduces the design of
this experiment. Procedure is presented in Sub-chapter 3.2.4 and data analysis in
Sub-chapter 3.2.5.
3.2.1 Participants
The participants were 166 pupils in music-intensive classes in comprehensive
school, primary education (third, fourth fifth, sixth, seventh, eighth, and ninth
grades), secondary school, and university students (music education). All

110
participants lived, in the Finnish context, in a rather big town (approximately
200,000 inhabitants). There were 54 male participants and 112 female participants.
The youngest participants were 9 years old, and the oldest participant was 35 years
old. The distribution of participants according to school level:
– 80 pupils at comprehensive school, primary education, music class (third,
fourth, fifth, and sixth grades)
– 64 pupils at comprehensive school, music class, upper grades (seventh, eighth,
and ninth grades)
– 12 students at secondary school (for ages 16–19) with an extended music
program
– 10 university music students with background in music class.
All participants were asked to announce in which instrument group their main
instrument belonged to, and 53 of the participants (31.9%) identified their main
instrument to be in the group of string instruments. Also, 53 participants belonged
to the group of piano, kantele, guitar, harp, or percussion, while 42 (25.3%) played
a woodwind instrument, and 17 (10.2%) played a brass instrument.
Further, all participants were divided into three groups based on the voice they
use to sing in the choir: top voice (59 participants, 35.5%), middle voice (64
participants, 38.6%), or bass voice (41 participants, 24.7%). The participants had
played their instruments on average 6.1 years (M=6.14, SD = 3.9). The shortest
time was one year, and the longest time was 22 years.
3.2.2 Musical materials
There were 40 chord progressions to be listened to. Every chord progression
included seven triads. The first two triads were half notes in duration, while the
third, fourth, fifth, and sixth triads were quarter notes, and the final triad was whole
notes. Fig. 10 shows an example of chord progressions in Experiment 1.
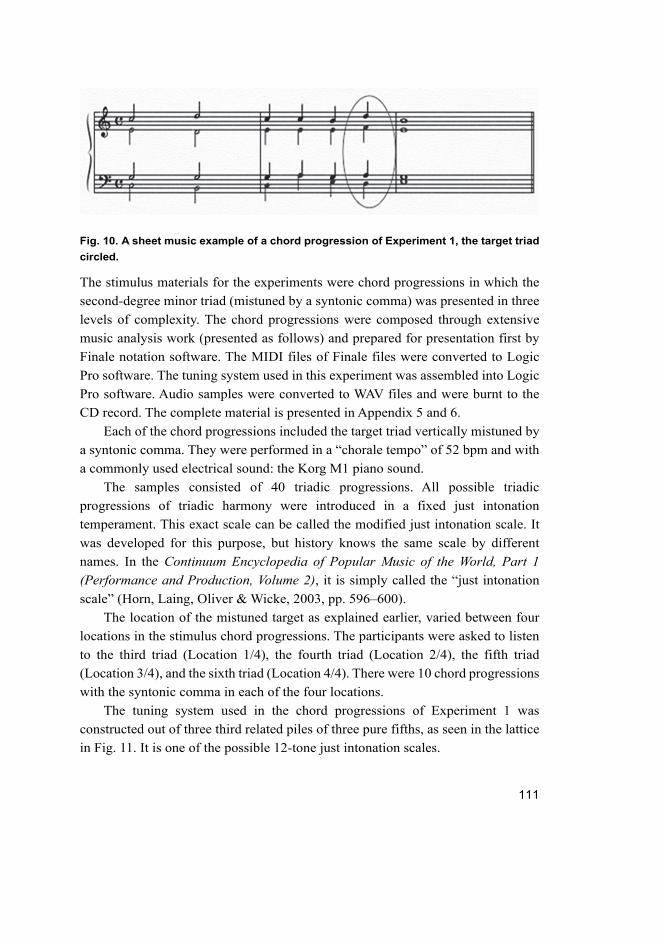
111
Fig. 10. A sheet music example of a chord progression of Experiment 1, the target triad
circled.
The stimulus materials for the experiments were chord progressions in which the
second-degree minor triad (mistuned by a syntonic comma) was presented in three
levels of complexity. The chord progressions were composed through extensive
music analysis work (presented as follows) and prepared for presentation first by
Finale notation software. The MIDI files of Finale files were converted to Logic
Pro software. The tuning system used in this experiment was assembled into Logic
Pro software. Audio samples were converted to WAV files and were burnt to the
CD record. The complete material is presented in Appendix 5 and 6.
Each of the chord progressions included the target triad vertically mistuned by
a syntonic comma. They were performed in a “chorale tempo” of 52 bpm and with
a commonly used electrical sound: the Korg M1 piano sound.
The samples consisted of 40 triadic progressions. All possible triadic
progressions of triadic harmony were introduced in a fixed just intonation
temperament. This exact scale can be called the modified just intonation scale. It
was developed for this purpose, but history knows the same scale by different
names. In the Continuum Encyclopedia of Popular Music of the World, Part 1
(Performance and Production, Volume 2), it is simply called the “just intonation
scale” (Horn, Laing, Oliver & Wicke, 2003, pp. 596–600).
The location of the mistuned target as explained earlier, varied between four
locations in the stimulus chord progressions. The participants were asked to listen
to the third triad (Location 1/4), the fourth triad (Location 2/4), the fifth triad
(Location 3/4), and the sixth triad (Location 4/4). There were 10 chord progressions
with the syntonic comma in each of the four locations.
The tuning system used in the chord progressions of Experiment 1 was
constructed out of three third related piles of three pure fifths, as seen in the lattice
in Fig. 11. It is one of the possible 12-tone just intonation scales.
112
Fig. 11. The just intonation scale presented as a lattice.
The same scale in C is introduced in Table 10.

113
Tab
le 1
0.
Ju
st
into
nati
on
scale
.
Sca
le
attribute
s
Sem
itone
M
inor
third
Augm
ente
d
fou
rth
Min
or
sixt
h
Min
or
seve
nth
Dia
tonic
inte
rvals
of
just
into
natio
n s
cale
to t
he r
ight
Ma
jor
seco
nd
Ma
jor
third
Perf
ect
fou
rth
Perf
ect
fifth
Ma
jor
sixt
h
Ma
jor
seve
nth
Cents
70.6
7
315.6
4
590.2
2
813.6
9
1017.6
0
O
203.9
1
386.3
1
498.0
4
701.9
6
884.3
6
1088.2
7
Ratio
25/2
4
6/5
45/3
2
8/5
9/5
1/1
9:8
5/4
4/3
3/2
5/3
15/8
Solfe
gg
io
C#
E
b
F#
Ab
B
b
C
D
E
F
G
A
B
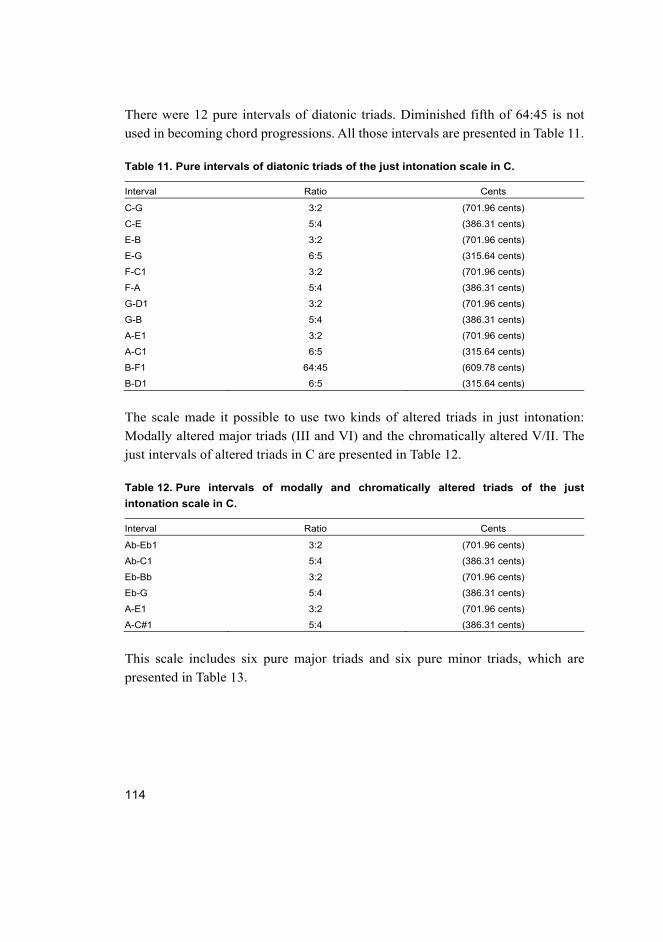
114
There were 12 pure intervals of diatonic triads. Diminished fifth of 64:45 is not
used in becoming chord progressions. All those intervals are presented in Table 11.
Table 11. Pure intervals of diatonic triads of the just intonation scale in C.
Interval Ratio Cents
C-G 3:2 (701.96 cents)
C-E 5:4 (386.31 cents)
E-B 3:2 (701.96 cents)
E-G 6:5 (315.64 cents)
F-C1 3:2 (701.96 cents)
F-A 5:4 (386.31 cents)
G-D1 3:2 (701.96 cents)
G-B 5:4 (386.31 cents)
A-E1 3:2 (701.96 cents)
A-C1 6:5 (315.64 cents)
B-F1 64:45 (609.78 cents)
B-D1 6:5 (315.64 cents)
The scale made it possible to use two kinds of altered triads in just intonation:
Modally altered major triads (III and VI) and the chromatically altered V/II. The
just intervals of altered triads in C are presented in Table 12.
Table 12. Pure intervals of modally and chromatically altered triads of the just
intonation scale in C.
Interval Ratio Cents
Ab-Eb1 3:2 (701.96 cents)
Ab-C1 5:4 (386.31 cents)
Eb-Bb 3:2 (701.96 cents)
Eb-G 5:4 (386.31 cents)
A-E1 3:2 (701.96 cents)
A-C#1 5:4 (386.31 cents)
This scale includes six pure major triads and six pure minor triads, which are
presented in Table 13.

115
Table 13. Pure major and minor triads of the just intonation scale.
Pure major triads Pure minor triads
C-E-G C-Eb-G
Eb-G-Bb E-G-B
F-A-C1 F-Ab-C1
G-B-D1 G-Bb-D
Ab-C-Eb A-C1-E
A-C#1-E1 B-D1-F#1
All these just intonation triads included a downside, as remembered from previous
chapters: The second-degree minor triad is mistuned by a syntonic comma. F#-A
is the same interval as re-fa, Pythagorean minor third, 32:27 = 294.13 cents. F#-
C#1 is the same as D-A (40:27 = 680.45 cents). This is called, as mentioned earlier,
“Wolf fifth.” However, this chord degree (F#-A-C#) was not used in chord
progressions. D-F# works very well (5:4 = 386.31 cents), but D-A is not usable, as
mentioned.
C#-E is a pure minor third, but C#-Ab (743 cents) is not acceptable as a perfect
fifth. C#-F is also unusable (32/25 = 427.37 cents). C#-F-Ab is extremely stretched.
F#-Bb is also maximally stretched (32/25 = 427.37 cents) and the fifth, F#-C#1
(40:27 = 680.45 cents) is narrow by a syntonic comma, as mentioned. E-Bb is 3:2,
but Eb-F# is too narrow, 75/64 = 274.58 cents. E-B is 3:2, but E-Ab is too sharp,
(32/25 = 427.37 cents). Ab-Eb1 is pure fifth (3:2), but the minor third Ab-B is too
narrow, (75/64 = 274.58 cents). Bb-D1 is 5:4, but Bb-F1 is too narrow,
40:27 = 680.45 cents. Bb-C# is absolutely too narrow, 125/108 = 253.08 cents. The
minor chord Bb-C#1-F1 has the most unsatisfying tuning in this temperament and
is thus completely unusable. B-Eb1-F”1 cannot be used because of the very sharp
major third B-Eb1 (32/25 = 427.37 cents). B-D1-F#1 is a pure minor triad, as noted.
The tuning of F# is insignificant in this experiment because it was not used in these
chord progressions.
There are two kinds of major seconds (203.91, 182.40 cents) and even four
kinds of minor seconds (70.67, 92.18, 111.73, and 133.24 cents). The syntonic
comma appears here, too: The difference between the minor second of 25:24 (70.67
cents) and 135:128 (92.18 cents) is the syntonic comma of 21.51 cents (81:80) as
well as the difference between the minor second of 16:15 (111.73 cents) and 27:25
(133.24 cents). Further, the difference of the major second of 9:8 (203.91 cents)
and 10:9 (182.40 cents) is the syntonic comma, too.

116
As mentioned earlier, the experiment consisted of chord progressions, which
are divided into three categories according to complexity. These samples were
performed through the maximal pure scale. All categories contain triads from all
scale degrees except for the seventh degree. Categories are presented as follows.
Chord progressions, Category 1
Most chord progressions in Category 1 are not typical tonal cadences. The purpose
was to create tonally neutral chord progressions. Possible tonal expectations might
have an influence on the recognition of mistuning by means of recognizing the
chord degree. Syntonic commas are located vertically in the second-degree minor
triad (ii triads, marked as an italicized font). There were 16 chord progressions,
each of which included seven triads. Some chord progressions do not stay in the
major key they started. Some chord progressions do not stay in the minor key they
started. Some chord progressions stay “unfinished,” at iii, IV, V, or vi triad. The
purpose is to recognize the mistuning, not the tonal function, as subdominant.
Seventh chords were omitted from the final score. This issue is discussed in Sub-
chapter 5.7.
The main idea of chord progressions of Category 1 is that the mistuned triad
appears only between I and iii triads. These triads appear in root position and both
inversions. Also, the mistuned triad by a syntonic comma in the third interval and
in the fifth interval appears in all inversions. In the stimulus set for Category 1, the
comma triad appeared four times in each of four consecutive positions of the chord
progressions, from the third to sixth chord of the test trial. For simplicity, these four
positions will be referred to as triads 1–4 (triads 3, 4, 5, and 6). For each position,
the triads before and after the target appeared once in all four possible combinations
of first and third degrees. In Category 1, the triads before and after the target (the
second-degree triad) are the following: iii – ii – I, I – ii – iii. I – ii – I, and iii – ii –
iii. There were no syntonic commas in melodic lines in any voice. These chord
progressions are presented in Table 14.

117
Table 14. Chord progressions, Category 1.
Chord
progression
number
Half note Half note 1st triad 2nd triad 3rd triad 4th triad Whole note
Quarter
note
Quarter
note
Quarter
note
Quarter
note
1. I IV64 I vi iii ii I
2. I vi iii V I ii6 iii
3. I iii vi IV I64 ii64 I
4. I V6 I vi iii ii iii
5. I IV vi iii ii I V
6. I vi IV I ii6 iii vi
7. I I6 IV I64 ii64 I64 V
8. I V6 I iii ii6 iii6 vi
9. I vi iii6 ii64 I I6 V
10. I V6 I ii6 iii V I
11. I IV I6 ii6 I64 V I
12. I vi6 iii64 ii64 iii6 vi IV
13. vi iii ii I IV vi iii
14. vi I ii6 iii vi I64 V
15. V6 I ii I IV I V
16. I iii64 ii64 iii6 vi I64 V
In Fig.12 we can see a sheet music example of chord progression from Category 1.
Fig. 12. A sheet music example of a chord progression from Category 1.
Chord progressions, Category 2
The main idea of chord progressions of Category 2 is that the comma triad appears
between triads on the first and third, fourth, and sixth degrees with various
combinations. Either IV triad or vi triad are surrounding the target (ii) triad. These
surroundings are presented in Table 15.

118
Table 15. Triads surrounding the mistuned triads in Category 2.
Preceding triad Mistuned triad Following triad
I ii vi
iii ii IV
IV ii vi
vi ii IV
vi ii vi
IV ii IV
IV ii iii
vi ii I
Triads on the third degree appear in root position. I triads appear in root position
and first inversion. IV triads appear in root position and second inversion and vi
triads appear as all forms of triads.
The triad of the second degree with a syntonic comma in the third interval and
in the fifth interval appears in the root position and both inversions. The placement
of the mistuned triad changes three times: The comma triad is the third triad, the
fourth triad, the fifth triad and the sixth triad, four times of each. In addition, there
are 10 triads that include the syntonic comma in the melodic movement. In the
eighth and ninth chord progressions, there are two melodic movements with
melodic movements. The complexity of harmonic changes increases in a controlled
manner in Category 2. These chord progressions are not typical tonal cadences,
either. Syntonic commas are located vertically in ii triad (ii marked as italicized
font). There are also 12 syntonic commas (horizontally) in melodic lines, marked
with black arrows in Table 16:
– CAT2/1. Melodic syntonic comma in middle voice
– CAT2/2. Melodic syntonic comma in middle voice
– CAT2/4. Melodic syntonic comma in middle voice
– CAT2/5. Melodic syntonic comma in top voice
– CAT2/6. Melodic syntonic comma in top voice
– CAT2/8. Melodic syntonic comma in bass voice and in middle voice
– CAT2/9. Melodic syntonic comma in top voice (G/B-F/C) and in bass voice
(Dm-Am)
– CAT2/12. Melodic syntonic comma in middle voice
– CAT2/14. Melodic syntonic comma in middle voice
– CAT2/16. Melodic syntonic comma in bass voice

119
Table 16. Chord progressions, Category 2.
Chord
progression
number
Half note Half note 1st triad 2nd triad 3rd triad 4th triad Whole note
Quarter
note
Quarter
note
Quarter
note
Quarter
note
1. I I6 ii6 vi V IV I
2. I iii ii64 IV V vi iii
3. I I6 ii6 vi V vi iii
4. vi iii ii6 IV V IV I
5. I I6 IV ii6 vi64 V I
6. I iii vi ii64 IV V iii
7. I iii64 vi ii6 vi64 V64 I
8. IV I6 IV ii IV V iii
9. IV I V6 IV64 ii vi iii
10. vi I V6 vi ii64 IV I
11. I iii V64 vi6 ii vi64 I
12. V I V6 IV64 ii64 IV I
13. I iii vi64 V64 IV64 ii iii
14. vi I64 IV6 V6 vi6 ii I
15. I iii64 vi V6 vi6 ii64 I
16. I I6 IV V64 IV64 ii iii
Fig. 13 illustrates an example of chord progression with melodic commas.
Fig. 13. A sheet music example of a chord progression with melodic commas from
Category 2.
Fig. 14 illustrates an example of chord progression without melodic commas.

120
Fig. 14. A sheet music example of a chord progression with no melodic commas from
Category 2.
Chord progressions, Category 3
In Category 3, in every chord progression, there is either the major triad at the third
degree or at the sixth degree. The main idea of chord progressions of Category 3 is
modally altered triads (Eb-major triad, Ab-major triad in C), which are vertically
pure major triads. They never precede the comma triad or appear as the following
triad of the comma triad. In addition, there is a modally altered triad in the 5th
degree (Gm) in one chord progression. If the participants really listened to
impurities of triads, they should not be disturbed by pure modal triads.
The construction of two nearest triads of the target triad is almost identical with
Category 1: A triad right before the mistuned triad and the following triad after the
target triad is either the I triad or the iii triad.
These triads appear in root position, as first inversion and as second inversion.
The mistuned targer triad also appears in root position, first inversion, and second
inversion. The location of the target triad changes three times: It is the third triad,
the fourth triad, the fifth triad and the sixth triad, two times of each.
The chord progressions in Category 3 are not typical tonal cadences, either.
Syntonic commas are located vertically in the comma triad, marked by an italicized
font. There are no syntonic commas in melodic lines in any voice. The melodic
movements to modally altered triads include a semitone (25:24 = 70.67 cents)
between the major third of and the flattened third and between the sixth and lowered
sixth of the root. The chord progressions of Category 3 are presented in Table 17.

121
Table 17. Chord progressions, Category 3.
Chord
progression
number
Half note Half note 1st triad 2nd triad 3rd triad 4th triad Whole note
Quarter
note
Quarter
note
Quarter
note
Quarter
note
1. I iii ii iii IV VI I
2. I iii64 ii64 I64 III v I
3. I V6 I ii iii III6 I
4. vi IV I6 ii6 I64 VI 64 I
5. I V III I64 ii64 I64 V
6. I IV VI64 I6 ii6 iii6 vi
7. I V64 I6 III I6 ii6 iii
8. I IV VI IV iii6 ii64 I
Fig. 15 illustrates an example of the chord progression from Category 3.
Fig. 15. A sheet music example of a chord progression from Category 3.
The keys of chord progressions from Category 1, 2, and 3 in original order were
selected according to the next chain of keys: C–Eb–Gb–A–C–Ab–E–C–Bb–D–
Ab–E–Gb–C–Db–B–D–Bb–Eb–A–E–Ab–F–G–Gb–C–G–F–Ab–E–A–Eb–Bb–
D–B–Db–C–Gb–F–G. The idea was to assemble the suitable key for every chord
progression and look after the variety of keys to avoid the possible fatigue to certain
keys. After this was done, the order of experiment trials (chord progressions from
Category 1, 2, and 3) were randomized. At the same time, the order of keys
collapsed again. The full score of the chord progressions of Experiments 1 is
presented in Appendix 6.
There are only pure minor and major triads surrounding the mistuned second-
degree triad (by a syntonic comma). Table 18 presents the final experiment order,
the location of the mistuned triad, minor and major triads, category, and the key.

122
Table 18. Location of syntonic comma, pure minor and major triads, key, and category
of chord progressions for Experiment 1.
Sample 3rd triad 4th triad 5th triad 6th triad Key Category
1 major major SC1 minor Gb CAT3/6
2 minor SC major major Bb CAT1/9
3 SC minor major major Bb CAT3/1
4 major major SC minor Gb CAT2/9
5 SC major major major Db CAT1/15
6 SC minor major minor Eb CAT2/3
7 major minor SC minor C CAT1/8
8 minor major minor SC A CAT2/15
9 minor major major SC Ab CAT2/13
10 major SC major major G CAT2/8
11 major major SC major C CAT3/5
12 major major minor SC G CAT3/8
13 SC minor major major D CAT2/1
14 SC major major minor D CAT3/2
15 major minor minor SC C CAT1/1
16 minor major major SC Gb CAT1/3
17 minor SC minor major F CAT2/7
18 major minor SC minor G CAT2/11
19 major major SC major E CAT 1/7
20 major major major SC Eb CAT2/16
21 major SC minor major D CAT1/10
22 minor major major SC Eb CAT1/2
23 major SC minor major E CAT2/5
24 SC major major minor Gb CAT1/13
25 major SC major major Ab CAT1/11
26 minor minor SC major C CAT1/5
27 SC major major minor Bb CAT2/2
28 major SC minor major B CAT3/3
29 SC minor minor major C CAT1/14
30 SC major major major A CAT2/4
31 major major major SC F CAT3/7
32 major minor SC major C CAT2/10
33 minor SC major major Ab CAT2/6
34 SC minor minor major B CAT1/16
35 major major SC minor Ab CAT1/6
36 major minor minor SC A CAT1/4
37 minor SC minor minor E CAT1/12
38 major SC major major Db CAT3/4
39 major major SC major F CAT2/12
40 major major minor SC E CAT2/14
1 SC = syntonic comma

123
3.2.3 Design
The dependent variable in all of the following will be ”recognition of mistuning”—
understood simply as the percentage of correct identifications of the target triad.
The first variable is 1) recognition of mistuning in the whole data set (40 chord
progressions). The next variable is 2) differences in recognition of mistuning
between separate locations of the mistuned triad.
Participants’ ability to recognize a mistuned triad in tonal environments
representing varying levels of harmonic complexity is the following issue. Thus,
the next three dependent variables are 3) recognition of mistuning in Category 1
(The mistuned ii triad between triads representing iii and I), 4) recognition of
mistuning in Category 2 (The mistuned ii degree triad between triads representing
I, iii, IV, and vi), and 5) recognition of mistuning in Category 3 (modal alterations,
the mistuned ii degree triad between triads representing iii/III and I), 6) mistuning
recognition, the syntonic comma in melodic movements.
False judgments in participants’ answers were divided between purely tuned
minor and major triads. Thereby there are eight dependent variables more: 7)
mistuning misattributions to a minor triad, 8) mistuning misattributions to a minor
triad in Category 1, 9) mistuning misattributions to a minor triad in Category 2, 10)
mistuning misattributions to a minor triad in Category 3, 11) mistuning
misattributions to a major triad, 12) mistuning misattributions to a major triad in
Category 1, 13) mistuning misattributions to a major triad in Category 2, and 14)
mistuning misattributions to a major triad in Category 3.
Finally, an important goal was to examine whether and how a certain musical
background would affect the listener’s ability to recognize a mistuned triad. This
was done by the following independent variables: the instrument group, choir voice,
and the duration of playing the main instrument. In addition, there were age and
gender as stabilized variables.
3.2.4 Procedure
Listener’s ability to perceive mistuned ii triad in three categories representing three
different stages of harmonic complexity is the focus of this experiment. Given that
participants could only single out one mistuned chord for each chord progression,
there is no need for a more sophisticated measure that would treat ”misses”
and ”false alarms” separately. The influence of the location of the mistuned target

124
triad also interested the author. The design of the influence of certain background
variables is presented in Sub-chapter 2.5.
The participants were tested in small groups (N = 7–11), with each of them
wearing headphones. There were 11 sets of similar headphones available (Shure
SRH 440), and thus a maximum of 11 participants could complete the experiment
at the same time. The number of participants running the experiment varied
depending on the circumstances. The samples were played back on a CD player
(Sony CDP-212, with Behringer Powerplay Pro-XL, four-channel High-Power
Headphones Mixing and Distribution Amplifier, Model HA 4700). The volume was
adjusted to a comfortable listening level, keeping it exactly on the same level for
all participant groups. Given the measures taken, the small groups will have no
practical significance for the research, and the participants may thus in the
following be treated as one larger group.
In the beginning of the session, a questionnaire was filled out on the front page
of the response packet (see Appendix 1). After this, they received spoken
instructions for the test. The content of these instructions was also summarized in
the response packet. When the experiment began with the CD, the instructions were
repeated through headphones, followed by one practice chord progression.
After this, in each of the 40 chord progressions, the participants’ task was to
listen very carefully to triads number 3–6. They were asked to write down to the
paper, which of these four triads sounded “most out of tune, mistuned, false.”
The 40 triadic progressions were performed twice. The duration of each chord
progression was 12 seconds. It took approximately 35 seconds to play one triadic
progression twice with necessary rests. Between chord progressions (performed
twice), the number of the next sample was announced spoken. The CD performed
in the experiment had a duration of approximately 24 minutes. With auditory
instructions given by the researcher, the total duration of the experiment was
approximately 30 minutes. Instructions for the youngest participants took, of
course, some more time. All the experiments were executed during the one school
lesson (45 minutes) scheduled for the pupils at music class in comprehensive school,
primary education (third, fourth, fifth, and sixth grades).
3.2.5 Data analysis
The basis of statistical data processing in the confidence interval for M was
(p = 0.05, CI = 95%). However, there were comparisons of several sum variables.
Because of this, Bonferroni corrections were calculated so that the CI was 98.3%

125
for three variables and 99.5% for four variables, resulting in a 95% confidence level
over all comparisons. The differences in recognition of mistuning between
Categories 1, 2, and 3 in relationship with descriptive values were tested
(CI = 98.3%, bootstrap).
The bootstrap method is sampling with replacement, and it gives simulated
data of the original size. The same observation can appear several times in
simulated data. Bootstrapping calculates the value of every bootstrap sample
separately (Davison & Hinkley, 1997, p. 507).
Most of the multidimensional analyses with background variables were done
using both parametric and nonparametric tests, because the frequency distributions
were both normally and non-normally distributed. The reliabilities of mistuning
misattributions to a minor triad and major triad in three categories were quite low,
and this is the reason for giving up reporting results from those three categories of
misattributions. We performed a series of EFAs, starting with a tethracoric
correlation matrix to examine the undedlying factorial structure of the variables
corresponding to test items. Factor analysis was, therefore, part of the validity
evaluation. Based on the results of EFAs, we created three sum variables that were
used as dependent variables at the end of the experiment in Sub-chapter 3.4.1. As
all the variables corresponding to the test items were binary, we used tetrachoric
correlation matrices as starting points for each EFA. The tetrachoric correlation is,
essentially, an estimate of the product–moment correlation that would have been
obtained with the underlying continuous variables if their joint distribution was
bivariate normal (see Lorenzo-Seva & Ferrando, 2012).
The one-way ANOVA (with Bonferroni post hoc test, when necessary) test was
used with the instrument group variable and choir voice variable. Also, the
nonparametric Kruskal–Wallis test was used with the instrument group variable
and choir voice variable: Pairwise comparisons were done using the Dunn test. The
analyses with gender variables were done using the independent samples t test and
nonparametric Mann–Whitney U test.
The analyses with instrumental experience variable and age variable were done
using the regression analysis with the supposition that all connections will not
necessarily come out. Correlations between dependent variables and instrumental
experience variable and age variable were done using the nonparametric
Spearman’s ρ because of non-normal distributions.
The validity analyses were conducted through factor analysis with the
maximum likelihood and varimax methods. The reliability analyses were
conducted using Cronbach’s α.

126
3.3 Results
The results of Experiment 1 are introduced detailly in the following sub-chapters.
Recognition of mistuning, on the whole, is presented in Sub-chapter 3.3.1. The
location of the mistuned triad is handled in Sub-chapter 3.3.2. Mistuning
misattributions are in focus in Sub-chapter 3.3.3. The influence of background
variables includes in Sub-chapter 3.3.4. Finally, Sub-chapter 3.3.5 includes music-
analytical observations.
3.3.1 Recognition of mistuning throughout the complete data set
and in categories
As already explained, this experiment used 40 chord progressions that all included
one triad mistuned by the syntonic comma. As seen in Fig. 16, the number of
correctly recognized mistuned chords (SC_All) varied from 8 to 35 (M = 22.97,
SD = 5.78, median = 24). The distribution did not obey the normal distribution
according to the Kolmogorov–Smirnov test [K–S(154) = .103, p < .001] and
Shapiro–Wilk [S–W(154) = .98, p < .05] and it was slightly skewned to the left
(skewness = −.26, C.R. = −1.35). Kurtosis (−.63, C.R. = −1.63) was clearly
negative.
Out of the 166 participants in this experiment, 12 participants had at least one
missing response and were discarded from the analysis. The results were analyzed
for the remaining 154 participants who both completed the background information
and responded to all 40 chord progressions in the main experiment. The number of
participants changed between the individual categories.

127
Fig. 16. The distribution of correct recognitions of mistuning in Experiment 1.
Horizontal axis = correct responses. Vertical axis = number of participants.
Category 1 (ii triad between triads representing I and iii)
The participants succeeded best in Category 1, with three of them even responding
correctly for all of the 16 chord progressions seen in Fig. 17. The observed
frequencies nevertheless ranged between 4 and 16, and the median was 11
(M = 10.68, SD = 2.84). The distribution had a clearly negative kurtosis (= −.79,
C.R. = −2.04), which can be regarded as significantly different from 0 (C.R. <
−1.96). The distribution did not obey the normal distribution [K–S(155) = .10, p
< .01] and [S–W(155) = .97, p < .01] and it was a bit skewed to left
(skewness = −.20, C.R. = −1.04). There was a sort of bump in the distribution at 14
correct identifications (20 participants). The range of recognition was 12 (4–16).
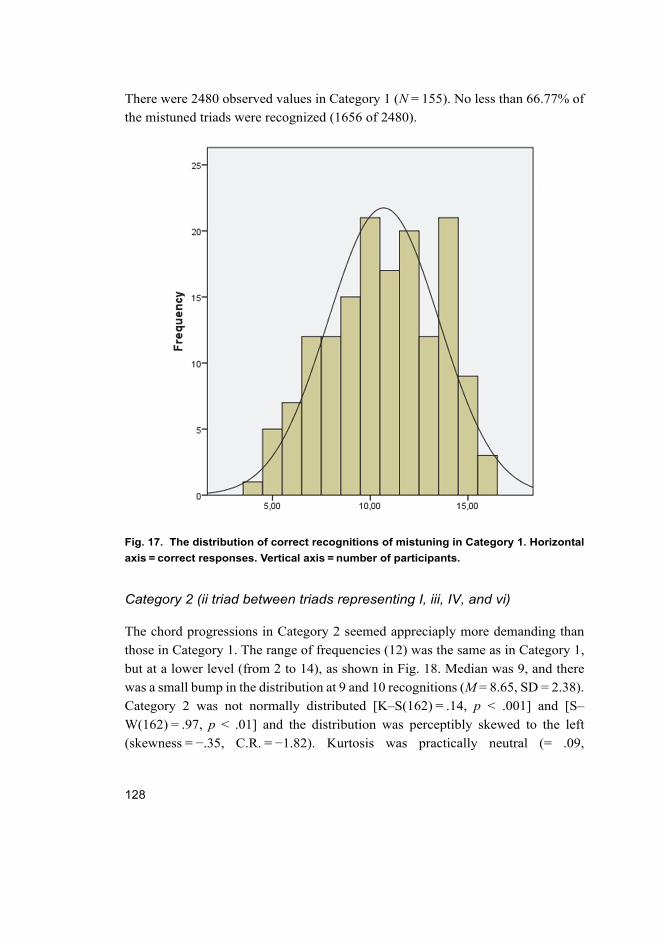
128
There were 2480 observed values in Category 1 (N = 155). No less than 66.77% of
the mistuned triads were recognized (1656 of 2480).
Fig. 17. The distribution of correct recognitions of mistuning in Category 1. Horizontal
axis = correct responses. Vertical axis = number of participants.
Category 2 (ii triad between triads representing I, iii, IV, and vi)
The chord progressions in Category 2 seemed appreciaply more demanding than
those in Category 1. The range of frequencies (12) was the same as in Category 1,
but at a lower level (from 2 to 14), as shown in Fig. 18. Median was 9, and there
was a small bump in the distribution at 9 and 10 recognitions (M = 8.65, SD = 2.38).
Category 2 was not normally distributed [K–S(162) = .14, p < .001] and [S–
W(162) = .97, p < .01] and the distribution was perceptibly skewed to the left
(skewness = −.35, C.R. = −1.82). Kurtosis was practically neutral (= .09,

129
C.R. = .02). There were 2592 observed values in Category 2 (N=162). The
participants recognized 54.1% of mistuned triads (1402 of 2592).
Fig. 18. The distribution of correct recognitions of mistuning in Category 2. Horizontal
axis = correct responses. Vertical axis = number of participants.
Category 3 (modal alterations, ii triad between triads representing I and iii)
The third category was the most demanding part of the experiment (see Fig. 19).
The range of correct responses was as wide as it could be (0–8), but the distribution
is clearly skewed to the right (skewness = .40, C.R. = 2.09) which differs
significantly from 0 (C.R. > 1.96). Normality tests [K–S(165) = .15, p < .001] and
[S–W(165) = .95, p < .001] confirm this. The distribution had a notable value of
kurtosis (−.62, C.R. = −1.66). There was a bump at 2, and the median remaining
quite low, 3 (M = 3.41, SD = 1.96). There were 1320 observed values in Category

130
3 (N = 165). The participants recognized 42.6% of mistuned triads (562 of 1320).
The range of recognition was as wide as it can be: 0–8.
It is presumable that modally altered chords (the III and VI triads) have been
experienced as mistuned, although they were purely intonated. This issue is viewed
later on in Sub-chapter 3.3.5.
Fig. 19. The distribution of correct recognitions of mistuning in Category 3. Horizontal
axis = correct responses. Vertical axis = number of participants.
Differences between categories in recognition of mistuning
As explained earlier, the categories were generated on the basis of music theory
considerations. Category 1 included the mistuned ii triad between triads
representing I and iii degrees. Category 2 included the mistuned ii triad between
triads representing I, iii, IV, and vi. Category 3 included modal alterations, and the
mistuned ii triad was performed between triads representing I and iii. The

131
complexity of musical texture grows from Category 1 through Category 2 to
Category 3. These three categories seem to have produced different results in
recognition of mistuning. The growing complexity seemed to complicate the
recognition of the target.
As remembered, there were 16 chord progressions in Category 1, 16 chord
progressions in Category 2, and 8 chord progressions in Category 3. Because there
were only 8 chord progressions in Category 3, linear transformation from 8 to 16
had to be done. It was calculated by the following formula: y = 2x. The sum variable
used in this context was simply created by multiplying the frequencies of Category
3 by 2. Table 19 shows the differences between categories concerning means,
medians, and confidence intervals of means and medians (N = 154).
Table 19. Values and confidence interval of means and median of mistuning recognition
in Categories 1, 2, and 3.
Variables M 1
Max
16.00
Confidence intervals of
means:
CI2 = 98.3% (bootstrap)
Mdn3 Confidence intervals of
medians:
CI = 98.3% (bootstrap)
SD4 Confidence intervals of
standard deviations:
CI = 98.3% (bootstrap)
lower upper lower upper lower upper
CAT1 10.69 10.16 11.23 11.00 10.00 12.00 2.85 2.55 3.15
CAT2 8.79 8.34 9.22 9.00 9.00 9.00 2.27 1.95 2.58
CAT3 6.99 6.18 7.74 6.00 6.00 8.00 3.97 3.51 4.40
1 M = mean, 2 CI = confidence interval, 3 Mdn = median, 4 SD = standard deviation
These findings confirmed the differences between the three categories. The
confidence intervals of means and medians of separate categories did not overlap.
It can be claimed (with a grain of salt) that the locations of the distributions were
distinct. Concerning the confidence intervals of SD, Category 1 and 2 barely
overlap, but Category 3 was clearly different.
Category 2 split into two sets
There were 10 chord progressions that included syntonic commas in melodic
movements in addition to the mistuned ii triad. These chord progressions have been
introduced in Sub-chapter 3.2.2. All of these chord progressions belonged to
Category 2. The observed frequencies ranged between 1 and 10, and the median
was 6 (M = 5.91, SD = 1.90). The distribution was clearly skewed to the left
(skewness = −.43, C.R. = −2.23) which can be regarded as significantly different
from 0 (C.R. < −1.96). So, because of skewness, the distribution did not obey the

132
normal distribution [K–S(162) = .16, p < .001] and [S–W(162) = .96, p < .001].
There were 1620 observed values in this area (N = 162) and the listeners recognized
958 of them (59.1%). Kurtosis was close to neutral (−.13, C.R. = −0.33). As
mentioned earlier, the participants recognized a total of 54.1% of mistuned triads
(1402 of 2592) in Category 2.
In comparison, there were six chord progressions that did not include a
syntonic comma in melodic movements. The observed values ranged from 0 to 5
(from a total of six) (M = 2.74, median = 2.91, SD = 1.11). The participants
recognized 452 of the total 972 observed values (46.50%). The distribution did not
obey the normal distribution according to the Kolmogorov–Smirnov test [K–
S(165) = .17, p < .001] and Shapiro–Wilk [S–W(165) = .93, p < .001] and it was
slightly skewed to left (skewness = .10, C.R. = 0.55). Kurtosis (−.36, C.R. = −.033)
was perceptibly negative.
Thus, Category 2 was split into two, and the following results are actually
presented in four categories. It is very important to remember that the participants
were asked to listen to harmonic mistuning in one triad of four possible.
Differences between four categories (Category 2 split in two)
Because of the differences between chord progressions (A syntonic comma in
melodic movements in category and chord progressions without melodic commas
in Category 2, the next analysis was done between four sum variables: A) Category
1, B) chord progressions (a syntonic comma in melodic movements in Category 2,
C) chord progressions without melodic commas in Category 2, and D) Category 3
in recognition of mistuning.
The difference between B) chord progressions (A a syntonic comma in melodic
movements in Category 2), and C) chord progressions without melodic commas in
Category 2) was so clear that it was justifiable to compare these two groups with
Category 1 and Category 3. To make this happen, it was necessary to create linear
transformations to sum variables of B, C, and D groups (16 chord progressions for
each). Mistuning recognition between these four groups in relationship with
descriptive values was tested (CI = 98.3%, bootstrap). The values are gathered in
Table 20 (N = 154).

133
Table 20. Values and confidence intervals of means and median for mistuning
recognition in four categories (Category 2 split in two).
Variables M 1
Max
16.00
Confidence intervals
of means:
CI2 = 99.2%
(bootstrap)
Mdn3 Confidence intervals
of medians:
CI = 99.2%
(bootstrap)
SD4 Confindence intervals of
standard deviations:
CI = 99.2% (bootstrap)
lower upper lower upper lower upper
CAT1 10.69 10.07 11.29 11.00 10.00 12.00 2.85 2.53 3.19
CAT2 mel. 9.64 9.02 10.28 9.60 9.60 11.20 2.89 2.45 3.34
CAT2 no mel. 7.34 6.77 7.98 8.00 5.33 8.00 2.94 2.51 3.33
CAT3 6.99 6.04 7.81 6.00 6.00 8.00 3.97 3.46 4.44
1 M = mean, 2 CI = confidence interval, 3 Mdn = median, 4 SD = standard deviation
Mistuning was detected best in A) Category 1. The set B (melodic commas) was
rather close to set A. In the set of chord progressions without melodic commas (C),
mistuning was recognized as essentially worse. The worst result occurred in
Category 3 (D), which was practically equal to Group C.
The confidence intervals of means and medians did not overlap between
Category 1 and Category 2 (no melodic commas), between two groups of Category
2, between Category 2 (melodic commas), and Category 3. The confidence
intervals of SD did not overlap between Category 2 (melodic commas) and
Category 3. As an unavoidable consequence of these results, the values did not
overlap between Category 1 and 3, either. It can even be claimed that the locations
of the distributions were distinct.
3.3.2 Locations of the mistuned triad
Mistuning recognition between the four locations in relationship with descriptive
values was tested (CI = 99.2%, bootstrap). The values are gathered in Table 21
(N = 154).

134
Table 21. Values and confidence intervals of means and medians with recognition of
mistuning in separate locations of the mistuned triad.
Variables M 1
Max
10.00
Confidence interval of
means:
CI2 = 99.2% (bootstrap)
Mdn3 Confidence interval of
medians:
CI = 99.2% (bootstrap)
SD4 Confidence intervals of
standard deviations:
CI = 99.2% (bootstrap)
lower upper lower upper lower upper
Loc. 1 5.82 5.32 6.30 6.00 5.00 7.00 2.36 2.06 2.64
Loc. 2 5.32 4.90 5.72 5.00 5.00 6.00 1.95 1.70 2.20
Loc. 3 6.11 5.83 6.43 6.00 6.00 7.00 1.36 1.14 1.56
Loc. 4 5.72 5.31 6.11 6.00 5.00 6.00 1.88 1.60 2.14
1 M = mean, 2 CI = confidence interval, 3 Mdn = median, 4 SD = standard deviation
When the mistuned triad was in Location 3, it was detected best. Location 1 and
Location 4 were practically equal. Both locations were not far away from Location
3. Location 2 was clearly the worst for recognizing mistuning. There was an
essential difference only between Locations 2 and 3 according to confidence
interval analysis (bootstrap). The confidence intervals of means and SDs did not
overlap between Location 2 and Location 3. It can be claimed that the locations of
the distributions were distinct. In addition, the confidence interval of SDs did not
overlap between Locations 3 and 4.
The explanation for this phenomenon is difficult to find. One possible
explanation for these differences is accented tones. The tones in Locations 1 and 3
are in principle accented tones of chord progression. These findings do not give a
reason to report further results by location.
3.3.3 Mistuning misattributions to a minor and major triad
The experiment was constructed so that participants had to choose between one of
four alternatives. If they did not recognize the mistuned triad (the triad with the
syntonic comma), there would only be pure minor triads and pure major triads left.
One might therefore ask how often the participants might have misattributed
mistuning to minor triads and how often to major triads. Misattributions to a minor
triad are more understandable because the intervals of a pure major triad come from
harmonic spectra. Mistuning was misattributed to a minor triad in 18.85% of cases
(1161 of 6160) (M = 7.54), and to a major triad in 23.73% of cases (1462 of 6160)
(M = 9.49). However, these values are not comparable: besides the mistuned
second-degree triad, there were more major triads (79) than minor triads (43) as
potential receivers of the misattribution. Indeed, there were 10 chord progressions

135
without any minor triad and one chord progression without any major triad. There
were only 29 experiment items where all alternatives (syntonic comma, minor triad,
major triad) were available. Hence, it is with reference to these 29 cases that the
question concerning misattributions to major and minor may be more relevantly
raised. However, there are only four triads to be listened to, one of them being the
mistuned target. There are either two minor triads and one major triad or two major
triads and one minor triad. The number of minor triads was 39, and the number of
major triads was 48. So, it is necessary to react very critically to the results of
misattributing to a minor and to a major triad.
Mistunings were misattributed most often to minor triads, although there were
39 minor triads against 48 major triads in 29 experiment items (N = 156). The
distribution of frequencies is seen in Fig. 20. Misattributions to a minor triad were
not normally distributed [K–S(156) = .1, p < .001] and [S–W(156) = .98, p < .05]
with the range of 1–14. There was a bumb in distribution of eight misattributions
(M = 7.17, SD =2 .62, median = 7, Mode = 8). The distribution was minimally
skewed to the right (skewness = .08, C.R. = .40) while kurtosis was negative (=
−.38, C.R. = −.99).

136
Fig. 20. The distribution of frequencies mistuning that was misattributed to minor triad
in 29 experiment items. Horizontal axis = correct responses. Vertical axis = number of
participants.
There were 48 major triads in 29 experiment items. The distribution of frequencies
of mistuning was misattributed to a major triad is clearly skewed to the right
(skewness = .95, C.R. = 4.91) which differs significantly from 0 (C.R. > 1.96). So,
it was not normally distributed [K–S(156) = .14, p < .001] and [S–W(156) = .94, p
< .001]. Also kurtosis (= 1.01, C.R. = 2.82) was significantly different from 0 (C.R. >
1.96). There were two participants who never misattributed mistuning to a major
triad. Nine participants misattributed once (N = 156). 51.3% of participants
misattributed mistuning to a major triad 2–5 times of total 29 experiment items.
Two outliers misattributed mistuning to a major triad as many as 17 times. The
range was broad: 0–17 (M = 5.47, SD = 3.23, median = 5, Mode = 3). The
distribution of frequencies is seen in Fig. 21.

137
Fig. 21. The distribution of frequencies mistuning was misattributed to major triad in 29
experiment items. Horizontal axis = correct responses. Vertical axis = number of
participants.
Mistuning was misattributed to a minor triad almost three times more often than to
a major triad in Category 1. In Category 2, the difference is much smaller (3.72 and
2.04). A remarkable change comes in Category 3: Mistuning misattributions to a
major triad is six times more frequent than to a minor triad. None of the
distributions in these six cases were normally distributed according to the
Kolmogorov–Smirnov test and Shapiro–Wilk test (for all, p < .001). The values of
test statistics and degrees of freedom were gathered into the table, which is seen in
Table 42 in Appendix 9 (The normality tests of mistuning misattributions to a minor
triad and major triad in three categories in Experiment 1).

138
The differences between categories in mistuning misattributions to a minor
triad and major triad
Mistuning was misattributed to a minor triad in 24.73% of cases (1,119 of 4,524)
(M = 7.17), and to a major triad in 18.88% of cases (854 of 4,524) (M = 5.47).
There were 12 experiment items in Category 1, 12 experiment items in
Category 2, and five experiment items in Category 3 in the data set (29 experiment
items). This condensed data set makes it possible to find out if there were
differences between categories in misattributions to a minor triad and to a major
triad. To make this happen, it was necessary to create a linear transformation to sum
variables of mistuning misattributions to a minor triad in Category 3 and mistuning
misattributions to a major triad in Category 3 to get 12 chord progressions also for
Category 3.
The differences in mistuning misattributions to a minor triad between Category
1, 2, and 3 in relationship with descriptive values were tested (CI = 98.3%,
bootstrap). The values are gathered in Table 22 (N = 156).
Table 22. Values and confidence interval of means and medians in mistuning
misattributions to a minor triad in Categories 1, 2, and 3.
Variables M 1
Max
12.00
Confidence intervals of means:
CI2 = 98.3% (bootstrap)
Mdn3 Confidence intervals of medians:
CI = 98.3% (bootstrap)
SD4
lower upper lower upper
CAT1 2.98 2.67 3.30 3.00 3.00 4.00 1.66
CAT2 3.72 3.42 4.01 4.00 3.00 4.00 1.59
CAT3 1.14 .89 1.43 .00 .00 2.40 1.45
1 M = mean, 2 CI = confidence interval, 3 Mdn = median, 4 SD = standard deviation
The confidence intervals of means did not overlap between Category 1 and 2,
between 2 and 3, and between 1 and 3. The confidence intervals of medians did not
overlap between 1 and 3 and between 2 and 3. It can be claimed that the locations
of the distributions were distinct.
Similarly, the differences in mistuning misattributions to a major triad in
between Category 1, 2, and 3 in relationship with descriptive values were tested
(CI = 98.3%, bootstrap). The values are gathered to Table 23 (N = 156).

139
Table 23. Values and confidence interval of means and median for mistuning
misattributions to a major triad in Categories 1, 2, and 3.
Variables M 1
Max
12.00
Confidence intervals of means:
CI2 = 98.3% (bootstrap)
Mdn3 Confidence intervals of medians:
CI = 98.3% (bootstrap)
SD4
lower upper lower upper
CAT1 1.10 .85 1.38 1.00 .00 1.00 1.42
CAT2 1.99 1.76 2.24 2.00 2.00 2.00 1.28
CAT3 5.71 5.12 6.35 4.80 4.80 7.20 3.33
1 M = mean, 2 CI = confidence interval, 3 Mdn = median, 4 SD = standard deviation
Concerning mistuning misattributions to a major triad, the confidence intervals of
means and medians did not overlap between Category 1 and 2, between 2 and 3,
and between 1 and 3. It can quite securely be claimed that the locations of the
distributions were distinct. Category 3 is a special one; misattributions to a major
triad differed clearly from other categories: Modally altered, but vertically pure
major triads have likely mislead several participants.
3.3.4 Background variables
As remembered, there were some background variables in this experiment. Those
variables were the instrument group, choir voice, and the duration of playing the
main instrument. In addition, there were age and gender as stabilized variables.
Recognition of mistuning by instrument groups, choir voices, and gender
Recognition of mistuning by instrument group is presented in Table 24.
Table 24. Recognition of mistuning, by instrument groups.
Instrument
group
Data set:
40 trials
N = 153
CAT1
16 trials
N = 154
CAT2
16 trials
N = 161
CAT3
8 trials
N = 164
Mel. commas (CAT2):
10 trials
N = 161
M 1 SD2 M SD M SD M SD M SD
String 23.59 5.55 11.17 3.01 8.75 1.89 3.25 1.75 5.83 1.79
Woodwind 22.74 5.42 10.58 2.60 8.50 2.26 3.41 1.93 5.88 1.68
Brass 20.94 6.80 9.49 2.65 7.94 3.21 2.94 2.13 5.35 2.64
Piano etc. 23.44 5.70 10.47 2.79 8.96 2.23 3.72 2.18 6.27 1.84
1 M = mean, 2 SD = standard deviation

140
Because of both normal and non-normal distributions (the values are shown in
Table 43, Appendix 10), the analysis was carried out both with one-way ANOVA
and nonparametric Kruskal–Wallis test. There were no significant differences
between how well participants representing different instrument groups succeeded
in recognizing the target. This was true in the whole data set and separately for each
of the stimulus Categories 1–3 and within the melodic commas group (for all,
p > .05).
The participants were asked which of the following voice they sing in choirs:
top voice (which often sings the melody line), middle voice or bass voice of choir
texture. Mistuning recognition by choir voices is presented in Table 25.
Table 25. Mistuning recognition, by choir voices.
Choir
voices
Data set:
40 trials
N = 152
CAT1
16 trials
N = 153
CAT2
16 trials
N = 160
CAT3
8 trials
N = 163
Mel. commas (CAT2)
10 trials
N = 160
M 1 SD2 M SD M SD M SD M SD
Top
voice
21.52 6.05 10.21 2.96 8.18 2.44 3.13 2.08 5.42 2.04
Middle
voice
23.47 5.59 10.95 2.98 8.89 2.08 3.63 1.90 6.05 1.85
Bass
voice
24.15 5.49 10.92 2.53 9.46 2.16 3.77 1.98 6.38 1.67
1 M = mean, 2 SD = standard deviation
Because of both normal and non-normal distributions (the values are shown in
Table 44, Appendix 11), the multidimensional analysis was carried out both with
one-way ANOVA and nonparametric Kruskal–Wallis test.
There were no statistically significant differences between choir voices in
recognition of mistuning (ANOVA) and in Category 1 and Category 3, either. This
result was also confirmed with the Kruskal–Wallis test (for all, p > .05). However,
in Category 2, ANOVA showed a statistically significant difference [F (2,
157) = 4.85, p < .01] between choir voices, which was also confirmed by a Kruskal–
Wallis test [χ2 (2) = 7.60, p < .05]. Further analyses revealed that bass voice singers
scored higher than top voice singers in recognition of mistuning (z = −2.70, p < .01).
In the set of melodic commas, there was a statistically significant difference
between top voice singers and bass voice singers according to ANOVA [F (2,
157) = 3.36, p < .05]. The same difference was seen in the Kruskal–Wallis test [χ2
(2) = 6.32, p < .05]. Further analyses revealed that bass voice singers scored higher

141
than top voice singers in recognition of mistuning (z =−2.37, p < .05). Recognition
of mistuning by gender is presented in Table 26.
Table 26. Recognition of mistuning, by gender.
Gender Data set:
40 trials
N = 154
CAT1
16 trials
N = 155
CAT2
16 trials
N = 162
CAT3
8 trials
N = 165
Mel. commas
(CAT2)
10 trials
N = 162
M 1 SD2 M SD M SD M SD M SD
Male 22.14 6.10 10.29 2.74 8.67 2.62 3.18 2.01 5.50 2.25
Female 23.38 5.60 10.88 2.90 8.84 2.09 3.65 1.96 6.12 1.67
1 M = mean, 2 SD = standard deviation
Because of dispersion of both normal and non-normal distributions (the values are
shown in Table 45, Appendix 12), the analysis was carried out using both the
independent samples t test and the nonparametric Mann–Whitney U test. According
to the independent samples t-test, there were no statistically significant differences
between male and female participants in recognition of the mistuning. There were
also no significant differences in Categories 1 and 3 (for all, p > .05). Interestingly,
there was a significant difference between male and female participants in Category
2 [t(160) = −1.01, p < .01]. According to the Mann–Whitney U test, there were no
statistically significant differences between male and female listeners in
recognition of mistuning, nor in separate categories (for all, p > .05). Therefore, it
cannot be said reliably that there were differences by gender.
Following the result of Category 2, there was a significant difference between
male and female participants in the set of melodic commas [t(160) = −1.98, p < .01]
according to independent samples t test. The mann–Whitney U test did not confirm
this result (p > .05). Hence, it cannot be said reliably that there were differences by
gender.
Mistuning misattributions to a minor triad and major triad by instrument
groups, choir voices and gender (data set: 29 experiment items)
Mistuning misattributions to a minor triad and major triad by instrument group,
choir voices, and gender are presented in Table 27.

142
Table 27. Mistuning misattributions to a minor or major triad, by instrument, choir voice,
and gender.
Instrument group by
Choir voice and by
Gender
Mistuning misattributions to a
minor triad, data set: 29 trials
M 1
SD2 Mistuning misattributions to a
major triad, data set: 29 trials
M
SD
Instrument (N = 155)
String
Woodwind
Brass
Piano etc.
6.82
7.16
8.24
7.14
2.53
2.58
2.84
2.64
5.50
5.55
6.53
4.88
3.32
3.05
3.87
2.86
Choir voice (N = 154)
Top voice
Middle voice
Bass voice
7.61
6.80
7.15
2.47
2.60
2.86
6.07
5.53
4.64
3.47
3.42
2.42
Gender (N = 156)
Male
Female
7.62
6.94
2.47
2.67
6.04
5.18
3.76
2.90
1 M = mean, 2 SD = standard deviation
Because of both normal and non-normal distributions concerning mistuning
misattributions to a minor triad and major triad by instrument groups and choir
voices, the multidimensional analysis was carried out both with one-way ANOVA
and nonparametric Kruskal–Wallis test.
There were no statistically significant differences between instrument groups
in mistuning misattributions to a minor triad (ANOVA) (p > .05). There were no
statistically significant differences between instrument groups in mistuning
misattributions to a major triad, either. Both results were also true according to the
Kruskal–Wallis test (for all, p > .05).
There were no statistically significant differences between choir voices in
mistuning misattributions to a minor triad (ANOVA). There was the same situation
with major triads. The Kruskal–Wallis test confirmed these results (for all, p > .05).
When it comes to misattributions to a minor triad and major triad by gender, a
dispersion of both normal and non-normal distributions was found. The analysis
was carried out using both the independent samples t test and the nonparametric
Mann–Whitney U test.
According to the independent samples t test, there were no statistically
significant differences between male and female participants in mistuning
misattributions to a minor triad or in Category 2 and 3. However, in Category 1,
there was a significant difference [t(156) = 1.29, p < .05]. According to the Mann–

143
Whitney U test, there were no statistically significant differences between male and
female listeners in mistuning misattributions to a minor triad, nor in separate
categories (for all, p > .05). Thus, it cannot be said reliably that there were
differences between male and female participants.
Concerning the misattributions to a major triad, the independent samples t-test
showed no statistically significant differences, nor in Category 1 and 3. In the case
of Category 2, there was a significant difference [t(161) = 1.27, p < .05] between
male and female participants. According to the Mann–Whitney U test, there were
no statistically significant differences between male and female listeners in
mistuning misattributions to a major triad, nor in separate categories (all p > .05).
In conclusion, it cannot be said reliably that there were differences between male
and female participants.
Recognition of mistuning (instrumental experience and age as
independent variables)
Several connections were found between recognition of mistuning and instrumental
experience and age. The results of the regression analysis are presented in the
following. The majority of distributions of recognition of mistuning by
instrumental experience and age were normally distributed. Because of some non-
normal distributions, the results are acceptable with certain reservations. It is
possible that all connections between variables did not appear in these analyses.
Instrumental experience variable and age variable are suitable variables for
regression analysis. At first, recognition of mistuning variable (all recognitions of
mistuning in the whole test, 40 experiment items) was set as a dependent variable.
Instrumental experience variable and age variable were set as independent
variables.
A simple linear regression was calculated to predict participants’ recognition
of mistuning based on instrumental experience and age. Instrumental experience
and age together explained 29.3% of recognition of mistuning, which can be
regarded as notable [F(2, 146) = 30.30, p < .001] . When age increased by one year,
recognition of mistuning increased by 0.46 unit element (p < .01). When
instrumental experience increased by one year, recognition of mistuning increased
by 0.36 unit element (p < .05). Both connections were relatively strong. To put in
formula:

144
Recognition of mistuning = 14.446 + 0.458 × age + 0.355 × instrumental experience
Recognition of mistuning = Recognitions of mistuning in the whole test (40 experiment items)
When recognition of mistuning in Category 1 variable was set as a dependent
variable in regression analysis, instrumental experience and age together explained
14.9% of recognitions of mistuning in Category 1, which can be regarded as
perceptible [F(2, 147) = 12.84, p < .001]. There were no statistically significant
connections between recognition of mistuning and instrumental experience and age
in Category 1 (both p > .05).
When recognition of mistuning in Category 2 variable was set as a dependent
variable, instrumental experience and age together explained 20.7% of recognitions
of mistuning in Category 2, which can be regarded as notable [F(2, 154) = 20.08, p
< .001]. When age increased by one year, recognition of mistuning increased by
0.16 unit element (p < .05). The connection between recognition of mistuning and
instrumental experience was not statistically significant in Category 2 (p > .05).
In the case of recognition of mistuning in Category 3 variable as a dependent
variable, instrumental experience and age together explained 24.7% of recognitions
of mistuning in Category 3 which can also be regarded as notable [F(2,
157) = 25.78, p < .001]. When age in Category 3 increased by one year, recognition
of mistuning increased by 0.18 unit element (p < .001). The connection between
recognition of mistuning and instrumental experience was not statistically
significant in Category 3 (p > .05). To put in formula:
Recognition of mistuning in Category 1 = 7.828 + 0.145 × age + 0.141 × instrumental experience
Recognition of mistuning in Category 2 = 5.706 + 0.160 × age + 0.125 × instrumental experience
Recognition of mistuning in Category 3 = 0.414 + 0.184 × age + 0.073 × instrumental experience
When recognition of mistuning in melodic commas variable was set as a dependent
variable, instrumental experience and age together explained 23.4% of recognitions
of mistuning with this variable, which can be regarded as notable [F(2, 154) = 23.55,
p < .001]. When age increased by one year, recognition of mistuning increased by
0.12 unit element (p < .05). When instrumental experience increased by one year,
recognition of mistuning increased by 0.12 unit element (p < .05). To put in formula:

145
Mistuning recognition in melodic commas = 3.502 + 0.121 × age + 0.123 × instrumental experience
Mistuning misattributions to a minor triad and major triad (instrumental
experience and age as independent variables) (Data set: 29 Experiment
items)
With regression analysis, mistuning misattributions to a minor triad was set as a
dependent variable. Instrumental experience and age together explained 15.4% of
mistuning misattributions to a minor triad, which can be regarded as notable [F(2,
148) = 13.48, p < .001]. When age increased by one year, misattributions to a minor
triad decreased by 0.20 unit element (p < .01). The connection between mistuning
misattributions to a minor triad and instrumental experience was not statistically
significant (p > .05). To put in formula:
Mistuning misattributions to a minor triad = 10.369 – 0.202 × age – 0.063 × instrumental experience
(Mistuning misattributions to a minor triad = Mistuning misattributions to a minor triad in data set: 29 items)
With regression analysis, mistuning misattributions to a major triad was set as a
dependent variable. Instrumental experience and age together explained 24.4% of
mistuning misattributions to a major triad, which can be regarded as notable [F(2,
148) = 23.83, p < .001]. When age increased by one year, mistuning misattributions
to a major triad decreased by 0.20 unit element (p < .05). When instrumental
experience increased by one year, mistuning misattributions to a major triad
decreased by 0.22 unit element (p < .05). So, the older and more experienced the
participant was, the less he or she misattributed mistuning to a major triad. There
was the same phenomenon with misattributions to a minor triad. This, of course,
makes sense, because mistuning recognition was clearly connected to the accession
of instrumental experience and age. To put in formula:
Mistuning misattributions to a major triad = 9.561 – 0.196 × age – 0.224 × instrumental experience
(Mistuning misattributions to a major triad = Mistuning misattributions to a major triad in data set: 29 items)

146
Correlations between recognition of mistuning and instrumental
experience and age
It seemed reasonable to clarify whether there occurred a correlation between
detected mistuning and instrumental experience and detected mistuning and age.
As remembered, none of the frequency distributions of recognition of mistuning in
the whole data set nor in Category 1, 2, and 3 were normally distributed. Because
of this, the analysis of correlations was carried out with nonparametric Spearman’s
rho correlations. As a result, recognition of mistuning was positively correlated
both with the participants’ age (ρ = .48, p < .001, N = 154) and with their
instrumental experience (ρ = .46, p < .001, N = 149). Age and instrumental
experience were strongly correlated (ρ = .72, p < .001, N = 161).
In Category 1, there was a positive correlation between recognition of
mistuning and instrumental experience (ρ = .34, p < .001, N = 150) as well as
between recognition of mistuning and age (ρ = .34, p < .001, N = 155).
Further, a positive correlation between the recognition of mistuning and
instrumental experience (ρ = .37, p < .001, N = 157) and recognition of mistuning
and age (ρ = .39, p < .001, N = 162) was found also in Category 2.
In addition, the same situation occurred between the recognition of mistuning
and instrumental experience (ρ = .38, p < .001, N = 160) and recognition of
mistuning and age (ρ = .43, p < .001, N = 165) also in Category 3. Finally, the
recognition of mistuning (a syntonic comma in melodic movements) was positively
correlated with the participants’ instrumental experience (ρ = .44, p < .001, N = 157)
and age (ρ = .45, p < .001, N = 162).
Correlations between mistuning misattributions to a minor and major triad
and instrumental experience and age
Further, none of the distributions of mistuning misattributions to a minor triad or
major triad, nor in separate categories, were normally distributed. Because of this,
nonparametric Spearman’s rho correlations were used: There was a negative
correlation between mistuning misattributions to a minor triad and instrumental
experience (ρ = −.28, p < .001, N = 151) and between mistuning misattributions to
a minor triad and age (ρ = −.31, p < .001, N = 156). Also, in Category 1, there was
a negative correlation between mistuning misattributions to a minor triad and
instrumental experience (ρ = −.31, p < .001, N = 153) and between mistuning
misattributions to a minor triad and age (ρ = −.36, p < .001, N = 158). In Category

147
2, the same correlation occurred only between misattributions to a minor triad and
age (ρ = −.16, p < .05, N = 163). The polarity of Category 2 was perhaps seen here.
However, there was no statistically significant correlation between mistuning
misattributions to a minor triad, on the other hand, and either instrumental
experience or age, on the other in Category 3. By contrast, there was a strong
negative correlation between mistuning misattributions to a major triad, on the
other hand, both instrumental experience (ρ = −.43, p < .001, N = 160) and age
(ρ = −.51 p < .001, N = 165), on the other hand in Category 3. The more aged and
instrumentally experienced the participants were, the less misattributed modally
altered major triads in Category 3.
There was a negative correlation between mistuning misattributions to a major
triad and instrumental experience (ρ = −.47, p < .001, N = 151) and between
mistuning misattributions to a major triad and age (ρ = −.49, p < .001, N = 156). As
written in previous lines, the negative correlation was the strongest in Category 3
(ρ = −.43, p < .001, N = 160) between mistuning misattributions to a minor triad
and instrumental experience. In relationship with age, the negative correlation was
even stronger (ρ = −.51, p < .001, N = 165). In Category 2, the corresponding values
were ρ = −.31 (p < .001, N = 158) with instrumental experience and ρ = −.31 (p
< .001, N = 163) with age. In Category 1, the values were ρ = −.37 (p < .001,
N = 153) with instrumental experience and ρ = −.35 (p < .001, N = 158) with age.
All significant correlations between mistuning misattributions to a major triad
and instrumental experience and age were negative. Participants had learned to
detect a pure major triad as a pure triad (as it is) following age and instrumental
experience.
3.3.5 Recognition of mistuning, music analysis observations
The means of recognition of mistuning of single chord progressions are presented
in Table 28. Chord progression 9, representing Category 2, was the most difficult
one for the participants: Here, only 22.4% of listeners recognized the target. Chord
progression 35 from Category 1 was the easiest one: 92.2% recognized the target.
As seen in Table 28, the four chord progressions in which the target was most
reliably recognized share the feature that the target is preceded by the tonic triad.
Another observation is that in these cases, the harmonic progressions preceding the
target are quite traditional. The tonal clarity probably helped listeners to detect the
target.

148
The presentation order of samples in Experiment 1 was the same for all
participants. This could have created an order effect in the results, which can be
considered a methodological limit. To make sure this did not happen, a Pearson
correlation test was conducted. It did not show clear differences in correlations
between first recognitions at the beginning of the experiment nor in correlations
between first and last recognitions. Statistically significant correlations occurred in
correlations across the 40 samples. Correlations between recognitions are presented
in Tables 46, 47, and 48 (see Appendixes 13, 14, and 15).
As can be seen in Table 28, recognition of mistuning succeeded worst in chord
progression 9 (M = 0.22 SD = 0.42). There are parallel octaves between the soprano
voice and bass voice from the previous triad (IV64) to the mistuned ii triad. In
traditional four-part harmony writing, this would be considered as poor voice
leading and, accidentally or not, this time the target was worst recognized. There
are odd chord progressions (VI64-V64-IV64) just before the mistuned second-degree
triad). These untraditional, fuzzy chord movements may perhaps explain the poor
result in recognition of mistuning.
Table 28. Recognition of mistuning, ranked according to the percentage of participants
recognizing the triad out of the complete data set (40 chord progressions).
Trial
number
Category /
progression
1st triad 2nd triad Location of the mistuned triad (ii) Final
triad
Recognition
(%) 1 2 3 4
35 CAT1/6 I vi IV I ii6 iii vi .92
19 CAT1/7 I I6 IV I64 ii64 I64 V .90
21 CAT1/10 I V6 I ii6 iii V I .82
5 CAT1/15 V6 I ii I IV I V .79
20 CAT2/16 I I6 IV V64 IV64 ii iii .79
40 CAT2/14 vi I64 IV6 V6 vi6 ii I .77
11 CAT3/5 I V III I64 ii64 I64 V .77
32 CAT2/10 vi I V6 vi ii64 IV I .77
2 CAT1/9 I vi iii6 ii64 I I6 V .77
33 CAT2/6 I iii vi ii64 IV V iii .76
16 CAT1/3 I iii vi IV I64 ii64 I .73
30 CAT2/4 vi iii ii6 IV V IV I .72
15 CAT1/1 I IV64 I vi iii ii I .71
26 CAT1/5 I IV vi iii ii I V .68
27 CAT2/2 I iii ii64 IV V vi iii .64
29 CAT1/14 vi I ii6 iii vi I64 V .64
23 CAT2/5 I I6 IV ii6 vi64 V I .63
39 CAT2/12 V I V6 IV64 ii64 IV I .61

149
Trial
number
Category /
progression
1st triad 2nd triad Location of the mistuned triad (ii) Final
triad
Recognition
(%) 1 2 3 4
37 CAT1/12 I vi6 iii64 ii64 iii6 vi IV .61
8 CAT2/15 I iii64 vi V6 vi6 ii64 I .60
34 CAT1/16 I iii64 ii64 iii6 vi I64 V .60
12 CAT3/8 I IV VI IV iii6 ii64 I .58
22 CAT1/2 I vi iii V I ii6 iii .58
3 CAT3/1 I iii ii iii IV VI I .56
7 CAT1/8 I V6 I iii ii6 iii6 vi .54
6 CAT2/3 I I6 ii6 vi V vi iii .54
24 CAT1/13 vi iii ii I IV vi iii .49
25 CAT1/11 I IV I6 ii6 I64 V I .42
13 CAT2/1 I I6 ii6 vi V IV I .45
28 CAT3/3 I V6 I ii iii III6 I .40
36 CAT1/4 I V6 I vi iii ii iii .37
18 CAT2/11 I iii V64 vi6 ii vi64 I .31
17 CAT2/7 I iii64 vi ii6 vi64 V64 I .30
14 CAT3/2 I iii64 ii64 I64 III v I .28
10 CAT2/8 IV I6 IV ii IV V iii .28
1 CAT3/6 I IV VI64 I6 ii6 iii6 vi .27
31 CAT3/7 I V64 I6 III I6 ii6 iii .26
38 CAT3/4 vi IV I6 ii6 I64 VI 64 I .26
4 CAT2/9 IV I V6 IV64 ii vi iii .24
9 CAT2/13 I iii vi64 V64 IV64 ii iii .22
In the next following chord progressions, the target was also poorly recognized.
There might be some explanations. We can see an example of modally altered sixth
degree triad in Fig. 22, chord progression 1, CAT3/6 (M = 0.27, SD = 0.45). The
modally altered sixth degree triad has probably fooled many participants.
Fig. 22. Chord progression 1, CAT3/6.

150
In Fig. 23 we can see chord progression 4, CAT2/9 (M = 0.24, SD = 0.43). The
untraditional harmony and the hidden tonic triad (not located in the beginning or at
the end) may have made it difficult to perceive the mistuned target triad.
Fig. 23. Chord progression 4, CAT2/9.
Further, Fig. 24 shows us chord progression 10, CAT2/8. (M = 0.28, SD = 0.45).
The hidden tonic triad /I6 as a second chord) may have caused confusion. It might
be that, for listeners, “odd” chord progressions can complicate the recognition of
mistuning.
Fig. 24. Chord progression 10, CAT2/8.
Chord progression 14, CAT3/2 (M = 0.28, SD = 0.45) is seen in Fig. 25. These are
all fuzzy factors. Three consecutive triads, each of them as a second inversion,
leading to the modally altered third degree triad. In addition, the dominant triad is
altered, too. It is perhaps no wonder the listeners had difficulties finding the
mistuned target triad.

151
Fig. 25. Chord progression 14, CAT3/2.
Chord progression 31, CAT3/7 (M = 0.26, SD = 0.44) is seen in Fig. 26. The
modally altered third degree triad has probably caused confusion.
Fig. 26. Chord progressions 31, CAT3/7.
Finally, Fig. 27 presents us chord progression 38, CAT3/4 (M = 0.26, SD = 0.44).
There are only three triads as a root version. In addition, the modally altered sixth
degree triad as a second inversion has probably caused confusion.
Fig. 27. Chord progression 38, CAT3/4.

152
As remembered from Sub-chapter 3.3.1, mistuning was detected best in A)
Category 1. The set B (melodic commas) was rather close to A. In the set of chord
progressions without melodic commas (C), mistuning was recognized significantly
worse. The worst result occurred in Category 3 (D) which was practically equal
with group C. The Category 1 is ranked according to the percentage of participants
in Table 29.
Table 29. Recognition of mistuning, ranked according to the percentage of participants
recognizing the target, Category 1.
Trial
number
Category 1/No. Location of the target (ii) Recognition
(%) 1st
triad
2nd
triad
1 2 3 4 Final
triad
35 6 I vi IV I ii6 iii vi .92
19 7 I I6 IV I64 ii64 I64 V .90
21 10 I V6 I ii6 iii V I .82
5 15 V6 I ii I IV I V .79
2 9 I vi iii6 ii64 I I6 V .77
16 3 I iii vi IV I64 ii64 I .73
15 1 I IV64 I vi iii ii I .71
26 5 I IV vi iii ii I V .68
29 14 vi I ii6 iii vi I64 V .64
37 12 I vi6 iii64 ii64 iii6 vi IV .61
34 16 I iii64 ii64 iii6 vi I64 V .60
22 2 I vi iii V I ii6 III .58
7 8 I V6 I iii ii6 iii6 vi .54
24 13 vi iii ii I IV vi iii .49
25 11 I IV I6 ii6 I64 V I .42
36 4 I V6 I vi iii ii iii .37
A syntonic comma in melodic lines in Category 2 seemed clearly to influence the
recognition of the target. In two of them (CAT2/8. and CAT2/9). there were two
melodic commas. In both samples another of these melodic commas is related to
the chord changes to the target triad. These two commas did not seem to help
participants to recognize the target as can been seen in the following table. In
Samples 5 and 12 had melodic comma in the chord change of the target triad, too,
but these matters did not seem to affect the recognition of the target. The location
of the melodic comma did not seem to be an essential factor in recognition of the
target. The results of Category 2 are introduced ranked according to the percentage
of participants in Table 30.

153
Table 30. Recognition of mistuning, ranked according to the percentage of participants
recognizing the target, Category 2.
Trial
number
Category
2/No.
1st
triad
2nd
triad
Location of the target (ii) Final
triad
Recognition
(%)
20 16 I I6 IV V64 IV64 ii iii .79
40 14 vi I64 IV6 V6 vi6 ii I .77
32 10 vi I V6 vi ii64 IV I .77
33 6 I iii vi ii64 IV V iii .76
30 4 vi iii ii6 IV V IV I .72
27 2 I iii ii64 IV V vi iii .64
23 5 I I6 IV ii6 vi64 V I .63
39 12 V I V6 IV64 ii64 IV I .61
8 15 I iii64 vi V6 vi6 ii64 I .60
6 3 I I6 ii6 vi V vi iii .54
13 1 I I6 ii6 vi V IV I .45
18 11 I iii V64 vi6 ii vi64 I .31
17 7 I iii64 vi ii6 vi64 V64 I .30
10 8 IV I6 IV ii IV V iii .28
4 9 IV I V6 IV64 ii vi iii .24
9 13 I iii vi64 V64 IV64 ii iii .22
The results of Category 3 are introduced ranked according to the percentage of
participants in Table 31.
Table 31. Recognition of mistuning ranked according to the percentage of participants
recognizing the target, Category 3.
Trial
number
Category 3
/ No.
1st
triad
2nd
triad
Location of the target (ii) Final
triad
Recognition
(%)
11 5 I V III I64 ii64 I64 V .77
12 8 I IV VI IV iii6 ii64 I .58
3 1 I III ii III IV vi I .56
28 3 I V6 I ii iii III6 I .40
14 2 I iii64 ii64 I64 III v I .28
1 6 I IV VI64 I6 ii6 iii6 vi .27
31 7 I V64 I6 III I6 ii6 iii .26
38 4 vi IV I6 ii6 I64 VI 64 I .26

154
3.4 Reliability and validity
In the following sub-chapters introduce us, how the reliability and validity of
Experiment were tested and reported. The validity of Experiment I is reported in
Sub-chapter 3.4.1. The reliability of Experiment 1 is reported in Sub-chapter 3.4.2.
3.4.1 Validity of Experiment 1
The recognition results of the experiment were also subjected to factor analysis.
We used a tetrachoric correlation matrix as a starting point for the analysis.
Extraction method was Maximum likelihood, rotation method used was varimax
(see Table 49 in Appendix 16 for detailed results of the analysis). The idea was to
examine whether there are certain factors influencing the pitch discrimination skill
of the participants in certain chord progressions and whether there is any
relationship between factors and preordained categories. The chord progressions
used in the present study are organized at basis of practical music theory. The
mistuning to be recognized has not been chosen on the grounds of cognitive
neuroscience (e.g., Slater et al., 2018) and it is not assumed that this target triad
used in the present experiment would represent accurately a certain feature of voice
processing functions of human brain. The results of the factor analysis of the
experiment items representing factors as variables are presented in Appendix 16.
All experiment items (with somewhat sufficient loadings) from Category 1 had
high loadings on Factor 1. Each of them had the tonic triad or iii triad surrounding
the target. In fact, all combinations with these chords were introduced in these four
chord progressions which got the highest loadings:
– iii – ii – I
– I – ii – I
– I – ii – iii
– iii – ii – iii
These kind of chord progressions is the basis of Category 1 and the experiment
items representing Factor 1 originates from Category 1. The results of this factor
analysis are gathered in Table 32:
– Trial 26: The previous triad before the target is the iii triad.
– Trial 5: The previous triad before the target is the tonic triad.
– Trials 35, and 36: The next triad after to the target is the iii triad.

155
Table 32. Experiment items representing Factor 1, by factor analysis (rotated factor
matrix), maximum likelihood.
Trial number Category No. Triads Factor
loading
26 CAT1 5 I IV vi iii ii I V .69
5 CAT1 15 V6 I ii I IV I V .50
35 CAT1 6 I vi IV I ii6 iii vi .46
36 CAT1 4 I V6 I vi iii ii iii .39
Interestingly, all experiment items with highest loadings in Factor 2 belonged to
Category 3. The basis of Category 3 was to examine, how pure major triads,
modally altered, influences the participant’s ability to detect the target. The
experiment items representing Factor 2 originates from Category 3. The results of
this factor analysis are gathered in Table 33:
– Trials 3, 14: The triad right before the target is the modally altered third degree
triad (III triad)
– Trials 28, 3: The next triad after to the target is the modally altered third degree
triad (III triad)
– Trials 14 and 38: The next triad after the target is the tonic triad.
Table 33. Experiment items for Factor 2, by factor analysis (rotated factor matrix).
Trial
number
Category No. Triads Factor
loading
28 CAT3 3 I V6 I ii III iii6 I .70
14 CAT3 2 I III64 ii64 I64 iii v I .54
3 CAT3 1 I III ii III IV vi I .47
38 CAT3 4 vi IV I6 ii6 I64 VI 64 I .46
The loadings of experiment items in Factor 3 were originated both from Category
2 and 1. The results of factor analysis by Factor 3 are gathered to the following
Table 34:
– Trials 6, 22, and 16: The triad right before the target is the tonic triad.
– Trial 2: The triad right before the target is the iii triad.
– Trials 2 and 16: The next triad after the target is the tonic triad.

156
Table 34. Experiment items for Factor 3, by factor analysis (rotated factor matrix).
Trial
number
Category No. Triads Factor
loading
6 CAT2 3 I I6 ii6 vi V vi iii .49
22 CAT1 2 I vi iii V I ii6 iii .44
2 CAT1 9 I vi iii6 ii64 I I6 V .38
16 CAT1 3 I iii vi IV I64 ii64 I .38
The only chord progression from Category 2 is Trial 6 (CAT2/3). It does not include
melodic commas like 10 chord progressions in Category 2. The findings of factor
analysis point to the direction that the basis of the Category 1 and the Category 3
were purposefully designed.
Experiment items of Factor 1 (Category 1) and Factor 2 (Category 3) and even
of Factor 3 (Category 2 and 1) included the same chord changes surrounding the
target: The tonic triad and the iii triad. The only exception was Trial 6 (CAT2/3) in
Factor 3: the next triad after the target was the vi triad.
The sum variable representing experiment items of Factor 1 was not normally
distributed [K–S(159) = .23, p < .001] and [S–W(159) = .86 p < .001] and the
distribution was clearly skewed to left (skewness = −.66, C.R. = −3.46) which
differs significantly from 0 (C.R. < −1.96). Kurtosis was negative (−.45,
C.R. = −1.19).
The sum variable representing experiment items of Factor 2 was not normally
distributed, either [K–S(159) = .20, p < .001] and [S–W(159) = .86 p < .001] and
the distribution was clearly skewed to right (skewness = .40, C.R. = 2.29) which
differs significantly from 0 (C.R. > 1.96). Kurtosis was strongly negative (−1.16,
C.R. = 3.02) which also differs significantly from 0 (C.R. > 1.96).
The sum variable representing experiment items of Factor 3 was non-normally
distributed, too [K–S(159) = .20, p < .001] and [S–W(159) = .89 p < .001] and the
distribution was perceptibly skewed to left (skewness = −.42, C.R. = −2.21) which
differs significantly from 0 (C.R. < −1.96). Kurtosis was notably negative (− .67,
C.R. = 1.77).

157
Recognition of mistuning by background variables (Factors 1, 2, and 3 as
dependent variables)
Because of both normal and non-normal distributions, the multidimensional
analysis was carried out both with one-way ANOVA and nonparametric Kruskal–
Wallis test.
According to ANOVA, there were no statistically significant differences
between instrument groups concerning Factor 1 and Factor 2. Kruskal–Wallis test
confirmed these results. Instead, Factor 3 as a dependent variable, there were
statistically significant differences between string instrument players and brass
instrument players according to ANOVA [F(3, 157) = 3.06, .01, p < .05]. Kruskal–
Wallis test did not show multiple comparison because the overall test did not show
significant differences across samples. Hence, it cannot be claimed reliably that
there were differences between instrument groups.
The result mentioned in previous lines differs slightly from the results of the
whole data set (40 chord progressions) and its three categories: As mentioned
earlier, ANOVA and Kruskal–Wallis test showed no significant differences between
how well participants representing different instrument groups succeeded in
recognizing the target. As remembered, the situation was the same separately for
each of the stimulus Categories 1–3 (for all, p > .05).
According to ANOVA, there were no statistically significant differences
between choir voices when there were Factors 1, 2, and 3 as dependent variables.
Kruskal–Wallis test confirmed this result (for all, p > .05).
When compared to the findings of the whole data set (with ANOVA), same
results were found: no statistically significant differences between choir voices in
recognition of mistuning nor in Category 1 and in Category 3, either. These results
were confirmed also by Kruskal–Wallis test (for all, p > .05). As remembered, there
was, however, a statistically significant difference between choir voices in
recognition of mistuning (ANOVA) in Category 2 [F(2, 157) = 4.85, p < .01].
Kruskal–Wallis test also showed this same difference (p < .05). Further analyses
revealed the significant difference between top voice group and bass voice group
(z = −2.70, p < .01). However, Category 2 did not stand out in factors in terms of
choir voices.
What it comes to gender, the analysis was carried out both independent samples
t test and the nonparametric Mann–Whitney U test because of both normal and non-
normal distributions in male and female distributions. According to independent
samples t test, there were no statistically significant differences between male and

158
female participants in recognition of mistuning when Factors 1, 2, and 3 were set
as dependent variables (for all, p > .05). This result was confirmed by Mann–
Whitney U Test (for all, p > .05).
Recognition of mistuning by Factors 1, 2, and 3 (instrumental experience
and age as independent variables)
As remembered, the goal in this sub-chapter, is still to estimate the validity of
Experiment 1. We saw that certain factors influenced the pitch discrimination skill
of the participants in certain chord progressions and the relationship between
factors and preordained categories was seen. Let us continue with regression
analysis. Instrumental experience variable and age variable are suitable variables
for regression analysis. A scanty majority of distributions of Factors 1, 2, and 3 by
instrumental experience and age were non-normally distributed. Because of this,
the results are acceptable with certain reservations. It is possible that all
connections between variables did not appear in these analyses. Factor 1 variable
was set as a dependent variable. Instrumental experience variable and age variable
were set as independent variables.
A simple linear regression was calculated to predict participants’ recognition
of mistuning (Factor 1) based on instrumental experience and age. Instrumental
experience and age together explained 12.7% of recognition of mistuning (Factor
1) which can be regarded as perceptible [F(2, 155) = 11.29, p < .001]. When age
increased by one year, recognition of mistuning (Factor 1) increased by 0.07 unit
element (p < .05). The connection between recognition of mistuning and
instrumental experience was not statistically significant in Factor 1 (p > .05). Put
in formula:
Recognition of mistuning = 1.626 + 0.065 × age + 0.041 × instrumental experience
Recognition of mistuning = Recognition of mistuning in Factor 1
A simple linear regression was calculated to predict participants’ recognition of
mistuning (Factor 2) based on instrumental experience and age. Instrumental
experience and age together explained 25.1% of recognition of mistuning (Factor
2) which can be regarded as notable [F(2, 157) = 26.34, p < .001]. When age
increased by one year, recognition of mistuning (Factor 2) increased by 0.13 unit
element (p < .001). The connection between recognition of mistuning and

159
instrumental experience was not statistically significant in Factor 2 (p > .05). Put
in formula:
Recognition of mistuning = −.65 + 0.133 × age + 0.054 × instrumental experience
Recognition of mistuning = Recognition of mistuning in Factor 2
A simple linear regression was calculated to predict participants’ recognition of
mistuning (Factor 3) based on instrumental experience and age. Instrumental
experience and age together explained 4.1% of recognition of mistuning (Factor 3)
which can be regarded as modest [F(2, 154) = 3.32, p < .05]. The connection
between recognition of mistuning (Factor 3) and instrumental experience nor with
age were not statistically significant in Factor 3 (both p > .05). Put in formula:
Recognition of mistuning = 2.075 + 0.021 × age + 0.040 × instrumental experience
Recognition of mistuning = Recognition of mistuning in Factor 3
3.4.2 Reliability of Experiment 1
The value of Cronbach’s α is a common key ratio to measure the reliability of the
study. It is known as a split-half test which gives an average correlation of all
possible split halves. Cronbach’s α is an estimate of this. If this value is for instance
0.9, it means that 90% of the variability in the observation is true and 10% is due
to error (Roberts, Priest & Traynor, 2006, p. 42). The value of Cronbach’s α should
be 0.7 or more in reliable studies (Cortina, 1993, p. 101).
Recognition of mistuning in the whole data set (40 chord progressions)
The inner validity of the sum variable recognition of mistuning (the whole data set,
40 chord progressions) seems quite good (Cronbach’s α = .785). When viewing the
separate chord progressions, it can be seen that the values of Cronbach’s α were
sufficient. However, there were some chord progressions, which lower the
reliability:
– Trial 39: CAT2/12.
– Trial 37: CAT1/12.
– Trial 32: CAT2/10.
– Trial 8: CAT2/15.
– Trial 18: CAT2/11.

160
– Trial 12: CAT3/8.
If any of these six chord progressions were deleted from the data set, the value of
Cronbach’s α would rise from the value (Cronbach’s α = .785). Regarding Category
1 of recognition of mistuning, the value of the Cronbach’s α (.65) was still sufficient.
In Category 2 of recognition of mistuning, the value of the Cronbach’s α (.44) was
not sufficient. The two clear dimensions of this category (a syntonic comma in
melodic movements—no melodic commas) probably weakens the inner validity.
Concerning Category 3 of recognition of mistuning, the value of the Cronbach’s α
(.64) was still sufficient. Regarding melodic commas from Category 2 the value of
Cronbach’s α (.48) did not rise a lot from the value of Category 2.
Mistuning misattributions to a minor triad and major triad (data set: 29
experiment items)
Misattributions to a minor triad did not achieve a sufficient value of Cronbach’s α
(.36). The three categories of misattributions to a minor triad got even worse values.
These three categories were not used in reporting results of the experiment. Instead,
misattributions to a major triad achieved a satisfying value of Cronbach’s α (.708).
The three categories of misattributions to a major triad got scantily lower values
(Cronbach’s α < .6).
The results of the experiment were reported so that misattributions to a minor
and major triad as frequency distributions were reported in the data set of 29
experiment items but not in separate categories. In the same way, they were used
as dependent variables in multidimensional analysis.
The values of Cronbach’s α (Location 1 = .67, Location 2 = .50, Location
3 = .07, Location 4 = .48) in four different locations of the target differed a lot from
each other. The locations were not used as dependent variables in multidimensional
analysis. The distributions of the recognition of mistuning by locations and their
differences were reported.
The experiments items representing Factor 1 (.598), Factor 2 (.736) achieved
a sufficient value of Cronbach’s α. The experiment items representing Factor 3
(Cronbach’s α = .444) was clearly weaker. The distributions of experiment items
for Factors 1, 2, and 3 were reported and they were used as dependent variables in
multidimensional analysis.
Cronbach’s α measures the reliability best when variables are one-dimensional.
Factor analysis in the previous sub-chapter pointed that the variables which

161
measures the recognition of mistuning of a syntonic comma are multidimensional.
Therefore, the values of Cronbach’s α might be underestimated.
The content validity and the criterion validity
The content validity of this experiment can be examined from the viewpoint of the
recognition of the target. It could be argued that the recognition of the mistuned
triad (manipulated by certain idea) measures only the reaction to mistuned triad
itself. Indeed, the recognition of the syntonic comma alone is not a music
psychological property. However, this sensitivity to perceive this kind of mistuning
relates to pitch discrimination skills. The mistuned minor triad narrowed by a
syntonic comma both from the part of third and fifth, is suitable representative and
traditionally judged as unusable. Musicians and music amateurs must notice certain
kind of mistunings to be able to play and sing successfully. The criterion validity
of this experiment cannot be estimated because, because there should be an
alternative test which could be used as testing the recognition of mistuning by a
syntonic comma.

162
163
4 Experiment 2: Intonation preferences
The fourth main chapter introduces the second experiment of this research, the
experiment of intonation preferences (Experiment 2). The aims are revised in Sub-
chapter 4.1. The method of experiment is presented in Sub-chapter 4.2. The results
of this experiment are reported in Sub-chapter 4.3. Finally, Sub-chapter 4.4
includes the operations of reliability and validity.
4.1 Aims of Experiment 2
The purpose of experiment of intonation preferences was to clarify which strategies
of tuning alternatives for solving the dilemma of the syntonic comma would be
most preferred by listeners. In particular, it was hoped that the experiment would
shed light on listeners’ sensitivity to the tuning strategy of pitch drift as a means of
eliminating the syntonic comma in a tonal homophonic context. In order to set pitch
drift in context, the experiment was designed to also include three other important
tuning strategies, all differing in their basic orientation. It could be assumed that
various contextual criteria greatly affect the preferences of the differences of tuning
alternatives that are due to different comma placements. In summary, the following
four tuning strategies were used in the experiment:
– Pitch drift: The triad that would otherwise involve the syntonic comma (the
second-degree minor triad) is not tempered, but performed vertically pure in
just intonation. This operation causes the pitch drift by a syntonic comma,
either upward or downward. Melodic syntonic commas linked to the second-
degree minor triad are also inevitable. This is a local usage of the syntonic
comma.
– Local tempering: The syntonic comma triad (the second-degree minor triad) is
tempered in equal temperament whereas other triads remain pure. This is a
local usage of syntonic comma.
– Equal temperament: This is a global usage of the problem of the syntonic
comma.
– Meantone tuning: This is a global usage of the problem of the syntonic comma.

164
4.2 Method of Experiment 2
This sub-chapter is divided on five sub-chapters. Sub-chapter 4.2.1 includes the
essential information of the participants of Experiment 1. Musical material is
described in Sub-chapter 4.2.2 and it is an overview of self-made chord
progressions and tuning manipulations used in this experiment. Sub-chapter 4.2.3
introduces the design of this experiment. Procedure is presented in Sub-chapter
4.2.4 and data analysis in Sub-chapter 4.2.5.
4.2.1 Participants
The participants were 93 (70 females, 23 males) students of music education and
musicology at the Universities of Oulu and Jyväskylä in Finland, as well as
professional music teachers in primary schools, upper primary schools, and
secondary schools in Finland. Professional teachers had a previous degree in music
education from a university or a music academy. Their ages ranged between 19 and
60 years, the M age being 28.12 years (SD = 10.09).
The participants reported a wide range of previous musical experience. The
duration of playing the main instrument ranged between 5 and 50 years, with a M
of 18.42 (SD = 10.47). In the beginning of the research it was assumed that
especially university music students would have a broad spectrum of main
instruments. Therefore, the division to string instruments, brass instruments,
woodwind instruments and other instruments seemed a reasonable starting point
Sfor constructing a background variable for the questionnaire. However, it turned
out that there were only a few orchestral instrument players, and instead, 68 of the
participants (73.1%) reported their main instrument as belonging to the fourth
category: piano, kantele, guitar, harp, percussion. In addition, there were 15 string
instrument players (16.1%), but only two brass players (2.2%) and seven
woodwind instrumentalists (7.5%; one participant did not report a main instrument).
Due to the uneven distribution, the participants’ main instrument cannot be treated
as an independent variable in the analysis of the results below. In hindsight, it would
have been wise simply to ask about the main instrument with an open question.
Concerning the participants’ main musical learning environment, the prior
assumption was that the individuals could be suitably divided in three groups, given
as alternatives in the questionnaire. According to this scheme, 52 (55.9%) of the
participants reported their main musical experience to be from a classically oriented
institute, while 25 participants reported a background in the music programs of

165
primary or secondary schools with music orientation (26.9%), and 16 reported a
background in popular music bands (17.2%). They were asked to name one musical
background that they experienced as dominant. The participants were given a
possibility to clarify their chosen alternative, and several of them did. However, it
turned out to be quite difficult to use the open answers for further specifying of the
categories.
According to given alternatives and open answers, the only clear-cut binary
distinction in terms of musical background that runs across the whole group of
participants was whether or not they had prior experience in choral singing. In this
respect, the questionnaire revealed two groups: participants who had experience in
choral singing before professional studies (51; 54.8%) and participants, who were
lacking in such experience (42; 45.2%).
In the next Sub-chapter 4.2.2, I will introduce a sheet music example of every
tuning alternatives of Experiment 2. All pitch drift samples are introduced in
Appendix 8.
4.2.2 Musical materials
To clear these four tuning manipulations, we take a short overview to them. First, I
introduce the example of an example of pitch drift. Pitch drift happens downward
in an example in Fig. 28. A sheet music example of local tempering is presented in
Fig. 29.

166
Fig. 28. A sheet music example of pitch drift.

167
Fig. 29. A sheet music example of local tempering.
Equal temperament was presented in Sub-chapter 2.1.6. As remembered, all the
sizes (in cents) of intervals vertically and horizontally are divisible by 100. The
local tempering manipulation uses the just intonation scale presented earlier. The
only exception is the second-degree minor triad, which is tuned into equal
temperament. This means, of course that some melodic movements are not from
just intonation scale nor from equal temperament. The modified just intonation
scale extended by local tempering is presented in Table 35.

168
Table 35. Intervals of the modified just intonation scale (2015) extended by local
tempering.
Intervals 1 m2 M2 m3 M3 4 #4 5 m6 M6 m6 M7
Cents 70.67 315.64 590.22 813.69 1017.60
Solfeggio di ma fi lo ta
Cents 0 203.91 386.31 498.04 701.96 884.36 1088.27
Solfeggio do re mi fa so la ti
Cents in
equal
temperament
200 in
ii triad
500 in
ii triad
900 in
ii triad
Meantone tuning used in this experiment was well-known ¼ comma meantone
tuning from Pietro Aaron (1523). A sheet music example of it is presented in Fig.
30.
Fig. 30. A sheet music example of meantone tuning.
The 30 chord progressions for this second experiment were selected from the score
of mistuning recognition. These chord progressions were selected so that their

169
harmony would work with all these four tuning alternatives. The solution was
simply omitting the chord progressions of Category 3 because of modally altered
triads of the third degree and the sixth degree. The musical material was thereby
homogenized. The most challenging manipulation was pitch drift. The harmonies
of chord progressions had to produce a possibility to the raise or lower fundamental
frequency: There were found 20 chord progressions of total 40, which included a
possibility to pitch drift. Finally, 15 chord progressions were selected for
comparisons of pitch drift preferences with all other alternatives. After this,
categories lost their significance. They only had to work with these four tuning
alternatives.
The minimum number of samples was 15 (5 × 3 comparisons) for each tuning
choice; therefore, the most suitable 15 samples from 20 possibilities for pitch drift
were selected:
– Pitch drift-local tempering (five chord progressions)
– Pitch drift-equal temperament (another five different chord progressions)
– Pitch drift-meantone tuning (another five different chord progressions)
In comparisons of local tempering-equal temperament and local tempering-
meantone tuning and equal temperament-meantone tuning, there were no such
limits (those of pitch drift). So, I added five separate chord progressions more to
local tempering-equal temperament. Then I added five separate chord progressions
more to local tempering-meantone tuning and finally, five separate chord
progressions more to equal temperament-meantone tuning. As a result, there were
30 chord progressions to be used. Every chord progression was used in one
experiment trial. The six comparisons were performed five times. The keys were
picked up directly from the keys of selected chord progressions of mistuning
recognition. When the order of comparison pairs was fixated, the keys of three
chord progressions were change, all because of pitch drift settings. The variety of
keys is practically random. The order of the experiment trials was selected
according to the Table 36.
Every chord progression was presented twice in one trial, always with two
separate tuning alternatives. The experiment was designed with a view to
presenting all of the possible pairwise comparisons between four tuning strategies
(pitch drift, local tempering, equal temperament, meantone tuning). Each
consecutive block of six trials in the experiment covered all of the possible six pairs
of tuning alternatives. As seen in Table 36, each consecutive block involved the
same order of six pairwise comparisons, with the temporal order of the alternatives

170
within the trials switched between consecutive blocks. So, each tuning
manipulation was performed through 15 chord progressions. The full score of the
experiment is seen in Appendix 7. Each pair with tuning alternatives was performed
five times, always with a different chord progression.
The keys of chord progressions in 30 test trials were randomly organized into
10 keys: C (five trials) D (two trials), Eb (three trials), E (three trials), F (two trials),
Gb (four trials), G (two trials), Ab (four trials), A (three trials), and Bb (two trials).
The keys inherited mostly (27/30) from the trials of experiment of mistuning
recognition. The procedure of key selection in that experiment is reported in Sub-
chapter 3.2.2. The key of three trials had to be altered because of practical reasons.
The order of the tuning alternatives was:
– Pitch drift
– Local tempering
– Equal temperament
– Meantone tuning
The presentation order of the tuning alternatives is shown in Table 36. The order of
the comparisons was the same in trials 1–6, 13–18, and 25–30. The order reversed
in trials 7–12 and 19–24 (pitch drift-local tempering to local tempering-pitch drift).
The order and the selection of the keys were randomized. The intention was that
the trials were performed in several keys to avoid fatiguing to one key.

171
Table 36. Experiment on intonation preferences: Final order of comparison pairs,
categories of chord progressions, and key.
Sample a) b) Category Key
1 LT1 PD2 CAT1/1 C
2 ET3 MT4 CAT1/16 A
3 PD ET CAT1/9 Bb
4 LT MT CAT1/ 4 A
5 ET LT CAT2/16 Eb
6 PD MT CAT2/5 E
7 PD LT CAT1/2 Eb
8 MT ET CAT2/1 D
9 ET PD CAT1/10 D
10 MT LT CAT1/7 E
11 LT ET CAT3/5 C
12 MT PD CAT2/7 F
13 LT PD CAT1/3 Gb
14 ET MT CAT2/3 Eb
15 PD ET CAT1/13 Gb
16 LT MT CAT1/8 C
17 ET LT CAT3/2 Gb
18 PD MT CAT2/9 Gb
19 PD LT CAT1/5 C
20 MT ET CAT2/4 A
21 ET PD CAT1/14 C
22 MT LT CAT1/11 Ab
23 LT ET CAT3/7 F
24 MT PD CAT2/11 G
25 LT PD CAT1/6 Ab
26 ET MT CAT2/6 Ab
27 PD ET CAT2/2 Bb
28 LT MT CAT1/12 E
29 ET LT CAT3/3 G
30 PD MT CAT2/13 Ab
1 LT = local tempering, 2 PD = pitch drift, 3 ET = equal temperament, 4 MT = meantone tuning
The chord progressions were notated with Finale software (2012), converted to
MIDI files and transferred into Pro Tools software. All samples and their tuning
systems were manipulated with Pro Tools. The final samples were produced with
the basic piano sound from the Korg M1 synthesizer.

172
4.2.3 Design
Participants’ preferences for these four tuning alternatives are in focus in this
experiment. For each tuning choice, the dependent variable was the frequency of
choosing this manipulation in the set of paired comparison trials involving this
particular manipulation as one of the two alternatives. Besides the relative
preference for the various tuning alternatives, an important goal was to explore
whether and how different musical backgrounds would affect participants’
sensitivity to how they prefer these alternatives. Besides age and gender, other
independent variables were chosen to reflect various aspects of the participants’
musical background: instrument group and years of playing the main instrument.
4.2.4 Procedure
The participants were tested in small groups, with each of them wearing
headphones. There were 11 sets of similar headphones available (Shure SRH 440),
and thus a maximum of 11 participants could complete the experiment at the same
time. The number of participants running the experiment varied depending on
circumstances. The stimuli were played back on a CD player (Sony CDP-212, with
Behringer Powerplay Pro-XL, 4-channel High-Power Headphones Mixing and
Distribution Amplifier, Model HA 4700). The volume was adjusted to a
comfortable listening level, keeping it exactly on the same level for all participant
groups. Given the measures taken, the division of the participants into small groups
will have no practical significance for the research, and the participants may thus
in the following be treated as one larger group. The circumstances remained the
same across groups.
In the beginning of the session, the participants were informed of details. Then
they were asked to sign an informed consent form and filled out a questionnaire of
background information on the front page of the response packet (see Appendix 4).
After this, they received spoken instructions for the test. The content of these
instructions was also summarized in the response packet. When the experiment
began from the CD, the instructions were repeated on the headphones, followed by
one practice trial.
After this, in each of the 30 trials (60 sample chord progressions), the
participants’ task was to listen to the two versions of a chord progression (both
involving a different tuning manipulation of the same chord progression), and
indicate which one of them they preferred. The chord progression duration was 12

173
seconds including a rest of equal duration between the items of comparison. After
each trial, there was a pause of 7–8 seconds. during which the number of the next
trial was heard spoken. The trial duration was approximately 35 seconds and the
whole listening task thus took 18 minutes. The total duration of the experimental
sessions was 25 minutes, at a maximum.
4.2.5 Data analysis
The basis of statistical data processing in confidence interval for M was (p = .05,
CI = 95%). However, there were comparisons of several sum variables. Because of
this, Bonferroni corrections were calculated so that CI was 99.5% for four variables
resulting in 95% confidence level for overall comparisons. Relative preferences for
tuning alternatives in pairwise comparison were analyzed using Chi-square test
(with Yates’s continuity correction).
Most of the multidimensional analyses with background variables were done
both with parametric and nonparametric tests, because the frequency distributions
were not normally distributed. The one-way ANOVA (with Bonferroni post hoc test,
when necessary) test was used with instrument group variable and choir voice
variable. Also, Kruskal–Wallis tests were used with the instrument group variable
and the choir voice variable: Pairwise comparisons were done using the Dunn test.
The analyses concerning the gender variable were done using independent
samples t test and in addition, nonparametric Mann–Whitney U test. Correlations
between dependent variables, on the other hand, and instrumental experience
variable and age variables, on the other, were done by nonparametric Spearman’s
ρ because of non-normal distributions. For repeated measures, we used Friedman’s
ANOVA along with the Dunn–Bonferroni post hoc test for dependent samples.
The validity of the experiment was tested by PCA. As all the variables
corresponding to the test items were binary, we used tetrachoric correlation matrix
as a starting point for PCA. The tetrachoric correlation is, essentially, an estimate
of the product–moment correlation that would have been obtained with the
underlying continuous variables if their joint distribution was bivariate normal (see
Lorenzo-Seva & Ferrando, 2012). Rotation method was varimax and by factor
analysis rotated factor matrix. For reliability, Cronbach’s α were determined for
sum variables created basing on the results of factor analysis.

174
4.3 Results
The results of this experiment are presented in four sub-chapters. Preferences of
the four tuning alternatives are reported in Sub-chapter 4.3.1. Comparisons of those
same alternatives are reported in Sub-chapter 4.3.2. The influence of background
variables is presented in Sub-chapter 4.3.3. Finally, Sub-chapter 4.3.4 includes the
comparisons of preferences between experiment blocks.
4.3.1 Preferences of the four tuning alternatives
The following sub-chapters includes the results of the four tuning alternatives. Pitch
drift preferences, local tempering preferences, equal temperament preferences, and
meantone tuning preferences are reported each of them in separate graphics.
Pitch drift preferences
A single participant could theoretically prefer a single tuning manipulation at most
15 times. For pitch drift, the range of preference judgments ranged between 0 and
10 (M = 3.48, median = 3, SD = 2.22, N = 92). In general, most of the participants
appeared to have disliked the sound of pitch drift, in comparison to the alternatives
presented. As can be seen in Fig. 31, the distribution of pitch drift preferences was
nevertheless significantly (C.R. > 1.96) skewed to the right (skewness = .88,
C.R. = 3.50), due to a minority of participants who apparently accepted this tuning
manipulation. Kurtosis was also notable (.62, C.R. = 1.24). Kolmogorov–Smirnov
test [K–S(92) = .18, p < .001] and Shapiro–Wilk test [S–W(92) = .93, p < .001] both
confirmed the perceived non-normality.

175
Fig. 31. The distribution of pitch drift preferences. Horizontal axis = correct responses.
Vertical axis = number of participants. PD preferences = Pitch drift preferences.
Local tempering preferences
This tuning manipulation was better accepted among participants (M = 7.92,
SD = 1.84, N = 92). As seen in Fig. 32, there was a concentration of observation
units for frequencies 6–9. Not less than 20 participants have preferred local
tempering eight times of 15 possible. The range of observation units was from 1 to
12 (median = 8). The distribution of local tempering preferences was skewed to left
(skewness = −.40, C.R. = −1.61) and it was non-normal [K–S(92) = .12, p < .01]
and [S–W(92), .94, p < .001]. Kurtosis was remarkable (1.38, C.R. = 2.76) which
differed significantly from 0 (C.R. > 1.96).

176
Fig. 32. The distribution of local tempering preferences. Horizontal axis = correct
responses. Vertical axis = number of participants. LT preferences = Local tempering
preferences.
Equal temperament preferences
Equal temperament was the most popular choice among four tuning alternatives
(M = 9.54, SD = 2.26, N = 92). The range of observation units was from 5 to 15 (see
Fig. 33). Median was 9 preferences (17 participants). Also 11 preferences had same
frequency, 17 participants. One single participant preferred equal temperament 15
times, which is the maximum. Only three participants chose equal temperament
five times. The distribution of equal temperament preferences was not normal
according to Kolmogorov–Smirnov test [K–S(92) = .11, p < .01]. Shapiro–Wilk test,
instead, [S–W(92) = .97, p = .067] showed roughly a normal distribution. Kurtosis

177
of the distribution was perceptibly negative (−.051, C.R. = −1.03) and skewness
(.03, C.R. = 0.11) practically neutral.
Fig. 33. The distribution of equal temperament preferences. Horizontal axis = correct
responses. Vertical axis = number of participants. ET preferences = Equal temperament
preferences.
Meantone tuning preferences
Meantone tuning was also well accepted by most participants in this experiment
(M = 9.05, SD = 1.96, N = 92). The range of meantone tuning preferences was from
4 to 14. Median (9) was actualized with 20 participants which is the highest number
in frequencies in this experiment together with local tempering preferences (20
participants having eight local tempering preferences). A total of 16 participants

178
had 11 meantone tuning preferences, while 80.7% of participants had 7–11
meantone tuning preferences, which is a bump in distribution (see Fig. 34).
The distribution of meantone tuning preferences did not obey a normal
distribution according to Kolmogorov–Smirnov test [K–S(92) = .11, p < .01] and
Shapiro–Wilk test [S–W(92) = .97, p < .05]. Kurtosis was notably negative (−.34,
C.R. = −.67) and the distribution was minimally skewed to left (skewness = −.08,
C.R. = −.20).
Fig. 34. The distribution of meantone tuning preferences. Horizontal axis = correct
responses. Vertical axis = number of participants. MT preferences = Meantone tuning
preferences.
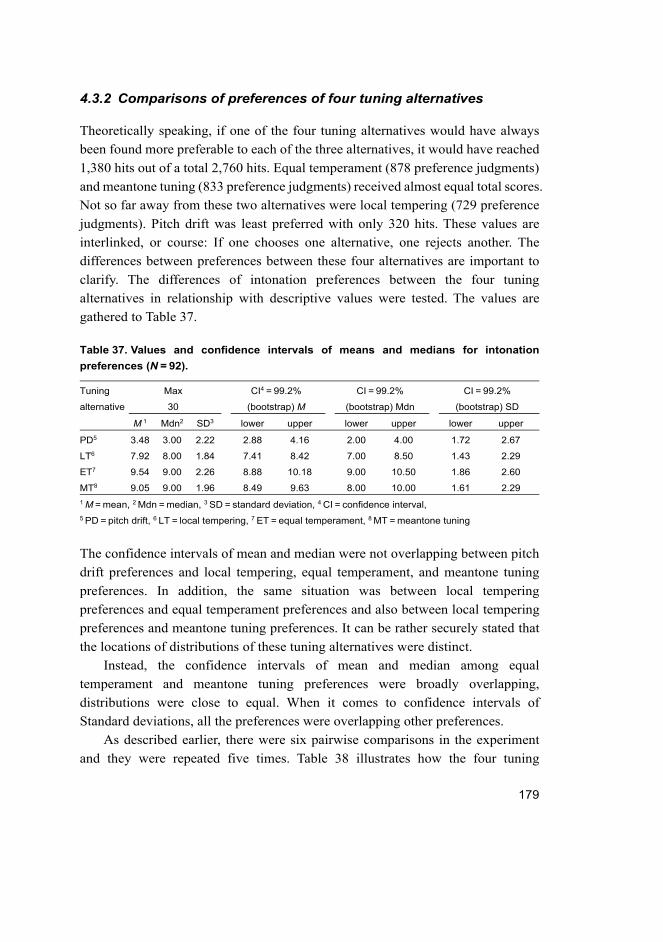
179
4.3.2 Comparisons of preferences of four tuning alternatives
Theoretically speaking, if one of the four tuning alternatives would have always
been found more preferable to each of the three alternatives, it would have reached
1,380 hits out of a total 2,760 hits. Equal temperament (878 preference judgments)
and meantone tuning (833 preference judgments) received almost equal total scores.
Not so far away from these two alternatives were local tempering (729 preference
judgments). Pitch drift was least preferred with only 320 hits. These values are
interlinked, or course: If one chooses one alternative, one rejects another. The
differences between preferences between these four alternatives are important to
clarify. The differences of intonation preferences between the four tuning
alternatives in relationship with descriptive values were tested. The values are
gathered to Table 37.
Table 37. Values and confidence intervals of means and medians for intonation
preferences (N = 92).
Tuning
alternative
Max
30
CI4 = 99.2%
(bootstrap) M
CI = 99.2%
(bootstrap) Mdn
CI = 99.2%
(bootstrap) SD
M 1 Mdn2 SD3 lower upper lower upper lower upper
PD5 3.48 3.00 2.22 2.88 4.16 2.00 4.00 1.72 2.67
LT6 7.92 8.00 1.84 7.41 8.42 7.00 8.50 1.43 2.29
ET7 9.54 9.00 2.26 8.88 10.18 9.00 10.50 1.86 2.60
MT8 9.05 9.00 1.96 8.49 9.63 8.00 10.00 1.61 2.29
1 M = mean, 2 Mdn = median, 3 SD = standard deviation, 4 CI = confidence interval, 5 PD = pitch drift, 6 LT = local tempering, 7 ET = equal temperament, 8 MT = meantone tuning
The confidence intervals of mean and median were not overlapping between pitch
drift preferences and local tempering, equal temperament, and meantone tuning
preferences. In addition, the same situation was between local tempering
preferences and equal temperament preferences and also between local tempering
preferences and meantone tuning preferences. It can be rather securely stated that
the locations of distributions of these tuning alternatives were distinct.
Instead, the confidence intervals of mean and median among equal
temperament and meantone tuning preferences were broadly overlapping,
distributions were close to equal. When it comes to confidence intervals of
Standard deviations, all the preferences were overlapping other preferences.
As described earlier, there were six pairwise comparisons in the experiment
and they were repeated five times. Table 38 illustrates how the four tuning

180
alternatives were preferred against each other. A series of Chi-square tests (with
Yates’ continuity correction) has been used to assess the extent to which the
observed values represent statistically significant deviations from a theoretically
even outcome—with both tuning alternatives being selected in 50% of the
responses. The observation unit in this comparison is the choices made by
participants.
When pitch drift was compared to equal temperament and meantone tuning,
the results were quite clear: pitch drift was shunned. Local tempering-pitch drift
comparisons were not equal: local tempering gathered approximately 60% from
preference judgments against pitch drift. pitch drift enjoyed some relative success
only in comparison to local tempering, nevertheless remaining the less favored
alternative. equal temperament and meantone tuning were practically equal. equal
temperament was slightly more preferred compared with local tempering. It is a bit
surprising that local tempering was slightly more preferred against meantone
tuning, but the result was not significant (p > .05).
Table 38. Relative preferences of tuning alternatives in pairwise comparison
(percentages pertain to the term in the left column).
Tuning
alternative
PD1 LT2 MT3
LT 59.8%
χ2 (1) = 17.22, p < .001
N = 92
MT 85.9%
χ2 (1) = 235.31, p < .001
N = 93
45.4%
χ2 (1) = 3.65, p > .05
N = 93
ET4 85.2%
χ2 (1) = 226.8, p < .001
N = 93
56.1%
χ2 (1) = 6.58, p = .01
N = 93
50.9%
χ2 (1) = 0.11, p > .05
N = 92
1 PD = pitch drift, 2 LT = local tempering, 3 MT = meantone tuning, 4 ET = equal temperament
Correlations between preferences for tuning alternatives
Because of non-normal distributions of separate tuning alternatives, nonparametric
Spearman’s ρ was used for seeking connections between preferences: There were
several correlations between preferences for the four tuning alternatives.
There was a strong, statistically significant negative correlation (ρ = −0.54)
between pitch drift preferences and equal temperament preferences (p < .001). The
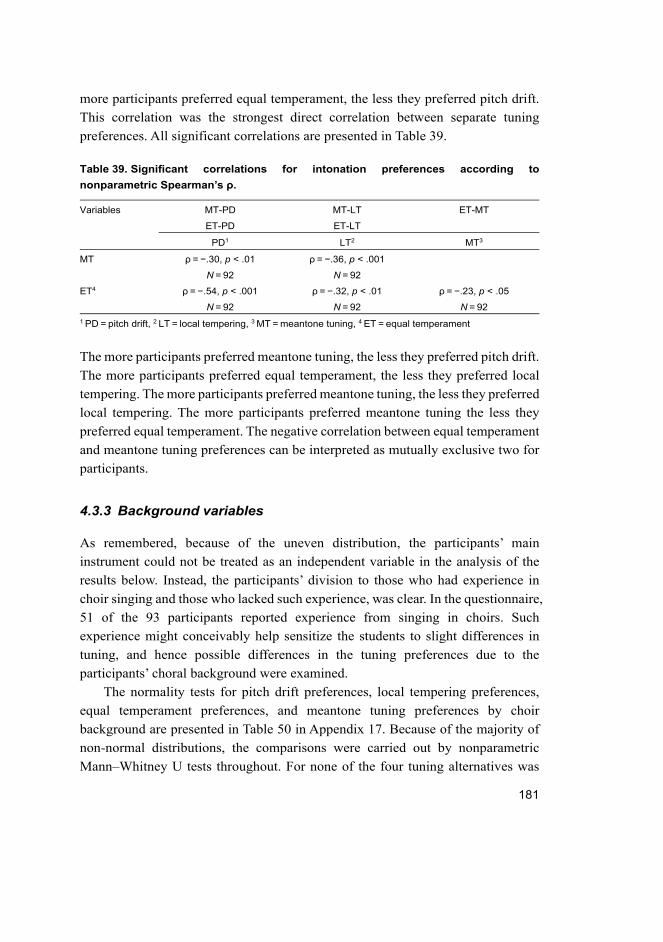
181
more participants preferred equal temperament, the less they preferred pitch drift.
This correlation was the strongest direct correlation between separate tuning
preferences. All significant correlations are presented in Table 39.
Table 39. Significant correlations for intonation preferences according to
nonparametric Spearman’s ρ.
Variables MT-PD
ET-PD
MT-LT
ET-LT
ET-MT
PD1 LT2 MT3
MT ρ = −.30, p < .01
N = 92
ρ = −.36, p < .001
N = 92
ET4 ρ = −.54, p < .001
N = 92
ρ = −.32, p < .01
N = 92
ρ = −.23, p < .05
N = 92
1 PD = pitch drift, 2 LT = local tempering, 3 MT = meantone tuning, 4 ET = equal temperament
The more participants preferred meantone tuning, the less they preferred pitch drift.
The more participants preferred equal temperament, the less they preferred local
tempering. The more participants preferred meantone tuning, the less they preferred
local tempering. The more participants preferred meantone tuning the less they
preferred equal temperament. The negative correlation between equal temperament
and meantone tuning preferences can be interpreted as mutually exclusive two for
participants.
4.3.3 Background variables
As remembered, because of the uneven distribution, the participants’ main
instrument could not be treated as an independent variable in the analysis of the
results below. Instead, the participants’ division to those who had experience in
choir singing and those who lacked such experience, was clear. In the questionnaire,
51 of the 93 participants reported experience from singing in choirs. Such
experience might conceivably help sensitize the students to slight differences in
tuning, and hence possible differences in the tuning preferences due to the
participants’ choral background were examined.
The normality tests for pitch drift preferences, local tempering preferences,
equal temperament preferences, and meantone tuning preferences by choir
background are presented in Table 50 in Appendix 17. Because of the majority of
non-normal distributions, the comparisons were carried out by nonparametric
Mann–Whitney U tests throughout. For none of the four tuning alternatives was

182
there a significant difference in preference for the tuning as a function of the
participants’ choral background (for all, p > .05, N = 92).
Yet, there were three background variables left: gender, instrumental
experience and age. Normality tests or pitch drift preferences, local tempering
preferences, equal temperament preferences, and meantone tuning preferences
explored by gender are presented in Table 51 in Appendix 18. Because of the
majority of non-normal distributions, the analysis went on with nonparametric
Mann–Whitney U Test. As a result, there were found no statistically significant
differences between genders for none of the four tuning alternatives (for all, p > .05,
N = 92).
When it comes to instrumental experience, nonparametric Spearman’s ρ test,
showed no statistically significant correlations between the variable instrumental
experience and intonation preferences (for all, p > .05, N = 92). Further, according
to Spearman’s ρ test, there were no statistically significant correlations between
age and tuning manipulation preferences (N = 92). However, the correlation
between local tempering preferences and age was nearly significant (ρ = .20,
p = .056, N = 92): The older the participants were, the more they preferred local
tempering.
4.3.4 Comparisons of preferences between experimental blocks
It could be assumed that the participants of the Experiment 2 felt themselves
comfortable when they started to listen to chord progressions with different tuning
alternatives. Participants may have experienced the differences between separate
samples as rather marginal. Then, after some repetitions, a participant may have
begun to pay attention to the slight differences better than in the beginning. It is a
worth exploring whether this might have been the case. Breaking down the means
across the five consecutive blocks of the experiment sheds some light on this matter
in Table 40.
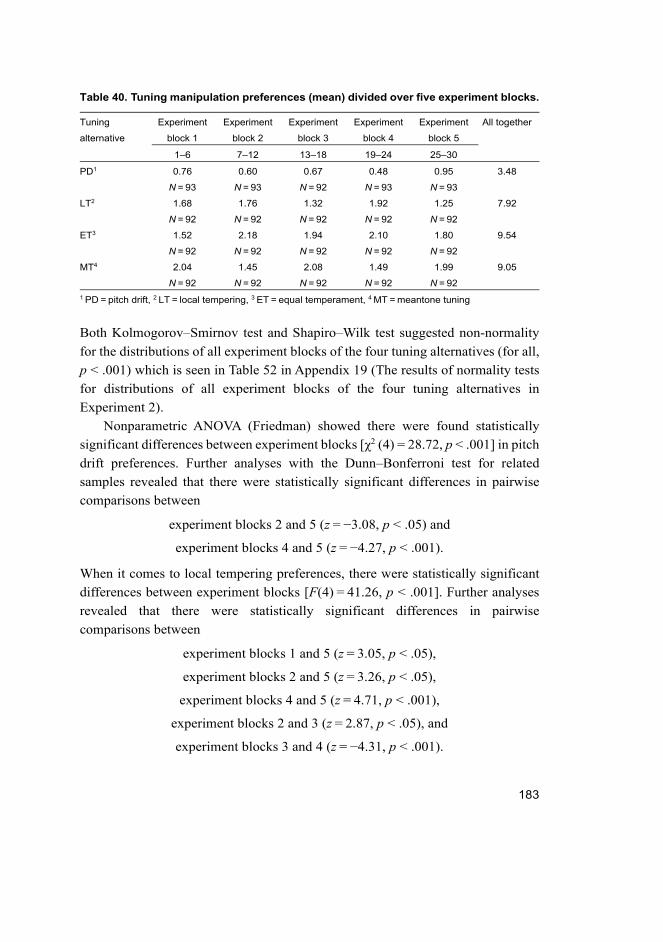
183
Table 40. Tuning manipulation preferences (mean) divided over five experiment blocks.
Tuning
alternative
Experiment
block 1
Experiment
block 2
Experiment
block 3
Experiment
block 4
Experiment
block 5
All together
1–6 7–12 13–18 19–24 25–30
PD1 0.76
N = 93
0.60
N = 93
0.67
N = 92
0.48
N = 93
0.95
N = 93
3.48
LT2 1.68
N = 92
1.76
N = 92
1.32
N = 92
1.92
N = 92
1.25
N = 92
7.92
ET3 1.52
N = 92
2.18
N = 92
1.94
N = 92
2.10
N = 92
1.80
N = 92
9.54
MT4 2.04
N = 92
1.45
N = 92
2.08
N = 92
1.49
N = 92
1.99
N = 92
9.05
1 PD = pitch drift, 2 LT = local tempering, 3 ET = equal temperament, 4 MT = meantone tuning
Both Kolmogorov–Smirnov test and Shapiro–Wilk test suggested non-normality
for the distributions of all experiment blocks of the four tuning alternatives (for all,
p < .001) which is seen in Table 52 in Appendix 19 (The results of normality tests
for distributions of all experiment blocks of the four tuning alternatives in
Experiment 2).
Nonparametric ANOVA (Friedman) showed there were found statistically
significant differences between experiment blocks [χ2 (4) = 28.72, p < .001] in pitch
drift preferences. Further analyses with the Dunn–Bonferroni test for related
samples revealed that there were statistically significant differences in pairwise
comparisons between
experiment blocks 2 and 5 (z = −3.08, p < .05) and
experiment blocks 4 and 5 (z = −4.27, p < .001).
When it comes to local tempering preferences, there were statistically significant
differences between experiment blocks [F(4) = 41.26, p < .001]. Further analyses
revealed that there were statistically significant differences in pairwise
comparisons between
experiment blocks 1 and 5 (z = 3.05, p < .05),
experiment blocks 2 and 5 (z = 3.26, p < .05),
experiment blocks 4 and 5 (z = 4.71, p < .001),
experiment blocks 2 and 3 (z = 2.87, p < .05), and
experiment blocks 3 and 4 (z = −4.31, p < .001).

184
When it comes to equal temperament preferences, there were found statistically
significant differences between experiment blocks [F(4) = 46.53, p < .001]. Further
analyses revealed that there were statistically significant differences in pairwise
comparisons between
experiment blocks 1 and 2 (z = −5.32, p < .001),
experiment blocks 1 and 3 (z = −3.22, p < .05),
experiment blocks 1 and 4 (z = −4.38, p < .001), and
experiment blocks 2 and 5 (z = 3.31, p < .01).
Finally, concerning meantone tuning preferences, there were found statistically
significant differences between experiment blocks [F(4) = 61.42, p < .001]. Further
analyses revealed that there were statistically significant differences in pairwise
comparisons between
experiment blocks 1 and 2 (z = 4.83, p < .001),
experiment blocks 1 and 4 (z = 4.34, p < .001),
experiment blocks 2 and 3 (z = −4.80, p < .001),
experiment blocks 2 and 5 (z = −4.22, p < .001),
experiment blocks 3 and 4 (z = 4.31, p < .001), and finally,
experiment blocks 4 and 5 (z = −3.73, p < .01).
Pitch drift was the most unpopular choice in every experiment block. In the last
block (25–30) it was better accepted. Local tempering preferences varied most of
these four alternatives (M varied from 1.25 up to 1.92). In the beginning equal
temperament was preferred as often as local tempering, but from the second
experiment item (chord progressions 7–12), it took its place as the most popular
tuning manipulation. Meantone tuning preferences seemed to have two separate
categories, M approximately = 1.5 and M approximately = 2.0.
It is very challenging to find the explanation for these differences. There were
no signs of fatigue or adjustment of the participants. It is possible that there are
some factors in chord progressions which explain these differences between
experiment blocks.

185
4.4 Reliability and validity of Experiment 2
The recognition results of the experiment were also subjected to PCA. Rotation
method was varimax. At first, according to PCA done for sum variables of pitch
drift preferences, local tempering preferences, equal temperament preferences, and
meantone tuning preferences, there occurred three components, which is seen in
Fig. 35.
Fig. 35. Component plot in rotated space for pitch drift preferences, local tempering
preferences, equal temperament preferences, and meantone tuning preferences by
PCA.
Equal temperament and local tempering preferences constituted Component 1 in
the PCA (see Fig. 35). According to this analysis, local tempering and equal
temperament preferences were alternatives to each other against pitch drift
preferences and meantone tuning preferences. This is somewhat surprising because
these two alternatives have only one common feature of tuning: equally tempered

186
second-degree minor triads. In local tempering manipulation all other vertical triads
are assembled in just intonation. Instead, local tempering and meantone tuning
alternatives have more common features: all major thirds are pure in meantone
tuning alternatives used.
Next, according to factor analysis done for all experiment items (30) revealed
even 13 factors according to rotated factor matrix of factor analysis. This result is
slightly surprising. Only sum variables representing Factors 1 and 2 gathered
loadings for four experiment items. The sum variables representing Factor 1 (.606),
Factor 2 (.645) achieved a sufficient value of Cronbach’s α, which means a
reasonable internal validity of experiment items representing Factor 1, and 2.
Other sum variables representing other factors (Factors 3–13) did not achieve
sufficient values of Cronbach’s α for Factors 5, 6, 7, 9, 12, and 13, there was only
one item with highest loading on them. They can be called as pseudo-factors. All
loadings of Factors 1–13 are gathered in Table 41 below. The results of the factor
analysis of the experiment items representing factors as variables are presented in
Table 53 in Appendix 20.

187
Table 41. Experiment items for Factors 1–13, by factor analysis (rotated factor matrix)
and Cronbach’s α.
Sum
variables
Factors
1 2 3 4 5 6 7 8 9 10 11 12 13
PD-ET3 .80
LT-ET4 .73
MT-PD4 .57
PD-MT3 .48
PD-MT1 .77
ET-PD2 .74
ET-PD4 .68
MT-PD2 .48
LT-PD5 .71
LT-MT3 .68
PD-ET5 .48
ET-MT3 .80
MT-ET4 .52
MT-LT2 .87
LT-ET2 .85
ET-LT1 .80
PD-ET1 .78
LT-MT5 .69
LT-PD3 .83
LT-MT1 .70
ET-LT5 .68
LT-PD1 .76
PD-LT2 .49
ET-MT1 .86
PD = pitch drift, LT = local tempering, ET = equal temperament, MT = meantone tuning
To view the loadings of these experiment items, it seems clear that the four tuning
alternatives do not measure four properties of participants. In seven experiment
items of eight in Factor 1, and 2, pitch drift preferences are against equal
temperament or meantone tuning. Once local tempering preferences “replaces”
pitch drift preferences. pitch drift appears in seven factors in all. Interesting is that
local tempering preferences appear in eight factor outside of Factors 1 and 2.
In the loadings of experiment items representing Factors 1–13 included
loadings as following:
– Meantone tuning against pitch drift in four loadings
– Equal temperament against pitch drift in five loadings

188
– Local tempering against pitch drift in five loadings
– Local tempering against equal temperament in four loadings
– Local tempering against meantone tuning in three loadings
– Equal temperament against meantone tuning in three loadings
This variety of pairs shows that the only clear separable property of these
experiment items representing different factors is pitch drift preferences.
The content validity of this experiment can be examined from the viewpoint of
the tuning alternatives used in the experiment. These alternatives and preferences
on them are interlinked: By choosing a certain alternative, one rejects other
alternatives. This experiment does not measure a certain property which is
connected to certain tuning. There were two traditional, well-known tunings and
two innovative tuning alternatives. The differences between local tempering, equal
temperament, and meantone tuning preferences were, as written before, were likely
too small to produce more distinct results.
The criterion validity of this experiment cannot be estimated because, because
there should be an alternative test which could be used as testing the preferences of
the four tuning alternatives used in this experiment.

189
5 Discussion
This last main chapter has the total nine sub-chapter. At first, we come back to
original research questions (see Sub-chapters 5.1 and 5.2). Then I will introduce
practical implications on the ground of this book (see Sub-chapters 5.3, 5.4, and
5.5). After these experiments, it may be justifiable to ask, is there music without
syntonic commas (see Sub-chapter 5.6). Description of ethical issues is taking place
in Sub-chapter 5.7. Further, the insight of self-criticism is seen in Sub-chapter 5.8
(Critical observations of the present research). Finally, recommendations for
further research, Sub-chapter 5.9, ends this book.
5.1 Answering the first and second research question
Experiment 1 (recognition of mistuning recognition) charted out the recognition of
the syntonic comma. To refresh the memory, the first two research questions were
the following:
1. To what extent do young music learners recognize mistuned triads in simple
four-voiced just intonation harmony?
2. To what extent can the recognition of the mistuned triads be explained by a)
musical features such as the complexity of harmony or the target location, and
b) the participants’ individual features (e.g., instrumental experience)?
The number of recognized mistunings (in the whole data set of 40 samples) varied
from 8 to 35 recognition (M = 22.97, SD = 5.78, median = 24) out of total (40
samples): The participants recognized on average 57.43% of mistuned triads. This
is, of course, clearly more than at random which means that young music learners
do have sensitivity to perceive this kind of mistuning. The recognition percentage
was highest (.92) in Trial 35 (CAT1/6). and lowest (.22) in Trial 9 (CAT2/9). The
range of distribution was rather broad. The finding of Schellenberg (2001), going
out of tune is more conspicuous than going in tune, was present in this study:
participants detected mistuned triad among the pure ones.
As mentioned in 2.2.8., thresholds for pitch discrimination between 2 cents and
20 cents for musicians in several investigations in recent years, so that the result of
the first research question was in line with previous studies. Thresholds for
simultaneous tones can vary from 2 cents (complex tones) to 50 cents (low-level
pure tones) according to Burns (1999). Ballard (2011, p. 30) reminded that the
difference limen for pitch perception is between 3 and 8 cents. In this experiment,

190
the mistuning of 21.51 cents was broadly detected. The results are better than in the
findings of Vurma (2010) where 34% of singers recognized a mistuning of 20 cents
and better than in the study of Schellenberg and Moreno (2010) where musically
trained scored a mean threshold of 41.63 cents and 43.92 cents (detecting mistuning
from two familiar melodies). Of course, the design of these experiments was not
similar.
The finding of Dunnigan (2002) and Schellenberg (2001) that flat fifths are
easier to accept than sharp fifths, may not have been supported. The flat fifths of
the second-degree minor triad were recognized as mistuned quite well. In the study
of Koelsch et al. (1999), professional violinists detected 80% of mistuning (−12
cents in the third of the major triad) in simultaneous triads which is a better result
than in the present study. However, Koelsch et al. (1999) studied professional
musicians whereas the present study was done for young music learners.
Interestingly, Larrouy-Maestri (2018) found the measured tolerance
concerning the subjects’ tolerance with regard to mistuning across six-tone
melodies, the mean tolerance threshold was approximately 21 cents, which is
practically a syntonic comma. Although, Larrouy-Maestri studied melodic
mistunings.
Concerning research question 2a, I found that complexity influenced the
recognition of the target. Mistuning was recognized best in the simplest category
(Category 1): 66.77% of the targets were recognized. Although the best mistuning-
finders were very skillful, it is impossible to predict their pitch-matching skills on
the basis of pitch discrimination skills. It seems strongly that good pitch
discrimination skills do not guarantee an accurate performance (Ballard, 2011;
Bradshaw & McHenry, 2005; Kopiez, 2003; Powell, 2010; Vurma, 2010;
Yarbrough et al., 1995).
The target was recognized worst in the most complex category (Category 3):
The participants recognized 42.6% of mistuned targets. Category 2 was in the
middle: The participants recognized 54.1% of targets. The differences between
categories were significant: The confidence intervals of means and medians of
separate categories were not overlapping.
The results showed that Category 2 was split in two: The target was recognized
better in chord progressions with the syntonic comma in melodic movements when
compared with those chord progressions without melodic commas. This finding
was significant: The confidence intervals of means and medians of these two
groups of Category 2 were not overlapping. Studies regarding the influence of the

191
complexity of musical material on detecting mistuning were not found among the
literature reviews of this research.
It was also a purpose to investigate, still according to research question 2a, how
the location of the target (four locations) affects the recognition of the target. The
results showed a significant difference between Location 2 and 3: The confidence
intervals of means and SDs were not overlapping between Location 2 and Location
3. Location 2 was clearly the worst for recognizing mistuning, Location 3 was best.
One possible explanation for this is that position 2 was the kind of perception point,
in which the listeners might have perceived to rhythmical change from half notes
to quarter notes: Target in position 3 might have been easier to perceive. This,
however, would need further investigations.
It was interesting to see to what extent the participants misattribute mistuning
to a pure minor and major triad. Mistuning was misattributed to a minor triad in
24.73% of cases and to a major triad in 18.88% of cases. Concerning the
misattributions to a minor triad, the confidence intervals of means were not
overlapping between Category 1 and 2, between 2 and 3, and between 1 and 3. The
confidence intervals of median were not overlapping between 1 and 3 and between
2 and 3. Concerning the misattributions to a major triad, the confidence intervals
of means and medians were not overlapping between Category 1 and 2, between 2
and 3, and between 1 and 3. It can be claimed that the distributions of categories
were situated in different places. It is a little bit comforting that there were more
mistuning misattributions to minor triads than to major triads (median = 5,
Mode = 4, M = 5.47). Elements of major triad are based directly to harmonic spectra.
Minor triad is, instead, a more complicated phenomenon. It was presumable that
there would be clear differences between three categories in misattributions to a
major triad, too. Misattributions to a major triad in Category 3 were understandable:
Modally altered, but vertically pure major triads have misled several participants.
Modally altered major triad has somehow sounded “weird” or “wrong” and a part
of participants has misattributed mistuning to a modally altered major triad. This,
of course, explains low values in misattributions to a minor triad in Category. In
the case of misattributions to a major triad in Category 3, the difficulty of
recognizing correct intonation (Baker, 2010; Hedden & Vurma, 2010; Rasch, 1985;
Siegel & Siegel, 1979; Vurma & Ross, 2006) were somehow supported.
Research question 2b) handled background variables and their effect on
recognition of mistuning: a) the instrument group of main instrument, b) the voice
that the participant sings in choir, c) gender, d) age, and e) instrumental experience
(measured in years). According to findings, participants’ main instrument did not

192
seem to affect recognition of mistuning nor misattributions to a minor triad or major
triad. There were no significant differences between how well participants
representing different instrument groups succeeded in localizing the mistuned
triads. The same was true separately for each of the stimulus Categories 1–3. There
were no statistically significant differences between choir voices in recognition of
mistuning in the whole data set nor in Category 1 or Category 3, either. Instead, in
Category 2 and in the set of melodic commas (in Category 2), there was a
statistically significant difference between top voice singers and bass voice singers:
Bass voice singers detected mistuning better.
There were no statistically significant differences between male and female
participants in recognition of mistuning, nor in separate categories.
Several connections were found between recognition of mistuning and
instrumental experience and age. The findings of several investigators (Dunnigan,
2002; Koelsch et al., 1999; Micheyl et al., 2006; Parbery-Clark et al., 2009;
Schellenberg & Moreno, 2010; Slater et al., 2018; Spiegel & Watson, 1984; Strait
et al., 2010; Tervaniemi et al., 2005) were supported: The musical experience
increase pitch-discriminating skills. Instrumental experience and age together
explained 29.3% of recognition of mistuning in the whole data set: When age
increased by one year, recognition of mistuning increased by 0.46 unit element.
When instrumental experience increased by one year, recognition of mistuning
increased by 0.36 unit element. The results were parallel in Categories 2 and 3.
However, there were no statistically significant connections between recognition
of mistuning and instrumental experience and age in Category 1.
Age and mistuning misattributions to a minor triad were inversely connected.
The older the participants were, the less they misattributed mistuning to a minor
triad. The connection between mistuning misattributions to a minor triad and
instrumental experience was not statistically significant. When it comes to
misattributions to a major triad: The older and more instrumentally experienced the
participants were, the less they misattributed mistuning to a major triad.
Age and instrumental experience had a strong, positive correlation. Mistuning
recognition was positively correlated to both of these variables. This was seen also
in separate categories of recognition of mistuning. Respectively, the correlations
between mistuning misattributions to a major triad and age and instrumental
experience were negative in the whole data set and in separate categories.
Concerning the misattributions to a minor triad, the correlation was negatively
significant in the whole data set and in Category 1 and practically in Category 2.
Instead, Category 3 was the exception: there was no a statistically significant

193
correlation between mistuning misattributions to a minor triad and instrumental
experience and mistuning misattributions to a minor triad and age in Category 3.
When it comes to recognition of mistuning, again, factor analysis revealed loadings
from Categories 1 and 3.
Music analysis explanations for the differences between participants in the
recognition of the target were hard to find. Marmel et al. (2008) found that tonally
related targets were discriminated more sensitively than tonally less related.
However, the chord progressions were composed to be functionally possibly
neutral. It was not observed that some “more” traditional chord progressions would
have stood out from results.
As remembered, bright tones were perceived sharper than dull tones (Geringer
& Worthy, 1999; Vurma et al., 2011). The results could have been different, if the
sound was duller. Ballard (2011) found that, pitch discrimination does not seem to
depend on tuning system. It would have been interesting to investigate, whether
there would be differences recognizing mistuning if the pure triads were in equal
temperament.
5.2 Answering the third and fourth research question
According to the third research question, my purpose was to clarify, which usages
of the syntonic comma university music students and professional music educators
prefer in tonal and modal four-part texture? To answer the third research question,
one must ask, how intonation preferences were distributed among the four tuning
alternatives pitch drift, local tempering, equal temperament, or meantone tuning.
The results showed that there was an overall rejection of pitch drift preferences:
pitch drift preferences had the clearly worst success (M = 3.48). equal temperament
preferences (M = 9.54) and meantone tuning preferences (M = 9.05) were almost
equal. local tempering preferences (M = 7.92) were clearly above pitch drift but not
so far away from equal temperament and meantone tuning. If one of the four tuning
alternatives (pitch drift, local tempering, equal temperament, and meantone tuning)
would have always been found more preferable to each of the three alternatives, it
would have reached at maximum value of 15. These values are interlinked, or
course: If one chooses one alternative, one rejects another. The shunning of pitch
drift is somewhat different result from finding of Hancock (2008): The gradual
change of pitch did not seem to bother the most listeners.
Aforementioned results conform the findings of Long (2008): Equal
temperament turned out to be preferred over other tuning alternatives in most
194
passages: The selection of one intonation systems preferred over another seemed
not to occur accidentally. The acceptability of equal temperament and meantone
tuning could resonate the finding of Nordmark and Ternström (1996): Experienced
musicians preferred major thirds (mean 395.4 cents) closer to equal temperament
than just intonation. local tempering and meantone tuning had pure major thirds in
chord progressions, which might indicate the preference for consonance and non-
beating chords supporting the finding of Johnson-Laird et al. (2012) regarding that
major triad was the most consonant chord (rated 1.67) whereas minor triad had a
rated dissonance of 2.41.
How were the preferences of the six comparisons of the four tuning alternatives
distributed? When pitch drift was compared to equal temperament (85.2%) and
meantone tuning (85.9%), pitch drift was clearly and significantly shunned. local
tempering gathered 59.8% from preference judgments against pitch drift. equal
temperament and meantone tuning were practically equal. Equal temperament was
slightly more preferred compared with local tempering. It is a bit surprising that
local tempering was slightly more preferred against meantone tuning, but the result
was not significant. The results are understandable remembering that equal
temperament has been found a typical reference system among wind
instrumentalists (Duke, 1985; Karrick, 1998; Kopiez, 2003; Leukel & Stoffer,
2004). On the other hand, aiming at just intonation was seen in studies of Karrick
(1998) and Leukel and Stoffer (2004) and with singing ensembles in vertical thirds
in the study by D’Amario et al. (2018). In practical situation of singing ensembles
and choirs, pitch drift can happen (Fischinger et al., 2015; Howard, 2007a, b) or
not (D’Amario et al., 2018; Devaney et al., 2012), but offered as aural sample with
a synthetized sound, it was not accepted very well.
I also clarified, how the interlinked preferences of tuning alternatives are
related to each other. There was a strong, negative correlation between pitch drift
preferences and equal temperament preferences: The more participants preferred
equal temperament, the less they preferred pitch drift. The more participants
preferred meantone tuning, the less they preferred pitch drift. The more participants
preferred equal temperament, the less they preferred local tempering. The more
participants preferred meantone tuning, the less they preferred local tempering. The
more participants preferred meantone tuning the less they preferred equal
temperament. The negative correlation between equal temperament and meantone
tuning preferences can be interpreted as alternatives for participants.
As known, sharp tendency seems to be true among the performances of string
instrument players (Bohrer, 2002; Burns and Ward, 1999; Byo et al., 2011; Fyk,

195
1998; Kantorski, 1986; Sundberg, 1982). In this experiment, “sharpest” tendency
was in equal temperament which was barely the most favored. It is a question worth
speculating, how Pythagorean tuning would have been preferred in this comparison.
The fourth research question was the following: To what extent can these
preferences be explained by the participants’ individual features (e.g., choral
experience)? These individual features were the following: A) choral background,
B) gender, C) age, and D) instrumental experience.
For none of the four tuning alternatives was there a significant difference in
preference for the tuning as a function of the participants’ choral background. There
were found no statistically significant differences between genders for none of the
four tuning alternatives, either. There were found no statistically significant
correlations between the variable instrumental experience and intonation
preferences. There was almost a same situation between age and intonation
preferences. Almost significant correlation was found between local tempering
preferences and age. The older the participant was, the more he/she preferred local
tempering.
When the means across the five consecutive blocks of the experiment were
broken down, there occurred several significant differences between experiment
blocks in pairwise comparisons. Pitch drift was the most unpopular choice in every
section. In last section (Trials 25–30), it was better accepted. Local tempering
preferences vary most of these four alternatives (M varied from 1.25 up to 1.92).
In the beginning equal temperament was preferred as often as local tempering, but
from the second experiment item (chord progressions 7–12), it took its place as the
most popular tuning manipulation. Meantone tuning preferences seemed to have
two separate categories, M approximately = 1.5 and M approximately = 2.0.
5.3 Practical implications from Experiment 1
The third objective of this dissertation is to find out, how the usage of the syntonic
comma, as assembled in Experiment 1 and 2, could help in teaching intonation
skills in music education. The results of Experiment 1 and 2 gave some practical
implications which I introduce in the following Sub-chapters 5.3.2 and 5.3.3. In
addition, there will be some practical implications based on research literature
concerning intonation issues from the music education point of view in Sub-chapter
5.5. Which factors do influence pitch matching? How to improve intonation in
practical situations of music? Practical implications are introduced in Sub-chapters
5.3, 5.4, and 5.5.

196
As a conclusion, the Experiment 1 showed that the complexity of the musical
material affected the recognition of mistuning which gives motivation for the
development of new exercises for intonation skills. Mistuning was detected very
well in simple harmony. This sensitivity of listeners indicates that aiming to better
intonation is possible. Instrumental experience and age were positively connected
with the recognition of the mistuned triad and this fact suggests improvement of
intonation skills in music pedagogy of all levels. Some clues were found according
to which the choir voice the music learner sings might affect the ability to recognize
mistunings. This, however, needs further studies.
The results of the Experiment 1 showed that the distribution of recognition of
mistuning in the whole data set was broad. It means that pupils in music-intensive
classes are differentiated in relationship with harmonic discrimination. This
experiment showed that the complexity of musical material influenced the
recognition of mistuned triad. The high values of recognition (over 90%) in the
simplest chord progressions indicate that it makes sense to strive for pure intonation
always when it is possible. The mistuned triads were recognized very well, in places,
which gives a concrete tool to illuminate to problem of the syntonic comma in
music pedagogy. When it has been illuminated by pedagogical tools, the next level
is to learn tools to eliminate it.
As an unexpected result of the Experiment 1 was that the distribution of
recognition of mistuned triad was broad. This experiment separated the participants
effectively. It means this experiment might be used as part of entrance examination
to professional music studies. This needs, however, further investigations.
A syntonic comma in melodic movements in Category 2 produced an
unexpected result: The target (vertically mistuned triad) was detected better, if there
was a syntonic comma also in melodic movements. This could be the key to open
a deep discussion of harmonic and melodic intonation and it should be investigated
more. It is possible to construct intentionally such harmonic progressions where
the mistuning of the syntonic comma is assembled only into melodic line while
vertical harmony staying pure. Which one disturbs more: mistuned vertical chords
or mistuning in melodic lines?
One clear observation of this experiment is that age and instrumental
experience have a strong relationship to recognition of mistuning. This is, of course,
not surprising at all but strengthens the motivation to develop learning tools of
intonation skills in music education. If learning music theory is based on only
equally tempered music, it may be misleading in relationship with many aspects.
The chord progressions of the experiment of recognition of mistuning (or the

197
corresponding ones) could be used in illuminating except the syntonic comma, but
also the elements of intonation. It would be completely possible to create a lively
learning material for ear training and music theory, which keeps intonation issues
attached from the beginning of learning. Young children could be accustomed to
pure triads in singing and playing if the teacher is aware enough of intonation issues.
The question of the syntonic comma could very well be presented for a 12-year-old
child attached to ear training and music theory. The demonstrations of different
temperaments and tuning alternatives can be performed with simple synthesizer.
The idea of the experiment of intonation preferences was partly based on the
findings of Howard (2007) and Howard et al. (2013). He reminds that good
listening skills are important. He thinks that the following manners are not
recommended when aiming at just intonation: Choir practice with instruments
tuned in equal temperament, listening equal temperament music, working with
conductors, who are unware of tuning implications, presenting an equal-tempered
chord to start the piece, being trained to remain in tune, and poor listening skills
(Howard, 2007a, p. 93).
It is extremely difficult to avoid listening to equal-tempered music. But in
acoustic ensembles and choirs, the awareness of complexity of intonation issues
may help player and singers to aim better intonation, which is not totally based on
equal temperament. Otherwise the recommendations of Howard seem to make
sense.
The experiment of recognition of mistuning turned out to be a functional
method to measure, how well student and pupils can recognize of the mistuned
minor triad. In music education, it could be more. These kind of chord progressions
can be a tool for harmony analysis and voice leading. But above all, this set of
chord progressions is a functional tool for a pedagogy of intonation systems. Just
intonation, the syntonic comma, tempering, mistuning, just few mentioned. The set
of samples could be used for literal tasks, audible analyzing and even singing and
playing. Four-voiced singing of samples including a syntonic comma could open
one’s eyes (and ears) for pure intonation as well as the strategies for tempering. A
distant concept of the syntonic comma would awake for students and pupils to work
on.
5.4 Practical implications from Experiment 2
As a conclusion: The results of Experiment 2 give new possibilities to increase the
awareness of different temperaments and tuning alternatives. Professional music

198
students were ready to accept old tuning method (meantone tuning) as well as the
most familiar equal temperament which surrounds us all over the Western world.
The results of preferences of local tempering were also encouraging to develop new
means for dealing with the syntonic comma in modal/tonal material.
In the Experiment 2, pitch drift executed in one change of chord, caused
suspicion. It is difficult to imagine that the demand on stable pitch would easily
loosen. Many choral conductors use equally tempered piano to support the learning
process. Unfortunately, this does not support the development of fine adjustments
of choral intonation. As worst, an amateur choir may use it during the whole process.
Singers never hear the purest alternatives of harmony. According to Howard (2007b,
p. 315), if choral conductors want to achieve consonant tuning, they should avoid
piano in rehearsals and give only the tonic of the first note in the beginning of the
performance piece.
Howard et al. (2013) argue that the overall pitch drift can cause confusion
among choir leaders which can lead to use of equal-tempered tuning reference in
choir rehearsal: That is not the way to achieve the most pleasant sound and
maximum consonance. He continues that the most skillful choirs may allow the
‘pitch drift’ to achieve the most consonant intonation of chords singing a cappella.
(Howard et al., 2013, pp. 136–141).
Tuning alternatives of the experiment of intonation preferences can be divided
in two categories based on how the dilemma of the syntonic comma is solved. In
pitch drift, the syntonic comma causes pitch drift in the second-degree minor triad:
The fundamental pitch rises or falls by a syntonic comma. 1) The usage is local, it
is tar geted to one chord. In local tempering, the usage also is local: One (mistuned)
chord is manipulated in an otherwise standard tuning system, equal temperament.
Instead, the fixed temperaments, equal temperament and meantone tuning,
distribute the mistuning due to the syntonic comma throughout the scale: 2) The
usage is global. As explained in Sub-chapter 2.1.6., equal temperament divides
comma in equal parts, meantone tuning distributes it in in various parts of the scale
in different amounts.
In the present experiment, the local usages (pitch drift and local tempering)
were preferred by the participants less other than either equal temperament or
meantone tuning. Fixed systems with global usages thus appeared to be more
readily acceptable to the listeners than systems with local alternatives. In practical
terms, equal temperament and meantone tuning can be considered as equal in favor.
On the other hand, local tempering preferences toward meantone tuning
preferences, produced a surprise (local tempering = 54.6%, meantone

199
tuning = 45.4%): the difference was almost significant. As mentioned, equal
temperament was significantly more preferred toward local tempering.
It can be considered as a one clear result of the Experiment 2 that the music
educators were shy of pitch drift in tonal and modal musical textures. All
comparisons involving pitch drift suggested that the listeners tend to avoid the
sound of pitch drift in favor of other possibilities. In comparison, the other three
tuning alternatives were notably better accepted.
It was not unpredictable that pitch drift was turned down by the listeners. There
does not seem to exist a tradition of pitch drift for instance in choral singing. If the
fundamental pitch changes during a choral performance, it is likely to be judged as
a failure, if indeed it is noticed at all. It is not very well known that pitch drift could
also be a sign of purely sung vertical chords rather than just evidence for the lack
of skill on the part of the singers.
Following the views of Howard et al. (2013) the use of equal temperament
could perhaps be somehow updated. It could be freshening to try earlier
temperaments or why not, new innovations in some occasions. For example, simple
exercises in ear training lessons, in warm-ups, in instrumental lessons, only few
examples to be mentioned, could be accompanied with local tempering or
meantone tuning. The ordinary praxis has shown that the most of the warm-up
exercises constitute of notes triads with rise–fall method. Or singing scale upward
and downward. There is no reason why this kind of exercises should be run with
equal temperament. The traditional just intonation itself could be the basis of these
exercises. The keyboard used through local tempering could be used in most warm-
up exercises and in harmonically simple songs. The most of the chord could be
sung purely.
Pitch drift could be allowed when a choir or vocal group exercises pure vertical
chords. It is practically very demanding but improving. If pitch drift arises with
singing group in particular chord progressions, it is a very concrete illustration for
the syntonic comma.
Local tempering is possible and usable due to well-developed technology. The
audio samples where ii triads were converted to equal temperament were fairly
simple to generate. Of course, a locally changeable temperament cannot by
definition be applied as a fixed tuning system in, say, a keyboard. It is very easy to
program a new temperament to a digital synthesizer. This does not have to be a
keyboard. It is possible to use synthesizer rack and connect it to any digital
keyboard anywhere. But this tuning manipulation, local tempering, would require
a separate software. All pitch classes of the ii triad are, in this manipulation, “stolen”

200
direct from equally tempered scale. So, their exact pitches vary slightly from those
of just intonation scale. The software should recognize ii chord played and give
always pitches corresponding to equal temperament. Respectively, those pitch
classes as a part of other chords, should stay in just intonation scale.
Local tempering as an innovative tuning system, was not, in general, rejected
by the participants in this limited experiment. It could be used anywhere where the
musical material is simple enough.
Local tempering could be an alternative adaptive tuning developed by
(Sethares, 1994). It is a method of dynamic adjusting for the pitches of note, called
an adaptive tuning. It maintains fidelity to a desired set of pitches and intervals,
and it can be modulated to any key. This invention is algorithm-based method
which changes the pitches of notes to maximize consonance during musical
performance. The system can be operated in real time and it is responsive to the
notes played. The adaptive tuning is a kind of generalization of the methods of just
intonation in two ways. It is independent of keys and it can be applied to common
harmonic as well as to timbres with nonharmonic spectra. This method does not
require specific musical knowledge. It retains both consonance and the ability to
modulate. The expense of the system is the microtonal adjustments in the pitch of
the notes. The timbre and the piece of music performed determine adaptive tunings
(Sethares, 1994, pp. 14–17).
One could easily conclude that meantone tuning should be used when it is
historically justifiable: in music from late Renaissance and early baroque periods.
In such contexts, there is no excuse to replace meantone tuning with equal
temperament. At least the listeners of this experiment would seem to have accepted
meantone tuning as well as they accepted equal temperament.
Experiment 2 as a tool of teaching intonation skills
The experiment of intonation preferences turned out to be a functional method to
chart out musician’s preferences for intonation choices. In addition, it could be
functional also in teaching different tuning systems audibly for pupils and students.
Above all, it would an innovative demonstration for pitch drift. Understanding this
phenomenon helps pupils and students to extend their intonation awareness. Pitch
drift illustrates the syntonic comma. Almost in studies of conservatories and among
university music students, student could make small intonation analyses in small
samples including pitch drift.

201
5.5 Practical implications from pedagogical motivations
In addition, as remembered from Sub-chapter 2.4, there are several inventions and
methods to improve intonation. Music educators are recommended to apply these
findings of research literature. The following sub-chapters include summarized
knowledge to apply intonation issues to practice flavoured with my experiences.
5.5.1 Factors influencing intonation: Summary
I will create a short summary concerning factors influencing intonation from the
basis of previous research on pedacogical motivations (see Sub-chapter 2.4). This
question is here considered from the viewpoint of choirs, wind bands and orchestras
and general factors.
Choirs
There are a number of factors influencing pitch matching in performances.
Concerning singing voice, the next factors influence the intonation: Breath support,
vibrato in choir; articulatory perturbation of pitch singer spacing and room
absorption on the self-to-other ratio, common partials, high partials, vibrato, and
the interval (Ternström & Karna, 2011; Ternström & Sundberg, 1988). Fischinger
et al. (2015) found that intonation is only a weakly influenced by room acoustics
(varied room acoustics, three levels). The pitch can differ a bit in the left and right
ears. The intrinsic pitch, the pitch-amplitude effect, breath support and complex
modulations can affect the choir going out of tune (Ternström & Karna, 2011;
Ternström & Sundberg, 1988). Demorest and Clements (2007) found that the
choice of matching task, suitability of singing register, and tasking conditions, can
influence pitch matching. The gestures influenced positively on pitch-matching
accuracy among children in choirs (Liao, 2008; Liao & Davidson, 2016). Gestures
and/or movement training influenced positively on singing in tune (Liao &
Davidson, 2016).
To my experience, all these factors seems to be true. Especially strong vibrato
of classically educated singers in choir singing makes aiming good intonation
challenging. Gestures, in right amount, seems really effective especially among
children choirs. On the other hand, I have seen a few conductors, who mostly
disturb singers with lively gesturing.

202
Wind bands and orchestras
Schlegel and Springler (2018) had recommendations to wind band educators. 1)
Teachers should offer players sound models which are in tune and out of tune. 2)
The use of chromatic tuners (to adjust instrument length at the starting phase of
rehearsals. 3) Students should have a possibility to train pitch discrimination and
pitch matching separately because of these skills seem to be discrete abilities
(Schlegel & Springler, 2018). Tuba sound was not an appropriate reference
stimulus for mass tuning (Byo et al., 2011).
Jagow (2012) listed the factors influencing the intonation by wind players: Air,
posture, embouchure, mouthpiece, amount of mouthpiece, angle of mouthpiece, lay
of mouthpiece, barrel and bocal length, horn hand positions, tongue positions, reed
condition, equipment, dynamics, pitch concept, balance, timpani pitch, percussion,
and temperature. The lowered external temperature lowers the pitch (Powell, 2010).
Garofalo (1996) listed 10 factors that may cause poor intonation in band and
orchestra performance: 1) Condition and quality of the instruments and accessories,
2) basic playing procedures, 3) insufficient warm-up (wind instruments), 4) playing
of the standard tuning frequency (wind instruments), 5) psychological and musical
phenomena, 6) pitch tendencies of instruments and performers, 6) poorly trained
ears (students with little or no ear training), 8) poor balance (vertical dynamics), 9)
poor seating arrangement, and 10) poor acoustics in the rehearsal and performance
environments.
As flute player and wind ensemble conductor, I may say: “Been there, done
that.” For instance, one single (cheap) unqualified wind instrument can ruin a
remarkable amount of efforts achieving correct intonation. Cold circumstances for
wind ensembles playing in patriotic events are familiar to most wind players in
Finland. In the relation of “poorly trained ears,” to my experience, there are a lot
of possibilities to make.
General factors
Kopiez (2003) found a few more affecting pitch matching: musical context, timbre,
register, dynamics, beat frequencies, tone durations, size of intervals, effects of
partial position of pitch production, and pitch classes. Worthy (2000) found that
tone quality influenced the performed concert pitch and “bright” tones were judged
sharper in pitch and “dark” tones flatter in pitch. He also noticed that woodwind
groups performed sharper than brass groups. Morrison and Fyk (2002) discovered

203
that specific feedback improves the pitch matching better than instructions alone.
Accurate and inaccurate visual feedback influence the tuning accuracy of high
school and college trombonists. Instrumental experience improved tuning accuracy
(Schlegel & Springler, 2018).
I have heard numerous brass quintets and wood wind quintets and the finding
of Worthy (2000) sounds familiar. Brass ensembles, on the whole, can achieve in
right guidance justly intonated vertical chords.
5.5.2 Improving intonation: Summary
I have picked up some methods from the basis of previous research on pedacogical
motivations (see Sub-chapter 2.4). Beat elimination, algorithms for pitch matching
and other methods are discussed.
Beat elimination
Wuttke (2011) got to know that there are effective methods in intonation training:
voice groups tune perfect intervals, building chords (root-fifth-third), performing
chords ascending and descending by semitone, performing exercises and stopping
on chords (identifying the partials of the chord), and using beat elimination process
to build the awareness of intonation. Originally, Miles (1972) developed a well-
working method of “beat elimination” and its utility has been noticed by Powell
(2010), Kopiez (2003), Wolbers (2002), and Garofalo (1996).
The chord progressions of Experiment 1 in this dissertation, could be one way
the practice to heat the beats only by listening. In real life, I have used this method
of Miles (1972) without understanding the elimination of beats. Completely
unprofessional players can learn to hear the beats in vertical triads, if they are
guided correctly.
Algorithms for pitch matching
Stange et al. (2018) enabled the musician play in just intonation in any key with a
dynamically adapting tuning scheme. Villegas and Cohen (2010) introduced a
program for adjustable intonation: It aims at pureness to intervals (so close to beat-
free sizes of intervals, as possible, just intonation intervals. Milne et al. (2007)
invented a system which simplifies just intonation into system that can be
controlled and played easily. They introduced keyboard fingering models to
204
different tunings and keyboard fingering models for different tone order to several
tuning systems, like 5-TET, 7-TET, 12 -TET and 17-TET and even models to
different mean tone temperaments. Dalby (1992) developed the HITP.
I have use different temperatures simply assembling them into synthetisizer
module. Of course, they are all closed systems, but the use of endless old
temperaments is available with very simple technical operations.
Other methods for training intonation skills
Schellenberg and Moreno (2010) found that musically trained participants
outperformed untrained participants in pitch-processing speed and relative pitch
and frequency discrimination. Henry (2004) found that singers seemed to benefit
of instructions using targeted pitch skills. Henry tested 15 pitch skills surrounding
cadential, chordal and scalar tasks finding that both participant groups achieved
significantly higher mean scores on the post-test than on the pre-test. Wolbers (2002)
discovered that singing intervals and phares in the band rehearsals can improve
pitch, balance, and musical syntax. Pasqua (2001) developed a method to increase
intonation awareness and improve tuning skills during regularly scheduled
instrumental lessons and it was designed in a cooperative learning model using four
phases of tuning activities. Fogarty, Buttsworth, and Gearing (1996) reported the
lack of motivation in intonation training tests. Among woodwind instrumentalists,
knowledge of directional mistunings improved tuning accuracy of wind players
(Yarbrough et al., 1995).
Garofalo (1996), again, has listed procedures helping to improve intonation:
Treating intonation awareness of players, demonstrating “in-tuneness” and “out-
of-tuneness,” requiring intonation charting with electronic tuner, teaching theory
fundamentals and ear training, teaching singing, maintaining constant temperature
and humidity, assigning parts for good balance, experimenting with seating (in
orchestra), and refining warm-up and tuning procedures.
There are also avoiding training methods: Playing one note alone does not
improve player’s intonation (Morrison, 2000; Yarbrough et al., 1995). Playing one
note. I have experienced this several times through decades. This can better your
embouchure but not your intonation.

205
5.6 Music without syntonic commas
The esteemed reader of this dissertation might conclude that singers or
instrumentalists cannot escape the syntonic comma anywhere where Western music
(triads including) exists. In a sense, one may say so. In fixed temperaments, like
keyboards, the syntonic comma is very effectively “hided” by spreading along the
chromatic scale of octave. But in most cases, where triads are somehow present in
acoustic musical situations with possibilities to adjust pitches without steps, the
syntonic comma occurs in chord movements. If performers, for example in vocal
ensembles, prefer vertical purity and beat minimization, the part of melodic
movements has to be altered by a syntonic comma. In addition, pitch drift may
happen. If singers prefer melodic logic for instance in the direction of equal
temperament, or even sharper direction, at least the part of vertical chords has to be
tempered. In certain circumstances, say, in clear tonal material of in four-part
texture with typical tonal cadences, the syntonic comma is an inevitable
discrepancy of intonation. Hopefully, the present research has enlightened the
essence of syntonic comma in Western tonal music.
However, there are some musical material to be performed in just intonation
without the concern of dealing with the syntonic comma. In Renaissance period, a
selection of harmonically simple material was found to be sang with purely tuned
intervals and triads. The secret of these works is that typical tonal cadences were
not needed. Two pieces of sheet music including vertical and horizontal intonation
analysis are presented in Appendixes 21 and 22. Everyone can compose more
music beyond the clear limits of just intonation.
5.7 Description of ethical issues
In both experiments, the listeners were informed consents. In Experiment 1, the
most participants were underaged. The permission of research was asked from the
corresponding office holder of school administrative. The informing presentation
and approval form (see Appendix 2) were sent to guardians of the pupils under 18
years. Only the pupils with approvals took part to the experiment. The research was
not a part of normal activity of school or teaching unit. The participants of the
Experiment 2 were grown-ups. Participants in both experiments had an opportunity
to interrupt the experiment, if they wanted. Nobody did.
The participants of both experiments listened to audial stimuli in the form of
chord progressions. In Experiment 1, the participants were asked to answer

206
(literally), what is the most mistuned/out-of-tune chord in the chord progressions
performed. The audial stimuli were performed digitally, and they were listened by
headphones. The volume of samples was less than 80 dB, and it did not cause any
harm. In the Experiment 2 the participants were asked to answer (literally), which
one of two chord progression manipulated by different ways they preferred. The
duration of a sample in both experiments was approximately 10 seconds. The
necessary rest between the sample pairs was five seconds.
The experiments of this research did not cause the damage for the participants.
So, there was no safety threat for participants. Nor there was an exception of
principle of permission based on knowledge. The integrity of participants of
Experiment 1 and 2 was guaranteed under experiment conditions.
5.8 Critical observations of the present research
The data collection of this research was rather complex and lengthy process. At
first, it was the purpose to investigate professional musicians Experiment 1. 335
professional musicians were invited with careful messages and administrative help.
Once I met a whole orchestra (60 musicians) and got an opportunity to perform the
research concept mutually. Seven professional musicians of total 335 from three
organizations accepted the invitation. All this left me an impression, according to
which recognition of mistuning among professional musicians may have been a
sensitive subject of research. Perhaps measuring the recognition of the key ability
of intonation caused a feeling of inconvenience. Unfortunately, I had to change to
target audience. It would have been extremely interesting to investigate
professional musicians but perhaps someone will succeed in it better than author.
If this research was started from the beginning, there would be quite many
things to be do in a different way. The fundamental idea of the experiment of
recognition of mistuning is functional. Musical material was divided into three
categories along the complexity of musical material. The simplest category (1) and
the most complex category (3) worked very well. The results showed that the
material was logically composed and usable. Instead, Category 2 divided in two in
recognition of mistuning: chord progressions with melodic commas and chord
progressions without melodic commas. It would absolutely been wise to confirm a
separate category which includes chord progressions with melodic commas only.
In the early stage of this PhD project, there were no less than 72 chord progressions
composed for this experiment. There were also Categories 4 and 5. Category 4
included 12 chord progressions, which all had melodic commas in one chord
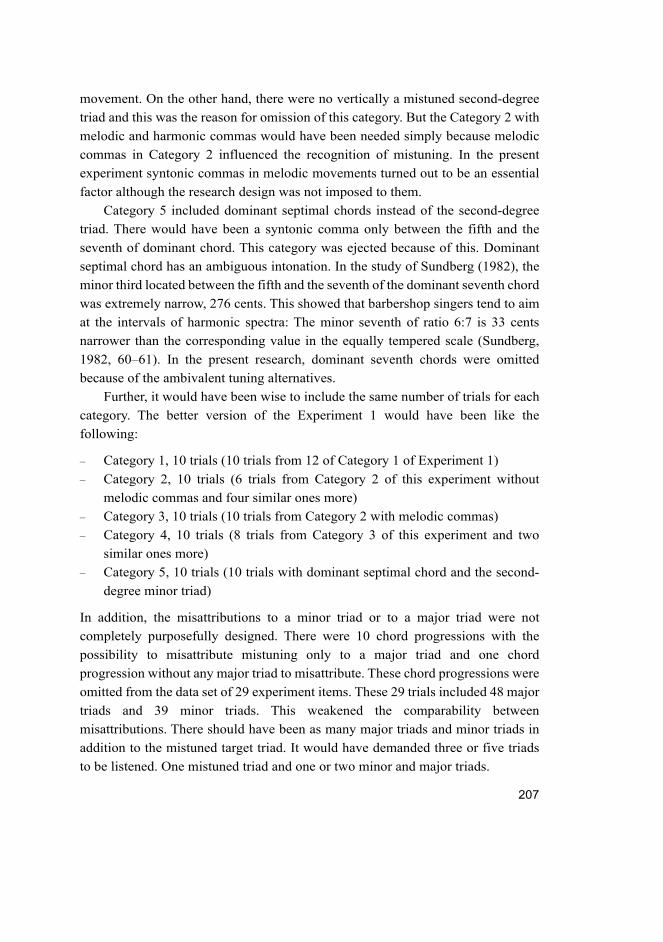
207
movement. On the other hand, there were no vertically a mistuned second-degree
triad and this was the reason for omission of this category. But the Category 2 with
melodic and harmonic commas would have been needed simply because melodic
commas in Category 2 influenced the recognition of mistuning. In the present
experiment syntonic commas in melodic movements turned out to be an essential
factor although the research design was not imposed to them.
Category 5 included dominant septimal chords instead of the second-degree
triad. There would have been a syntonic comma only between the fifth and the
seventh of dominant chord. This category was ejected because of this. Dominant
septimal chord has an ambiguous intonation. In the study of Sundberg (1982), the
minor third located between the fifth and the seventh of the dominant seventh chord
was extremely narrow, 276 cents. This showed that barbershop singers tend to aim
at the intervals of harmonic spectra: The minor seventh of ratio 6:7 is 33 cents
narrower than the corresponding value in the equally tempered scale (Sundberg,
1982, 60–61). In the present research, dominant seventh chords were omitted
because of the ambivalent tuning alternatives.
Further, it would have been wise to include the same number of trials for each
category. The better version of the Experiment 1 would have been like the
following:
– Category 1, 10 trials (10 trials from 12 of Category 1 of Experiment 1)
– Category 2, 10 trials (6 trials from Category 2 of this experiment without
melodic commas and four similar ones more)
– Category 3, 10 trials (10 trials from Category 2 with melodic commas)
– Category 4, 10 trials (8 trials from Category 3 of this experiment and two
similar ones more)
– Category 5, 10 trials (10 trials with dominant septimal chord and the second-
degree minor triad)
In addition, the misattributions to a minor triad or to a major triad were not
completely purposefully designed. There were 10 chord progressions with the
possibility to misattribute mistuning only to a major triad and one chord
progression without any major triad to misattribute. These chord progressions were
omitted from the data set of 29 experiment items. These 29 trials included 48 major
triads and 39 minor triads. This weakened the comparability between
misattributions. There should have been as many major triads and minor triads in
addition to the mistuned target triad. It would have demanded three or five triads
to be listened. One mistuned triad and one or two minor and major triads.

208
The other point of this experiment was originally to investigate professional
musicians, university music students and school pupils. As mentioned, it was
almost impossible to attract participants among the musicians. But it would have
been extremely interesting to compare professional musicians and university music
students and school pupils of music-intensive classes. In addition, the original
thought was to run both experiments for all three groups of participants. The data
would have been rich and these designs would have made possible to investigate
potential connections between recognition of mistuning and intonation preferences
of participants in three level. How these experiments materialized in reality were
considerable compromises with respect to participants, and it can be considered as
sort of failure.
I organized some unofficial pilots before the final research design concerning
the experiment of recognition of mistuning. In my research process, a couple of
sub-experiments gave some hints about influence of timbre to the mistuning
recognition. The original plan was to execute the chord progressions with two
different sound: the sini-wave sound and piano sound. The problems of attracting
the participants made me to abandon this research design: I had to choose only one
sound. Synthetic piano sound is closer to practical music education than sini-wave
sound. In these pilots, I made attempts with different tempos and it did not seem to
influence the recognition of mistuning. Hence, I chose a chorale tempo, 52 bpm
into the final experiment.
When it comes to the basis of Experiment 2, a low reliability and validity of
this experiment requires consideration. In Experiment 2 it would have been perhaps
more informative if there were such tuning alternatives which differed from each
other more than those tuning alternatives used. The differences between local
tempering, equal temperament, and meantone tuning and especially local
tempering and meantone tuning were obviously so small that the experiment did
not completely measured such qualities it was intended to measure. For example,
Pythagorean tuning would probably have been different enough to bring clearer
results. Pythagorean tuning produces wide major thirds for I, IV and V triads and
hence, high leading tone for dominant triad. Pythagorean tuning, local tempering,
pitch drift, and some artificial tuning manipulation with mistuned elements would
have brought interesting results. On the other hand, the alternatives used in
Experiment 2 were natural alternatives which could have been used in real musical
contexts.
The clearest imperfection of the design of the Experiment 2 was the selection
of background variables. In the beginning of running process of this experiment,

209
the participants were asked to describe their own musical background. As a result
of these questions, the only valid criterion was choral background/no choral
background. This process could have been planned more pedantically in
relationship with choosing the participants. On the other hand, the recruiting the
participants is challenging.
As mentioned in Sub-chapter 5.1, the variety of main instrument of participants
was unilateral: the complete groups of instruments did not gather enough
participants. It would have been wise to use an open question.
5.9 Recommendations for further research
Intonation in performance is a complex phenomenon. If there is an instrument with
fixed pitch (like keyboard), the pitch matching of musician is wise to target to those
fixed pitches. A cappella choirs, string orchestras, wind ensembles are much more
complex. There is standard tuning frequency of A4 (440, 442, 444 Hz) and the rest
is up to the player. Of course, the fingerings of wind instruments produce certain
approximate pitches near equal temperament, but the accuracy of pitches is highly
depended on blowing technique, temperature, acoustics, etc. A possibility to adjust
pitches is common for all orchestral instruments excluding pitched percussion and
harp. What is “pure” or “mistuned” depends of style period of music. This, in turn,
is connected to complexity of harmony. Thick atonal harmonies require equal
temperament. Instead of this, very easy tonal harmonies can be performed, of
course, with equal temperament, but they, to my opinion, simply sound better using
just intonation.
The conclusion made in the basis of the research literature of intonation in
performance showed several possibilities for future potential. Three experiments
would be needed. The participants of the experiments could be university music
students divided in three groups. The first experiment group is called beat
elimination –group (according to Miles, 1972). The second group, the comma
group, would be taught by the method which is developed for this research and it
is based on the syntonic comma –phenomenon.
The experiment of improving pitch matching
There are a few chord progressions to be sang by the groups. Most of the chord
progressions can be singed/played in just intonation. There are also chord
progressions which include chords with the discrepancies of the syntonic comma

210
(21.5 cents). In other words, some chords in chord progression cannot be
singed/played in just intonation without beats. First, the purpose is to find out how
effectively the participants can learn to play chords in just intonation and second,
to find relevant strategies to avoid the problems of the syntonic comma in ensemble
playing in those same tonal chord progressions. The intonation skills would be
estimated by measuring the sizes of intervals of chord progressions in cents. The
accuracy of intonation produces by the participants would be estimated by
comparing the results with the just intonation intervals. In those chord progressions
including syntonic commas, the estimation is focused on the strategies of tempering
the syntonic comma in certain chords. The tempering of the “comma-chord” is
successful when the fundamental pitch stays stabile. Strategies to avoid the
syntonic comma are tempering: stretching or compress intervals in triads with
syntonic comma.
The participants plays/sings a part of four-part harmony
There would be four tasks where the participants are asked to play a part of four-
part harmony. The first task is to play soprano part. The second task is to play alto
part. The third task is to play tenor part and finally the fourth task is to play bass.
There are four different chorale-styled pieces in four-part harmony. This study
would include three intonation experiments: The first one in the beginning, the
second one after the first intervention, and the third one after the second
intervention. Before the first intervention, the starting level of the intonation skills
of students would be measured.
There would be basically two skills to observe and measure. First, the ability
to produce beat-free intervals as a second tone of the intervals (1.8, 5, M3, m3) or
as a part of a major triad or a minor triad. Second, the ability to temper triads with
the syntonic comma (21.5 cents) would be observed and measured.
The beat elimination group would be trained to play/sing beat-free intervals
and triads. The comma group will be trained to understand theoretically the
principles of intonation in tonal music to aurally discriminate beat-free triads.
All the intervals would be played by both groups are measured and tabulated.
The deviations from just intonation are measured and would be analyzed. The basic
aim is to figure out how the chords with the syntonic comma would be handled.
The tempering of chord including the syntonic comma has to be done somehow. It
is also necessary to know, if the ensembles can produce beat-free chords in those
chords, where it is theoretically possible.

211
The interventions needed
This study would include two interventions. Before the first intervention the
intonation skills of the participants are measured with the experiment of intonation
skills which is the first experiment. The first intervention: There would be two
groups of participants. The first group is taught with beat elimination –method. The
second group is taught with the comma method. After this, it is time for the first
intervention. The second experiment is taking place after the first intervention in
both groups.
Experiment 1 in the present research seemed to discriminate participants in the
means of recognition of mistuning. It indicated that ability of recognize a vertical
syntonic comma in the context of pure triads discriminated the participants of this
study effectively. The by-product of this study was the fact according to which
Experiment 1 measured cogently the one central aspect of intonation skills: the
perception of pitch and harmony. There will be a gap of research to find out whether
this experiment could describe some aspects of musicality. One possible research
design could be a comparison of this experiment and some well-known and time-
honored musicality test. This experiment could be supposed to be a noteworthy tool
to measure certain aspects of musicality.
The question of harmonic versus melodic intonation needs further studies. For
instance, one common conception in instrument pedagogy is “high” leading tones.
By gut feeling, this is happening independently from the musical style, context, or
harmony. Previous findings have shown that there is often a tendency for sharp
intonation. However, it is rather clear to sketch an optimal intonation for limited,
homophonic harmony to maximize pure intervals vertically. Yet, the melodic line
above the harmony can be ambivalent for this intonation strategy. It could be
thrilling to create experiment design where high leading tones are assembled to
homophonic harmony. In my opinion, they do not sound good, I have tried.
Professional musicians and instrument pedagogues would be the group of
participants. If these high leading tones in harmony would be disliked, the
pedagogy of intonation should be rethought. Possibly.
The influence of tempo to mistuning recognition should be studied, too. My
unofficial sub-studies with two tempos did not seem to bring clear hints, but this
should be studied properly.
Now, when the recognition of the second-degree minor triad is now charted out
quite thoroughly, it would be reasonable to investigate the recognition of mistuning
in major triads, too. For instance, the major thirds of major triads could be tuned

212
into Pythagorean size (81:64 = 407.82 cents). The fifths could be tuned as “Wolf”
(40:27 = 680.45 cents) or pure (3:2 = 701.96 cents).
The detection of mistuning could be investigated more precisely. The
complexity of the musical material could be added to extremity: chromaticism of
late Romantic period or atonal harmony. On the grounds of Experiment 1 it is
possible that mistuning of the syntonic comma would not be perceived very well
in such a complex harmonic context. It would be tempting to think that the
harmonic context where the syntonic comma is not perceived could be a
justification to equal temperament. Respectively, the harmonic context where the
syntonic comma is well detected, should be the environment of just intonation or
extended just intonation. This could, at best, formulate a theory of optimal
intonation: The recognition percentage of the syntonic comma could determine an
intonation system recommended to use, at least theoretically.
In addition, it would be interesting to find out, whether the mistuned triad by a
syntonic comma is recognized in equal temperament context as well as in just
intonation context. This could be a part of the series of experiment to formulate a
theory of optimal intonation mentioned in previous lines. There could be a few
experiments all measuring the perception of the syntonic comma. The experiment
could include excerpts from Renaissance music, baroque period, classism,
Romantic period and atonal music. The musical passages would be performed with
maximum consonance in extended just intonation. When this is not possible (late
romanticism, atonal music), the excerpts would be assembled to equal temperament.
If we stick in chord progressions used in two experiment of this dissertation,
they could be investigated using singers and players. These chord progressions, or
same type of chord progressions, could be played by participants. Because of the
exact knowledge and transparency of the syntonic comma, it would be easy to
create a research design where participants would sing or play those chord
progressions. The main focus would, hence, be how participants solve the problem
of the syntonic comma.
As written in Sub-chapter 3.4.1, the chord progressions used in the Experiment
1 and 2, were organized at basis of practical music theory. The modern cognitive
neuroscience (e.g., Slater et al., 2018) could help future potential so that target to
be perceived, could be more one-dimensional than it was in Experiment 1.
It seems that the equal temperament, from the basis of ordinary observation,
assembled to electric instruments produces flat intonation among singers. This
possible phenomenon should be studied scientifically. At the same time, it would
be ponderable to study the intonation by singers above the harmony performed in

213
equal temperament and harmony performed in just intonation. Pop music
harmonies are often very simple. It would be rather simple to apply a maximally
pure tuned temperament to them. To develop this research subject further, it could
be expanding to find out, what kind of reactions and preferences maximally pure
tuned harmony assembled to pop music or even jazz music can cause among
listeners.
Equally tempered pianos are important tools of choir directors around the
Western world. There are a plenty of easy ways to assemble different temperaments
to electric keyboards. The influence of pure tuned triads to the intonation by choir
or ensemble could be a worth of studying.
There is solo repertoire in string instrument literature in which couple, triple
and quadrable stops are used. The intonation of these chords is often, if I may say,
fuzzy. The simple analysis on the basis of just intonation and methods of dealing
with the syntonic comma could help many instrumentalists. It would be possible to
create an “intonation group” and an “ordinary” group of players. Then the
intonation would be measured and compared.
Speaking of string instruments, the intonation by string quartet would be a
worth exploring. In ordinary observations, it seems that string quartets often make
practical solutions of intonation at basis of melodic intonation. This, as previous
findings have shown, often leads to Pythagorean ratios of intervals. Vertical chords
sound tensioned and stretched. The research design where a professional string
quartet would be a “student of just intonation.” A kind of “beat elimination” (Miles,
1972) but through the intonation analysis marked into sheet of music and
professional instructions. I am an optimist in respect of improving the sound and
intonation by string ensembles! This article could be titled as “The misconception
of sharp intonation—Don’t be afraid of flat Intonation in thirds and sixths.”
Harmonies used in popular music can locally be stereotypical and simple
compared with harmonies of contemporary concert music. Sometimes these
harmonies can be a certain kind of simplifications of canonical Western harmony.
It is completely possible that there are three to four chords used in one piece,
probably from diatonic scale. If one examines the evolution of intonation and
tuning through the centuries, it is easy to notice the principle according to which
more solutions to tuning discrepancies had to be found because of harmony became
more and more complex. Chromatic harmony in late Romantic period simply
requires equal tempering to be able to be played with acceptable tuning errors and
with keyboard with 12 tones per octave. Instead, just intonation intervals can be
used in certain simple harmony of 16th century Renaissance period. The music of

214
baroque and classicism needs a plenty of tempering, but not equal tempering. In
choir music a cappella, there are excerpts of compositions, where just intonation is
possible. But also, complex harmonic turns which absolutely needs tempering if
pitch drift is denied. So, it is completely absurd that pop-industry uses equal
temperament in maximally simple pop harmonies. The simplest pop songs could
be performed in just intonation or in some kind of extended just intonation. Of
course, there would be adjustment issues with electric guitar and bass instruments,
but this huge potential should not be lost as now happens. Dozens of old keyboard
temperaments from meantone tuning to Neidhardt temperaments would be more
than suitable to most typical pop music harmonies. This is a massive gap in research
of intonation issues.

215
References
Abeßer, J., Frieler, K., Cano, E., Pfleiderer, M., & Zaddach, W. (2017). Score-informed analysis of tuning, intonation, pitch modulation, and dynamics in jazz solos. IEEE/ACM Transactions on Audio, Speech and Language Processing (TASLP), 25(1), 168–177.
Backus, J. (1977). The acoustical foundations of music. New York, NY: Norton. Ballard, D. L. (2011). Relationships between college-level wind instrumentalists’
achievement in intonation perception and performance. Bulletin of the Council for Research in Music Education, 187, 19–32.
Barbour, J. M. (1938). Just intonation confuted. Music and Letters, 19(1), 48–60. Barbour, J. M. (2004). Tuning and temperament: A historical survey. Mineola, NY: Dover.
(Original work published 1951) Benade, A. H. (1990). Fundamentals of musical acoustics. New York, NY: Dover. Benson, D. J. (2006). Music: A mathematical offering. Cambridge, United Kingdom:
Cambridge University Press. Bidelman, G. M., & Krishnan, A. (2009). Neural correlates of consonance, dissonance, and
the hierarchy of musical pitch in the human brainstem. The Journal of Neuroscience, 29, 13165–13171.
Blackwood, E. (1985). The structure of recognizable diatonic tunings. Princeton, NJ: Princeton University Press.
Bohrer, J. C. S. (2002). Intonational strategies in ensemble singing (Unpublished doctoral thesis). London, United Kingdom: City University.
Bradshaw, E., & McHenry, M. A. (2005). Pitch discrimination and pitch matching abilities of adults who sing inaccurately. Journal of Voice, 19, 431–439.
Burns, E. M., (1999). Intervals, scales, and tuning. In D. Deutsch (Ed.), The psychology of music (2nd ed., pp. 215–264). Cambridge, MA: Academic Press.
Burns, E. M., & Campbell, S. L. (1994). Frequency and frequency‐ratio resolution by possessors of absolute and relative pitch: Examples of categorical perception. The Journal of the Acoustical Society of America, 96, 2704–2719.
Burns, E. M., & Ward, W. D. (1978). Categorical perception – Phenomenon or epiphenomenon: Evidence from experiments in the perception of melodic musical intervals. The Journal of the Acoustical Society of America, 63, 456–468.
Byo, J. L., Schlegel, A. L., & Clark, N. A. (2011). Effects of stimulus octave and timbre on the tuning accuracy of secondary school instrumentalists. Journal of Research in Music Education, 58, 316–328.
Campbell, M., Greated, C., & Myers, A. (2004). Musical Instruments: History, technology, & performance of instruments of Western Music. New York, NY: Oxford University Press.
Cazden, N. (1980). The definition of consonance and dissonance. International Review of the Aesthetics and Sociology of Music, 11(2), 123–168.
Chuckrow, R. (2006). Historical tuning of keyboard instruments: Theory and practice: Pythagorean through equal temperament. New York, NY: Rising Mist Publications.
216
Cohen, H. F. (1984). Quantifying music: The science of music at the first stage of scientific revolution, 1580–1650. Dordrecht, Holland: D. Reidel.
Cortina, J. M. (1993). What is coefficient alpha? An examination of theory and applications. Journal of Applied Psychology, 78, 98–104.
Cuffman, T. J. (2016). A practical introduction to just intonation through string quartet playing (Doctoral dissertation). Iowa city, IA: The University of Iowa. https://doi.org/10.17077/etd.bvwmxy9h.
Cyr, M. (2017). Performing baroque music. London, United Kingdom: Routledge. Dalby, B. F. (1992). A computer-based training program for developing harmonic intonation
discrimination skill. Journal of Research in Music Education, 40(2), 139–152. D’Amario, S., Howard, D. M., Daffern, H., & Pennill, N. (2018). A longitudinal study of
intonation in an a cappella singing quintet. Journal of Voice, 34, 159e13–159e27. Davison, A. C., & Hinkley, D. V. (1997). Bootstrap methods and their application. New
York, NY: Cambridge University Press. de Cheveigné, A. (2010). Pitch perception. In C. J. Plack (Ed.), The Oxford handbook of
auditory science: Hearing (pp. 71–104). New York: Oxford University Press. Demorest, S. M., & Clements, A. (2007). Factors influencing the pitch-matching of junior
high boys. Journal of Research in Music Education, 55(3), 190–203. Devaney, J. (2011). An empirical study of the influence of musical context on intonation
practices in solo singers and SATB ensembles (Doctoral dissertation). Montreal, Canada: McGill University.
Devaney, J., & Ellis, D. P. W. (2008). An empirical approach to studying intonation tendencies in polyphonic vocal performances. Journal of Interdisciplinary Music Studies, 2, 141–156.
Devaney, J., Mandel, M. I., Ellis, D. P., & Fujinaga, I. (2011). Automatically extracting performance data from recordings of trained singers. Psychomusicology: Music, Mind and Brain, 21, 108–136.
Devaney, J., Mandel, M. I., & Fujinaga, I. (2012). A study of intonation in three-part singing using the automatic music performance analysis and comparison toolkit (AMPACT). In 13th International Society for Music Information Retrieval Conference (ISMIR 2012), 511–516.
Di Veroli, C. (1978). Unequal temperaments and their role in the performance of early music. Buenos Aires, Argentiina: Farro.
Dobbins, P. A., & Cuddy, L. L. (1982). Octave discrimination: An experimental confirmation of the “stretched” subjective octave. The Journal of the Acoustical Society of America, 72, 411–415.
Duffin, R. (2007). Tuning and temperament. In J. Kite-Powell (Ed.), A performer’s guide to Renaissance music (2nd ed., pp. 461–477). Bloomington, IN: Indiana University Press.
Duffin, R. W. (2008). How equal temperament ruined harmony (and why you should care). New York, NY: Norton.
Duke, R. A. (1985). Wind instrumentalists’ intonational performance of selected musical intervals. Journal of Research in Music Education, 33(2), 101–111.

217
Dunnigan, D. P. (2002). Effects of tempo, bass loudness, and tonic chord degree on the perception and performance of intonation by wind instrumentalists (Doctoral dissertation). Austin, TX: University of Texas.
Elliot, J., Platt, J., & Racine, R. (1987). Adjustment of successive and simultaneous intervals by musically experienced and inexperienced subjects. Perception & Psychophysics, 42, 594–598.
Ellis, J. A. (1874). Illustrations of just and tempered intonation. Proceedings of the Musical Association, 1st sess. (1874–1875), pp. 159–165. Taylor & Francis, on behalf of the Royal Musical Association. Retrieved 20th October, 2020, from https://www.jstor.org/stable/765411
Fischinger, T., Frieler, K., & Louhivuori, J. (2015). Influence of virtual room acoustics on choir singing. Psychomusicology: Music, Mind, and Brain, 25(3), 208.
Fischinger, T., & Hemming, J. (2011). Wie singe ich im Chor? – Intonations- und Timingmessungen in Vokalensembles. [How do I sing in choir? – Intonation and timing measurements in vocal ensembles]. In T. Greuel, U. Kranefeld & E. Szczepaniak (Eds.), Singen und Lernen – Perspektiven auf schulische und außerschulische Vokalpraxis (pp. 45–58), Aachen, Germany: Shaker.
Fyk, J. (1995). Melodic intonation, psychoacoustics and the violin. Zielona Gora, Poland: Organon.
Garofalo, R. J. (1996). Improving intonation in band and orchestra performance. Fort Lauderdale, FL: Meredith Music Publications.
Geringer, J. M., & Allen, M. L. (2004). An analysis of vibrato among high school and university violin and cello students. Journal of Research in Music Education, 52(2), 167–178.
Geringer, J. M., MacLeod, R. B., & Allen, M. L. (2010). Perceived pitch of violin and cello vibrato tones among music majors. Journal of Research in Music Education, 57(4), 351–363.
Geringer, J. M., MacLeod, R. B., & Ellis, J. C. (2014). Two studies of pitch in string instrument vibrato: Perception and pitch matching responses of university and high school string players. International Journal of Music Education, 32(1), 19–30.
Geringer, J. M., MacLeod, R. B., Madsen, C. K., & Napoles, J. (2015). Perception of melodic intonation in performances with and without vibrato. Psychology of Music, 43, 675–685.
Geringer, J. M., MacLeod, R. B., & Sasanfar, J. K. (2015). In tune or out of tune: Are different instruments and voice heard differently? Journal of Research in Music Education, 63, 89–101.
Geringer, J. M., & Madsen, C. K. (1998). Musicians’ ratings of good versus bad vocal and string performances. Journal of Research in Music Education, 46(4), 522–534.
Geringer, J. M., & Worthy, M. D. (1999). Effects of tone-quality changes on intonation and tone-quality ratings of high school and college instrumentalists. Journal of Research in Music Education, 47(2), 135–149.
Gordon, R. D. (1983). The world of musical sound. Dubuque, Iowa: Kendall/Hunt.

218
Hagerman, B., & Sundberg, J. (1980). Fundamental frequency adjustment in barbershop singing. Speech, Music & Hearing: Quarterly Progress and Status Report, 21(1), 28–42. Speech Transmission Laboratory, Department of Speech Communication. Stockholm, Sweden: Royal Institute of Technology.
Hall, D. E. (1974). Quantitative evaluation of musical scale tunings. American Journal of Physics, 42(7), 543–552.
Hall, D. E., & Hess, J. T. (1984). Perception of musical interval tuning. Music Perception: An Interdisciplinary Journal, 2(2), 166–195.
Hancock, C. B. (2008). Aesthetic responses of music and non-music majors to gradual pitch center changes. Bulletin of the Council for Research in Music Education, 178, 85–94.
Hartmann, W. M. (1993). On the origin of the enlarged melodic octave. The Journal of the Acoustical Society of America, 93(6), 3400–3409.
Hedden, D. G., & Baker, V. A. (2010). Perceptual and acoustical analyses of second graders’ pitch-matching ability in singing A cappella or with piano accompaniment. Bulletin of the Council for Research in Music Education, 184, 35–48.
Horn, D., Laing, D., Oliver, P., & Wicke, P., (2003). Tuning. In J. Shepherd, D. Horn, D. Laing, P. Oliver & P. Wicke, P. (Eds.), Continuum encyclopedia of popular music of the world, Part 1, Volume II: Performance and production (pp. 596–600). London, United Kingdom: Continuum.
Houtsma, A. J. (1968). Discrimination of frequency ratios. The Journal of the Acoustical Society of America, 44(1), 383–383.
Howard, D. M. (2007a). Equal or non-equal temperament in a capella SATB singing. Logopedics Phonatrics Vocology, 32(2), 87–94.
Howard, D. M. (2007b). Intonation drift in a capella soprano, alto, tenor, bass quartet singing with key modulation. Journal of Voice, 21(3), 300–315.
Howard, D. M., Daffern, H., & Brereton, J. (2013). Four-part choral synthesis system for investigating intonation in a cappella choral singing. Logopedics Phoniatrics Vocology, 38(3), 135–142.
Hutchins, S., Roquet, C., & Peretz, I. (2012). The vocal generosity effect: How bad can your singing be? Music Perception, 30(2), 147–159.
Jagow, S. (2012). Tuning for wind instruments: A roadmap to successful intonation. Galesville, MD: Meredith Music Publications.
Jeans, J. H. (1937). Science & music. New York, NY: Dover. Johnson-Laird, P. N., Kang, O. E., & Leong, Y. C. (2012). On musical dissonance. Music
Perception: An Interdisciplinary Journal, 30(1), 19–35. Jorgensen, O. H. (1991). Tuning: Containing the perfection of eighteenth-century
temperament, the lost art of nineteenth-century temperament, and the science of equal temperament, complete with instructions for aural and electronic tuning. East Lansing, MI: Michigan State University Press.
Kalin, G. (2005). Formant frequency adjustment in barbershop quartet singing (Master thesis in music acoustics). Department of Speech Communication. Stockholm, Sweden: Royal Institute of Technology.

219
Kanno, M. (2003). Thoughts on how to play in tune: Pitch and intonation. Contemporary Music Review, 22, 35–52.
Kantorski, V. J. (1986). String instrument intonation in upper and lower registers: The effects of accompaniment. Journal of Research in Music Education, 34(3), 200–210.
Karrick, B. (1998). An examination of the intonation tendencies of wind instrumentalists based on their performance of selected harmonic musical intervals. Journal of Research in Music Education, 46(1), 112–127.
Kassel, R., & Bush, D. E. (2006). Tuning and temperament. In R. Kassel & D. E. Bush, (Eds.), The organ: An encyclopedia (pp. 577–640). New York, NY: Routledge.
Killam, R. N., Lorton, P. V., & Schubert, E. D. (1975). Interval recognition: Identification of harmonic and melodic intervals. Journal of Music Theory, 19(2), 212–234.
Koelsch, S., Schröger, E., & Tervaniemi, M. (1999). Superior pre-attentive auditory processing in musicians. Neuroreport, 10(6), 1309–1313.
Kopiez, R. (2003). Intonation of harmonic intervals: Adaptability of expert musicians to equal temperament and just intonation. Music Perception, 20(4), 383–410.
Larrouy-Maestri, P. (2018). “I know it when I hear it”: On listeners’ perception of mistuning. Music & Science, 1, 1–17.
Larrouy-Maestri, P., Harrison, P. M. C., & Müllensiefen, D. (2019). The mistuning perception test: A new measurement instrument. Behavior Research Methods, 51, 663–675. https://doi.org/10.3758/s13428-019-01225-1
Larrouy-Maestri, P., Lévêque, Y., Schön, D., Giovanni, A., & Morsomme, D. (2013). The evaluation of singing voice accuracy: A comparison between subjective and objective methods. Journal of Voice, 27(2), 259.e1–259.e5.
Leedy, D., & Haynes, B. (2005). Intonation (ii). In S. Sadie (Ed.), The new Grove dictionary of music and musicians, 12, 503–504. London, United Kingdom: MacMillan.
Leukel, W., & Stoffer, T. (2004). The influence of harmonic context on the tuning of thirds played by professional flautists. Psychology of Music, 32(1), 75–88. https://doi.org/10.1177/0305735604039283
Liao, M. (2008). The effects of gesture use on young children’s pitch accuracy for singing tonal patterns. International Journal of Music Education, 26(3), 197–211.
Liao, M., & Davidson, J. W. (2016). The effects of gesture and movement training on the intonation of children’s singing in vocal warm-up sessions. International Journal of Music Education, 34(1), 4–18.
Lindley, M. (1990). An historical survey of meantone temperaments to 1620. Early Keyboard Journal, 8, 1–29.
Long, D. R. (2008). Coincidence theory: Seeking a perceptual preference for just intonation, equal temperament, and pythagorean intonation in excerpts for wind instruments (Doctoral dissertation). Hattiesburg, MS: University of Southern Missisippi.
Loosen, F. (1994). Tuning of diatonic scales by violinists, pianists, and nonmusicians. Perception & Psychophysics, 56(2), 221–226.
Lorentz, R. (2001). 19-TET in a Renaissance chanson by Guillaume Costeley. Paper presented at Microfest, Claremont, California, April 6.

220
Lorenzo-Seva, U., & Ferrando, P. J. (2012). TETRA-COM: A comprehensive SPSS program for estimating the tetrachoric correlation. Behavior Research Methods, 44, 1191–1196.
MacLeod, R. B. (2008). Influences of dynamic level and pitch register on the vibrato rates and widths of violin and viola players. Journal of Research in Music Education, 56(1), 43–54.
Marmel, F., Tillmann, B., & Dowling, W. J. (2008). Tonal expectations influence pitch perception. Perception and Psychophysics, 70(5), 841–852.
Mauch, M., Frieler, K., & Dixon, S. (2014). Intonation in unaccompanied singing: Accuracy, drift, and a model of reference pitch memory. The Journal of the Acoustical Society of America, 136(1), 401–411.
Micheyl, C., Delhommeau, K., Perrot, X., & Oxenham, A. J. (2006). Influence of musical and psychoacoustical training on pitch discrimination. Hearing Research, 219(1–2), 36–47.
Mick, J. (2014). An investigation of double bass vibrato characteristics. Contributions to Music Education, 40, 41–56.
Miles, E. M. (1972). Beat elimination as a means of teaching intonation to beginning wind instrumentalists. Journal of Research in Music Education, 20(4), 496–500.
Miller, G. A. (1956). The magical number seven, plus or minus two: Some limits on our capacity for processing information. Psychological Review, 63(2), 81.
Milne, A., Sethares, W., & Plamondon, J. (2007). Isomorphic controllers and dynamic tuning: Invariant fingering over a tuning continuum. Computer Music Journal, 31(4), 15–32.
Morrison, S. J. (2000). Effect of melodic context, tuning behaviors, and experience on the intonation accuracy of wind players. Journal of Research in Music Education, 48(1), 39–51.
Morrison, S. J., & Fyk, J. (2002). Intonation. In R. Parncutt & G. McPherson (Eds.), The science and psychology of music performance: Creative strategies for teaching and learning (pp. 183–197). New York, NY: Oxford University Press.
Neuwirth, E. (2012). Musical temperaments. Vienna, Austria: Springer. Nordmark, J., & Ternström, S. (1996). Intonation preferences for major thirds with non-
beating ensemble sounds. Speech Transmission Laboratory – Quarterly Progress and Status Report, 1, 57–62.
Oxenham, A. J. (2013). The perception of musical tones. The Psychology of Music, 3, 1–33. Paret, D., & Sibony, S. (2017). Musical techniques: Frequencies and harmony. London,
United Kingdom: Iste. Parncutt, R., & Hair, G. (2011). Consonance and dissonance in music theory and psychology:
Disentangling dissonant dichotomies. Journal of Interdisciplinary Music Studies, 5(2) Parbery-Clark, A., Skoe, E., Lam, C., & Kraus, N. (2009). Musician enhancement in speech-
in-noise. Ear & Hearing, 30(6), 653–661. Partch, H. (1974). Genesis of a music, enlarged. New York, NY: Da Capo.

221
Pasqua, F. A. (2001). The development of tuning awareness and the implementation of intonation skills for high school age wind musicians (Doctoral dissertation). New York, NY: Columbia University.
Pfordresher, P. Q., Brown, S., Meier, K. M., Belyk, M., & Liotti, M. (2010). Imprecise singing is widespread. The Journal of the Acoustical Society of America, 128(4), 2182–2190.
Pierce, J. R. (1983). The science of musical sound. New York, NY: Scientific American Library.
Polansky, L., Rockmore, D., Johnson, M. K., Repetto, D., & Pan, W. (2009). A mathematical model for optimal tuning systems. Perspectives of New Music, 47(1), 69–110.
Pope, D. A. (2012). An analysis of high school and university cellists’ vibrato rates, widths, and pitches. String Research Journal, 3(1), 51–66.
Powell, S. R. (2010). Wind instrument intonation: A research synthesis. Bulletin of the Council for Research in Music Education, 184, 79–96.
Price, H. E. (2000). Interval matching by undergraduate nonmusic majors. Journal of Research in Music Education, 48(4), 360–372.
Rameau, J. (1971). Treatise on harmony (P. Gosset, Trans.). Paris, France: Dover. (Original publication by Jean-Babtiste-Christophe Ballard, 1722)
Rasch, R. (2002). Tuning and temperament. In T. Christensen (Ed.), The Cambridge history of Western music theory (pp. 193–222). Cambridge, United Kingdom: Cambridge University Press.
Rasch, R. A. (1985). Perception of melodic and harmonic intonation of two-part musical fragments. Music Perception: An Interdisciplinary Journal, 2(4), 441–458.
Reinhard, J. (2016). Bach and tuning. New York, NY: American Festival of Microtonal Music.
Renney, N., Gaster, B. R., & Mitchell, T., (2018). Return to the fundamentals on temperament (in digital systems). Proceedings of Audio Mostly 2018: Sound in Immersion and Emotion, 24, 1–4. Wrexham, United Kingdom.
Roberts, P., Priest, H., & Traynor, M. (2006). Reliability and validity in research. Nursing Standard, 20(44).
Rowland, D. (2001). Early keyboard instruments: A practical guide. Cambridge, United Kingdom: Cambridge University Press.
Russo, F. A., & Thompson W. F., (2005). An interval size illusion: The influence of timbre on the perceived size of melodic intervals. Perception and Psychophysics, 67(4), 559–68.
Ryan, D. (2016). An algorithm to assign musical prime commas to every prime number and construct a universal and compact free just intonation musical notation. Mathematics, Computer Science. Published in ArXiv 2016:arXiv Preprint arXiv:1612.01860
Schellenberg, E. G. (2001). Asymmetries in the discrimination of musical intervals: Going out-of-tune is more noticeable than going in-tune. Music Perception, 19(2), 223–248.
Schellenberg, E. G., & Moreno, S. (2010). Music lessons, pitch processing, and g. Psychology of Music, 38(2), 209–221.

222
Schellenberg, E. G., & Trehub, S. E. (1994). Frequency ratios and the discrimination of pure tone sequences. Perception & Psychophysics, 56(4), 472–478.
Schenker, H. (1979). Free composition: Volume III of new musical theories and fantasies (E. Oster, Trans. & Ed.). New York, NY: Pendragon Press. (Original work published 1935)
Schlegel, A. L., & Springer, D. G. (2018). Effects of accurate and inaccurate visual feedback on the tuning accuracy of high school and college trombonists. International Journal of Music Education, 36(3), 394–406.
Schoenberg, A. (1978). Theory of harmony (3rd ed., R. E. Carter, Trans.). Berkeley, CA: University of California Press. (Original work published 1911)
Scholtz, K. P. (1998). Algorithms for tunings and temperaments. A Journal of the Society of Music Theory 4(4), 1–15. https://mtosmt.org/issues/mto.98.4.4./mto.98.4.4.scholtz.pdf
Schubart, C. (1806). Ideen zu einer Ästhetik der Tonkunst [Ideas towards an aesthetics of music]. Vienna, Austria: J. V. Degen.
Schön, D., Regnault, P., Ystad, S., & Besson, M. (2005). Sensory consonance: An ERP study. Music Perception: An Interdisciplinary Journal, 23(2), 105–118. https://doi.org/10.1525/mp.2005.23.2.105
Sethares, W. A. (1994). Adaptive tunings for musical scales. The Journal of the Acoustical Society of America, 96(1), 10–18.
Sethares, W. A. (2005). Tuning, timbre, spectrum, scale. London, United Kingdom: Springer. Siegel, J. A., & Siegel, W. (1977). Categorical perception of tonal intervais: Musicians can’t
tell sharp from flat. Perception & Psychophysics, 21(5), 399–407. Slater, J., Azem, A., Nicol, T., Swedenborg, B., & Kraus, N. (2017). Variations on the theme
of musical expertise: Cognitive and sensory processing in percussionists, vocalists and non‐musicians. European Journal of Neuroscience, 45(7), 952–963.
Spiegel, M. F., & Watson, C. S. (1984). Performance on frequency‐discrimination tasks by musicians and nonmusicians. The Journal of the Acoustical Society of America, 76(6), 1690–1695.
Sponsler, E. (2011). Flexible tuning software: Beyond equal temperament. Syracuse University Honors Program, Capstone Projects 239. Syracuse, NY: Syracuse University. https://surface.syr.edu/honors_capstone/239.
Stange, K., Wick, C., & Hinrichsen, H. (2018). Playing music in just intonation – A dynamically adapting tuning scheme. Computer Music Journal, 42(3), 47–62.
Stolzenburg, F. (2015). Harmony perception by periodicity detection. Journal of Mathematics and Music, 9(3), 215–238.
Strait, D. L., Kraus, N., Parbery-Clark, A., & Ashley, R. (2010). Musical experience shapes top-down auditory mechanisms: Evidence from masking and auditory attention performance. Hearing Research, 261(1–2), 22–29.
Sundberg, J. (1982). In tune or not? A study of fundamental frequency in music practice. Speech, Music & Hearing: Quarterly Progress and Status Report, 23(1). Speech Transmission Laboratory, Deparment of Speech Communication. Stockholm, Sweden: Royal Institute of Technology.
223
Tenney, J. (1988). A History of “consonance” and “dissonance”. New York, NY: Routledge.
Terhardt, E. (1984). The concept of musical consonance: A link between music and psychoacoustics. Music Perception: An Interdisciplinary Journal, 1(3), 276–295.
Ternström, S., & Karna, D. R. (2011). Choir. In R. Parncutt & G. McPherson (Eds.), The science and psychology of music performance: Creative strategies for teaching and learning (pp. 269–283). New York, NY: Oxford University Press.
Ternström, S., & Sundberg, J. (1988). Intonation precision of choir singers. The Journal of the Acoustical Society of America, 84(1), 59–69.
Tervaniemi, M., Just, V., Koelsch, S., Widmann, A., & Schröger, E. (2005). Pitch discrimination accuracy in musicians vs nonmusicians: An event-related potential and behavioral study. Experimental Brain Research, 161(1), 1–10. https://doi.org/10.1007/s00221-004-2044-5
van Besouw, R. M., Brereton, J. S., & Howard, D. M. (2008). Range of tuning for tones with and without vibrato. Music Perception, 26(2), 145–155.
Viitasaari, M. (2001). Yksi vai useampi intonaatio: Intonaation opettamisen metodologiaa musiikin historiallisiin tyylikausiin liittyvien virityskäytäntöjen mukaisesti säveltapailussa [One or more intonations: The methodology of teaching intonation in accordance with tuning practises related to historical periods of music in ear training] (Licentiate thesis). Jyväskylä, Finland: University of Jyväskylä.
Villegas, J., & Cohen, M. (2010). Roughness minimization through automatic intonation adjustments. Journal of New Music Research, 39(1), 75–92.
Von Helmholtz, H. (1912). On the sensations of tone as a physiological basis for the theory of music. London, United Kingdom: Longmans Green.
Vos, J. (1982). The perception of pure and mistuned musical fifths and major thirds: Thresholds for discrimination, beats, and identification. Perception & Psychophysics, 32(4), 297–313.
Vurma, A. (2010). Mistuning in two-part singing. Logopedics Phoniatrics Vocology, 35(1), 24–33.
Vurma, A., Raju, M., & Kuuda, A. (2011). Does timbre affect pitch? Estimations by musicians and non-musicians. Psychology of Music, 39(3), 291–306.
Vurma, A., & Ross, J. (2006). Production and perception of musical intervals. Music Perception, 23(4), 331–344.
Weiss, P., & Taruskin, R. (2007). Music in the Western world. Belmont, CA: Thomson Learning.
Werckmeister, A. (1976). Werckmeister’s Erweiterte und Verbesserte Orgel-Probe in English (G. Krapf, Trans.). Raleigh, NC: Sunbury Press. (Original work published 1681)
Werntz, J. (2001). Adding pitches: Some new thoughts, ten years after perspectives of new music’s “forum: Microtonality today.” Perspectives of New Music, 39(2), 159–210.
White, F. A. (1975). Our acoustic environment. New York, NY: Wiley. Wolbers, M. (2002). Singing in the band rehearsal. Music Educators Journal, 89(2), 37–41. Wood, A. (1975). The physics of music (7th ed.). New York, NY: Wiley.
224
Worthy, M. D. (2000). Effects of tone-quality conditions on perception and performance of pitch among selected wind instrumentalists. Journal of Research in Music Education, 48(3), 222–236.
Wuttke, B. C. (2011). A model describing the effects of equipment, instruction and director and student attributes on wind-band intonation (A dissertaton submitted in partial fulfillment of the requirements for the degree of Doctor of Philosophy), Miami, FL: University of Miami.
Yarbrough, C., Karrick, B., & Morrison, S. J. (1995). Effect of knowledge of directional mistunings on the tuning accuracy of beginning and intermediate wind players. Journal of Research in Music Education, 43(3), 232–241.
Zabriskie, A. (2011). Effect of reverberation and dynamics on musicians’ ratings of choral tone quality and intonation. Missouri Journal of Research in Music Education, 48, 58–67.
Zarate, J. M., Ritson, C. R., & Poeppel, D. (2012). Pitch-interval discrimination and musical expertise: Is the semitone a perceptual boundary? The Journal of the Acoustical Society of America, 132(2), 984–993.
Zatorre, R. J., & Halpern, A. R. (1979). Identification, discrimination, and selective adaptation of simultaneous musical intervals. Perception & Psychophysics, 26(5), 384–395.
Zweifel, P. F. (1994). Just tuning and the unavoidable discrepancies. Indiana Theory Review, 15(2), 89–120.

225
Appendices
Appendix 1 The questionnaire and aural instructions of Experiment 1
Appendix 2 The approval form for parents of the underaged participants of
Experiment 1
Appendix 3 The approval form of Experiment 2
Appendix 4 Aural instructions and response packet of Experiment 2
Appendix 5 Experiment 1: Chord progressions by categories in C
Appendix 6 Experiment 1: The full score of Experiment 1
Appendix 7 The full score of Experiment 2
Appendix 8 Pitch drift samples
Appendix 9 Table 42. The normality tests of mistuning misattributions to a
minor triad and major triad in three categories in Experiment 1.
Appendix 10 Table 43. The normality tests of recognition of mistuning three
categories by instruments in Experiment 1.
Appendix 11 Table 44. The normality tests of recognition of mistuning three
categories, by choir voices, in Experiment 1.
Appendix 12 Table 45. The normality tests of recognition of mistuning three
categories, by gender, in Experiment 1.
Appendix 13 Table 46. Pearson correlations between recognitions in Category 1.
Appendix 14 Table 47. Pearson correlations between recognitions in Category 2.
Appendix 15 Table 48. Pearson correlations between recognitions in Category 3.
Appendix 16 Table 49. Results of the factor analysis of the experiment items
representing factors as variables in Experiment 1.
Appendix 17 Table 50. The normality tests for pitch drift preferences, local
tempering preferences, equal temperament preferences, and
meantone tuning preferences by choir background in Experiment 2.
Appendix 18 Table 51. Normality tests or pitch drift preferences, local tempering
preferences, equal temperament preferences, and meantone tuning
preferences explored by gender in Experiment 2.
Appendix 19 Table 52. The results of normality tests for distributions of all
experiment blocks of the four tuning alternatives in Experiment 2.
Appendix 20 Table 53. Results of the factor analysis of the experiment items
representing factors as variables in Experiment 2.
Appendix 21 Music without syntonic commas, Ludwig Senfl: Das Gleut zu Speyr
Appendix 22 Music without syntonic commas, Michael Praetorius: In dulci jubilo

226
Appendix 1. The questionnaire and aural instructions of Experiment 1
EPÄPUHTAUKSIEN HAVAITSEMINEN / ENSIMMÄISEN TESTIN
SOINTUSARJAT
Taustatiedot
Rastita oikea vaihtoehto.
Mikä on pääinstrumenttisi? a) jousisoitin ___ b) vaskipuhallin ___ c) puupuhallin ___ d) piano, kantele, kitara harppu tai lyömäsoittimet ___
Olen soittanut pääinstrumenttiani ___ vuotta
Mitä ääntä laulat kuorossa? 1. ääntä ___ 2. ääntä ___ 3. ääntä ___
Olen poika ___
Olen tyttö ___
Ikäni on ___vuotta
Kuulet 40 sointusarjaa, joissa kaikissa on seitsemän sointua. Ensimmäiset kaksi
sointua ovat kestoltaan puolinuotteja, soinnut 3–6 ovat kestoltaan neljäsosanuotteja
ja viimeinen sointu on kokonuotti. Tempo on 52 neljäsosanuottia minuutissa.
Sinun tehtäväsi on kuunnella jokaisesta sointusarjasta kolmatta, neljättä,
viidettä ja kuudetta sointua, siis neljäsosanuotin mittaisia nuotteja. Merkitse
rastilla lomakkeelle, mikä näistä neljästä soinnusta kuulostaa mielestäsi
epäpuhtaimmalta, epävireisimmältä, ”falskeimmalta” kussakin sointusarjassa. Älä
kiinnitä huomiota harmonian luontevuuteen, vaan yksittäisten sointujen puhtauteen.
Jokainen sointusarja soitetaan kahdesti.
Ennen kuin varsinainen testi alkaa, kuulet lyhennelmän yllä olevasta tekstistä
kuulokkeistasi. Sen jälkeen kuulet yhden esimerkkisointusarjan. Sekin soitetaan
kahdesti. Sinun ei tarvitse merkitä mitään lomakkeeseen siinä vaiheessa. Sen
jälkeen kuulet lauseen ”testi alkaa” ja heti perään ”näyte 1”. Testin alettua kuulet

227
sointusarjat kahdesti soitettuna. Jokaisen näytteen välissä kerrotaan seuraavan
näytteen numero. Näin jatketaan testin loppuun saakka. Tervetuloa testiin!
Näyte sointu 1 sointu 2 sointu 3 sointu 4 sointu 5 sointu 6 sointu 7 näyte 1 ****** ****** ****** näyte 2 ****** ****** ****** näyte 3 ****** ****** ****** näyte 4 ****** ****** ****** näyte 5 ****** ****** ****** näyte 6 ****** ****** ****** näyte 7 ****** ****** ****** näyte 8 ****** ****** ****** näyte 9 ****** ****** ****** näyte 10 ****** ****** ****** näyte 11 ****** ****** ****** näyte 12 ****** ****** ****** näyte 13 ****** ****** ****** näyte 14 ****** ****** ****** näyte 15 ****** ****** ****** näyte 16 ****** ****** ****** näyte 17 ****** ****** ****** näyte 18 ****** ****** ****** näyte 19 ****** ****** ****** näyte 20 ****** ****** ****** näyte 21 ****** ****** ****** näyte 22 ****** ****** ****** näyte 23 ****** ****** ****** näyte 24 ****** ****** ****** näyte 25 ****** ****** ****** näyte 26 ****** ****** ****** näyte 27 ****** ****** ****** näyte 28 ****** ****** ****** näyte 29 ****** ****** ****** näyte 30 ****** ****** ****** näyte 31 ****** ****** ****** näyte 32 ****** ****** ****** näyte 33 ****** ****** ****** näyte 34 ****** ****** ****** näyte 35 ****** ****** ****** näyte 36 ****** ****** ****** näyte 37 ****** ****** ******

228
näyte 38 ****** ****** ****** näyte 39 ****** ****** ****** näyte 40 ****** ****** ******
RECOGNITION OF MISTUNED CHORDS EXPERIMENT 1
Background information
Please cross the correct alternative:
I am a) a string instrument player ___ b) a wind instrument player ___ c) a keyboard or percussion player ___ d) a singer ___
I have experienced my main instrument ___ years
Please draw a circle on one of the following alternatives which describes you as a
music listener. During my leisure time I prefer listen mainly to a) Western art music and choral music acoustically produced. I visit
concerts. b) all kinds of channels from radio, widely, how it happens. Sometimes I
visit concerts. c) different kind of music than at my work. I do not visit concerts very
much during my leisure time. I prefer to listen electrically produced pop-music with headphones or ear buds.
d) silence. I hear enough music at my work, I hardly do not listen to music during my leasure time.
I am a male ___
I am a female ___
My age is ___ years
You will hear 40 chord progressions. There are seven chords in every chord
progression. The first two chords are half notes in duration. The chords 3-6 are
quarter notes. The last chord is whole note. The tempo is 52 quarter notes per
minute.

229
Listen to very carefully the third, the fourth, the fifth, and the sixth chord of
every chord progression, thus quarter notes. Please write down to the answering
form, which of these four chords sounds the most mistuned, out-of-tune, false.
Please do not pay attention to the naturality of chords but only the purity of single
chords. Every chord progression is played twice.
Before the actual test begins, you will hear the abstract of this text in spoken
in your headphones. After this, you will hear the example of chord progression. It
is played twice, too. You do not have to write anything to you answering form.
After this, you will hear the sentence “The test begins” and “sample 1”. When the
test has begun, the samples are played twice. Between samples you will hear the
number of the next sample. This is the way how this test works until the end.
Welcome to the test!
Sample chord 1 chord 2 chord 3 chord 4 chord 5 chord 6 chord 7 sample 1 ****** ****** ****** sample 2 ****** ****** ****** sample 3 ****** ****** ****** sample 4 ****** ****** ****** sample 5 ****** ****** ****** sample 6 ****** ****** ****** sample 7 ****** ****** ****** sample 8 ****** ****** ****** sample 9 ****** ****** ****** sample 10 ****** ****** ****** sample 11 ****** ****** ****** sample 12 ****** ****** ****** sample 13 ****** ****** ****** sample 14 ****** ****** ****** sample 15 ****** ****** ****** sample 16 ****** ****** ****** sample 17 ****** ****** ****** sample 18 ****** ****** ****** sample 19 ****** ****** ****** sample 20 ****** ****** ****** sample 21 ****** ****** ****** sample 22 ****** ****** ****** sample 23 ****** ****** ****** sample 24 ****** ****** ****** sample 25 ****** ****** ******

230
sample 26 ****** ****** ****** sample 27 ****** ****** ****** sample 28 ****** ****** ****** sample 29 ****** ****** ****** sample 30 ****** ****** ****** sample 31 ****** ****** ****** sample 32 ****** ****** ****** sample 33 ****** ****** ****** sample 34 ****** ****** ****** sample 35 ****** ****** ****** sample 36 ****** ****** ****** sample 37 ****** ****** ****** sample 38 ****** ****** ****** sample 39 ****** ****** ****** sample 40 ****** ****** ******

231
Appendix 2. The approval form for parents of the underaged participants
of Experiment 1
ARVOISA MUSIIKKILUOKKALAISEN OPPILAAN HUOLTAJA
Olen tekemässä musiikkikasvatuksen alaan kuuluvaa väitöskirjatutkimusta, joka
käsittelee musiikilliseen intonaatioon liittyvää havaitsemista ja intonaatioon
liittyviä mieltymyksiä. Oulun kaupunki on myöntänyt minulle tutkimusluvan
29.1.2015. Olen nyt pyytämässä koehenkilöiksi ala- ja yläkouluikäisiä
musiikkiluokkalaisia, ammattiopintojensa alussa olevia instrumenttiopiskelijoita
sekä ammattimuusikoita.
Musiikkiluokkaa käyvät oppilaat 5.–9. musiikkiluokalla olisi ihanteellinen
osallistujaryhmä. Siksi lähestyn nyt teitä, Teuvo Pakkalan 5. ja 6. musiikkiluokan
oppilaiden huoltajat. Pyydän saada tehdä kaksi musiikkipsykologista koetta näiden
kahden luokan oppilaille.
Ensimmäisessä kokeessa tutkitaan sävelpuhtauteen liittyvää havaitsemista 40
sointusarjalla. Koe kestää noin puoli tuntia. Toisessa kokeessa tutkitaan
osallistujien intonaatiomieltymyksiä 30 sointusarjaparilla. Tämä koe kestää noin
45 min. On siis kyse kvantitatiivisista musiikkipsykologisista tutkimusasetelmista.
Oppilaille soitetaan kuulokkeiden kautta digitaalisesti tehtyjä sointusarjoja,
joissa on erilaisia sävelpuhtausmuutoksia mukana. Yksi sointusarja kestää n. 10
sekuntia. Sointusarjojen välissä on taukoja. Sointusarjojen esittämisen voimakkuus
ei aiheuta haittaa kuuloelimille. Kokeen voi keskeyttää, jos oppilas niin haluaa.
Koe ei aiheuta psyykkistä haittaa osallistujille.
Yliopiston tohtoriopiskelijat suorittavat Tieteellinen tutkimus ja etiikka -
kurssin. Tutkimuksessa noudatetaan yliopiston hyväksymiä käytäntöjä:
http://www.oulu.fi/hutk/node/10238.
Pidän kokeet Teuvo Pakkalan koululla. Kaikki kokeet pidetään koulupäivän
aikana ja luokan oma opettaja on mukana molemmissa tilaisuudessa ja vastaa
siirtymisistä koululta tutkimuspaikalle ja takaisin.
Kokeet pidetään seuraavina ajankohtina
xx.xx.2015 klo XX
xx.xx.2015 klo XX
232
PALAUTA TÄMÄ OSA OPETTAJALLE
LAPSENI _____________________________________
VOI OSALLISTUA KOKEISIIN ___
EI VOI OSALLISTUA KOKEISIIN ___
Annan mielelläni lisätietoja tarvittaessa.
Oulussa 5. maaliskuuta 2015
t.
Markku Viitasaari
FL, KM, LO, MO, musiikkipedagogi
tohtoriopiskelija / Oulun yliopiston tutkijakoulu
050 3444886

233
Appendix 3. The approval form of Experiment 2
INTONAATIOMIELTYMYKSET / TOISEN TESTIN SOINTUSARJAT
Rastita oikea vaihtoehto.
Mikä on pääinstrumenttisi?
jousisoitin ___
vaskipuhallin ___
puupuhallin ___
piano, kantele, kitara, harppu tai lyömäsoittimet ___
Olen soittanut pääinstrumenttiani ___ vuotta
Musiikillinen tausta (ympyröi se vaihtoehto, joka parhaiten kuvaa musiikillista
taustaasi ennen musiikin yliopisto-opintojasi).
Musiikkiluokkatausta
- musiikkiluokalla vähintään alakoulussa
- musiikkilukio/musiikkiopisto
- kuorossa laulaminen mukana koko ajan
Musiikkiopistotausta
- vähintään perustason oppimäärä suoritettu tai musiikkiopistotason
oppimäärä
- klassinen musiikki, instrumenttiopetus
- ei juuri kokemusta nk. “kevyestä” musiikista, ei kuoroharrastusta
Bänditausta
- pop, rock, jazz
- bändisoitinten soittoa, ehkä useampia
- omia bändejä
- ei muodollisia musiikkiopintoja / vähän muodollisia opintoja
Kansanmusiikkitausta
- pelimannitraditio, kansanmusiikkiyhtyeet
- kiinnostus etnisiin musiikkikulttuureihin, myös perehtymistä niihin
Jos haluat tarkentaa sinua parhaiten kuvaavaa vaihtoehtoa, kirjoita tähän.
Olen mies ___ nainen ___
Ikäni on ___ vuotta
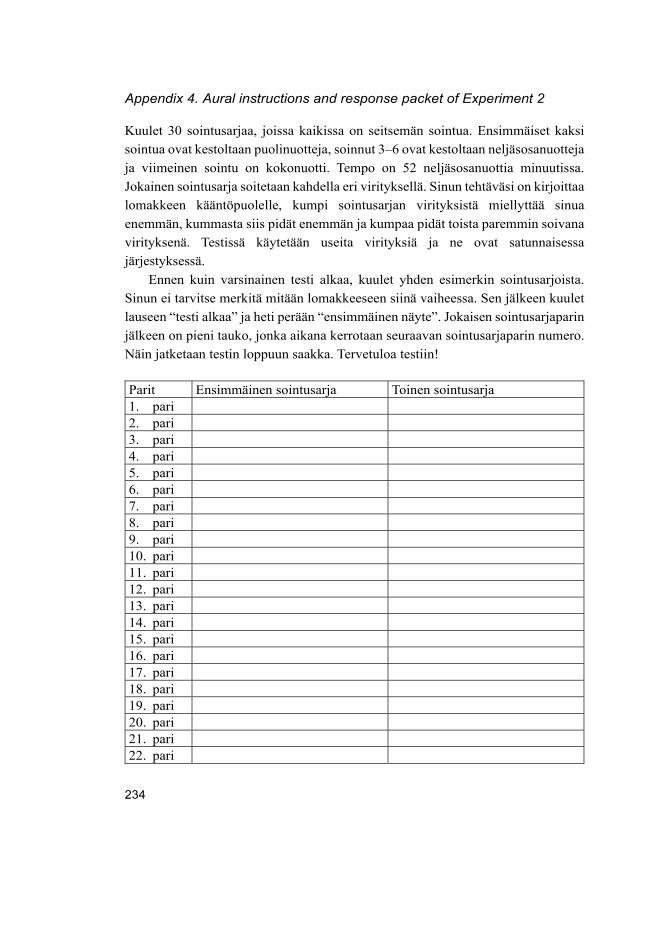
234
Appendix 4. Aural instructions and response packet of Experiment 2
Kuulet 30 sointusarjaa, joissa kaikissa on seitsemän sointua. Ensimmäiset kaksi
sointua ovat kestoltaan puolinuotteja, soinnut 3–6 ovat kestoltaan neljäsosanuotteja
ja viimeinen sointu on kokonuotti. Tempo on 52 neljäsosanuottia minuutissa.
Jokainen sointusarja soitetaan kahdella eri virityksellä. Sinun tehtäväsi on kirjoittaa
lomakkeen kääntöpuolelle, kumpi sointusarjan virityksistä miellyttää sinua
enemmän, kummasta siis pidät enemmän ja kumpaa pidät toista paremmin soivana
virityksenä. Testissä käytetään useita virityksiä ja ne ovat satunnaisessa
järjestyksessä.
Ennen kuin varsinainen testi alkaa, kuulet yhden esimerkin sointusarjoista.
Sinun ei tarvitse merkitä mitään lomakkeeseen siinä vaiheessa. Sen jälkeen kuulet
lauseen “testi alkaa” ja heti perään “ensimmäinen näyte”. Jokaisen sointusarjaparin
jälkeen on pieni tauko, jonka aikana kerrotaan seuraavan sointusarjaparin numero.
Näin jatketaan testin loppuun saakka. Tervetuloa testiin!
Parit Ensimmäinen sointusarja Toinen sointusarja 1. pari 2. pari 3. pari 4. pari 5. pari 6. pari 7. pari 8. pari 9. pari 10. pari 11. pari 12. pari 13. pari 14. pari 15. pari 16. pari 17. pari 18. pari 19. pari 20. pari 21. pari 22. pari

235
23. pari 24. pari 25. pari 26. pari 27. pari 28. pari 29. pari 30. pari

236
Appendix 5. Experiment 1: Chord progressions by categories in C

237

238

239

240
Appendix 6. Experiment 1: The full score of Experiment 1

241

242

243

244

245
Appendix 7. The full score of Experiment 2

246
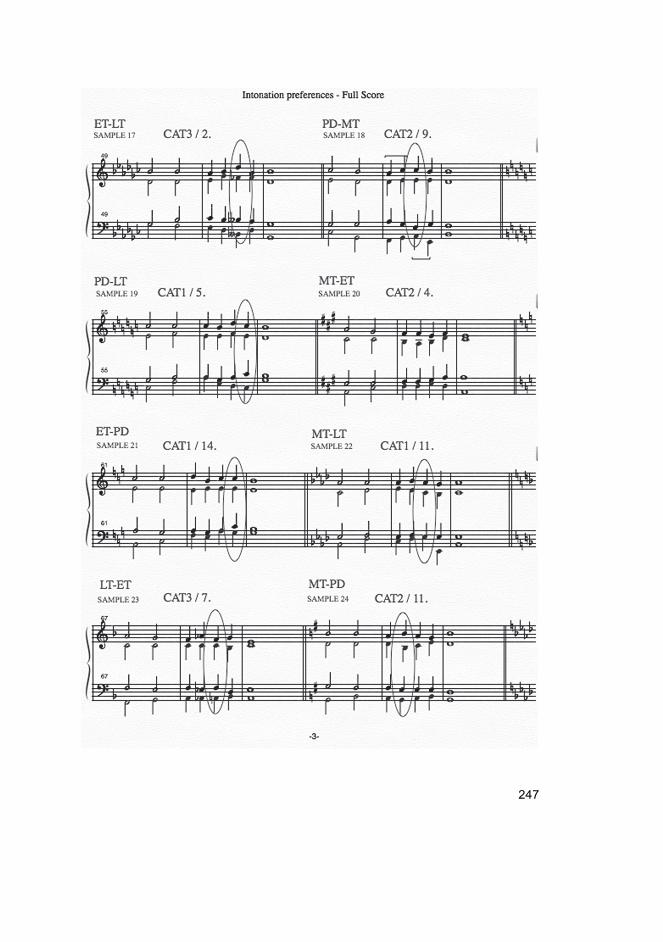
247

248

249
Appendix 8. Pitch drift samples

250

251

252

253

254

255
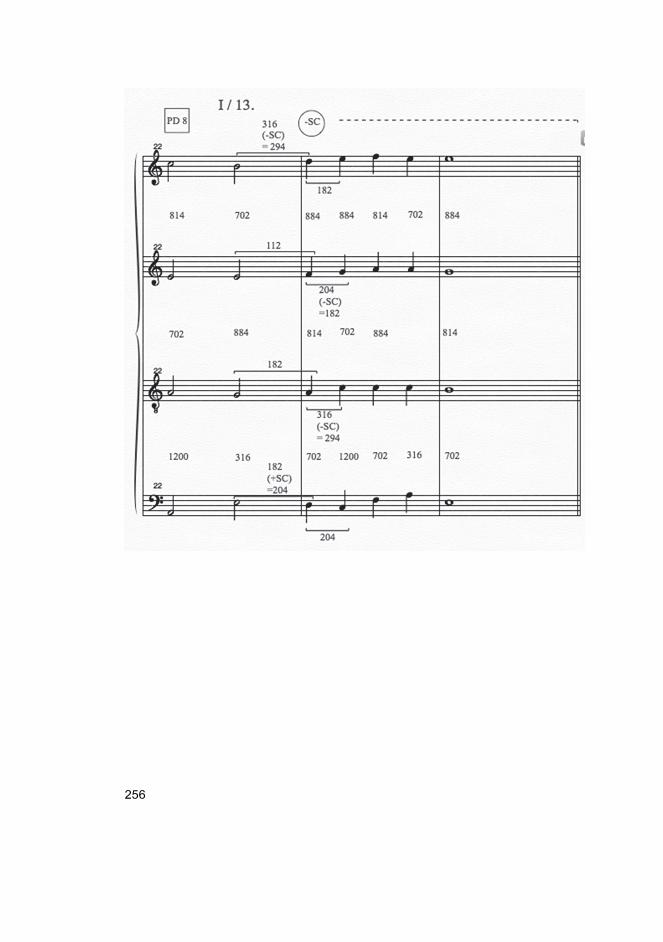
256
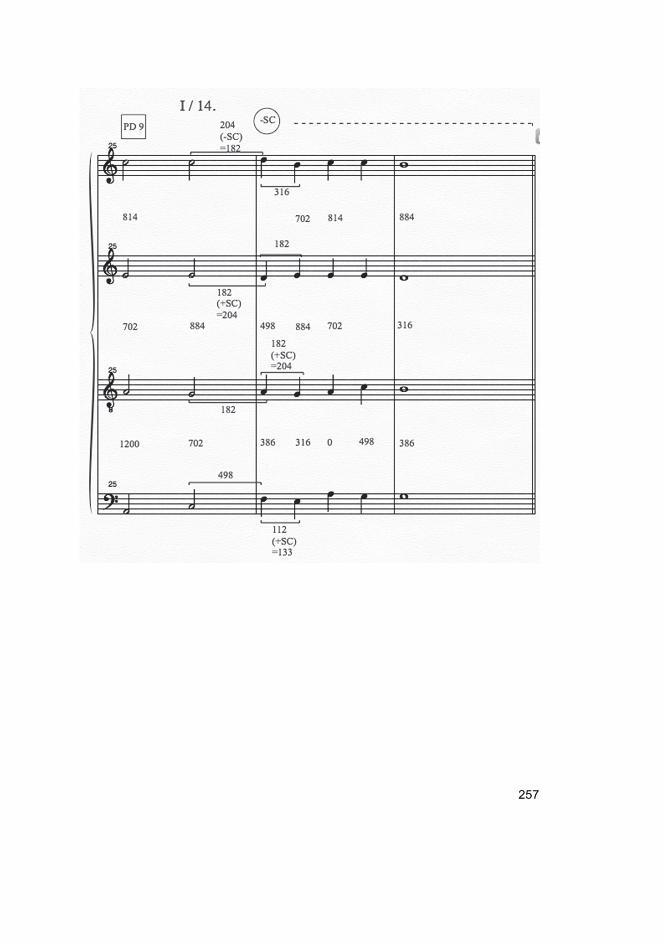
257

258

259

260

261

262

263

264
Appendix 9.
Table 42. The normality tests of mistuning misattributions to a minor triad and major
triad in three categories in Experiment 1.
Data set Kolmogorov-Smirnov1 Shapiro-Wilk
Statistic df Sig. Statistic df Sig.
Minor_CAT1_29 ,166 156 ,000 ,946 156 ,000
Minor_CAT2_29 ,161 156 ,000 ,956 156 ,000
Minor_CAT3_29 ,367 156 ,000 ,701 156 ,000
Major_CAT1_29 ,260 156 ,000 ,761 156 ,000
Major_CAT2_29 ,254 156 ,000 ,882 156 ,000
Major_CAT3_29 ,146 156 ,000 ,933 156 ,000
1 Lilliefors significance correction

265
Appendix 10.
Table 43. The normality tests of recognition of mistuning three categories by
instruments in Experiment 1.
Data set Instrument
group
Kolmogorov-Smirnov1 Shapiro-Wilk
Statistic df Sig. Statistic df Sig.
SC_All string instrument ,121 49 ,069 ,959 49 ,087
brass instrument ,125 16 ,200 2 ,978 16 ,948
woodwind
instrument
,125 38 ,143 ,964 38 ,265
piano, kantele,
guitar, harp,
percussion
,094 50 ,200 2 ,976 50 ,402
SC_All_CAT1 string instrument ,154 49 ,005 ,937 49 ,011
brass instrument ,172 16 ,200 2 ,954 16 ,560
woodwind
instrument
,106 38 ,200 2 ,971 38 ,425
piano, kantele,
guitar, harp,
percussion
,120 50 ,070 ,972 50 ,273
SC_All_CAT2 string instrument ,183 49 ,000 ,944 49 ,022
brass instrument ,207 16 ,066 ,942 16 ,375
woodwind
instrument
,187 38 ,002 ,930 38 ,021
piano, kantele,
guitar, harp,
percussion
,123 50 ,056 ,943 50 ,017
SC_All_CAT3 string instrument ,150 49 ,008 ,933 49 ,008
brass instrument ,243 16 ,012 ,864 16 ,022
woodwind
instrument
,129 38 ,114 ,962 38 ,218
piano, kantele,
guitar, harp,
percussion
,121 50 ,066 ,952 50 ,043
Minor_All_29 string instrument ,109 49 ,200 2 ,968 49 ,206
brass instrument ,167 16 ,200 2 ,947 16 ,447
woodwind
instrument
,114 38 ,200 2 ,951 38 ,094
piano, kantele,
guitar, harp,
percussion
,112 50 ,155 ,976 50 ,410
Major_All_29 string instrument ,195 49 ,000 ,909 49 ,001
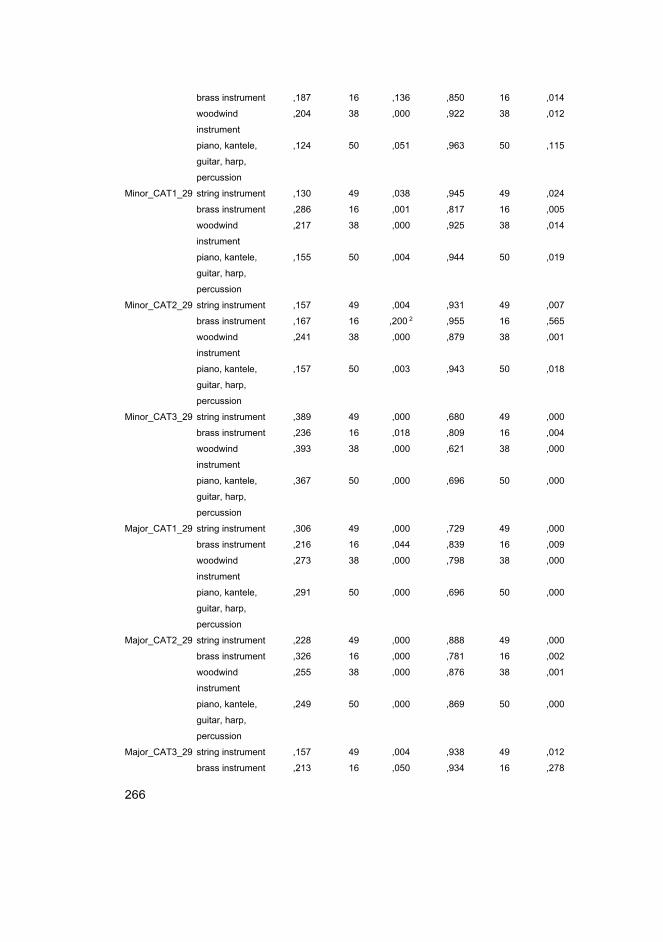
266
brass instrument ,187 16 ,136 ,850 16 ,014
woodwind
instrument
,204 38 ,000 ,922 38 ,012
piano, kantele,
guitar, harp,
percussion
,124 50 ,051 ,963 50 ,115
Minor_CAT1_29 string instrument ,130 49 ,038 ,945 49 ,024
brass instrument ,286 16 ,001 ,817 16 ,005
woodwind
instrument
,217 38 ,000 ,925 38 ,014
piano, kantele,
guitar, harp,
percussion
,155 50 ,004 ,944 50 ,019
Minor_CAT2_29 string instrument ,157 49 ,004 ,931 49 ,007
brass instrument ,167 16 ,200 2 ,955 16 ,565
woodwind
instrument
,241 38 ,000 ,879 38 ,001
piano, kantele,
guitar, harp,
percussion
,157 50 ,003 ,943 50 ,018
Minor_CAT3_29 string instrument ,389 49 ,000 ,680 49 ,000
brass instrument ,236 16 ,018 ,809 16 ,004
woodwind
instrument
,393 38 ,000 ,621 38 ,000
piano, kantele,
guitar, harp,
percussion
,367 50 ,000 ,696 50 ,000
Major_CAT1_29 string instrument ,306 49 ,000 ,729 49 ,000
brass instrument ,216 16 ,044 ,839 16 ,009
woodwind
instrument
,273 38 ,000 ,798 38 ,000
piano, kantele,
guitar, harp,
percussion
,291 50 ,000 ,696 50 ,000
Major_CAT2_29 string instrument ,228 49 ,000 ,888 49 ,000
brass instrument ,326 16 ,000 ,781 16 ,002
woodwind
instrument
,255 38 ,000 ,876 38 ,001
piano, kantele,
guitar, harp,
percussion
,249 50 ,000 ,869 50 ,000
Major_CAT3_29 string instrument ,157 49 ,004 ,938 49 ,012
brass instrument ,213 16 ,050 ,934 16 ,278

267
woodwind
instrument
,164 38 ,011 ,942 38 ,050
piano, kantele,
guitar, harp,
percussion
,162 50 ,002 ,910 50 ,001
1 Lilliefors significance correction, 2 This is a lower bound of the true significance

268
Appendix 11.
Table 44. The normality tests of recognition of mistuning three categories, by choir
voices, in Experiment 1.
Data set Choir voice Kolmogorov-Smirnov1 Shapiro-Wilk
Statistic df Sig. Statistic df Sig.
SC_All top voice ,097 56 ,200 2 ,977 56 ,369
assisting
voice
,152 57 ,002 ,943 57 ,010
bass voice ,100 39 ,200 2 ,973 39 ,464
SC_All_CAT1 top voice ,100 56 ,200 2 ,973 56 ,230
assisting
voice
,094 57 ,200 2 ,961 57 ,065
bass voice ,128 39 ,110 ,917 39 ,007
SC_All_CAT2 top voice ,132 56 ,017 ,962 56 ,074
assisting
voice
,169 57 ,000 ,951 57 ,021
bass voice ,145 39 ,037 ,963 39 ,231
SC_All_CAT3 top voice ,134 56 ,014 ,940 56 ,008
assisting
voice
,139 57 ,008 ,957 57 ,042
bass voice ,164 39 ,010 ,927 39 ,015
Minor_All_29 top voice ,152 56 ,002 ,965 56 ,104
assisting
voice
,132 57 ,015 ,965 57 ,096
bass voice ,111 39 ,200 2 ,975 39 ,531
Major_All_29 top voice ,115 56 ,061 ,941 56 ,008
assisting
voice
,186 57 ,000 ,906 57 ,000
bass voice ,092 39 ,200 2 ,978 39 ,634
Minor_CAT1_29 top voice ,216 56 ,000 ,911 56 ,001
assisting
voice
,154 57 ,002 ,937 57 ,005
bass voice ,129 39 ,101 ,949 39 ,077
Minor_CAT2_29 top voice ,169 56 ,000 ,940 56 ,008
assisting
voice
,179 57 ,000 ,948 57 ,017
bass voice ,127 39 ,115 ,965 39 ,267
Minor_CAT3_29 top voice ,405 56 ,000 ,657 56 ,000
assisting
voice
,380 57 ,000 ,690 57 ,000
bass voice ,337 39 ,000 ,706 39 ,000
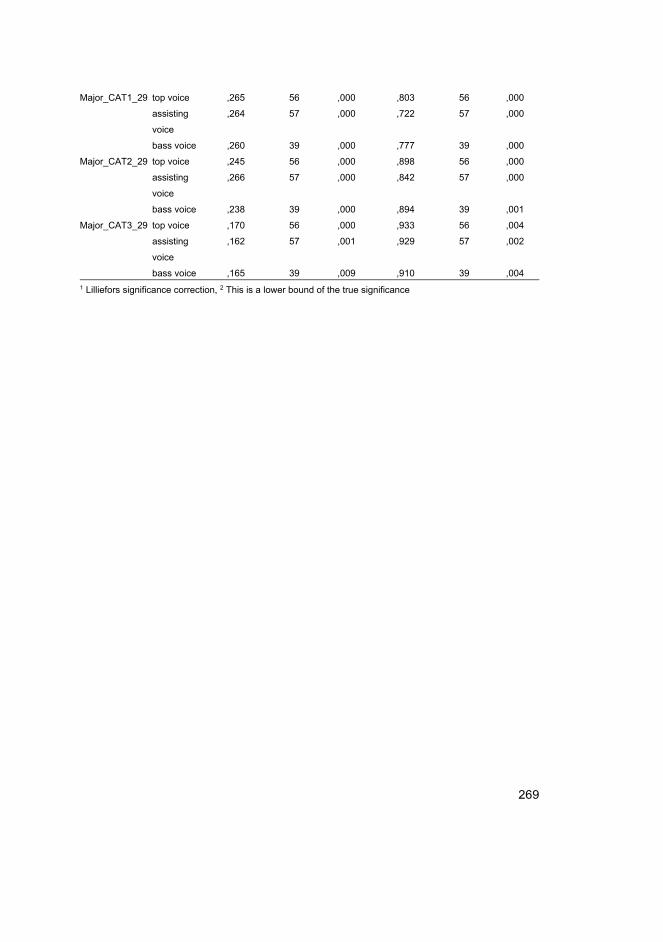
269
Major_CAT1_29 top voice ,265 56 ,000 ,803 56 ,000
assisting
voice
,264 57 ,000 ,722 57 ,000
bass voice ,260 39 ,000 ,777 39 ,000
Major_CAT2_29 top voice ,245 56 ,000 ,898 56 ,000
assisting
voice
,266 57 ,000 ,842 57 ,000
bass voice ,238 39 ,000 ,894 39 ,001
Major_CAT3_29 top voice ,170 56 ,000 ,933 56 ,004
assisting
voice
,162 57 ,001 ,929 57 ,002
bass voice ,165 39 ,009 ,910 39 ,004
1 Lilliefors significance correction, 2 This is a lower bound of the true significance

270
Appendix 12.
Table 45. The normality tests of recognition of mistuning three categories, by gender,
in Experiment 1.
Data set Gender Kolmogorov-Smirnov1 Shapiro-Wilk
Statistic df Sig. Statistic df Sig.
SC_All male ,094 51 ,200 2 ,978 51 ,472
female ,127 103 ,000 ,971 103 ,024
SC_All_CAT1 male ,124 51 ,049 ,960 51 ,080
female ,106 103 ,006 ,966 103 ,009
SC_All_CAT2 male ,126 51 ,042 ,975 51 ,340
female ,151 103 ,000 ,974 103 ,037
SC_All_CAT3 male ,172 51 ,001 ,921 51 ,002
female ,120 103 ,001 ,962 103 ,005
Minor_All_29 male ,166 51 ,001 ,952 51 ,040
female ,140 103 ,000 ,972 103 ,028
Major_All_29 male ,137 51 ,019 ,916 51 ,002
female ,137 103 ,000 ,936 103 ,000
Minor_CAT1_29 male ,161 51 ,002 ,951 51 ,035
female ,165 103 ,000 ,936 103 ,000
Minor_CAT2_29 male ,192 51 ,000 ,951 51 ,034
female ,142 103 ,000 ,955 103 ,002
Minor_CAT3_29 male ,305 51 ,000 ,740 51 ,000
female ,397 103 ,000 ,668 103 ,000
Major_CAT1_29 male ,278 51 ,000 ,778 51 ,000
female ,248 103 ,000 ,739 103 ,000
Major_CAT2_29 male ,252 51 ,000 ,884 51 ,000
female ,252 103 ,000 ,876 103 ,000
Major_CAT3_29 male ,149 51 ,006 ,936 51 ,008
female ,154 103 ,000 ,930 103 ,000
1 Lilliefors significance correction, 2 This is a lower bound of the true significance
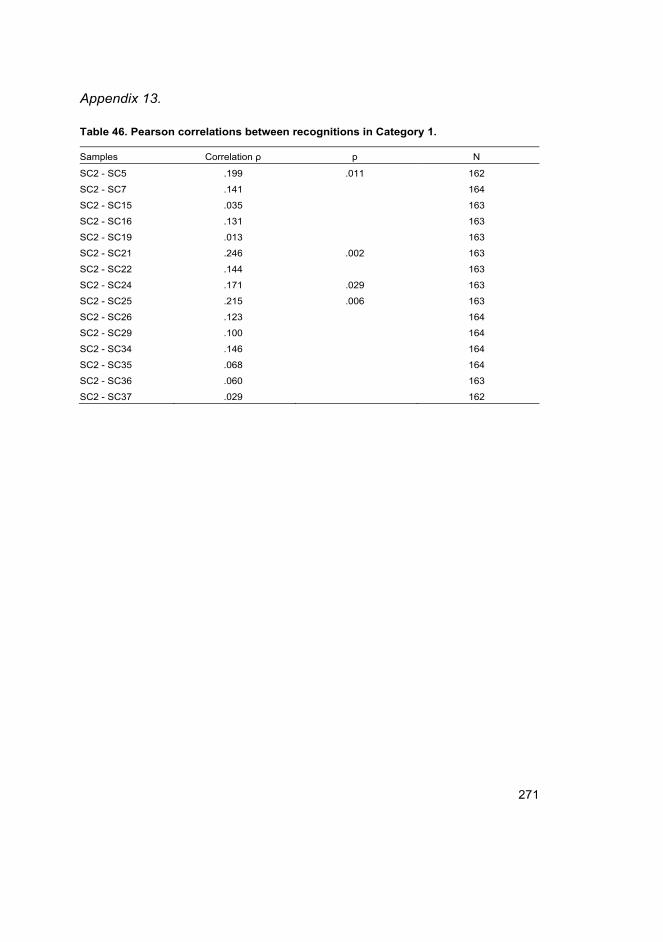
271
Appendix 13.
Table 46. Pearson correlations between recognitions in Category 1.
Samples Correlation ρ p N
SC2 - SC5 .199 .011 162
SC2 - SC7 .141 164
SC2 - SC15 .035 163
SC2 - SC16 .131 163
SC2 - SC19 .013 163
SC2 - SC21 .246 .002 163
SC2 - SC22 .144 163
SC2 - SC24 .171 .029 163
SC2 - SC25 .215 .006 163
SC2 - SC26 .123 164
SC2 - SC29 .100 164
SC2 - SC34 .146 164
SC2 - SC35 .068 164
SC2 - SC36 .060 163
SC2 - SC37 .029 162

272
Appendix 14.
Table 47. Pearson correlations between recognitions in Category 2.
Samples Correlation ρ p N
SC4 – SC6 .034 165
SC4 – SC8 -.128 165
SC4 – SC9 .257 .001 164
SC4 – SC10 .099 165
SC4 – SC13 -.066 163
SC4 – SC17 .254 .001 165
SC4 – SC18 .099 165
SC4 - SC20 .144 164
SC4 - SC23 .154 165
SC4 - SC27 .141 165
SC4 – SC30 .091 165
SC4 - SC32 -.102 165
SC4 - SC33 .248 .001 165
SC4 - SC39 -.113 165
SC4 – SC40 .121 165

273
Appendix 15.
Table 48. Pearson correlations between recognitions in Category 3.
Samples Correlation ρ p N
SC1 – SC3 .155 .047 165
SC1 – SC11 .066 166
SC1 – SC12 -.091 166
SC1 – SC14 .218 .005 166
SC1 – SC28 .114 166
SC1 – SC31 .042 166
SC1 – SC38 .134 166

274
Appendix 16.
Table 49. Results of the factor analysis of the experiment items representing factors as
variables in Experiment 1.

275
Appendix 16 continues.
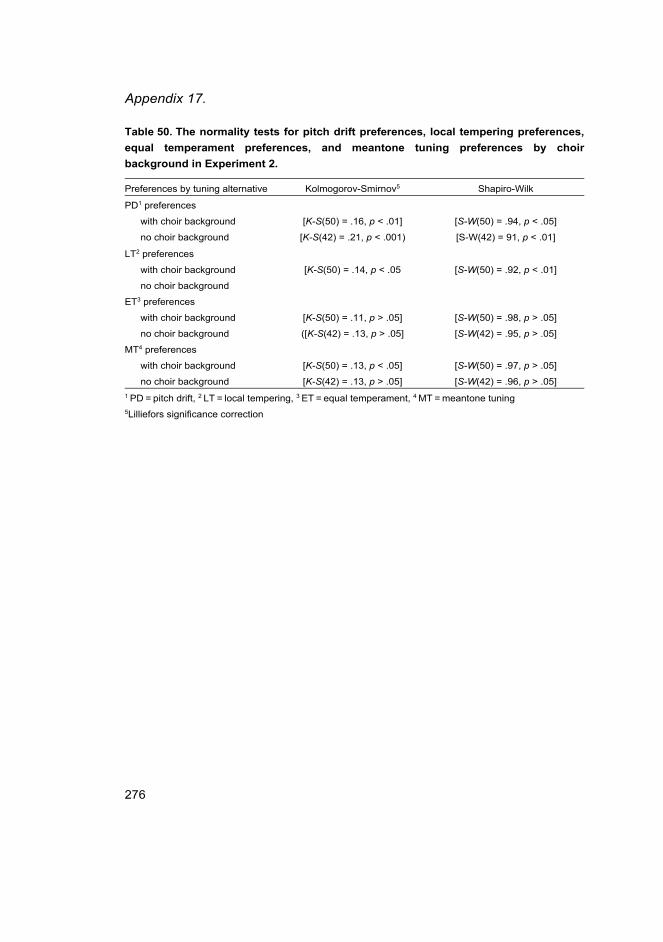
276
Appendix 17.
Table 50. The normality tests for pitch drift preferences, local tempering preferences,
equal temperament preferences, and meantone tuning preferences by choir
background in Experiment 2.
Preferences by tuning alternative Kolmogorov-Smirnov5 Shapiro-Wilk
PD1 preferences
with choir background
no choir background
[K-S(50) = .16, p < .01]
[K-S(42) = .21, p < .001)
[S-W(50) = .94, p < .05]
[S-W(42) = 91, p < .01]
LT2 preferences
with choir background
no choir background
[K-S(50) = .14, p < .05
[S-W(50) = .92, p < .01]
ET3 preferences
with choir background
no choir background
[K-S(50) = .11, p > .05]
([K-S(42) = .13, p > .05]
[S-W(50) = .98, p > .05]
[S-W(42) = .95, p > .05]
MT4 preferences
with choir background
no choir background
[K-S(50) = .13, p < .05]
[K-S(42) = .13, p > .05]
[S-W(50) = .97, p > .05]
[S-W(42) = .96, p > .05]
1 PD = pitch drift, 2 LT = local tempering, 3 ET = equal temperament, 4 MT = meantone tuning 5Lilliefors significance correction

277
Appendix 18.
Table 51. Normality tests or pitch drift preferences, local tempering preferences, equal
temperament preferences, and meantone tuning preferences explored by gender in
Experiment 2.
Preferences by tuning alternative Kolmogorov-Smirnov5 Shapiro-Wilk
PD1 preferences
male
female
[K-S(23) = .25, p < .001]
[K-S(69) = .20 p < .001]
[S-W(23) = .85, p < .01]
[S-W(69) = .92, p < .001].
LT2 preferences
male
female
[K-S(23) = .18, . p < .05]
K-S(69) = .13, p < .01]
S-W(69) = .94, p < .05]
[S-W(69) = .94, p < .01].
ET3 preferences
male
female
[K-S(23) = .19, p > .05]
[K-S(69) = .12, p < .05)
[S-W(23) = .97, p > .05]
[S-W(69) = .98, p > .05]
MT4 preferences
male
female
[K-S(23) = -.18, p > .05]
(K-S(69) = .13, p < .01
[S-W(23) = -.90, p < .05].
[S-W(69) = .95, p < .01]
1 PD = pitch drift, 2 LT = local tempering, 3 ET = equal temperament, 4 MT = meantone tuning 5Lilliefors significance correction
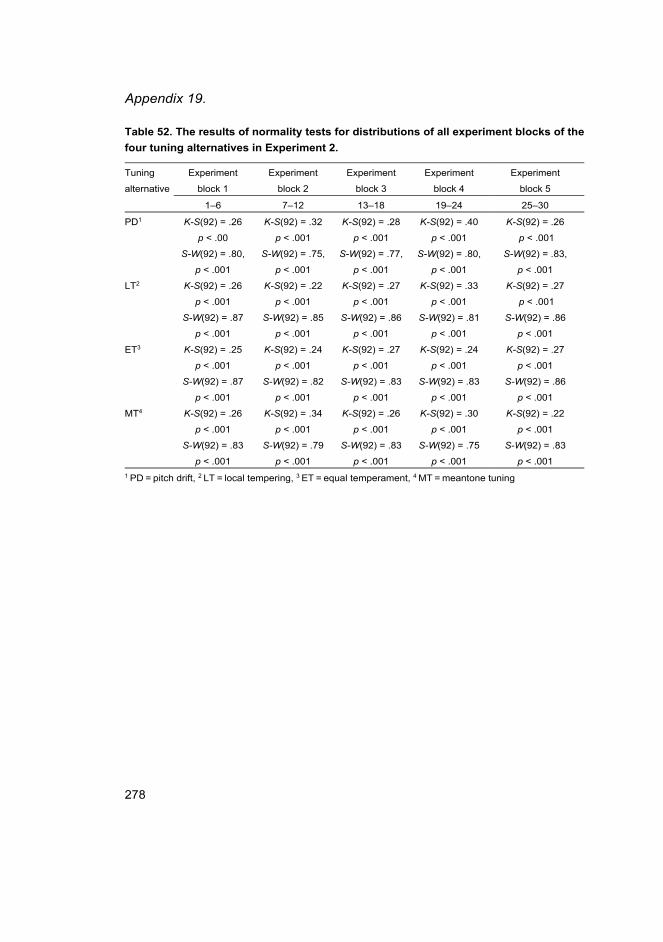
278
Appendix 19.
Table 52. The results of normality tests for distributions of all experiment blocks of the
four tuning alternatives in Experiment 2.
Tuning
alternative
Experiment
block 1
Experiment
block 2
Experiment
block 3
Experiment
block 4
Experiment
block 5
1–6 7–12 13–18 19–24 25–30
PD1 K-S(92) = .26
p < .00
S-W(92) = .80,
p < .001
K-S(92) = .32
p < .001
S-W(92) = .75,
p < .001
K-S(92) = .28
p < .001
S-W(92) = .77,
p < .001
K-S(92) = .40
p < .001
S-W(92) = .80,
p < .001
K-S(92) = .26
p < .001
S-W(92) = .83,
p < .001
LT2 K-S(92) = .26
p < .001
S-W(92) = .87
p < .001
K-S(92) = .22
p < .001
S-W(92) = .85
p < .001
K-S(92) = .27
p < .001
S-W(92) = .86
p < .001
K-S(92) = .33
p < .001
S-W(92) = .81
p < .001
K-S(92) = .27
p < .001
S-W(92) = .86
p < .001
ET3 K-S(92) = .25
p < .001
S-W(92) = .87
p < .001
K-S(92) = .24
p < .001
S-W(92) = .82
p < .001
K-S(92) = .27
p < .001
S-W(92) = .83
p < .001
K-S(92) = .24
p < .001
S-W(92) = .83
p < .001
K-S(92) = .27
p < .001
S-W(92) = .86
p < .001
MT4 K-S(92) = .26
p < .001
S-W(92) = .83
p < .001
K-S(92) = .34
p < .001
S-W(92) = .79
p < .001
K-S(92) = .26
p < .001
S-W(92) = .83
p < .001
K-S(92) = .30
p < .001
S-W(92) = .75
p < .001
K-S(92) = .22
p < .001
S-W(92) = .83
p < .001
1 PD = pitch drift, 2 LT = local tempering, 3 ET = equal temperament, 4 MT = meantone tuning

279
Appendix 20.
Table 53. Results of the factor analysis of the experiment items representing factors as
variables in Experiment 2.

280
Appendix 20 continues.

281
Appendix 21. Music without syntonic commas, Ludwig Senfl: Das Gleut zu
Speyr

282

283

284

285

286

287

288
Appendix 22. Music without syntonic commas, Michael Praetorius: In dulci
jubilo

289
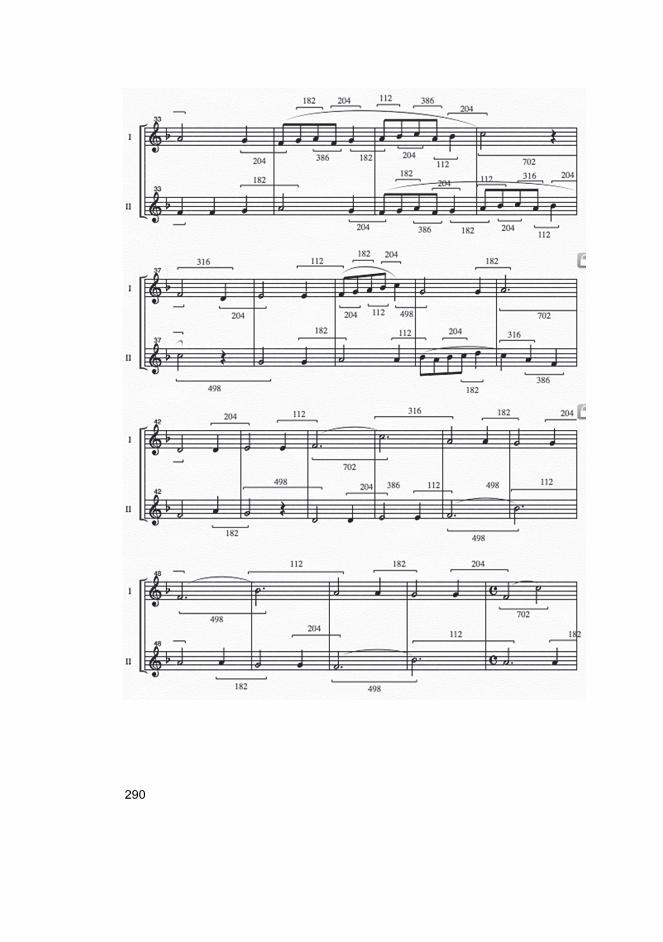
290

291

292

A C T A U N I V E R S I T A T I S O U L U E N S I S
Book orders:Virtual book store
http://verkkokauppa.juvenesprint.fi
S E R I E S E S C I E N T I A E R E R U M S O C I A L I U M
181. Välimäki, Anna-Leena (2018) Kun työ tulee hymyillen kotiin : suomalaisenperhepäivähoidon 50 vuoden tarina 1960-luvulta 2010-luvulle
182. Tuomisto, Timo (2018) Kansanopistopedagogiikka kolmessa kristillisessäkansanopistossa
183. Uematsu-Ervasti, Kiyoko (2019) Global perspectives in teacher education : acomparative study of the perceptions of Finnish and Japanese student teachers
184. Pijeira Díaz, Héctor Javier (2019) Electrodermal activity and sympathetic arousalduring collaborative learning
185. Paradis, Audrey (2019) Towards a relational conceptualisation of teacherautonomy : narrative research on the autonomy perceptions of upper-secondaryschool teachers in different contexts
186. Hasari, Matti (2019) Opettajan ammatti-identiteetin muotoutuminenmatemaattisten aineiden opetusharjoittelussa
187. Tenhu, Tapio (2019) Taide mielessä – Mieli taiteessa : opettajienkuvataidekokemuksien narratiivista tarkastelua
188. Louhela, Helena (2019) Sexual violence : voiced and silenced by girls with multiplevulnerabilities
189. Ameir, Mwanakhamis (2020) Supporting active learning teaching techniquesthrough collaborative learning and feedback in Zanzibar, a challenging educationalcontext
190. Sutela, Katja (2020) Exploring the possibilities of Dalcroze-based music educationto foster the agency of students with special needs : a practitioner inquiry in aspecial school
191. Isohätälä, Jaana (2020) The interplay of cognitive and socio-emotional processesin social interaction : process-oriented analyses of collaborative learning
192. Haapakoski, Jani (2020) Market exclusions and false inclusions : mapping obstaclesfor more ethical approaches in the internationalization of higher education
193. Krzensk, Alexander (2020) Influencing academic resilience and self-regulation instudents : an intervention in Mathematics
194. Sirkko, Riikka (2020) Opettajat ammatillisina toimijoina inkluusiota edistämässä
195. Kiema-Junes, Heli (2020) Associations of social skills and social support with well-being-related outcomes at work and in higher education : Heart rate variability,engagement, and burnout
UNIVERSITY OF OULU P .O. Box 8000 F I -90014 UNIVERSITY OF OULU FINLAND
A C T A U N I V E R S I T A T I S O U L U E N S I S
University Lecturer Tuomo Glumoff
University Lecturer Santeri Palviainen
Postdoctoral researcher Jani Peräntie
University Lecturer Anne Tuomisto
University Lecturer Veli-Matti Ulvinen
Planning Director Pertti Tikkanen
Professor Jari Juga
University Lecturer Anu Soikkeli
University Lecturer Santeri Palviainen
Publications Editor Kirsti Nurkkala
ISBN 978-952-62-2790-0 (Paperback)ISBN 978-952-62-2791-7 (PDF)ISSN 0355-323X (Print)ISSN 1796-2242 (Online)
U N I V E R S I TAT I S O U L U E N S I SACTAE
SCIENTIAE RERUM SOCIALIUM
E 196
AC
TAM
arkku Viitasaari
OULU 2020
E 196
Markku Viitasaari
HOW TO DEAL WITHTHE SYNTONIC COMMAIN MUSIC EDUCATION?RECOGNITION, PREFERENCES OF USAGE,AND UTILITY
UNIVERSITY OF OULU GRADUATE SCHOOL;UNIVERSITY OF OULU,FACULTY OF EDUCATION