How Mapping Media May Enable Knowledge Federation
133
How mapping media may enable Knowledge Federation: The Domain Map Prototype Thesis submitted for the degree of Master in Programming and Networks 60 credits Department of Informatics Faculty of mathematics and natural sciences Spring 2019 Julien Ange-Aimé Céré-Imboden
-
Upload
khangminh22 -
Category
Documents
-
view
5 -
download
0
Transcript of How Mapping Media May Enable Knowledge Federation

How mapping media may enable
Knowledge Federation:
The Domain Map Prototype
Thesis submitted for the degree of Master in Programming and Networks
60 credits
Department of Informatics Faculty of mathematics and natural sciences
Spring 2019
Julien Ange-Aimé Céré-Imboden


How mapping media may enable
Knowledge Federation:
The Domain Map Prototype
Julien Ange-Aimé Céré-Imboden

© 2019 Julien Ange-Aimé Céré-Imboden
How mapping media may enable Knowledge Federation:
The Domain Map Prototype
http://www.duo.uio.no/
Printed: Reprosentralen, University of Oslo

iii
Abstract
This thesis describes the design of a domain map prototype, which serves as a means of
tackling wicked problems from the perspective of knowledge federation. This is to create
a new way of problem-solving in a time of information glut. The domain map prototype
is rooted in the vision of an open-hyperdocuments-system (OHS) by Douglas C. Engel-
bart, continuing his unfinished revolution by building on his prototype of a Dynamic
Knowledge Repository (DKR). As part of the knowledge federation initiative, the proto-
type serves as a tool towards a paradigm shift within knowledge work. This means
changing how information is presented and allow for new ways of interacting with
knowledge work through models and graphical notations. This with the goal of solving
wicked problems such as global warming and education systems.
The approach taken to design the domain map prototype was directly linked to the devel-
opment of the knowledge federation website. Building the website was the first step
towards launching knowledge federation, the second step is the design of the prototype.
The information and structure form the website was used to inform the design of test
models developed inside the debate graph application using the IBIS notation and other
knowledge mapping techniques as a foundation. The test models which were made cre-
ated the basis for developing the grammar and visual identity of the debate graph
prototype and to identify necessary features.
The domain map prototype consists of three main elements as described in this thesis.
Each element tackles an obstacle that comes with mapping complex issues. The first ele-
ment is the structure of the map. The structure is focused on the use of tags as a means of
organizing information. It does this by building on specifications of an OHS. The second
part if the grammar which consists of the node objects which make up the domain map
and the connections which contextualize the objects in relation to other data. The third
element is the integration of the value matrix prototype as a means of establishing a rating
system to better organize the information of the map. The value matrix is rooted in a QRI-
model to derive the measure of a contribution.
The design of the domain map prototype results in creating a base language for an appli-
cation to be built on, as well as highlighting new areas of study to continue the
development of a domain map application. It serves to federate the need for a knowledge
mapping tool and as an invitation to collaborate and create new knowledge work.

iv

v
Table of Contents
Abstract ............................................................................................................................ iii
Table of Contents .............................................................................................................. v
Table of Figures & Tables ............................................................................................. viii
Preface ............................................................................. Error! Bookmark not defined.
Foreword ........................................................................................................................... x
1 Introduction ............................................................................................................. 1
1.1 Scope - Knowledge Federation .......................................................................... 3
1.2 Personal Motivation ........................................................................................... 3
1.3 Outline ................................................................................................................ 5
2 Background .............................................................................................................. 7
2.1 Information Glut ................................................................................................ 7
2.2 Wicked Problems ............................................................................................... 8
2.2.1 Characteristics ............................................................................................. 9
2.2.2 Tackling Wicked Problems....................................................................... 14
2.3 Systemic Innovation ......................................................................................... 17
2.4 Collective Intelligence ..................................................................................... 19
2.4.1 Doug Engelbart ......................................................................................... 20
2.4.2 Open hyperdocument system (OHS) ........................................................ 24
2.4.3 CoDIAK and Dynamic Knowledge Repository ....................................... 26
2.5 Knowledge Mapping ........................................................................................ 29
2.5.1 Concept Mapping ...................................................................................... 32

vi
2.5.2 Issue-based information system (IBIS) ..................................................... 36
2.6 Debate graph .................................................................................................... 41
2.7 Value Matrix .................................................................................................... 44
3 Approach ................................................................................................................ 47
3.1 What is the Prototype? ..................................................................................... 47
3.2 Mapping a Wicked Problem ............................................................................. 48
3.3 Knowledge Federation ..................................................................................... 49
3.4 Knowledge Federation Website ....................................................................... 50
3.5 Debate Graph Model ........................................................................................ 53
3.6 Evaluating approach ......................................................................................... 58
4 Domain Map Prototype ......................................................................................... 61
4.1 Results from Test Models ................................................................................ 62
4.2 Structure ........................................................................................................... 65
4.2.1 Spider Structure ........................................................................................ 66
4.2.2 Tagging ..................................................................................................... 67
4.3 Grammar........................................................................................................... 69
4.3.1 Nodes ........................................................................................................ 71
4.3.2 Connections............................................................................................... 75
4.3.3 Cross-linking ............................................................................................. 80
4.4 Visual Representations ..................................................................................... 81
4.4.1 Interface .................................................................................................... 82
4.4.2 Symbols..................................................................................................... 85
4.4.3 Media ........................................................................................................ 86
4.5 Rating ............................................................................................................... 88
4.5.1 User ........................................................................................................... 88

vii
4.5.2 Value Matrix Implementation ................................................................... 90
4.5.3 Road Map .................................................................................................. 91
4.6 Analysis ............................................................................................................ 92
5 Discussion ............................................................................................................... 97
5.1 The Prototype ................................................................................................... 97
5.2 Realization of Prototype................................................................................. 101
5.3 New World ..................................................................................................... 103
5.4 Alternate approaches ...................................................................................... 104
5.4.1 Onboarding ............................................................................................. 105
5.5 Unfinished Revolution ................................................................................... 106
5.6 Problem Statement ......................................................................................... 108
6 Conclusion ............................................................................................................ 111
6.1 Future work .................................................................................................... 112
7 Bibliography ......................................................................................................... 116

viii
Table of Figures & Tables
Figure 1- Chart characterizing the B and C steps of the ABC-method. From Douglas C.
Engelbart 'Toward High-Performance Organizations’ 1992 .......................................... 28
Figure 2- A concept map as shown in Knowledge Cartography .................................... 34
Figure 3- Shows the core elements of the IBIS notation and how they relate to one
another............................................................................................................................. 37
Figure 4 - Example of dialog map from Dialog Mapping by Jeffrey Conklin ............... 38
Figure 5 - Image from debate graph website highlighting the different types of nodes
that can be created in the debate graph map and how they relate. .................................. 43
Figure 6- knowledge federation logo as seen on knowledge federation website ........... 49
Figure 7- Model made in debate graph, showing a selected area of a map depicting the
knowledge federation website......................................................................................... 55
Figure 8 - Model of Images section from knowledge federation website, modeled in
debate graph using a split at the paragraph level and linking to persons being quoted. . 58
Figure 9- Visual representation of the spider structure element of the domain map ...... 67
Figure 10 - Sample of content from knowledge federation website with appropriate tags
for section........................................................................................................................ 69
Figure 11 - Shows creation of connection between new node and map. ........................ 77
Figure 12- Potential layout of domain map prototype with emphasis on map. .............. 83
Table 1- List of Nodes that comprise the domain map base notation...........…..………...75
Table 2 - Visual representation of different connection types as displayed in domain
map……………………………………………………………………………………..79

ix
Acknowledgment
I would like to extend my gratitude to my advisor Dino Karabeg, for letting me experience
true academia and for setting me on this journey of exploration and discovery. I truly
never expected to have the opportunity to be part of such an amazing project.
My gratitude also goes out to Fredrik Eive Refsli for helping with the design process and
for being a conversation partner sparking new creative viewpoints.
Thanks to the debate graph team in particular David Price, for making himself available
to explain the ins and outs of the application. This thesis would likely not have been pos-
sible without the foundation that was provided by the debate graph.
I would also like to acknowledge several people who have helped me stay motivated
through the process of developing and writing this thesis.
First, to my mother, for always believing in me and doing everything to allow me the
opportunities that have led to this thesis.
To Lorina, for being my rock through this process. You were my shining light at the end
of the tunnel when things were the hardest.
For all the support of my friends and teachers,
Thank you.

x
Foreword
Information scarcity has plagued humanity for millennia, suddenly through the emer-
gence of the information age, the tides have turned and now the world has changed from
one of scarcity, to one of information abundance. This has led to information glut.
This thesis intends to design a domain mapping prototype as a tool for tackling complex
problems. The goal is to explore the problems which arise in the age of information over-
load. Taking the lens of knowledge federation as a starting point. Through an exploration
of the nature of complex problems, the aim is to generate an understanding of the nature
of these problems. Furthermore looking into the previous works which inform the field
of knowledge mapping and collective intelligence.
The design of the knowledge federation website aims to serve as a jumping off point to
engage with complex issues and lead towards a paradigm shift in the knowledge field.
Building on the development of the knowledge federation website and the debate graph
application this thesis aims to design a prototype for a domain map. A modeling tool
which enables the mapping of information in a manner which informs the approach to
wicked problems and which allows for exploratory education.
The domain map prototype is the major contribution of this thesis. The elements which
inform this contribution are the design and modeling of the knowledge federation website,
the design of a domain map notation consisting of structure and visual elements of a map
model, and the description of features which make up the design for a domain map pro-
totype. The thesis also aims to generate new ideas that can be explored as a result of the
design of the domain map prototype.

1
1 Introduction
This generation is faced with a problem that no generation before has had to face,
access to too much information. Through the advent of globalization and the in-
ternet, access to knowledge is more readily available than ever before. More
knowledge is being created than ever before in human history (Lyman & Varian,
2003). There is more information being created every minute than a human could
consume in a lifetime (Marr, 2018). The abundance of information that is being
generated and shared results in information glut. Information glut makes it diffi-
cult to find relevant information among the sheer volume of content that is being
created (Wright, 2007 ).
The result of information glut is that knowledge is not being used effectively. The
data that is being created is being gathered and stored. But as stated by Wright, it
is not being used to its full effect. It can often take years for information to have
its intended effect, simply because it is lost in the sea of information. There is an
inherent need for a system by which information is organized, in a manner in
which it can be applied effectively to make sense of complex problems (Weick,
1995). There is a need for a tool which allows for information to be applied more
effectively.
Information glut may be a modern problem, but even in 1945, Vannevar Bush saw
that information was not being used to its full potential for problem-solving (Bush,
1945). He would inspire Douglas C. Engelbart to dedicate his life to the pursuit
of collective intelligence (The MIT/Brown Vannevar Bush Symposium, 2018).
Engelbart envisioned a world in which information would be shared freely, and
would directly be applied to the improvement of systems. Through the improve-
ment of the improvement mechanism, the collective capability of humanity could
increase drastically. A minuscule improvement in the Collective IQ could yield a
vast increase in the global problem-solving capability. To this end Engelbart de-
veloped tools which he saw as necessary to fulfill his vision, becoming famous

2
for inventing the computer mouse, hypertext and more in the process of doing so.
He died believing he had failed (Daul, 2013).
Knowledge Federation is an initiative which picks up Engelbart’s vision where he
left it off. Knowledge Federation aims to serve as a model in order to present a
new way of approaching knowledge work, enabling a new paradigm (Karabeg, A
paradigm, 2019). Through the institutions called transdisciplines, which exist out-
side of traditional domains, the aim is to transform knowledge creation and enable
a paradigm shift. A domain is a specialized field or topic. Knowledge Federation
is attempting to connect the dots of information into a larger picture capable of
tackling the world’s greatest wicked problems such as global warming, political
strife and many more. In order to facilitate these changes, knowledge federation
requires a tool which is capable of organizing knowledge in a manner which em-
phasizes connection and shows the big picture.
Realizing the aims of knowledge federation requires a tool with the means of or-
ganizing knowledge effectively. Knowledge mapping has been used as a way of
visualizing complex information and to make it understandable more easily.
Knowledge mapping tools have been developed in conjunction with mapping
methodologies. Which can be separated into many different genres of knowledge
mapping (Okada, Buckingham, & Sherborne, 2008). There is a need for a
knowledge mapping tool which is designed to the specifications required by
knowledge federation as a means of enabling a paradigm shift. A tool as such
would require a visual language to be created to facilitate the federation of
knowledge.
This thesis aims to design a prototype of a tool which fits the needs of knowledge
federation. The design should include a visual language described as a grammar
which is designed specifically for the federation of knowledge and which can be
used across new transdisciples, spanning multiple domains. The problem state-
ment of this thesis is defined as:
Design a mapping tool prototype with a grammar enabling knowledge
federation across multiple domains.

3
1.1 Scope - Knowledge Federation
Designing a domain map can be approached from many different views and with
many different aims. The domain map has the potential to have a major impact on
many fields, as it may be applied to many different domains. When designing a
prototype that is intended to fit every domain imaginable it is likely that it be-
comes too generic and not being robust enough to tackle complex problems.
This thesis is part of the knowledge federation initiative. Knowledge federation
aims to achieve a complete paradigm shift by reinventing the way knowledge is
interacted with. A natural approach for the design of the domain map is, therefore,
information federation. The scope of knowledge federation that will be explored
as part of the design is going to be focused on exploratory education. Through the
use of a domain map allowing users to explore different domains as a learning
experience. Through this approach, the user should gain an understanding of the
bigger problems, which are the result of smaller information pieces and questions.
The goal of using this scope is that by enabling education through a domain map
the insight gained will generate new ideas and approaches for solving problems.
1.2 Personal Motivation
The choice of topic when approaching a master thesis can be a daunting task.
Finding a project which resonates at a personal level as well as on an academic
level can be a challenge. Knowledge federation was a natural fit. Fulfilling the
three requirements that a project would need. First, the project falls in an area of
personal interested, that being education. Second, the project allows for independ-
ent exploration and allows for the scope to be self-determined. Third and most
importantly the projects has the potential to change the world for the better. The
final point is what is crucial to making the work feel worthwhile. Knowing that
even if the thesis is only a small pebble of a larger contribution. The end goal
makes the contributions of every pebble leading to that goal worth it.

4
The domain map prototype has the potential to be a piece in a larger movement
which leads to a global paradigm shift. Changing how knowledge is created,
shared and applied to problems. By applying the information into the improve-
ment of systems as part of development, a feedback loop can be created allowing
for systems to improve themselves. Improving the underlying system which spans
many different fields and disciplines could result in the effectiveness of those
field’s capabilities could be improved dramatically. Doing so could allow for the
collective human capability to increase drastically solving many of the greatest
problems facing the world today. Contributing a step towards that vision is the
goal of this thesis.
The domain map prototype has the potential to be applied in many different fields
such as politics, journalism, science and many more. This thesis approached the
prototype from the scope of exploratory education and knowledge federation. The
reason for this choice comes twofold. A personal interest in the field of education
but also a belief that it is the approach which will be the most effective at achiev-
ing the end goal. Federating information and questions through the engagement
people is how this thesis believes that the necessary insights to tackle major prob-
lems will be created.
The phrase; knowledge is power, has been used in a large number of situations
and context. The meaning of power can be interpreted in many different ways.
Power can be the ability to defeat one’s military opponents, power might be the
ability to make sure that major world problems are being addressed rather than
minor political squabbles, power can also be the ability to feed ones family.
If knowledge is power, then improving knowledge systems can increase the power
to solve issues. It can be used to increase the problem-solving power of a society.
And it falls in the hands of the academic community to make sure that the respon-
sibility that comes with great power is used well, and effectively. It is the
responsibility of this thesis to use the power of knowledge to make a better world.

5
1.3 Outline
This thesis is divided into five major parts. Chapter 2 will introduce concepts and
theory which the domain map is built on and which are crucial to understanding
the domain map prototype. Chapter 3 will highlight the approach that was taken
to create the domain map prototype. Chapter 4 builds on the approach and de-
scribes the domain map prototype in detail. Each aspect of the prototype is
described. Chapter 5 takes a critical look at the result of the prototype. Evaluating
different approaches and seeing what worked well and what did not as part of the
prototype. Chapter 6 provides a conclusion to the thesis, as well as presenting
future work that arises as a result of the thesis.

6

7
2 Background
The domain map prototype is part of the knowledge federation infinitive. The
prototype is part of a larger field of knowledge work. The field consists of a large
amount of contributions both small and big, all fitting together like puzzle pieces
describing a bigger picture. This thesis aims to add a new piece to the puzzle. In
order to determine where the piece fits in, one first needs an understanding of the
neighboring pieces. This allows to sculpt a piece which fits in snuggly between
the other pieces and which helps to enhance the big picture. Each section in this
chapter describes a neighboring piece.
2.1 Information Glut
The problem that is facing this generation is a problem that no generation before
has ever had to face, abundant access to knowledge and information. Through the
advent of the internet and globalization, more information is readily available at
a finger press than was previously stored in knowledge archives. More infor-
mation is being created than ever before (Lyman & Varian, 2003), over the past
years alone over 90 percent of all data in the world was generated (Marr, 2018).
One might not think an overabundance of information a problem, traditionally
lack of information has been the problem, however given the sheer volume of
knowledge being created on a daily basis there is more information than any hu-
man could consume in many lifetimes. Given the volume of information and given
that the information is scattered across many platforms a point has been reached
of no longer being able to see the forest amongst the many trees. In order to leave
the forest of knowledge behind and see what is relevant there is a need to find a
vantage point from which one can not only start seeing the information needed
but also to start using it in an effective way.
Information overload may be a more recent problem, but the information being
created and stored rather than used to its full potential has much deeper roots. In

8
1945 American Scientist and inventor Vannevar Bush wrote: "Professionally our
methods of transmitting and reviewing the results of research are generations old
and by now are totally inadequate for their purpose" (Bush, 1945). He realized
that information was not being used to its full potential for problem solving. Over
seventy years later and still nothing has changed in the way that knowledge is
shared and created. While the internet has enhanced the reach and speed at which
information can be shared and created the underlying method has not. For all in-
tent and purpose the knowledge field is still writing letter and publishing papers
hoping that someone will read them.
The way knowledge media is being developed has not changed in centuries. In-
formation is recorded as plain text sometimes accompanied by graphs and/or other
visual aids. While a plain text environment is by no means a poor means of sharing
information given that written language is very expressive and versatile it does
however not make any particular relationships salient. Salience can be a very pow-
erful tool to express concepts and ideas that are not well defined or that are being
prototyped, as it can highlight information such as conceptual relationships. This
can however come at the expense of other data (Larkin & Simon, 1987). Through
the use of such methodology, one is more likely to move from a traditional plain
text format to a more graphical notation which shows how information is con-
nected to one another. This can be an advantage when dealing with complex issues
on a problem-solving level.
2.2 Wicked Problems
Wicked problems are problems which are very difficult or even impossible to
solve, they usually involve too many variables to be reasonably summed up, or
are ever changing some wicked problems are incomplete. Understanding wicked
problems is crucial to understand why the domain map prototype is necessary and
to see how it fits in with existing approaches.

9
2.2.1 Characteristics
There are two notable ways to determine the common characteristics of wicked
problems allowing them to be identified as suck. Rittel and Weber defined wicked
problems by ten characteristics (Rittel & Weber, 1973), later Conklin devised his
own shorter definition with six-point (Conklin J. , Dialogue Mapping: Building
Shared Understanding of Wicked Problems, 2005).
Rittel and Weber, two professors from the university Berkley devised in 1973
what they saw as at least ten of the significant characteristics of wicked problems.
They observed them from the perspective of exploring social policies. Wicked
problems found in public policy issues such as tax rates, the development of
school curriculum and the confrontation of crime rates stood in stark contrast to
the more tame issues faced by engineers and scientists of the time. The term
“wicked” was to signify the malignant nature of the problems as opposed to be-
nign problems, though they made sure to clarify that it was not the intent that was
malignant but rather to show the significance of overcoming these issues. The list
of ten points is still one of the prime methods for determining the nature of a
problem and its degree of “wickedness”.
The ten characteristics found by Rittel and Weber are:
1) “There is no definitive formulation of a wicked problem.”
The problem cannot be given as a simple well-defined statement that en-
compasses the scope of the problem. While an ordinary problem can be
summarized in a statement, a wicked problem requires pre-existing
knowledge of all possible solution to be understood.
2) “Wicked problems have no stopping rule.”
Because there is no end in understanding a wicked problem there is also
no way of determining when it has been solved. One could measure im-
provement, but never be certain to have solved the problem.
3) “Solutions to wicked problems are not true-or-false, but better or worse.”

10
There is no way to determine whether the solution to a wicked problem is
correct or incorrect, it can only be evaluated is one solution is better or
worse than another solution.
4) “There is no immediate and no ultimate test of a solution to a wicked prob-
lem.”
The solution approaches to tame problems can be tested, this is not the
case with wicked problems. When a solution has been implemented un-
derstanding the outcome can be a wicked problem in and of itself.
5) “Every solution to a wicked problem is a "one-shot operation"; because
there is no opportunity to learn by trial and error, every attempt counts
significantly.”
When implementing a solution to a wicked problem it cannot be tested as
the outcome will have significant consequence. Not being able to test a
solution due to its complexity makes every approach to solving a wicked
problem crucial in its understanding of the problem and cannot simply be
done by trial and error.
6) “Wicked problems do not have an enumerable (or an exhaustively describ-
able) set of potential solutions, nor is there a well-described set of
permissible operations that may be incorporated into the plan.”
How many solutions there might be to a wicked problem cannot be proven
by any criteria. A problem might have no solutions and no measure can
determine that this is the case for the given problem. It might also be the
case the problem is dynamic and changing making it impossible to meas-
ure potential solutions as these solutions will dynamically have to the
change with the problem.
7) “Every wicked problem is essentially unique.”
Wicked problems are unique in that one cannot learn to solve a wicked
problem the way one can be trained to solve a traditional problem. A dan-
ger when operating with wicked problems can be that one applies solutions
which are practical for similar problems of lower complexity expecting

11
the same results which would result in unforeseen complications given the
complex nature of the problem.
8) “Every wicked problem can be considered to be a symptom of another
problem.”
Most problems are rather simple, having a root cause which created the
problem, resolving the root cause should resolve the problem. Wicked
problems are the result of one or more different problems which must be
addressed. The danger is that by attempting to alter a lower level problem
in order to solve the complex problem might result in unforeseen conse-
quences within the higher level wicked problem.
9) “The existence of a discrepancy representing a wicked problem can be
explained in numerous ways. The choice of explanation determines the
nature of the problem's resolution.”
When approaching wicked problems there are many actors and parties in-
volved in trying to fix the problem and each will have a different approach
to the matter depending on their world view and experience. This is the
result of interpreting the problem through different lenses depending on
the viewpoint one approaches. For example; a teacher might claim the
lower test scored among students is the result of less funding to the school
resulting in less time for the students to devote to a certain topic, whereas
it could also be claimed that students owning smartphones in class might
result in less attention being paid to the lesson and resulting in the low
scores. Both viewpoints would go about changing the problem differently
and might or might not improve the situation.
10) “The social planner has no right to be wrong (i.e., planners are liable for
the consequences of the actions they generate).”
Due to the high level of complexity and often interconnectivity involved
in a wicked problem those who seek out to solve them will have a large
impact on a large scale with grievous consequences. Therefore those who
handle wicked problems cannot afford to be wrong in their approach.

12
In his 2005 book, Conklin reduces the number of characteristics which comprise
wicked problems. His approach focuses less on planning and social policies but is
rather a more generalized list of characteristics which define wicked problems.
His list of six points shares similarities to those of Rittel and Weber, but is more
broadly applicable.
1) “The problem is not understood until after the formulation of a solution.”
Attempting to solve a wicked problem only results in new questions and
problems. The problem also cannot be understood without the proper con-
text to frame it. As there are many interpretations of the problem is not
possible to formulate the problem in a matter which satisfies all parties.
Where most problems require understanding of the problem first to at-
tempt to find a solution, wicked problems require knowledge of the
solutions in order to truly comprehend the problem.
2) “Wicked problems have no stopping rule.”
A wicked problem does not resolve once it has been solved like mundane
problems do, but rather ends once a party has exhausted all its resources
invested into the problem or remains an ongoing improvement process.
Solving a wicked problem is about ending with a satisfactory outcome, not
a complete one.
3) “Solutions to wicked problems are not right or wrong.”
As with Rittel and Weber’s definition of the characteristic, wicked prob-
lems are quantified by better or worse solutions rather than by wrong or
right.
4) “Every wicked problem is essentially novel and unique.”
Wicked problems may share many similarities but each is inherently
unique. While wisdom can be taken from tackling a wicked problem and
used to tackle a different wicked problem the complexity does not allow
for direct application and the new problem must be understood and exam-
ined from the ground up.
5) “Every solution to a wicked problem is a 'one shot operation.'”

13
One cannot solve wicked problems theoretically, a solution has to be tested
by applying it to the situation. This is usually expensive and will generate
a new set of outcomes which will result in new unforeseen wicked prob-
lems being generated.
6) “Wicked problems have no given alternative solutions.”
Wicked problems will have either no possible solutions or no solutions
which are apparent. It is therefore a matter of creativity in approach which
allows one to approach wicked problems with any manner of success.
The problem of information glut that has emerged is a wicked problem. Viewing
it through the lenses of education makes this even more apparent (see example
from 9) in Rittel and Weber list). Taking Cotlin’s characteristics one can see that
all six points are satisfied while looking at the information glut problem. 1) The
problem of information overload is not always clearly visible from the outside, it
would be easy to conclude that more material being published would result in
more knowledge. Organizing and creating the knowledge is the problem which
causes this and it becomes apparent how difficult a task it is to do so once one
attempts to develop managing systems. Finding that a new way of creating
knowledge is the wicked problem that is actually being discussed. 2) There will
likely never be a perfect way of collecting all human knowledge and applying it
effectively. There can be made many improvements, but there is no stopping point
at which it is done. There will be the point that is good enough. 3) There is no one
right way of solving the problem. The goal is to develop a new approach which is
better than the one in use now. 4) While tools and applications that have been used
to solve or at least improve similar problems such as the creation of hyperlinking
(Implemented Hypermedia in the '60s, 2019) the problem is wholly unique.
5) Creating a new knowledge creation tool which becomes used (which it must be
in order to be tested) runs the risk of compromising a large scale of knowledge
creation and can generate new wicked problems such as for example the dichot-
omy between two entirely different approached to knowledge creation which split
the talented researches in a way that could reduce the effectiveness of the research
being made. It is therefore crucial that the solution presented be conscious of this

14
danger and be developed with that in mind. 6) It is not a matter of choosing which
solution to use in order to solve the problem, but rather about developing a robust
tool which can be customized for different applications (although the focusing on
education and knowledge creation).
2.2.2 Tackling Wicked Problems
Tackling wicked problems is different from solving traditional problems which
consequently means that traditional approaches to solving them also do not work.
The traditional approach to solving a problem which is to first define the problem
in its entirety, then analyze it before solving it step by step. Through the charac-
teristics of wicked problems, it becomes apparent that this approach is not ideal
and can even be detrimental to tackling wicked problems. Nancy Roberts pre-
sented three approaches to coping with wicked problems (Roberts, 2000).
Authoritative:
Authoritative strategies aim to tame a wicked problem by reducing the number
of stockholders that are involved in solving the problem. While limiting the
number of individuals involved in the decision making process limits the
amount of knowledge and expertise that is being dedicated to the problem it
does allow for a clear path to be taken. An example of an authoritarian strategy
would be the U.S. Supreme Court giving a legal definition of a term in order
to settle a locked Congress. This strategy is also very common in the business
sector where CEOs have the power to make absolute decisions regarding the
trajectory of the companies’ direction (Camillus, 2008).
The advantages that come from authoritarian strategies are that by effectively
electing a representative to make executive decision fewer people are directly
involved allowing for faster and more concise decisions to be made. This also
reduced the overall complexity of a problem by reducing the number of actors
involved. Experts having to spend less time explaining the solutions to others
is also a significant advantage, leaving them to focus on implementing the
solutions and getting faster result.

15
There are disadvantages that come by using an authoritarian system. The reli-
ance on few expert individuals rather than bringing in a wide pool of
knowledge brings more danger with it. If the experts tackling the problem
make mistakes these are less likely to be discovered and can have catastrophic
consequences. A side effect of using such a system also can result in less learn-
ing opportunities due to the reliance on experts, creating a disconnect between
the stakeholder that are connected to the wicked problem and the experts. It
can also lead to tunnel vision as some important factors may not be considered
by the expert panel. Rittel and Weber (Rittel & Weber, 1973) state that in the
long run taming a wicked problem will only result in the problem to manifest-
ing into a different wicked problem or even worse create a problem even worse
than the original being tackled.
Competitive:
The competitive strategy aims to solve wicked problems why setting up op-
posing viewpoints against one another in order to encourage growth through
competition. Pitting different ideas against one another in order to gain a
stronger viewpoint of the opposing points of view and allowing for a greater
understanding of the problem and needing to greatly examine solution against
external criticism. The competitive strategy often creates a win-lose scenario
in which on position will come out on top. Military warfare scenarios repre-
sents a zero-sum example of a competitive strategy. The two opposing
viewpoints clash, violently, and the side that comes out on top has its solution
implemented.
The advantage of a competitive strategy comes from the fact that the perceived
stronger idea comes out on top. This is often represented by the idea of letting
the market decide on an idea. If for example two operating system provides
have different approached to solving problems that their end users are facing,
rather than coming to a consensus on how the problem is to be solved, they
will each implement their own solution and present them to the public letting
it decide on the solution that is better.

16
Disadvantages to competitive systems come in many forms. Looking at the
examples stated above, they can have rather drastic consequences creating
even worse wicked problems, such as the resulting conflict of a military action
which can lead to war and long lasting disputes taking years to resolve. Pre-
senting two solutions to a wicked problem can also fragment the user base
making tackling the problem in the future even more difficult as a problem
might arise within one implementation and a different problem in the other.
Now two different problems have been generated and both require resources
to fix the issues separately.
Collaborative:
The collaborative strategy stands in direct opposition to the competitive strat-
egy. Rather than pinning two ideas against one another edging out the other it
is about taking the best of both ideas in a win-win scenario. These ideas are
often discussed in meetings or through other means of facilitating dialog. Col-
laborative ventures allow for cooperation cross international boards and
within different organizations.
The advantages of collaborative approaches to wicked problems come from
joining of knowledge and resources to tackle the problem. Though coopera-
tion is allows for resources to be shared across the solution allowing for more
efficient solution, as well as relieving a single party of the financial burden.
Redundancies are also eliminated when the resources are pooled into solving
the task combined.
The disadvantages to collaborative strategies are largely logistical. Coopera-
tion requires cross communication and incurs transition cost between the
entities working together. The number of actors involved grow and with that
the likelihood of reaching a consensus. Bringing in large numbers of stake-
holders runs the risk of dialog turning into debate and requires this to be
facilitated. This is a skill which must be learned and trained to result in effec-
tive cooperation. The outcome of cooperation may also result in many

17
compromised which satisfy none of the stakeholders and as such runs the risk
of creating new problems down the line.
Each approach carries with is a number of advantages and disadvantages and de-
pending on the scope of the wicked problem different approaches might yield
better results. Evaluating which methodology to pursue when tackling wicked
problem is however one of the important decisions that need to be taken before
approaching such a problem.
Making the involved stakeholder part of developing the solution was suggested
by Rittel (Rittel H. , 1972) as a means of maximizing the pool of knowledge avail-
able. This effort can prove time and resource consuming without a way of
facilitating the process. Computer designed and implemented cross-stakeholder
argumentation techniques can facilitate such an endeavor (Shum, 2003). New
techniques and tools are being developed to facilitate such debate such as Dialog
Mapping (Conklin J. , Dialog Mapping: Reflections on an Industrial Strength Case
Study, 2003) which allows stakeholder to come to a consensus through facilitated
dialog. Robert Knapp also emphasizes this move from simply needing solutions
to problem to moving into inventions which are capable of tackling growing prob-
lems as an ongoing process (Knapp, 2008). Through the development of tools
which facilitate dynamic problem-solving though multiple stakeholders dynami-
cally.
2.3 Systemic Innovation
When tackling wicked problems the design methodology which is used to ap-
proach solving such issues can be equally important as the problem itself. The
term systemic innovation has been used in a wide array of contexts and definitions
and has grown more popular in recent years. The lack of a clear definition of the
term does require clarification as to its use within the context given. Building off
of the deemed most popular definition of the term (Takey & de Carvalho, 2016)
as a type of innovation which must be accompanied by complimentary innovation,

18
Midgley and Lindhult sugegst that there are four different popular defintions of
the term (Midgley & Lindhult, 2017).
The first definition as alluded to before is found as the result of innovation span-
ning across more than a single organization or company and requiring a multitude
of innovations in order to be successful. The definition derives its name from the
fact that an innovation of systems is giving rise to it.
The second definition of systemic innovation is most commonly used in regards
to the regional or methodical framework policies often provided by governments
as a way of intervening or supporting the industry. Innovation is pushed by an
external agent onto existing systems which are already in place and mostly auton-
omous. This innovation can come as a meta-level approach to enabling innovation
with the ultimate goal of strengthening local economies and/or increasing employ-
ment. It is systemic innovation in that it is a meta-systems supporting the growth
and development innovation within private or third-party organizations or systems
of organization by a regional government.
The third definition is a much more high-concept approach to viewing innovation
than the two other definitions given before. It is mostly used when viewing a larger
social impact which comes from innovation leading towards a larger social shift.
It is often about changing how the game is being played rather than improving a
strategy by which to play the game. It is often with the goal of transitioning into
a more sustainable society often leading towards a tipping point such as a para-
digm shift (Karabeg, Information design - a new paradigm in creation and use of
information, 2003). This definition defines systemic innovation as innovation to
the underlying systems in place as a means of changing the methodology bringing
forth groundbreaking innovation as a result.
The fourth and final definition given by Midgley and Lindhult is concerned with
approching the innovation process through which the parties involved learn to
view their methodlogies and methods as systems. The goal being to chagne the
way in which people are viewing their approuch methods as part of a larger system
in order to see the bigger picture. Changing the view of a system into a single

19
artifact and approuching it as a means of making sense of a much larger situation
or problemt which requires innovativ thinking becomes the appraoch. Engaiging
situations by thinking in terms of systems as a means of leading to clear action
and innovation within the bigger picture scheme.
Having explored the wide selection of scopes in which the term systemic
innovation can be used in it becomes possible to narrow in on defining the term
in a manner in which it becomes useful for the context of developing a Domain
Map prototype within the scope of exploratory education and knowldege
federation.
Systemic innovation is a means by which an actor engaging withing a piece of
knowledge work can be connected to the bigger picture and see how a piece of
knowledge work fits into the whole of the puzzle which comprises the entire
system. Using the view of the system gathering meta-data which enables
innovation to the underlying methodology of the development of knowledge and
its application within the larger knoweldge system. Using the new innovations to
tackle the bigger picture issues which are being mapped as part of the whole
system. Though viewing the entire system, it also beceoms clear in what areas the
system is lacking and need new pieces and innovation to be placed to complete
the whole system.
Defining systemic innovation as the innovation of the underlying methodology of
a system and improving the system as a means of tackeling larger wicked
problems.
2.4 Collective Intelligence
Changing how information is being created and shared is the first step towards
again harnessing the full potential of the knowledge pool that is available. What
is arguably needed is a way of dynamically creating knowledge. A way of having
20
knowledge work build on the newest information and to be interconnected glob-
ally. Standing on the shoulders of giants as a means of seeing further.1 In the field
of informatics there are few giants that loom as large as Douglas Engelbart, it is
his vision of a collective mind which guides the creation of the domain map pro-
totype.
2.4.1 Doug Engelbart
Douglas C. Engelbart is one of the influential inventors and visionaries that have
entered the field of computing. Today Engelbart is best remembered for being the
inventor of the mouse. He is also the invertor of display editing, windows, hyper-
text, network computing and more. The inventions he would become most
famous for were all presented during a live tech demo in 1968, later dubbed “the
mother of all demos”. The 90 minute presentation included a live video confer-
encing tool as well as what would lay the foundation for graphical user interfaces
in the future. Though they were only around 13 years old at the time these inven-
tions would later set the foundation for Steve Jobs and Bill Gates as they worked
on developing Apple and Windows respectively. While these companies devel-
oped what would become modern computing and commercialized it in the 80s
and 90s Engelbart seemed largely only to be remembered for inventing the mouse
at the time. In 1998 he was honored at the University of Stanford during the 30th
anniversary of the mother of all demos, where he was celebrated for his major
contributions to modern computing and the influence on the World Wide Web
(Celebrating the 30th anniversary of Doug's 1968 Demo, 2018). In the year 2000
he was awarded the highest honor within the National Medal of Technology by
U.S President Clinton.
Alan Kay has been quoted in saying, “I don’t know what Silicon Valley will do
when it runs out of Doug’s ideas.” (Landau, How Douglas Engelbart Invented the
1 “If I have seen further than others, it is by standing upon the shoulders of giants.” - Isaac New-ton
21
Future, 2018) While this is an exaggeration it highlights the deep impact that En-
gelbart’s inventions and ideas had on the technological community as well as the
world. Despite his many accolades and successes when he passed away on July 2,
2013 people close to him such as Bill Daul have noted that he did so feeling he
had failed (Daul, 2013). The title of his 1998 symposium where he was being
honored was “Engelbart's Unfinished Revolution” which even then implied that
only a small part of Engelbart’s vision had yet been realized. Engelbart viewed
the tools he had created as just that tools, which were there to help achieve his
greater vision. Daul also notes that Engelbart was well known for exclaiming to
people “You just don’t get it.” He felt that he and his vision had been largely not
understood. When asked how much what he had envisioned had been attained he
said “About 2.8 percent.” So the question arises, what happened to the remaining
97 percent of his vision? What was Doug Engelbart’s Unfinished Revolution?
In order to understand Doug Engelbart’s vision it is important to understand where
his philosophy came from and how he approached problems. A key inspiration
for Engelbart was a paper published by Vannevar Bush called "As We May
Think" which Engelbart read while serving in the Navy as a radar technician (The
MIT/Brown Vannevar Bush Symposium, 2018). The paper would inspire him to
change his career trajectory towards the betterment of mankind (The unfinished
revolution, 2000). He believed that this could be achieved by harnessing a collec-
tive human intelligence facilitated though technology to tackle the world’s biggest
problem. He coined the term collective IQ as a means of describing how people
would collectively work on solving important problems. By achieving even a min-
imal increase in the worlds collective IQ it would allow for problems to be solved
across a large spectrum of domains. As a means of achieving this goal Engelbart
turned to digital technology (O'Brien, 1999).
Engelbart’s inventions were the first step in implementing his larger vision of a
collective IQ. The tools allowed for much faster communication, knowledge gath-
ering and distribution as had been possible before. He also realized that it was

22
important that in order for a true collective intelligence to exist the way he envi-
sioned it, the approach would have to change.
“Digital technology could help make this a better world. But we've also
got to change our way of thinking.” (Douglas, 1995)
It was the Human-system that Engelbart viewed as the difficult task to change
(Doug's Strategic Vision - A Human Endeavor, 2018). As he proved by develop-
ing the tool-system necessary (started to prove) it was not where he though the
major challenge of a collective intelligence was lying. It was the Human element
that had to undergo a change.
“Many years ago, I dreamed that people were talking seriously about the
potential of harnessing a technological and social nervous system to im-
prove the IQ of our various organizations. What if, suddenly, in an
evolutionary sense, we evolved a super new nervous system to upgrade
our collective social organisms? Then I dreamed that we got strategic and
began to form cooperative alliances of organizations, employing ad-
vanced networked computer tools and methods to develop and apply new
collective knowledge.” (Landau, The Engelbart Hypothesis: dialogs with
Douglas Engelbart, 2009)
A social nervous system is what Engelbart saw as the key to raising our collective
IQ. The technological progress that has been made since Engelbart’s time is stag-
gering. The technological advances that limited him at the time are now fully
realized. But as technologies grow more advanced the underlying methods have
not evolved and scaled accordingly. The nervous system that is in place is not
capable so sending the message from the brain to the rest of the organism. If one
were to view information technology as a living creature that has grown to the
size of a blockbuster movie sized monster, the monster is in danger of running
over a cliff or even collapse under its own weight unless it learns to move its limbs
using a nervous system that is well designed for its size and purpose. For a nervous
system to be capable of working at the scale and speed that technology moves the
process of improving it must match the pace of technological growth.

23
Bootstrapping is the word Engelbart coined in order to describe the tools and pro-
cesses that are being developed to improve the rate at which the process itself
would be improved. The ideas being that increasing the effectiveness of the pro-
cess improvement would drastically change the overall effectiveness across the
entire field of application. The way bootstrapping is intended, is to “use what they
build to boost their own effectiveness” (About Bootstrapping, 2018). Any process
that is about improving team collaboration, knowledge technologies and innova-
tion disciplines are bootstrapping the collective nature by their definition.
The Bootstrapping strategy is about improving the improvement process as a
means of collective intelligence. Bootstrapping generated a feedback loop with
the customer, feeding the advancement of the collective IQ back into the improve-
ment team. Using the bootstrapping strategy allows for both the general
improvement of the collective IQ, but also allows the teams and businesses im-
plementing it to gain an edge over the competition as contributors of leading edge
improvement.
The Bootstrapping strategy also carries other benefits, such as faster and smart
growth. As the developer becomes the customer by means of development as the
improvement gained through the development will be directly applicable to the
further development of the project and of future projects. The integration of im-
provement strategies also becomes streamlined and improved as part of the overall
efforts as they are a direct part of the end product. By raising the collective IQ the
provider will see stronger return of investment as the creation and deployment
becomes faster and smarter. The direct involvement of the customer as a stake-
holder would also increase the amount of investment and knowledge dedicated to
the research and development process. As the primary users of the product that is
being improved they have the strongest firsthand experience and expertise with
the product and have the strongest grasp on how to improve the process to benefit
the user (themselves). Another benefit is the exponential benefit which the user
receives from the improvements. The improvement that the customer is experi-
encing though the process is passed on straight to the end user. As well as the end
user having direct access to the working environment and to the development,

24
thereby they can take part directly in the innovation work which results in a prod-
uct which is shaped specifically to the needs of the end user and refined by all the
stakeholders.
In order to achieve the bootstrapping strategy the development of an improvement
mechanism needs to be in place, developing an improvement tool would be a form
of bootstrapping. Engelbart’s vision of such a tool was in line with his inventions,
an open hyperdocument system.
2.4.2 Open hyperdocument system (OHS)
A key tool in Doug Engelbart bootstrapping strategy was the development and
implementation of an Open hyperdocument system (OHS) (About An Open
Hyperdocument System (OHS), 2019). Such a system would need to be world-
wide accessible and accessible on all platforms in order to be most effective. The
system would span across a multitude of knowledge domains allowing for more
direct linking and accessing of knowledge.
The requirement of an OHS is that it allows an individual accessing it to have
access to specific knowledge pieces which can be accessed directly as well as
allowing for the big picture to be seen. While the internet has been used in great
effect with hyperlinking as a way off connecting information to one another it
does not fully satisfy what Engelbart envisioned with his OHS. Commonly a hy-
perlink will send the user to a different document which must be skimmed in order
to find the desired information. Tagging individual parts of a document and link-
ing to it is possible but is widely underused and would require a shift in the way
the knowledge is being created, straying away from the conventional format and
embracing a more modern digital native approach of piecing information together.
Moving away from standard pipeline approaches has been the philosophy of Sili-
con Valley over the recent decade moving towards more agile development
methods (Stavru, 2014). The same approach must be applied in knowledge work
in order to satisfy the vision that Doug Engelbart laid out.

25
Some key attributes of the OHS as highlighted by Engelbart himself are broken
down into three major categories; internal attributes, key features and Further sup-
port (Lehtman, Engelbart, & Engelbart, 1998).
Internal attributes:
The key attributes that must be in place for an OHS system to function the way
Engelbart envisioned it are reliant on developing the knowledge creation in a way
that is tailored to the system. Each knowledge object, which can be anything from
written text to a visual slide, an email or even voice and video recordings, must
be tagged automatically and tagged by the author. Each object must also include
timestamps and dates noting the creation and every modification of the object.
The system should also encourage the user to structure the objects in a natural and
logical manner.
Key Features:
The key features that would be enabled though the internal attributed and make
and OHS possible are the core of the system. The ability to link and jump between
each knowledge object freely and allowing for different views to be possible hav-
ing both a top down birds eye view of the system and seeing the big picture as
well as seeing the specific knowledge object self-contained as an individual piece.
The view must be highly customizable allowing the user to only see the infor-
mation that is required and desired, allowing for information such as dates and
timestamps not to appear unless required. Directly integrated messaging system
linked directly to emails allowing for direct integration and accessing of messages
as part of knowledge objects. Control over the access control over the information
objects.
Further support:
There are additional support items which would allow to round out the full OHS
as a complete implementation of the vision. Merging the browsing and editing
process, allowing to seamlessly switch between editing and creating knowledge
and accessing and reading knowledge. Easy ways of tracking and collecting pieces

26
of knowledge into journals or libraries. The ability to subscribe and get notifica-
tions when certain knowledge objects or topics are being updated, connected or
created. A key aspect would be the signature encryption for each knowledge piece
allowing for clear identification. In addition to build in text and email support the
system should also allow for video conferences to be held, both in a structured
and moderated format as well as in a free format, being recorded and documented
as a knowledge piece. A versatile UI-system which allows for point-and-click in-
teractions as well as, direct commands, voice commands, macros and menus. The
entire UI should be customizable to the individual user and to the individual do-
main that it is being applied to.
Some tools already exist which incorporate one or more of the desired features,
traits and attributes, but no tool has combined all into a true OHS yet. For example
an open source tool named hypothes.is (To enable a conversation over the world’s
knowledge., 2019) allows for individual parts of a text to be highlighted and then
tagged as a piece of knowledge. The object can be commented on and discussed
directly. There are also numerous other examples that have some or more of the
features desired in an OHS, the Doug Engelbart Institute lists: Spreadsheets, Doc-
uments, Video, Wikipedia, Ubiquitous Linking and Annotation, Websites and
finally specifically their own website (OHS-Like Tools, 2019). The feature that
they highlight in their own website is the indexed number that accompanies every
paragraph of text on the website allowing for sections to easily be found, tagged
and linked to.
2.4.3 CoDIAK and Dynamic Knowledge Repository
Engelbart worked on defining and developing his own approach to OHS. As part
of his the bootstrapping paradigm he saw two key aspects at the center of realizing
this. The two prototypes he used to describe his ideas were the CoDIAK process
and the Dynamic Knowledge Repository.

27
The CoDIAK process is describes what Engelbart saw as the methodology for his
bootstrapping initiative. CoDIAK stands for: the concurrent development, inte-
gration and application of knowledge (Engelbart, 1992). It is the cornerstone for
what Engelbart thought businesses at the time needed to do in order to increase
their effectiveness and thereby their Collective IQ. Engelbart uses what he called
the ABC model as a means of underlining the CoDIAK process and highlighting
how the need for businesses to tackle improvement methods rather than simply
applying improvements to the problems at hand.
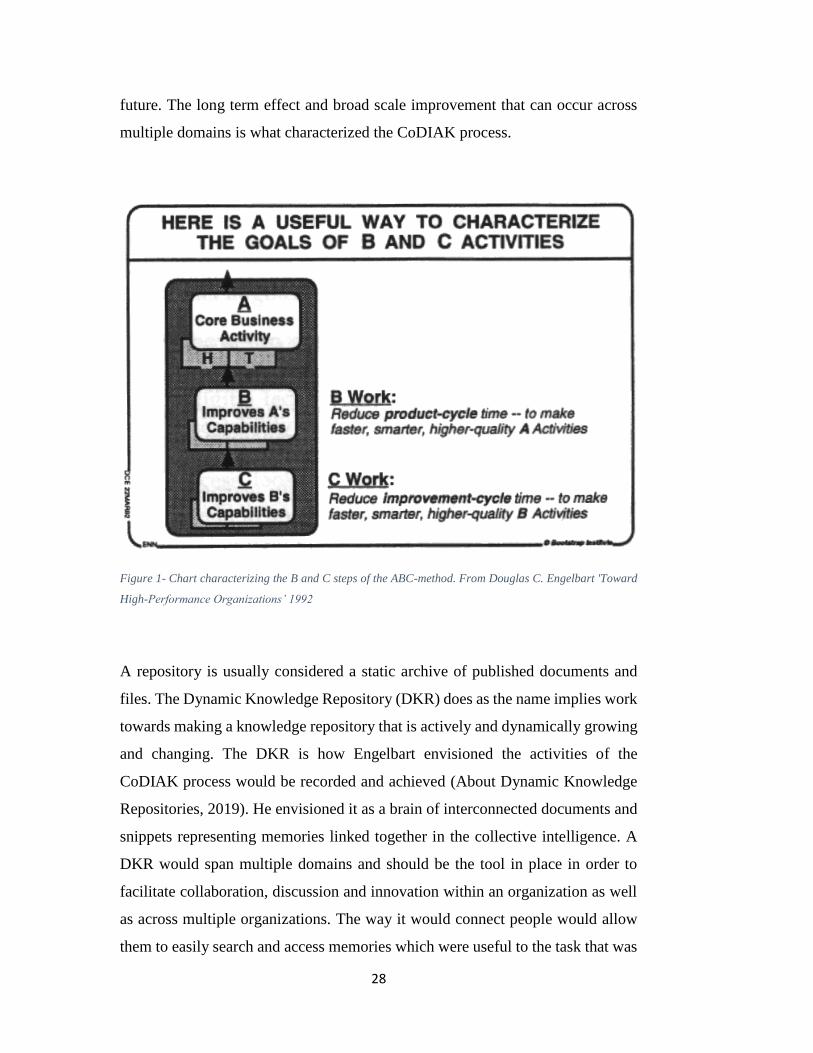
The ABC model is a framework which outlines three basic activities (See Figure
1):
A Activity: Business as Usual:
The primary activity describes how the business or other entity in question is op-
erating at a day to day basis. It is the baseline from which the improvements
method can begin. It can involve many complex task or just one simple task as
long as it the norm for the entity.
B Activity: Improving how we do that:
The base activity is set in A, the B activity is to look at how the A activity can be
improved. This improvement can come in any form such as speed or productivity.
Introducing new routines or changing existing ones are typical examples of a B
Activity.
C Activity: Improving how we improve:
Finally the step that is what makes the ABC model stand out from other improve-
ment strategies. Rather than focusing directly on improving Activity A the model
focuses on improving Activity B as part of Activity C. This means improving the
improvement method that is being used in activity B. If Activity B was about
developing new routines for activity A then activity C would look at improving
the development of routines. Improving how routines will be developed in the
28
future. The long term effect and broad scale improvement that can occur across
multiple domains is what characterized the CoDIAK process.
Figure 1- Chart characterizing the B and C steps of the ABC-method. From Douglas C. Engelbart 'Toward
High-Performance Organizations’ 1992
A repository is usually considered a static archive of published documents and
files. The Dynamic Knowledge Repository (DKR) does as the name implies work
towards making a knowledge repository that is actively and dynamically growing
and changing. The DKR is how Engelbart envisioned the activities of the
CoDIAK process would be recorded and achieved (About Dynamic Knowledge
Repositories, 2019). He envisioned it as a brain of interconnected documents and
snippets representing memories linked together in the collective intelligence. A
DKR would span multiple domains and should be the tool in place in order to
facilitate collaboration, discussion and innovation within an organization as well
as across multiple organizations. The way it would connect people would allow
them to easily search and access memories which were useful to the task that was

29
being tackled. Engelbart thought that the quality of DKR that was available to the
organizations would be the key contributor to the increasing or lowering of its
Collective IQ. In a way everything that Engelbart was envisioning was simply
laying out the groundwork for the direction that he hoped humanity was moving
towards, allowing for the solving of the world’s greatest and most complex
wicked problems. He was laying out at path that future generation one day could
follow. He was drawing a map.
2.5 Knowledge Mapping
Maps are one of the oldest forms of visual representations of concepts by humans
predating the written word and numerals systems. Maps allow for an abstract and
symbolic representation of a concept to be visualized and for connections between
objects and/or themes to be made. Maps allow for the complexities of grand land-
scapes to be condensed into the most important information elements, it simplifies
the information without losing the big picture of the entire landscape. Wicked
problems are complex and interwoven, they typically involve a large degreed of
complex actors and issues. Simplifying the issue through the use of maps without
losing the overview of the big picture and the connection between the points of
interest seems a good approach to tackling wicked problems. Or allowing for al-
lowing for a better understanding of wicked problems. In the time of information
overload how to interact with the complex problems becomes increasingly crucial
to the success of tackling big problems and complex issues. Mapping allows for
the abstract to be communicated visually. For the first time in human history a
generation is growing up that has never know the absence of connected infor-
mation networks. Connecting information through linking and as nodes is a
natural way for this generation to communicate and interact with knowledge me-
dia. Creating the strongest models that allow this to be enables is therefore
significant in building up knowledge work moving forward.
Representing knowledge as an interconnected map in virtual space it how
Knowledge Mapping can bridge the gap between knowledge work and interactive

30
problems solving engagement. Knowledge Mapping or Knowledge Cartography
is a large field with many approaches and definitions. In the book literally titled
Knowledge Cartography (Okada, Buckingham, & Sherborne, 2008) it is defined
as:
“the art, craft, science, design and engineering of different genres of map
to describe intellectual landscapes – answering the question how can we
create knowledge maps?
and the study of cartographic practices in both beginners and experts as
they make and use such maps – answering the question how effective are
knowledge maps for different kinds of users?”
In short Knowledge Cartography is about making sense of the world and gaining
new understandings through the process of doing so. It allows for sense to be
gained in a manner which the written word struggles to do, the way humans can
communicate sense through body language, subtle speech patterns, tone, film, and
other forms of communication of ideas. In the book Knowledge Cartography em-
phasis is placed on three key concept which are central to the digital design of
connected ideas.
I. “Clarify the intellectual moves and commitments at different levels. (e.g.
Which concepts are seen as more abstract? What relationships are legiti-
mate? What are the key issues? What evidence is being appealed to?)
II. Incorporate further contributions from others, whether in agreement or
not. The map is not closed, but rather has affordances designed to make it
easy for others to extend and restructure it.
III. Provoke, mediate, capture and improve constructive discourse. This is
central to sensemaking in unfamiliar or contested domains, in which the
primary challenge is to construct plausible narratives about how the world
was, is, or might be, often in the absence of complete, unambiguous data.”
I. is centered on establishing the major aspects that need to be developed as part
of the model. It highlights what is existing and what areas are to be explored. It
established the boundary objects which can then be interacted with. This is where

31
meta-connections and trans-disciplines can be established where they are lacking
and appropriate. It is in part building the structure of the knowledge domain.
II. Knowledge creation can yield strong results through cooperation. Knowledge
mapping is therefor also enhanced though the collaborative process. As the
strength of knowledge mapping is the sharing and communication of complex and
often difficult to understand topics it becomes an ideal tool for sharing and col-
laborating on knowledge work. Incorporating the ability for multiple people to be
involved on the development of knowledge through the map.
III. Gathering and resenting knowledge is important, but there value of mapping
comes from the insights which can be gathered though the connections made by
the map as part of the network of interconnected information. The purpose of a
map is to navigate a landscape and to get to a desired destination, similarly
Knowledge Cartography requires for the navigation of topics, opinions and ac-
tors as a means of reaching the concluding goal of solving a complex problem.
The goal can be in the scope of learning and exploration as long as it allows the
user to generate new insights as part of step I. and II.
Developing a DKR or similar knowledge system could benefit from being struc-
tured as a knowledge map, employing the methods of knowledge cartography as
an underlying grammar for the development of knowledge work. It would allow
for the creation of meta-connections and meta-domains which generate new field
of research and development as new domains for knowledge creation. The flexi-
bility of maps allows for scaling and adapting to complex growing problems, such
as wicked problems.
Knowledge cartography is a wide field and has seen many techniques and models
which are being used, all with different focuses which come with strength and
weaknesses. There are a range of mapping techniques and support tools available,
so many in fact that they can be split into genres (Okada, Buckingham, &
Sherborne, 2008). The different genres of knowledge cartography are designed
with a specific purpose in mind. Some are educational (Cañas & Novak , Concept
Mapping Using CmapTools, 2008) (Hyerle, 2008), some are developed for debate

32
(Culmsee & Awati , 2008) (Groetker, 2008), and others are information linking
tools (Zeiliger & Esnault , 2008).
For the foundation of a domain map and the tackling of wicked problems, two
mapping techniques stand out, concept mapping and issue mapping.
2.5.1 Concept Mapping
Concept mapping was first developed in 1972 by Joseph D. Novak and his re-
search team and was initially developed to measure the learning progress of
children, but has since then been used as a tool for facilitate learning and as a
teaching tool for students and educators alike. Concept mapping is a mapping
technique which strived to combined images, words and ideas into a diagram map
and highlight connections between them and how they stand in relation to other
existing pieces of knowledge. It has been shown be an effective learning tool at
many levels, ranging from elementary school to higher education and even at a
corporate level (Novak & Gowin, Learning How to Learn, 1984). Concept map-
ping also has a highly collaborative application, and has been shown to be an
effective tool to both build knowledge in collaboration with other (Novak,
Learning, Creating, and Using Knowledge: Concept Maps(tm) As Facilitative
Tools in Schools and Corporations, 1998), but also allows for the result to be
achieved and accessed later. Concept maps are usually arranged in a hierarchical
manner having the more general concepts at the top and becoming increasingly
more specific towards the bottom. The concepts are generally defined as words
which are connected through linking phrases to form sentences of meaning and
linking ideas together. The linking phrases should be kept as short as possible to
simply the model and highlight the concepts themselves which are being net-
worked together.
The underlying theory behind concept mapping lies in David Ausubel’s theory of
cognitive learning which was first introduced in 1963 (Ausubel, 1963) and is the
foundation for the development that Novak and his team used for concept map-
ping. The core principle is what Ausubel refers to as meaningful learning, which

33
is described in three ways. The first entails that the person that is learning must
choose to relate new ideas and concepts into their existing body of knowledge and
preexisting notions and concepts. The second is the person learning must possess
the necessary concepts already to make connections to new ones. And third is that
what is learned must be meaningful within the domain. Meaningful learning is
presented as an alternative to what he calls rote learning. Rote learning is when
one does not attempt to assimilate new knowledge into ones existing pool of
knowledge, but rather memorizes it without integrating the new concepts into own
knowledge, it is the opposite of meaningful learning which is also part of assim-
ilation theory by Ausubel. Concept mapping is underlines by constructivist
psychology and constructivist teaching (Cañas & Novak , Concept Mapping
Using CmapTools, 2008) which as opposed to early twentieth century education
thinking encourages knowledge to be engages with rather than simply consumed,
it also recognized that knowledge work are growing and changing and that learn-
ing methods must adapt as well. Adapting to it through the use of tools such as
concept mapping.
Creating a concept map begins with defining what the central concept is that is
going to be mapped. This is the focal point of the map and located at the top as
the most general concept. All other concept are going to be placed below it in a
hierarchy based on their generality. In order to start the process one should gen-
erate a focus question which is tied to the main concept. It is there to serve as a
guideline for what specific view within the concept that is taken, f. ex. If the topics
is ‘School’ a focus question could be; what makes up a school? This limits the
scope of the topics and allows for new concepts to be generated such as class-
rooms, teachers, students, etc. The focus question should be an open question to
allow for exploration rather than a closed question. And questions that require that
the subject concept be explained are ideal (Derbentseva , Safayeni, & Cañas,
2006). Once the focus question has been established, a brainstorming session
should occur where all concept that are linked to the main concept through the
focus question are listed in what is called the ‘parking lot’ and is simply a list
located to the side of the map before being added. Once a large amount of concepts

34
have been gathered, typically ten to twenty, they are sorted by how general they
are. Evaluating the order in which the concepts are presented and how they should
be integrated into the map is what Bloom refers to as synthesis and evaluation
(Bloom, 1956) which he deems the highest levels of cognitive thinking. Integrat-
ing and connecting the concepts into the map are also synthesis and evaluation
activities and according to Bloom improve the cognitive learning of the topic.
Connecting the concept from top to bottom is helpful, but in order to utilize the
full strength of concept mapping, cross-linking concepts vertically allows for
greater insights to be gained, as well as connecting concepts from across the map
to generate new phrases between the concepts and thereby new relationships. A
map will typically go through several iterations before being complete. For an
example of a complete concept map over the concept of concept mapping see
figure 2.
Figure 2- A concept map as shown in Knowledge Cartography
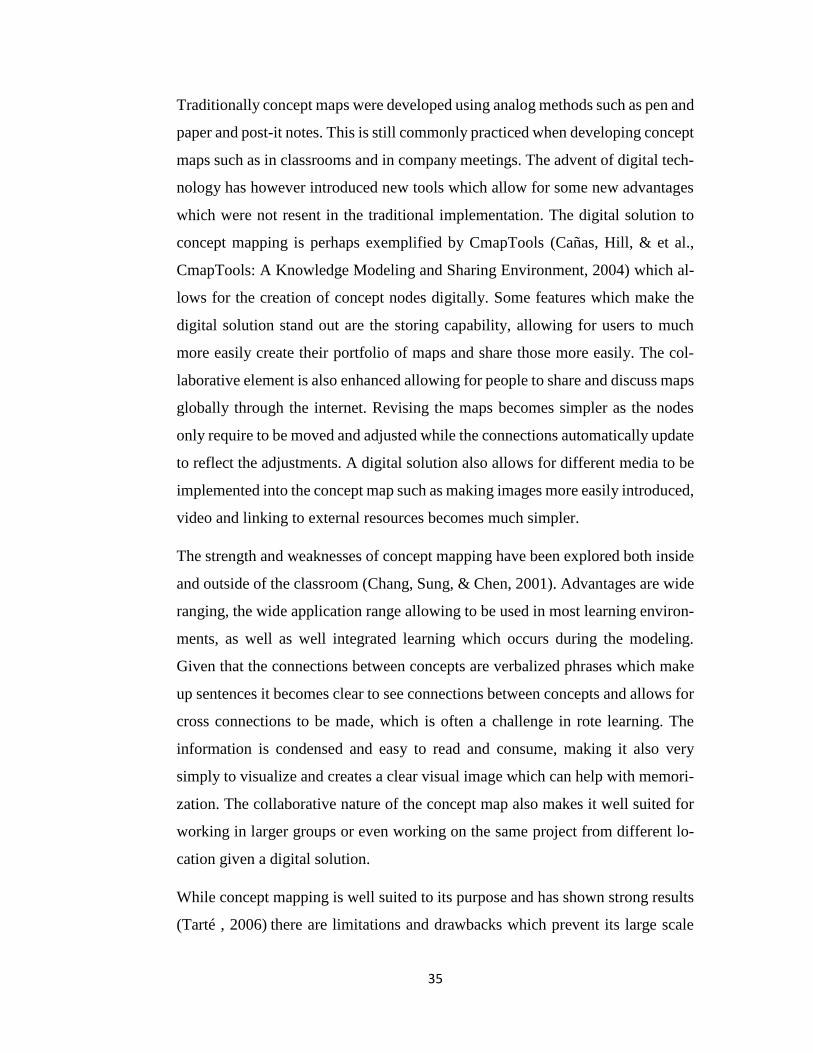
35
Traditionally concept maps were developed using analog methods such as pen and
paper and post-it notes. This is still commonly practiced when developing concept
maps such as in classrooms and in company meetings. The advent of digital tech-
nology has however introduced new tools which allow for some new advantages
which were not resent in the traditional implementation. The digital solution to
concept mapping is perhaps exemplified by CmapTools (Cañas, Hill, & et al.,
CmapTools: A Knowledge Modeling and Sharing Environment, 2004) which al-
lows for the creation of concept nodes digitally. Some features which make the
digital solution stand out are the storing capability, allowing for users to much
more easily create their portfolio of maps and share those more easily. The col-
laborative element is also enhanced allowing for people to share and discuss maps
globally through the internet. Revising the maps becomes simpler as the nodes
only require to be moved and adjusted while the connections automatically update
to reflect the adjustments. A digital solution also allows for different media to be
implemented into the concept map such as making images more easily introduced,
video and linking to external resources becomes much simpler.
The strength and weaknesses of concept mapping have been explored both inside
and outside of the classroom (Chang, Sung, & Chen, 2001). Advantages are wide
ranging, the wide application range allowing to be used in most learning environ-
ments, as well as well integrated learning which occurs during the modeling.
Given that the connections between concepts are verbalized phrases which make
up sentences it becomes clear to see connections between concepts and allows for
cross connections to be made, which is often a challenge in rote learning. The
information is condensed and easy to read and consume, making it also very
simply to visualize and creates a clear visual image which can help with memori-
zation. The collaborative nature of the concept map also makes it well suited for
working in larger groups or even working on the same project from different lo-
cation given a digital solution.
While concept mapping is well suited to its purpose and has shown strong results
(Tarté , 2006) there are limitations and drawbacks which prevent its large scale

36
implementations. A disadvantage that comes from the use of concept maps comes
in the form a double edged sword, while the simplicity in concept and phrasing
allows for a clean and simple visual map which is easily read and remembered it
does also limit the disruptiveness that is possible for the concepts and connections.
Some concepts or connections might prove too difficult or complex to reduce to
a single phrase connection or node. Another disadvantage can be that fact that it
can be time consuming to create a complete map and then to revise to and incor-
porate all elements such as images and external resources. Mapping also generally
comes with the downside of having a learning curve which can make it difficult
for new users to adopt it over conventional methods of knowledge creation and
learning. While concept mapping has a very simple notation it does still require
to be learned and practiced, through revision, in order to achieve the best results.
2.5.2 Issue-based information system (IBIS)
Issue mapping derives its name from “Issue-Based Information System” (IBIS)
and was originally developed by Horst Rittel and Werner Kunz in the late 1960s
to early 70s (Rittel & Kunz, 1970), the IBIS principles and notations have also
directly inspired conversation mapping or dialog mapping. IBIS was originally
developed with the intent of supporting political planning and coordination pro-
cess. It is intended to guide discussion and allow for issues to be settled through
problem-solving groups. It does this through the examination of an issues taking
in arguments from all sides involved.

37
Figure 3- Shows the core elements of the IBIS notation and how they relate to one another.
Issue mapping takes the notation from IBIS and applies it to tackling great issues
and to find solution through organized debate. The IBIS notation centered around
questions which is represented as an issue which needs to be solved. The core
issue is placed at the far left and can be pointed to by positions to the Issue. The
positions are a response to the issue, and thereby is an attempt at answering the
questions. A positions can be also be pointed to by another issue which may arise
as a result of the positions. Arguments either in favor or against the position can
also be raised and point towards the position. Arguments in turn can also be the
subject of new issues that are raised as a result, opening the map for new positions
and arguments. While an Issue map can keep on going, it is the responsibility of
the actors and moderators to return the discussion to the core issue the discussion
leads further from the core issue than is intended. Figure 3 shows the IBIS notation
as it is used in Issue mapping, noting the three main elements of Issue, positions
and arguments, and how they relate to one another within the map.

38
Dialog mapping is a method and notation for quickly and accurately recording a
conversation or meeting in an efficient way. Dialogue Mapping was developed
by Jeff Conklin (Conklin J. , 2005) as a means of utilizing IBIS as a way of map-
ping a conversation, but more importantly he saw it as a way of tackling wicked
problems.
Dialog mapping aims to work towards solving wicked problems by creating mod-
els which are non-linear and try to reflect how humans really think and
communicate. Instead of trying to create models based on the problem the ap-
proach is to start a dialog and discus the problem, by having a more organic
conversation this can allow individual to think more freely and not the reliant on
the formatting of a problem. A dialog can be mapped by a designated individual
which does not partake in the discussion, or if everyone is versed in the grammar
everyone can keep track of the conversation with their own map and use these to
generate new ideas and topics in relation to solve a problem.
Figure 4 - Example of dialog map from Dialog Mapping by Jeffrey Conklin

39
Dialog mapping is conducted using a shared visual display which allows all actors
involved to view the progress of the debate and the topics that have already been
explored and argued. As the purpose of a dialog map is to suspend decisions and
generate a clear understanding of all the viewpoints and arguments involved in an
issue, before coming to a conclusion. Coming to a consensus is arguably easier
when the information is clearly displayed with all accompanying arguments.
The notation of Dialog mapping is simple and deeply rooted in IBIS. The termi-
nology used is slightly different and is accompanied with a visual language of
symbols which make the overall readability simpler to view, which is important
given the dynamic nature of the creation. The basis of the notation is centered on
questions symbolized with question marks and correspond sing to issues in issue
mapping. Positions are labeled as answers and are still supported by arguments
which are represented using a green plus symbol or a red minus symbols respec-
tive to their supportive or opposing nature. Dialog mapping also introduces to
additional symbols to the notation, namely the introduction of information ele-
ments, represented as documents and which can make up the basis for a question,
an answer or arguments. In Figure 4 several different information elements have
been introduced. These elements range from an excel document, a wall street jour-
nal article and a research forecast. Each element is shown supporting a different
element. Important to note is that not too many such elements are to be introduces
as to enhance readability and not clutter the map. The final symbol introduced to
dialog mapping is a gavel which symbolized the conclusion of a topic and will
highlight the conclusion or decision that has been reached within the issue. If no
conclusion is reached the symbol will be absent. A map can be complete without
having a conclusion, as it will still serve to give an insight into the debate and can
be used historically as a recording of the session. Using a dialog map can also
prevent debates from being repeated, as the facilitator can simply point to the el-
ement on the map and show that it has already been argued.

40
Making use of dialog mapping, as part of issue solving, brings with it several
advantages that yield positive results in the solving of wicked problems. Conklin
highlights some of the following in his book.
Given the large number of potential contributors, the dialog map retains
input from all involved and reflects this as part of its map. This gives all
participants a voice that is incorporated into the map.
The map allows for group thinking as a collaborative activity. The shared
display of elements give a shared understanding and visual clarification if
the questions and arguments that have been presented.
Through the logical display of the topics the map focuses the group to
discuss in a guided direction.
The session is recorded as part of its process and can therefor easily be
references and cited later.
Actors that were not involved in the debate can get an understanding of
the debate after the fact, as the topics discussed are clearly visible and
noted.
The rationale behind answers and arguments is made visually clear
through the IBIS notations.
The map encourages collaborative work as a means of gaining a large
number of views and arguments and has a better chance of covering many
actors and viewpoints to a problem. This makes it well suited to discussing
wicked problems.
Some drawbacks to the use of dialog mapping are common with general draw-
backs of mapping techniques. Other issues are more specific to dialog mapping
itself.
Given the broad number of actors involved a large number of solutions
and answers might present itself to a questions and it might be difficult to
choose a point of action if the arguments are evenly distributed.
The IBIS notation is simple and easy to read, but it requires that someone
actively create the map as it is being debated for it to be effective during
41
the debate. This can be resource effective as it requires a practiced mapper
well versed in dialog mapping.
Through the simple display elements there can be a lack of understanding
from the actors if an element requires greater explanation to be fully
grasped.
2.6 Debate graph
When looking for an implementation of DKR like knowledge systems the debate
graph stands out as an implementation of many of the ideas discussed by Engel-
bart in his Vision. The debate graph is a web-based tool which allows for
collaborative discussion of issues through visualized mapping of debate. The de-
bate graph was created by former Australian Minister for Higher Education Peter
Baldwin and David Price with the goal of developing public service discourse
platform which would allow for global cooperation and debate from a clear and
neutral scientific standpoint free from the distractions of repetitive clutter.
Through the creation of communities and the development of graphical maps
within the debate graph issues are under constant discourse and the map is to be
revise throughout the development.
The debate graph has seen application at high levels of political discourse being
used by the US Whitehouse (Noveck, 2009) and the UK Foreign and Common-
wealth Office (Nuclear 2010: NPT Review , 2011) amongst many other mass
media outlets and newspapers. The political application was highlighted the com-
plexity of issues that can be approached though mapping tools such as this. Over
the span of four week the development of a Gaza map took place in 2009 aiming
to help reach an understanding the Middle East (Price, 2009).
The debate graph is a web based application where one interact directly with
knowledge maps. The only requirement is to create a free account before being
able to create and share maps. The maps can be used by individuals, small teams
or even large corporations as a means of structuring debate and information. The
interface is split into two main components; and inspector which contains long

42
form information such as text, video, citations, commends and history, and the
navigation map, which shows how the pieces of information connect to one an-
other and which create the bigger picture. The navigation is done through
interacting with nodes which have connections going in and out depending on the
relation. The view of the map can also be changed highlighting different features
such as how much is to be shown and expanded. The navigation map takes its
roots in the IBIS notation.
The notation of the debate graph which includes the nodes and connection be-
tween them will be referred to as the grammar of the debate graph. This is to
indicate the connection between mapping and language. The debate graph has a
large number of different ways for information to be stored and interacted with.
The grammar is heavily based on the IBIS notation, following the structure of an
Issue or a question being raised than then having positions be taken to the issues
and supported by arguments. The debate graph also adds variants of as well as
more specific elements to the notation. The different types of elements are high-
lighted in different colors with differently colored arrows allowing for quick and
visual identification of the elements role at a glance.
A brief overview over the different elements with quick descriptions can be seen
on figure 5 as taken from the debate graph website (debategraph, 2019).

43
Figure 5 - Image from debate graph website highlighting the different types of nodes that can be created in
the debate graph map and how they relate.
Visual elements are added to the map to allow for easier navigation. The node
elements are centered on the current topic that is being viewed. Connecting ele-
ments are displayed as either being larger or smaller depending on how they stand
in relation to the topic. Larger objects bring the user further up in the hierarchy
and smaller go deeper. Symbols are sued to identify other properties that a node
has; * indicated that the object has children (elements further down in the hierar-
chy) or that it is being linked to through an external cross-link, ° denotes that there
is a detailed explanation to the element in form of either text and/or video.
Cross-linking between objects and maps allows for information to be placed out-
side of the hierarchy and can create a connection between all types of elements.

44
The debate graph has its own notations for the different kind of cross-link refer-
ences that can be made as well and is indicted by the ‘ symbol. (debategraph,
2019).
The information that is stored on the map can also be viewed in different modes.
From variants of the initial setup to more traditional hierarchical views, for a vis-
ual reference on how such a view can look see figure 5 which displays the nodes
in such a view.
A feature of the debate graph which allows it to ensure quality of the nodes and
connection, as well as allow for interaction of many actors with the map. The
rating system is simple to engage with, allowing for objects inside the nodes as
well as relations to be rated on a scale from 1 to 9. The rating of an idea is repre-
sented in the thickness of the arrow, the higher the rating the thicker the arrow
will be displayed to the rest of the community. Not yet rated items will by default
appear as thin. The rating appears alongside any citations and comments which
are made to the knowledge object. The rating allows for a visual representation of
the strongest ideas and concepts to be highlighted and seen more easily.
2.7 Value Matrix
Assuring high quality of publishing is generated through the peer review system
within academia. This is a tried and tested method which results in high quality
publishing around the world. Internet resources are generally criticized for the
lack of through evaluation of content. This creates an unappealing environed for
academics to enter new forms of digital publishing and knowledge creation, leav-
ing the alternative of digitalized versions of old school publishing. Creating a new
academic ecology requires that the system keeps track and records contributions
to knowledge work, giving a measurable impact that a contribution has to a
knowledge work system, such as a domain map. The Value matrix object proto-
type is suggested to that end, being part of the knowledge federation applications
(Karabeg, Federation through applicaiton, 2019).

45
The value matrix object prototype is an object which is attached to a contribution
in a system and through a matrix estimates the value the contribution is providing
to the system, as well as other value it adds as a knowledge object. The value
matrix object can be attached to any knowledge object including documents as
well as people and actors within a knowledge system. The overall relevance of a
given knowledge object is determined by the overall value of that is provided by
the matrix.
The value matrix is the result of the implementation of the QRI-model to a
knowledge system. The QRI-model stands for Quality, Relevance and Im-
portance, and is the basis of the matrix which makes up the value matrix object.
The three are defined (Lachica, Karabeg, & Rudan, 2008) within the context of
the value matrix as such:
“Quality reflects the intrinsic value of an information resource. Information
that is unreliable or impossible to understand is valueless, even if it may oth-
erwise be highly relevant or important.
Relevance reflects the value of an information resource from the point of view
of the user’s needs as the user himself perceives them.
Importance reflects the value of an information resource from the point of
view of a larger context or as seen by people who may possess knowledge
about what the user may need which the user himself may not possess.”
The factors are how knowledge pieces are to be captured and evaluated in order
asses their value. In order to be implemented in a mapping system the question of
how the value of an object is to be measure. A combination of two approached
suggested by the prototype are manual and automatic.
The manual assigning of the QRI falls on the user of the system in order to demine
the significance of the knowledge piece in respect to the system. The QRI-score
is to be given on a scale between 0 and 10. Knowledge Objects with low scores
are to no longer appear as part of the system to users (though will not be removed
entirely). The ratings are to be given to each aspect of the QRI-model. The users
46
providing the ratings are weighted based on their ‘trustworthiness’ and contribu-
tion level which is to give an indication of their knowledge level. This
measurement of contribution would be a reflection of their own value matrix as
part of the system, creating a feedback loop between users and knowledge objects
within the system. In the context or relevance its score is dependent on the location
within the map. One knowledge object can have different relevance depending on
is connection and context.
The automatic generation of QRI is to account for only a margin of the weight
that is taken into the overall value score. It is to provide the guiding frame and
smoothen the process resulting in a stronger result. It does this by recording the
user’s activity and activities in relation to one another to determine the weight that
is to be given every users input. By adding this automation the quality of the man-
ual assignment is strengthened.
The role of the value matric within the context of a domain map is to record con-
tributions to the map in terms of Quality, Relevance and importance. Creating a
map where the valuable knowledge objects are more visible on the map and gen-
erating the most accurate map as a result. The prototype of the value matrix is
designed to work together with other systems such as a domain map and is there-
fore ideal to be integrated as part of the domain map prototype.

47
3 Approach
The underlying foundation which allows for the domain map prototype to be de-
signed has been set. It is a manner of deciding on an approach on how the model
of the prototype is going to look. The approach strategy needs to be determined
as a means of guiding which design methodology is used to approach wicked
problems. This creates the guiding philosophy by which the modeling will be ap-
proached. Determining test models will be crucial to determine what features to
include and what needs to be highlighted as part of a domain map prototype. Cre-
ating a general picture of that the prototype will look like well inform changes
that need to be introduced.
3.1 What is the Prototype?
In order to get an understanding of how to approach the design of the prototype
the general concepts need to be in place serving as a blue print to follow for the
approach. These concepts have been introduced in the previous chapter. The blue-
print is a how the domain map prototype is envisioned to work. Based on the
problem statement there are several key aspects to incorporate.
Design a mapping tool prototype with a grammar enabling knowledge
federation across multiple domains.
The model serves the primary goal of knowledge federation as part of the indica-
tives larger goal of a paradigm shift. The prototype is to work across multiple
domains. A domain in this context can be a field, it can be a larger topic or it can
even be a transdiscipline. Building on the principles of knowledge mapping the
grammar is to be defined and well as the general use of the application (tool).
The intent for the domain map prototype is for it to be a web based application
which enables users to interact with, create and share in domain maps. Maps are
tied to specific domains but can intersect through the use of link connection which
can span cross-domain. Through the creation of domain maps a web of maps is

48
crated which is the complete knowledge map. The map consist of nodes contain-
ing information as well as connection which connect the nodes, as well as
providing some form of context. The map should be easy to navigate and interact
with as well as be edited seamlessly as part of the exploration. Through navigating
the map it serves as a learning tool and can allow for the education on specific
topics while leaving room for new ideas and insights.
3.2 Mapping a Wicked Problem
The domain map prototype is being crated to address the complexity of modeling
and understanding wicked problems. In order to tackle wicked problems getting a
full view of the problem from as many different perspectives and with many ideas
as possible allows for the problems to be managed more accurately. The creation
of a tool which allows for wicked problems to be approached more easily can
yield positive results across many fields. Some of the biggest problems facing the
world a wicked problems. Creating a knowledge community organized though the
domain map could allow for such problems to be attacked more strategically. In
order to do so a strategy needs to be decided on.
When introducing wicked problems there where three strategies suggested as ap-
proached to wicked problems: Authoritarian, completive and cooperative (see
2.2.2).
Looking at the different strategies they all come with clear advantages and disad-
vantages. When tackling a wicked problem the strategy that is implemented is
crucial to the success. In the scope of education a fully authoritarian strategy
seems to go against the academic nature of knowledge development. Reducing
the number of participants that partake in learning and development of knowledge
is the opposite of the purpose of education. Competitive strategies can allow for
debate to become a key aspect problem solving, it can however result in unideal
solutions winning out. Cooperative strategies seem a natural fit in tackling infor-
mation creation as if facilitated well it allows for all stakeholders to participate in
the solution process as well as generating the most versatile solutions.
49
3.3 Knowledge Federation
In order to map a terrain on requires first understanding of the geography that one
is attempting to map. The domain map prototype is only a small part in the
knowledge federation prototype which is being spearheaded by Dino Karabeg as
a means of finishing Doug Engelbart’s unfinished revolution (Karabeg,
Knowledge Federation Prototpye, 2019). Creating the prototype of the domain
map requires something to map in order to assess what elements need to be in
place to fully capture the complexity of a problem. As the domain map prototype
falls under the domain of knowledge federation it seems an appropriate base line
for modeling. By mapping knowledge federation is in fact modeling itself and is
as such designing itself for its needs.
Knowledge federation is a prototype which aims
to show how knowledge can be created and shared
utilizing modern technology and methodologies.
While the domain map prototype has the scope of
exploratory education in this thesis, the
knowledge federation aims to encompass many
domains, such as politics, science, as well as edu-
cation and others. The visual theme of knowledge
federation and its motto are centered on connect-
ing the dots. Visualized through the logo which are the letter K and F created
through dots which are connected (See figure 6). The visual theme that resembles
a map. The goal of the prototype is to change the way that knowledge is being
approached, enabling a new goal oriented mindset, which seeks to improve our
systems as a way of avoiding catastrophe. Steering towards a cultural revival on
par with the resonance.
Why use knowledge federation as the basis of modeling for the domain map?
The answer is twofold: First while knowledge federation encompasses many do-
mains as a trans-discipline the core of what knowledge federation is about is
enabling knowledge work. The domain map aims to enable the creation of
Figure 6- knowledge federation logo as seen on knowledge federa-
tion website
50
knowledge as well making the two well aligned. Second the complexity of
knowledge federation and its connection to wicked problems makes it a strong
test case for how robust the map will be at handling complex issues such as wicked
problems. It acts as a sort of stress test for the domain map prototype.
The approach to map knowledge federation is going to steer the direction of the
entire project and as such will give the basis for this thesis. The initial approach
will be to take the knowledge federation prototype website as a starting point.
Through the creation of the website the information becomes organized and can
then be visualized more easily into a model. The website contains the major ele-
ments of what makes up knowledge federation and acts as an introduction to the
topic. The Initial map will be designed using the debate graph application.
Through the development of the map it should become clear in which areas it is
not suited for the mapping of this nature. From there improvements and additional
implementations will be viewed and designed. In order to get a better understand-
ing of what needs to be mapped as part of the domain map prototype the first
prototype towards that end will be the design of the knowledge federation website.
3.4 Knowledge Federation Website
The design of the knowledge federation website is the first step in a approaching
the domain map prototype. Having been part of the design team which allowed
for the website to launch at the start of 2019 allowed for a deep understanding of
the information which makes up knowledge federation. The design of the domain
map will be modeled in the website and is thereby an extensions of the project.
The domain map prototype is a piece of the larger knowledge federation initiative.
The website is therefore part of the domain map prototype as well (Karabeg,
Knowledge Federation Protoype, 2019).
The knowledge federation website is designed as a jumping on point for people
to understand what knowledge federation is about. It guides the reader through a
series of discoveries and stories to help bridge the understanding of the ‘paradigm
shift’, the Cultural Revolution that is the goal of the prototype. The website is

51
structured simple and straight forwards, containing five key parts. The first part is
the main page which is the first point of contact for the reader. There are then four
sections which each focus on brining understanding through a different lens or
medium. The four section are called Federation through; images, stories, applica-
tions and conversations (Karabeg, Knowledge Federation Prototpye, 2019).
The homepage is designed in the same manner as the other pages, but the content
tells the historical story of knowledge federation and its origin and inspirations of
scientific ‘giants’. The pages themselves are structures as small vignettes each
with its own purpose and topic. Each vignette is then again split into several topics
which are titled and can be accompanies by other media. Each vignette can lead
or link to other pages and/or other media, but serves as a puzzle piece in the page
as a whole striving to bring the reader out of the metaphorical forest and on top of
the mountain from which they can see the whole big picture that knowledge fed-
eration is tackling.
Federation through images is the first of the pages the reader is directed to explore
upon completing the front page. The page is as the name suggests centered on
designed images which convey a concept or idea, building on the idea that images
are worth more than a thousand words. In this case some images have the potential
to be worth far more than a thousand words. The page is the first that the reader
will begin to explore, and this is by intent. The images allow the reader to properly
contextualize the information in a visually simple manner, and keeps the reader
engaged. Each vignette in this section is centered on an image and is built around
contextualizing and explaining it. This is an important detail to keep in mind in
regards to mapping the website, keeping the image at the center of the element.
Federation through stories follows the most traditional format resembling a series
of articles or journals. The vignettes in this section are telling historical tales
which lead to a point of understanding or which informs a piece of knowledge or
idea. The stories are usually centered on individuals whom embodies the
knowledge federation spirit in some form or another such as Doug Engelbart, Er-
ich Jantsch and Aurelio Peccei. The stories are the longest elements amongst the

52
pages and serves to give a more relatable context to the reader which might begin
to feel somewhat overwhelmed by the amount of different information, ideas and
concepts that the site has presented up until this point. The challenge in mapping
this section will most likely derive from the long form structure which is some-
what different the digestible bites that the other vignettes have provided.
Federation through applications is the section which is most rooted in technology.
The vignettes in this section are focused on presenting different application and
prototypes which are being used and/or designed for the use by knowledge feder-
ation. The domain map prototype will find its home in this section once the
prototype is completed. As an application which enables the visualization
knowledge federation in an alternative medium to the website, there to accompany
it. The section sends the reader to many different locations and sites as a result of
fully exploring it, highlighting the advantages that direct linking within a map
could provide. The challenge become incorporating the different applications and
prototypes into the map in a map which is easy to explore and does the applica-
tions justice.
Federation through conversations is the section which stands to gain the most from
a different medium as it is reliant on cooperation. The website follows the same
structure of vignettes that is present in the previous sections, but hints at a more
collaborative element. The creation process is being examined, letting the reader
reflect and decide on how they can fit into the bigger picture. The section acts as
a tail end to the website leading the reader off to explore. It does however hint at
the collaborative nature that is desired. Creation through dialog. This section
might include a more interactive part in the context of the map. Allowing for con-
versations to be recorded and engaged with as knowledge emblems of discovery.
Mapping the knowledge federation website can be approached in many different
ways. This thesis will build on the debate graph as a discovery tool. Developing
the map within the structure of the debate graph and highlighting what areas need
improvement or change, as well as what features that might have to be added or
implemented to fully take advantage of the visual medium more effectively.
53
The mapping must be able to incorporate all five sections of the website and
should ideally also build on them making use of the mapping medium. The flow
of the presentation should remain intact, allowing the reader to explore if desired,
but also provide a road map which one can follow leading to the top of the moun-
tain.
3.5 Debate Graph Model
The debate graph application was as the name implies designed for debate. The
knowledge federation website was created as an ideas starter, as a way of intro-
ducing a very complex topic to readers and to invite them to join the knowledge
federation. While the two are rooted in many of the same ideas and philosophies
they inheritably to not overlap in practical use. The debate graph does however
allow for many features and ideas which the website does not allow for, and would
like to see implemented as stated in the applications section on the website. Such
as the ability to directly comment on each individual piece and to start a dialog
directly related to the topic in the element. The aim of modeling the website in the
debate graph is to get a better understanding of the tools that need to be in place
in order to achieve the desired domain map, and to see how they might be imple-
mented. The domain map is intended to serve as a learning tool as well as a
modeling tool, as such the development process will have its foundation in active
learning (Wrenn & Wrenn , 2009).
One of the major challenges when attempting to translate the website from its
static text based layout to a graphical model is on deciding how to divide the in-
formation that is on the website.
One approach would be to fully translate the content of the website into a different
form so as to fit into the IBIS notation structure. Rephrasing and organizing the
information into issues and questions and divide the supporting and opposing ar-
guments that the website provides. This approach would result would likely work
well in the creation process of the map, as it would be tailored to the grammar of
the debate graph. It would however also require large amounts of restructuring of
54
knowledge as not all information on the website is structured to fit into the IBIS
notation. Not only would that require terrible effort (something which isn’t re-
peatable easily) but it also runs the risk of information being mistranslated or used
incorrectly as many of the information elements are very multi-faceted. It would
also eliminate the discovery of areas that might be lacking in the debate graph for
a more education centered approach. Building on the outline by Conklin for this
method (Conklin J. , Dialogue Mapping: Building Shared Understanding of
Wicked Problems, 2005).
Alternatively approaching the mapping process with the intent to ‘break’ the map
and see what does not work with this approach as a means of iteratively making
improvements and seeing what needs to be implanted has the benefit of generating
ideas more easily and to find problematic areas. A danger with this method is the
potential disconnect between the notation that is in place on the debate graph and
the general layout of the website. Testing both methods will give the best under-
standing, and generate a picture what to address in the domain map prototype.
Regardless of which approach is used there are a number of factors that will be
taken into account when translating the website into the issue map.
When presenting the information how to split it up becomes crucial. Each of the
pages is intended as a whole, split into vignettes and split once more into titled
paragraphs. This seems to give a natural way of splitting the information, but it
does raise some questions. Should the vignettes be the smallest node element or
should the paragraphs be nodes of their own? How should the information be con-
nected? Should they be linked in order to maintain chronological order or be
grouped by page and allow the reader to explore them in the order they see best?
Fracturing the information too much could result in the reader losing sight of the
connection, or read a piece which was intended with prior knowledge of a differ-
ent element. Determining what elements might require their own nodes, or which
could link to other nodes or even maps will also give insight into what grammar
might be needed in the domain map. Should actors or individuals be mapped and
linked? Creating a node for say Albert Einstein would allow for multiple maps to

55
connect to this element and view other works or references to the individual. Giv-
ing the individual a map of their own.
A factor to consider is what the intended view is for the information. The debate
graph allows for a range of different presentations of the information which each
have advantages and weakness in terms of presentation of information. The de-
fault view of the debate graph is the explorer view. In the explorer view the
highlighted element is shown as a node with connection to all neighboring ele-
ments. The range of how many elements that are shown can be adjusted as well
ranging from all, to only showing the highlighted item and its immediate neigh-
bors. Figure 7 shows an example of how the default view looks like when all nodes
are shows rather than being in focused mode which is the default edit mode.
Figure 7- Model made in debate graph, showing a selected area of a map depicting the knowledge federa-
tion website.
The different displays allow for the reader to explore and create connections in
different ways. Using different displays also gives perspective on what might be
missing, or if information is getting clumped and/or too much is bound into one
node and might need to be split up for ease of view.

56
A feature which will likely be particularly useful in translating the website into a
map is the article function. The article view generates a plain text version of the
map which aims to mirror a traditional article. The website follows the traditional
structure of an article, meaning that if the article generated by the debate graph as
a result of the map is the same as the website article, then it is clear that the infor-
mation has been translated onto the map in its entirety. It does not however
determine whether the presentation results in an equally good reading and learning
experience.
Modeling the different parts of the website comes with different challenges as the
different pages have different modeling needs. The views might also play differ-
ently for each of the different sections, benefitting one more than the other. The
main page and introduction requires a certain sense of hierarchy. The information
must be ordered correctly to allow the reader to result with the correct conclusion
and understanding. This means that not splitting up the information becomes more
valuable. Requiring the information to be in one place does however also reduce
the precise links that can be made between ideas and concepts, especially cross-
map. The image section of the website often builds on one image which takes
center stage, it is therefore important that the image remain visible to the reader
as it is being explained. The stories are the ones that benefit the most from being
split up, connecting to a single argument or view point. Each story should stand
on its own and only stand to inform the argument. Applications can prove chal-
lenging to the debate graph to the extent that much of the information is being
linked externally, and not modelled inside the map itself. Attempting to model
some of the prototypes however would provide some additional insight on what
may need to be implemented in a domain map. For the conversations section of
the page two factors stand out. The first being that multiple mediums need to be
mapped which might not be supported, such as time coded video or conversation
recordings. The second factor is conversation on the map. Discussing specific top-
ics of the map and having the comments and discussion be a valuable tool that
adds to the map rather than distract from it.

57
The approach to developing the domain map is going to be to create all the differ-
ent models describes so far as a means of getting a better understanding. As the
subject is complex by its nature and generating understanding of it is the main
task of the map, using surveys or other methods of crowd sourcing the methods
would likely not result in relevant insights outside of utility of the debate graph,
which is not the primary goal. Once a solution for a domain map is completed, by
its very nature the map will create a feedback loop which will allow for it to im-
prove itself.
Each model that is created in the debate graph is testing a specific model or re-
quirement for the modeling of a map. A list of the following factors which play
into the models is what will generate the insight which will inform the creation of
the domain map prototype:
Information splitting models
o Full page with linking to external sources
o Vignette based splitting, keeping each vignette in place
o Paragraph based splitting, each paragraph is a node in the graph
Page models
o Main page; a model which focuses on different implementations
of the front mage
o Image based; takes the image page and attempts to keep the image
the center of focus. See figure 8.
o Story based; focusing on longer stories, attempting to interconnect-
ing them for insights
o Application based; testing how external objects requiring more
complex explanations are modeled.
o Conversations based; allowing for different mediums to be imple-
mented and for conversation to be tested as part of the model
Creating the models which are made from combining the task from the first list
with a point from the second generates fifteen different domain maps. Each map

58
can give insight into different issues and suggest reasonable or unreasonable ap-
proaches.
Figure 8 - Model of Images section from knowledge federation website, modeled in debate graph using a
split at the paragraph level and linking to persons being quoted.
Different forms of linking will be tested in the maps as well. Testing direct linking
of nodes, indirect linking through topics and linking to external sources. The dif-
ferent links that can be created through the debate graph notation are versatile and
should allow for all connections needed in an IBIS based notation.
3.6 Evaluating approach
Building on the methods and concepts established in the background chapter the
context and insights that can be gained will allow for the design of the domain
map prototype. Having gained a thorough understanding of the problem through
the literature as well as having established multiple approaches will allow for the

59
prototype to be rooted in existing knowledge, standing on the shoulder of giants.
The vision that was laid out by Engelbart over half a century ago and which
knowledge federation has picked up is creating the blueprint for how to approach
the design of the prototype.
The models that are being established as part of the approach chapter will inform
the design of the different elements what will encompass the domain map. Some
models might result in many different issues that need to be addressed. The debate
graph serves as a base model for the domain map, implementations of ideas that
work well for the purposes of the domain map will be incorporated in the proto-
type.
The insights gained from the development of the models as part of implementing
the knowledge federation website will dictate the features that will be highlighted
in the grammar that will make up the domain map. The visual layout and interface
as well as what view and visual layout the map is presented in will also be based
on the results of the quasi-issue maps that are created. The different forms of link-
ing and implementations of media are the most uncertain factors as they are more
likely to be more different than the implementation of the debate graph. The do-
main map prototype will also attempt to intergrade a value matrix or value matrix
like object which will approach rating and categorizing elements in a matter that
makes the map more readable. As well as allowing for simple and effective cita-
tions and means of gaging the contributions of elements and actors.
The domain map prototype will attempt to be one more step towards finishing
Doug Engelbart’s unfinished revolution.

60
61
4 Domain Map Prototype
The domain map prototype is an attempt at developing a modeling language and
tool which allows a reader to comprehend complex issues and topics which exist
in the space between multiple domains. A traditional problem might exist within
a classical field such as physics or journalism. In wicked problems such clear dis-
tinctions rarely exist. The issues span multiple actors in multiple different domains
and requires a cross-domain approach. To facilitate such an approach there must
be a shared language of the problem which enables the cooperation of multiple
fields. The issue might also exist on a meta-level. Meaning that the issue is not
domain specific at all, but rather exists within the routines and methods that are
shared across multiple domains. Addressing the methods requires that they be
tackled at a fundamental base level. The answers to a problem might already exist
as a combination of best practice solutions and ideas which are present in one
domain but not the other and vice versa. Through a domain map the diffrent do-
mains can get a shared understanding and tackle the core issues within the new
shared domain.
Achieving the domain map prototype requires several elements to be in place.
Based on similar methodologies and technologies such as different knowledge
mapping techniques (See 2.5) and the debate graph there is a need for an underly-
ing grammar. The grammar will include definitions of the different elements and
connections which make up the notations. The grammar will include and be sup-
ported by a visual representation which will be called the map. The map is what
the user will experience when exploring a domain or issue. Ensuring quality and
readability will require the integration of a rating and reviewing system to be in
place to achieve an academic standard of quality and to measure the impact of
contributions. The combination of all these elements is what makes up the domain
map prototype.

62
The prototype is the result of implementing the insights gained from developing
test models within the debate graph application and the theoretical knowledge
gathered from examining existing methods and technologies. The modeling of the
website into the debate graph, creating maps designed to test each side and feature
of the website is what lead to the decisions on what missing and what would be
included for a domain map.
4.1 Results from Test Models
The test models created in the debate graph application based on the knowledge
federation website give the foundation of identifying what areas need to be ad-
dressed as part of the domain map prototype. The areas that the debate graph
proves to not be suited for in the context of domain mapping, new solutions will
be suggested and modeled as part of the prototype. The suggestions that are being
made as part of the evaluation of the test models will be described in greater detail
in the rest of this section. In areas where the debate graph is well suited in its
features to create a model these features will be implemented and continued.
Standing on what has come before, looking at it with a different lens to fit new
issues.
The model structure of the debate graph is designed to address issues and to solve
them directly whereas the domain map is focused on creating a view of the big
picture in order to solve issues. The goals of the two models are mostly aligned,
but the approach is different. The debate graph typically begins by positon a ques-
tion which is then supported by positons and arguments. For the domain map,
asking a question is central as well, but the positions should be more encompass-
ing and are spanning multiple domains. The hierarchies for the position elements
would therefor benefit from being more encompassing. Arguments can then exist
on the high level the way the IBIS notation uses them, but also at a lower level to
support or oppose base positions and information. The different levels of hierar-
chy also addresses the grammar needs to be different base on the conceptual level,
as well as the view to reflect this. This insight is the result of attempting to model

63
the stories which were supporting an idea rather than a question. Understanding
that a different structure would benefit such an approach.
The grammar defined as part of the IBIS notation and expanded upon as part of
the debate graph does not addresses all facets of the domain map. When develop-
ing the test maps many of the different node types where not appropriate for the
implementation of the webpage. The IBIS notation allows for the high concept
map layer to remain mostly as it is implemented in the debate graph, with some
slight changes to names and definitions to emphasis specifically what the purpose
is in the context of the domain map. The lower level view which includes more
informative and discovery based elements requires an approach which reflect its
nature more accurately. The grammar requires new nodes to be introduces and
existing ones to be modified. While relying on issue based mapping, but also in-
troducing mapping more akin to concept mapping.
Changing the nodes which make up the language of the map will require for the
connection to be changed adjusting. The connections are in essence no different
from the nodes in that they can contain information but they serve a different pur-
pose. The purpose of the connections is to link two ideas. The link can in some
instances be as complex and contain as much information as the nodes themselves.
The typing should therefor only be relative to the view the reader is currently
exploring. A connection should have the ability to be a node in a different context
and be used as such, by creating a new link which connects the link in one view
to a node in a different view. This enforces the idea of hierarchies.
The different views are one of the most effective tools in creating understanding
based on the models which were made in the debate graph. The views allow to
see more information as it relates to one another and to get a better understanding.
The Feature which proved to be effective in the evaluation of the models was the
ability to adjust how many neighboring nodes should be made visible. In the case
of the main page showing less seemed to encourage stronger buy-in and prevent
overwhelming a reader. While in the case of the stories it was important to show
what each story was informing. At times the inspector seemed to be given too

64
little focus in contrast to the map. The ability to switch between views from the
inspector element would enable for a simple way of switching hierarchy and of
gaining a perspective on the different context that the information object can be
viewed in.
The debate graph allows for many different mediums to be place inside the node
and connection objects, but the media is all used in the same manner. The focus
on images and recordings of interview or meetings as part of knowledge federa-
tion and exploring new mediums of knowledge creation requires the domain map
to support such exploration and implementation. The Doug Engelbart Institute
(See 2.4.3) suggested a tagging system which each element has. This is true for
video and audio as well. Through the creation of time stamp tags, a video file
could be separated into different nodes based on the information that is being cov-
ered. Thereby a single video file as part of a high concept node can also be split
into multiple information object and used and referenced as lower levels. This was
particularly noticeable when exploring the ideas of a DKR as well as the conver-
sations section on the knowledge federation website.
The collaborative focus of knowledge federation would suggest that the domain
map require an emphasis on incorporating tools which encourage communication
and collaboration. The comment feature in the debate graph does allow for dialog
to happen and for it to be part of the model, but it is not fully incorporated into the
map itself, it is part of the object inside the map. To enhance the connectivity of
the dialog each comment is tagged in the same manner as every object in the map.
Though this tag the element can then be connected to other elements in the map.
A comment should always be clearly visible to be such however. Participants in
the map (meaning the creator and/or experts) should be viewed as part of the map
as well. This with the intent that they will be connected to their value matrix object
as a means of measure credibility and contribution impact. In the same sense chat
nodes will be weighted through the matrix.
The importance of citations are crucial to the credibility of any source and must
be incorporated into a map. The citations should ideally be connected directly to

65
a tagged node which includes the source. The debate graph allows for citations to
be connected to the object belongs to. It does not send the citation along to the
next object. From the tests it would seem that a clearer indication of where a cita-
tion originates could be beneficial. The goal being to make the citation easier to
track back and to view it. An object should ideally only occur once in a domain
map and be pointed to from every other place.
The development of a map through the debate graph comes with a sometimes
steep learning curve. The complexity of the application makes it at times difficult
to use. The areas that are mostly impacted are the choosing of link type when
cross-linking and the creation of long for connected information, such as in the
stories section. The introduction of direct linking from a tag within the inspector
would reduce some steps and me user friendly though drag and drop. Creating
larger elements could also be done through the inspector allowing for the connec-
tion to be made as part of a structure. This makes the creation of new information
more traditional while still implementing it into a map with full functionality.
4.2 Structure
In order approach the development of a mapping language the structure of how
the map is built is what sets the foundation of everything else to be built on top
off. The structure of a knowledge mapping language in this context is how the
individual information pieces are fit together in order to create greater understand-
ing. The domain map builds on the underlying idea of the IBIS notation that was
also used in the debate graph. While Issue based notations are very good for ad-
dressing problems, it is not intended to convey large complex information to a
reader. Concept maps are more commonly used in such a manner. In order to
achieve high levels of problem-solving as well as be an effective teaching tool, in
the sense of conveying information, a combination of the two methodologies will
be the approach of the domain map. Following the IBIS notation on the high con-
ceptual level, such as the creation and exploration of domains and meta-

66
information. For the low level of exploration of knowledge objects a different
structure will be implemented which is being called a spider structure.
4.2.1 Spider Structure
The spider structure is what will enable the domain map to convey connected in-
formation in a manner where it retains its long for structure while still being
interconnected and referenceable. The spider structure derives its name from the
shape which resembles a web with a spider sitting at the center (See Figure 9).
The spider structure is considered as one element for the high level application
and connectivity. On the IBIS layer it can interact as a position or as an infor-
mation piece. It could even serve as an argument if structured this way.
What makes the spider structure different from other nodes is that it is a node
which is constructed of other nodes. The center ideas is what makes up the idea,
it is treated as a regular node within the IBIS notation. The nodes that connect to
it do so in the same manner as any other node. The spider node does however
allow for the reader to zoom in, revealing the ‘web’ that surrounds the node. The
web consists of several other nodes which each consists of a single information
piece (a paragraph between 100-200 words typically, ideally no longer than 300
words). The information pieces are designed to act as standalone information
nodes which can be connected to other maps and nodes. Each node is however
part of a chain which makes up a larger piece. The same way a vignette in the
knowledge website is built up of small information pieces. The Spider structure is
built up of these nodes. They are ordered and have a previous and next node which
is to be read next within the context of the structure. Should the node be linked to
a different view the information will still be available, but only by changing view.
A model of how a spider structure will look in the domain map can be seen in
figure 9.

67
Figure 9- Visual representation of the spider structure element of the domain map
The series of nodes that make up the web are simply marked with simple number
tags inside the larger spider object and read like an article. In the spider node the
information is presented in order and is tagged. The spider node does not typically
contain any information on its own, it only displays the information of all its child
nodes.
4.2.2 Tagging
Central to the functionality of many features of the domain map is the idea of
tagging information pieces. The concept of tagging was central to Doug Engel-
bart’s vision of a DKR and it remains a central component of creating a highly
interconnected domain map.
The reason tagging becomes so important is because of the large number of small
individual information pieces that make up the map. In the analogy of the map
tagging each element is the equivalent of naming each town on a map. It becomes

68
very difficult to orient oneself the further away one is from the main cities if the
towns are not named and labeled on the map. By enabling tags it also encourages
the writers within the domain map to consider information as individual pieces of
a larger structure. A piece which does not stand well on its own might not be worth
adding if it does not contribute to the overall. Some pieces however will always
be needed to bridge information and this can come in the form of smaller connec-
tions. Such as the links between the web elements in the spider structure. These
links contain no additional information other than to show the order in which the
information is intended to be consumed by the author.
Tags are each unique parts of the domain map. A tag is an object more than it is a
simple identification number. The tag is built up in a manner which indicates
where it is located. Starting with a domain followed by a map, then identified by
the object and any parent objects it may have. Finally it is numbered inside the
node it is places in. A sample tag might look like this:
“Paradigm_Shift.Kowledge_Federation.Federation_through_Applicaitons.Do-
main_Map_Prototype.Result.Strucutre.Tagging.3”.
The tag is only displayed as a number within the node when the text is viewed
(See figure 10). Upon inspecting the tag more information will be displayed. The
information inside the tag can have multiple application, both front end as well as
back end.

69
Figure 10 - Sample of content from knowledge federation website with appropriate tags for section.
The information inside the tag of an object can be used in several ways. The tag
is an identifier for each object of the domain map across all different domains. It
acts in a similar manner as a web address works inside a browser. Unlike a simple
address it does also server to connect the object to its value matrix object which
give the object its weight and tracks its impact. The Tag itself is as simple as it
can be while containing the information which both the domain map require from
it at a back end level as well as the value matrix requirement to create a value
object connected to each knowledge object.
4.3 Grammar
The term grammar in the context of the domain map refers to the notations which
makes up the elements of the model. The domain map elements are comprised out
of Nodes which are the central viewing elements and are the landmarks and ideas

70
which make up the landscape. The connection between the nodes are the other
side of the model. The connection are what binds the elements together and can
be made either directly between elements or more indirectly as cross-linked ideas
which can span across the maps and domains. The grammar is what enables a user
to place at object in the correct locations. In terms of the map metaphor this means
that a mountain is the result of earth plates colliding and as such can only be placed
at such intersecting plates.
A Grammar is built with a primary goal in mind of what it is supposed to achieve.
The focus of the domain map grammar is twofold. The First focus is on explora-
tion and learning. The information and ideas are there to get an understanding of
a topic or domain and allows for free exploration using the map to prevent getting
lost. The second focus is much more aligned with issued based mapping. The goal
being to highlight areas where information is missing and allowing for the creation
of new domains. By assembling information and highlighting where there are
holes or where there is a lack of solutions the map points out what is to be im-
proved, even across domains. This is how the domain map aims to approach issue
solving. By addressing underlying issues which build up to larger more complex
wicked problems. The domain map grammar is intended to be flexible and non-
restrictive. The goal is for the grammar so serve as a framing tool, but not to force
the user into a set model which might not correlate to the idea that is being pre-
sented. The base grammar is what sets the general use, but allows for the creation
of new types to be added as need be. In a sense the grammar is only the framework
for the larger tool which is the domain map prototype.
Part of what makes up the grammar is how it is being created. The approach on
how a node is made or how a link is established is a central part of how a user
begins to think about the information. The creation of the grammar will also con-
nect it more directly to the tagging and enable a more modular design of the
domain map. The modular approach to information is how the loose frame of the
domain map grammar approaches how information is to be treated within the
71
model. As moving, changing, interacting and evolving pieces of a constantly
growing ecosystem and community of knowledge work and creators.
4.3.1 Nodes
A node object in the domain map is a piece of knowledge framed within a certain
context. Nodes have types associated with them which give them a definition of
meaning. The information inside the node is neutral without the context of the
type. When switching view it is possible for the type of the same information
object to be different depending on the connection that is made. Nodes can contain
information in the form of plane text, images, video, audio, graphs and other forms
of media which allow information to be shared from an individual to another. The
information of an interview record, might be used as a positive argument as part
of supporting a position in an argument or the same piece of information might be
used to pose a question that was raised by the interview and which is being ad-
dressed. The information inside the node is defined in the context of the grammar
and through the connection in which it is being used.
In order to understand how nodes function it is beneficial to look at how nodes
are created by a user in the domain map prototype. Unlike in the debate graph
application where a node is added to the graph and is then filled with information.
In the domain map a node is first created as a neutral node outside of a map inside
the inspector. The node is filled with information and the tags are applied auto-
matically based on the formatting. If it is a longer text that can mean that every
paragraph has a tag and thus will be a smaller node inside a spider structure of the
node that is being created. Once a node is filled it can be categorized. If the node
is note categorized it remains as neutral and has no properties of its own. Such
nodes can be given context through the connection with other nodes or can be
given a custom type by applying the appropriate tag. The tagged nodes that are
created as part of the node inherit the typing of the node, but can independently
be given new tags as they are being connected or incorporated as part of a new
view. Each node is automatically tags the creator as the author.
72
The base grammar of the domain map includes several node types and are what
makes up the framework for domain mapping. The node types are based on the
IBIS centered notation from the debate graph (debategraph, 2019) and the expe-
rience of working with the notation to create the website test models (see 4.1).
The notation renames, adds and/or removed elements from that notation based on
the results of the test models.
The based nodes that make up the domain map prototype are:
Origin: The origin node is a starting point for a new map. The origin described
the topics and ideas that are being addressed as part of the map. Each domain
includes an origin point defining the domain. Trans-disciplines might have an
origin or might emerge as the result of two maps connecting and overlapping
greatly, in which case an origin can be create to define is specifically. The origin
node is a way of orienting the reader similar to a wind rose on a map showing
where north is.
Question: The question is the center of all problems. It is by asking questions that
one can get closer to finding answers and solutions. The high level view of the
domain map is centered on questions as with Issue mapping and the debate graph.
A Question can stand on its own and does not require a response in order to be a
valuable piece of knowledge. By having an unanswered question as part of a map
one can learn as much if not more than with a simple piece of information.
Response: The response node is created connecting to question nodes. The re-
sponse can be a positions to a question or it can be an extensive comment. The
Reason the word response is used is to emphasis the idea of the dialog. The do-
main map is a collaborative effort in knowledge creation as much as it is an
exploration of knowledge. By framing the grammar as a dialog the idea is to entice
users to join in and be part of the solution. Responses can also additionally be
classified as supporting or opposing the same way arguments are in the IBIS no-
tation.

73
Supportive: Responses are building on the object that is being responded
to. The supportive response is trying to add information or context to the
element. A supportive response will typically be accompanied by addi-
tional information which can be integrated into the element.
Opposing: Responses are presenting information or positions which op-
pose the element that it is connected to. An opposing response is intended
to present knowledge that undermines or disproves statements. The Op-
posing response should not present its own position. This should be done
in from of a regular response.
Information: Information nodes are the central element that make up the lower
level view of the debate graph. An information node can be many things, it is a
manner of generic node type, but unlike the undefined node it contains a central
piece of information. It contains one or more facts that are being presented. An
information node could be something as simple as this description of the infor-
mation node or it could be a complete essay on the complete agricultural history
of a Tibetan village. Information nodes are enhanced through the connection that
are made between them. An information node might require multiple information
nodes to give a greater insight.
Idea: An idea node is intended as a conversation starter. Unlike the question node
which poses a specific question which it wants answered, the idea node suggests
a typically unfounded idea. The idea could come in the form of a solution or an
invention. The idea does not inherently have to be supported by information or
evidence. The idea is a space for exploration. Ideas can form into more specific
information and generate questions, but cannot support any arguments or posi-
tions.
Actor: An actor node can come in several different variant. First it can be used to
connect and attribute ideas and quotes to a person. This can come in the form of
historical figures such as Einstein or in this case Engelbart. As papers are being
cited the authors of those papers become integrated into the map. Second the actor
can highlight an individual that is actively a factor of a question or positions. This

74
might come in the form of political figures. And third the actor is attributed to
each user of the domain map. A user is linked to their actor node through the value
matrix which stores information there (some visible and some not). The actor node
is to give a face to the conversation.
Comment: When chatting on a topic the chat creates a series of minor nodes.
Each node is generally not considered more than a note or a comment. These com-
ments can be given a different context through new connection and linking. A
comment might in a different view be used as an information node or it might
spark an idea node. Comments are grouped inside a spider structure as part of a
conversation node.
Conversation: A conversation node stores the exchanges that are made as part of
one or multiple actors engaging in dialog. The dialog can be recorded through chat
log or can come in other mediums such as video or audio.
Undefined: By default all nodes are set as undefined. Undefined nodes cannot be
part of a map, buy can be connected privately to an actor. The nodes are defined
once they are introduced into the domain map.
Custom: The custom node has its own type. All nodes that are defined outside the
base grammar of the debate graph notation are considered custom nodes. The Cus-
tom node will be accompanied with a name such as for example ‘custom: Task’.
The node includes a section which allows for a more detailed description of the
node type that has been created and as part of what context. The custom node can
be connected to any other node.
Creating custom nodes is an approach which is intended to give more flexibility
and range to the domain map. If the grammar suggested is not extensive enough
for the implementation of an idea or concept then the necessary nodes can simply
be added.

75
Node Type: Description:
Origin Beginning of a new topic or domain for a map.
Question A question which is posed.
Response A Response to a question in form of a position or
argument.
Supporting Response Presenting supporting information.
Opposing Response Presenting opposing information
Information Presenting one or more facts.
Idea An ideas to spark conversation.
Actor Visual representation if individuals.
Comment Comment or note.
Conversation Collection of comments or recorded conversation.
Undefined Not part of domain map yet.
Custom Defined by user.
Table 1- List of Nodes that comprise the domain map base notation
The node types are visually separated and made distinct though the use of color
to give a simple graphical view of the different types. Table 1 shows the colors
that are attributed to each node type: Black for Origin, Blue for Question, Orange
for Response, Green and Red for Supporting and Opposing Responses respec-
tively, Yellow for Information, Pink of Idea, Lime for Actor, Grey for Comment,
Dark Grey for Conversation, White for Custom and Undefined nodes.
4.3.2 Connections
Connections are the way that knowledge objects relate to one another within the
domain map. In the metaphor of the map the connections are the roads that link
places to one another making them reachable. Connection on their own do not
have meaning of their own, they are given meaning by the two nodes that they are
connected to, at the same time context is given to the nodes. Connections are how

76
a user explores the domain map, traversing between nodes along the connections.
The connection can be as simple as connection one element to another such as in
spider structures where the links are only intended to keep a sorted order. Such
simple connections are a visual tool which bridges ideas. Connections can be far
more complex, incorporating information of their own and other forms of medium
as long as they give context from one node to another. The different connections
are visually distinct to differentiate whether a connection is simple of complex.
Nodes and Connections can have much in common when only their content is
examined instead of their role. While the information that is inside the different
objects can be very similar the role they serve is different. A node stands on its
own, conveying information and typically making a point of some sort. Connec-
tions cannot be made without nodes. The role of a connection is simply to give
the information that is necessary to go from one node to the other, if no infor-
mation is necessary then the node is a blank connection. Connections can however
be used as nodes if appropriate by creating a link from a connection to a node.
The connection will then be seen as a new node in the view which observes it. It
will still remain a link, and be seen as such, from the view of the original connec-
tion.
When a node is introduced to the domain map it is done so through the creation
of a new connection (Except of the Origin node of a map). A connection is by
default a blank connection. This means that it has no inherent attribute other than
to connect on node to another. Once a connection has been established the node
can then be made more specific, whether that is through the addition of a desig-
nated type from the domain map grammar and/or to be filled with information
which gives context to the connection. Figure 11 below shows how a created node
is being connected to an existing map through a blank connection by dragging the
node tag into the domain map. The nodes that have been created as part of the
example node are automatically connected to one another through ‘previous’ and
‘next’ connections inside a spider stricture.

77
Deleting a node results in all connection pointing to and from the node to be de-
leted as well. Similarly if all connection to a node are removed the node object is
connected to the creator’s actor-node where it is no longer visible to the domain
map. Nodes and connections can be deleted only by the creator and authorized
members of a domain.
Figure 11 - Shows creation of connection between new node and map.
Connections are separated into defined types similarly to the way nodes are given
types. The reason for the typing is to allow for common connections of significant
to be preexisting requiring less work from the writer to create a simple connection.
As connections can very much more broadly creating custom connection types is
more encouraged than the creation of custom nodes. Connections have a second
property which makes them distinct from nods. They can be directional. A con-
nection is pointing from one node to another if it is directional. The visual
representation of the direction is indicated by an arrow on the map. If the connec-
tion goes both ways it is considered non-directional, at which point the nodes are
connected through a line.

78
The Connections that make up the domain map prototype grammar are:
Blank: The default connection. Contains no information. Is non-directional. Vis-
ually displayed as a simple black line.
Blank-directional: Same as Blank connection, but points from one node to an-
other. Visually displayed as simple black arrow.
Citation: Citing a source is a cornerstone of academic writing and establishes
credibility. By building on existing work the new work becomes validated and
enhanced. The Citation connection is crucial to enable this in the domain map to
validate information and to give credit. A citation is a directional node, pointing
to an information node which contains the information that is being cited as part
of the node. A Quote can be tagged and connected through citation node directly
to the source of the quote. Citation connections are visually represented by a
stripped black arrow.
Inform: Where the citation connection draws a direct reference to another piece
of information the inform connection makes a more indirect connection. The in-
form connection is a way of tracking an idea or concept. It can also be used as
way of building on a piece of information more directly than a blank connection
would, but not as concise as a citation. The connation is represented visually as
an arrow with a round dotted line.
Previous/Next: The previous and next connections are typically created by a spi-
der-structure. It allows for connected to be sorted in an intended reading order.
The connection will appear as a next connection from one node, once said node is
being explored the connection will be splayed as a previous connection leading
back to the original node. This is useful when one arrives to a node which is part
of a series which is intended to be read in an order. The user can track back getting
an understanding of the entire piece. When a chain of previous and next connec-
tions is made an icon will appear next to the node which leads to the beginning of
the chain. This means that only one previous or next connection can exist for any
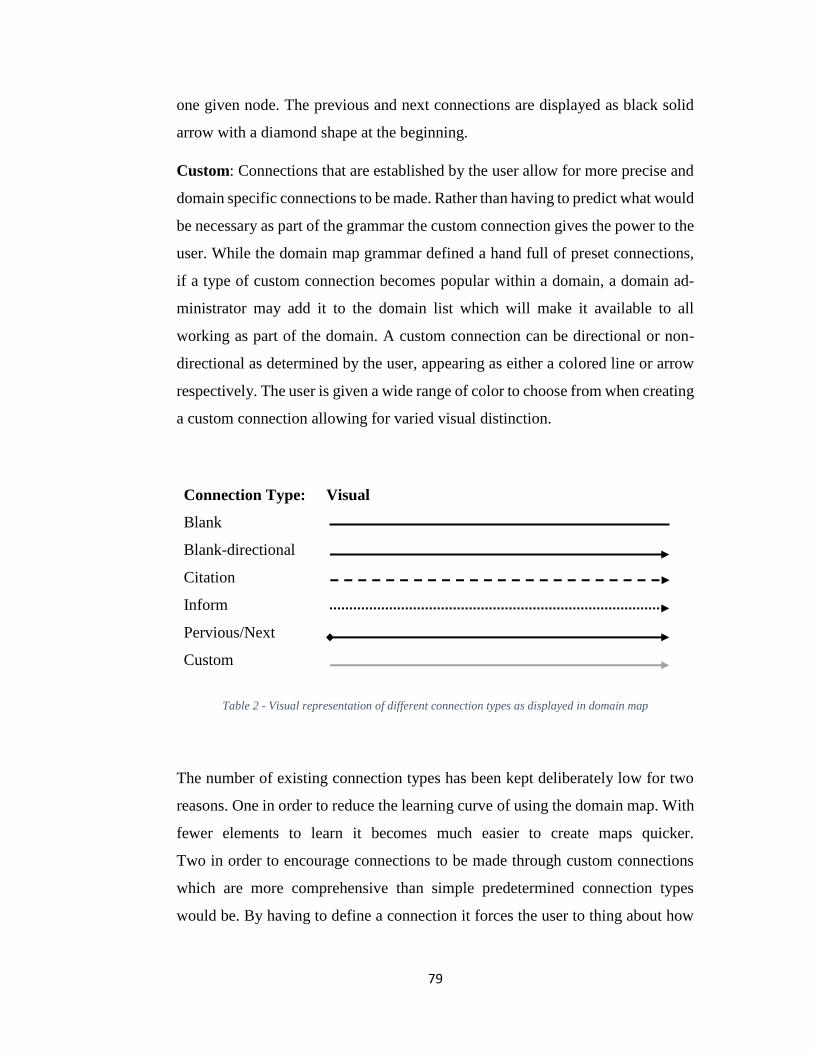
79
one given node. The previous and next connections are displayed as black solid
arrow with a diamond shape at the beginning.
Custom: Connections that are established by the user allow for more precise and
domain specific connections to be made. Rather than having to predict what would
be necessary as part of the grammar the custom connection gives the power to the
user. While the domain map grammar defined a hand full of preset connections,
if a type of custom connection becomes popular within a domain, a domain ad-
ministrator may add it to the domain list which will make it available to all
working as part of the domain. A custom connection can be directional or non-
directional as determined by the user, appearing as either a colored line or arrow
respectively. The user is given a wide range of color to choose from when creating
a custom connection allowing for varied visual distinction.
Connection Type: Visual
Blank
Blank-directional
Citation
Inform
Pervious/Next
Custom
Table 2 - Visual representation of different connection types as displayed in domain map
The number of existing connection types has been kept deliberately low for two
reasons. One in order to reduce the learning curve of using the domain map. With
fewer elements to learn it becomes much easier to create maps quicker.
Two in order to encourage connections to be made through custom connections
which are more comprehensive than simple predetermined connection types
would be. By having to define a connection it forces the user to thing about how

80
to elements relate to one another significantly, rather than checking what category
the elements fall into and then connecting them accordingly.
4.3.3 Cross-linking
The term cross-linking was inherited from the debate graph application as a means
of referencing connections that are made across maps and domains. Although the
term originated from the debate graph application the domain map solution is
much simpler and contains far fewer defined connection types. Cross-linking is a
type of connection, but is different in its use rather than notation. The main dif-
ference between concretions and cross-linking is how it is done from the
perspective of the user. The notation for cross-linking mostly retains the same
types as the with the exception of the previous/next connection which cannot be
created cross map.
The primary function of cross-linking is to generate new spaces and domains by
connecting ideas and solutions from one domain into another to create new appli-
cations. By creation the relations ideas can start to organically form between
disciplines in what knowledge federation called trans-disciplines. Cross linking is
also the primary way citations are used as the information that is being used can
often be located in different domain maps.
A cross-link connection is distinct from other notations in that the reader moves
from one map to another. The transition of one map to another is visualized
through a dot at the center of the connection that is being explored as well as
through a symbol on the object that is being visited. The cross-connection shows
information on what domain map is being accessed and allows for the reader to
access the Origin node of the map simply by clicking the link that is displayed as
part of the connection object.
Creating a cross-link is inherently no different than creating another connection.
The location of the two nodes that are being connected is not located in the same
place. As a result when creating a connection between such elements one much
first locate the objects one wishes to create. There are two ways in which this can

81
be achieved in the domain map prototype. First the user can find the first node and
lock it in the inspector, this will allow to keep track of it. Then the user can search
for the object in the different domain map and once it has been located the con-
nection can be stablished through drag and drop the same way as a regular
connection. Second the user can mark the connection option on the tag on the node
that is being connected. This will open a search box which allowed to find the
desired node through the tag address of the object. Then the connection is stab-
lished and can be further customized by the user.
4.4 Visual Representations
Knowledge mapping is a visual representation of a group’s knowledge and ideas
associated with an information topic. It acts as an inventory of knowledge, dis-
played as a visual medium. The visual nature of maps allows for certain properties
which are only available through a model. The visual display allows for connec-
tions to be seen directly. Following the idea that an image can be worth more than
a thousand words. The information is enhanced when it is combined with a visual
model.
A knowledge community benefits from a large number of contributors and input
from a large pool of options and minds. The domain map allows for the infor-
mation to be organized in a structured methods and displayed to as many people
as possible. To enable the accessibility of a large community the application has
to be a convenient to use as possible to minimize people being becoming lost. By
making the domain map a web application in the same vein as the debate graph it
makes the application easily applicable to all who are connected to the web. It also
makes integration into other application easily feasible operating on the same plat-
form. The web based format also allows for all the desired features and layout
which would be possible with other forms of software. The Limitations of the web
are mostly related to user interaction. This is mostly minimized though the design
of the interface and implementation of media.

82
The grammar serves as a means of conveying and understanding the domain map
and learn how to interact with the map in a manner which allows for the creation
and interaction of knowledge in a manner which enables the federation of
knowledge. In order to prevent the user from being overwhelmed the grammar is
kept as simple as possible while still being robust and allowing for specific nota-
tions. The learning curve of using the domain map is reduced to understanding
how to interact with the interface, understanding the symbols which are used as
part of the visual representation and knowing how different media may be imple-
mented into a map element.
4.4.1 Interface
The visual layout of the domain map prototype is heavily based on the general
look and feel of the debate graph as well as taking inspiration from general image
manipulation software such as Adobe Photoshop and similar programs. The visual
layout of the application is split into three major components; the map display, the
interaction tools and the inspector.
The largest part of the screen revenue is granted to the visual representation of the
map. As the map serves both as a navigation tool as well as being a means of
visualizing connections and interactions of different ideas and problems. The map
displays the nodes which contain information inside them as well as the connec-
tion which are med between them. Both elements can be viewed in more detail
through the inspector. Simple symbols give some basic ideas of what the nodes
and connection might mean displayed through color and shape as described the
grammar section (see 4.3). Figure 12 shows a sample layout of what the visual
layout of the domain map could look like, focusing on showing the elements in
correlation to one another and highlighting the map portion as the largest area of
the application.

83
Figure 12- Potential layout of domain map prototype with emphasis on map.
The inspector is the way the user interacts with the knowledge that is stored inside
the map. Through the inspector the information is displayed in a manner for the
reader to interact with. The inspector also allows for an object to the edited (if
authorized) or otherwise interacted with. When viewing an object through the in-
spector the user has the ability to leave feedback in form of a comment, which
establishes a linking node, the history of the object can be accesses as well as a
full overview off all the connection that are part of the object. The overview of all
the connection show in what context and way the information is being used across
the domain maps that it is part of. Upon clicking on of the connection the user will
be transported on the map to the location of the interaction and displaying the
connection in the context that is relevant to the selected interaction.
Administrative changes to an object are made through interacting with the object
though the inspector. Such as enabling the level of access the object is given to
what type of users. Connections can be made through the inspector by dragging
the tags of the object or a sub-object (such as a node that is part of a spider struc-
ture) to another node inside the map that is being splayed (See figure 11).

84
The connection is set as a blank connection by default. But can be edited through
clicking on it and editing it though the inspector. The inspector is separated by
tabs which display different elements. One displays the information stored in the
node and allows for it to be altered, as well as the type to be set or defined. A tab
displays the history and administrative properties of the object and one displays
the connections and views that the object is part of. Comments can be viewed as
part of the connections section being separated from the other connections.
The final major component that comprised the interface of the domain map are
the tools. The tools are inside the toolbar and are visualized with symbols. High-
lighting the object will display a tool tip, giving better insight on how to use it.
The tools are separated into two categories: the interaction tools and the naviga-
tion tools.
The creation tools allow for the manipulation of the domain map directly. The
tools are: Create new node object, create connection, create cross-link, select ob-
jects, move object and delete object, export. The tools are in some cases shortcuts
of what can also be done inside the inspector, but can be done quicker by directly
interacting with the map.
The navigation tools allow the user to traverse the domain map. The nation tools
are: display style, display depth, free drag, pointer and a search bar.
The display style defines the visual esthetic that the map is displayed as, allowing
for views similar to the other graphical notations such as argument mapping, web
mapping and/or issue mapping (Okada, Buckingham, & Sherborne, 2008). This
can also be observed in the debate graph (debategraph, 2019). The display style
only shows how the information is displayed, it can still be interacted with in the
same manner regardless of display style. Display depth described defines now
many neighboring nodes are displayed for any given object that is being inspected.
The limit how many can be displayed is based on the amount if objects that can
be graphically rendered based on the limitations of web browser. By default the
limit is 3 levels, as more information will likely result in information overload.
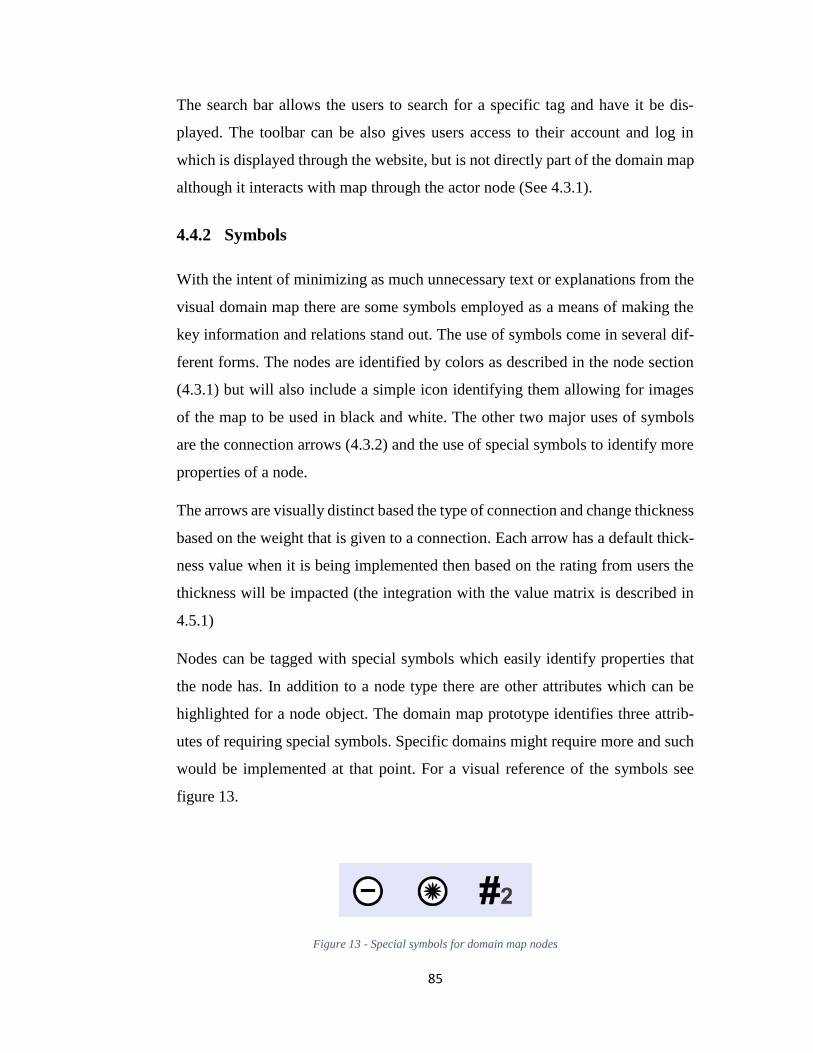
85
The search bar allows the users to search for a specific tag and have it be dis-
played. The toolbar can be also gives users access to their account and log in
which is displayed through the website, but is not directly part of the domain map
although it interacts with map through the actor node (See 4.3.1).
4.4.2 Symbols
With the intent of minimizing as much unnecessary text or explanations from the
visual domain map there are some symbols employed as a means of making the
key information and relations stand out. The use of symbols come in several dif-
ferent forms. The nodes are identified by colors as described in the node section
(4.3.1) but will also include a simple icon identifying them allowing for images
of the map to be used in black and white. The other two major uses of symbols
are the connection arrows (4.3.2) and the use of special symbols to identify more
properties of a node.
The arrows are visually distinct based the type of connection and change thickness
based on the weight that is given to a connection. Each arrow has a default thick-
ness value when it is being implemented then based on the rating from users the
thickness will be impacted (the integration with the value matrix is described in
4.5.1)
Nodes can be tagged with special symbols which easily identify properties that
the node has. In addition to a node type there are other attributes which can be
highlighted for a node object. The domain map prototype identifies three attrib-
utes of requiring special symbols. Specific domains might require more and such
would be implemented at that point. For a visual reference of the symbols see
figure 13.
Figure 13 - Special symbols for domain map nodes
86
End: The first symbols identifies that the tagged node is the end node in a con-
nection. This means that no more connections are made to the node.
Cross-domain: The cross-domain symbols identifies the node has a connection
with one or more nodes of a map that is part of a different domain.
Number of Connections: A small number is next to the # symbol identifying how
many connections are made with the node. This allows to identify how integral
and entangled a node is with others, although it is not an absolute measurement
only an indication. Comment nodes are not includes. While engagement is an im-
portant part of the domain map, measuring engaging levels in such a manner might
encourage unconstructive comments to me made more frequently.
4.4.3 Media
Knowledge mapping methods and applications can often include the use of media
other than text and images. The use of video and audio files can easily be incor-
porated by building in a function to display the given file types. Often however,
like with the debate graph, the file only exist as part of a knowledge node. A major
component of the domain map is the fact that every element is tagged. But in the
case of objects other than text the tagging needs to be customized accordingly to
gain as much flexibility and intractability. To support different forms of media the
domain map attempts to incorporate them as strongly as possible.
Video and audio files have one thing in common which will make them able to be
tagged as part of the domain map notation, they both have a run time. Having a
quantifiable runtime allows for them to be broken up into smaller pieces the same
way text can be. There are two primary methods of doing this. The first method is
to divide the audio file into smaller chapters or topic as appropriate. In the case of
an example it might mean separating the question and answer into tagged pieces.
This requires the user incorporating the object into the map to divide the file as

87
they see fit. A node or connection would be made with one of the piece. The sec-
ond way is to allow users to define a section using time codes. This would mean
defining a start point and endpoint (or giving no end point at which point the re-
mainder of the file is tagged). This method comes with a significant advantage
and drawback. The flexibility of the being able to define the section by user gives
more control of which section are used, this is especially useful in long files where
the section might be minutes or hours long. The drawback is that many different
but functionally identical nodes can be created from the same file. Since the time
stamps are precise a one second difference in time stamp would result in a differ-
ent tagged nodes. The amount of clutter that could be generated goes against the
idea of simplifying the way one interacts with knowledge. Given the downside of
the second method, the first method is used in the domain map. The time tags
appear below the file allowing to tag either the entire node or a time interval.
External sources that are linked to the domain map are not strictly part of the map
itself and are therefore not tagged, only the link itself would be tagged. In order
to allow for external sources to be tagged there is the option of creating a tag list
as part of the custom node. A tag list is a reference list of a source. The main node
contains a reference point to the external source, wheatear it be a text document,
a visual map or any other media. The tag list references all the elements that can
be split up into nodes. The tag list could be splitting a published article into each
of its section allowing connections to be made to specific part. The tag will then
point back to the node including the original link to the external source.
The domain map is intended a shared collaborative working tool. When the do-
main map needs to be used in other media or referenced directly visually there are
a number of way of doing so. First exporting a domain map or a section of a do-
main map (if only partial all nodes are selected) as a formatted document. As with
the debate graph the ability to convert the information of the map into an article
form allows for the conversion of new media to traditional media. Audio and
video files are only references linking to the original file. Second exporting as a
map model with supporting text. This is a non-interactive representation of the

88
domain map. Showing the domain map model as images in the form of the se-
lected display form. The information contained in the nodes is then listed
separately similar to the article form. The final way of exporting a map is by send-
ing a time-stamped link to the domain map. This will show a map in the state it
was in at the sent date, allowing for references of object that might be constantly
evolving and changing in the domain map application.
4.5 Rating
Ensuring the quality and accuracy of the domain map requires for information to
be curated and reviewed. The curation is done in conjugation between human ac-
tors and automated systems. The human element when reviewing and
understanding knowledge is as of yet unmatched my machines. The algorithms
and systems that are in place serve as a means of contextualizing information
quantifiably and using said information in a manner which is valuable to the
maintenance of the system as a whole. The domain map prototype is as much as
collection of people as it is a knowledge platform and a problems solving tool.
The user is crucial to allowing the domain map to grow and adapt to new environ-
ments, ideas and problems. It is through systems innovation that the domain map
prototype aims to achieve its full potential and being to complete the unfinished
revolution.
4.5.1 User
Every used of the domain map (anyone aiming to interact with it directly) must
create a user profile. By default a user profile simply allows the user to be incor-
porated into the domain map and take part in exploring and discovering ideas and
information that exists in the map. In order to contribute to a map user must reg-
ister themselves as part of the domain and confirm their identity. The gatekeeping
might deter some users, but it reduced the amount of bad actors that have influ-
enced similar knowledge platforms such as Wikipedia (Magnus, 2008). To
89
confirm ones identity the prototype suggests verifying someone’s phone number.
This might be altered depending the practical implementation and usage.
Domains are curated by what are called domain experts. A domain expert serves
as a knowledge source being an expert in the domain that is mapped as well as
serving as an administrator for the domain. Approving major edits and creating
empty nodes with holes that need to be filled. It is important to note that the expert
id not required to approve every user and surveil every action. The experts is
simply an authority in the domain. Experts are appointed though knowledge fed-
eration throughout multiple domains. The expert appoints administrators to
oversee certain areas of the map and to handle minor issues. The experts can be
contacted though their actor node which is linked to the domain origin node.
Every user has an actor node connected to their user. The actor node displays all
connections and nodes that have been contributed by the users, as well as all com-
ments the user has made. The node also contains the value matrix object of the
user which is used in determining the credibility and trustworthiness of a user.
Through the actor node it is easy to see the contributions of an individual as well
as gain an understating how who the person is, as he actor node is customizable
through the account profile site.
Users have the ability to subscribe to desired feed in order to receive any updates
that are made. A user can subscribe to a domain though the domain origin node,
a user can subscribe to a topic or to a tag, getting email updates of any changes.
Users also have the ability to subscribe to other users by following their actor
node. The information will appear in log form on the user’s profile (only visible
to the user) as well as being sent to them via email. By subscribing to an idea it
allows for users to stay up to date with new development within their field as well
as new problems which might present themselves. It also allows for communities
to develop within domains as well as across multiple different disciples.

90
4.5.2 Value Matrix Implementation
The value matrix prototype is an integral part of the domain map validation sys-
tem. The value matrix is where the values for relevance and impact are being
generated to then inform the domain map. The accuracy of the domain map is
heavily reliant on a functioning value matrix. While administrators and exerts
serve to curate the maps within the given domains, the potential scope and inter-
connectivity of the maps will require information to evaluate date objectively as
well as critically. The matrix allows for the generation of value scores which can
then enable the visual representation of the impact of certain objects.
Each tagged object inside the domain map has a value score associated with it
which is a measurement of its overall contribution to the map. By taking into ac-
count the three key parameter highlighted in the matrix (see 2.7) the overall score
is determined. The rating system inside the domain map is weighted by user con-
tribution. Every object has a value attributed to it, this includes the actor nodes
that are part of the user account. The contributions of a user in regards to trust-
worthiness and weighted impact on rating are determined by the value score of
the user, which in turn is determined by the impact of their contributions. Through
weighted arithmetic means a median of all ratings is achieved which makes up an
objects rating. The more valuable insights a user contributes the more weight they
will carry for the evolution of information and connections. An important factor
is that the contribution is not cumulative or quantitative. Meaning that more con-
tributions will not arbitrarily inflate a score. By the same means a new user can
gain a high score through few contributions if the impact of the contributions is
significant.
The impact of the rating on the domain map can be observed visually in the do-
main map as well as more suddenly throughout. The connections which are
represented though lines or arrows have the lines grow thicker the higher rated an
object is (new objects are set to a default value). The visual impact is that the
connections that are bigger are more important. This is in one sense a way of
seeing what is considered valuable information. It does however also serve the

91
point of showing what areas might be lacking and inform what new research might
be needed within a domain. The same way the a domain expert can create an
empty object to show an area that is ripe for exploration the absence of valuable
objects within a topic can show the need for new solutions. This ties into the learn-
ing and exploration aspect of the domain map. Serving to guide task oriented
education. A student could use the domain map to find a research question to write
a thesis by finding objects that are lacking as well as by finding connections which
are entirely missing. Subtlety the domain map shows what areas on the map are
easily reached. If a mountain needs exploration but lacks a strong road, then a
different route might be taken or the route might need to be rebuilt.
4.5.3 Road Map
Using the domain map as an educational tool poses the question of how does one
measure the progress that an individual is making? The answer is the road map.
The road map is a way of seeing what information a user has been exploring and
engaging with. What connections that have been explored and what have been
ignored. In the metaphor of the map it is the equivalent of traveling a red line
across every road and town one has visited as part of the journey. The road that is
formed is the sum of the knowledge one as gained.
The road map serves as a means of evaluating the progress that has been made in
exploring the domain map. It informs what information a person has been exposed
to and should have gained an understanding of. In the context of education it is
providing a way of evaluation the progress and learning outcome of a student. The
roadmap allows for a customized leaning experience in conjunction with tradi-
tional education. The road map can also show how an insight has been reached.
By tracing what path someone takes to reach a certain understanding or conclusion
the same process might be reproduced. If many people find that a path yields the
best learning outcome then their road map could serve as a navigational aid for
people less likely or willing to explore. It can give a way of approaching a task by
highlighting the steps that have lead others to a solution.

92
The implementation of the road map is rather simple as the ground work for ena-
bling such an approach is already in place. There are two methods of creating a
road map.
The first approach is by manually tracking the road map. Each map object has a
small button which allows it to be tracked as part of the current road map. The
user simply navigates the object and adds every new object to the map by clicking
the button. This gives the user control over the road map, but might be inconven-
ient for some users. Some users might forget to track every node or omit important
steps.
The second approach is based on the exploration history of a user. Each user has
a history of each tab they have explored (within a certain time frame) and in what
order. The list appears as a list of every tag in order of having been explored, if
the user backtracked this is also recorded. In order to create the road map the user
simply export the list of nodes as a road map. The road map is then generated and
can be explored similarly to a slide presentation. Allowing to move forward and
backward in steps.
4.6 Analysis
In order to find out if the method outlined in the approach chapter was successful
at creating a prototype which fulfils the desired requirements the model must be
analyzed. Looking back at what was set up as part of the approach chapter and
seeing how well the results matched the expecting will give an indication of the
success of the prototype. The approach methodology was rooted in the approach
of wicked problems which was highlighted. Choosing to pursue a cooperative
strategy. As the role of the domain expert in the domain map became clearer the
model moved more towards a hybrid incorporating elements from an Authoritar-
ian strategy.
The vison of the prototype which was described as part of the approach chapter
(see 3.1) was realized as well as refined in several areas. The grammar which was
developed does fit the requirement that were set out beforehand. The visual nature
93
of the application was addressed as well (see 4.4) which was not part of the orig-
inal approach strategy, although suggested. In order to truly see how well the
domain map prototype has been able to achieve its aspirations, one has to put it to
the test. Testing a theoretical model will be done by seeing how well it can enable
what originally was set out to design. In this case that is the model of the
knowledge federation website. The domain map prototype should be capable of
mapping the website in a manner which upholds all the attributes and functionality
which was desired.
Looking at the construction of the knowledge federation website there are the five
major parts which need to be addressed in order to map the website successfully.
The five parts as highlighted in the approach chapter (see 3.4) are the main intro-
duction page, federation though images, through stories, through applications and
through conversations. Each of the major elements needs to be mapped in a man-
ner which does not lose any of the information and context that is present on the
website, while simultaneously allowing for addition information and context to be
generated. The website does also link to addition pages located on the website
which are not part of the core five pages. This is naturally integrated as the domain
map is built in the idea of connection information, taking inspiration in the hyper-
linking concept invented by Doug Engelbart (See 2.4.1).
Mapping each aspect of the knowledge federation website comes with unique
challenges. The different parts of the website have a focus on different elements.
The mapping for the main page is the most straight forward approach. The main
page build the concept of knowledge federation up through a series of vignettes.
The key feature for the main map is that it is supposed to be read sequentially for
it to have the desired outcome. For this purpose the domain map has introduced
the spider structure. The whole of the main page will be considered one node
which is part of the knowledge federation domain. This introductions node can
then be zoomed in revealing the inner nodes which make up the larger structure.
Inside the structure are nodes which make up the vignettes that the page is built
up from. The nodes are ordered as part of the spider structure. Most vignettes

94
contain enough information that they warrant their own spider structure as well.
Reducing the information of the page into single information snippets. As the
main page refers to other sites within the website domain a connection is made
between the information node containing the information and the node containing
the information from the referenced page.
Federation through images is centered on images and models being able to convey
information more concisely in some context. In the context of the domain map
this aspect is mapped in a similar manner as the main page. The overall structure
of the page remains the same. What is notably different from the images page is
that each vignette is centered on an image. The image is at the center of the struc-
ture and each connecting node surrounds it. An image can have different meanings
depending on different context. The map reflects this by allowing the image to be
part of multiple spider structures. New conceptions are simply made to the image
node. The image stays the focal point allowing for information to be introduced
to emphasize it.
Federation though stories has one key attribute which needs to be taken into ac-
count when mapping it as part of the domain map. The vignettes which make up
the stories of the page are notably longer than the other vignettes. Contrary to
intuition this results in the information likely being split into fewer pieces. As the
stories are more long form text which is necessary as a whole to generate infor-
mation. This highlights an attribute of the domain map. The fact that information
can be split into as small pieces as one desires, but the language for the domain
map encourages to structure the information in a manner which contributes to un-
derstanding and insight.
Federation through application presents prototypes and applications in the context
of how they serve knowledge federation. The domain map is versatile enough in
its design to allow for both the description of an application to be mapped as well
as the application itself. Taking the value matrix prototype as an example which
is described on the webpage. The value matrix can be mapped though its func-
tionality inside the grammar of the domain map. Examining in the concepts and
95
features, and citing the origin of some concepts. Or a simple vignette can also
server to introduce the application into the domain map. It is the second approach
that is the result of mapping the website rather than mapping the prototype itself.
The domain map is capable of mapping both.
Federation though conversions is the perhaps least clearly defined section of the
website as it incorporates several concepts. Regarding the elements which can
provide the need for a different approach as part of the domain mapping the fea-
ture which stands out is recording dialog. Conversations can be captured in many
different forms. The domain map aims to allow for all forms of dialog to be inte-
grated into a model. Comment nodes which allow for every branching
conversations to be recorded allows for the most direct way of interacting with
information. Each comment creates a node which in turn can be commented on.
The connections between nodes can then highlight which branches of conversa-
tion are productive, based on the rating, and worth pursuing. The domain map also
allows for recorded conversation such as video or audio from a conference to be
mapped and tag in a manner which makes it intractable directly. The different
mediums can even be interacted with across medium. A comment can be made on
a section of a video and responded to through a link to and audio interview.
The conversation section is also a special case because while being an application,
the domain map directly addresses the ideas of the conversation section. The do-
main map is an enabler for conversations and community.
The domain map prototype has the capability to map the contents of the
knowledge federation website. This makes it a tool which can be used to explain
the concepts which are part of knowledge federation and serve as a way to engage
people to interact with wicked problems. As people are engaging with the prob-
lems through the map this will lead to insights and solutions to the problems.

96

97
5 Discussion
The process of developing the domain map prototype has yielded as number of
insights and raised a number of questions and ideas. Being a prototype the work
that has been done as part of the thesis is a step towards building a more complete
application and community which enables the federation of knowledge on a global
scale, guided through the experts of different domains both academic in nature as
well as not. This chapter aims to discuss and highlight the major insights and de-
velopment gained as part of the development of the thesis.
5.1 The Prototype
The domain map prototype is an application in the larger domain of knowledge
federation. As such it is positioned in a place where it serves to both federate the
ideas presented by knowledge federation as well as inform the creation and evo-
lution of ideas within the knowledge federation domain. The prototype is
positioned in a matter which allows it to work as an improvement mechanism as
well as being part of the mechanism itself. This loges it firmly in the bootstrapping
category highlighted by Doug Engelbart (see 2.4.1). The development of the pro-
totype has led to a series of insights in regards to its own development as well as
raised new questions and issues.
The spider structure was an unexpected solution which developed naturally as part
of the implementation of the test maps into the debate graph. The problem of how
to split up larger information was one of the biggest hurdles when attempting to
introduce information into a map. The structure emerges as a result of splitting an
object while rating its context as a whole. The spider structure is the only structure
component introduced as part of the prototype, as it seemed the only necessary
structure for the implementation of the website into the domain map. In a different

98
domain there might be a need for different and more complex structures. Explor-
ing these could yield in interesting new development of future prototypes or
applications.
The grammar was built on the basis of issue based mapping as well as the notation
used in the debate graph application, but also introduced new elements as deemed
necessary. The new grammar that developed as a result is notably different in
several areas and borrows some general ideas of concept mapping while introduc-
ing its own notions which were deemed appropriate for a domain map within the
scope of knowledge federation. The development of the grammar is heavily influ-
enced by the website’s structure and what was required to map the information on
it, as well as on personal bias while developing the grammar. The grammar is on
one hand very subjective, but its development is reproducible. A different devel-
oper might approach the problem differently, but following the same steps and
test case a similar notation would likely be reached. The naming of the grammar
is result of the works at knowledge federation as well as the IBIS notation and
might be different in other versions, thought it would likely function similarly.
The domain map grammar sets a heavy emphasis on customization and user ac-
tivity. What became clear when working on the test maps was that developing a
grammar which accurately would represent any domain accurately and satisfacto-
rily would be highly unlikely if even possible at all. Instead of making the
notations purposefully vague or more general the decision was made to stick to
the language and tools which are useful for the knowledge federation domain and
allow for new grammar tools to be introduced by the users of different domains
through customization tools. One could argue that the introduction of custom
nodes makes the need for a grammar immaterial. However giving a set of basic
tools, which are proven to work in other models such as issue mapping, as well as
introducing some new tools into the tools box allows the user access to the neces-
sary general tools. The custom tools can then be made more specialized for
specific fields. The idea being that giving everyone a hammer and wrench might
be a good start, providing enough to start remodeling the house, even though one

99
might eventually need a drill down the line. Rather than letting someone start
without tools, providing the basic ones, but still allowing for more to be added.
The ability to create new custom nodes and connections will likely result in a
naturally growing and developing notation which grows as the result of actual
users’ needs rather than attempting to predict what users might need in all given
domains and fields.
Transforming the display of the domain map from the debate graph required fewer
changes than originally expected. The general layout of the two applications are
very similar. This is because the same general needs are present for both projects.
The map portion requires more space to visualize all the information. Examining
the information through an inspector object which shows the information of the
objects seems very intuitive as well. The major changes that were implemented
come in the form of the tool bar and the display symbols. Implementing a toolbar
more akin to image editing software suggests that the user is intended to interact
and change the map actively. This choice was the result of feeling that the debate
graph was difficult to interacting with initially having a steeper learning curve
than desired. More in regards to the learning curve is discussed in Section 5.4.1.
The choices of symbols was a late addition when finding that there were numerous
shared properties for the different nodes that could be highlighted to give the map
more information without adding clutter. There are more symbols which could be
employed such as the * º ´ symbols and properties from the debate graph. The
symbols used are a result of deliberate choice of what information was valuable
to an implementation of the website information. For instance knowing whether a
connection was leading to a different map seemed relevant, whereas knowing if
an information node contained information was not as important as the expecta-
tion is that the nodes contain some information. Unlike in debate mapping where
a single word might summarize and argument.
A crucial element to making the domain map prototype function as described is
the functionality provided by the value matrix prototype. The heavy reliance on

100
another prototype which has not been extensively tested or implemented is dan-
gerous. It adds a risk factor which would compromise the prototype externally.
Why take the risk? There are two main reasons why the value matrix prototype
was used.
First, both prototypes are part of knowledge federation, meaning that if one pro-
totype does not function then another prototype can help find weakness of the
other than that will have provided added value to the overall system. The idea is
to bootstrap using the value matrix prototype.
Second, the value matrix was designed to work with a tool similar to the domain
map (Karabeg & Johansson, Boundary Objects for Online Knowledge
Management, 2012). This means it fits ideally with the specifications of the
model.
The use a value matrix prototype was the approach chosen for a ranking system,
but the question does pose, why use a rating system at all? The reason why a rating
system is useful is because it allows to compare information and to help make
guided decision. It also allows to show what information is being engaged with
more. A fear of using a rating system is that is generates a system which can in-
herently be gamed to achieve ones purpose. The argument against that is that the
alternative would be to have every object be unlisted which would result in less
information to be gained. The argument that a system can be manipulated is true
of most systems. The way the debate graph attempts to minimize this is by making
the scores hidden where possible. While the map is influenced by the ratings vis-
ually, the numbers are not visible to the users. The user’s weight and ratings are
not visible either.
The user score does present the danger of making a certain few have more power
inside the domain maps of certain fields. This is however intentional. The reliance
on experts should be utilized. Systemic innovation requires that there be a guiding
force behind decision making, allowing for guided evolution of the system rather
than simply relying a the free market ecosystem (see 2.3). It is for the same reason

101
that there are experts as part of the domain map and administrators. Using human
insights informed by algorithm rather than relying entirely on the rating values.
The road map function of the domain map is a way to give a more educational
way of using the domain way. The emphasis of the domain map is on knowledge
federation trough exploration. The road map was the result of attempting to back-
track what nodes have been visited and through which connections. Utilizing the
information for education and evaluation purposes were a late addition to the pro-
totype functionality. The function is non-intrusive to users meaning is optional to
use without taking up much screen revenue. The function can also be used as
originally intended to review how a conclusion was reached and to get an idea of
a bigger picture by seeing the explored information in order.
Viewing the completed design of the domain map prototype the question arises of
the reproducibility of the project. Is it possible to arrive at the same or similar
version of a domain mapping prototype. Many of the ideas that are implemented
and used as part of the prototype have been around for a long time, dating back to
the 60s and even further back. Knowledge mapping is being used across many
fields and the debate graph application is a similar application only with a differ-
ent focus. The foundation for the prototype has been in place a long time. What
was required is to put the pieces together and to address issues that arise by doing
so, as well as designing the now public knowledge federation website (Karabeg,
Knowledge Federation Prototpye, 2019). All the information and technology is
publicly available, making it reasonable for anyone with the understanding of
knowledge federation to reproduce the prototype. The results are in part informed
on experience and trial and error, and different conclusion might be reached based
on the modeling that is done.
5.2 Realization of Prototype
The prototype of the domain map is designed as a means of establishing the gram-
mar and functionality needed to develop a fully functioning domain map. Given
more time a working prototype of the application could be made. Having a strong
102
theoretical foundation for the prototype does however create a solid foundation as
well as an outline for the development and testing of a fully-fledged functioning
prototype in the future.
In order to create the prototype the need for some form of testing environed be-
comes immensely valuable. In the case of the domain map prototype having
access to the debate graph allowed for a much better feel and visualization of the
prototype. As the two applicators are similar in the technical functionality that is
required it allowed to create the test models which informed the design of the final
prototype. It is fair to say that the approach of this thesis would have required a
far greater amount of modeling and physical prototyping such as with sticky notes
and strings in order to visualize the map. Another advantage of having access to
a similar piece of mapping tools is that by modeling the website in the debate
graph everything that was not possible to map inside the debate graph and every-
thing which needed to be changed became more visible. The creation of the
models inside the debate graph resulted in a positive result in regards to getting a
vision of the full prototype. The needs for what needed to be altered and imple-
mented were made visible through trial and error of the models. The major
challenge came from having to translate the information from the website into the
grammar of the debate graph which was not intended for this purpose.
The use of the debate graph might also highlight some areas which could benefit
the debate graph. Some of the features such as predefined structures and modes
of the connections and symbols might be interesting additions to the debate graph.
From a technical standpoint the implementation of the domain map should be fea-
sibly doable. The Base architecture for an application such as the domain map
already exists in the debate graph, although not open source. An alternative which
could be implemented is building a mod on top of the debate graph which trans-
lates information from the domain map grammar into the debate graph as well as
keeping track of all new features such as the implementation of the value matrix.
This would also be very doable by introducing the new notation of the domain
map into the debate graph which is easily done according to co-founder Davis

103
Price. Alternatively the application could be built from scratch allowing for the
features to be build and integrated from the ground up with an architecture that is
fully build on the idea of tagging and the value system. The application will result
in a large amount of small objects which are only loaded in memory when dis-
played. This would also make it browser friendly.
5.3 New World
The metaphor of the traditional map has served to describe many phenomena in
the thesis. It would seem appropriate to continue it while discussing the process
of developing the domain map. In order to create the mapping language for the
domain map the basis was taken in the test maps developed in the debate graph
based on the website. The maps were mapping what was there to be mapped.
Adding the objects (mountains and towns) that were necessary for the knowledge
federation domain. But what if the map was of the wrong continent. What if, like
Columbus, the wrong continent is being named inaccurately? Mapping a different
domain could result in a very different map with very different objects on it. Per-
haps the domain map does not have a tool which integrates metaphorical deserts
into its map. The addition of custom nodes and connection elevate the potential
of missing information but the question dose pose. Would a different domain have
been a better approach for the creation of the domain map grammar?
The choice of the prototype domain informed much of the design decisions. The
debate graph was built on the idea of facilitating debate and organizing infor-
mation gathered from debate into a readable map. The purpose of the domain map
is to serve as a way of facilitating knowledge as a means of addressing problems
across trans-disciplines which exists across domains. The choice of using the web-
site of knowledge federation is therefore a natural selection. In essence, mapping
the contents of the website is akin to the domain map mapping itself as a means
of creating itself. While the map is not of the domain map itself, it is of what has
led to its inception. It would now in retrospect be possible to create a map of the

104
domain map inside the domain map. This could serve to introduce the functional-
ity of the domain map to new users. Mapping knowledge federation brings with
it the advantage that it is a domain that emphasizes the sharing of information. It
serves as a way of exploratory education which makes it an ideal first domain to
map, as once a map is in place which can teach users how to use it, the other
domains can be created as the result of the learning gained from the base domain.
Developing the test models allowed for a wide amount of experimentation and
exploration of the mapping tools. Each test model was addressing a specific need
and came with similar challenges. The challenges where mostly a result of the
grammar disconnect between the two projects. Once the nodes and connections
where re-contextualized, how to split up information became the major obstacle.
With unlimited time each test map would have included every element of the web-
site as a means of understanding how the objects interact in relation of one
another. Narrowing in on one task at the time did however make each test more
focused. The results of the test maps where very positive.
5.4 Alternate approaches
When deciding on the approach to address the problem statement there where a
number of factors which determined which direction to take. Wicked problems
can be tackled in different ways, and choosing an approach in regards to the three
approaches highlighted by Nancy Roberts (see 2.2.2). The focus was places on a
collaborative strategy, which is very much a mantra of the knowledge federation
movement. While this approach was highlighted there were also elements which
are more akin to an authoritative approach. Through the introduction of experts
and the suggestion of domains being curated by individuals which undoubtable
have authority within the system this becomes a hybrid approach of the two meth-
odologies.
The hybrid approach is also supported by the idea of systemic innovation and the
idea of bootstrapping as part of the development. Making a system which im-
proves itself as a part of development. The emphasis was placed less on the

105
improvement methods however and more on the collaborative integration if in-
formation into a system as a whole. Focusing more on the ABC approach outlined
by Engelbart (See 2.4.3) could result in interesting new features to a domain map.
The approach chosen was dictated by the problem statement which was focused
on designing a prototype which would enable a domain map. A more common
approach might have been to attempt to build a prototype. The reason that the
thesis focuses on design rather than development is a matter of time allocation.
The approach of solving wicked problems is dictated by ones understanding of
such problem. In order to fully comprehend the full scope of such a problem re-
quires a large time investment. The development of the grammar and prototype if
done extensively is also a time intensive matter. In order to build a prototype one
needs to familiarize oneself with the tools, design what is to be implemented and
then develop it with the likelihood of many unexpected problems. Given the
timeframe of the thesis. Both designing and developing a prototype would likely
have resulted in a subpar result. Focusing on designing allowed to explore the
grammar more thoroughly. The hope is that creating a solid framework for a do-
main map is a better step towards the unfished revolution than a limited
functioning application would have been.
5.4.1 Onboarding
When exploring the debate graph as part of developing the test maps for the do-
main map one thing that became apparent as a new user to the mapping tool was
the steep learning curve that is experienced. The learning curve for a new user
was steeper than would have been expected looking at the grammar and general
mapping design of the application. The domain map prototype in a similar vein
does not have a proper onboarding process for new users in regards to functional-
ity. The initial introduction is given through an information section which explains
the notations and how they are to be used, but the user does not experience learn-
ing process. The focus of the design was on conveying the concepts and
connections that are part of knowledge federation and to gain and understanding

106
of the information. In order to create a learning tool for new users there are a
number of onboarding strategies which could be explored (Cook, 2019).
An approach that could be explored as a means of onboarding is the exploration
of a domain map which maps the domain map. By creating a map of the domain
map notation one could use the map itself (with a limited view and scope) to ex-
plain how it is intended to be used. The connectivity aspect of the map would then
allow to bridge from a tutorial map into the full domain map. This is an approach
which could generate new ideas and features in the future.
5.5 Unfinished Revolution
The unfinished revolution is what knowledge federation refers to as Doug Engel-
bart’s unrealized vision of how technology could be used to improve the collective
human capability. Realizing the unfinished revolution could be described as the
task of the century. Engelbart describes an OHS system as part of the solution to
raise collective intelligence (see 2.4.2). Realizing a completely functional system
of the scale which he described would allow for the collective IQ across all fields
and domains to be enhanced. When Engelbart was asked how much of his vison
had been achieved he answered that only 2.8 percent had been achieved. The do-
main map aims to be a step closer to realizing the vision. The prototype is the next
step in realizing the 97 percent that were missing during his lifetime.
Developing a tool which enables the open collaboration, sharing of ideas and
lifelong explorative education is what needs to be in place for the unfinished rev-
olution to be tackled. The application requires to have a set number of properties
as highlighted as part of the OHS (see 2.4.2). Comparing the domain map proto-
type to the three categories and seeing how it approaches these issues can provide
an insight in how it could be used for this purposes. The properties fall into three
categories: Internal attributes, key features and additional features.
The internal attributes that where highlighted as part of examining the idea of the
OHS were, that each object must be tagged automatically and can be tagged by
the author. This is a core attribute of the domain map build on the concept that

107
every object is tagged. The tag also includes a time stamp and a log of what user
updated the object as part of the tag. This is another intern attribute which is de-
sired for an OHS which the domain map has implemented. The final key attribute
which was highlighted was that the system should encourage user to structure ob-
jects naturally. This is a somewhat subjective manner, however given the vignette
structure and the splitting according to natural writing (the forming of paragraphs)
this also can be deemed executed as part of the domain map.
The key features which should be in place for an OHS are numerous. The five that
where highlighted where all implemented to some extent as part of the domain
map. Objects are linked and can be jumped to freely though different views. The
domain map allows for both a top down view as well as a contained focused view
and access over the view is given to the user as part of navigating the map. Addi-
tionally the domain map differentiates between high-level concepts and simple
information pieces. It does this though the used of grammar which encourages
objects to be viewed differently based on the connection which is being observed.
The messages system is realized more as the ability to post comments and to start
comment chains which are integrated as conversation inside the map. Email alerts
are integrated as part of the subscription functionality which allows the message
to be forwarded to the user, but only on desired elements and parts of the map.
In regards to the further support attributes which are described the domain map
does also address the majority of them. The application prototype allows for seam-
less transition between exploring and editing of the map. Simply by interacting
with the object that is being viewed. The information is gathered as part of do-
mains. This is somewhat different then what was described as journals or libraries,
but served the inherently same purpose of grouping information in a logical man-
ner. The subscription function is realized. Each object is tagged uniquely which
makes it clearly identifiable.
The areas which are not realized are in regards to the direct integration of video
conferencing. While the tools can be used in conjunction with conferences the
domain map is not designed to provide the direct integration. A conference can be

108
recorded and then integrated into the map. The idea of recording is strongly en-
couraged and the implementation of live communication is a feature which could
be addressed in the development of the prototype. There is also no direct email
support as part of the domain map. Integrating email support into the grammar
could provide a new structure to be created. Finally the UI should be highly cus-
tomizable as part of an OHS. The domain map prototype has a very simplistic UI
with only three main components. Making the UI customizable was not a focus
for the initial prototype. This could be explored as part of developing the applica-
tion.
The domain map prototype does fulfil a large amount of functionality and prop-
erties which was desired by Engelbart. It realizes one aspect of what Engelbart
saw as part of his vision. With the tool in place the Cultural Revolution can be
enabled. But it will require the ideas to be developed, tested and implemented for
Engelbart’s revolution tot truly be complete and for Collective Intelligence to be
enhanced.
5.6 Problem Statement
At the beginning of the thesis work the problem statement was defined to insure
that the work would be guided towards accomplishing a single goal. The problem
statement was defined as:
Design a mapping tool prototype with a grammar enabling knowledge
federation across multiple domains.
The problem statement has been the guiding force behind the decision made in
the thesis. Being the steering force of the thesis makes it pivotal. Each aspect of
the statement was made deliberately.
The Focus was from the beginning on creating the language and approach for a
domain map application. The prototype as needs to be in place in order for an
application to be built which support the key features and attributes that have been
highlighted as part of the thesis. The thesis would have been completely different

109
if any part of the problem statement had been changes and other approaches would
have resulted from that.
Changing the design aspect to ‘develop’ would have shifted the focus on the tech-
nical implementation of a design. This would also have raised the question of
testing the application which would have taken focus away from developing the
necessary language which could enable a domain map. Having the focusing scope
be different from knowledge federation would also have resultant in a different
approach as different features might have become more important. Different
structures would have become more relevant as a result as well.
A desire that existed before the problem statement was even conceived was to
federate the need for a domain map. Doug Engelbart was often quotes as saying
“You just don’t get it”. This thesis hopes to show that someone got it.

110

111
6 Conclusion
The goal of this thesis was to design a domain map prototype in order to address
the means by which wicked problems are being approached and how knowledge
mapping can be employed as a tool towards solving global issues. Through the
design of a prototype with grammar based on the IBIS notation (See 2.5.2) and
other mapping techniques (2.5.1), specialized for the purpose of knowledge fed-
eration as a means of generating understating of problems as a means of solving
them. The thesis is part of the knowledge federation infinitive, which aims to en-
able a new approach to knowledge work by presenting information in new ways
(See 3.3). This means changing how information is presented and allow for new
ways of interacting with knowledge (See 2.3). This in turn allows for major
wicked problems like global warming and education systems to be approached
from a new side.
The design of the domain map prototype is built on the vision by Douglas C. En-
gelbart of collective intelligence achieved through tools such as the DKR (See
2.4.3), incorporating mapping tools and techniques (Such as IBIS and Concept
mapping) as part of the design. The creation and launch of the knowledge federa-
tion was the first step of contributing to this vision. Through the design of the
website, the information was presented and organized in a traditional manner. The
domain map prototype then serves as a tool to federate the content in a systemic
manner (See 2.3). It does this through a grammar which was designed specifically
for this purpose as part of this thesis. The grammar incorporates methods from
other modeling languages and tools (such as the debate graph notation) modified
to the needs of the domain map.
The approach to designing the domain map prototype once the completion of the
website had been completed was heavily tied to the use of the debate graph appli-
cation. Through the use of the application, test maps were created (See 3.5 & 4.1)
to discover which features would need to be implemented and was used to create

112
a better understanding of the features needed for the domain map prototype. The
prototype also makes use of the value matrix prototype (See 2.7). The value matrix
is integrated into the domain map prototype and serves as the basis of information
evaluation which the domain map provides as a means of organizing and present-
ing information.
This thesis presenting the domain map prototype aims to federate the ideas of
using knowledge mapping as a means of tackling wicked problems. The prototype
is an invitation to collaborate and create new knowledge work. Through the im-
plementation of the prototype and through the use of the language that this thesis
provides as part of the domain map grammar.
6.1 Future work
Closing out this thesis with a look into the future of the project and different ap-
proaches what can make domain mapping more robust and get closer to Doug
Engelbart’s vision. The domain map prototype falls in as one of the applications
that make up knowledge federation and as such serves to advance the overall goal
of a paradigm shift. The domain map prototype is only a small piece in a larger
puzzle. With every new application that gets added to knowledge federation, the
puzzle becomes more whole. The closer the image that Doug Engelbart envi-
sioned becomes wholly visible.
The next step in regards to the domain map prototype is the implementation of the
grammar and design into a functioning application which can then be used as part
of knowledge federation as well as other domains. This will enable more effective
testing than a theoretical prototype is capable of, using only approximation tools
such as the debate graph. Once the domain map reaches the hands of users the
domain map should begin to generate a feedback loop. The loop between user
need and domain-specific issues enable the growth and change of the domain map
in a dynamic manner.
Areas which are subject to change and evolution in the domain map are in regards
to structures. The domain map prototype only introduced the spider structure as a

113
way of organizing fractioned sequential information in a manner which is able to
create logical connections while meaning the integrity of an information piece as
a whole. Different domains will likely have new needs and new structures could
accommodate these needs. The idea of implementing a structure for email inte-
gration seems a likely first approach in regards to introducing new elements.
However, there are likely many more to be explored.
The rating system introduced in conjunction with the value matrix prototype is
likely to be the subject of revision. Once the application is developed and is being
used by a large number of users the need for the rating system to adjust are highly
likely. The ratings will have to be adjusted to the actual way that users are inter-
acting with the information. There is likely an interesting analysis thesis possible
in regards to investigating the effectiveness of the value matric in conjunction
with the domain map as well as the results of the rating system. The adjustments
and evaluation can only happen once data has been gathered however.
The design of an onboarding section for the domain map could also result in a
possible subject for the development of a thesis. The specific methodology of cre-
ating an onboarding process which teaches the user to utilize the domain map
through the use of the domain map would be a valuable tool and addition to the
domain map prototype. Such an onboarding process could be made regardless of
which domain the user approaches, but could result in the users being navigated
through a domain map of domain maps in order to orient themselves and find the
information that is most useful to them and allow them to begin exploring using
the map as a guide.
The debate graph has been an invaluable tool for the testing and experimenting of
different ideas, implementations and concepts. It has served as the basis for many
design decisions that were made in regard to the domain map. The hope is that
through the design of the prototype some areas are highlighted which might ben-
efit the debate graph as well. Allowing for some features to be implemented into

114
the debate graph. As knowledge federation the goal is to create and share infor-
mation to change how knowledge is used. The debate graph has been a valuable
asset and will hopefully benefit from the research in this thesis as well.

115

116
7 Bibliography
About An Open Hyperdocument System (OHS). (2019). Retrieved from The
Doug Engebart Institute : http://dougengelbart.org/content/view/156/88/
About Bootstrapping. (2018). Retrieved from The Doug Engelbart Institute:
http://www.dougengelbart.org/content/view/226/269/
About Dynamic Knowledge Repositories. (2019). Retrieved February 15, 2019,
from The Doug Engelbart Institute:
http://www.dougengelbart.org/content/view/190/163/
Ausubel, D. P. (1963). The psychology of meaningful verbal learning. New
York, Grune & Stratton.
Bloom, B. (1956). Taxonomy of Educational Objectives: The Classification of
Educational Goals.
Bush, V. (1945). As We May Think. The Atlantic Volume 176, No. 1, 101–108.
Camillus, J. C. (2008). Strategy as a Wicked Problem. Harvard Business Review
(may).
Cañas, A. J., & Novak , J. D. (2008). Concept Mapping Using CmapTools. In A.
Okada, S. Buckingham Shum, & T. Sherborne, Knowledge Cartography:
Software Tools and Mapping Techniques.
Cañas, A. J., & Novak , J. D. (2008). Concept Mapping Using CmapTools. In A.
Okada, S. S. Buckingham, & T. Sherborne, "Knowledge cartography."
Software Tools and Mapping Techniques.
Cañas, A. J., Hill, G., & et al. (2004). CmapTools: A Knowledge Modeling and
Sharing Environment.
Celebrating the 30th anniversary of Doug's 1968 Demo. (2018). Retrieved from
The Doug Engelbart Institute:
http://dougengelbart.org/content/view/223/000/
117
Chang, K., Sung, Y., & Chen, S. (2001). Learning through computer-based.
ournal of Computer Assisted Learning 17, 21-33.
Conklin, J. (2003). Dialog Mapping: Reflections on an Industrial Strength Case
Study. In B. S. Kirschner P.A., Visualizing Argumentation. Computer
Supported Cooperative Work. London: Springer.
Conklin, J. (2005). Dialogue Mapping: Building Shared Understanding of
Wicked Problems. Wiley .
Conklin, J. (2005). Dialogue Mapping: Building Shared Understanding of
Wicked Problems. Wiley.
Cook, M. (2019). UX Flows: How to Turn Onboarding into an Amazing First
Date with Your User. Retrieved April 28, 2019, from Telepathy:
https://www.dtelepathy.com/blog/design/ux-flows-onboarding
Culmsee, P., & Awati , K. (2008). The Map and the Territory: A Practitioner. In
A. Okada , S. S. Buckingham , & T. Sherborne , "Knowledge
cartography." Software Tools and Mapping Techniques.
Daul, B. (2013). Bill Daul interviewed by Martin Wasserman. (M. Wasserman,
Interviewer)
debategraph. (2019). Help. Retrieved August 15, 2018, from debategraph:
https://debategraph.org/Stream.aspx?nid=61932&vt=rgraph&dc=1
Derbentseva , N., Safayeni, F., & Cañas, A. J. (2006). Concept maps:
Experiments on dynamic thinking. Journal of Research in Science
Teaching, 448–465 .
Douglas, E. C. (1995). Dreaming of the Future. Bootstrap Institute.
Doug's Strategic Vision - A Human Endeavor. (2018). Retrieved from The Doug
Engelbart Institute: http://www.dougengelbart.org/content/view/309/313/
Engelbart, D. C. (1992). Toward High-Performance Organizations. GroupWare
'92.

118
Groetker, R. (2008). Visualized Problem Structuring for Stakeholder
Consultations. In A. Okada , S. S. Buckingham , & T. Sherborne ,
"Knowledge cartography." Software Tools and Mapping Techniques.
Hyerle, D. (2008). Thinking Maps®: A Visual Language. In A. Okada, S. S.
Buckingham , & T. Sherborne , "Knowledge cartography." Software
Tools and Mapping Techniques.
Implemented Hypermedia in the '60s. (2019, April 28). Retrieved from Doug
Engelbart Institute: http://www.dougengelbart.org/content/view/158/90/
Karabeg, D. (2003). Information design - a new paradigm in creation and use of
information.
Karabeg, D. (2019). Retrieved April 15, 2019, from Knowledge Federation
Prototpye: http://kf.wikiwiki.ifi.uio.no/Main_Page
Karabeg, D. (2019, March 01). Retrieved from Knowledge Federation Protoype:
http://kf.wikiwiki.ifi.uio.no/Main_Page
Karabeg, D. (2019). A paradigm. Retrieved from Knowledge Federation:
http://kf.wikiwiki.ifi.uio.no/Main_Page
Karabeg, D. (2019, 04 01). Federation through applicaiton. Retrieved from
Knowledge Federation: Prototype:
http://knowledgefederation.org/APPLICATIONS#Value_Matrix_object
Karabeg, D., & Johansson, B. (2012). Boundary Objects for Online Knowledge
Management.
Knapp, R. (2008). Wholesome Design for Wicked Problems. Public Sphere
Project.
Lachica, R., Karabeg, D., & Rudan, S. (2008). Quality, relevance and
importance in information retrieval with fuzzy semantic networks.
Subject-Centric Computing - 4th International Conference on Topic
Maps Research and Applications, TMRA 2008. 12.

119
Landau, V. (2009). The Engelbart Hypothesis: dialogs with Douglas Engelbart.
NextPress; 2st Edition edition.
Landau, V. (2018). How Douglas Engelbart Invented the Future.
SMITHSONIAN MAGAZINE.
Larkin, J. H., & Simon, H. A. (1987). Why a Diagram is (Sometimes) Worth
Ten Thousand Words. Cognitive Science Volume 11 Issue 1, 65–99.
Lehtman, H., Engelbart, D., & Engelbart, C. (1998). TECHNOLOGY
TEMPLATE PROJECT OHS Framework. ALLIANCE,980.
Lyman, P., & Varian, H. R. (2003). How Much Information? University of
California.
Magnus, P. (2008). Early response to false claims in Wikipedia. First Monday,
Volume 13 Number 9.
Marr, B. (2018). How Much Data Do We Create Every Day? The Mind-
Blowing Stats Everyone Should Read. Forbes.
Midgley, G., & Lindhult, E. (2017). What is Systemic Innovation?
Novak, J. D. (1998). Learning, Creating, and Using Knowledge: Concept
Maps(tm) As Facilitative Tools in Schools and Corporations. Routledge.
Novak, J. D., & Gowin, D. (1984). Learning How to Learn. New York:
Cambridge University Press.
Noveck, B. (2009, June 5). Open Government Brainstorm: Collaboration in
Action. Retrieved November 30, 2018, from The Whitehouse: president
Obama: https://obamawhitehouse.archives.gov/blog/2009/06/05/open-
government-brainstorm-collaboration-action
Nuclear 2010: NPT Review . (2011). Nuclear debategraph. Retrieved
November 30, 2018, from A: The National Archieves.
O'Brien, T. (1999, February 09). From the archives: Douglas Engelbart's lasting
legacy, 1999. San Jose Mercury News. Retrieved from

120
https://web.archive.org/web/20130707130924/http:/www.siliconvalley.c
om/ci_23592605
OHS-Like Tools. (2019). Retrieved 02 14, 2019, from The Doug Engelbart
Institute: http://www.dougengelbart.org/content/view/193/388/
Okada, A., Buckingham, S. S., & Sherborne, T. (2008). "Knowledge
cartography." Software Tools and Mapping Techniques.
Price, D. (2009). Mapping the path to peace in the Middle East. The Independet.
Rittel, H. (1972). On the Planning Crisis: Systems Analysis of the 'First and
Second Generations. Bedriftskonomen.
Rittel, H. W., & Kunz, W. (1970). Issues as Elements of Information Systems.
Working Paper 131.
Rittel, H., & Weber, M. (1973). Dilemmas in a general theory of planning
Policy. 155-169.
Roberts, N. (2000). Wicked problems and network approaches to resolution.
International public management review, 1(1), 1-19.
Shum, S. B. (2003). The Roots of Computer Supported Argument Visualization.
In B. S. Kirschner P.A., Visualizing Argumentation. Computer Supported
Cooperative Work. London: Springer.
Stavru, S. (2014). A critical examination of recent industrial surveys on agile
method usage. Journal of Systems and Software, Volume 94.
Takey, S., & de Carvalho, M. M. (2016). Fuzzy front end of systemic
innovations: A conceptual framework based on a systematic literature
review. Technological Forecasting and Social Change.
Tarté , G. (2006). Conéctate al Conocimiento: Una Estrategia Nacional de
Panamá basada en Mapas. CMC 2006 Concept Maps: Theory,
Methodology, Technology. San José, Costa Rica: CMC: International
Conference on Concept Mapping.

121
The MIT/Brown Vannevar Bush Symposium. (2018). Retrieved from The Doug
Engelbart Institute: http://dougengelbart.org/content/view/258/000/#2
The unfinished revolution. (2000, April). Retrieved from Dougengelbart:
http://www.dougengelbart.org/colloquium/colloquium.html
To enable a conversation over the world’s knowledge. (2019). Retrieved from
hypothes.is: https://web.hypothes.is/about/
Weick, K. E. (1995). Sensemaking in organizations. SAGE.
Wrenn , J., & Wrenn , B. (2009). Enhancing Learning by Integrating.
International Journal of Teaching and Learning in Higher Education
Volume 21, Number 2.
Wright, A. (2007 ). Glut: Mastering Information through the Ages. Joseph
Henry Press.
Zeiliger, R., & Esnault , L. (2008). The Constructivist Mapping of Internet. In A.
Okada , S. S. Buckingham , & T. Sherborne , "Knowledge cartography."
Software Tools and Mapping Techniques.